Additional Information and Where to Find It In connection with the proposed merger, Camden National Corporation (“Camden National”) will file with the Securities and Exchange Commission (“SEC”) a Registration Statement on Form S-4 that will include a Proxy Statement of SBM Financial, Inc. (“SBM”) and Camden National and a Prospectus of Camden National, as well as other relevant documents concerning the proposed merger. Investors and stockholders are urged to read the Registration Statement and the Proxy Statement/Prospectus regarding the proposed merger when it becomes available and any other relevant documents filed with the SEC, as well as any amendments or supplements to those documents, because they will contain important information. A free copy of the Registration Statement and Proxy Statement/Prospectus, as well as other filings containing information about Camden National and SBM, when they become available, may be obtained at the SEC’s Internet site (http://www.sec.gov). Copies of the Registration Statement and Proxy Statement/Prospectus (when they become available) and the filings that will be incorporated by reference therein may also be obtained, free of charge, from Camden National’s website at camdennational.com or by contacting Camden National Investor Relations at (207) 236-8821 or by contacting SBM Investor Relations at (207) 518-5607.

Participants in Solicitation Camden National and certain of its directors and executive officers may be deemed to be participants in the solicitation of proxies from the shareholders of Camden National in connection with the proposed merger. Information about the directors and executive officers of Camden National is set forth in the proxy statement for Camden National’s 2015 annual meeting of shareholders, as filed with the SEC on a Schedule 14A on March 12, 2015. Additional information regarding the interests of those participants and other persons who may be deemed participants in the transaction and a description of their direct and indirect interests, by security holdings or otherwise, may be obtained by reading the Proxy Statement/Prospectus and other relevant documents regarding the proposed merger to be filed with the SEC (when they become available). Free copies of these documents may be obtained as described in the preceding paragraph.

Forward-Looking Statements This presentation contains certain statements that may be considered forward- looking statements under the Private Securities Litigation Reform Act of 1995, including certain plans, expectations, goals, projections, and statements, which are subject to numerous risks, assumptions, and uncertainties. Forward-looking statements can be identified by the use of the words “believe,” “expect,” “anticipate,” “intend,” “estimate,” “assume,” “plan,” “target,” or “goal,” or future or conditional verbs such as “will,” “may,” “might,” “should,” “would,” “could” and other expressions which predict or indicate future events or trends and which do not relate to historical matters. Forward-looking statements should not be relied on, because they involve known and unknown risks, uncertainties and other factors, some of which are beyond the control of Camden National. These risks, uncertainties and other factors may cause the actual results, performance or achievements of Camden National to be materially different from the anticipated future results, performance or achievements expressed or implied by the forward-looking statements.

Forward-Looking Statements - continued Some of the factors that might cause these differences include, but are not limited to the following: the ability of Camden National to successfully close its merger with SBM Financial, Inc. in October 2015; the ability of Camden to obtain the requisite regulatory approval for the SBM merger without having to agree to material divestures of assets, or the imposition of other adverse regulatory conditions; the ability of Camden to successfully integrate SBM and Bank of Maine following closing of the transaction; continued weakness in the regional and local economies within the New England region and Maine, which could result in a deterioration of credit quality, an increase in the allowance for loan losses, or a reduced demand for Camden National’s credit or fee-based products and services; changes in trade, monetary and fiscal policies and laws, including interest rate policies of the Board of Governors of the Federal Reserve System; competitive pressures resulting from continued industry consolidation and the increased financial services provided by non-banks; volatility in the securities markets that could adversely affect the value or credit quality of Camden National’s assets, impairment of goodwill, the availability and terms of funding necessary to meet Camden National’s liquidity needs, and could lead to impairment in the value of securities in Camden National’s investment portfolio; and changes in accounting policies, practices and standards, as may be adopted by the

Forward-Looking Statements - continued regulatory agencies as well as Financial Accounting Standards Board, and other accounting standard setters. Additional factors that could also cause results to differ materially from those described above can be found in Camden National’s Annual Report on Form 10-K, as updated by our Quarterly Reports on Form 10-Q and other filings with the SEC. All of these factors should be carefully reviewed, and readers should not place undue reliance on these forward-looking statements. These forward-looking statements were based on information, plans and estimates at the date of this press release, and Camden National does not promise and assumes no obligation to update any forward-looking statements to reflect changes in underlying assumptions or factors, new information, future events or other changes.

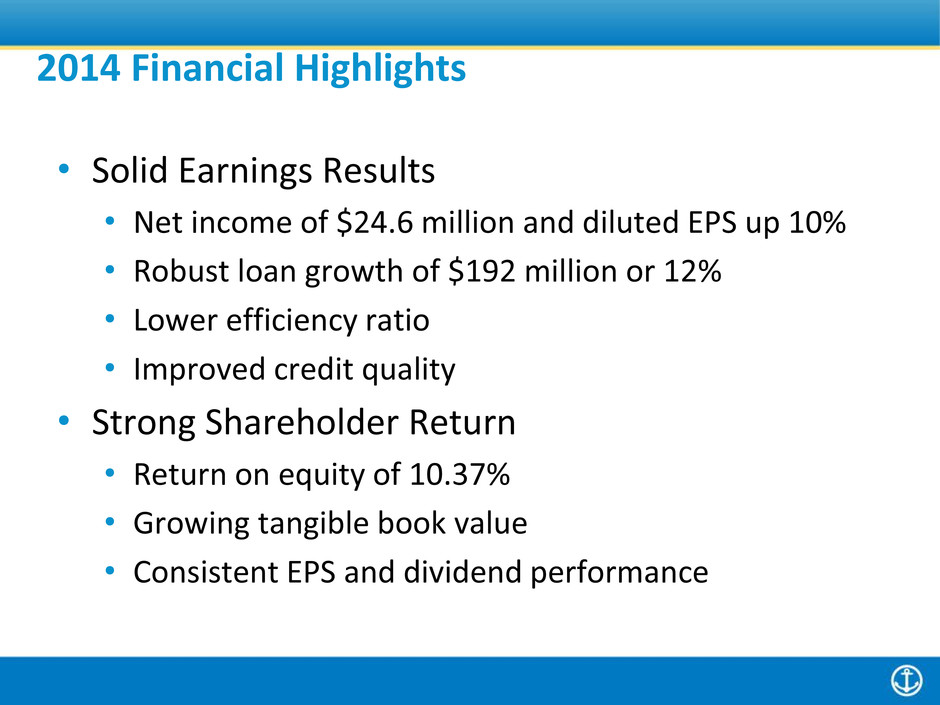
2014 Financial Highlights • Solid Earnings Results • Net income of $24.6 million and diluted EPS up 10% • Robust loan growth of $192 million or 12% • Lower efficiency ratio • Improved credit quality • Strong Shareholder Return • Return on equity of 10.37% • Growing tangible book value • Consistent EPS and dividend performance

Solid Earnings Results Loan Growth and Mix Residential Real Estate 33% Commercial Real Estate 36% Business Loans 15% Home Equity/ Consumer 16% Loan Mix 12/31/14 (1) Includes loans held for sale.

Solid Earnings Results Efficiency Ratio Proxy Peer – Average of 17 publicly traded commercial and savings banks in the Northeast BHCPR Peer – Average of 343 bank holding companies with consolidated assets between $1 and $3 billion Source: SNL Financial. Utilized SNL’s calculation of Efficiency Ratio which may differ from the Company’s reported ratio.

Solid Earnings Results Non-Performing Assets to Total Assets Proxy Peer – Average of 17 publicly traded commercial and savings banks in the Northeast BHCPR Peer – Average of 343 bank holding companies with consolidated assets between $1 and $3 billion Source: SNL Financial 1.08% 1.27% 1.13% 1.18% 0.82% 0.00% 0.50% 1.00% 1.50% 2.00% 2.50% 3.00% 3.50% 4.00% 4.50% 2010 2011 2012 2013 2014 CAC Proxy Peer BHCPR

Proxy Peer – Average of 17 publicly traded commercial and savings banks in the Northeast BHCPR Peer – Average of 343 bank holding companies with consolidated assets between $1 and $3 billion Source: SNL Financial Strong Shareholder Return Return on Average Equity

Strong Shareholder Return Tangible Book Value Per Share Proxy Peer – Average of 17 publicly traded commercial and savings banks in the Northeast SNL U.S. Bank $1B-$5B – Average of all major exchanges (NYSE, NYSE MKT, NASDAQ) banks in SNL's coverage universe with $1B to $5B in assets Source: SNL Financial $20.91 $22.66 $23.68 $23.98 $26.52 $13.15 $16.12 $13.14 $15.75 $- $5.00 $10.00 $15.00 $20.00 $25.00 $30.00 2010 2011 2012 2013 2014 CAC Proxy Peer SNL U.S. Banks $1-$5B

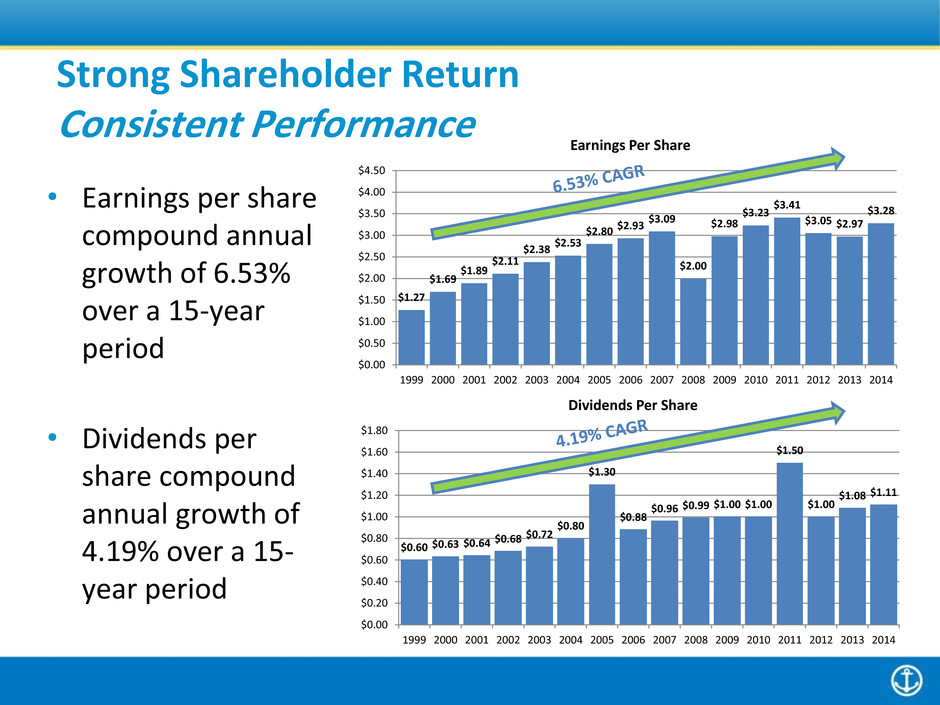
• Earnings per share compound annual growth of 6.53% over a 15-year period • Dividends per share compound annual growth of 4.19% over a 15- year period Strong Shareholder Return Consistent Performance $1.27 $1.69 $1.89 $2.11 $2.38 $2.53 $2.80 $2.93 $3.09 $2.00 $2.98 $3.23 $3.41 $3.05 $2.97 $3.28 $0.00 $0.50 $1.00 $1.50 $2.00 $2.50 $3.00 $3.50 $4.00 $4.50 1999 2000 2001 2002 2003 2004 2005 2006 2007 2008 2009 2010 2011 2012 2013 2014 Earnings Per Share $0.60 $0.63 $0.64 $0.68 $0.72 $0.80 $1.30 $0.88 $0.96 $0.99 $1.00 $1.00 $1.50 $1.00 $1.08 $1.11 $0.00 $0.20 $0.40 $0.60 $0.80 $1.00 $1.20 $1.40 $1.60 $1.80 1999 2000 2001 2002 2003 2004 2005 2006 2007 2008 2009 2010 2011 2012 2013 2014 Dividends Per Share

First Quarter 2015 Core Operating Results (1) Non-GAAP measure. Please refer to the earnings release filed on Form 8-K on April 28, 2015 for the “Reconciliation of non-GAAP to GAAP Financial Measures.” March 31, 2015 2014 $ Increase % Increase (in thousands, except per share) Revenue 25,581$ 24,095$ 1,486$ 6.2% Expenses/Provision/Taxes 1 (19,317) (18,488) 829 4.5% Core Net Income 1 6,264$ 5,607$ 657$ 11.7% Core Diluted EPS 1 0.84$ 0.74$ 0.10$ 13.5% Core Return on Equity 1 10.25% 9.78% 0.47% 4.8%

Gregory A. Dufour President and Chief Executive Officer CEO Comments

Growing to preserve our past… and ensure our future • Changing customer expectations • Challenged Maine economy • Increased competition • Changing technology • Rising compliance costs

Camden National’s balanced approach to growth… $0 $200 $400 $600 $800 $1,000 $1,200 $1,400 $1,600 $1,800 $2,000 $2,200 $2,400 $2,600 $2,800 $3,000 $3,200 $3,400 $3,600 $3,800 1994 1995 1996 1997 1998 1999 2000 2001 2002 2003 2004 2005 2006 2007 2008 2009 2010 2011 2012 2013 2014 2015 Asset Growth and M&A History ($mm) United Corp. $54 million KSB Bancorp $179 million Union Bankshares $565 million Bank of America 14 Branches $287 million Branch Sale 5 Branches $46 million The Bank of Maine $806 million Key Bank 4 Branches $54 million

Positioning Camden National for the future

Positioning Camden National for the future

Positioning Camden National for the future

Positioning Camden National for the future

Positioning Camden National for the future • Assets: $3.6 billion • Loans: $2.4 billion • Deposits: $2.6 billion • Annualized revenue: $150 million • 68 Branches, 3 lending offices and 3 Acadia Trust locations •Market capitalization: approximately $390 million 1 (1) Based on CAC closing price of $38.60 on March 27, 2015 (subject to change).

About SBM Financial / The Bank of Maine History • Founded in 1834 • 2008-2009 Financial Crisis • 2010 Recap • Turnaround I-95 Corridor Source: Company reports and SNL Financial.

(1) Based on CAC closing price of $38.60 on March 27, 2015 (subject to change). Deal Value: Aggregate deal value of $135 million 1 Per share deal value of $208.60 1 Consideration Mix: 80% stock / 20% cash 5.421 exchange ratio or $206.00 in cash Represents approximately 2.8 million CAC shares and $26 million in cash Pro Forma Ownership: 72% Camden National / 28% SBM Financial Board Representation: Combined board will include 2 directors from SBM Financial Transaction Overview

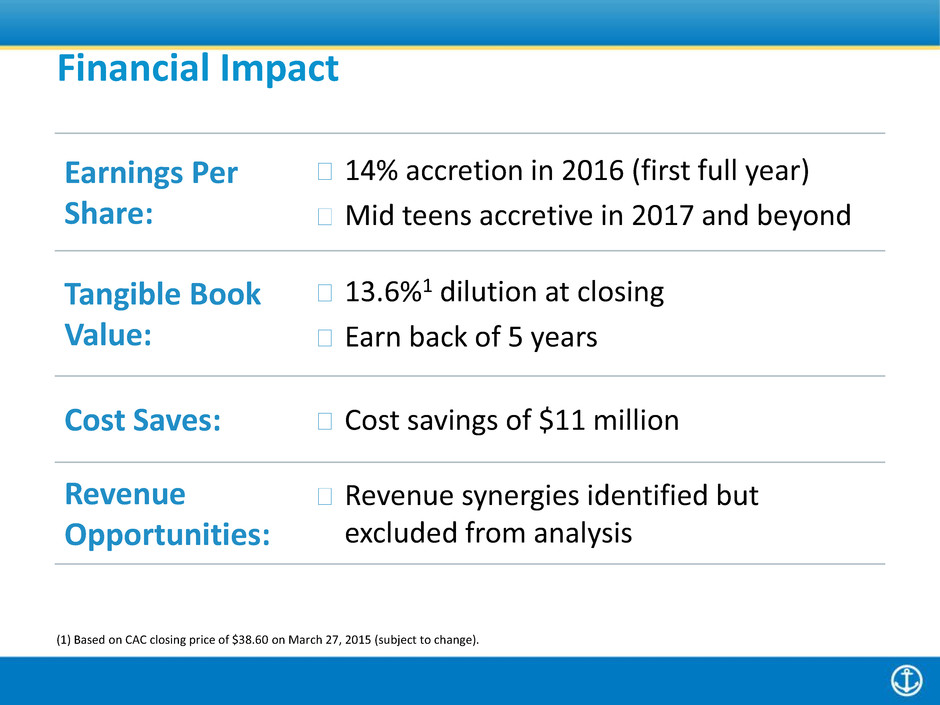
(1) Based on CAC closing price of $38.60 on March 27, 2015 (subject to change). Earnings Per Share: 14% accretion in 2016 (first full year) Mid teens accretive in 2017 and beyond Tangible Book Value: 13.6%1 dilution at closing Earn back of 5 years Cost Saves: Cost savings of $11 million Revenue Opportunities: Revenue synergies identified but excluded from analysis Financial Impact

Next Steps • Camden National and SBM/Bank of Maine shareholder approvals • Proxy statement / prospectus • Special meeting – summer 2015 • Closing (subject to shareholder and regulatory approval) – October 2015

Summary • Accelerates our expansion into higher growth Southern Maine markets • Enhances franchise through added scale, density, and low cost deposits • Healthcare and mortgage businesses represent new sources of growth • Financially attractive transaction • Low execution risk – compatible culture and customer focused community banking model


