 Third Quarter Report - 2016
Dear Fellow Shareholders:
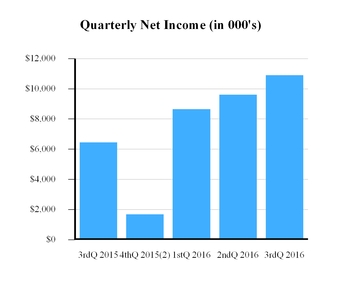
Focus on performance. We are pleased to report net income for the nine months ended September 30, 2016 of $29.2 million and diluted earnings per share of $1.88 compared to net income of $19.3 million and diluted earnings per share of $1.71 for the same period last year. Our strong performance reflects the growth from our traditional markets and those acquired through our merger in October 2015, and our continued focus on operating efficiencies, highlighted by our year-to-date efficiency ratio of 57.92%. These results favorably impacted several of our key performance ratios with our return on average assets increasing 11 basis points to 1.02% and return on average equity up 10 basis points to 10.29% compared to the same period last year.
Focus on strategy. In the third quarter of 2016,we announced two major strategic initiatives. On September 30, 2016, we completed a 3-for-2 stock split to better align the Company’s share price with peers and enhance liquidity for all shareholders. We also announced that our wholly-owned wealth management subsidiary, Acadia Trust, N.A., would be merged into Camden National Bank to create ‘‘Camden National Wealth Management.’’ This will align all of our brands, including our brokerage group, Camden Financial Consultants, to provide a comprehensive offering of banking, wealth management and brokerage products and services. Subject to regulatory approval, we expect to complete this initiative in the fourth quarter of this year.
Focus on balanced growth. We deeply believe our role as a community bank is to prudently grow our organization to benefit customers, communities, stakeholders and our shareholders. Strategies such as acquiring other organizations, like SBM Financial, Inc. in 2015, or realigning services and product lines as we are accomplishing through the creation of Camden National Wealth Management, are important elements of our strategy to grow and enhance our
breadth of products. Our total assets are now over
$3.9 billion,with total loans of nearly $2.6 billion
and deposits of $2.9 billion.We also manage over $1 billion of assets through our wealth management and brokerage groups.We are the second largest originator of residential mortgages in Maine and for the first nine months of 2016 have originated and committed to over $725 million of new loans to individuals and businesses of all sizes.
We remain cautious about the economy at the national, regional and state levels with particular concern surrounding the interest rate outlook. We see several external factors beyond our control that will increase the cost structure across our industry and others. In addition to higher compliance costs and expenses to keep pace with regulatory and technology changes, we expect additional costs due to changes in new overtime rules for salaried employees. While several states are considering increasing their minimum wage, earlier in 2016, Camden National increased its starting wage to $12.00 an hour, which is incorporated in our current expenses.
While these factors threaten the future of smaller banks, our proactive, yet conservative approach to growing our organization, positions us well to surmount these and other challenges.
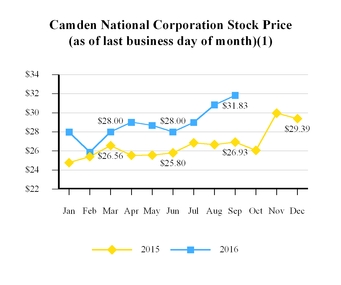
Focus on shareholder value. In addition to the 3-for-2 stock split, the Board of Directors declared a cash dividend of $0.20 per common share resulting in an annualized dividend yield of 2.51% based on the post-split stock price of $31.83 per share on September 30, 2016.
Your support as shareholders of Camden National Corporation is appreciated.
Sincerely,
Gregory A. Dufour
President and Chief Executive Officer
| Financial Highlights (unaudited) |
| | | | | | | | | | | | | | | | |
| | | Three Months Ended September 30, | | Nine Months Ended September 30, |
| (Dollars in thousands, except per share data) | | 2016 | | 2015 | | 2016 | | 2015 |
| Earnings and Dividends | | | | | | | | |
| Net interest income | | $ | 28,372 |
| | $ | 20,012 |
| | $ | 84,828 |
| | $ | 60,081 |
|
| Provision for credit losses | | 1,279 |
| | 279 |
| | 5,003 |
| | 979 |
|
| Non-interest income | | 11,001 |
| | 6,561 |
| | 29,470 |
| | 19,018 |
|
| Non-interest expense | | 22,149 |
| | 16,711 |
| | 67,388 |
| | 49,669 |
|
| Income before taxes | | 15,945 |
| | 9,583 |
| | 41,907 |
| | 28,451 |
|
| Income taxes | | 5,042 |
| | 3,127 |
| | 12,742 |
| | 9,191 |
|
| Net income | | $ | 10,903 |
| | $ | 6,456 |
| | $ | 29,165 |
| | $ | 19,260 |
|
Diluted earnings per share1 | | $ | 0.70 |
| | $ | 0.57 |
| | $ | 1.88 |
| | $ | 1.71 |
|
Cash dividends declared per share1 | | 0.20 |
| | 0.20 |
| | 0.60 |
| | 0.60 |
|
| Performance Ratios | | | | | | | | |
| Return on average equity | | 11.18 | % | | 9.99 | % | | 10.29 | % | | 10.19 | % |
| Return on average assets | | 1.11 | % | | 0.90 | % | | 1.02 | % | | 0.91 | % |
| Net interest margin | | 3.24 | % | | 3.08 | % | | 3.31 | % | | 3.12 | % |
| Efficiency ratio (non-GAAP) | | 56.29 | % | | 58.94 | % | | 57.92 | % | | 59.80 | % |
| Balance sheet (end of period) | | | | | | | | |
| Investments | | | | | | $ | 906,286 |
| | $ | 820,052 |
|
| Loans and loans held for sale | | | | | | 2,616,653 |
| | 1,831,033 |
|
| Allowance for loan losses | | | | | | 23,290 |
| | 21,132 |
|
| Total assets | | | | | | 3,903,966 |
| | 2,871,798 |
|
| Deposits | | | | | | 2,889,225 |
| | 2,008,177 |
|
| Borrowings | | | | | | 559,273 |
| | 563,905 |
|
| Shareholders' equity | | | | | | 393,181 |
| | 259,403 |
|
| Book Value per Share and Capital Ratios | | | | | | | | |
Book value per share1 | | | | | | $ | 25.47 |
| | $ | 23.20 |
|
Tangible book value per share (non-GAAP)1 | | | | | | 18.87 |
| | 18.97 |
|
| Tier I leverage capital ratio | | | | | | 8.48 | % | | 9.41 | % |
| Total risk-based capital ratio | | | | | | 13.60 | % | | 14.76 | % |
| Asset Quality | | | | | | | | |
| Allowance for loan losses to total loans | | | | | | 0.90 | % | | 1.15 | % |
| Net charge-offs to average loans | | | | | | 0.15 | % | | 0.07 | % |
| Non-performing loans to total loans | | | | | | 0.98 | % | | 0.83 | % |
| Non-performing assets to total assets | | | | | | 0.67 | % | | 0.54 | % |
1 All per share data has been adjusted to reflect the 3-for-2 split on September 30, 2016, for all periods presented.
1 All per share data has been adjusted to reflect the 3-for-2 split on September 30, 2016, for all periods presented.
2 Includes merger and acquisition costs of $6.0 million, net of tax.
A complete set of financial statements for Camden National Corporation may be obtained upon written request to Camden National Corporation, P.O. Box 310, Camden, Maine 04843.