 First Quarter Report - 2017
Dear Fellow Shareholders:
Someone once said that the most important strategic
question to ask is “What now?” That question resonated with many of us over the past three months as we celebrated the strategic and financial accomplishments of 2016 but understood our focus and energies were on the future.
I’m pleased to provide a first quarter 2017 update answering the question—“What now?”
We are off to a great start financially with net income of $10.1 million for the first quarter of 2017, which is 17% higher than the first quarter of 2016. Diluted earnings per share of $0.64 for the first quarter of 2017 were $0.08 per share, or 14%, higher than the same period a year ago. Total revenues for the first quarter of 2017 increased $558,000, or 2%, to $36.4 million over the same period last year due to higher mortgage banking income.We are also benefiting from our efforts over the past 18 months to run an effective organization with an efficiency ratio of 58.00% compared to 61.18% a year ago. This level of efficiency allows us to maximize profitability while strategically investing in the future of our organization.
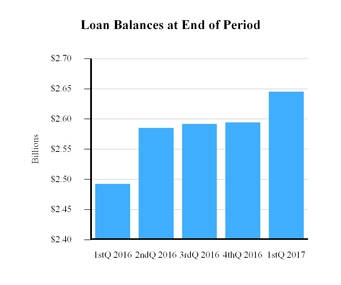
Our growing balance sheet continues to be strong with solid capital ratios and good credit quality. Total assets at March 31, 2017 were $3.9 billion compared to $3.8 billion a year ago, while shareholders’ equity increased $22.4 million to $397.8 million over the same period. We utilize the ratio of tangible shareholders’ equity to tangible assets as an indication of our balance sheet strength compared to our risk profile, and I’m pleased to report that our ratio increased from 7.43% at March 31, 2016 to 7.74% at March 31, 2017. During the first quarter of 2017, our loan portfolio, excluding loans held for sale, grew $50.6 million representing an annualized growth rate of 8%. Asset quality across our loan portfolio remains stable as indicated by our non-performing assets to total assets ratio of 0.68% at March 31, 2017 compared to 0.56% at March 31, 2016, and for the same comparable periods we experienced net recoveries on loans instead of net charge-offs.
We are uniquely positioned to invest in services that larger competitors offer, but differentiate ourselves by
delivering these services with a personalized community banking approach. For example, in November 2016 we introduced a live 24 hour a day customer assistance center, a first for a Maine-based bank. We immediately saw our customers contacting us between the hours of 7:00 p.m. and 7:00 a.m.—we could not previously provide this convenient service and our local competitors currently do not. This investment provided enhanced customer service during two recent blizzards which resulted in local banks and other businesses closing during the day. We were able to switch to our expanded call center capabilities and nearly 1,000 customers were assisted and our employees were able to travel home safely.
In late March, we launched MortgageTouch, which automates and simplifies much of the process to apply for a residential mortgage—and so far the response has been great. More importantly, our customer experience has improved dramatically. In one customer’s case, the mortgage application was completed in 13 minutes and they received a pre-qualification letter within 30 minutes! Similar to many of our other digital based enhancements, this positions us to compete against national competitors, while differentiating ourselves through delivery of our personal services in our banking centers and support teams.
Our focus remains on building long-term shareholder value by creating a strong and viable organization. Tangible book value per share was $19.14 at March 31, 2017, an increase of 8% since March 31, 2016, while our dividends of $0.23 for the first quarter of 2017 were 15% higher than the first quarter of 2016.
For Camden National, the answer to “What now?” is to deliver strong financial results driven by customer growth through innovative products and services, solid underwriting fundamentals and outstanding customer service. The support of our shareholders is much appreciated.
Sincerely,
Gregory A. Dufour
President and Chief Executive Officer
| Financial Highlights (unaudited) |
| | | | | | | | |
| | | At or For The Three Months Ended March 31, |
| (Dollars in thousands, except per share data) | | 2017 | | 2016 |
| Earnings and Dividends | | | | |
| Net interest income | | $ | 27,855 |
| | $ | 27,952 |
|
| Provision for credit losses | | 579 |
| | 872 |
|
| Non-interest income | | 8,572 |
| | 7,917 |
|
| Non-interest expense | | 21,428 |
| | 22,909 |
|
| Income before taxes | | 14,420 |
| | 12,088 |
|
| Income taxes | | 4,344 |
| | 3,442 |
|
| Net income | | $ | 10,076 |
| | $ | 8,646 |
|
Diluted earnings per share1 | | $ | 0.64 |
| | $ | 0.56 |
|
Cash dividends declared per share1 | | 0.23 |
| | 0.20 |
|
| Performance Ratios | | | | |
| Return on average equity | | 10.36 | % | | 9.41 | % |
| Return on average assets | | 1.05 | % | | 0.93 | % |
| Net interest margin | | 3.18 | % | | 3.35 | % |
Efficiency ratio (non-GAAP)2 | | 58.00 | % | | 61.18 | % |
| Balance sheet (end of period) | | | | |
| Investments | | $ | 943,061 |
| | $ | 909,584 |
|
| Loans and loans held for sale | | 2,650,818 |
| | 2,509,266 |
|
| Allowance for loan losses | | 23,721 |
| | 21,339 |
|
| Total assets | | 3,938,465 |
| | 3,762,541 |
|
| Deposits | | 2,937,183 |
| | 2,674,832 |
|
| Borrowings | | 556,922 |
| | 659,111 |
|
| Shareholders' equity | | 397,827 |
| | 375,458 |
|
| Book Value per Share and Capital Ratios | | | | |
Book value per share1 | | $ | 25.65 |
| | $ | 24.37 |
|
Tangible book value per share (non-GAAP)1,2 | | 19.14 |
| | 17.65 |
|
Tangible common equity ratio (non-GAAP)2 | | 7.74 | % | | 7.43 | % |
| Tier I leverage capital ratio | | 8.90 | % | | 8.42 | % |
| Total risk-based capital ratio | | 14.05 | % | | 13.08 | % |
| Asset Quality | | | | |
| Allowance for loan losses to total loans | | 0.90 | % | | 0.86 | % |
| Net charge-offs to average loans (annualized) | | 0.00 | % | | 0.11 | % |
| Non-performing loans to total loans | | 0.99 | % | | 0.80 | % |
| Non-performing assets to total assets | | 0.68 | % | | 0.56 | % |
1 All per share data for the three months ended March 31, 2016 has been adjusted to reflect the 3-for-2 split on September 30, 2016.
2 A reconciliation of non-GAAP measures to GAAP can be found in the Company's earning release dated and filed with the SEC on April 25, 2017.
1 All per share data for the three months ended March 31, 2016 has been adjusted to reflect the 3-for-2 split on September 30, 2016.
A complete set of financial statements for Camden National Corporation may be obtained upon written request to Camden National Corporation, P.O. Box 310, Camden, Maine 04843.
 First Quarter Report - 2017

