
2019 Annual Shareholders Meeting
Welcome to the 2019 Annual Shareholders’ Meeting Lawrence Sterrs Chair of the Board 1
Agenda Business Meeting • Introductions • Reading of the Minutes • Shareholder Voting Presentations • Financial Results – Debbie Jordan • Business Overview – Greg Dufour Questions and Answers 2

Camden National Corporation Board of Directors • Larry Sterrs, Chair • Marie McCarthy • Gregory Dufour, Pres/CEO • Catherine Longley • Ann Bresnahan • James Page, Ph.D. • Craig Denekas • Robin Sawyer • David Flanagan • Carl Soderberg 3
Camden National Bank Board of Directors • Larry Sterrs, Chair • James Markos, Jr. • Gregory Dufour, Pres/CEO • Marie McCarthy • Ann Bresnahan • Robert Merrill • William Dubord • Robin Sawyer • David Flanagan • Carl Soderberg 4
Senior Management Team • Gregory Dufour, President and Chief Executive Officer • Joanne Campbell, EVP - Risk Management Officer • Debbie Jordan, CPA, EVP – COO and CFO • Jennifer Mirabile, SVP – Director of Wealth Management • Tim Nightingale, EVP - Senior Loan Officer • Heather Robinson, SVP – Chief Human Resource Officer • Patricia Rose, EVP - Retail and Mortgage Banking Officer • Renée Smyth, EVP – Chief Experience and Marketing Officer 5

Meeting Minutes 6

Proposals Proposal 1: Election of Directors • Craig Denekas • David Flanagan • Marie McCarthy • James Page Proposal 2: “Say On Pay” Proposal 3: Ratification of Independent Registered Public Accounting Firm • RSM US LLP 7

Submission of Proxy Votes 8
Camden National Corporation 9
Financial Results for 2018 and First Quarter 2019 Debbie Jordan Executive Vice President, Chief Operating and Financial Officer 10
Forward Looking Statements and Non-GAAP Financial Measures FORWARD LOOKING STATEMENTS This presentation contains certain statements that may be considered forward-looking statements under the Private Securities Litigation Reform Act of 1995 and other federal securities laws, including certain plans, exceptions, goals, projections, and statements, which are subject to numerous risks, assumptions, and uncertainties. Forward-looking statements can be identified by the use of the words “believe,” “expect,” “anticipate,” “intend,” “estimate,” “assume,” “plan,” “target,” or “goal” or future or conditional verbs such as “will,” “may,” “might,” “should,” “could” and other expressions which predict or indicate future events or trends and which do not relate to historical matters. Forward-looking statements should not be relied on, because they involve known and unknown risks, uncertainties and other factors, some of which are beyond the control of Camden National Corporation (the “Company”). These risks, uncertainties and other factors may cause the actual results, performance or achievements of the Company to be materially different from the anticipated future results, performance or achievements expressed or implied by the forward-looking statements. The following factors, among others, could cause the Company’s financial performance to differ materially from the Company’s goals, plans, objectives, intentions, expectations and other forward-looking statements: weakness in the United States economy in general and the regional and local economies within the New England region and Maine, which could result in a deterioration of credit quality, an increase in the allowance for loan losses or a reduced demand for the Company’s credit or fee-based products and services; changes in trade, monetary, and fiscal policies and laws, including interest rate policies of the Board of Governors of the Federal Reserve System; inflation, interest rate, market, and monetary fluctuations; competitive pressures, including continued industry consolidation and the increased financial services provided by non-banks; volatility in the securities markets that could adversely affect the value or credit quality of the Company’s assets, impairment of goodwill, the availability and terms of funding necessary to meet the Company’s liquidity needs, and could lead to impairment in the value of securities in the Company's investment portfolio; changes in information technology that require increased capital spending; changes in consumer spending and savings habits; changes in tax, banking, securities and insurance laws and regulations; and changes in accounting policies, practices and standards, as may be adopted by the regulatory agencies as well as the Financial Accounting Standards Board ("FASB"), and other accounting standard setters. You should carefully review all of these factors, and be aware that there may be other factors that could cause differences, including the risk factors listed in the Company’s filings with the SEC, including our Annual Report on Form 10-K for the year ended December 31, 2018, as updated by the Company's quarterly reports on Form 10-Q and other filings with the Securities and Exchange Commission. You should carefully review the risk factors described therein and should not place undue reliance on our forward-looking statements. These forward-looking statements were based on information, plans and estimates at the date of this report, and we undertake no obligation to update any forward-looking statements to reflect changes in underlying assumptions or factors, new information, future events or other changes, except to the extent required by applicable law or regulation. NOTE REGARDING PRESENTATION OF NON-GAAP FINANCIAL MEASURES This presentation includes certain non-GAAP financial measures, including return on tangible equity. Schedules that reconcile the non-GAAP financial measures to GAAP financial information are included in our Annual Report on Form 10-K and earnings releases filed with the SEC. 11
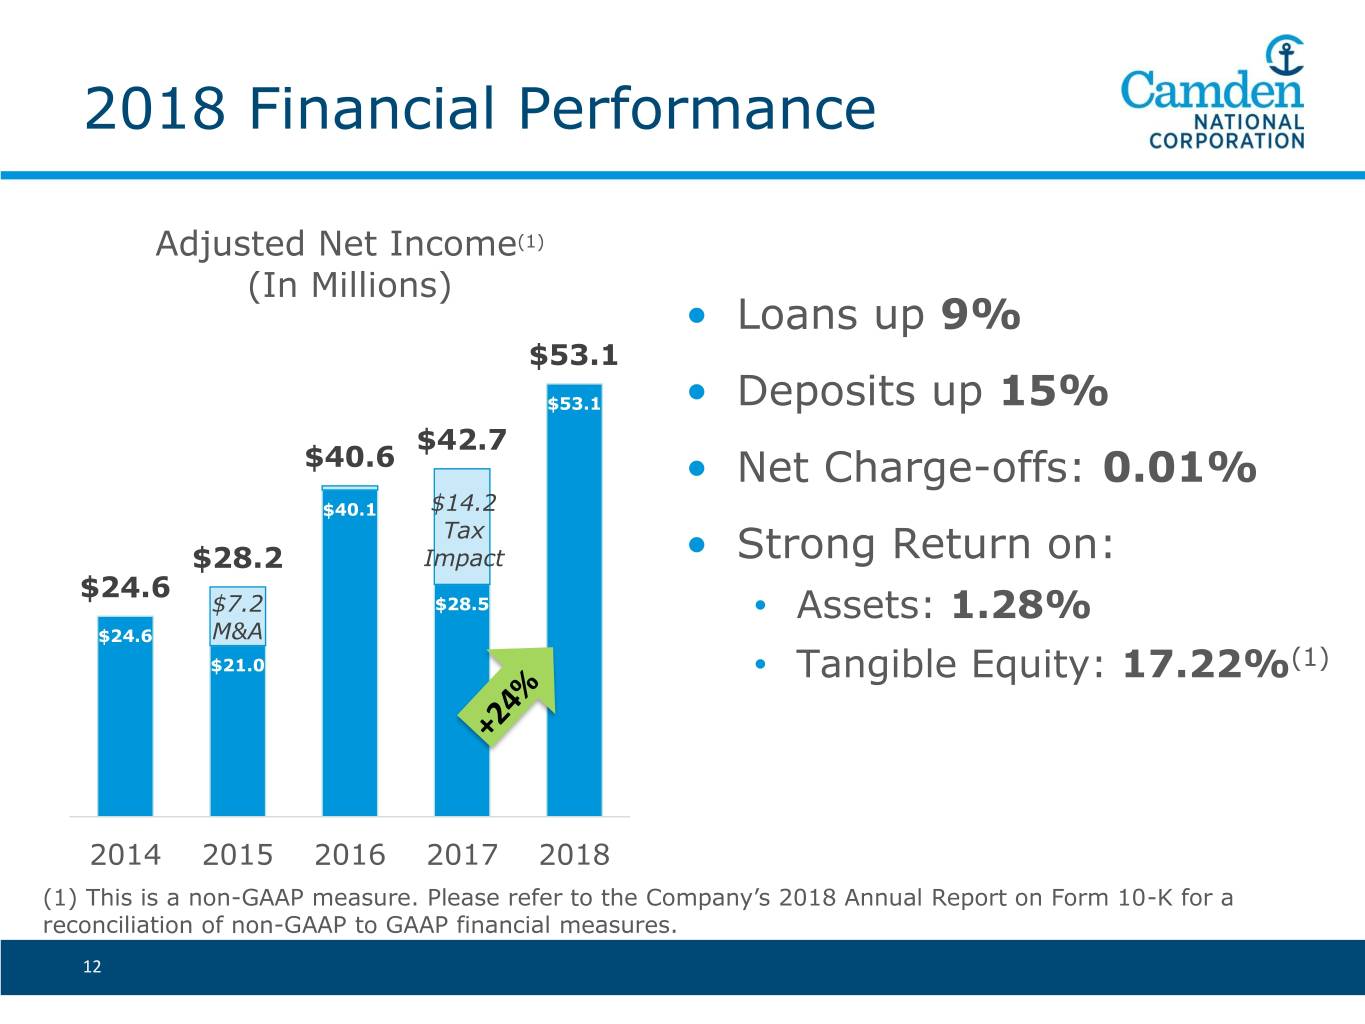
2018 Financial Performance Adjusted Net Income(1) (In Millions) • Loans up 9% $53.1 $53.1 • Deposits up 15% $42.7 $40.6 • Net Charge-offs: 0.01% $40.1 $14.2 Tax $28.2 Impact • Strong Return on: $24.6 $7.2 $28.5 • Assets: 1.28% $24.6 M&A $21.0 • Tangible Equity: 17.22%(1) 2014 2015 2016 2017 2018 (1) This is a non-GAAP measure. Please refer to the Company’s 2018 Annual Report on Form 10-K for a reconciliation of non-GAAP to GAAP financial measures. 12
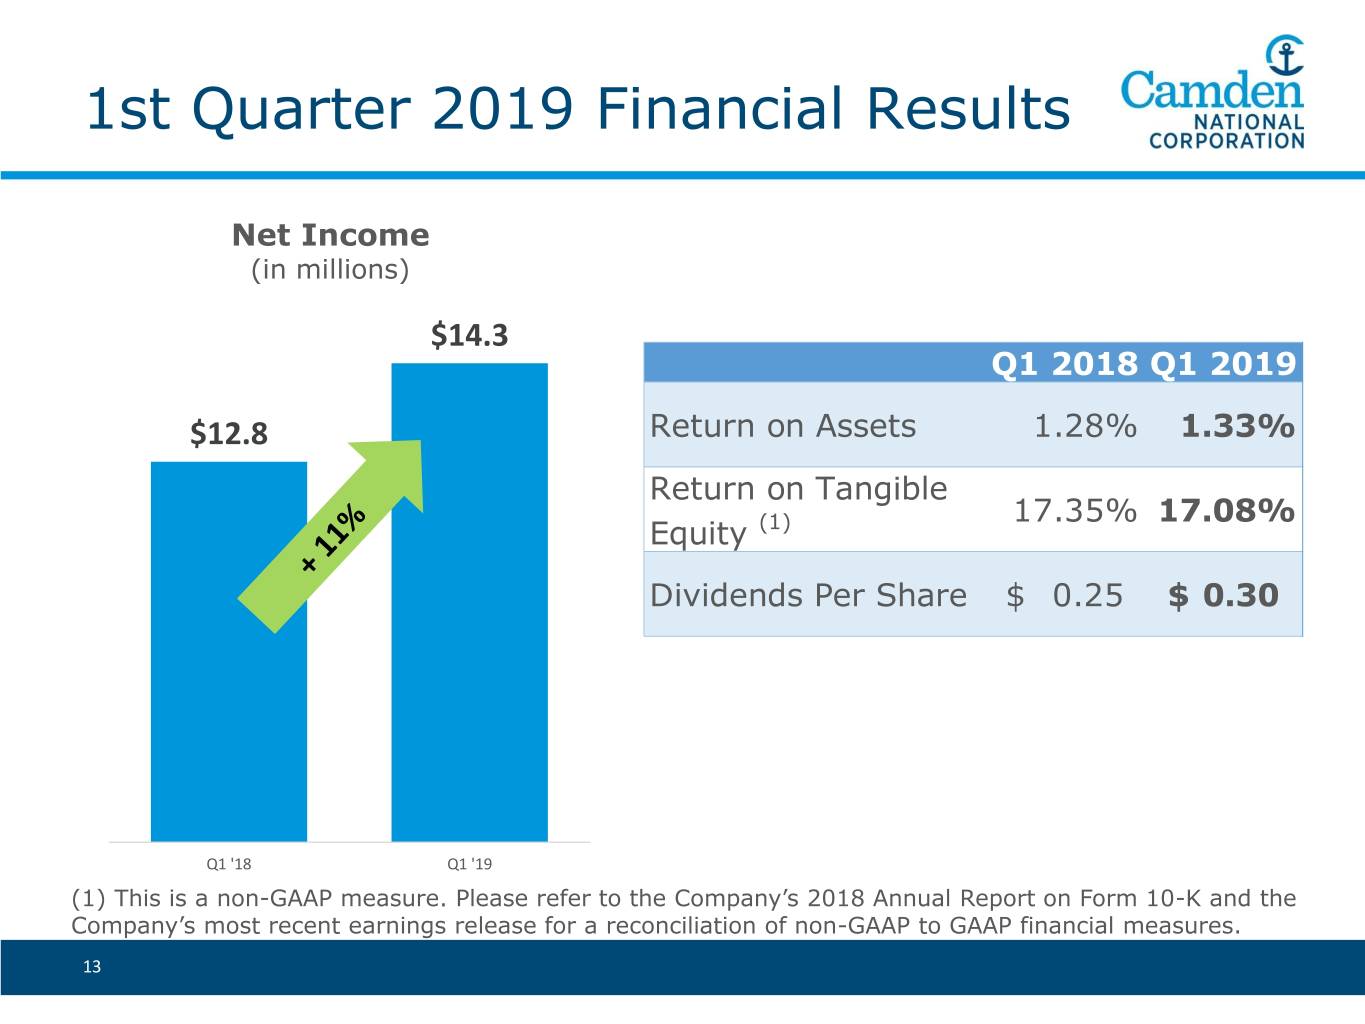
1st Quarter 2019 Financial Results Net Income (in millions) $14.3 Q1 2018 Q1 2019 $12.8 Return on Assets 1.28% 1.33% Return on Tangible 17.35% 17.08% Equity (1) Dividends Per Share $ 0.25 $ 0.30 Q1 '18 Q1 '19 (1) This is a non-GAAP measure. Please refer to the Company’s 2018 Annual Report on Form 10-K and the Company’s most recent earnings release for a reconciliation of non-GAAP to GAAP financial measures. 13

Three Year Total Return April 1, 2016 to March 31, 2019 Camden National Corporation 61.95% KBW Bank Index 54.73% SNL $1B to $5B Bank Index 48.86% Russell 2000 43.52% Proxy Peer Average 35.62% Proxy Peer – Average of 19 publicly traded commercial and savings banks in the Northeast. Source: SNL Financial - Total Return includes stock appreciation and dividends from 4/1/16 to 3/31/19 14
Voting Results Larry Sterrs Chair of the Board 15

Business Overview Greg Dufour President and Chief Executive Officer 16
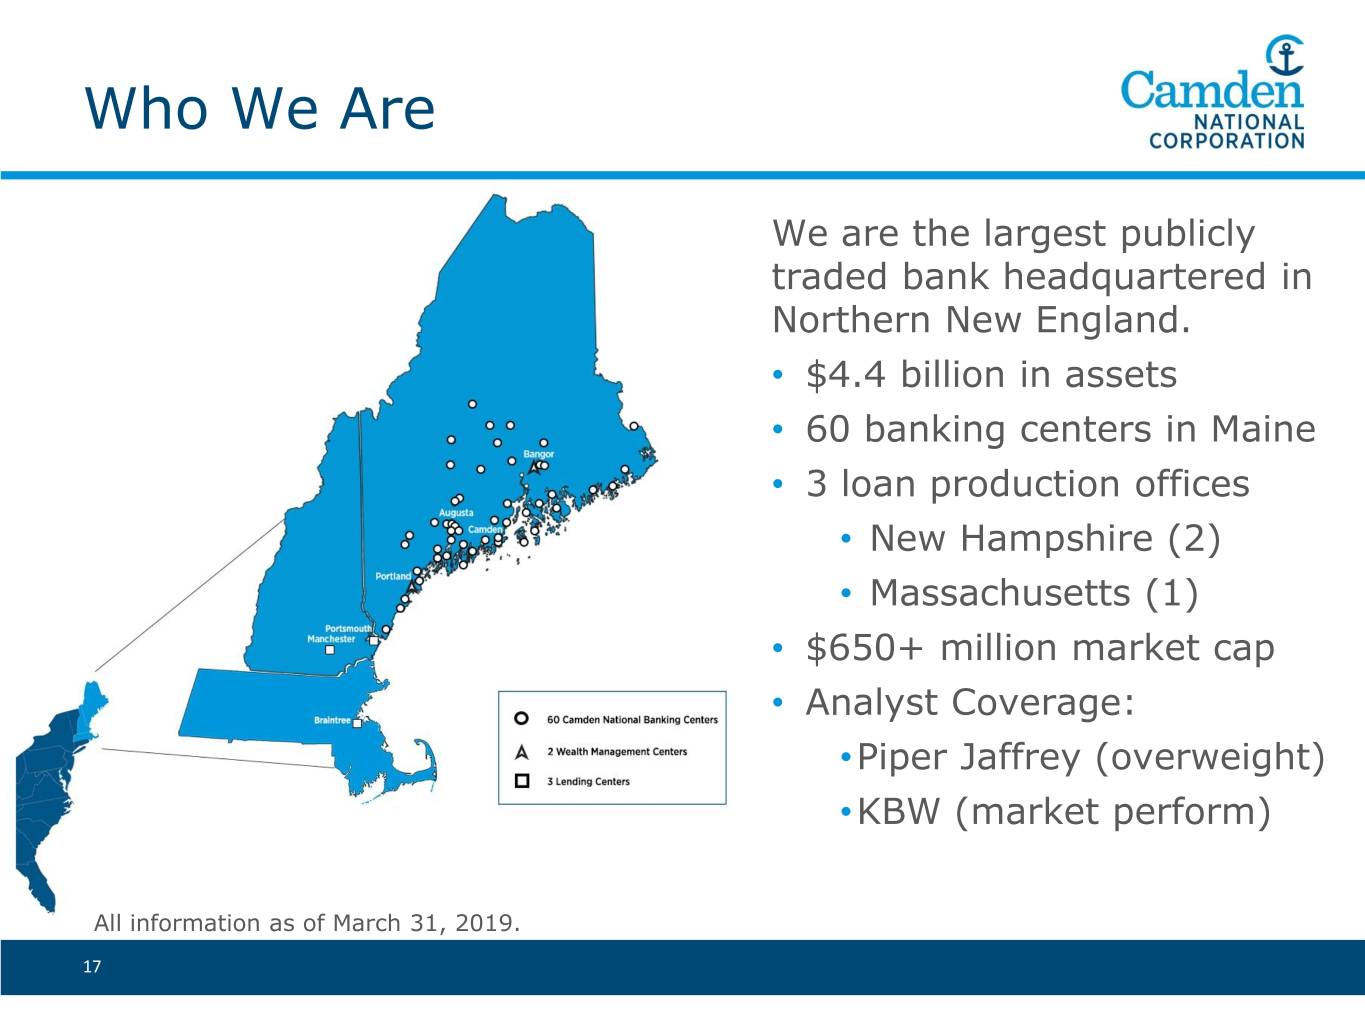
Who We Are We are the largest publicly traded bank headquartered in Northern New England. • $4.4 billion in assets • 60 banking centers in Maine • 3 loan production offices • New Hampshire (2) • Massachusetts (1) • $650+ million market cap • Analyst Coverage: •Piper Jaffrey (overweight) •KBW (market perform) All information as of March 31, 2019. 17
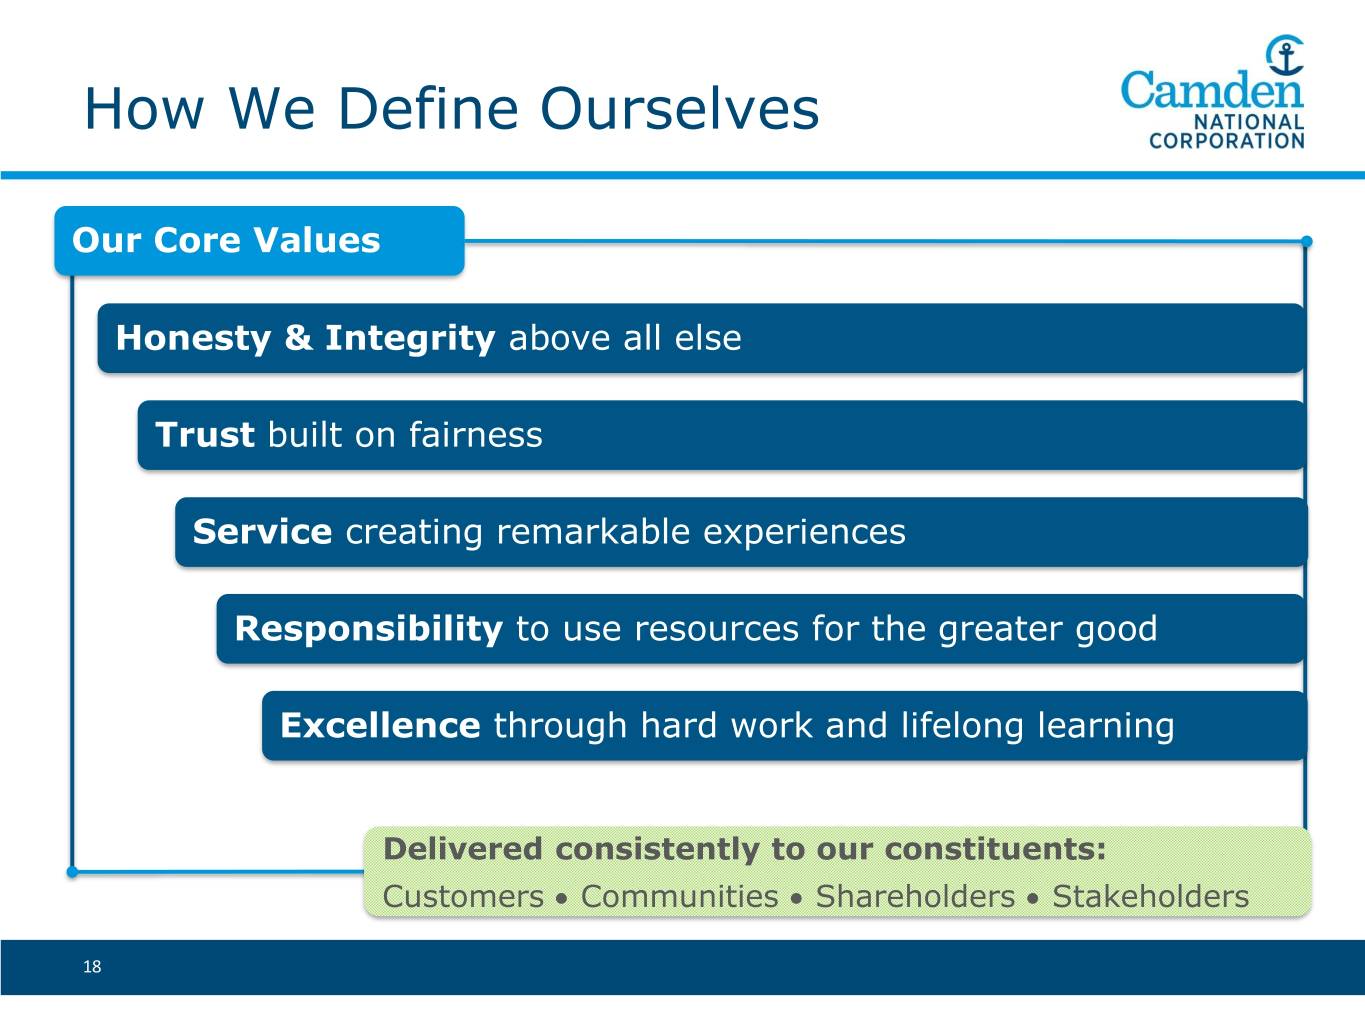
How We Define Ourselves Our Core Values Honesty & Integrity above all else Trust built on fairness Service creating remarkable experiences Responsibility to use resources for the greater good Excellence through hard work and lifelong learning Delivered consistently to our constituents: Customers Communities Shareholders Stakeholders 18
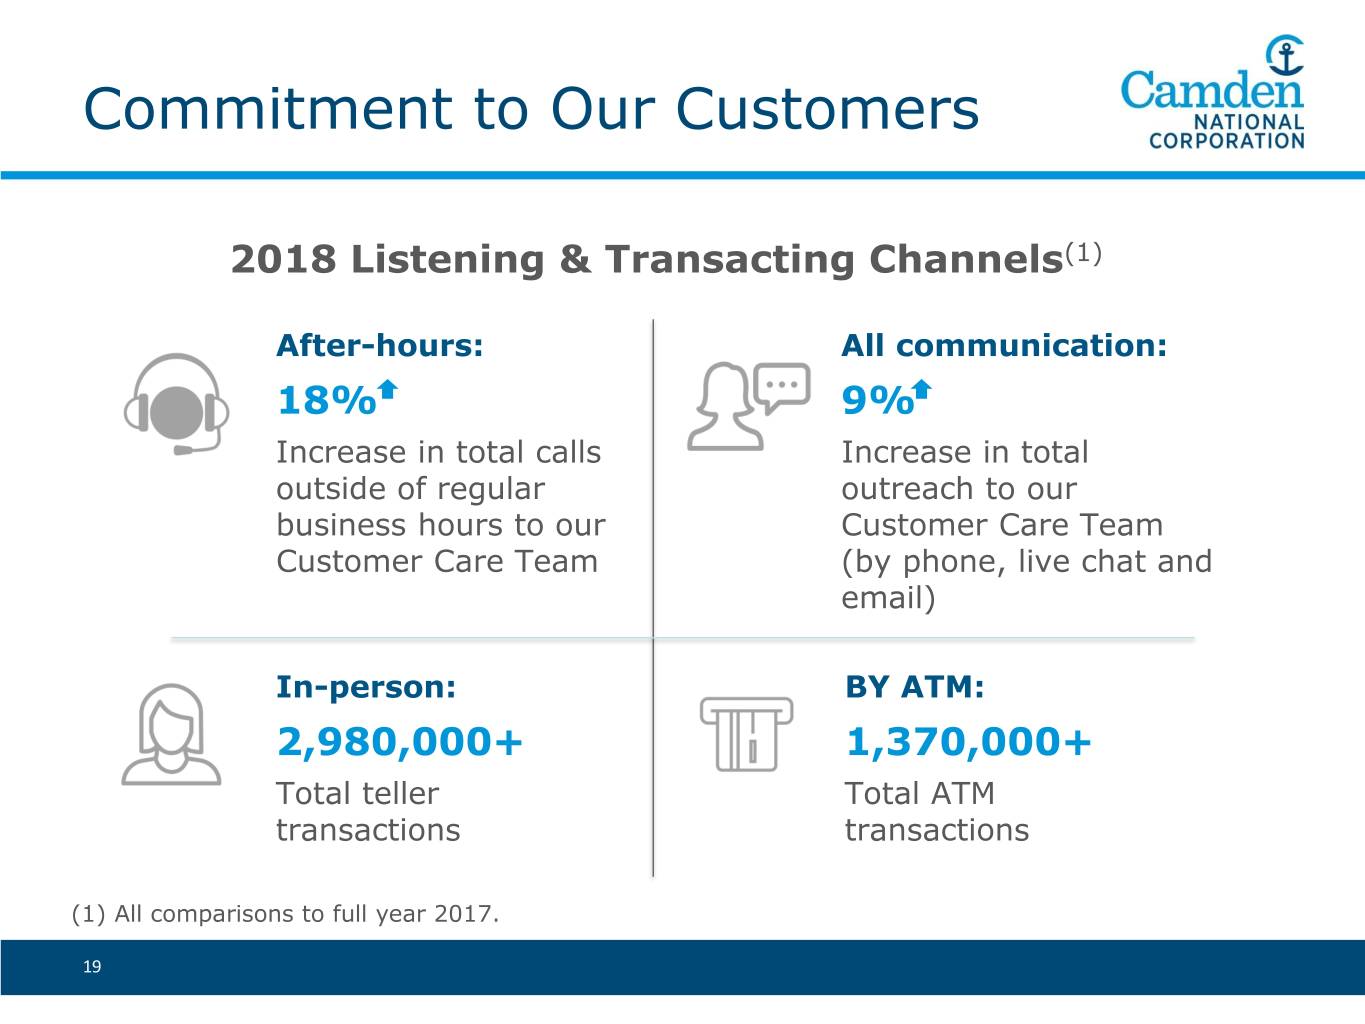
Commitment to Our Customers 2018 Listening & Transacting Channels(1) After-hours: All communication: 18% 9% Increase in total calls Increase in total outside of regular outreach to our business hours to our Customer Care Team Customer Care Team (by phone, live chat and email) In-person: BY ATM: 2,980,000+ 1,370,000+ Total teller Total ATM transactions transactions (1) All comparisons to full year 2017. 19
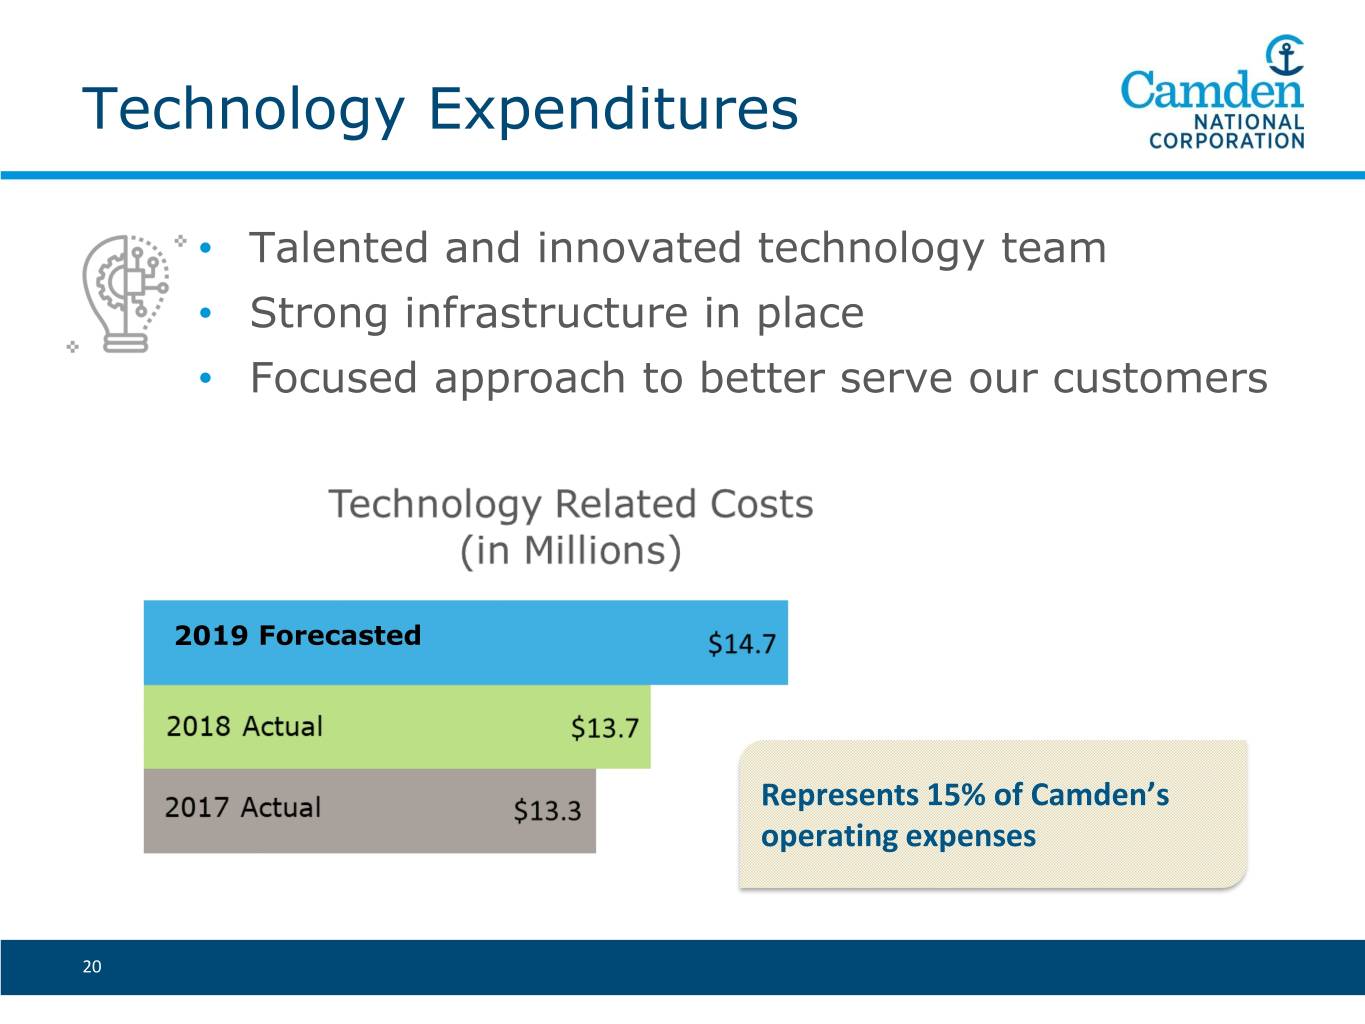
Technology Expenditures • Talented and innovated technology team • Strong infrastructure in place • Focused approach to better serve our customers 2019 Forecasted Represents 15% of Camden’s operating expenses 20
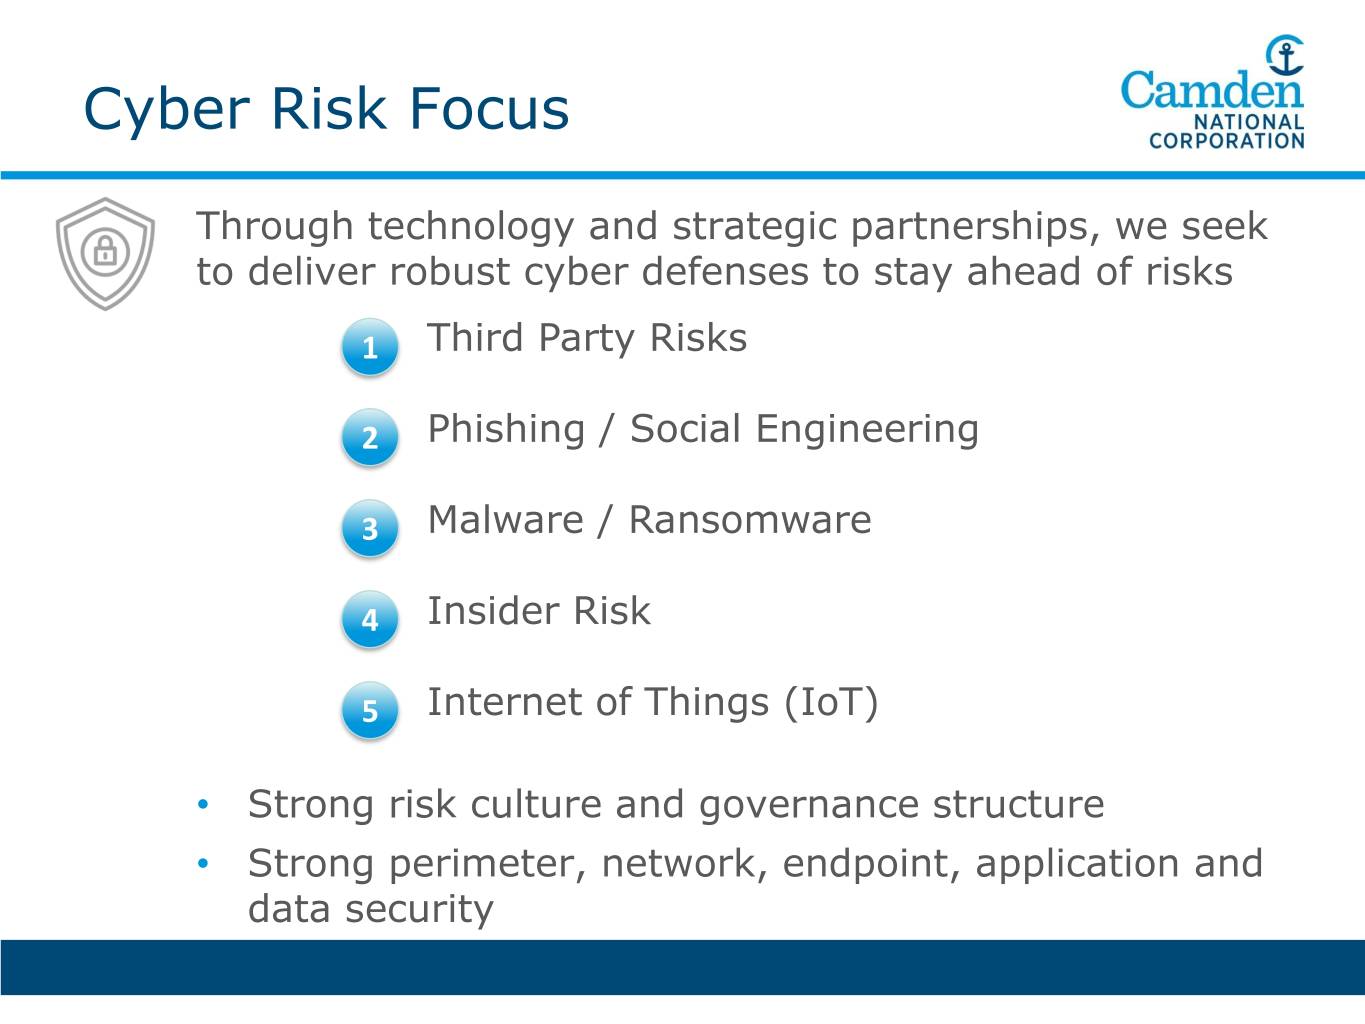
Cyber Risk Focus Through technology and strategic partnerships, we seek to deliver robust cyber defenses to stay ahead of risks 1 Third Party Risks 2 Phishing / Social Engineering 3 Malware / Ransomware 4 Insider Risk 5 Internet of Things (IoT) • Strong risk culture and governance structure • Strong perimeter, network, endpoint, application and data security
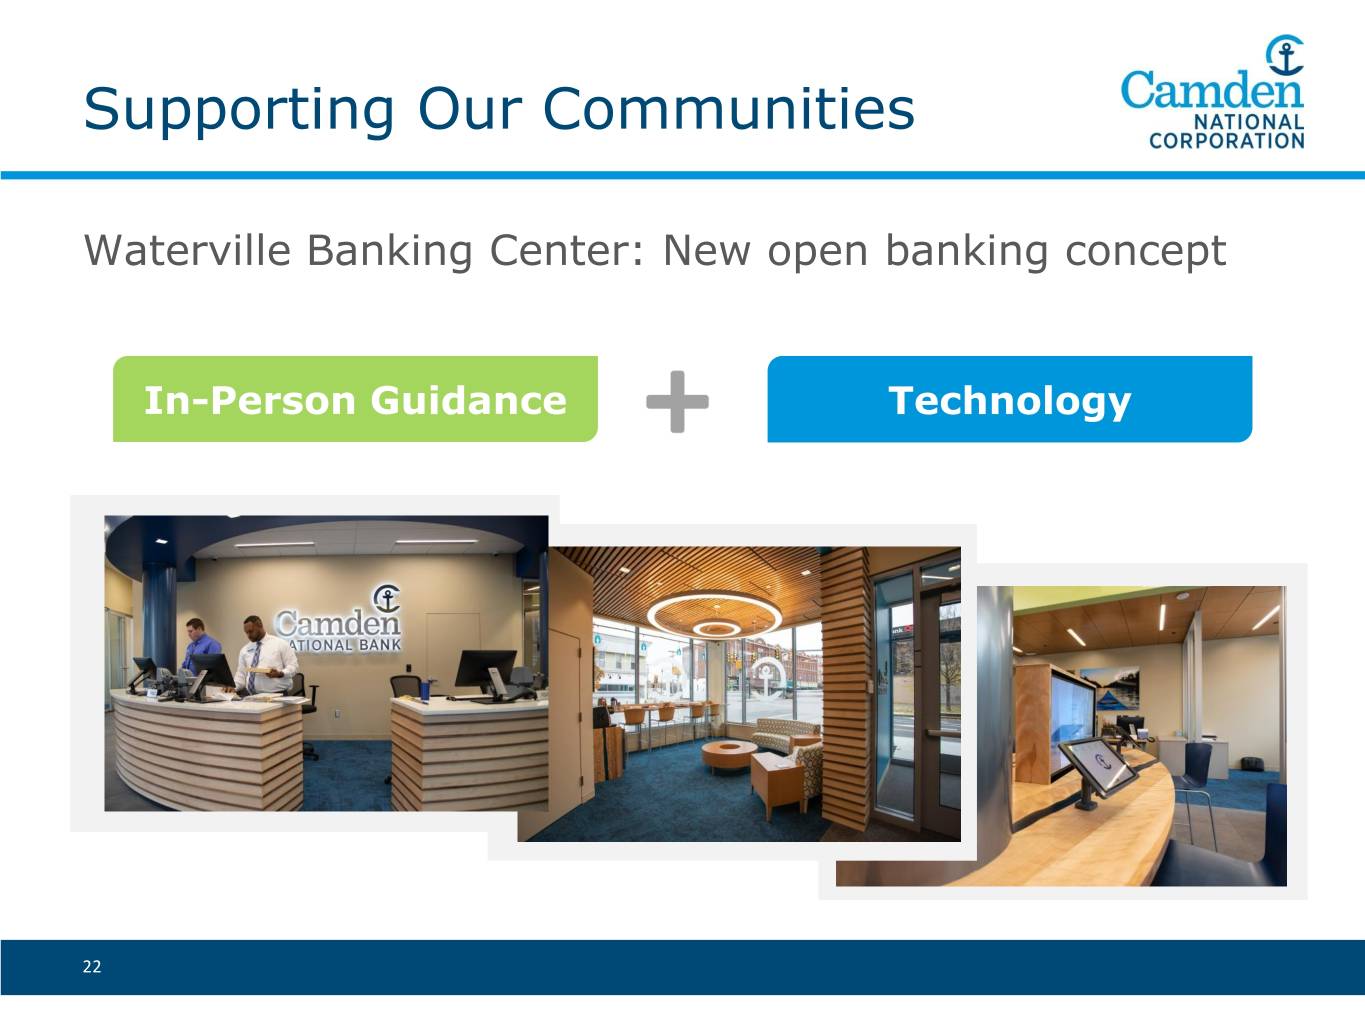
Supporting Our Communities Waterville Banking Center: New open banking concept In-Person Guidance Technology 22

Social Responsibility Hope@Home Employee $367,600 Commitment. (since 2015) $114,700 50 2018 Donations Homeless Shelters 17,000+ Employee volunteer hours recorded in 2018 Financial Fitness. New, online educational 1 in 5 resource for employees. Employees serve on nonprofit boards 23
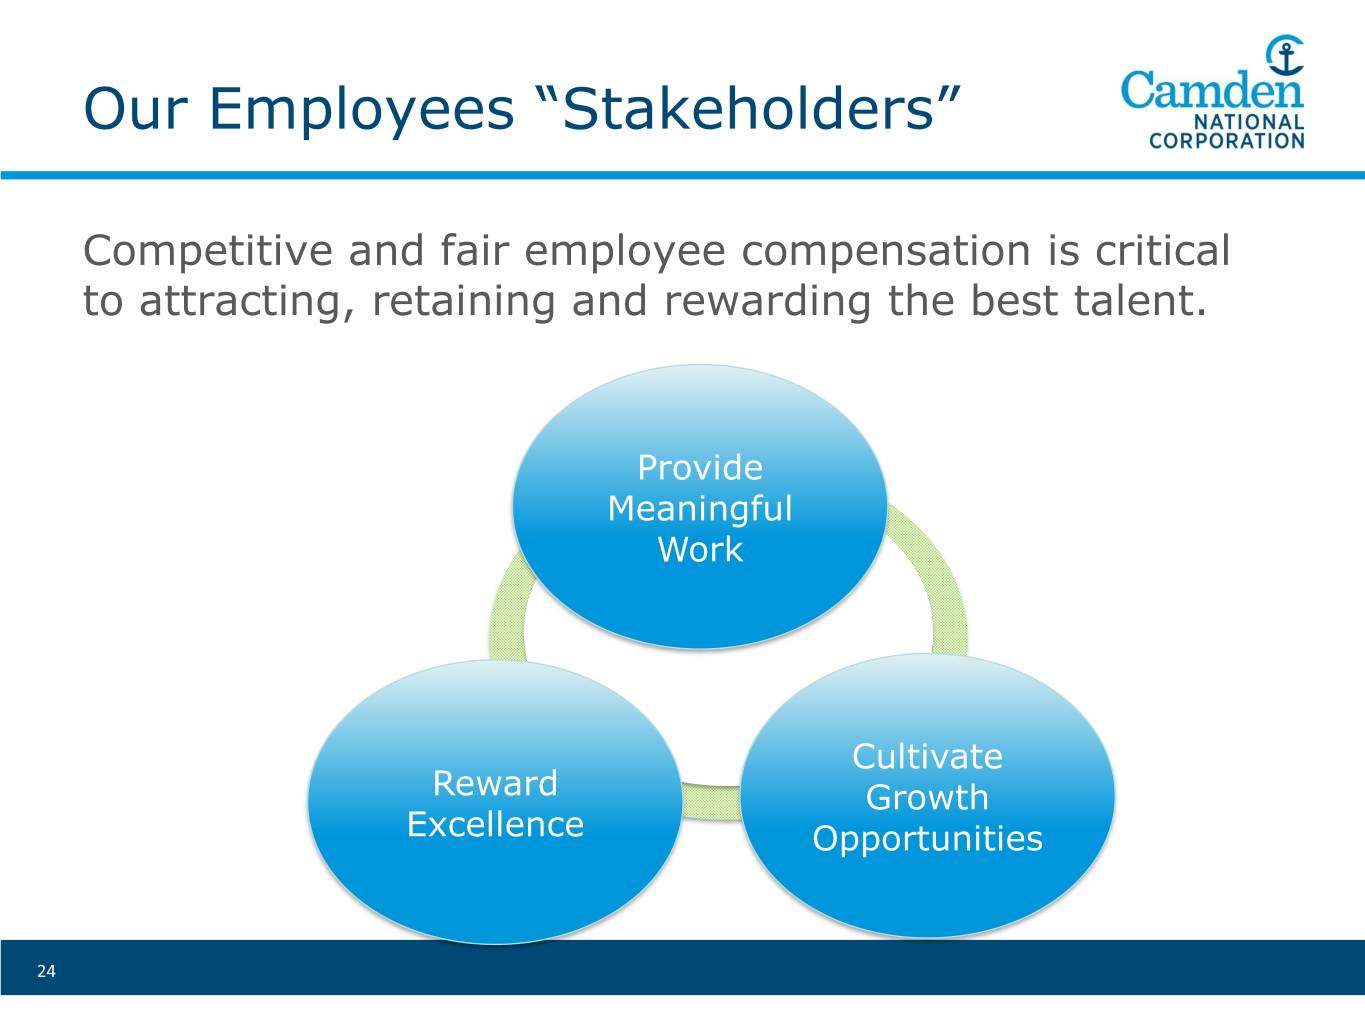
Our Employees “Stakeholders” Competitive and fair employee compensation is critical to attracting, retaining and rewarding the best talent. Provide Meaningful Work Cultivate Reward Growth Excellence Opportunities 24

Why Camden National? • Strong board governance; “low risk” ISS rating • Top tier employee engagement • Strong commitment to customers • Socially responsible full-service community bank • Strategically focused on long-term performance • Strong shareholder returns • 62% total return vs. 36% proxy peer group average(1) (1) Three-year total return from April 1, 2016 to March 31, 2019; Proxy Peer – Average of 19 publicly traded commercial and savings banks in the Northeast. 25

Question & Answers 26


