Dear Fellow Shareholders:
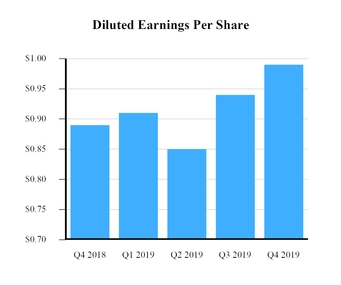
It is with great pride that I share Camden National Corporation’s 2019 strong financial results with record net income of $57.2 million and earnings per diluted share of $3.69, representing an 8% and 9% increase, respectively, over 2018. Our performance is the result of the strategic investments we have made, as well as the hard work and dedication of our valuable employees. Whether it’s helping customers buy their first home or building a new business, our employees are part of a caring team that goes the extra mile for our customers, communities, and each other.
Benefitting from Our Investments. We were able to maintain our net interest margin at 3.15% for 2019, compared to 3.16% for 2018 despite a challenging interest rate environment. The stability in this major source of revenue reflects our focus on building low-cost deposits within our market areas, dating back to our acquisition of 14 branches in 2012 and The Bank of Maine merger in 2015. Over several years, we have invested in our employees and technology throughout our branch network and treasury management areas, while expanding and strengthening our lending, underwriting, and risk management capabilities. As a result, average loans and deposits grew 8% and 14%, respectively, in 2019. Asset quality remained strong in 2019 with year-end non-performing assets to total assets at 0.25%, compared to 0.34% at the end of 2018.
Recognition of Our Efforts. As a result of our team’s hard work in 2019, I am proud to share that we were:
| |
| • | Named to the Sandler O’Neil Sm-All Stars Class of 2019 for top financial performance among small-cap banks and thrifts in the country |
| |
| • | Presented with the U.S. Small Business Administration (SBA) District Director Award for our exceptional dedication to Maine business growth |
| |
| • | Named Lender at Work for Maine by the Finance Authority of Maine (FAME) for the tenth time |
| |
| • | Recognized as Customer Experience Leader in U.S. Retail Banking by Greenwich Associates for exceeding industry benchmarks, for the second year in a row |
Recognizing Our Employees. We refer to our employees as “Stakeholders” to reflect the shared commitment and passion they have for our values, customers, communities, and ongoing success. Dedicated, collaborative, and highly productive, our employees contributed immensely to our 56% efficiency ratio in 2019, and helped to deliver outstanding financial results. We provide our employees with a “Total Rewards” program, including competitive salaries and benefits, long-term savings plans, as well as educational and advancement opportunities. To recognize their extraordinary efforts and share achievements in 2019, we will:
| |
| • | Award a $750 special cash bonus to certain non-executive, non-management employees, in addition to our existing stakeholder performance incentive plan |
| |
| • | Contribute $1.2 million to the profit sharing plan to aid our stakeholders’ retirement planning |
| |
| • | Continue to provide a strong benefits package in 2020 by offsetting the majority of employee health insurance premiums and contributing up to $3,150 annually into an employee’s Health Savings Account |
Rooted in Our Communities. Community is at the core of what we do and why we do it, and as we've grown over the years, our commitment to social responsibility and giving back have deepened. Impactful community investments included:
| |
| • | Hope@Home: In 2019, we donated more than $108,000 to over 50 homeless shelters in Maine, New Hampshire, and Massachusetts, bringing our total donation to $430,000 since 2015. |
| |
| • | Health & Wellness: We announced a $500,000 multi-year pledge to Pen Bay Healthcare and Maine Medical Center, to support long-term community health and wellness. |
| |
| • | Volunteerism: Our employees volunteered over 14,000 hours to support community organizations. One in five also serve on nonprofit boards. |
Grateful for You, Our Shareholders. By effectively managing capital and resources, we delivered a 12.44% return on average equity during 2019, slightly down from 12.92% in 2018, while our return on average assets improved to 1.30% for 2019 from 1.28% last year. In 2019, we recognized your valued support by:
| |
| • | Repurchasing 488,052 shares of our stock, returning nearly $21 million to our owners. |
| |
| • | Increasing our quarterly cash dividend in the fourth quarter by 10%, representing a $0.33 dividend for the fourth quarter of 2019, and declaring $18.9 million in total dividends to our owners in 2019. |
| |
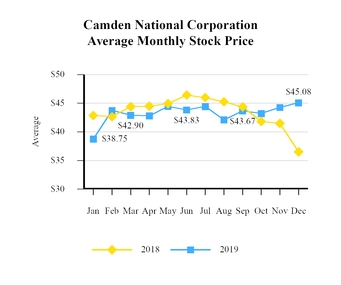
| • | Delivering a 31.78% total return on Camden National Corporation stock from December 31, 2018 to December 31, 2019. |
Please take note that our annual report and proxy voting process will be electronic this year, as more shareholders prefer to vote online and we strive to reduce our environmental impact. If you would like to receive hard copy materials and vote using paper, instructions to do so will be included within our upcoming proxy mailing. In the meantime, should you have any concerns or questions regarding this process change, please contact us at (800) 860-8821.
On behalf of everyone at Camden National Corporation, thank you for your support in 2019. We look forward to another fantastic year ahead.
Sincerely,
Gregory A. Dufour
President and Chief Executive Officer
 Fourth Quarter Report - 2019

