Fourth Quarter Report - 2020
Dear Fellow Shareholders:
Recently, one of our small business customers sent us a heartfelt thank you note. He shared that one of our banking center managers had reached out a few months ago to remind him about the Maine Economic Recovery grant program, and because of that outreach, he applied for and received the grant. Our customer let us know that thanks to our outreach, he was able to keep his business open without dipping into retirement savings.
This story and countless others from the past year illustrate how 2020 has presented many changes and challenges for our customers, communities, and employees. It also demonstrates that, by looking out for each other, we can all support each other during difficult times. Our sense of caring and commitment are embedded in our culture, which is driven by our vision and core values—enduring, as they have, since 1875.
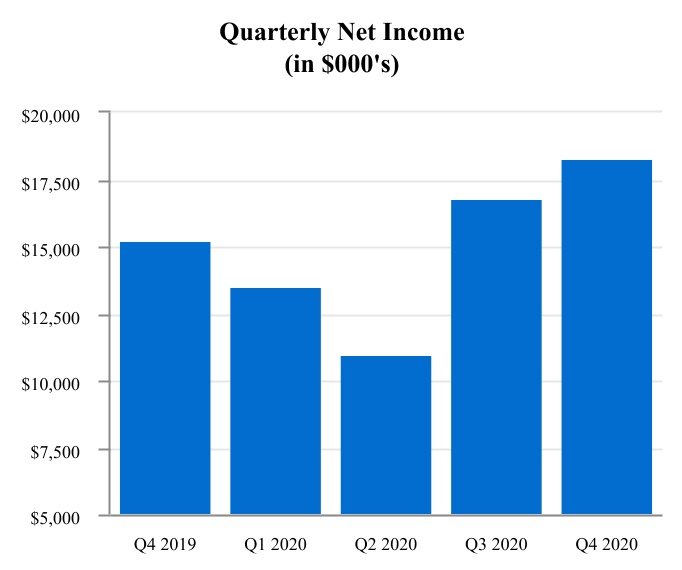
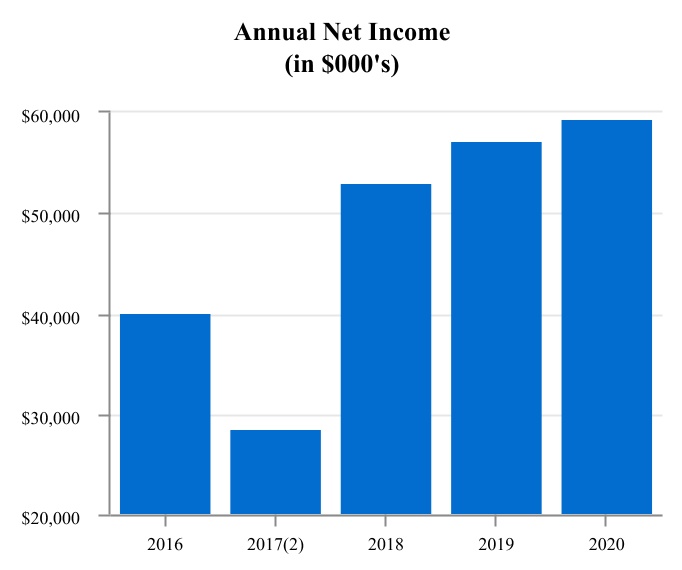
Financially resilient and strong. For our shareholders, we are pleased to report earnings for 2020 of $59.5 million, or $3.95 per diluted share, compared to $57.2 million, or $3.69 per diluted share for 2019. Record residential mortgage volume and the impact of Paycheck Protection Program (“PPP”) loans counterbalanced the impact historically low interest rates had on net interest income and the higher loan loss provision due to the health crisis.
We are known for thoughtful, deliberate capital management, and this past year, we did not shy away from strengthening our reserves and continuing to bolster our balance sheet. We recorded provisions for credit losses of $12.4 million, increasing our allowance for loan losses to total loans, excluding PPP loans, to 1.23% at December 31, 2020, up from 0.81% at the previous year-end. Asset quality was also strong with non-performing assets to total assets of 0.22% at December 31, 2020, and, net charge-offs for the year of 0.02% of average loans. Our tangible common equity ratio and total risk-based capital ratio
were 8.99% and 15.40%, respectively, at December 31, 2020, highlighting our capital strength.
Anchored in our communities. Strong earnings in 2020 also allowed us to deepen our commitment to areas of need throughout our communities. In previous letters, I’ve shared our ongoing efforts to support local homeless shelters through our Hope@Home program, as well as our focus on partnering with local organizations to combat key issues, such as food insecurity and domestic violence. Equally important is our commitment to the many incredible community nonprofits where our employees volunteered throughout the year. In recognition of our team’s dedication and care, we designated $21,000 for organizations where our employees volunteer.
Delivering impressive year-end results through such a challenging environment requires a deep commitment to core values and a willingness to remain balanced and agile. When we look back at the beginning of the year, we couldn’t have imagined the challenges that would unfold, but I’m honored to report that Camden National Corporation has been—and continues to be—positioned to thrive. Our constituents trust that they can rely on us, and it is thanks to our talented team, dedicated directors, prudent capital management, and resilient operating model that we look to the future with hope, readiness, and much potential.
Thank you, as always, for your steadfast support and loyalty.
Be well,
Gregory A. Dufour
President and Chief Executive Officer
Financial Highlights (unaudited)
Three Months Ended December 31, | Year Ended December 31, | |||||||||||||||||||||||||
(Dollars in thousands, except per share data) | 2020 | 2019 | 2020 | 2019 | ||||||||||||||||||||||
Earnings and Dividends | ||||||||||||||||||||||||||
Net interest income | $ | 35,461 | $ | 32,239 | $ | 136,307 | $ | 127,630 | ||||||||||||||||||
Non-interest income | 14,331 | 11,948 | 50,490 | 42,113 | ||||||||||||||||||||||
Non-interest expense | (26,692) | (24,814) | (99,983) | (95,303) | ||||||||||||||||||||||
Pre-tax, pre-provision earnings(1) | 23,100 | 19,373 | 86,814 | 74,440 | ||||||||||||||||||||||
Provision for credit losses | (258) | (214) | (12,418) | (2,861) | ||||||||||||||||||||||
Income before income tax expense | 22,842 | 19,159 | 74,396 | 71,579 | ||||||||||||||||||||||
Income tax expense | (4,564) | (3,921) | (14,910) | (14,376) | ||||||||||||||||||||||
Net income | $ | 18,278 | $ | 15,238 | $ | 59,486 | $ | 57,203 | ||||||||||||||||||
Diluted earnings per share | $ | 1.22 | $ | 0.99 | $ | 3.95 | $ | 3.69 | ||||||||||||||||||
Cash dividends declared per share | 0.33 | 0.33 | 1.32 | 1.23 | ||||||||||||||||||||||
Performance Ratios | ||||||||||||||||||||||||||
Return on average assets | 1.45 | % | 1.35 | % | 1.23 | % | 1.30 | % | ||||||||||||||||||
Return on average equity | 13.94 | % | 12.77 | % | 11.81 | % | 12.44 | % | ||||||||||||||||||
Net interest margin (fully-taxable equivalent) | 3.06 | % | 3.12 | % | 3.09 | % | 3.15 | % | ||||||||||||||||||
Efficiency ratio1 | 53.30 | % | 55.64 | % | 52.56 | % | 55.77 | % | ||||||||||||||||||
Balance sheet (end of period) | ||||||||||||||||||||||||||
Investments | $ | 1,128,651 | $ | 933,069 | ||||||||||||||||||||||
Loans and loans held for sale | 3,261,379 | 3,106,877 | ||||||||||||||||||||||||
Allowance for loan losses | 37,865 | 25,171 | ||||||||||||||||||||||||
Total assets | 4,898,745 | 4,429,521 | ||||||||||||||||||||||||
Deposits | 4,005,244 | 3,537,743 | ||||||||||||||||||||||||
Borrowings | 246,770 | 337,889 | ||||||||||||||||||||||||
Shareholders' equity | 529,314 | 473,415 | ||||||||||||||||||||||||
Book Value per Share and Capital Ratios | ||||||||||||||||||||||||||
Book value per share | $ | 35.50 | $ | 31.26 | ||||||||||||||||||||||
Tangible book value per share1 | 28.96 | 24.77 | ||||||||||||||||||||||||
Tangible common equity ratio1 | 8.99 | % | 8.66 | % | ||||||||||||||||||||||
Tier I leverage capital ratio | 9.13 | % | 9.55 | % | ||||||||||||||||||||||
Common equity tier 1 risk-based capital ratio | 12.45 | % | 11.80 | % | ||||||||||||||||||||||
Total risk-based capital ratio | 15.40 | % | 14.44 | % | ||||||||||||||||||||||
Asset Quality | ||||||||||||||||||||||||||
Allowance for loan losses to total loans | 1.18 | % | 0.81 | % | ||||||||||||||||||||||
Allowance for loan losses to total loans, excluding SBA PPP loans(1) | 1.23 | % | 0.81 | % | ||||||||||||||||||||||
Net charge-offs to average loans (annualized) | 0.02 | % | 0.08 | % | ||||||||||||||||||||||
Non-performing loans to total loans | 0.33 | % | 0.36 | % | ||||||||||||||||||||||
Non-performing assets to total assets | 0.22 | % | 0.25 | % |
1 This is a non-GAAP measure. A reconciliation of non-GAAP to GAAP financial measures can be found in the Company's earnings release dated and filed with the SEC on January 26, 2021.
2 Annual net income for 2017 reflects a $14.3 million income tax charge upon the enactment of a change in federal corporate
income tax as a result of the Tax Cut and Jobs Act of 2017.
A complete set of financial statements for Camden National Corporation may be obtained upon written request to Camden National Corporation, P.O. Box 310, Camden, Maine 04843.