1 Investor Presentation Gregory Dufour | President & Chief Executive Officer Gregory White | Chief Financial Officer August 3, 2021

2 Forward Looking Statements This presentation contains certain statements that may be considered forward-looking statements under the Private Securities Litigation Reform Act of 1995 and other federal securities laws, including certain plans, exceptions, goals, projections, and statements, which are subject to numerous risks, assumptions, and uncertainties. Forward-looking statements can be identified by the use of the words “believe,” “expect,” “anticipate,” “intend,” “estimate,” “assume,” “plan,” “target,” or “goal” or future or conditional verbs such as “will,” “may,” “might,” “should,” “could” and other expressions which predict or indicate future events or trends and which do not relate to historical matters. Forward-looking statements should not be relied on, because they involve known and unknown risks, uncertainties and other factors, some of which are beyond the control of Camden National Corporation (the “Company”). These risks, uncertainties and other factors may cause the actual results, performance or achievements of the Company to be materially different from the anticipated future results, performance or achievements expressed or implied by the forward-looking statements. The following factors, among others, could cause the Company’s financial performance to differ materially from the Company’s goals, plans, objectives, intentions, expectations and other forward-looking statements: (i) weakness in the United States economy in general and the regional and local economies within the New England region and Maine, which could result in a deterioration of credit quality, an increase in the allowance for credit losses or a reduced demand for the Company’s credit or fee-based products and services; (ii) changes in trade, monetary, and fiscal policies and laws, including interest rate policies of the Board of Governors of the Federal Reserve System; (iii) inflation, interest rate, market, and monetary fluctuations; (iv) competitive pressures, including continued industry consolidation and the increased financial services provided by non-banks; (v) volatility in the securities markets that could adversely affect the value or credit quality of the Company’s assets, impairment of goodwill, or the availability and terms of funding necessary to meet the Company’s liquidity needs, and that could lead to impairment in the value of securities in the Company's investment portfolio; (vi) changes in information technology and other operational risks, including cybersecurity, that require increased capital spending; changes in consumer spending and savings habits; (vii) changes in tax, banking, securities and insurance laws and regulations; and (viii) changes in accounting policies, practices and standards, as may be adopted by the regulatory agencies as well as the Financial Accounting Standards Board, and other accounting standard setters. In addition, statements about the potential effects of the COVID-19 pandemic on the Company’s businesses and results of operations and financial conditions may constitute forward- looking statements. Such statements may include, but are not limited to, statements concerning: (i) the continued effectiveness of our Pandemic Work Group; (ii) the continuing ability of our employees to work remotely; (iii) our continuing ability to staff our branches and keep our branches open; (iv) the continuing strength of our capital and liquidity positions; (v) our continued ability to access sources of contingent liquidity; (vi) the continuing strength of our asset quality within our loan portfolio; and (vii) the potential effectiveness of relief measures and programs for customers affected by COVID-19. These statements are subject to the risk that the actual effects may differ, possibly materially, from what is reflected in those forward-looking statements due to factors and future developments that are uncertain, unpredictable and in many cases beyond our control, including the scope and duration of the pandemic, actions taken by governmental authorities in response to the pandemic, and the direct and indirect impact of the pandemic on our customers, third parties and the Company. You should carefully review all of these factors, and be aware that there may be other factors that could cause the Company’s actual results to differ materially from those anticipated, including the risk factors listed in the Company’s filings with the SEC, including our Annual Report on Form 10-K for the year ended December 31, 2020, as updated by the Company's quarterly reports on Form 10-Q and other filings with the Securities and Exchange Commission. You should carefully review the risk factors described therein and should not place undue reliance on our forward-looking statements. These forward-looking statements were based on information, plans and estimates at the date of this presentation, and we undertake no obligation to update any forward-looking statements to reflect changes in underlying assumptions or factors, new information, future events or other changes, except to the extent required by applicable law or regulation.

3 Non-GAAP Financial Measures This presentation includes certain non-GAAP financial measures. Management uses these non-GAAP financial measures for purposes of measuring our performance against our peer group and other financial institutions and analyzing our internal performance. These non-GAAP financial measures also help investors better understand the Company’s operating performance and trends and allow for better performance comparisons to other financial institutions. These measures are not a substitute for GAAP operating results and may not be comparable to non-GAAP measures used by other financial institutions. Schedules that reconcile the non-GAAP financial measures to GAAP financial information are included in our Annual Report on Form 10-K and earnings releases filed with the SEC.

4 Camden National Corporation Largest publicly traded bank headquartered in Northern New England • $5.2 billion in assets • 58 banking centers • Maine - 57 • New Hampshire - 1 • 2 loan production offices • New Hampshire - 1 • Massachusetts - 1 • $670 million market cap • 50 day avg share volume of approximately 47,000 • Analyst Coverage • Raymond James (outperform) • Stephens (overweight) • KBW (market perform) • Janney (market perform)
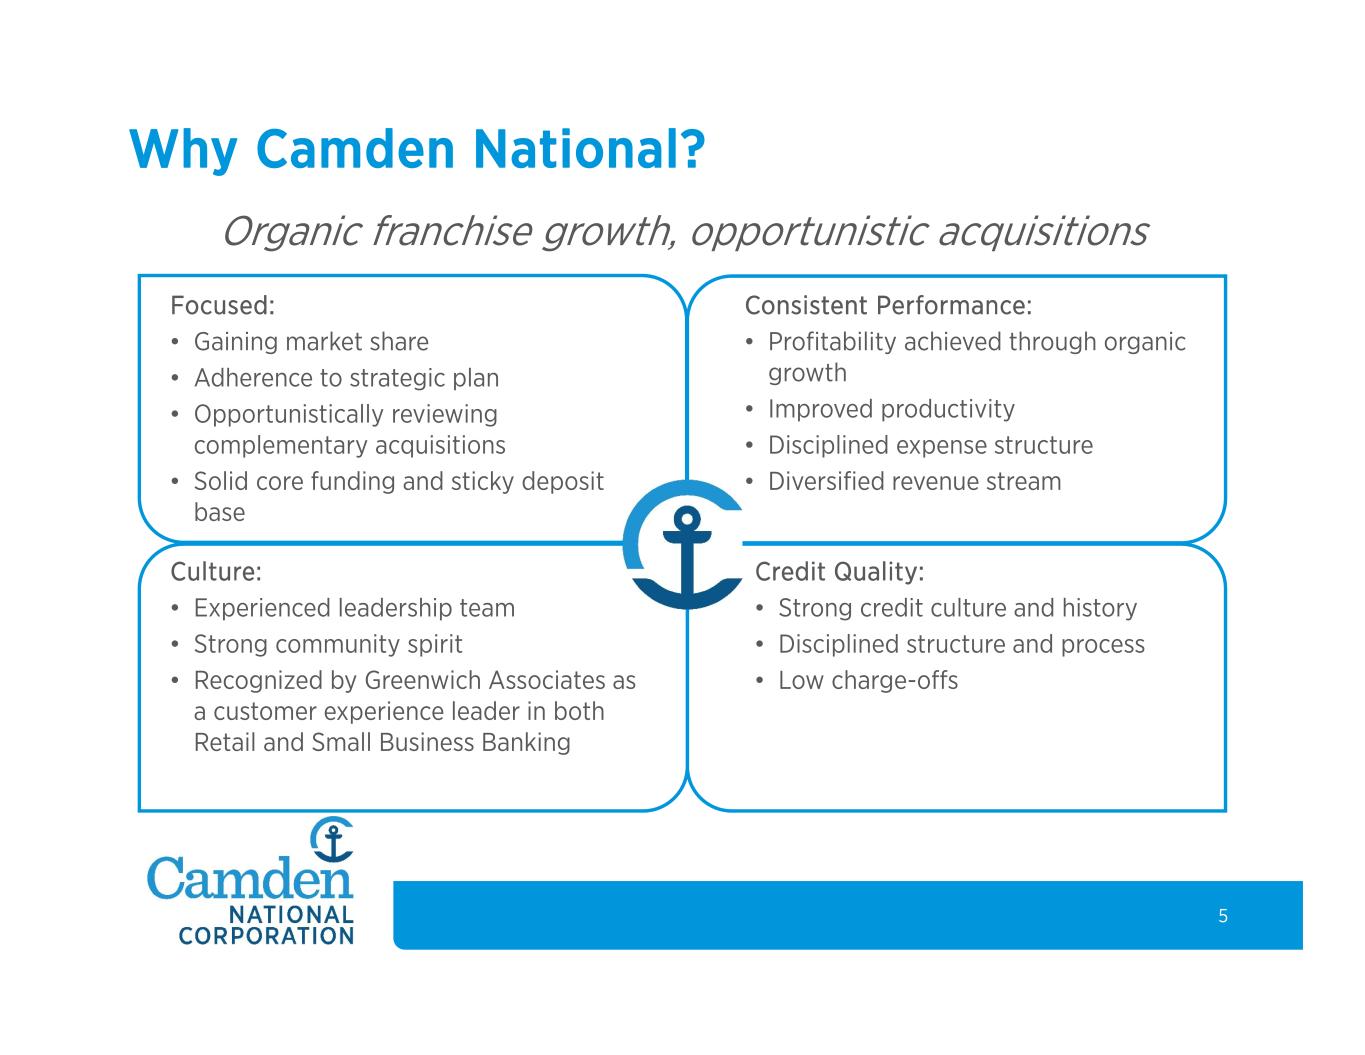
5 Why Camden National? Organic franchise growth, opportunistic acquisitions Focused: • Gaining market share • Adherence to strategic plan • Opportunistically reviewing complementary acquisitions • Solid core funding and sticky deposit base Culture: • Experienced leadership team • Strong community spirit • Recognized by Greenwich Associates as a customer experience leader in both Retail and Small Business Banking Consistent Performance: • Profitability achieved through organic growth • Improved productivity • Disciplined expense structure • Diversified revenue stream Credit Quality: • Strong credit culture and history • Disciplined structure and process • Low charge-offs
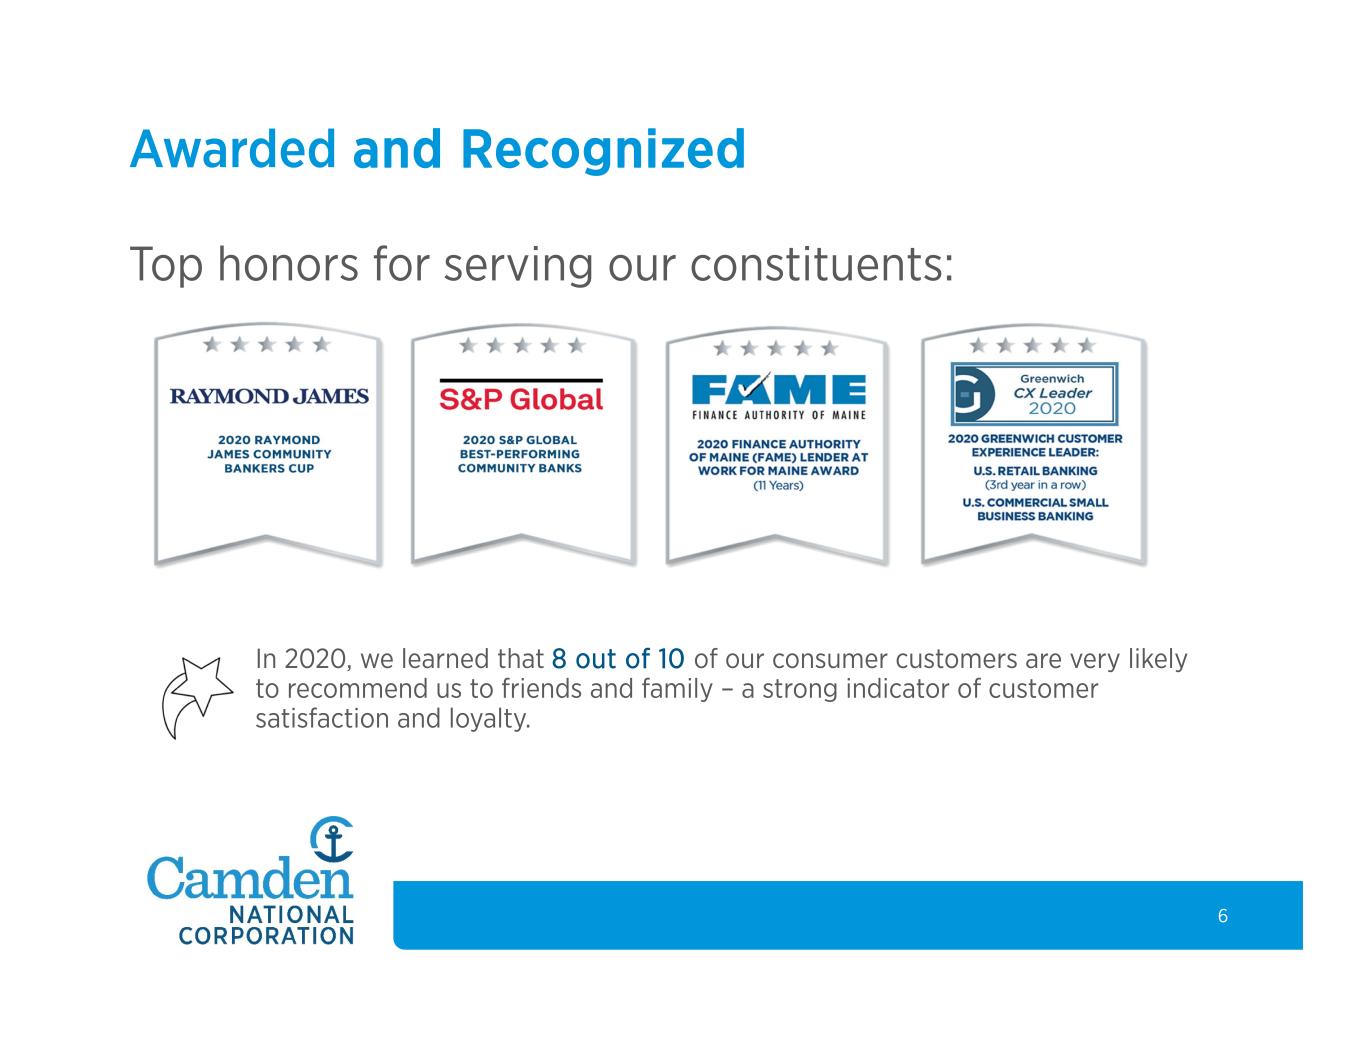
6 Awarded and Recognized Top honors for serving our constituents: In 2020, we learned that 8 out of 10 of our consumer customers are very likely to recommend us to friends and family – a strong indicator of customer satisfaction and loyalty.

7 Second Quarter 2021 Highlights • Second quarter net income down 8% compared to last quarter’s record earnings • Second quarter mortgage banking income $4.5 million lower on a linked quarter basis due to strategic shift to hold more residential mortgage production in portfolio • Provision release of $3.4 million for the second quarter, and a $5.4 million provision release for the first half of 2021 • No loans on short-term deferral arrangements due to COVID-19 as of June 30, 2021 • Asset quality remains strong • Maintained a strong capital and liquidity position Net Income $18.1 million Diluted Earnings Per Share $1.21 Return on Assets 1.42% Efficiency Ratio (non-GAAP) 56.72% Total Risk-Based Capital Ratio 15.26%

8 Net Interest Income and Net Interest Margin Estimated Changes in Net Interest Income(1) Year 1 Year 2 +200 bps 0.81% 5.86% -100 bps -1.27% -11.41% (1) Assumes flat balance sheet, no changes in asset/funding mix, and a parallel and pro rata shift in rates over a 12 month period. In the down -100 bps scenarios, Prime is floored at 3.00%, Fed Funds and Treasury rates at 0.01%, and all other market rates are floored at the lesser of current rates or 0.25%. As of June 30, 2021. Recent actions and continued focus • Hold a larger portion of residential mortgage production in portfolio • Deploy excess cash into investment portfolio • Commercial loan growth through syndications and small business specials • Continue to manage deposit rates lower • In Q2 2021, shifted $272 million of consumer deposits from interest to non-interest checking through a checking product redesign • In Q2 2021, called $15 million of subordinated debt, at par plus accrued and unpaid interest NII and NIM ($ in millions) Q2 2021 Net Interest Margin

9 Diversified Revenue Fee income is 25% of total revenue (net interest income plus fee income) All data is presented as of June 30, 2021.

10 Loan Portfolio Residential Real Estate • 68% located in Maine and 25% in Massachusetts • 63% are primary residences, 29% second homes and 8% investment property • 97% of balances at </= 80% LTV(1) (or supplemented with private mortgage insurance) Commercial Real Estate • 68% of real estate located in Maine, 19% in New Hampshire, and 8% in Massachusetts • 92% of balances at </= 80% LTV(1) • Top 50 CRE loans average a 67% LTV(1) Commercial • SBA PPP loans contributed $158.3 million to average loan balances for Q2 with an average yield of 4.15% Loan Repricing • $1.0 billion repricing in the next 12 months (average yield 2.94%) • Floating rate: $910 million, 4% with in-the-money floors, and 75% without floors • Adjustable rate: $94 million, 0% with in-the-money floors, and 43% without floors All data is presented as of June 30, 2021. (1) At origination date. Balances of $3.3 Billion (as of 6/30/21)

11 Commercial Diversification CRE and Commercial Loans by Industry (as of 6/30/21) Real Estate Investment Breakdown (as of 6/30/21) Exposure to COVID-19 impacted industries • $389.6 million, or 12% of total loan portfolio, is within Lodging, Sr. Living & Care Facilities, Restaurants, and Travel & Recreation • 55% of Lodging located in Maine, 23% in Massachusetts, and 12% in New Hampshire. Approximately 54% are nationally branded franchises. • Approximately 99% of Office Buildings are located in New England. 58% located in Maine, 32% New Hampshire, and 9% in Massachusetts $1.9 billion $804 million

12 SBA PPP Loans Year Units Total Production ($ in millions) Total Outstanding(1) ($ in millions) 2020 3,034 $244.8 $29.5 2021 1,620 $102.2 $102.0 Total 4,654 $347.0 $131.5 Period Origination Fees ($ in millions) Interest ($ in millions) Total Income ($ in millions) Full Year 2020 $6.2 $1.6 $7.8 Q1 2021 $1.5 $0.4 $1.9 Q2 2021 $1.3 $0.4 $1.7 Total $9.0 $2.4 $11.4 • $5.4 million of origination fees were yet to be recognized at 6/30/21 Total Originations Income Recognized All data is presented as of June 30, 2021 unless otherwise noted. (1) Excludes unamortized origination fees.

13 COVID-19 Loan Deferral Details 12/31/2020 3/31/2021 6/30/2021 Category ($ in millions) Deferred Volume % of Category Deferred Deferred Volume % of Category Deferred Deferred Volume % of Category Deferred Real Estate Investment $7.1 0.9% $0.9 0.1% $0.0 0.0% Lodging $6.9 2.6% $0.0 0.0% $0.0 0.0% Other Services (expt. Public Admin) $3.5 7.8% $0.0 0.0% $0.0 0.0% Other Accommodation $1.4 4.1% $1.4 4.1% $0.0 0.0% Restaurants $0.4 0.9% $0.0 0.0% $0.0 0.0% Other Business $0.5 0.1% $0.1 0.0% $0.0 0.0% Business $19.8 1.1% $2.4 0.1% $0.0 0.0% Consumer $6.7 0.5% $0.0 0.0% $0.0 0.0% Total $26.5 0.8% $2.4 0.1% $0.0 0.0% • There were no loans operating under a short-term deferral arrangement at June 30, 2021 • Of the loans that were previously operating under a short-term deferral arrangement, $1.3 million were classified as non-accrual and $536,000 were 30-89 days past due as of June 30, 2021
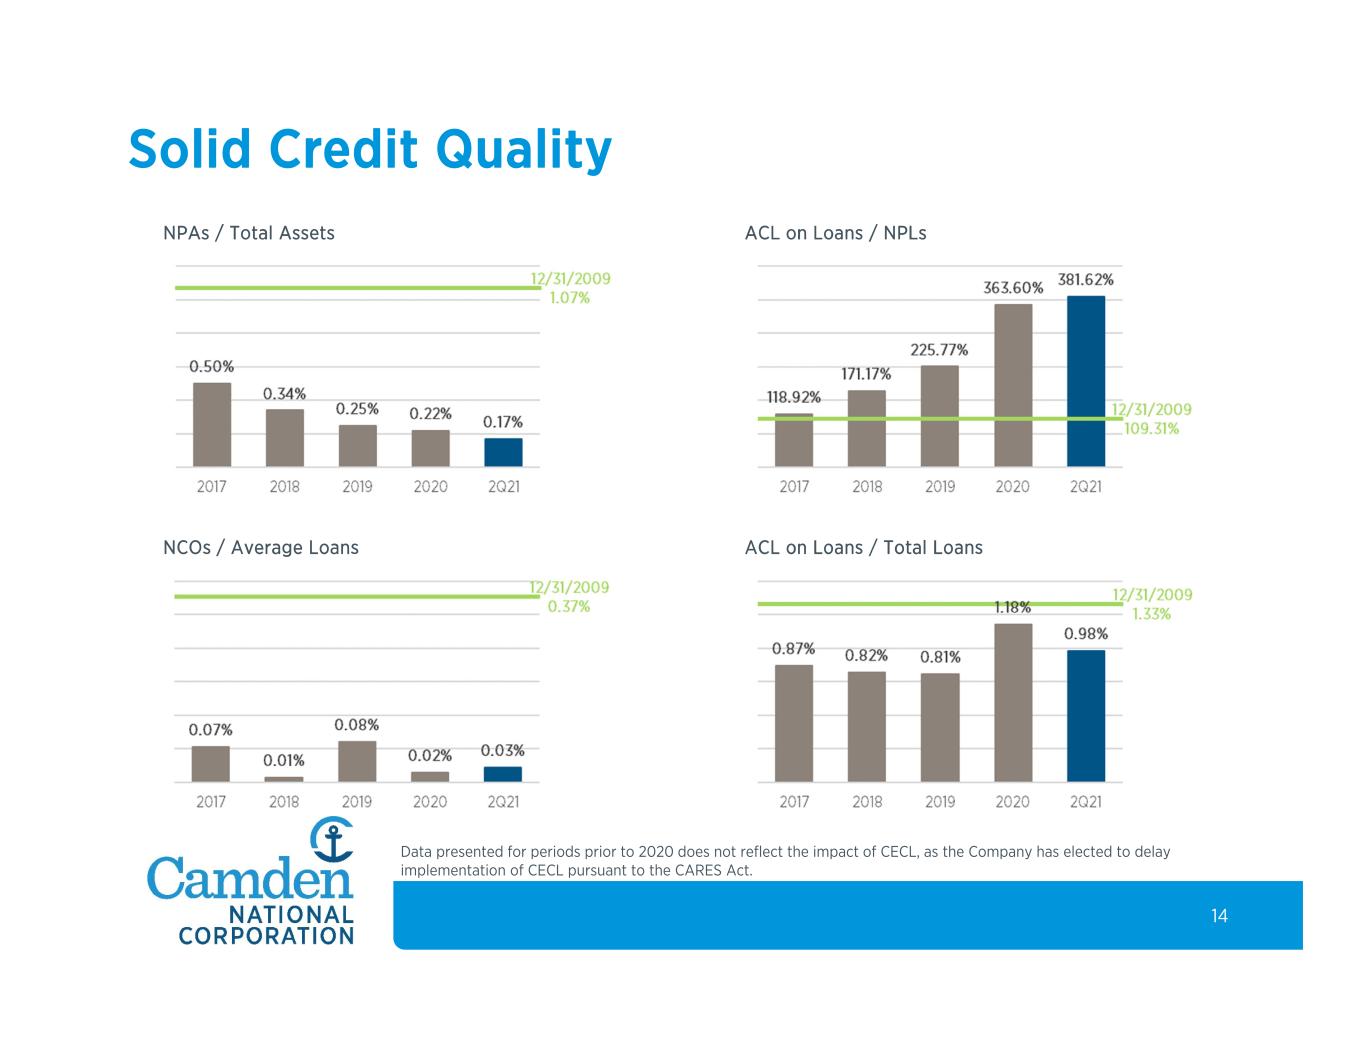
14 Solid Credit Quality Data presented for periods prior to 2020 does not reflect the impact of CECL, as the Company has elected to delay implementation of CECL pursuant to the CARES Act. NPAs / Total Assets ACL on Loans / NPLs NCOs / Average Loans ACL on Loans / Total Loans
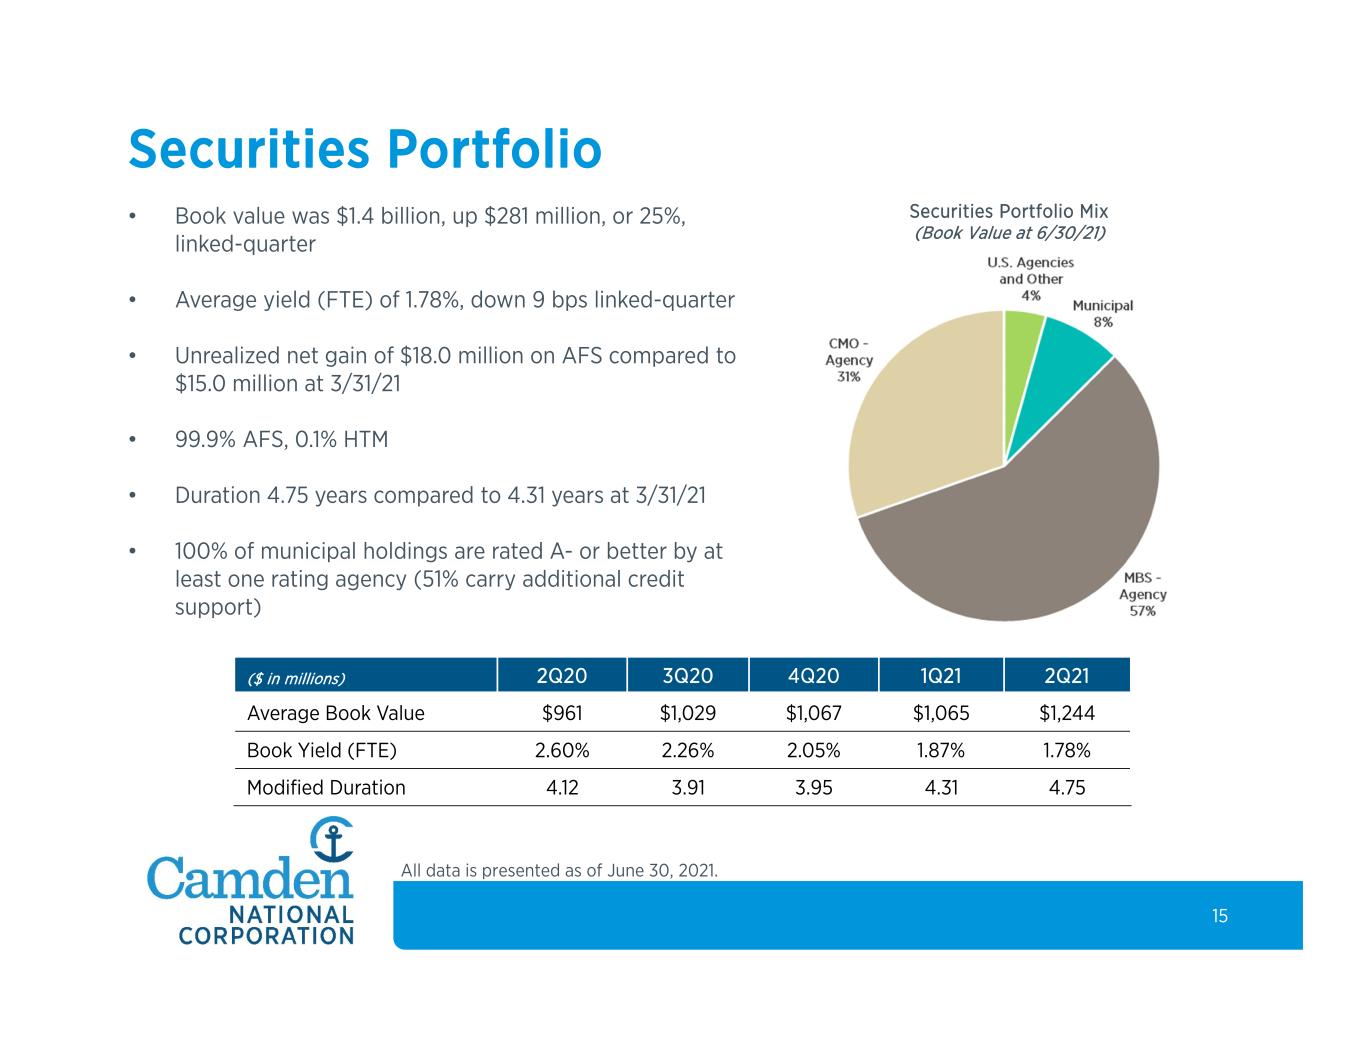
15 Securities Portfolio ($ in millions) 2Q20 3Q20 4Q20 1Q21 2Q21 Average Book Value $961 $1,029 $1,067 $1,065 $1,244 Book Yield (FTE) 2.60% 2.26% 2.05% 1.87% 1.78% Modified Duration 4.12 3.91 3.95 4.31 4.75 All data is presented as of June 30, 2021. • Book value was $1.4 billion, up $281 million, or 25%, linked-quarter • Average yield (FTE) of 1.78%, down 9 bps linked-quarter • Unrealized net gain of $18.0 million on AFS compared to $15.0 million at 3/31/21 • 99.9% AFS, 0.1% HTM • Duration 4.75 years compared to 4.31 years at 3/31/21 • 100% of municipal holdings are rated A- or better by at least one rating agency (51% carry additional credit support) Securities Portfolio Mix (Book Value at 6/30/21)

16 Funding Mix All data is presented as Q2 2021 averages unless otherwise stated. Average Funding Q2 2021 Deposits • Average balance of $4.0 billion • Average deposit cost of 0.16% • 2nd highest deposit market share in Maine (10.8% of deposits as of 6/30/20) • 8th highest deposit market share in York and Cumberland counties (5.1% of deposits as of 6/30/20) • Loan / Deposit ratio of 77% at 6/30/21, flat with 3/31/21 Borrowings • Average balance of $515.5 million • Average borrowing cost of 0.88% • 36% of borrowings are customer repurchase agreements • Prepaid $25 million FHLB long term borrowing in February 2021, resulting in a $514,000 one-time charge

17 Strong Capital Position ($ in millions) Ratios at 6/30/21 Amount Required Minimum(1) Cushion Capital Above Required Minimum Asset Growth Tier 1 Leverage 9.48% $474.9 4.00% $274.6 $6,864.3 Total Assets for Leverage Ratio $5,008.3 Common Equity Tier 1 12.94% $431.9 7.00% $198.3 $2,832.5 Total Risk Based Capital 15.26% $509.5 10.50% $159.0 $1,514.6 Total Risk Weighted Assets $3,337.6 Tier 1 Leverage Ratio Total Risk Based Capital Ratio Common Equity Tier 1 (CET1) Ratio (1) “Required Minimum” ratios represent minimum required capital ratios plus, for the risk based ratios, the fully phased-in 2.50% CET1 capital conservation buffer.
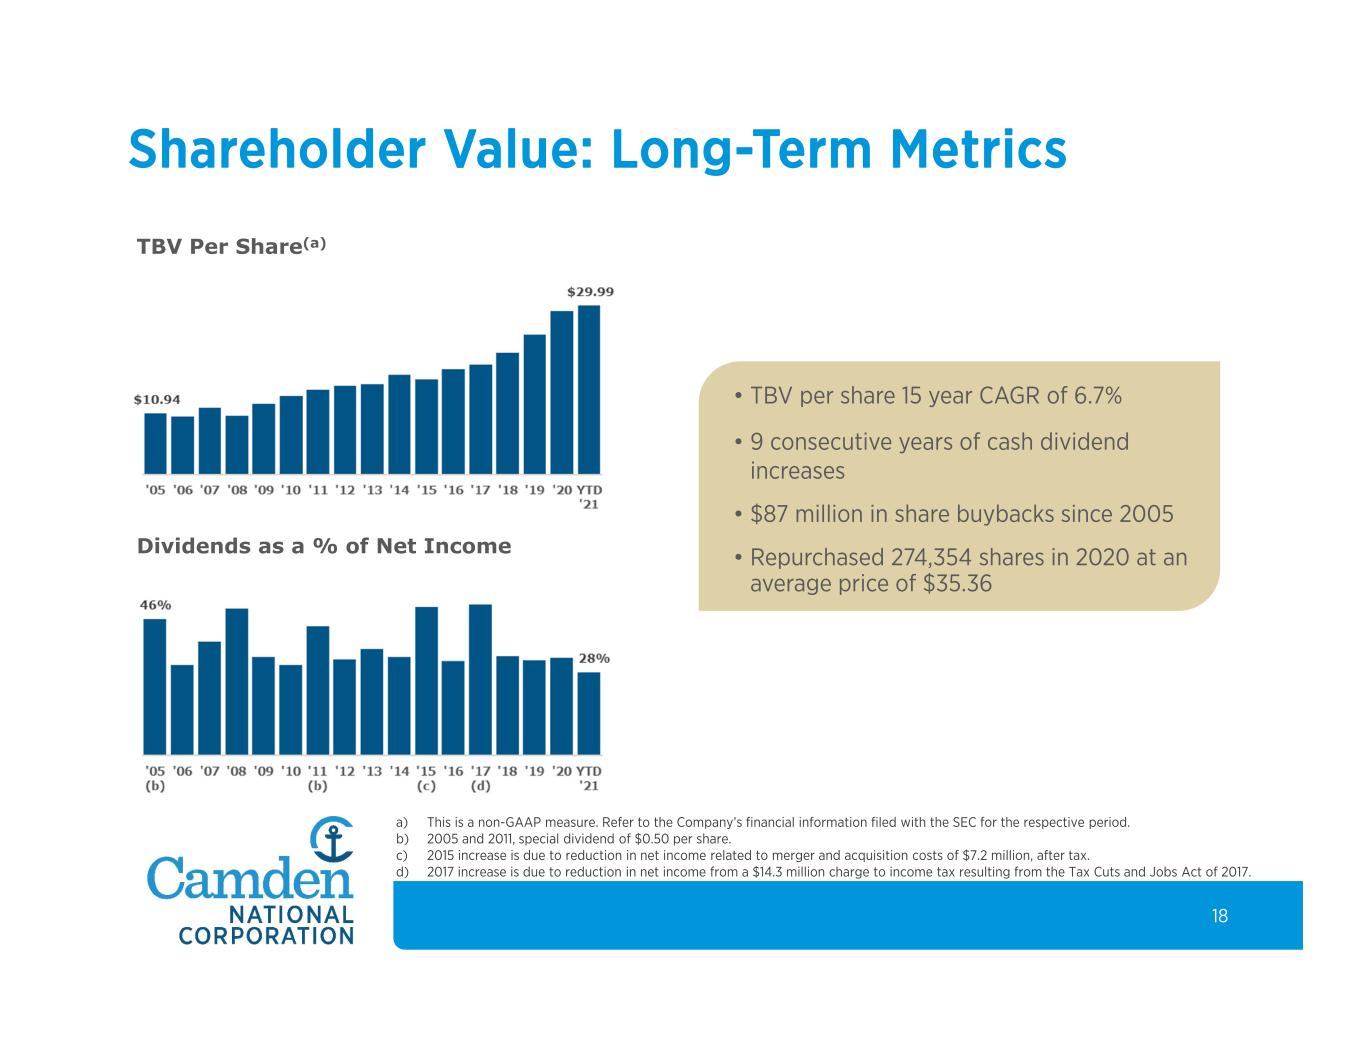
18 Shareholder Value: Long-Term Metrics a) This is a non-GAAP measure. Refer to the Company’s financial information filed with the SEC for the respective period. b) 2005 and 2011, special dividend of $0.50 per share. c) 2015 increase is due to reduction in net income related to merger and acquisition costs of $7.2 million, after tax. d) 2017 increase is due to reduction in net income from a $14.3 million charge to income tax resulting from the Tax Cuts and Jobs Act of 2017. TBV Per Share(a) Dividends as a % of Net Income • TBV per share 15 year CAGR of 6.7% • 9 consecutive years of cash dividend increases • $87 million in share buybacks since 2005 • Repurchased 274,354 shares in 2020 at an average price of $35.36
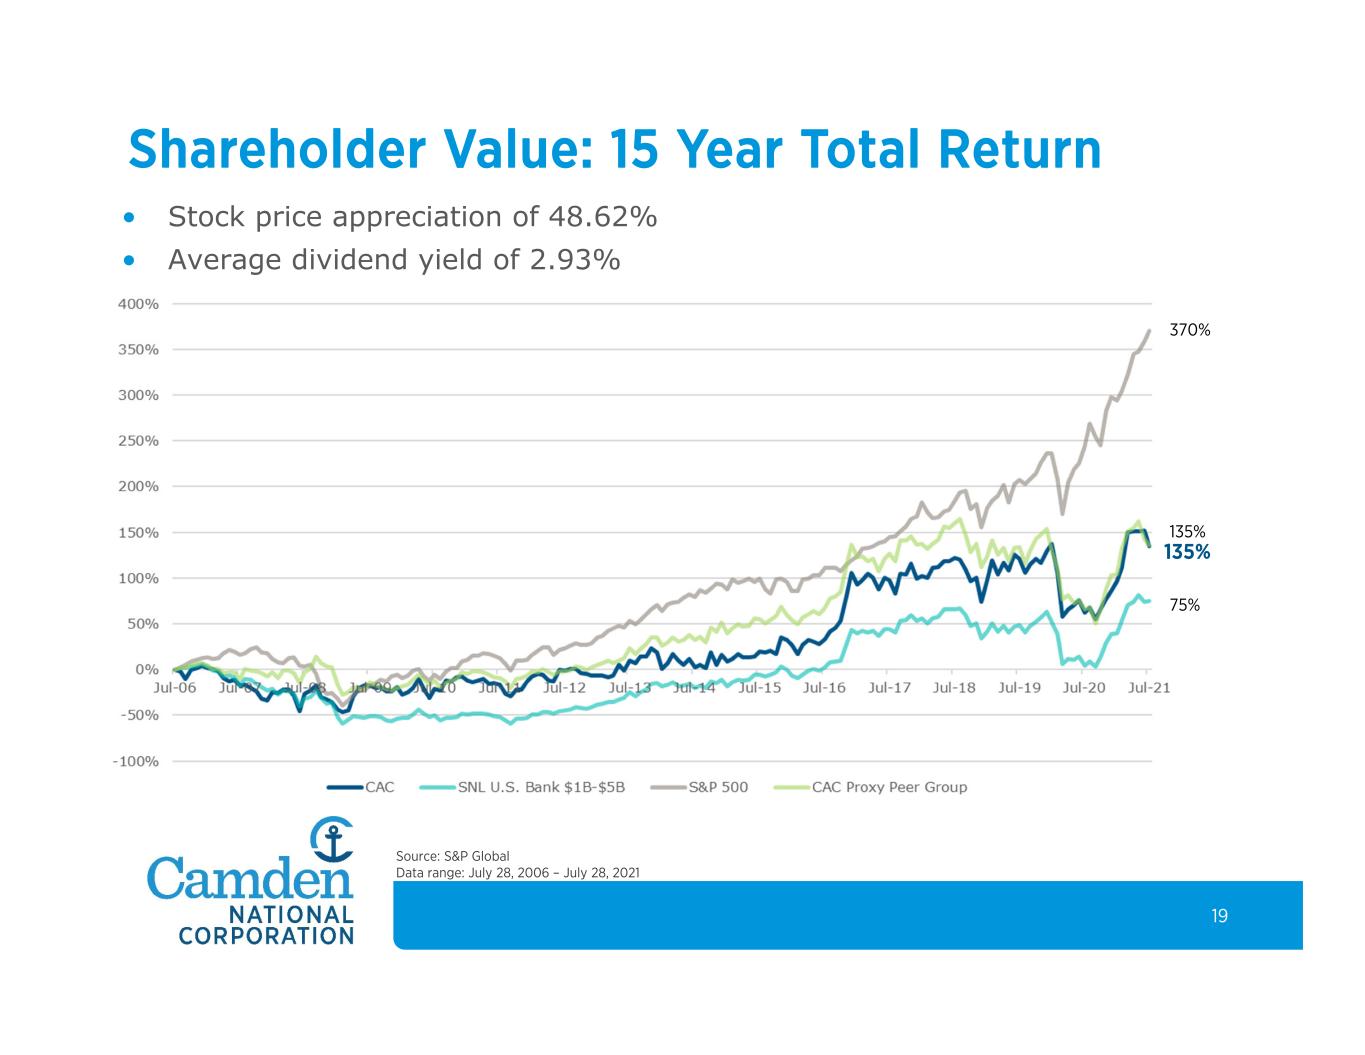
19 Shareholder Value: 15 Year Total Return • Stock price appreciation of 48.62% • Average dividend yield of 2.93% Source: S&P Global Data range: July 28, 2006 – July 28, 2021 370% 135% 135% 75%

20 Investment Summary Proven Management Team • Delivered on previous acquisition commitments • Long-term strategic perspective • Diverse experience from community and large bank perspectives Strong Market Share and Brand Recognition • 146 year operating history • #2 overall deposit market share in Maine, 1st in community banks • #3 mortgage originator in Maine, with 5.6% of all mortgage originations in the state Quality Growth • Consistent long-term growth - both organically and through acquisitions • Expanded presence in higher growth Southern Maine markets and enhanced scale, density, and deposit costs in existing markets Strong Fundamental Operating Metrics • Historically strong credit quality with nonperforming assets consistently less than 1% of total assets • Solid efficiency ratio, ROAA and ROATCE
21 Appendix

22 Seasoned Management Team Name Position Age Years of Banking Experience Year joined Camden Greg Dufour President and CEO 61 30+ 2001 Greg White EVP Chief Financial Officer 56 30+ 2020 Joanne Campbell EVP Risk Management 59 30+ 1996 William Martel EVP Technology & Support Services 51 20+ 2020 Jennifer Mirabile EVP Director of Wealth Management 62 30+ 2017 Tim Nightingale EVP Chief Credit Officer 63 30+ 2000 Heather Robinson, CPA SVP Chief Human Resources Officer 47 3 2018 Patricia Rose EVP Retail Banking 57 30+ 2017 Ryan Smith EVP Commercial Banking 48 25+ 2012 Renée Smyth EVP Chief Experience & Marketing Officer 50 15+ 2015

23 Income Statement $ thousands 2Q21 1Q21 4Q20 3Q20 2Q20 Net interest income $33,529 $32,364 $35,461 $34,481 $34,539 Non-interest income $11,320 $15,215 $14,331 $12,696 $12,060 Total revenue $44,849 $47,579 $49,792 $47,177 $46,599 Non-interest expense $25,590 $24,899 $26,692 $25,221 $23,509 Pretax, pre-provision earnings(1) $19,259 $22,680 $23,100 $21,956 $23,090 Provision for credit losses ($3,403) ($1,956) $258 $987 $9,398 Income tax expense $4,519 $4,896 $4,564 $4,194 $2,752 Net income $18,143 $19,740 $18,278 $16,775 $10,940 2Q21 1Q21 4Q20 3Q20 2Q20 Efficiency Ratio(1) 56.72% 50.96% 53.30% 50.60% 50.13% Net Interest Margin (FTE) 2.83% 2.88% 3.06% 3.00 3.11% Diluted EPS $1.21 $1.31 $1.22 $1.11 $0.73 (1) Non-GAAP measure.

24 Balance Sheet $ millions 2Q21 1Q21 4Q20 3Q20 2Q20 Loans $3,301 $3,259 $3,261 $3,313 $3,363 Investment Securities $1,416 $1,131 $1,133 $1,125 $1,068 Total Assets $5,152 $5,089 $4,899 $5,154 $4,959 Deposits $4,294 $4,212 $4,005 $4,224 $3,996 Borrowings $215 $246 $247 $294 $330 Shareholders’ Equity $546 $532 $529 $518 $506 2Q21 1Q21 4Q20 3Q20 2Q20 Total Risk-Based Capital Ratio 15.26% 16.00% 15.40% 15.15% 14.56% Tier 1 Leverage Capital Ratio 9.48% 9.61% 9.13% 8.96% 8.95% Loan / Deposit Ratio 77% 77% 80% 78% 83%

25 Historical Credit Metrics NPAs / Assets NCOs / Average Loans Loan Loss Reserves / Gross Loans(1) Nonaccrual Loans / Loans (1) CNC loan loss reserves / gross loans as presented under the incurred loss model. Note: Peer Group defined as publicly traded banks and thrifts headquartered in the United States with total assets between $1.5 billion and $7.0 billion, excluding merger targets. Source: S&P Global
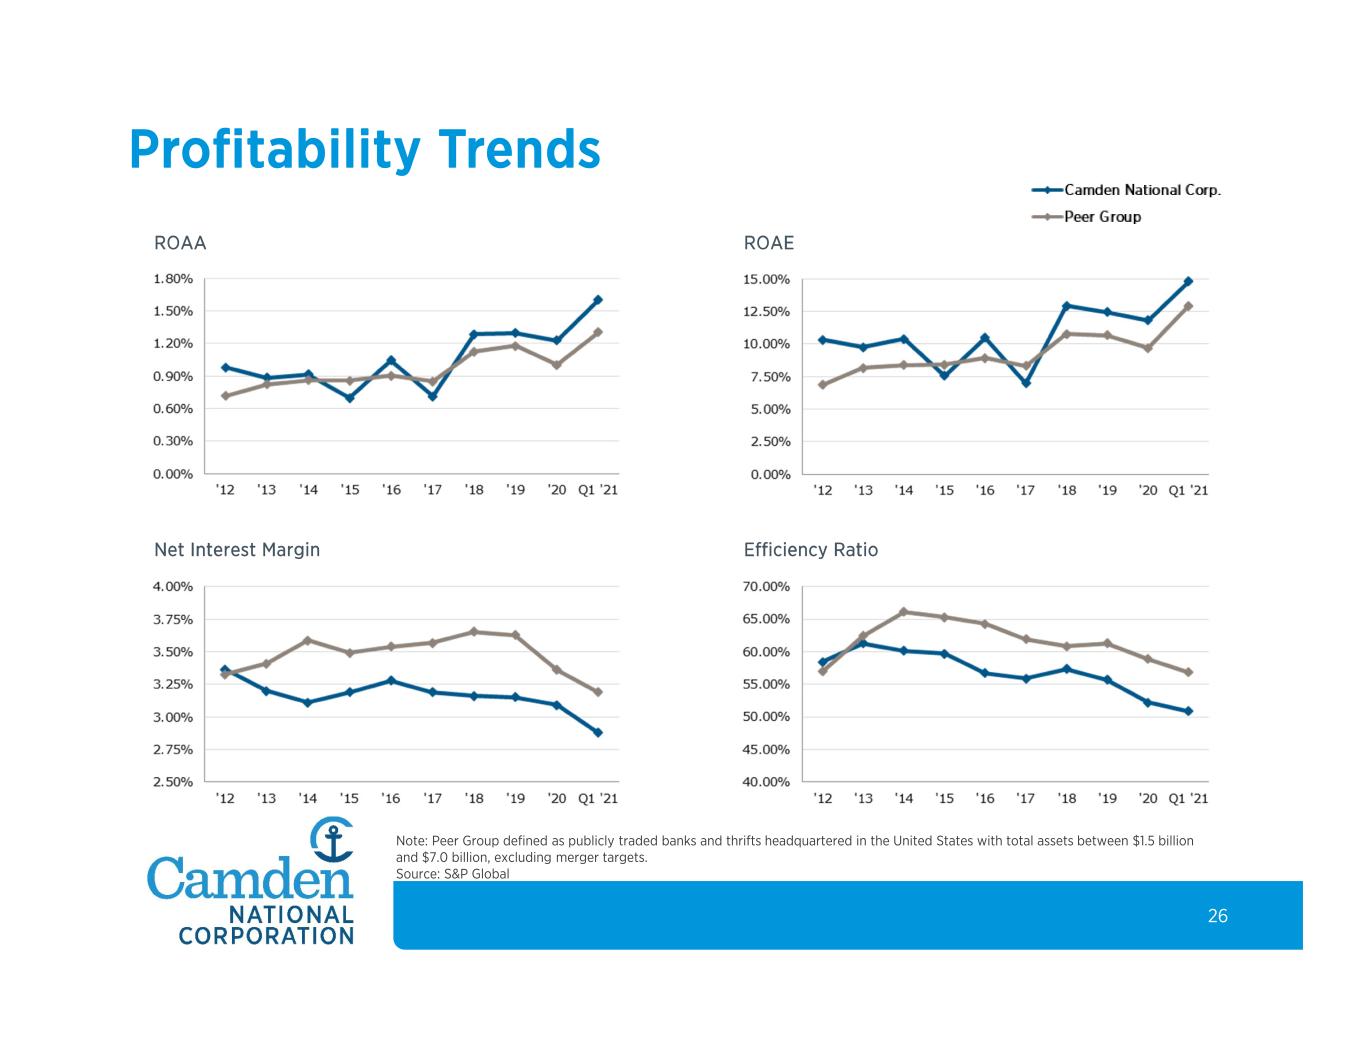
26 Profitability Trends Note: Peer Group defined as publicly traded banks and thrifts headquartered in the United States with total assets between $1.5 billion and $7.0 billion, excluding merger targets. Source: S&P Global ROAA ROAE Net Interest Margin Efficiency Ratio

27 Deposit Cost Trend • 54% of CD portfolio matures in the next 12 months at 0.38% • Redesigned consumer checking product set, shifting $272 million of interest checking balances to non- interest checking • $3.9 billion of non-maturity deposits at 0.13% • $1.2 billion have balances >$1 million at a rate of 0.32% • $2.7 billion is all other non- maturity deposits at a rate of 0.04% • Ability to continue lowering non-maturity deposit rates lower is limited

28 Maine Mortgage Banking Activity Source: MRS, Inc. Data obtained from registry of deeds throughout the state of Maine. Top 15 Lenders Origination Units Rank % of Total Bangor Savings Bank 3,057 1 9.8% Quicken Loans 2,345 2 7.5% Camden National Bank 1,754 3 5.6% Residential Mortgage Services Inc. 1,562 4 5.0% United Wholesale Mortgage 1,403 5 4.5% Kennebec Savings Bank 1,096 6 3.5% First, N.A. 1,059 7 3.4% Key Bank 1,032 8 3.3% Machias Savings Bank 835 9 2.7% TD Bank, N.A. 568 10 1.8% USA - various agencies 561 11 1.8% Norway Savings Bank 547 12 1.8% CUSO Mortgage Corp. 492 13 1.6% Gorham Savings Bank 449 14 1.4% Mortgage Network 437 15 1.4% All Other Lenders 13,927 - 44.7% Total 31,124 100.0% Six Months Ended June 30, 2021


