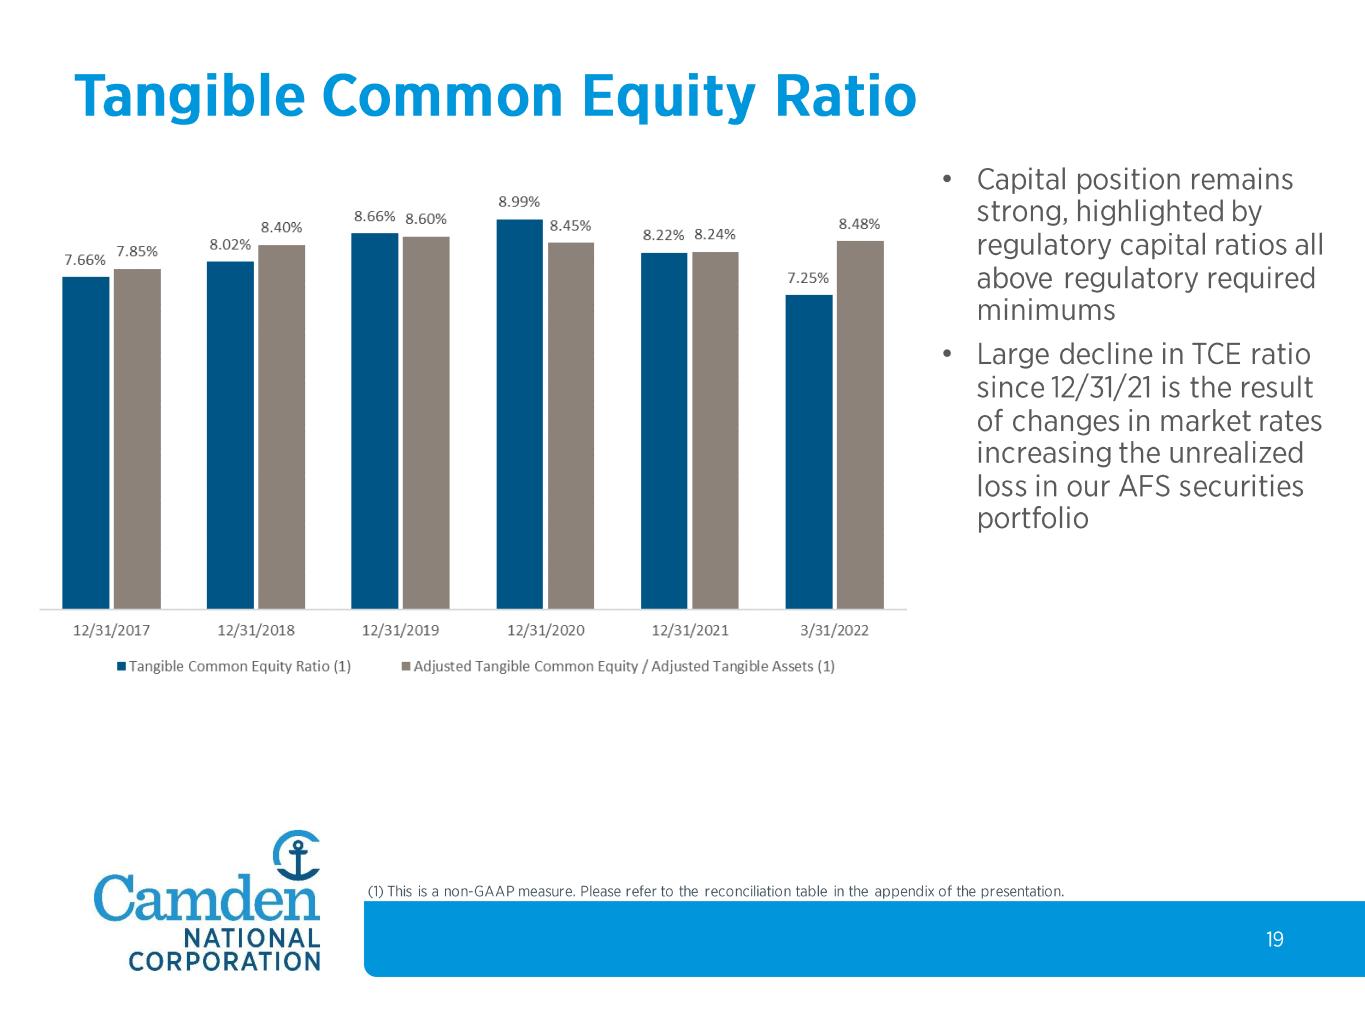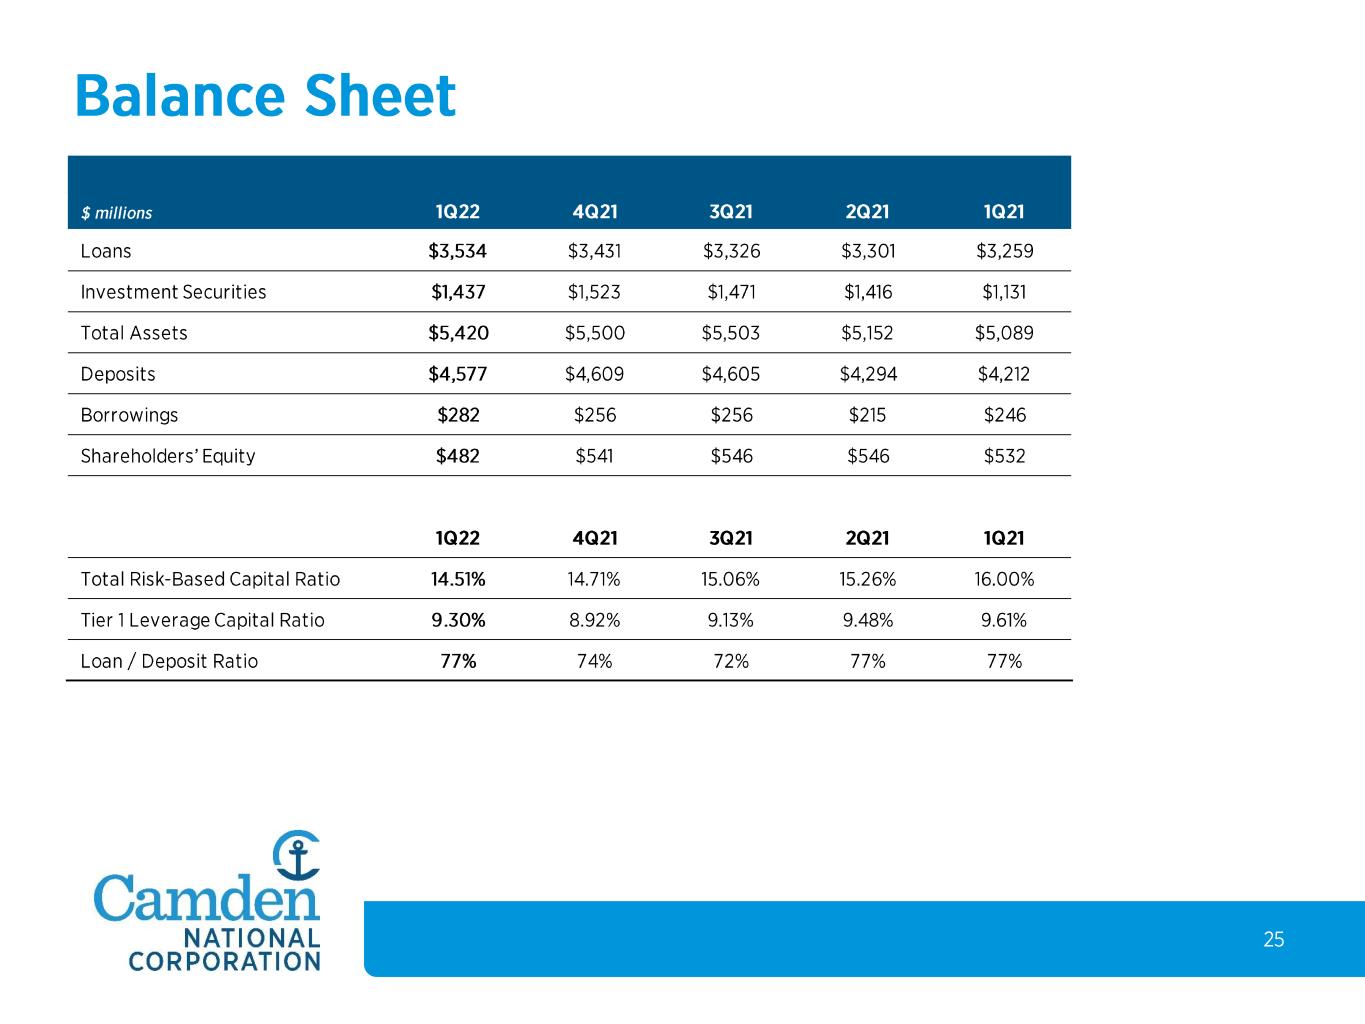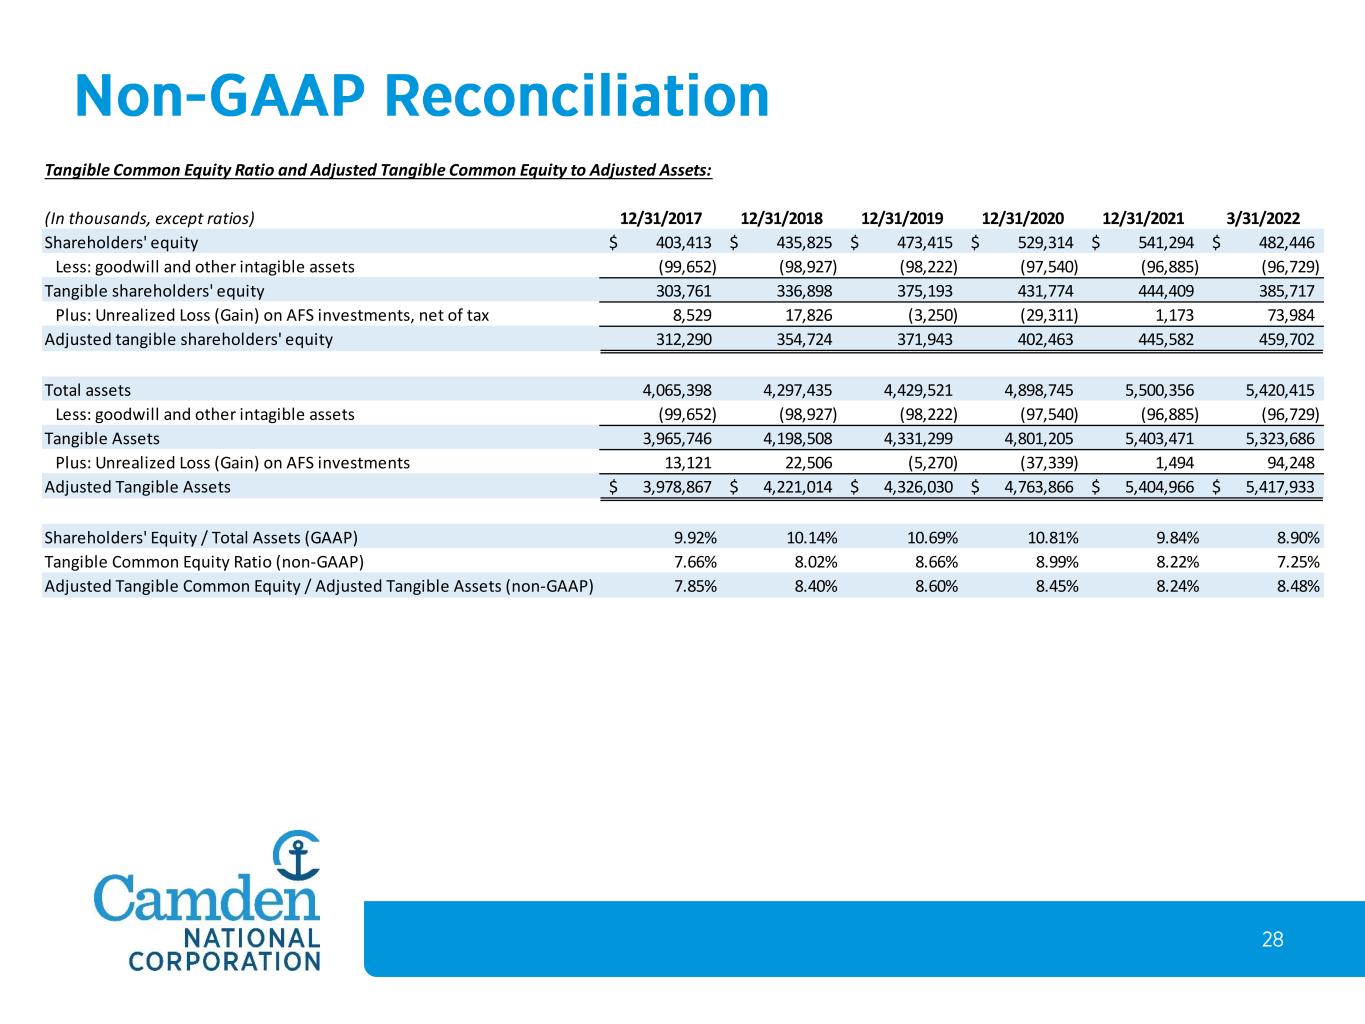
Tangible Common Equity Ratio and Adjusted Tangible Common Equity to Adjusted Assets: (In thousands, except ratios) 12/31/2017 12/31/2018 12/31/2019 12/31/2020 12/31/2021 3/31/2022 Shareholders' equity 403,413$ 435,825$ 473,415$ 529,314$ 541,294$ 482,446$ Less: goodwill and other intagible assets (99,652) (98,927) (98,222) (97,540) (96,885) (96,729) Tangible shareholders' equity 303,761 336,898 375,193 431,774 444,409 385,717 Plus: Unrealized Loss (Gain) on AFS investments, net of tax 8,529 17,826 (3,250) (29,311) 1,173 73,984 Adjusted tangible shareholders' equity 312,290 354,724 371,943 402,463 445,582 459,702 Total assets 4,065,398 4,297,435 4,429,521 4,898,745 5,500,356 5,420,415 Less: goodwill and other intagible assets (99,652) (98,927) (98,222) (97,540) (96,885) (96,729) Tangible Assets 3,965,746 4,198,508 4,331,299 4,801,205 5,403,471 5,323,686 Plus: Unrealized Loss (Gain) on AFS investments 13,121 22,506 (5,270) (37,339) 1,494 94,248 Adjusted Tangible Assets 3,978,867$ 4,221,014$ 4,326,030$ 4,763,866$ 5,404,966$ 5,417,933$ Shareholders' Equity / Total Assets (GAAP) 9.92% 10.14% 10.69% 10.81% 9.84% 8.90% Tangible Common Equity Ratio (non-GAAP) 7.66% 8.02% 8.66% 8.99% 8.22% 7.25% Adjusted Tangible Common Equity / Adjusted Tangible Assets (non-GAAP) 7.85% 8.40% 8.60% 8.45% 8.24% 8.48%
