Acquisition of 15 Maine Branches April 24, 2012

Safe Harbor Statement The information presented may contain forward - looking statements within the meaning of the Private Securities Litigation Reform Act of 1995. These statements are based upon current beliefs and expectations and are subject to significant risks and uncertainties (some of which are beyond Camden National Corporation’s control). Actual results may differ materially from the results discussed in these forward - looking statements. Factors that could cause Camden National Corporation’s results to differ materially can be found in the risk factors set forth in Camden National Corporation’s Annual Report on Form 10 - K for the year ended December 31, 2011, as updated by Camden National Corporation’s Quarterly Reports on Form 10Q and other filings with the SEC. 1
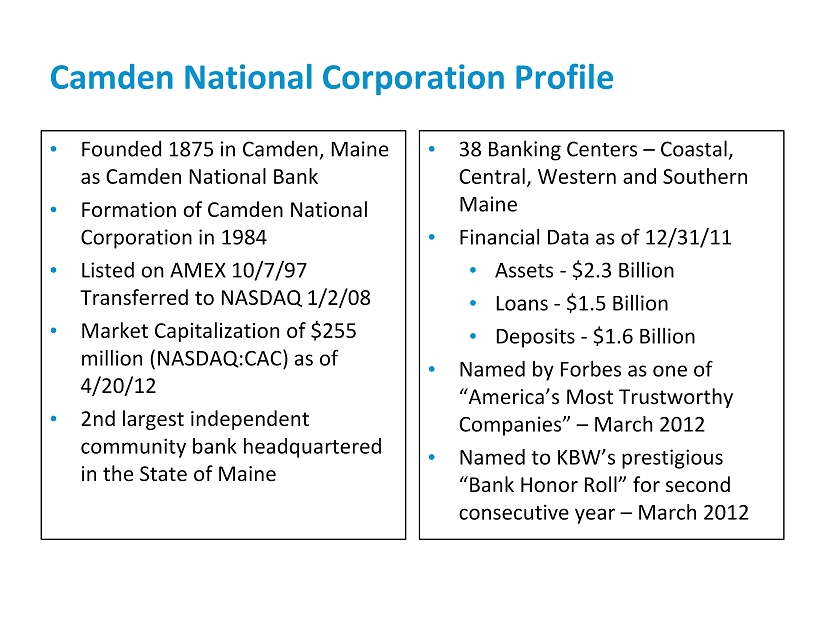
Camden National Corporation Profil e • Founded 1875 in Camden, Maine as Camden National Bank • Formation of Camden National Corporation in 1984 • Listed on AMEX 10/7/97 Transferred to NASDAQ 1/2/08 • Market Capitalization of $255 million (NASDAQ:CAC) as of 4/20/12 • 2nd largest independent community bank headquartered in the State of Maine • 38 Banking Centers – Coastal, Central, Western and Southern Maine • Financial Data as of 12/31/11 • Assets - $2.3 Billion • Loans - $1.5 Billion • Deposits - $1.6 Billion • Named by Forbes as one of “America’s Most Trustworthy Companies” – March 2012 • Named to KBW’s prestigious “Bank Honor Roll” for second consecutive year – March 2012 2
Core Strengths • Measured growth and expanding customer base • Solid earnings performance • Disciplined risk management culture • Steady shareholder returns 3
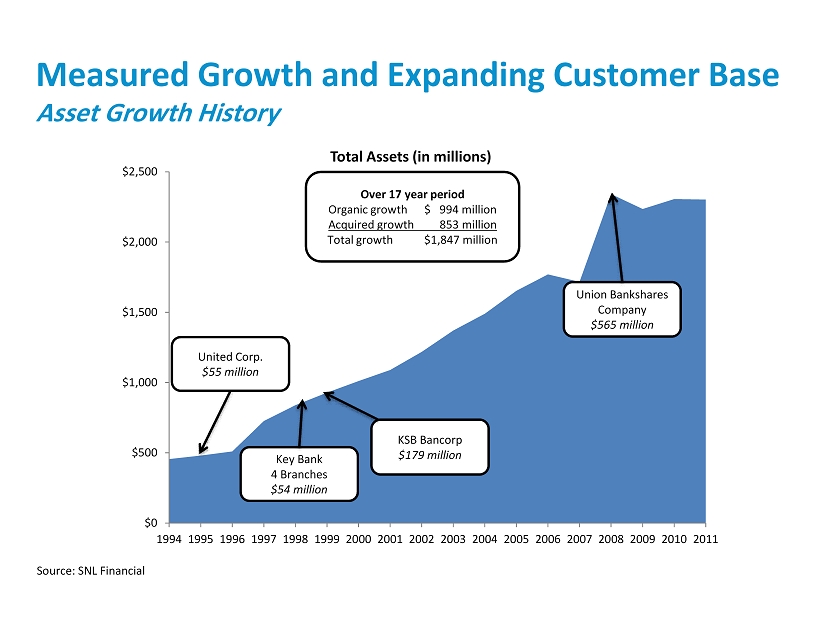
4 Measured Growth and Expanding Customer Base Asset Growth History $0 $500 $1,000 $1,500 $2,000 $2,500 1994 1995 1996 1997 1998 1999 2000 2001 2002 2003 2004 2005 2006 2007 2008 2009 2010 2011 Total Assets (in millions) KSB Bancorp $ 179 million United Corp. $ 55 million Key Bank 4 Branches $ 54 million Union Bankshares Company $565 million Over 17 year period Organic growth $ 994 million Acquired growth 853 million Total growth $1,847 million Source: SNL Financial
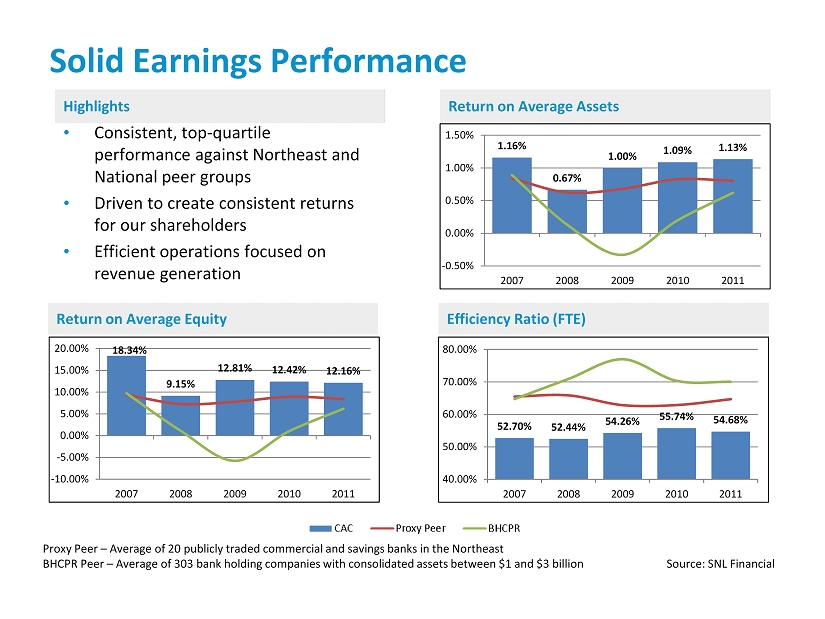
Solid Earnings Performance • Consistent , top - quartile performance against Northeast and National peer groups • Driven to create consistent returns for our shareholders • Efficient operations focused on revenue generation Proxy Peer – Average of 20 publicly traded commercial and savings banks in the Northeast BHCPR Peer – Average of 303 bank holding companies with consolidated assets between $1 and $3 billion Source : SNL Financial 1.16% 0.67% 1.00% 1.09% 1.13% -0.50% 0.00% 0.50% 1.00% 1.50% 2007 2008 2009 2010 2011 18.34% 9.15% 12.81% 12.42% 12.16% -10.00% -5.00% 0.00% 5.00% 10.00% 15.00% 20.00% 2007 2008 2009 2010 2011 52.70% 52.44% 54.26% 55.74% 54.68% 40.00% 50.00% 60.00% 70.00% 80.00% 2007 2008 2009 2010 2011 5 Highlights Return on Average Assets Return on Average Equity Efficiency Ratio (FTE)
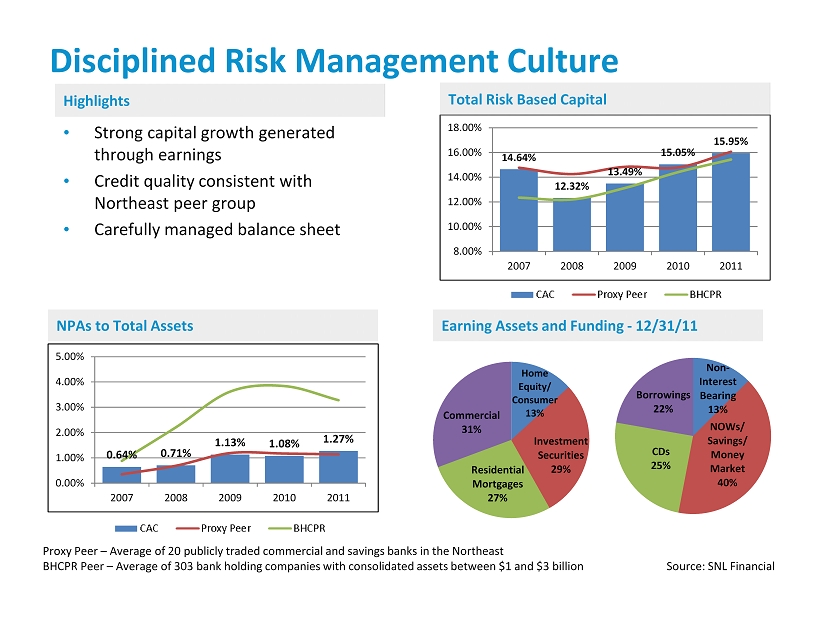
Disciplined Risk Management Culture 14.64% 12.32% 13.49% 15.05% 15.95% 8.00% 10.00% 12.00% 14.00% 16.00% 18.00% 2007 2008 2009 2010 2011 6 0.64% 0.71% 1.13% 1.08% 1.27% 0.00% 1.00% 2.00% 3.00% 4.00% 5.00% 2007 2008 2009 2010 2011 Home Equity / Consumer 13% Investment Securities 29% Residential Mortgages 27% Commercial 31% Non - Interest Bearing 13% NOWs/ Savings/ Money Market 40% CDs 25% Borrowings 22% • Strong capital growth generated through earnings • Credit quality consistent with Northeast peer group • Carefully managed balance sheet NPAs to Total Assets Earning Assets and Funding - 12/31/11 Total Risk Based Capital Highlights Proxy Peer – Average of 20 publicly traded commercial and savings banks in the Northeast BHCPR Peer – Average of 303 bank holding companies with consolidated assets between $1 and $3 billion Source : SNL Financial

7 Steady Shareholder Returns Source: SNL Financial $1.27 $1.38 $1.27 $1.69 $1.89 $2.11 $2.38 $2.53 $2.80 $2.93 $3.09 $2.00 $2.98 $3.23 $3.41 $. 45 $. 55 $. 60 $. 63 $. 64 $. 68 $. 72 $. 80 $1.30 $. 88 $. 96 $. 99 $1.00 $1.00 $1.50 $0.00 $0.50 $1.00 $1.50 $2.00 $2.50 $3.00 $3.50 $4.00 1997 1998 1999 2000 2001 2002 2003 2004 2005 2006 2007 2008 2009 2010 2011 Earnings Per Share Dividends Per Share • Earnings per share compound annual growth of 7.31% over a 14 - year period • Average annual total return of 11.63% since 1997 • One of 45 high - performing banks to be named to the 2011 KBW Bank Honor Roll. One of only 28 returning members $0 $50 $100 $150 $200 $250 $300 $350 CAC Russell 2000 SNL U.S. Bank $1B-$5B S&P 500 Stock Performance Graph Assumes $100 investment on 12/31/97

Acquisition of 15 Maine Branches from Bank of America “Strategically compelling and financially attractive opportunity to expand and strengthen Camden National’s franchise, while deepening our commitment to our existing markets.” Gregory A. Dufour President and Chief Executive Officer 8
Unique Expansion Opportunity • Strategically Compelling • Contiguous expansion – I - 95 corridor fills - out footprint • Increase market share in Maine from 7.22% to 9.13% • Adds $414 million in core deposits and 15 branches • Financially Attractive • Projected 2013 Operating EPS accretion of 12% • Pro forma Tangible Book Value dilution earned back in three to four years • Low Risk • Markets in which we currently operate in or are adjacent to • Management has successful integration track record • Limited credit risk with only $14 million of business loans 9
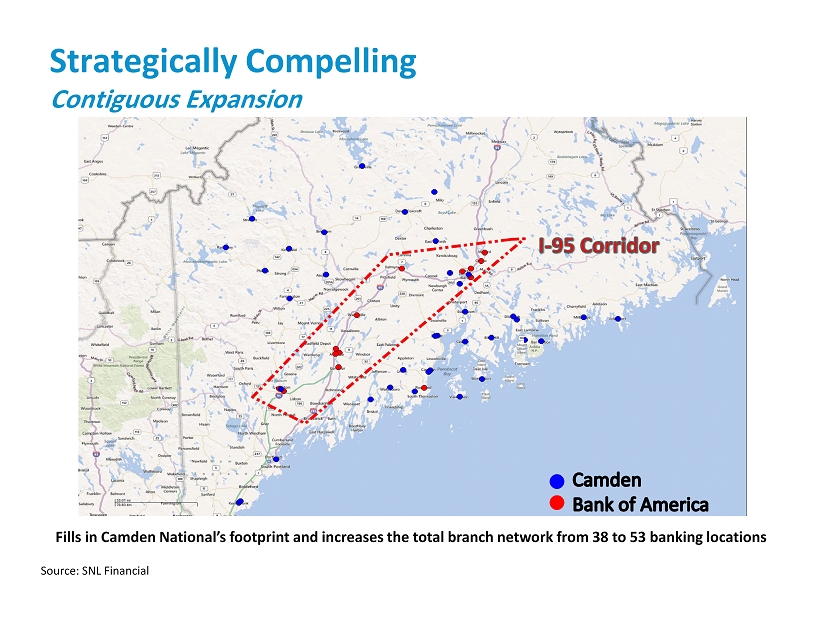
10 Source: SNL Financial Strategically Compelling Contiguous Expansion Fills in Camden National’s footprint and increases the total branch network from 38 to 53 banking locations
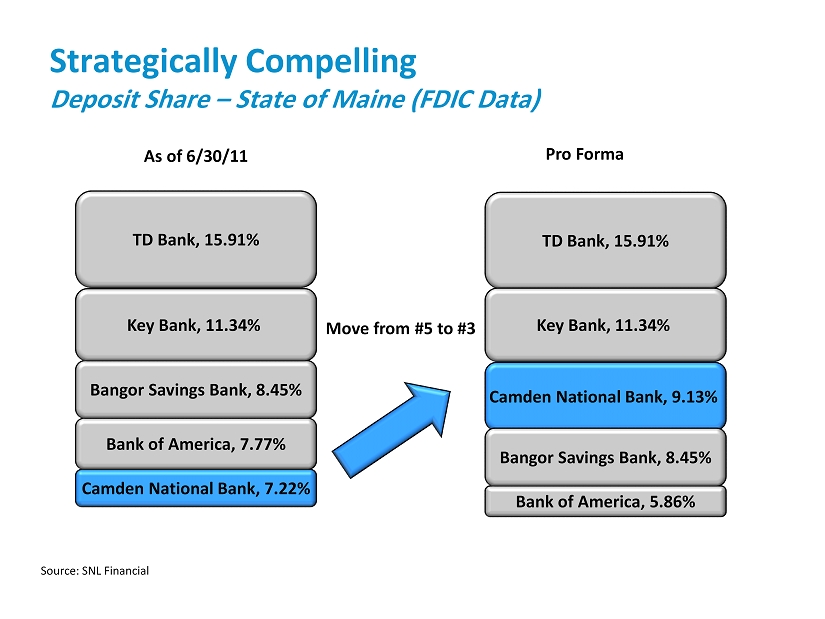
Strategically Compelling Deposit Share – State of Maine (FDIC Data) Camden National Bank , 7.22% Bank of America, 7.77% Bangor Savings Bank, 8.45% Key Bank, 11.34% TD Bank, 15.91% TD Bank, 15.91% Key Bank, 11.34% Camden National Bank, 9.13% Bank of America, 5.86% As of 6/30/11 Pro Forma Move from #5 to #3 Bangor Savings Bank, 8.45% 11 Source: SNL Financial
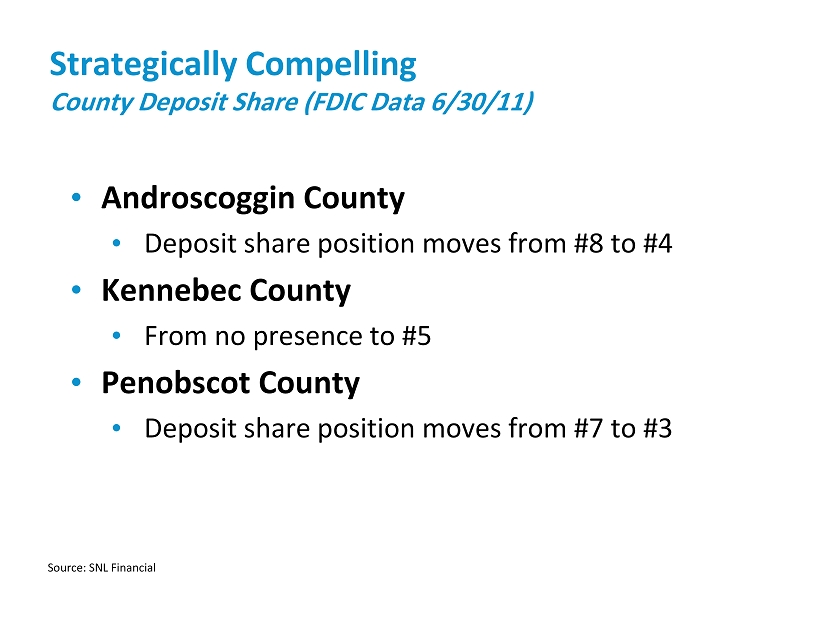
Strategically Compelling County Deposit Share (FDIC Data 6/30/11) 12 Source: SNL Financial • Androscoggin County • Deposit share position moves from #8 to #4 • Kennebec County • F rom no presence to #5 • Penobscot County • Deposit share position moves from #7 to #3

Strategically Compelling Add $414 million in core deposits with an average cost of 0.31% CDs 32% Non - Interest Bearing 16% NOWs, MMDA and Savings 52% Camden National $1.6 Billion at 12/31/11 CDs 23% Non - Interest Bearing 39% NOWs, MMDA and Savings 38% BoA Branches $414 Million at 12/31/11 CDs 30% Non - Interest Bearing 21% NOWs, MMDA and Savings 49% Pro Forma $2.0 Billion • Non - Interest Bearing Deposits increase from 16% to 21% • Reduces cost of deposits by 7 basis points 13
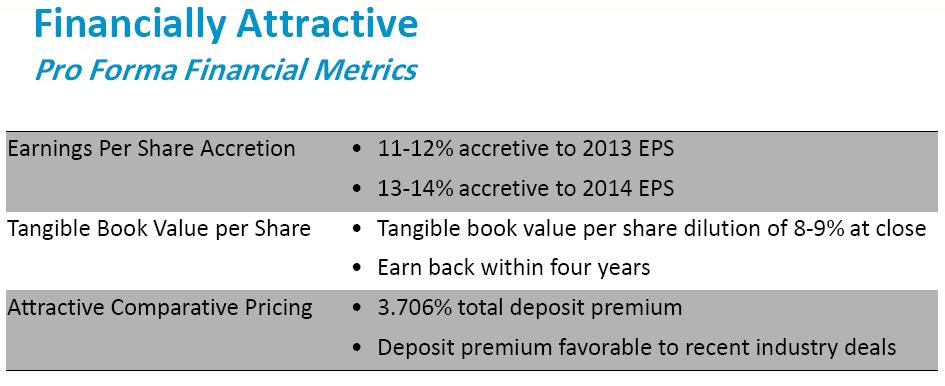
Financially Attractive Pro Forma Financial Metrics 14 Earnings Per Share Accretion • 11 - 12% accretive to 2013 EPS • 13 - 14% accretive to 2014 EPS Tangible Book Value per Share • Tangible book value per share dilution of 8 - 9 % at close • 3 - 4 year earn back period Attractive Comparative Pricing • 3.706% total deposit premium • Deposit premium favorable to recent industry deals
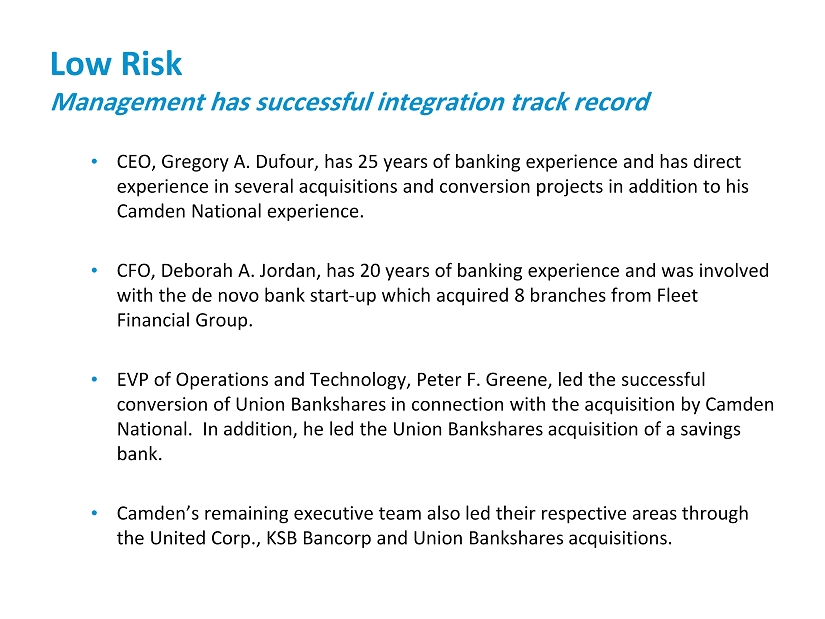
Low Risk Management has successful integration track record • CEO, Gregory A. Dufour, has 25 years of banking experience and has direct experience in several acquisitions and conversion projects in addition to his Camden National experience . • CFO, Deborah A. Jordan, has 20 years of banking experience and was involved with the de novo bank start - up which acquired 8 branches from Fleet Financial Group. • EVP of O perations and Technology, Peter F. Greene, led the successful conversion of Union Bankshares in connection with the acquisition by Camden National. In addition, he led the Union Bankshares acquisition of a savings bank . • Camden’s remaining executive team also led their respective areas through the United Corp., KSB Bancorp and Union Bankshares acquisitions. 15
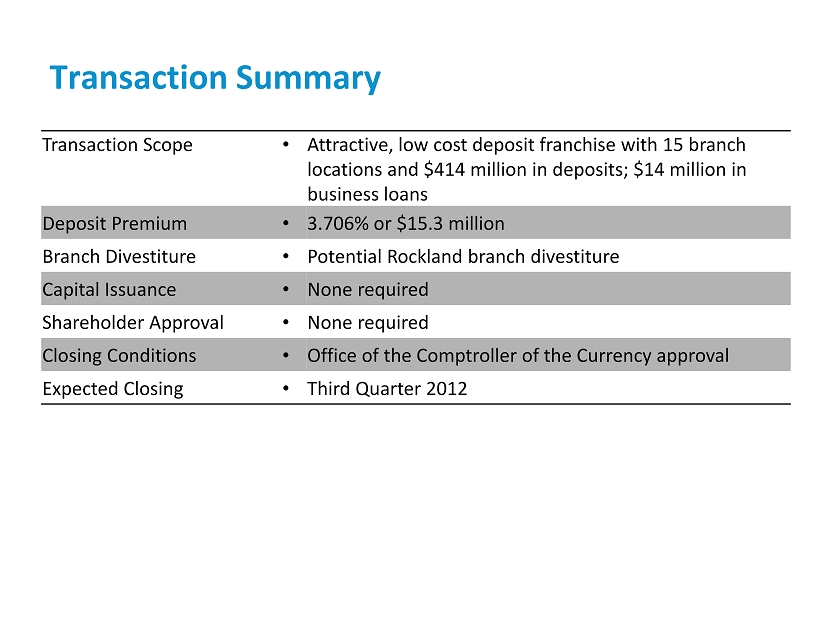
Transaction Summary 16 Transaction Scope • Attractive, low cost deposit franchise with 15 branch locations and $414 million in deposits; $14 million in business loans Deposit Premium • 3.706% or $15.3 million Branch Divestiture • Potential Rockland branch divestiture Capital Issuance • None required Shareholder Approval • None required Closing Conditions • Office of the Comptroller of the Currency approval Expected Closing • Third Quarter 2012
17 “Financial Institution of the Year” by Finance Authority of Maine November, 2011 KBWs prestigious “ Bank Honor Roll” March, 2012 Forbes one of “America’s Most Trustworthy Companies ” March, 2012

Appendix 18
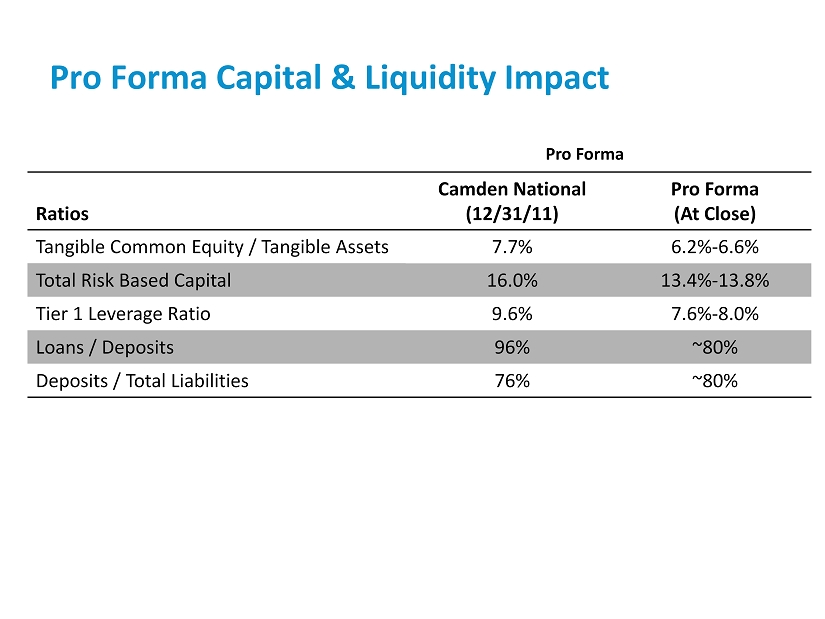
Pro Forma Capital & Liquidity Impact Ratios Camden National (12/31/11) Pro Forma (At Close) Tangible Common Equity / Tangible Assets 7.7% 6.2% - 6.6% Total Risk Based Capital 16.0% 13.4% - 13.8% Tier 1 Leverage Ratio 9.6% 7.6% - 8.0% Loans / Deposits 96% ~80% Deposits / Total Liabilities 76% ~80% 19 Pro Forma

Deposit Share – State of Maine (FDIC Data 6/30/11) 20 Source: SNL Financial In-Market In-Market Market 1-Yr Dep. 5-Yr Dep. Rank Institution HQ City HQ State Type Branches Deposits ($000) Share (%) Growth CAGR 1 Toronto-Dominion Bank Toronto Canada Bank 55 3,449,640 15.91 31.28 28.10 2 KeyCorp (OH) Cleveland OH Bank 61 2,457,749 11.34 (9.01) (0.31) PRO FORMA - Camden National Bank Camden ME Bank 53 1,978,657 9.13 3 Bangor Bancorp MHC (ME) Bangor ME Bank 58 1,832,474 8.45 8.32 5.21 4 Bank of America Charlotte NC Bank 36 1,684,076 7.77 (0.87) 3.46 5 Camden National Bank Camden ME Bank 38 1,564,791 7.22 0.12 0.36 PRO FORMA - Bank of America Charlotte NC Bank 21 1,270,210 5.86 6 First Bancorp Inc. (ME) Damariscotta ME Bank 14 999,582 4.61 5.23 4.89 7 Machias Bancorp MHC (ME) Machias ME Bank 13 792,006 3.65 (4.55) 6.39 8 People's United Financial Inc. (CT) Bridgeport CT Thrift 31 762,194 3.52 (7.03) (2.39) 9 Bar Harbor Bankshares (ME) Bar Harbor ME Bank 13 730,205 3.37 9.22 8.38 10 Norway Bancorp MHC (ME) Norway ME Bank 20 706,493 3.26 1.13 3.58 11 Gorham Bancorp MHC (ME) Gorham ME Bank 11 649,040 2.99 7.99 6.22 12 SBM Financial Inc. (ME) Gardiner ME Thrift 33 639,957 2.95 (3.90) (5.18) 13 Kennebunk Savings Bank (ME) Kennebunk ME Thrift 14 628,846 2.90 (0.30) 1.71 14 Kennebec Savings Bank (ME) Augusta ME Thrift 5 524,033 2.42 4.23 6.71 15 Androscoggin Bancorp MHC (ME) Lewiston ME Bank 13 517,279 2.39 0.87 6.83 16 Saco & Biddeford Svgs Inst (ME) Saco ME Thrift 6 513,771 2.37 2.93 3.77 17 Bath Savings Institution (ME) Bath ME Thrift 11 473,378 2.18 10.63 7.61 18 Katahdin Bankshares Corp. (ME) Patten ME Bank 17 417,396 1.93 5.16 7.50 19 Northeast Bancorp (ME) Lewiston ME Bank 11 402,168 1.86 4.33 0.25 20 SIS Bancorp MHC (ME) Sanford ME Bank 8 314,469 1.45 (0.19) 4.26 21 Skowhegan Savings Bank (ME) Skowhegan ME Thrift 10 309,559 1.43 0.53 (0.12) 22 Mechanics SB (ME) Auburn ME Thrift 3 238,641 1.10 11.12 3.02 23 FSB Bancorp MHC (ME) Farmington ME Bank 8 235,189 1.08 1.72 1.79 24 Biddeford Savings Bank (ME) Biddeford ME Thrift 6 229,121 1.06 5.50 3.60 25 Damariscotta Bankshares Inc. (ME) Damariscotta ME Bank 6 138,797 0.64 2.46 3.12 26 First FS&LA of Bath (ME) Bath ME Thrift 5 93,516 0.43 4.46 3.07 27 Aroostook Cnty FS&LA (ME) Caribou ME Thrift 2 87,856 0.41 (0.04) 5.75 28 Rockland Savings Bank FSB (ME) Rockland ME Thrift 2 66,712 0.31 12.52 7.01 29 Bar Harbor S&LA (ME) Bar Harbor ME Thrift 1 63,092 0.29 22.48 23.34 30 Auburn Bancorp Inc. (MHC) (ME) Auburn ME Thrift 2 54,025 0.25 (3.54) 3.68 31 Kennebec FS&LA of Waterville (ME) Waterville ME Thrift 2 53,336 0.25 (0.07) 3.65 32 Border Bancshares Inc. (ME) Augusta ME Bank 3 47,869 0.22 21.14 (4.78) Total - Entire State of Maine 518 21,677,260 100.00
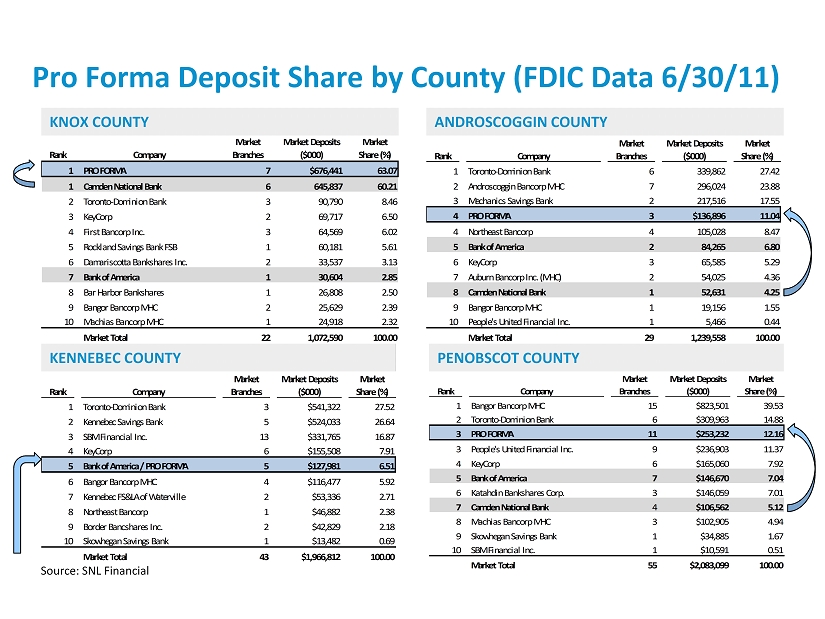
Pro Forma Deposit Share by County (FDIC Data 6/30/11 ) 21 KNOX COUNTY ANDROSCOGGIN COUNTY KENNEBEC COUNTY PENOBSCOT COUNTY Source: SNL Financial Rank Company Market Branches Market Deposits ($000) Market Share (%) 1 PRO FORMA 7 $676,441 63.07 1 Camden National Bank 6 645,837 60.21 2 Toronto-Dominion Bank 3 90,790 8.46 3 KeyCorp 2 69,717 6.50 4 First Bancorp Inc. 3 64,569 6.02 5 Rockland Savings Bank FSB 1 60,181 5.61 6 Damariscotta Bankshares Inc. 2 33,537 3.13 7 Bank of America 1 30,604 2.85 8 Bar Harbor Bankshares 1 26,808 2.50 9 Bangor Bancorp MHC 2 25,629 2.39 10 Machias Bancorp MHC 1 24,918 2.32 Market Total 22 1,072,590 100.00 Rank Company Market Branches Market Deposits ($000) Market Share (%) 1 Toronto-Dominion Bank 6 339,862 27.42 2 Androscoggin Bancorp MHC 7 296,024 23.88 3 Mechanics Savings Bank 2 217,516 17.55 4 PRO FORMA 3 $136,896 11.04 4 Northeast Bancorp 4 105,028 8.47 5 Bank of America 2 84,265 6.80 6 KeyCorp 3 65,585 5.29 7 Auburn Bancorp Inc. (MHC) 2 54,025 4.36 8 Camden National Bank 1 52,631 4.25 9 Bangor Bancorp MHC 1 19,156 1.55 10 People's United Financial Inc. 1 5,466 0.44 Market Total 29 1,239,558 100.00 Rank Company Market Branches Market Deposits ($000) Market Share (%) 1 Toronto-Dominion Bank 3 $541,322 27.52 2 Kennebec Savings Bank 5 $524,033 26.64 3 SBM Financial Inc. 13 $331,765 16.87 4 KeyCorp 6 $155,508 7.91 5 Bank of America / PRO FORMA 5 $127,981 6.51 6 Bangor Bancorp MHC 4 $116,477 5.92 7 Kennebec FS&LA of Waterville 2 $53,336 2.71 8 Northeast Bancorp 1 $46,882 2.38 9 Border Bancshares Inc. 2 $42,829 2.18 10 Skowhegan Savings Bank 1 $13,482 0.69 Market Total 43 $1,966,812 100.00 Rank Company Market Branches Market Deposits ($000) Market Share (%) 1 Bangor Bancorp MHC 15 $823,501 39.53 2 Toronto-Dominion Bank 6 $309,963 14.88 3 PRO FORMA 11 $253,232 12.16 3 People's United Financial Inc. 9 $236,903 11.37 4 KeyCorp 6 $165,060 7.92 5 Bank of America 7 $146,670 7.04 6 Katahdin Bankshares Corp. 3 $146,059 7.01 7 Camden National Bank 4 $106,562 5.12 8 Machias Bancorp MHC 3 $102,905 4.94 9 Skowhegan Savings Bank 1 $34,885 1.67 10 SBM Financial Inc. 1 $10,591 0.51 Market Total 55 $2,083,099 100.00
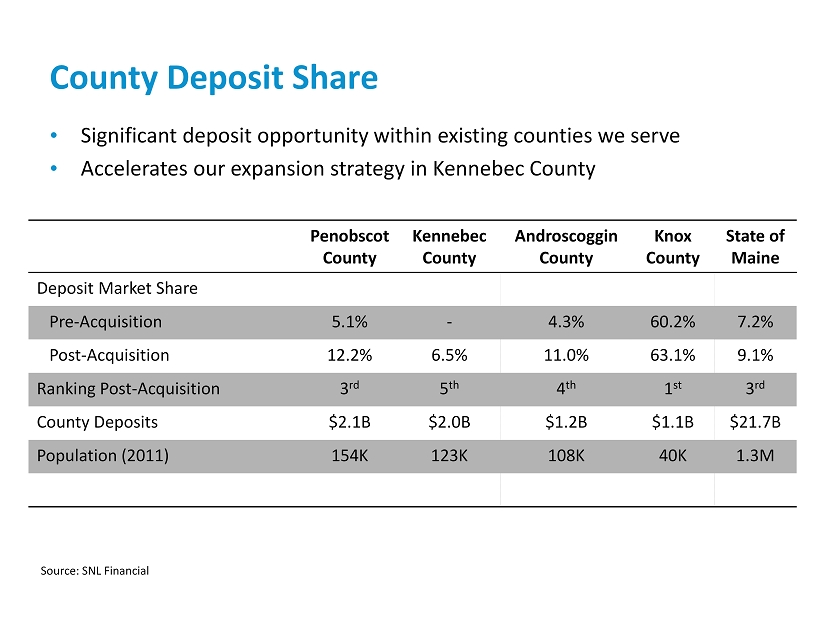
County Deposit Share Penobscot County Kennebec County Androscoggin County Knox County State of Maine Deposit Market Share Pre - Acquisition 5.1% - 4.3% 60.2% 7.2% Post - Acquisition 12.2% 6.5% 11.0% 63.1% 9.1% Ranking Post - Acquisition 3 rd 5 th 4 th 1 st 3 rd County Deposits $2.1B $2.0B $1.2B $1.1B $21.7B Population (2011) 154K 123K 108K 40K 1.3M • Significant deposit opportunity within existing counties we serve • Accelerates our expansion strategy in Kennebec County Source: SNL Financial 22

23 “Financial Institution of the Year” by Finance Authority of Maine November, 2011 KBWs prestigious “ Bank Honor Roll” March, 2012 Forbes one of “America’s Most Trustworthy Companies ” March, 2012