
Dear Fellow Shareholders,
Our activities and performance during the second quarter of 2012 reflect our commitment to long-term sustainable growth for Camden National Corporation. We are excited to expand our market presence in Maine with the acquisition of 15 branches from Bank of America as well as our ability to face the challenges of the low interest rate environment and escalating regulatory burdens placed upon community banks.
We expect that our first half 2012 performance will continue to be in the top 25% of our local, regional and national peer groups. For the first six months of 2012, our return on average assets and return on average equity were 1.12% and 11.74%, respectively, compared to the national peer group averages of 0.77% and 7.48%, respectively, for the first three months of 2012.
Our continuing focus on core operations resulted in net income of $13.0 million for the first six months of 2012, or $1.69 per diluted share. These results were 3% lower than the results reported for the first six months of 2011 and reflect one-time events in both time periods, in addition to the impact of the slow economy and historically low interest rates.
Net interest income was $1.1 million below levels experienced in the first half of 2011. This was due to one-time loan fees received in 2011 of $600,000 combined with a lower net interest margin and reduced loan volumes triggered by higher than normal levels of refinancing. Non-interest revenues increased $858,000 to $11.0 million, for the first half of 2012 compared to the same period a year ago, due to an $872,000 gain on sale of securities in 2012. Non-interest expenses for the first half of 2012 increased $341,000 to $26.9 million, but included $308,000 in costs related to the branch acquisition and $728,000 in costs associated with prepaying various borrowings and refinancing at lower interest rates.
We remain cautious in our outlook of the overall health of the economy and the impact it may have on the asset quality of our organization. Many individual and business borrowers continue to struggle with the effects of high unemployment and a depressed housing market. Our focus on the long-term strength of Camden National is reflected in our “credit culture” of early identification and proactive management of problem loans and maintenance of strong reserve and capital levels.
During the first half of 2012, net charge-offs as a percentage of total assets were 0.21%, which compares favorably to our peers but is above the 0.18% level we reported for the same period a year ago. Our non-performing assets as a percentage of total loans also increased to 1.24% from 1.15% during this time period last year. Reflecting our cautious stance, our allowance for loan losses increased to 1.52% of total loans at June 30, 2012, compared to 1.48% at June 30, 2011
Since we announced the acquisition of 15 branches from Bank of America on April 24, 2012, our teams have been working closely with their counterparts at Bank of America to ensure a smooth transition for customers and impacted employees. The dedication of all those associated with this project is truly impressive. In addition to conversion-related efforts, we also made several announcements that reflect a strategic realignment of our branch network. We announced the closure of our Lewiston location on Canal Street and the relocation of our services to the new Lewiston and Auburn locations that are being acquired. The Canal Street property is currently being marketed for sale. We also announced the relocation of our existing Bangor branch at 145 Exchange Street to 80 Exchange Street to accommodate increased customer volumes. Many shareholders may recall that the 145 Exchange Street location previously served as the headquarters for United Bank and United Kingfield Bank and served us extremely well for many years.
On July 2, 2012, we announced that we would divest the Bank of America Rockland branch, which we were required to do as part of our regulatory approval, and sell the 145 Exchange Street building to The First Bancorp, Inc. of Damariscotta, Maine. The divestiture and building sale resulted in a favorable impact to the financial expectations of the overall branch acquisition. Camden National expects to gain 38,000 customer relationships and approximately $350.0 million in core deposits for an investment of $14 million, which is comprised of the deposit premium and real estate and equipment net of the branch divestiture and sale of building.
Amidst our efforts to deliver a top 25% performance and execute a strategically important acquisition, several significant changes occurred in our regulatory environment that will impact the future of community banking. During the first half of 2012, the Consumer Financial Protection Bureau (“CFPB”), which was created as a result of the Dodd-Frank Wall Street Reform and Consumer Protection Act, began to communicate new reporting requirements and regulations. We at Camden National support efforts to protect consumers and pride ourselves on our service to customers, many of whom are our neighbors and friends. We also support the CFPB’s efforts to bring regulation to those non-bank entities that previously were not subject to the same rules and oversight as banks. Our concern is that, as new rules and reporting requirements are applied to all organizations, those of us who already adhere to consumer protection regulations will be burdened with additional costs with no material improvement in consumer protection.
On June 7, 2012, the Federal Reserve issued its determination that all banks, including community banks, will be subject to the increased capital requirements of the internationally based Basel III Accord. In other words, community banks will have to adhere to the same capital rules and requirements as international “mega banks.”
Fortunately, Camden National Corporation is well positioned to sustain itself in the future, even with these strong headwinds. Our conservative approach to risk management, including credit, interest rate, operational, capital and financial risks, has provided us with a strong balance sheet and capital structure. This same approach has allowed us to strategically expand our organization, which provides us the required scale to efficiently meet the new regulatory burdens.
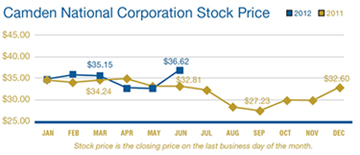
During the second quarter of 2012, we announced a $0.25 dividend per common share, which reflects a 2.73% dividend yield based on our closing market price of $36.62 on June 30, 2012. The tangible book value per share was $23.82 on June 30, 2012, a 6% increase from a year ago. We believe that, during these uncertain economic times, combined with increased regulation, our capital management strategies allow us to balance the needs of our shareholders while maintaining the resources necessary to grow the organization and maintain its sustainability.
Our path to long-term growth consists of delivering top quartile financial performance, maintaining our financial and operational capabilities to take advantage of strategic opportunities, and orienting our organization in the changing economic and regulatory environments. While many organizations may follow the same path, Camden National Corporation is differentiated by the mutual support of our shareholders, customers and employees. Your support of our organization and its mission is very much appreciated.
Sincerely,

President and Chief Executive Officer

Summary Financial Data (unaudited)
(Dollars in thousands, except per share data)
| Financial Condition Data | | June 30, 2012 | | | June 30, 2011 | | | December 31, 2011 | | | | |
| Investments | | $ | 698,296 | | | $ | 617,297 | | | $ | 611,998 | | | | | |
| Loans and loans held for sale | | | 1,536,464 | | | | 1,553,311 | | | | 1,520,089 | | | | | |
| Allowance for loan losses | | | 23,262 | | | | 22,989 | | | | 23,011 | | | | | |
| Total assets | | | 2,403,857 | | | | 2,331,014 | | | | 2,302,720 | | | | | |
| Deposits | | | 1,601,861 | | | | 1,545,551 | | | | 1,591,366 | | | | | |
| Borrowings | | | 527,813 | | | | 541,823 | | | | 456,233 | | | | | |
| Shareholders' equity | | | 226,088 | | | | 218,241 | | | | 218,876 | | | | | |
| | | | At or for the Three Months Ended | | | | At or for the Six Months Ended | |
| Operating Data | | | June 30, 2012 | | | | June 30, 2011 | | | | June 30, 2012 | | | | June 30, 2011 | |
| Interest income | | $ | 22,797 | | | $ | 25,645 | | | $ | 45,762 | | | $ | 50,505 | |
| Interest expense | | | 4,431 | | | | 6,082 | | | | 9,025 | | | | 12,383 | |
| Net interest income | | | 18,366 | | | | 19,563 | | | | 36,737 | | �� | | 38,122 | |
| Provision for credit losses | | | 835 | | | | 970 | | | | 1,840 | | | | 2,089 | |
| Net interest income after provision for credit losses | | | 17,531 | | | | 18,593 | | | | 34,897 | | | | 36,033 | |
| Non-interest income | | | 5,754 | | | | 5,006 | | | | 10,982 | | | | 10,124 | |
| Non-interest expense | | | 13,979 | | | | 13,272 | | | | 26,898 | | | | 26,557 | |
| Income before income taxes | | | 9,306 | | | | 10,327 | | | | 18,981 | | | | 19,600 | |
| Income taxes | | | 2,894 | | | | 3,257 | | | | 5,986 | | | | 6,191 | |
| Net income | | $ | 6,412 | | | $ | 7,070 | | | $ | 12,995 | | | $ | 13,409 | |
| Per Share Data | | | | | | | | | | | | | | | | |
| Basic earnings per share | | $ | 0.84 | | | $ | 0.92 | | | $ | 1.69 | | | $ | 1.75 | |
| Diluted earnings per share | | | 0.83 | | | | 0.92 | | | | 1.69 | | | | 1.75 | |
| Cash dividends paid per share | | | 0.25 | | | | 0.25 | | | | 0.50 | | | | 0.50 | |
| Book value per share | | | 29.67 | | | | 28.43 | | | | 29.67 | | | | 28.43 | |
| Tangible book value per share(1) | | | 23.82 | | | | 22.49 | | | | 23.82 | | | | 22.49 | |
| Selected Financial Data | | | | | | | | | | | | | | | | |
| Return on average assets | | | 1.10 | % | | | 1.22 | % | | | 1.12 | % | | | 1.16 | % |
| Return on average equity | | | 11.48 | % | | | 13.29 | % | | | 11.74 | % | | | 12.88 | % |
| Tier 1 leverage capital ratio | | | 9.64 | % | | | 9.13 | % | | | 9.64 | % | | | 9.13 | % |
| Tier 1 risk-based capital ratio | | | 14.97 | % | | | 14.19 | % | | | 14.97 | % | | | 14.19 | % |
| Total risk-based capital ratio | | | 16.22 | % | | | 15.45 | % | | | 16.22 | % | | | 15.45 | % |
| Efficiency ratio(2) | | | 56.10 | % | | | 53.39 | % | | | 55.26 | % | | | 54.31 | % |
| Allowance for credit losses to total loans | | | 1.52 | % | | | 1.48 | % | | | 1.52 | % | | | 1.48 | % |
| Net loan charge-offs to average loans (annualized) | | | 0.15 | % | | | 0.22 | % | | | 0.21 | % | | | 0.18 | % |
| Non-performing loans to total loans | | | 1.83 | % | | | 1.61 | % | | | 1.83 | % | | | 1.61 | % |
| Non-performing assets to total assets | | | 1.24 | % | | | 1.15 | % | | | 1.24 | % | | | 1.15 | % |
(1) Computed by dividing shareholders' equity less goodwill and other intangibles by the number of common shares outstanding.
(2) Calculated by dividing non-interest expense (excluding preyment fees on borrowings) by the sum of net interest income (tax equivalent) and non-interest income (excluding securities gains/losses and OTTI).
A complete set of financial statements for Camden National Corporation my be obtained upon written request to
Susan M. Westfall, SVP Clerk, Camden National Corporation, P.O. Box 310, Camden, Maine 04843, 207-230-2096.