
February 11, 2013 NASDAQ : CAC
Safe Harbor Statement The information presented may contain forward - looking statements within the meaning of the Private Securities Litigation Reform Act of 1995. These statements are based upon current beliefs and expectations and are subject to significant risks and uncertainties some of which are beyond Camden National Corporation’s control. Actual results may differ materially from the results discussed in these forward - looking statements. Factors that could cause Camden National Corporation’s results to differ materially can be found in the risk factors set forth in Camden National Corporation’s Annual Report on Form 10 - K for the year ended December 31, 2011, as updated by Camden National Corporation’s Quarterly Reports on Form 10 - Q and other filings with the SEC. 1
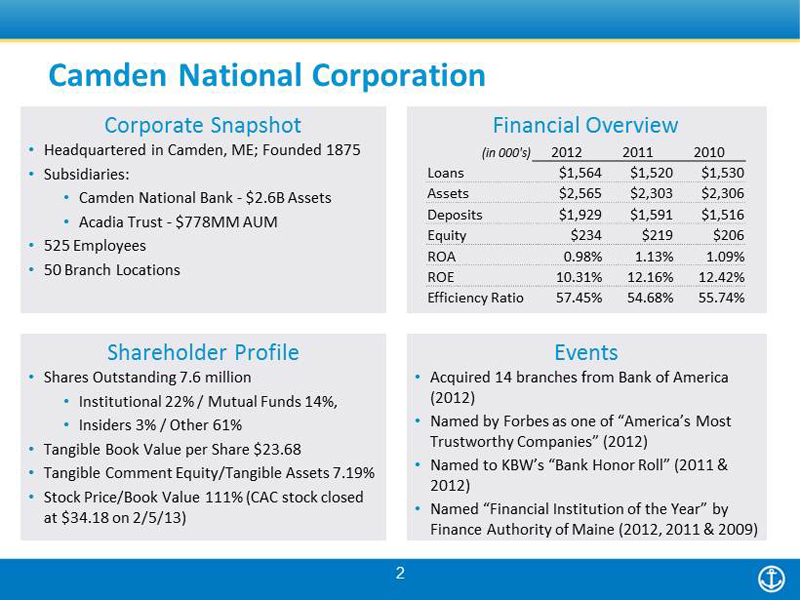
Camden National Corporation Corporate Snapshot • Headquartered in Camden, ME; Founded 1875 • Subsidiaries: • Camden National Bank - $2.6B Assets • Acadia Trust - $778MM AUM • 525 Employees • 50 Branch Locations Financial Overview Shareholder Profile • Shares Outstanding 7.6 million • Institutional 22% / Mutual Funds 14%, • Insiders 3% / Other 61% • Tangible Book Value per Share $23.68 • Tangible Comment Equity/Tangible Assets 7.19% • Stock Price/Book Value 111% (CAC stock closed at $34.18 on 2/5/13) Events • Acquired 14 branches from Bank of America (2012) • Named by Forbes as one of “America’s Most Trustworthy Companies” (2012) • Named to KBW’s “Bank Honor Roll” (2011 & 2012) • Named “Financial Institution of the Year” by Finance Authority of Maine (2012, 2011 & 2009) (in 000's) 2012 2011 2010 Loans $1,564 $1,520 $1,530 Assets $2,565 $2,303 $2,306 Deposits $1,929 $1,591 $1,516 Equity $234 $219 $206 ROA 0.98% 1.13% 1.09% ROE 10.31% 12.16% 12.42% Efficiency Ratio 57.45% 54.68% 55.74% 2
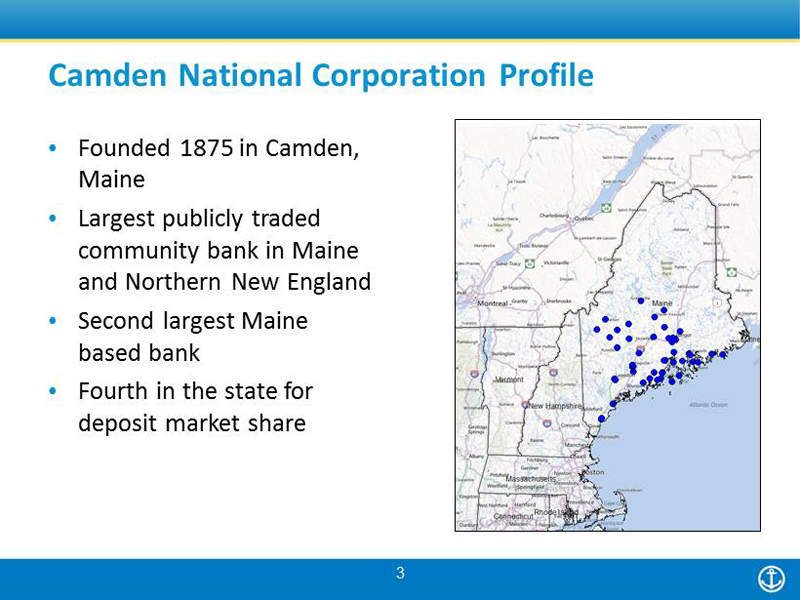
Camden National Corporation Profil e 3 • Founded 1875 in Camden, Maine • Largest publicly traded community bank in Maine and Northern New England • Second largest Maine based bank • Fourth in the state for deposit market share
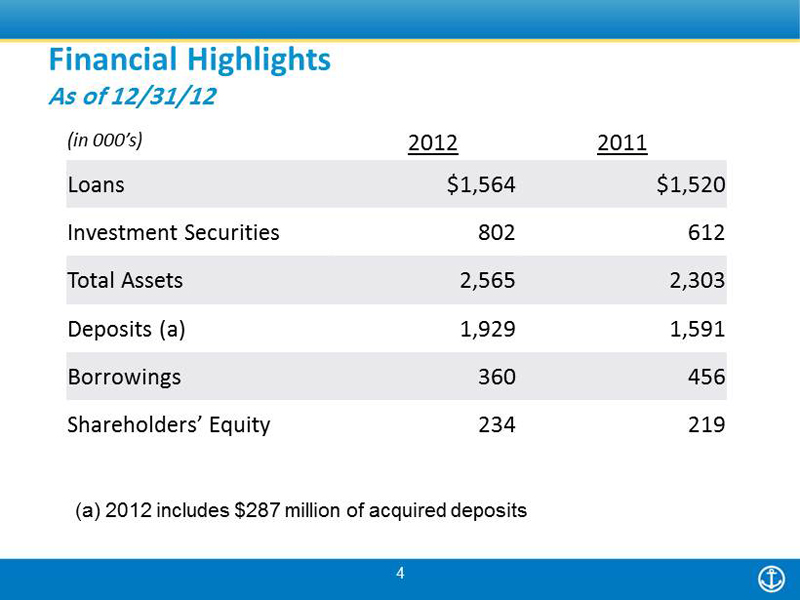
4 (in 000’s) 2012 2011 Loans $1,564 $1,520 Investment Securities 802 612 Total Assets 2,565 2,303 Deposits (a) 1,929 1,591 Borrowings 360 456 Shareholders’ Equity 234 219 (a) 2012 includes $287 million of acquired deposits Financial Highlights As of 12/31/12

5 2012 (a) 2011 Net Income (in millions) $23.4 $26.2 Diluted Earnings per Share $3.05 $3.40 Return on Tangible Equity 12.95% 15.42% Return on Assets 0.98% 1.13% Efficiency Ratio 57.45% 54.68% Net Interest Margin 3.36% 3.57% (a) 2012 includes one - time branch acquisition costs of $2.3 million Financial Highlights As of 12/31/12

Checking 31% Savings/Money Market 30% CD's 23% Borrowings 16% Funding Mix Home Equity/ Consumer 19% Commercial Real Estate 32% Residential Mortgages 37% Commercial 12% Loan Portfolio Total Loans: $1.56 billion Yield: 4.62% Funding: $2.29 billion Total Funding Cost: 0.71% Deposit Cost: 0.41% 6 Loans and Funding As of 12/31/12

Portfolio Stats Market Value $781 Million Average Yield 2.41% Duration 3.6 Years Premium $8.3 Million Premium as % of Portfolio 1.1% Investment Portfolio As of 12/31/12 7 MBS $345 45% Agency CMO $376 50% Municipals $31 4% Non - Agency $9 1% Book Value - $761 Million Excludes FRB/FHLB stock of $21 million
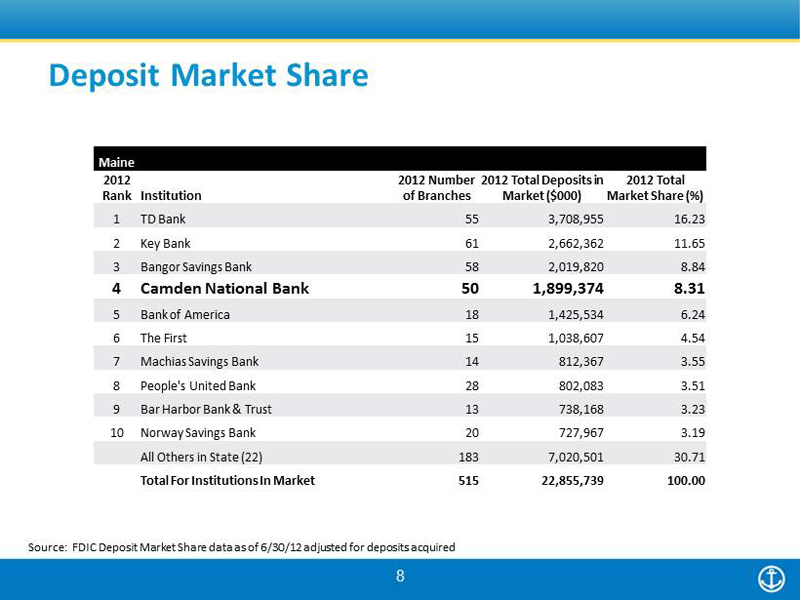
8 Source: FDIC Deposit Market Share data as of 6/30/12 adjusted for deposits acquired Maine 2012 Rank Institution 2012 Number of Branches 2012 Total Deposits in Market ($000) 2012 Total Market Share (%) 1 TD Bank 55 3,708,955 16.23 2 Key Bank 61 2,662,362 11.65 3 Bangor Savings Bank 58 2,019,820 8.84 4 Camden National Bank 50 1,899,374 8.31 5 Bank of America 18 1,425,534 6.24 6 The First 15 1,038,607 4.54 7 Machias Savings Bank 14 812,367 3.55 8 People's United Bank 28 802,083 3.51 9 Bar Harbor Bank & Trust 13 738,168 3.23 10 Norway Savings Bank 20 727,967 3.19 All Others in State (22) 183 7,020,501 30.71 Total For Institutions In Market 515 22,855,739 100.00 Deposit Market Share
Core Strengths • Solid track record of organic and acquired growth • Above peer earnings performance • Disciplined risk management culture • Consistent shareholder returns 9
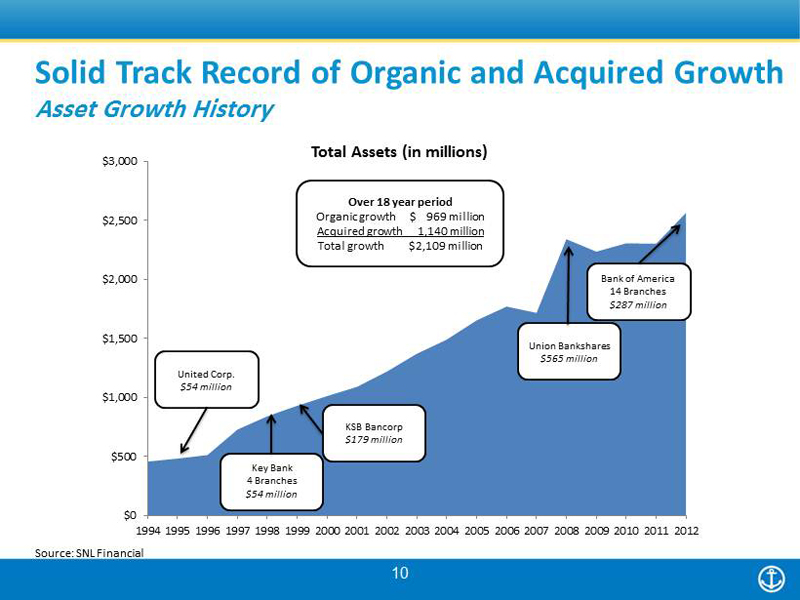
10 Solid Track Record of Organic and Acquired Growth Asset Growth History Source: SNL Financial $0 $500 $1,000 $1,500 $2,000 $2,500 $3,000 1994 1995 1996 1997 1998 1999 2000 2001 2002 2003 2004 2005 2006 2007 2008 2009 2010 2011 2012 Total Assets (in millions) United Corp. $54 million KSB Bancorp $179 million Union Bankshares $565 million Bank of America 14 Branches $287 million Key Bank 4 Branches $54 million Over 18 year period Organic growth $ 969 million Acquired growth 1,140 million Total growth $2,109 million

Above Peer Earnings Performance • Consistent , top - quartile performance against Northeast and National peer groups • Driven to create consistent returns for our shareholders • Efficient operations focused on revenue generation Proxy Peer – Average of 20 publicly traded commercial and savings banks in the Northeast (as of 12/31/12) BHCPR Peer – Average of 355 bank holding companies with consolidated assets between $1 and $3 billion (as of 9/30/12) Source : SNL Financial 0.67% 1.00% 1.09% 1.13% 0.98% -0.50% 0.00% 0.50% 1.00% 1.50% 2008 2009 2010 2011 2012 9.15% 12.81% 12.42% 12.16% 10.31% -10.00% -5.00% 0.00% 5.00% 10.00% 15.00% 2008 2009 2010 2011 2012 52.44% 54.26% 55.74% 54.68% 57.45% 40.00% 50.00% 60.00% 70.00% 80.00% 2008 2009 2010 2011 2012 11 Highlights Return on Average Assets Return on Average Equity Efficiency Ratio (FTE)
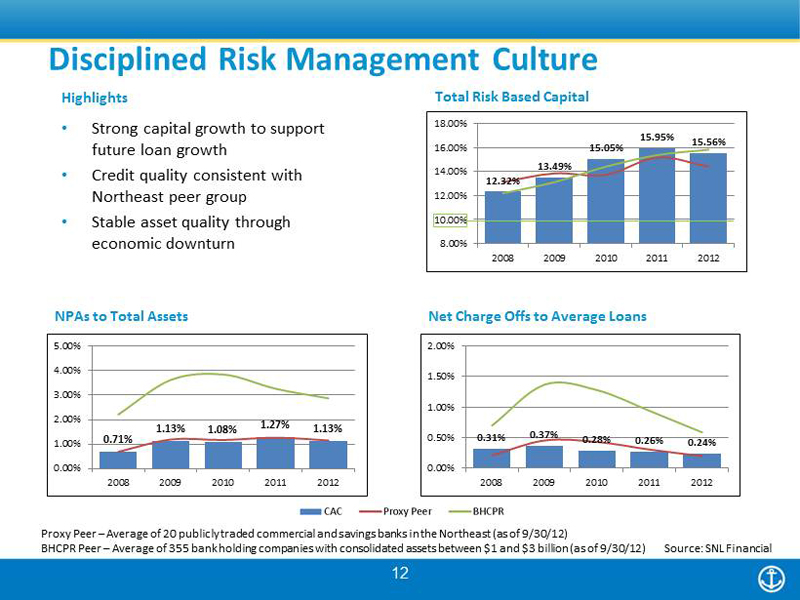
Disciplined Risk Management Culture 12.32% 13.49% 15.05% 15.95% 15.56% 8.00% 10.00% 12.00% 14.00% 16.00% 18.00% 2008 2009 2010 2011 2012 12 0.71% 1.13% 1.08% 1.27% 1.13% 0.00% 1.00% 2.00% 3.00% 4.00% 5.00% 2008 2009 2010 2011 2012 • Strong capital growth to support future loan growth • Credit quality consistent with Northeast peer group • Stable asset quality through economic downturn NPAs to Total Assets Net Charge Offs to Average Loans Total Risk Based Capital Highlights Proxy Peer – Average of 20 publicly traded commercial and savings banks in the Northeast (as of 9/30/12) BHCPR Peer – Average of 355 bank holding companies with consolidated assets between $1 and $3 billion (as of 9/30/12) Source : SNL Financial 0.31% 0.37% 0.28% 0.26% 0.24% 0.00% 0.50% 1.00% 1.50% 2.00% 2008 2009 2010 2011 2012
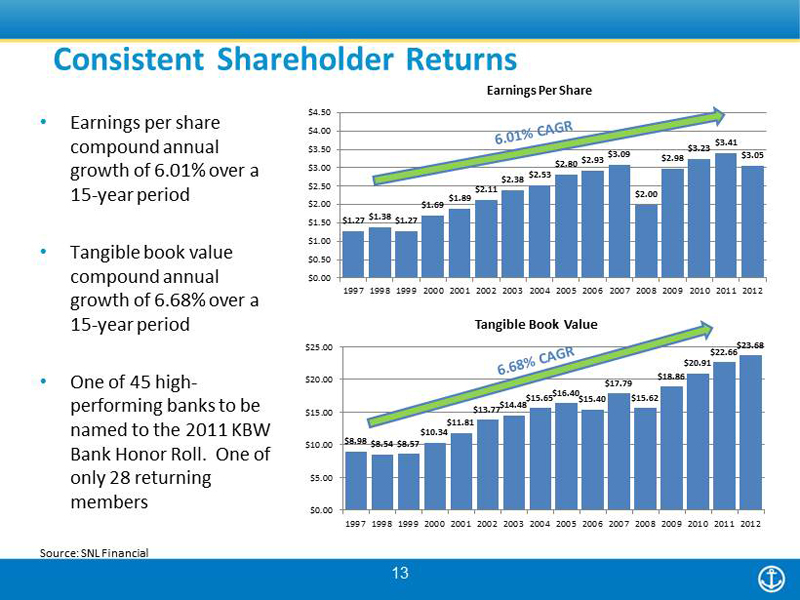
13 Consistent Shareholder Returns Source: SNL Financial • Earnings per share compound annual growth of 6.01% over a 15 - year period • Tangible book value compound annual growth of 6.68% over a 15 - year period • One of 45 high - performing banks to be named to the 2011 KBW Bank Honor Roll. One of only 28 returning members $1.27 $1.38 $1.27 $1.69 $1.89 $2.11 $2.38 $2.53 $2.80 $2.93 $3.09 $2.00 $2.98 $3.23 $3.41 $3.05 $0.00 $0.50 $1.00 $1.50 $2.00 $2.50 $3.00 $3.50 $4.00 $4.50 1997 1998 1999 2000 2001 2002 2003 2004 2005 2006 2007 2008 2009 2010 2011 2012 Earnings Per Share $8.98 $8.54 $8.57 $10.34 $11.81 $13.77 $14.48 $15.65 $16.40 $15.40 $17.79 $15.62 $18.86 $20.91 $22.66 $23.68 $0.00 $5.00 $10.00 $15.00 $20.00 $25.00 1997 1998 1999 2000 2001 2002 2003 2004 2005 2006 2007 2008 2009 2010 2011 2012 Tangible Book Value

• Strategically Compelling • Contiguous expansion – I - 95 corridor fills - out footprint • Increased market share in Maine from 7.22% to 8.31% • Added $287 million in core deposits and 14 branches • Financially Attractive • Accretive within 14 months of acquisition • Pro forma Tangible Book Value dilution earned back in three to four years • Low Risk • Markets in which we currently operate in or are adjacent to • Management has successful integration track record • Limited credit risk with only $6 million of business loans acquired 14 Branch Acquisition Unique Expansion Opportunity

15 Source: SNL Financial Branch Acquisition Strategically Compelling - Contiguous Expansion Filled in Camden National’s footprint and increased the branch network from 38 to 50 banking locations

($ in 000s) Acquired Divested Net Acquired Deposits $318,949 $32,290 $286,659 Premium on deposits (a) 12,035 3,333 8,702 Fixed assets 5,029 3,000 2,029 Total acquisition cost $ 17,064 $ 6,333 $ 10,731 # of Accounts 60,153 5,030 55,123 Cost per account $283.68 - $194.67 (a) Premium on deposits paid of 3.706% compared to deposit premium received of 10.01% on Rockland divestiture 16 Branch Acquisition Cost of Acquisition – 12/31/12

17 “Financial Institution of the Year” by Finance Authority of Maine 2009, 2011, and 2012 KBWs “ Bank Honor Roll” 2011 and 2012 Forbes one of “America’s Most Trustworthy Companies ” 2012
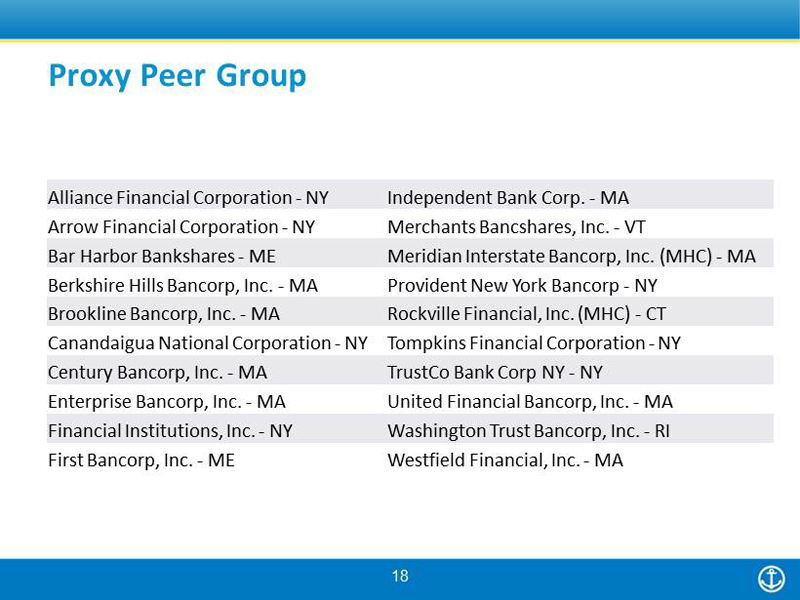
Proxy Peer Group 18 Alliance Financial Corporation - NY Arrow Financial Corporation - NY Bar Harbor Bankshares - ME Berkshire Hills Bancorp, Inc. - MA Brookline Bancorp, Inc. - MA Canandaigua National Corporation - NY Century Bancorp, Inc. - MA Enterprise Bancorp, Inc. - MA Financial Institutions, Inc. - NY First Bancorp, Inc. - ME Independent Bank Corp. - MA Merchants Bancshares, Inc. - VT Meridian Interstate Bancorp, Inc. (MHC) - MA Provident New York Bancorp - NY Rockville Financial, Inc. (MHC) - CT Tompkins Financial Corporation - NY TrustCo Bank Corp NY - NY United Financial Bancorp, Inc. - MA Washington Trust Bancorp, Inc. - RI Westfield Financial, Inc. - MA