
2013 Annual Meeting

Welcome to the 2013 Annual Shareholder’s Meeting Karen W. Stanley Chairman of the Board

Official Meeting Notice Sue W estfall Recording Secretary

Agenda • Business Meeting • Introductions • Reading of the Minutes • Shareholder Voting • Presentations • Chairman’s Remarks – Karen Stanley • Financial Results – Deborah Jordan • Strategic Update – Greg Dufour • Questions and Answers

Camden National Bank Board of Directors • Karen Stanley, Chair • Gregory Dufour, President/CEO • Ann Bresnahan • William Dubord • David Flanagan • John Holmes • James Markos , Jr. • Robert Merrill • Francis O’Hara , Jr. • John Rohman • Rosemary Weymouth

Camden National Corporation Board of Directors • Karen Stanley, Chair • Gregory Dufour, President/CEO • Ann Bresnahan • Robert Campbell • David Flanagan • Craig Gunderson • John Holmes • James Page , Ph.D. • John Rohman • Robin Sawyer , CPA

Acadia Trust Board of Directors • Gregory Dufour, Chair • Ann Bresnahan • Robert Campbell • Rendle Jones • Stephen Tall , President/CEO

Camden National Corporation Senior Management Team Gregory Dufour , President and CEO Joanne Campbell , EVP - Risk Management Officer Carolyn Crosby , SVP - Human Resources & Development Peter Greene , EVP - Operations & Technology Deborah Jordan , CPA, EVP - Chief Financial Officer Robert McKay , SVP - Camden Financial Consultants Timothy Nightingale , EVP - Senior Lending Officer June Parent , EVP - Senior Retail Banking Officer Stephen Tall , Acadia Trust President and CEO

Meeting Minutes Susan M. Westfall Recording Secretary
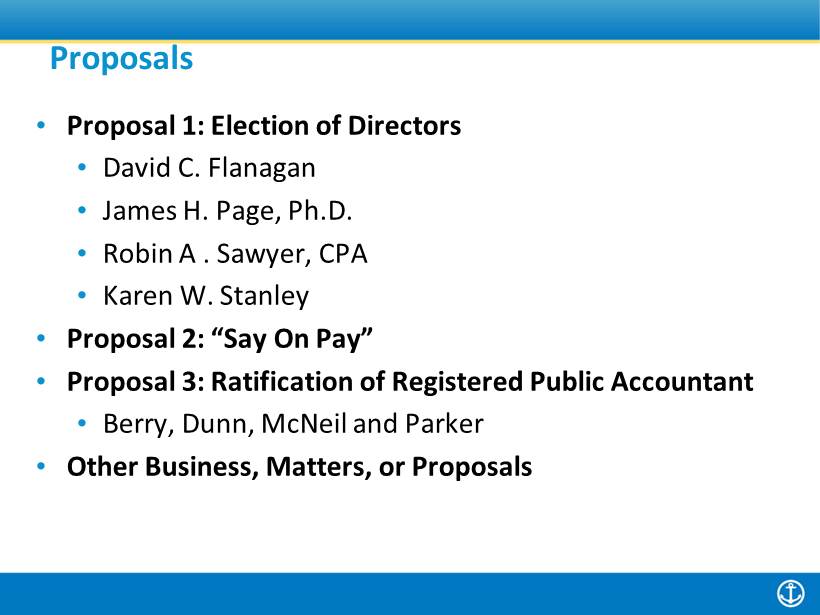
• Proposal 1: Election of Directors • David C. Flanagan • James H. Page, Ph.D. • Robin A . Sawyer, CPA • Karen W. Stanley • Proposal 2: “Say On Pay” • Proposal 3 : Ratification of Registered Public Accountant • Berry, Dunn, McNeil and Parker • Other Business, Matters, or Proposals Proposals
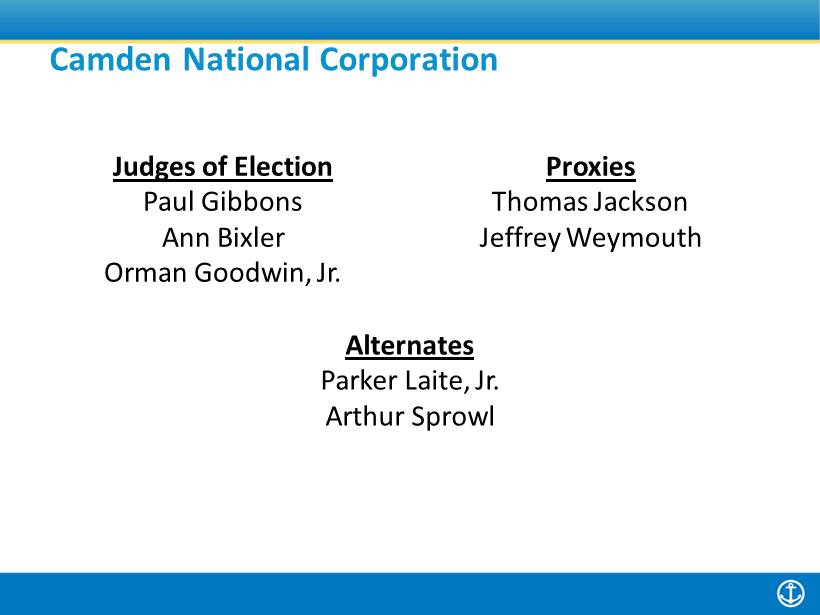
Camden National Corporation Judges of Election Paul Gibbons Ann Bixler Orman Goodwin , Jr. Proxies Thomas Jackson Jeffrey Weymouth Alternates Parker Laite , Jr. Arthur Sprowl
Submission of Proxy Votes

Chairman’s Remarks Karen W. Stanley Chair of the Board
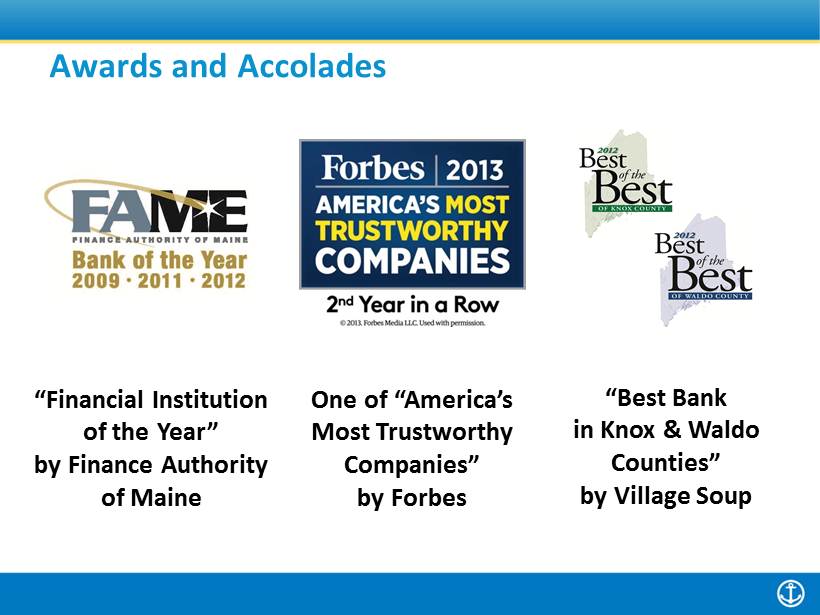
“Best Bank in Knox & Waldo Counties” by Village Soup One of “America’s Most Trustworthy Companies ” by Forbes “Financial Institution of the Year” by Finance Authority of Maine Awards and Accolades
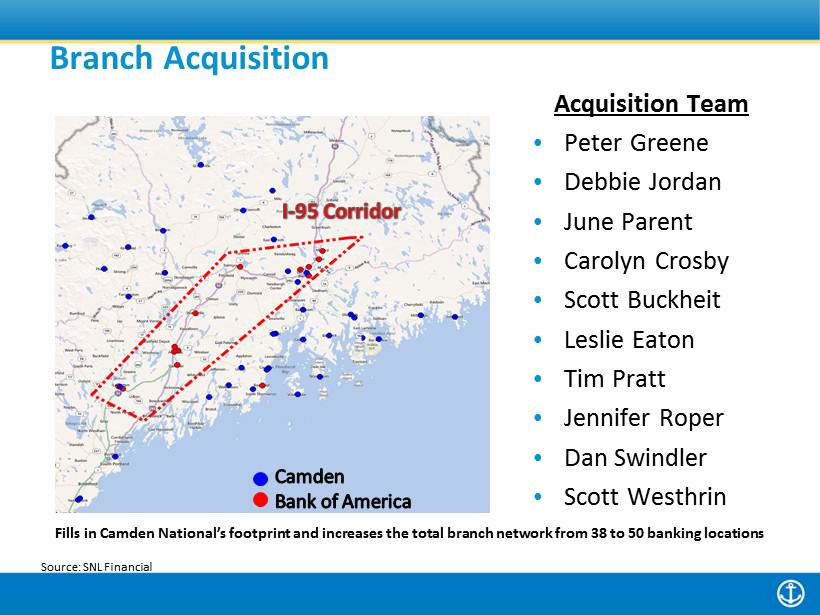
Source: SNL Financial Fills in Camden National’s footprint and increases the total branch network from 38 to 50 banking locations Acquisition Team • Peter Greene • Debbie Jordan • June Parent • Carolyn Crosby • Scott Buckheit • Leslie Eaton • Tim Pratt • Jennifer Roper • Dan Swindler • Scott Westhrin Branch Acquisition
Building Long - Term Value • Revenue Growth through building Market Share • Balancing Risk/Reward • Capital Management Strategies • Cash Dividend Increase of 8% • Retirements • Director Rendle Jones • Senior Vice President Jack Williams
2012 Financial Highlights, First Quarter 2013 Financial Results and Branch Acquisition Update Deborah Jordan Chief Financial Officer

Safe Harbor Statement The information presented may contain forward - looking statements within the meaning of the Private Securities Litigation Reform Act of 1995. These statements are based upon current beliefs and expectations and are subject to significant risks and uncertainties (some of which are beyond Camden National Corporation’s control). Actual results may differ materially from the results discussed in these forward - looking statements. Factors that could cause Camden National Corporation’s results to differ materially can be found in the risk factors set forth in Camden National Corporation’s Annual Report on Form 10 - K for the year ended December 31, 2012, as updated by Camden National Corporation’s Quarterly Reports on Form 10 - Q and other filings with the SEC.
2012 Financial Highlights • Growth in loans and deposits • Net income of $23.4 million and return on equity of 10.31% • Improved credit quality • Maintained strong capital position • Continued outperformance to peer groups
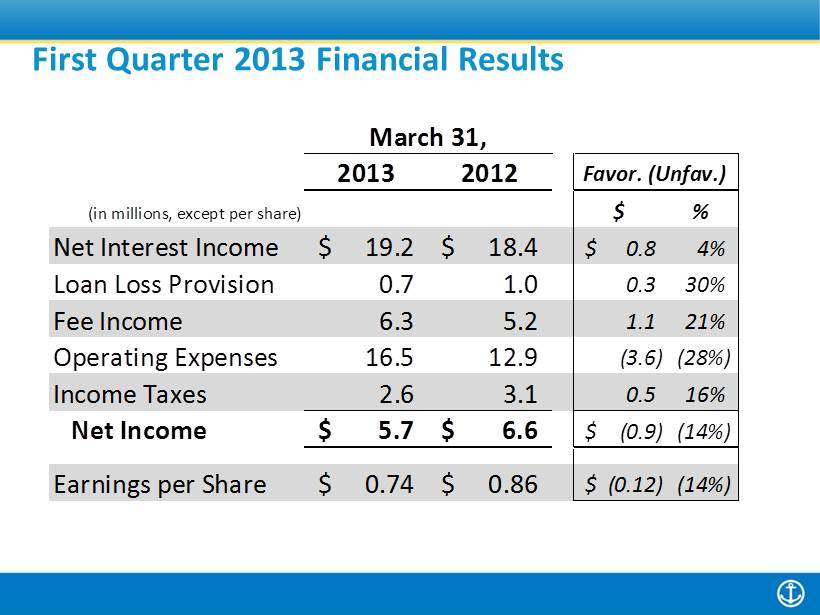
First Quarter 2013 Financial Results March 31, 2013 2012 Favor. (Unfav.) (in millions, except per share) $ % Net Interest Income 19.2$ 18.4$ 0.8$ 4% Loan Loss Provision 0.7 1.0 0.3 30% Fee Income 6.3 5.2 1.1 21% Operating Expenses 16.5 12.9 (3.6) (28%) Income Taxes 2.6 3.1 0.5 16% Net Income 5.7$ 6.6$ (0.9)$ (14%) Earnings per Share 0.74$ 0.86$ (0.12)$ (14%)
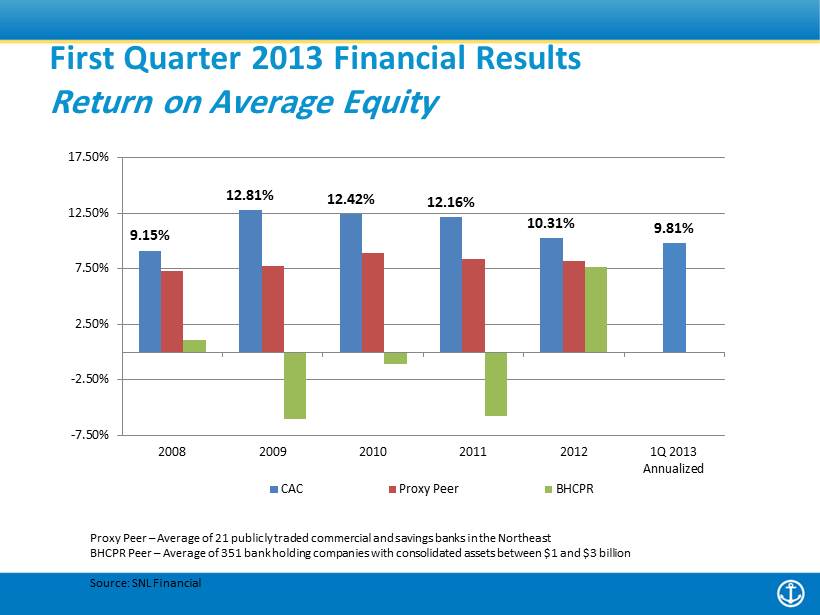
Proxy Peer – Average of 21 p ublicly traded c ommercial and savings banks in the Northeast BHCPR Peer – Average of 351 bank holding companies with consolidated assets between $1 and $3 billion Source: SNL Financial First Quarter 2013 Financial Results Return on Average Equity 9.15% 12.81% 12.42% 12.16% 10.31% 9.81% -7.50% -2.50% 2.50% 7.50% 12.50% 17.50% 2008 2009 2010 2011 2012 1Q 2013 Annualized CAC Proxy Peer BHCPR
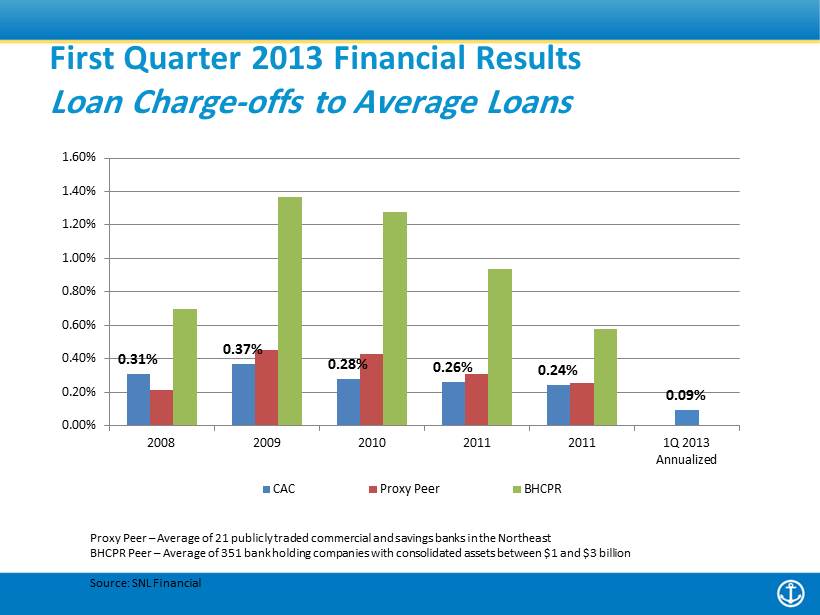
First Quarter 2013 Financial Results Loan Charge - offs to Average Loans 0.31% 0.37% 0.28% 0.26% 0.24% 0.09% 0.00% 0.20% 0.40% 0.60% 0.80% 1.00% 1.20% 1.40% 1.60% 2008 2009 2010 2011 2011 1Q 2013 Annualized CAC Proxy Peer BHCPR Proxy Peer – Average of 21 p ublicly traded c ommercial and savings banks in the Northeast BHCPR Peer – Average of 351 bank holding companies with consolidated assets between $1 and $3 billion Source: SNL Financial

First Quarter 2013 Financial Results Efficiency Ratio 52.44% 54.26% 55.74% 54.68% 57.45% 63.88% 25.00% 35.00% 45.00% 55.00% 65.00% 75.00% 85.00% 2008 2009 2010 2011 2011 1Q 2013 CAC Proxy Peer BHCPR Proxy Peer – Average of 21 p ublicly traded c ommercial and savings banks in the Northeast BHCPR Peer – Average of 351 bank holding companies with consolidated assets between $1 and $3 billion Source: SNL Financial
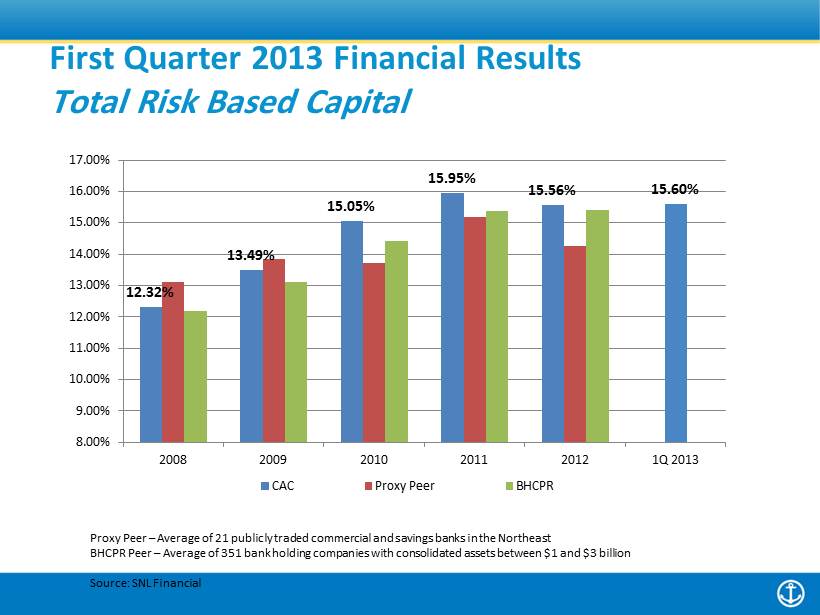
First Quarter 2013 Financial Results Total Risk Based Capital 12.32% 13.49% 15.05% 15.95% 15.56% 15.60% 8.00% 9.00% 10.00% 11.00% 12.00% 13.00% 14.00% 15.00% 16.00% 17.00% 2008 2009 2010 2011 2012 1Q 2013 CAC Proxy Peer BHCPR Proxy Peer – Average of 21 p ublicly traded c ommercial and savings banks in the Northeast BHCPR Peer – Average of 351 bank holding companies with consolidated assets between $1 and $3 billion Source: SNL Financial
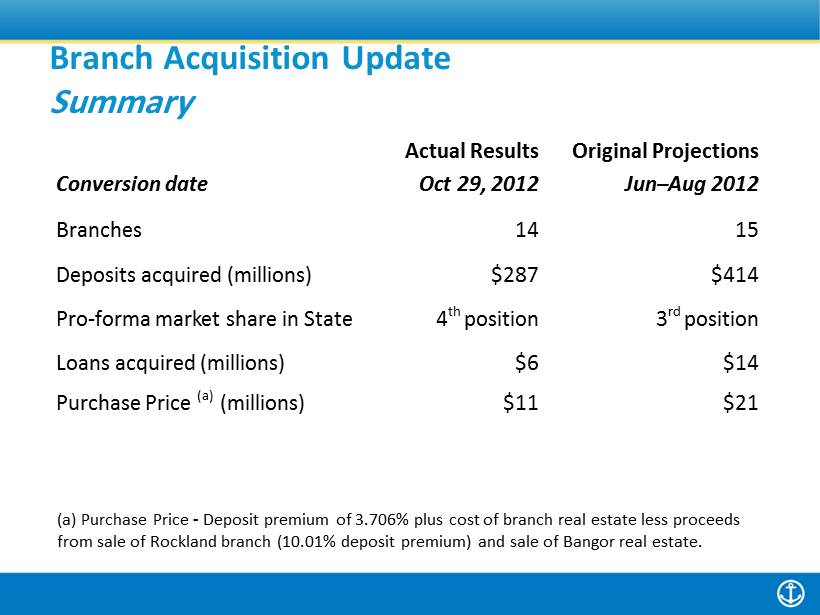
Actual Results Original Projections Conversion date Oct 29, 2012 Jun – Aug 2012 Branches 14 15 Deposits acquired (millions) $287 $414 Pro - forma market share in State 4 th position 3 rd position Loans acquired (millions) $6 $14 Purchase Price (a) (millions) $11 $21 (a) Purchase Price - Deposit premium of 3.706% plus cost of branch real estate less proceeds from sale of Rockland branch (10.01% deposit premium) and sale of Bangor real estate. Branch Acquisition Update Summary

• Growth in Core Deposits of $359 million or 35% • Saved over $6 million in interest expense with lower cost of funds • Loan to deposit ratio reduced to 81% from 97% Branch Acquisition Update Change in Funding Profile Core Deposits 49% Borrowing 32% Retail CDs 19% 3/31/12 $2.1 Billion Cost of Funds 0.90% Core Deposits 59% Borrowing 23% Retail CDs 18% 3/31/13 $2.3 Billion Cost of Funds 0.58%

Source: FDIC Deposit Market Share data as of 6/30/12 adjusted for deposits acquired Institution # of Branches Deposits in Market ($000) Market Share 1 TD Bank 55 3,708,955 16.2% 2 Key Bank 61 2,662,362 11.7% 3 Bangor Savings Bank 58 2,019,820 8.8% 4 Camden National Bank 50 1,899,374 8.3% 5 Bank of America 18 1,425,534 6.2% • Penobscot County – Now 3 rd market share from 7 th • Androscoggin County – Now 5 th market share from 8 th • Kennebec County – Now 5 th market share from no presence Branch Acquisition Update Deposit Market Share
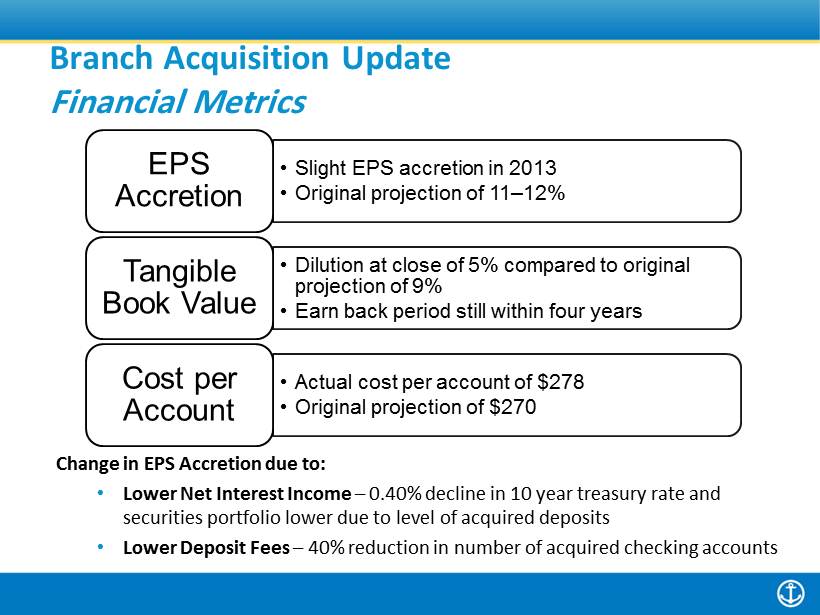
Change in EPS Accretion due to: • Lower Net Interest Income – 0.40% decline in 10 year treasury rate and securities portfolio lower due to level of acquired deposits • Lower Deposit Fees – 40% reduction in number of acquired checking accounts Branch Acquisition Update Financial Metrics • Slight EPS accretion in 2013 • Original projection of 11 – 12% EPS Accretion • Dilution at close of 5% compared to original projection of 9% • Earn back period still within four years Tangible Book Value • Actual cost per account of $278 • Original projection of $270 Cost per Account

Gregory A. Dufour President and Chief Executive Officer CEO Comments

Economic and Industry Overview, Strategic Update and Shareholder Return

• Minimal economic growth • Risk of low/no population growth • Risk of low/no consumer and business demand • Prolonged period of low interest rates • Risk of continued “Margin Compression” • Risk of “spikes” in interest rates and inflation • Concerns regarding global events and local impact • Risk of sovereign debt defaults • Risk of China’s economy Economic Overview
• Increased regulation • Increased capital requirements • Uneven playing field Industry Overview
• Dodd - Frank Act (2010) • 3,900 pages of proposed and final rules • Creation of the Consumer Financial Protection Bureau (“CFPB”) • Escalating cost of compliance Industry Overview Increased Regulation

Industry Overview Increased Regulation – Residential mortgages
• What this means to us is … • Some rules are well meaning – others will deny credit to otherwise worthy borrowers • CFPB – not accountable to Congress • Increased costs impacts service and shareholder value Industry Overview Increased Regulation

• Basel III • International capital rules for large, multi - national banks • Proposed to be applied to community banks • Difficult and expensive to measure, track and comply • Alternative minimal capital requirements • Simpler to implement • Negative impact on capital • What this means to us is … • Less capacity to lend (revenues) • Less capacity to support shareholders • Additional cost to comply Industry Overview Increased Capital Requirements
• Mortgage Companies • Credit Unions • What this means to us is … • Mortgage companies are not subject to the same compliance as Banks • Credit Unions have a 35% price advantage • Lack of transparency as compared to banks and publicly traded organizations Industry Overview The Uneven Playing Fi eld

Strategic Update Succeeding in a challenging environment
• Cultivate a comprehensive relationship - based sales and marketing culture • Enhance the customer and stakeholder experiences through continuous improvement, innovation and organizational effectiveness • Build information systems to better understand customer behaviors, manage relationships and advance our organization • Create convenient and seamless ways to serve and interact with our customers • Foster an environment of leaders and engaged stakeholders Strategic Update 5 Strategic Priorities

Strategic Update Selected 2012 Accomplishments Cultivate a relationship - based sales and marketing culture • Established three commercial lending niche products - $3 million of balances • Phase II of brand campaign • 2012 Finance Authority of Maine’s “Financial Institution of the Year”

Strategic Update Selected 2012 Accomplishments Enhance the customer and stakeholder experiences • Established department level service metrics • Implemented online mortgage applications and online account opening (2013) • Reduced Debit Card issuance from 10 days to 2 days
Strategic Update Selected 2012 Accomplishments Build management information systems to better understand and manage customer relationships • Established Sharepoint and associated management information tools • Transitioned Acadia Trust to “state of the art” SEI investment platform

Strategic Update Selected 2012 Accomplishments Create convenient and seamless ways to serve and interact with our customers • Expanded Customer Assistance Center hours and staff • Implemented “Smart” ATM technology • Created Android and iPhone apps

Strategic Update Selected 2012 Accomplishments Foster an environment of leaders and engaged Stakeholders • Average training hours: 47.4 per FTE • 76% participation in Wellness program • 21,000 hours of employee volunteering

Shareholder Return

$0.45 $0.55 $0.60 $0.63 $0.64 $0.68 $0.72 $0.80 $1.30 $0.88 $0.96 $0.99 $1.00 $1.00 $1.50 $1.00 $1.08 $0.00 $0.20 $0.40 $0.60 $0.80 $1.00 $1.20 $1.40 $1.60 $1.80 1997 1998 1999 2000 2001 2002 2003 2004 2005 2006 2007 2008 2009 2010 2011 2012 2013* Dividends Per Share Source: SNL Financial *1 st Q 2013 Annualized • Earnings per share compound annual growth of 6.01% over a 15 - year period • Dividend per share compound annual growth of 5.67% over a 16 - year period $1.27 $1.38 $1.27 $1.69 $1.89 $2.11 $2.38 $2.53 $2.80 $2.93 $3.09 $2.00 $2.98 $3.23 $3.41 $3.05 $0.00 $0.50 $1.00 $1.50 $2.00 $2.50 $3.00 $3.50 $4.00 $4.50 1997 1998 1999 2000 2001 2002 2003 2004 2005 2006 2007 2008 2009 2010 2011 2012 Earnings Per Share Shareholder Return Consistent Performance
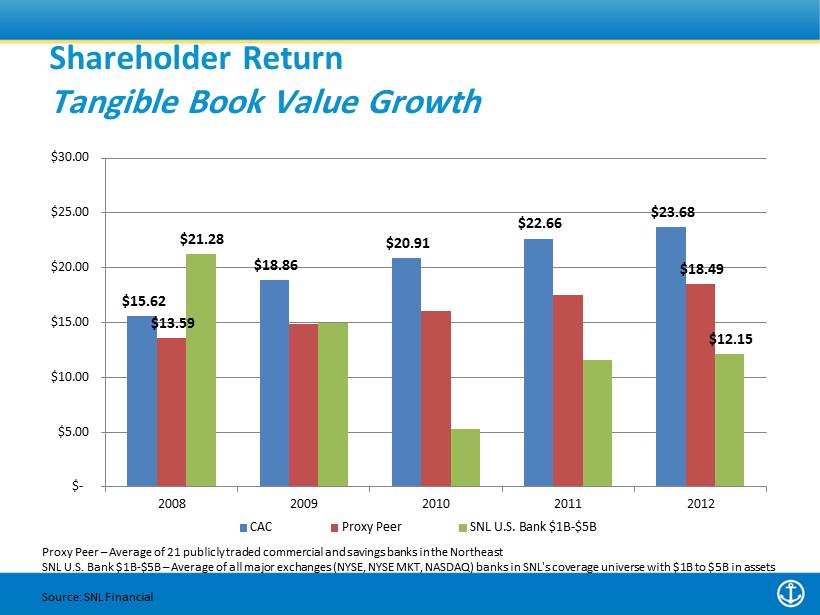
Shareholder Return Tangible Book Value Growth $15.62 $18.86 $20.91 $22.66 $23.68 $13.59 $18.49 $21.28 $12.15 $- $5.00 $10.00 $15.00 $20.00 $25.00 $30.00 2008 2009 2010 2011 2012 CAC Proxy Peer SNL U.S. Bank $1B-$5B Proxy Peer – Average of 21 publicly traded commercial and savings banks in the Northeast SNL U.S. Bank $1B - $5B – Average of all major exchanges (NYSE, NYSE MKT, NASDAQ) banks in SNL's coverage universe with $1B to $5B in a ssets Source: SNL Financial

Distribution • Increased market share in Maine’s stronger markets • Web and mobile Products • Full product set: Commercial & Retail banking, Brokerage and Wealth Management • Online applications and account openings Customers • Serving over 100,000 customers – 30% more than a year ago Capital • Long - term focus • Regulatory: “Well Capitalized” • Shareholder: 3.3% dividend yield • Invest for the future We are positioned to succeed!

Questions and Answers

Supplemental Information

Proxy Peer Group Alliance Financial Corporation - NY Arrow Financial Corporation - NY Bar Harbor Bankshares - ME Berkshire Hills Bancorp, Inc. - MA Brookline Bancorp, Inc. - MA Canandaigua National Corporation - NY Century Bancorp, Inc. - MA Enterprise Bancorp, Inc. - MA Financial Institutions, Inc. - NY First Bancorp, Inc. - ME Hingham Institution for Savings - MA Independent Bank Corp. - MA Merchants Bancshares, Inc. - VT Meridian Interstate Bancorp, Inc. (MHC) - MA Provident New York Bancorp - NY Rockville Financial, Inc. (MHC) - CT Tompkins Financial Corporation - NY TrustCo Bank Corp NY - NY United Financial Bancorp, Inc. - MA Washington Trust Bancorp, Inc. - RI Westfield Financial, Inc. - MA