Exhibit 99.1
Dear Shareholders:
With three quarters of this year now at our backs, I am pleased to report that your Company has fared well thus far in the face of continued uncertainties in the economy and financial markets that can, at best, be described as uneven. This is a tribute to the loyalty of our expanding customer base and a commitment to quality growth and outstanding customer service expressed by our dedicated workforce.
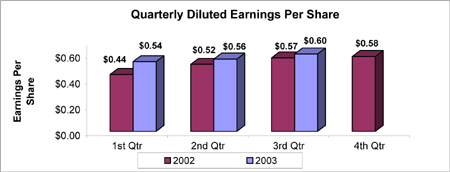
Earnings per diluted share of $1.70 for the first nine months of 2003 were 11.11% higher than the first nine months of 2002, while results for the third quarter of 2003, of $0.60 per diluted share, were 5.26% higher than last year’s third quarter. Our three primary financial benchmarks, return on equity, return on assets and the efficiency ratio (non-interest expense/net interest income and non-interest income), remained consistent with the previous year’s performance. As of September 30, 2003, return on equity was 15.11%, return on assets was 1.43% and the efficiency ratio was 50.96%, which compares to 15.18%, 1.46% and 52.52%, respectively, for the first nine months of 2002.
Total loans of $953.5 million on September 30, 2003 represented a 26.0% increase over the same period a year ago. Heavily impacting this significant year-on-year increase was the effect of the residential mortgage refinance boom. Total deposits of $902.7 million on September 30, 2003 increased 5.14% from September 30, 2002. Noteworthy is the 12.33% growth in low-cost demand deposit balances during that same time period.
In previous shareholder letters, I have shared with you how we focus on three major risk factors that greatly affect financial services companies: asset quality, interest rate and capital. We believe that by properly managing these risks, Camden National Corporation can achieve an appropriate long-term, sustainable rate of growth without exposing the franchise to the potential negative impact of these risks. I am pleased to provide you with an encouraging update on our activities in managing each of these highlighted risk factors.
Asset quality is typically the most significant risk facing a financial services company whose primary activity is making loans. The recent enhancements we have made in asset quality management, including people, systems and increases to the reserve for loan losses, have resulted in significant benefit to the Company during the third quarter of 2003. Non-performing assets of $4.5 million on September 30, 2003 represented an improvement of 33.65% over levels recorded on June 30, 2003. As a percentage of total loans, non-performing assets stood at 0.48% on September 30, 2003 compared to 0.76% on June 30, 2003. In addition, third quarter 2003 recoveries on prior loan losses exceeded current quarter charge-offs by $189,400, which reflects the hard work of our Corporate Risk Management team.
This sustained period of low interest rates has required on-going vigilance as well. Management from all areas of the Company has worked collaboratively to develop
competitive pricing on loan and deposit products while protecting shareholder interest through the implementation of proactive balance sheet management strategies. The success of this collaboration is best exemplified by the fact that we closed more residential mortgages in the third quarter than ever before, and these mortgages were efficiently sold into the secondary market or effectively match-funded while housed in the bank loan portfolios.
Finally, as part of its overall effort to manage our capital position, your Company repurchased 181,600 shares of common stock during the quarter at an average cost of $28.78 per share. The reduction in capital due to this repurchase activity was more than offset by the increase in capital generated by third quarter operating performance, resulting in a quarter-end risk-based capital ratio of 12.69% and a Tier 1 capital ratio of 11.43%. Both compare favorably to the 10.0% and 6.0% minimums required by the Federal Reserve for a bank holding company to be considered ‘well capitalized.’
We announced several management changes during the quarter. Johann Gouws, Founder, Chairman, President and Chief Executive Officer of Acadia Trust, N.A., and a Director of the Company, retired on July 31, 2003. William Bolinder joined Acadia Trust, N.A. as its President and Chief Executive Officer. Bill previously served as group executive for Zurich Financial Services Group, responsible for the North and Latin American operations. His broad management experience with a global leader in financial services will help us continue the growth of our wealth management business.
Also announcing his retirement was John Witherspoon, who served as President and Chief Executive Officer of UnitedKingfield Bank. Currently providing able leadership for this affiliate are Jeffrey Smith, Chief Operating Officer, and Timothy Nightingale, Senior Loan Officer.
We are grateful to Johann and John for their contributions while with Camden National Corporation, and wish them both the best in the years that follow.
During the third quarter, a dividend of $0.19 per share was declared for stockholders of record on October 15, 2003, payable on October 31, 2003. The price of your Company’s stock (AMEX: CAC) was $29.51 per share on September 30, 2003, an increase of 21.94% since the closing price on December 31, 2002.
We are proud of what has been accomplished through the first nine months of this challenging year, and we appreciate the support you have offered through your ownership of common stock in our Company.
Sincerely,
Robert W. Daigle
President & Chief Executive Officer
Consolidated Statements of Condition (unaudited)
| | | September 30,
| | December 31,
|
| (In thousands, except number of shares & per share data) | | 2003
| | 2002
| | 2002
|
Assets | | | | | | | | | |
Cash and due from banks | | $ | 32,018 | | $ | 38,841 | | $ | 33,523 |
Federal funds sold | | | 3,820 | | | 22,019 | | | — |
Securities available for sale, at market value | | | 232,252 | | | 324,749 | | | 313,780 |
Securities held to maturity | | | 799 | | | 647 | | | 995 |
Residential mortgages held for sale | | | 10,769 | | | — | | | — |
Loans, less allowance for loan losses of of $14,491, $14,771 and $15,242 at September 30, 2003 and 2002 and December 31, 2002, respectively | | | 928,232 | | | 741,940 | | | 793,640 |
Premises and equipment, net | | | 15,998 | | | 17,273 | | | 16,710 |
Goodwill | | | 3,518 | | | 3,518 | | | 3,518 |
Other assets | | | 58,068 | | | 59,665 | | | 56,253 |
| | |
|
| |
|
| |
|
|
Total assets | | $ | 1,285,474 | | $ | 1,208,652 | | $ | 1,218,419 |
| | |
|
| |
|
| |
|
|
Liabilities | | | | | | | | | |
Deposits: | | | | | | | | | |
Demand | | $ | 125,398 | | $ | 111,632 | | $ | 105,091 |
NOW | | | 121,321 | | | 105,209 | | | 107,383 |
Money market | | | 186,538 | | | 172,007 | | | 169,457 |
Savings | | | 108,909 | | | 95,714 | | | 98,197 |
Certificates of deposit | | | 360,526 | | | 374,017 | | | 370,006 |
| | |
|
| |
|
| |
|
|
Total deposits | | | 902,692 | | | 858,579 | | | 850,134 |
Borrowings from Federal Home Loan Bank | | | 200,600 | | | 171,529 | | | 191,901 |
Other borrowed funds | | | 53,457 | | | 53,031 | | | 46,960 |
Accrued interest and other liabilities | | | 11,910 | | | 10,696 | | | 10,596 |
| | |
|
| |
|
| |
|
|
Total liabilities | | | 1,168,659 | | | 1,093,835 | | | 1,099,591 |
| | |
|
| |
|
| |
|
|
Shareholders’ Equity | | | | | | | | | |
Common stock, no par value; authorized 20,000,000 shares, issued 8,609,898 shares | | | 2,450 | | | 2,450 | | | 2,450 |
Surplus | | | 5,387 | | | 5,719 | | | 5,719 |
Retained earnings | | | 123,384 | | | 110,850 | | | 114,128 |
Accumulated other comprehensive income | | | | | | | | | |
Net unrealized gains on securities available for sale, net of tax | | | 2,978 | | | 6,904 | | | 6,800 |
Net unrealized gains on derivative instruments marked to market, net of tax | | | 765 | | | 78 | | | 914 |
| | |
|
| |
|
| |
|
|
| | | | 134,964 | | | 126,001 | | | 130,011 |
Less cost of 831,456, 582,524 and 582,524 shares of treasury stock on September 30, 2003 and 2002 and December 31, 2002, respectively | | | 18,149 | | | 11,184 | | | 11,183 |
| | |
|
| |
|
| |
|
|
Total shareholders’ equity | | | 116,815 | | | 114,817 | | | 118,828 |
| | |
|
| |
|
| |
|
|
Total liabilities and shareholders’ equity | | $ | 1,285,474 | | $ | 1,208,652 | | $ | 1,218,419 |
| | |
|
| |
|
| |
|
|
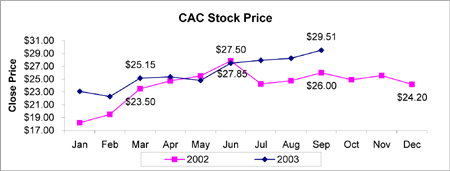
Camden National Corporation
stock is listed on the American
Stock Exchange under the
ticker symbol “CAC”, Stock
prices shown in chart are as of
close of trading on the last
business day of the month.
Consolidated Statements of Income (unaudited)
| | | Nine Months Ended September 30,
| | | Three Months Ended September 30,
|
| (In thousands, except number of shares & per share data) | | 2003
| | 2002
| | | 2003
| | 2002
|
Interest Income | | | | | | | | | | | | | |
Interest and fees on loans | | $ | 42,039 | | $ | 41,399 | | | $ | 14,216 | | $ | 13,780 |
Interest on securities | | | 11,052 | | | 12,929 | | | | 3,079 | | | 4,262 |
Other interest income | | | 449 | | | 704 | | | | 152 | | | 340 |
| | |
|
| |
|
|
| |
|
| |
|
|
Total interest income | | | 53,540 | | | 55,032 | | | | 17,447 | | | 18,382 |
Interest Expense | | | | | | | | | | | | | |
Interest on deposits | | | 10,760 | | | 12,926 | | | | 3,476 | | | 4,416 |
Interest on borrowings | | | 7,086 | | | 7,059 | | | | 2,281 | | | 2,356 |
| | |
|
| |
|
|
| |
|
| |
|
|
Total interest expense | | | 17,846 | | | 19,985 | | | | 5,757 | | | 6,772 |
| | |
|
| |
|
|
| |
|
| |
|
|
Net interest income | | | 35,694 | | | 35,047 | | | | 11,690 | | | 11,610 |
Provision for Loan Losses | | | 1,050 | | | 2,520 | | | | 185 | | | 570 |
| | |
|
| |
|
|
| |
|
| |
|
|
Net interest income after provision for loan losses | | | 34,644 | | | 32,527 | | | | 11,505 | | | 11,040 |
Other Income | | | | | | | | | | | | | |
Service charges on deposit accounts | | | 2,810 | | | 2,821 | | | | 928 | | | 961 |
Merchant assessments | | | — | | | 1,716 | | | | — | | | 846 |
Income from fiduciary activities | | | 1,595 | | | 1,776 | | | | 502 | | | 552 |
Life insurance earnings | | | 547 | | | 649 | | | | 179 | | | 216 |
Other income | | | 2,597 | | | 3,492 | | | | 922 | | | 1,208 |
| | |
|
| |
|
|
| |
|
| |
|
|
Total other income | | | 7,549 | | | 10,454 | | | | 2,531 | | | 3,783 |
Operating Expenses | | | | | | | | | | | | | |
Salaries and employee benefits | | | 11,909 | | | 12,048 | | | | 3,707 | | | 4,034 |
Premises and fixed assets | | | 3,255 | | | 3,456 | | | | 1,058 | | | 1,128 |
Merchant program | | | — | | | 1,573 | | | | — | | | 737 |
Amortization of core deposit intangible | | | 706 | | | 706 | | | | 235 | | | 219 |
Other expenses | | | 6,168 | | | 6,116 | | | | 1,938 | | | 1,898 |
| | |
|
| |
|
|
| |
|
| |
|
|
Total operating expenses | | | 22,038 | | | 23,899 | | | | 6,938 | | | 8,016 |
| | |
|
| |
|
|
| |
|
| |
|
|
Income before income taxes and cumulative effect of accounting change | | | 20,155 | | | 19,082 | | | | 7,098 | | | 6,807 |
Income Taxes | | | 6,587 | | | 6,242 | | | | 2,350 | | | 2,235 |
| | |
|
| |
|
|
| |
|
| |
|
|
Income before cumulative effect of accounting change | | | 13,568 | | | 12,840 | | | | 4,748 | | | 4,572 |
Cumulative effect of change in accounting for goodwill, net of tax benefit of $241 | | | — | | | (449 | ) | | | — | | | — |
| | |
|
| |
|
|
| |
|
| |
|
|
Net Income | | $ | 13,568 | | $ | 12,391 | | | $ | 4,748 | | $ | 4,572 |
| | |
|
| |
|
|
| |
|
| |
|
|
Per Share Data | | | | | | | | | | | | | |
Basic earnings per share before cumulative effect of accounting change | | $ | 1.70 | | $ | 1.60 | | | $ | 0.60 | | $ | 0.57 |
Cumulative effect of change in accounting for goodwill, net | | | — | | | (0.06 | ) | | | — | | | — |
| | |
|
| |
|
|
| |
|
| |
|
|
Basic earnings per share | | $ | 1.70 | | $ | 1.54 | | | $ | 0.60 | | $ | 0.57 |
Diluted earnings per share before cumulative effect of accounting change | | $ | 1.70 | | $ | 1.59 | | | $ | 0.60 | | $ | 0.57 |
Cumulative effect of change in accounting for goodwill, net | | | — | | | (0.06 | ) | | | — | | | — |
| | |
|
| |
|
|
| |
|
| |
|
|
Diluted earnings per share | | $ | 1.70 | | $ | 1.53 | | | $ | 0.60 | | $ | 0.57 |
Cash dividends per share | | | 0.53 | | | 0.51 | | | | 0.19 | | | 0.17 |
Weighted average number of shares outstanding | | | 7,966,384 | | | 8,056,978 | | | | 7,894,807 | | | 8,054,363 |
A complete set of financial statements for certain Camden National Corporation
may be obtained upon written request to Gregory A. Dufour, Senior Vice
President of Finance, Camden National Corporation, P.O. Box 310,
Camden, Maine 04843.