Exhibit 99.1
Dear Shareholders,
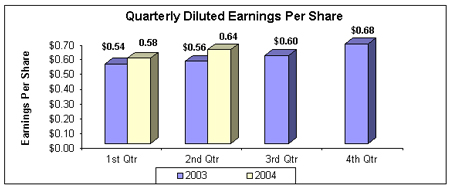
I am pleased to report that, yet again, your Company admirably withstood the earnings pressure affected by this extended period of low interest rates. For the quarter ended June 30, 2004, earnings per diluted share increased 14.29% to $0.64, compared to $0.56 per diluted share registered during the second quarter of 2003. Net income after taxes for the recently completed quarter was $5.0 million, which compared favorably to $4.5 million for the same quarter a year ago.
For the six months ended June 30, 2004, earnings per diluted share of $1.22 were up 10.91% compared to $1.10 for the first half of 2003. Net income for the first six months of 2004 increased 7.37% to $9.5 million, up from $8.8 million reported at mid-year in 2003. These results translated into a return on average equity of 15.73% and a return on average assets of 1.40% at June 30, 2004, compared to 14.80% and 1.41%, respectively, for the same six-month period a year ago.
Contributing to these results was the solid balance sheet growth from our combined affiliate banks. Total loans at June 30, 2004, surpassed the billion-dollar mark for the first time in the Company’s history. This represented a 12.23% increase over the levels reported for the same period a year ago. Deposit growth was even more pronounced as recent quarter-end balances were at $964.2 million, up 14.09% from June 30, 2003 levels. Of significance was the fact that demand deposit balances, representing the lowest-cost source of funding on our balance sheet, increased 16.84% from the same period last year.
The recent protracted period of low interest rates resulted in a net interest margin of 3.81% through the first half of this year versus 4.13% at the mid-year point in 2003. The Federal Reserve (the “Fed”) moved the Federal Funds Rate up a ¼ of 1% at the end of June, setting into motion a similar upward adjustment to the Wall Street Journal Prime Rate, a major pricing index used by the banking industry. Loan balances tied to the latter index will provide some measure of increased revenues to the Company going forward. The Company’s internal Asset and Liability Management Committee also continued its efforts to proactively manage our balance sheet during this period of low interest rates, in an effort to augment our revenue stream while maintaining interest rate risk sensitivity. Among steps taken on the asset side of the balance sheet, the Company sold the majority of its 30-year mortgages originated during the past three years, and limited investment portfolio security purchases during this time to an average duration of three to four years. On the liability side of the balance sheet, the Company capitalized on the low interest rate environment by extending maturities on certificates of deposit, both brokered and retail, and term borrowings from the Federal Home Loan Bank of Boston.
The Company also experienced improved performance in the area of non-interest income, further mitigating our narrowing interest margin. Through the first six months of 2004, this critical component of our revenue stream was up $883,000, or 17.60%, over the same period in 2003. Of significance in this revenue category is Acadia Trust, N.A., our wealth management affiliate, which continues to successfully implement its ambitious strategic and operational plans. During the last six months, Acadia Trust, N.A., increased non-interest income 14.42% compared to the mid-year point in 2003. These results are part of our overall goal to increase non-interest income through the delivery of a broader array of financial products and services. In addition, this important component of our organization continues to improve its operational effectiveness and efficiency. For example, Acadia Trust, N.A. recently entered into a strategic alliance with Actuarial Designs and Solutions, a provider of administrative record keeping for retirement plans. Together, these two Maine-based enterprises are providing our business clients with a much more comprehensive level of retirement services, and at considerably less expense to the Company.
During the Company’s 2004 budget and strategic planning processes, we committed to investments in new technology that would ensure our Company’s preparedness for the future, even if it meant a short-term slowdown in our earnings growth. We have moved ahead on several fronts with our technology initiatives, including investing in a new consumer loan origination and processing system that reduces application time and accelerates the loan approval process. In addition, the Company has committed to a software solution that offers a single platform for budgeting, forecasting and financial reporting across the organization. In today’s operating environment, the ability to immediately access a variety of financial metrics, critical to decision-making and execution, is no longer a luxury. In fact it is an absolute necessity, in part due to the regulatory requirements arising out of Sarbanes-Oxley legislation. Armed with more timely and comprehensive information, our managers will be able to respond more effectively and efficiently to changing market dynamics, thus enabling your Company to maintain its competitive edge.
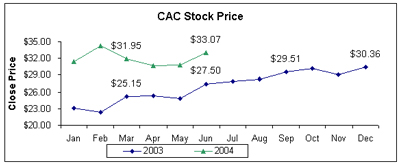
The Board of Directors of the Company approved a dividend of $0.20 per share, payable on July 30, 2004, for shareholders of record on July 15, 2004. This represents an increase of 5.3% over the dividend paid for the same period a year ago. The stock price of Camden National Corporation (AMEX: CAC) ended the second quarter of 2004 at $33.07 per share, an increase of $5.57, or 20.3%, above the closing price at June 30, 2003.Additionally, on June 25, 2004, Camden National Corporation had its listing on the Russell 3000® Index and Russell 2000® Index reaffirmed. Inclusion in the Russell Indexes broadens the exposure of Camden National Corporation’s stock to the wide range of investors who base buying decisions upon a company’s inclusion in these important indexes.
In closing, I would like to share a proud moment for all of us here at Camden National Corporation. On June 6, 2004, the Company honored the memory of one of its finest by naming our Rockport facility, which houses the largest segment of our workforce, the Frederick G. “Ted” Hanley Center. Ted Hanley epitomized what a community banker is all about…trust, respect, fairness and accessibility. All of us here at the Company, who follow in Ted’s footsteps, would be well served to live by these tenets, ones that Ted practiced religiously each and every day of his life. We invite you to stop by the Hanley Center and see for yourself this wonderful tribute to an extraordinary individual.
Sincerely,
Robert W. Daigle
President and Chief Executive Officer
Consolidated Statements of Condition (unaudited)
| June 30, | December 31, | |||||||||
| (In thousands, except number of shares & per share data) | 2004 | 2003 | 2003 | |||||||
Assets | ||||||||||
Cash and due from banks | $ | 32,351 | $ | 32,723 | $ | 37,164 | ||||
Securities available for sale, at market value | 265,116 | 282,924 | 302,951 | |||||||
Securities held to maturity | — | — | 798 | |||||||
Residential mortgages held for sale | — | 337 | — | |||||||
Loans, less allowance for loan and lease losses of $14,520, $14,117 and $14,135 at June 30, 2004 and 2003 and December 31, 2003, respectively | 995,521 | 885,519 | 952,720 | |||||||
Premises and equipment, net | 16,106 | 16,275 | 15,739 | |||||||
Goodwill | 3,989 | 3,518 | 3,518 | |||||||
Other assets | 59,272 | 57,977 | 57,473 | |||||||
Total assets | $ | 1,372,355 | $ | 1,279,273 | $ | 1,370,363 | ||||
Liabilities | ||||||||||
Deposits: | ||||||||||
Demand | $ | 122,234 | $ | 104,613 | $ | 119,216 | ||||
NOW | 113,628 | 102,408 | 112,116 | |||||||
Money market | 204,163 | 160,516 | 184,766 | |||||||
Savings | 108,893 | 104,716 | 108,508 | |||||||
Certificates of deposit | 415,312 | 372,888 | 376,390 | |||||||
Total deposits | 964,230 | 845,141 | 900,996 | |||||||
Borrowings from Federal Home Loan Bank | 213,083 | 250,374 | 277,043 | |||||||
Other borrowed funds | 64,994 | 51,015 | 61,365 | |||||||
Accrued interest and other liabilities | 11,281 | 11,168 | 11,253 | |||||||
Total liabilities | 1,253,588 | 1,157,698 | 1,250,657 | |||||||
Shareholders’ Equity | ||||||||||
Common stock, no par value; authorized 20,000,000 shares, issued 7,670,847 on June 30, 2004 and 8,609,898 shares on June 30, 2003 and December 31, 2003, respectively | 2,450 | 2,450 | 2,450 | |||||||
Surplus | 4,482 | 5,556 | 5,353 | |||||||
Retained earnings | 112,908 | 120,175 | 127,460 | |||||||
Accumulated other comprehensive income | ||||||||||
Net unrealized (losses) gains on securities available for sale, net of tax | (1,386 | ) | 5,743 | 2,864 | ||||||
Net unrealized gains on derivative instruments marked to market, net of tax | 313 | 884 | 536 | |||||||
Total accumulated other comprehensive (loss) income | (1,073 | ) | 6,627 | 3,400 | ||||||
Less cost of 658,930 and 851,248 shares of treasury stock on June 30, 2003 and December 31, 2003, respectively | — | 13,233 | 18,957 | |||||||
Total shareholders’ equity | 118,767 | 121,575 | 119,706 | |||||||
Total liabilities and shareholders’ equity | $ | 1,372,355 | $ | 1,279,273 | $ | 1,370,363 | ||||
| Camden National Corporation stock is listed on the American Stock Exchange under the ticker symbol "CAC". Stock prices shown in chart are as of close of trading on the last business day of the month. |
Consolidated Statements of Income(unaudited)
Six Months Ended June 30, | Three Months Ended June 30, | |||||||||||
| (In thousands, except number of shares & per share data) | 2004 | 2003 | 2004 | 2003 | ||||||||
Interest Income | ||||||||||||
Interest and fees on loans | $ | 28,475 | $ | 27,824 | $ | 14,140 | $ | 14,049 | ||||
Interest on securities | 6,512 | 7,973 | 3,090 | 3,773 | ||||||||
Other interest income | 210 | 297 | 110 | 136 | ||||||||
Total interest income | 35,197 | 36,094 | 17,340 | 17,958 | ||||||||
Interest Expense | ||||||||||||
Interest on deposits | 7,164 | 7,284 | 3,673 | 3,611 | ||||||||
Interest on borrowings | 3,844 | 4,806 | 1,850 | 2,433 | ||||||||
Total interest expense | 11,008 | 12,090 | 5,523 | 6,044 | ||||||||
Net interest income | 24,189 | 24,004 | 11,817 | 11,914 | ||||||||
Provision for Loan and Lease Losses | 165 | 865 | — | 445 | ||||||||
Net interest income after provision for loan and lease losses | 24,024 | 23,139 | 11,817 | 11,469 | ||||||||
Other Income | ||||||||||||
Service charges on deposit accounts | 1,866 | 1,882 | 970 | 999 | ||||||||
Trust and investment management income | 1,576 | 1,093 | 811 | 578 | ||||||||
Life insurance earnings | 464 | 368 | 232 | 212 | ||||||||
Other income | 1,995 | 1,675 | 1,346 | 840 | ||||||||
Total other income | 5,901 | 5,018 | 3,359 | 2,629 | ||||||||
Operating Expenses | ||||||||||||
Salaries and employee benefits | 8,664 | 8,202 | 4,221 | 4,143 | ||||||||
Premises and fixed assets | 2,200 | 2,197 | 1,092 | 1,055 | ||||||||
Amortization of core deposit intangible | 454 | 471 | 223 | 236 | ||||||||
Other expenses | 4,445 | 4,230 | 2,194 | 2,064 | ||||||||
Total operating expenses | 15,763 | 15,100 | 7,730 | 7,498 | ||||||||
Income before income taxes | 14,162 | 13,057 | 7,446 | 6,600 | ||||||||
Income Taxes | 4,692 | 4,237 | 2,496 | 2,105 | ||||||||
Net Income | $ | 9,470 | $ | 8,820 | $ | 4,950 | $ | 4,495 | ||||
Per Share Data | ||||||||||||
Basic earnings per share | $ | 1.23 | $ | 1.10 | $ | 0.65 | $ | 0.56 | ||||
Diluted earnings per share | 1.22 | 1.10 | $ | 0.64 | $ | 0.56 | ||||||
Cash dividends per share | $ | 0.40 | $ | 0.34 | 0.20 | 0.17 | ||||||
Weighted average number of shares outstanding | 7,724,485 | 8,005,919 | 7,699,523 | 7,985,028 | ||||||||
 | A complete set of financial statements for Camden National Corporation may be obtained upon written request to Gregory A. Dufour, Chief Banking Officer, Camden National Corporation, P.O. Box 310, Camden, Maine 04843. |