Exhibit 99.1
Dear Shareholders:
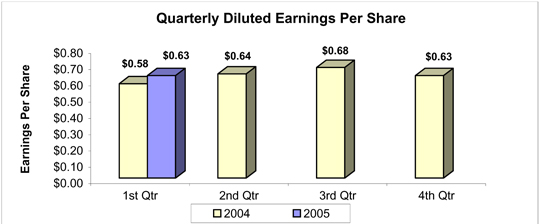
I am pleased to report to you that your company achieved solid financial results during the quarter ended March 31, 2005. Net income per diluted share increased 8.6% to $0.63, compared to $0.58 per diluted share in the first quarter of 2004. Net income after taxes for the first quarter of 2005 was $4.8 million, an increase of 7.1% from the same three-month period a year ago. These results translated into a return on average equity of 15.80% and a return on average assets of 1.30% for the first quarter of 2005, which compares to 14.98% and 1.33%, respectively, for the period ended March 31, 2004.
Total assets of the Company increased $188.4 million, or 13.9%, from March 31, 2004 to a Company record $1.5 billion on March 31, 2005. Growth occurred in both the loan and investment portfolios, which at $1.1 billion and $360.4 million were up 11.9% and 22.7%, respectively, from levels reported at the end of the first quarter in 2004.
Fueling loan growth were consumer loans, residential mortgages and commercial real estate loans with balances, at March 31, 2005, that increased 23.4%, 12.0% and 10.7%, respectively, from the same period a year ago. These double-digit increases are a reflection of vibrant economies within our primary market areas and the positive effect of targeted advertising coupled with concerted business development campaigns at each of our affiliate banks.
The expansion noted in the Company’s investment portfolio resulted from the improvement in the bond market, which created opportunities to once again acquire securities at acceptable yields.
Helping to fund this robust expansion in assets was deposit growth of $99.0 million, or 10.6%, from March 31, 2004, to $1.0 billion through the first quarter of 2005. Particularly encouraging has been the increase of $20.4 million, or 18.7%, in low-cost demand deposit balances. These results can be directly attributed to strategic initiatives at both affiliate banks that are focused on expanding market share within the small business sector.
In addition to deposit growth, we have increased our borrowings from the Federal Home Loan Bank of Boston by $92.7 million, or 40.6%, from March 31, 2004 to $321.1 million at March 31, 2005, thus providing a means of laddering funding maturities and locking-in future funding costs during this current period of rising interest rates.
The positive momentum in financial performance and business activity noted above can be traced to several strategic steps taken, and reported on, during the past 18 months. These include a restructuring of our executive management team, recruitment of highly qualified personnel to fill critical positions, streamlining of our various operating entities, and the effective deployment of capital, including better utilization of existing human and technological resources.
While we have invested considerably to maintain our competitiveness, we continue with our tradition of being a low-cost producer as evidenced by an efficiency ratio of 51.27% at March 31, 2005, down from 53.86% for the same reporting period a year ago. This speaks to the dedication of our workforce and their commitment to innovation, which is creating a fulfilling professional environment for each Stakeholder and a remarkable banking experience for each customer.
We continue to maintain a strong capital position, which will position your Company to seize on future growth and expansion opportunities as they might present themselves. At March 31, 2005, Camden National Corporation reported a total risk-based capital ratio of 12.27% and a tier 1 ratio of 11.01% compared to the 10.0% and 6.0% minimums, respectively, required by the Federal Reserve for a bank holding company to be considered “well capitalized.”
Finally, the Board of Directors of the Company approved a dividend of $0.20 per share, payable on April 30, 2005 to shareholders of record on April 15, 2005. Additionally, the stock price of Camden National Corporation (AMEX: CAC) ended the first quarter of 2005 at $35.35 per share, an increase of $3.40 or 10.6% above the closing price at March 31, 2004.
As we march forward in this 130th year of service, I am encouraged by the enthusiasm within the workforce for our stated goal of becoming a national model for sustainable community banking. I believe my colleagues’ commitment to that end is reflected in the positive results reported herein.
Sincerely,
Robert W. Daigle
President & Chief Executive Officer
Consolidated Statements of Condition (unaudited)
| | | | | | | | | | |
| | | March 31,
| | December 31, 2004
|
(In thousands, except number of shares & per share data)
| | 2005
| | | 2004
| |
| Assets | | | | | | | | | | |
Cash and due from banks | | $ | 27,645 | | | $ | 27,629 | | $ | 31,573 |
Securities available for sale, at market value | | | 347,383 | | | | 293,295 | | | 321,881 |
Securities held to maturity | | | 13,018 | | | | 399 | | | 2,117 |
Loans, less allowance for loan and lease losses of $13,670, $14,502, and $13,641 at March 31, 2005 and 2004 and December 31, 2004, respectively | | | 1,075,769 | | | | 959,010 | | | 1,055,653 |
Premises and equipment, net | | | 16,520 | | | | 15,477 | | | 16,392 |
Goodwill | | | 3,991 | | | | 3,518 | | | 3,991 |
Other assets | | | 60,728 | | | | 57,333 | | | 58,258 |
| | |
|
|
| |
|
| |
|
|
Total assets | | $ | 1,545,054 | | | $ | 1,356,661 | | $ | 1,489,865 |
| | |
|
|
| |
|
| |
|
|
| Liabilities | | | | | | | | | | |
Deposits: | | | | | | | | | | |
Demand | | $ | 129,703 | | | $ | 109,283 | | $ | 131,998 |
NOW | | | 116,226 | | | | 109,991 | | | 120,203 |
Money market | | | 219,056 | | | | 196,854 | | | 211,060 |
Savings | | | 110,824 | | | | 107,982 | | | 112,010 |
Certificates of deposit | | | 457,979 | | | | 410,632 | | | 439,330 |
| | |
|
|
| |
|
| |
|
|
Total deposits | | | 1,033,788 | | | | 934,742 | | | 1,014,601 |
Borrowings from Federal Home Loan Bank | | | 321,127 | | | | 228,398 | | | 277,690 |
Other borrowed funds | | | 53,258 | | | | 57,466 | | | 59,130 |
Accrued interest and other liabilities | | | 13,285 | | | | 12,218 | | | 12,039 |
| | |
|
|
| |
|
| |
|
|
Total liabilities | | | 1,421,458 | | | | 1,232,824 | | | 1,363,460 |
| | |
|
|
| |
|
| |
|
|
| Shareholders’ Equity | | | | | | | | | | |
Common stock, no par value; authorized 20,000,000 shares, issued and outstanding 7,638,664 and 7,634,975 shares on March 31, 2005 and December 31, 2004, respectively, and issued 8,609,898 shares on March 31, 2004 | | | 2,450 | | | | 2,450 | | | 2,450 |
Surplus | | | 4,264 | | | | 5,328 | | | 4,440 |
Retained earnings | | | 118,435 | | | | 130,424 | | | 118,764 |
Accumulated other comprehensive (loss) income | | | | | | | | | | |
Net unrealized (losses) gains on securities available for sale, net of tax | | | (1,553 | ) | | | 4,768 | | | 751 |
Net unrealized gains on derivative instruments marked to market, net of tax | | | — | | | | 536 | | | — |
| | |
|
|
| |
|
| |
|
|
Total accumulated other comprehensive (loss) income | | | (1,553 | ) | | | 5,304 | | | 751 |
| | | |
Less cost of 871,323 shares of treasury stock on March 31, 2004 | | | — | | | | 19,669 | | | — |
| | |
|
|
| |
|
| |
|
|
Total shareholders’ equity | | | 123,596 | | | | 123,837 | | | 126,405 |
| | |
|
|
| |
|
| |
|
|
Total liabilities and shareholders’ equity | | $ | 1,545,054 | | | $ | 1,356,661 | | $ | 1,489,865 |
| | |
|
|
| |
|
| |
|
|
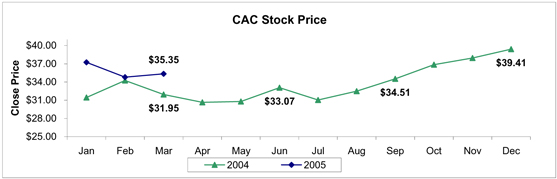
Camden National Corporation stock is listed on the American Stock Exchange under the ticker symbol “CAC.” Stock prices shown in chart are as of close of trading on the last business day of the month.
Consolidated Statements of Income(unaudited)
| | | | | | |
| | | Three Months Ended March 31,
|
(In thousands, except number of shares & per share data)
| | 2005
| | 2004
|
| Interest Income | | | | | | |
Interest and fees on loans | | $ | 16,271 | | $ | 14,125 |
Interest on securities | | | 3,525 | | | 3,422 |
Interest on interest rate swap agreements | | | 173 | | | 518 |
Other interest income | | | 184 | | | 100 |
| | |
|
| |
|
|
Total interest income | | | 20,153 | | | 18,165 |
| | |
| Interest Expense | | | | | | |
Interest on deposits | | | 4,362 | | | 3,491 |
Interest on other borrowings | | | 2,689 | | | 1,994 |
Interest on interest rate swap agreements | | | 142 | | | 308 |
| | |
|
| |
|
|
Total interest expense | | | 7,193 | | | 5,793 |
| | |
|
| |
|
|
Net interest income | | | 12,960 | | | 12,372 |
| | |
Provision for Loan and Lease Losses | | | 230 | | | 165 |
| | |
|
| |
|
|
Net interest income after provision for loan and lease losses | | | 12,730 | | | 12,207 |
| | |
Non-interest Income | | | | | | |
Service charges on deposit accounts | | | 818 | | | 896 |
Other service charges and fees | | | 271 | | | 234 |
Income from fiduciary services | | | 947 | | | 988 |
Life insurance earnings | | | 161 | | | 232 |
Other income | | | 229 | | | 192 |
| | |
|
| |
|
|
Total non-interest income | | | 2,426 | | | 2,542 |
| | |
Non-interest Expenses | | | | | | |
Salaries and employee benefits | | | 4,224 | | | 4,443 |
Premises and fixed assets | | | 1,097 | | | 1,108 |
Amortization of core deposit intangible | | | 222 | | | 231 |
Other expenses | | | 2,345 | | | 2,251 |
| | |
|
| |
|
|
Total non-interest expenses | | | 7,888 | | | 8,033 |
| | |
|
| |
|
|
Income before income taxes | | | 7,268 | | | 6,716 |
Income Taxes | | | 2,427 | | | 2,196 |
| | |
|
| |
|
|
Net Income | | $ | 4,841 | | $ | 4,520 |
| | |
|
| |
|
|
Per Share Data | | | | | | |
| | |
Basic earnings per share | | $ | 0.63 | | $ | 0.58 |
| | |
Diluted earnings per share | | | 0.63 | | | 0.58 |
| | |
Cash dividends per share | | $ | 0.70 | | $ | 0.20 |
| | |
Weighted average number of shares outstanding | | | 7,636,549 | | | 7,749,446 |
A complete set of financial statements for Camden National Corporation may be obtained upon written request to Sean G. Daly, Chief Financial Officer, Camden National Corporation, P.O. Box 310, Camden, Maine 04843.