Exhibit 99.1
Dear Shareholders:
The performance of your Company, through June 30, 2005, provides increasing evidence that the investments made a year ago, of time, effort and capital spent crafting and implementing a strategic game plan to pursue our envisioned future, is beginning to yield the anticipated outcomes, even as we navigate in a challenging economic environment.
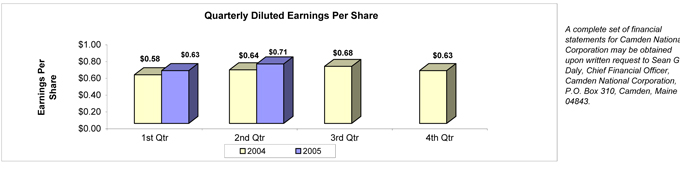
For the first six months of this year, net income per diluted share increased 9.84% to $1.34, compared to $1.22 per diluted share earned during the first half of 2004. Net income for the six-month period ended June 30, 2005 was $10.3 million, an increase of 8.73% from the same period a year ago. These results translated into a return on average equity of 16.73% and a return on average assets of 1.35% for the six months ended June 30, 2005, compared to 15.73% and 1.40%, respectively, for the same six-month period in 2004.
For the three-month period ended June 30, 2005, net income per diluted share of $0.71 was up 10.94% compared to $0.64 for the second quarter of 2004. Net income for the recently completed quarter was $5.5 million, which compared favorably to $5.0 million for the quarter ended June 30, 2004. The results of the past three months represent positive momentum heading into our traditionally stronger quarters of the year, those heavily influenced by tourism.
Factors aiding this positive year-to-date net income trend include strong asset growth, an improving net interest margin, and our focus on keeping non-interest expenses in check. Balance sheet improvement is reflected in loans outstanding, which are up $120.4 million, or 11.92%, versus a year ago. Our commitment, and corresponding investment, in consumer-oriented products and services contributed to strong growth in the residential mortgage and consumer loan portfolios, up 12.57% and 22.94% respectively, from June 30, 2004 to June 30, 2005.
Quality within the overall loan portfolio remains satisfactory at June 30, 2005. The percentage of non-performing loans to total loans is unchanged from a year ago at 0.57%. Year-to-date net charge-offs of $175,000, while higher than the net recovery position at June 30, 2004, still represents a very modest 0.02% of total loans, well below the industry average.
The nine consecutive 0.25% increases in the Fed Funds rate, which started early last year, are having a beneficial effect on the net interest margin. It is safe to say that the net interest margin has stabilized following considerable narrowing over an extended period. Although the Company’s funding costs are on the rise, we have been able to mitigate this trend through a combination of re-pricing within the various loan portfolios, effective use of newly installed relationship pricing technology, and solid growth in low-cost deposit categories.
The Company’s commitment to fostering innovation within the workforce, initiated in 2004, is beginning to flourish. Countless examples of process improvements, product refinements and customer-service enhancements are underway throughout the Company, all with the goal of creating what we callThe Camden National Experience.SM Tangible evidence of the beneficial effect of these activities is reflected in total non-interest expenses, where year-on-year comparisons, through June 30, reveal a slight decline and an improved efficiency ratio of 50.05%, down from 52.39%. This important performance assessment ratio represents how much
revenue a company is capable of generating for every dollar of non-interest expense (overhead) it incurs. At Camden National Corporation, the most recent six-month results suggest that we are producing nearly $2.00 for every $1.00 expended. By any measurement standard in the industry, this is quite remarkable. It speaks to a committed, and invested, workforce.
The latter seems an appropriate segue to the sidebar theme selected for this quarter’s letter –Vitalizing Communities.Many times I am asked, “What does it mean to call oneself a community banker?” The simplest way I can explain it is by reciting our Company’sCore Purpose – “Through each interaction, we will enrich the lives of people, help businesses succeed, and vitalize communities.” The “we,” of course, refers to my colleagues and me. In most people’s minds, we are the Company. Who we are and what we do ‘on the clock,’ and often times ‘off the clock,’ defines who we are as an organization.
Along these lines, I am compelled to share with you a few distinctions bestowed upon some of my colleagues this past quarter, further illustrating what community banking is all about. The Mid-Coast Board of Realtors recognized Janet Weaver, Mortgage Loan Officer, as ‘Affiliate of the Year’, an honor conveyed to an individual in a real estate-related industry who provides exemplary service to the Board and the community at large. Gary Stone, Lincoln County Market Manager, was named ‘Community Banker of the Year’ by the Maine Bankers Association for his outstanding community service. Finally, several individuals, representing all three of our subsidiaries, were recognized as America’s Promise volunteers dedicated to “Making a Difference for Kids and Communities” by Governor John E. Baldacci at a recent Statehouse ceremony. These recognitions of volunteerism, one of the hallmarks of community banking, speak to one thing - commitment. Being remarkable requires an impassioned workforce, it just doesn’t happen.
I’m aware that, as Shareholders, you may find it unusual to hear me describe our Company more in terms of individual employees than as an inanimate corporate entity. Why? It’s who we are as a Company and why we’ve been successful for 130 years. Those among you who do business with us know full well what I am referring to, which is why I’m convinced that our success going forward is all about providing our customers the kind of remarkable experiences that build strong bonds and lead to partnerships more so than relationships. And while this may all sound a bit “warm and fuzzy,” I invite you to sample theExperience.See for yourself, today, what the future of community banking is all about at your Company.
Sincerely,
Robert W. Daigle
President & Chief Executive Officer
Consolidated Statements of Condition(unaudited)
| | | | | | | | | | | |
| | | June 30,
| | | December 31, 2004
|
(In thousands, except number of shares & per share data)
| | 2005
| | | 2004
| | |
Assets | | | | | | | | | | | |
Cash and due from banks | | $ | 27,271 | | | $ | 32,351 | | | $ | 31,573 |
Securities available for sale, at market value | | | 346,715 | | | | 265,116 | | | | 321,881 |
Securities held to maturity | | | 13,932 | | | | — | | | | 2,117 |
Loans, less allowance for loan and lease losses of $14,040, $14,520, and $13,641 at June 30, 2005 and 2004 and December 31, 2004, respectively | | | 1,116,443 | | | | 995,521 | | | | 1,055,653 |
Premises and equipment, net | | | 16,506 | | | | 16,106 | | | | 16,392 |
Goodwill | | | 3,991 | | | | 3,989 | | | | 3,991 |
Other assets | | | 62,126 | | | | 59,272 | | | | 58,258 |
| | |
|
|
| |
|
|
| |
|
|
Total assets | | $ | 1,586,984 | | | $ | 1,372,355 | | | $ | 1,489,865 |
| | |
|
|
| |
|
|
| |
|
|
Liabilities | | | | | | | | | | | |
Deposits: | | | | | | | | | | | |
Demand | | $ | 136,487 | | | $ | 122,234 | | | $ | 131,998 |
NOW | | | 124,026 | | | | 113,628 | | | | 120,203 |
Money market | | | 221,271 | | | | 204,163 | | | | 211,060 |
Savings | | | 103,837 | | | | 108,893 | | | | 112,010 |
Certificates of deposit | | | 492,426 | | | | 415,312 | | | | 439,330 |
| | |
|
|
| |
|
|
| |
|
|
Total deposits | | | 1,078,047 | | | | 964,230 | | | | 1,014,601 |
Borrowings from Federal Home Loan Bank | | | 310,409 | | | | 213,083 | | | | 277,690 |
Other borrowed funds | | | 60,818 | | | | 64,994 | | | | 59,130 |
Accrued interest and other liabilities | | | 11,135 | | | | 11,281 | | | | 12,039 |
| | |
|
|
| |
|
|
| |
|
|
Total liabilities | | | 1,460,409 | | | | 1,253,588 | | | | 1,363,460 |
| | |
|
|
| |
|
|
| |
|
|
Shareholders’ Equity | | | | | | | | | | | |
Common stock, no par value; authorized 20,000,000 shares, issued and outstanding 7,588,461, 7,670,847 and 7,634,975 shares on June 30, 2005, June 30, 2004 and December 31, 2004, respectively | | | 2,450 | | | | 2,450 | | | | 2,450 |
Surplus | | | 4,158 | | | | 4,482 | | | | 4,440 |
Retained earnings | | | 120,542 | | | | 112,908 | | | | 118,764 |
Accumulated other comprehensive (loss) income | | | | | | | | | | | |
Net unrealized (losses) gains on securities available for sale, net of tax | | | (575 | ) | | | (1,386 | ) | | | 751 |
Net unrealized gains on derivative instruments marked to market, net of tax | | | — | | | | 313 | | | | — |
| | |
|
|
| |
|
|
| |
|
|
Total accumulated other comprehensive (loss) income | | | (575 | ) | | | (1,073 | ) | | | 751 |
| | |
|
|
| |
|
|
| |
|
|
Total shareholders’ equity | | | 126,575 | | | | 118,767 | | | | 126,405 |
| | |
|
|
| |
|
|
| |
|
|
Total liabilities and shareholders’ equity | | $ | 1,586,984 | | | $ | 1,372,355 | | | $ | 1,489,865 |
| | |
|
|
| |
|
|
| |
|
|
Consolidated Statements of Income(unaudited)
| | | | | | | | | | | | |
| | | Six Months Ended June 30,
| | Three Months Ended June 30,
|
(In thousands, except number of shares & per share data)
| | 2005
| | 2004
| | 2005
| | 2004
|
| Interest Income | | | | | | | | | | | | |
Interest and fees on loans | | $ | 33,790 | | $ | 28,047 | | $ | 17,519 | | $ | 13,922 |
Interest on securities | | | 7,398 | | | 6,512 | | | 3,873 | | | 3,090 |
Interest on interest rate swap agreements | | | 173 | | | 1,035 | | | — | | | 517 |
Other interest income | | | 404 | | | 210 | | | 220 | | | 110 |
| | |
|
| |
|
| |
|
| |
|
|
Total interest income | | | 41,765 | | | 35,804 | | | 21,612 | | | 17,639 |
| | | | |
| Interest Expense | | | | | | | | | | | | |
Interest on deposits | | | 9,318 | | | 7,164 | | | 4,956 | | | 3,673 |
Interest on other borrowings | | | 5,939 | | | 3,844 | | | 3,250 | | | 1,850 |
Interest on interest rate swap agreements | | | 142 | | | 607 | | | — | | | 299 |
| | |
|
| |
|
| |
|
| |
|
|
Total interest expense | | | 15,399 | | | 11,615 | | | 8,206 | | | 5,822 |
| | |
|
| |
|
| |
|
| |
|
|
Net interest income | | | 26,366 | | | 24,189 | | | 13,406 | | | 11,817 |
| | | | |
| Provision for Loan and Lease Losses | | | 575 | | | 165 | | | 345 | | | — |
| | |
|
| |
|
| |
|
| |
|
|
Net interest income after provision for loan and lease losses | | | 25,791 | | | 24,024 | | | 13,061 | | | 11,817 |
| | | | |
| Non-interest Income | | | | | | | | | | | | |
Service charges on deposit accounts | | | 1,702 | | | 1,866 | | | 884 | | | 970 |
Other service charges and fees | | | 618 | | | 643 | | | 347 | | | 353 |
Income from fiduciary services | | | 1,971 | | | 1,966 | | | 1,024 | | | 978 |
Life insurance earnings | | | 322 | | | 464 | | | 161 | | | 232 |
Other income | | | 477 | | | 962 | | | 248 | | | 826 |
| | |
|
| |
|
| |
|
| |
|
|
Total non-interest income | | | 5,090 | | | 5,901 | | | 2,664 | | | 3,359 |
| | | | |
| Non-interest Expenses | | | | | | | | | | | | |
Salaries and employee benefits | | | 8,933 | | | 8,664 | | | 4,709 | | | 4,221 |
Premises and fixed assets | | | 2,109 | | | 2,184 | | | 1,012 | | | 1,076 |
Amortization of core deposit intangible | | | 443 | | | 454 | | | 221 | | | 223 |
Other expenses | | | 4,260 | | | 4,461 | | | 1,915 | | | 2,210 |
| | |
|
| |
|
| |
|
| |
|
|
Total non-interest expenses | | | 15,745 | | | 15,763 | | | 7,857 | | | 7,730 |
| | |
|
| |
|
| |
|
| |
|
|
Income before income taxes | | | 15,136 | | | 14,162 | | | 7,868 | | | 7,446 |
| Income Taxes | | | 4,839 | | | 4,692 | | | 2,412 | | | 2,496 |
| | |
|
| |
|
| |
|
| |
|
|
| Net Income | | $ | 10,297 | | $ | 9,470 | | $ | 5,456 | | $ | 4,950 |
| | |
|
| |
|
| |
|
| |
|
|
| Per Share Data | | | | | | | | | | | | |
| | | | |
Basic earnings per share | | $ | 1.35 | | $ | 1.23 | | $ | 0.72 | | $ | 0.65 |
| | | | |
Diluted earnings per share | | | 1.34 | | | 1.22 | | | 0.71 | | | 0.64 |
| | | | |
Cash dividends per share | | $ | 0.90 | | $ | 0.40 | | $ | 0.20 | | $ | 0.20 |
| | | | |
Weighted average number of shares outstanding | | | 7,629,786 | | | 7,724,485 | | | 7,615,464 | | | 7,699,523 |