Exhibit 99.1
Dear Shareholders
As we venture forth into this 131st year of our service, a great sense of excitement envelops each and every one of us who serve as a custodian of your investment in Camden National Corporation. This excitement is fueled by several factors: pride in reputation of this venerable institution; its continued quality earnings growth; and, the countless strategic initiatives currently underway, which are designed to ensure a continuation of our rich history of independent community banking.
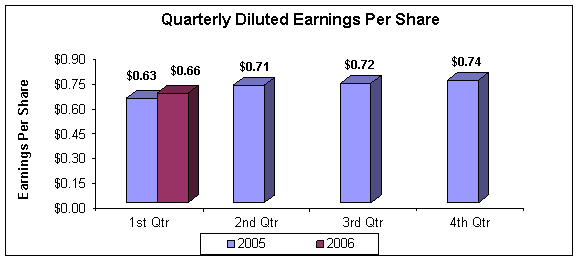
With respect to your Company’s financial performance, we are pleased to report that for the quarter ended March 31, 2006, net income per diluted share increased 4.8% to $0.66, compared to $0.63 per diluted share in the first quarter of 2005. Net income after taxes for the first quarter of 2006 was $4.9 million, an increase of 2.0% from the same three-month period a year ago. These results translated into a return on average equity of 15.48% and a return on average assets of 1.18% for the first quarter of 2006, compared to 15.80% and 1.30%, respectively, for the quarterly period ended March 31, 2005.
Reflected in the first quarter 2006 results is the impact of a charge to earnings of $645,000 resulting from the Steamship Navigation et al litigation involving Camden National Bank (CNB). You may recall that on February 7, 2006, the Maine Law Court ruled against CNB and upheld a Superior Court jury’s award of $1.5 million to the plaintiff. However, an earlier judgment of $865,000 obtained by CNB against the plaintiff substantially offset the jury award. Based upon the current assessment of settlement negotiations, CNB recorded the expected net amount of the offsetting judgments. Without this one-time expense, the Company’s diluted earning per share and net income would have been up 12.7% and 11.1%, respectively, over the same period a year ago.
Total assets of the Company increased $191.6 million, or 12.4%, from March 31, 2005 to a Company record of $1.7 billion on March 31, 2006. Growth occurred in both the loan and investment portfolios, which at $1.2 billion and $416.4 million were up 11.3% and 15.5%, respectively, from levels reported at the end of the first quarter in 2005.
Fueling loan growth were residential and consumer loans with balances at March 31, 2006, that increased 17.5% and 12.6%, respectively, from the same period a year ago. These double-digit increases are a reflection of continued strength in the housing market and the positive effect of focused business development initiatives at each of our subsidiary banks.
Helping to fund this strong loan portfolio expansion was deposit growth of $170.5 million, or 16.5%, from March 31, 2005, to $1.2 billion at the end of the first quarter of 2006. Unlike a year ago, when we were seeing healthy increases in low-cost demand deposit balances, the bulk of the growth since then has occurred in the pricier money market and certificate of deposit categories. The effect of the latter can be seen in the net interest margin, which at the most recent quarter-end declined to 3.63% from 3.71% at March 31, 2005.
On March 28th, the Federal Reserve Bank authorized a fifteenth consecutive 25 basis point increase, to 4.75%, in the Federal Funds Rate. The net effect has been a flattening,
and at times inverted yield curve, which continues to place unprecedented pressure on the net interest margin. Your Company has been able to work to mitigate the adverse effect of this development in large part through increases in non-interest income (14.5%) and the previously mentioned growth in the loan portfolio.
Double-digit loan growth automatically begs the question regarding loan quality. I am pleased to report that the primary performance indicators in this all-important area are quite good. The percentage of non-performing loans to total loans declined to 0.71%, at March 31, 2006, from 0.83% at the same time a year ago. Year-to-date net charge-offs of $79,500 represent a very modest 0.01% of total loans, well below the industry average and an improvement over the $200,500, or 0.02%, reported for the first quarter of 2005. The allowance for loan and lease losses to total loans of 1.21% at this recent quarter end was down only slightly from the 1.25% posted at March 31, 2005. Provision for loan and lease losses during the first quarter of 2006 was increased by $322,000, or 140.0%, over the $230,000 expensed during the same period a year ago. While pleased with these results, we continue to be cautious as evidenced by the recent addition to our risk management team of a seasoned workout specialist.
Your Company’s capital position remains strong with a total risk-based capital ratio of 11.83% and a tier 1 ratio of 10.58%, compared to the 10.0% and 6.0%, respectively, required by the Federal Reserve for a bank holding company to be considered “well-capitalized.” As you are aware, we recently announced the commencement of a modified “Dutch Auction” tender offer, approved by the Board of Directors, to repurchase up to 752,000 shares of our common stock. We believe that over the past several quarters, the stock market has not rewarded you for the performance of the Company. After an extensive analysis of our capital position and stock performance, we concluded that a tender offer would serve the interests of both shareholders who would like to sell their shares, as well as those who wish to remain owners. We fully expect that the procedural steps taken to successfully complete the tender offer will not affect your Company’s ability to maintain its “well-capitalized” position.
In closing, I am pleased to report that the transition to a one-bank format is proceeding expeditiously. Under the leadership of Jeff Smith, President & COO of UnitedKingfield Bank (UKB), the initiative has received regulatory approval and is now progressing through the 600+ tasks incorporated in our project management plan. We continue to target early fourth quarter for full integration into the surviving entity, Camden National Bank. I am pleased that, to date, our announced transition has positively impacted customer relationship retention. I am convinced that “The Camden National Experience,” our Company’s customer service manifesto, is firmly embedded in the UKB culture.
As always, your support as shareholders and customers is greatly appreciated.
Sincerely,
Robert W. Daigle
President and Chief Executive Officer
Consolidated Statements of Condition (unaudited)
| | | | | | | | | | | | |
| | | March 31, | | | December 31, 2005 | |
(In thousands, except number of shares & per share data) | | 2006 | | | 2005 | | |
| Assets | | | | | | | | | | | | |
Cash and due from banks | | $ | 36,292 | | | $ | 27,645 | | | $ | 30,321 | |
Federal funds sold | | | — | | | | — | | | | 1,110 | |
Securities available for sale, at market value | | | 390,364 | | | | 347,383 | | | | 350,502 | |
Securities held to maturity | | | 25,996 | | | | 13,018 | | | | 17,127 | |
Loans, less allowance for loan and lease losses of $14,639, $13,670 and $14,167 at March 31, 2006 and 2005 and December 31, 2005, respectively | | | 1,197,859 | | | | 1,075,769 | | | | 1,168,008 | |
Premises and equipment, net | | | 15,586 | | | | 16,520 | | | | 15,967 | |
Goodwill | | | 3,991 | | | | 3,991 | | | | 3,991 | |
Other assets | | | 66,539 | | | | 60,728 | | | | 66,231 | |
| | | | | | | | | | | | |
Total assets | | $ | 1,736,627 | | | $ | 1,545,054 | | | $ | 1,653,257 | |
| | | | | | | | | | | | |
| Liabilities | | | | | | | | | | | | |
Deposits: | | | | | | | | | | | | |
Demand | | $ | 129,207 | | | $ | 129,703 | | | $ | 150,953 | |
NOW | | | 115,193 | | | | 116,226 | | | | 118,247 | |
Money market | | | 244,652 | | | | 219,056 | | | | 240,958 | |
Savings | | | 97,921 | | | | 110,824 | | | | 101,010 | |
Certificates of deposit | | | 617,293 | | | | 457,979 | | | | 552,737 | |
| | | | | | | | | | | | |
Total deposits | | | 1,204,266 | | | | 1,033,788 | | | | 1,163,905 | |
Borrowings from Federal Home Loan Bank | | | 330,320 | | | | 321,127 | | | | 287,501 | |
Other borrowed funds | | | 55,173 | | | | 53,258 | | | | 59,538 | |
Accrued interest and other liabilities | | | 15,375 | | | | 13,285 | | | | 12,775 | |
| | | | | | | | | | | | |
Total liabilities | | | 1,605,134 | | | | 1,421,458 | | | | 1,523,719 | |
| | | | | | | | | | | | |
| Shareholders’ Equity | | | | | | | | | | | | |
Common stock, no par value; authorized 20,000,000 shares, issued and outstanding 7,519,759, 7,639,428 and 7,529,073 shares on March 31, 2006 and 2005 and December 31, 2005, respectively | | | 2,450 | | | | 2,450 | | | | 2,450 | |
Surplus | | | 3,806 | | | | 4,264 | | | | 4,098 | |
Retained earnings | | | 129,536 | | | | 118,435 | | | | 126,687 | |
Accumulated other comprehensive loss | | | | | | | | | | | | |
Net unrealized losses on securities available for sale, net of tax | | | (4,099 | ) | | | (1,553 | ) | | | (3,584 | ) |
Net unrealized losses on derivative instruments marked to market, net of tax | | | (200 | ) | | | — | | | | (113 | ) |
| | | | | | | | | | | | |
Total accumulated other comprehensive loss | | | (4,299 | ) | | | (1,553 | ) | | | (3,697 | ) |
| | | | | | | | | | | | |
Total shareholders’ equity | | | 131,493 | | | | 123,596 | | | | 129,538 | |
| | | | | | | | | | | | |
Total liabilities and shareholders’ equity | | $ | 1,736,627 | | | $ | 1,545,054 | | | $ | 1,653,257 | |
| | | | | | | | | | | | |
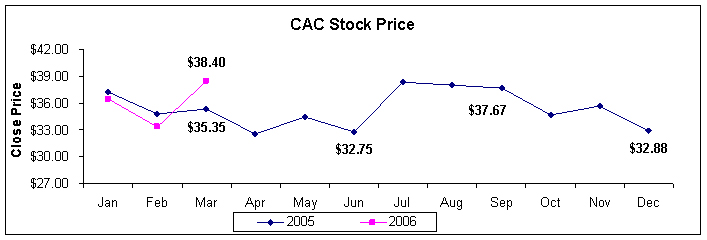
Camden National Corporation stock is listed on the American Stock Exchange under the ticker symbol “CAC.” Stock prices shown in chart are as of close of trading on the last business day of the month.
Consolidated Statements of Income(unaudited)
| | | | | | |
| | | Three Months Ended March 31, |
(In thousands, except number of shares & per share data) | | 2006 | | 2005 |
| Interest Income | | | | | | |
Interest and fees on loans | | $ | 20,683 | | $ | 16,271 |
Interest on securities | | | 4,422 | | | 3,525 |
Interest on interest rate swap agreements | | | — | | | 173 |
Other interest income | | | 291 | | | 184 |
| | | | | | |
Total interest income | | | 25,396 | | | 20,153 |
| | |
| Interest Expense | | | | | | |
Interest on deposits | | | 7,492 | | | 4,362 |
Interest on other borrowings | | | 3,702 | | | 2,689 |
Interest on interest rate swap agreements | | | — | | | 142 |
| | | | | | |
Total interest expense | �� | | 11,194 | | | 7,193 |
| | | | | | |
Net interest income | | | 14,202 | | | 12,960 |
| | |
| Provision for Loan and Lease Losses | | | 552 | | | 230 |
| | | | | | |
Net interest income after provision for loan and lease losses | | | 13,650 | | | 12,730 |
| | |
| Non-interest Income | | | | | | |
Service charges on deposit accounts | | | 795 | | | 818 |
Other service charges and fees | | | 474 | | | 271 |
Income from fiduciary services | | | 1,077 | | | 947 |
Life insurance earnings | | | 200 | | | 161 |
Other income | | | 233 | | | 229 |
| | | | | | |
Total non-interest income | | | 2,779 | | | 2,426 |
| | |
| Non-interest Expenses | | | | | | |
Salaries and employee benefits | | | 4,736 | | | 4,224 |
Premises and fixed assets | | | 1,188 | | | 1,097 |
Amortization of core deposit intangible | | | 221 | | | 222 |
Other expenses | | | 3,067 | | | 2,345 |
| | | | | | |
Total non-interest expenses | | | 9,212 | | | 7,888 |
| | | | | | |
Income before income taxes | | | 7,217 | | | 7,268 |
Income Taxes | | | 2,280 | | | 2,427 |
| | | | | | |
| Net Income | | $ | 4,937 | | $ | 4,841 |
| | | | | | |
| Per Share Data | | | | | | |
| | |
Basic earnings per share | | $ | 0.66 | | $ | 0.63 |
| | |
Diluted earnings per share | | | 0.66 | | | 0.63 |
| | |
Cash dividends per share | | | 0.22 | | | 0.70 |
| | |
Tangible book value per share | | $ | 16.71 | | $ | 15.30 |
| | |
Weighted average number of shares outstanding | | | 7,523,982 | | | 7,636,549 |
A complete set of financial statements for Camden National Corporation may be obtained upon written request to Sean G. Daly, Chief Financial Officer, Camden National Corporation, P.O. Box 310, Camden, Maine 04843.