Exhibit 99.1
Dear Shareholders
I am pleased to report that your Company stayed the strategic course during the third quarter of 2006 posting modest, but satisfactory, financial results in the face of continued uncertain times. While a pause in interest rate increases by the Federal Reserve Bank, coupled with moderating energy costs and evidence of greater than expected vigor in our local economies, provided some positive sway to the past quarter’s performance, the on-going flatness of the interest-rate yield curve and weakening loan demand had a moderating effect on the Company’s overall operating performance.
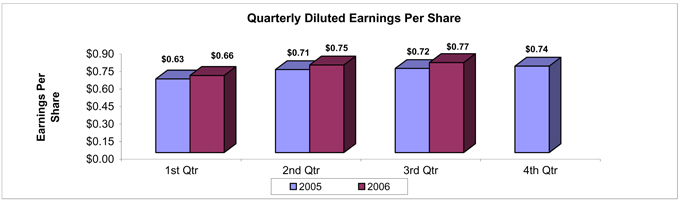
For the quarter ended September 30, 2006, earnings per diluted share, favorably impacted by share repurchases, increased 6.9% to $0.77 compared to $0.72 per diluted share for the third quarter of 2005. Net income of $5.1 million for the three-month period ended September 30, 2006 was down from $5.5 million for the same quarter a year ago.
Through the first nine months of 2006, earnings per diluted share of $2.18 represented an increase of 5.8% compared to $2.06 for the same three quarters in 2005. Net income of $15.3 million for the nine months ended September 30, 2006 was down $457,000, or 2.9% versus the similar period in 2005. These results translated into return on average equity of 18.23% and a return on average assets of 1.19% for the nine months ended September 30, 2006, compared to 16.89% and 1.35%, respectively, for the same nine-month period a year ago.
Reflected in the nine-month results for 2006 are the impact of a charge to earnings of $645,000 arising from the Steamship Navigation et al litigation involving Camden National Bank, $283,000 in expenses incurred as part of the consolidation of our two banks, which occurred over the final weekend of this year’s third quarter, and interest costs of $1.0 million associated with the issuance of Trust Preferred securities to fund the successful “Dutch Auction” tender offer that took place during the second quarter. Without the one-time expenses associated with the litigation and bank consolidation, and introduction of Trust Preferred interest expense, the Company’s net income would have been up 3.3% and 5.7%, respectively, over the third quarter and nine-month period in 2005.
The consolidation of our two bank franchises into the surviving Camden National Bank (see side panel) was executed with precision following nine months of preparation and a task list that included over 600 “To Do’s”. Our goal, established at the outset of this campaign, was to not lose a single employee or customer household as a result of this combination. I’m proud to report to you that your Company was able to successfully deliver on that commitment. A debt of gratitude is owed to all the members of our Transition Team, who were lead by Executive Sponsor, Jeff Smith, and Project Manager, Tim Pratt.
The growth of your Company has slowed thus far in 2006. This is by design given the current interest rate climate, denoted by a protracted flattening of the yield curve, and continued irrational lending practices among bank and non-bank competitors. The latter can best be summed-up as, “too much supply in lending capacity versus too little loan demand.” The competition for new loans has become fierce with pricing and structure both being significantly compromised by our competitors. While we have not abandoned prospecting for new loan opportunities, we are primarily focused on the pursuit of quality new relationships contemporaneous with the delivery of ‘best in class’ service to our existing client base.
At September 30, 2006, total assets of $1.7 billion were up 5.7% over the same period a year ago. Total loans of $1.2 billion increased 6.9% year-on-year, while investments, the second largest asset category, were up nominally to $395.4 million reflecting the challenge in finding satisfactory-yielding securities in the current interest rate environment. Total deposits were up $90.6 million, or 8.0%, over September 30, 2005 balances. The latter growth is a sign that our increased commitment to deposit generation, outlined in previous editions of this letter, is taking hold in a positive manner.
Year-to-date, the quality of the loan portfolio has exhibited some softness, although management believes the issues are isolated to a few, larger relationships negatively impacted by economic conditions, as opposed to general portfolio weaknesses. Non-performing loans to total loans, at September 30, 2006, were 0.68%, up from 0.53% at the end of the first nine months a year ago. Net charge-offs of $1.4 million, or 0.11% of total loans, at the end of the third quarter of 2006 compared unfavorably to the September 30, 2005 results of $732,600 and 0.06%, respectively. The 2006 charge-off results are impacted largely by a single credit and represent a prudent action on the Company’s part. The allowance for loan and lease losses to total loans stands at 1.16%, which we believe is an appropriate level based on the economic conditions in the Company’s service area and management’s estimation of the quality of the current loan portfolio.
The third quarter featured several notable accomplishments celebrating Camden National Corporation’s commitment to excellence. The first-ever “Best Places to Work in Maine” awards, recognizing elite employers, were bestowed in the presence of our State Governor at an event in Augusta. The award is particularly gratifying since it is the first for a Maine bank and resulted from a workforce survey independently administered by ModernThink, a partner of Best Companies Group. In early October, Arthur Comstock, Senior Vice President and Senior Market Manager – Bangor, was feted in Washington, D.C. as Maine’s Outstanding Older Worker. This recognition not only acknowledges productive employment beyond normal retirement age, but community service, as well. Arthur’s commitment to the community is legendary and was recently featured on the front page of theBangor Daily News’ Business Section. Finally, your Company was recognized byUSBanker magazine as the 35th best performing mid-tier bank (between $1 billion and $10 billion in assets) in the country for 2005. This was an improvement from previous rankings of 52nd in 2004 and 59th in 2003.
The Board of Directors of the Company approved a dividend of $0.22 per share, payable on October 31, 2006 to shareholders of record as of October 16, 2006. This represents an increase of 10.0% over the dividend paid for the same period a year ago. The stock price of Camden National Corporation (AMEX: CAC) ended the third quarter of 2006 at $40.20, an increase of $2.53, or 6.7% above the closing price at September 30, 2005.
In conclusion, while we remain cautious about the external factors of change and what they may have in store for us through the balance of the year, I am heartened by the spirit of innovation that permeates our Company, and believe strongly that it will enable us in our quest to be a national model for sustainable community banking.
Thank you for your continued loyalty and support.
Sincerely,
|
Robert W. Daigle |
| President & CEO |
| Consolidated | Statements of Condition (unaudited) |
| | | | | | | | | | | | |
| | | September 30, | | | December 31, | |
(In thousands, except number of shares & per share data) | | 2006 | | | 2005 | | | 2005 | |
Assets | | | | | | | | | | | | |
Cash and due from banks | | $ | 34,069 | | | $ | 32,627 | | | $ | 30,321 | |
Federal funds sold | | | 2,125 | | | | — | | | | 1,110 | |
Securities available for sale, at market value | | | 361,257 | | | | 374,694 | | | | 350,502 | |
Securities held to maturity | | | 34,169 | | | | 13,929 | | | | 17,127 | |
Loans, less allowance for loan and lease losses of $14,472, $13,828 and $14,167 at September 30, 2006 and 2005 and December 31, 2005, respectively | | | 1,229,670 | | | | 1,149,696 | | | | 1,168,008 | |
| | | |
Premises and equipment, net | | | 16,758 | | | | 16,357 | | | | 15,967 | |
Goodwill | | | 3,991 | | | | 3,991 | | | | 3,991 | |
Other assets | | | 67,149 | | | | 64,317 | | | | 66,231 | |
| | | | | | | | | | | | |
Total assets | | $ | 1,749,188 | | | $ | 1,655,611 | | | $ | 1,653,257 | |
| | | | | | | | | | | | |
Liabilities | | | | | | | | | | | | |
Deposits: | | | | | | | | | | | | |
Demand | | $ | 157,816 | | | $ | 153,873 | | | $ | 150,953 | |
NOW | | | 126,429 | | | | 123,146 | | | | 118,247 | |
Money market | | | 262,817 | | | | 232,724 | | | | 240,958 | |
Savings | | | 95,060 | | | | 103,072 | | | | 101,010 | |
Certificates of deposit | | | 577,999 | | | | 516,749 | | | | 552,737 | |
| | | | | | | | | | | | |
Total deposits | | | 1,220,121 | | | | 1,129,564 | | | | 1,163,905 | |
Borrowings from Federal Home Loan Bank | | | 307,227 | | | | 318,315 | | | | 287,501 | |
Other borrowed funds | | | 67,723 | | | | 65,076 | | | | 59,538 | |
Long-term debt | | | 36,083 | | | | — | | | | — | |
Accrued interest and other liabilities | | | 15,308 | | | | 13,214 | | | | 12,775 | |
| | | | | | | | | | | | |
Total liabilities | | | 1,646,462 | | | | 1,526,169 | | | | 1,523,719 | |
| | | | | | | | | | | | |
Shareholders’ Equity | | | | | | | | | | | | |
Common stock, no par value; authorized 20,000,000 shares, issued and outstanding 6,615,480, 7,593,461 and 7,529,073 shares on September 30, 2006 and 2005 and December 31, 2005, respectively | | | 2,450 | | | | 2,450 | | | | 2,450 | |
Surplus | | | 2,278 | | | | 4,107 | | | | 4,098 | |
Retained earnings | | | 102,434 | | | | 124,629 | | | | 126,687 | |
Accumulated other comprehensive loss | | | | | | | | | | | | |
Net unrealized losses on securities available for sale, net of tax | | | (4,266 | ) | | | (1,691 | ) | | | (3,584 | ) |
Net unrealized losses on derivative instruments marked to market, net of tax | | | (170 | ) | | | (53 | ) | | | (113 | ) |
| | | | | | | | | | | | |
Total accumulated other comprehensive loss | | | (4,436 | ) | | | (1,744 | ) | | | (3,697 | ) |
| | | | | | | | | | | | |
Total shareholders’ equity | | | 102,726 | | | | 129,442 | | | | 129,538 | |
| | | | | | | | | | | | |
Total liabilities and shareholders’ equity | | $ | 1,749,188 | | | $ | 1,655,611 | | | $ | 1,653,257 | |
| | | | | | | | | | | | |
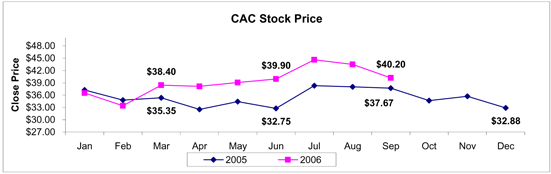
Camden National Corporation stock is listed on the American Stock Exchange under the ticker symbol “CAC.” Stock prices shown in chart are as of close of trading on the last business day of the month.
Consolidated Statements of Income(unaudited)
| | | | | | | | | | | | |
(In thousands, except number of shares & per share data) | | Nine Months Ended
September 30, | | Three Months Ended
September 30, |
| | 2006 | | 2005 | | 2006 | | 2005 |
Interest Income | | | | | | | | | | | | |
Interest and fees on loans | | $ | 64,795 | | $ | 53,018 | | $ | 22,441 | | $ | 19,228 |
Interest on securities | | | 13,815 | | | 11,360 | | | 4,639 | | | 3,962 |
Interest on interest rate swap agreements | | | — | | | 173 | | | — | | | — |
Other interest income | | | 906 | | | 639 | | | 341 | | | 235 |
| | | | | | | | | | | | |
Total interest income | | | 79,516 | | | 65,190 | | | 27,421 | | | 23,425 |
| | | | |
Interest Expense | | | | | | | | | | | | |
Interest on deposits | | | 25,708 | | | 15,013 | | | 9,405 | | | 5,695 |
Interest on borrowed funds | | | 12,926 | | | 9,458 | | | 4,853 | | | 3,519 |
Interest on interest rate swap agreements | | | — | | | 142 | | | — | | | — |
| | | | | | | | | | | | |
Total interest expense | | | 38,634 | | | 24,613 | | | 14,258 | | | 9,214 |
| | | | | | | | | | | | |
Net interest income | | | 40,882 | | | 40,577 | | | 13,163 | | | 14,211 |
| | | | |
Provision for Loan and Lease Losses | | | 1,656 | | | 920 | | | 552 | | | 345 |
| | | | | | | | | | | | |
Net interest income after provision for loan and lease losses | | | 39,226 | | | 39,657 | | | 12,611 | | | 13,866 |
| | | | |
Non-interest Income | | | | | | | | | | | | |
Service charges on deposit accounts | | | 2,570 | | | 2,589 | | | 892 | | | 887 |
Other service charges and fees | | | 1,271 | | | 999 | | | 416 | | | 381 |
Income from fiduciary services | | | 3,290 | | | 2,961 | | | 1,139 | | | 990 |
Life insurance earnings | | | 600 | | | 482 | | | 200 | | | 160 |
Other income | | | 979 | | | 700 | | | 356 | | | 223 |
| | | | | | | | | | | | |
Total non-interest income | | | 8,710 | | | 7,731 | | | 3,003 | | | 2,641 |
| | | | |
Non-interest Expenses | | | | | | | | | | | | |
Salaries and employee benefits | | | 13,663 | | | 13,890 | | | 4,455 | | | 4,957 |
Premises and fixed assets | | | 3,466 | | | 3,148 | | | 1,120 | | | 1,039 |
Amortization of core deposit intangible | | | 650 | | | 664 | | | 213 | | | 221 |
Other expenses | | | 7,877 | | | 6,432 | | | 2,392 | | | 2,172 |
| | | | | | | | | | | | |
Total non-interest expenses | | | 25,656 | | | 24,134 | | | 8,180 | | | 8,389 |
| | | | | | | | | | | | |
Income before income taxes | | | 22,280 | | | 23,254 | | | 7,434 | | | 8,118 |
Income Taxes | | | 6,948 | | | 7,465 | | | 2,298 | | | 2,626 |
| | | | | | | | | | | | |
Net Income | | $ | 15,332 | | $ | 15,789 | | $ | 5,136 | | $ | 5,492 |
| | | | | | | | | | | | |
Per Share Data | | | | | | | | | | | | |
| | | | |
Basic earnings per share | | $ | 2.18 | | $ | 2.07 | | $ | 0.77 | | $ | 0.72 |
| | | | |
Diluted earnings per share | | | 2.18 | | | 2.06 | | | 0.77 | | | 0.72 |
| | | | |
Cash dividends per share | | $ | 0.66 | | $ | 1.10 | | $ | 0.22 | | $ | 0.20 |
| | | | |
Weighted average number of shares outstanding | | | 7,021,808 | | | 7,616,815 | | | 6,613,379 | | | 7,591,939 |
| | | | |
Tangible book value per share | | $ | 14.71 | | $ | 16.24 | | | | | | |
A complete set of financial statements for Camden National Corporation may be obtained upon written request to Sean G. Daly, Chief Financial Officer, Camden National Corporation, P.O. Box 310, Camden, Maine 04843.