Exhibit 99.1
Dear Shareholders,
As I write this first Shareholder Letter of the new fiscal year, the State of Maine is bracing itself for yet another wintry storm. The good thing about snow this time of the year is that we know it will be short-lived with better weather just around the corner. “Poor man’s fertilizer,” we used to call it back in my native Aroostook County.
I wish I could forecast a similar turnaround for the stormy economic conditions surrounding our industry these days. What with a flat interest-rate yield curve continuing to pressure the net interest margin and mixed reviews on local economic conditions, there appears to be no ‘quick fix’ on the horizon, with no more than modest growth to look forward to in the near term. All of this suggests a focus on basic ‘block and tackling’ activities within the Company. This will ensure the core of the franchise is strengthened in preparation for the inevitable opportunities that arise when such adverse conditions prevail.
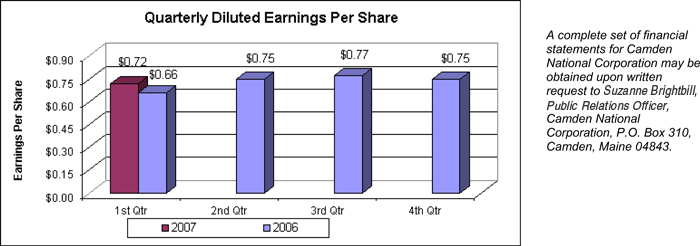
During the quarter ended March 31, 2007, your Company reported net income per diluted share of $0.72, a 9.1% increase over the $0.66 per diluted share earned for the same period a year ago. Net income after taxes for the first quarter of 2007 was $4.8 million, a decrease of 3.1% compared to the quarter ended March 31, 2006. These results reflect the effect of the Company’s repurchase of nearly 11.7% of its outstanding shares in 2006, and the funding of that purchase through the issuance of trust preferred securities.
For the first quarter of 2007, the Company achieved a return on average equity of 18.01% and a return on average assets of 1.11% compared to 15.45% and 1.18%, respectively, for the quarterly period ended March 31, 2006.
Total assets of the Company at March 31, 2007 were $1.7 billion, which is flat compared to where the Company ended the first quarter of 2006. Loans, which at $1.2 billion represent the largest component of total assets, experienced similar flatness year-on-year. We believe that this is indicative of a paucity of higher quality financing opportunities coupled with keen competition for this limited supply. The latter combination may create conditions where underwriting practices are relaxed and pricing does not reflect the risk inherent in the overall relationship. Your Company has elected not to extend itself beyond the level of prudent risk it has been comfortable in accepting in the past, preferring instead to risk short-term negative loan growth in some of the loan categories that have on occasion proven problematic in a stressed economy.
The Company’s focus on loan quality is paying dividends as non-performing loans totaling $7.9 million, or 0.66% of total loans at March 31, 2007, declined from $8.6 million, or 0.71% of total loans at March 31, 2006. Net charge-offs of $160,000 during the first quarter of 2007 represent a very modest 0.01% of total loans, which is well below the industry average. The allowance for loan and lease losses to total loans of 1.24% at this recent quarter-end increased from the 1.21% posted at March 31, 2006. While pleased with these results, we remain vigilant and proactive in the early detection of problem credits, thus enabling our experienced team of collection associates to work collaboratively with our borrowers in getting them through their ‘rough patch.’
Total deposits of $1.2 billion at March 31, 2007 were relatively level with last year’s balances at the end of the first quarter. Encouraging, however, is the 7.61% increase in core deposits (total deposits excluding brokered certificates of deposit), to $1.0 billion, which is a direct result of the formation of a Deposit Group in 2006. This dedicated staff is charged with lessening the Company’s reliance on less predictable wholesale funding by increasing the level of lower-cost and ‘stickier’ core deposits. Aiding in this endeavor has been the successful introduction of our bundled deposit solution, the Customer Care Package, which features free worldwide ATM use, free checking with direct deposit, and free bill payment service with eStatements.
Given the earlier mentioned competitive pricing environment on the lending front, core deposit generation continues to be a prime mitigation strategy for the continued compression in the Company’s net interest margin, which at March 31, 2007 was 3.07% compared to 3.63% at March 31, 2006.
Also assisting in offsetting the shrinking net interest margin during the first quarter of this year was our growth in non-interest income, which at $3.0 million improved 9.5% over the same period a year ago. Primary contributors to this success were fiduciary services, brokerage and insurance sales, and debit card activities, with year-on-year revenue increases of 11.3%, 77.7% and 14.8%, respectively, during the first quarter.
Meanwhile, non-interest expenses for the first quarter of 2007 were flat versus the same period a year ago when netting out the effect of a $645,000 charge to earnings in 2006 resulting from the Steamship Navigation et al litigation involving Camden National Bank. We are being deliberate in managing our overhead expenses during these challenging times mindful as always of not sacrificing on the investments required to maintain our competitive advantage.
There were several notable developments that took place during this reporting period, includingUS Banker magazine’s annual ranking of top U.S. mid-tier banks (Assets: $1 – $10 billion), which listed Camden National Corporation as 28th with a three-year average return on equity of 17.12%. This is an improvement from 35th in 2005. For the fourth consecutive year, Camden National Bank was voted “Best of the Best” in a readers’ poll conducted throughout Knox County. Continuing with celebratory events, the Bank’s new downtown Rockland branch, located in the historic Spear Block, opened to rave reviews and an evening reception featuring more than 500 guests in attendance. This project preserves an important part of the City’s past and continues the Bank’s tradition of investing, and operating, in downtown settings.
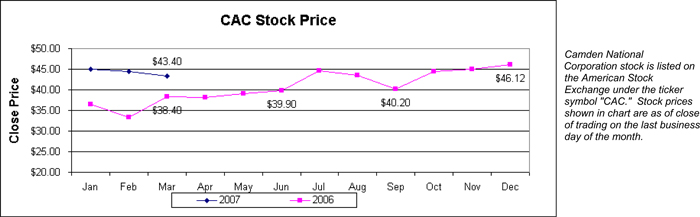
Finally, the Board of Directors of the Company approved a dividend of $0.24 per share, payable on April 30, 2007 to shareholders of record on April 16, 2007. This represents a $0.02, or 9.1%, increase from that paid for the same period a year ago. Additionally, the stock price of Camden National Corporation (AMEX: CAC) ended the first quarter of 2007 at $43.40 per share, an increase of $5.00, or 13.0%, above the closing price at March 31, 2006.
The roller coaster effect forecasted in our 2006 Annual Report is very much in evidence to date in 2007. What gives me comfort is that we are well prepared for the ‘twists and turns’ that lie before us. We believe that we have a fortress-like balance sheet, a superb track record of operating discipline, and a workforce committed to providing service that’s second to none. We look forward to rewarding your continued loyalty and support.
Sincerely,
Robert W. Daigle
President and Chief Executive Officer
Consolidated Statements of Condition(unaudited)
| | | | | | | | | | | | |
| | | March 31, | | | December 31, | |
(In thousands, except number of shares & per share data) | | 2007 | | | 2006 | | | 2006 | |
Assets | | | | | | | | | | | | |
Cash and due from banks | | $ | 29,823 | | | $ | 36,292 | | | $ | 33,358 | |
Federal funds sold | | | 55 | | | | — | | | | — | |
Securities available for sale, at market value | | | 401,674 | | | | 390,364 | | | | 409,926 | |
Securities held to maturity | | | 33,920 | | | | 25,996 | | | | 34,167 | |
Loans, less allowance for loan losses of $14,873, $14,639 and $14,933 at March 31, 2007 and 2006 and December 31, 2006, respectively | | | 1,185,384 | | | | 1,197,859 | | | | 1,203,196 | |
| | | |
Premises and equipment, net | | | 18,977 | | | | 15,586 | | | | 17,595 | |
Other real estate owned | | | — | | | | 349 | | | | 125 | |
Goodwill | | | 3,991 | | | | 3,991 | | | | 3,991 | |
Other assets | | | 66,938 | | | | 66,190 | | | | 67,528 | |
| | | | | | | | | | | | |
Total assets | | $ | 1,740,762 | | | $ | 1,736,627 | | | $ | 1,769,886 | |
| | | | | | | | | | | | |
| | | |
Liabilities | | | | | | | | | | | | |
Deposits: | | | | | | | | | | | | |
Demand | | $ | 139,553 | | | $ | 129,207 | | | $ | 146,458 | |
NOW | | | 123,637 | | | | 115,193 | | | | 125,809 | |
Money market | | | 283,451 | | | | 244,652 | | | | 261,585 | |
Savings | | | 90,217 | | | | 97,921 | | | | 96,661 | |
Certificates of deposit | | | 552,506 | | | | 617,293 | | | | 555,288 | |
| | | | | | | | | | | | |
Total deposits | | | 1,189,364 | | | | 1,204,266 | | | | 1,185,801 | |
Borrowings from Federal Home Loan Bank | | | 306,087 | | | | 330,320 | | | | 340,499 | |
Other borrowed funds | | | 80,806 | | | | 55,173 | | | | 60,782 | |
Junior subordinated debentures | | | 36,083 | | | | — | | | | 36,083 | |
Due to broker | | | — | | | | — | | | | 24,354 | |
Accrued interest and other liabilities | | | 16,159 | | | | 15,375 | | | | 15,315 | |
| | | | | | | | | | | | |
Total liabilities | | | 1,628,499 | | | | 1,605,134 | | | | 1,662,834 | |
| | | | | | | | | | | | |
| | | |
Shareholders’ Equity | | | | | | | | | | | | |
Common stock, no par value; authorized 20,000,000 shares, issued and outstanding 6,624,636, 7,519,759 and 6,616,780 shares on March 31, 2007 and 2006 and December 31, 2006, respectively | | | 2,478 | | | | 2,450 | | | | 2,450 | |
Surplus | | | 2,535 | | | | 3,806 | | | | 2,584 | |
Retained earnings | | | 109,385 | | | | 129,536 | | | | 105,959 | |
Accumulated other comprehensive loss | | | | | | | | | | | | |
Net unrealized losses on securities available for sale, net of tax | | | (1,158 | ) | | | (4,099 | ) | | | (2,985 | ) |
Net unrealized losses on derivative instruments marked to market, net of tax | | | (188 | ) | | | (200 | ) | | | (198 | ) |
Adjustment for unfunded post-retirement plans, net of tax | | | (789 | ) | | | — | | | | (758 | ) |
| | | | | | | | | | | | |
Total accumulated other comprehensive loss | | | (2,135 | ) | | | (4,299 | ) | | | (3,941 | ) |
| | | | | | | | | | | | |
| | | |
Total shareholders’ equity | | | 112,263 | | | | 131,493 | | | | 107,052 | |
| | | | | | | | | | | | |
Total liabilities and shareholders’ equity | | $ | 1,740,762 | | | $ | 1,736,627 | | | $ | 1,769,886 | |
| | | | | | | | | | | | |
Consolidated Statements of Income(unaudited)
| | | | | | |
| | | Three Months Ended
March 31, |
(In thousands, except number of shares & per share data) | | 2007 | | 2006 |
Interest Income | | | | | | |
Interest and fees on loans | | $ | 21,499 | | $ | 20,683 |
Interest on securities | | | 5,163 | | �� | 4,422 |
Other interest income | | | 327 | | | 291 |
| | | | | | |
Total interest income | | | 26,989 | | | 25,396 |
| | |
Interest Expense | | | | | | |
Interest on deposits | | | 9,470 | | | 7,492 |
Interest on other borrowings | | | 4,490 | | | 3,702 |
Interest on junior subordinated debentures | | | 587 | | | — |
| | | | | | |
Total interest expense | | | 14,547 | | | 11,194 |
| | | | | | |
Net interest income | | | 12,442 | | | 14,202 |
| | |
Provision for Loan and Lease Losses | | | 100 | | | 552 |
| | | | | | |
Net interest income after provision for loan and lease losses | | | 12,342 | | | 13,650 |
| | |
Non-interest Income | | | | | | |
Service charges on deposit accounts | | | 845 | | | 795 |
Other service charges and fees | | | 427 | | | 474 |
Income from fiduciary services | | | 1,199 | | | 1,077 |
Life insurance earnings | | | 188 | | | 200 |
Other income | | | 385 | | | 233 |
| | | | | | |
Total non-interest income | | | 3,044 | | | 2,779 |
| | |
Non-interest Expenses | | | | | | |
Salaries and employee benefits | | | 4,646 | | | 4,736 |
Premises and fixed assets | | | 1,232 | | | 1,188 |
Amortization of core deposit intangible | | | 214 | | | 221 |
Other expenses | | | 2,473 | | | 3,067 |
| | | | | | |
Total non-interest expenses | | | 8,565 | | | 9,212 |
| | | | | | |
| | |
Income before income taxes | | | 6,821 | | | 7,217 |
Income Taxes | | | 2,039 | | | 2,280 |
| | | | | | |
| | |
Net Income | | $ | 4,782 | | $ | 4,937 |
| | | | | | |
| | |
Per Share Data | | | | | | |
| | |
Basic earnings per share | | $ | 0.72 | | $ | 0.66 |
| | |
Diluted earnings per share | | | 0.72 | | | 0.66 |
| | |
Cash dividends per share | | $ | 0.24 | | $ | 0.22 |
| | |
Weighted average number of shares outstanding | | | 6,621,407 | | | 7,523,982 |
| | |
Tangible book value per share (1) | | $ | 16.20 | | $ | 16.71 |
| (1) | Computed by dividing total shareholders’ equity less goodwill and core deposit intangible by the number of common shares outstanding. |