Exhibit 99.1
Dear Shareholders,
This letter represents the first quarterly communique following the merger of Union Bankshares Company (“Union Bankshares”) with and into Camden National Corporation (the “Company”). The merger officially occurred on January 3, 2008, hereinafter referred to as Legal Day One. Legal Day One triggered a series of transactions, which culminated in the complete integration of our latest strategic acquisition in less than 90 days – a noteworthy achievement.
The additional transactions alluded to include the sale of a branch, consolidation of several branches in overlapping markets, conversion of bank technology systems, merger of full-service brokerage functions into Acadia Financial Consultants and integration of wealth management and financial advisory services into Acadia Trust, N.A.
It was our goal to make the transition of over 16,000 Union Trust households and businesses to Camden National Bank as seamless and least disruptive as possible. Bear in mind that our integration team had created a project checklist of nearly 3,000 items to be completed. In my 38 years of service in banking, I have witnessed, and participated in, countless of these transactions and I am pleased to report to you that this latest one was the smoothest of them all.
While there were customer-impacting issues in the first days following the integration, compounded by a significant security breach announced by a local company at the same time, the synchronized response to these challenges by our highly-trained and customer-focused staff made this a merger and acquisition model others in the industry would do well to emulate.
My heartfelt thanks go out to all within our Company who worked many long hours to make this integration a success—both in customer retention and customer experience—as well as to our new and existing customers who offered their support and understanding throughout the process. We are a stronger company for what we have been through, and the fruits of our labor are very much in evidence.
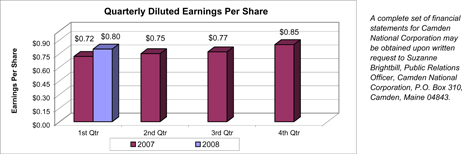
We are pleased to report that for the quarter ended March 31, 2008, net income per diluted share increased 11.1%, to $0.80, compared to $0.72 per diluted share in the first quarter of 2007. Reflecting the addition of Union Bankshares’ $547.4 million asset base, net income for the first quarter of 2008 was $6.2 million, an increase of 29.5% from the same three month period a year ago.
These results translated into a return on average equity of 14.83% and a return on average assets of 1.09% for the first quarter of 2008, compared to 18.01% and 1.11%, respectively, for the quarterly period ended March 31, 2007. The decline in these ratios is primarily the result of $38.8 million of goodwill created from the Union Bankshares acquisition. First quarter return on average tangible equity (which excludes goodwill and other intangible assets) was 20.50% compared to 18.87% for the same period a year ago.
Total assets of the Company increased $557.7 million, or 32.0%, from March 31, 2007 to a Company record of $2.3 billion on March 31, 2008. Growth occurred in both loan and investment portfolios, which at $1.5 billion and $593.9 million, respectively, representing an increase of 26.5% and 36.3%, respectively, from levels reported at the end of the first quarter in 2007.
Net interest income for the first quarter of 2008 increased 37.9% to $17.2 million, compared to $12.4 million for the same period in 2007. This year-on-year gain is due primarily to the previously-mentioned Union Bankshares acquisition and a 24 basis point improvement in the Company’s net interest margin, to 3.31%, resulting from the recent interest rate moves by the Federal Reserve and the return of a positively sloped yield curve.
Non-interest income of $4.4 million for the quarter ended March 31, 2008, was up 44.7% from the same quarter a year ago. This was due in large part to an increase in fiduciary services revenue, service charges on deposit accounts and the gain on sale of securities arising from a restructuring of the investment portfolio.
Non-interest expense for the first quarter of 2008 was $12.3 million, an increase of $3.7 million, or 43.2%, over the same quarter in the prior year. Included in the results were merger-related expenses arising from the operational integration. The Company’s efficiency ratio for the quarter ended March 31, 2008 was 56.85%, compared to 55.31% for the first quarter of 2007.
Reflected in the first quarter 2008 results is a higher provision for loan losses of $500,000 compared to $100,000 for the same period a year ago. This increase is in response to greater stress in the Company’s loan portfolio brought on by a weakening economy. The impact of this deteriorating economic trend can be seen in rising non-performing loans, which at 1.02% of total loans at March 31, 2008, is up from 0.66% a year ago. Additionally, net charge-offs, at $1.5 million, or 0.10% of total loans, are up considerably from the $160,000, or 0.01% of total loans, for the first three months of 2007. While these indicators reveal some weakening year-on-year, I would hasten to say that the results noted reflect more the impact of a select number of credits, than a general deterioration within the Company’s loan portfolio. We remain vigilant in the monitoring of asset quality and continue to add resources to be more proactive in managing through this down part of the economic cycle. The allowance for loan and lease losses was 1.12% of total loans outstanding at March 31, 2008, compared to 1.24% of loans outstanding on the same date in 2007.
At March 31, 2008, the Company’s total risk-based capital ratio of 11.69% and tier 1 capital ratio of 10.53% compared favorably to the minimum ratios of 10.0% and 6.0%, respectively, required by the Federal Reserve for a bank holding company to be considered “well capitalized.”
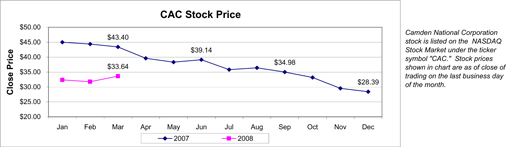
The Company’s Board of Directors approved a dividend of $0.25 per share, payable on April 30, 2008 to shareholders of record on April 15, 2008. This represents a $0.01, or 4.2%, increase from that paid a year ago. Additionally, the stock price of Camden National Corporation (NASDAQ: CAC) ended the first quarter of 2008 at $33.64 per share, an increase of $5.25, or 18.5%, above the closing price of $28.39 at December 31, 2007.
While these are extremely challenging times for our industry, I believe the strength of our liquidity, credit reserves, capital and operating margins have successfully positioned our Company well for the future.
As always, your support as shareholders, customers and ambassadors for our Company is greatly appreciated.
|
| Sincerely |
|
| Robert W. Daigle |
| President & Chief Executive Officer |
Consolidated Statements of Condition (unaudited)
| | | | | | | | | | | | |
| | | March 31, | | | December 31, | |
(In thousands, except number of shares & per share data) | | 2008 | | | 2007 | | | 2007 | |
Assets | | | | | | | | | | | | |
Cash and due from banks | | $ | 35,765 | | | $ | 29,823 | | | $ | 28,790 | |
Federal funds sold | | | — | | | | 55 | | | | — | |
Securities available for sale, at market value | | | 551,529 | | | | 401,674 | | | | 423,108 | |
Securities held to maturity | | | 42,418 | | | | 33,920 | | | | 40,726 | |
Loans held for sale | | | 4,265 | | | | — | | | | — | |
Loans, less allowance for loan losses of $16,979, $14,873 and $13,653 at March 31, 2008 and 2007 and December 31, 2007, respectively | | | 1,496,914 | | | | 1,185,384 | | | | 1,131,986 | |
Premises and equipment, net | | | 27,277 | | | | 18,977 | | | | 19,650 | |
Other real estate owned | | | 554 | | | | — | | | | 400 | |
Goodwill | | | 42,758 | | | | 3,991 | | | | 3,991 | |
Other assets | | | 96,985 | | | | 66,938 | | | | 68,137 | |
| | | | | | | | | | | | |
Total assets | | $ | 2,298,464 | | | $ | 1,740,762 | | | $ | 1,716,788 | |
| | | | | | | | | | | | |
Liabilities | | | | | | | | | | | | |
Deposits: | | | | | | | | | | | | |
Demand | | $ | 172,417 | | | $ | 139,553 | | | $ | 141,858 | |
NOW | | | 210,400 | | | | 123,637 | | | | 132,331 | |
Money market | | | 324,612 | | | | 283,451 | | | | 298,677 | |
Savings | | | 132,095 | | | | 90,217 | | | | 85,931 | |
Certificates of deposit | | | 551,498 | | | | 552,506 | | | | 459,254 | |
| | | | | | | | | | | | |
Total deposits | | | 1,391,022 | | | | 1,189,364 | | | | 1,118,051 | |
| | | | | | | | | | | | |
Borrowings from Federal Home Loan Bank | | | 466,905 | | | | 306,087 | | | | 271,558 | |
Other borrowed funds | | | 195,368 | | | | 80,806 | | | | 142,492 | |
Junior subordinated debentures | | | 43,333 | | | | 36,083 | | | | 36,083 | |
Accrued interest and other liabilities | | | 29,696 | | | | 16,159 | | | | 28,401 | |
| | | | | | | | | | | | |
Total liabilities | | | 2,126,324 | | | | 1,628,499 | | | | 1,596,585 | |
| | | | | | | | | | | | |
Shareholders’ Equity | | | | | | | | | | | | |
Common stock, no par value; authorized 20,000,000 shares, issued and outstanding 7,703,885, 6,624,636 and 6,513,573 shares on March 31, 2008 and 2007 and December 31, 2007, respectively | | | 2,802 | | | | 2,478 | | | | 2,522 | |
Surplus | | | 45,987 | | | | 2,535 | | | | 2,629 | |
Retained earnings | | | 119,195 | | | | 109,385 | | | | 114,289 | |
Accumulated other comprehensive loss | | | | | | | | | | | | |
Net unrealized losses on securities available for sale, net of tax | | | 4,516 | | | | (1,158 | ) | | | 1,516 | |
Net unrealized losses on derivative instruments marked to market, net of tax | | | — | | | | (188 | ) | | | — | |
Adjustment for unfunded post-retirement plans, net of tax | | | (360 | ) | | | (789 | ) | | | (753 | ) |
| | | | | | | | | | | | |
Total accumulated other comprehensive loss | | | 4,156 | | | | (2,135 | ) | | | 763 | |
| | | | | | | | | | | | |
Total shareholders’ equity | | | 172,140 | | | | 112,263 | | | | 120,203 | |
| | | | | | | | | | | | |
Total liabilities and shareholders’ equity | | $ | 2,298,464 | | | $ | 1,740,762 | | | $ | 1,716,788 | |
| | | | | | | | | | | | |
Consolidated Statements of Income(unaudited)
| | | | | | |
| | | Three Months Ended
March 31, |
(In thousands, except number of shares & per share data) | | 2008 | | 2007 |
Interest Income | | | | | | |
Interest and fees on loans | | $ | 25,314 | | $ | 21,499 |
Interest on securities | | | 6,824 | | | 5,163 |
Other interest income | | | 771 | | | 327 |
| | | | | | |
Total interest income | | | 32,909 | | | 26,989 |
| | |
Interest Expense | | | | | | |
Interest on deposits | | | 8,942 | | | 9,470 |
Interest on other borrowings | | | 6,052 | | | 4,490 |
Interest on junior subordinated debentures | | | 752 | | | 587 |
| | | | | | |
Total interest expense | | | 15,746 | | | 14,547 |
| | | | | | |
Net interest income | | | 17,163 | | | 12,442 |
| | |
Provision for Loan and Lease Losses | | | 500 | | | 100 |
| | | | | | |
Net interest income after provision for loan and lease losses | | | 16,663 | | | 12,342 |
| | |
Non-interest Income | | | | | | |
Service charges on deposit accounts | | | 1,227 | | | 845 |
Other service charges and fees | | | 639 | | | 427 |
Income from fiduciary services | | | 1,677 | | | 1,199 |
Life insurance earnings | | | 293 | | | 188 |
Other income | | | 567 | | | 385 |
| | | | | | |
Total non-interest income | | | 4,403 | | | 3,044 |
| | |
Non-interest Expenses | | | | | | |
Salaries and employee benefits | | | 6,652 | | | 4,646 |
Premises and fixed assets | | | 1,941 | | | 1,232 |
Amortization of core deposit intangible | | | 310 | | | 214 |
Other expenses | | | 3,358 | | | 2,473 |
| | | | | | |
Total non-interest expenses | | | 12,261 | | | 8,565 |
| | | | | | |
Income before income taxes | | | 8,805 | | | 6,821 |
Income Taxes | | | 2,611 | | | 2,039 |
| | | | | | |
Net Income | | $ | 6,194 | | $ | 4,782 |
| | | | | | |
Per Share Data | | | | | | |
Basic earnings per share | | $ | 0.81 | | $ | 0.72 |
Diluted earnings per share | | | 0.80 | | | 0.72 |
Cash dividends per share | | $ | 0.24 | | $ | 0.24 |
Weighted average number of shares outstanding | | | 7,692,726 | | | 6,621,407 |
Tangible book value per share (1) | | $ | 16.14 | | $ | 16.20 |
| (1) | Computed by dividing total shareholders’ equity less goodwill and core deposit intangible by the number of common shares outstanding. |