Exhibit 99.1
Dear Shareholders
With financial markets having been roiled by bad economic news in recent months and bank stock prices, including our very own, seemingly caught in a virtual free-fall, one could hardly be faulted for subscribing to a ‘Chicken Little’ outlook these days. While there is ample evidence to support the illusion of a falling sky, particularly when it comes to the financial sector, I would contend that in the midst of what some are characterizing as an economic meltdown there are some pockets of prosperity. To find such evidence, one needs to look no further than our very own Company, where a successful strategic acquisition and a steady, conservative and disciplined approach in carrying-on normal day-to-day activities are producing solid operating results.
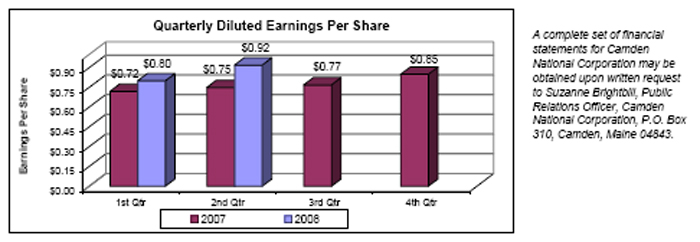
To wit, I am pleased to report that for the quarter ended June 30, 2008, earnings per diluted share of $0.92 were up 22.7%, compared to $0.75 per diluted share for the second quarter of 2007. Reflecting the addition earlier in the year of Union Bankshares’ $547.4 million asset base, net income for the recently completed quarter was $7.1 million, an increase of 43.8% over the same three-month period a year ago.
For the six months ended June 30, 2008, earnings per diluted share of $1.73 were up 17.7%, compared to $1.47 for the first half of 2007. Net income for the first six months of 2008 increased 36.8%, to $13.3 million, compared to the $9.7 million reported for the six months ended June 30, 2007. These results translated into a return on average equity of 15.77% and a return on average assets of 1.17% for the six months ended June 30, 2008, compared to 17.97% and 1.12%, respectively, for the same six-month period a year ago. The decline in return on average equity is primarily the result of $38.4 million of goodwill created from the Union Bankshares acquisition. First half return on average tangible equity (which excludes goodwill and other intangibles) was 22.21% compared to 18.75% for the same period a year ago.
Total assets of $2.3 billion at June 30, 2008 increased $552.5 million, or 31.4%, from June 30, 2007. Growth occurred in both the loan and investment portfolios, which at $1.5 billion and $596.6 million, respectively, represented an increase of 28.3% and 30.0%, respectively, from levels reported at the end of the second quarter in 2007.
Net interest income for the first six months of 2008 increased 41.5% to $35.1 million, compared to $24.8 million for the same period in 2007. This year-on-year gain is due primarily to the previously-mentioned Union Bankshares acquisition and a 31 basis point improvement in the Company’s net interest margin, to 3.37%, resulting from the recent interest rate moves by the Federal Reserve, continued positive slope to the yield curve and a fastidious approach in managing the Company’s asset-liability (ALM) process.
Non-interest income of $9.1 million for the first half of 2008 was up 44.9% from the same period a year ago. This was due in large part to an increase in fiduciary and brokerage services revenue, service charges on deposit accounts and the gain on sale of securities arising from the restructuring of the investment portfolio.
Non-interest expense for the first six months of 2008 was $24.2 million, an increase of $7.1 million, or 41.7%, over the same period in the prior year. Included are merger-related expenses arising from the successfully concluded operational integration. The Company’s efficiency ratio for the six-month period ended June 30, 2008 was 54.80%, compared to 55.00% for the six-month
period ended June 30, 2007, and 56.85% for the quarter ended March 31, 2008 when the combined operation with Union Bankshares was first reported. This quarter-to-quarter improvement demonstrates our ability to successfully execute on our cost savings targets and earnings accretion goals established during the acquisition due diligence process.
With much of the consternation in the financial markets revolving around credit quality and capital adequacy, it seems only right to devote specific discussion herein to each subject. Let me preface these remarks by reiterating that your Company has not engaged in any sub-prime lending activities in the past nor do we have any exposure presently. Our bread and butter lending has and continues to be small business- and consumer-related. Commercial real estate, a fairly significant component of past years’ activities, has been managed to lower levels within the last 18 months as we began to see evidence of stress in that sector.
With respect to credit quality, we have not been immune from the adverse effects of a weakening economy, despite being proactive in re-tooling our loan origination practices and increasing our vigilance on all matters relating to risk management. This is evidenced by our non-performing loans to total loans ratio, which at 0.90% at June 30, 2008 is up from 0.56% at June 30, 2007. In addition, net charge-offs to total average loans through June 30, 2008 was 0.11% compared to 0.09% for the same period a year ago. The allowance for loan and lease losses to total loans has decreased slightly to 1.13% versus a year ago, and is 125.6% of non-performing loans at June 30, 2008. These indicators are not where we are accustomed to seeing them. However, you should know that I have the utmost confidence in the people and processes we have in place to guide us through these difficult times and return us to more comfortable levels in the future.
Regarding capital adequacy, I am pleased to report that at June 30, 2008, Camden National Corporation reported a total risk-based capital ratio of 11.95% and a Tier 1 ratio of 10.77% compared to the 10.00% and 6.00% minimums, respectively, required by the Federal Reserve for a bank holding company to be considered “well capitalized.” Your directors and management are strongly committed to preserving capital to withstand the adverse effects of an economic down cycle while at the same time ensuring for well-supported dividend distributions, the occasional share repurchase when the market is not properly valuing our stock and opportunistic acquisitions aimed at strengthening the future of our existing franchise.
In closing, let me say that we are not without our challenges, yet I remain optimistic for our continued success predicated on three important factors: the existence of a well thought out long-range strategic plan, which has proven resilient and adaptable to the change required during these unpredictable times, a management team capable of executing on the plan’s strategic objectives, and a workforce committed to delivering unique customer experiences. You have heard me say on countless occasions that our long-term vision is to create a national model for sustainable community banking at Camden National Corporation. I believe, more than ever, that we are on a path that has us realizing this ambitious, yet noble, objective.
|
| Sincerely, |
|
| Robert W. Daigle |
| President & CEO |
Consolidated Statements of Condition (unaudited)
| | | | | | | | | | | | |
| | | June 30, | | | December 31,
2007 | |
(In thousands, except number of shares & per share data) | | 2008 | | | 2007 | | |
Assets | | | | | | | | | | | | |
Cash and due from banks | | $ | 36,373 | | | $ | 31,629 | | | $ | 28,790 | |
Federal funds sold | | | — | | | | 300 | | | | — | |
Securities available for sale, at market value | | | 554,516 | | | | 424,858 | | | | 423,108 | |
Securities held to maturity | | | 42,132 | | | | 33,723 | | | | 40,726 | |
Loans, less allowance for loan losses of $17,266, $13,927 and $13,653 at June 30, 2008 and 2007 and December 31, 2007, respectively | | | 1,509,692 | | | | 1,176,175 | | | | 1,131,986 | |
Premises and equipment, net | | | 27,068 | | | | 19,774 | | | | 19,650 | |
Other real estate owned | | | 296 | | | | — | | | | 400 | |
Bank-owned life insurance | | | 35,301 | | | | 22,062 | | | | 22,509 | |
Goodwill | | | 42,383 | | | | 3,991 | | | | 3,991 | |
Other assets | | | 65,834 | | | | 48,591 | | | | 45,628 | |
| | | | | | | | | | | | |
Total assets | | $ | 2,313,595 | | | $ | 1,761,103 | | | $ | 1,716,788 | |
| | | | | | | | | | | | |
Liabilities | | | | | | | | | | | | |
Deposits: | | | | | | | | | | | | |
Demand | | $ | 184,409 | | | $ | 150,485 | | | $ | 141,858 | |
NOW | | | 198,191 | | | | 130,695 | | | | 132,331 | |
Money market | | | 289,875 | | | | 278,098 | | | | 298,677 | |
Savings | | | 131,328 | | | | 87,573 | | | | 85,931 | |
Certificates of deposit | | | 605,427 | | | | 486,127 | | | | 459,254 | |
| | | | | | | | | | | | |
Total deposits | | | 1,409,230 | | | | 1,132,978 | | | | 1,118,051 | |
Borrowings from Federal Home Loan Bank | | | 453,716 | | | | 376,687 | | | | 271,558 | |
Other borrowed funds | | | 206,261 | | | | 92,534 | | | | 142,492 | |
Junior subordinated debentures | | | 43,342 | | | | 36,083 | | | | 36,083 | |
Due to broker | | | 5,000 | | | | — | | | | — | |
Accrued interest and other liabilities | | | 23,901 | | | | 15,312 | | | | 28,401 | |
| | | | | | | | | | | | |
Total liabilities | | | 2,141,450 | | | | 1,653,594 | | | | 1,596,585 | |
| | | | | | | | | | | | |
Shareholders' Equity | | | | | | | | | | | | |
Common stock, no par value; authorized 20,000,000 shares, issued and outstanding 7,686,441, 6,512,980 and 6,513,573 shares on June 30, 2008 and 2007 and December 31, 2007, respectively | | | 2,814 | | | | 2,530 | | | | 2,522 | |
Surplus | | | 46,051 | | | | 2,481 | | | | 2,629 | |
Retained earnings | | | 123,831 | | | | 108,430 | | | | 114,289 | |
Accumulated other comprehensive (loss) income | | | | | | | | | | | | |
Net unrealized (losses) gains on securities available for sale, net of tax | | | (197 | ) | | | (4,936 | ) | | | 1,516 | |
Net unrealized losses on derivative instruments marked to market, net of tax | | | — | | | | (218 | ) | | | — | |
Net unrealized losses on post-retirement plans, net of tax | | | (354 | ) | | | (778 | ) | | | (753 | ) |
| | | | | | | | | | | | |
Total accumulated other comprehensive (loss) income | | | (551 | ) | | | (5,932 | ) | | | 763 | |
| | | | | | | | | | | | |
Total shareholders' equity | | | 172,145 | | | | 107,509 | | | | 120,203 | |
| | | | | | | | | | | | |
Total liabilities and shareholders' equity | | $ | 2,313,595 | | | $ | 1,761,103 | | | $ | 1,716,788 | |
| | | | | | | | | | | | |

Consolidated Statements of Income(unaudited)
| | | | | | | | | | | | |
| | | Six Months Ended
June 30, | | Three Months Ended
June 30, |
(In thousands, except number of shares & per share data) | | 2008 | | 2007 | | 2008 | | 2007 |
Interest Income | | | | | | | | | | | | |
Interest and fees on loans | | $ | 49,724 | | $ | 43,057 | | $ | 24,410 | | $ | 21,558 |
Interest on securities | | | 13,861 | | | 10,295 | | | 7,037 | | | 5,132 |
Other interest income | | | 1,455 | | | 818 | | | 684 | | | 491 |
| | | | | | | | | | | | |
Total interest income | | | 65,040 | | | 54,170 | | | 32,131 | | | 27,181 |
| | | | | | | | | | | | |
Interest Expense | | | | | | | | | | | | |
Interest on deposits | | | 16,501 | | | 18,652 | | | 7,559 | | | 9,182 |
Interest on other borrowings | | | 12,035 | | | 9,563 | | | 5,983 | | | 5,073 |
Interest on junior subordinated debentures | | | 1,443 | | | 1,181 | | | 691 | | | 594 |
| | | | | | | | | | | | |
Total interest expense | | | 29,979 | | | 29,396 | | | 14,233 | | | 14,849 |
| | | | | | | | | | | | |
Net interest income | | | 35,061 | | | 24,774 | | | 17,898 | | | 12,332 |
| | | | |
Provision for Loan and Lease Losses | | | 950 | | | 100 | | | 450 | | | — |
| | | | | | | | | | | | |
Net interest income after provision for loan and lease losses | | | 34,111 | | | 24,674 | | | 17,448 | | | 12,332 |
| | | | | | | | | | | | |
Non-interest Income | | | | | | | | | | | | |
Service charges on deposit accounts | | | 2,692 | | | 1,744 | | | 1,465 | | | 899 |
Other service charges and fees | | | 1,335 | | | 878 | | | 696 | | | 451 |
Income from fiduciary services | | | 3,378 | | | 2,428 | | | 1,701 | | | 1,229 |
Life insurance earnings | | | 578 | | | 385 | | | 285 | | | 197 |
Other income | | | 1,072 | | | 816 | | | 505 | | | 431 |
| | | | | | | | | | | | |
Total non-interest income | | | 9,055 | | | 6,251 | | | 4,652 | | | 3,207 |
| | | | | | | | | | | | |
Non-interest Expenses | | | | | | | | | | | | |
Salaries and employee benefits | | | 13,051 | | | 9,285 | | | 6,399 | | | 4,639 |
Premises and fixed assets | | | 3,915 | | | 2,495 | | | 1,974 | | | 1,263 |
Amortization of core deposit intangible | | | 504 | | | 428 | | | 194 | | | 214 |
Other expenses | | | 6,704 | | | 4,856 | | | 3,346 | | | 2,383 |
| | | | | | | | | | | | |
Total non-interest expenses | | | 24,174 | | | 17,064 | | | 11,913 | | | 8,499 |
| | | | | | | | | | | | |
Income before income taxes | | | 18,992 | | | 13,861 | | | 10,187 | | | 7,040 |
Income Taxes | | | 5,691 | | | 4,136 | | | 3,080 | | | 2,097 |
| | | | | | | | | | | | |
Net Income | | $ | 13,301 | | $ | 9,725 | | $ | 7,107 | | $ | 4,943 |
| | | | | | | | | | | | |
Per Share Data | | | | | | | | | | | | |
Basic earnings per share | | $ | 1.73 | | $ | 1.47 | | $ | 0.92 | | $ | 0.75 |
Diluted earnings per share | | | 1.73 | | | 1.47 | | | 0.92 | | | 0.75 |
Cash dividends per share | | $ | 0.49 | | $ | 0.48 | | $ | 0.25 | | $ | 0.24 |
Weighted average number of shares outstanding | | | 7,694,326 | | | 6,601,741 | | | 7,695,798 | | | 6,582,291 |
Tangible book value per share (1) | | $ | 16.16 | | $ | 15.78 | | | | | | |
| (1) | Computed by dividing total shareholders' equity less goodwill and other intangible assets by the number of common shares outstanding. |