| Serving Hawaii Investors For More Than 25 Years Hawaiian Tax-Free Trust “Getting All the Pieces to Fit” | |
May, 2011
Dear Fellow Shareholder:
Like a jigsaw puzzle piece, Hawaiian Tax-Free Trust’s portfolio management team must decide whether any municipal bond under consideration for addition to the Trust’s portfolio has the potential to fit correctly into place. Otherwise, the addition might distort the overall picture.
Specifically, any bond under consideration must “fit” in terms of the principal amount, quality, maturity, liquidity and sector diversification.
For example, let’s say the Trust has $500,000 to invest. The portfolio management team must first find bonds available for purchase in the marketplace within that size range. Then, it must be decided whether to purchase one bond for the full amount of $500,000, several $100,000 offerings or some other combination. If the portfolio already possesses a significant holding in “Issuer A,” the portfolio management team may decide to purchase a smaller additional offering so as not to overweight the portfolio in that particular issuer.
The bonds available for purchase must also be looked at in terms of quality, maturity and sector diversification. As you know, the municipal bonds in Hawaiian Tax-Free Trust must be rated investment grade – within the top four credit ratings assigned by a Nationally Recognized Statistical Rating Organization (NRSRO) like Moody’s or Standard & Poor’s – or, if unrated, must be determined to be of comparable quality. The portfolio is also managed to have an intermediate maturity (as of March 31, 2011, the Trust’s average maturity was 9.14 years) and a reasonable degree of diversification among varying projects.
So, if both a transportation and a school bond are available with identical maturities and quality rating, the portfolio management team may decide for sector diversification purposes to purchase the transportation bond if the portfolio already contains a sufficient amount of school bonds.
NOT A PART OF THE ANNUAL REPORT
The last piece of the puzzle is an ongoing attempt to keep the overall portfolio functioning smoothly, such that when one bond is removed, another complementary one is sought in an effort to keep the “picture just right”.
Sincerely,
 Lacy B. Herrmann Founder and Chairman Emeritus | |  Diana P. Herrmann Vice Chair and President |
Consideration should be given to the risks of investing, including: potential loss of value, market risk, interest rate risk, credit risk, and geographic concentration. Past performance does not guarantee future results. Investment return and principal value will fluctuate so that an investor’s shares, when redeemed, may be worth more or less than their original cost. For certain investors, some dividends may be subject to Federal and state taxes, including the Alternative Minimum Tax (AMT).
NOT A PART OF THE ANNUAL REPORT
| Serving Hawaii Investors for More Than 25 Years Hawaiian Tax-Free Trust ANNUAL REPORT Management Discussion | |
U.S. Economy
At the start of 2010, there was relatively high uncertainty about the path of the U.S. economy for the year, with forecasts ranging from quarters of 5%+ GDP growth, to a double-dip recession scenario, and the slow growth consensus view falling in between. The GDP results for 4Q-2009 and 1Q-2010 started the economy on solid footing, but the European sovereign debt crisis in early May highlighted the fragility of the global recovery. Economic growth slowed and expectations were revised downward. On the whole for 2010, GDP growth generally finished in line with the slow growth consensus view, successfully avoiding the “double-dip” scenario.
In 2010, while the unemployment rate improved slightly better than consensus expectations, the rate remained well above the 9% level and equated to 1.1 million jobs, which is still far short of the 7 million jobs that were lost in the last recession.
Looking forward, we expect to see continued slow growth for the U.S. economy as corporations are generally in pretty good shape from an earnings and balance sheet standpoint, and private sector jobs continue to be added at a gradual pace. Potential headwinds may come from ongoing Euro-area debt concerns as well as increased food and energy prices, as growth outside the U.S. in the emerging markets continues at a more rapid pace than within the more developed economies.
Hawaii Economy
The economy continues to slowly improve in Hawaii as well. The state unemployment rate has been regularly running well below the national average starting 2010 at 6.9% and dropping to 6.3% in June, but then the rate remained stuck at 6.4% through December of 2010 and it is forecasted to gradually improve to 6% in 2011. It is important to note, however, that most of the improvements in the employment picture have been in Honolulu County (island of Oahu) while any neighbor island recovery has lagged. Tourism for the state saw a substantial rebound in 2010. The increased visitor traffic has led to a sharp increase in visitor spending. In 2010, visitor expenditures were nearly 16% higher than in 2009. Spending by visitors from the U.S. mainland was up more than 12%, and a dramatic increase of more than 50% occurred in the combined spending by visitors from other international markets, including Korea, Australia, and Europe.
The tragic events in Japan related to the earthquake and tsunami in March of 2011 has initially led to a decrease in arrivals from Japan between 20-30% year over year, which may be partially offset by growth in arrivals from other markets, such that the full year growth in tourism for 2011 is expected to remain at a small positive.
Municipal Market and Fund Performance
The spot year over year changes in the municipal curve as of March 31, 2011, had the short end of the yield curve dropping from an already low yield of 0.39% down to 0.35% while 30-year municipal rates increased from 4.46% to 4.82%. Short rates lowered due to ongoing impacts from the near 0% overnight Federal Funds rate and demand for short term bonds. While at the longer end, rates backed up with the expiration of the Build America Bond (BAB) program (generally long-term taxable municipal bonds) that raised concerns about who will now be the largest buyers of long term municipal debt.
Management Discussion (continued)
In addition to the expiration of the BAB program, at year end 2010, there was the passage of the tax bill which included a provision to keep federal income tax rates as is for two more years as opposed to an increase in rates as had been anticipated. Naturally, an increase in federal rates would make tax-exempt municipal bonds more attractive at the margin. Finally, also at year end, some concerns were raised about municipal budgetary challenges and whether this could lead to widespread municipal defaults. While most municipal and fixed income participants (ourselves included) consider the possibility of immediate and widespread municipal defaults as unrealistic, the comments at least raised broader awareness of the municipal market and possibly helped garner some political support necessary to make the tough decisions that are needed to balance budgets.
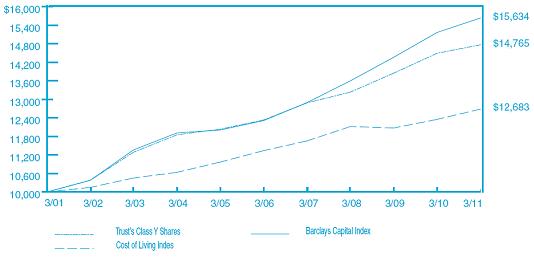
Hawaiian Tax-Free Trust had a total return, without sales charges, of 1.64% for its Class A shares, 0.83% for Class C shares, and 1.85% for Class Y shares for the calendar year ending December 31, 2010. For the fiscal year ending March 31, 2011, the total return, without sales charges, was 1.69% for Class A shares, 0.79% for Class C shares, and 1.89% for Class Y shares. Total return reflects the market fluctuation of the share price as well as reinvested dividends. The Barclays Capital Intermediate Municipal Bond Index, which is nationally oriented and does not include operating expenses nor sales charges, had a total return of 3.21% for the calendar year 2010, and 3.09% for the Trust’s fiscal year.
We are pleased to note that Hawaiian Tax-Free Trust has experienced much less volatility and better risk adjusted performance than other Hawaii municipal bond funds over the past three years during this highly volatile period in the financial markets. We believe this is a result of our prudent investment management.
Outlook and Strategy
The economy has been on a consistently positive, albeit slow recovery following the recession. An important factor going forward will be whether the economy can continue to grow on its own as the effects of the stimulus wear off and/or are removed.
In managing Hawaiian Tax-Free Trust, we keep in mind the Trust’s goal to provide as high a level of double tax-free income as is consistent with principal preservation. Accordingly, we continually seek to manage the Trust conservatively both in terms of credit quality and interest rate risk by investing primarily in highly rated municipal bonds with intermediate maturities. So far in 2011, supply of new issuance of municipal bonds into the market is running well behind prior recent years. If this continues throughout the year, rates may stay contained or slightly decrease, but if a larger wave of supply arrives, it might at least temporarily push long term rates higher. The portfolio is currently balanced and we believe we are prepared to adjust to either scenario.
Performance data represents past performance, but does not guarantee future results. Investment return and principal value will fluctuate; shares, when redeemed, may be worth more or less than their original cost; current performance may be lower or higher than the data presented. NOT FDIC INSURED - NO BANK GUARANTEE - MAY LOSE VALUE
PERFORMANCE REPORT
The following graph illustrates the value of $10,000 invested in the Class Y shares of Hawaiian Tax-Free Trust for the 10-year period ended March 31, 2011 as compared with the Barclays Capital Quality Intermediate Municipal Bond Index (the “Barclays Capital Index”) and the Consumer Price Index (a cost of living index). The performance of each of the other classes is not shown in the graph but is included in the table below. In prior “Performance Reports”, Class A shares performance was graphed. The chart below now shows Class Y shares which is consistent with the bar chart disclosure in the Trust’s prospectus. It should be noted that the Barclays Capital Index does not include any operating expenses nor sales charges, and being nationally oriented, does not reflect state specific bond market performance.
| | | Average Annual Total Return | |
| | | for periods ended March 31, 2011 | |
| | | | | | | | | | | | Since | |
| Class and Inception Date | | 1 Year | | | 5 Years | | | 10 Years | | | Inception | |
| Class A (commenced operations on 2/20/85) | | | | | | | | | | | | |
| With Maximum Sales Charge | | | (2.36 | )% | | | 2.62 | % | | | 3.35 | % | | | 5.86 | % |
| Without Sales Charge | | | 1.69 | | | | 3.46 | | | | 3.77 | | | | 6.02 | |
| Class C (commenced operations on 4/01/96) | | | | | | | | | | | | | | | | |
| With CDSC | | | (0.22 | ) | | | 2.63 | | | | 2.94 | | | | 3.47 | |
| Without CDSC | | | 0.79 | | | | 2.63 | | | | 2.94 | | | | 3.47 | |
| Class Y (commenced operations on 4/01/96) | | | | | | | | | | | | | | | | |
| No Sales Charge | | | 1.89 | | | | 3.67 | | | | 3.97 | | | | 4.67 | |
| Barclays Capital Index | | | 3.09 | | | | 4.89 | | | | 4.57 | | | | 5.76 | * (Class A) |
| | | | | | | | | | | | | | | | 4.99 | (Class C&Y) |
* From commencement of the index on 1/1/87.
Total return figures shown for the Trust reflect any change in price and assume all distributions within the period were invested in additional shares. Returns for Class A shares are calculated with and without the effect of the initial 4% maximum sales charge. Returns for Class C shares are calculated with and without the effect of the 1% contingent deferred sales charge (CDSC) imposed on redemptions made within the first 12 months after purchase. Class Y shares are sold without any sales charge. The rates of return will vary and the principal value of an investment will fluctuate with market conditions. Shares, if redeemed, may be worth more or less than their original cost. A portion of each class’s income may be subject to Federal and state income taxes and/or the Federal Alternative Minimum Tax. Past performance is not predictive of future investment results.
REPORT OF INDEPENDENT REGISTERED PUBLIC ACCOUNTING FIRM
To the Board of Trustees and Shareholders of
Hawaiian Tax-Free Trust:
We have audited the accompanying statement of assets and liabilities, including the schedule of investments, of Hawaiian Tax-Free Trust as of March 31, 2011 and the related statement of operations for the year then ended, the statements of changes in net assets for each of the two years in the period then ended, and the financial highlights for each of the five years in the period then ended. These financial statements and financial highlights are the responsibility of the Trust’s management. Our responsibility is to express an opinion on these financial statements and financial highlights based on our audits.
We conducted our audits in accordance with the standards of the Public Company Accounting Oversight Board (United States). Those standards require that we plan and perform the audit to obtain reasonable assurance about whether the financial statements and financial highlights are free of material misstatement. The Trust is not required to have, nor were we engaged to perform, an audit of the Trust’s internal control over financial reporting. Our audits included consideration of internal control over financial reporting as a basis for designing audit procedures that are appropriate in the circumstances, but not for the purpose of expressing an opinion on the effectiveness of the Trust’s internal control over financial reporting. Accordingly, we express no such opinion. An audit also includes examining, on a test basis, evidence supporting the amounts and disclosures in the financial statements. Our procedures included confirmation of securities owned as of March 31, 2011, by correspondence with the custodian. An audit also includes assessing the accounting principles used and significant estimates made by management, as well as evaluating the overall financial statement presentation. We believe that our audits provide a reasonable basis for our opinion.
In our opinion, the financial statements and financial highlights referred to above present fairly, in all material respects, the financial position of Hawaiian Tax-Free Trust as of March 31, 2011, the results of its operations for the year then ended, the changes in its net assets for each of the two years in the period then ended, and the financial highlights for each of the five years in the period then ended, in conformity with accounting principles generally accepted in the United States of America.
TAIT, WELLER & BAKER LLP
Philadelphia, Pennsylvania
May 27, 2011
HAWAIIAN TAX-FREE TRUST
SCHEDULE OF INVESTMENTS
MARCH 31, 2011
| | | | | Rating | | | |
| Principal | | | | Moody’s/S&P | | | |
| Amount | | Municipal Bonds (98.2%) | | (unaudited) | | Value | |
| | |
| | | General Obligation Bonds (60.9%) | | | | | |
| | | City and County of Honolulu, Hawaii | | | | | |
| $ | 5,000,000 | | 5.000%, 09/01/19 Series F | | Aa1/NR*** | | $ | 5,706,050 | |
| | 5,000,000 | | 5.000%, 09/01/20 | | Aa1/NR*** | | | 5,623,250 | |
| | 3,500,000 | | 5.250%, 09/01/26 | | Aa1/NR*** | | | 3,762,990 | |
| | 3,820,000 | | 5.250%, 09/01/27 | | Aa1/NR*** | | | 4,073,572 | |
| | 7,390,000 | | 5.250%, 09/01/28 Series D | | Aa1/NR*** | | | 7,832,365 | |
| | 8,585,000 | | 5.250%, 09/01/30 | | Aa1/NR*** | | | 8,982,228 | |
| | 9,105,000 | | 5.250%, 09/01/31 | | Aa1/NR*** | | | 9,468,289 | |
| | | | City and County of Honolulu, Hawaii, Board of Water | | | | |
| | | | Supply System, Refunding Series A, NPFG Insured | | | | |
| | 3,010,000 | | 4.750%, 07/01/31 | | Aa2/AA | | | 2,986,582 | |
| | | | City and County of Honolulu, Hawaii, FGIC Insured | | | | |
| | 7,720,000 | | 5.000%, 07/01/21 | | Aa1/NR*** | | | 8,279,005 | |
| | | | City and County of Honolulu, Hawaii, NPFG Insured | | | | |
| | 8,500,000 | | 5.000%, 07/01/17 | | Aa1/NR*** | | | 9,343,370 | |
| | | | City and County of Honolulu, Hawaii, NPFG FGIC | | | | |
| | | | Insured | | | | | | |
| | 8,270,000 | | 5.000%, 07/01/21 | | Aa1/NR*** | | | 8,868,831 | |
| | 1,000,000 | | 5.000%, 07/01/22 | | Aa1/NR*** | | | 1,068,730 | |
| | | | City and County of Honolulu, Hawaii, Refunding, | | | | |
| | | | Series A | | | | | | |
| | 7,000,000 | | 5.000%, 04/01/27 | | Aa1/NR*** | | | 7,337,960 | |
| | 8,105,000 | | 5.000%, 07/01/27 | | Aa1/NR*** | | | 8,370,844 | |
| | | | City and County of Honolulu, Hawaii Refunding, | | | | |
| | | | Series B | | | | | | |
| | 5,000,000 | | 5.000%, 12/01/30 | | Aa1/NR*** | | | 5,150,300 | |
| | 3,000,000 | | 5.000%, 12/01/33 | | Aa1/NR*** | | | 3,029,580 | |
| | 5,000,000 | | 4.750%, 12/01/35 | | Aa1/NR*** | | | 4,809,950 | |
| | | | City and County of Honolulu, Hawaii Refunding, | | | | |
| | | | Series F, NPFG FGIC Insured | | | | |
| | 1,500,000 | | 5.000%, 07/01/28 | | Aa1/NR*** | | | 1,538,445 | |
HAWAIIAN TAX-FREE TRUST
SCHEDULE OF INVESTMENTS (continued)
MARCH 31, 2011
| | | | | Rating | | | |
| Principal | | | | Moody’s/S&P | | | |
| Amount | | General Obligation Bonds (continued) | | (unaudited) | | Value | |
| | |
| | | City and County of Honolulu, Hawaii, Series A 1993, | | | | | |
| | | FGIC - TCRS Insured, Escrowed to Maturity, | | | | | |
| | | Collateral: U.S. Government Securities | | | | | |
| $ | 920,000 | | 6.000%, 01/01/12 | | #Aaa/NR | | $ | 958,392 | |
| | | | City and County of Honolulu, Hawaii Series A 1994, | | | | | | |
| | | | FGIC Insured, Escrowed to Maturity, Collateral: | | | | | | |
| | | | U.S. Government Securities | | | | | | |
| | 3,995,000 | | 5.750%, 04/01/11 | | #Aaa/NR | | | 3,995,584 | |
| | 775,000 | | 5.750%, 04/01/13 | | Aaa/NR | | | 852,818 | |
| | | | City and County of Honolulu, Hawaii, Series A 2003, | | | | | | |
| | | | NPFG Insured, Unrefunded Portion | | | | | | |
| | 1,115,000 | | 5.250%, 03/01/15 | | Aa1/NR*** | | | 1,192,370 | |
| | 1,775,000 | | 5.250%, 03/01/17 | | Aa1/NR*** | | | 1,884,021 | |
| | 745,000 | | 5.250%, 03/01/18 | | Aa1/NR*** | | | 789,171 | |
| | | | City and County of Honolulu, Hawaii, Series A, | | | | | | |
| | | | AGM Insured | | | | | | |
| | 3,000,000 | | 5.000%, 07/01/29 | | Aa1/AA+ | | | 3,078,960 | |
| | | | City and County of Honolulu, Hawaii, Series A, AGM | | | | | | |
| | | | Insured, Prerefunded to 09/01/11 @100, Collateral: | | | | | | |
| | | | U.S. Treasury Obligations & Resolution Funding | | | | | | |
| | | | Corporation | | | | | | |
| | 3,500,000 | | 5.375%, 09/01/18 | | Aa1/AA+ | | | 3,570,910 | |
| | 2,000,000 | | 5.125%, 09/01/20 | | Aa1/AA+ | | | 2,038,500 | |
| | | | City and County of Honolulu, Hawaii, Series A, | | | | | | |
| | | | FGIC-TCRS Insured | | | | | | |
| | 1,580,000 | | 6.000%, 01/01/12 | | Aa1/NR | | | 1,645,681 | |
| | 3,025,000 | | 5.750%, 04/01/13 | | Aa1/NR | | | 3,314,190 | |
| | | | City and County of Honolulu, Hawaii, Series A, | | | | | | |
| | | | NPFG FGIC Insured, Unrefunded Portion | | | | | | |
| | 5,000 | | 5.750%, 04/01/11 | | Aa1/NR | | | 5,001 | |
| | | | City and County of Honolulu, Hawaii, Series A, | | | | | | |
| | | | NPFG Insured | | | | | | |
| | 5,000,000 | | 5.000%, 07/01/21 | | Aa1/NR*** | | | 5,347,750 | |
| | 5,000,000 | | 5.000%, 07/01/22 | | Aa1/NR*** | | | 5,242,550 | |
| | 12,000,000 | | 5.000%, 07/01/28 | | Aa1/NR*** | | | 12,205,200 | |
HAWAIIAN TAX-FREE TRUST
SCHEDULE OF INVESTMENTS (continued)
MARCH 31, 2011
| | | | | Rating | | | |
| Principal | | | | Moody’s/S&P | | | |
| Amount | | General Obligation Bonds (continued) | | (unaudited) | | Value | |
| | |
| | | City and County of Honolulu, Hawaii, Series A, | | | | | |
| | | NPFG Insured (continued) | | | | | |
| $ | 7,000,000 | | 5.000%, 07/01/29 | | Aa1/NR*** | | $ | 7,092,750 | |
| | | | City and County of Honolulu, Hawaii, Series A, NPFG | | | | | | |
| | | | Insured, Prerefunded to 03/01/13 @100, Collateral: | | | | | | |
| | | | U.S. Government Securities | | | | | | |
| | 1,885,000 | | 5.250%, 03/01/15 | | NR/AAA | | | 2,048,561 | |
| | 3,005,000 | | 5.250%, 03/01/17 | | NR/AAA | | | 3,265,744 | |
| | 1,255,000 | | 5.250%, 03/01/18 | | NR/AA | | | 1,363,896 | |
| | | | City and County of Honolulu, Hawaii, Series A, | | | | | | |
| | | | Prerefunded to 09/01/11 @100 | | | | | | |
| | 5,000,000 | | 5.250%, 09/01/22 | | Aa1/AA+ | | | 5,098,750 | |
| | | | City and County of Honolulu, Hawaii, Series A, | | | | | | |
| | | | Refunding | | | | | | |
| | 2,000,000 | | 5.250%, 04/01/17 | | Aa1/NR*** | | | 2,319,840 | |
| | 5,000,000 | | 5.000%, 04/01/19 | | Aa1/NR*** | | | 5,705,650 | |
| | 3,930,000 | | 5.000%, 04/01/20 | | Aa1/NR*** | | | 4,387,059 | |
| | | | City and County of Honolulu, Hawaii, Series B, | | | | | | |
| | | | FGIC-TCRS Insured, Unrefunded Portion | | | | | | |
| | 7,310,000 | | 5.500%, 10/01/11 | | Aa1/NR | | | 7,495,162 | |
| | | | City and County of Honolulu, Hawaii, Series C, | | | | | | |
| | | | NPFG Insured | | | | | | |
| | 6,740,000 | | 5.000%, 07/01/18 | | Aa1/NR*** | | | 7,382,187 | |
| | | | City and County of Honolulu, Hawaii, Series D, | | | | | | |
| | | | AGM Insured | | | | | | |
| | 2,595,000 | | 5.000%, 07/01/22 | | Aa1/AA+ | | | 2,720,883 | |
| | | | City and County of Honolulu, Hawaii, Series D, | | | | | | |
| | | | NPFG Insured | | | | | | |
| | 3,750,000 | | 5.000%, 07/01/19 | | Aa1/NR*** | | | 4,083,712 | |
| | 6,080,000 | | 5.000%, 07/01/21 | | Aa1/NR*** | | | 6,502,864 | |
| | | | City and County of Honolulu, Hawaii, Series F, | | | | | | |
| | | | NPFG FGIC Insured | | | | | | |
| | 1,000,000 | | 5.250%, 07/01/19 | | Aa1/NR*** | | | 1,097,660 | |
| | 5,335,000 | | 5.250%, 07/01/20 | | Aa1/NR*** | | | 5,795,944 | |
HAWAIIAN TAX-FREE TRUST
SCHEDULE OF INVESTMENTS (continued)
MARCH 31, 2011
| | | | | Rating | | | |
| Principal | | | | Moody’s/S&P | | | |
| Amount | | General Obligation Bonds (continued) | | (unaudited) | | Value | |
| | |
| | | City and County of Honolulu, Hawaii, Water Utility | | | | | |
| | | Refunding and Improvement, Escrowed to Maturity, | | | | | |
| | | FGIC Insured, Collateral: U.S. Government Securities | | | | | |
| $ | 1,125,000 | | 6.000%, 12/01/12 | | Aa2/NR | | $ | 1,226,092 | |
| | 1,050,000 | | 6.000%, 12/01/15 | | Aa2/NR | | | 1,258,015 | |
| | | | County of Hawaii | | | | | | |
| | 1,890,000 | | 5.500%, 07/15/22 | | Aa2/AA- | | | 2,112,869 | |
| | 2,245,000 | | 5.500%, 07/15/23 | | Aa2/AA- | | | 2,499,112 | |
| | 1,990,000 | | 5.750%, 07/15/24 | | Aa2/AA- | | | 2,219,845 | |
| | 2,370,000 | | 5.750%, 07/15/25 | | Aa2/AA- | | | 2,620,035 | |
| | 3,585,000 | | 6.000%, 07/15/27 | | Aa2/AA- | | | 3,990,535 | |
| | | | County of Hawaii, FGIC Insured, Prerefunded to | | | | | | |
| | | | 07/15/11 @100 | | | | | | |
| | 1,065,000 | | 5.500%, 07/15/14 | | Aa2/AA- | | | 1,080,453 | |
| | 1,340,000 | | 5.500%, 07/15/15 | | Aa2/AA- | | | 1,359,443 | |
| | | | County of Hawaii, NPFG Insured | | | | | | |
| | 2,010,000 | | 5.250%, 07/15/21 | | Aa2/AA- | | | 2,176,890 | |
| | | | County of Hawaii, Series A, AMBAC Insured | | | | | | |
| | 1,900,000 | | 5.000%, 07/15/17 | | Aa2/AA- | | | 2,170,769 | |
| | | | County of Hawaii, Series A | | | | | | |
| | 2,870,000 | | 5.000%, 03/01/29 | | Aa2/AA- | | | 2,995,620 | |
| | 1,085,000 | | 5.000%, 03/01/30 | | Aa2/AA- | | | 1,126,816 | |
| | | | County of Hawaii, Series A, AGM Insured | | | | | | |
| | 1,000,000 | | 5.000%, 07/15/16 | | Aa2/AA+ | | | 1,075,500 | |
| | 2,000,000 | | 5.000%, 07/15/17 | | Aa2/AA+ | | | 2,144,940 | |
| | 1,000,000 | | 5.000%, 07/15/18 | | Aa2/AA+ | | | 1,067,600 | |
| | | | County of Hawaii, Series A, CIFG Insured | | | | | | |
| | 1,850,000 | | 5.000%, 07/15/20 | | Aa2/AA- | | | 1,996,446 | |
| | | | County of Hawaii, Series A, NPFG FGIC Insured | | | | | | |
| | 4,905,000 | | 5.600%, 05/01/11 | | Aa2/AA- | | | 4,925,814 | |
| | 1,000,000 | | 5.600%, 05/01/12 | | Aa2/AA- | | | 1,053,350 | |
| | 1,000,000 | | 5.600%, 05/01/13 | | Aa2/AA- | | | 1,095,840 | |
HAWAIIAN TAX-FREE TRUST
SCHEDULE OF INVESTMENTS (continued)
MARCH 31, 2011
| | | | | Rating | | | |
| Principal | | | | Moody’s/S&P | | | |
| Amount | | General Obligation Bonds (continued) | | (unaudited) | | Value | |
| | |
| | | County of Hawaii, Series A, FGIC Insured, | | | | | |
| | | Prerefunded to 07/15/11 @100 Collateral: State | | | | | |
| | | and Local Government Securities | | | | | |
| $ | 1,465,000 | | 5.500%, 07/15/16 | | Aa2/AA- | | $ | 1,486,257 | |
| | 1,025,000 | | 5.125%, 07/15/20 | | Aa2/AA- | | | 1,038,807 | |
| | | | County of Kauai, Hawaii, 2005-Series A, NPFG | | | | | | |
| | | | FGIC Insured | | | | | | |
| | 1,560,000 | | 5.000%, 08/01/16 | | Aa2/AA | | | 1,744,579 | |
| | 2,010,000 | | 5.000%, 08/01/17 | | Aa2/AA | | | 2,240,768 | |
| | 2,060,000 | | 5.000%, 08/01/18 | | Aa2/AA | | | 2,289,237 | |
| | 1,400,000 | | 5.000%, 08/01/19 | | Aa2/AA | | | 1,549,156 | |
| | | | County of Kauai, Hawaii, NPFG Insured, | | | | | | |
| | | | Prerefunded to 08/01/11 @100, Collateral: State | | | | | | |
| | | | & Local Government Series 100% | | | | | | |
| | 140,000 | | 5.625%, 08/01/13 | | NR/AA | | | 142,412 | |
| | 560,000 | | 5.625%, 08/01/14 | | NR/AA | | | 569,649 | |
| | 355,000 | | 5.625%, 08/01/17 | | NR/AA | | | 361,117 | |
| | 345,000 | | 5.625%, 08/01/18 | | NR/AA | | | 350,944 | |
| | 805,000 | | 5.500%, 08/01/20 | | NR/AA | | | 818,548 | |
| | | | County of Kauai, Hawaii, NPFG Insured, | | | | | | |
| | | | Unrefunded Portion | | | | | | |
| | 985,000 | | 5.625%, 08/01/13 | | Baa1/AA | | | 999,086 | |
| | 1,060,000 | | 5.625%, 08/01/14 | | Baa1/AA | | | 1,074,384 | |
| | 680,000 | | 5.625%, 08/01/17 | | Baa1/AA | | | 688,629 | |
| | 655,000 | | 5.625%, 08/01/18 | | Baa1/AA | | | 662,945 | |
| | 1,555,000 | | 5.500%, 08/01/20 | | Baa1/AA | | | 1,572,323 | |
| | | | County of Kauai, Hawaii, Series A, NPFG FGIC | | | | | | |
| | | | Insured | | | | | | |
| | 1,000,000 | | 5.000%, 08/01/23 | | Aa2/AA | | | 1,053,480 | |
| | 1,555,000 | | 5.000%, 08/01/24 | | Aa2/AA | | | 1,629,282 | |
| | 1,500,000 | | 5.000%, 08/01/25 | | Aa2/AA | | | 1,563,150 | |
| | 1,000,000 | | 5.000%, 08/01/28 | | Aa2/AA | | | 1,030,070 | |
| | 1,000,000 | | 5.000%, 08/01/29 | | Aa2/AA | | | 1,026,490 | |
| | | | County of Maui, Hawaii, NPFG Insured | | | | | | |
| | 1,250,000 | | 3.800%, 03/01/16 | | Aa1/AA+ | | | 1,309,613 | |
| | 1,105,000 | | 5.000%, 03/01/19 | | Aa1/AA+ | | | 1,194,317 | |
HAWAIIAN TAX-FREE TRUST
SCHEDULE OF INVESTMENTS (continued)
MARCH 31, 2011
| | | | | Rating | | | |
| Principal | | | | Moody’s/S&P | | | |
| Amount | | General Obligation Bonds (continued) | | (unaudited) | | Value | |
| | |
| | | County of Maui, Hawaii, 2002 - Series A, NPFG | | | | | |
| | | Insured, Prerefunded to 03/01/12 @100, Collateral: | | | | | |
| | | U.S. Government Securities | | | | | |
| $ | 1,105,000 | | 5.250%, 03/01/15 | | NR/AA+ | | $ | 1,154,007 | |
| | 1,205,000 | | 5.250%, 03/01/16 | | NR/AA+ | | | 1,258,442 | |
| | 1,000,000 | | 5.250%, 03/01/18 | | NR/AA+ | | | 1,044,350 | |
| | 1,750,000 | | 5.250%, 03/01/19 | | NR/AA+ | | | 1,827,613 | |
| | 1,000,000 | | 5.000%, 03/01/20 | | NR/AA+ | | | 1,042,100 | |
| | | | County of Maui, Hawaii, Series A, NPFG Insured | | | | | | |
| | 1,165,000 | | 4.375%, 07/01/19 | | Aa1/AA+ | | | 1,240,911 | |
| | | | County of Maui, Hawaii, Refunding, Series A, B & C, | | | | | | |
| | | | NPFG Insured | | | | | | |
| | 1,000,000 | | 5.000%, 03/01/18 | | Aa1/AA+ | | | 1,085,850 | |
| | | | County of Maui, Hawaii, Refunding, Series B | | | | | | |
| | 3,950,000 | | 4.000%, 06/01/19 | | Aa1/AA+ | | | 4,224,920 | |
| | 4,620,000 | | 4.000%, 06/01/20 | | Aa1/AA+ | | | 4,903,622 | |
| | 2,385,000 | | 4.000%, 06/01/21 | | Aa1/AA+ | | | 2,479,541 | |
| | | | State of Hawaii | | | | | | |
| | 6,285,000 | | 5.000%, 05/01/19 | | Aa1/AA | | | 7,110,472 | |
| | | | State of Hawaii, Prerefunded to 08/01/11 @100 | | | | | | |
| | 3,230,000 | | 5.250%, 08/01/21 | | Aa1/AA | | | 3,281,745 | |
| | | | State of Hawaii, Prerefunded to 02/01/12 @100 | | | | | | |
| | 1,050,000 | | 5.500%, 02/01/21 | | Aa1/AA+ | | | 1,094,447 | |
| | | | State of Hawaii, Prerefunded to 05/01/18 @100 | | | | | | |
| | 715,000 | | 5.000%, 05/01/19 | | NR/NR* | | | 833,726 | |
| | | | State of Hawaii, AGM Insured | | | | | | |
| | 1,450,000 | | 5.500%, 02/01/21 | | Aa1/AA+ | | | 1,496,937 | |
| | | | State of Hawaii, AMBAC Insured | | | | | | |
| | 5,000,000 | | 5.000%, 07/01/16 | | Aa1/AA | | | 5,602,250 | |
| | | | State of Hawaii, NPFG Insured | | | | | | |
| | 3,895,000 | | 5.000%, 08/01/20 | | Aa1/AA | | | 3,935,118 | |
| | 1,770,000 | | 5.250%, 08/01/21 | | Aa1/AA | | | 1,792,532 | |
| | 5,000,000 | | 5.000%, 10/01/22 | | Aa1/AA | | | 5,358,050 | |
| | | | State of Hawaii, NPFG FGIC Insured | | | | | | |
| | 2,330,000 | | 6.000%, 12/01/12 | | Aa1/AA | | | 2,534,504 | |
HAWAIIAN TAX-FREE TRUST
SCHEDULE OF INVESTMENTS (continued)
MARCH 31, 2011
| | | | | Rating | | | |
| Principal | | | | Moody’s/S&P | | | |
| Amount | | General Obligation Bonds (continued) | | (unaudited) | | Value | |
| | |
| | | State of Hawaii, Series BZ, NPFG FGIC Insured | | | | | |
| $ | 3,700,000 | | 6.000%, 10/01/11 | | Aa1/AA | | $ | 3,802,749 | |
| | 3,500,000 | | 6.000%, 10/01/12 | | Aa1/AA | | | 3,778,075 | |
| | | | State of Hawaii, Series CH | | | | | | |
| | 1,000,000 | | 4.750%, 11/01/11 | | Aa1/AA | | | 1,024,780 | |
| | | | State of Hawaii, Series CM, NPFG FGIC Insured | | | | | | |
| | 3,000,000 | | 6.500%, 12/01/15 | | Aa1/AA | | | 3,613,470 | |
| | | | State of Hawaii , Series CV, Prerefunded to 08/01/11 | | | | | | |
| | | | @100 | | | | | | |
| | 7,105,000 | | 5.000%, 08/01/20 | | Aa1/AA | | | 7,213,138 | |
| | | | State of Hawaii , Series CV, NPFG FGIC Insured | | | | | | |
| | 1,015,000 | | 5.000%, 08/01/21 | | Aa1/AA | | | 1,025,120 | |
| | | | State of Hawaii , Series CX, AGM Insured, | | | | | | |
| | | | Prerefunded 02/01/12 @ 100 | | | | | | |
| | 8,725,000 | | 5.500%, 02/01/13 | | Aa1/AA+ | | | 9,094,329 | |
| | | | State of Hawaii , Series CX, AGM Insured, | | | | | | |
| | | | Unrefunded Balance | | | | | | |
| | 3,075,000 | | 5.500%, 02/01/16 | | Aa1/AA+ | | | 3,186,684 | |
| | | | State of Hawaii, Series CZ, Prerefunded to 07/01/12 | | | | | | |
| | | | @100 | | | | | | |
| | 2,000,000 | | 5.250%, 07/01/15 | | Aa1/AA+ | | | 2,118,960 | |
| | | | State of Hawaii, Series CZ, AGM Insured | | | | | | |
| | | | Prerefunded to 07/01/12 @100, Collateral: U.S. | | | | | | |
| | | | Government Securities | | | | | | |
| | 3,000,000 | | 5.250%, 07/01/17 | | Aa1/AA+ | | | 3,178,440 | |
| | | | State of Hawaii, Series DD, NPFG Insured | | | | | | |
| | 5,000,000 | | 5.250%, 05/01/23 | | Aa1/AA | | | 5,433,450 | |
| | | | State of Hawaii, Series DE, NPFG Insured | | | | | | |
| | 16,000,000 | | 5.000%, 10/01/21 | | Aa1/AA | | | 17,222,880 | |
| | 2,500,000 | | 5.000%, 10/01/24 | | Aa1/AA | | | 2,645,725 | |
| | | | State of Hawaii, Series DF, AMBAC Insured | | | | | | |
| | 3,500,000 | | 5.000%, 07/01/18 | | Aa1/AA | | | 3,877,965 | |
| | 10,000,000 | | 5.000%, 07/01/22 | | Aa1/AA | | | 10,777,700 | |
| | 5,000,000 | | 5.000%, 07/01/23 | | Aa1/AA | | | 5,370,300 | |
| | 10,000,000 | | 5.000%, 07/01/24 | | Aa1/AA | | | 10,699,600 | |
| | 5,000,000 | | 5.000%, 07/01/25 | | Aa1/AA | | | 5,329,350 | |
HAWAIIAN TAX-FREE TRUST
SCHEDULE OF INVESTMENTS (continued)
MARCH 31, 2011
| | | | | Rating | | | |
| Principal | | | | Moody’s/S&P | | | |
| Amount | | General Obligation Bonds (continued) | | (unaudited) | | Value | |
| | |
| | | State of Hawaii, Series DG, AMBAC Insured, | | | | | |
| | | Refunding | | | | | |
| $ | 2,000,000 | | 5.000%, 07/01/17 | | Aa1/AA | | $ | 2,224,540 | |
| | | | State of Hawaii, Series DI, AGM Insured | | | | | | |
| | 5,000,000 | | 5.000%, 03/01/20 | | Aa1/AA+ | | | 5,433,850 | |
| | 2,750,000 | | 5.000%, 03/01/21 | | Aa1/AA+ | | | 2,972,997 | |
| | 5,000,000 | | 5.000%, 03/01/22 | | Aa1/AA+ | | | 5,365,500 | |
| | | | State of Hawaii, Series DJ, AMBAC Insured | | | | | | |
| | 5,000,000 | | 5.000%, 04/01/23 | | Aa1/AA | | | 5,343,500 | |
| | | | State of Hawaii, Series DJ, AGM-CR AMBAC Insured | | | | | | |
| | 5,000,000 | | 5.000%, 04/01/23 | | Aa1/AA+ | | | 5,343,500 | |
| | | | State of Hawaii, Series DK | | | | | | |
| | 5,000,000 | | 5.000%, 05/01/12 | | Aa1/AA | | | 5,238,650 | |
| | | | State of Hawaii, Series DN | | | | | | |
| | 1,000,000 | | 5.250%, 08/01/25 | | Aa1/AA | | | 1,086,540 | |
| | | | State of Hawaii, Series DQ | | | | | | |
| | 10,000,000 | | 5.000%, 06/01/23 | | Aa1/AA | | | 10,863,500 | |
| | | | State of Hawaii, Series DY, Refunding | | | | | | |
| | 5,765,000 | | 5.000%, 02/01/20 | | Aa1/AA | | | 6,504,880 | |
| | | | Total General Obligation Bonds | | | | | 488,376,637 | |
| | | | | | | | | | |
| | | | Revenue Bonds (37.3%) | | | | | | |
| | | | Board of Regents, University of Hawaii, University | | | | | | |
| | | | System, Series A, FGIC Insured, Prerefunded to | | | | | | |
| | | | 07/15/12 @100, Collateral: State & Local | | | | | | |
| | | | Government Series 100% | | | | | | |
| | 2,000,000 | | 5.500%, 07/15/19 | | Aa2/A+ | | | 2,129,060 | |
| | 2,000,000 | | 5.500%, 07/15/21 | | Aa2/A+ | | | 2,129,060 | |
| | 2,000,000 | | 5.500%, 07/15/22 | | Aa2/A+ | | | 2,129,060 | |
| | 3,000,000 | | 5.500%, 07/15/29 | | Aa2/A+ | | | 3,193,590 | |
| | | | Board of Regents, University of Hawaii, University | | | | | | |
| | | | System, Series B, AGM Insured | | | | | | |
| | 1,110,000 | | 5.250%, 10/01/12 | | Aa3/AA+ | | | 1,133,388 | |
| | 1,000,000 | | 5.250%, 10/01/13 | | Aa3/AA+ | | | 1,019,480 | |
| | 1,140,000 | | 5.250%, 10/01/14 | | Aa3/AA+ | | | 1,160,064 | |
| | 1,395,000 | | 5.250%, 10/01/15 | | Aa3/AA+ | | | 1,418,520 | |
HAWAIIAN TAX-FREE TRUST
SCHEDULE OF INVESTMENTS (continued)
MARCH 31, 2011
| | | | | Rating | | | |
| Principal | | | | Moody’s/S&P | | | |
| Amount | | Revenue Bonds (continued) | | (unaudited) | | Value | |
| | |
| | | City and County of Honolulu, Hawaii Board of Water | | | | | |
| | | Supply & System, AGM Insured, Prerefunded to | | | | | |
| | | 07/01/11 @100, Collateral: U.S. Government | | | | | |
| | | Securities | | | | | |
| $ | 1,490,000 | | 5.125%, 07/01/21 | | Aa2/AA+ | | $ | 1,507,433 | |
| | 5,450,000 | | 5.250%, 07/01/23 | | Aa2/AA+ | | | 5,515,400 | |
| | | | City and County of Honolulu, Hawaii Board of Water | | | | | | |
| | | | Supply Water Systems, NPFG Insured | | | | | | |
| | 5,000,000 | | 5.000%, 07/01/26 | | Aa2/AA | | | 5,186,050 | |
| | | | City and County of Honolulu, Hawaii Board of Water | | | | | | |
| | | | Supply Systems, Refunding Series A, NPFG Insured | | | | | | |
| | 3,075,000 | | 4.500%, 07/01/22 | | Aa2/AA | | | 3,222,385 | |
| | 4,525,000 | | 4.500%, 07/01/24 | | Aa2/AA | | | 4,600,749 | |
| | | | City and County of Honolulu, Hawaii Board of Water | | | | | | |
| | | | Supply Water Systems, AGM Insured, Unrefunded | | | | | | |
| | | | Balance | | | | | | |
| | 1,510,000 | | 5.125%, 07/01/21 | | Aa2/AA+ | | | 1,520,283 | |
| | | | City and County of Honolulu, Hawaii Board of Water | | | | | | |
| | | | Supply Water Systems, NPFG FGIC Insured | | | | | | |
| | 2,545,000 | | 4.750%, 07/01/19 | | Aa2/AA | | | 2,646,240 | |
| | | | City and County of Honolulu, Hawaii, Wastewater | | | | | | |
| | | | System, NPFG Insured | | | | | | |
| | 5,000,000 | | 5.000%, 07/01/32 | | Aa3/AA- | | | 5,011,050 | |
| | | | City and County of Honolulu, Hawaii, Wastewater | | | | | | |
| | | | System, Series A, NPFG FGIC Insured | | | | | | |
| | 1,825,000 | | 5.000%, 07/01/22 | | Aa2/AA | | | 1,913,531 | |
| | | | City and County of Honolulu, Hawaii | | | | | | |
| | | | Wastewater System, Senior Series, AMBAC Insured | | | | | | |
| | 1,810,000 | | 5.500%, 07/01/11 | | Aa2/NR*** | | | 1,832,227 | |
| | | | City and County of Honolulu, Hawaii, Wastewater | | | | | | |
| | | | System, Senior Series A, NPFG FGIC Insured | | | | | | |
| | 3,370,000 | | 5.000%, 07/01/18 | | Aa2/AA | | | 3,653,013 | |
| | 2,000,000 | | 5.000%, 07/01/24 | | Aa2/AA | | | 2,074,000 | |
HAWAIIAN TAX-FREE TRUST
SCHEDULE OF INVESTMENTS (continued)
MARCH 31, 2011
| | | | | Rating | | | |
| Principal | | | | Moody’s/S&P | | | |
| Amount | | Revenue Bonds (continued) | | (unaudited) | | Value | |
| | |
| | | City and County of Honolulu, Hawaii, Wastewater | | | | | |
| | | System, First Bond Resolution, Series SR, | | | | | |
| | | Prerefunded to 07/01/11 @100, Collateral: State | | | | | |
| | | & Local Government Series 100% | | | | | |
| $ | 1,065,000 | | 5.500%, 07/01/16 | | Aa2/NR*** | | $ | 1,078,291 | |
| | 3,000,000 | | 5.500%, 07/01/17 | | Aa2/NR*** | | | 3,037,440 | |
| | 2,310,000 | | 5.500%, 07/01/18 | | Aa2/NR*** | | | 2,338,829 | |
| | 2,000,000 | | 5.250%, 07/01/19 | | Aa2/NR*** | | | 2,023,760 | |
| | | | City and County of Honolulu, Hawaii, Wastewater | | | | | | |
| | | | System, First Bond Resolution, Senior Series A, | | | | | | |
| | | | NPFG Insured | | | | | | |
| | 1,000,000 | | 5.000%, 07/01/36 | | Aa2/AA | | | 980,250 | |
| | | | City and County of Honolulu, Hawaii Wastewater | | | | | | |
| | | | System, Second Bond, Junior B-1 Remarket | | | | | | |
| | | | 09/15/06, NPFG Insured | | | | | | |
| | 1,340,000 | | 5.000%, 07/01/18 | | Aa3/AA- | | | 1,466,925 | |
| | 1,935,000 | | 5.000%, 07/01/19 | | Aa3/AA- | | | 2,088,117 | |
| | 2,035,000 | | 5.000%, 07/01/20 | | Aa3/AA- | | | 2,178,834 | |
| | | | Hawaii State Department of Budget and Finance, | | | | | | |
| | | | Special Purpose Revenue Linked Certificates | | | | | | |
| | | | (Kapiolani Health Care) | | | | | | |
| | 3,180,000 | | 6.400%, 07/01/13 | | A3/BBB+ | | | 3,380,245 | |
| | | | Hawaii State Department of Budget and Finance, | | | | | | |
| | | | Special Purpose Revenue PAC Health, Series B, | | | | | | |
| | | | LOC: Bank of Nova Scotia VRDO*, weekly reset | | | | | | |
| | 5,000,000 | | 0.230%, 07/01/33 | | VMIG1/A-1+ | | | 5,000,000 | |
| | | | Hawaii State Department of Budget and Finance, Special | | | | | | |
| | | | Purpose Revenue Refunding Queens Health System, | | | | | | |
| | | | Series A, LOC: Bank of America VRDO*, weekly reset | | | | | | |
| | 14,350,000 | | 0.240%, 07/01/29 | | VMIG1/A-1 | | | 14,350,000 | |
| | | | Hawaii State Department of Budget and Finance, Special | | | | | | |
| | | | Purpose Revenue Refunding Queens Health System, | | | | | | |
| | | | Series B, LOC: Bank of America VRDO*, weekly reset | | | | | | |
| | 2,000,000 | | 0.240%, 07/01/29 | | VMIG1/A-1 | | | 2,000,000 | |
HAWAIIAN TAX-FREE TRUST
SCHEDULE OF INVESTMENTS (continued)
MARCH 31, 2011
| | | | | Rating | | | |
| Principal | | | | Moody’s/S&P | | | |
| Amount | | Revenue Bonds (continued) | | (unaudited) | | Value | |
| | |
| | | Hawaii State Department of Budget and Finance, | | | | | |
| | | Special Purpose Revenue (Hawaiian Electric | | | | | |
| | | Company, Inc.), Series A, AMBAC Insured | | | | | |
| $ | 4,965,000 | | 5.500%, 12/01/14 | | Baa1/BBB- | | $ | 4,977,810 | |
| | | | Hawaii State Department of Budget and Finance, | | | | | | |
| | | | Special Purpose Revenue (Hawaiian Electric | | | | | | |
| | | | Company, Inc.), Series A, NPFG Insured | | | | | | |
| | 4,125,000 | | 4.950%, 04/01/12 | | Baa1/BBB | | | 4,227,176 | |
| | | | Hawaii State Department of Budget and Finance of | | | | | | |
| | | | the State of Hawaii Special Purpose Revenue | | | | | | |
| | | | (Hawaiian Electric Company, Inc. and Subsidiaries | | | | | | |
| | | | Projects), Series A-AMT, NPFG Insured | | | | | | |
| | 5,700,000 | | 5.650%, 10/01/27 | | Baa1/BBB | | | 5,551,002 | |
| | | | Hawaii State Department of Budget and Finance, | | | | | | |
| | | | Special Purpose Revenue (Hawaiian Electric Co.) | | | | | | |
| | | | Series B-AMT, AMBAC Insured | | | | | | |
| | 1,000,000 | | 5.750%, 12/01/18 | | Baa1/BBB- | | | 999,940 | |
| | | | Hawaii State Department of Budget and Finance, | | | | | | |
| | | | Special Purpose Revenue (Hawaiian Electric | | | | | | |
| | | | Company, Inc., and Subsidiaries Projects), Series | | | | | | |
| | | | B-AMT, Syncora Guarantee, Inc. Insured | | | | | | |
| | 1,000,000 | | 5.000%, 12/01/22 | | Baa1/BBB- | | | 953,180 | |
| | | | Hawaii State Department of Budget and Finance, | | | | | | |
| | | | Special Purpose Revenue (Hawaiian Electric | | | | | | |
| | | | Company, Inc.), Series D-AMT, AMBAC Insured | | | | | | |
| | 2,500,000 | | 6.150%, 01/01/20 | | Baa1/BBB- | | | 2,501,550 | |
| | | | Hawaii State Department of Budget and Finance, | | | | | | |
| | | | Special Purpose Revenue (Wilcox Memorial | | | | | | |
| | | | Hospital Projects) | | | | | | |
| | 1,145,000 | | 5.350%, 07/01/18 | | A3/BBB+ | | | 1,145,401 | |
| | | | Hawaii State Department of Hawaiian Home Lands | | | | | | |
| | 605,000 | | 4.000%, 04/01/11 | | A1/NR**** | | | 605,032 | |
| | 575,000 | | 4.000%, 04/01/12 | | A1/NR**** | | | 585,011 | |
| | 730,000 | | 4.500%, 04/01/14 | | A1/NR**** | | | 765,770 | |
| | 500,000 | | 5.000%, 04/01/15 | | A1/NR**** | | | 534,415 | |
| | 715,000 | | 5.000%, 04/01/17 | | A1/NR**** | | | 756,642 | |
| | 1,000,000 | | 5.500%, 04/01/20 | | A1/NR**** | | | 1,048,630 | |
HAWAIIAN TAX-FREE TRUST
SCHEDULE OF INVESTMENTS (continued)
MARCH 31, 2011
| | | | | Rating | | | |
| Principal | | | | Moody’s/S&P | | | |
| Amount | | Revenue Bonds (continued) | | (unaudited) | | Value | |
| | |
| | | Honolulu, Hawaii City & County Wastewater | | | | | |
| | | Systems Revenue, 1st Board Resolution-Senior | | | | | |
| | | Series A | | | | | |
| $ | 2,455,000 | | 5.000%, 07/01/21 | | Aa2/AA | | $ | 2,699,862 | |
| | 2,800,000 | | 5.000%, 07/01/22 | | Aa2/AA | | | 3,045,952 | |
| | 3,300,000 | | 5.000%, 07/01/23 | | Aa2/AA | | | 3,553,242 | |
| | 2,500,000 | | 5.000%, 07/01/24 | | Aa2/AA | | | 2,666,625 | |
| | | | Honolulu, Hawaii City & County Wastewater | | | | | | |
| | | | Systems Revenue, 2nd Board Resolution | | | | | | |
| | | | Resolution-Junior-Series A | | | | | | |
| | 1,155,000 | | 4.000%, 07/01/13 | | Aa3/AA- | | | 1,219,368 | |
| | 1,000,000 | | 4.000%, 07/01/14 | | Aa3/AA- | | | 1,069,550 | |
| | 1,000,000 | | 5.000%, 07/01/20 | | Aa2/AA | | | 1,113,320 | |
| | 1,030,000 | | 5.000%, 07/01/22 | | Aa3/AA- | | | 1,112,812 | |
| | | | Honolulu, Hawaii City & County Wastewater | | | | | | |
| | | | Systems Revenue, 2nd Board Resolution | | | | | | |
| | | | Resolution-Junior-Series A | | | | | | |
| | 7,400,000 | | 4.500%, 07/01/27 | | Aa3/AA- | | | 7,323,854 | |
| | | | Puerto Rico Commonwealth Highway & | | | | | | |
| | | | Transportation Authority Revenue, Series G, | | | | | | |
| | | | FGIC Insured | | | | | | |
| | 1,000,000 | | 5.250%, 07/01/15 | | A3/BBB | | | 1,030,780 | |
| | | | Puerto Rico Commonwealth Public Finance | | | | | | |
| | | | Corporation Revenue Bonds, Series A, | | | | | | |
| | | | Prerefunded to 08/01/11 @100, NPFG Insured, | | | | | | |
| | | | Collateral: 38% U.S. Treasury; 62% U.S. | | | | | | |
| | | | Government Securities | | | | | | |
| | 5,000,000 | | 5.500%, 08/01/17 | | Aaa/NR | | | 5,082,800 | |
| | | | Puerto Rico Electric Power Authority Power Revenue | | | | | | |
| | | | Bonds Series QQ, Syncora Guarantee, Inc. Insured | | | | | | |
| | 3,195,000 | | 5.500%, 07/01/16 | | A3/BBB+ | | | 3,503,062 | |
| | | | Puerto Rico Electric Power Authority Power Revenue | | | | | | |
| | | | Series TT | | | | | | |
| | 5,000,000 | | 5.000%, 07/01/26 | | A3/BBB+ | | | 4,606,800 | |
| | | | Puerto Rico Electric Power Authority Power Revenue, | | | | | | |
| | | | Refunding Series UU | | | | | | |
| | 1,000,000 | | 4.250%, 07/01/13 | | A3/BBB+ | | | 1,042,510 | |
HAWAIIAN TAX-FREE TRUST
SCHEDULE OF INVESTMENTS (continued)
MARCH 31, 2011
| | | | | Rating | | | |
| Principal | | | | Moody’s/S&P | | | |
| Amount | | Revenue Bonds (continued) | | (unaudited) | | Value | |
| | |
| | | State of Hawaii Airport System, AMT, NPFG FGIC | | | | | |
| | | Insured | | | | | |
| $ | 7,425,000 | | 5.750%, 07/01/13 | | A2/A- | | $ | 7,508,754 | |
| | 4,000,000 | | 5.750%, 07/01/17 | | A2/A- | | | 4,033,440 | |
| | 11,000,000 | | 5.625%, 07/01/18 | | A2/A- | | | 11,079,640 | |
| | 6,000,000 | | 5.250%, 07/01/21 | | A2/A- | | | 6,011,340 | |
| | | | State of Hawaii Airport System, AMT, Second Series, | | | | | | |
| | | | Escrowed to Maturity, NPFG Insured, Collateral: | | | | | | |
| | | | U.S. Government Securities | | | | | | |
| | 2,830,000 | | 6.900%, 07/01/12 | | NR/BBB | | | 2,945,605 | |
| | | | State of Hawaii Airport System Revenue Refunding, | | | | | | |
| | | | Series A | | | | | | |
| | 1,150,000 | | 5.250%, 07/01/21 | | A2/A- | | | 1,233,398 | |
| | 1,000,000 | | 5.250%, 07/01/23 | | A2/A- | | | 1,048,400 | |
| | | | State of Hawaii Airport System, Series A | | | | | | |
| | 2,000,000 | | 4.000%, 07/01/20 | | A2/A- | | | 1,983,120 | |
| | 3,000,000 | | 5.000%, 07/01/22 | | A2/A- | | | 3,123,690 | |
| | | | State of Hawaii Harbor Capital Improvement | | | | | | |
| | | | Revenue, Series B-AMT, AMBAC Insured | | | | | | |
| | 3,000,000 | | 5.500%, 07/01/19 | | NR/NR** | | | 3,045,300 | |
| | | | State of Hawaii Harbor System Revenue, Series A | | | | | | |
| | 16,500,000 | | 5.750%, 07/01/35 | | A2/A+ | | | 16,556,925 | |
| | 3,000,000 | | 5.625%, 07/01/40 | | A2/A+ | | | 2,930,310 | |
| | | | State of Hawaii Harbor System Revenue, Series A, | | | | | | |
| | | | AGM Insured | | | | | | |
| | 4,910,000 | | 5.250%, 01/01/25 | | Aa3/AA+ | | | 4,834,091 | |
| | | | State of Hawaii Harbor System Revenue, Series | | | | | | |
| | | | A-AMT, AGM Insured | | | | | | |
| | 2,000,000 | | 5.250%, 07/01/15 | | Aa3/AA+ | | | 2,142,360 | |
| | 2,215,000 | | 5.250%, 07/01/17 | | Aa3/AA+ | | | 2,328,917 | |
| | | | State of Hawaii Highway Revenue | | | | | | |
| | 1,000,000 | | 5.250%, 01/01/17 | | Aa2/AA+ | | | 1,151,910 | |
| | 1,000,000 | | 5.250%, 01/01/18 | | Aa2/AA+ | | | 1,154,780 | |
| | 6,110,000 | | 5.500%, 07/01/18 | | Aa2/AA+ | | | 7,175,156 | |
| | 5,220,000 | | 6.000%, 01/01/23 | | Aa2/AA+ | | | 5,964,581 | |
HAWAIIAN TAX-FREE TRUST
SCHEDULE OF INVESTMENTS (continued)
MARCH 31, 2011
| | | | | Rating | | | |
| Principal | | | | Moody’s/S&P | | | |
| Amount | | Revenue Bonds (continued) | | (unaudited) | | Value | |
| | |
| | | State of Hawaii Highway Revenue, Prerefunded to | | | |
| | | 07/01/11 @100, AGM Insured, Collateral: State | | | |
| | | & Local Government Series 100% | | | |
| $ | 1,530,000 | | 5.375%, 07/01/14 | | Aa2/AA+ | | $ | 1,548,635 | |
| | 2,000,000 | | 5.375%, 07/01/20 | | Aa2/AA+ | | | 2,024,360 | |
| | | | State of Hawaii Highway Revenue, Series A, AGM | | | | |
| | | | Insured | | | | | | |
| | 1,000,000 | | 5.000%, 07/01/20 | | Aa2/AA+ | | | 1,070,360 | |
| | 2,000,000 | | 5.000%, 07/01/22 | | Aa2/AA+ | | | 2,121,180 | |
| | | | State of Hawaii Highway Revenue, Series B, AGM | | | | |
| | | | Insured | | | | | | |
| | 2,000,000 | | 5.000%, 07/01/16 | | Aa2/AA+ | | | 2,225,400 | |
| | | | State of Hawaii Housing Finance and Development | | | | |
| | | | Corporation Single Family Mortgage, Series | | | | |
| | | | A-AMT, FNMA Insured | | | | | | |
| | 2,320,000 | | 5.300%, 07/01/22 | | Aaa/AAA | | | 2,326,403 | |
| | 7,830,000 | | 5.400%, 07/01/29 | | Aaa/AAA | | | 7,829,765 | |
| | 1,110,000 | | 5.750%, 07/01/30 | | Aaa/AAA | | | 1,110,011 | |
| | 690,000 | | 5.400%, 07/01/30 | | Aaa/AAA | | | 686,667 | |
| | | | State of Hawaii Housing Finance and Development | | | | |
| | | | Corporation Single Family Mortgage, Series B, | | | | |
| | | | FNMA Insured | | | | | | |
| | 3,160,000 | | 5.450%, 07/01/17 | | Aaa/AAA | | | 3,161,232 | |
| | 5,290,000 | | 5.300%, 07/01/28 | | Aaa/AAA | | | 5,213,189 | |
| | | | University of Hawaii Revenue | | | | | | |
| | 2,725,000 | | 5.500%, 10/01/22 | | Aa2/A+ | | | 3,058,431 | |
| | | | University of Hawaii Revenue, NPFG Insured | | | | |
| | 5,000,000 | | 5.000%, 07/15/21 | | Aa2/A+ | | | 5,385,800 | |
| | | | University of Hawaii Revenue Refunding, Series A, | | | | |
| | | | NPFG Insured | | | | | | |
| | 4,840,000 | | 4.500%, 07/15/25 | | Aa2/A+ | | | 4,889,562 | |
| | | | University of Hawaii Revenue, Series A | | | | |
| | 1,000,000 | | 4.000%, 10/01/18 | | Aa2/A+ | | | 1,061,110 | |
| | 2,000,000 | | 5.250%, 10/01/34 | | Aa2/A+ | | | 2,032,840 | |
HAWAIIAN TAX-FREE TRUST
SCHEDULE OF INVESTMENTS (continued)
MARCH 31, 2011
| | | | | Rating | | | |
| Principal | | | | Moody’s/S&P | | | |
| Amount | | Revenue Bonds (continued) | | (unaudited) | | Value | |
| | |
| | | University of Hawaii Revenue, Series A-2 | | | | | |
| $ | 1,000,000 | | 4.000%, 10/01/14 | | Aa2/A+ | | $ | 1,078,300 | |
| | 500,000 | | 4.000%, 10/01/15 | | Aa2/A+ | | | 541,610 | |
| | 2,175,000 | | 4.000%, 10/01/17 | | Aa2/A+ | | | 2,328,881 | |
| | 1,000,000 | | 4.000%, 10/01/19 | | Aa2/A+ | | | 1,048,360 | |
| | | | University of Hawaii Revenue, Series B-2 | | | | | | |
| | 1,500,000 | | 4.000%, 10/01/14 | | Aa2/A+ | | | 1,617,450 | |
| | | | University of Hawaii Revenue, AGM-ICC NPFG | | | | | | |
| | | | Insured | | | | | | |
| | 2,000,000 | | 5.000%, 10/01/23 | | Aa2/AA+ | | | 2,133,200 | |
| | | | University of Hawaii, University System Revenue, | | | | | | |
| | | | FGIC Insured, Prerefunded to 07/12/12 @100 | | | | | | |
| | | | Collateral: State and Local Government Securities | | | | | | |
| | 1,650,000 | | 5.125%, 07/15/32 | | Aa2/A+ | | | 1,748,604 | |
| | | | Total Revenue Bonds | | | | | 299,132,437 | |
| | | | | | | | | | |
| | | | Total Investments (cost $771,904,807-note 4) | | | 98.2 | % | | | 787,509,074 | |
| | | | Other assets less liabilities | | | 1.8 | | | | 14,506,825 | |
| | | | NET ASSETS | | | 100.0 | % | | $ | 802,015,899 | |
| | |
| | | | * | Variable rate demand obligations (VRDOs) are payable upon demand within the same day for securities with daily liquidity or seven days for securities with weekly liquidity. | | | | | |
| | | | | |
| | | | ** | Any security not rated (NR) by any of the nationally recognized statistical rating organizations has been determined by the Investment Adviser to have sufficient quality to be ranked in the top four credit ratings if a credit rating were to be assigned by a rating service. | | | | | |
| | | | | | | | | | | | |
| | | | Fitch Ratings: | | | | | | | | |
| | | | *** | AA | | | | | | | | |
| | | | **** | A | | | | | | | | |
HAWAIIAN TAX-FREE TRUST
SCHEDULE OF INVESTMENTS (continued)
MARCH 31, 2011
| | | | Percent of | | |
| | Portfolio Distribution by Quality Rating (unaudited) | | Portfolio † | | |
| | Aaa or #Aaa or VMIG1 | | | 5.3 | % | |
| | Prerefunded bonds †† / Escrowed to Maturity bonds | | | 13.3 | | |
| | Aa of Moody’s | | | 68.5 | | |
| | A of Moody’s | | | 9.4 | | |
| | Baa of Moody’s | | | 3.1 | | |
| | Not rated** | | | 0.4 | | |
| | | | | 100.0 | % | |
| | † | | Calculated using the Moody’s rating unless otherwise noted. | |
| | | | | |
| | †† | | Pre-refunded bonds are bonds for which U.S. Government Obligations have been placed in escrow to retire the bonds at their earliest call date. | |
| | PORTFOLIO ABBREVIATIONS: | |
| | | | | |
| | AGM | | Assured Guaranty Municipal Corp. | |
| | AMBAC | | American Municipal Bond Assurance Corporation | |
| | AMT | | Alternative Minimum Tax | |
| | CIFG | | CDC IXIS Financial Guaranty | |
| | CR | | Custodial Receipts | |
| | FGIC | | Financial Guaranty Insurance Co. | |
| | FNMA | | Federal National Mortgage Association | |
| | ICC | | Insured Custody Certificate | |
| | LOC | | Letter of Credit | |
| | NPFG | | National Public Finance Guarantee | |
| | NR | | Not Rated | |
| | TCRS | | Transferable Custodial Receipts | |
| | VRDO | | Variable Rate Demand Obligation | |
See accompanying notes to financial statements.
HAWAIIAN TAX-FREE TRUST
STATEMENT OF ASSETS AND LIABILITIES
MARCH 31, 2011
| ASSETS | | | |
| Investments at value (cost $771,904,807) | | $ | 787,509,074 | |
| Cash | | | 6,209,046 | |
| Interest receivable | | | 10,006,465 | |
| Receivable for Trust shares sold | | | 198,992 | |
| Other assets | | | 23,955 | |
| Total assets | | | 803,947,532 | |
| | | | | |
| LIABILITIES | | | | |
| Payable for Trust shares redeemed | | | 1,218,716 | |
| Dividends payable | | | 283,825 | |
| Adviser and Administrator fees payable | | | 274,086 | |
| Distribution and service fees payable | | | 11,353 | |
| Accrued expenses | | | 143,653 | |
| Total liabilities | | | 1,931,633 | |
| | | | | |
| NET ASSETS | | $ | 802,015,899 | |
| Net Assets consist of: | | | | |
| Capital Stock – Authorized an unlimited number of shares, par value $0.01 per share. | | $ | 718,087 | |
| Additional paid-in capital | | | 793,724,224 | |
| Net unrealized appreciation on investments (note 4) | | | 15,604,267 | |
| Accumulated net realized loss on investments | | | (8,030,679 | ) |
| | | $ | 802,015,899 | |
| | | | | |
| CLASS A | | | | |
| Net Assets | | $ | 708,552,139 | |
| Capital shares outstanding | | | 63,440,566 | |
| Net asset value and redemption price per share | | $ | 11.17 | |
| Maximum offering price per share (100/96 of $11.17 adjusted to nearest cent) | | $ | 11.64 | |
| | | | | |
| CLASS C | | | | |
| Net Assets | | $ | 65,038,989 | |
| Capital shares outstanding | | | 5,827,205 | |
| Net asset value and offering price per share | | $ | 11.16 | |
| Redemption price per share (*a charge of 1% is imposed on the redemption | | | | |
| proceeds of the shares, or on the original price, whichever is lower, if redeemed | | | | |
| during the first 12 months after purchase) | | $ | 11.16 | * |
| | | | | |
| CLASS Y | | | | |
| Net Assets | | $ | 28,424,771 | |
| Capital shares outstanding | | | 2,540,957 | |
| Net asset value, offering and redemption price per share | | $ | 11.19 | |
See accompanying notes to financial statements.
HAWAIIAN TAX-FREE TRUST
STATEMENT OF OPERATIONS
YEAR ENDED MARCH 31, 2011
| Investment Income: | | | | | | |
| | | | | | | |
| Interest income | | | | | $ | 31,941,911 | |
| | | | | | | | |
| Expenses: | | | | | | | |
| | |
| Investment Adviser fees (note 3) | | $ | 1,140,397 | | | | | |
| Administrator fees (note 3) | | | 2,117,893 | | | | | |
| Distribution and service fees (note 3) | | | 2,047,541 | | | | | |
| Transfer and shareholder servicing agent fees | | | 440,381 | | | | | |
| Trustees’ fees and expenses (note 8) | | | 216,740 | | | | | |
| Legal fees (note 3) | | | 148,007 | | | | | |
| Shareholders’ reports and proxy statements | | | 101,924 | | | | | |
| Custodian fees (note 6) | | | 53,231 | | | | | |
| Insurance | | | 37,556 | | | | | |
| Registration fees and dues | | | 36,071 | | | | | |
| Auditing and tax fees | | | 26,101 | | | | | |
| Chief compliance officer (note 3) | | | 4,504 | | | | | |
| Miscellaneous | | | 47,277 | | | | | |
| Total expenses | | | 6,417,623 | | | | | |
| | | | | | | | | |
| Expenses paid indirectly (note 6) | | | (3,941 | ) | | | | |
| Net expenses | | | | | | | 6,413,682 | |
| Net investment income | | | | | | | 25,528,229 | |
| | |
| Realized and Unrealized Gain (Loss) on Investments: | | | | | | | | |
| | |
| Net realized gain (loss) from securities transactions | | | 3,826 | | | | | |
| Change in unrealized appreciation on investments | | | (13,322,844 | ) | | | | |
| | |
| Net realized and unrealized gain (loss) on investments | | | | | | | (13,319,018 | ) |
| Net change in net assets resulting from operations | | | | | | $ | 12,209,211 | |
See accompanying notes to financial statements.
HAWAIIAN TAX-FREE TRUST
STATEMENTS OF CHANGES IN NET ASSETS
| | | Year Ended | | | Year Ended | |
| | | March 31, 2011 | | | March 31, 2010 | |
| OPERATIONS: | | | | | | |
| Net investment income | | $ | 25,528,229 | | | $ | 23,895,502 | |
| Net realized gain (loss) from securities transactions | | | 3,826 | | | | (987,067 | ) |
| Change in unrealized appreciation on investments | | | (13,322,844 | ) | | | 9,512,696 | |
| Net change in net assets resulting from operations | | | 12,209,211 | | | | 32,421,131 | |
| | |
| DISTRIBUTIONS TO SHAREHOLDERS (note 10): | | | | | | | | |
| Class A Shares: | | | | | | | | |
| Net investment income | | | (22,934,179 | ) | | | (21,787,363 | ) |
| | |
| Class C Shares: | | | | | | | | |
| Net investment income | | | (1,448,808 | ) | | | (1,044,714 | ) |
| | |
| Class Y Shares: | | | | | | | | |
| Net investment income | | | (1,145,242 | ) | | | (1,063,425 | ) |
| Change in net assets from distributions | | | (25,528,229 | ) | | | (23,895,502 | ) |
| | |
| CAPITAL SHARE TRANSACTIONS (note 7): | | | | | | | | |
| Proceeds from shares sold | | | 108,027,539 | | | | 114,811,474 | |
| Reinvested dividends and distributions | | | 14,619,042 | | | | 13,191,577 | |
| Cost of shares redeemed | | | (97,369,390 | ) | | | (66,615,960 | ) |
| Change in net assets from capital share transactions | | | 25,277,191 | | | | 61,387,091 | |
| | |
| Change in net assets | | | 11,958,173 | | | | 69,912,720 | |
| | |
| NET ASSETS: | | | | | | | | |
| Beginning of period | | | 790,057,726 | | | | 720,145,006 | |
| | |
| End of period | | $ | 802,015,899 | | | $ | 790,057,726 | |
See accompanying notes to financial statements.
HAWAIIAN TAX-FREE TRUST
NOTES TO FINANCIAL STATEMENTS
MARCH 31, 2011
1. Organization
Hawaiian Tax-Free Trust (the “Trust”), a non-diversified, open-end investment company, was organized on May 7, 1984, as a Massachusetts business trust and commenced operations on February 20, 1985. The Trust is authorized to issue an unlimited number of shares and, from its inception to April 1, 1996, offered only one class of shares. On that date, the Trust began offering two additional classes of shares, Class C and Class Y Shares. All shares outstanding prior to that date were designated as Class A Shares and are sold at net asset value plus a sales charge of varying size (depending upon a variety of factors) paid at the time of purchase and bear a distribution fee. Class C Shares are sold at net asset value with no sales charge payable at the time of purchase but with a level charge for service and distribution fees for six years thereafter. Class C Shares automatically convert to Class A Shares after six years. Class Y Shares are sold only through institutions acting for investors in a fiduciary, advisory, agency, custodial or similar capacity, and are not offered directly to retail customers. Class Y Shares are sold at net asset value with no sales charge, no redemption fee, no contingent deferred sales charge (“CDSC”) and no distribution fee. On July 21, 1998, the Trust established Class I Shares, which are offered and sold only through financial intermediaries and are not offered directly to retail customers. Class I Shares are sold at net asset value with no sales charge and no redemption fee or CDSC, although a financial intermediary may charge a fee for effecting a purchase or other transaction on behalf of its customers. Class I Shares may carry a distribution and a service fee. As of the report date, there were no Class I Shares outstanding. All classes of shares represent interests in the same portfolio of investments and are identical as to rights and privileges but differ with respect to the effect of sales charges, the distribution and/or service fees borne by each class, expenses specific to each class, voting rights on matters affecting a single class and the exchange privileges of each class.
2. Significant Accounting Policies
The following is a summary of significant accounting policies followed by the Trust in the preparation of its financial statements. The policies are in conformity with accounting principles generally accepted in the United States of America for investment companies.
| a) | Portfolio valuation: Municipal securities which have remaining maturities of more than 60 days are valued each business day based upon information provided by a nationally prominent independent pricing service and periodically verified through other pricing services. In the case of securities for which market quotations are readily available, securities are valued by the pricing service at the mean of bid and asked quotations. If a market quotation or a valuation from the pricing service is not readily available, the security is valued at fair value determined in good faith under procedures established by and under the general supervision of the Board of Trustees. Securities which mature in 60 days or less are valued at amortized cost if their term to maturity at purchase is 60 days or less, or by amortizing their unrealized appreciation or depreciation on the 61st day prior to maturity, if their term to maturity at purchase exceeds 60 days. |
HAWAIIAN TAX-FREE TRUST
NOTES TO FINANCIAL STATEMENTS (continued)
MARCH 31, 2011
| b) | Fair Value Measurements: The Trust follows a fair value hierarchy that distinguishes between market data obtained from independent sources (observable inputs) and the Trust’s own market assumptions (unobservable inputs). These inputs are used in determining the value of the Trust’s investments and are summarized in the following fair value hierarchy: Level 1 – Unadjusted quoted prices in active markets for identical assets or liabilities that the Trust has the ability to access. |
Level 2 – Observable inputs other than quoted prices included in Level 1 that are observable for the asset or liability, either directly or indirectly. These inputs may include quoted prices for the identical instrument on an inactive market, prices for similar instruments, interest rates, prepayment speeds, credit risk, yield curves, default rates and similar data.
Level 3 – Unobservable inputs for the asset or liability, to the extent relevant observable inputs are not available, representing the Trust’s own assumptions about the assumptions a market participant would use in valuing the asset or liability, and would be based on the best information available.
The inputs or methodology used for valuing securities are not an indication of the risk associated with investing in those securities.
The following is a summary of the valuation inputs, representing 100% of the Trust’s investments, used to value the Trust’s net assets as of March 31, 2011:
| Valuation Inputs | | | Investments in Securities | |
| Level 1 – Quoted Prices | | $ | – | |
| Level 2 – Other Significant Observable Inputs – | | | | |
| Municipal Bonds* | | | 787,509,074 | |
| Level 3 – Significant Unobservable Inputs | | | – | |
| Total | | $ | 787,509,074 | |
*See schedule of investments for a detailed listing of securities.
| c) | Subsequent events: In preparing these financial statements, the Trust has evaluated events and transactions for potential recognition or disclosure through the date these financial statements were issued. |
| d) | Securities transactions and related investment income: Securities transactions are recorded on the trade date. Realized gains and losses from securities transactions are reported on the identified cost basis. Interest income is recorded daily on the accrual basis and is adjusted for amortization of premium and accretion of original issue discount and market discount. |
| e) | Federal income taxes: It is the policy of the Trust to continue to qualify as a regulated investment company by complying with the provisions of the Internal Revenue Code applicable to certain investment companies. The Trust intends to make distributions of income and securities profits sufficient to relieve it from all, or substantially all, Federal income and excise taxes. |
HAWAIIAN TAX-FREE TRUST
NOTES TO FINANCIAL STATEMENTS (continued)
MARCH 31, 2011
Management has reviewed the tax positions for each of the open tax years (2008-2010) or expected to be taken in the Trust’s 2011 tax returns and has concluded that there are no significant uncertain tax positions that would require recognition in the financial statements.
| f) | Multiple class allocations: All income, expenses (other than class-specific expenses), and realized and unrealized gains or losses are allocated daily to each class of shares based on the relative net assets of each class. Class-specific expenses, which include distribution and service fees and any other items that are specifically attributed to a particular class, are also charged directly to such class on a daily basis. |
| g) | Use of estimates: The preparation of financial statements in conformity with accounting principles generally accepted in the United States of America requires management to make estimates and assumptions that affect the reported amounts of assets and liabilities and disclosure of contingent assets and liabilities at the date of the financial statements and the reported amounts of increases and decreases in net assets from operations during the reporting period. Actual results could differ from those estimates. |
| h) | Reclassification of capital accounts: Accounting principles generally accepted in the United States of America require that certain components of net assets relating to permanent differences be reclassified between financial and tax reporting. These reclassifications have no effect on net assets or net asset value per share. There were no reclassifications for the year ended March 31, 2011. |
| i) | Accounting pronouncement: In January 2010, the Financial Accounting Standards Board (“FASB”) issued Accounting Standards Update “Improving Disclosures about Fair Value Measurements” that requires additional disclosures regarding fair value measurements. Certain required disclosures are effective for interim and annual reporting periods beginning after December 15, 2010. Management is currently evaluating the impact the update will have on the Trust’s financial statement disclosures. |
3. Fees and Related Party Transactions
a) Management Arrangements:
The Asset Management Group of Bank of Hawaii (the “Adviser”), serves as Investment Adviser to the Trust. In this role, under an Investment Advisory Agreement, the Adviser supervises the Trust’s investments and provides various services to the Trust, for which it is entitled to receive a fee which is payable monthly and computed as of the close of business each day at the annual rate of 0.14% of the Trust’s net assets.
Aquila Investment Management LLC the (“Administrator”), a wholly-owned subsidiary of Aquila Management Corporation, the Trust’s founder and sponsor, serves as the Administrator for the Trust under an Administration Agreement with the Trust. Under this Agreement, the Administrator provides all administrative services to the Trust, other than those relating to the management of the Trust’s investments. These include providing the office of the Trust and all related services as well as overseeing the activities of all the various support organizations to the Trust such as the shareholder servicing agent, custodian, legal counsel, auditors and distributor. For its services, the Administrator is entitled to receive a fee which is payable monthly and computed as of the close of business each day at the annual rate of 0.26% of the Trust’s net assets.
HAWAIIAN TAX-FREE TRUST
NOTES TO FINANCIAL STATEMENTS (continued)
MARCH 31, 2011
The Adviser and the Administrator each agree that the above fees shall be reduced, but not below zero, by an amount equal to its pro-rata portion (based on aggregate fees of the Adviser and the Administrator) of the amount, if any, by which the total expenses of the Trust in any fiscal year, exclusive of taxes, interest and brokerage fees, shall exceed the lesser of (i) 2.5% of the first $30 million of average annual net assets of the Trust plus 2% of the next $70 million of such assets and 1.5% of its average annual net assets in excess of $100 million, or (ii) 25% of the Trust’s total annual investment income. The payment of the above fees at the end of any month will be reduced or postponed so that at no time will there be any accrued but unpaid liability under this expense limitation. No such reduction in fees was required during the year ended March 31, 2011.
Under a Compliance Agreement with the Administrator, the Administrator is additionally compensated for Chief Compliance Officer related services provided to enable the Trust to comply with Rule 38a-1 of the Investment Company Act of 1940.
Specific details as to the nature and extent of the services provided by the Adviser and the Administrator are more fully defined in the Trust’s Prospectus and Statement of Additional Information.
b) Distribution and Service Fees:
The Trust has adopted a Distribution Plan (the “Plan”) pursuant to Rule 12b-1 (the “Rule”) under the Investment Company Act of 1940. Under one part of the Plan, with respect to Class A Shares, the Trust is authorized to make distribution fee payments to broker-dealers or others (“Qualified Recipients”) selected by Aquila Distributors, Inc. (the “Distributor”), including, but not limited to, any principal underwriter of the Trust, with which the Distributor has entered into written agreements contemplated by the Rule and which have rendered assistance in the distribution and/or retention of the Trust’s shares or servicing of shareholder accounts. The Trust makes payment of this distribution fee at the annual rate of 0.20% of the Trust’s average net assets represented by Class A Shares. For the year ended March 31, 2011, service fees on Class A Shares amounted to $1,439,847 of which the Distributor retained $64,657.
Under another part of the Plan, the Trust is authorized to make payments with respect to Class C Shares to Qualified Recipients which have rendered assistance in the distribution and/or retention of the Trust’s Class C shares or servicing of shareholder accounts. These payments are made at the annual rate of 0.75% of the Trust’s average net assets represented by Class C Shares and for the year ended March 31, 2011, amounted to $455,770. In addition, under a Shareholder Services Plan, the Trust is authorized to make service fee payments with respect to Class C Shares to Qualified Recipients for providing personal services and/or maintenance of shareholder accounts. These payments are made at the annual rate of 0.25% of the Trust’s average net assets represented by Class C Shares and for the year ended March 31, 2011, amounted to $151,924. The total of these payments made with respect to Class C Shares amounted to $607,694 of which the Distributor retained $111,754.
HAWAIIAN TAX-FREE TRUST
NOTES TO FINANCIAL STATEMENTS (continued)
MARCH 31, 2011
Specific details about the Plans are more fully defined in the Trust’s Prospectus and Statement of Additional Information.
Under a Distribution Agreement, the Distributor serves as the exclusive distributor of the Trust’s shares. Through agreements between the Distributor and various brokerage and advisory firms (“intermediaries”), the Trust’s shares are sold primarily through the facilities of these intermediaries having offices within Hawaii, with the bulk of any sales commissions inuring to such intermediaries. For the year ended March 31, 2011, total commissions on sales of Class A Shares amounted to $1,613,896, of which the Distributor received $144,165.
c) Other Related Party Transactions:
For the year ended March 31, 2011, the Trust incurred $145,553 of legal fees allocable to Butzel Long PC, counsel to the Trust, for legal services in conjunction with the Trust’s ongoing operations. The Secretary of the Trust is Of Counsel to that firm.
4. Purchases and Sales of Securities
During the year ended March 31, 2011, purchases of securities and proceeds from the sales of securities aggregated $122,961,320, and $56,210,000, respectively.
At March 31, 2011, the aggregate tax cost for all securities was $771,904,807. At March 31, 2011, the aggregate gross unrealized appreciation for all securities in which there is an excess of value over tax cost amounted to $20,777,214 and aggregate gross unrealized depreciation for all securities in which there is an excess of tax cost over value amounted to $5,172,947 for a net unrealized appreciation of $15,604,267.
5. Portfolio Orientation
Since the Trust invests principally and may invest entirely in double tax-free municipal obligations of issuers within Hawaii, it is subject to possible risks associated with economic, political, or legal developments or industrial or regional matters specifically affecting Hawaii and whatever effects these may have upon Hawaii issuers’ ability to meet their obligations.
6. Expenses
The Trust has negotiated an expense offset arrangement with its custodian wherein it receives credit toward the reduction of custodian fees and other Trust expenses whenever there are uninvested cash balances. The Statement of Operations reflects the total expenses before any offset, the amount of offset and the net expenses.
HAWAIIAN TAX-FREE TRUST
NOTES TO FINANCIAL STATEMENTS (continued)
MARCH 31, 2011
7. Capital Share Transactions
Transactions in Capital Shares of the Trust were as follows:
| | | Year Ended | | | Year Ended | |
| | | March 31, 2011 | | | March 31, 2010 | |
| | | Shares | | | Amount | | | Shares | | | Amount | |
| Class A Shares: | | | | | | | | | | | | |
| Proceeds from shares sold | | | 6,502,521 | | | $ | 74,031,760 | | | | 7,306,165 | | | $ | 82,887,110 | |
| Reinvested distributions | | | 1,195,615 | | | | 13,579,694 | | | | 1,094,040 | | | | 12,409,845 | |
| Cost of shares redeemed | | | (6,387,902 | ) | | | (72,315,973 | ) | | | (4,806,792 | ) | | | (54,511,370 | ) |
| Net change | | | 1,310,234 | | | | 15,295,481 | | | | 3,593,413 | | | | 40,785,585 | |
| | | | | | | | | | | | | | | | | |
| Class C Shares: | | | | | | | | | | | | | | | | |
| Proceeds from shares sold | | | 2,235,661 | | | | 25,441,707 | | | | 2,170,841 | | | | 24,608,384 | |
| Reinvested distributions | | | 65,752 | | | | 745,439 | | | | 47,426 | | | | 538,085 | |
| Cost of shares redeemed | | | (1,090,681 | ) | | | (12,323,787 | ) | | | (654,305 | ) | | | (7,409,047 | ) |
| Net change | | | 1,210,732 | | | | 13,863,359 | | | | 1,563,962 | | | | 17,737,422 | |
| | | | | | | | | | | | | | | | | |
| Class Y Shares: | | | | | | | | | | | | | | | | |
| Proceeds from shares sold | | | 749,760 | | | | 8,554,072 | | | | 644,538 | | | | 7,315,980 | |
| Reinvested distributions | | | 25,770 | | | | 293,909 | | | | 21,451 | | | | 243,647 | |
| Cost of shares redeemed | | | (1,126,372 | ) | | | (12,729,630 | ) | | | (414,171 | ) | | | (4,695,543 | ) |
| Net change | | | (350,842 | ) | | | (3,881,649 | ) | | | 251,818 | | | | 2,864,084 | |
| Total transactions in Trust | | | | | | | | | | | | | | | | |
| shares | | | 2,170,124 | | | $ | 25,277,191 | | | | 5,409,193 | | | $ | 61,387,091 | |
8. Trustees’ Fees and Expenses
At March 31, 2011 there were 7 Trustees, one of whom is affiliated with the Administrator and is not paid any fees. The total amount of Trustees’ service fees (for carrying out their responsibilities) and attendance fees paid during the year ended March 31, 2011 was $181,803. Attendance fees are paid to those in attendance at regularly scheduled quarterly Board Meetings and meetings of the Independent Trustees held prior to each quarterly Board Meeting, as well as additional meetings (such as Audit, Nominating, Shareholder and special meetings). Trustees are reimbursed for their expenses such as travel, accommodations and meals incurred in connection with attendance at Board Meetings and the Annual and Outreach Meetings of Shareholders. For the year ended March 31, 2011, such meeting-related expenses amounted to $34,937.
HAWAIIAN TAX-FREE TRUST
NOTES TO FINANCIAL STATEMENTS (continued)
MARCH 31, 2011
9. Securities Traded on a When-Issued Basis
The Trust may purchase or sell securities on a when-issued basis. When-issued transactions arise when securities are purchased or sold by the Trust with payment and delivery taking place in the future in order to secure what is considered to be an advantageous price and yield to the Trust at the time of entering into the transaction. Beginning on the date the Trust enters into a when-issued transaction, cash or other liquid securities are segregated in an amount equal to or greater than the value of the when-issued transaction. These transactions are subject to market fluctuations and their current value is determined in the same manner as for other securities.
10. Income Tax Information and Distributions
The Trust declares dividends daily from net investment income and makes payments monthly. Net realized capital gains, if any, are distributed annually and are taxable. Dividends and capital gains distributions are paid in additional shares at the net asset value per share, in cash, or in a combination of both, at the shareholder’s option.
The Trust intends to maintain, to the maximum extent possible, the tax-exempt status of interest payments received from portfolio municipal securities in order to allow dividends paid to shareholders from net investment income to be exempt from regular Federal and State of Hawaii income taxes. Due to differences between financial statement reporting and Federal income tax reporting requirements, distributions made by the Trust may not be the same as the Trust’s net investment income, and/ or net realized securities gains. Further, a portion of the dividends and distributions may, under some circumstances, be subject to taxes at ordinary income and/or capital gain rates. For certain shareholders, some dividend income may, under some circumstances, be subject to the alternative minimum tax. At March 31, 2011 the Trust had a capital loss carryover of $8,030,679, of which $2,273,607 expires in 2015, $1,251,412 expires in 2016, $1,198,556 expires in 2017, $3,244,561 expires in 2018 and $62,543 expires in 2019. This carryover is available to offset future net realized gains on securities transactions to the extent provided for in the Internal Revenue Code. To the extent that this loss carryover is used to offset future realized capital gains, it is probable the gains so offset will not be distributed.
The tax character of distributions:
| | | | Year Ended March 31, | |
| | | | 2011 | | | 2010 | |
| | Net tax-exempt income | | $ | 25,459,392 | | | $ | 23,808,866 | |
| | Ordinary income | | | 68,837 | | | | 86,636 | |
| | Long-term capital gain | | | – | | | | – | |
| | | | $ | 25,528,229 | | | $ | 23,895,502 | |
HAWAIIAN TAX-FREE TRUST
NOTES TO FINANCIAL STATEMENTS (continued)
MARCH 31, 2011
As of March 31, 2011, the components of distributable earnings on a tax basis were as follows:
| | Unrealized appreciation | | $ | 15,604,267 | |
| | Undistributed tax-exempt income | | | 283,825 | |
| | Other accumulated losses | | | (8,030,679 | ) |
| | Other temporary differences | | | (283,825 | ) |
| | | | $ | 7,573,588 | |
The difference between book basis and tax basis undistributed income is due to the timing difference in recognizing dividends paid.
11. Tax Information
The Regulated Investment Company Modernization Act of 2010 (the “Modernization Act”) was enacted on December 22, 2010. The Modernization Act amends several tax provisions impacting mutual funds. In general, the amendments under the Modernization Act will be effective for fiscal years after enactment. The Modernization Act provides several benefits, including the unlimited carryover of future capital losses versus the prior eight year limitation. Relevant information regarding the impact of the Modernization Act, if any, will be contained within the Federal Tax Status of Distributions section of the financial statement notes for the fiscal year ending March 31, 2012.
12. Ongoing Development
The three major rating agencies (Standard & Poor’s, Moody’s and Fitch) have downgraded or eliminated ratings of the majority of the municipal bond insurance companies since December 2007 due to loss of capital from investments in subprime mortgages. As such, only a few are now deemed to be investment grade. Thus, while certain bonds still have insurance, some are no longer rated based upon the ratings of their insurers. Furthermore, because the ability of many of the Trust’s insurers to pay claims has been downgraded, the protection of such insurance has been diminished, and there is no assurance that some of them may be relied on for payment.
HAWAIIAN TAX-FREE TRUST
FINANCIAL HIGHLIGHTS
For a share outstanding throughout each period
| | | Class A |
| | | Year Ended March 31, |
| | | 2011 | | 2010 | | 2009 | | 2008 | | 2007 |
| Net asset value, beginning of period | | $ | 11.34 | | | $ | 11.21 | | | $ | 11.15 | | | $ | 11.33 | | | $ | 11.32 | |
| Income (loss) from investment operations: | | | | | | | | | | | | | | | | | | | | |
| Net investment income | | | 0.36 | (1) | | | 0.36 | (1) | | | 0.42 | (1) | | | 0.46 | (1) | | | 0.46 | (2) |
| Net gain (loss) on securities (both realized | | | | | | | | | | | | | | | | | | | | |
| and unrealized) | | | (0.17 | ) | | | 0.13 | | | | 0.06 | | | | (0.18 | ) | | | 0.02 | |
| Total from investment operations | | | 0.19 | | | | 0.49 | | | | 0.48 | | | | 0.28 | | | | 0.48 | |
| Less distributions (note 10): | | | | | | | | | | | | | | | | | | | | |
| Dividends from net investment income | | | (0.36 | ) | | | (0.36 | ) | | | (0.42 | ) | | | (0.46 | ) | | | (0.46 | ) |
| Distributions from capital gains | | | – | | | | – | | | | – | | | | – | | | | (0.01 | ) |
| Total distributions | | | (0.36 | ) | | | (0.36 | ) | | | (0.42 | ) | | | (0.46 | ) | | | (0.47 | ) |
| Net asset value, end of period | | $ | 11.17 | | | $ | 11.34 | | | $ | 11.21 | | | $ | 11.15 | | | $ | 11.33 | |
| Total return (not reflecting sales charge) | | | 1.69 | % | | | 4.44 | % | | | 4.43 | % | | | 2.49 | % | | | 4.28 | % |
| Ratios/supplemental data | | | | | | | | | | | | | | | | | | | | |
| Net assets, end of period (in millions) | | $ | 709 | | | $ | 705 | | | $ | 656 | | | $ | 636 | | | $ | 645 | |
| Ratio of expenses to average net assets | | | 0.74 | % | | | 0.74 | % | | | 0.75 | % | | | 0.75 | % | | | 0.75 | % |
| Ratio of net investment income to average | | | | | | | | | | | | | | | | | | | | |
| net assets | | | 3.19 | % | | | 3.19 | % | | | 3.80 | % | | | 4.06 | % | | | 3.99 | % |
| Portfolio turnover rate | | | 7 | % | | | 13 | % | | | 10 | % | | | 18 | % | | | 38 | % |
| The expense ratios after giving effect to the expense offset for uninvested cash balances were: | |
| Ratio of expenses to average net assets | | | 0.74 | % | | | 0.74 | % | | | 0.74 | % | | | 0.75 | % | | | 0.75 | % |
______________
| (1) | | Per share amounts have been calculated using the daily average shares method. |
| (2) | | Per share amounts have been calculated using the monthly average shares method. |
See accompanying notes to financial statements.
HAWAIIAN TAX-FREE TRUST
FINANCIAL HIGHLIGHTS (continued)
For a share outstanding throughout each period
| | | Class C | | Class Y |
| | | Year Ended March 31, | | Year Ended March 31, |
| | | 2011 | | 2010 | | 2009 | | 2008 | | 2007 | | 2011 | | 2010 | | 2009 | | 2008 | | 2007 |
| Net asset value, beginning of period | | $ | 11.34 | | | $ | 11.20 | | | $ | 11.14 | | | $ | 11.33 | | | $ | 11.31 | | | $ | 11.36 | | | $ | 11.23 | | | $ | 11.17 | | | $ | 11.35 | | | $ | 11.34 | |
| Income (loss) from investment operations: | | | | | | | | | | | | | | | | | | | | | | | | | | | | | | | | | | | | | | | | |
| Net investment income | | | 0.27 | (1) | | | 0.27 | (1) | | | 0.33 | (1) | | | 0.37 | (1) | | | 0.36 | (2) | | | 0.38 | (1) | | | 0.39 | (1) | | | 0.44 | (1) | | | 0.48 | (1) | | | 0.48 | (2) |
| Net gain (loss) on securities (both | | | | | | | | | | | | | | | | | | | | | | | | | | | | | | | | | | | | | | | | |
| realized and unrealized) | | | (0.18 | ) | | | 0.14 | | | | 0.06 | | | | (0.19 | ) | | | 0.03 | | | | (0.16 | ) | | | 0.13 | | | | 0.06 | | | | (0.18 | ) | | | 0.02 | |
| Total from investment operations | | | 0.09 | | | | 0.41 | | | | 0.39 | | | | 0.18 | | | | 0.39 | | | | 0.22 | | | | 0.52 | | | | 0.50 | | | | 0.30 | | | | 0.50 | |
| Less distributions (note 10): | | | | | | | | | | | | | | | | | | | | | | | | | | | | | | | | | | | | | | | | |
| Dividends from net investment income | | | (0.27 | ) | | | (0.27 | ) | | | (0.33 | ) | | | (0.37 | ) | | | (0.36 | ) | | | (0.39 | ) | | | (0.39 | ) | | | (0.44 | ) | | | (0.48 | ) | | | (0.48 | ) |
| Distributions from capital gains | | | – | | | | – | | | | – | | | | – | | | | (0.01 | ) | | | – | | | | – | | | | – | | | | – | | | | (0.01 | ) |
| Total distributions | | | (0.27 | ) | | | (0.27 | ) | | | (0.33 | ) | | | (0.37 | ) | | | (0.37 | ) | | | (0.39 | ) | | | (0.39 | ) | | | (0.44 | ) | | | (0.48 | ) | | | (0.49 | ) |
| Net asset value, end of period | | $ | 11.16 | | | $ | 11.34 | | | $ | 11.20 | | | $ | 11.14 | | | $ | 11.33 | | | $ | 11.19 | | | $ | 11.36 | | | $ | 11.23 | | | $ | 11.17 | | | $ | 11.35 | |
| Total return | | | 0.79 | %(3) | | | 3.70 | %(3) | | | 3.60 | % (3) | | | 1.59 | % (3) | | | 3.55 | % (3) | | | 1.89 | % | | | 4.65 | % | | | 4.64 | % | | | 2.70 | % | | | 4.49 | % |
| Ratios/supplemental data | | | | | | | | | | | | | | | | | | | | | | | | | | | | | | | | | | | | | | | | |
| Net assets, end of period (in millions) | | $ | 65.0 | | | $ | 52.3 | | | $ | 34.2 | | | $ | 30.2 | | | $ | 35.6 | | | $ | 28.4 | | | $ | 32.9 | | | $ | 29.6 | | | $ | 27.7 | | | $ | 22.8 | |
| Ratio of expenses to average net assets | | | 1.54 | % | | | 1.54 | % | | | 1.55 | % | | | 1.55 | % | | | 1.55 | % | | | 0.54 | % | | | 0.54 | % | | | 0.55 | % | | | 0.55 | % | | | 0.55 | % |
| Ratio of net investment income to | | | | | | | | | | | | | | | | | | | | | | | | | | | | | | | | | | | | | | | | |
| average net assets | | | 2.38 | % | | | 2.37 | % | | | 2.99 | % | | | 3.26 | % | | | 3.19 | % | | | 3.38 | % | | | 3.39 | % | | | 4.00 | % | | | 4.26 | % | | | 4.19 | % |
| Portfolio turnover rate | | | 7 | % | | | 13 | % | | | 10 | % | | | 18 | % | | | 38 | % | | | 7 | % | | | 13 | % | | | 10 | % | | | 18 | % | | | 38 | % |
| The expense ratios after giving effect to the expense offset for uninvested cash balances were: | |
| Ratio of expenses to average net assets | | | 1.54 | % | | | 1.54 | % | | | 1.54 | % | | | 1.55 | % | | | 1.55 | % | | | 0.54 | % | | | 0.54 | % | | | 0.54 | % | | | 0.55 | % | | | 0.55 | % |
______________
| (1) | | Per share amounts have been calculated using the daily average shares method. |
| (2) | | Per share amounts have been calculated using the monthly average shares method. |
| (3) | | Not reflecting CDSC. |
See accompanying notes to financial statements.
| Additional Information (unaudited) |
| |
Trustees and Officers(1)(2) |
| | | | | | | Number of | | |
| | | Positions | | | | Portfolios | | |
| | | Held with | | | | in Fund | | |
| | | Trust and | | | | Complex(5) | | Other Directorships |
Name, Address(3) | | Length of | | Principal Occupation(s) | | Overseen | | Held by Trustee During |
| and Date of Birth | | Service(4) | | During Past 5 Years | | by Trustee | | Past 5 Years |
| | | | | | | | | |
Interested Trustee(6) | | | | |
| | | | | | | | | |
Diana P. Herrmann New York, NY (02/25/58) | | Vice Chair of the Board of Trustees since 2003, President since 1998 and Trustee since 2004 | | Vice Chair and Chief Executive Officer of Aquila Management Corporation, Founder of the Aquila Group of Funds(7) and parent of Aquila Investment Management LLC, Administrator, since 2004, President since 1997, Chief Operating Officer, 1997-2008, a Director since 1984, Secretary since 1986 and previously its Executive Vice President, Senior Vice President or Vice President, 1986-1997; Chief Executive Officer and Vice Chair since 2004, President and Manager since 2003, and Chief Operating Officer (2003-2008), of the Administrator; Chair, Vice Chair, President, Executive Vice President and/or Senior Vice President of funds in the Aquila Group of Funds since 1986; Director of the Distributor since 1997; Governor, Investment Company Institute (the trade organization for the U.S. mutual fund industry which is dedicated to protecting shareholder interests and educating the public about investing) for various periods since 2004, and head of its Small Funds Committee, 2004-2009; active in charitable and volunteer organizations. | | 12 | | ICI Mutual Insurance Company, a Risk Retention Group (2006-2009 and since 2010) |
| | | | | | | Number of | | |
| | | Positions | | | | Portfolios | | |
| | | Held with | | | | in Fund | | |
| | | Trust and | | | | Complex(5) | | Other Directorships |
Name, Address(3) | | Length of | | Principal Occupation(s) | | Overseen | | Held by Trustee During |
| and Date of Birth | | Service(4) | | During Past 5 Years | | by Trustee | | Past 5 Years |
| | | | | | | | | |
| Non-interested Trustees | | | | |
| | | | | | | | | |
Theodore T. Mason Hastings-on-Hudson, NY (11/24/35) | | Chair of the Board of Trustees since 2004 and Trustee since 1984 | | Executive Director, East Wind Power Partners LTD since 1994 and Louisiana Power Partners, 1999-2003; Assistant Treasurer, Fort Schuyler Maritime Alumni Association, Inc., successor to Alumni Association of SUNY Maritime College, since 2010 (Treasurer, 2004-2009, President, 2002-2003, First Vice President, 2000-2001, Second Vice President, 1998-2000) and director of the same organization since 1997; Director, STCM Management Company, Inc., 1973-2004; twice national officer of Association of the United States Navy (formerly Naval Reserve Association), Commanding Officer of four naval reserve units and Captain, USNR (Ret); director, The Navy League of the United States New York Council since 2002; trustee, The Maritime Industry Museum at Fort Schuyler, 2000-2004; and Fort Schuyler Maritime Foundation, Inc., successor to the Maritime College at Fort Schuyler Foundation, Inc., since 2000. | | 9 | | Formerly Trustee, Premier VIT |
| | | | | | | | | |
Stanley W. Hong Honolulu, HI (04/05/36) | | Trustee since 1992 | | President, Waste Management of Hawaii, Inc. and Corporate Vice President –Hawaii Area for Waste Management, Inc., 2001-2005; Trustee, The King William Charles Lunalilo Trust Estate since 2001; President and Chief Executive Officer, The Chamber of Commerce of Hawaii, 1996-2001; Regent, Chaminade University of Honolulu since 1991; Trustee, the Nature Conservancy of Hawaii since 1998; Trustee, Child and Family Service since 2005; Director, The East West Center Foundation since 2006 and St. Louis School since 2007; and a director of other corporate and community organizations. | | 4 | | First Insurance Co. of Hawaii, Ltd., Lanihau Properties, Ltd., Riggs Distributing Co.; formerly Trustee, Pacific Capital Funds® |
| | | | | | | Number of | | |
| | | Positions | | | | Portfolios | | |
| | | Held with | | | | in Fund | | |
| | | Trust and | | | | Complex(5) | | Other Directorships |
Name, Address(3) | | Length of | | Principal Occupation(s) | | Overseen | | Held by Trustee During |
| and Date of Birth | | Service(4) | | During Past 5 Years | | by Trustee | | Past 5 Years |
| | | | | | | | | |
Richard L. Humphreys Kaneohe, HI (10/06/43) | | Trustee since 2009 | | President, Hawaii Receivables Management, LLC (a factoring company) since 2001; President, Lynk Payment Systems Hawaii, LLC (credit card processing) since 2002. Formerly Chairman, Bank of America, Hawaii; President, Hawaiian Trust Co.; President, First Federal S&L; and, Executive Vice President, Bank of Hawaii. | | 4 | | Board of Directors, Bishop Museum; Board of Directors, Friends of the Cancer Research Center; Board of Directors, The Castle Group, Inc.; formerly Trustee, Pacific Capital Funds® |
| | | | | | | | | |
Bert A. Kobayashi, Jr. Honolulu, HI (04/22/70) | | Trustee since 2009 | | Managing Partner, BlackSand Capital, LLC (private equity real estate investment company) since 2010; Partner, Kobayashi Group, LLC (a group of companies primarily engaged in real estate enterprises) since 2001; Managing Director, KG Holdings, LLC (real estate investment) since 2009; Vice President, Nikken Holdings, LLC (real estate investment) since 2003; interested in a number of other real estate companies in Hawaii. | | 4 | | Hawaiian Electric Company, Inc. |
| | | | | | | | | |
Glenn P. O’Flaherty Denver, CO (08/03/58) | | Trustee since 2009 | | Chief Financial Officer and Chief Operating Officer of Lizard Investors, LLC, 2008; Co-Founder, Chief Financial Officer and Chief Compliance Officer of Three Peaks Capital Management, LLC, 2003-2005; Vice President – Investment Accounting, Global Trading and Trade Operations, Janus Capital Corporation, and Chief Financial Officer and Treasurer, Janus Funds, 1991-2002. | | 6 | | None |
| | | | | | | Number of | | |
| | | Positions | | | | Portfolios | | |
| | | Held with | | | | in Fund | | |
| | | Trust and | | | | Complex(5) | | Other Directorships |
Name, Address(3) | | Length of | | Principal Occupation(s) | | Overseen | | Held by Trustee During |
| and Date of Birth | | Service(4) | | During Past 5 Years | | by Trustee | | Past 5 Years |
| | | | | | | | | |
Russell K. Okata Honolulu, HI (03/22/44) | | Trustee since 1992 | | Executive Director, Hawaii Government Employees Association AFSCME Local 152, AFL-CIO 1981-2007; International Vice President, American Federation of State, County and Municipal Employees, AFL-CIO 1981-2007; Hawaii Democratic Party National Committeeman; director of various civic and charitable organizations. | | 5 | | Formerly Trustee, Pacific Capital Funds®; past Chair of the Royal State Group (insurance) |
The specific experience, qualifications, attributes or skills that led to the conclusion that these persons should serve as Trustees of the Trust, in addition to those listed above, were as follows.
| | Diana P. Herrmann: | | Nearly 25 years of experience in mutual fund management. |
| | | | |
| | Theodore T. Mason: | | Extensive financial and management experience; knowledgeable about operation and management of mutual funds. |
| | | | |
| | Stanley W. Hong: | | Experienced business executive with knowledge of local government and mutual fund governance. |
| | | | |
| | Richard L. Humphreys: | | Experienced in banking and finance. |
| | | | |
| | Bert A. Kobayashi, Jr.: | | Experienced in local government affairs and real estate. |
| | | | |
| | Glenn P. O’Flaherty: | | Knowledgeable about financial markets and operation of mutual funds. |
| | | | |
| | Russell K. Okata: | | Experienced in local government affairs and mutual fund governance. |
| | | Positions | | |
| | | Held with | | |
| | | Trust and | | |
Name, Address(3) | | Length of | | |
| and Date of Birth | | Service(4) | | Principal Occupation(s) During Past 5 Years |
| | | | | |
Chairman Emeritus(8) | | | | |
| | | | | |
Lacy B. Herrmann New York, NY (05/12/29) | | Founder and Chairman Emeritus since 2004, Trustee, 1984-2004, and Chairman of the Board of Trustees, 1984-2003 | | Founder and Chairman of the Board, Aquila Management Corporation, the sponsoring organization and parent of the Manager or Administrator and/or Adviser to each fund of the Aquila Group of Funds; Chairman of the Manager or Administrator and/or Adviser to each since 2004; Founder and Chairman Emeritus of each fund in the Aquila Group of Funds; previously Chairman and a Trustee of each fund in the Aquila Group of Funds since its establishment until 2004 or 2005; Director of the Distributor since 1981 and formerly Vice President or Secretary, 1981-1998; Director or trustee, Premier VIT, 1994-2009; Director or trustee of Oppenheimer Quest Value Funds Group, Oppenheimer Small Cap Value Fund, and Oppenheimer Midcap Fund, 1987-2009, and Oppenheimer Rochester Group of Funds, 1995-2009; Trustee Emeritus, Brown University and the Hopkins School; active in university, school and charitable organizations. |
| | | | | |
Officers | | | | |
| | | | | |
Charles E. Childs, III New York, NY (04/01/57) | | Executive Vice President since 2003 | | Executive Vice President of all funds in the Aquila Group of Funds and the Administrator and the Administrator’s parent since 2003; Chief Operating Officer of the Administrator and the Administrator’s parent since 2008; formerly Senior Vice President, corporate development, Vice President, Assistant Vice President and Associate of the Administrator’s parent since 1987; Senior Vice President, Vice President or Assistant Vice President of the Aquila Money-Market Funds, 1988-2003. |
| | | | | |
Marie E. Aro Denver, CO (02/10/55) | | Senior Vice President since 2010 | | Co-President of the Distributor since 2010, Vice President, 1993-1997; Senior Vice President, Aquila Three Peaks Opportunity Growth Fund since 2004; Senior Vice President, Tax-Free Trust of Arizona since 2010 and Vice President, 2004-2010; Senior Vice President, Aquila Three Peaks High Income Fund since 2006; Senior Vice President, Hawaiian Tax-Free Trust, Tax-Free Fund For Utah, Tax-Free Fund of Colorado, Tax-Free Trust of Oregon, Churchill Tax-Free Fund of Kentucky and Narragansett Insured Tax-Free Income Fund since 2010; Vice President, INVESCO Funds Group, 1998-2003. |
| | | | | |
Paul G. O’Brien Charlotte, NC (11/28/59) | | Senior Vice President since 2010 | | Co-President, Aquila Distributors, Inc. since 2010, Managing Director, 2009-2010; Senior Vice President of Aquila Three Peaks Opportunity Growth Fund, Aquila Three Peaks High Income Fund, and each of the Aquila Municipal Bond Funds since 2010; held various positions to Senior Vice President and Chief Administrative Officer of Evergreen Investments Services, Inc., 1997-2008; Mergers and Acquisitions Coordinator for Wachovia Corporation, 1994-1997. |
| | | Positions | | |
| | | Held with | | |
| | | Trust and | | |
Name, Address(3) | | Length of | | |
| and Date of Birth | | Service(4) | | Principal Occupation(s) During Past 5 Years |
| | | | | |
Stephen J. Caridi New York, NY (05/06/61) | | Vice President since 1998 | | Vice President of the Distributor since 1995; Vice President, Hawaiian Tax-Free Trust since 1998; Senior Vice President, Narragansett Insured Tax-Free Income Fund since 1998, Vice President 1996-1997; Senior Vice President, Tax-Free Fund of Colorado 2004-2009; Vice President, Aquila Three Peaks Opportunity Growth Fund since 2006. |
| | | | | |
Robert S. Driessen New York, NY (10/12/47) | | Chief Compliance Officer since 2009 | | Chief Compliance Officer of each fund in the Aquila Group of Funds, the Administrator and the Distributor since December 2009; Vice President, Chief Compliance Officer, Curian Capital, LLC, (2004-2008); and Phoenix Investment Partners, Ltd., (1999- 2004); Vice President, Risk Liaison, Corporate Compliance, Bank of America, 1996-1999; Vice President, Securities Compliance, Prudential Insurance Company of America, 1993-1996; various positions to Branch Chief, U.S. Securities and Exchange Commission, 1972-1993. |
| | | | | |
Joseph P. DiMaggio New York, NY (11/06/56) | | Chief Financial Officer since 2003 and Treasurer since 2000 | | Chief Financial Officer of each fund in the Aquila Group of Funds since 2003 and Treasurer since 2000. |
| | | | | |
Edward M. W. Hines New York, NY (12/16/39) | | Secretary since 1984 | | Of Counsel to Butzel Long, a professional corporation, counsel to the Trust, since 2010 and previously Shareholder since 2007; Partner of Hollyer Brady Barrett & Hines LLP, its predecessor as counsel, 1989-2007; Secretary of each fund in the Aquila Group of Funds. |
| | | | | |
John M. Herndon New York, NY (12/17/39) | | Assistant Secretary since 1995 | | Assistant Secretary of each fund in the Aquila Group of Funds since 1995 and Vice President of the three Aquila Money-Market Funds since 1990; Vice President of the Administrator or its predecessor and current parent since 1990. |
| | | Positions | | |
| | | Held with | | |
| | | Trust and | | |
Name, Address(3) | | Length of | | |
| and Date of Birth | | Service(4) | | Principal Occupation(s) During Past 5 Years |
| | | | | |
Yolonda S. Reynolds New York, NY (04/23/60) | | Assistant Treasurer since 2010 | | Director of Fund Accounting for the Aquila Group of Funds since 2007; Investment Accountant, TIIA-CREF, 2007; Sr. Fund Accountant, JP Morgan Chase, 2003-2006. |
| | | | | |
Lori A. Vindigni New York, NY (11/02/66) | | Assistant Treasurer since 2000 | | Assistant Treasurer of each fund in the Aquila Group of Funds since 2000; Assistant Vice President of the Administrator or its predecessor and current parent since 1998; Fund Accountant for the Aquila Group of Funds, 1995-1998. |
____________________________
(1) The Trust’s Statement of Additional Information includes additional information about the Trustees and officers and is available, without charge, upon request by calling 800-437-1020 (toll-free) or by visiting www.aquilafunds.com or the EDGAR Database at the SEC’s internet site at www.sec.gov.
(2) From time to time Bank of Hawaii may enter into normal investment management, commercial banking and/or lending arrangements with one or more of the Trustees of the Trust and their affiliates. The Asset Management Group of Bank of Hawaii is the Trust’s investment adviser.
(3) The mailing address of each Trustee and officer is c/o Hawaiian Tax-Free Trust, 380 Madison Avenue, Suite 2300, New York, NY 10017.
(4) Each Trustee holds office until the next annual meeting of shareholders or until his or her successor is elected and qualifies. The term of office of each officer is one year.
(5) Includes certain Aquila-sponsored funds that are dormant and have no public shareholders.
(6) Ms. Herrmann is an interested person of the Trust as an officer of the Trust, as a director, officer and shareholder of the Administrator’s corporate parent, as an officer and Manager of the Administrator, and as a shareholder and director of the Distributor. Ms. Herrmann is the daughter of Lacy B. Herrmann, the Founder and Chairman Emeritus of the Trust.
(7) In this material Pacific Capital Cash Assets Trust, Pacific Capital Tax-Free Cash Assets Trust and Pacific Capital U.S. Government Securities Cash Assets Trust, each of which is a money-market fund, are called the “Aquila Money-Market Funds”; Tax-Free Trust of Arizona, Tax-Free Fund of Colorado, Hawaiian Tax-Free Trust, Churchill Tax-Free Fund of Kentucky, Tax-Free Trust of Oregon, Narragansett Insured Tax-Free Income Fund (Rhode Island) and Tax-Free Fund For Utah, each of which is a tax-free municipal bond fund, are called the “Aquila Municipal Bond Funds”; Aquila Three Peaks Opportunity Growth Fund is an equity fund; and Aquila Three Peaks High Income Fund is a high income corporate bond fund; considered together, these 12 funds, which do not include the dormant funds described in footnote 5, are called the “Aquila Group of Funds.”
(8) The Chairman Emeritus may attend Board meetings but has no voting power.
Analysis of Expenses (unaudited)
As a shareholder of the Trust, you may incur two types of costs: (1) transaction costs, including front-end sales charges with respect to Class A shares or contingent deferred sales charges (“CDSC”) with respect to Class C shares; and (2) ongoing costs, including management fees; distribution and/or service (12b-1) fees; and other Trust expenses. The table below is intended to help you understand your ongoing costs (in dollars) of investing in the Trust and to compare these costs with the ongoing costs of investing in other mutual funds.
The table below is based on an investment of $1,000 invested on October 1, 2010 and held for the six months ended March 31, 2011.
Actual Expenses
This table provides information about actual account values and actual expenses. You may use the information provided in this table, together with the amount you invested, to estimate the expenses that you paid over the period. To estimate the expenses you paid on your account, divide your ending account value by $1,000 (for example, an $8,600 ending account value divided by $1,000 = 8.6), then multiply the result by the number under the heading entitled “Expenses Paid During the Period”.
| Six months ended March 31, 2011 | | | | | | |
| | | | | | | |
| | | Actual | | | | | | |
| | | Total Return | | Beginning | | Ending | | Expenses |
| | | Without | | Account | | Account | | Paid During |
| | | Sales Charges(1) | | Value | | Value | | the Period(2) |
| Class A | | (1.79)% | | $1,000.00 | | $982.10 | | $3.61 |
| Class C | | (2.18)% | | $1,000.00 | | $978.20 | | $7.55 |
| Class Y | | (1.69)% | | $1,000.00 | | $983.10 | | $2.62 |
| (1) | Assumes reinvestment of all dividends and capital gain distributions, if any, at net asset value and does not reflect the deduction of the applicable sales charges with respect to Class A shares or the applicable contingent deferred sales charges (“CDSC”) with respect to Class C shares. Total return is not annualized, as it may not be representative of the total return for the year. |
| (2) | Expenses are equal to the annualized expense ratio of 0.73%, 1.53% and 0.53% for the Trust’s Class A, C and Y shares, respectively, multiplied by the average account value over the period, multiplied by 182/365 (to reflect the one-half year period). |
Analysis of Expenses (unaudited) (continued)
Hypothetical Example for Comparison Purposes
The table below provides information about hypothetical account values and hypothetical expenses based on the actual expense ratio and an assumed rate of return of 5.00% per year before expenses, which is not the Trust’s actual return. The hypothetical account values and expenses may not be used to estimate the actual ending account balance or expenses you paid for the period. You may use the information provided in this table to compare the ongoing costs of investing in the Trust and other mutual funds. To do so, compare this 5.00% hypothetical example relating to the Trust with the 5.00% hypothetical examples that appear in the shareholder reports of other mutual funds.
Please note that the expenses shown in the table below are meant to highlight your ongoing costs only and do not reflect any transactional costs, with respect to Class A shares. The example does not reflect the deduction of contingent deferred sales charges (“CDSC”) with respect to Class C shares. Therefore, the table is useful in comparing ongoing costs only, and will not help you determine the relative total costs of owning different mutual funds. In addition, if these transaction costs were included, your costs would have been higher.
| Six Months ended March 31, 2011 | | | | | | |
| | | | | | | |
| | | Hypothetical | | | | | | |
| | | Annualized | | Beginning | | Ending | | Expenses |
| | | Total | | Account | | Account | | Paid During |
| | | Return | | Value | | Value | | the Period(1) |
| Class A | | 5.00% | | $1,000.00 | | $1,021.29 | | $3.68 |
| Class C | | 5.00% | | $1,000.00 | | $1,017.31 | | $7.70 |
| Class Y | | 5.00% | | $1,000.00 | | $1,022.29 | | $2.67 |
| (1) | Expenses are equal to the annualized expense ratio of 0.73%, 1.53% and 0.53% for the Trust’s Class A, C and Y shares, respectively, multiplied by the average account value over the period, multiplied by 182/365 (to reflect the one-half year period). |
Information Available (unaudited)
Much of the information that the funds in the Aquila Group of Funds produce is automatically sent to you and all other shareholders. Specifically, you are routinely sent your Trust’s entire list of portfolio securities twice a year in the semi-annual and annual reports you receive. Additionally, under Trust policies, the Administrator publicly discloses the complete schedule of the Trust’s portfolio holdings, as of each calendar quarter, generally by the 15th day after the end of each calendar quarter. Such information remains accessible until the next schedule is made publicly available. You may obtain a copy of the Trust’s portfolio holdings schedule for the most recently completed period by visiting the Trust’s website at www.aquilafunds.com. The Trust may also disclose other portfolio holdings as of a specified date (currently the Trust discloses its five largest holdings by value as of the close of the last business day of each calendar month in a posting to its website on approximately the 5th business day following the month end). This information remains on the website until the next such posting. Whenever you wish to see a listing of your Trust’s portfolio other than in your shareholder reports, please check our website at www.aquilafunds.com or call us at 1-800-437-1020.
The Trust additionally files a complete list of its portfolio holdings with the SEC for the first and third quarter ends of each fiscal year on Form N-Q. Forms N-Q are available free of charge on the SEC website at www.sec.gov. You may also review or, for a fee, copy the forms at the SEC’s Public Reference Room in Washington, D.C. or by calling 1-800-SEC-0330.
Proxy Voting Record (unaudited)
The Trust does not invest in equity securities. Accordingly, there were no matters relating to a portfolio security considered at any shareholder meeting held during the 12 months ended June 30, 2010 with respect to which the Trust was entitled to vote. Applicable regulations require us to inform you that the foregoing proxy voting information is available on the SEC website at www.sec.gov.
Federal Tax Status of Distributions (unaudited)
This information is presented for your information only and no current action on the part of shareholders is required.
For the fiscal year ended March 31, 2011, $25,459,392 of dividends paid by Hawaiian Tax-Free Trust, constituting 99.73% of total dividends paid during fiscal 2011, were exempt-interest dividends, exempt from regular Federal income tax and Hawaii state income tax; and the balance was ordinary dividend income.
Prior to February 15, 2011, shareholders were mailed the appropriate tax form(s) which contained information on the status of distributions paid for the 2010 calendar year.
PRIVACY NOTICE (unaudited)
Hawaiian Tax-Free Trust
Our Privacy Policy. In providing services to you as an individual who owns or is considering investing in shares of the Trust, we collect certain non-public personal information about you. Our policy is to keep this information strictly safeguarded and confidential, and to use or disclose it only as necessary to provide services to you or as otherwise permitted by law. Our privacy policy applies equally to former shareholders and persons who inquire about the Trust.
Information We Collect. ”Non-public personal information” is personally identifiable financial information about you as an individual or your family. The kinds of non-public personal information we have about you may include the information you provide us on your share purchase application or in telephone calls or correspondence with us, and information about your fund transactions and holdings, how you voted your shares and the account where your shares are held.
Information We Disclose. We disclose non-public personal information about you to companies that provide necessary services to us, such as the Trust’s transfer agent, distributor, investment adviser or sub-adviser, if any, as permitted or required by law, or as authorized by you. Any other use is strictly prohibited. We do not sell information about you or any of our fund shareholders to anyone.
Non-California Residents: We also may disclose some of this information to another fund in the Aquila Group of Funds (or its service providers) under joint marketing agreements that permit the funds to use the information only to provide you with information about other funds in the Aquila Group of Funds or new services we are offering that may be of interest to you.
California Residents Only: In addition, unless you “opt-out” of the following disclosures using the form that was mailed to you under separate cover, we may disclose some of this information to another fund in the Aquila Group of Funds (or its service providers) under joint marketing agreements that permit the funds to use the information only to provide you with information about other funds in the Aquila Group of Funds or new services we are offering that may be of interest to you.
How We Safeguard Your Information. We restrict access to non-public personal information about you to only those persons who need it to provide services to you or who are permitted by law to receive it. We maintain physical, electronic and procedural safeguards to protect the confidentiality of all non-public personal information we have about you.
If you have any questions regarding our Privacy Policy, please contact us at 1-800-437-1020.
Aquila Distributors, Inc.
Aquila Investment Management LLC
This Privacy Policy also has been adopted by Aquila Distributors, Inc. and Aquila Investment Management LLC and applies to all non-public information about you that each of these companies may obtain in connection with services provided to the Trust or to you as a shareholder of the Trust.
(THIS PAGE INTENTIONALLY LEFT BLANK)
| Founders |
| Lacy B. Herrmann, Chairman Emeritus |
| Aquila Management Corporation |
| |
| Administrator |
| AQUILA INVESTMENT MANAGEMENT LLC |
| 380 Madison Avenue, Suite 2300 |
| New York, New York 10017 |
| |
| Investment Adviser |
| ASSET MANAGEMENT GROUP of |
| BANK of HAWAII |
| P.O. Box 3170 |
| Honolulu, Hawaii 96802 |
| |
| Board of Trustees |
| Theodore T. Mason, Chair |
| Diana P. Herrmann, Vice Chair |
| Stanley W. Hong |
| Richard L. Humphreys |
| Bert A. Kobayashi, Jr. |
| Glenn P. O’Flaherty |
| Russell K. Okata |
| |
| Officers |
| Diana P. Herrmann, President |
| Marie E. Aro, Senior Vice President |
| Sherri Foster, Senior Vice President |
| Paul G. O’Brien, Senior Vice President |
| Stephen J. Caridi, Vice President |
| Robert S. Driessen, Chief Compliance Officer |
| Joseph P. DiMaggio, Chief Financial Officer |
| and Treasurer |
| Edward M.W. Hines, Secretary |
| |
| Distributor |
| AQUILA DISTRIBUTORS, INC. |
| 380 Madison Avenue, Suite 2300 |
| New York, New York 10017 |
| |
| Transfer and Shareholder Servicing Agent |
| BNY MELLON |
| 4400 Computer Drive |
| Westborough, Massachusetts 01581 |
| |
| Custodian |
| JPMORGAN CHASE BANK, N.A. |
| 1111 Polaris Parkway |
| Columbus, Ohio 43240 |
| |
| Independent Registered Public Accounting Firm |
| TAIT, WELLER & BAKER LLP |
| 1818 Market Street, Suite 2400 |
| Philadelphia, Pennsylvania 19103 |
| |
Further information is contained in the Prospectus,
which must precede or accompany this report. |
ITEM 2. CODE OF ETHICS.
(a) As of March 31, 2011 (the end of the reporting period) the Trust has adopted a code of ethics that applies to the Trust's principal executive officer(s)and principal financial officer(s) and persons performing similar functions ("Covered Officers") as defined in the Aquila Group of Funds Code of Ethics for Principal Executive and Senior Financial Officers under Section 406 of the Sarbanes-Oxley Act of 2002;
(f)(1) Pursuant to Item 10(a)(1), a copy of the Trust's Code of Ethics that applies to the Trust's principal executive officer(s) and principal financial officer(s) and persons performing similar functions is included as an exhibit to its annual report on this Form N-CSR;
(f)(2) The text of the Trust's Code of Ethics that applies to the Trust's principal executive officer(s) and principal financial officer(s) and persons performing similar functions has been posted on its Internet website which can be found at the Trust's Internet address at aquilafunds.com.
ITEM 3. AUDIT COMMITTEE FINANCIAL EXPERT.
(a)(1)(i) The Registrant's board of trustees has determined that Mr. Glenn O'Flaherty, a member of its audit committee, is an audit committee financial expert. Mr. O'Flaherty is 'independent' as such term is defined in Form N-CSR.
ITEM 4. PRINCIPAL ACCOUNTANT FEES AND SERVICES.
a) Audit Fees - The aggregate fees billed for professional services rendered by the principal accountant for the audit of the Registrant's annual financial statements were $19,800 in 2010 and $20,800 in 2011.
b) Audit Related Fees - There were no amounts billed for audit-related fees over the past two years.
c) Tax Fees - The Registrant was billed by the principal accountant $3,200 and $3,300 in 2010 and 2011, respectively, for return preparation and tax compliance.
d) All Other Fees - There were no additional fees paid for audit and non-audit services other than those disclosed in a) thorough c) above.
e)(1) Currently, the audit committee of the Registrant pre-approves audit services and fees on an engagement-by-engagement basis
e)(2) None of the services described in b) through d) above were approved by the audit committee pursuant to paragraph (c)(7)(i)(C) of Rule 2-01 of Regulation S-X, all were pre-approved on an engagement-by-engagement basis.
f) No applicable.
g) There were no non-audit services fees billed by the Registrant's accountant to the Registrant's investment adviser or distributor over the past two years
h) Not applicable.
ITEM 5. AUDIT COMMITTEE OF LISTED REGISTRANTS.
Not applicable
ITEM 6. SCHEDULE OF INVESTMENTS.
Included in Item 1 above
| ITEM 7. | DISCLOSURE OF PROXY VOTING POLICIES AND PROCEDURES FOR CLOSED-END MANAGEMENT INVESTMENT COMPANIES. |
Not applicable
ITEM 8. PORTFOLIO MANAGERS OF CLOSED-END MANAGEMENT INVESTMENT COMPANIES.
Not applicable
| ITEM 9. | PURCHASES OF EQUITY SECURITIES BY CLOSED-END MANAGEMENT INVESTMENT COMPANY AND AFFILIATED PURCHASERS. |
Not applicable
ITEM 10. SUBMISSION OF MATTERS TO A VOTE OF SECURITY HOLDERS.
The Board of Directors of the Registrant has adopted a Nominating Committee Charter which provides that the Nominating Committee (the 'Committee') may consider and evaluate nominee candidates properly submitted by shareholders if a vacancy among the Independent Trustees of the Registrant occurs and if, based on the Board's then current size, composition and structure, the Committee determines that the vacancy should be filled. The Committee will consider candidates submitted by shareholders on the same basis as it considers and evaluates candidates recommended by other sources. A copy of the qualifications and procedures that must be met or followed by shareholders to properly submit a nominee candidate to the Committee may be obtained by submitting a request in writing to the Secretary of the Registrant.
ITEM 11. CONTROLS AND PROCEDURES.
(a) Based on their evaluation of the registrant's disclosure controls and procedures (as defined in Rule 30a-2(c) under the Investment Company Act of 1940) as of a date within 90 days of the filing of this report, the registrant's chief financial and executive officers have concluded that the disclosure controls and procedures of the registrant are appropriately designed to ensure that information required to be disclosed in the registrant's reports that are filed under the Securities Exchange Act of 1934 are accumulated and communicated to registrant's management, including its principal executive officer(s) and principal financial officer(s), to allow timely decisions regarding required disclosure and is recorded, processed, summarized and reported, within the time periods specified in the rules and forms adopted by the Securities and Exchange Commission.
(b) There have been no significant changes in registrant's internal controls or in other factors that could significantly affect registrant's internal controls subsequent to the date of the most recent evaluation, including no significant deficiencies or material weaknesses that required corrective action.
ITEM 12. EXHIBITS.
(a)(1) Aquila Group of Funds Code of Ethics for Principal Executive and Senior Financial Officers under Section 406 of the Sarbanes-Oxley Act of 2002.
(a)(2) Certifications of principal executive officer and principal financial officer as required by Rule 30a-2(a) under the Investment Company Act of1940.
(b) Certifications of principal executive officer and principal financial officer as required by Rule 30a-2(b) under the Investment Company Act of 1940.
SIGNATURES
Pursuant to the requirements of the Securities Exchange Act of 1934 and the Investment Company Act of 1940, the registrant has duly caused this report to be signed on its behalf by the undersigned thereunto duly authorized.
HAWAIIAN TAX-FREE TRUST
| By: | /s/ Diana P. Herrmann | |
| | Vice Chair, President and Trustee | |
| | | |
| | | |
| By: | /s/ Joseph P. DiMaggio | |
| | Chief Financial Officer and Treasurer | |
Pursuant to the requirements of the Securities Exchange Act of 1934 and the Investment Company Act of 1940, this report has been signed below by the following persons on behalf of the registrant and in the capacities and on the dates indicated.
| By: | /s/ Diana P. Herrmann | |
| | Diana P. Herrmann Vice Chair, President and Trustee | |
| | | |
| | | |
| By: | /s/ Joseph P. DiMaggio | |
| | Joseph P. DiMaggio Chief Financial Officer and Treasurer | |
HAWAIIAN TAX-FREE TRUST
EXHIBIT INDEX
(a)(1) Aquila Group of Funds Code of Ethics for Principal Executive and Senior Financial Officers under Section 406 of the Sarbanes-Oxley Act of 2002, as amended.
(a) (2)Certifications of principal executive officer and principal financial officer as required by Rule 30a-2(a) under the Investment Company Act of 1940.
(b) Certification of chief executive officer and chief financial officer as required by Rule 30a-2(b) of the Investment Company Act of 1940.