UNITED STATES
SECURITIES AND EXCHANGE COMMISSION
WASHINGTON, D.C. 20549
FORM N-CSR
CERTIFIED SHAREHOLDER REPORT OF REGISTERED MANAGEMENT
INVESTMENT COMPANIES
Investment Company Act File Number 811-4084
Hawaiian Tax-Free Trust
(Exact name of Registrant as specified in charter)
120 West 45th Street, Suite 3600
New York, New York 10036
(Address of principal executive offices) (Zip code)
Joseph P. DiMaggio
120 West 45th Street, Suite 3600
New York, New York 10036
(Name and address of agent for service)
Registrant's telephone number, including area code:
(212) 697-6666
Date of fiscal year end: 3/31/24
Date of reporting period: 3/31/24
FORM N-CSR
ITEM 1. REPORTS TO STOCKHOLDERS
| | | | | | | | | | | | | | | | | | | | | | | | | | |

Annual Report March 31, 2024 |
| |
| |  |
 | Hawaiian Tax-Free Trust Assessing the Current Environment and
Preparing for What May Lie Ahead Serving Hawaii investors since 1985 |  |
| | | |
May, 2024
Dear Fellow Shareholder:
One of the primary characteristics of fixed income investments, including municipal bonds, is an inherent dependency on certain market conditions. Perhaps chief among them is the direction of interest rates, which results in a direct, inverse relationship between bond yields and valuations. Although expected, this yield/valuation dynamic has been further influenced by mounting uncertainty regarding interest rates and federal monetary policy for the year ahead. The Federal Reserve (the “Fed”), which previously signaled a series of rate cuts in 2024, has instead adopted a wait-and-see approach — suggesting that interest rates may remain “higher for longer.” In the process, bond yields have generally remained elevated, offering income-oriented investors attractive yield opportunities. On the other hand, investors focused on bond valuations remain skittish about their principal investments.
Current market conditions, thus, beg the questions: Will the Fed decide to cut interest rates in 2024? How might bond yields and valuations be affected going forward? While no one has a crystal ball, of course, we believe it’s important to understand the current environment and prepare for what may lie ahead.
Potential Implications for Municipal Bonds
Municipal securities generally began the year on a positive note, continuing the strong rally that occurred toward the end of 2023. However, as the first quarter unfolded, bond valuations gave way to a prevailing increase in yields that swept across fixed income markets. Overall, municipal bonds performed respectably on a relative basis, especially considering a significant amount of volatility among many fixed income asset classes, including U.S. Treasury securities. In addition to enduring interest rate volatility, U.S. Treasuries have continued to experience an inversion of the yield curve. The municipal yield curve has also experienced somewhat of an aberration, taking on an atypical “ladle” shape. Much of these conditions have come amid continued uncertainty about the direction of interest rates, and as investors appeared to gravitate toward shorter-term durations and investment alternatives.
As referenced above, short-term interest rates are largely driven by the monetary policy adopted by the Federal Reserve. A rather striking strategic change by the Fed in recent months has introduced added uncertainty for financial markets. For instance, at the Federal Open Market Committee (“FOMC”) meeting in December 2023, the Fed indicated that it was prepared to begin implementing a series of rate cuts during
NOT A PART OF THE ANNUAL REPORT
the coming year. And this stance was reiterated as recently as the FOMC meeting in March. However, citing stubborn inflation and stronger-than-expected economic data, the Fed instead elected to again hold rates steady and maintain the overnight federal funds rate (the rate that banks charge each other to borrow or lend excess reserves overnight) at its target range of 5.25% to 5.5%. In fact, the FOMC in May marked the sixth consecutive meeting that the Fed chose to leave rates unchanged, which kept the federal funds rate at its highest level in more than two decades.
Federal Reserve Chair Jerome Powell stated that he doesn’t anticipate the Fed cutting interest rates until it is confident inflation is moving sustainably downward. Mr. Powell added that gaining such confidence will likely take longer than previously expected, and that any further decisions regarding monetary policy will be considered on a meeting-by-meeting basis. Therefore, financial markets have pivoted and are prepared for what appears may be a period of persistently higher interest rates.
In terms of key economic drivers, inflation (as measured by the Consumer Price Index) has fallen significantly from its most recent peak of 9.1%, yet remains more than a percentage point above the Fed’s target rate of 2%. Lingering inflation continues to have its effects on various aspects of the economy and does not go unnoticed by market observers. Meanwhile, the labor force has remained strong and remains one of the bright spots for the U.S. economy. According to Bureau of Labor statistics in March, the labor participation rate rose to 62.7%, while the unemployment rate dropped to 3.8%, bringing unemployment to its lowest level in nearly 50 years.
So, what does this mean for fixed income investors? Financial markets continue to take it all in and react accordingly. The current environment is clearly indicative of just how dependent fixed income investments, including municipal bonds, are to changing market conditions. Whereas the markets had been prepared for potential interest rate reductions, they are now bracing for what could be a period of “higher for longer” rates — and with it, potential uncertainty.
Assessing the Road Ahead
The economic backdrop seems to be plotting the roadmap for fixed income investments for the time being. Heightened market sensitivity to key economic data may continue in the interim, which could further contribute to uncertainty and volatility across fixed income asset classes. As noted above, this backdrop has allowed the Federal Reserve to be patient with its monetary strategy and overall approach to managing interest rates. Predictions for interest rate reductions in 2024 have changed and continue to vary among market pundits. Talk of as many as six rate cuts has muted to possibly three, or perhaps only one, if any. And the timing of any possible action is very much dependent on forthcoming economic indicators. One thing is for sure: Until such time, both the Federal Reserve and investors alike will be closely monitoring what transpires.
Coinciding with a recent rise in bond yields, issuance of new municipal bonds has continued to increase nationally. Municipalities appear to be more confident bringing new issues to market, as demand for municipal bonds remains relatively
NOT A PART OF THE ANNUAL REPORT
high. During the first quarter of 2024, new issuance totaled $95 billion — a year-over-year increase of 19.5%, according to Bloomberg. This is an encouraging sign for municipalities, and for the municipal bond market overall.
Another positive development for municipal bonds is improving credit fundamentals. According to S&P Global Ratings and Fitch Ratings, municipal credit rating upgrades far outweighed downgrades during the first quarter of 2024. Municipal credits have continued to benefit from federal pandemic aid, along with strong tax revenue collections, which has helped maintain healthy fiscal budgets and cash reserves, in many cases.
No market scenario would be complete without the possibility of other influencing factors. The unfortunate geopolitical tensions and potential for escalation abroad pose a lingering threat to global financial markets. And domestically, the presidential election cycle presents an additional consideration as we progress in 2024 and beyond.
Regardless of these and other macro market forces, we believe that with changing market conditions come opportunities. That’s why we also believe in the importance of maintaining a disciplined, long-term approach to investing.
Remain Focused on Your Long-Term Investment Goals
At Aquila Group of Funds, we remain optimistic for the municipal bond market — and for the role that mutual funds play in helping investors achieve their long-term financial goals. Municipal bonds are vital to financing the infrastructure of states and local communities. Moreover, they may play an important role in an investor’s asset allocation strategy. We, therefore, believe it’s important to keep in mind the key benefits that municipal bond funds offer, particularly during periods of market change and uncertainty. And, we feel it’s critical for our fellow shareholders to stay true to their individual financial goals. Below are a few key items to keep in mind when considering your investment options:
| · | Investment objectives – Identify the desired results that are most important to you when it comes to an investment’s stated objectives. For example, high current income, as is consistent with preservation of capital, tax-exempt income, among others. |
| · | Time horizon – Determine your projected need for the investment principal. Included in this may be your ability to recover potential losses due to declines in market value. |
| · | Risk tolerance – Assess your sentiment towards risk, your ability to withstand market volatility, whether financially or emotionally, as well as your willingness to accept fluctuations in principal value. |
| · | Portfolio diversification – “Don’t put all your eggs in one basket,” as the saying goes. Having a diversified portfolio of various types of investment vehicles, characteristics and correlations can help manage changing market conditions and associated risks. |
NOT A PART OF THE ANNUAL REPORT
| · | Consult with a financial professional – Align your choice of investments with your individual financial goals, such as the items referenced above, along with any other considerations pertaining to your unique situation. A trusted financial professional can help you choose the investments that are right for you. |
Hawaiian Tax-Free Trust continually endeavors to remain aligned with its stated investment mandates. The primary goal of your Fund’s Investment Adviser — Asset Management Group, Bank of Hawaii — is to deliver the highest level of income exempt from regular federal and state income taxes, as is consistent with preservation of capital.
Thank you as always for choosing to invest with Aquila Group of Funds.
| | Sincerely, | |
| |  | |
| |  | |
| | Diana P. Herrmann, Vice Chair and President | |
Any information in this Shareholder Letter regarding market or economic trends or the factors influencing the Trust’s historical or future performance are statements of opinion as of the date of this report. These statements should not be relied upon for any other purposes. Past performance is no guarantee of future results, and there is no guarantee that any market forecasts discussed will be realized.
NOT A PART OF THE ANNUAL REPORT
| Hawaiian Tax-Free Trust ANNUAL REPORT
Management Discussion Serving Hawaii investors since 1985 | |
| | | |
Economic Overview
The mantra of “higher of longer” rings true for the first quarter of 2024. Macro-economic factors seem to be playing out to question the market’s assumption of lower yields and Federal Reserve (the “Fed”) guidance. With confidence, the markets celebrated the end of 2023 with an aggressive fixed income rally in this face of declining inflation and statements by the Fed affirming a forecast of three cuts in the Federal Funds rate (the interest rate that banks charge each other to borrow or lend money overnight) in 2024. The market quickly amplified the forecast to drive the market higher to effectively imbed six implied cuts in short rates by the end of 2024. Most of the exuberance faded by the end of the first quarter as employment showed a strong economy through solid job creation and an upward tick in inflation. By the end of the quarter, the Federal Reserve indicated that it would stand firm at the current level of the Federal Funds rate for as long as it takes to bring to bear the recent unfavorable trends in inflation. The market backed off by pushing longer term rates higher realizing that higher rates down the road would be longer than expected in the current environment.
Municipal Bond and Hawaii Municipal Bond Markets Overview
In the most recent quarter ended March 31, 2024, the municipal market declined in sympathy with its taxable counterparts as yields increased. The Bloomberg Municipal Index and the Bloomberg Hawaii Index fell -0.38% and -0.28%, respectively. Municipals outperformed the higher increases in US Treasury in the first quarter. The ratio of Bloomberg BVAL “AAA” tax-exempt yields fell by the end of the quarter to 59.4% on higher market new issue supply. The inverse of this ratio is an indicator of the tax savings breakeven against taxable bond equivalents.
Higher interest rates combined with a late quarter increase in supply of newly issued bonds during March cheapened Hawaii bond prices relative to national tax-exempt bonds and decreased relative returns. According to Bloomberg, the national municipal 10 year maturity “AAA” yield increased from 2.3% to 2.8% during your Fund’s fourth fiscal quarter (ended March 31, 2024). During the same period, the Hawaiian 10 year maturity rose from 2.4% to 2.9%. However, for the fiscal year, Hawaii bond yields in the same tenor rose from 2.5%, while national yields rose from 2.4%.
Issuance during the first quarter of 2024, remained muted historically even with an increase of 21% new issuance from the prior year. A yield higher than national municipals is a relative value opportunity for Hawaii bonds. This represents a chance for Hawaii residents to obtain the benefits of a higher Hawaii tax advantage compared to mainland yields.
1 | Hawaiian Tax-Free Trust
MANAGEMENT DISCUSSION (continued)
An interesting observation is the unusual shape of the tax-exempt yield curve as of March 31, 2024. Unlike US Treasury yields in similar maturities, municipals exhibited a greater value in longer maturities. Specifically, the U.S. Treasury vs. the AAA Municipal Yield Ratio for 10 years was 59.4% at the end of the quarter, while the ratio stood at 88% for 30 years. In fact, the yield of a Hawaii bond in 30 years yields was almost 60 basis points (“bps”) (0.60%) higher between the 1 and 30 year maturity Hawaii bond yields. This gap was a negative 49 bps (-.49%) in the US Treasury market. It underscores the relative value between the two markets in the longer end of the tax-exempt maturity curve. This greater value of longer term bond is exactly the spot your portfolio management team has focused upon with the new purchases of the Hawaiian Tax-Free Trust portfolio over the last several months of the fiscal year. They continue to seek the maximum amount of tax-exempt income and sustainability of dividends over many years for the long-term success of your Fund.
Hawaii Economy
Although the economic numbers were mixed for the calendar year of 2023, the Hawaiian economy has been solidly pushing forward based on State of Hawaii Department of Business, Economic Development & Tourism statistics. During the year, tourism arrivals fell -1.7% and for the fourth quarter 2023 the daily visitor census dropped 4.7% (State of Hawaii’s most recent release of information). In contrast, in 2023, total salary jobs increased 2.2% with the State unemployment rate dropping from 3.5 to 3.0%.
In addition, for the fourth quarter of 2023, the State’s general fund tax revenue increased $191 million or a positive 9.5% compared to 2022. During the same time period, State General Excise tax collections increased 2.3% while individual income taxes increased 23.3%. This placed the State of Hawaii in a steady and net favorable position.
Although firm estimates are fluid, the investment in infrastructure across all the islands proposed for the next five years is significant. From the redevelopment of essential water, wastewater and port facilities on all the islands to the rebuilding of Maui, this will be a welcome relief for many local residents and jobs.
Performance
During the first quarter of 2024, with rates increasing, Hawaiian Tax-Free Trust’s Class Y shares returned -0.38% for the three-month period. This compares to -0.46% for the Fund’s prospectus benchmark, the Bloomberg Municipal Bond Quality Intermediate Total Return Unhedged USD (the “Index”). During the same period the Bloomberg Hawaii Index (the “local benchmark”) returned a -0.27%. The Fund’s outperformance when compared to the Index was due a greater exposure to longer maturity bonds when the Index’s shorter intermediate bonds underperformed.
As of March 31, 2024, Hawaiian Tax-Free Trust was over-weighted in recently issued essential service water bonds (Honolulu Board of Water Supply) which came to market in March and placed upward pressure on yields (lowering price) to the
2 | Hawaiian Tax-Free Trust
MANAGEMENT DISCUSSION (continued)
exposure already held in the Fund. This contributed to a slight underperformance against the local benchmark. The Bloomberg Hawaii Index contained a heavier weight to General Obligation bonds versus the Fund. However, at higher yields, the Fund participated in the new issue benefiting shareholders with higher double tax-exempt Hawaii income. Your portfolio management team seeks to overweight the islands’ essential service revenue bonds for diversification and credit strength.
Outlook and Strategy
Looking forward, we believe the Federal Reserve will continue to hold interest rates at the current level for a period of time. We expect the economy will slow in coming quarters and inflationary pressures will continue to ease despite the current stickiness. To be sure, it is unknown whether the Fed’s goal of lower inflation can be achieved without precipitating a recession. For now, our outlook points towards a generally positive environment for the performance of investment grade municipal bonds. We have opportunistically extended your Fund’s average maturity with a goal to lock in elevated interest rates. We believe this should bode well for the forward return potential of your Fund and continued generation of double tax-exempt income distributions.
Mutual fund investing involves risk and loss of principal is possible.
The market prices of the Trust’s securities may rise or decline in value due to general market conditions, such as real or perceived adverse economic, political or regulatory conditions, political instability, recessions, inflation, changes in interest rates, lack of liquidity in the bond markets, the spread of infectious illness or other public health issues, weather or climate events, armed conflict, sanctions or other government actions, market disruptions caused by tariffs, trade disputes or other factors, or adverse investor sentiment. When market prices fall, the value of your investment may go down. In the past decade, financial markets have experienced increased volatility, depressed valuations, decreased liquidity and heightened uncertainty. These conditions may continue, recur, worsen or spread.
The long-term impact of the COVID-19 pandemic and its subsequent variants on economies, markets, industries and individual issuers, are not known. Some sectors of the economy and individual issuers have experienced or may experience particularly large losses. Periods of extreme volatility in the financial markets, reduced liquidity of many instruments, increased government debt, inflation, and disruptions to supply chains, consumer demand and employee availability, may continue for some time.
Raising the ceiling on U.S. government debt has become increasingly politicized. Any failure to increase the total amount that the U.S. government is authorized to borrow could lead to a default on U.S. government obligations, with unpredictable consequences for economies and markets in the U.S. and elsewhere. Inflation and interest rates have increased and may rise further. These circumstances could adversely affect the value and liquidity of the Trust ‘s investments, impair the Trust’s ability to satisfy redemption requests, and negatively impact the Trust’s performance.
Economies and financial markets throughout the world are increasingly interconnected. Economic, financial or political events, trading and tariff arrangements, public health events, terrorism, wars, natural disasters and other circumstances in one country or region could have profound impacts on global economies or markets. As a result, whether or not the Trust invests in securities of issuers located in or with significant exposure to the countries or markets directly affected, the value and liquidity of the Trust’s investments may be negatively affected. Following Russia’s invasion of Ukraine, Russian securities lost all, or nearly all, their market value. Other securities or markets could be similarly affected by past or future political, geopolitical or other events or conditions. Furthermore, events involving limited liquidity, defaults, non-performance or other adverse developments that affect one industry, such as the financial services industry, or concerns or rumors about any events of these kinds, have in the past and may in the future lead to market-wide liquidity problems, may spread to other industries, and could negatively affect the value and liquidity of the Trust’s investments.
3 | Hawaiian Tax-Free Trust
MANAGEMENT DISCUSSION (continued)
Governments and central banks, including the U.S. Federal Reserve, have taken extraordinary and unprecedented actions to support local and global economies and the financial markets. These actions have resulted in significant expansion of public debt, including in the U.S. The consequences of high public debt, including its future impact on the economy and securities markets, may not be known for some time.
The U.S. and other countries are periodically involved in disputes over trade and other matters, which may result in tariffs, investment restrictions and adverse impacts on affected companies and securities. For example, the U.S. has imposed tariffs and other trade barriers on Chinese exports, has restricted sales of certain categories of goods to China, and has established barriers to investments in China. Trade disputes may adversely affect the economies of the U.S. and its trading partners, as well as companies directly or indirectly affected and financial markets generally. If the political climate between the U.S. and China does not improve or continues to deteriorate, if China were to attempt unification of Taiwan by force, or if other geopolitical conflicts develop or get worse, economies, markets and individual securities may be severely affected both regionally and globally, and the value of the Trust’s assets may go down.
The value of your investment will generally go down when interest rates rise. A rise in interest rates tends to have a greater impact on the prices of longer term or longer duration securities. In recent years, interest rates and credit spreads in the U.S. have been at historic lows. The U.S. Federal Reserve has raised certain interest rates, and interest rates may continue to go up. A general rise in interest rates may cause investors to move out of fixed income securities on a large scale and could also result in increased redemptions from the Trust.
Investments in the Trust are subject to possible loss due to the financial failure of the issuers of underlying securities and their inability to meet their debt obligations.
The value of municipal securities can be adversely affected by changes in the financial condition of one or more individual municipal issuers or insurers of municipal issuers, regulatory developments, legislative actions, and by uncertainties and public perceptions concerning these and other factors. The Trust may be affected significantly by adverse economic, political or other events affecting state and other municipal issuers in which it invests, and may be more volatile than a more geographically diverse fund. The municipal bond market can be susceptible to unusual volatility, particularly for lower-rated and unrated securities. Liquidity can be reduced unpredictably in response to overall economic conditions or credit tightening. Municipal issuers may be adversely affected by rising health care costs, increasing unfunded pension liabilities, and by the phasing out of federal programs providing financial support. Unfavorable conditions and developments relating to projects financed with municipal securities can result in lower revenues to issuers of municipal securities, potentially resulting in defaults. Municipal securities may be more susceptible to downgrades or defaults during a recession or similar periods of economic stress. Financial difficulties of municipal issuers may continue or get worse, particularly in the event of political, economic or market turmoil or a recession.
A portion of income may be subject to local, state, Federal and/or alternative minimum tax. Capital gains, if any, are subject to capital gains tax.
These risks may result in share price volatility.
Any information in this Annual Report regarding market or economic trends or the factors influencing the Trust’s historical or future performance are statements of opinion as of the date of this report. These statements should not be relied upon for any other purposes. Past performance is no guarantee of future results, and there is no guarantee that any market forecasts discussed will be realized.
4 | Hawaiian Tax-Free Trust
PERFORMANCE REPORT
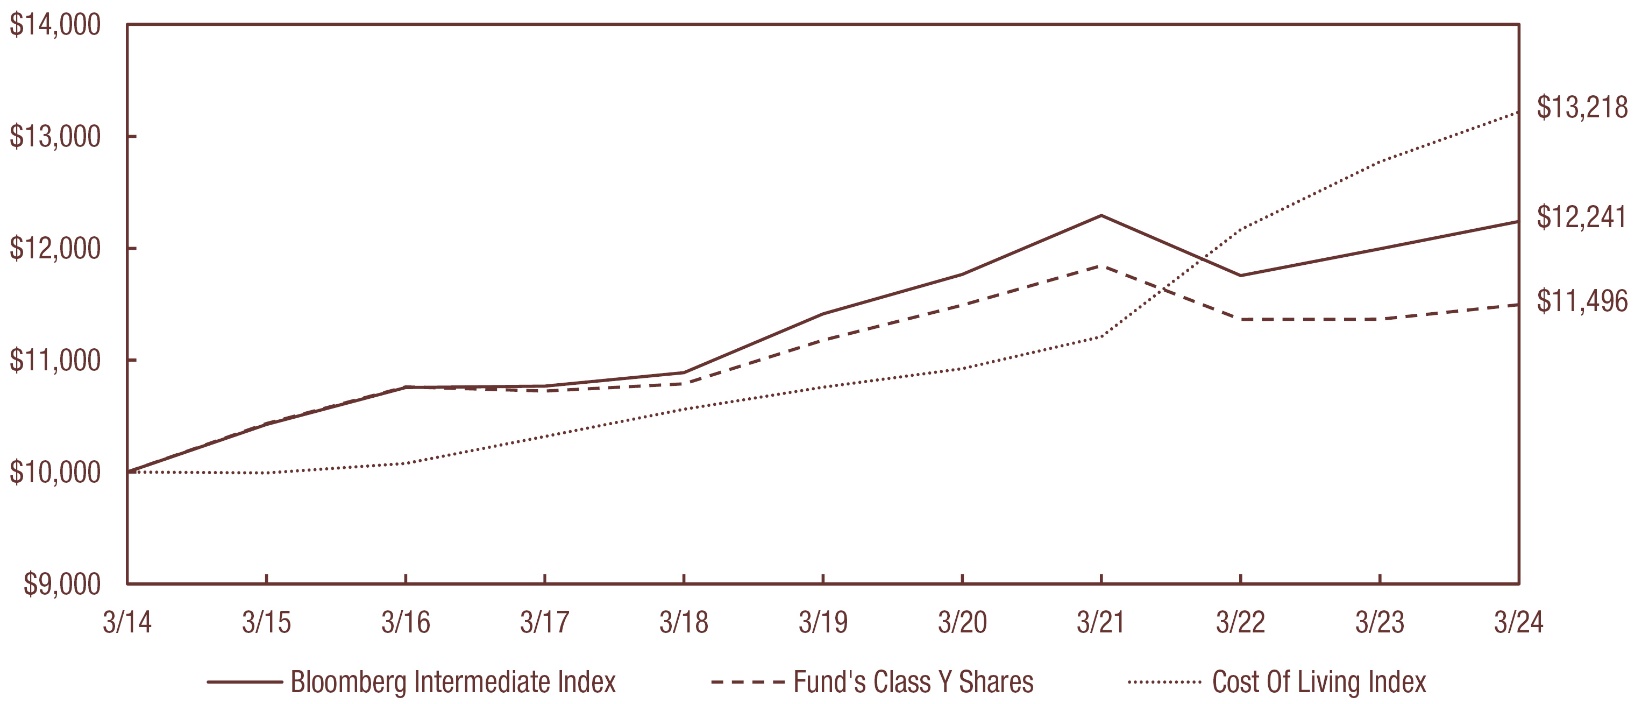
The following graph illustrates the value of $10,000 invested in the Class Y shares of Hawaiian Tax-Free Trust (the “Trust”) for the 10-year period ended March 31, 2024 as compared with the Bloomberg Municipal Bond: Quality Intermediate TR Unhedged Index*** (the “Bloomberg Intermediate Index”) and the Consumer Price Index (a cost of living index). The performance of each of the other classes is not shown in the graph but is included in the table below. It should be noted that the Bloomberg Intermediate Index does not include any operating expenses nor sales charges, and being nationally oriented, does not reflect state-specific bond market performance.
| | | Average Annual Total Return
for periods ended March 31, 2024 | |
| Class and Inception Date | | 1 Year | | 5 Years | | 10 Years | | Since
Inception | |
| Class A since 2/20/85 | | | | | | | | | |
| With Maximum Sales Charge | | (2.09)% | | (0.45)% | | 0.79% | | 4.45% | |
| Without Sales Charge | | 0.95 | | 0.36 | | 1.20 | | 4.56 | |
| Class C since 4/01/96 | | | | | | | | | |
| With CDSC** | | (0.84) | | (0.42) | | 0.40 | | 2.27 | |
| Without CDSC | | 0.15 | | (0.42) | | 0.40 | | 2.27 | |
| Class F since 11/30/18 | | | | | | | | | |
| No Sales Charge | | 1.09 | | 0.59 | | N/A | | 1.10 | |
| Class Y since 4/01/96 | | | | | | | | | |
| No Sales Charge | | 1.16 | | 0.56 | | 1.40 | | 3.37 | |
| Bloomberg Intermediate Index | | 2.05 | | 1.41 | | 2.04 | | 4.58* | (Class A) |
| | | | | | | | | 3.78 | (Class C & Y) |
| | | | | | | | | 1.61 | (Class F) |
Total return figures shown for the Trust reflect any change in price and assume all distributions, including capital gains, within the period were invested in additional shares. The returns shown do not reflect the deduction of taxes that a shareholder would pay on Trust distributions or the redemption of Trust Shares. The rates of return will vary and the principal value of an investment will fluctuate with market conditions. Shares, if redeemed, may be worth more or less than their original cost. A portion of each class’s income may be subject to Federal and state income taxes and/or the Federal Alternative Minimum Tax (“AMT”). Past performance is not predictive of future investment results.
* From commencement of the Bloomberg Barclays Quality Index on 1/1/87.
** CDSC = 1% contingent deferred sales charge imposed on redemptions made within the first 12 months after purchase.
5 | Hawaiian Tax-Free Trust
PERFORMANCE REPORT (continued)
| *** | Source: Bloomberg Index Services Limited. BLOOMBERG® is a trademark and service mark of Bloomberg Finance L.P. and its affiliates (collectively “Bloomberg”). Bloomberg or Bloomberg’s licensors own all proprietary rights in the Bloomberg Indices. Bloomberg does not approve or endorse this material or guarantee the accuracy or completeness of any information therein, nor does Bloomberg make any warranty, express or implied, as to results to be obtained therefrom, and, to the maximum extent allowed by the law, Bloomberg shall not have any liability or responsibility for any injury or damages arising in connection therewith. |
6 | Hawaiian Tax-Free Trust
REPORT OF INDEPENDENT REGISTERED PUBLIC ACCOUNTING FIRM To the Board of Trustees and the Shareholders of Hawaiian Tax-Free Trust: Opinion on the Financial Statements We have audited the accompanying statement of assets and liabilities of Hawaiian Tax-Free Trust (the “Trust”), including the schedule of investments, as of March 31, 2024, the related statement of operations for the year then ended, the statements of changes in net assets for each of the two years in the period then ended, and financial highlights for each of the five years in the period then ended, and the related notes (collectively referred to as the “financial statements”). In our opinion, the financial statements present fairly, in all material respects, the financial position of the Trust as of March 31, 2024, the results of its operations for the year then ended, the changes in its net assets for each of the two years in the period then ended, and its financial highlights for each of the five years in the period then ended, in conformity with accounting principles generally accepted in the United States of America. Basis for Opinion These financial statements are the responsibility of the Trust’s management. Our responsibility is to express an opinion on the Trust’s financial statements based on our audits. We are a public accounting firm registered with the Public Company Accounting Oversight Board (United States) (“PCAOB”) and are required to be independent with respect to the Trust in accordance with the U.S. federal securities laws and the applicable rules and regulations of the Securities and Exchange Commission and the PCAOB. We have served as the auditor for the Trust since 2005. We conducted our audit in accordance with the standards of the PCAOB. Those standards require that we plan and perform the audit to obtain reasonable assurance about whether the financial statements are free of material misstatement, whether due to error or fraud. The Trust is not required to have, nor were we engaged to perform, an audit of its internal control over financial reporting. As part of our audit we are required to obtain an understanding of internal control over financial reporting, but not for the purpose of expressing an opinion on the effectiveness of the Trust’s internal control over financial reporting. Accordingly, we express no such opinion. Our audit included performing procedures to assess the risks of material misstatement of the financial statements, whether due to error or fraud, and performing procedures that respond to those risks. Such procedures included examining, on a test basis, evidence regarding the amounts and disclosures in the financial statements. Our audits also included evaluating the accounting principles used and significant estimates made by management, as well as evaluating the overall presentation of the financial statements. Our procedures included confirmation of securities owned as of March 31, 2024 by correspondence with the custodian and brokers. We believe that our audit provides a reasonable basis for our opinion. TAIT, WELLER & BAKER LLP Philadelphia, Pennsylvania May 30, 2024 |
7 | Hawaiian Tax-Free Trust
HAWAIIAN TAX-FREE TRUST SCHEDULE OF INVESTMENTS MARCH 31, 2024 |
Principal
Amount | | General Obligation Bonds (37.0%) | | Ratings
Moody’s, S&P
and Fitch
(unaudited) | | Value |
| | | City & County (13.4%) | | | | |
| | | City and County of Honolulu, Hawaii | | | | |
| $ 1,000,000 | | 5.000%, 10/01/25 Series A | | Aa2/NR/AA+ | | $ 1,027,830 |
| 5,055,000 | | 5.000%, 10/01/26 Series A | | Aa2/NR/AA+ | | 5,182,639 |
| 1,735,000 | | 5.000%, 10/01/29 Series A | | Aa2/NR/AA+ | | 1,775,217 |
| 1,300,000 | | 5.000%, 10/01/35 Series A | | Aa2/NR/AA+ | | 1,325,948 |
| 1,000,000 | | 5.000%, 10/01/36 Series A | | Aa2/NR/AA+ | | 1,018,350 |
| 2,095,000 | | 5.000%, 10/01/27 Series C | | Aa2/NR/AA+ | | 2,146,956 |
| 4,510,000 | | 5.000%, 10/01/28 Series C | | Aa2/NR/AA+ | | 4,619,187 |
| 575,000 | | 5.000%, 10/01/29 Series C | | Aa2/NR/AA+ | | 588,329 |
| 1,820,000 | | 5.000%, 09/01/29 Series 2017E | | Aa2/NR/AA+ | | 1,941,685 |
| 1,500,000 | | 5.000%, 09/01/25 Series 2019A | | Aa2/NR/AA+ | | 1,538,985 |
| 1,060,000 | | 5.000%, 09/01/26 Series 2019A | | Aa2/NR/AA+ | | 1,110,339 |
| 1,565,000 | | 4.000%, 08/01/43 Series 2019C | | Aa2/NR/AA+ | | 1,572,199 |
| 500,000 | | 4.000%, 09/01/36 Series 2020A | | Aa2/NR/AA+ | | 518,295 |
| 640,000 | | 4.000%, 09/01/39 Series 2020A | | Aa2/NR/AA+ | | 650,918 |
| 500,000 | | 4.000%, 09/01/40 Series 2020A | | Aa2/NR/AA+ | | 506,025 |
| 1,000,000 | | 3.000%, 07/01/37 Series 2020C | | Aa2/NR/AA+ | | 927,250 |
| 1,000,000 | | 4.000%, 07/01/39 Series 2020C | | Aa2/NR/AA+ | | 1,018,860 |
| 930,000 | | 5.000%, 07/01/43 Series 2020C | | Aa2/NR/AA+ | | 1,004,307 |
| 175,000 | | 5.000%, 07/01/33 Series 2020F | | Aa2/NR/AA+ | | 197,551 |
| 3,920,000 | | 5.250%, 07/01/46 Series 2022B | | Aa2/NR/AA+ | | 4,368,918 |
| 5,155,000 | | 5.000%, 07/01/47 Series 2022B | | Aa2/NR/AA+ | | 5,615,393 |
| 2,435,000 | | 5.000%, 07/01/42 Series 2023A | | NR/AA+/AA+ | | 2,722,500 |
| 1,500,000 | | 5.000%, 07/01/43 Series 2023A | | NR/AA+/AA+ | | 1,669,335 |
| 3,400,000 | | 5.000%, 07/01/44 Series 2023A | | NR/AA+/AA+ | | 3,772,878 |
| 3,455,000 | | 5.000%, 07/01/45 Series 2023A | | NR/AA+/AA+ | | 3,820,677 |
| 3,865,000 | | 5.000%, 07/01/46 Series 2023A | | NR/AA+/AA+ | | 4,260,853 |
| 4,115,000 | | 5.000%, 07/01/47 Series 2023A | | NR/AA+/AA+ | | 4,503,456 |
| 3,325,000 | | 5.000%, 07/01/48 Series 2023A | | NR/AA+/AA+ | | 3,629,969 |
| | | Total City & County | | | | 63,034,849 |
| | | | | | | |
8 | Hawaiian Tax-Free Trust
HAWAIIAN TAX-FREE TRUST SCHEDULE OF INVESTMENTS (continued) MARCH 31, 2024 |
Principal
Amount | | General Obligation Bonds (continued) | | Ratings
Moody’s, S&P
and Fitch
(unaudited) | | Value |
| | | County (10.1%) | | | | |
| | | County of Hawaii | | | | |
| $ 1,000,000 | | 5.000%, 09/01/30 Series 2016A | | Aa2/AA+/NR | | $ 1,032,880 |
| 1,095,000 | | 4.000%, 09/01/35 Series 2016A | | Aa2/AA+/NR | | 1,109,454 |
| 4,000,000 | | 5.000%, 09/01/29 Series 2017A | | Aa2/NR/AA+ | | 4,233,040 |
| 2,000,000 | | 4.000%, 09/01/28 Series 2017D | | Aa2/NR/AA+ | | 2,061,000 |
| 1,000,000 | | 4.000%, 09/01/31 Series 2017D | | Aa2/NR/AA+ | | 1,028,050 |
| 1,050,000 | | 5.000%, 09/01/25 Series 2020A | | Aa2/AA+/AA+ | | 1,076,260 |
| 2,000,000 | | 5.000%, 09/01/29 Series 2020A | | Aa2/AA+/AA+ | | 2,229,060 |
| 2,250,000 | | 5.000%, 09/01/31 Series 2020A | | Aa2/AA+/AA+ | | 2,553,863 |
| 1,000,000 | | 5.000%, 09/01/37 Series 2020A | | Aa2/AA+/AA+ | | 1,114,980 |
| 4,570,000 | | 5.000%, 09/01/41 Series 2023 | | NR/AA+/AA+ | | 5,159,484 |
| | | County of Kauai, Hawaii | | | | |
| 300,000 | | 3.000%, 08/01/24 Series 2017 | | Aa2/NR/AA | | 298,641 |
| 295,000 | | 5.000%, 08/01/25 Series 2017 | | Aa2/NR/AA | | 301,788 |
| 235,000 | | 5.000%, 08/01/26 Series 2017 | | Aa2/NR/AA | | 245,429 |
| 285,000 | | 5.000%, 08/01/28 Series 2017 | | Aa2/NR/AA | | 304,542 |
| 825,000 | | 2.500%, 08/01/29 Series 2017 | | Aa2/NR/AA | | 805,167 |
| 385,000 | | 5.000%, 08/01/30 Series 2017 | | Aa2/NR/AA | | 410,641 |
| 200,000 | | 4.000%, 08/01/32 Series 2017 | | Aa2/NR/AA | | 205,836 |
| 200,000 | | 5.000%, 08/01/37 Series 2017 | | Aa2/NR/AA | | 209,814 |
| | | County of Maui, Hawaii | | | | |
| 4,000,000 | | 5.000%, 09/01/30 Series 2018 | | Aa2/AA+/AA+ | | 4,377,560 |
| 1,275,000 | | 5.000%, 03/01/34 Series 2020 | | Aa2/AA+/AA+ | | 1,432,743 |
| 1,200,000 | | 5.000%, 03/01/40 Series 2020 | | Aa2/AA+/AA+ | | 1,304,172 |
| 1,000,000 | | 5.000%, 03/01/33 Series 2022 | | Aa2/AA+/AA+ | | 1,161,940 |
| 925,000 | | 5.000%, 03/01/34 Series 2022 | | Aa2/AA+/AA+ | | 1,073,416 |
| 1,650,000 | | 5.000%, 03/01/38 Series 2022 | | Aa2/AA+/AA+ | | 1,854,584 |
| 3,885,000 | | 5.000%, 03/01/39 Series 2022 | | Aa2/AA+/AA+ | | 4,345,567 |
| 4,075,000 | | 5.000%, 03/01/40 Series 2022 | | Aa2/AA+/AA+ | | 4,533,438 |
| 1,350,000 | | 5.000%, 03/01/41 Series 2022 | | Aa2/AA+/AA+ | | 1,494,626 |
| 1,575,000 | | 5.000%, 03/01/42 Series 2022 | | Aa2/AA+/AA+ | | 1,736,075 |
| | | Total County | | | | 47,694,050 |
| | | | | | | |
9 | Hawaiian Tax-Free Trust
HAWAIIAN TAX-FREE TRUST SCHEDULE OF INVESTMENTS (continued) MARCH 31, 2024 |
Principal
Amount | | General Obligation Bonds (continued) | | Ratings
Moody’s, S&P
and Fitch
(unaudited) | | Value |
| | | State (13.5%) | | | | |
| | | State of Hawaii | | | | |
| $ 1,735,000 | | 5.000%, 08/01/28 Series EO | | NR/AA+/AA | | $ 1,743,658 |
| 1,475,000 | | 5.000%, 08/01/29 Series EO | | NR/AA+/AA | | 1,482,213 |
| 3,195,000 | | 5.000%, 08/01/30 Series EO | | Aa2/AA+/AA | | 3,210,400 |
| 5,000,000 | | 5.000%, 08/01/24 Series EP | | Aa2/AA+/AA | | 5,022,700 |
| 6,225,000 | | 5.000%, 04/01/27 Series FB | | Aa2/AA+/AA | | 6,450,469 |
| 2,255,000 | | 4.000%, 04/01/29 Series FB | | Aa2/AA+/AA | | 2,289,231 |
| 825,000 | | 5.000%, 10/01/25 Series FH | | Aa2/AA+/AA | | 847,844 |
| 6,460,000 | | 4.000%, 10/01/30 Series FH | | Aa2/AA+/AA | | 6,589,781 |
| 1,215,000 | | 5.000%, 10/01/31 Series FN | | Aa2/AA+/AA | | 1,293,149 |
| 10,100,000 | | 5.000%, 01/01/29 Series FT | | Aa2/AA+/AA | | 10,914,262 |
| 1,680,000 | | 5.000%, 01/01/30 Series FT | | Aa2/AA+/AA | | 1,815,929 |
| 4,100,000 | | 5.000%, 01/01/33 Series FT | | Aa2/AA+/AA | | 4,409,919 |
| 1,095,000 | | 5.000%, 01/01/38 Series FT | | Aa2/AA+/AA | | 1,164,675 |
| 4,000,000 | | 4.000%, 01/01/25 Series FW | | Aa2/AA+/AA | | 4,018,680 |
| 2,000,000 | | 4.000%, 01/01/34 Series FW | | Aa2/AA+/AA | | 2,081,440 |
| 3,000,000 | | 5.000%, 01/01/37 Series FW | | Aa2/AA+/AA | | 3,271,710 |
| 6,000,000 | | 5.000%, 01/01/38 Series FW | | Aa2/AA+/AA | | 6,490,020 |
| 400,000 | | 5.000%, 01/01/39 Series FW | | Aa2/AA+/AA | | 430,676 |
| | | Total State | | | | 63,526,756 |
| | | Total General Obligation Bonds | | | | 174,255,655 |
| | | | | | | |
| | | Revenue Bonds (55.5%) | | | | |
| | | Airport (5.0%) | | | | |
| | | State of Hawaii Airport System Revenue | | | | |
| 2,000,000 | | 5.000%, 07/01/41 Series 2015A AMT | | A1/AA-/AA- | | 2,012,160 |
| 3,000,000 | | 5.000%, 07/01/45 Series 2015A AMT | | A1/AA-/AA- | | 3,010,890 |
| 2,465,000 | | 5.000%, 07/01/48 Series 2018A AMT | | A1/AA-/AA- | | 2,525,121 |
| 12,000,000 | | 5.000%, 07/01/51 Series 2022A AMT | | A1/AA-/AA- | | 12,613,080 |
| | | State of Hawaii Department of Transportation Airports Division Lease Revenue COP AMT | | | | |
| 3,435,000 | | 5.250%, 08/01/25 Series 2013 | | A2/A+/A+ | | 3,436,546 |
| | | Total Airport | | | | 23,597,797 |
10 | Hawaiian Tax-Free Trust
HAWAIIAN TAX-FREE TRUST SCHEDULE OF INVESTMENTS (continued) MARCH 31, 2024 |
Principal
Amount | | Revenue Bonds (continued) | | Ratings
Moody’s, S&P
and Fitch
(unaudited) | | Value |
| | | Education (5.5%) | | | | |
| | | Hawaii State Department of Budget and Finance, Special Purpose Revenue (Mid-Pacific Institute) | | | | |
| $ 340,000 | | 4.000%, 01/01/28 Series 2020 | | NR/BBB+/NR | | $ 338,147 |
| 360,000 | | 4.000%, 01/01/29 Series 2020 | | NR/BBB+/NR | | 358,006 |
| 540,000 | | 4.000%, 01/01/32 Series 2020 | | NR/BBB+/NR | | 535,820 |
| 540,000 | | 4.000%, 01/01/33 Series 2020 | | NR/BBB+/NR | | 534,389 |
| 435,000 | | 3.000%, 01/01/34 Series 2020 | | NR/BBB+/NR | | 386,476 |
| 300,000 | | 3.000%, 01/01/35 Series 2020 | | NR/BBB+/NR | | 264,711 |
| 280,000 | | 3.000%, 01/01/36 Series 2020 | | NR/BBB+/NR | | 243,018 |
| | | University of Hawaii | | | | |
| 1,250,000 | | 4.000%, 10/01/24 Series 2015B | | Aa3/NR/AA | | 1,251,900 |
| 1,125,000 | | 5.000%, 10/01/25 Series 2015B | | Aa3/NR/AA | | 1,152,821 |
| 1,065,000 | | 5.000%, 10/01/26 Series 2015B | | Aa3/NR/AA | | 1,088,909 |
| 4,635,000 | | 5.000%, 10/01/29 Series 2015E | | Aa3/NR/AA | | 4,830,226 |
| 3,825,000 | | 5.000%, 10/01/31 Series 2015E | | Aa3/NR/AA | | 3,972,110 |
| 1,595,000 | | 5.000%, 10/01/25 Series 2017F | | Aa3/NR/AA | | 1,634,444 |
| 1,335,000 | | 5.000%, 10/01/29 Series 2017F | | Aa3/NR/AA | | 1,430,105 |
| 2,080,000 | | 5.000%, 10/01/30 Series 2017F | | Aa3/NR/AA | | 2,231,694 |
| 2,690,000 | | 5.000%, 10/01/31 Series 2017F | | Aa3/NR/AA | | 2,887,231 |
| 655,000 | | 5.000%, 10/01/34 Series 2017F | | Aa3/NR/AA | | 701,813 |
| 2,000,000 | | 4.000%, 10/01/33 Series 2020D | | Aa3/NR/AA | | 2,104,780 |
| | | Total Education | | | | 25,946,600 |
| | | | | | | |
| | | Housing (0.4%) | | | | |
| | | State of Hawaii Housing Finance and Development Corp., Iwilei Apartments | | | | |
| 1,825,000 | | 3.750%, 01/01/31 Series 2012A FHLMC Insured Liquidity Agreement | | NR/AA+/NR | | 1,825,620 |
| | | | | | | |
11 | Hawaiian Tax-Free Trust
HAWAIIAN TAX-FREE TRUST SCHEDULE OF INVESTMENTS (continued) MARCH 31, 2024 |
Principal
Amount | | Revenue Bonds (continued) | | Ratings
Moody’s, S&P
and Fitch
(unaudited) | | Value |
| | | Medical (12.3%) | | | | |
| | | Hawaii State Department of Budget and Finance, Special Purpose Revenue (Hawaii Pacific Health) | | | | |
| $ 1,645,000 | | 5.000%, 07/01/24 Group A | | A1/NR/AA- | | $ 1,648,948 |
| 1,890,000 | | 5.000%, 07/01/25 Group A | | A1/NR/AA- | | 1,923,793 |
| 1,745,000 | | 5.000%, 07/01/29 Group A | | A1/NR/AA- | | 1,902,399 |
| 1,855,000 | | 5.000%, 07/01/30 Group A | | A1/NR/AA- | | 2,051,278 |
| 1,975,000 | | 5.000%, 07/01/31 Group A | | A1/NR/AA- | | 2,206,885 |
| 4,000,000 | | 5.000%, 07/01/33 Group A | | A1/NR/AA- | | 4,580,600 |
| 2,675,000 | | 5.000%, 07/01/37 Group B | | A1/NR/AA- | | 3,028,474 |
| 2,585,000 | | 5.000%, 07/01/30 Group B | | A1/NR/AA- | | 2,858,519 |
| 2,855,000 | | 5.000%, 07/01/32 Group B | | A1/NR/AA- | | 3,231,432 |
| 10,000,000 | | 5.500%, 07/01/52 Group C | | A1/NR/AA- | | 10,973,800 |
| | | Hawaii State Department of Budget and Finance, Special Purpose Revenue (Queens Health System) | | | | |
| 3,120,000 | | 5.000%, 07/01/25 Series 2015A | | NR/AA-/AA | | 3,175,786 |
| 1,500,000 | | 5.000%, 07/01/26 Series 2015A | | NR/AA-/AA | | 1,528,470 |
| 2,400,000 | | 5.000%, 07/01/27 Series 2015A | | NR/AA-/AA | | 2,443,008 |
| 600,000 | | 5.000%, 07/01/28 Series 2015A | | NR/AA-/AA | | 611,316 |
| 15,520,000 | | 5.000%, 07/01/35 Series 2015A | | NR/AA-/AA | | 15,804,637 |
| | | Total Medical | | | | 57,969,345 |
| | | | | | | |
| | | Transportation (9.8%) | | | | |
| | | State of Hawaii Harbor System | | | | |
| 1,000,000 | | 4.000%, 07/01/33 Series 2020A AMT | | Aa3/NR/AA- | | 1,026,890 |
| 495,000 | | 4.000%, 07/01/35 Series 2020A AMT | | Aa3/NR/AA- | | 506,172 |
| 10,000,000 | | 4.000%, 07/01/36 Series 2020A AMT | | Aa3/NR/AA- | | 10,139,500 |
| 9,000,000 | | 4.000%, 07/01/37 Series 2020A AMT | | Aa3/NR/AA- | | 9,058,950 |
| 430,000 | | 5.000%, 07/01/29 Series 2020C | | Aa3/NR/AA- | | 475,361 |
| 200,000 | | 4.000%, 07/01/34 Series 2020C | | Aa3/NR/AA- | | 210,278 |
| 560,000 | | 4.000%, 07/01/37 Series 2020C | | Aa3/NR/AA- | | 574,616 |
| 875,000 | | 4.000%, 07/01/38 Series 2020C | | Aa3/NR/AA- | | 890,059 |
| | | | | | | |
12 | Hawaiian Tax-Free Trust
HAWAIIAN TAX-FREE TRUST SCHEDULE OF INVESTMENTS (continued) MARCH 31, 2024 |
Principal
Amount | | Revenue Bonds (continued) | | Ratings
Moody’s, S&P
and Fitch
(unaudited) | | Value |
| | | Transportation (continued) | | | | |
| | | State of Hawaii Highway Revenue | | | | |
| $ 1,000,000 | | 5.000%, 01/01/27 Series 2016A | | Aa2/AA+/AA | | $ 1,039,830 |
| 5,000,000 | | 5.000%, 01/01/30 Series 2016A | | Aa2/AA+/AA | | 5,188,100 |
| 4,500,000 | | 4.000%, 01/01/31 Series 2016A | | Aa2/AA+/AA | | 4,578,345 |
| 1,000,000 | | 5.000%, 01/01/32 Series 2019A | | Aa2/AA+/NR | | 1,101,230 |
| 1,010,000 | | 5.000%, 01/01/35 Series 2021 | | Aa2/AA+/NR | | 1,148,784 |
| 2,800,000 | | 5.000%, 01/01/37 Series 2021 | | Aa2/AA+/NR | | 3,150,392 |
| 3,000,000 | | 5.000%, 01/01/39 Series 2021 | | Aa2/AA+/NR | | 3,324,660 |
| 3,580,000 | | 5.000%, 01/01/41 Series 2021 | | Aa2/AA+/NR | | 3,934,384 |
| | | Total Transportation | | | | 46,347,551 |
| | | | | | | |
| | | Utility (1.8%) | | | | |
| | | Hawaii State Department of Budget and Finance, Special Purpose Revenue (Hawaiian Electric Co.) | | | | |
| 6,300,000 | | 3.200%, 07/01/39 Series 2019 | | Ba3/NR/B+ | | 4,166,505 |
| 7,000,000 | | 3.500%, 10/01/49 Series 2019 AMT | | Ba3/NR/B+ | | 4,551,540 |
| | | Total Utility | | | | 8,718,045 |
| | | | | | | |
| | | Water & Sewer (19.6%) | | | | |
| | | City and County of Honolulu, Hawaii, Board of Water Supply Water System | | | | |
| 1,890,000 | | 4.000%, 07/01/37 Series 2020A | | NR/AAA/AAA | | 1,941,465 |
| 35,000 | | 4.000%, 07/01/39 Series 2021A | | NR/AAA/AAA | | 35,753 |
| 760,000 | | 5.000%, 07/01/40 Series 2023 | | NR/AAA/AAA | | 863,816 |
| 800,000 | | 5.000%, 07/01/41 Series 2023 | | NR/AAA/AAA | | 901,616 |
| 885,000 | | 5.000%, 07/01/43 Series 2023 | | NR/AAA/AAA | | 988,598 |
| 5,150,000 | | 5.000%, 07/01/52 Series 2023 | | NR/AAA/AAA | | 5,607,011 |
| 7,500,000 | | 5.250%, 07/01/49 Series 2024A Green Bond | | NR/AAA/AAA | | 8,473,125 |
| | | | | | | |
13 | Hawaiian Tax-Free Trust
HAWAIIAN TAX-FREE TRUST SCHEDULE OF INVESTMENTS (continued) MARCH 31, 2024 |
Principal
Amount | | Revenue Bonds (continued) | | Ratings
Moody’s, S&P
and Fitch
(unaudited) | | Value |
| | | Water & Sewer (continued) | | | | |
| | | City and County of Honolulu, Hawaii, Wastewater System (First Bond Resolution) | | | | |
| $ 1,500,000 | | 5.000%, 07/01/24 Senior Series 2015B | | Aa2/NR/AA | | $ 1,504,980 |
| 2,095,000 | | 5.000%, 07/01/25 Senior Series 2015B | | Aa2/NR/AA | | 2,141,991 |
| 2,085,000 | | 5.000%, 07/01/34 Senior Series 2016A | | Aa2/NR/AA | | 2,163,438 |
| 635,000 | | 5.000%, 07/01/35 Senior Series 2016B | | Aa2/NR/AA | | 658,051 |
| 6,000,000 | | 5.000%, 07/01/36 Senior Series 2018A | | Aa2/NR/AA | | 6,417,300 |
| 770,000 | | 5.000%, 07/01/44 Senior Series 2019A | | Aa2/NR/AA | | 821,590 |
| | | City and County of Honolulu, Hawaii, Wastewater System (First Bond Resolution) Green Bond | | | | |
| 4,000,000 | | 5.000%, 07/01/47 Senior Series 2022A | | Aa2/NR/AA | | 4,363,160 |
| 17,500,000 | | 5.250%, 07/01/51 Senior Series 2022A | | Aa2/NR/AA | | 19,250,525 |
| 19,360,000 | | 5.000%, 07/01/51 Senior Series 2022A | | Aa2/NR/AA | | 20,885,955 |
| 10,000,000 | | 5.250%, 07/01/53 Senior Series 2023 | | NR/AA+/AA | | 11,083,100 |
| | | City and County of Honolulu, Hawaii, Wastewater System (Second Bond Resolution) Junior Series 2015A | | | | |
| 4,000,000 | | 5.000%, 07/01/25 Junior Series 2015A | | Aa3/NR/AA- | | 4,089,720 |
| | | Total Water & Sewer | | | | 92,191,194 |
| | | | | | | |
| | | Other (1.1%) | | | | |
| | | Hawaii State Department of Hawaiian Home Lands | | | | |
| 500,000 | | 5.000%, 04/01/24 Series 2017 | | A1/NR/NR | | 500,000 |
| 945,000 | | 5.000%, 04/01/26 Series 2017 | | A1/NR/NR | | 978,122 |
| 905,000 | | 5.000%, 04/01/29 Series 2017 | | A1/NR/NR | | 950,485 |
| 840,000 | | 5.000%, 04/01/30 Series 2017 | | A1/NR/NR | | 879,774 |
| | | Hawaii State Department of Hawaiian Home Lands, COP (Kapolei Office Facility) | | | | |
| 330,000 | | 5.000%, 11/01/24 Series 2017A | | Aa3/NR/NR | | 332,531 |
| 145,000 | | 5.000%, 11/01/25 Series 2017A | | Aa3/NR/NR | | 148,803 |
| 1,115,000 | | 5.000%, 11/01/27 Series 2017A | | Aa3/NR/NR | | 1,193,396 |
| | | Total Other | | | | 4,983,111 |
| | | Total Revenue Bonds | | | | 261,579,263 |
| | | | | | | |
14 | Hawaiian Tax-Free Trust
HAWAIIAN TAX-FREE TRUST SCHEDULE OF INVESTMENTS (continued) MARCH 31, 2024 |
Principal
Amount | | Pre-Refunded Bonds\Escrowed
to Maturity Bonds (5.4%)†† | | Ratings
Moody’s, S&P
and Fitch
(unaudited) | | Value |
| | | Pre-Refunded General Obligation Bonds (3.0%) | | | | |
| | | State (3.0%) | | | | |
| | | State of Hawaii | | | | |
| $ 590,000 | | 5.000%, 08/01/27 Series EO | | NR/NR/NR* | | $ 592,366 |
| 265,000 | | 5.000%, 08/01/28 Series EO | | NR/NR/NR* | | 266,063 |
| 570,000 | | 5.000%, 08/01/29 Series EO | | NR/NR/NR* | | 572,286 |
| 5,280,000 | | 5.000%, 08/01/25 Series EP | | Aa2/AA+/AA | | 5,302,915 |
| 5,300,000 | | 5.000%, 08/01/26 Series EP | | Aa2/AA+/AA | | 5,323,002 |
| 2,070,000 | | 5.000%, 10/01/30 Series ET | | Aa2/AA+/AA | | 2,123,944 |
| | | Total Pre-Refunded General Obligation Bonds | | | | 14,180,576 |
| | | | | | | |
| | | Pre-Refunded\Escrowed to Maturity Revenue Bonds (2.4%) | | | | |
| | | Water & Sewer (2.4%) | | | | |
| | | City and County of Honolulu, Hawaii, Board of Water Supply Water System | | | | |
| 700,000 | | 5.000%, 07/01/24 Series 2014A ETM | | Aa2/NR/AAA | | 702,289 |
| 1,795,000 | | 5.000%, 07/01/26 Series 2014A | | Aa2/NR/AAA | | 1,800,421 |
| 875,000 | | 5.000%, 07/01/27 Series 2014A | | Aa2/NR/AAA | | 877,643 |
| 1,750,000 | | 5.000%, 07/01/28 Series 2014A | | Aa2/NR/AAA | | 1,755,285 |
| | | | | | | |
| | | City and County of Honolulu, Hawaii, Wastewater System (First Bond Resolution) | | | | |
| 200,000 | | 5.000%, 07/01/40 Senior Series 2015A | | Aa2/NR/AA | | 204,314 |
| 2,150,000 | | 5.000%, 07/01/30 Senior Series 2015B | | Aa2/NR/AA | | 2,196,376 |
| 3,700,000 | | 5.000%, 07/01/31 Senior Series 2015B | | Aa2/NR/AA | | 3,779,809 |
| | | Total Pre-Refunded\Escrowed to Maturity Revenue Bonds | | | | 11,316,137 |
| | | Total Pre-Refunded\Escrowed to Maturity Bonds | | | | 25,496,713 |
| | | Total Municipal Bonds
(cost $474,517,141) | | | | 461,331,631 |
15 | Hawaiian Tax-Free Trust
HAWAIIAN TAX-FREE TRUST SCHEDULE OF INVESTMENTS (continued) MARCH 31, 2024 |
| Shares | | Short-Term Investment (2.9%) | | Ratings
Moody’s, S&P
and Fitch
(unaudited) | | Value |
| 13,799,744 | | Dreyfus Government Cash Management, Institutional Shares,
5.20%** (cost $13,799,744) | | Aaa-mf/AAAm/NR | | $ 13,799,744 |
| | | | | | | |
| | | Total Investments
(cost $488,316,885 - note 4) | | 100.8% | | 475,131,375 |
| | | Other assets less liabilities | | (0.8) | | (3,775,806) |
| | | Net Assets | | 100.0% | | $ 471,355,569 |
| Portfolio Distribution By Quality Rating (unaudited) | | Percentage of
Investments† |
| Aaa-mf of Moody's or AAA and AAAm of S&P or AAA of Fitch | | 6.8% |
| Pre-Refunded\ETM Bonds†† | | 5.4 |
| Aa of Moody's or AA of S&P or Fitch | | 84.0 |
| A of Moody's or S&P or Fitch | | 1.4 |
| BBB of S&P | | 0.6 |
| Ba of Moody’s | | 1.8 |
| | | 100.0% |
| PORTFOLIO ABBREVIATIONS |
AMT - Alternative Minimum Tax COP - Certificates of Participation ETM – Escrowed to Maturity FHLMC - Federal Home Loan Mortgage Corp. NR - Not Rated |
| * | Any security not rated (“NR”) by any of the Nationally Recognized Statistical Rating Organizations (“NRSRO”) has been determined by the Investment Adviser to have sufficient quality to be ranked in the top four credit ratings if a credit rating were to be assigned by a NRSRO. |
| | |
| ** | The rate is an annualized seven-day yield at period end. |
| | |
| † | Where applicable, calculated using the highest rating of the three NRSRO. |
| | |
| †† | Pre-refunded bonds are bonds for which U.S. Government Obligations usually have been placed in escrow to retire the bonds at their earliest call date. Escrowed to Maturity bonds are bonds where money has been placed in the escrow account which is used to pay principal and interest through the bond’s originally scheduled maturity date. Escrowed to Maturity are shown as ETM. All other securities in the category are pre-refunded. |
See accompanying notes to financial statements.
16 | Hawaiian Tax-Free Trust
HAWAIIAN TAX-FREE TRUST STATEMENT OF ASSETS AND LIABILITIES MARCH 31, 2024 |
| ASSETS | | | |
| Investments at value (cost $488,316,885) | | $ | 475,131,375 |
| Interest receivable | | | 6,119,788 |
| Receivable for Trust Shares sold | | | 150,178 |
| Other assets | | | 81,574 |
| Total assets | | | 481,482,915 |
| LIABILITIES | | | |
| Payables: | | | |
| Investment securities purchased | | | 8,490,075 |
| Fund shares redeemed | | | 1,036,231 |
| Dividends | | | 188,005 |
| Advisory and Administrative fees | | | 181,001 |
| Distribution and service fees payable | | | 1,942 |
| Accrued other expenses | | | 230,092 |
| Total liabilities | | | 10,127,346 |
| NET ASSETS | | $ | 471,355,569 |
| Net Assets consist of: | | | |
| Capital Stock – Authorized an unlimited number of shares, par value $0.01 per share | | $ | 448,344 |
| Additional paid-in capital | | | 494,054,615 |
| Total distributable earnings (losses) | | | (23,147,390) |
| | | $ | 471,355,569 |
| CLASS A | | | |
| Net Assets | | $ | 413,158,521 |
| Capital shares outstanding | | | 39,306,197 |
| Net asset value and redemption price per share | | $ | 10.51 |
| Maximum offering price per share (100/97 of $10.51) | | $ | 10.84 |
| CLASS C | | | |
| Net Assets | | $ | 6,190,553 |
| Capital shares outstanding | | | 589,294 |
| Net asset value and offering price per share | | $ | 10.51 |
| CLASS F | | | |
| Net Assets | | $ | 399,941 |
| Capital shares outstanding | | | 38,017 |
| Net asset value, offering and redemption price per share | | $ | 10.52 |
| CLASS Y | | | |
| Net Assets | | $ | 51,606,554 |
| Capital shares outstanding | | | 4,900,869 |
| Net asset value, offering and redemption price per share | | $ | 10.53 |
See accompanying notes to financial statements.
17 | Hawaiian Tax-Free Trust
HAWAIIAN TAX-FREE TRUST STATEMENT OF OPERATIONS YEAR ENDED MARCH 31, 2024 |
| Investment Income | | | | | | |
| Interest income | | | | | $ | 14,120,089 |
| | | | | | | |
| Expenses | | | | | | |
| Investment Adviser fee (note 3) | | $ | 1,133,691 | | | |
| Administrator/Business Manager fee (note 3) | | | 1,084,400 | | | |
| Distribution and service fee (note 3) | | | 936,450 | | | |
| Transfer and shareholder servicing agent fees | | | 371,283 | | | |
| Trustees’ fees and expenses (note 7) | | | 229,493 | | | |
| Fund accounting fees | | | 165,513 | | | |
| Legal fees | | | 157,050 | | | |
| Registration fees and dues | | | 50,442 | | | |
| Auditing and tax fees | | | 36,100 | | | |
| Insurance | | | 29,924 | | | |
| Shareholders’ reports and proxy statements | | | 21,402 | | | |
| Custodian fees | | | 20,312 | | | |
| Credit facility fees (note 10) | | | 15,880 | | | |
| Compliance services (note 3) | | | 10,372 | | | |
| Miscellaneous | | | 30,873 | | | |
| | | | | | | |
| Total expenses | | | | | | 4,293,185 |
| Net investment income | | | | | | 9,826,904 |
| | | | | | | |
| Realized and Unrealized Gain (Loss) on Investments | | | | | | |
| Net realized gain (loss) from securities transactions | | | (6,763,230) | | | |
| Change in unrealized appreciation (depreciation) on investments | | | 805,033 | | | |
| | | | | | | |
| Net realized and unrealized gain (loss) on investments | | | | | | (5,958,197) |
| Net change in net assets resulting from operations | | | | | $ | 3,868,707 |
See accompanying notes to financial statements.
18 | Hawaiian Tax-Free Trust
HAWAIIAN TAX-FREE TRUST STATEMENT OF CHANGES IN NET ASSETS |
| | | Year Ended
March 31, 2024 | | Year Ended
March 31, 2023 |
| OPERATIONS: | | | | | | |
| Net investment income | | $ | 9,826,904 | | $ | 8,877,774 |
| Realized gain (loss) from securities transactions | | | (6,763,230) | | | (2,262,391) |
| Change in unrealized appreciation (depreciation) on investments | | | 805,033 | | | (8,910,550) |
| Change in net assets resulting from operations | | | 3,868,707 | | | (2,295,167) |
| | | | | | | |
| DISTRIBUTIONS TO SHAREHOLDERS (note 9): | | | | | | |
| Class A Shares | | | (8,539,799) | | | (7,761,146) |
| | | | | | | |
| Class C Shares | | | (88,715) | | | (105,568) |
| | | | | | | |
| Class F Shares | | | (9,549) | | | (5,174) |
| | | | | | | |
| Class Y Shares | | | (1,188,838) | | | (1,178,990) |
| Change in net assets from distributions | | | (9,826,901) | | | (9,050,878) |
| | | | | | | |
| CAPITAL SHARE TRANSACTIONS (note 6): | | | | | | |
| Proceeds from shares sold | | | 19,569,736 | | | 32,952,870 |
| Reinvested dividends and distributions | | | 7,723,414 | | | 7,101,764 |
| Cost of shares redeemed | | | (73,725,068) | | | (91,261,992) |
| Change in net assets from capital share transactions | | | (46,431,918) | | | (51,207,358) |
| | | | | | | |
| Change in net assets | | | (52,390,112) | | | (62,553,403) |
| | | | | | | |
| NET ASSETS: | | | | | | |
| Beginning of period | | | 523,745,681 | | | 586,299,084 |
| End of period | | $ | 471,355,569 | | $ | 523,745,681 |
See accompanying notes to financial statements.
19 | Hawaiian Tax-Free Trust
HAWAIIAN TAX-FREE TRUST NOTES TO FINANCIAL STATEMENTS MARCH 31, 2024 |
1. Organization
Hawaiian Tax-Free Trust (the “Trust”), a non-diversified, open-end investment company, was organized on May 7, 1984, as a Massachusetts business trust and commenced operations on February 20, 1985. The Trust is authorized to issue an unlimited number of shares. Class A Shares are sold at net asset value plus a sales charge of varying size (depending upon a variety of factors) paid at the time of purchase and bear a distribution fee. Class C Shares are sold at net asset value with no sales charge payable at the time of purchase but with a level charge for service and distribution fees for six years thereafter. Class C Shares automatically convert to Class A Shares after six years. Class F Shares and Class Y Shares are sold only through authorized financial institutions acting for investors in a fiduciary, advisory, agency, custodial or similar capacity, and are not offered directly to retail customers. Class F Shares and Class Y Shares are sold at net asset value with no sales charge, no redemption fee, no contingent deferred sales charge (“CDSC”) and no distribution fee. All classes of shares represent interests in the same portfolio of investments and are identical as to rights and privileges but differ with respect to the effect of sales charges, the distribution and/or service fees borne by each class, expenses specific to each class, voting rights on matters affecting a single class and the exchange privileges of each class.
2. Significant Accounting Policies
The following is a summary of significant accounting policies followed by the Trust in the preparation of its financial statements. The policies are in conformity with accounting principles generally accepted in the United States of America for investment companies.
| a) | Portfolio valuation: Municipal securities are valued each business day based upon information provided by a nationally prominent independent pricing service and periodically verified through other pricing services. In the case of securities for which market quotations are readily available, securities are valued by the pricing service at the mean of bid and ask quotations. If a market quotation or a valuation from the pricing service is not readily available, the security is valued using other fair value methods. Rule 2a-5 under the 1940 Act provides that in the event that market quotations are not readily available, such securities must be valued at their fair value as determined in good faith by the Trust’s Board of Trustees. Rule 2a-5 further provides that the Board may choose to designate a “valuation designee” to perform the fair value determination. The Hawaiian Tax-Free Trust Board has designated the Asset Management Group of Bank of Hawaii as the valuation designee (the “Valuation Designee”) to determine the fair value of Fund securities in good faith. The Asset Management Group of Bank of Hawaii as Valuation Designee, selects an appropriate methodology or methodologies for determining and calculating the fair value of Fund investments and applies such methodology or methodologies in a consistent manner, including specifying the key inputs and assumptions specific to each asset class or portfolio holding. |
| b) | Fair value measurements: The Trust follows a fair value hierarchy that distinguishes between market data obtained from independent sources (observable inputs) and the Trust’s own market assumptions (unobservable inputs). These inputs are used in determining the value of the Trust’s investments and are summarized in the following fair value hierarchy: |
20 | Hawaiian Tax-Free Trust
HAWAIIAN TAX-FREE TRUST NOTES TO FINANCIAL STATEMENTS (continued) MARCH 31, 2024 |
Level 1 – Unadjusted quoted prices in active markets for identical assets or liabilities that the Trust has the ability to access.
Level 2 – Observable inputs other than quoted prices included in Level 1 that are observable for the asset or liability, either directly or indirectly. These inputs may include quoted prices for the identical instrument on an inactive market, prices for similar instruments, interest rates, prepayment speeds, credit risk, yield curves, default rates and similar data.
Level 3 – Unobservable inputs for the asset or liability, to the extent relevant observable inputs are not available, representing the Trust’s own assumptions about the assumptions a market participant would use in valuing the asset or liability, based on the best information available.
The inputs or methodology used for valuing securities are not an indication of the risk associated with investing in those securities.
The following is a summary of the valuation inputs, representing 100% of the Trust’s investments, used to value the Trust’s net assets as of March 31, 2024:
| | Valuation Inputs* | | Investments
in Securities |
| | Level 1 – Quoted Prices – Short-Term Investment | | $ | 13,799,744 |
| | Level 2 – Other Significant Observable Inputs – Municipal Bonds* | | | 461,331,631 |
| | Level 3 – Significant Unobservable Inputs | | | — |
| | Total | | $ | 475,131,375 |
| | * See schedule of investments for a detailed listing of securities. | | | |
| c) | Subsequent events: In preparing these financial statements, the Trust has evaluated events and transactions for potential recognition or disclosure through the date these financial statements were issued. |
| d) | Securities transactions and related investment income: Securities transactions are recorded on the trade date. Realized gains and losses from securities transactions are reported on the identified cost basis. Interest income is recorded daily on the accrual basis and is adjusted for amortization of premium and accretion of original issue discount and market discount. |
| e) | Federal income taxes: It is the policy of the Trust to continue to qualify as a regulated investment company by complying with the provisions of the Internal Revenue Code applicable to certain investment companies. The Trust intends to make distributions of income and securities profits sufficient to relieve it from all, or substantially all, Federal income and excise taxes. |
Management has reviewed the tax positions for each of the open tax years (2021 – 2023) or expected to be taken in the Trust’s 2024 tax returns and has concluded that there are no significant uncertain tax positions that would require recognition in the financial statements.
21 | Hawaiian Tax-Free Trust
HAWAIIAN TAX-FREE TRUST NOTES TO FINANCIAL STATEMENTS (continued) MARCH 31, 2024 |
| f) | Multiple class allocations: All income, expenses (other than class-specific expenses), and realized and unrealized gains or losses are allocated daily to each class of shares based on the relative net assets of each class. Class-specific expenses, which include distribution and service fees and any other items that are specifically attributed to a particular class, are also charged directly to such class on a daily basis. |
| g) | Use of estimates: The preparation of financial statements in conformity with accounting principles generally accepted in the United States of America requires management to make estimates and assumptions that affect the reported amounts of assets and liabilities and disclosure of contingent assets and liabilities at the date of the financial statements and the reported amounts of increases and decreases in net assets from operations during the reporting period. Actual results could differ from those estimates. |
| h) | Reclassification of capital accounts: Accounting principles generally accepted in the United States of America require that certain components of net assets relating to permanent differences be reclassified between financial and tax reporting. These reclassifications had no effect on net assets or net asset value per share. For the year ended March 31, 2024, there were no items identified that have been reclassified among components of net assets. |
| i) | The Trust is an investment company and accordingly follows the investment company accounting and reporting guidance of the Financial Accounting Standards Board (“FASB”) Accounting Standard Codification Topic 946 “Financial Services-Investment Companies”. |
3. Fees and Related Party Transactions
| a) | Management Arrangements: |
The Asset Management Group of Bank of Hawaii (the “Adviser”), serves as Investment Adviser to the Trust. In this role, under an Investment Advisory Agreement, the Adviser supervises the Trust’s investments. Aquila Investment Management LLC (the “Administrator/Business Manager”), a wholly-owned subsidiary of Aquila Management Corporation, the Trust’s founder and sponsor, serves as the Administrator/Business Manager for the Trust under an Administration and Business Management Agreement with the Trust. The Administrator/Business Manager provides all administrative services to the Trust other than those relating to its investment portfolio. These include providing the office of the Trust and all related services as well as overseeing the activities of all the various support organizations to the Trust such as the transfer and shareholder servicing agent, fund accounting agent, custodian, legal counsel, auditors and distributor.
The Trust pays the Adviser a fee which is payable monthly and computed on the net assets of the Trust as of the close of business each day at the annual rate of 0.23% of the Trust’s net assets up to and including $875 million; 0.17% of the Trust’s net assets between $875 million and $1.5 billion; and 0.155% of the Trust’s net assets over $1.5 billion. For its services, the Administrator/Business Manager is entitled to receive a fee which is payable monthly and computed as of the close of business each day at the annual rate of 0.22% of the Trust’s net assets.
22 | Hawaiian Tax-Free Trust
HAWAIIAN TAX-FREE TRUST NOTES TO FINANCIAL STATEMENTS (continued) MARCH 31, 2024 |
Under a Compliance Agreement with the Administrator/Business Manager, the Administrator/Business Manager is additionally compensated by the Trust for compliance related services provided to enable the Trust to comply with Rule 38a-1 of the Investment Company Act of 1940, as amended (the “1940 Act”).
Specific details as to the nature and extent of the services provided by the Adviser and the Administrator/Business Manager are more fully defined in the Trust’s Prospectus and Statement of Additional Information.
| b) | Distribution and Service Fees: |
The Trust has adopted a Distribution Plan (the “Plan”) pursuant to Rule 12b-1 (the “Rule”) under the 1940 Act. Under one part of the Plan, with respect to Class A Shares, the Trust is authorized to make distribution fee payments to broker-dealers or others (“Qualified Recipients”) selected by Aquila Distributors LLC (the “Distributor”), including, but not limited to, any principal underwriter of the Trust, with which the Distributor has entered into written agreements contemplated by the Rule and which have rendered assistance in the distribution and/or retention of the Trust’s shares or servicing of shareholder accounts. The Trust makes payment of this distribution fee at the annual rate of 0.20% of the Trust’s average net assets represented by Class A Shares. For the year ended March 31, 2024, distribution fees on Class A Shares amounted to $860,386 of which the Distributor retained $59,959.
Under another part of the Plan, the Trust is authorized to make payments with respect to Class C Shares to Qualified Recipients which have rendered assistance in the distribution and/or retention of the Trust’s Class C shares or servicing of shareholder accounts. These payments are made at the annual rate of 0.75% of the Trust’s average net assets represented by Class C Shares and for the year ended March 31, 2024, amounted to $57,048. In addition, under a Shareholder Services Plan, the Trust is authorized to make service fee payments with respect to Class C Shares to Qualified Recipients for providing personal services and/or maintenance of shareholder accounts. These payments are made at the annual rate of 0.25% of the Trust’s average net assets represented by Class C Shares and for the year ended March 31, 2024, amounted to $19,016. The total of these payments made with respect to Class C Shares amounted to $76,064 of which the Distributor retained $19,059.
Specific details about the Plans are more fully defined in the Trust’s Prospectus and Statement of Additional Information.
Under a Distribution Agreement, the Distributor serves as the exclusive distributor of the Trust’s shares. Through agreements between the Distributor and various brokerage and advisory firms (“financial intermediaries”), the Trust’s shares are sold primarily through the facilities of these financial intermediaries having offices within Hawaii, with the bulk of any sales commissions inuring to such financial intermediaries. For the year ended March 31, 2024, total commissions on sales of Class A Shares amounted to $34,533, of which the Distributor received $8,104.
23 | Hawaiian Tax-Free Trust
HAWAIIAN TAX-FREE TRUST NOTES TO FINANCIAL STATEMENTS (continued) MARCH 31, 2024 |
| c) | Transfer and shareholder servicing fees: |
The Trust occasionally compensates financial intermediaries in connection with the sub-transfer agency related services provided by such entities in connection with their respective Fund shareholders so long as the fees are deemed by the Board of Trustees to be reasonable in relation to (i) the value of the services and the benefits received by the Fund and certain shareholders; and (ii) the payments that the Fund would make to another entity to perform similar ongoing services to existing shareholders.
4. Purchases and Sales of Securities
During the year ended March 31, 2024, purchases of securities and proceeds from the sales of securities aggregated $89,027,802 and $123,769,312, respectively.
At March 31, 2024, the aggregate tax cost for all securities was $488,316,885. At March 31, 2024, the aggregate gross unrealized appreciation for all securities in which there is an excess of value over tax cost amounted to $1,342,128 and aggregate gross unrealized depreciation for all securities in which there is an excess of tax cost over value amounted to $14,527,638 for a net unrealized depreciation of $13,185,510.
5. Portfolio Orientation
Since the Trust invests principally and may invest entirely in double tax-free municipal obligations of issuers within Hawaii, it is subject to possible risks associated with economic, political, or legal developments or industrial or regional matters specifically affecting Hawaii and whatever effects these may have upon Hawaii issuers’ ability to meet their obligations. At March 31, 2024, the Trust had all of its long-term portfolio holdings invested in the securities of Hawaii issuers.
24 | Hawaiian Tax-Free Trust
HAWAIIAN TAX-FREE TRUST NOTES TO FINANCIAL STATEMENTS (continued) MARCH 31, 2024 |
6. Capital Share Transactions
Transactions in Capital Shares of the Trust were as follows:
| | | Year Ended
March 31, 2024 | | Year Ended
March 31, 2023 |
| | | Shares | | Amount | | Shares | | Amount |
| Class A Shares: | | | | | | | | | | |
| Proceeds from shares sold | | 1,115,113 | | $ | 11,611,240 | | 2,038,359 | | $ | 21,455,585 |
| Reinvested dividends and distributions | | 642,173 | | | 6,690,698 | | 581,015 | | | 6,110,935 |
| Cost of shares redeemed | | (5,392,415) | | | (56,097,755) | | (5,732,124) | | | (60,417,058) |
| Net change | | (3,635,129) | | | (37,795,817) | | (3,112,750) | | | (32,850,538) |
| | | | | | | | | | | |
| Class C Shares: | | | | | | | | | | |
| Proceeds from shares sold | | 16,759 | | | 174,648 | | 74,606 | | | 790,826 |
| Reinvested dividends and distributions | | 7,120 | | | 74,115 | | 8,606 | | | 90,441 |
| Cost of shares redeemed | | (355,721) | | | (3,716,393) | | (570,140) | | | (6,017,240) |
| Net change | | (331,842) | | | (3,467,630) | | (486,928) | | | (5,135,973) |
| | | | | | | | | | | |
| Class F Shares: | | | | | | | | | | |
| Proceeds from shares sold | | 11,212 | | | 115,486 | | 25,612 | | | 269,953 |
| Reinvested dividends and distributions | | 915 | | | 9,549 | | 491 | | | 5,175 |
| Cost of shares redeemed | | (14,345) | | | (150,114) | | (3,987) | | | (42,185) |
| Net change | | (2,218) | | | (25,079) | | 22,116 | | | 232,943 |
| | | | | | | | | | | |
| Class Y Shares: | | | | | | | | | | |
| Proceeds from shares sold | | 732,358 | | | 7,668,362 | | 986,246 | | | 10,436,506 |
| Reinvested dividends and distributions | | 90,911 | | | 949,052 | | 84,951 | | | 895,213 |
| Cost of shares redeemed | | (1,316,942) | | | (13,760,806) | | (2,348,774) | | | (24,785,509) |
| Net change | | (493,673) | | | (5,143,392) | | (1,277,577) | | | (13,453,790) |
| Total transactions in Trust shares | | (4,462,862) | | $ | (46,431,918) | | (4,855,139) | | $ | (51,207,358) |
7. Trustees’ Fees and Expenses
At March 31, 2024, there were 4 Trustees, one of whom is affiliated with the Administrator/Business Manager and is not paid any fees. The total amount of Trustees’ service fees (for carrying out their responsibilities) and attendance fees paid during the year ended March 31, 2024 was $197,500. Attendance fees are paid to those in attendance at regularly scheduled quarterly Board Meetings and meetings of the
25 | Hawaiian Tax-Free Trust
HAWAIIAN TAX-FREE TRUST NOTES TO FINANCIAL STATEMENTS (continued) MARCH 31, 2024 |
Independent Trustees held prior to each quarterly Board Meeting, as well as additional meetings (such as Audit, Nominating, Shareholder and special meetings). Trustees are reimbursed for their expenses such as travel, accommodations and meals incurred in connection with attendance at Board Meetings and the Annual and Outreach Meetings of Shareholders. For the year ended March 31, 2024, such meeting-related expenses amounted to $31,993.
8. Securities Traded on a When-Issued Basis
The Trust may purchase or sell securities on a when-issued basis. When-issued transactions arise when securities are purchased or sold by the Trust with payment and delivery taking place in the future in order to secure what is considered to be an advantageous price and yield to the Trust at the time of entering into the transaction. These transactions are subject to market fluctuations and their current value is determined in the same manner as for other securities.
9. Income Tax Information and Distributions
The Trust declares dividends daily from net investment income and makes payments monthly. Net realized capital gains, if any, are distributed annually and are taxable. These distributions are paid in additional shares at the net asset value per share or in cash at the shareholder’s option. The Trust intends to maintain, to the maximum extent possible, the tax-exempt status of interest payments received from portfolio municipal securities in order to allow dividends paid to shareholders from net investment income to be exempt from regular Federal and State of Hawaii income taxes. Due to differences between financial statement reporting and Federal income tax reporting requirements, distributions made by the Trust may not be the same as the Trust’s net investment income, and/or net realized securities gains. Further, a portion of the dividends and distributions may, under some circumstances, be subject to taxes at ordinary income and/or capital gain rates. For certain shareholders, some dividend income may, under some circumstances, be subject to the Alternative Minimum Tax. As a result of the passage of the Regulated Investment Company Act of 2010 (the “Act”), losses incurred in this fiscal year and beyond retain their character as short-term or long-term, have no expiration date and are utilized before capital losses incurred prior to the enactment of the Act. At March 31, 2024, the Trust had capital loss carry forwards of $7,986,282 where the $1,435,345 retains it character of short-term and $6,550,937 retains its character of long-term; both have no expiration. This carryover is available to offset future net realized gains on securities transactions to the extent provided for in the Internal Revenue Code. As of March 31, 2024, the Fund had post-October losses of $1,977,800, which is deferred until fiscal 2024 for tax purposes.
The tax character of distributions was as follows:
| | | | Year Ended
March 31, 2024 | | Year Ended
March 31, 2023 |
| | Net tax-exempt income | | $ | 9,445,571 | | $ | 8,632,836 |
| | Ordinary Income | | | 381,330 | | | 244,518 |
| | Capital gains | | | — | | | 173,524 |
| | | | $ | 9,826,901 | | $ | 9,050,878 |
26 | Hawaiian Tax-Free Trust
HAWAIIAN TAX-FREE TRUST NOTES TO FINANCIAL STATEMENTS (continued) MARCH 31, 2024 |
As of March 31, 2024, the components of distributable earnings on a tax basis were:
| | Unrealized depreciation | | $ | (13,185,510) |
| | Undistributed tax-exempt income | | | 190,207 |
| | Post October losses | | | (1,977,800) |
| | Other temporary differences | | | (188,005) |
| | Accumulated net realized loss on investments | | | (7,986,282) |
| | | | $ | (23,147,390) |
The difference between book basis and tax basis undistributed income is due to the timing difference, and other temporary differences, in recognizing dividends paid and the deduction of distributions payable.
10. Credit Facility
Since August 30, 2017, Bank of New York Mellon and the Aquila Group of Funds (comprised of nine funds) have been parties to a $40 million credit agreement, which currently terminates on August 21, 2024 (per the August 23, 2023 amendment). In accordance with the Aquila Group of Funds Guidelines for Allocation of Committed Line of Credit, each fund is responsible for payment of its proportionate share of
| a) | a 0.17% per annum commitment fee; and, |
| b) | interest on amounts borrowed for temporary or emergency purposes by the fund (at the applicable per annum rate selected by the Aquila Group of Funds at the time of the borrowing of either (i) the adjusted daily simple Secured Overnight Financing Rate (“SOFR”) plus 1% or (ii) the sum of the higher of (a) the Prime Rate, (b) the Federal Funds Effective Rate, or (c) the adjusted daily simple Secured Overnight Financing Rate plus 1%). |
There were no borrowings under the credit agreement during the year ended March 31, 2024.
11. Risks
Mutual fund investing involves risk and loss of principal is possible. The market prices of the Trust’s securities may rise or decline in value due to general market conditions, such as real or perceived adverse economic, political or regulatory conditions, political instability, recessions, inflation, changes in interest rates, lack of liquidity in the bond markets, the spread of infectious illness or other public health issues, weather or climate events, armed conflict, sanctions or other government actions, market disruptions caused by tariffs, trade disputes or other factors, or adverse investor sentiment. When market prices fall, the value of your investment may go down. In the past decade, financial markets have experienced increased volatility, depressed valuations, decreased liquidity and heightened uncertainty. These conditions may continue, recur, worsen or spread.
The long-term impact of the COVID-19 pandemic and its subsequent variants on economies, markets, industries and individual issuers, are not known. Some sectors of the economy and individual issuers have experienced or may experience particularly large
27 | Hawaiian Tax-Free Trust
HAWAIIAN TAX-FREE TRUST NOTES TO FINANCIAL STATEMENTS (continued) MARCH 31, 2024 |
losses. Periods of extreme volatility in the financial markets, reduced liquidity of many instruments, increased government debt, inflation, and disruptions to supply chains, consumer demand and employee availability, may continue for some time.
Raising the ceiling on U.S. government debt has become increasingly politicized. Any failure to increase the total amount that the U.S. government is authorized to borrow could lead to a default on U.S. government obligations, with unpredictable consequences for economies and markets in the U.S. and elsewhere. Inflation and interest rates have increased and may rise further. These circumstances could adversely affect the value and liquidity of the Trust’s investments, impair the Trust’s ability to satisfy redemption requests, and negatively impact the Trust’s performance.
Economies and financial markets throughout the world are increasingly interconnected. Economic, financial or political events, trading and tariff arrangements, public health events, terrorism, wars, natural disasters and other circumstances in one country or region could have profound impacts on global economies or markets. As a result, whether or not the Trust invests in securities of issuers located in or with significant exposure to the countries or markets directly affected, the value and liquidity of the Trust’s investments may be negatively affected. Following Russia’s invasion of Ukraine, Russian securities lost all, or nearly all, their market value. Other securities or markets could be similarly affected by past or future political, geopolitical or other events or conditions. Furthermore, events involving limited liquidity, defaults, non-performance or other adverse developments that affect one industry, such as the financial services industry, or concerns or rumors about any events of these kinds, have in the past and may in the future lead to market-wide liquidity problems, may spread to other industries, and could negatively affect the value and liquidity of the Trust’s investments.
Governments and central banks, including the U.S. Federal Reserve, have taken extraordinary and unprecedented actions to support local and global economies and the financial markets. These actions have resulted in significant expansion of public debt, including in the U.S. The consequences of high public debt, including its future impact on the economy and securities markets, may not be known for some time.
The U.S. and other countries are periodically involved in disputes over trade and other matters, which may result in tariffs, investment restrictions and adverse impacts on affected companies and securities. For example, the U.S. has imposed tariffs and other trade barriers on Chinese exports, has restricted sales of certain categories of goods to China, and has established barriers to investments in China. Trade disputes may adversely affect the economies of the U.S. and its trading partners, as well as companies directly or indirectly affected and financial markets generally. If the political climate between the U.S. and China does not improve or continues to deteriorate, if China were to attempt unification of Taiwan by force, or if other geopolitical conflicts develop or get worse, economies, markets and individual securities may be severely affected both regionally and globally, and the value of the Trust’s assets may go down.
28 | Hawaiian Tax-Free Trust
HAWAIIAN TAX-FREE TRUST NOTES TO FINANCIAL STATEMENTS (continued) MARCH 31, 2024 |
The value of your investment will generally go down when interest rates rise. A rise in interest rates tends to have a greater impact on the prices of longer term or longer duration securities. In recent years, interest rates and credit spreads in the U.S. have been at historic lows. The U.S. Federal Reserve has raised certain interest rates, and interest rates may continue to go up. A general rise in interest rates may cause investors to move out of fixed income securities on a large scale and could also result in increased redemptions from the Trust.
Investments in the Trust are subject to possible loss due to the financial failure of the issuers of underlying securities and their inability to meet their debt obligations.
The value of municipal securities can be adversely affected by changes in the financial condition of one or more individual municipal issuers or insurers of municipal issuers, regulatory developments, legislative actions, and by uncertainties and public perceptions concerning these and other factors. The Trust may be affected significantly by adverse economic, political or other events affecting state and other municipal issuers in which it invests, and may be more volatile than a more geographically diverse fund. The municipal bond market can be susceptible to unusual volatility, particularly for lower-rated and unrated securities. Liquidity can be reduced unpredictably in response to overall economic conditions or credit tightening. Municipal issuers may be adversely affected by rising health care costs, increasing unfunded pension liabilities, and by the phasing out of federal programs providing financial support. Unfavorable conditions and developments relating to projects financed with municipal securities can result in lower revenues to issuers of municipal securities, potentially resulting in defaults. Municipal securities may be more susceptible to downgrades or defaults during a recession or similar periods of economic stress. Financial difficulties of municipal issuers may continue or get worse, particularly in the event of political, economic or market turmoil or a recession.
A portion of income may be subject to local, state, Federal and/or alternative minimum tax. Capital gains, if any, are subject to capital gains tax.
These risks may result in share price volatility.
29 | Hawaiian Tax-Free Trust
HAWAIIAN TAX-FREE TRUST FINANCIAL HIGHLIGHTS |
For a share outstanding throughout each period
| | | Class A |
| | | Year Ended March 31, |
| | | 2024 | | 2023 | | 2022 | | 2021 | | 2020 |
| Net asset value, beginning of period | | $10.62 | | $10.82 | | $11.48 | | $11.36 | | $11.29 |
| Income (loss) from investment operations: | | | | | | | | | | |
| Net investment income(1) | | 0.21 | | 0.17 | | 0.17 | | 0.19 | | 0.21 |
Net gain (loss) on securities
(both realized and unrealized) | | (0.11) | | (0.19) | | (0.65) | | 0.14 | | 0.07 |
| Total from investment operations | | 0.10 | | (0.02) | | (0.48) | | 0.33 | | 0.28 |
| Less distributions (note 9): | | | | | | | | | | |
| Dividends from net investment income | | (0.21) | | (0.18) | | (0.17) | | (0.19) | | (0.21) |
| Distributions from capital gains | | — | | —† | | (0.01) | | (0.02) | | —† |
| Total distributions | | (0.21) | | (0.18) | | (0.18) | | (0.21) | | (0.21) |
| Net asset value, end of period | | $10.51 | | $10.62 | | $10.82 | | $11.48 | | $11.36 |
| Total return (not reflecting sales charge) | | 0.95% | | (0.19)% | | (4.25)% | | 2.97% | | 2.51% |
| Ratios/supplemental data | | | | | | | | | | |
| Net assets, end of period (in millions) | | $413 | | $456 | | $499 | | $549 | | $553 |
| Ratio of expenses to average net assets | | 0.88% | | 0.86% | | 0.82% | | 0.83% | | 0.88% |
| Ratio of net investment income to average net assets | | 1.98% | | 1.64% | | 1.47% | | 1.68% | | 1.84% |
| Portfolio turnover rate | | 19% | | 21% | | 14% | | 9% | | 12% |
† Capital gain distribution less than $0.01.
(1) Per share amounts have been calculated using the daily average shares method.
See accompanying notes to financial statements.
30 | Hawaiian Tax-Free Trust
HAWAIIAN TAX-FREE TRUST FINANCIAL HIGHLIGHTS (continued) |
For a share outstanding throughout each period
| | | Class C |
| | | Year Ended March 31, |
| | | 2024 | | 2023 | | 2022 | | 2021 | | 2020 |
| Net asset value, beginning of period | | $10.62 | | $10.82 | | $11.47 | | $11.36 | | $11.28 |
| Income (loss) from investment operations: | | | | | | | | | | |
| Net investment income(1) | | 0.12 | | 0.09 | | 0.08 | | 0.10 | | 0.12 |
Net gain (loss) on securities
(both realized and unrealized) | | (0.11) | | (0.20) | | (0.64) | | 0.13 | | 0.08 |
| Total from investment operations | | 0.01 | | (0.11) | | (0.56) | | 0.23 | | 0.20 |
| Less distributions (note 9): | | | | | | | | | | |
| Dividends from net investment income | | (0.12) | | (0.09) | | (0.08) | | (0.10) | | (0.12) |
| Distributions from capital gains | | — | | —† | | (0.01) | | (0.02) | | —† |
| Total distributions | | (0.12) | | (0.09) | | (0.09) | | (0.12) | | (0.12) |
| Net asset value, end of period | | $10.51 | | $10.62 | | $10.82 | | $11.47 | | $11.36 |
| Total return (not reflecting CDSC) | | 0.15% | | (0.99)% | | (4.94)% | | 2.06% | | 1.78% |
| Ratios/supplemental data | | | | | | | | | | |
| Net assets, end of period (in millions) | | $6 | | $10 | | $15 | | $20 | | $24 |
| Ratio of expenses to average net assets | | 1.68% | | 1.66% | | 1.62% | | 1.63% | | 1.68% |
| Ratio of net investment income to average net assets | | 1.17% | | 0.82% | | 0.67% | | 0.87% | | 1.03% |
| Portfolio turnover rate | | 19% | | 21% | | 14% | | 9% | | 12% |
† Capital gain distribution less than $0.01.
(1) Per share amounts have been calculated using the daily average shares method.
See accompanying notes to financial statements.
31 | Hawaiian Tax-Free Trust
HAWAIIAN TAX-FREE TRUST FINANCIAL HIGHLIGHTS (continued) |
For a share outstanding throughout each period
| | | Class F |
| | | Year Ended March 31, |
| | | 2024 | | 2023 | | 2022 | | 2021 | | 2020 |
| Net asset value, beginning of period | | $10.64 | | $10.84 | | $11.50 | | $11.39 | | $11.30 |
| Income (loss) from investment operations: | | | | | | | | | | |
| Net investment income(1) | | 0.23 | | 0.20 | | 0.20 | | 0.22 | | 0.23 |
Net gain (loss) on securities
(both realized and unrealized) | | (0.12) | | (0.20) | | (0.65) | | 0.13 | | 0.09 |
| Total from investment operations | | 0.11 | | — | | (0.45) | | 0.35 | | 0.32 |
| Less distributions (note 9): | | | | | | | | | | |
| Dividends from net investment income | | (0.23) | | (0.20) | | (0.20) | | (0.22) | | (0.23) |
| Distributions from capital gains | | — | | —† | | (0.01) | | (0.02) | | —† |
| Total distributions | | (0.23) | | (0.20) | | (0.21) | | (0.24) | | (0.23) |
| Net asset value, end of period | | $10.52 | | $10.64 | | $10.84 | | $11.50 | | $11.39 |
| Total return | | 1.09% | | 0.05% | | (4.02)% | | 3.11% | | 2.91% |
| Ratios/supplemental data | | | | | | | | | | |
| Net assets, end of period (in millions) | | $0.40 | | $0.43 | | $0.20 | | $0.30 | | $0.11 |
| Ratio of expenses to average net assets | | 0.65% | | 0.62% | | 0.60% | | 0.59% | | 0.66% |
| Ratio of net investment income to average net assets | | 2.22% | | 1.89% | | 1.70% | | 1.89% | | 2.00% |
| Portfolio turnover rate | | 19% | | 21% | | 14% | | 9% | | 12% |
| † | Capital gain distribution less than $0.01. |
| (1) | Per share amounts have been calculated using the daily average shares method. |
See accompanying notes to financial statements.
32 | Hawaiian Tax-Free Trust
HAWAIIAN TAX-FREE TRUST FINANCIAL HIGHLIGHTS (continued) |
For a share outstanding throughout each period
| | | Class Y |
| | | Year Ended March 31, |
| | | 2024 | | 2023 | | 2022 | | 2021 | | 2020 |
| Net asset value, beginning of period | | $10.64 | | $10.84 | | $11.50 | | $11.39 | | $11.31 |
| Income (loss) from investment operations: | | | | | | | | | | |
| Net investment income(1) | | 0.23 | | 0.19 | | 0.19 | | 0.22 | | 0.23 |
Net gain (loss) on securities
(both realized and unrealized) | | (0.11) | | (0.19) | | (0.65) | | 0.13 | | 0.08 |
| Total from investment operations | | 0.12 | | — | | (0.46) | | 0.35 | | 0.31 |
| Less distributions (note 9): | | | | | | | | | | |
| Dividends from net investment income | | (0.23) | | (0.20) | | (0.19) | | (0.22) | | (0.23) |
| Distributions from capital gains | | — | | —† | | (0.01) | | (0.02) | | —† |
| Total distributions | | (0.23) | | (0.20) | | (0.20) | | (0.24) | | (0.23) |
| Net asset value, end of period | | $10.53 | | $10.64 | | $10.84 | | $11.50 | | $11.39 |
| Total return | | 1.16% | | 0.01% | | (4.05)% | | 3.08% | | 2.80% |
| Ratios/supplemental data | | | | | | | | | | |
| Net assets, end of period (in millions) | | $52 | | $57 | | $72 | | $76 | | $69 |
| Ratio of expenses to average net assets | | 0.68% | | 0.66% | | 0.62% | | 0.63% | | 0.69% |
| Ratio of net investment income to average net assets | | 2.18% | | 1.83% | | 1.66% | | 1.87% | | 2.03% |
| Portfolio turnover rate | | 19% | | 21% | | 14% | | 9% | | 12% |
† Capital gain distribution less than $0.01.
(1) Per share amounts have been calculated using the daily average shares method.
See accompanying notes to financial statements.
33 | Hawaiian Tax-Free Trust
Additional Information (unaudited):
Statement Regarding Liquidity Risk Management Program
Rule 22e-4 under the Investment Company Act of 1940, as amended, requires open-end management investment companies to adopt and implement written liquidity risk management programs that are reasonably designed to assess and manage liquidity risk. Liquidity risk is defined in the rule as the risk that a fund could not meet requests to redeem shares issued by the fund without significant dilution of remaining investors’ interests in the fund. In accordance with Rule 22e-4, Hawaiian Tax-Free Trust (the “Trust”) has adopted a Liquidity Risk Management (“LRM”) program (the “program”). The Trust’s Board of Trustees (the “Board”) has designated an LRM Committee consisting of employees of Aquila Investment Management LLC as the administrator of the program (the “Committee”).
The Board met on June 2, 2023 to review the program. At the meeting, the Committee provided the Board with a report that addressed the operation of the program and assessed its adequacy and effectiveness of implementation, and any material changes to the program (the “Report”). The Report covered the period from May 1, 2022 through April 30, 2023 (the “Reporting Period”).
During the Reporting Period, the Committee reviewed whether the Trust’s strategy is appropriate for an open-end fund structure taking into account less liquid and illiquid assets.
The Committee reviewed the Trust’s short-term and long-term cash flow projections during both normal and reasonably foreseeable stressed conditions. In classifying and reviewing the Trust’s investments, the Committee considered whether trading varying portions of a position in a particular portfolio investment or asset class in sizes the Trust would reasonably anticipate trading, would be reasonably expected to significantly affect liquidity. The Committee considered the following information when determining the sizes in which the Trust would reasonably anticipate trading: historical net redemption activity, the Trust’s concentration in an issuer, shareholder concentration, Trust performance, Trust size, and distribution channels.
The Committee considered the Trust’s holdings of cash and cash equivalents, as well as borrowing arrangements. The Committee considered the terms of the credit facility applicable to the Aquila Group of Funds, the financial health of the institution providing the facility and the fact that the credit facility is shared among multiple Funds.
The Committee also performed an analysis to determine whether the Trust is required to maintain a Highly Liquid Investment Minimum (“HLIM”), and determined that the requirement to maintain an HLIM was inapplicable to the Trust because the Trust primarily holds highly liquid investments.
There were no material changes to the program during the Reporting Period. The Report provided to the Board stated that the Committee concluded that the program is reasonably designed and operated effectively throughout the Review Period.
34 | Hawaiian Tax-Free Trust
Additional Information (unaudited)
Trustees(1)(2)
and Officers | | | | | | | | |
| | | | | | | | | |
Name, Address
and Year of Birth(3) | | Positions
Held with
Trust and
Length of
Service(4) | | Principal Occupation(s)
During Past 5 Years | | Number of
Portfolios
in Fund
Complex
Overseen
by Trustee | | Other
Directorships
Held by Trustee
During Past 5
Years |
| | | | | | | | | |
Interested
Trustee(5) | | | | | | | | |
| | | | | | | | | |
Diana P. Herrmann
New York, NY
(1958) | | Vice Chair of the Board of Trustees since 2003, President since 1998 and Trustee since 1994 | | Chair (since 2016 and previously Vice Chair since 2004) and Chief Executive Officer (since 2004) of Aquila Management Corporation, Founder and Sponsor of the Aquila Group of Funds(6) and parent of Aquila Investment Management LLC, Administrator, President since 1997, Chief Operating Officer, 1997-2008, a Director since 1984, Secretary, 1986-2016, and previously its Executive Vice President, Senior Vice President or Vice President, 1986-1997; Chief Executive Officer (since 2004) and Chair (since 2016 and previously Vice Chair since 2004), President and Manager since 2003, and Chief Operating Officer (2003-2008), of the Administrator; Chair, Vice Chair, President, Executive Vice President and/or Senior Vice President of funds in the Aquila Group of Funds since 1986; Manager of the Distributor since 1997; Governor, Investment Company Institute (the U.S. mutual fund industry trade organization dedicated to protecting shareholder interests and educating the public about investing) for various periods since 2004, and Chair of its Small Funds Committee, 2004-2009; active in charitable and volunteer organizations. | | 9 | | Director of ICI Mutual Insurance Company, a Risk Retention Group, for various periods since 2006; formerly Vice Chair and Trustee of Pacific Capital Funds of Cash Assets Trust (three money-market funds in the Aquila Group of Funds) 2004-2012 |
| | | | | | | | | |
Non-Interested
Trustees | | | | | | | | |
| | | | | | | | | |
Glenn P. O’Flaherty
Granby, CO
(1958) | | Chair of the Board since 2020; Trustee since 2009 | | Chief Financial Officer and Chief Operating Officer of Lizard Investors, LLC, 2008; Co-Founder, Chief Financial Officer and Chief Compliance Officer of Three Peaks Capital Management, LLC, 2003-2005; Vice President – Investment Accounting, Global Trading and Trade Operations, Janus Capital Corporation, and Chief Financial Officer and Treasurer, Janus Funds, 1991-2002; Trustee of various funds in the Aquila Group of Funds since 2006. | | 9 | | Granby Ranch Metropolitan District (quasi-municipal corporation); formerly Trustee of Pacific Capital Funds of Cash Assets Trust (three money-market funds in the Aquila Group of Funds) 2009-2012 |
| | | | | | | | | |
Catherine Luke
Honolulu, HI
(1972) | | Trustee
since 2018 | | President and Director, Loyalty Enterprises, Ltd. (property management) since 2013; Vice President, Loyalty Development, Ltd. (real estate investment) since 2012; President and Director, KJL, Inc. (real estate investment) since 2011; Director, Hawaii Leadership Forum (leadership program) since 2015. | | 1 | | Director, Trinity Merger Corporation (special purpose acquisition vehicle) 2018-2019 |
35 | Hawaiian Tax-Free Trust
Name, Address
and Year of Birth(3) | | Positions
Held with
Trust and
Length of
Service(4) | | Principal Occupation(s)
During Past 5 Years | | Number of
Portfolios
in Fund
Complex
Overseen
by Trustee | | Other
Directorships
Held by Trustee
During Past 5
Years |
| | | | | | | | | |
Non-Interested
Trustees (cont’d) | | | | | | | | |
| | | | | | | | | |
Randolph P. Perreira
Honolulu, HI
(1959) | | Trustee
since 2018 | | Executive Director, Hawaii Government Employees Association since 1986; President, Hawaii State AFL-CIO since 2005; Director, Aloha United Way since 2005; Member, P-20 Council for the State of Hawaii since 2003; Director, American Judicature Society (Hawaii) since 2009; Director, Island Energy Services since July, 2020; current Board member, Industrial Relations Research Association; currently or formerly active with various civic and charitable organizations. | | 1 | | None |
| (1) | The Trust’s Statement of Additional Information includes additional information about the Trustees and is available, without charge, upon request by calling 800-437-1020 (toll-free) or by visiting www.aquilafunds.com or the EDGAR Database at the SEC’s internet site at www.sec.gov. |
| (2) | From time to time Bank of Hawaii may enter into normal investment management, commercial banking and/or lending arrangements with one or more of the Trustees of the Trust and their affiliates. The Asset Management Group of Bank of Hawaii is the Trust’s investment adviser. |
| (3) | The mailing address of each Trustee is c/o Hawaiian Tax-Free Trust, 120 West 45th Street, Suite 3600, New York, NY 10036. |
| (4) | Each Trustee holds office until his or her successor is elected or his or her earlier retirement or removal. |
| (5) | Ms. Herrmann is an “interested person” of the Trust, as that term is defined in the Investment Company Act of 1940, as amended (the “1940 Act”), as an officer of the Trust, as a director, officer and shareholder of the Administrator’s corporate parent, as an officer and Manager of the Administrator, and as a Manager of the Distributor. |
| (6) | The “Aquila Group of Funds” includes: Aquila Tax-Free Trust of Arizona, Aquila Tax-Free Fund of Colorado, Hawaiian Tax-Free Trust, Aquila Churchill Tax-Free Fund of Kentucky, Aquila Tax-Free Trust of Oregon, Aquila Narragansett Tax-Free Income Fund (Rhode Island) and Aquila Tax-Free Fund For Utah, each of which is a tax-free municipal bond fund and are called the “Aquila Municipal Bond Funds”; Aquila Opportunity Growth Fund, which is an equity fund; and Aquila High Income Fund, which is a high-income corporate bond fund. |
36 | Hawaiian Tax-Free Trust
Name, Address
and Year of Birth(1) | | Positions
Held with
Trust and Length of Service(2) | | Principal Occupation(s) During Past 5 Years(3) |
| | | | | |
| Officers | | | | |
| | | | | |
Sherri Foster
Lahaina, HI
(1950) | | Senior Vice President
since 1993 | | Senior Vice President, Hawaiian Tax-Free Trust since 1993 and formerly Vice President or Assistant Vice President; Vice President 1997-2012 and formerly Assistant Vice President of three money-market funds in the Aquila Group of Funds; Vice President, Aquila Funds Trust since 2013 and Aquila Opportunity Growth Fund, 2006-2013. |
| | | | | |
Paul G. O’Brien
New York, NY
(1959) | | Senior Vice President
since 2010 | | President, Aquila Distributors LLC since 2019, Co-President 2010-2019, Managing Director, 2009-2010; Senior Vice President of all funds in the Aquila Group of Funds since 2010; held various positions to Senior Vice President and Chief Administrative Officer of Evergreen Investments Services, Inc., 1997-2008; Mergers and Acquisitions Coordinator for Wachovia Corporation, 1994-1997. |
| | | | | |
Stephen J. Caridi
New York, NY
(1961) | | Vice President since 1998 | | Regional Sales Manager (since 2009) and registered representative (since 1986) of the Distributor; Vice President of the Distributor 1995-2009; Vice President, Hawaiian Tax-Free Trust since 1998; Senior Vice President, Aquila Municipal Trust (which includes Aquila Narragansett Tax-Free Income Fund) since 2013; Vice President, Aquila Funds Trust since 2013; Senior Vice President, Aquila Narragansett Tax-Free Income Fund 1998-2013, Vice President 1996-1997; Senior Vice President, Aquila Tax-Free Fund of Colorado 2004-2009; Vice President, Aquila Opportunity Growth Fund 2006-2013. |
| | | | | |
Randall S. Fillmore
New York, NY
(1960) | | Chief Compliance Officer
since 2012 | | Chief Compliance Officer of all funds in the Aquila Group of Funds, the Administrator and the Distributor since 2012; Managing Director, Fillmore & Associates, 2009-2012; Fund and Adviser Chief Compliance Officer (2002-2009), Senior Vice President - Broker Dealer Compliance (2004-2009), Schwab Funds Anti Money Laundering Officer and Identity Theft Prevention Officer (2004-2009), Vice President - Internal Audit (2000-2002), Charles Schwab Corporation; National Director, Information Systems Risk Management - Consulting Services (1999-2000), National Director, Investment Management Audit and Business Advisory Services (1992-1999), Senior Manager, Manager, Senior and Staff Roles (1983-1992), PricewaterhouseCoopers LLP. |
| | | | | |
Joseph P. DiMaggio
New York, NY
(1956) | | Chief Financial Officer since 2003 and Treasurer
since 2000 | | Chief Financial Officer of all funds in the Aquila Group of Funds since 2003 and Treasurer since 2000. |
| | | | | |
Anita Albano, CPA
New York, NY
(1973) | | Secretary since 2020, Assistant Secretary 2018-2019 | | Secretary of all funds in the Aquila Group of Funds since 2020, Assistant Secretary 2018 – 2019; Senior Vice President and Chief Financial Officer of Aquila Investment Management LLC and Aquila Management Corporation since 2018; Treasurer of Aquila Investment Management LLC and Aquila Management Corporation since 2005. |
| | | | | |
Yolonda S. Reynolds
New York, NY
(1960) | | Assistant Treasurer
since 2010 | | Assistant Treasurer of all funds in the Aquila Group of Funds since 2010; Director of Fund Accounting for the Aquila Group of Funds since 2007. |
37 | Hawaiian Tax-Free Trust
Name, Address
and Year of Birth(1) | | Positions
Held with
Trust and Length of Service(2) | | Principal Occupation(s) During Past 5 Years(3) |
| | | | | |
| Officers (cont’d) | | | | |
| | | | | |
Lori A. Vindigni
New York, NY
(1966) | | Assistant Treasurer since 2000 | | Assistant Treasurer of all funds in the Aquila Group of Funds since 2000; Assistant Vice President of the Administrator or its predecessor and current parent since 1998; Fund Accountant for the Aquila Group of Funds, 1995-1998. |
| (1) | The mailing address of each officer is c/o Hawaiian Tax-Free Trust, 120 West 45th Street, Suite 3600, New York, NY 10036. |
| (2) | The term of office of each officer is one year. |
| (3) | The Trust’s Statement of Additional Information includes additional information about the officers and is available, without charge, upon request by calling 800-437-1020 (toll-free) or by visiting www.aquilafunds.com or the EDGAR Database at the SEC’s internet site at www.sec.gov. |
38 | Hawaiian Tax-Free Trust
Your Trust’s Expenses (unaudited)
As a Trust shareholder, you may incur two types of costs: (1) transaction costs, including front-end sales charges with respect to Class A shares or contingent deferred sales charges (“CDSC”) with respect to Class C shares; and (2) ongoing costs including management fees; distribution “12b-1” and/or service fees; and other Fund expenses. The table below is intended to help you understand your ongoing costs (in dollars) of investing in the Trust and to compare these costs with the ongoing costs of investing in other mutual funds. The table below assumes a $1,000 investment held for the six months indicated.
Actual Expenses
The table provides information about actual account values and actual expenses. You may use the information provided in this table, together with the amount you invested, to estimate the expenses that you paid over the period. To estimate the expenses that you paid on your account, divide your ending account value by $1,000 (for example, an $8,600 ending account value divided by $1,000 = 8.6), then multiply the result by the number under the heading “Expenses Paid During the Period”.
Hypothetical Example for Comparison with Other Funds
Under the heading, “Hypothetical” in the table, information is provided about hypothetical account values and hypothetical expenses based on the Trust’s actual expense ratio and an assumed rate of return of 5% per year before expenses, which is not the Trust’s actual return. This information may not be used to estimate the actual ending account balance or expenses you paid for the period, but it can help you compare ongoing costs of investing in the Fund with those of other funds. To do so, compare this 5% hypothetical example for the class of shares you hold with the 5% hypothetical examples that appear in the shareholder reports of other funds.
Please note that expenses shown in the table are meant to highlight ongoing costs and do not reflect any transactional costs. Therefore, information under the heading “Hypothetical” is useful comparing ongoing costs only, and will not help you compare total costs of owning different funds. In addition, if transactional costs were included, your total costs would have been higher.
| | Actual | | Hypothetical |
| | (actual return after expenses) | | (5% annual return before expenses) |
Share
Class | Beginning Account
Value
10/01/23 | Ending(1) Account
Value
3/31/24 | Expenses(2)
Paid During Period
10/01/23 –
3/31/24 | | Ending
Account
Value
3/31/24 | Expenses(2)
Paid During
Period
10/01/23 –
3/31/24 | Net
Annualized
Expense
Ratio |
| A | $1,000 | $1,053.50 | $4.62 | | $1,020.50 | $4.55 | 0.90% |
| C | $1,000 | $1,050.30 | $8.71 | | $1,016.50 | $8.57 | 1.70% |
| F | $1,000 | $1,053.60 | $3.49 | | $1,021.60 | $3.44 | 0.68% |
| Y | $1,000 | $1,054.50 | $3.60 | | $1,021.50 | $3.54 | 0.70% |
| (1) | Assumes reinvestment of all dividends and capital gain distributions, if any, at net asset value and does not reflect the deduction of the applicable sales charges with respect to Class A or the applicable CDSC with respect to Class C shares. Total return is not annualized and as such, it may not be representative of the total return for the year. |
| | |
| (2) | Expenses are equal to the annualized expense ratio for the six-month period as indicated above - in the far right column - multiplied by the simple average account value over the period indicated, and then multiplied by 183/366 to reflect the one-half year period. |
39 | Hawaiian Tax-Free Trust
Information Available (unaudited) Annual and Semi-Annual Reports and Complete Schedules of Investments Your Trust’s Annual and Semi-Annual Reports are filed with the SEC twice a year. Each Report contains a complete Schedule of Portfolio Holdings, along with full financial statements and other important financial statement disclosures. Additionally, your Trust files a complete Schedule of Investments with the SEC for the first and third quarters of each fiscal year as an exhibit to its Reports on Form N-PORT. Your Trust’s Annual and Semi-Annual Reports and N-PORT reports are available free of charge on the SEC website at www.sec.gov. You may also review or, for a fee, copy the forms at the SEC’s Public Reference Room in Washington, D.C. or by calling 1-800-SEC-0330. In addition, your Trust’s Annual and Semi-Annual Reports and complete Portfolio Holdings Schedules for each fiscal quarter end are also available, free of charge, on your Trust’s website, www.aquilafunds.com or by calling us at 1-800-437-1000. Portfolio Holdings Reports In accordance with your Trust’s Portfolio Holdings Disclosure Policy, the Administrator also prepares a Portfolio Holdings Report as of each quarter end, which is typically posted to your Trust’s individual page at www.aquilafunds.com by the 15th day after the end of each calendar quarter. Such information will remain accessible until the next Portfolio Holdings Report is made publicly available by being posted to www.aquilafunds.com. The quarterly Portfolio Holdings Report may be accessed, free of charge, by visiting www.aquilafunds.com or calling us at 1-800-437-1000. |
Proxy Voting Record (unaudited) During the 12 month period ended June 30, 2023, there were no proxies related to any portfolio instruments held by the Trust. As such, the Trust did not vote any proxies. Applicable regulations require us to inform you that the Trust’s proxy voting information is available on the SEC website at www.sec.gov. |
Federal Tax Status of Distributions (unaudited) This information is presented in order to comply with a requirement of the Internal Revenue Code. No action on the part of shareholders is required. For the fiscal year ended March 31, 2024, $9,826,901 of dividends paid by Hawaiian Tax-Free Trust, constituting 96.1% of total dividends paid, were exempt-interest dividends, exempt from regular Federal income tax and Hawaii state income tax; and the balance was ordinary dividend income. Prior to February 15, 2025, shareholders will be mailed the appropriate tax form(s) which will contain information on the status of distributions paid for the 2024 calendar year. |
40 | Hawaiian Tax-Free Trust
Founders
Lacy B. Herrmann (1929-2012)
Aquila Management Corporation, Sponsor
Administrator/Business Manager
AQUILA INVESTMENT MANAGEMENT LLC
120 West 45th Street, Suite 3600
New York, New York 10036
Investment Adviser
ASSET MANAGEMENT GROUP of
BANK of HAWAII
130 Merchant Street, Suite 370
Honolulu, Hawaii 96813
Board of Trustees
Glenn P. O’Flaherty, Chair
Diana P. Herrmann, Vice Chair
Catherine Luke
Randolph P. Perreira
Officers
Diana P. Herrmann, President
Sherri Foster, Senior Vice President
Paul G. O’Brien, Senior Vice President
Stephen J. Caridi, Vice President
Randall S. Fillmore, Chief Compliance Officer
Joseph P. DiMaggio, Chief Financial Officer
and Treasurer
Anita Albano, Secretary
Distributor
AQUILA DISTRIBUTORS LLC
120 West 45th Street, Suite 3600
New York, New York 10036
Transfer and Shareholder Servicing Agent
BNY MELLON INVESTMENT SERVICING (US) INC.
118 Flanders Road
Westborough, Massachusetts 01581
Custodian
THE BANK OF NEW YORK MELLON
240 Greenwich Street
New York, New York 10286
Independent Registered Public Accounting Firm
TAIT, WELLER & BAKER LLP
Two Liberty Place
50 South 16th Street, Suite 2900
Philadelphia, Pennsylvania 19102
Further information is contained in the Prospectus,
which must precede or accompany this report.
AQL-HIAR-0524
ITEM 2. CODE OF ETHICS.
| (a) | As of March 31, 2024 the Registrant has adopted a code of ethics that applies to the Registrant's principal executive officer, principal financial officer, principal accounting officer or controller, or persons performing similar functions as defined in the Aquila Group of Funds Code of Ethics for Principal Executive and Senior Financial Officers under Section 406 of the Sarbanes-Oxley Act of 2002, as amended; |
| (f)(2) | The text of the Registrant’s Code of Ethics that applies to the Registrant’s principal executive officer(s) and principal financial officer(s) and persons performing similar functions has been posted on its Internet website which can be found at the Registrant’s Internet address at aquilafunds.com. |
ITEM 3. AUDIT COMMITTEE FINANCIAL EXPERT.
| (a)(1)(i) | The Registrant’s Board of Trustees has determined that Mr. Randolph Perreira and Mr. Glenn O’Flaherty, members of the Registrant’s Audit Committee, are audit committee financial experts. Mr. Perreira and Mr. O’Flaherty are both “independent” as such term is defined in Form N-CSR. |
ITEM 4. PRINCIPAL ACCOUNTANT FEES AND SERVICES.
| (a) | Audit Fees - The aggregate fees billed for professional services rendered by the principal accountant for the audit of the Registrant’s annual financial statements were $30,900 in 2023 and $34,700 in 2024. |
| (b) | Audit Related Fees - There were no amounts billed for audit-related fees over the past two years. |
| (c) | Tax Fees - The Registrant was billed by the principal accountant $3,500 and $3,500 in 2023 and 2024, respectively, for return preparation and tax compliance. |
| (d) | All Other Fees - There were no additional fees paid for audit and non-audit services other than those disclosed in a) thorough c) above. |
| (e)(1) | Currently, the audit committee of the Registrant pre-approves audit services and fees on an engagement-by-engagement basis |
| (e)(2) | None of the services described in b) through d) above were approved by the audit committee pursuant to paragraph (c)(7)(i)(C) of Rule 2-01 of Regulation S-X, all were pre-approved on an engagement-by-engagement basis. |
| (g) | There were no non-audit services fees billed by the Registrant’s accountant to the Registrant’s investment adviser or distributor over the past two years |
ITEM 5. AUDIT COMMITTEE OF LISTED REGISTRANTS.
Not applicable
ITEM 6. INVESTMENTS.
(a) Schedule I -Included in Item 1 above
ITEM 7. DISCLOSURE OF PROXY VOTING POLICIES AND PROCEDURES FOR CLOSED-END MANAGEMENT
INVESTMENT COMPANIES.
Not applicable
ITEM 8. PORTFOLIO MANAGERS OF CLOSED-END MANAGEMENT INVESTMENT COMPANIES.
Not applicable
ITEM 9. PURCHASES OF EQUITY SECURITIES BY CLOSED-END MANAGEMENT INVESTMENT COMPANY AND
AFFILIATED PURCHASERS.
Not applicable
ITEM 10. SUBMISSION OF MATTERS TO A VOTE OF SECURITY HOLDERS.
The Board of Directors of the Registrant has adopted a Nominating Committee Charter which provides that the Nominating Committee (the “Committee”) may consider and evaluate nominee candidates properly submitted by shareholders if a vacancy among the Independent Trustees of the Registrant occurs and if, based on the Board’s then current size, composition and structure, the Committee determines that the vacancy should be filled. The Committee will consider candidates submitted by shareholders on the same basis as it considers and evaluates candidates recommended by other sources. A copy of the qualifications and procedures that must be met or followed by shareholders to properly submit a nominee candidate to the Committee may be obtained by submitting a request in writing to the Secretary of the Registrant.
ITEM 11. CONTROLS AND PROCEDURES.
| (a) | Evaluation of Disclosure Controls and Procedures. The Registrant maintains disclosure controls and procedures that are designed to provide reasonable assurance that the information required to be disclosed in the Registrant’s filings under the Securities Exchange Act of 1934, as amended, and the Investment Company Act of 1940 is recorded, processed, summarized and reported within the periods specified in the rules and forms of the Securities and Exchange Commission. Such information is accumulated and communicated to the Registrant’s management, including the principal executive officer and the principal financial officer, recognizes that any set of controls and procedures, no matter how well designed and operated, can provide only reasonable assurance of achieving the desired control objectives. |
Within 90 days prior to the filing date of this Shareholder Report on Form N-CSR, the Registrant has carried out an evaluation, under the supervision and with the participation of the Registrant’s management, including the Registrant’s principal executive officer and the Registrant’s principal financial officer, of the effectiveness of the design and operation of the Registrant’s disclosure controls and procedures. Based on such evaluation, the Registrant’s principal executive officer and principal financial officer concluded that the Registrant’s disclosure controls and procedures are effective.
| (b) | Change in Internal Controls. There have been no significant changes in Registrant’s internal control over financial reporting that occurred during the period covered by this report that has materially affected, or is reasonably likely to materially affect the internal control over financial reporting. |
ITEM 12. DISCLOSURE OF SECURITIES LENDING ACTIVITIES FOR CLOSED-END MANAGEMENT
INVESTMENT COMPANIES
Not applicable
ITEM 13. EXHIBITS.
SIGNATURES
Pursuant to the requirements of the Securities Exchange Act of 1934 and the Investment Company Act of 1940, the registrant has duly caused this report to be signed on its behalf by the undersigned thereunto duly authorized.
HAWAIIAN TAX-FREE TRUST
By: /s/ Diana P. Herrmann
Diana P. Herrmann
Vice Chair, Trustee and President
June 5, 2024
By: /s/ Joseph P. DiMaggio
Chief Financial Officer and Treasurer
June 5, 2024
Pursuant to the requirements of the Securities Exchange Act of 1934 and the Investment Company Act of 1940, this report has been signed below by the following persons on behalf of the registrant and in the capacities and on the dates indicated.
By: /s/ Diana P. Herrmann
Diana P. Herrmann
Vice Chair, Trustee and President
June 5, 2024
By: /s/ Joseph P. DiMaggio
Joseph P. DiMaggio
Chief Financial Officer and Treasurer
June 5, 2024