EXPERTS IN POWER AND MOTION CONTROL
Forward-Looking Statements This presentation contains “forward-looking statements,” as defined in the Private Securities Litigation Reform Act of 1995, that are subject to risks and uncertainties which, in many cases, are beyond the control of the company. These include, but are not limited to, economic conditions in general, business conditions in material handling, elevator, mining, and renewable energy markets, operating conditions, competitive factors such as pricing and technology, risks associated with acquisitions and divestitures, legal proceedings and the risk that the company’s ultimate costs of doing business exceed present estimates. Further information regarding factors that could affect Magnetek’s results can be found in the company’s filings with the Securities and Exchange Commission. We undertake no obligation to update or revise any forward-looking statements. Actual results could differ materially from those anticipated in the forward-looking statements and from any projections included in this presentation. We may, in the course of our financial presentations, earnings releases, earnings conference calls, and otherwise, publicly disclose certain numerical measures which are or may be considered "non-GAAP financial measures” under SEC Regulation G. As used herein, "GAAP" refers to generally accepted accounting principles in the United States. Non-GAAP financial measures disclosed by management are provided as additional information to investors in order to provide them with an alternative method for assessing our financial condition and operating results. These measures are not in accordance with, or a substitute for, GAAP, and may be different from or inconsistent with non-GAAP financial measures used by other companies. This presentation includes non-GAAP measures such as EBITDA and adjusted EBITDA. EBITDA represents our GAAP results adjusted to exclude interest, taxes, depreciation and amortization. Adjusted EBITDA represents EBITDA adjusted to exclude non-cash pension and stock compensation expenses. 1
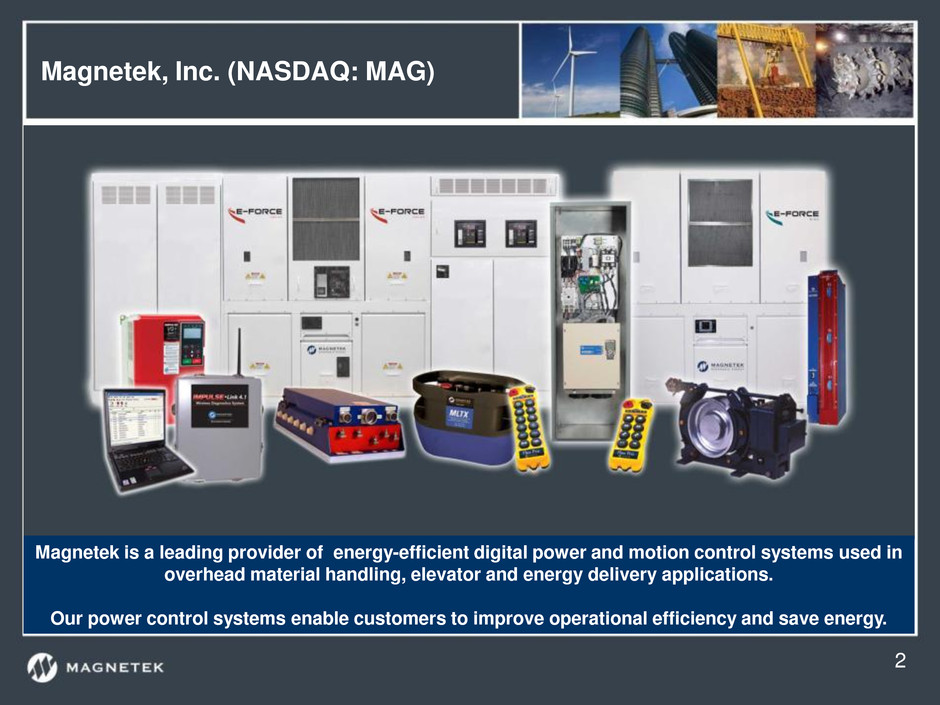
Magnetek, Inc. (NASDAQ: MAG) 2 Magnetek is a leading provider of energy-efficient digital power and motion control systems used in overhead material handling, elevator and energy delivery applications. Our power control systems enable customers to improve operational efficiency and save energy.
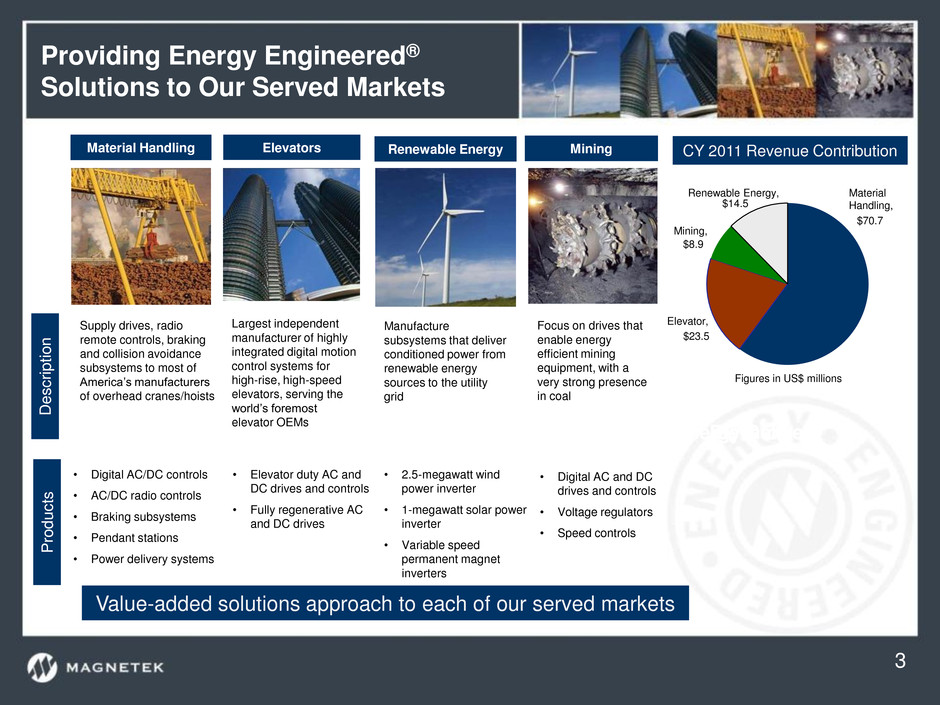
Providing Energy Engineered® Solutions to Our Served Markets Material Handling Elevator Energy Delivery 3 CY 2011 Revenue Contribution Material Handling Mining Elevators Renewable Energy Descrip tio n Supply drives, radio remote controls, braking and collision avoidance subsystems to most of America’s manufacturers of overhead cranes/hoists Focus on drives that enable energy efficient mining equipment, with a very strong presence in coal Largest independent manufacturer of highly integrated digital motion control systems for high-rise, high-speed elevators, serving the world’s foremost elevator OEMs Manufacture subsystems that deliver conditioned power from renewable energy sources to the utility grid Value-added solutions approach to each of our served markets P ro d u ct s • Digital AC/DC controls • AC/DC radio controls • Braking subsystems • Pendant stations • Power delivery systems • Elevator duty AC and DC drives and controls • Fully regenerative AC and DC drives • 2.5-megawatt wind power inverter • 1-megawatt solar power inverter • Variable speed permanent magnet inverters • Digital AC and DC drives and controls • Voltage regulators • Speed controls $70.7 $23.5 $8.9 $14.5 Elevator, Material Handling, Mining, Renewable Energy, Figures in US$ millions
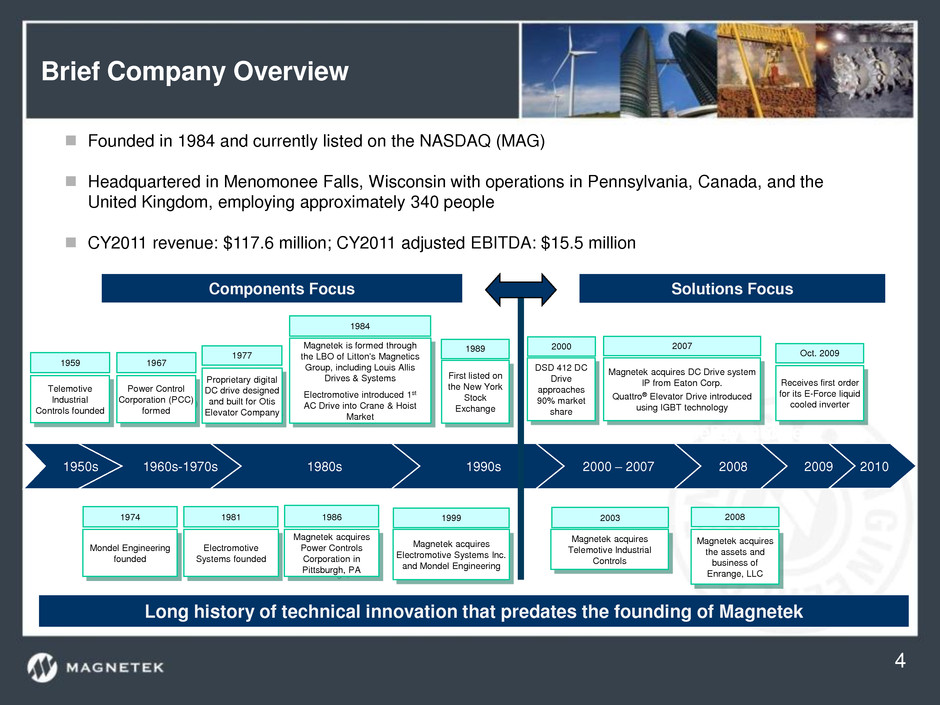
Brief Company Overview Material Handling Elevator Energy Delivery 4 1950s 1960s-1970s 1980s 2000 – 2007 2008 2009 2010 Magnetek is formed through the LBO of Litton's Magnetics Group, including Louis Allis Drives & Systems Electromotive introduced 1st AC Drive into Crane & Hoist Market 1984 DSD 412 DC Drive approaches 90% market share 2000 Magnetek acquires DC Drive system IP from Eaton Corp. Quattro® Elevator Drive introduced using IGBT technology 2007 Magnetek acquires the assets and business of Enrange, LLC 2008 Magnetek acquires Power Controls Corporation in Pittsburgh, PA 1986 Magnetek acquires Electromotive Systems Inc. and Mondel Engineering 1999 Magnetek acquires Telemotive Industrial Controls 2003 Receives first order for its E-Force liquid cooled inverter Oct. 2009 Electromotive Systems founded 1981 Mondel Engineering founded 1974 Power Control Corporation (PCC) formed 1967 Proprietary digital DC drive designed and built for Otis Elevator Company 1977 Telemotive Industrial Controls founded 1959 1990s First listed on the New York Stock Exchange 1989 Solutions Focus Components Focus Long history of technical innovation that predates the founding of Magnetek Founded in 1984 and currently listed on the NASDAQ (MAG) Headquartered in Menomonee Falls, Wisconsin with operations in Pennsylvania, Canada, and the United Kingdom, employing approximately 340 people CY2011 revenue: $117.6 million; CY2011 adjusted EBITDA: $15.5 million
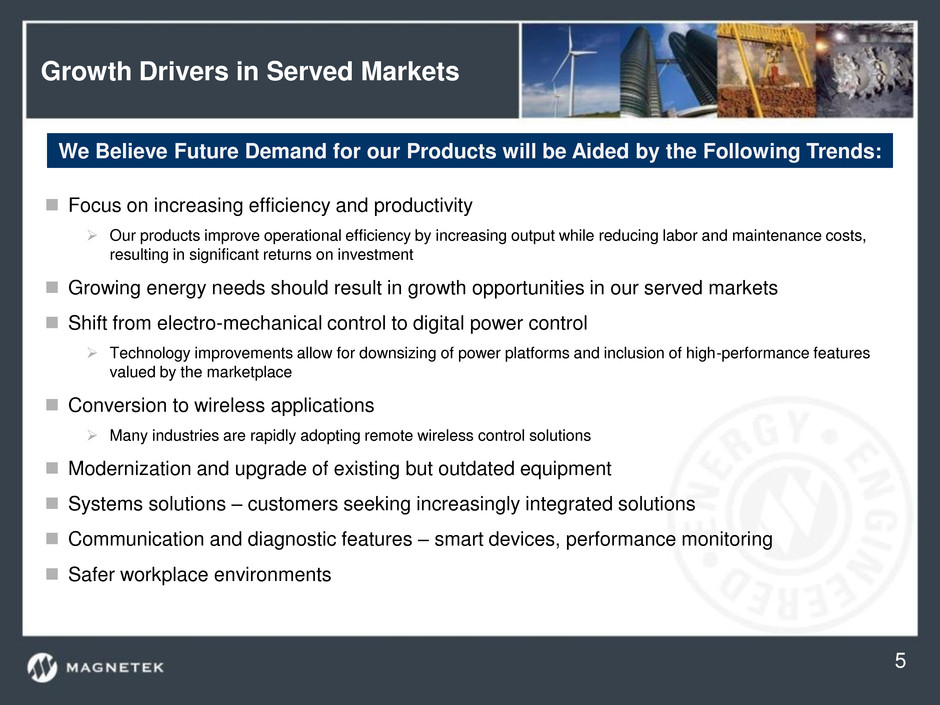
Growth Drivers in Served Markets Focus on increasing efficiency and productivity Our products improve operational efficiency by increasing output while reducing labor and maintenance costs, resulting in significant returns on investment Growing energy needs should result in growth opportunities in our served markets Shift from electro-mechanical control to digital power control Technology improvements allow for downsizing of power platforms and inclusion of high-performance features valued by the marketplace Conversion to wireless applications Many industries are rapidly adopting remote wireless control solutions Modernization and upgrade of existing but outdated equipment Systems solutions – customers seeking increasingly integrated solutions Communication and diagnostic features – smart devices, performance monitoring Safer workplace environments We Believe Future Demand for our Products will be Aided by the Following Trends: 5
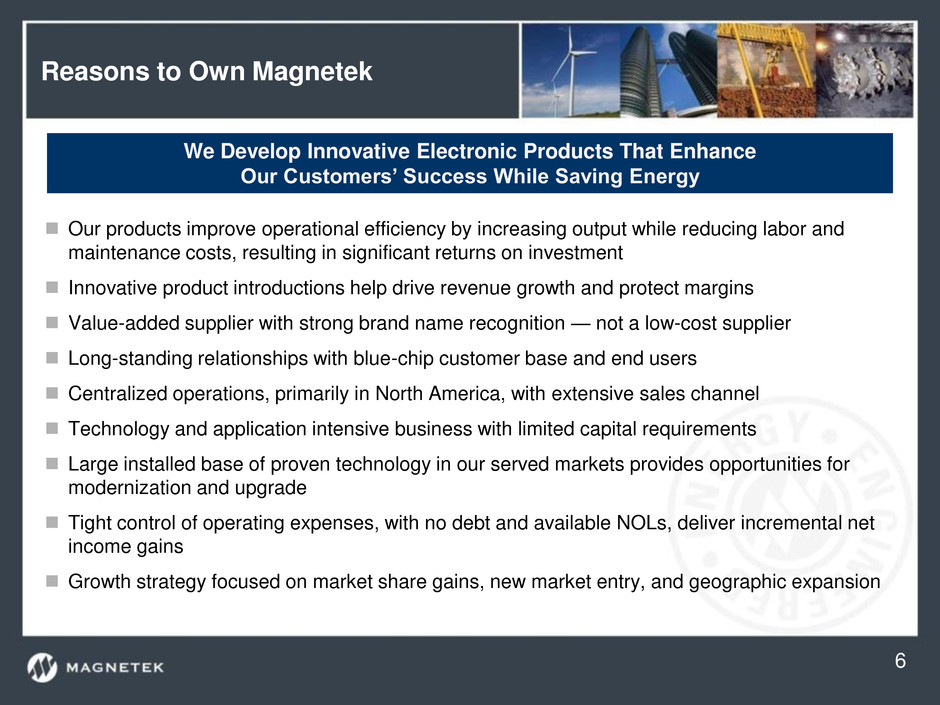
Reasons to Own Magnetek Our products improve operational efficiency by increasing output while reducing labor and maintenance costs, resulting in significant returns on investment Innovative product introductions help drive revenue growth and protect margins Value-added supplier with strong brand name recognition — not a low-cost supplier Long-standing relationships with blue-chip customer base and end users Centralized operations, primarily in North America, with extensive sales channel Technology and application intensive business with limited capital requirements Large installed base of proven technology in our served markets provides opportunities for modernization and upgrade Tight control of operating expenses, with no debt and available NOLs, deliver incremental net income gains Growth strategy focused on market share gains, new market entry, and geographic expansion We Develop Innovative Electronic Products That Enhance Our Customers’ Success While Saving Energy 6
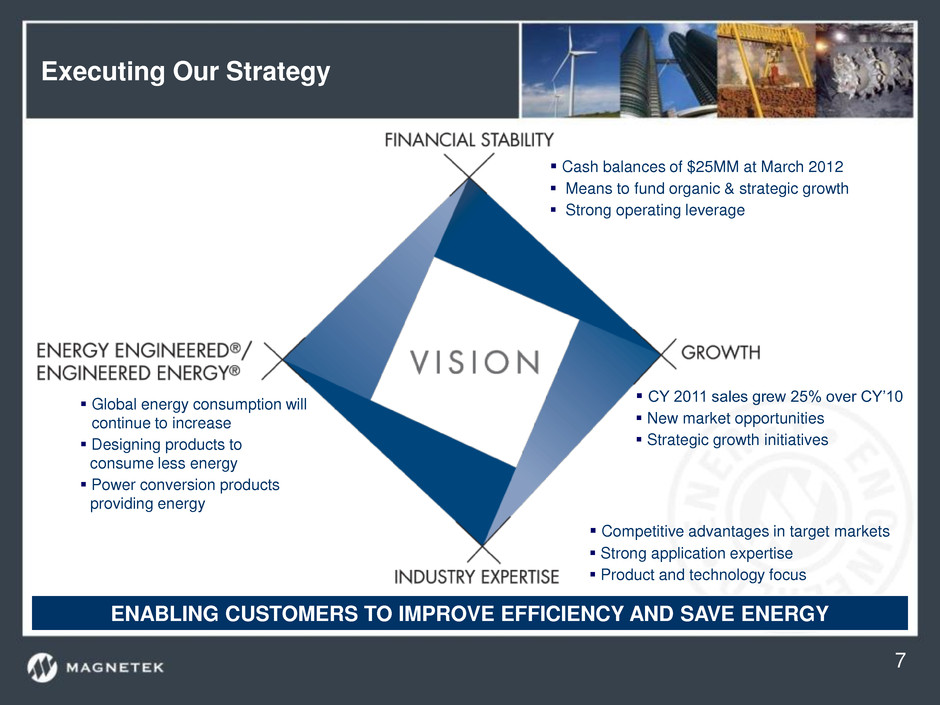
Executing Our Strategy ENABLING CUSTOMERS TO IMPROVE EFFICIENCY AND SAVE ENERGY CY 2011 sales grew 25% over CY’10 New market opportunities Strategic growth initiatives Cash balances of $25MM at March 2012 Means to fund organic & strategic growth Strong operating leverage Global energy consumption will continue to increase Designing products to consume less energy Power conversion products providing energy Competitive advantages in target markets Strong application expertise Product and technology focus 7
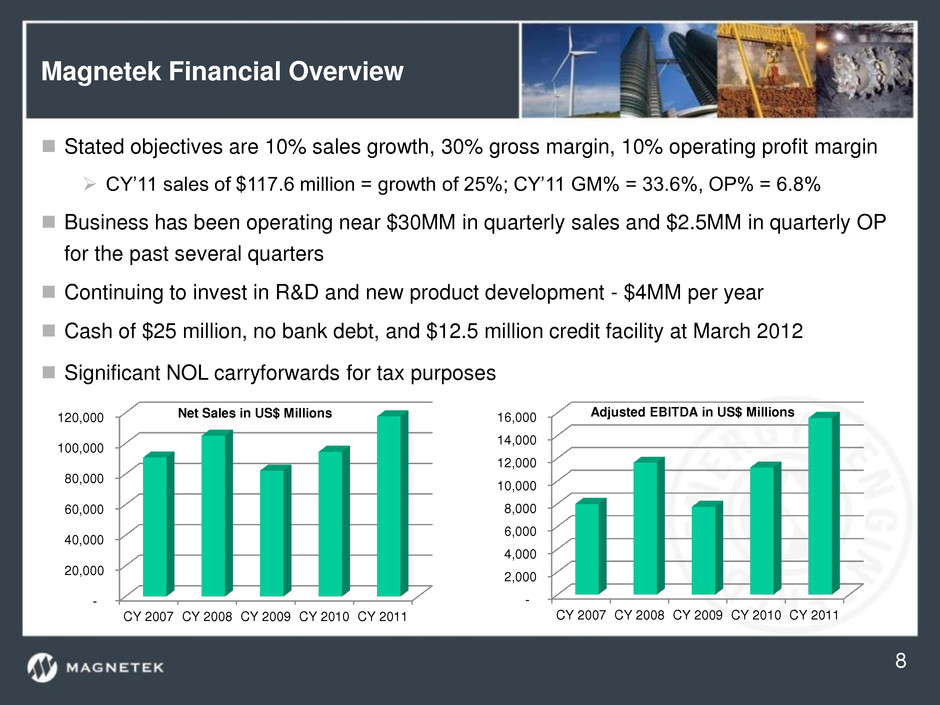
Magnetek Financial Overview Stated objectives are 10% sales growth, 30% gross margin, 10% operating profit margin CY’11 sales of $117.6 million = growth of 25%; CY’11 GM% = 33.6%, OP% = 6.8% Business has been operating near $30MM in quarterly sales and $2.5MM in quarterly OP for the past several quarters Continuing to invest in R&D and new product development - $4MM per year Cash of $25 million, no bank debt, and $12.5 million credit facility at March 2012 Significant NOL carryforwards for tax purposes 8 - 20,000 40,000 60,000 80,000 100,000 120,000 CY 2007 CY 2008 CY 2009 CY 2010 CY 2011 Net Sales in US$ Millions - 2,000 4,000 6,000 8,000 10,000 12,000 14,000 16,000 CY 2007 CY 2008 CY 2009 CY 2010 CY 2011 Adjusted EBITDA in US$ Millions
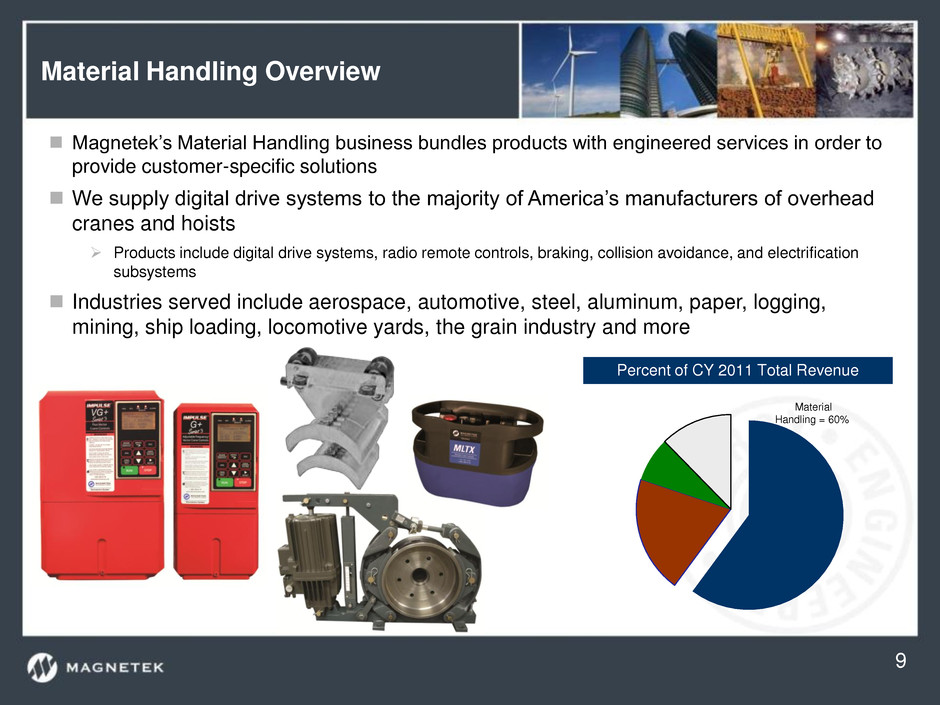
Material Handling Overview Magnetek’s Material Handling business bundles products with engineered services in order to provide customer-specific solutions We supply digital drive systems to the majority of America’s manufacturers of overhead cranes and hoists Products include digital drive systems, radio remote controls, braking, collision avoidance, and electrification subsystems Industries served include aerospace, automotive, steel, aluminum, paper, logging, mining, ship loading, locomotive yards, the grain industry and more Percent of CY 2011 Total Revenue Material Handling = 60% 9
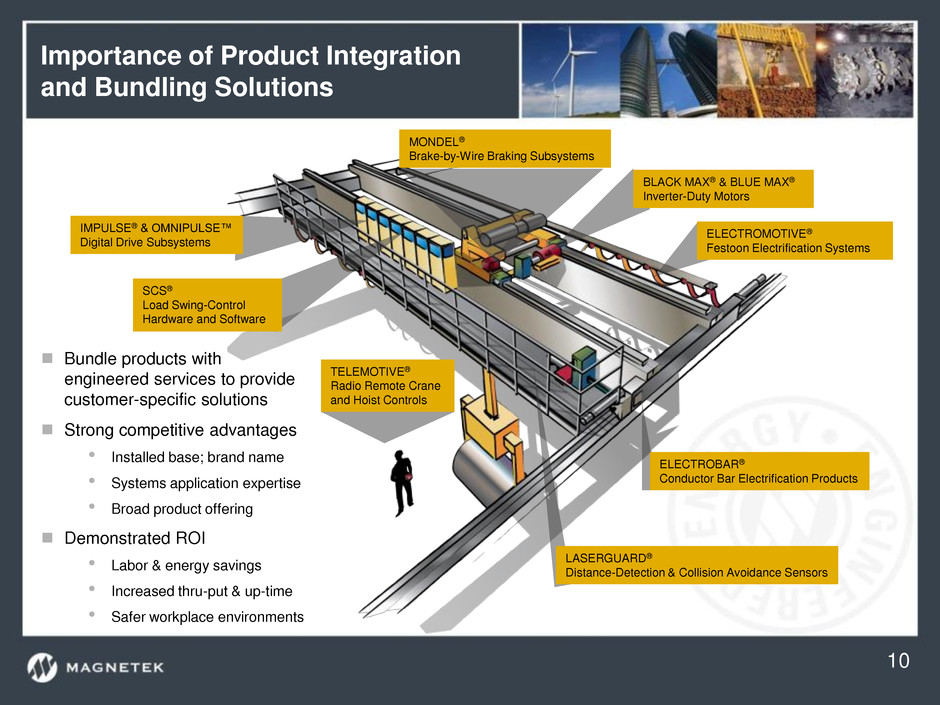
Importance of Product Integration and Bundling Solutions MONDEL® Brake-by-Wire Braking Subsystems BLACK MAX® & BLUE MAX® Inverter-Duty Motors ELECTROMOTIVE® Festoon Electrification Systems LASERGUARD® Distance-Detection & Collision Avoidance Sensors ELECTROBAR® Conductor Bar Electrification Products TELEMOTIVE® Radio Remote Crane and Hoist Controls IMPULSE® & OMNIPULSE™ Digital Drive Subsystems SCS® Load Swing-Control Hardware and Software Bundle products with engineered services to provide customer-specific solutions Strong competitive advantages • Installed base; brand name • Systems application expertise • Broad product offering Demonstrated ROI • Labor & energy savings • Increased thru-put & up-time • Safer workplace environments 10
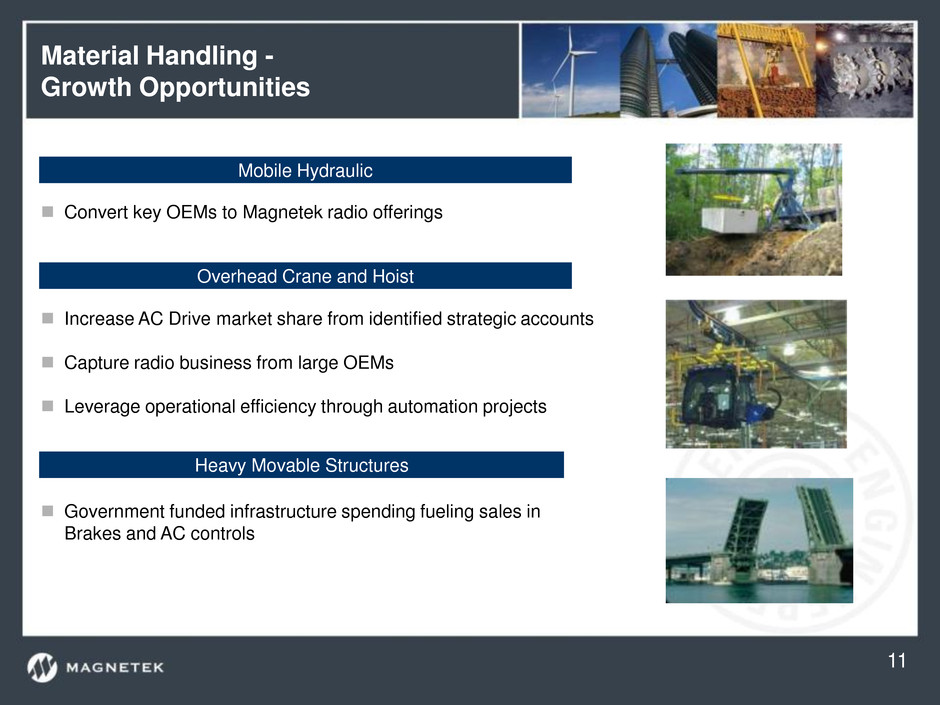
Material Handling - Growth Opportunities Convert key OEMs to Magnetek radio offerings Increase AC Drive market share from identified strategic accounts Capture radio business from large OEMs Leverage operational efficiency through automation projects Government funded infrastructure spending fueling sales in Brakes and AC controls Mobile Hydraulic Overhead Crane and Hoist Heavy Movable Structures 11
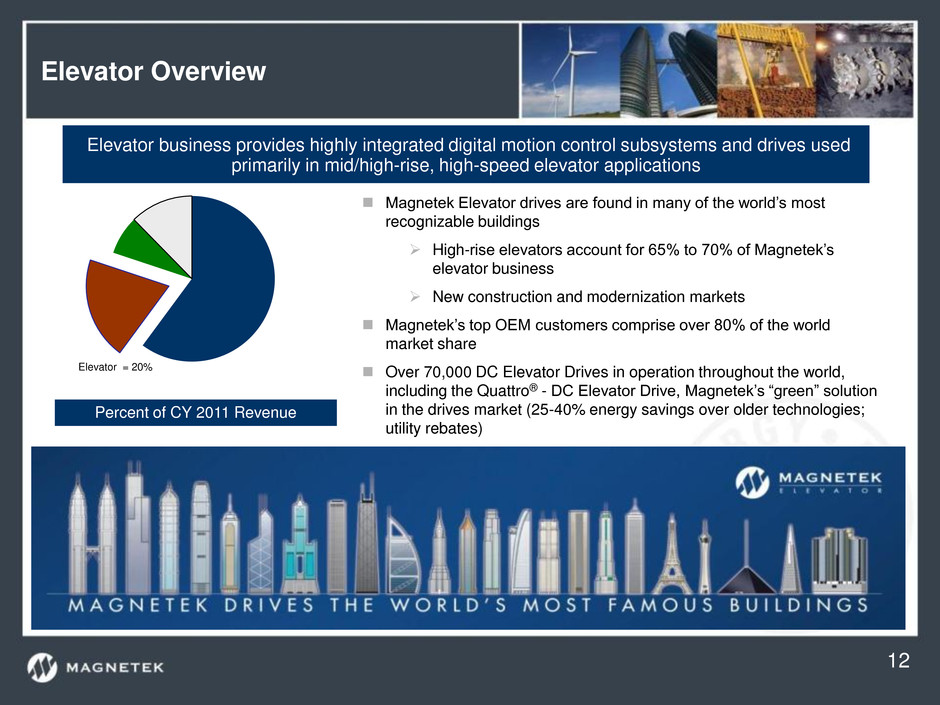
Elevator Overview Magnetek Elevator drives are found in many of the world’s most recognizable buildings High-rise elevators account for 65% to 70% of Magnetek’s elevator business New construction and modernization markets Magnetek’s top OEM customers comprise over 80% of the world market share Over 70,000 DC Elevator Drives in operation throughout the world, including the Quattro® - DC Elevator Drive, Magnetek’s “green” solution in the drives market (25-40% energy savings over older technologies; utility rebates) Percent of CY 2011 Revenue Elevator business provides highly integrated digital motion control subsystems and drives used primarily in mid/high-rise, high-speed elevator applications Elevator = 20% 12
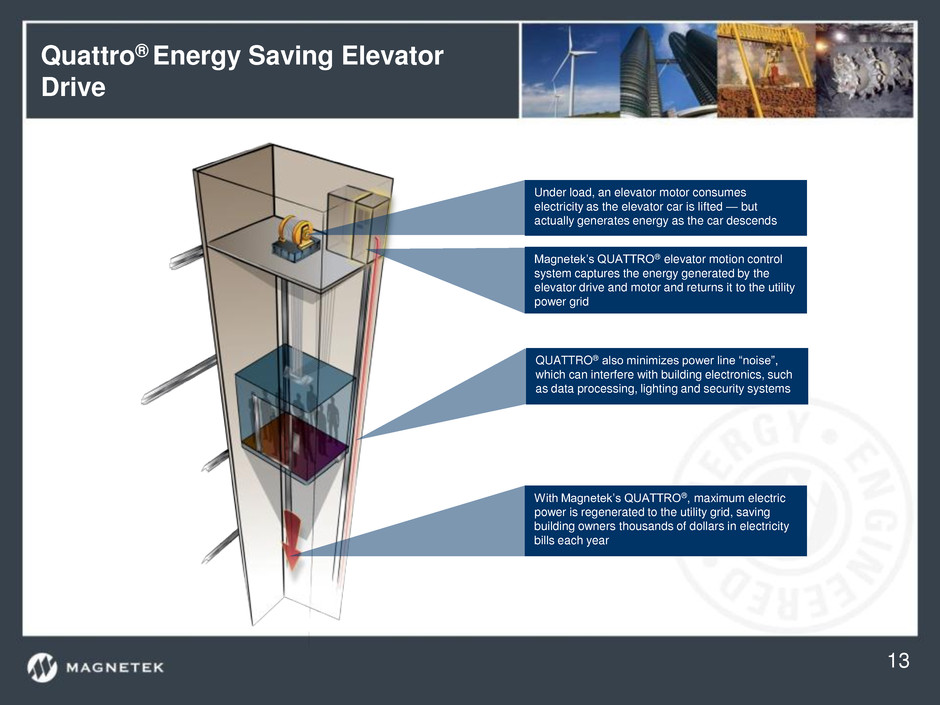
Quattro® Energy Saving Elevator Drive Under load, an elevator motor consumes electricity as the elevator car is lifted — but actually generates energy as the car descends Magnetek’s QUATTRO® elevator motion control system captures the energy generated by the elevator drive and motor and returns it to the utility power grid QUATTRO® also minimizes power line “noise”, which can interfere with building electronics, such as data processing, lighting and security systems With Magnetek’s QUATTRO®, maximum electric power is regenerated to the utility grid, saving building owners thousands of dollars in electricity bills each year 13
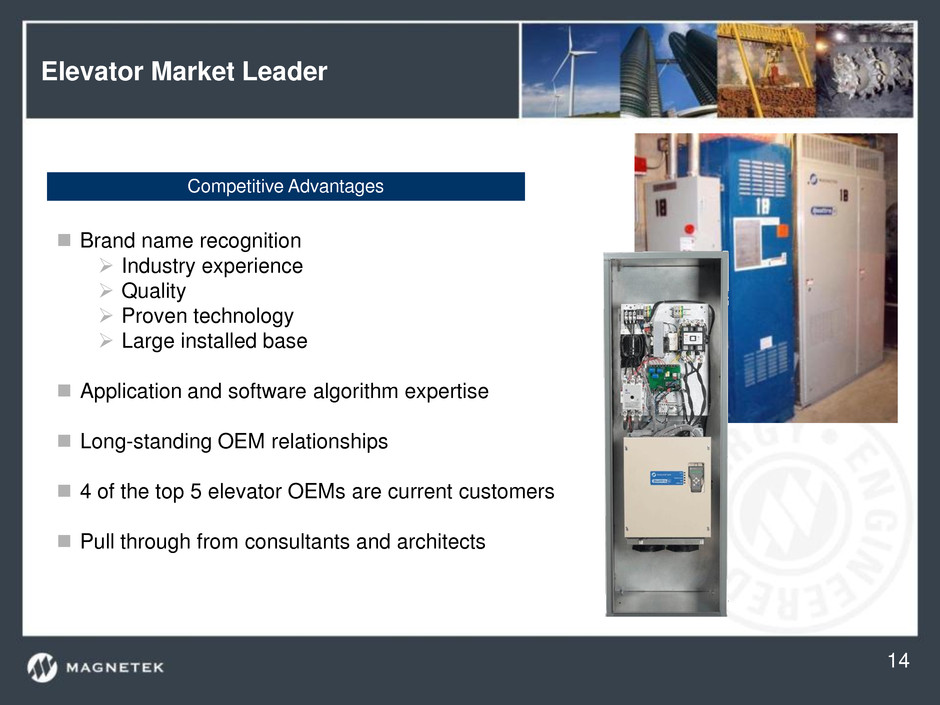
Elevator Market Leader Competitive Advantages Brand name recognition Industry experience Quality Proven technology Large installed base Application and software algorithm expertise Long-standing OEM relationships 4 of the top 5 elevator OEMs are current customers Pull through from consultants and architects 14
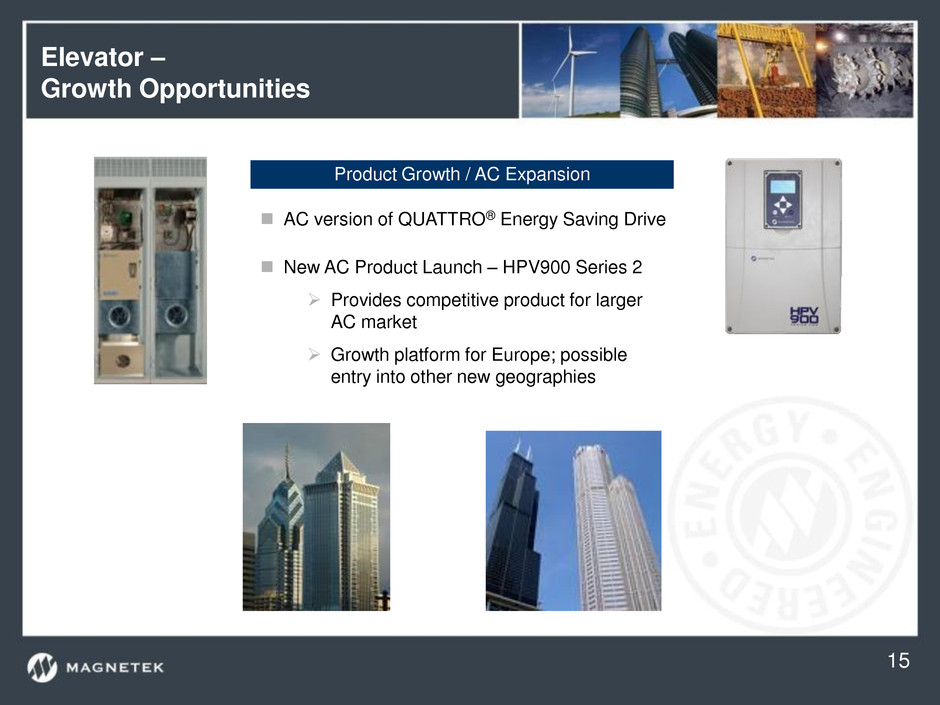
Elevator – Growth Opportunities AC version of QUATTRO® Energy Saving Drive Product Growth / AC Expansion New AC Product Launch – HPV900 Series 2 Provides competitive product for larger AC market Growth platform for Europe; possible entry into other new geographies 15
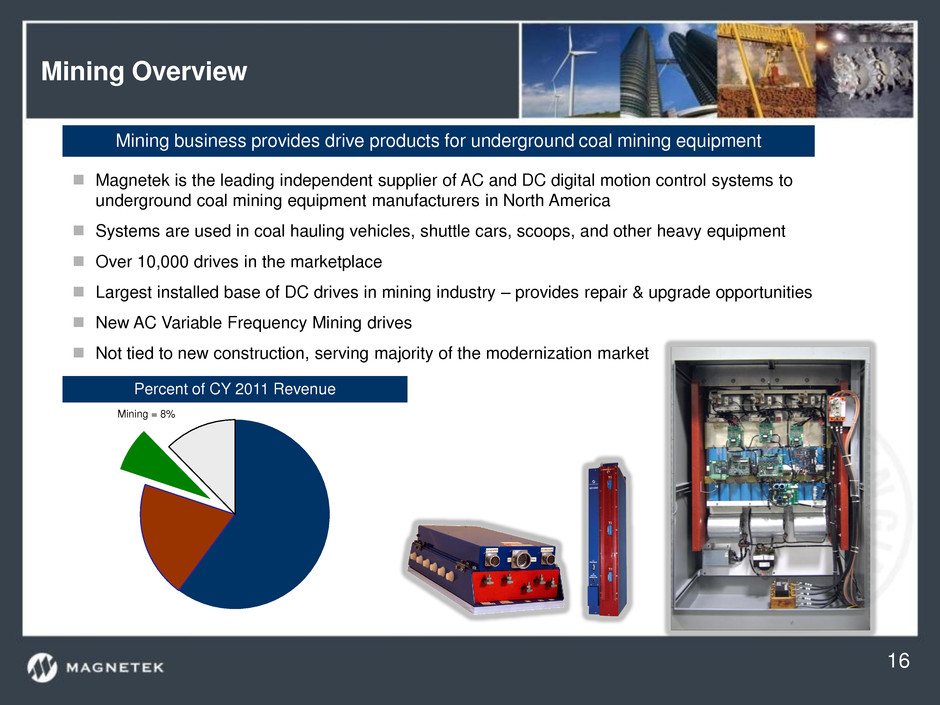
Mining Overview Magnetek is the leading independent supplier of AC and DC digital motion control systems to underground coal mining equipment manufacturers in North America Systems are used in coal hauling vehicles, shuttle cars, scoops, and other heavy equipment Over 10,000 drives in the marketplace Largest installed base of DC drives in mining industry – provides repair & upgrade opportunities New AC Variable Frequency Mining drives Not tied to new construction, serving majority of the modernization market Percent of CY 2011 Revenue Mining business provides drive products for underground coal mining equipment 16 Mining = 8%
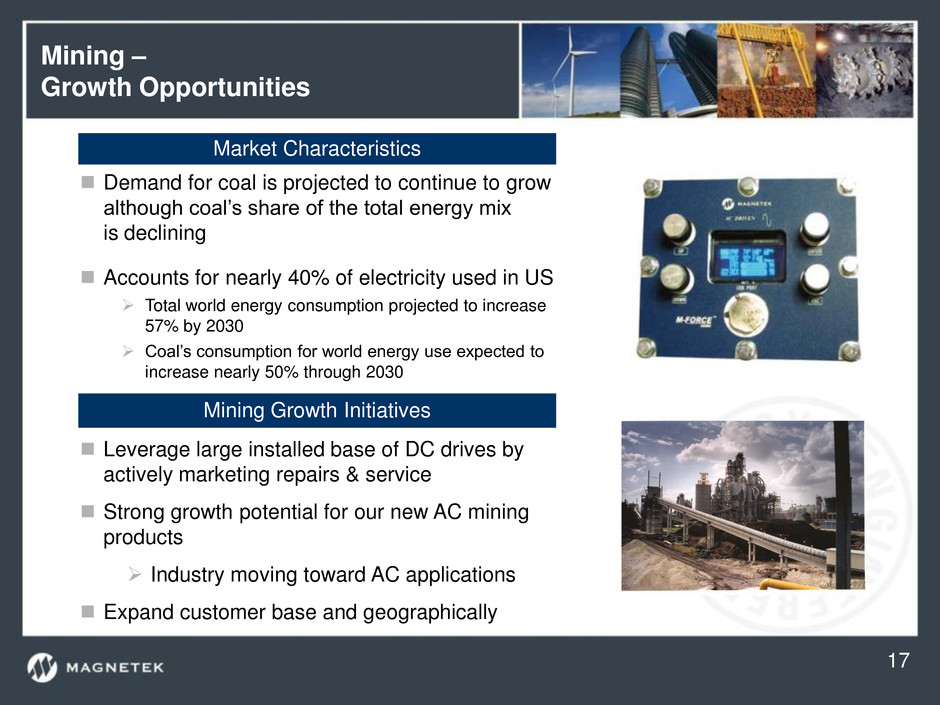
Mining – Growth Opportunities Leverage large installed base of DC drives by actively marketing repairs & service Strong growth potential for our new AC mining products Industry moving toward AC applications Expand customer base and geographically Mining Growth Initiatives 17 Demand for coal is projected to continue to grow although coal’s share of the total energy mix is declining Accounts for nearly 40% of electricity used in US Total world energy consumption projected to increase 57% by 2030 Coal’s consumption for world energy use expected to increase nearly 50% through 2030 Market Characteristics
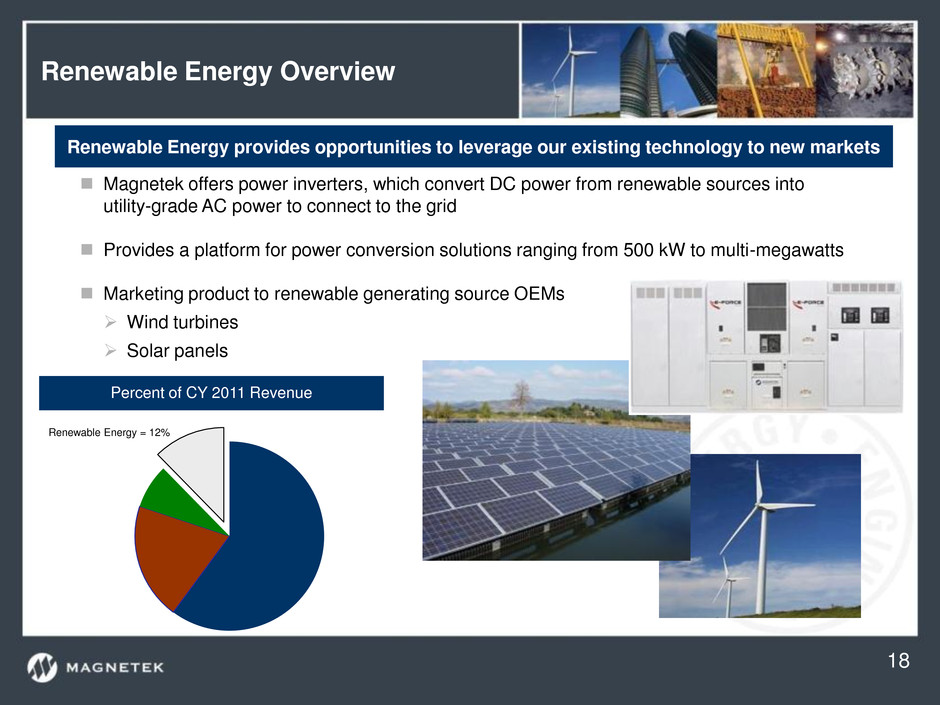
Renewable Energy Overview Magnetek offers power inverters, which convert DC power from renewable sources into utility-grade AC power to connect to the grid Provides a platform for power conversion solutions ranging from 500 kW to multi-megawatts Marketing product to renewable generating source OEMs Wind turbines Solar panels Percent of CY 2011 Revenue Renewable Energy provides opportunities to leverage our existing technology to new markets 18 Renewable Energy = 12%
Market Overview- Renewable Energy 19 Emerging industries characterized by rapidly changing market conditions and evolving, non-standard solutions Lower traditional energy prices negatively impact RE market conditions Attractive growth prospects remain in certain market segments (utility scale solar) State renewable energy standards (RES) continue to drive future growth in renewable energy markets; future tax incentives are less certain Growth and profitability issues are significantly impacting valuations Current Market Characteristics Current Inverter Market Characteristics Growing number of world-class competitors Resulting in price declines and margin erosion High levels of R&D required Due to changing market requirements, customized solutions, and short product life cycles Scale is becoming increasingly important to compete effectively Declining profitability for nearly all competitors Market conditions have changed significantly over the past several years
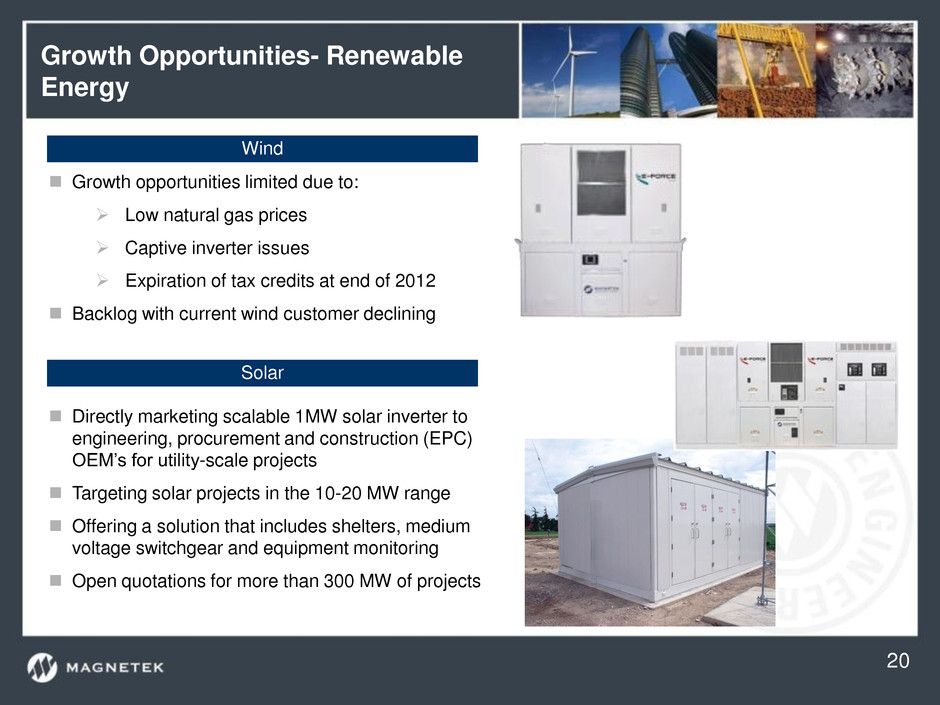
Growth Opportunities- Renewable Energy Directly marketing scalable 1MW solar inverter to engineering, procurement and construction (EPC) OEM’s for utility-scale projects Targeting solar projects in the 10-20 MW range Offering a solution that includes shelters, medium voltage switchgear and equipment monitoring Open quotations for more than 300 MW of projects Solar 20 Wind Growth opportunities limited due to: Low natural gas prices Captive inverter issues Expiration of tax credits at end of 2012 Backlog with current wind customer declining
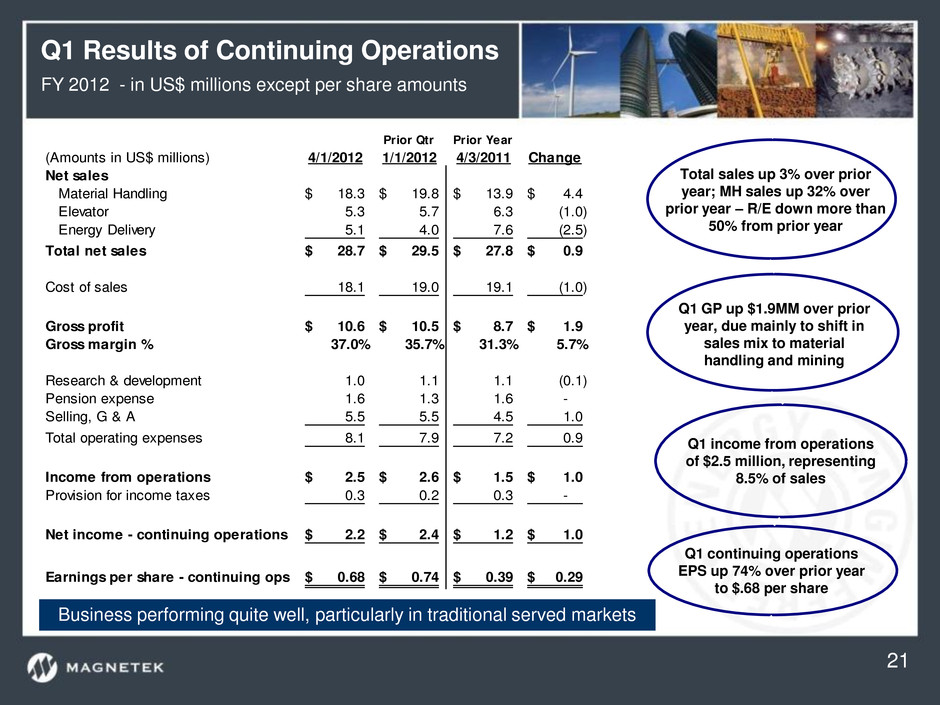
Q1 Results of Continuing Operations FY 2012 - in US$ millions except per share amounts Prior Qtr Prior Year (Amounts in US$ millions) 4/1/2012 1/1/2012 4/3/2011 Change Net sales Material Handling 18.3$ 19.8$ 13.9$ 4.4$ Elevator 5.3 5.7 6.3 (1.0) Energy Delivery 5.1 4.0 7.6 (2.5) Total net sales 28.7$ 29.5$ 27.8$ 0.9$ Cost of sales 18.1 19.0 19.1 (1.0) Gross profit 10.6$ 10.5$ 8.7$ 1.9$ Gross margin % 37.0% 35.7% 31.3% 5.7% Research & development 1.0 1.1 1.1 (0.1) Pension expense 1.6 1.3 1.6 - Selling, G & A 5.5 5.5 4.5 1.0 Total operating expenses 8.1 7.9 7.2 0.9 Income from operations 2.5$ 2.6$ 1.5$ 1.0$ Provision for income taxes 0.3 0.2 0.3 - Net income - continuing operations 2.2$ 2.4$ 1.2$ 1.0$ Earnings per share - continuing ops 0.68$ 0.74$ 0.39$ 0.29$ Total sales up 3% over prior year; MH sales up 32% over prior year – R/E down more than 50% from prior year Q1 GP up $1.9MM over prior year, due mainly to shift in sales mix to material handling and mining Q1 income from operations of $2.5 million, representing 8.5% of sales Q1 continuing operations EPS up 74% over prior year to $.68 per share Business performing quite well, particularly in traditional served markets 21
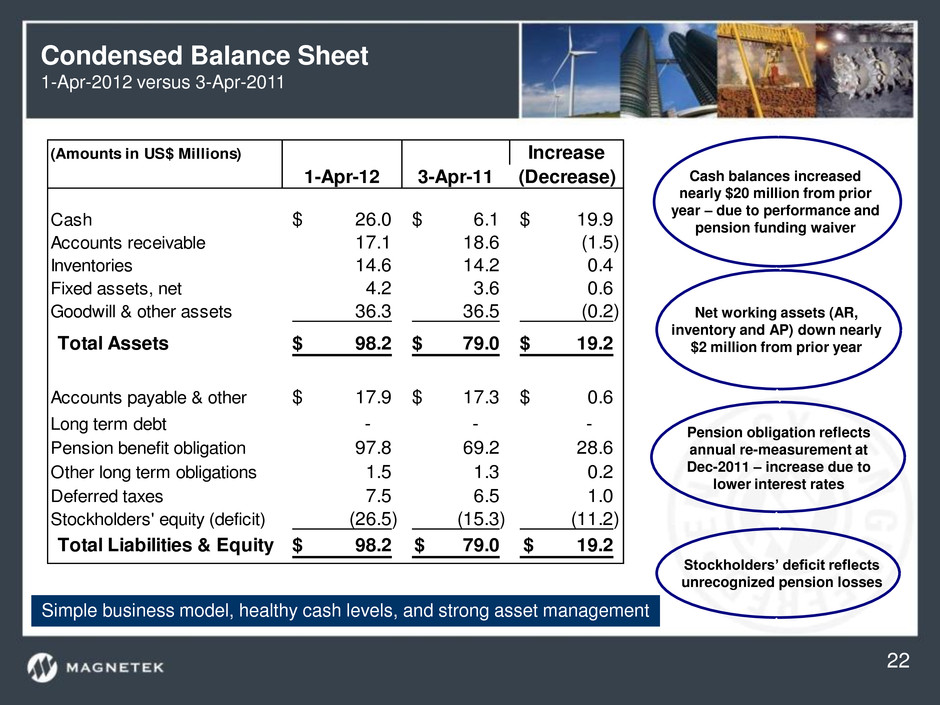
Condensed Balance Sheet 1-Apr-2012 versus 3-Apr-2011 (Amounts in US$ Millions) Increase 1-Apr-12 3-Apr-11 (Decrease) Cash 26.0$ 6.1$ 19.9$ Accounts receivable 17.1 18.6 (1.5) Inventories 14.6 14.2 0.4 Fixed assets, net 4.2 3.6 0.6 Goodwill & other assets 36.3 36.5 (0.2) Total Assets 98.2$ 79.0$ 19.2$ Accounts payable & other 17.9$ 17.3$ 0.6$ Long term debt - - - Pension benefit obligation 97.8 69.2 28.6 Other long term obligations 1.5 1.3 0.2 Deferred taxes 7.5 6.5 1.0 Stockholders' equity (deficit) (26.5) (15.3) (11.2) Total Liabilities & Equity 98.2$ 79.0$ 19.2$ Pension obligation reflects annual re-measurement at Dec-2011 – increase due to lower interest rates Cash balances increased nearly $20 million from prior year – due to performance and pension funding waiver Net working assets (AR, inventory and AP) down nearly $2 million from prior year Stockholders’ deficit reflects unrecognized pension losses 22 Simple business model, healthy cash levels, and strong asset management
Defined Benefit Pension Plan Legacy from our history as a $1 billion industrial electro-mechanical company until late 1990s / early 2000 – retained the liability as we divested certain businesses Plan was frozen in June 2003 – no new participants, no additional service years, etc. The increase in our pension obligation since June 2008 is mainly due to reductions in interest rates since that time We believe it’s likely that the majority of the interest rate declines are behind us Future interest rate increases or changes in the funding rules could significantly help our pension situation As our pension liability decreases over time, the value of our equity should increase 23 Pension obligation is manageable – has not impacted our ability to invest in & grow our business
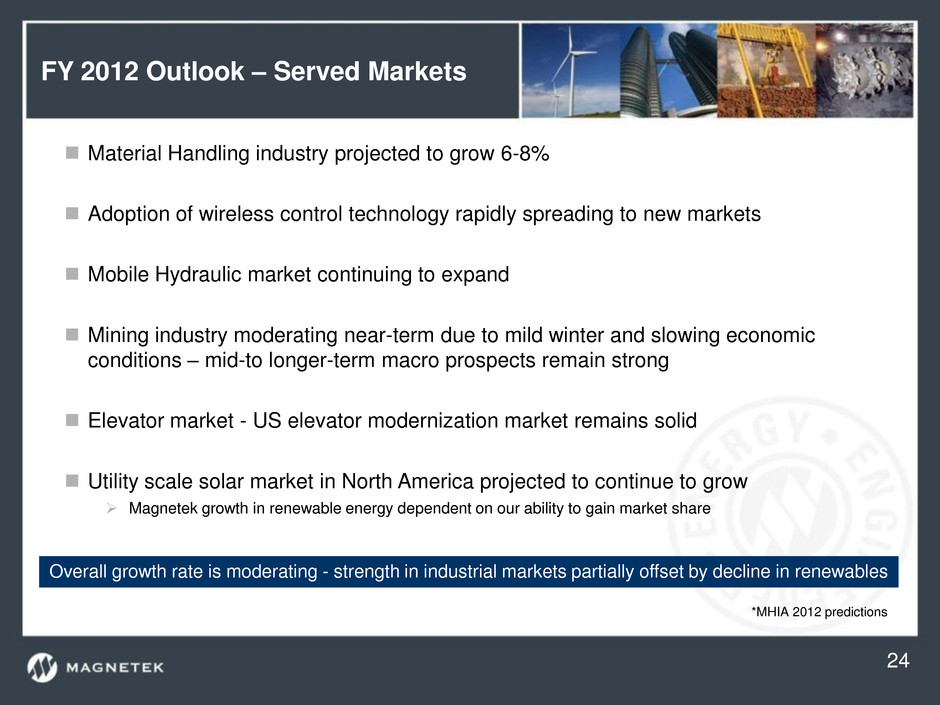
FY 2012 Outlook – Served Markets *MHIA 2012 predictions Material Handling industry projected to grow 6-8% Adoption of wireless control technology rapidly spreading to new markets Mobile Hydraulic market continuing to expand Mining industry moderating near-term due to mild winter and slowing economic conditions – mid-to longer-term macro prospects remain strong Elevator market - US elevator modernization market remains solid Utility scale solar market in North America projected to continue to grow Magnetek growth in renewable energy dependent on our ability to gain market share Overall growth rate is moderating - strength in industrial markets partially offset by decline in renewables 24
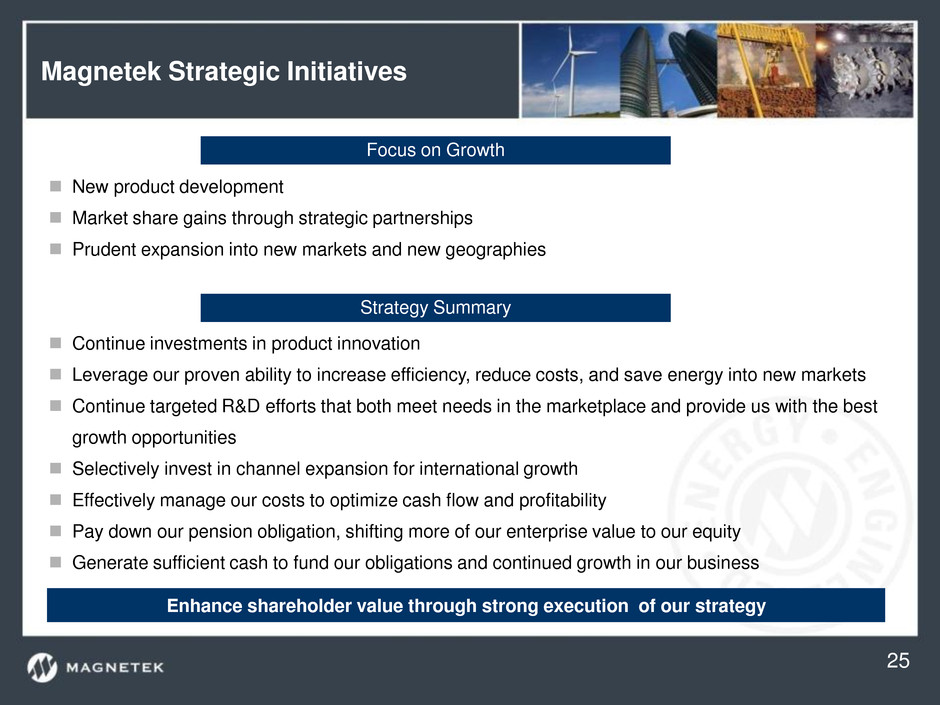
Magnetek Strategic Initiatives New product development Market share gains through strategic partnerships Prudent expansion into new markets and new geographies Continue investments in product innovation Leverage our proven ability to increase efficiency, reduce costs, and save energy into new markets Continue targeted R&D efforts that both meet needs in the marketplace and provide us with the best growth opportunities Selectively invest in channel expansion for international growth Effectively manage our costs to optimize cash flow and profitability Pay down our pension obligation, shifting more of our enterprise value to our equity Generate sufficient cash to fund our obligations and continued growth in our business Focus on Growth Strategy Summary Enhance shareholder value through strong execution of our strategy 25
Appendix
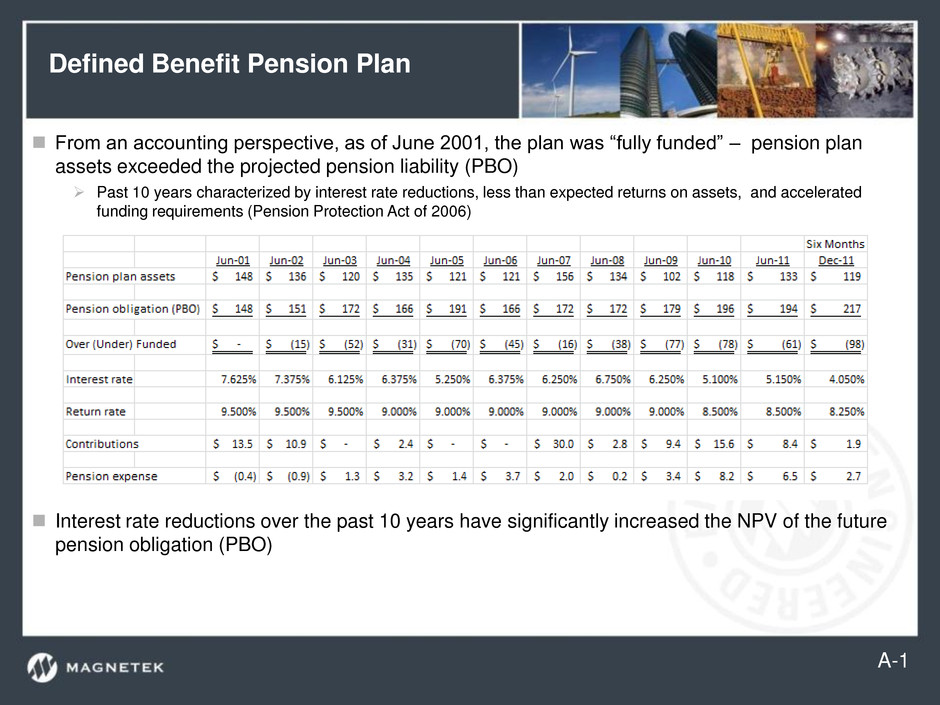
Defined Benefit Pension Plan From an accounting perspective, as of June 2001, the plan was “fully funded” – pension plan assets exceeded the projected pension liability (PBO) Past 10 years characterized by interest rate reductions, less than expected returns on assets, and accelerated funding requirements (Pension Protection Act of 2006) Interest rate reductions over the past 10 years have significantly increased the NPV of the future pension obligation (PBO) A-1
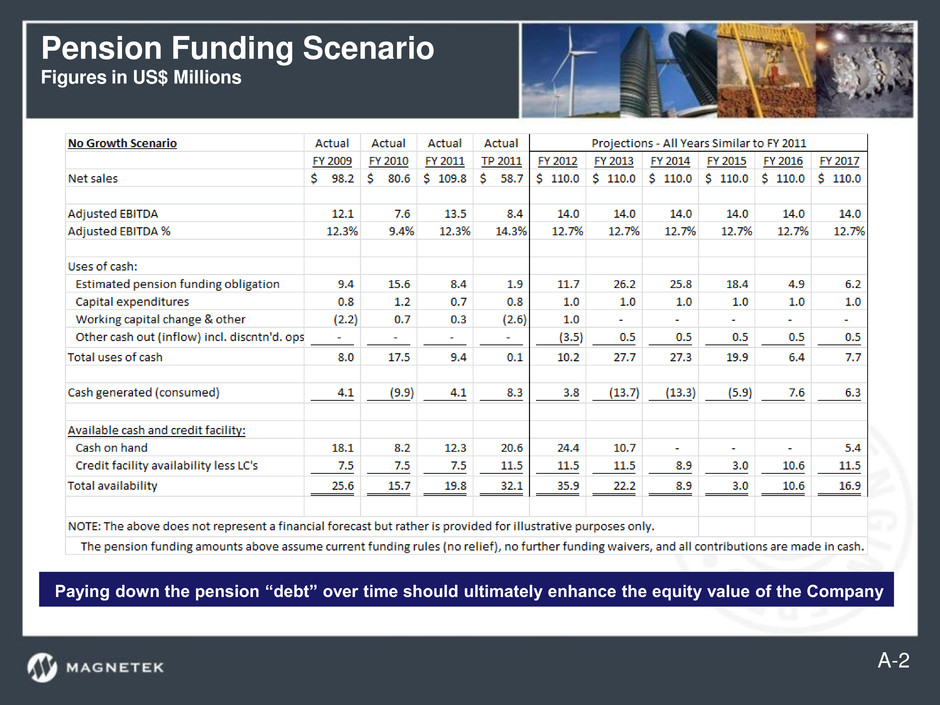
Pension Funding Scenario Figures in US$ Millions Paying down the pension “debt” over time should ultimately enhance the equity value of the Company A-2
Defined Benefit Pension Plan Funding Status per Pension Protection Act of 2006 Magnetek made a voluntary cash contribution of $30MM in December 2006 o Since that time, we have made additional contributions totaling $38MM, funded by cash on hand and cash generated from operations (aggregate cash contributions of $68MM over 5 years) We received a funding waiver of plan year 2011 contributions (deferral of contributions to future periods) in an amount of $17MM o Allowed us to replenish cash reserves & re-invest in growing the business o Buys time for interest rates to increase, which ultimately would reduce the funding total o A 100 basis point movement in interest rates = $20MM of funding Can apply for additional funding waivers in the future if necessary Pension plans making headline news – possibility of funding relief is growing A-3 Ultimate objective is to terminate plan if economically feasible
Primary IR Contact: Marty Schwenner Chief Financial Officer 262.703.4282


