EXPERTS IN POWER AND MOTION CONTROL
This presentation contains “forward-looking statements,” as defined in the Private Securities Litigation Reform Act of 1995, that are subject to risks and uncertainties which, in many cases, are beyond the control of the company. These risks and uncertainties include, but are not limited to, economic conditions in general, business conditions in material handling, elevator, and mining markets, operating conditions, competitive factors such as pricing and technology, risks associated with acquisitions and divestitures, legal proceedings, the risk that the company’s ultimate costs of doing business exceed present estimates, and those described in Item 1A of our most recent annual report on Form 10-K. Further information regarding factors that could affect Magnetek’s results can be found in the company’s filings with the Securities and Exchange Commission. The forward-looking statements in this presentation relate to developments, results, conditions, or other events we expect or anticipate will occur in the future. Words such as “believes,” “anticipates,” “estimate,” “may,” “should,” “could,” “plans,” “expects” and similar expressions identify forward-looking statements. Those statements may relate to future equity value, pension expenses, pension obligations and funding amounts, revenues, margins, earnings, cash flows, market conditions, new strategies, and the competitive environment, and include the statements on the slides entitled “Industry & Application Expertise Drive Higher Margins,” “Growth Market for Wireless Controls,” “Elevator Growth Opportunities,” “Mining Growth Opportunities,” “Today’s Business,” “Q3 P&L - Continuing Operations,” “Balance Sheet Comparison,” “2014 P&L Forecast – Continuing Operations,” “Pension Actions & Status,” “Future Growth Drivers in Our Served Markets,” “FY 2014-2016 Top Level Objectives,” “Why Invest in Magnetek?,” and “Relationship Between Share Price and Pension Obligation.” We undertake no obligation to update or revise any forward-looking statements. Actual results could differ materially from those anticipated in the forward-looking statements and from any projections or illustrations included in this presentation. We may, in the course of our financial presentations, earnings releases, earnings conference calls, and otherwise, publicly disclose certain numerical measures which are or may be considered "non-GAAP financial measures” under SEC Regulation G. As used herein, "GAAP" refers to generally accepted accounting principles in the United States. Non-GAAP financial measures disclosed by management are provided as additional information to investors in order to provide them with an alternative method for assessing our financial condition and operating results. These measures are not in accordance with, or a substitute for, GAAP, and may be different from or inconsistent with non-GAAP financial measures used by other companies. This presentation includes non-GAAP measures such as EBITDA and adjusted EBITDA. EBITDA represents our GAAP results adjusted to exclude interest, taxes, depreciation and amortization. Adjusted EBITDA represents EBITDA adjusted to exclude non-cash pension and stock compensation expenses. Forward-Looking Statements 2
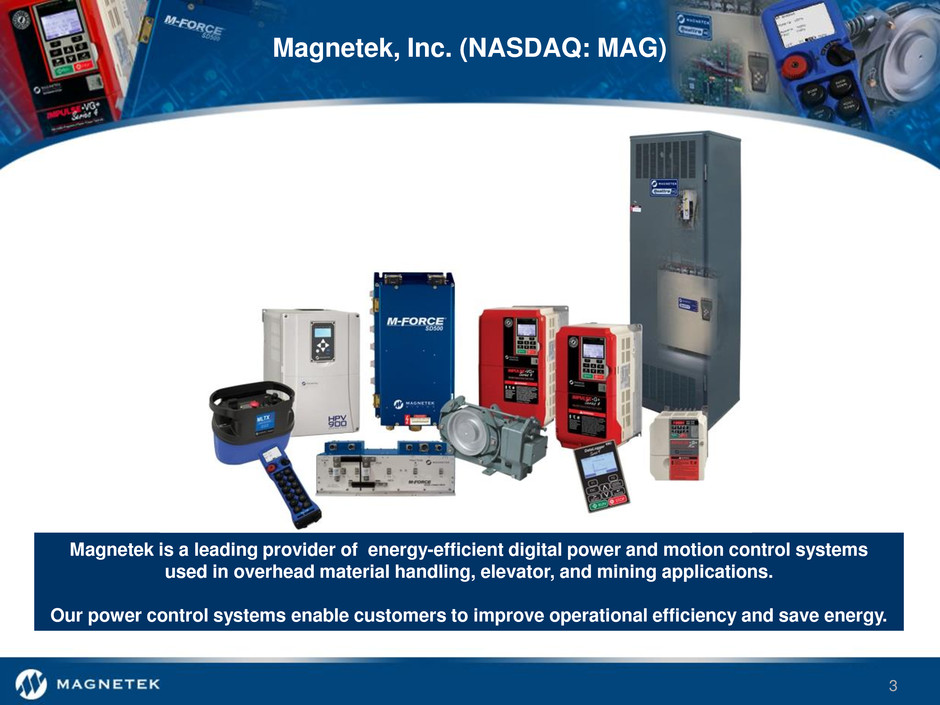
Magnetek, Inc. (NASDAQ: MAG) Magnetek is a leading provider of energy-efficient digital power and motion control systems used in overhead material handling, elevator, and mining applications. Our power control systems enable customers to improve operational efficiency and save energy. 3
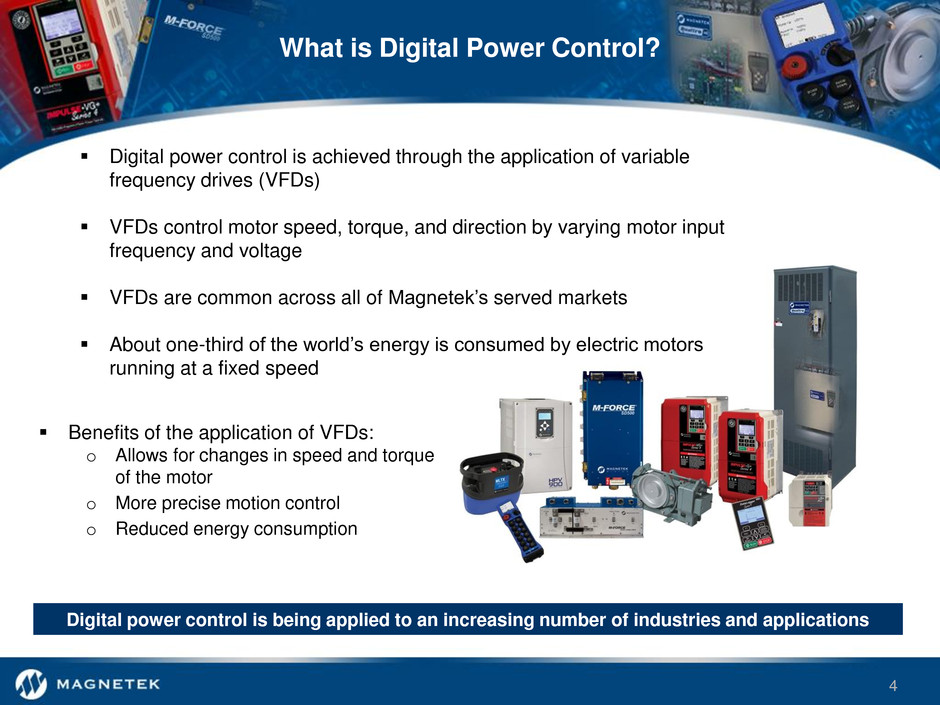
What is Digital Power Control? Digital power control is being applied to an increasing number of industries and applications Digital power control is achieved through the application of variable frequency drives (VFDs) VFDs control motor speed, torque, and direction by varying motor input frequency and voltage VFDs are common across all of Magnetek’s served markets About one-third of the world’s energy is consumed by electric motors running at a fixed speed Benefits of the application of VFDs: o Allows for changes in speed and torque of the motor o More precise motion control o Reduced energy consumption 4
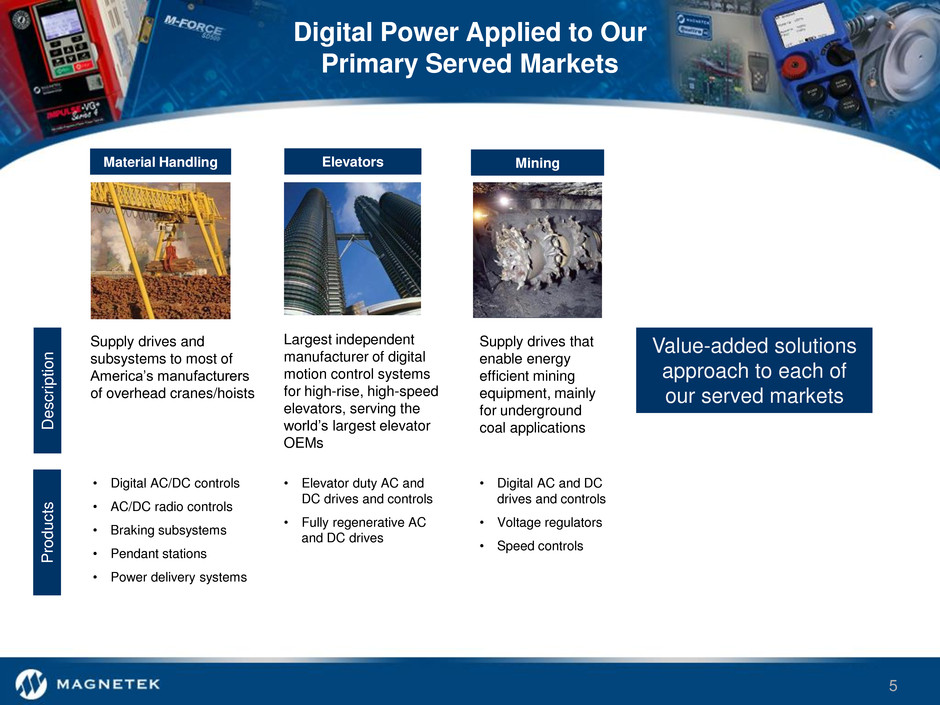
Digital Power Applied to Our Primary Served Markets Material Handling MiningElevators Descrip tio n Supply drives and subsystems to most of America’s manufacturers of overhead cranes/hoists Largest independent manufacturer of digital motion control systems for high-rise, high-speed elevators, serving the world’s largest elevator OEMs Value-added solutions approach to each of our served markets P ro d u ct s • Digital AC/DC controls • AC/DC radio controls • Braking subsystems • Pendant stations • Power delivery systems • Elevator duty AC and DC drives and controls • Fully regenerative AC and DC drives • Digital AC and DC drives and controls • Voltage regulators • Speed controls Supply drives that enable energy efficient mining equipment, mainly for underground coal applications 5
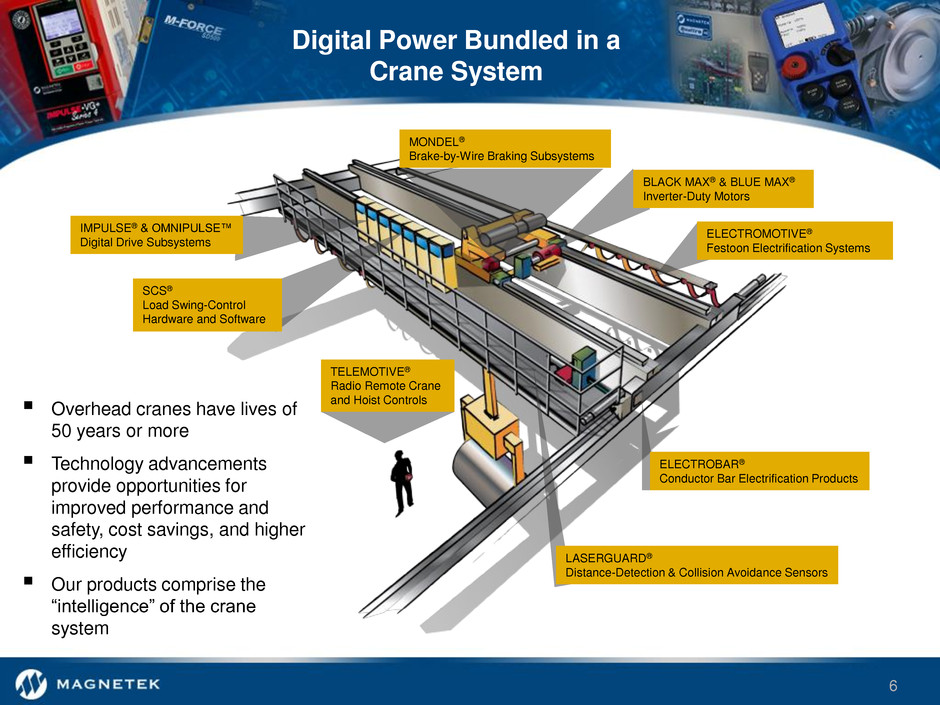
Overhead cranes have lives of 50 years or more Technology advancements provide opportunities for improved performance and safety, cost savings, and higher efficiency Our products comprise the “intelligence” of the crane system Digital Power Bundled in a Crane System MONDEL® Brake-by-Wire Braking Subsystems BLACK MAX® & BLUE MAX® Inverter-Duty Motors ELECTROMOTIVE® Festoon Electrification Systems LASERGUARD® Distance-Detection & Collision Avoidance Sensors ELECTROBAR® Conductor Bar Electrification Products TELEMOTIVE® Radio Remote Crane and Hoist Controls IMPULSE® & OMNIPULSE™ Digital Drive Subsystems SCS® Load Swing-Control Hardware and Software 6
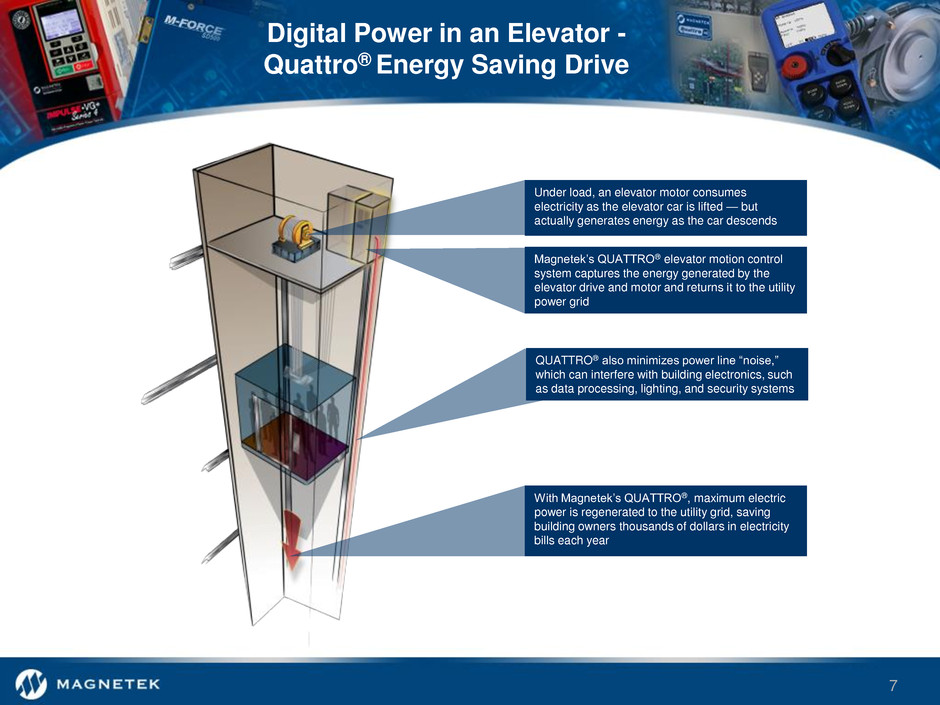
Digital Power in an Elevator - Quattro® Energy Saving Drive Under load, an elevator motor consumes electricity as the elevator car is lifted — but actually generates energy as the car descends Magnetek’s QUATTRO® elevator motion control system captures the energy generated by the elevator drive and motor and returns it to the utility power grid QUATTRO® also minimizes power line “noise,” which can interfere with building electronics, such as data processing, lighting, and security systems With Magnetek’s QUATTRO®, maximum electric power is regenerated to the utility grid, saving building owners thousands of dollars in electricity bills each year 7
Magnetek has built a long-standing, relationship-driven, diversified blue-chip customer base that includes many of the most recognized names in its served markets We Touch Many Blue-Chip Customers Strong customer and end-user loyalty over years of proven innovation, expertise, and service 8
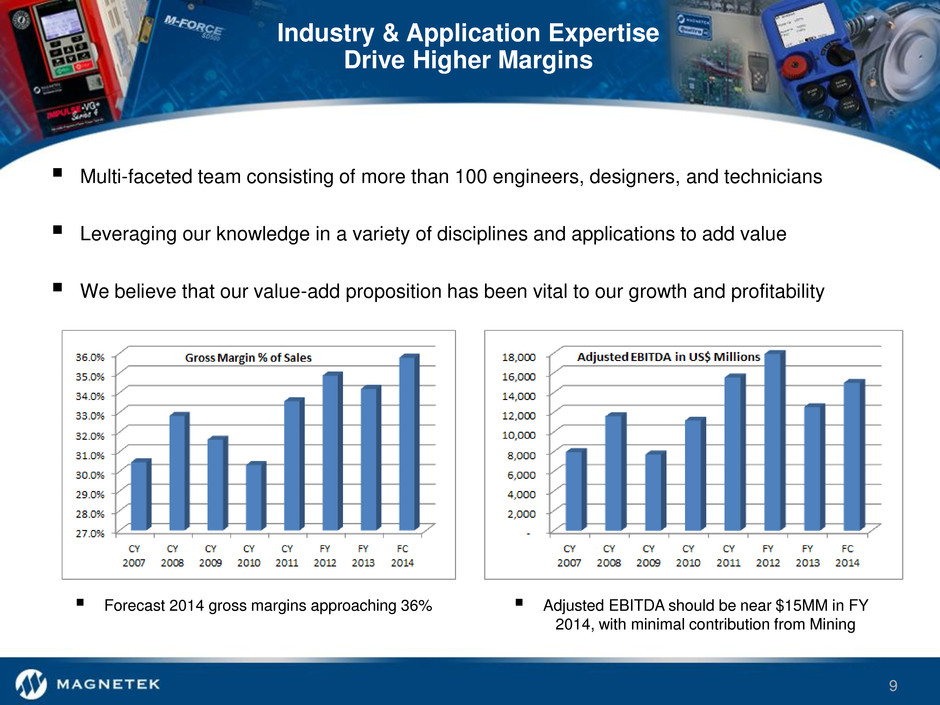
Industry & Application Expertise Drive Higher Margins Multi-faceted team consisting of more than 100 engineers, designers, and technicians Leveraging our knowledge in a variety of disciplines and applications to add value We believe that our value-add proposition has been vital to our growth and profitability Forecast 2014 gross margins approaching 36% Adjusted EBITDA should be near $15MM in FY 2014, with minimal contribution from Mining 9
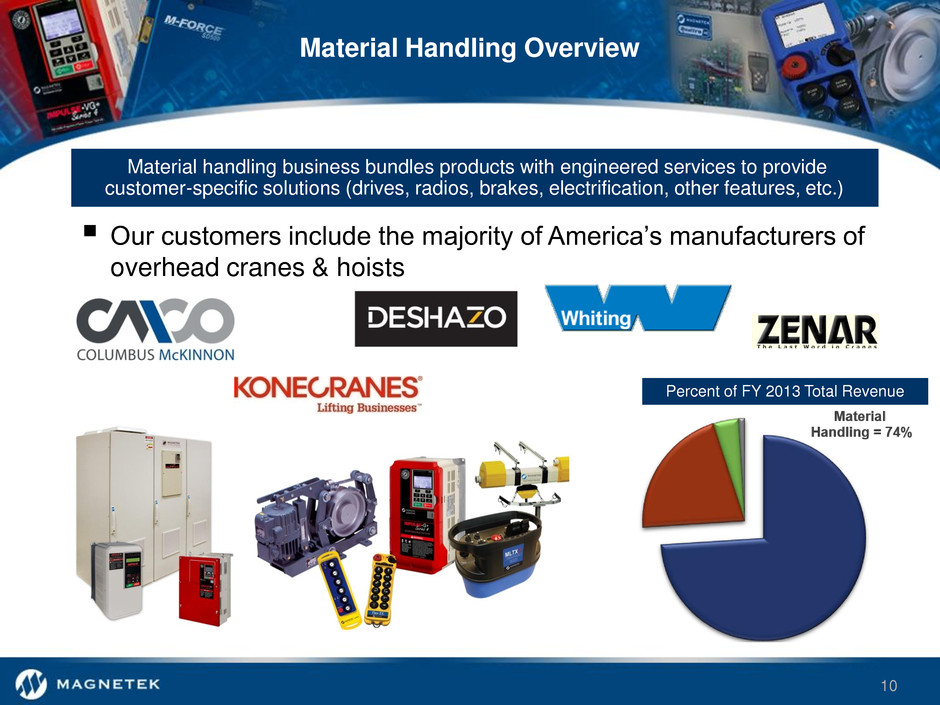
Material Handling Overview Our customers include the majority of America’s manufacturers of overhead cranes & hoists Percent of FY 2013 Total Revenue Material handling business bundles products with engineered services to provide customer-specific solutions (drives, radios, brakes, electrification, other features, etc.) 10
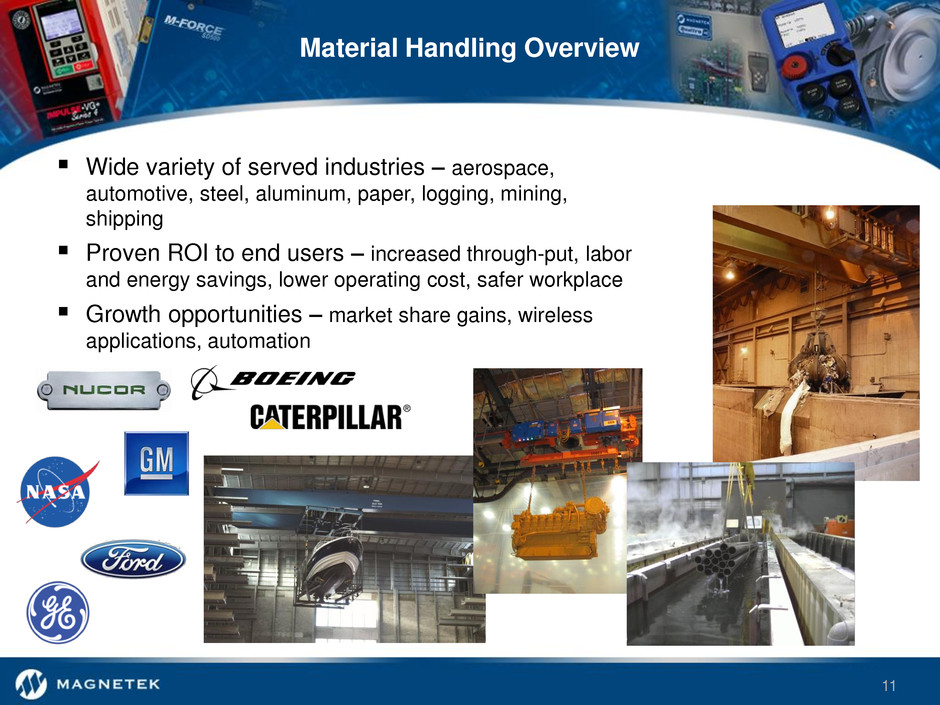
Material Handling Overview Wide variety of served industries – aerospace, automotive, steel, aluminum, paper, logging, mining, shipping Proven ROI to end users – increased through-put, labor and energy savings, lower operating cost, safer workplace Growth opportunities – market share gains, wireless applications, automation 11
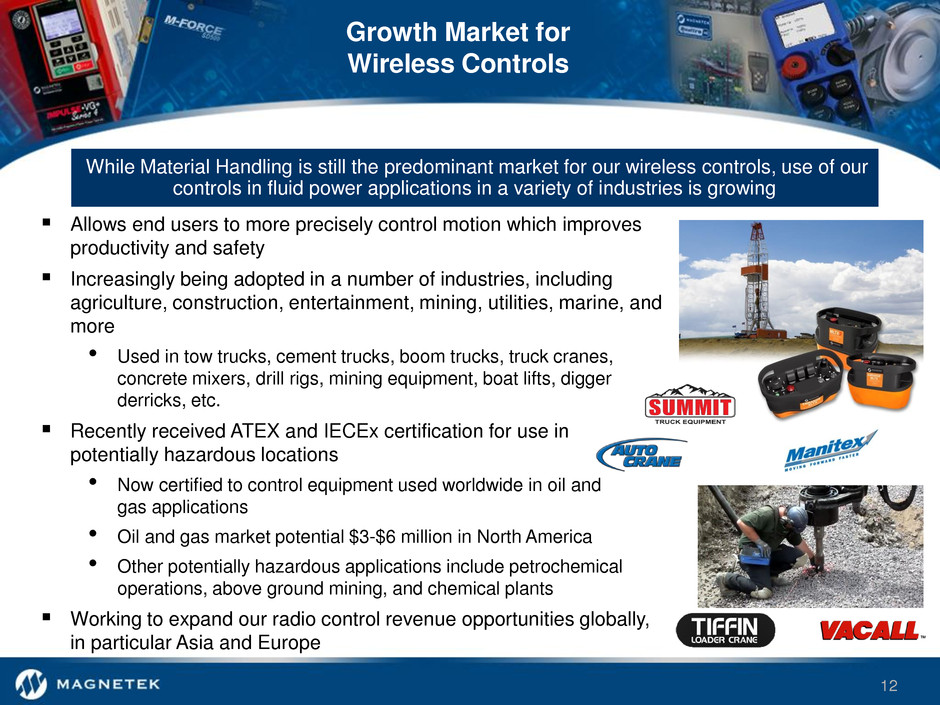
Growth Market for Wireless Controls Allows end users to more precisely control motion which improves productivity and safety Increasingly being adopted in a number of industries, including agriculture, construction, entertainment, mining, utilities, marine, and more • Used in tow trucks, cement trucks, boom trucks, truck cranes, concrete mixers, drill rigs, mining equipment, boat lifts, digger derricks, etc. Recently received ATEX and IECEx certification for use in potentially hazardous locations • Now certified to control equipment used worldwide in oil and gas applications • Oil and gas market potential $3-$6 million in North America • Other potentially hazardous applications include petrochemical operations, above ground mining, and chemical plants Working to expand our radio control revenue opportunities globally, in particular Asia and Europe While Material Handling is still the predominant market for our wireless controls, use of our controls in fluid power applications in a variety of industries is growing 12
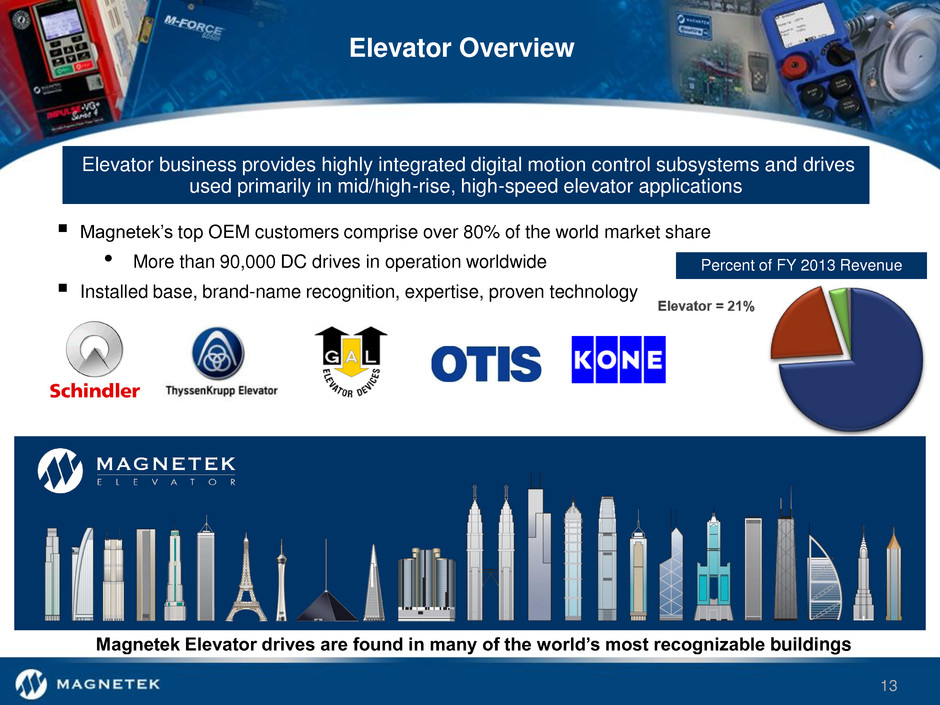
Elevator Overview Magnetek Elevator drives are found in many of the world’s most recognizable buildings Percent of FY 2013 Revenue Elevator business provides highly integrated digital motion control subsystems and drives used primarily in mid/high-rise, high-speed elevator applications Magnetek’s top OEM customers comprise over 80% of the world market share • More than 90,000 DC drives in operation worldwide Installed base, brand-name recognition, expertise, proven technology 13
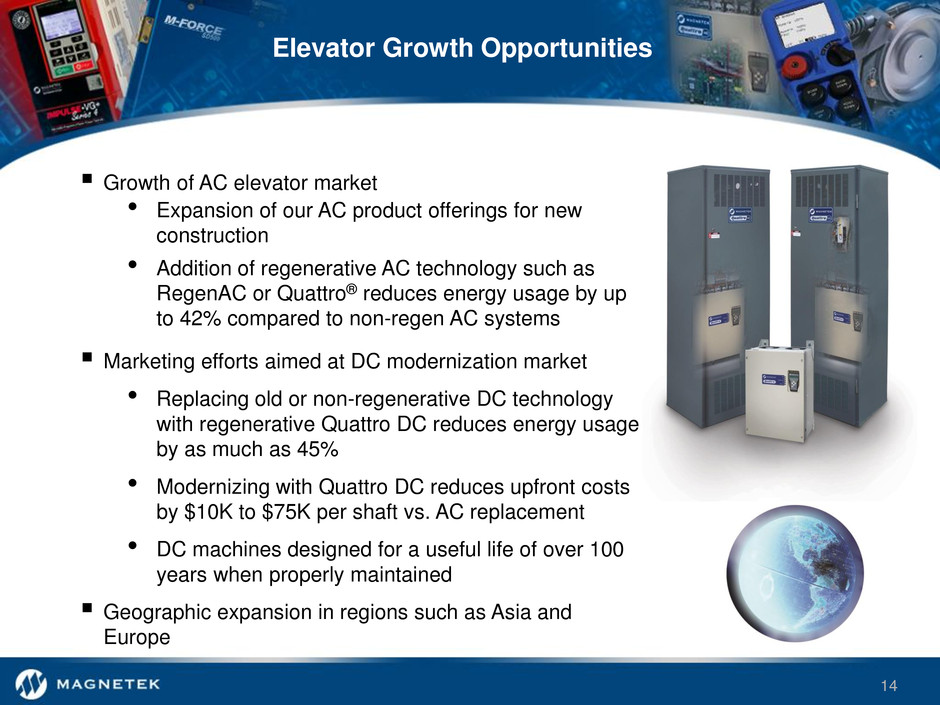
Elevator Growth Opportunities Growth of AC elevator market • Expansion of our AC product offerings for new construction • Addition of regenerative AC technology such as RegenAC or Quattro® reduces energy usage by up to 42% compared to non-regen AC systems Marketing efforts aimed at DC modernization market • Replacing old or non-regenerative DC technology with regenerative Quattro DC reduces energy usage by as much as 45% • Modernizing with Quattro DC reduces upfront costs by $10K to $75K per shaft vs. AC replacement • DC machines designed for a useful life of over 100 years when properly maintained Geographic expansion in regions such as Asia and Europe 14
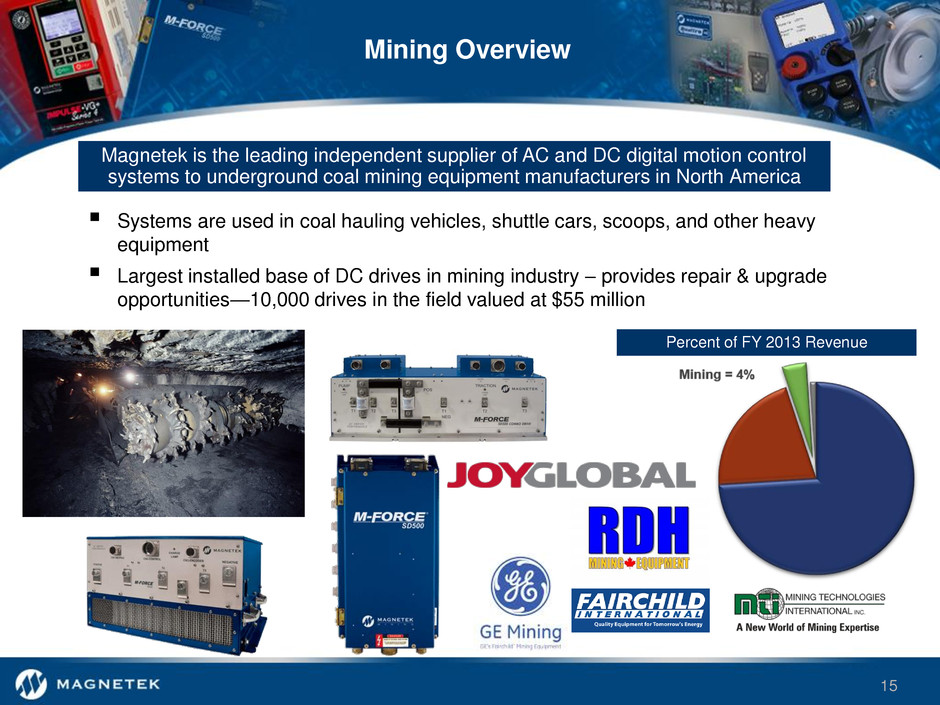
Mining Overview Systems are used in coal hauling vehicles, shuttle cars, scoops, and other heavy equipment Largest installed base of DC drives in mining industry – provides repair & upgrade opportunities—10,000 drives in the field valued at $55 million Percent of FY 2013 Revenue Magnetek is the leading independent supplier of AC and DC digital motion control systems to underground coal mining equipment manufacturers in North America 15
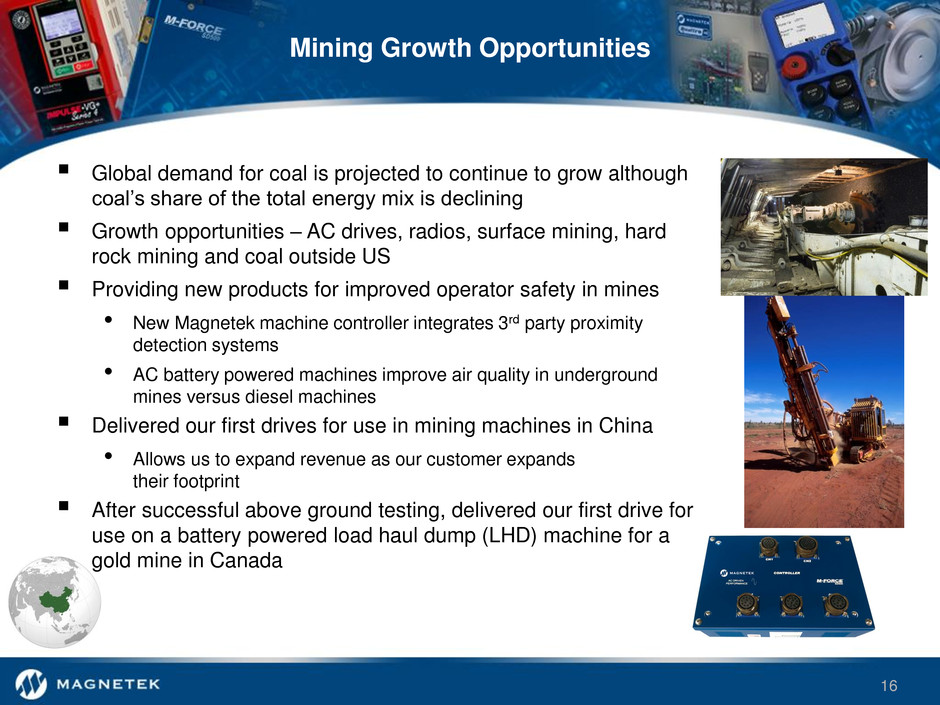
Global demand for coal is projected to continue to grow although coal’s share of the total energy mix is declining Growth opportunities – AC drives, radios, surface mining, hard rock mining and coal outside US Providing new products for improved operator safety in mines • New Magnetek machine controller integrates 3rd party proximity detection systems • AC battery powered machines improve air quality in underground mines versus diesel machines Delivered our first drives for use in mining machines in China • Allows us to expand revenue as our customer expands their footprint After successful above ground testing, delivered our first drive for use on a battery powered load haul dump (LHD) machine for a gold mine in Canada Mining Growth Opportunities 16
History of Magnetek Founding and acquisition period – rapid growth phase – 1984 to 1995 • Founded in 1984, Magnetek grew very quickly by acquisition through the mid-1990s • Focus on electro-mechanical technologies - ballasts, motors, generators – financed with debt • Grew to $1.5 billion in sales and nearly 15,000 employees in 1994 Divestiture period – downsizing phase with retention of certain liabilities – 1996 to 2001 • Acquisition period resulted in significant debt balances • Electro-mechanical businesses became increasingly “commoditized” (pricing & margin pressure) • Prior management executed a plan to divest electro-mechanical businesses to repay debt ‒ Retained power electronic solutions with competitive advantages and better growth prospects • Terms of these divestiture agreements resulted in retention of a number of liabilities from previously owned businesses ‒ Primarily pension obligations, and to a lesser extent, certain various environmental & other liabilities ‒ Pension was considered fully funded in 2001, but is now underfunded due mainly to interest rate reductions 17
Today’s Business Today’s business – built through acquisitions in the early 2000s timeframe • Relocated from CA to WI in 2007, cut costs, focused on power control systems solutions • We have no debt but a fairly large legacy pension issue – impacted by low interest rates ‒ The pension liability comprises $30MM of enterprise value today • Current management is committed to growing the business while resolving legacy issues • As legacy liabilities continue to decline, the equity value of the Company should continue to increase Our value proposition – continue to grow profitably while reducing our liabilities • We believe we can continue to grow our sales at better than GDP rates ‒ Our end markets have strong momentum; US manufacturing is accelerating; minimal exposure outside US ‒ FY 2014 sales growth should be in the 4-5% range – from $103MM in 2013 to $108MM range in 2014 • Current business has a history of consistently strong profitability and cash flow ‒ Accelerating earnings - gross margin, operating profit margin, and EPS are all up significantly over last year ‒ FY 2014 (current year) adjusted EBITDA should total nearly $15MM, or 14% of sales • Our pension situation has improved materially over the past 2 years ‒ Resulting in lower pension expense (P&L) as well as lower future pension funding (cash flow) • We believe we have a high probability of continued gains in equity value going forward ‒ Based on organic sales growth, tremendous operating leverage, EPS gains, and further pension reduction 18
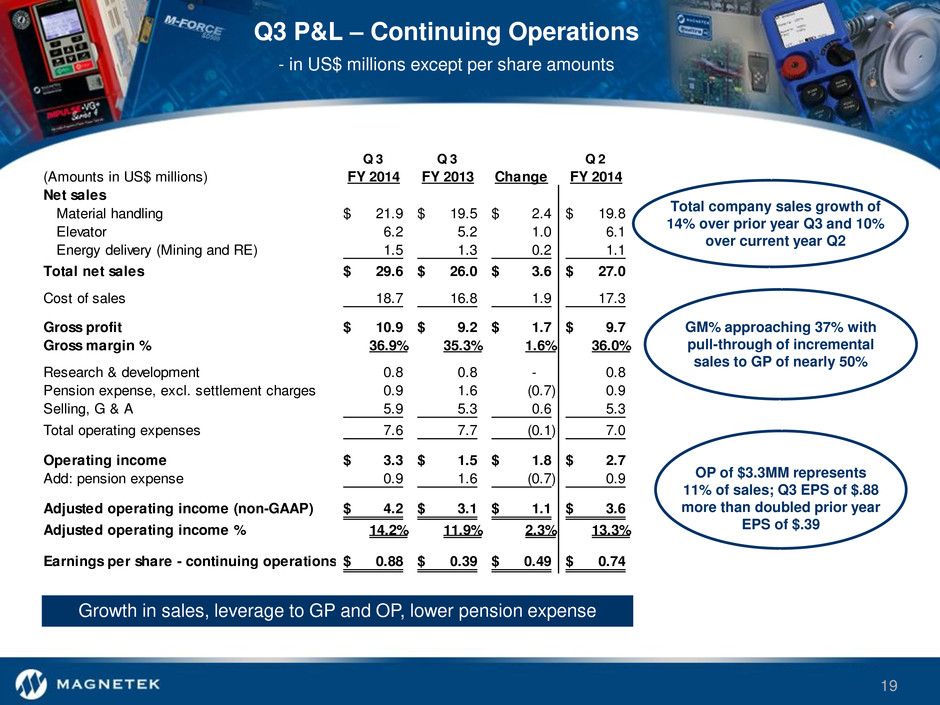
Q3 P&L – Continuing Operations - in US$ millions except per share amounts Q 3 Q 3 Q 2 (Amounts in US$ millions) FY 2014 FY 2013 Change FY 2014 Net sales Material handling 21.9$ 19.5$ 2.4$ 19.8$ Elevator 6.2 5.2 1.0 6.1 Energy delivery (Mining and RE) 1.5 1.3 0.2 1.1 Total net sales 29.6$ 26.0$ 3.6$ 27.0$ Cost of sales 18.7 16.8 1.9 17.3 Gross profit 10.9$ 9.2$ 1.7$ 9.7$ Gross margin % 36.9% 35.3% 1.6% 36.0% Research & development 0.8 0.8 - 0.8 Pension expense, excl. settlement charges 0.9 1.6 (0.7) 0.9 Selling, G & A 5.9 5.3 0.6 5.3 Total operating expenses 7.6 7.7 (0.1) 7.0 Operating inc me 3.3$ 1.5$ 1.8$ 2.7$ Add: pension expense 0.9 1.6 (0.7) 0.9 Adjusted operating income (non-GAAP) 4.2$ 3.1$ 1.1$ 3.6$ Adjusted operating income % 14.2% 11.9% 2.3% 13.3% Earnings per share - continuing operations 0.88$ 0.39$ 0.49$ 0.74$ Total company sales growth of 14% over prior year Q3 and 10% over current year Q2 GM% approaching 37% with pull-through of incremental sales to GP of nearly 50% OP of $3.3MM represents 11% of sales; Q3 EPS of $.88 more than doubled prior year EPS of $.39 Growth in sales, leverage to GP and OP, lower pension expense 19
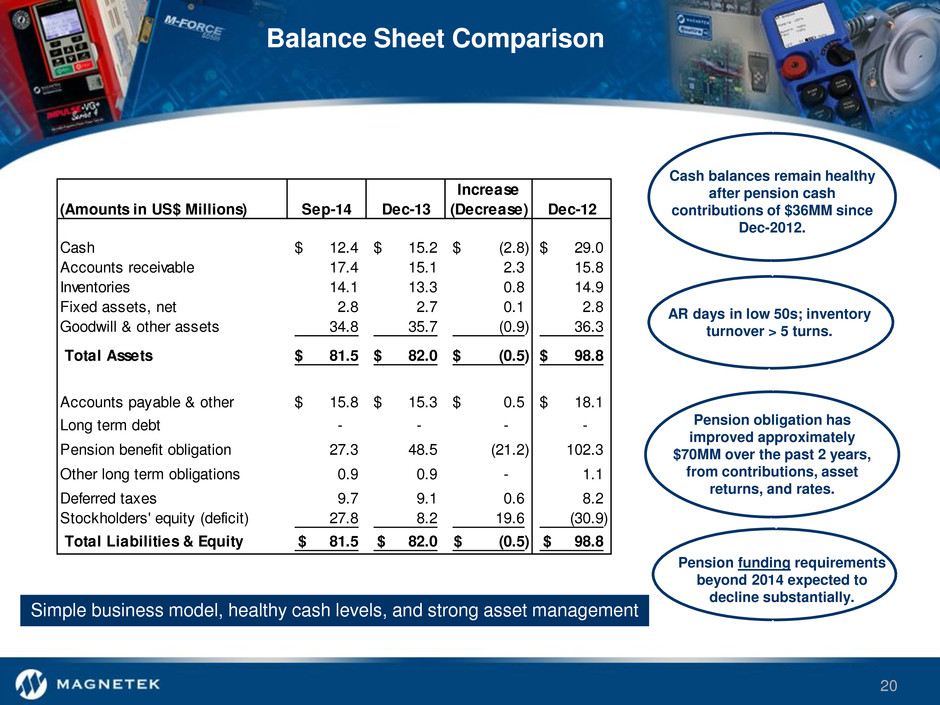
Balance Sheet Comparison Increase (Amounts in US$ Millions) Sep-14 Dec-13 (Decrease) Dec-12 Cash 12.4$ 15.2$ (2.8)$ 29.0$ Accounts receivable 17.4 15.1 2.3 15.8 Inventories 14.1 13.3 0.8 14.9 Fixed assets, net 2.8 2.7 0.1 2.8 Goodwill & other assets 34.8 35.7 (0.9) 36.3 Total Assets 81.5$ 82.0$ (0.5)$ 98.8$ Accounts payable & other 15.8$ 15.3$ 0.5$ 18.1$ Long term debt - - - - Pension benefit obligation 27.3 48.5 (21.2) 102.3 Other long term obligations 0.9 0.9 - 1.1 Deferred taxes 9.7 9.1 0.6 8.2 Stockholders' equity (deficit) 27.8 8.2 19.6 (30.9) Total Liabilities & Equity 81.5$ 82.0$ (0.5)$ 98.8$ Pension obligation has improved approximately $70MM over the past 2 years, from contributions, asset returns, and rates. Cash balances remain healthy after pension cash contributions of $36MM since Dec-2012. AR days in low 50s; inventory turnover > 5 turns. Pension funding requirements beyond 2014 expected to decline substantially. Simple business model, healthy cash levels, and strong asset management 20
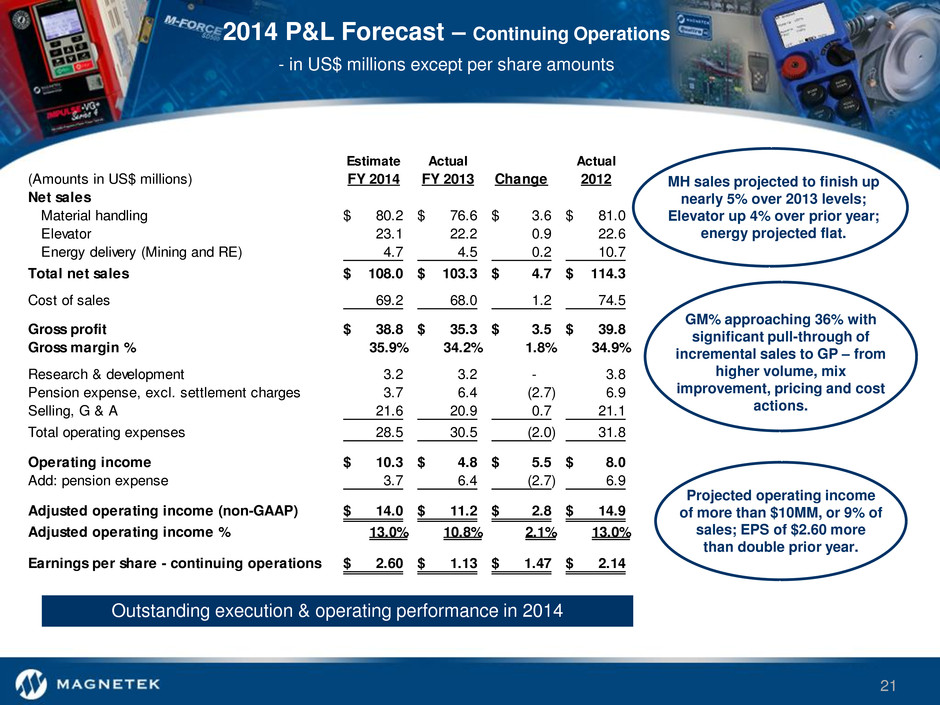
2014 P&L Forecast – Continuing Operations - in US$ millions except per share amounts Estimate Actual Actual (Amounts in US$ millions) FY 2014 FY 2013 Change 2012 Net sales Material handling 80.2$ 76.6$ 3.6$ 81.0$ Elevator 23.1 22.2 0.9 22.6 Energy delivery (Mining and RE) 4.7 4.5 0.2 10.7 Total net sales 108.0$ 103.3$ 4.7$ 114.3$ Cost of sales 69.2 68.0 1.2 74.5 Gross profit 38.8$ 35.3$ 3.5$ 39.8$ Gross margin % 35.9% 34.2% 1.8% 34.9% Research & development 3.2 3.2 - 3.8 Pension expense, excl. settlement charges 3.7 6.4 (2.7) 6.9 Selling, G & A 21.6 20.9 0.7 21.1 Total operating expenses 28.5 30.5 (2.0) 31.8 Operating i come 10.3$ 4.8$ 5.5$ 8.0$ Add: pension expense 3.7 6.4 (2.7) 6.9 Adjusted operating income (non-GAAP) 14.0$ 11.2$ 2.8$ 14.9$ Adjusted operating income % 13.0% 10.8% 2.1% 13.0% Earnings per share - continuing operations 2.60$ 1.13$ 1.47$ 2.14$ MH sales projected to finish up nearly 5% over 2013 levels; Elevator up 4% over prior year; energy projected flat. GM% approaching 36% with significant pull-through of incremental sales to GP – from higher volume, mix improvement, pricing and cost actions. Projected operating income of more than $10MM, or 9% of sales; EPS of $2.60 more than double prior year. Outstanding execution & operating performance in 2014 21
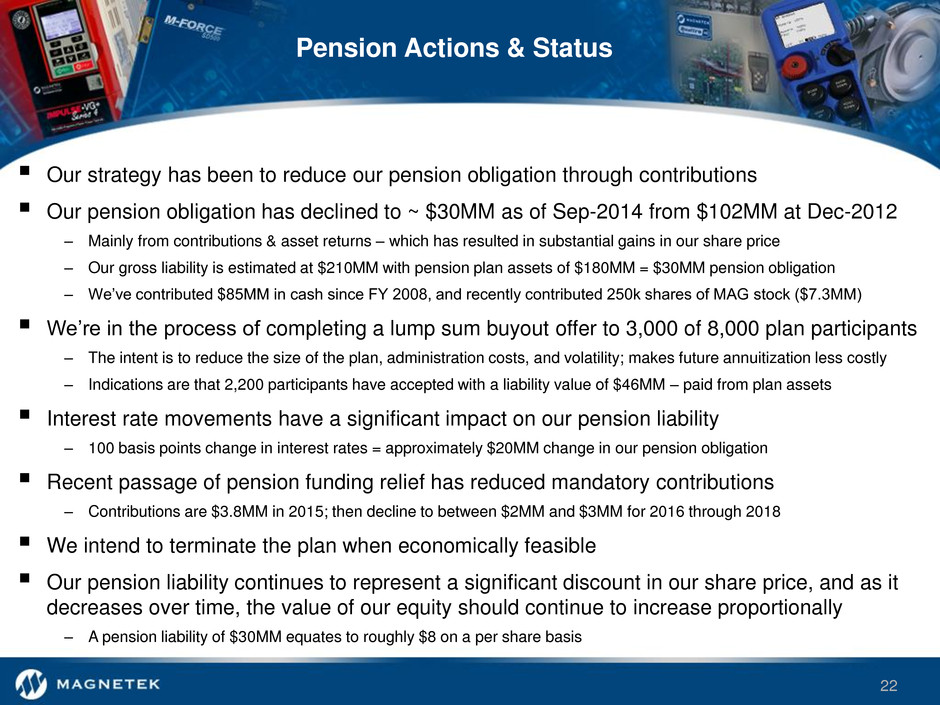
Pension Actions & Status Our strategy has been to reduce our pension obligation through contributions Our pension obligation has declined to ~ $30MM as of Sep-2014 from $102MM at Dec-2012 – Mainly from contributions & asset returns – which has resulted in substantial gains in our share price – Our gross liability is estimated at $210MM with pension plan assets of $180MM = $30MM pension obligation – We’ve contributed $85MM in cash since FY 2008, and recently contributed 250k shares of MAG stock ($7.3MM) We’re in the process of completing a lump sum buyout offer to 3,000 of 8,000 plan participants – The intent is to reduce the size of the plan, administration costs, and volatility; makes future annuitization less costly – Indications are that 2,200 participants have accepted with a liability value of $46MM – paid from plan assets Interest rate movements have a significant impact on our pension liability – 100 basis points change in interest rates = approximately $20MM change in our pension obligation Recent passage of pension funding relief has reduced mandatory contributions – Contributions are $3.8MM in 2015; then decline to between $2MM and $3MM for 2016 through 2018 We intend to terminate the plan when economically feasible Our pension liability continues to represent a significant discount in our share price, and as it decreases over time, the value of our equity should continue to increase proportionally – A pension liability of $30MM equates to roughly $8 on a per share basis 22
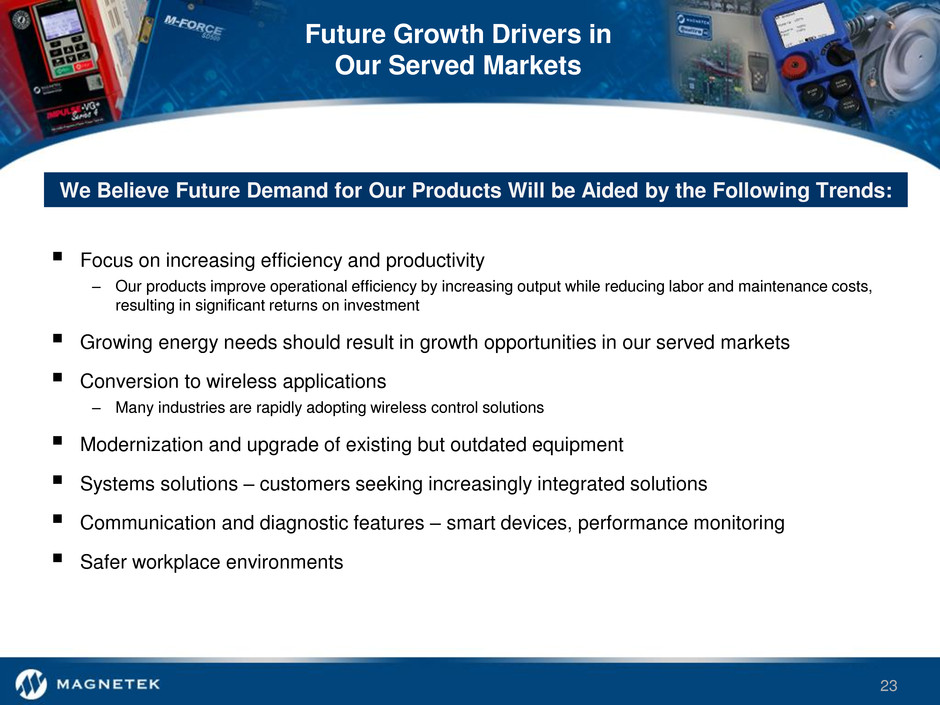
Future Growth Drivers in Our Served Markets Focus on increasing efficiency and productivity – Our products improve operational efficiency by increasing output while reducing labor and maintenance costs, resulting in significant returns on investment Growing energy needs should result in growth opportunities in our served markets Conversion to wireless applications – Many industries are rapidly adopting wireless control solutions Modernization and upgrade of existing but outdated equipment Systems solutions – customers seeking increasingly integrated solutions Communication and diagnostic features – smart devices, performance monitoring Safer workplace environments We Believe Future Demand for Our Products Will be Aided by the Following Trends: 23
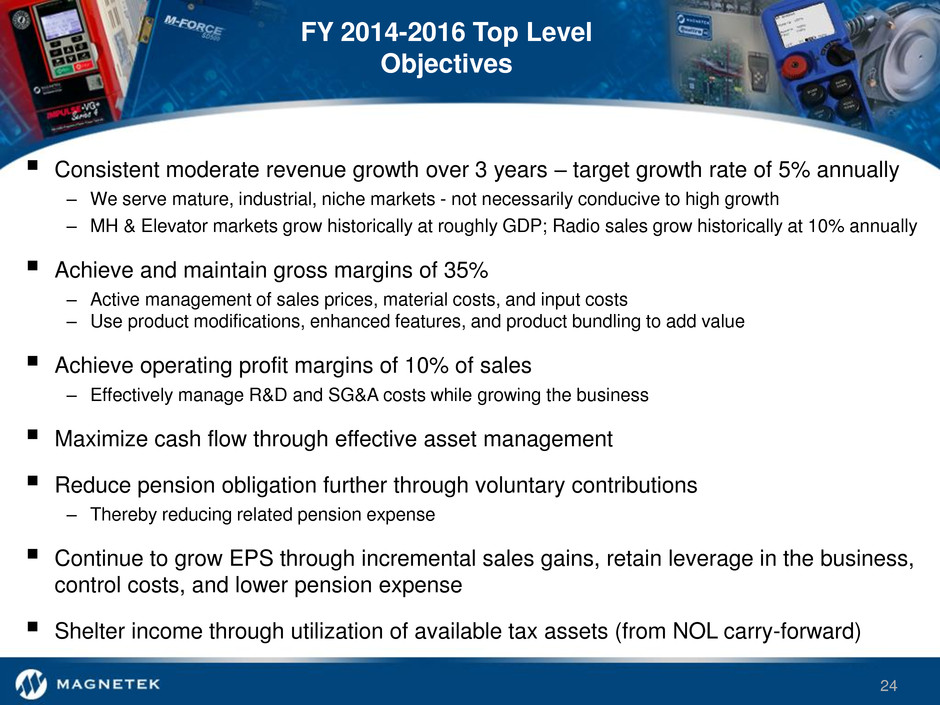
FY 2014-2016 Top Level Objectives Consistent moderate revenue growth over 3 years – target growth rate of 5% annually – We serve mature, industrial, niche markets - not necessarily conducive to high growth – MH & Elevator markets grow historically at roughly GDP; Radio sales grow historically at 10% annually Achieve and maintain gross margins of 35% – Active management of sales prices, material costs, and input costs – Use product modifications, enhanced features, and product bundling to add value Achieve operating profit margins of 10% of sales – Effectively manage R&D and SG&A costs while growing the business Maximize cash flow through effective asset management Reduce pension obligation further through voluntary contributions – Thereby reducing related pension expense Continue to grow EPS through incremental sales gains, retain leverage in the business, control costs, and lower pension expense Shelter income through utilization of available tax assets (from NOL carry-forward) 24
Why Invest in Magnetek? We are a thinly traded, micro-cap stock requiring a longer investment horizon Our legacy liabilities, mainly our pension, comprise a fair amount of enterprise value (EV) today Over the next several years, we should continue to see a reduction in liabilities, which could translate into further equity appreciation – By reducing our pension through contributions; we could also benefit substantially from future higher interest rates We have an established history of consistently strong profitability and cash generation Earnings growth is accelerating – YTD continuing operations EPS doubled over last year EPS in 2015 will be favorably impacted by a reduction in pension expense, as well as lower tax expense – cash flow will be favorably impacted by reduced pension funding, NOL tax assets – Both pension expense and funding requirements should be significantly lower beyond 2014 We further believe EV could increase, as we believe adjusted EBITDA could increase over time to $20MM - several years out if economic conditions remain stable and mining recovers We Believe There is Opportunity for Substantial Returns for Shareholders 25
Appendix
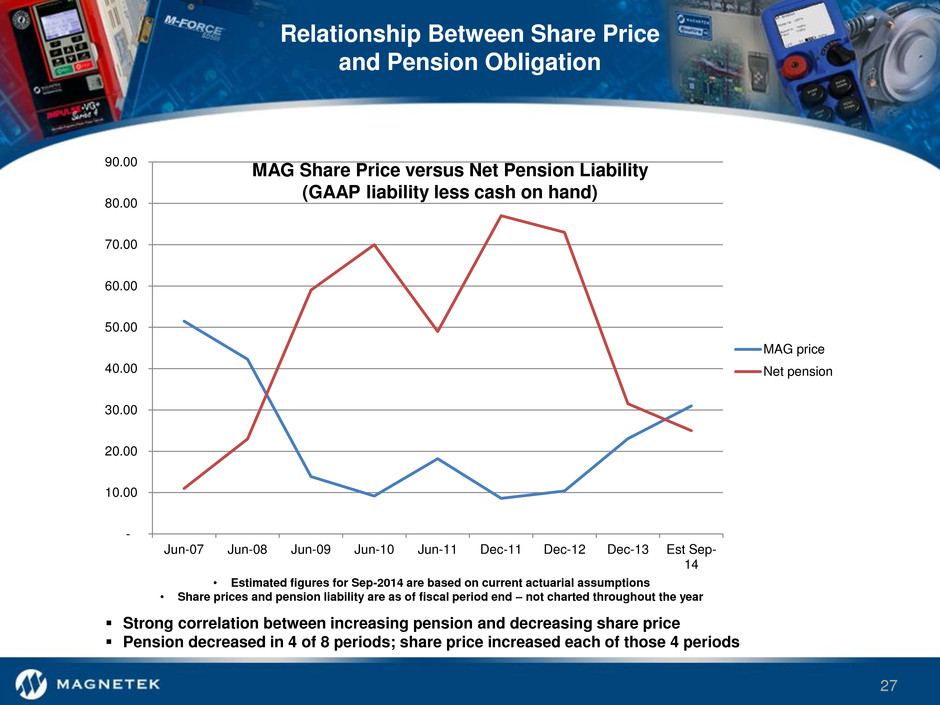
Relationship Between Share Price and Pension Obligation • Estimated figures for Sep-2014 are based on current actuarial assumptions • Share prices and pension liability are as of fiscal period end – not charted throughout the year Strong correlation between increasing pension and decreasing share price Pension decreased in 4 of 8 periods; share price increased each of those 4 periods - 10.00 20.00 30.00 40.00 50.00 60.00 70.00 80.00 90.00 Jun-07 Jun-08 Jun-09 Jun-10 Jun-11 Dec-11 Dec-12 Dec-13 Est Sep- 14 MAG price Net pension MAG Share Price versus Net Pension Liability (GAAP liability less cash on hand) 27
Primary IR Contact: Marty Schwenner Chief Financial Officer 262.703.4282


