UNITED STATES
SECURITIES AND EXCHANGE COMMISSION
Washington, D.C. 20549
FORM N-CSR
CERTIFIED SHAREHOLDER REPORT OF REGISTERED
MANAGEMENT INVESTMENT COMPANIES
Investment Company Act file number 811-4085
Fidelity Income Fund
(Exact name of registrant as specified in charter)
82 Devonshire St., Boston, Massachusetts 02109
(Address of principal executive offices) (Zip code)
Eric D. Roiter, Secretary
82 Devonshire St.
Boston, Massachusetts 02109
(Name and address of agent for service)
Registrant's telephone number, including area code: 617-563-7000
Date of fiscal year end: | July 31 |
| |
Date of reporting period: | July 31, 2005 |
Item 1. Reports to Stockholders
Fidelity® Ginnie Mae Fund
Fidelity Government
Income Fund
Fidelity Intermediate
Government Income Fund
Annual Report
July 31, 2005
(2_fidelity_logos) (Registered_Trademark)
Contents
To view a fund's proxy voting guidelines and proxy voting record for the 12-month period ended June 30, visit www.fidelity.com/proxyvotingresults or visit the Securities and Exchange Commission's (SEC) web site at www.sec.gov. You may also call 1-800-544-8544 to request a free copy of the proxy voting guidelines.
Standard & Poor's, S&P and S&P 500 are registered service marks of The McGraw-Hill Companies, Inc. and have been licensed for use by Fidelity Distributors Corporation.
Other third party marks appearing herein are the property of their respective owners.
All other marks appearing herein are registered or unregistered trademarks or service marks of FMR Corp. or an affiliated company.
Annual Report
This report and the financial statements contained herein are submitted for the general information of the shareholders of the funds. This report is not authorized for distribution to prospective investors in the funds unless preceded or accompanied by an effective prospectus.
A fund files its complete schedule of portfolio holdings with the SEC for the first and third quarters of each fiscal year on Form N-Q. Forms N-Q are available on the SEC's web site at http://www.sec.gov. A fund's Forms N-Q may be reviewed and copied at the SEC's Public Reference Room in Washington, DC. Information regarding the operation of the SEC's Public Reference Room may be obtained by calling 1-800-SEC-0330. For a complete list of a fund's portfolio holdings, view the most recent quarterly holdings report, semiannual report, or annual report on Fidelity's web site at http://www.fidelity.com/holdings.
NOT FDIC INSURED · MAY LOSE VALUE · NO BANK GUARANTEE
Neither the funds nor Fidelity Distributors Corporation is a bank.
Annual Report
Chairman's Message
(photo_of_Edward_C_Johnson_3d)
Dear Shareholder:
During the past year or so, much has been reported about the mutual fund industry, and much of it has been more critical than I believe is warranted. Allegations that some companies have been less than forthright with their shareholders have cast a shadow on the entire industry. I continue to find these reports disturbing, and assert that they do not create an accurate picture of the industry overall. Therefore, I would like to remind everyone where Fidelity stands on these issues. I will say two things specifically regarding allegations that some mutual fund companies were in violation of the Securities and Exchange Commission's forward pricing rules or were involved in so-called "market timing" activities.
First, Fidelity has no agreements that permit customers who buy fund shares after 4 p.m. to obtain the 4 p.m. price. This is not a new policy. This is not to say that someone could not deceive the company through fraudulent acts. However, we are extremely diligent in preventing fraud from occurring in this manner - and in every other. But I underscore again that Fidelity has no so-called "agreements" that sanction illegal practices.
Second, Fidelity continues to stand on record, as we have for years, in opposition to predatory short-term trading that adversely affects shareholders in a mutual fund. Back in the 1980s, we initiated a fee - which is returned to the fund and, therefore, to investors - to discourage this activity. Further, we took the lead several years ago in developing a Fair Value Pricing Policy to prevent market timing on foreign securities in our funds. I am confident we will find other ways to make it more difficult for predatory traders to operate. However, this will only be achieved through close cooperation among regulators, legislators and the industry.
Yes, there have been unfortunate instances of unethical and illegal activity within the mutual fund industry from time to time. That is true of any industry. When this occurs, confessed or convicted offenders should be dealt with appropriately. But we are still concerned about the risk of over-regulation and the quick application of simplistic solutions to intricate problems. Every system can be improved, and we support and applaud well thought out improvements by regulators, legislators and industry representatives that achieve the common goal of building and protecting the value of investors' holdings.
For nearly 60 years, Fidelity has worked very hard to improve its products and service to justify your trust. When our family founded this company in 1946, we had only a few hundred customers. Today, we serve more than 18 million customers including individual investors and participants in retirement plans across America.
Let me close by saying that we do not take your trust in us for granted, and we realize that we must always work to improve all aspects of our service to you. In turn, we urge you to continue your active participation with your financial matters, so that your interests can be well served.
Best regards,
/s/Edward C. Johnson 3d
Edward C. Johnson 3d
Annual Report
Shareholder Expense Example
As a shareholder of a Fund, you incur two types of costs: (1) transaction costs, and (2) ongoing costs, including management fees and other Fund expenses. This Example is intended to help you understand your ongoing costs (in dollars) of investing in the Funds and to compare these costs with the ongoing costs of investing in other mutual funds.
The Example is based on an investment of $1,000 invested at the beginning of the period and held for the entire period (February 1, 2005 to July 31, 2005).
Actual Expenses
The first line of the table below for each fund provides information about actual account values and actual expenses. You may use the information in this line, together with the amount you invested, to estimate the expenses that you paid over the period. Simply divide your account value by $1,000.00 (for example, an $8,600 account value divided by $1,000.00 = 8.6), then multiply the result by the number in the first line for a fund under the heading entitled "Expenses Paid During Period" to estimate the expenses you paid on your account during this period. A small balance maintenance fee of $12.00 that is charged once a year may apply for certain accounts with a value of less than $2,000. This fee is not included in the table below. If it was, the estimate of expenses you paid during the period would be higher, and your ending account value lower, by this amount.
Hypothetical Example for Comparison Purposes
The second line of the table below for each fund provides information about hypothetical account values and hypothetical expenses based on a fund's actual expense ratio and an assumed rate of return of 5% per year before expenses, which is not the Fund's actual return. The hypothetical account values and expenses may not be used to estimate the actual ending account balance or expenses you paid for the period. You may use this information to compare the ongoing costs of investing in the Fund and other funds. To do so, compare this 5% hypothetical example with the 5% hypothetical examples that appear in the shareholder reports of the other funds. A small balance maintenance fee of $12.00 that is charged once a year may apply for certain accounts with a value of less than $2,000. This fee is not included in the table below. If it was, the estimate of expenses you paid during the period would be higher, and your ending account value lower, by this amount.
Please note that the expenses shown in the table are meant to highlight your ongoing costs only and do not reflect any transaction costs. Therefore, the second line of the table is useful in comparing ongoing costs only, and will not help you determine the relative total costs of owning different funds.
| Beginning
Account Value
February 1, 2005 | Ending
Account Value
July 31, 2005 | Expenses Paid
During Period*
February 1, 2005
to July 31, 2005 |
Ginnie Mae Fund | | | |
Actual | $ 1,000.00 | $ 1,009.80 | $ 2.74** |
HypotheticalA | $ 1,000.00 | $ 1,022.07 | $ 2.76** |
Government Income Fund | | | |
Actual | $ 1,000.00 | $ 1,009.70 | $ 2.79** |
HypotheticalA | $ 1,000.00 | $ 1,022.02 | $ 2.81** |
| Beginning
Account Value
February 1, 2005 | Ending
Account Value
July 31, 2005 | Expenses Paid
During Period*
February 1, 2005
to July 31, 2005 |
Intermediate Government Income Fund | | | |
Actual | $ 1,000.00 | $ 1,004.90 | $ 2.73** |
HypotheticalA | $ 1,000.00 | $ 1,022.07 | $ 2.76** |
A 5% return per year before expenses
* Expenses are equal to each Fund's annualized expense ratio (shown in the table below); multiplied by the average account value over the period, multiplied by 181/365 (to reflect the one-half year period).
| Annualized
Expense Ratio |
Ginnie Mae Fund | .55%** |
Government Income Fund | .56%** |
Intermediate Government Income Fund | .55%** |
** If contractual expense reductions effective June 1, 2005 had been in effect during the entire period, the annualized expense ratios and the expenses paid in the actual and hypothetical examples above would have been as follows:
| Annualized
Expense Ratio | Expenses Paid |
Ginnie Mae Fund | .45% | |
Actual | | $ 2.24 |
HypotheticalA | | $ 2.26 |
Government Income Fund | .45% | |
Actual | | $ 2.24 |
HypotheticalA | | $ 2.26 |
Intermediate Government Income Fund | .45% | |
Actual | | $ 2.24 |
HypotheticalA | | $ 2.26 |
A 5% return per year before expenses
Annual Report
Fidelity Ginnie Mae Fund
Performance: The Bottom Line
Average annual total return reflects the change in the value of an investment, assuming reinvestment of the fund's dividend income and capital gains (the profits earned upon the sale of securities that have grown in value) and assuming a constant rate of performance each year. The $10,000 table and the fund's returns do not reflect the deduction of taxes that a shareholder would pay on fund distributions or the redemption of fund shares. During periods of reimbursement by Fidelity, a fund's total return will be greater than it would be had the reimbursement not occurred. How a fund did yesterday is no guarantee of how it will do tomorrow.
Average Annual Total Returns
Periods ended July 31, 2005 | Past 1
year | Past 5
years | Past 10
years |
Fidelity® Ginnie Mae Fund | 4.11% | 5.97% | 6.06% |
$10,000 Over 10 Years
Let's say hypothetically that $10,000 was invested in Fidelity® Ginnie Mae Fund on July 31, 1995. The chart shows how the value of your investment would have changed, and also shows how the Lehman Brothers® GNMA Index performed over the same period.
Annual Report
Fidelity Ginnie Mae Fund
Management's Discussion of Fund Performance
Comments from William Irving, Portfolio Manager of Fidelity® Ginnie Mae Fund
Not unlike the domestic equity markets, taxable bonds swung up and down during the 12 months ending July 31, 2005, rallying early in the period, then selling off in late winter, only to advance again in the spring. During the one-year period, the Lehman Brothers® Aggregate Bond Index - a measure of the overall investment-grade bond universe - rose 4.79%. Much of this gain came on the strength of returns from higher-yielding spread sectors, such as investment-grade corporates, reflected in the 5.76% return of the Lehman Brothers Credit Bond Index over the 12-month period. Mortgage-backed securities were spurred on by the relative stability of long-term interest rates, and the Lehman Brothers Mortgage-Backed Securities gained 4.67%. Treasuries also bolstered the overall market, as illustrated by the 4.62% return of the Lehman Brothers U.S. Treasury Index, which moved ahead on a flight to quality as investors continued to ponder the future direction of the U.S. economy. The Lehman Brothers U.S. Agency Index returned a more modest 3.88%.
For the 12 months ending July 31, 2005, the fund returned 4.11%, while the LipperSM GNMA Funds Average gained 3.40% and the Lehman Brothers GNMA Index returned 4.60%. Likely aiding the fund's outperformance of its Lipper peer group average was good sector selection. In particular, the fund's returns were helped by its stake in Fannie Mae and Freddie Mac securities, which tended to prepay less quickly than Ginnie Mae loans. Ginnie Mae securities experienced higher-than-expected prepayments as borrowers migrated to Ginnie Mae adjustable-rate loans and other lenders' more-competitively priced mortgage products. Security selection among 30-year mortgage pass-through securities generally was helpful as well, with my emphasis on lower-coupon, discount securities working out favorably, as they experienced comparatively less prepayment activity than higher-coupon, premium issues. On the flip side, my decision to maintain a very small exposure to "interest-only" securities - in which investors receive only the interest payments generated by the underlying loans - performed poorly due to higher-than-expected rates of prepayment.
The views expressed in this statement reflect those of the portfolio manager only through the end of the period of the report as stated on the cover and do not necessarily represent the views of Fidelity or any other person in the Fidelity organization. Any such views are subject to change at any time based upon market or other conditions and Fidelity disclaims any responsibility to update such views. These views may not be relied on as investment advice and, because investment decisions for a Fidelity fund are based on numerous factors, may not be relied on as an indication of trading intent on behalf of any Fidelity fund.
Annual Report
Fidelity Ginnie Mae Fund
Investment Changes
Coupon Distribution as of July 31, 2005 |
| % of fund's
investments | % of fund's investments
6 months ago |
Less than 4% | 3.2 | 2.1 |
4 - 4.99% | 5.7 | 7.4 |
5 - 5.99% | 43.5 | 38.7 |
6 - 6.99% | 26.8 | 30.3 |
7 - 7.99% | 5.2 | 6.8 |
8% and over | 1.0 | 1.3 |
Coupon distribution shows the range of stated interest rates on the fund's investments, excluding short-term investments. |
Average Years to Maturity as of July 31, 2005 |
| | 6 months ago |
Years | 4.9 | 4.2 |
Average years to maturity is based on the average time remaining until principal payments are expected from each of the fund's bonds, weighted by dollar amount. |
Duration as of July 31, 2005 |
| | 6 months ago |
Years | 2.7 | 2.5 |
Duration shows how much a bond fund's price fluctuates with changes in comparable interest rates. If rates rise 1%, for example, a fund with a five-year duration is likely to lose about 5% of its value. Other factors also can influence a bond fund's performance and share price. Accordingly, a bond fund's actual performance may differ from this example. |
Asset Allocation (% of fund's net assets) |
As of July 31, 2005 | As of January 31, 2005 |
 | Mortgage
Securities* 79.2% | | | Mortgage
Securities** 84.2% | |
 | CMOs and Other Mortgage Related Securities 19.2% | | | CMOs and Other Mortgage Related Securities 12.2% | |
 | Short-Term
Investments and
Net Other Assets 1.6% | | | Short-Term
Investments and
Net Other Assets 3.6% | |
* GNMA Securities | 86.8% | | ** GNMA Securities | 87.7% | |

Annual Report
Fidelity Ginnie Mae Fund
Investments July 31, 2005
Showing Percentage of Net Assets
U.S. Government Agency - Mortgage Securities - 79.2% |
| Principal
Amount (000s) | | Value (Note 1)
(000s) |
Fannie Mae - 8.4% |
3.753% 10/1/33 (c) | | $ 652 | | $ 642 |
4.372% 4/1/35 (c) | | 449 | | 448 |
4.409% 5/1/35 (c) | | 1,988 | | 1,989 |
4.554% 7/1/35 (c) | | 2,425 | | 2,426 |
4.823% 12/1/34 (c) | | 1,917 | | 1,924 |
4.847% 12/1/34 (c) | | 769 | | 771 |
5% 10/1/17 to 9/1/18 | | 80,501 | | 80,758 |
5.204% 6/1/35 (c) | | 3,393 | | 3,438 |
5.5% 11/1/13 to 3/1/25 (a) | | 37,745 | | 38,489 |
5.817% 5/1/35 (c) | | 4,696 | | 4,746 |
6% 8/1/35 (a) | | 60,000 | | 61,350 |
6.5% 10/1/17 to 3/1/34 | | 47,383 | | 49,064 |
6.5% 8/1/35 (a) | | 80,000 | | 82,825 |
7% 11/1/16 to 3/1/17 | | 2,492 | | 2,608 |
7.5% 1/1/07 to 4/1/17 | | 5,816 | | 6,105 |
8.5% 12/1/27 | | 560 | | 609 |
9.5% 9/1/30 | | 559 | | 616 |
10.25% 10/1/18 | | 17 | | 18 |
11.5% 5/1/14 to 9/1/15 | | 45 | | 49 |
12.5% 11/1/13 to 7/1/16 | | 108 | | 120 |
13.25% 9/1/11 | | 77 | | 87 |
| | 339,082 |
Freddie Mac - 1.0% |
4.498% 3/1/35 (c) | | 6,585 | | 6,542 |
5.5% 11/1/17 to 3/1/25 | | 30,042 | | 30,459 |
8.5% 6/1/08 to 6/1/25 | | 97 | | 103 |
9% 7/1/08 to 7/1/21 | | 384 | | 404 |
9.5% 7/1/30 to 8/1/30 | | 187 | | 206 |
9.75% 12/1/08 to 4/1/13 | | 36 | | 38 |
10% 1/1/09 to 11/1/20 | | 825 | | 905 |
10.25% 2/1/09 to 11/1/16 | | 352 | | 380 |
10.5% 5/1/10 | | 7 | | 8 |
11.25% 2/1/10 | | 23 | | 25 |
11.75% 11/1/11 | | 13 | | 14 |
12% 5/1/10 to 2/1/17 | | 118 | | 130 |
12.5% 11/1/12 to 5/1/15 | | 151 | | 168 |
13% 5/1/14 to 11/1/14 | | 17 | | 19 |
13.5% 1/1/13 to 12/1/14 | | 8 | | 9 |
| | 39,410 |
Government National Mortgage Association - 69.8% |
3% 4/20/35 (c) | | 4,534 | | 4,454 |
U.S. Government Agency - Mortgage Securities - continued |
| Principal
Amount (000s) | | Value (Note 1)
(000s) |
Government National Mortgage Association - continued |
3.5% 3/20/34 | | $ 1,293 | | $ 1,139 |
3.5% 5/20/34 (c) | | 2,175 | | 2,139 |
3.5% 5/20/35 (c) | | 2,272 | | 2,211 |
3.5% 6/20/35 (c) | | 2,426 | | 2,363 |
3.5% 6/20/35 (c) | | 7,903 | | 7,847 |
3.75% 1/20/34 (c) | | 25,154 | | 24,742 |
3.75% 5/20/35 (c) | | 10,867 | | 10,632 |
3.75% 6/20/35 | | 5,769 | | 5,621 |
4% 11/20/33 | | 1,882 | | 1,748 |
4.5% 12/20/32 to 4/20/34 | | 219,570 | | 212,254 |
4.5% 9/20/34 (c) | | 8,955 | | 8,926 |
4.5% 3/20/35 (c) | | 1,373 | | 1,368 |
5% 4/15/24 to 9/20/34 | | 619,795 | | 615,274 |
5% 2/20/35 (c) | | 503 | | 506 |
5% 6/20/35 (c) | | 7,309 | | 7,256 |
5% 8/1/35 (a) | | 7,054 | | 7,008 |
5% 8/1/35 (a) | | 204,786 | | 202,802 |
5% 8/1/35 (a) | | 45,057 | | 44,620 |
5.5% 12/20/18 to 3/20/34 | | 308,303 | | 311,929 |
5.5% 8/1/35 (a) | | 178,588 | | 180,876 |
6% 10/15/23 to 9/20/34 | | 565,830 | | 581,302 |
6% 7/1/35 (a)(b) | | 11,000 | | 11,320 |
6.5% 4/15/23 to 11/20/34 | | 308,089 | | 321,424 |
7% 3/15/22 to 9/20/34 | | 148,982 | | 157,374 |
7.25% 9/15/27 to 12/15/30 | | 610 | | 649 |
7.5% 4/15/06 to 9/20/32 | | 49,561 | | 53,093 |
8% 4/15/06 to 7/15/32 | | 19,546 | | 21,034 |
8.5% 12/15/05 to 2/15/31 | | 6,959 | | 7,573 |
9% 5/15/08 to 6/15/30 | | 3,059 | | 3,356 |
9.5% 12/20/15 to 4/20/17 | | 989 | | 1,081 |
10.5% 1/15/14 to 9/15/19 | | 916 | | 1,026 |
13% 2/15/11 to 1/15/15 | | 224 | | 251 |
13.5% 7/15/10 to 1/15/15 | | 43 | | 48 |
| | 2,815,246 |
TOTAL U.S. GOVERNMENT AGENCY - MORTGAGE SECURITIES (Cost $3,183,498) | 3,193,738 |
Collateralized Mortgage Obligations - 16.8% |
| Principal
Amount (000s) | | Value (Note 1)
(000s) |
U.S. Government Agency - 16.8% |
Fannie Mae: | | | | |
Series 2003-39 Class IA, 5.5% 10/25/22 (c)(d) | | $ 6,596 | | $ 1,152 |
target amortization class Series G94-2 Class D, 6.45% 1/25/24 | | 6,415 | | 6,572 |
Fannie Mae guaranteed REMIC pass thru certificates: | | | | |
planned amortization class Series 2003-8 Class QC, 5% 8/25/14 | | 5,000 | | 5,031 |
sequential pay: | | | | |
Series 2002-63 Class LA, 5.5% 10/25/16 | | 3,526 | | 3,565 |
Series 2003-1 Class HB, 5% 9/25/16 | | 14,227 | | 14,304 |
Fannie Mae STRIP Series 353 Class 1, 7/1/34 (e) | | 2,853 | | 2,162 |
Freddie Mac Multi-class participation certificates guaranteed: | | | | |
planned amortization class: | | | | |
Series 2220 Class PD, 8% 3/15/30 | | 7,100 | | 7,588 |
Series 2535 Class IP, 6% 6/15/29 (d) | | 5,619 | | 162 |
Series 40 Class K, 6.5% 8/17/24 | | 2,300 | | 2,407 |
sequential pay: | | | | |
Series 2601 Class TI, 5.5% 10/15/22 (d) | | 26,863 | | 4,567 |
Series 2750 Class ZT, 5% 2/15/34 | | 5,495 | | 5,048 |
Series 2866 Class CY, 4.5% 10/15/19 | | 4,491 | | 4,331 |
Series 2406: | | | | |
Class FP, 4.3681% 1/15/32 (c) | | 6,320 | | 6,463 |
Class PF, 4.3681% 12/15/31 (c) | | 5,002 | | 5,133 |
Series 2410 Class PF, 4.3681% 2/15/32 (c) | | 11,475 | | 11,737 |
Ginnie Mae guaranteed Multi-family pass thru securities sequential pay Series 2002-71 Class Z, 5.5% 10/20/32 | | 40,893 | | 40,797 |
Ginnie Mae guaranteed REMIC pass thru securities: | | | | |
planned amortization class: | | | | |
Series 1994-4 Class KQ, 7.9875% 7/16/24 | | 1,892 | | 2,000 |
Series 2000-26 Class PK, 7.5% 9/20/30 | | 6,138 | | 6,318 |
Series 2001-13 Class PC, 6.5% 12/20/28 | | 2,642 | | 2,650 |
Series 2001-45 Class GC, 6.5% 10/20/30 | | 1,040 | | 1,042 |
Series 2001-53: | | | | |
Class PB, 6.5% 11/20/31 | | 10,000 | | 10,544 |
Class TA, 6% 12/20/30 | | 837 | | 837 |
Series 2001-60 Class PD, 6% 10/20/30 | | 9,541 | | 9,668 |
Series 2001-65 Class PH, 6% 11/20/28 | | 6,323 | | 6,513 |
Series 2002-4 Class TB, 6.5% 3/20/31 | | 33 | | 33 |
Series 2003-12 Class IO, 5.5% 11/16/25 (d) | | 14,034 | | 456 |
Collateralized Mortgage Obligations - continued |
| Principal
Amount (000s) | | Value (Note 1)
(000s) |
U.S. Government Agency - continued |
Ginnie Mae guaranteed REMIC pass thru securities: - continued | | | | |
planned amortization class: | | | | |
Series 2003-19: | | | | |
Class IG, 5.5% 1/16/24 (d) | | $ 158 | | $ 0 |
Class IL, 5.5% 12/16/25 (d) | | 3,318 | | 65 |
Series 2003-20 Class BI, 5.5% 5/16/27 (d) | | 16,496 | | 709 |
Series 2003-29: | | | | |
Class IB, 5.5% 11/16/24 (d) | | 8,707 | | 129 |
Class IG, 5.5% 11/16/24 (d) | | 1,685 | | 25 |
Series 2003-31 Class PI, 5.5% 4/16/30 (d) | | 33,408 | | 2,165 |
Series 2003-33 Class NI, 5.5% 2/16/26 (d) | | 19,276 | | 578 |
Series 2003-34 Class IO, 5.5% 4/16/28 (d) | | 32,872 | | 2,242 |
Series 2003-4 Class LI, 5.5% 7/16/27 (d) | | 13,760 | | 734 |
Series 2003-7: | | | | |
Class IN, 5.5% 1/16/28 (d) | | 27,405 | | 1,960 |
Class IP, 5.5% 10/16/25 (d) | | 3,213 | | 108 |
Series 2003-70 CLass LE, 5% 7/20/32 | | 44,000 | | 43,524 |
Series 2003-79 Class PV, 5.5% 10/20/23 | | 27,869 | | 28,107 |
Series 2003-8 Class QI, 5.5% 1/16/27 (d) | | 2,449 | | 99 |
Series 2004-19 Class DP, 5.5% 3/20/34 | | 3,895 | | 4,024 |
Series 2004-30 Class PC, 5% 11/20/30 | | 19,736 | | 19,674 |
Series 2004-41 Class PC, 5.5% 10/20/33 | | 27,523 | | 27,618 |
Series 2004-54 Class LE, 5.5% 8/20/33 | | 45,183 | | 45,437 |
Series 2004-64 Class KE, 5.5% 12/20/33 | | 22,978 | | 22,977 |
Series 2004-98 Class IG, 5.5% 2/20/30 (d) | | 2,581 | | 458 |
Series 2005-17 Class IA, 5.5% 8/20/33 (d) | | 12,255 | | 1,848 |
Series 2005-24 Class TC, 5.5% 3/20/35 | | 5,403 | | 5,438 |
Series 2008-28 Class PC, 5.5% 4/20/34 | | 18,652 | | 18,975 |
sequential pay: | | | | |
Series 1995-4 Class CQ, 8% 6/20/25 | | 1,498 | | 1,547 |
Series 1998-23 Class ZB, 6.5% 6/20/28 | | 38,098 | | 39,505 |
Series 2001-15 Class VB, 6.5% 4/20/19 | | 9,377 | | 9,459 |
Series 2002-29 Class SK, 8.25% 5/20/32 (c) | | 787 | | 809 |
Series 2002-41 Class VD, 6% 4/16/13 | | 7,878 | | 8,016 |
Series 2002-49 Class ZH, 6.5% 2/20/31 | | 15,827 | | 15,895 |
Series 2002-54 Class GA, 6.5% 7/20/31 | | 4,082 | | 4,103 |
Series 2002-88 Class GZ, 5.5% 12/20/32 | | 23,046 | | 22,699 |
Series 2003-7 Class VP, 6% 11/20/13 | | 6,231 | | 6,471 |
Series 2004-105 Class VD, 5.5% 6/17/16 | | 12,644 | | 12,882 |
Series 2004-86 Class G, 6% 10/20/34 | | 6,273 | | 6,720 |
Collateralized Mortgage Obligations - continued |
| Principal
Amount (000s) | | Value (Note 1)
(000s) |
U.S. Government Agency - continued |
Ginnie Mae guaranteed REMIC pass thru securities: - continued | | | | |
sequential pay: | | | | |
Series 2005-28: | | | | |
Class AJ, 5.5% 4/20/35 | | $ 98,826 | | $ 100,335 |
Class AK, 5.5% 4/20/35 | | 50,808 | | 51,578 |
Series 2005-6 Class EX, 5.5% 11/20/34 | | 1,001 | | 965 |
Series 1995-6 Class Z, 7% 9/20/25 | | 4,332 | | 4,508 |
Series 2005-47 Class ZY, 6% 6/20/35 | | 4,020 | | 4,131 |
Series 2005-6 Class EY, 5.5% 11/20/33 | | 1,016 | | 1,010 |
TOTAL COLLATERALIZED MORTGAGE OBLIGATIONS (Cost $689,820) | 678,607 |
Commercial Mortgage Securities - 2.4% |
|
Fannie Mae: | | | | |
sequential pay Series 2000-7 Class MB, 7.5259% 2/17/24 (c) | | 7,642 | | 8,012 |
Series 1997-M1 Class N, 0.445% 10/17/36 (c)(d) | | 63,429 | | 793 |
Fannie Mae guaranteed REMIC pass thru certificates: | | | | |
Series 1998-M3 Class IB, 0.9353% 1/17/38 (c)(d) | | 48,327 | | 1,674 |
Series 1998-M4 Class N, 1.3208% 2/25/35 (c)(d) | | 28,804 | | 1,141 |
Ginnie Mae guaranteed Multi-family pass thru securities: | | | | |
sequential pay Series 2001-58 Class X, 1.4331% 9/16/41 (c)(d) | | 202,928 | | 10,598 |
Series 2001-12 Class X, 1.1882% 7/16/40 (c)(d) | | 92,556 | | 4,433 |
Ginnie Mae guaranteed REMIC pass thru securities: | | | | |
sequential pay Series 2002-81 Class IO, 2.0054% 9/16/42 (c)(d) | | 124,610 | | 10,280 |
Series 2002-62 Class IO, 1.8809% 8/16/42 (c)(d) | | 111,080 | | 8,471 |
Series 2002-85 Class X, 2.278% 3/16/42 (c)(d) | | 103,425 | | 11,183 |
Series 2003-22 Class XA, 0.3923% 2/16/43 (c)(d) | | 280,866 | | 18,926 |
Series 2003-36 Class XA, 0.2815% 3/16/43 (d) | | 306,419 | | 20,109 |
Series 2003-47 Class XA, 0.1927% 6/16/43 (c)(d) | | 38,859 | | 1,829 |
TOTAL COMMERCIAL MORTGAGE SECURITIES (Cost $118,028) | 97,449 |
Cash Equivalents - 16.7% |
| | Maturity
Amount (000s) | | Value (Note 1)
(000s) |
Investments in repurchase agreements (Collateralized by U.S. Government Obligations, in a joint trading account at 3.32%, dated 7/29/05 due 8/1/05) (f)
(Cost $671,374) | | $ 671,559 | | $ 671,374 |
TOTAL INVESTMENT PORTFOLIO - 115.1% (Cost $4,662,720) | | | 4,641,168 |
NET OTHER ASSETS - (15.1)% | | | (607,691) |
NET ASSETS - 100% | | $ 4,033,477 |
Legend |
(a) Security or a portion of the security purchased on a delayed delivery or when-issued basis. |
(b) Security or a portion of the security is subject to a forward commitment sell. |
(c) The coupon rate shown on floating or adjustable rate securities represents the rate at period end. |
(d) Security represents right to receive monthly interest payments on an underlying pool of mortgages. Principal shown is the par amount of the mortgage pool. |
(e) Principal Only Strips represent the right to receive the monthly principal payments on an underlying pool of mortgage loans. |
(f) Additional information on each counterparty to the repurchase agreement is as follows: |
Repurchase Agreement/
Counterparty | Value
(000s) |
$671,374,000 due 8/1/05 at 3.32% | |
Banc of America Securities LLC | $ 134,493 |
Bank of America, National Association | 69,866 |
Barclays Capital Inc. | 279,465 |
Countrywide Securities Corporation | 69,866 |
Morgan Stanley & Co. Incorporated. | 100,217 |
UBS Securities LLC | 17,467 |
| $ 671,374 |
See accompanying notes which are an integral part of the financial statements.
Annual Report
Fidelity Ginnie Mae Fund
Financial Statements
Statement of Assets and Liabilities
Amounts in thousands (except per-share amount) | July 31, 2005 |
| | |
Assets | | |
Investment in securities, at value (including repurchase agreements of $671,374) (cost $4,662,720) - See accompanying schedule | | $ 4,641,168 |
Commitment to sell securities on a delayed delivery basis | $ (11,320) | |
Receivable for securities sold on a delayed delivery basis | 11,344 | 24 |
Cash | | 867 |
Receivable for investments sold
Regular delivery | | 10,579 |
Delayed delivery | | 3,267 |
Receivable for fund shares sold | | 2,402 |
Interest receivable | | 18,123 |
Other affiliated receivables | | 9 |
Total assets | | 4,676,439 |
| | |
Liabilities | | |
Payable for investments purchased
Regular delivery | $ 33,029 | |
Delayed delivery | 602,392 | |
Payable for fund shares redeemed | 4,091 | |
Distributions payable | 1,541 | |
Accrued management fee | 1,091 | |
Other affiliated payables | 480 | |
Other payables and accrued expenses | 338 | |
Total liabilities | | 642,962 |
| | |
Net Assets | | $ 4,033,477 |
Net Assets consist of: | | |
Paid in capital | | $ 4,041,273 |
Undistributed net investment income | | 7,375 |
Accumulated undistributed net realized gain (loss) on investments | | 6,357 |
Net unrealized appreciation (depreciation) on investments | | (21,528) |
Net Assets, for 366,741 shares outstanding | | $ 4,033,477 |
Net Asset Value, offering price and redemption price per share ($4,033,477 ÷ 366,741 shares) | | $ 11.00 |
See accompanying notes which are an integral part of the financial statements.
Annual Report
Statement of Operations
Amounts in thousands | Year ended July 31, 2005 |
| | |
Investment Income | | |
Interest | | $ 184,601 |
| | |
Expenses | | |
Management fee | $ 16,491 | |
Transfer agent fees | 4,846 | |
Accounting fees and expenses | 946 | |
Fund wide operations fee | 176 | |
Independent trustees' compensation | 21 | |
Appreciation in deferred trustee compensation account | 2 | |
Custodian fees and expenses | 325 | |
Registration fees | 72 | |
Audit | 97 | |
Legal | 9 | |
Miscellaneous | 10 | |
Total expenses before reductions | 22,995 | |
Expense reductions | (23) | 22,972 |
Net investment income | | 161,629 |
Realized and Unrealized Gain (Loss) Net realized gain (loss) on investment securities | | 25,145 |
Change in net unrealized appreciation (depreciation) on: Investment securities | (26,113) | |
Delayed delivery commitments | 639 | |
Total change in net unrealized appreciation (depreciation) | | (25,474) |
Net gain (loss) | | (329) |
Net increase (decrease) in net assets resulting from operations | | $ 161,300 |
See accompanying notes which are an integral part of the financial statements.
Annual Report
Fidelity Ginnie Mae Fund
Financial Statements - continued
Statement of Changes in Net Assets
Amounts in thousands | Year ended
July 31,
2005 | Year ended
July 31,
2004 |
Increase (Decrease) in Net Assets | | |
Operations | | |
Net investment income | $ 161,629 | $ 163,025 |
Net realized gain (loss) | 25,145 | (684) |
Change in net unrealized appreciation (depreciation) | (25,474) | 16,509 |
Net increase (decrease) in net assets resulting
from operations | 161,300 | 178,850 |
Distributions to shareholders from net investment income | (162,997) | (155,883) |
Distributions to shareholders from net realized gain | - | (36,640) |
Total distributions | (162,997) | (192,523) |
Share transactions
Proceeds from sales of shares | 798,447 | 622,507 |
Reinvestment of distributions | 144,222 | 171,102 |
Cost of shares redeemed | (884,514) | (2,409,367) |
Net increase (decrease) in net assets resulting from share transactions | 58,155 | (1,615,758) |
Total increase (decrease) in net assets | 56,458 | (1,629,431) |
| | |
Net Assets | | |
Beginning of period | 3,977,019 | 5,606,450 |
End of period (including undistributed net investment income of $7,375 and undistributed net investment income of $2,901, respectively) | $ 4,033,477 | $ 3,977,019 |
Other Information Shares | | |
Sold | 72,083 | 56,098 |
Issued in reinvestment of distributions | 13,026 | 15,437 |
Redeemed | (79,918) | (217,505) |
Net increase (decrease) | 5,191 | (145,970) |
See accompanying notes which are an integral part of the financial statements.
Annual Report
Financial Highlights
Years ended July 31, | 2005 | 2004 | 2003 | 2002 | 2001 |
Selected Per-Share Data | | | | | |
Net asset value,
beginning of period | $ 11.00 | $ 11.05 | $ 11.11 | $ 10.91 | $ 10.42 |
Income from Investment Operations | | | | | |
Net investment income B | .443 | .404 | .364 | .563 E | .684 |
Net realized and unrealized gain (loss) | .004 C | .027 | (.029) | .225 E | .487 |
Total from investment operations | .447 | .431 | .335 | .788 | 1.171 |
Distributions from net investment income | (.447) | (.391) | (.395) | (.588) | (.681) |
Distributions from net
realized gain | - | (.090) | - | - | - |
Total distributions | (.447) | (.481) | (.395) | (.588) | (.681) |
Net asset value,
end of period | $ 11.00 | $ 11.00 | $ 11.05 | $ 11.11 | $ 10.91 |
Total Return A | 4.11% | 3.96% | 3.02% | 7.42% | 11.55% |
Ratios to Average Net Assets D | | | | |
Expenses before expense reductions | .57% | .60% | .57% | .60% | .63% |
Expenses net of voluntary waivers, if any | .57% | .60% | .57% | .60% | .62% |
Expenses net of all reductions | .57% | .60% | .57% | .60% | .62% |
Net investment income | 4.00% | 3.64% | 3.25% | 5.15% E | 6.40% |
Supplemental Data | | | | | |
Net assets, end of period (in millions) | $ 4,033 | $ 3,977 | $ 5,606 | $ 5,743 | $ 2,836 |
Portfolio turnover rate | 160% | 155% | 262% | 327% | 120% |
A Total returns would have been lower had certain expenses not been reduced during the periods shown.
B Calculated based on average shares outstanding during the period.
C The amount shown for a share outstanding does not correspond with the aggregate net gain (loss) on investments for the period due to the timing of sales and repurchases of shares in relation to fluctuating market values of the investments of the fund.
D Expense ratios reflect operating expenses of the fund. Expenses before reductions do not reflect amounts reimbursed by the investment adviser or reductions from brokerage service arrangements or other expense offset arrangements and do not represent the amount paid by the fund during periods when reimbursements or reductions occur. Expenses net of any voluntary waivers reflect expenses after reimbursement by the investment adviser but prior to reductions from brokerage service arrangements or other expense offset arrangements. Expenses net of all reductions represent the net expenses paid by the fund.
E Effective August 1, 2001, the fund adopted the provisions of the AICPA Audit and Accounting Guide for Investment Companies and began amortizing premium and discount on all debt securities. Per-share data and ratios for periods prior to adoption have not been restated to reflect this change.
See accompanying notes which are an integral part of the financial statements.
Annual Report
Fidelity Government Income Fund
Performance: The Bottom Line
Average annual total return reflects the change in the value of an investment, assuming reinvestment of the fund's dividend income and capital gains (the profits earned upon the sale of securities that have grown in value) and assuming a constant rate of performance each year. The $10,000 table and the fund's returns do not reflect the deduction of taxes that a shareholder would pay on fund distributions or the redemption of fund shares. During periods of reimbursement by Fidelity, a fund's total return will be greater than it would be had the reimbursement not occurred. How a fund did yesterday is no guarantee of how it will do tomorrow.
Average Annual Total Returns
Periods ended July 31, 2005 | Past 1
year | Past 5
years | Past 10
years |
Fidelity Government Income Fund | 4.24% | 6.35% | 6.07% |
$10,000 Over 10 Years
Let's say hypothetically that $10,000 was invested in Fidelity Government Income Fund on July 31, 1995. The chart shows how the value of your investment would have changed, and also shows how the Lehman Brothers Government Bond Index performed over the same period.

Annual Report
Fidelity Government Income Fund
Management's Discussion of Fund Performance
Comments from George Fischer, Portfolio Manager of Fidelity® Government Income Fund
Not unlike the domestic equity markets, taxable bonds swung up and down during the 12 months ending July 31, 2005, rallying early in the period, then selling off in late winter, only to advance again in the spring. During the one-year period, the Lehman Brothers® Aggregate Bond Index - a measure of the overall investment-grade bond universe - rose 4.79%. Much of this gain came on the strength of returns from higher-yielding spread sectors, such as investment-grade corporates, reflected in the 5.76% return of the Lehman Brothers Credit Bond Index over the 12-month period. Mortgage-backed securities were spurred on by the relative stability of long-term interest rates, and the Lehman Brothers Mortgage-Backed Securities gained 4.67%. Treasuries also bolstered the overall market, as illustrated by the 4.62% return of the Lehman Brothers U.S. Treasury Index, which moved ahead on a flight to quality as investors continued to ponder the future direction of the U.S. economy. The Lehman Brothers U.S. Agency Index returned a more modest 3.88%.
For the 12 months ending July 31, 2005, the fund gained 4.24%, while the Lehman Brothers 75% U.S. Government/25% Mortgage-Backed Securities Index returned 4.46% and the LipperSM General U.S. Government Funds Average returned 4.24%. Aiding the fund's performance was my sector selection. In particular, my decisions to maintain an overweighting relative to the index in agency securities throughout the year, while significantly underweighting Treasuries, worked out well, as agencies outpaced similar-duration Treasuries. Within the Treasury sector, an allocation to Treasury Inflation-Protected Securities (TIPS) also contributed to the fund's performance, as they fared well throughout most of the year. In addition, my yield-curve strategy - which involved positioning the fund for a flattening of the curve - worked in our favor. In terms of disappointments, the fund's performance probably would have been helped had I owned more mortgage securities, which outpaced agencies during much of the past year.
The views expressed in this statement reflect those of the portfolio manager only through the end of the period of the report as stated on the cover and do not necessarily represent the views of Fidelity or any other person in the Fidelity organization. Any such views are subject to change at any time based upon market or other conditions and Fidelity disclaims any responsibility to update such views. These views may not be relied on as investment advice and, because investment decisions for a Fidelity fund are based on numerous factors, may not be relied on as an indication of trading intent on behalf of any Fidelity fund.
Annual Report
Fidelity Government Income Fund
Investment Changes
Coupon Distribution as of July 31, 2005 |
| % of fund's
investments | % of fund's investments
6 months ago |
Less than 2% | 4.3 | 2.9 |
2 - 2.99% | 15.1 | 18.7 |
3 - 3.99% | 16.2 | 21.0 |
4 - 4.99% | 12.8 | 12.3 |
5 - 5.99% | 20.4 | 16.7 |
6 - 6.99% | 12.0 | 8.2 |
7 - 7.99% | 2.5 | 1.5 |
8% and over | 3.8 | 4.8 |
Coupon distribution shows the range of stated interest rates on the fund's investments, excluding short-term investments. |
Average Years to Maturity as of July 31, 2005 |
| | 6 months ago |
Years | 6.1 | 6.0 |
Average years to maturity is based on the average time remaining until principal payments are expected from each of the fund's bonds, weighted by dollar amount. |
Duration as of July 31, 2005 |
| | 6 months ago |
Years | 4.1 | 4.2 |
Duration shows how much a bond fund's price fluctuates with changes in comparable interest rates. If rates rise 1%, for example, a fund with a five-year duration is likely to lose about 5% of its value. Other factors also can influence a bond fund's performance and share price. Accordingly, a bond fund's actual performance may differ from this example. |
Asset Allocation (% of fund's net assets) |
As of July 31, 2005* | As of January 31, 2005** |
| Mortgage
Securities 21.4% | | | Mortgage
Securities 13.7% | |
 | CMOs and Other Mortgage Related Securities 5.6% | | | CMOs and Other Mortgage Related Securities 6.3% | |
| U.S. Treasury
Obligations 38.2% | | | U.S. Treasury
Obligations 40.1% | |
 | U.S. Government
Agency Obligations 28.5% | | | U.S. Government
Agency Obligations 31.5% | |
| Short-Term
Investments and
Net Other Assets 6.3% | | | Short-Term
Investments and
Net Other Assets 8.4% | |
* Futures and Swaps | 0.0% | | ** Futures and Swaps | 1.5% | |

Annual Report
Fidelity Government Income Fund
Investments July 31, 2005
Showing Percentage of Net Assets
U.S. Government and Government Agency Obligations - 66.7% |
| Principal
Amount (000s) | | Value (Note 1)
(000s) |
U.S. Government Agency Obligations - 28.5% |
Fannie Mae: | | | | |
2.375% 12/15/05 | | $ 80,000 | | $ 79,587 |
2.625% 11/15/06 | | 45,430 | | 44,571 |
3.25% 1/15/08 | | 57,140 | | 55,800 |
3.25% 2/15/09 | | 116,465 | | 112,292 |
3.625% 3/15/07 | | 5,649 | | 5,603 |
3.75% 5/17/07 | | 25,560 | | 25,350 |
3.875% 5/15/07 | | 6,660 | | 6,624 |
4.625% 10/15/14 | | 70,000 | | 70,263 |
5% 4/15/15 | | 50,000 | | 51,650 |
5.125% 1/2/14 | | 15,000 | | 15,302 |
5.5% 3/15/11 | | 66,695 | | 70,039 |
6.25% 2/1/11 | | 19,445 | | 20,890 |
6.375% 6/15/09 | | 39,220 | | 41,987 |
Federal Home Loan Bank: | | | | |
1.5% 8/19/05 | | 62,125 | | 62,057 |
3.75% 9/28/06 | | 34,660 | | 34,454 |
3.8% 12/22/06 | | 7,375 | | 7,326 |
5.8% 9/2/08 | | 13,440 | | 13,998 |
Financing Corp. - coupon STRIPS: | | | | |
0% 8/3/05 | | 907 | | 907 |
0% 8/3/05 | | 1,082 | | 1,082 |
Freddie Mac: | | | | |
2.375% 4/15/06 | | 133,000 | | 131,492 |
2.75% 8/15/06 | | 6,630 | | 6,540 |
2.875% 12/15/06 | | 45,920 | | 45,139 |
4.25% 7/15/09 | | 4,460 | | 4,439 |
4.5% 7/15/13 | | 2,825 | | 2,821 |
4.875% 11/15/13 | | 73,400 | | 75,191 |
5.5% 9/15/11 | | 1,240 | | 1,309 |
5.875% 3/21/11 | | 34,550 | | 36,634 |
7% 3/15/10 | | 68,405 | | 75,852 |
Government Loan Trusts (assets of Trust guaranteed by U.S. Government through Agency for International Development) Series 1-B, 8.5% 4/1/06 | | 1,749 | | 1,791 |
Guaranteed Export Trust Certificates (assets of Trust guaranteed by U.S. Government through Export-Import Bank) Series 1994-A, 7.12% 4/15/06 | | 1,534 | | 1,555 |
Guaranteed Trade Trust Certificates (assets of Trust guaranteed by U.S. Government through Export-Import Bank) Series 1994-B, 7.5% 1/26/06 | | 699 | | 707 |
U.S. Government and Government Agency Obligations - continued |
| Principal
Amount (000s) | | Value (Note 1)
(000s) |
U.S. Government Agency Obligations - continued |
Israeli State (guaranteed by U.S. Government through Agency for International Development): | | | | |
5.5% 9/18/23 | | $ 110,500 | | $ 119,312 |
5.89% 8/15/05 | | 29,600 | | 29,606 |
6.6% 2/15/08 | | 27,214 | | 27,724 |
6.8% 2/15/12 | | 18,000 | | 19,646 |
Overseas Private Investment Corp. U.S. Government guaranteed participation certificates: | | | | |
6.77% 11/15/13 | | 5,427 | | 5,875 |
6.99% 5/21/16 | | 17,259 | | 19,265 |
Private Export Funding Corp.: | | | | |
secured: | | | | |
5.34% 3/15/06 | | 21,700 | | 21,878 |
5.66% 9/15/11 (c) | | 11,160 | | 11,803 |
5.685% 5/15/12 | | 16,815 | | 17,958 |
6.49% 7/15/07 | | 5,000 | | 5,193 |
6.67% 9/15/09 | | 2,120 | | 2,303 |
7.17% 5/15/07 | | 8,500 | | 8,931 |
3.375% 2/15/09 | | 3,565 | | 3,457 |
4.974% 8/15/13 | | 16,940 | | 17,450 |
Small Business Administration guaranteed development participation certificates: | | | | |
Series 2002-20J Class 1, 4.75% 10/1/22 | | 8,445 | | 8,467 |
Series 2002-20K Class 1, 5.08% 11/1/22 | | 4,334 | | 4,407 |
Series 2003 P10B, 5.136% 8/10/13 | | 13,529 | | 13,896 |
Series 2004-20H Class 1, 5.17% 8/1/24 | | 3,874 | | 3,952 |
U.S. Department of Housing and Urban Development Government guaranteed participation certificates Series 1999-A: | | | | |
5.75% 8/1/06 | | 9,300 | | 9,452 |
5.96% 8/1/09 | | 9,930 | | 10,285 |
U.S. Trade Trust Certificates (assets of Trust guaranteed by U.S. Government through Export-Import Bank) 8.17% 1/15/07 | | 934 | | 963 |
TOTAL U.S. GOVERNMENT AGENCY OBLIGATIONS | | 1,465,075 |
U.S. Treasury Inflation Protected Obligations - 7.6% |
U.S. Treasury Inflation-Indexed Bonds 3.625% 4/15/28 | | 133,419 | | 172,268 |
U.S. Treasury Inflation-Indexed Notes: | | | | |
0.875% 4/15/10 | | 99,540 | | 95,628 |
U.S. Government and Government Agency Obligations - continued |
| Principal
Amount (000s) | | Value (Note 1)
(000s) |
U.S. Treasury Inflation Protected Obligations - continued |
U.S. Treasury Inflation-Indexed Notes: - continued | | | | |
1.875% 7/15/13 | | $ 79,387 | | $ 79,628 |
2% 7/15/14 | | 41,254 | | 41,702 |
TOTAL U.S. TREASURY INFLATION PROTECTED OBLIGATIONS | | 389,226 |
U.S. Treasury Obligations - 30.6% |
U.S. Treasury Bonds: | | | | |
6.125% 8/15/29 | | 235,000 | | 289,564 |
8% 11/15/21 | | 142,000 | | 198,312 |
U.S. Treasury Notes: | | | | |
2.75% 6/30/06 | | 29,345 | | 29,049 |
2.75% 7/31/06 | | 461,550 | | 456,391 |
3.375% 9/15/09 | | 301,383 | | 292,742 |
3.625% 6/30/07 | | 150,000 | | 148,916 |
4.25% 8/15/13 (b) | | 59,275 | | 59,349 |
4.25% 11/15/13 | | 15,000 | | 14,998 |
4.75% 5/15/14 | | 75,948 | | 78,600 |
TOTAL U.S. TREASURY OBLIGATIONS | | 1,567,921 |
TOTAL U.S. GOVERNMENT AND
GOVERNMENT AGENCY OBLIGATIONS (Cost $3,398,961) | 3,422,222 |
U.S. Government Agency - Mortgage Securities - 21.4% |
|
Fannie Mae - 19.9% |
3.463% 4/1/34 (e) | | 1,973 | | 1,966 |
3.734% 1/1/35 (e) | | 1,161 | | 1,149 |
3.753% 10/1/33 (e) | | 805 | | 793 |
3.786% 12/1/34 (e) | | 991 | | 981 |
3.793% 6/1/34 (e) | | 3,504 | | 3,422 |
3.801% 12/1/34 (e) | | 232 | | 230 |
3.828% 1/1/35 (e) | | 777 | | 770 |
3.838% 1/1/35 (e) | | 2,241 | | 2,232 |
3.867% 1/1/35 (e) | | 1,308 | | 1,301 |
3.88% 6/1/33 (e) | | 3,222 | | 3,192 |
3.913% 12/1/34 (e) | | 693 | | 688 |
3.937% 10/1/34 (e) | | 961 | | 953 |
3.937% 12/1/34 (e) | | 1,394 | | 1,387 |
3.967% 11/1/34 (e) | | 1,529 | | 1,516 |
U.S. Government Agency - Mortgage Securities - continued |
| Principal
Amount (000s) | | Value (Note 1)
(000s) |
Fannie Mae - continued |
3.97% 5/1/33 (e) | | $ 265 | | $ 263 |
3.975% 1/1/35 (e) | | 984 | | 975 |
3.981% 12/1/34 (e) | | 944 | | 934 |
4% 10/1/18 to 4/1/19 | | 6,637 | | 6,410 |
4% 8/1/20 (d) | | 44,739 | | 43,145 |
4.008% 12/1/34 (e) | | 5,227 | | 5,217 |
4.011% 1/1/35 (e) | | 627 | | 621 |
4.014% 12/1/34 (e) | | 754 | | 746 |
4.023% 2/1/35 (e) | | 718 | | 712 |
4.03% 1/1/35 (e) | | 1,363 | | 1,351 |
4.03% 1/1/35 (e) | | 360 | | 358 |
4.032% 12/1/34 (e) | | 504 | | 503 |
4.045% 5/1/34 (e) | | 330 | | 329 |
4.049% 2/1/35 (e) | | 676 | | 670 |
4.053% 10/1/18 (e) | | 836 | | 828 |
4.054% 1/1/35 (e) | | 674 | | 668 |
4.079% 4/1/33 (e) | | 267 | | 266 |
4.098% 1/1/35 (e) | | 1,478 | | 1,483 |
4.104% 2/1/35 (e) | | 533 | | 531 |
4.11% 2/1/35 (e) | | 488 | | 487 |
4.117% 2/1/35 (e) | | 1,332 | | 1,326 |
4.118% 1/1/35 (e) | | 1,469 | | 1,462 |
4.121% 2/1/35 (e) | | 2,724 | | 2,711 |
4.124% 1/1/35 (e) | | 1,456 | | 1,462 |
4.137% 1/1/35 (e) | | 2,537 | | 2,527 |
4.138% 2/1/35 (e) | | 1,648 | | 1,654 |
4.144% 1/1/35 (e) | | 2,101 | | 2,110 |
4.15% 11/1/34 (e) | | 1,255 | | 1,248 |
4.154% 2/1/35 (e) | | 1,425 | | 1,421 |
4.178% 1/1/35 (e) | | 2,772 | | 2,798 |
4.183% 1/1/35 (e) | | 1,239 | | 1,237 |
4.189% 11/1/34 (e) | | 383 | | 383 |
4.197% 1/1/35 (e) | | 1,595 | | 1,584 |
4.232% 3/1/34 (e) | | 750 | | 747 |
4.25% 2/1/35 (e) | | 817 | | 813 |
4.258% 10/1/34 (e) | | 2,055 | | 2,067 |
4.293% 3/1/35 (e) | | 792 | | 792 |
4.297% 7/1/34 (e) | | 725 | | 726 |
4.302% 1/1/35 (e) | | 1,069 | | 1,062 |
4.306% 8/1/33 (e) | | 1,737 | | 1,730 |
4.315% 3/1/33 (e) | | 390 | | 389 |
4.323% 5/1/35 (e) | | 1,219 | | 1,218 |
U.S. Government Agency - Mortgage Securities - continued |
| Principal
Amount (000s) | | Value (Note 1)
(000s) |
Fannie Mae - continued |
4.332% 12/1/34 (e) | | $ 512 | | $ 513 |
4.335% 2/1/35 (e) | | 548 | | 546 |
4.349% 1/1/35 (e) | | 802 | | 795 |
4.351% 1/1/35 (e) | | 799 | | 796 |
4.367% 2/1/34 (e) | | 1,988 | | 1,983 |
4.372% 4/1/35 (e) | | 567 | | 566 |
4.401% 2/1/35 (e) | | 1,267 | | 1,258 |
4.409% 5/1/35 (e) | | 2,479 | | 2,480 |
4.433% 11/1/34 (e) | | 12,182 | | 12,178 |
4.451% 6/1/33 (e) | | 586 | | 580 |
4.455% 3/1/35 (e) | | 1,106 | | 1,096 |
4.467% 10/1/34 (e) | | 4,526 | | 4,528 |
4.479% 4/1/34 (e) | | 1,451 | | 1,453 |
4.489% 8/1/34 (e) | | 2,735 | | 2,734 |
4.5% 8/1/20 (d) | | 80,000 | | 78,675 |
4.5% 3/1/35 (e) | | 2,452 | | 2,443 |
4.508% 1/1/35 (e) | | 1,459 | | 1,468 |
4.529% 3/1/35 (e) | | 2,293 | | 2,284 |
4.538% 8/1/34 (e) | | 1,613 | | 1,622 |
4.554% 7/1/35 (e) | | 3,075 | | 3,076 |
4.564% 2/1/35 (e) | | 5,652 | | 5,658 |
4.57% 2/1/35 (e) | | 929 | | 932 |
4.619% 2/1/35 (e) | | 2,439 | | 2,430 |
4.645% 2/1/35 (e) | | 662 | | 666 |
4.649% 11/1/34 (e) | | 2,896 | | 2,902 |
4.687% 11/1/34 (e) | | 2,861 | | 2,864 |
4.74% 7/1/34 (e) | | 2,506 | | 2,490 |
4.741% 3/1/35 (e) | | 1,350 | | 1,350 |
4.823% 12/1/34 (e) | | 2,425 | | 2,433 |
4.847% 12/1/34 (e) | | 972 | | 975 |
5% 12/1/15 to 8/1/35 | | 204,432 | | 202,470 |
5% 8/1/35 (d) | | 64,813 | | 63,821 |
5% 8/1/35 (d) | | 37,781 | | 37,202 |
5.123% 2/1/35 (e) | | 7,295 | | 7,282 |
5.137% 5/1/35 (e) | | 840 | | 841 |
5.204% 6/1/35 (e) | | 4,285 | | 4,341 |
5.366% 12/1/32 (e) | | 1,265 | | 1,279 |
5.5% 4/1/09 to 3/1/34 (d) | | 222,633 | | 225,783 |
5.5% 8/1/35 (d) | | 60,705 | | 61,046 |
5.5% 8/11/35 (d) | | 51,000 | | 51,287 |
5.817% 5/1/35 (e) | | 5,955 | | 6,018 |
6% 9/1/17 to 10/1/32 | | 44,654 | | 45,847 |
U.S. Government Agency - Mortgage Securities - continued |
| Principal
Amount (000s) | | Value (Note 1)
(000s) |
Fannie Mae - continued |
6.5% 3/1/13 to 3/1/35 | | $ 35,614 | | $ 36,926 |
6.5% 8/1/35 (d) | | 1,265 | | 1,310 |
7% 7/1/13 to 5/1/30 | | 4,194 | | 4,429 |
7.5% 8/1/10 to 10/1/15 | | 279 | | 295 |
8% 1/1/22 | | 88 | | 91 |
8.5% 1/1/15 to 4/1/16 | | 892 | | 953 |
9% 5/1/14 | | 875 | | 956 |
9.5% 11/15/09 to 10/1/20 | | 1,405 | | 1,526 |
10% 8/1/10 | | 25 | | 26 |
11.5% 6/15/19 to 1/15/21 | | 2,402 | | 2,654 |
| | 1,018,701 |
Freddie Mac - 1.3% |
4.106% 12/1/34 (e) | | 963 | | 957 |
4.13% 12/1/34 (e) | | 1,375 | | 1,368 |
4.223% 1/1/35 (e) | | 1,273 | | 1,269 |
4.3% 5/1/35 (e) | | 2,100 | | 2,089 |
4.311% 12/1/34 (e) | | 1,231 | | 1,223 |
4.312% 3/1/35 (e) | | 1,176 | | 1,172 |
4.351% 1/1/35 (e) | | 2,862 | | 2,866 |
4.368% 3/1/35 (e) | | 1,698 | | 1,679 |
4.4% 2/1/35 (e) | | 2,314 | | 2,288 |
4.404% 2/1/35 (e) | | 2,535 | | 2,529 |
4.446% 3/1/35 (e) | | 1,055 | | 1,043 |
4.449% 2/1/34 (e) | | 1,306 | | 1,300 |
4.49% 3/1/35 (e) | | 3,110 | | 3,083 |
4.497% 6/1/35 (e) | | 1,670 | | 1,669 |
4.498% 3/1/35 (e) | | 8,190 | | 8,136 |
4.504% 3/1/35 (e) | | 1,250 | | 1,238 |
4.565% 2/1/35 (e) | | 1,774 | | 1,776 |
5% 1/1/09 to 6/1/09 | | 811 | | 815 |
5% 8/1/35 (d) | | 8,848 | | 8,710 |
5.036% 4/1/35 (e) | | 6,927 | | 6,969 |
5.223% 8/1/33 (e) | | 525 | | 536 |
6% 5/1/33 | | 10,912 | | 11,168 |
7% 4/1/11 | | 5 | | 6 |
7.5% 7/1/10 to 5/1/16 | | 2,721 | | 2,885 |
8% 1/1/10 to 6/1/11 | | 54 | | 56 |
8.5% 8/1/08 to 12/1/25 | | 205 | | 217 |
9% 8/1/09 to 12/1/10 | | 110 | | 115 |
9.75% 8/1/14 | | 179 | | 197 |
| | 67,359 |
U.S. Government Agency - Mortgage Securities - continued |
| Principal
Amount (000s) | | Value (Note 1)
(000s) |
Government National Mortgage Association - 0.2% |
6% 7/15/08 to 12/15/10 | | $ 5,596 | | $ 5,751 |
6.5% 5/15/28 to 11/15/32 | | 1,501 | | 1,566 |
7% 10/15/26 to 8/15/32 | | 79 | | 84 |
7.5% 3/15/28 to 8/15/28 | | 172 | | 184 |
8% 11/15/06 to 12/15/23 | | 1,424 | | 1,533 |
8.5% 10/15/08 to 2/15/31 | | 106 | | 112 |
9.5% 2/15/25 | | 2 | | 2 |
| | 9,232 |
TOTAL U.S. GOVERNMENT AGENCY - MORTGAGE SECURITIES (Cost $1,101,072) | 1,095,292 |
Collateralized Mortgage Obligations - 5.6% |
|
U.S. Government Agency - 5.6% |
Fannie Mae: | | | | |
planned amortization class: | | | | |
Series 1993-109 Class NZ, 6% 7/25/08 | | 5,272 | | 5,338 |
Series 1993-160 Class PK, 6.5% 11/25/22 | | 2,372 | | 2,373 |
Series 1993-207 Class H, 6.5% 11/25/23 | | 18,360 | | 19,407 |
Series 1994-23 Class PG, 6% 4/25/23 | | 9,565 | | 9,720 |
Series 1994-27 Class PJ, 6.5% 6/25/23 | | 3,432 | | 3,468 |
Series 1994-50 Class PJ, 6.5% 8/25/23 | | 17,000 | | 17,326 |
Series 1996-28 Class PK, 6.5% 7/25/25 | | 3,430 | | 3,612 |
sequential pay Series 1997-41 Class J, 7.5%
6/18/27 | | 5,130 | | 5,287 |
Fannie Mae guaranteed REMIC pass thru certificates: | | | | |
planned amortization class: | | | | |
Series 2002-25 Class PD, 6.5% 3/25/31 | | 24,353 | | 24,740 |
Series 2002-8 Class PD, 6.5% 7/25/30 | | 2,595 | | 2,606 |
Series 2003-32 Class PB, 3% 6/25/16 | | 3,780 | | 3,760 |
Series 2002-50 Class LE, 7% 12/25/29 | | 946 | | 960 |
Freddie Mac: | | | | |
planned amortization class: | | | | |
Series 1413 Class J, 4% 11/15/07 | | 2,284 | | 2,282 |
Series 2351 Class PX, 6.5% 7/15/30 | | 171 | | 172 |
sequential pay: | | | | |
Series 2114 Class ZM, 6% 1/15/29 | | 2,962 | | 3,037 |
Series 2516 Class AH, 5% 1/15/16 | | 1,562 | | 1,571 |
Collateralized Mortgage Obligations - continued |
| Principal
Amount (000s) | | Value (Note 1)
(000s) |
U.S. Government Agency - continued |
Freddie Mac Manufactured Housing participation certificates guaranteed: | | | | |
planned amortization class Series 1681 Class PJ, 7% 12/15/23 | | $ 9,200 | | $ 9,531 |
Series 1560 Class PN, 7% 12/15/12 | | 13,579 | | 13,972 |
Freddie Mac Multi-class participation certificates guaranteed: | | | | |
planned amortization class: | | | | |
Class 2325 Class PL, 7% 1/15/31 | | 3,049 | | 3,079 |
Series 1614 Class L, 6.5% 7/15/23 | | 8,138 | | 8,393 |
Series 1727 Class H, 6.5% 8/15/23 | | 8,382 | | 8,464 |
Series 2461 Class PG, 6.5% 1/15/31 | | 1,990 | | 2,017 |
Series 2690 Class TB, 4.5% 12/15/17 | | 8,193 | | 8,192 |
Series 2760 Class EC, 4.5% 4/15/17 | | 8,098 | | 7,929 |
Series 2763 Class PD, 4.5% 12/15/17 | | 10,150 | | 9,958 |
Series 2770 Class UD, 4.5% 5/15/17 | | 15,620 | | 15,302 |
Series 2780 Class OC, 4.5% 3/15/17 | | 4,980 | | 4,932 |
Series 2802 Class OB, 6% 5/15/34 | | 7,795 | | 8,174 |
Series 2828 Class JA, 4.5% 1/15/10 | | 9,404 | | 9,422 |
Series 2831 Class PB, 5% 7/15/19 | | 4,945 | | 4,956 |
Series 2885 Class PC, 4.5% 3/15/18 | | 6,515 | | 6,439 |
sequential pay Series 2866 Class N, 4.5%
12/15/18 | | 5,873 | | 5,794 |
Series 2406: | | | | |
Class FP, 4.3681% 1/15/32 (e) | | 8,010 | | 8,192 |
Class PF, 4.3681% 12/15/31 (e) | | 6,340 | | 6,506 |
Series 2410 Class PF, 4.3681% 2/15/32 (e) | | 14,540 | | 14,872 |
Series 2769 Class BU, 5% 3/15/34 | | 6,434 | | 6,343 |
target amortization class Series 2156 Class TC, 6.25% 5/15/29 | | 9,656 | | 9,839 |
Ginnie Mae guaranteed REMIC pass thru securities planned amortization class: | | | | |
Series 1997-8 Class PE, 7.5% 5/16/27 | | 8,358 | | 8,684 |
Series 2001-53 Class TA, 6% 12/20/30 | | 443 | | 443 |
TOTAL COLLATERALIZED MORTGAGE OBLIGATIONS (Cost $289,347) | 287,092 |
Cash Equivalents - 13.8% |
| | Maturity
Amount (000s) | | Value (Note 1)
(000s) |
Investments in repurchase agreements (Collateralized by U.S. Government Obligations, in a joint trading account at 3.32%, dated 7/29/05 due 8/1/05) (a) (f)
(Cost $709,093) | | $ 709,289 | | $ 709,093 |
TOTAL INVESTMENT PORTFOLIO - 107.5% (Cost $5,498,473) | | | 5,513,699 |
NET OTHER ASSETS - (7.5)% | | | (386,324) |
NET ASSETS - 100% | | $ 5,127,375 |
Legend |
(a) Includes investment made with cash collateral received from securities on loan. |
(b) Security or a portion of the security is on loan at period end. |
(c) Security exempt from registration under Rule 144A of the Securities Act of 1933. These securities may be resold in transactions exempt from registration, normally to qualified institutional buyers. At the period end, the value of these securities amounted to $11,803,000 or 0.2% of net assets. |
(d) Security or a portion of the security purchased on a delayed delivery or when-issued basis. |
(e) The coupon rate shown on floating or adjustable rate securities represents the rate at period end. |
(f) Additional information on each counterparty to the repurchase agreement is as follows: |
Repurchase Agreement/
Counterparty | Value
(000s) |
$709,093,000 due 8/1/05 at 3.32% | |
Banc of America Securities LLC | $ 142,049 |
Bank of America, National Association | 73,791 |
Barclays Capital Inc. | 295,166 |
Countrywide Securities Corporation | 73,791 |
Morgan Stanley & Co. Incorporated. | 105,848 |
UBS Securities LLC | 18,448 |
| $ 709,093 |
See accompanying notes which are an integral part of the financial statements.
Annual Report
Fidelity Government Income Fund
Financial Statements
Statement of Assets and Liabilities
Amounts in thousands (except per-share amount) | July 31, 2005 |
| | |
Assets | | |
Investment in securities, at value (including securities loaned of $60,579 and repurchase agreements of $709,093)(cost $5,498,473) - See accompanying schedule | | $ 5,513,699 |
Cash | | 289 |
Receivable for investments sold | | 944 |
Receivable for fund shares sold | | 11,347 |
Interest receivable | | 48,166 |
Total assets | | 5,574,445 |
| | |
Liabilities | | |
Payable for investments purchased
Regular delivery | $ 33,063 | |
Delayed delivery | 347,694 | |
Payable for fund shares redeemed | 2,147 | |
Distributions payable | 255 | |
Accrued management fee | 1,375 | |
Other affiliated payables | 541 | |
Other payables and accrued expenses | 191 | |
Collateral on securities loaned, at value | 61,804 | |
Total liabilities | | 447,070 |
| | |
Net Assets | | $ 5,127,375 |
Net Assets consist of: | | |
Paid in capital | | $ 5,112,044 |
Undistributed net investment income | | 8,741 |
Accumulated undistributed net realized gain (loss) on investments | | (8,636) |
Net unrealized appreciation (depreciation) on investments | | 15,226 |
Net Assets, for 502,585 shares outstanding | | $ 5,127,375 |
Net Asset Value, offering price and redemption price per share ($5,127,375 ÷ 502,585 shares) | | $ 10.20 |
See accompanying notes which are an integral part of the financial statements.
Annual Report
Statement of Operations
Amounts in thousands | Year ended July 31, 2005 |
| | |
Investment Income | | |
Interest | | $ 174,963 |
Security lending | | 380 |
Total income | | 175,343 |
| | |
Expenses | | |
Management fee | $ 18,777 | |
Transfer agent fees | 6,756 | |
Accounting and security lending fees | 967 | |
Fund wide operations fee | 220 | |
Independent trustees' compensation | 24 | |
Custodian fees and expenses | 107 | |
Registration fees | 63 | |
Audit | 64 | |
Legal | 9 | |
Miscellaneous | 32 | |
Total expenses before reductions | 27,019 | |
Expense reductions | (165) | 26,854 |
Net investment income | | 148,489 |
Realized and Unrealized Gain (Loss) Net realized gain (loss) on: | | |
Investment securities | 6,969 | |
Swap agreements | (582) | |
Total net realized gain (loss) | | 6,387 |
Change in net unrealized appreciation (depreciation) on investment securities | | 31,902 |
Net gain (loss) | | 38,289 |
Net increase (decrease) in net assets resulting from operations | | $ 186,778 |
See accompanying notes which are an integral part of the financial statements.
Annual Report
Fidelity Government Income Fund
Financial Statements - continued
Statement of Changes in Net Assets
Amounts in thousands | Year ended
July 31,
2005 | Year ended
July 31,
2004 |
Increase (Decrease) in Net Assets | | |
Operations | | |
Net investment income | $ 148,489 | $ 118,290 |
Net realized gain (loss) | 6,387 | 14,478 |
Change in net unrealized appreciation (depreciation) | 31,902 | 24,630 |
Net increase (decrease) in net assets resulting
from operations | 186,778 | 157,398 |
Distributions to shareholders from net investment income | (144,880) | (116,019) |
Distributions to shareholders from net realized gain | (15,082) | (56,842) |
Total distributions | (159,962) | (172,861) |
Share transactions
Proceeds from sales of shares | 1,285,690 | 1,202,777 |
Reinvestment of distributions | 156,778 | 168,396 |
Cost of shares redeemed | (510,049) | (809,223) |
Net increase (decrease) in net assets resulting from share transactions | 932,419 | 561,950 |
Total increase (decrease) in net assets | 959,235 | 546,487 |
| | |
Net Assets | | |
Beginning of period | 4,168,140 | 3,621,653 |
End of period (including undistributed net investment income of $8,741 and undistributed net investment income of $6,532, respectively) | $ 5,127,375 | $ 4,168,140 |
Other Information Shares | | |
Sold | 125,500 | 117,744 |
Issued in reinvestment of distributions | 15,297 | 16,526 |
Redeemed | (49,765) | (79,300) |
Net increase (decrease) | 91,032 | 54,970 |
See accompanying notes which are an integral part of the financial statements.
Annual Report
Financial Highlights
Years ended July 31, | 2005 | 2004 | 2003 | 2002 | 2001 |
Selected Per-Share Data | | | | | |
Net asset value,
beginning of period | $ 10.13 | $ 10.16 | $ 10.30 | $ 9.98 | $ 9.49 |
Income from Investment Operations | | | | | |
Net investment income B | .329 | .307 | .374 | .452 D | .577 |
Net realized and unrealized gain (loss) | .097 | .124 | (.014) | .335 D | .525 |
Total from investment operations | .426 | .431 | .360 | .787 | 1.102 |
Distributions from net investment income | (.321) | (.301) | (.370) | (.467) | (.612) |
Distributions from net
realized gain | (.035) | (.160) | (.130) | - | - |
Total distributions | (.356) | (.461) | (.500) | (.467) | (.612) |
Net asset value,
end of period | $ 10.20 | $ 10.13 | $ 10.16 | $ 10.30 | $ 9.98 |
Total Return A | 4.24% | 4.30% | 3.45% | 8.08% | 11.92% |
Ratios to Average Net Assets C | | | | |
Expenses before expense reductions | .58% | .63% | .65% | .69% | .61% |
Expenses net of voluntary waivers, if any | .58% | .63% | .65% | .69% | .61% |
Expenses net of all reductions | .58% | .63% | .65% | .68% | .60% |
Net investment income | 3.21% | 3.01% | 3.56% | 4.50% D | 5.91% |
Supplemental Data | | | | | |
Net assets, end of period (in millions) | $ 5,127 | $ 4,168 | $ 3,622 | $ 2,920 | $ 2,154 |
Portfolio turnover rate | 114% | 224% | 253% | 284% | 214% |
A Total returns would have been lower had certain expenses not been reduced during the periods shown.
B Calculated based on average shares outstanding during the period.
C Expense ratios reflect operating expenses of the fund. Expenses before reductions do not reflect amounts reimbursed by the investment adviser or reductions from brokerage service arrangements or other expense offset arrangements and do not represent the amount paid by the fund during periods when reimbursements or reductions occur. Expenses net of any voluntary waivers reflect expenses after reimbursement by the investment adviser but prior to reductions from brokerage service arrangements or other expense offset arrangements. Expenses net of all reductions represent the net expenses paid by the fund.
D Effective August 1, 2001, the fund adopted the provisions of the AICPA Audit and Accounting Guide for Investment Companies and began amortizing premium and discount on all debt securities. Per-share data and ratios for periods prior to adoption have not been restated to reflect this change.
See accompanying notes which are an integral part of the financial statements.
Annual Report
Fidelity Intermediate Government Income Fund
Performance: The Bottom Line
Average annual total return reflects the change in the value of an investment, assuming reinvestment of the fund's dividend income and capital gains (the profits earned upon the sale of securities that have grown in value) and assuming a constant rate of performance each year. The $10,000 table and the fund's returns do not reflect the deduction of taxes that a shareholder would pay on fund distributions or the redemption of fund shares. During periods of reimbursement by Fidelity, a fund's total return will be greater than it would be had the reimbursement not occurred. How a fund did yesterday is no guarantee of how it will do tomorrow.
Average Annual Total Returns
Periods ended July 31, 2005 | Past 1
year | Past 5
years | Past 10
years |
Fidelity Intermediate Govt Income Fund | 2.43% | 5.79% | 5.80% |
$10,000 Over 10 Years
Let's say hypothetically that $10,000 was invested in Fidelity Intermediate Government Income Fund on July 31, 1995. The chart shows how the value of your investment would have changed, and also shows how the Lehman Brothers Intermediate Government Bond Index performed over the same period.
Annual Report
Fidelity Intermediate Government Income Fund
Management's Discussion of Fund Performance
Comments from George Fischer, Portfolio Manager of Fidelity® Intermediate Government Income Fund
Not unlike the domestic equity markets, taxable bonds swung up and down during the 12 months ending July 31, 2005, rallying early in the period, then selling off in late winter, only to advance again in the spring. During the one-year period, the Lehman Brothers® Aggregate Bond Index - a measure of the overall investment-grade bond universe - rose 4.79%. Much of this gain came on the strength of returns from higher-yielding spread sectors, such as investment-grade corporates, reflected in the 5.76% return of the Lehman Brothers Credit Bond Index over the 12-month period. Mortgage-backed securities were spurred on by the relative stability of long-term interest rates, and the Lehman Brothers Mortgage-Backed Securities gained 4.67%. Treasuries also bolstered the overall market, as illustrated by the 4.62% return of the Lehman Brothers U.S. Treasury Index, which moved ahead on a flight to quality as investors continued to ponder the future direction of the U.S. economy. The Lehman Brothers U.S. Agency Index returned a more modest 3.88%.
For the 12 months ending July 31, 2005, the fund gained 2.43%, while the Lehman Brothers Intermediate Government Bond Index returned 2.51% and the LipperSM Short-Intermediate U.S. Government Funds Average gained 1.79%. I believe the biggest factor aiding the fund's outperformance of its Lipper peer group average was my sector selection. In particular, my decisions to maintain an overweighting relative to the index in agency securities during most of the period, while significantly underweighting Treasuries, was beneficial, as agencies outpaced similar-duration Treasuries. Within the Treasury sector, an allocation to Treasury Inflation-Protected Securities (TIPS) also contributed to the fund's performance, as they fared well throughout most of the year. In addition, my yield-curve strategy - which involved positioning the fund for a flattening of the curve - worked in our favor. In terms of disappointments, the fund's performance probably would have been helped had I owned more mortgage securities, which outpaced agencies during much of the past year.
The views expressed in this statement reflect those of the portfolio manager only through the end of the period of the report as stated on the cover and do not necessarily represent the views of Fidelity or any other person in the Fidelity organization. Any such views are subject to change at any time based upon market or other conditions and Fidelity disclaims any responsibility to update such views. These views may not be relied on as investment advice and, because investment decisions for a Fidelity fund are based on numerous factors, may not be relied on as an indication of trading intent on behalf of any Fidelity fund.
Annual Report
Fidelity Intermediate Government Income Fund
Investment Changes
Coupon Distribution as of July 31, 2005 |
| % of fund's
investments | % of fund's investments
6 months ago |
Less than 2% | 1.9 | 0.0 |
2 - 2.99% | 21.8 | 25.3 |
3 - 3.99% | 32.0 | 16.5 |
4 - 4.99% | 11.4 | 9.8 |
5 - 5.99% | 15.1 | 26.2 |
6 - 6.99% | 15.2 | 14.8 |
7% and over | 2.3 | 3.4 |
Coupon distribution shows the range of stated interest rates on the fund's investments, excluding short-term investments. |
Average Years to Maturity as of July 31, 2005 |
| | 6 months ago |
Years | 4.2 | 4.1 |
Average years to maturity is based on the average time remaining until principal payments are expected from each of the fund's bonds, weighted by dollar amount. |
Duration as of July 31, 2005 |
| | 6 months ago |
Years | 3.1 | 3.2 |
Duration shows how much a bond fund's price fluctuates with changes in comparable interest rates. If rates rise 1%, for example, a fund with a five-year duration is likely to lose about 5% of its value. Other factors also can influence a bond fund's performance and share price. Accordingly, a bond fund's actual performance may differ from this example. |
Asset Allocation (% of fund's net assets) |
As of July 31, 2005* | As of January 31, 2005** |
| Mortgage
Securities 12.2% | | | Mortgage
Securities 8.4% | |
| CMOs and Other Mortgage Related Securities 6.7% | | | CMOs and Other Mortgage Related Securities 5.5% | |
| U.S. Treasury
Obligations 35.7% | | | U.S. Treasury
Obligations 34.0% | |
| U.S. Government Agency Obligations 48.1% | | | U.S. Government Agency Obligations 51.1% | |
 | Short-Term
Investments and
Net Other Assets(dagger) (2.7)% | | | Short-Term
Investments and
Net Other Assets 1.0% | |
* Futures and Swaps | 0.0% | | ** Futures and Swaps | 1.9% | |

(dagger) Short-Term Investments and Net Other Assets are not included in the pie chart. |
Annual Report
Fidelity Intermediate Government Income Fund
Investments July 31, 2005
Showing Percentage of Net Assets
U.S. Government and Government Agency Obligations - 83.8% |
| Principal
Amount (000s) | | Value (Note 1)
(000s) |
U.S. Government Agency Obligations - 48.1% |
Fannie Mae: | | | | |
2.375% 12/15/05 | | $ 20,000 | | $ 19,897 |
2.5% 6/15/06 | | 7,375 | | 7,277 |
2.625% 11/15/06 | | 11,930 | | 11,704 |
3.25% 1/15/08 | | 3,370 | | 3,291 |
3.625% 3/15/07 | | 2,517 | | 2,496 |
3.75% 5/17/07 | | 4,800 | | 4,761 |
4.625% 10/15/14 | | 17,000 | | 17,064 |
5% 4/15/15 | | 10,000 | | 10,330 |
5.125% 1/2/14 | | 6,000 | | 6,121 |
5.5% 3/15/11 | | 33,295 | | 34,964 |
6% 5/15/11 | | 55,860 | | 60,103 |
6.25% 2/1/11 | | 1,285 | | 1,380 |
6.375% 6/15/09 | | 11,870 | | 12,707 |
Federal Home Loan Bank: | | | | |
3.75% 9/28/06 | | 24,160 | | 24,016 |
3.8% 12/22/06 | | 5,140 | | 5,106 |
5.8% 9/2/08 | | 16,625 | | 17,316 |
Freddie Mac: | | | | |
2.375% 4/15/06 | | 67,125 | | 66,364 |
2.75% 8/15/06 | | 4,620 | | 4,557 |
2.875% 12/15/06 | | 32,015 | | 31,471 |
4.25% 7/15/09 | | 5,521 | | 5,496 |
4.5% 7/15/13 | | 575 | | 574 |
5.5% 9/15/11 | | 1,000 | | 1,056 |
5.875% 3/21/11 | | 1,075 | | 1,140 |
Government Loan Trusts (assets of Trust guaranteed by U.S. Government through Agency for International Development) Series 1-B, 8.5% 4/1/06 | | 2,057 | | 2,107 |
Guaranteed Trade Trust Certificates (assets of Trust guaranteed by U.S. Government through Export-Import Bank): | | | | |
Series 1994-A, 7.39% 6/26/06 | | 1,000 | | 1,020 |
Series 1994-B, 7.5% 1/26/06 | | 69 | | 70 |
Israeli State (guaranteed by U.S. Government through Agency for International Development): | | | | |
5.89% 8/15/05 | | 5,815 | | 5,816 |
6.6% 2/15/08 | | 15,994 | | 16,294 |
6.8% 2/15/12 | | 7,500 | | 8,186 |
Overseas Private Investment Corp. U.S. Government guaranteed participation certificates Series 1996-A1, 6.726% 9/15/10 | | 1,913 | | 2,021 |
U.S. Government and Government Agency Obligations - continued |
| Principal
Amount (000s) | | Value (Note 1)
(000s) |
U.S. Government Agency Obligations - continued |
Private Export Funding Corp.: | | | | |
secured: | | | | |
5.66% 9/15/11 (c) | | $ 9,000 | | $ 9,518 |
5.685% 5/15/12 | | 3,915 | | 4,181 |
3.375% 2/15/09 | | 745 | | 722 |
4.974% 8/15/13 | | 3,435 | | 3,538 |
Small Business Administration guaranteed development participation certificates Series 2004-20H Class 1, 5.17% 8/1/24 | | 897 | | 916 |
U.S. Department of Housing and Urban Development Government guaranteed participation certificates Series 1999-A: | | | | |
5.75% 8/1/06 | | 10,000 | | 10,164 |
6.06% 8/1/10 | | 10,000 | | 10,424 |
U.S. Trade Trust Certificates (assets of Trust guaranteed by U.S. Government through Export-Import Bank) 8.17% 1/15/07 | | 965 | | 994 |
TOTAL U.S. GOVERNMENT AGENCY OBLIGATIONS | | 425,162 |
U.S. Treasury Inflation Protected Obligations - 6.2% |
U.S. Treasury Inflation-Indexed Bonds 2.375% 1/15/25 | | 15,470 | | 16,333 |
U.S. Treasury Inflation-Indexed Notes: | | | | |
1.625% 1/15/15 | | 17,308 | | 16,924 |
2% 1/15/14 | | 21,043 | | 21,273 |
TOTAL U.S. TREASURY INFLATION PROTECTED OBLIGATIONS | | 54,530 |
U.S. Treasury Obligations - 29.5% |
U.S. Treasury Notes: | | | | |
2.75% 7/31/06 | | 19,900 | | 19,678 |
3.375% 9/15/09 | | 117,130 | | 113,778 |
3.75% 5/15/08 | | 114,604 | | 113,673 |
4.25% 8/15/13 (b) | | 3,592 | | 3,596 |
4.75% 5/15/14 | | 10,000 | | 10,349 |
TOTAL U.S. TREASURY OBLIGATIONS | | 261,074 |
TOTAL U.S. GOVERNMENT AND
GOVERNMENT AGENCY OBLIGATIONS (Cost $744,297) | 740,766 |
U.S. Government Agency - Mortgage Securities - 12.2% |
| Principal
Amount (000s) | | Value (Note 1)
(000s) |
Fannie Mae - 9.9% |
3.463% 4/1/34 (e) | | $ 355 | | $ 353 |
3.734% 1/1/35 (e) | | 243 | | 241 |
3.753% 10/1/33 (e) | | 134 | | 132 |
3.786% 12/1/34 (e) | | 180 | | 178 |
3.793% 6/1/34 (e) | | 651 | | 636 |
3.801% 12/1/34 (e) | | 42 | | 42 |
3.828% 1/1/35 (e) | | 173 | | 171 |
3.838% 1/1/35 (e) | | 457 | | 455 |
3.867% 1/1/35 (e) | | 271 | | 269 |
3.88% 6/1/33 (e) | | 685 | | 679 |
3.913% 12/1/34 (e) | | 156 | | 155 |
3.937% 10/1/34 (e) | | 200 | | 199 |
3.937% 12/1/34 (e) | | 302 | | 301 |
3.967% 11/1/34 (e) | | 325 | | 323 |
3.97% 5/1/33 (e) | | 47 | | 46 |
3.975% 1/1/35 (e) | | 214 | | 212 |
3.981% 12/1/34 (e) | | 197 | | 194 |
4% 8/1/20 (d) | | 495 | | 477 |
4% 8/1/20 (d) | | 6,000 | | 5,786 |
4.008% 12/1/34 (e) | | 1,054 | | 1,052 |
4.011% 1/1/35 (e) | | 130 | | 128 |
4.014% 12/1/34 (e) | | 151 | | 149 |
4.023% 2/1/35 (e) | | 144 | | 142 |
4.03% 1/1/35 (e) | | 281 | | 279 |
4.03% 1/1/35 (e) | | 72 | | 72 |
4.032% 12/1/34 (e) | | 110 | | 109 |
4.045% 5/1/34 (e) | | 51 | | 51 |
4.049% 2/1/35 (e) | | 135 | | 134 |
4.053% 10/1/18 (e) | | 155 | | 153 |
4.054% 1/1/35 (e) | | 135 | | 134 |
4.079% 4/1/33 (e) | | 55 | | 55 |
4.098% 1/1/35 (e) | | 318 | | 319 |
4.104% 2/1/35 (e) | | 93 | | 93 |
4.11% 2/1/35 (e) | | 93 | | 93 |
4.117% 2/1/35 (e) | | 276 | | 274 |
4.118% 1/1/35 (e) | | 295 | | 294 |
4.121% 2/1/35 (e) | | 549 | | 547 |
4.124% 1/1/35 (e) | | 309 | | 310 |
4.137% 1/1/35 (e) | | 517 | | 515 |
4.138% 2/1/35 (e) | | 339 | | 340 |
4.144% 1/1/35 (e) | | 425 | | 427 |
4.15% 11/1/34 (e) | | 251 | | 250 |
U.S. Government Agency - Mortgage Securities - continued |
| Principal
Amount (000s) | | Value (Note 1)
(000s) |
Fannie Mae - continued |
4.154% 2/1/35 (e) | | $ 257 | | $ 256 |
4.178% 1/1/35 (e) | | 567 | | 572 |
4.183% 1/1/35 (e) | | 248 | | 247 |
4.189% 11/1/34 (e) | | 87 | | 87 |
4.197% 1/1/35 (e) | | 300 | | 298 |
4.232% 3/1/34 (e) | | 131 | | 131 |
4.25% 2/1/35 (e) | | 144 | | 143 |
4.258% 10/1/34 (e) | | 407 | | 409 |
4.293% 3/1/35 (e) | | 140 | | 140 |
4.297% 7/1/34 (e) | | 153 | | 153 |
4.302% 1/1/35 (e) | | 190 | | 189 |
4.306% 8/1/33 (e) | | 320 | | 319 |
4.315% 3/1/33 (e) | | 78 | | 78 |
4.323% 5/1/35 (e) | | 226 | | 225 |
4.332% 12/1/34 (e) | | 116 | | 117 |
4.335% 2/1/35 (e) | | 91 | | 91 |
4.349% 1/1/35 (e) | | 160 | | 159 |
4.351% 1/1/35 (e) | | 141 | | 140 |
4.367% 2/1/34 (e) | | 387 | | 386 |
4.372% 4/1/35 (e) | | 95 | | 94 |
4.401% 2/1/35 (e) | | 239 | | 237 |
4.409% 5/1/35 (e) | | 441 | | 441 |
4.433% 11/1/34 (e) | | 2,641 | | 2,640 |
4.451% 6/1/33 (e) | | 123 | | 122 |
4.455% 3/1/35 (e) | | 221 | | 219 |
4.467% 10/1/34 (e) | | 900 | | 901 |
4.479% 4/1/34 (e) | | 261 | | 261 |
4.489% 8/1/34 (e) | | 516 | | 515 |
4.5% 8/1/20 (d) | | 17,000 | | 16,718 |
4.5% 3/1/35 (e) | | 485 | | 484 |
4.508% 1/1/35 (e) | | 261 | | 263 |
4.529% 3/1/35 (e) | | 439 | | 437 |
4.538% 8/1/34 (e) | | 338 | | 340 |
4.554% 7/1/35 (e) | | 525 | | 525 |
4.564% 2/1/35 (e) | | 1,063 | | 1,064 |
4.57% 2/1/35 (e) | | 169 | | 170 |
4.619% 2/1/35 (e) | | 475 | | 474 |
4.645% 2/1/35 (e) | | 128 | | 129 |
4.649% 11/1/34 (e) | | 552 | | 553 |
4.687% 11/1/34 (e) | | 545 | | 546 |
4.714% 3/1/35 (e) | | 1,383 | | 1,389 |
4.74% 7/1/34 (e) | | 477 | | 474 |
U.S. Government Agency - Mortgage Securities - continued |
| Principal
Amount (000s) | | Value (Note 1)
(000s) |
Fannie Mae - continued |
4.741% 3/1/35 (e) | | $ 260 | | $ 260 |
4.823% 12/1/34 (e) | | 416 | | 417 |
4.847% 12/1/34 (e) | | 158 | | 159 |
5.123% 2/1/35 (e) | | 1,412 | | 1,409 |
5.137% 5/1/35 (e) | | 187 | | 187 |
5.204% 6/1/35 (e) | | 743 | | 753 |
5.366% 12/1/32 (e) | | 230 | | 233 |
5.5% 1/1/09 to 3/1/20 | | 17,938 | | 18,309 |
5.817% 5/1/35 (e) | | 1,041 | | 1,052 |
6% 4/1/16 to 11/1/17 | | 2,301 | | 2,377 |
6.5% 2/1/17 to 3/1/35 | | 8,274 | | 8,576 |
6.5% 8/1/35 (d) | | 70 | | 72 |
7% 3/1/12 to 9/1/31 | | 810 | | 848 |
7% 8/1/20 (d) | | 8 | | 9 |
9% 2/1/13 | | 227 | | 242 |
9.5% 11/15/09 | | 319 | | 341 |
10.25% 10/1/09 to 10/1/18 | | 15 | | 16 |
11% 8/1/10 to 1/1/16 | | 637 | | 702 |
11.25% 5/1/14 to 1/1/16 | | 96 | | 106 |
11.5% 9/1/11 to 6/15/19 | | 369 | | 409 |
12.25% 7/1/12 to 9/1/13 | | 23 | | 25 |
12.5% 9/1/12 to 7/1/16 | | 344 | | 382 |
12.75% 10/1/11 to 6/1/15 | | 187 | | 211 |
13% 7/1/13 to 7/1/15 | | 140 | | 157 |
13.25% 9/1/11 | | 125 | | 142 |
13.5% 11/1/14 to 12/1/14 | | 18 | | 20 |
15% 4/1/12 | | 4 | | 5 |
| | 87,324 |
Freddie Mac - 2.0% |
4% 1/1/19 to 4/1/19 | | 2,470 | | 2,384 |
4.106% 12/1/34 (e) | | 175 | | 174 |
4.13% 12/1/34 (e) | | 240 | | 239 |
4.223% 1/1/35 (e) | | 817 | | 814 |
4.3% 5/1/35 (e) | | 386 | | 384 |
4.311% 12/1/34 (e) | | 237 | | 235 |
4.312% 3/1/35 (e) | | 226 | | 225 |
4.368% 3/1/35 (e) | | 320 | | 316 |
4.4% 2/1/35 (e) | | 438 | | 434 |
4.404% 2/1/35 (e) | | 490 | | 489 |
4.446% 3/1/35 (e) | | 196 | | 194 |
4.449% 2/1/34 (e) | | 251 | | 250 |
U.S. Government Agency - Mortgage Securities - continued |
| Principal
Amount (000s) | | Value (Note 1)
(000s) |
Freddie Mac - continued |
4.49% 3/1/35 (e) | | $ 583 | | $ 578 |
4.497% 6/1/35 (e) | | 295 | | 295 |
4.498% 3/1/35 (e) | | 1,455 | | 1,445 |
4.504% 3/1/35 (e) | | 245 | | 243 |
4.565% 2/1/35 (e) | | 355 | | 355 |
5% 8/1/35 (d) | | 2,826 | | 2,782 |
5.036% 4/1/35 (e) | | 1,266 | | 1,274 |
5.223% 8/1/33 (e) | | 121 | | 124 |
6.5% 5/1/08 | | 117 | | 120 |
8.5% 6/1/14 to 6/1/17 | | 171 | | 177 |
9% 11/1/09 to 8/1/16 | | 82 | | 86 |
9.5% 7/1/16 to 8/1/21 | | 557 | | 607 |
10% 7/1/09 to 3/1/21 | | 1,205 | | 1,314 |
10.5% 9/1/09 to 5/1/21 | | 129 | | 141 |
11% 2/1/11 to 9/1/20 | | 77 | | 86 |
11.25% 2/1/10 to 10/1/14 | | 146 | | 159 |
11.5% 10/1/15 to 8/1/19 | | 73 | | 80 |
11.75% 11/1/11 to 7/1/15 | | 16 | | 18 |
12% 10/1/09 to 11/1/19 | | 247 | | 272 |
12.25% 8/1/11 to 8/1/15 | | 151 | | 167 |
12.5% 10/1/09 to 6/1/19 | | 1,250 | | 1,386 |
12.75% 2/1/10 to 10/1/10 | | 12 | | 13 |
13% 9/1/10 to 5/1/17 | | 218 | | 243 |
13.25% 11/1/10 to 12/1/14 | | 48 | | 54 |
13.5% 11/1/10 to 8/1/11 | | 77 | | 86 |
14% 11/1/12 to 4/1/16 | | 8 | | 9 |
14.5% 12/1/10 | | 2 | | 2 |
14.75% 3/1/10 | | 3 | | 4 |
16.25% 7/1/11 | | 1 | | 1 |
| | 18,259 |
Government National Mortgage Association - 0.3% |
8% 9/15/06 to 12/15/23 | | 802 | | 859 |
8.5% 6/15/16 to 2/15/17 | | 13 | | 14 |
10.5% 9/15/15 to 10/15/21 | | 1,144 | | 1,288 |
10.75% 12/15/09 to 3/15/10 | | 21 | | 23 |
11% 7/20/15 to 1/20/21 | | 65 | | 71 |
12.5% 12/15/10 | | 2 | | 2 |
13% 1/15/11 to 3/15/14 | | 122 | | 137 |
13.25% 8/15/14 | | 11 | | 13 |
13.5% 6/15/10 to 12/15/14 | | 59 | | 67 |
U.S. Government Agency - Mortgage Securities - continued |
| Principal
Amount (000s) | | Value (Note 1)
(000s) |
Government National Mortgage Association - continued |
14% 6/15/11 | | $ 8 | | $ 9 |
17% 12/15/11 | | 2 | | 3 |
| | 2,486 |
TOTAL U.S. GOVERNMENT AGENCY - MORTGAGE SECURITIES (Cost $108,105) | 108,069 |
Collateralized Mortgage Obligations - 6.7% |
|
U.S. Government Agency - 6.7% |
Fannie Mae: | | | | |
floater: | | | | |
Series 1994-42 Class FK, 3.5% 4/25/24 (e) | | 5,654 | | 5,535 |
Series 2003-25 Class CF, 3.6644% 3/25/17 (e) | | 3,153 | | 3,163 |
planned amortization class: | | | | |
Series 1988-21 Class G, 9.5% 8/25/18 | | 140 | | 151 |
Series 1994-12 Class PH, 6.25% 1/25/09 | | 1,885 | | 1,925 |
Series 2003-39 Class PV, 5.5% 9/25/22 | | 1,905 | | 1,929 |
sequential pay Series 1993-238 Class C, 6.5% 12/25/08 | | 8,110 | | 8,260 |
Fannie Mae guaranteed REMIC pass thru certificates: | | | | |
floater Series 2002-74 Class FV, 3.7644% 11/25/32 (e) | | 6,109 | | 6,153 |
planned amortization class: | | | | |
Series 2002-11 Class QB, 5.5% 3/25/15 | | 831 | | 836 |
Series 2003-32 Class PB, 3% 6/25/16 | | 743 | | 739 |
sequential pay Series 2005-4 Class ED, 5% 6/25/27 | | 5,000 | | 5,031 |
Series 2002-50 Class LE, 7% 12/25/29 | | 253 | | 257 |
Series 2005-44 Class Z, 5% 8/25/34 | | 542 | | 531 |
Freddie Mac Multi-class participation certificates guaranteed: | | | | |
floater Series 2526 Class FC, 3.7881% 11/15/32 (e) | | 2,127 | | 2,138 |
planned amortization class: | | | | |
Series 1543 Class VK, 6.7% 1/15/23 | | 3,144 | | 3,177 |
Series 2802 Class OB, 6% 5/15/34 | | 1,355 | | 1,421 |
Series 2810 Class PD, 6% 6/15/33 | | 1,020 | | 1,051 |
Series 2828 Class JA, 4.5% 1/15/10 | | 1,900 | | 1,904 |
sequential pay: | | | | |
Series 1929 Class EZ, 7.5% 2/17/27 | | 4,173 | | 4,364 |
Series 2866 Class N, 4.5% 12/15/18 | | 1,340 | | 1,322 |
Collateralized Mortgage Obligations - continued |
| Principal
Amount (000s) | | Value (Note 1)
(000s) |
U.S. Government Agency - continued |
Freddie Mac Multi-class participation certificates guaranteed: - continued | | | | |
Series 2406: | | | | |
Class FP, 4.3681% 1/15/32 (e) | | $ 1,385 | | $ 1,416 |
Class PF, 4.3681% 12/15/31 (e) | | 1,095 | | 1,124 |
Series 2410 Class PF, 4.3681% 2/15/32 (e) | | 2,515 | | 2,572 |
Series 2769 Class BU, 5% 3/15/34 | | 1,571 | | 1,549 |
Series 2996 Class ZB, 5.75% 6/15/35 | | 241 | | 240 |
3% 3/15/10 | | 1,745 | | 1,729 |
Ginnie Mae guaranteed REMIC pass thru securities planned amortization class Series 2001-53 Class TA, 6% 12/20/30 | | 173 | | 173 |
TOTAL COLLATERALIZED MORTGAGE OBLIGATIONS (Cost $59,380) | 58,690 |
Cash Equivalents - 0.4% |
| | Maturity
Amount (000s) | | |
Investments in repurchase agreements (Collateralized by U.S. Government Obligations, in a joint trading account at 3.32%, dated 7/29/05 due 8/1/05) (a)
(Cost $3,827) | | $ 3,828 | | 3,827 |
TOTAL INVESTMENT PORTFOLIO - 103.1% (Cost $915,609) | | | 911,352 |
NET OTHER ASSETS - (3.1)% | | | (27,395) |
NET ASSETS - 100% | | $ 883,957 |
Legend |
(a) Includes investment made with cash collateral received from securities on loan. |
(b) Security or a portion of the security is on loan at period end. |
(c) Security exempt from registration under Rule 144A of the Securities Act of 1933. These securities may be resold in transactions exempt from registration, normally to qualified institutional buyers. At the period end, the value of these securities amounted to $9,518,000 or 1.1% of net assets. |
(d) Security or a portion of the security purchased on a delayed delivery or when-issued basis. |
(e) The coupon rate shown on floating or adjustable rate securities represents the rate at period end. |
Income Tax Information |
At July 31, 2005, the fund had a capital loss carryforward of approximately $23,098,000 of which $11,911,000, $7,507,000, $3,266,000 and $414,000 will expire on July 31, 2008, 2009, 2012 and 2013, respectively. |
See accompanying notes which are an integral part of the financial statements.
Annual Report
Fidelity Intermediate Government Income Fund
Financial Statements
Statement of Assets and Liabilities
Amounts in thousands (except per-share amount) | July 31, 2005 |
| | |
Assets | | |
Investment in securities, at value (including securities loaned of $3,671 and repurchase agreements of $3,827)(cost $915,609) - See accompanying schedule | | $ 911,352 |
Receivable for investments sold | | 1,936 |
Receivable for fund shares sold | | 243 |
Interest receivable | | 9,086 |
Total assets | | 922,617 |
| | |
Liabilities | | |
Payable for investments purchased
Regular delivery | $ 7,435 | |
Delayed delivery | 26,019 | |
Payable for fund shares redeemed | 729 | |
Distributions payable | 354 | |
Accrued management fee | 240 | |
Other affiliated payables | 98 | |
Other payables and accrued expenses | 40 | |
Collateral on securities loaned, at value | 3,745 | |
Total liabilities | | 38,660 |
| | |
Net Assets | | $ 883,957 |
Net Assets consist of: | | |
Paid in capital | | $ 914,473 |
Undistributed net investment income | | 1,945 |
Accumulated undistributed net realized gain (loss) on investments | | (28,204) |
Net unrealized appreciation (depreciation) on investments | | (4,257) |
Net Assets, for 87,459 shares outstanding | | $ 883,957 |
Net Asset Value, offering price and redemption price per share ($883,957 ÷ 87,459 shares) | | $ 10.11 |
See accompanying notes which are an integral part of the financial statements.
Annual Report
Statement of Operations
Amounts in thousands | Year ended July 31, 2005 |
| | |
Investment Income | | |
Interest | | $ 35,335 |
Security lending | | 44 |
Total income | | 35,379 |
| | |
Expenses | | |
Management fee | $ 3,806 | |
Transfer agent fees | 1,140 | |
Accounting and security lending fees | 161 | |
Fund wide operations fee | 39 | |
Independent trustees' compensation | 5 | |
Custodian fees and expenses | 43 | |
Registration fees | 27 | |
Audit | 53 | |
Legal | 3 | |
Miscellaneous | 3 | |
Total expenses before reductions | 5,280 | |
Expense reductions | (3) | 5,277 |
Net investment income | | 30,102 |
Realized and Unrealized Gain (Loss) Net realized gain (loss) on: | | |
Investment securities | (3,426) | |
Swap agreements | (79) | |
Total net realized gain (loss) | | (3,505) |
Change in net unrealized appreciation (depreciation) on investment securities | | (4,183) |
Net gain (loss) | | (7,688) |
Net increase (decrease) in net assets resulting from operations | | $ 22,414 |
See accompanying notes which are an integral part of the financial statements.
Annual Report
Fidelity Intermediate Government Income Fund
Financial Statements - continued
Statement of Changes in Net Assets
Amounts in thousands | Year ended
July 31,
2005 | Year ended
July 31,
2004 |
Increase (Decrease) in Net Assets | | |
Operations | | |
Net investment income | $ 30,102 | $ 29,283 |
Net realized gain (loss) | (3,505) | (4,178) |
Change in net unrealized appreciation (depreciation) | (4,183) | 7,091 |
Net increase (decrease) in net assets resulting
from operations | 22,414 | 32,196 |
Distributions to shareholders from net investment income | (28,832) | (29,700) |
Share transactions
Proceeds from sales of shares | 92,102 | 161,283 |
Reinvestment of distributions | 24,669 | 25,722 |
Cost of shares redeemed | (189,450) | (509,767) |
Net increase (decrease) in net assets resulting from share transactions | (72,679) | (322,762) |
Total increase (decrease) in net assets | (79,097) | (320,266) |
| | |
Net Assets | | |
Beginning of period | 963,054 | 1,283,320 |
End of period (including undistributed net investment income of $1,945 and undistributed net investment income of $746, respectively) | $ 883,957 | $ 963,054 |
Other Information Shares | | |
Sold | 9,010 | 15,687 |
Issued in reinvestment of distributions | 2,416 | 2,506 |
Redeemed | (18,557) | (49,761) |
Net increase (decrease) | (7,131) | (31,568) |
See accompanying notes which are an integral part of the financial statements.
Annual Report
Financial Highlights
Years ended July 31, | 2005 | 2004 | 2003 | 2002 | 2001 |
Selected Per-Share Data | | | | | |
Net asset value,
beginning of period | $ 10.18 | $ 10.17 | $ 10.11 | $ 9.77 | $ 9.32 |
Income from Investment Operations | | | | | |
Net investment income B | .330 | .274 | .329 | .457 D | .607 |
Net realized and unrealized gain (loss) | (.084) | .014 | .056 | .353 D | .452 |
Total from investment operations | .246 | .288 | .385 | .810 | 1.059 |
Distributions from net investment income | (.316) | (.278) | (.325) | (.470) | (.609) |
Net asset value,
end of period | $ 10.11 | $ 10.18 | $ 10.17 | $ 10.11 | $ 9.77 |
Total Return A | 2.43% | 2.84% | 3.80% | 8.51% | 11.68% |
Ratios to Average Net Assets C | | | | |
Expenses before expense reductions | .57% | .60% | .60% | .59% | .64% |
Expenses net of voluntary waivers, if any | .57% | .60% | .60% | .59% | .61% |
Expenses net of all reductions | .57% | .60% | .60% | .59% | .60% |
Net investment income | 3.23% | 2.67% | 3.18% | 4.63% D | 6.34% |
Supplemental Data | | | | | |
Net assets, end of period (in millions) | $ 884 | $ 963 | $ 1,283 | $ 1,107 | $ 844 |
Portfolio turnover rate | 90% | 152% | 229% | 145% | 114% |
A Total returns would have been lower had certain expenses not been reduced during the periods shown.
B Calculated based on average shares outstanding during the period.
C Expense ratios reflect operating expenses of the fund. Expenses before reductions do not reflect amounts reimbursed by the investment adviser or reductions from brokerage service arrangements or other expense offset arrangements and do not represent the amount paid by the fund during periods when reimbursements or reductions occur. Expenses net of any voluntary waivers reflect expenses after reimbursement by the investment adviser but prior to reductions from brokerage service arrangements or other expense offset arrangements. Expenses net of all reductions represent the net expenses paid by the fund.
D Effective August 1, 2001, the fund adopted the provisions of the AICPA Audit and Accounting Guide for Investment Companies and began amortizing premium and discount on all debt securities. Per-share data and ratios for periods prior to adoption have not been restated to reflect this change.
See accompanying notes which are an integral part of the financial statements.
Annual Report
Notes to Financial Statements
For the period ended July 31, 2005
(Amounts in thousands except ratios)
1. Significant Accounting Policies.
Fidelity Ginnie Mae Fund, Fidelity Government Income Fund and Fidelity Intermediate Government Income Fund (the funds) are funds of Fidelity Income Fund (the trust). The trust is registered under the Investment Company Act of 1940, as amended (the 1940 Act), as an open-end management investment company organized as a Massachusetts business trust. Each fund is authorized to issue an unlimited number of shares. The financial statements have been prepared in conformity with accounting principles generally accepted in the United States of America, which require management to make certain estimates and assumptions at the date of the financial statements. The following summarizes the significant accounting policies of the funds:
Security Valuation. Net asset value per share (NAV calculation) is calculated as of the close of business of the New York Stock Exchange, normally 4:00 p.m. Eastern time. Debt securities, including restricted securities, are valued on the basis of information provided by a pricing service. Pricing services use valuation matrices that incorporate both dealer-supplied valuations and valuation models. If prices are not readily available or do not accurately reflect fair value for a security, or if a security's value has been materially affected by events occurring after the close of the exchange or market on which the security is principally traded, that security may be valued by another method that the Board of Trustees believes accurately reflects fair value. A security's valuation may differ depending on the method used for determining value. Price movements in futures contracts and ADRs, market and trading trends, the bid/ask quotes of brokers and off-exchange institutional trading may be reviewed in the course of making a good faith determination of a security's fair value. Short-term securities with remaining maturities of sixty days or less for which quotations are not readily available are valued on the basis of amortized cost. Investments in open-end investment companies are valued at their net asset value each business day.
Investment Transactions and Income. Security transactions are accounted for as of trade date. Gains and losses on securities sold are determined on the basis of identified cost. Interest income is accrued as earned. Interest income includes coupon interest and amortization of premium and accretion of discount on debt securities.
Expenses. Most expenses of the trust can be directly attributed to a fund. Expenses which cannot be directly attributed are apportioned among each fund in the trust.
Deferred Trustee Compensation. Under a Deferred Compensation Plan (the Plan) for Fidelity Ginnie Mae Fund, independent Trustees must defer receipt of a portion of, and may elect to defer receipt of an additional portion of, their annual compensation. Deferred amounts are treated as though equivalent dollar amounts had been invested in shares of each applicable fund or are invested in a cross-section of other Fidelity funds, and are marked-to-market. Deferred amounts remain in the fund until distributed in accordance with the Plan.
Annual Report
1. Significant Accounting Policies - continued
Income Tax Information and Distributions to Shareholders. Each year, each fund intends to qualify as a regulated investment company by distributing all of its taxable income and realized gains under Subchapter M of the Internal Revenue Code. As a result, no provision for income taxes is required in the accompanying financial statements.
Dividends are declared daily and paid monthly from net investment income. Distributions from realized gains, if any, are recorded on the ex-dividend date. Income and capital gain distributions are determined in accordance with income tax regulations, which may differ from generally accepted accounting principles. In addition, certain funds will claim a portion of the payment made to redeeming shareholders as a distribution for income tax purposes.
Capital accounts within the financial statements are adjusted for permanent book-tax differences. These adjustments have no impact on net assets or the results of operations. Temporary book-tax differences will reverse in a subsequent period.
Book-tax differences are primarily due to swap agreements, prior period premium and discount on debt securities, market discount, deferred trustees compensation, financing transactions, capital loss carryforwards, expiring capital loss carryforwards and losses deferred due to wash sales and excise tax regulations.
The tax-basis components of distributable earnings and the federal tax cost as of period end were as follows for each fund:
| Cost for Federal
Income Tax
Purposes | Unrealized
Appreciation | Unrealized
Depreciation | Net Unrealized
Appreciation/
(Depreciation) |
Ginnie Mae Fund | $ 4,677,132 | $ 22,207 | $ (58,171) | $ (35,964) |
Government Income Fund | 5,500,197 | 51,519 | (38,017) | 13,502 |
Intermediate Government Income Fund | 914,950 | 3,750 | (7,348) | (3,598) |
| Undistributed
Ordinary
Income | Undistributed
Long-term
Capital Gain | Capital Loss
Carryforward |
Ginnie Mae Fund | $ 20,282 | $ 6,708 | $ - |
Government Income Fund | 6,274 | - | - |
Intermediate Government Income Fund | 825 | - | (23,098) |
Annual Report
Notes to Financial Statements - continued
(Amounts in thousands except ratios)
1. Significant Accounting Policies - continued
Income Tax Information and Distributions to Shareholders - continued
The tax character of distributions paid was as follows:
July 31, 2005 | Ordinary
Income | Long-term
Capital Gains | Total |
Ginnie Mae Fund | $ 162,997 | $ - | $ 162,997 |
Government Income Fund | 157,882 | 2,080 | 159,962 |
Intermediate Government Income Fund | 28,832 | - | 28,832 |
July 31, 2004 | Ordinary
Income | Long-term
Capital Gains | Total |
Ginnie Mae Fund | $ 183,260 | $ 9,263 | $ 192,523 |
Government Income Fund | 156,624 | 16,237 | 172,861 |
Intermediate Government Income Fund | 29,700 | - | 29,700 |
2. Operating Policies.
Repurchase Agreements. Fidelity Management & Research Company (FMR) has received an Exemptive Order from the Securities and Exchange Commission (the SEC) which permits certain funds and other affiliated entities of FMR to transfer uninvested cash balances into joint trading accounts which are then invested in repurchase agreements. Certain funds may also invest directly with institutions in repurchase agreements. Repurchase agreements are collateralized by government or non-government securities. Collateral is held in segregated accounts with custodian banks and may be obtained in the event of a default of the counterparty. Each applicable fund monitors, on a daily basis, the value of the collateral to ensure it is at least equal to the principal amount of the repurchase agreement (including accrued interest). In the event of a default by the counterparty, realization of the collateral proceeds could be delayed, during which time the value of the collateral may decline.
Delayed Delivery Transactions and When-Issued Securities. Certain funds may purchase or sell securities on a delayed delivery or when-issued basis. Payment and delivery may take place after the customary settlement period for that security. The price of the underlying securities and the date when the securities will be delivered and paid for are fixed at the time the transaction is negotiated. During the time a delayed delivery sell is outstanding, the contract is marked-to-market daily and equivalent deliverable securities are held for the transaction. The value of the securities purchased on a delayed delivery or when-issued basis are identified as such in each applicable fund's Schedule of Investments. Certain funds may receive compensation for interest forgone in the purchase of a delayed delivery or when-issued security. With respect to purchase commitments, each applicable fund identifies securities as segregated in its records
Annual Report
2. Operating Policies - continued
Delayed Delivery Transactions and When-Issued Securities - continued
with a value at least equal to the amount of the commitment. Losses may arise due to changes in the value of the underlying securities or if the counterparty does not perform under the contract's terms, or if the issuer does not issue the securities due to political, economic, or other factors.
Restricted Securities. Certain funds may invest in securities that are subject to legal or contractual restrictions on resale. These securities generally may be resold in transactions exempt from registration or to the public if the securities are registered. Disposal of these securities may involve time-consuming negotiations and expense, and prompt sale at an acceptable price may be difficult. Information regarding restricted securities is included at the end of each applicable fund's Schedule of Investments.
Swap Agreements. Certain funds may invest in swaps for the purpose of managing their exposure to interest rate, credit or market risk.
Interest rate swaps are agreements to exchange cash flows periodically based on a notional principal amount, for example, the exchange of fixed rate interest payments for floating rate interest payments. Periodic payments received or made by each applicable fund are recorded in the accompanying Statement of Operations as realized gains or losses, respectively. The primary risk associated with interest rate swaps is that unfavorable changes in the fluctuation of interest rates could adversely impact a fund.
Total return swaps are agreements to exchange the return generated by one instrument or index for the return generated by another instrument, for example, the agreement to pay interest in exchange for a market-linked return based on a notional amount. To the extent the total return of the index exceeds the offsetting interest obligation a fund will receive a payment from the counterparty. To the extent it is less, a fund will make a payment to the counterparty. Periodic payments received or made by each applicable fund are recorded in the accompanying Statement of Operations as realized gains or losses, respectively.
Swaps are marked-to-market daily based on dealer-supplied valuations and changes in value are recorded as unrealized appreciation (depreciation). Gains or losses are realized upon early termination of the swap agreement. Collateral, in the form of cash or securities, may be required to be held in segregated accounts with a fund's custodian in compliance with swap contracts.
Mortgage Dollar Rolls. To earn additional income, certain funds may employ trading strategies which involve the sale and simultaneous agreement to repurchase similar securities ("mortgage dollar rolls") or the purchase and simultaneous agreement to sell similar securities ("reverse mortgage dollar rolls"). The securities traded are mortgage
Annual Report
Notes to Financial Statements - continued
(Amounts in thousands except ratios)
2. Operating Policies - continued
Mortgage Dollar Rolls - continued
securities and bear the same interest rate but may be collateralized by different pools of mortgages. During the period between the sale and repurchase in a mortgage dollar roll transaction, a fund will not be entitled to receive interest and principal payments on the securities sold but will invest the proceeds of the sale in other securities which may enhance the yield and total return. In addition, the difference between the sale price and the future purchase price is recorded as an adjustment to investment income. During the period between the purchase and subsequent sale in a reverse mortgage dollar roll transaction a fund is entitled to interest and principal payments on the securities purchased. The price differential between the purchase and sale is recorded as an adjustment to investment income. Losses may arise due to changes in the value of the securities or if the counterparty does not perform under the terms of the agreement. If the counterparty files for bankruptcy or becomes insolvent, a fund's right to repurchase or sell securities may be limited.
3. Fees and Other Transactions with Affiliates.
Management Fee. FMR and its affiliates provide the funds with investment management related services for which the funds pay a monthly management fee. The management fee is the sum of an individual fund fee rate that is based on an annual rate of .30% of each fund's average net assets (effective June 1, 2005, the funds management contracts were amended, reducing the individual fund fee rate to .20% of average net assets) and a group fee rate that averaged .12% during the period. The individual fund fee rate is applied to each fund's average net assets. The group fee rate is based upon the average net assets of all the mutual funds advised by FMR. The group fee rate decreases as assets under management increase and increases as assets under management decrease. For the period, each fund's annual management fee rate expressed as a percentage of each fund's average net assets was as follows:
| Total |
Ginnie Mae Fund | .41% |
Government Income Fund | .41% |
Intermediate Government Income Fund | .41% |
Transfer Agent Fees. Fidelity Service Company, Inc. (FSC), an affiliate of FMR, is the funds' transfer, dividend disbursing and shareholder servicing agent. FSC receives account fees and asset-based fees that vary according to account size and type of account. FSC pays for typesetting, printing and mailing of shareholder reports, except proxy statements. Under an amended contract effective June 1, 2005, transfer agent fees include an asset based fee and were reduced to a rate of .10% of average net assets. The
Annual Report
3. Fees and Other Transactions with Affiliates - continued
Transfer Agent Fees - continued
account fees were eliminated. For the period, the transfer agent fees were equivalent to the following annual rates expressed as a percentage of average net assets:
Ginnie Mae Fund | .12% | | |
Government Income Fund | .15% | |
Intermediate Government Income Fund | .12% | |
Accounting and Security Lending Fees. FSC maintains each fund's accounting records. The accounting fee is based on the level of average net assets for the month. Under a separate contract, FSC administers the security lending program. The security lending fee is based on the number and duration of lending transactions. Effective June 1, 2005, FMR pays these fees.
Fundwide Operations Fee. Pursuant to a new Fundwide Operations and Expense Agreement (FWOE) effective on June 1, 2005, FMR has agreed to provide for fund level expenses (which do not include transfer agent, Rule 12b-1 fees, the compensation of the independent trustees or other extraordinary expenses) in return for a FWOE fee equal to .35% less the total amount of the management fee. The FWOE paid by the fund is reduced by an amount equal to the fees and expenses paid to the independent trustees. For the period, the FWOE fees were equivalent to the following rates expressed as a percentage of average net assets:
Ginnie Mae Fund | .004% |
Government Income Fund | .005% |
Intermediate Government Income Fund | .004% |
4. Committed Line of Credit.
Certain funds participate with other funds managed by FMR in a $4.2 billion credit facility (the "line of credit") to be utilized for temporary or emergency purposes to fund shareholder redemptions or for other short-term liquidity purposes. The participating funds have agreed to pay commitment fees on their pro rata portion of the line of credit. During the period, there were no borrowings on this line of credit.
5. Security Lending.
Certain funds lend portfolio securities from time to time in order to earn additional income. Each applicable fund receives collateral (in the form of U.S. Treasury obligations, letters of credit and/or cash) against the loaned securities and maintains collateral in an amount not less than 100% of the market value of the loaned securities during the period of the loan. The market value of the loaned securities is determined at the close of business of the funds and any additional required collateral is delivered to the funds on
Annual Report
Notes to Financial Statements - continued
(Amounts in thousands except ratios)
5. Security Lending - continued
the next business day. If the borrower defaults on its obligation to return the securities loaned because of insolvency or other reasons, a fund could experience delays and costs in recovering the securities loaned or in gaining access to the collateral. Cash collateral is invested in cash equivalents. The value of loaned securities and cash collateral at period end are disclosed on each applicable fund's Statement of Assets and Liabilities.
6. Expense Reductions.
Through arrangements with each applicable fund's custodian and transfer agent, credits realized as a result of uninvested cash balances were used to reduce each applicable fund's expenses. All of the applicable expense reductions are noted in the table below.
| Custody
expense
reduction | Transfer
Agent
expense
reduction |
Ginnie Mae Fund | $ - | $ 23 |
Government Income Fund | 4 | 161 |
Intermediate Government Income Fund | 1 | 2 |
7. Other.
The funds' organizational documents provide former and current trustees and officers with a limited indemnification against liabilities arising in connection with the performance of their duties to the funds. In the normal course of business, the funds may also enter into contracts that provide general indemnifications. The funds' maximum exposure under these arrangements is unknown as this would be dependent on future claims that may be made against the funds. The risk of material loss from such claims is considered remote.
At the end of the period, Fidelity Freedom 2010 and Fidelity Freedom 2020 were the owners of record of approximately 25% and 17%, respectively, of the total outstanding shares of the Fidelity Government Income Fund. The Fidelity Freedom Funds were the owners of record, in the aggregate, of approximately 63% of the total outstanding shares of Fidelity Government Income Fund.
Annual Report
Report of Independent Registered Public Accounting Firm
To the Trustees of Fidelity Income Fund and the Shareholders of Fidelity Ginnie Mae Fund, Fidelity Government Income Fund and Fidelity Intermediate Government Income Fund:
In our opinion, the accompanying statements of assets and liabilities, including the schedules of investments, and the related statements of operations and of changes in net assets and the financial highlights present fairly, in all material respects, the financial position of Fidelity Ginnie Mae Fund, Fidelity Government Income Fund and Fidelity Intermediate Government Income Fund (funds of Fidelity Income Fund) at July 31, 2005, and the results of their operations, the changes in their net assets and the financial highlights for the periods indicated, in conformity with accounting principles generally accepted in the United States of America. These financial statements and financial highlights (hereafter referred to as "financial statements") are the responsibility of the Fidelity Income Fund's management; our responsibility is to express an opinion on these financial statements based on our audits. We conducted our audits of these financial statements in accordance with the standards of the Public Company Accounting Oversight Board (United States). Those standards require that we plan and perform the audit to obtain reasonable assurance about whether the financial statements are free of material misstatement. An audit includes examining, on a test basis, evidence supporting the amounts and disclosures in the financial statements, assessing the accounting principles used and significant estimates made by management, and evaluating the overall financial statement presentation. We believe that our audits, which included confirmation of securities at July 31, 2005 by correspondence with the custodian and brokers, provide a reasonable basis for our opinion.
/s/ PricewaterhouseCoopers LLP
PricewaterhouseCoopers LLP
Boston, Massachusetts
September 20, 2005
Annual Report
Trustees and Officers
The Trustees, Members of the Advisory Board, and executive officers of the trust and funds, as applicable, are listed below. The Board of Trustees governs each fund and is responsible for protecting the interests of shareholders. The Trustees are experienced executives who meet periodically throughout the year to oversee each fund's activities, review contractual arrangements with companies that provide services to each fund, and review each fund's performance. Except for William O. McCoy, Stephen P. Jonas, and Kenneth L. Wolfe, each of the Trustees oversees 320 funds advised by FMR or an affiliate. Mr. McCoy oversees 322 funds advised by FMR or an affiliate. Mr. Jonas and Mr. Wolfe oversee 311 funds advised by FMR or an affiliate.
The Trustees hold office without limit in time except that (a) any Trustee may resign; (b) any Trustee may be removed by written instrument, signed by at least two-thirds of the number of Trustees prior to such removal; (c) any Trustee who requests to be retired or who has become incapacitated by illness or injury may be retired by written instrument signed by a majority of the other Trustees; and (d) any Trustee may be removed at any special meeting of shareholders by a two-thirds vote of the outstanding voting securities of the trust. Each Trustee who is not an interested person (as defined in the 1940 Act) (Independent Trustee), shall retire not later than the last day of the calendar year in which his or her 72nd birthday occurs. The Independent Trustees may waive this mandatory retirement age policy with respect to individual Trustees. The executive officers and Advisory Board Members hold office without limit in time, except that any officer and Advisory Board Member may resign or may be removed by a vote of a majority of the Trustees at any regular meeting or any special meeting of the Trustees. Except as indicated, each individual has held the office shown or other offices in the same company for the past five years.
The funds' Statement of Additional Information (SAI) includes more information about the Trustees. To request a free copy, call Fidelity at 1-800-544-8544.
Interested Trustees*:
Correspondence intended for each Trustee who is an interested person may be sent to Fidelity Investments, 82 Devonshire Street, Boston, Massachusetts 02109.
Name, Age; Principal Occupation |
Edward C. Johnson 3d (75)** |
| Year of Election or Appointment: 1984 Mr. Johnson is Chairman of the Board of Trustees. Mr. Johnson serves as Chief Executive Officer, Chairman, and a Director of FMR Corp.; a Director and Chairman of the Board and of the Executive Committee of FMR; Chairman and a Director of Fidelity Management & Research (Far East) Inc.; Chairman and a Director of Fidelity Investments Money Management, Inc.; and Chairman (2001-present) and a Director (2000-present) of FMR Co., Inc. |
Abigail P. Johnson (43)** |
| Year of Election or Appointment: 2001 Senior Vice President of Ginnie Mae (2001-present), Government Income (2001-present), and Intermediate Government Income (2001-present). Ms. Johnson also serves as Senior Vice President of other Fidelity funds (2001-present). She is President and a Director of FMR (2001-present), Fidelity Investments Money Management, Inc. (2001-present), FMR Co., Inc. (2001-present), and a Director of FMR Corp. Previously, Ms. Johnson managed a number of Fidelity funds. |
Stephen P. Jonas (52) |
| Year of Election or Appointment: 2005 Mr. Jonas is Senior Vice President of Ginnie Mae (2005-present), Government Income (2005-present), and Intermediate Government Income (2005-present). He also serves as Senior Vice President of other Fidelity funds (2005-present). Mr. Jonas is Executive Director of FMR (2005-present). Previously, Mr. Jonas served as President of Fidelity Enterprise Operations and Risk Services (2004-2005), Chief Administrative Officer (2002-2004), and Chief Financial Officer of FMR Co. (1998-2000). In addition, he serves on the Boards of Boston Ballet (2003-present) and Simmons College (2003-present). |
Robert L. Reynolds (53) |
| Year of Election or Appointment: 2003 Mr. Reynolds is a Director (2003-present) and Chief Operating Officer (2002-present) of FMR Corp. He also serves on the Board at Fidelity Investments Canada, Ltd. (2000-present). Previously, Mr. Reynolds served as President of Fidelity Investments Institutional Retirement Group (1996-2000). |
* Trustees have been determined to be "Interested Trustees" by virtue of, among other things, their affiliation with the trust or various entities under common control with FMR.
** Edward C. Johnson 3d, Trustee, is Abigail P. Johnson's father.
Annual Report
Independent Trustees:
Correspondence intended for each Independent Trustee (that is, the Trustees other than the Interested Trustees) may be sent to Fidelity Investments, P.O. Box 55235, Boston, Massachusetts 02205-5235.
Name, Age; Principal Occupation |
Dennis J. Dirks (57) |
| Year of Election or Appointment: 2005 Prior to his retirement in May 2003, Mr. Dirks was Chief Operating Officer and a member of the Board of The Depository Trust & Clearing Corporation (DTCC) (1999-2003). He also served as President, Chief Operating Officer, and Board member of The Depository Trust Company (DTC) (1999-2003) and President and Board member of the National Securities Clearing Corporation (NSCC) (1999-2003). In addition, Mr. Dirks served as Chief Executive Officer and Board member of the Government Securities Clearing Corporation (2001-2003) and Chief Executive Officer and Board member of the Mortgage-Backed Securities Clearing Corporation (2001-2003). Mr. Dirks also serves as a Trustee of Manhattan College (2005-present). |
Robert M. Gates (61) |
| Year of Election or Appointment: 1997 Dr. Gates is Vice Chairman of the Independent Trustees (2005-present). Dr. Gates is President of Texas A&M University (2002-present). He was Director of the Central Intelligence Agency (CIA) from 1991 to 1993. From 1989 to 1991, Dr. Gates served as Assistant to the President of the United States and Deputy National Security Advisor. Dr. Gates is a Director of NACCO Industries, Inc. (mining and manufacturing), Parker Drilling Co., Inc. (drilling and rental tools for the energy industry, 2001-present), and Brinker International (restaurant management, 2003-present). Previously, Dr. Gates served as a Director of LucasVarity PLC (automotive components and diesel engines), a Director of TRW Inc. (automotive, space, defense, and information technology), and Dean of the George Bush School of Government and Public Service at Texas A&M University (1999-2001). Dr. Gates also is a Trustee of the Forum for International Policy. |
George H. Heilmeier (69) |
| Year of Election or Appointment: 2004 Dr. Heilmeier is Chairman Emeritus of Telcordia Technologies (communication software and systems), where prior to his retirement, he served as company Chairman and Chief Executive Officer. He currently serves on the Boards of Directors of The Mitre Corporation (systems engineering and information technology support for the government), and HRL Laboratories (private research and development, 2004-present). He is Chairman of the General Motors Science & Technology Advisory Board and a Life Fellow of the Institute of Electrical and Electronics Engineers (IEEE) (2000-present). Dr. Heilmeier is a member of the Defense Science Board and the National Security Agency Advisory Board. He is also a member of the National Academy of Engineering, the American Academy of Arts and Sciences, and the Board of Overseers of the School of Engineering and Applied Science of the University of Pennsylvania. Previously, Dr. Heilmeier served as a Director of TRW Inc. (automotive, space, defense, and information technology, 1992-2002), Compaq (1994-2002), Automatic Data Processing, Inc. (ADP) (technology-based business outsourcing, 1995-2002), INET Technologies Inc. (telecommunications network surveillance, 2001-2004), and Teletech Holdings (customer management services). He is the recipient of the 2005 Kyoto Prize in Advanced Technology for his invention of the liquid display. |
Marie L. Knowles (58) |
| Year of Election or Appointment: 2001 Prior to Ms. Knowles' retirement in June 2000, she served as Executive Vice President and Chief Financial Officer of Atlantic Richfield Company (ARCO) (diversified energy, 1996-2000). From 1993 to 1996, she was a Senior Vice President of ARCO and President of ARCO Transportation Company. She served as a Director of ARCO from 1996 to 1998. She currently serves as a Director of Phelps Dodge Corporation (copper mining and manufacturing) and McKesson Corporation (healthcare service, 2002-present). Ms. Knowles is a Trustee of the Brookings Institution and the Catalina Island Conservancy and also serves as a member of the Advisory Board for the School of Engineering of the University of Southern California. |
Ned C. Lautenbach (61) |
| Year of Election or Appointment: 2000 Mr. Lautenbach has been a partner of Clayton, Dubilier & Rice, Inc. (private equity investment firm) since September 1998. Previously, Mr. Lautenbach was with the International Business Machines Corporation (IBM) from 1968 until his retirement in 1998. Mr. Lautenbach serves as a Director of Italtel Holding S.p.A. (telecommunications (Milan, Italy), 2004-present) and Eaton Corporation (diversified industrial) as well as the Philharmonic Center for the Arts in Naples, Florida. He also is a member of the Board of Trustees of Fairfield University (2005-present), as well as a member of the Council on Foreign Relations. |
Marvin L. Mann (72) |
| Year of Election or Appointment: 1993 Mr. Mann is Chairman of the Independent Trustees (2001-present). He is Chairman Emeritus of Lexmark International, Inc. (computer peripherals), where he served as CEO until April 1998, retired as Chairman May 1999, and remains a member of the Board. Prior to 1991, he held the positions of Vice President of International Business Machines Corporation (IBM) and President and General Manager of various IBM divisions and subsidiaries. He is a member of the Executive Committee of the Independent Director's Council of the Investment Company Institute. In addition, Mr. Mann is a member of the President's Cabinet at the University of Alabama and the Board of Visitors of the Culverhouse College of Commerce and Business Administration at the University of Alabama. |
William O. McCoy (71) |
| Year of Election or Appointment: 1997 Prior to his retirement in December 1994, Mr. McCoy was Vice Chairman of the Board of BellSouth Corporation (telecommunications) and President of BellSouth Enterprises. He is currently a Director of Liberty Corporation (holding company), Duke Realty Corporation (real estate), and Progress Energy, Inc. (electric utility). He is also a partner of Franklin Street Partners (private investment management firm) and a member of the Research Triangle Foundation Board. In addition, Mr. McCoy served as the Interim Chancellor (1999-2000) and a member of the Board of Visitors for the University of North Carolina at Chapel Hill and currently serves on the Board of Directors of the University of North Carolina Health Care System and the Board of Visitors of the Kenan-Flagler Business School (University of North Carolina at Chapel Hill). He also served as Vice President of Finance for the University of North Carolina (16-school system). |
Cornelia M. Small (61) |
| Year of Election or Appointment: 2005 Ms. Small is a member (2000-present) and Chairperson (2002-present) of the Investment Committee, and a member (2002-present) of the Board of Trustees of Smith College. Previously, she served as Chief Investment Officer (1999-2000), Director of Global Equity Investments (1996-1999), and a member of the Board of Directors of Scudder, Stevens & Clark (1990-1997) and Scudder Kemper Investments (1997-1998). In addition, Ms. Small served as Co-Chair (2000-2003) of the Annual Fund for the Fletcher School of Law and Diplomacy. |
William S. Stavropoulos (66) |
| Year of Election or Appointment: 2001 Mr. Stavropoulos is Chairman of the Board (2000-present) and a Member of the Board of Directors of The Dow Chemical Company. Since joining The Dow Chemical Company in 1967, Mr. Stavropoulos served in numerous senior management positions, including President (1993-2000; 2002-2003), CEO (1995-2000; 2002-2004), and Chairman of the Executive Committee (2000-2004). Currently, he is a Director of NCR Corporation (data warehousing and technology solutions), BellSouth Corporation (telecommunications), Chemical Financial Corporation, Maersk Inc. (industrial conglomerate, 2002-present), and Metalmark Capital (private equity investment firm, 2005-present). He also serves as a member of the Board of Trustees of the American Enterprise Institute for Public Policy Research. In addition, Mr. Stavropoulos is a member of The Business Council, J.P. Morgan International Council and the University of Notre Dame Advisory Council for the College of Science. |
Kenneth L. Wolfe (66) |
| Year of Election or Appointment: 2005 Mr. Wolfe also serves as a Trustee (2005-present) or Member of the Advisory Board (2004-present) of other investment companies advised by FMR. Prior to his retirement in 2001, Mr. Wolfe was Chairman and Chief Executive Officer of Hershey Foods Corporation (1993-2001). He currently serves as a member of the boards of Adelphia Communications Corporation (2003-present), Bausch & Lomb, Inc., and Revlon Inc. (2004-present). |
Annual Report
Advisory Board Members and Executive Officers:
Correspondence intended for Mr. Gamper may be sent to Fidelity Investments, P.O. Box 55235, Boston, Massachusetts 02205-5235. Correspondence intended for each executive officer and Mr. Lynch may be sent to Fidelity Investments, 82 Devonshire Street, Boston, Massachusetts 02109.
Name, Age; Principal Occupation |
Albert R. Gamper, Jr. (63) |
| Year of Election or Appointment: 2005 Member of the Advisory Board of Fidelity Income Fund. Prior to his retirement in December 2004, Mr. Gamper served as Chairman of the Board of CIT Group Inc. (commercial finance). During his tenure with CIT Group Inc. Mr. Gamper served in numerous senior management positions, including Chairman (1987-1989; 1999-2001; 2002-2004), Chief Executive Officer (1987-2004), and President (1989-2002). He currently serves as a member of the Board of Directors of Public Service Enterprise Group (utilities, 2001-present), Chairman of the Board of Governors, Rutgers University (2004-present), and Chairman of the Board of Saint Barnabas Health Care System. |
Peter S. Lynch (61) |
| Year of Election or Appointment: 2003 Member of the Advisory Board of Fidelity Income Fund. Vice Chairman and a Director of FMR, and Vice Chairman (2001-present) and a Director (2000-present) of FMR Co., Inc. Previously, Mr. Lynch served as a Trustee of the Fidelity funds (1990-2003). In addition, he serves as a Trustee of Boston College, Massachusetts Eye & Ear Infirmary, Historic Deerfield, John F. Kennedy Library, and the Museum of Fine Arts of Boston. |
Walter C. Donovan (43) |
| Year of Election or Appointment: 2005 Vice President of Ginnie Mae, Government Income, and Intermediate Government Income. Mr. Donovan also serves as Vice President of Fidelity's High Income Funds (2005-present), Fidelity's Fixed-Income Funds (2005-present), certain Asset Allocation Funds (2005-present), and certain Balanced Funds (2005-present). Mr. Donovan also serves as Executive Vice President of FMR (2005-present) and FMRC (2005-present). Previously, Mr. Donovan served as Vice President and Director of Fidelity's International Equity Trading group (1998-2005). |
David L. Murphy (57) |
| Year of Election or Appointment: 2005 Vice President of Ginnie Mae, Government Income, and Intermediate Government Income. Mr. Murphy also serves as Vice President of Fidelity's Money Market Funds (2002-present), certain Asset Allocation Funds (2003-present), Fidelity's Investment Grade-Bond Funds (2005-present), and Fidelity's Balanced Funds (2005-present). He serves as Senior Vice President (2000-present) and Head (2004-present) of the Fidelity Investments Fixed Income Division. Mr. Murphy is also a Senior Vice President of FIMM (2003-present) and a Vice President of FMR (2000-present). Previously, Mr. Murphy served as Money Market Group Leader (2002-2004), Bond Group Leader (2000-2002), and Vice President of Fidelity's Taxable Bond Funds (2000-2002) and Fidelity's Municipal Bond Funds (2001-2002). Mr. Murphy joined Fidelity Investments in 1989 as a portfolio manager in the Bond Group. |
Thomas J. Silvia (44) |
| Year of Election or Appointment: 2005 Vice President of Ginnie Mae, Government Income, and Intermediate Government Income. Mr. Silvia also serves as Vice President of Fidelity's Bond Funds (2005-present) and Senior Vice President and Bond Group Leader of the Fidelity Investments Fixed-Income Division (2005-present). Previously, Mr. Silvia served as Director of Fidelity's Taxable Bond portfolio managers (2002-2004) and a portfolio manager in the Bond Group (1997-2004). |
George Fischer (44) |
| Year of Election or Appointment: 2002 or 2003 Vice President of Intermediate Government Income (2002) and Government Income (2003). Mr. Fischer also serves as Vice President of other funds advised by FMR. Prior to assuming his current responsibilities, Mr. Fischer managed a variety of Fidelity funds. |
William Irving (41) |
| Year of Election or Appointment: 2005 Vice President of Ginnie Mae. Dr. Irving also serves as Vice President of other funds advised by FMR. Prior to assuming his current responsibilities, Dr. Irving managed a variety of Fidelity funds. |
Eric D. Roiter (56) |
| Year of Election or Appointment: 1998 Secretary of Ginnie Mae, Government Income, and Intermediate Government Income. He also serves as Secretary of other Fidelity funds; Vice President, General Counsel, and Secretary of FMR Co., Inc. (2001-present) and FMR; Assistant Secretary of Fidelity Management & Research (U.K.) Inc. (2001-present), Fidelity Management & Research (Far East) Inc. (2001-present), and Fidelity Investments Money Management, Inc. (2001-present). Mr. Roiter is an Adjunct Member, Faculty of Law, at Boston College Law School (2003-present). Previously, Mr. Roiter served as Vice President and Secretary of Fidelity Distributors Corporation (FDC) (1998-2005). |
Stuart Fross (45) |
| Year of Election or Appointment: 2003 Assistant Secretary of Ginnie Mae, Government Income, and Intermediate Government Income. Mr. Fross also serves as Assistant Secretary of other Fidelity funds (2003-present), Vice President and Secretary of FDC (2005-present), and is an employee of FMR. |
Christine Reynolds (46) |
| Year of Election or Appointment: 2004 President, Treasurer, and Anti-Money Laundering (AML) officer of Ginnie Mae, Government Income, and Intermediate Government Income. Ms. Reynolds also serves as President, Treasurer, and AML officer of other Fidelity funds (2004) and is a Vice President (2003) and an employee (2002) of FMR. Before joining Fidelity Investments, Ms. Reynolds worked at PricewaterhouseCoopers LLP (PwC) (1980-2002), where she was most recently an audit partner with PwC's investment management practice. |
Timothy F. Hayes (54) |
| Year of Election or Appointment: 2002 Chief Financial Officer of Ginnie Mae, Government Income, and Intermediate Government Income. Mr. Hayes also serves as Chief Financial Officer of other Fidelity funds (2002-present) and President of Fidelity Investment Operations (2005-present) which includes Fidelity Pricing and Cash Management Services Group (FPCMS), where he served as President (1998-2005). Mr. Hayes serves as President of Fidelity Service Company (2003-present) where he also serves as a Director. Mr. Hayes also served as President of Fidelity Investments Operations Group (FIOG, 2002-2005). |
Kenneth A. Rathgeber (58) |
| Year of Election or Appointment: 2004 Chief Compliance Officer of Ginnie Mae, Government Income, and Intermediate Government Income. Mr. Rathgeber also serves as Chief Compliance Officer of other Fidelity funds (2004) and Executive Vice President of Risk Oversight for Fidelity Investments (2002). Previously, he served as Executive Vice President and Chief Operating Officer for Fidelity Investments Institutional Services Company, Inc. (1998-2002). |
John R. Hebble (47) |
| Year of Election or Appointment: 2003 Deputy Treasurer of Ginnie Mae, Government Income, and Intermediate Government Income. Mr. Hebble also serves as Deputy Treasurer of other Fidelity funds (2003), and is an employee of FMR. Before joining Fidelity Investments, Mr. Hebble worked at Deutsche Asset Management where he served as Director of Fund Accounting (2002-2003) and Assistant Treasurer of the Scudder Funds (1998-2003). |
Bryan A. Mehrmann (44) |
| Year of Election or Appointment: 2005 Deputy Treasurer of Ginnie Mae, Government Income, and Intermediate Government Income. Mr. Mehrmann also serves as Deputy Treasurer of other Fidelity funds (2005-present) and is an employee of FMR. Previously, Mr. Mehrmann served as Vice President of Fidelity Investments Institutional Services Group (FIIS)/Fidelity Investments Institutional Operations Corporation, Inc. (FIIOC) Client Services (1998-2004). |
Kimberley H. Monasterio (41) |
| Year of Election or Appointment: 2004 Deputy Treasurer of Ginnie Mae, Government Income, and Intermediate Government Income. Ms. Monasterio also serves as Deputy Treasurer of other Fidelity funds (2004) and is an employee of FMR (2004). Before joining Fidelity Investments, Ms. Monasterio served as Treasurer (2000-2004) and Chief Financial Officer (2002-2004) of the Franklin Templeton Funds and Senior Vice President of Franklin Templeton Services, LLC (2000-2004). |
Kenneth B. Robins (35) |
| Year of Election or Appointment: 2005 Deputy Treasurer of Ginnie Mae, Government Income, and Intermediate Government Income. Mr. Robins also serves as Deputy Treasurer of other Fidelity funds (2005-present) and is an employee of FMR (2004-present). Before joining Fidelity Investments, Mr. Robins worked at KPMG LLP, where he was a partner in KPMG's department of professional practice (2002-2004) and a Senior Manager (1999-2000). In addition, Mr. Robins served as Assistant Chief Accountant, United States Securities and Exchange Commission (2000-2002). |
Robert G. Byrnes (38) |
| Year of Election or Appointment: 2005 Assistant Treasurer of Ginnie Mae, Government Income, and Intermediate Government Income. Mr. Byrnes also serves as Assistant Treasurer of other Fidelity funds (2005-present) and is an employee of FMR (2005-present). Previously, Mr. Byrnes served as Vice President of FPCMS (2003-2005). Before joining Fidelity Investments, Mr. Byrnes worked at Deutsche Asset Management where he served as Vice President of the Investment Operations Group (2000-2003). |
John H. Costello (58) |
| Year of Election or Appointment: 1986 or 1988 Assistant Treasurer of Ginnie Mae (1986), Government Income (1986), and Intermediate Government Income (1988). Mr. Costello also serves as Assistant Treasurer of other Fidelity funds and is an employee of FMR. |
Peter L. Lydecker (51) |
| Year of Election or Appointment: 2004 Assistant Treasurer of Ginnie Mae, Government Income, and Intermediate Government Income. Mr. Lydecker also serves as Assistant Treasurer of other Fidelity funds (2004) and is an employee of FMR. |
Mark Osterheld (50) |
| Year of Election or Appointment: 2002 Assistant Treasurer of Ginnie Mae, Government Income, and Intermediate Government Income. Mr. Osterheld also serves as Assistant Treasurer of other Fidelity funds (2002) and is an employee of FMR. |
Gary W. Ryan (46) |
| Year of Election or Appointment: 2005 Assistant Treasurer of Ginnie Mae, Government Income, and Intermediate Government Income. Mr. Ryan also serves as Assistant Treasurer of other Fidelity funds (2005-present) and is an employee of FMR (2005-present). Previously, Mr. Ryan served as Vice President of Fund Reporting in FPCMS (1999-2005). |
Salvatore Schiavone (39) |
| Year of Election or Appointment: 2005 Assistant Treasurer of Ginnie Mae, Government Income, and Intermediate Government Income. Mr. Schiavone also serves as Assistant Treasurer of other Fidelity funds (2005-present) and is an employee of FMR (2005-present). Before joining Fidelity Investments, Mr. Schiavone worked at Deutsche Asset Management, where he most recently served as Assistant Treasurer (2003-2005) of the Scudder Funds and Vice President and Head of Fund Reporting (1996-2003). |
Annual Report
Distributions
The Board of Trustees of each fund voted to pay to shareholders of record at the opening of business on record date, the following distributions per share derived from capital gains realized from sales of portfolio securities:
Fund | Pay Date | Record Date | Capital Gains |
Fidelity Ginnie Mae Fund | 9/12/05 | 9/9/05 | $0.02 |
The funds hereby designate as capital gain dividends the amounts noted below for the taxable year indicated or for dividends for the taxable year ended 2005, if subsequently determined to be different, the net capital gain of such year; and for dividends for the taxable year ended 2004, if subsequently determined to be different, the excess of: (a) the net capital gain of such year, over (b) amounts previously designated as capital gain dividends with respect to such year.
Fund | 2005 | 2004 |
Fidelity Ginnie Mae Fund | 7,939,978 | - |
Fidelity Government Income Fund | 281,394 | 2,020,325 |
A percentage of the dividends distributed during the fiscal year for the following funds was derived from interest on U.S. Government securities which is generally exempt from state income tax:
Fidelity Government Income Fund | 35.14% |
Fidelity Intermediate Government Income Fund | 38.71% |
The funds will notify shareholders in January 2006 of amounts for use in preparing 2005 income tax returns.
Annual Report
Board Approval of Investment Advisory Contracts and Management Fees
Fidelity Ginnie Mae Fund / Fidelity Government Income Fund / Fidelity Intermediate Government Income Fund
Each year, typically in June, the Board of Trustees, including the independent Trustees (together, the Board), votes on the renewal of the management contract and sub-advisory agreements (together, the Advisory Contracts) for each fund. The Board, assisted by the advice of fund counsel and independent Trustees' counsel, requests and considers a broad range of information throughout the year.
The Board meets regularly each month except August and takes into account throughout the year matters bearing on Advisory Contracts. The Board, acting directly and through its separate committees, considers at each of its meetings factors that are relevant to the annual renewal of each fund's Advisory Contracts, including the services and support provided to each fund and its shareholders by Fidelity. At the time of the renewal, the Board had 11 standing committees, each composed of independent Trustees with varying backgrounds, to which the Board has assigned specific subject matter responsibilities in order to enhance effective decision-making by the Board. Each committee has adopted a written charter outlining the structure and purposes of the committee. One such committee, the Fixed-Income Contract Committee, meets periodically during the first six months of each year and as necessary to consider matters specifically related to the annual renewal of Advisory Contracts. The committee requests and receives information on, and makes recommendations to the independent Trustees concerning, the approval and annual review of the Advisory Contracts.
At its June 2005 meeting, the Board of Trustees, including the independent Trustees, unanimously determined to renew the Advisory Contracts for each fund. In reaching its determination, the Board considered all factors it believed relevant, including (1) the nature, extent, and quality of the services to be provided to each fund and its shareholders by Fidelity (including the investment performance of each fund); (2) the competitiveness of the management fee and total expenses of each fund; (3) the total costs of the services to be provided by and the profits to be realized by the investment adviser and its affiliates from the relationship with each fund; (4) the extent to which economies of scale would be realized as each fund grows; and (5) whether fee levels reflect these economies of scale, if any, for the benefit of fund shareholders.
In determining whether to renew the Advisory Contracts for each fund, the Board ultimately reached a determination, with the assistance of fund counsel and independent Trustees' counsel, that the renewal of the Advisory Contracts and the compensation to be received by Fidelity under the management contracts is consistent with Fidelity's fiduciary duty under applicable law. In addition to evaluating the specific factors noted above, the Board, in reaching its determination, is aware that shareholders in each fund have a broad range of investment choices available to them, including a wide choice among mutual funds offered by competitors to Fidelity, and that each fund's shareholders, with the opportunity to review and weigh the disclosure provided by the fund in its prospectus and other public disclosures, have chosen to invest in that fund, managed by Fidelity.
Annual Report
Nature, Extent, and Quality of Services Provided by Fidelity. The Board considered staffing within the investment adviser, FMR, and the sub-advisers (together, the Investment Advisers), including the backgrounds of the funds' portfolio managers and the funds' investment objectives and disciplines. The independent Trustees also had discussions with senior management of Fidelity's investment operations and investment groups. The Board considered the structure of the portfolio manager compensation program and whether this structure provides appropriate incentives.
Fidelity Resources Dedicated to Investment Management and Support Services. The Board reviewed the size, education, and experience of the Investment Advisers' investment staff, their use of technology, and the Investment Advisers' approach to recruiting, training, and retaining portfolio managers and other research, advisory, and management personnel. The Board considered Fidelity's extensive global research capabilities that enable the Investment Advisers to aggregate data from various sources in an effort to produce positive investment results. The Board noted that Fidelity's analysts have access to a variety of technological tools that enable them to perform both fundamental and quantitative analysis and to specialize in various disciplines. The Board also considered that Fidelity's portfolio managers and analysts have access to daily portfolio attribution that allows for monitoring of a fund's portfolio, as well as an electronic communication system that provides immediate real-time access to research concerning issuers and credit enhancers.
Shareholder and Administrative Services. The Board considered the nature, extent, quality, and cost of administrative, distribution, and shareholder services performed by the Investment Advisers and their affiliates under the Advisory Contracts and under separate agreements covering transfer agency, pricing and bookkeeping, and securities lending services for each fund. The Board also considered the nature and extent of the Investment Advisers' supervision of third party service providers, principally custodians and subcustodians. The Board reviewed the allocation of fund brokerage, including allocations to brokers affiliated with the Investment Advisers. The Board also considered the resources devoted to, and the record of compliance with, each fund's compliance policies and procedures.
The Board noted that the growth of fund assets across the complex allows Fidelity to reinvest in the development of services designed to enhance the value or convenience of the Fidelity funds as investment vehicles. These services include 24-hour access to account information and market information through phone representatives and over the Internet, and investor education materials and asset allocation tools.
Annual Report
Board Approval of Investment Advisory Contracts and
Management Fees - continued
Investment in a Large Fund Family. The Board considered the benefits to shareholders of investing in a Fidelity fund, including the benefits of investing in a fund that is part of a large family of funds offering a variety of investment disciplines and providing for a large variety of mutual fund investor services. For example, fund shareholders are offered the privilege of exchanging shares of a fund for shares of other Fidelity funds, as set forth in the fund's prospectus, without paying a sales charge. The Board noted that, since the last Advisory Contract renewals in June 2004, Fidelity has taken a number of actions that benefited particular funds, including (i) voluntarily deciding in 2004 to stop using "soft" commission dollars to pay for market data and, instead, to pay for that data out of its own resources, (ii) contractually agreeing to impose management fee reductions and expense limitations on its five Spartan stock index funds and its stock index fund available through variable insurance products, (iii) contractually agreeing to eliminate the management fees on the Fidelity Freedom Funds and the Fidelity Advisor Freedom Funds, (iv) contractually agreeing to reduce the management fees on most of its investment-grade taxable bond funds, and (v) contractually agreeing to impose expense limitations on its retail and Spartan investment-grade taxable bond funds.
Investment Performance. The Board considered whether each fund has operated within its investment objective, as well as its record of compliance with its investment restrictions. It also reviewed each fund's absolute investment performance, as well as each fund's relative investment performance measured against (i) a broad-based securities market index, and (ii) a peer group of mutual funds deemed appropriate by the Board over multiple periods. For each fund, the following charts considered by the Board show, over the one-, three-, and five-year periods ended December 31, 2004, the fund's returns, the returns of a broad-based securities market index ("benchmark"), and a range of returns of a peer group of mutual funds identified by Lipper Inc. as having an investment objective similar to that of the fund. The box within each chart shows the 25th percentile return (bottom of box) and the 75th percentile return (top of box) of the Lipper peer group. The percentage beaten number noted below each chart corresponds to the percentile box and represents the percentage of funds in the Lipper peer group whose performance was equal to or lower than that of the fund.
Annual Report
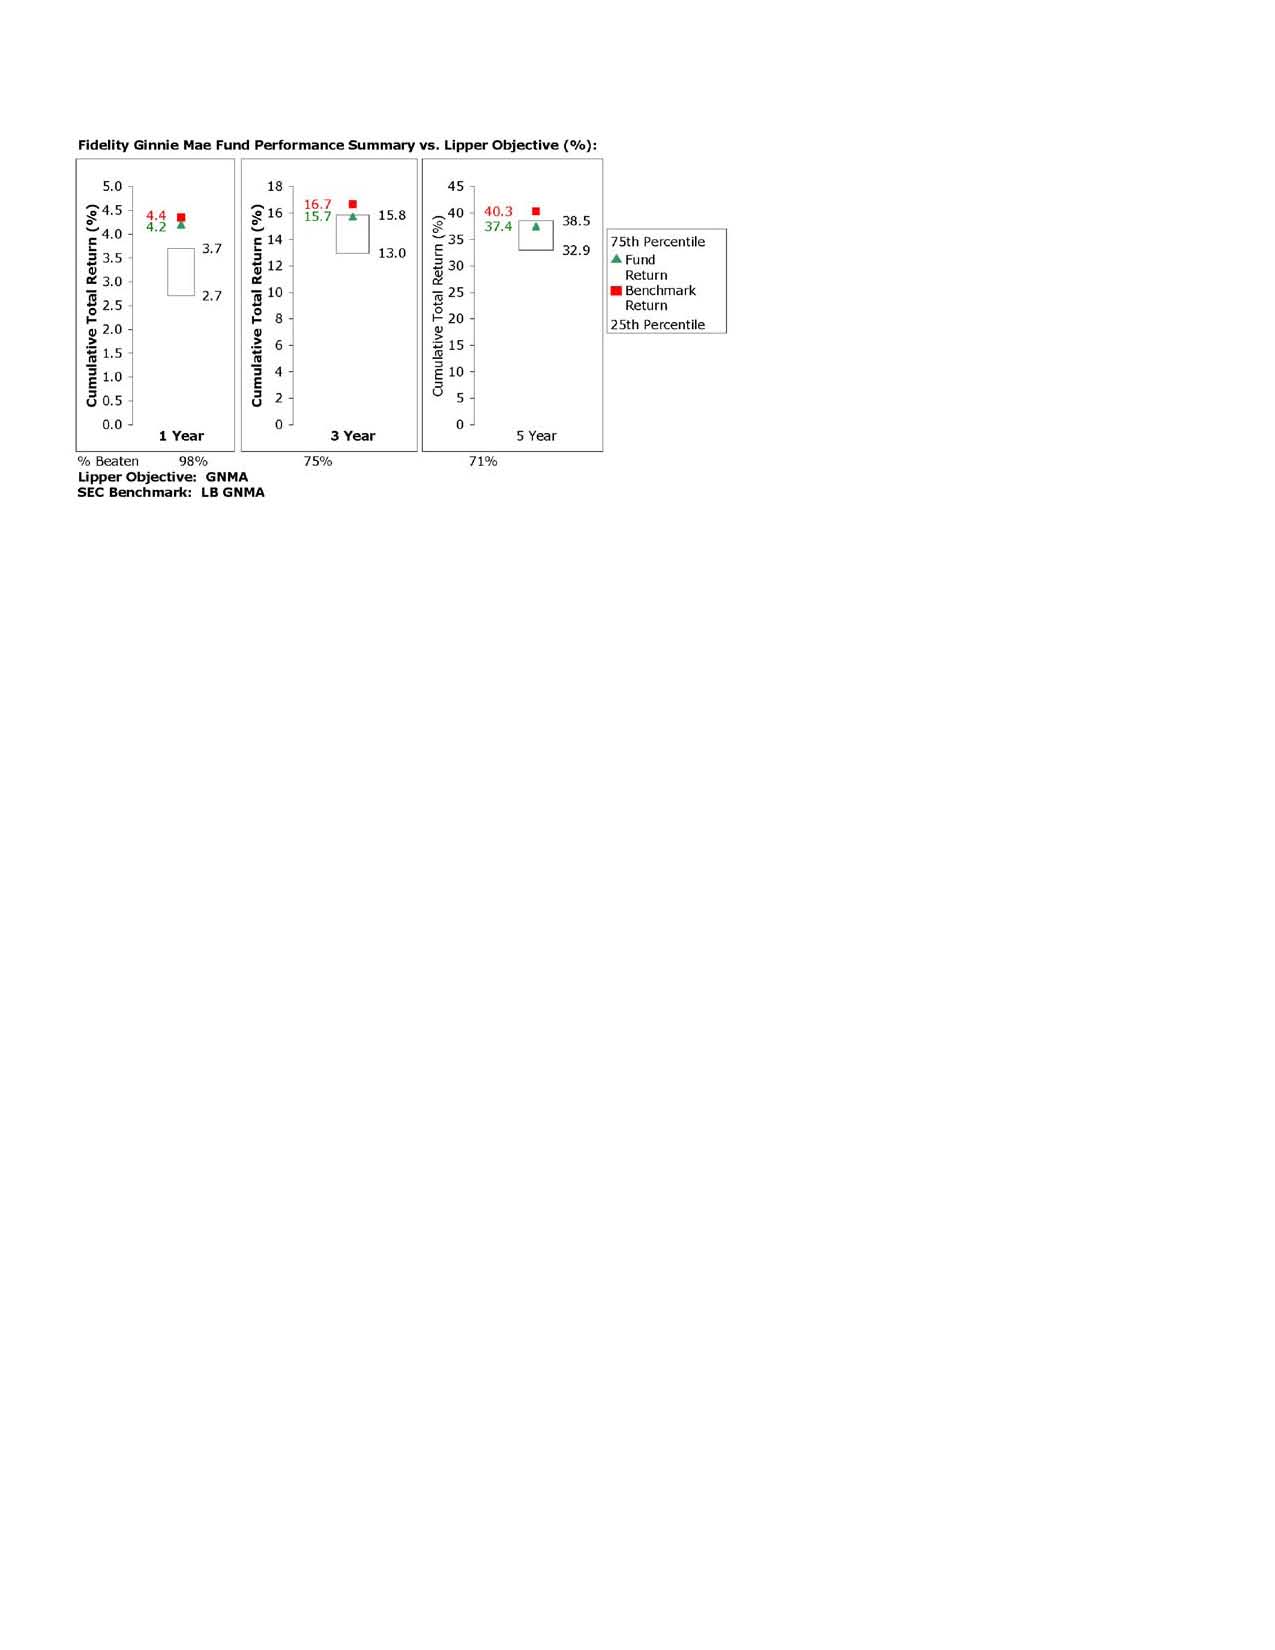
The Board noted that the relative investment performance of the fund has compared favorably to its Lipper peer group over time. The Board also noted that the relative investment performance of the fund was lower than its benchmark over time.
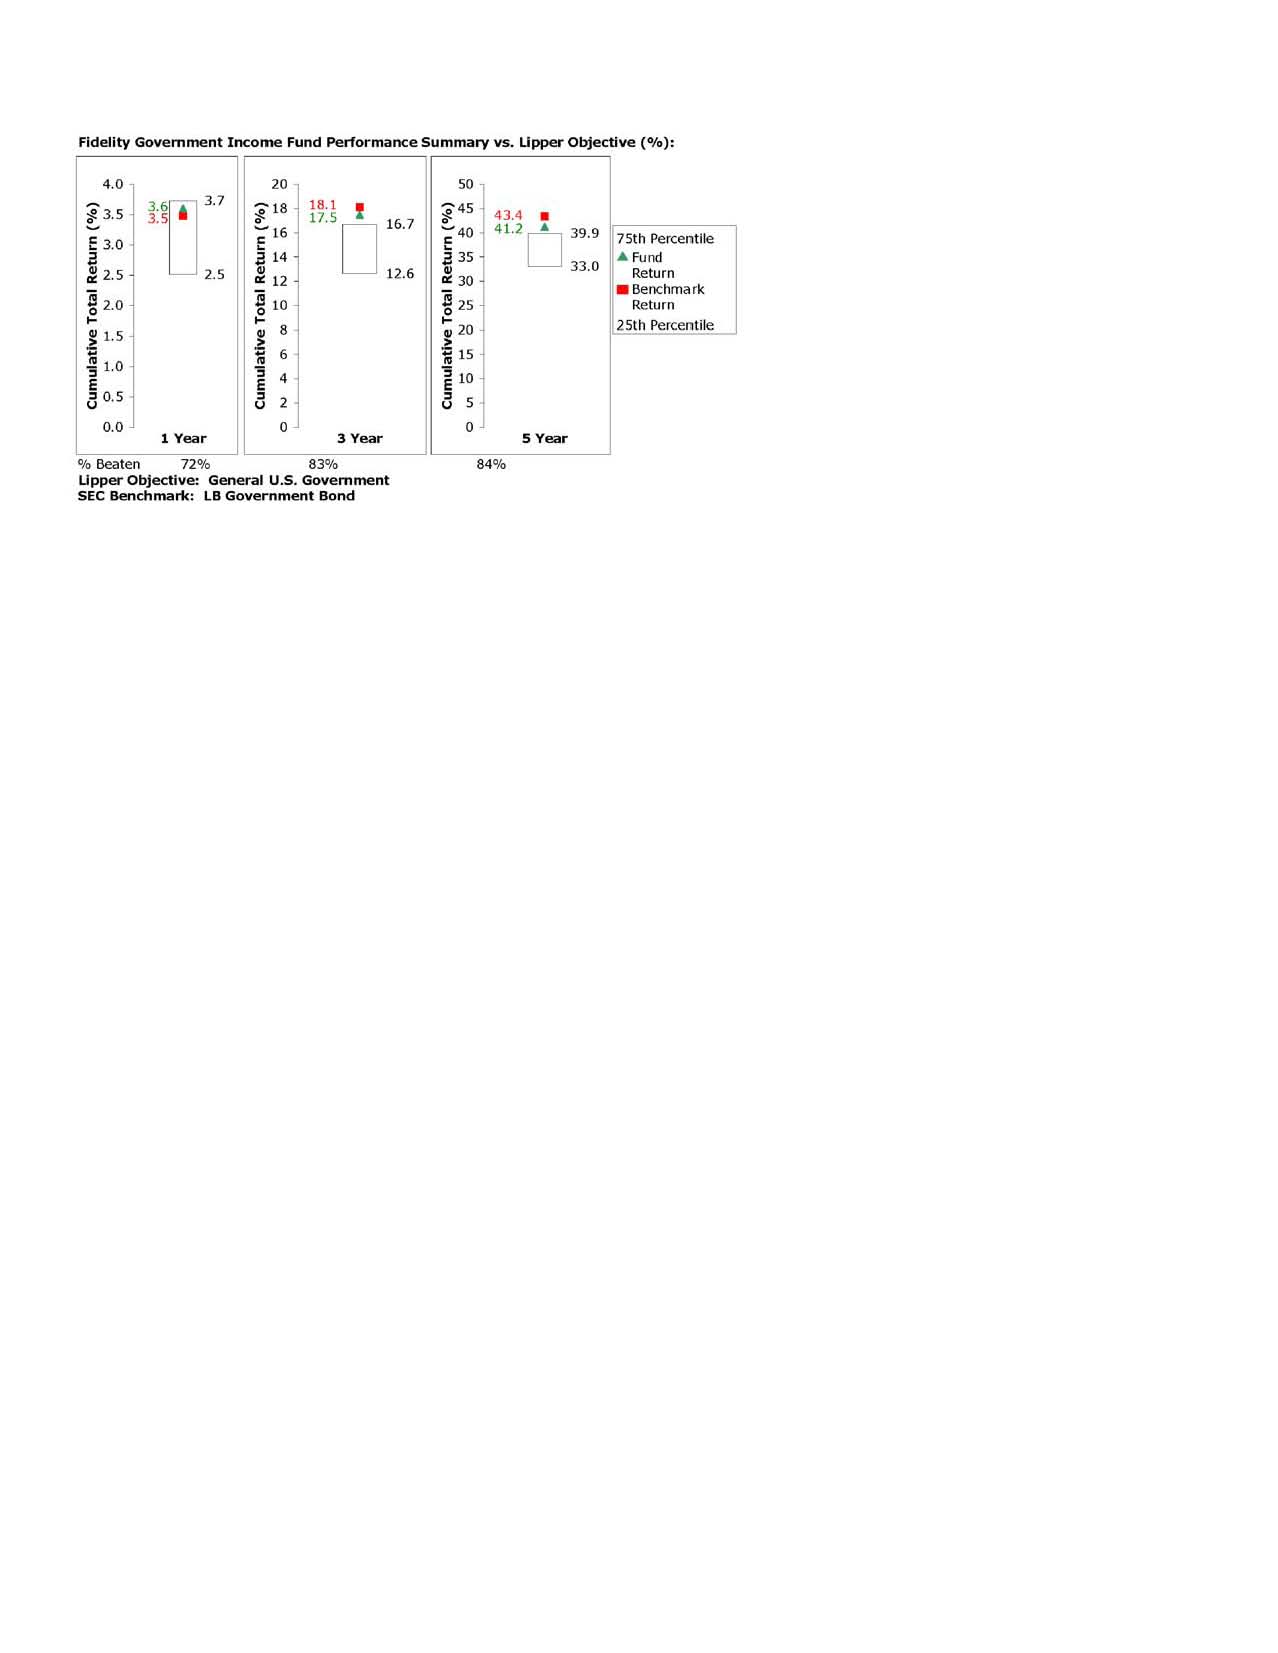
The Board noted that the relative investment performance of the fund has compared favorably to its Lipper peer group over time. The Board also noted that the relative investment performance of the fund was lower than its benchmark over time, although the one-year cumulative total return of the fund compared favorably to its benchmark.
Annual Report
Board Approval of Investment Advisory Contracts and
Management Fees - continued
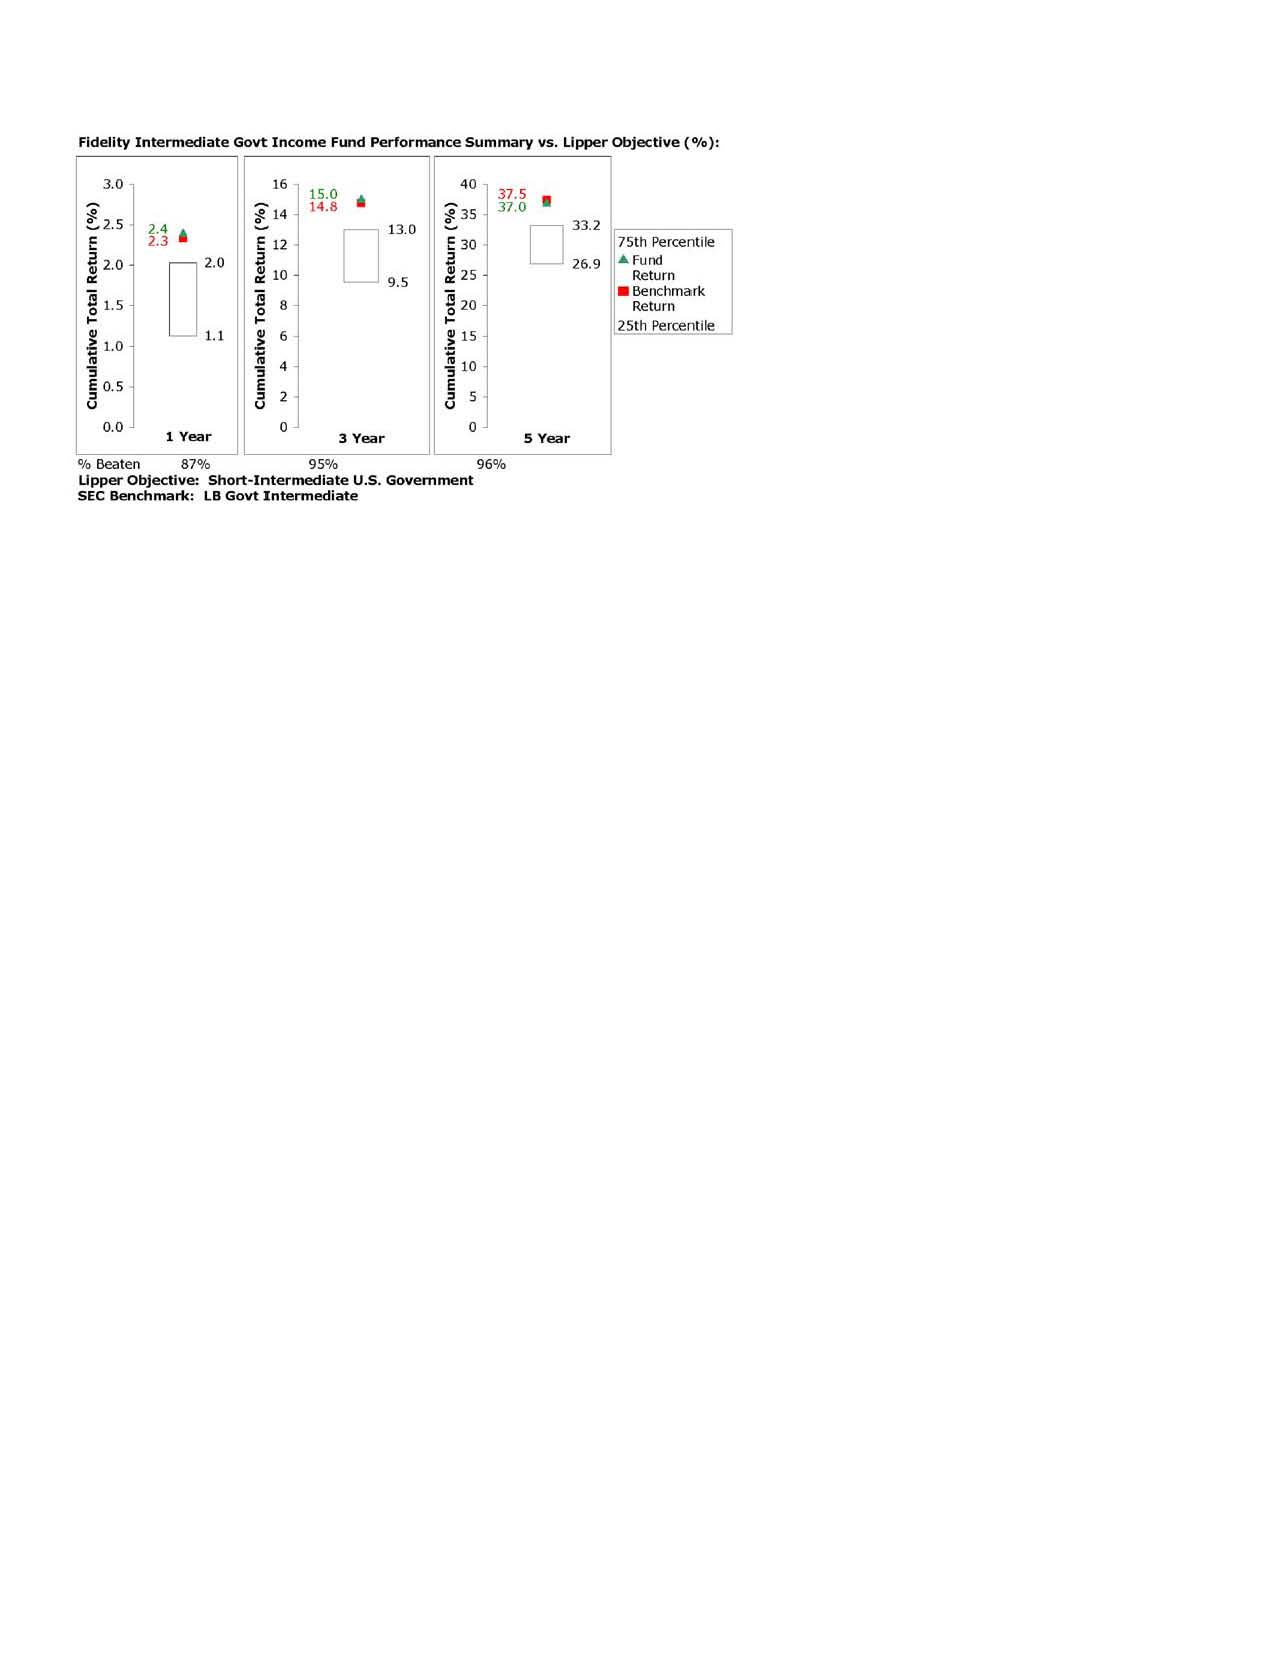
The Board noted that the relative investment performance of the fund has compared favorably to its Lipper peer group over time. The Board also noted that the relative investment performance of the fund has compared favorably to its benchmark over time, although the fund's five-year cumulative total return was lower than its benchmark.
Based on its review, and giving particular weight to the nature and quality of the resources dedicated by the Investment Advisers to maintain and improve relative performance, the Board concluded that the nature, extent, and quality of the services provided by Fidelity will benefit each fund's shareholders, particularly in light of the Board's view that each fund's shareholders benefit from investing in a fund that is part of a large family of funds offering a variety of investment disciplines and services.
Competitiveness of Management Fee and Total Fund Expenses. The Board considered each fund's management fee and total expenses compared to "mapped groups" of competitive funds and classes. Fidelity creates "mapped groups" by combining similar Lipper investment objective categories that have comparable management fee characteristics. Combining Lipper investment objective categories aids the Board's management fee and total expense comparisons by broadening the competitive group used for comparison and by reducing the number of universes to which various Fidelity funds are compared.
The Board considered two proprietary management fee comparisons for the 12-month periods shown in the charts below. The group of Lipper funds used by the Board for management fee comparisons is referred to below as the "Total Mapped Group" and, for the reasons explained above, is broader than the Lipper peer group used by the Board for performance comparisons. The Total Mapped Group comparison focuses on a fund's standing relative to the total universe of comparable funds available to investors, in terms of gross management fees before expense reimbursements or caps. "TMG %" represents the percentage of funds in the Total Mapped Group that had management fees that were lower than a fund's. For example, a TMG % of 22% would mean that 78% of the funds in the Total Mapped Group had higher management fees than a fund. The "Asset-Size Peer Group" (ASPG) comparison focuses on a fund's standing relative to non-Fidelity funds similar in size to the fund within the Total Mapped Group. The ASPG represents at least 15% of the funds in the Total Mapped Group with comparable asset size and management fee characteristics, subject to a minimum of 50 funds (or all funds in the Total Mapped Group if fewer than 50). Additional information, such as the ASPG quartile ("quadrant") in which a fund's management fee ranked, is also included in the charts and considered by the Board.
Annual Report
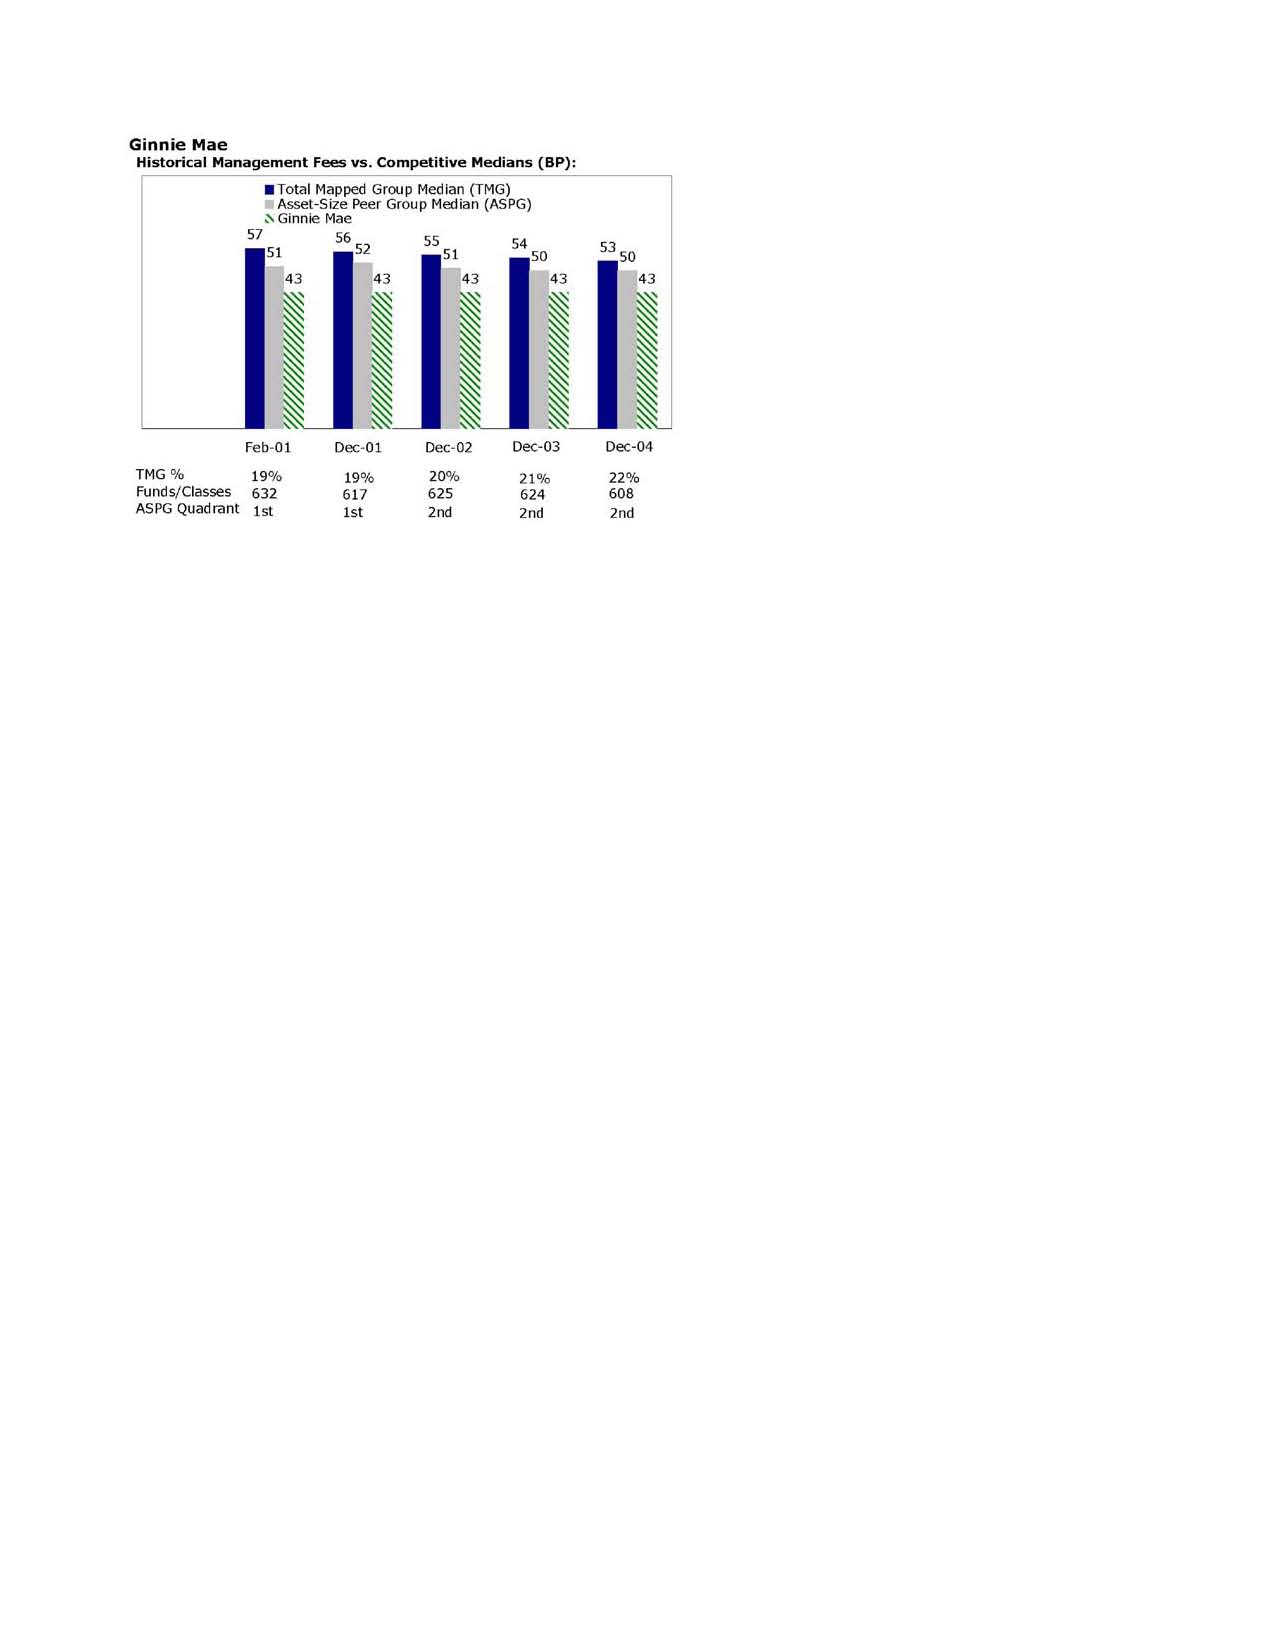
Annual Report
Board Approval of Investment Advisory Contracts and
Management Fees - continued

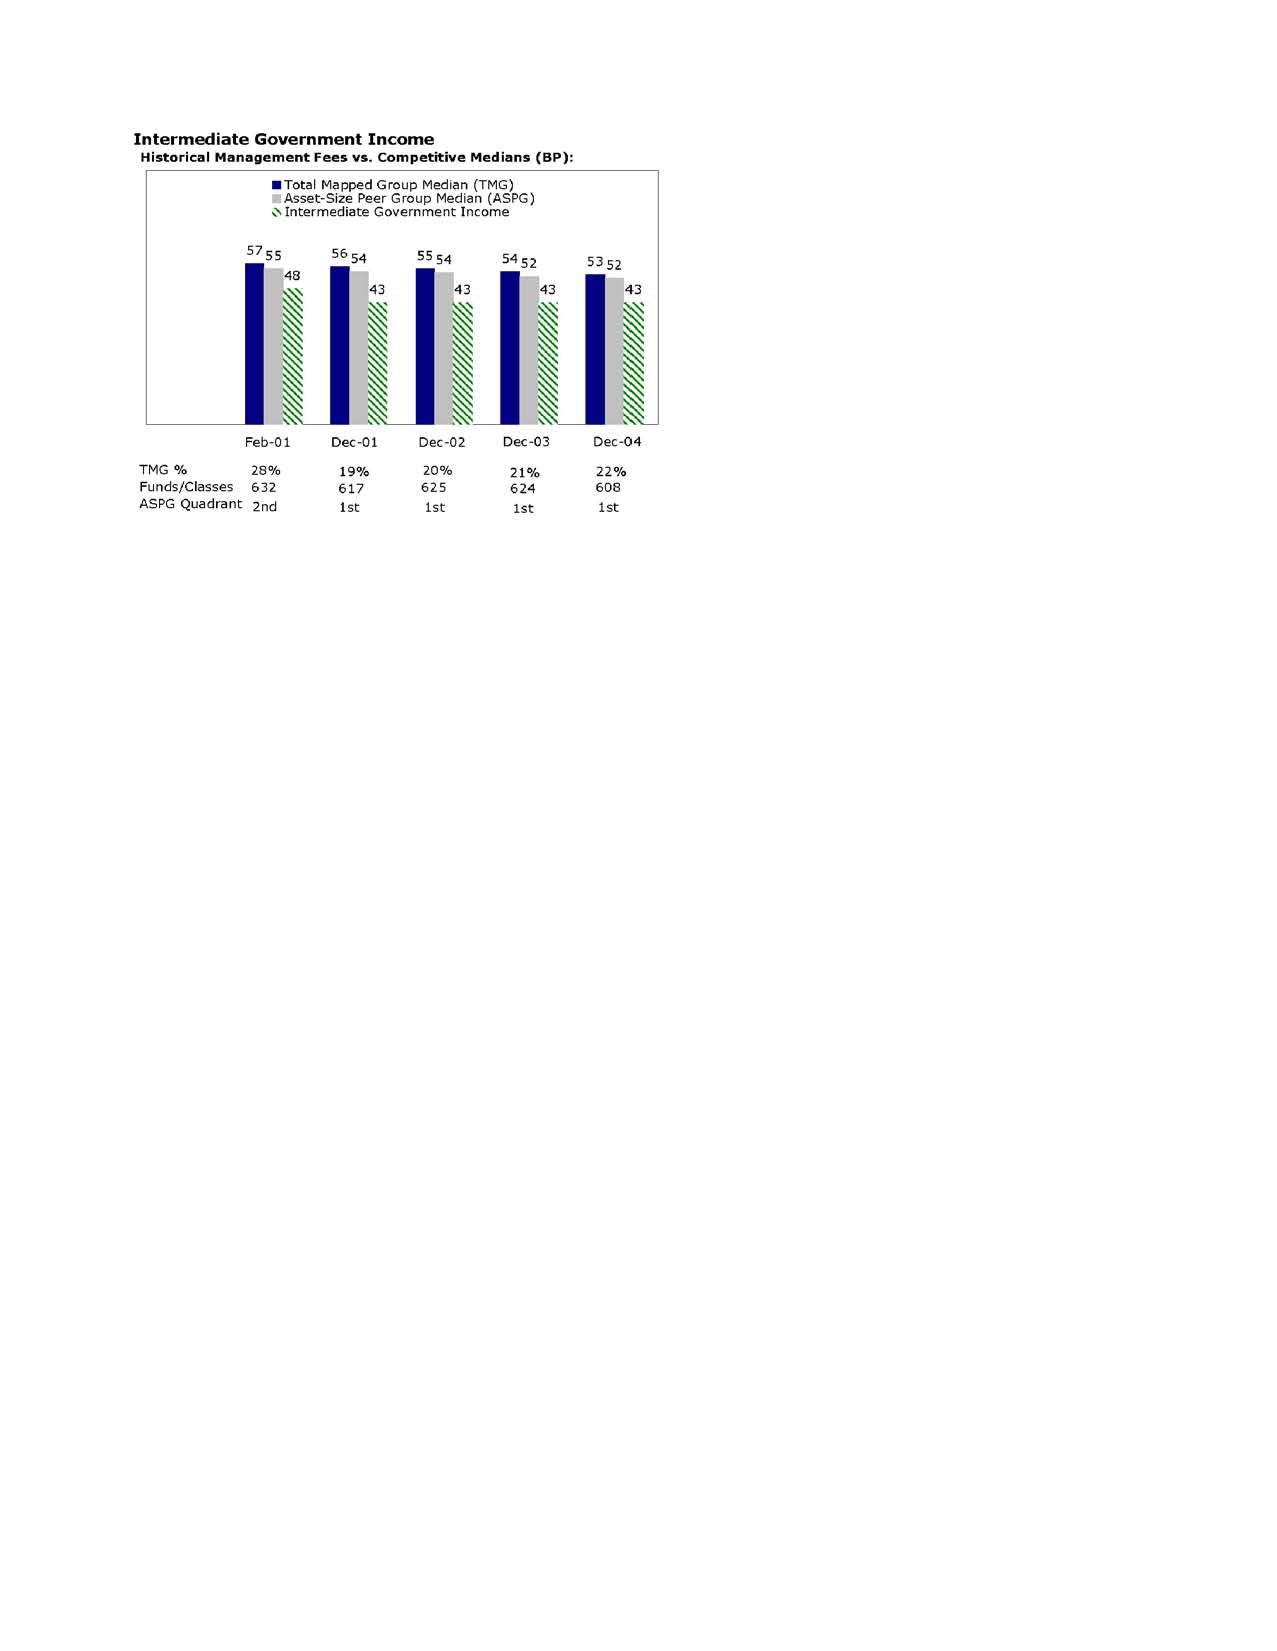
The Board noted that each fund's management fee ranked below the median of its Total Mapped Group and below the median of its ASPG for 2004.
Furthermore, the Board considered that, on May 19, 2005, after the periods shown in the charts above, it had approved an amendment (effective June 1, 2005) to each fund's management contract that lowered the fund's individual fund fee rate from 30 basis points to 20 basis points. The Board considered that, if the lower individual fund fee rate had been in effect in 2004, it would have reduced each fund's management fee rate from 43 basis points to 33 basis points.
Annual Report
Based on its review, the Board concluded that each fund's management fee was fair and reasonable in light of the services that the fund receives and the other factors considered.
In its review of each fund's total expenses, the Board considered the fund's management fee as well as other fund expenses, such as transfer agent fees, pricing and bookkeeping fees, and custodial, legal, and audit fees. The Board also noted the effects of any waivers and reimbursements on fees and expenses. As part of its review, the Board also considered current and historical total expenses of each fund compared to competitive fund median expenses. Each fund is compared to those funds and classes in the Total Mapped Group (used by the Board for management fee comparisons) that have a similar sales load structure.
The Board noted that each fund's total expenses ranked below its competitive median for 2004. The Board considered that if the lower individual fund fee rate had been in effect in 2004, it would have reduced each fund's total expenses by 10 basis points.
The Board also considered that on May 19, 2005, it had approved changes (effective June 1, 2005) in the contractual arrangements for each fund that (i) have the effect of setting the total "fund-level" expenses (including, among certain other expenses, the management fee) at 35 basis points, (ii) lower and limit the "class-level" transfer agent fee to 10 basis points, and (iii) limit each fund's total expenses to 45 basis points. These new contractual arrangements may not be increased without Board approval.
The Board recognized that each fund's management contract incorporates a "group fee" structure, which provides for lower fee rates as total fund assets under FMR's management increase, and for higher fee rates as total fund assets under FMR's management decrease. The Board noted that because the new contractual arrangements set each fund's total fund-level expenses at 35 basis points, increases or decreases in the management fee due to changes in the group fee rate will not impact total expenses. However, the Board realized that the 35 basis point fee rate was below the lowest management fee available under the old contractual arrangements. The maximum benefit that a decrease in the group fee rate could provide each fund would be a reduction in the management fee to approximately 39 basis points (compared to total fund-level expenses of 35 basis points under the new contractual arrangements).
In its review of total expenses, the Board also considered Fidelity fee structures and other information on clients that FMR and its affiliates service in other competitive markets, such as other mutual funds advised or subadvised by FMR or its affiliates, pension plan clients, and other institutional clients.
Based on its review, the Board concluded that each fund's total expenses were reasonable in light of the services that the fund and its shareholders receive and the other factors considered.
Annual Report
Board Approval of Investment Advisory Contracts and
Management Fees - continued
Costs of the Services and Profitability. The Board considered the revenues earned and the expenses incurred by Fidelity in conducting the business of developing, marketing, distributing, managing, administering and servicing each fund and its shareholders. The Board also considered the level of Fidelity's profits in respect of all the Fidelity funds.
On an annual basis, FMR presents to the Board Fidelity's profitability for each fund. Fidelity calculates the profitability for each fund, as well as aggregate profitability for groups of Fidelity funds and all Fidelity funds, using a series of detailed revenue and cost allocation methodologies which originate with the audited books and records of Fidelity. The Audit Committee of the Board reviews any significant changes from the prior year's methodologies.
PricewaterhouseCoopers LLP (PwC), independent registered accounting firm and auditor to Fidelity and certain Fidelity funds, has been engaged annually by the Board as part of the Board's assessment of the results of Fidelity's profitability analysis. PwC's engagement includes the review and assessment of Fidelity's methodologies used in determining the revenues and expenses attributable to Fidelity's mutual fund business, and completion of agreed-upon procedures surrounding the mathematical accuracy of fund profitability and its conformity to allocation methodologies. After considering PwC's reports issued under the engagement and information provided by Fidelity, the Board believes that while other allocation methods may also be reasonable, Fidelity's profitability methodologies are reasonable in all material respects.
The Board has also reviewed Fidelity's non-fund businesses and any fall-out benefits related to the mutual fund business as well as cases where Fidelity's affiliates may benefit from or be related to the funds' business. In addition, a special committee of the Board reviewed services provided to Fidelity by its affiliates and determined that the fees that Fidelity paid for such services were reasonable.
The Board considered the costs of the services provided by and the profits realized by Fidelity in connection with the operation of each fund and determined that the amount of profit is a fair entrepreneurial profit for the management of each fund.
Economies of Scale. The Board considered whether there have been economies of scale in respect of the management of the Fidelity funds, whether the Fidelity funds (including each fund) have appropriately benefited from any such economies of scale, and whether there is potential for realization of any further economies of scale. The Board considered the extent to which each fund will benefit from economies of scale through increased services to the fund, through waivers or reimbursements, or through fee or expense reductions. The Board also noted that the reduction in each fund's management fee rate from 43 basis points to 33 basis points and the reduction in each fund's total expenses by 10 basis points would deliver significant economies to fund shareholders. The Board concluded that any potential economies of scale are being shared between fund shareholders and Fidelity in an appropriate manner.
Annual Report
Additional Information Requested by the Board. In order to develop fully the factual basis for consideration of the Advisory Contracts, the Board requested additional information regarding (i) Fidelity's fund profitability methodology, including additional detail on various cost allocations; (ii) fall-out benefits to Fidelity; and (iii) compensation of portfolio managers and research analysts.
Based on its evaluation of all of the conclusions noted above, and after considering all material factors, the Board ultimately concluded that the existing advisory fee structures are fair and reasonable, and that each fund's existing Advisory Contracts should be renewed.
Annual Report
Investment Adviser
Fidelity Management & Research Company
Boston, MA
Investment Sub-Advisers
Fidelity Management & Research
(U.K.) Inc.; Ginnie Mae and
Intermediate Government Income
Fidelity Management & Research
(Far East) Inc.; Ginnie Mae and
Intermediate Government Income
Fidelity Investments
Money Management, Inc.
Fidelity Investments Japan Limited;
Ginnie Mae and Intermediate
Government Income
Fidelity International Investment Advisors
Fidelity International Investment Advisors
(U.K.) Limited
General Distributor
Fidelity Distributors Corporation
Boston, MA
Transfer and Service Agent
Fidelity Service Company, Inc.
Boston, MA
Custodian
The Bank of New York
New York, NY
The Fidelity Telephone Connection
Mutual Fund 24-Hour Service
Exchanges/Redemptions
and Account Assistance 1-800-544-6666
Product Information 1-800-544-6666
Retirement Accounts 1-800-544-4774
(8 a.m. - 9 p.m.)
TDD Service 1-800-544-0118
for the deaf and hearing impaired
(9 a.m. - 9 p.m. Eastern time)
Fidelity Automated Service
Telephone (FAST®) (automated graphic) 1-800-544-5555
(automated graphic) Automated line for quickest service
GVT-UANN-0905
1.789246.102
(Fidelity Investment logo)(registered trademark)
Corporate Headquarters
82 Devonshire St., Boston, MA 02109
www.fidelity.com
Fidelity
Total Bond
Fund
Annual Report
July 31, 2005
(2_fidelity_logos) (Registered_Trademark)
Contents
Chairman's Message | <Click Here> | Ned Johnson's message to shareholders. |
Performance | <Click Here> | How the fund has done over time. |
Management's Discussion | <Click Here> | The manager's review of fund performance, strategy and outlook. |
Shareholder Expense Example | <Click Here> | An example of shareholder expenses. |
Investment Changes | <Click Here> | A summary of major shifts in the fund's investments over the past six months. |
Investments | <Click Here> | A complete list of the fund's investments with their market values. |
Financial Statements | <Click Here> | Statements of assets and liabilities, operations, and changes in net assets,
as well as financial highlights. |
Notes | <Click Here> | Notes to the financial statements. |
Report of Independent Registered Public Accounting Firm | <Click Here> | |
Trustees and Officers | <Click Here> | |
Distributions | <Click Here> | |
Board Approval of Investment Advisory Contracts and Management Fees | <Click Here> | |
Central Fund Investments | <Click Here> | Complete list of investments for Fidelity's fixed-income central funds. |
To view a fund's proxy voting guidelines and proxy voting record for the 12-month period ended June 30, visit www.fidelity.com/proxyvotingresults or visit the Securities and Exchange Commission's (SEC) web site at www.sec.gov. You may also call 1-800-544-8544 to request a free copy of the proxy voting guidelines.
Standard & Poor's, S&P and S&P 500 are registered service marks of The McGraw-Hill Companies, Inc. and have been licensed for use by Fidelity Distributors Corporation.
Other third party marks appearing herein are the property of their respective owners.
All other marks appearing herein are registered or unregistered trademarks or service marks of FMR Corp. or an affiliated company.
Annual Report
This report and the financial statements contained herein are submitted for the general information of the shareholders of the fund. This report is not authorized for distribution to prospective investors in the fund unless preceded or accompanied by an effective prospectus.
A fund files its complete schedule of portfolio holdings with the SEC for the first and third quarters of each fiscal year on Form N-Q. Forms N-Q are available on the SEC's web site at http://www.sec.gov. A fund's Forms N-Q may be reviewed and copied at the SEC's Public Reference Room in Washington, DC. Information regarding the operation of the SEC's Public Reference Room may be obtained by calling 1-800-SEC-0330. For a complete list of a fund's portfolio holdings, view the most recent quarterly holdings report, semiannual report, or annual report on Fidelity's web site at http://www.fidelity.com/holdings.
NOT FDIC INSURED · MAY LOSE VALUE · NO BANK GUARANTEE
Neither the fund nor Fidelity Distributors Corporation is a bank.
Annual Report
Chairman's Message
(photo_of_Edward_C_Johnson_3d)
Dear Shareholder:
During the past year or so, much has been reported about the mutual fund industry, and much of it has been more critical than I believe is warranted. Allegations that some companies have been less than forthright with their shareholders have cast a shadow on the entire industry. I continue to find these reports disturbing, and assert that they do not create an accurate picture of the industry overall. Therefore, I would like to remind everyone where Fidelity stands on these issues. I will say two things specifically regarding allegations that some mutual fund companies were in violation of the Securities and Exchange Commission's forward pricing rules or were involved in so-called "market timing" activities.
First, Fidelity has no agreements that permit customers who buy fund shares after 4 p.m. to obtain the 4 p.m. price. This is not a new policy. This is not to say that someone could not deceive the company through fraudulent acts. However, we are extremely diligent in preventing fraud from occurring in this manner - and in every other. But I underscore again that Fidelity has no so-called "agreements" that sanction illegal practices.
Second, Fidelity continues to stand on record, as we have for years, in opposition to predatory short-term trading that adversely affects shareholders in a mutual fund. Back in the 1980s, we initiated a fee - which is returned to the fund and, therefore, to investors - to discourage this activity. Further, we took the lead several years ago in developing a Fair Value Pricing Policy to prevent market timing on foreign securities in our funds. I am confident we will find other ways to make it more difficult for predatory traders to operate. However, this will only be achieved through close cooperation among regulators, legislators and the industry.
Yes, there have been unfortunate instances of unethical and illegal activity within the mutual fund industry from time to time. That is true of any industry. When this occurs, confessed or convicted offenders should be dealt with appropriately. But we are still concerned about the risk of over-regulation and the quick application of simplistic solutions to intricate problems. Every system can be improved, and we support and applaud well thought out improvements by regulators, legislators and industry representatives that achieve the common goal of building and protecting the value of investors' holdings.
For nearly 60 years, Fidelity has worked very hard to improve its products and service to justify your trust. When our family founded this company in 1946, we had only a few hundred customers. Today, we serve more than 18 million customers including individual investors and participants in retirement plans across America.
Let me close by saying that we do not take your trust in us for granted, and we realize that we must always work to improve all aspects of our service to you. In turn, we urge you to continue your active participation with your financial matters, so that your interests can be well served.
Best regards,
/s/Edward C. Johnson 3d
Edward C. Johnson 3d
Annual Report
Performance: The Bottom Line
Average annual total return reflects the change in the value of an investment, assuming reinvestment of Total Bond's dividend income and capital gains (the profits earned upon the sale of securities that have grown in value) and assuming a constant rate of performance each year. The $10,000 table and the fund's returns do not reflect the deduction of taxes that a shareholder would pay on fund distributions or the redemption of fund shares. During periods of reimbursement by Fidelity, a fund's total return will be greater than it would be had the reimbursement not occurred. How a fund did yesterday is no guarantee of how it will do tomorrow.
Average Annual Total Returns
Periods ended July 31, 2005 | Past 1
year | Life of
FundA |
Total Bond | 5.75% | 5.89% |
A From October 15, 2002.
$10,000 Over Life of Fund
Let's say hypothetically that $10,000 was invested in Total Bond on October 15, 2002, when the fund started. The chart shows how the value of your investment would have changed, and also shows how the Lehman Brothers® U.S. Universal Index performed over the same period.
Annual Report
Management's Discussion of Fund Performance
Comments from Ford O'Neil, Portfolio Manager of Fidelity Total Bond Fund
Not unlike the domestic equity markets, taxable bonds swung up and down during the 12 months ending July 31, 2005, rallying early in the period, selling off in late winter, only to advance again in the spring. During the one-year period, the Lehman Brothers® Aggregate Bond Index - a measure of the overall investment-grade bond universe - - rose 4.79%. Much of this gain came on the strength of returns from higher-yielding spread sectors, such as investment-grade corporates, reflected in the 5.76% return of the Lehman Brothers Credit Bond Index over the 12-month period. Mortgage-backed securities were spurred on by the relative stability of long-term interest rates, and the Lehman Brothers Mortgage-Backed Securities gained 4.67%. Treasuries also bolstered the overall market, as illustrated by the 4.62% return of the Lehman Brothers U.S. Treasury Index, which moved ahead on a flight to quality as investors continued to ponder the future direction of the U.S. economy. The Lehman Brothers U.S. Agency Index returned a more modest 3.88%.
Total Bond gained 5.75% during the past year, while the Lehman Brothers U.S. Universal Index and the LipperSM Intermediate Investment Grade Debt Funds Average rose 5.53% and 4.36%, respectively. Benefiting the fund's performance was our sector selection. In particular, the decision to overweight high-yield corporate bonds and emerging-markets debt worked out well relative to the index, as these segments were boosted by a combination of strong demand for higher-yielding securities and improving creditworthiness. Security selection in both sectors also generally was advantageous. Within the investment-grade portion of the portfolio - which accounted for the majority of the fund's net assets and was the main driver of its absolute and relative returns - our yield-curve positioning helped as the curve flattened. Security selection among investment-grade bonds also added value, with the fund's corporate bond holdings leading the way. However, positions in auto-related companies disappointed. Elsewhere, the decision to invest in high-quality securitized products - namely mortgage securities and asset-backed securities - worked in our favor, as did security selection within those segments. An allocation to Treasury Inflation-Protected Securities (TIPS) also contributed, as they posted strong gains throughout most of the year, although an underweighting in nominal Treasuries detracted from results.
The views expressed in this statement reflect those of the portfolio manager only through the end of the period of the report as stated on the cover and do not necessarily represent the views of Fidelity or any other person in the Fidelity organization. Any such views are subject to change at any time based upon market or other conditions and Fidelity disclaims any responsibility to update such views. These views may not be relied on as investment advice and, because investment decisions for a Fidelity fund are based on numerous factors, may not be relied on as an indication of trading intent on behalf of any Fidelity fund.
Annual Report
Shareholder Expense Example
As a shareholder of the Fund, you incur two types of costs: (1) transaction costs, including sales charges (loads) on purchase payments or redemption proceeds, and (2) ongoing costs, including management fees, distribution and/or service (12b-1) fees and other Fund expenses. This Example is intended to help you understand your ongoing costs (in dollars) of investing in the Fund and to compare these costs with the ongoing costs of investing in other mutual funds.
The Example is based on an investment of $1,000 invested at the beginning of the period and held for the entire period (February 1, 2005 to July 31, 2005).
Actual Expenses
The first line of the table below for each class of the Fund provides information about actual account values and actual expenses. You may use the information in this line, together with the amount you invested, to estimate the expenses that you paid over the period. Simply divide your account value by $1,000.00 (for example, an $8,600 account value divided by $1,000.00 = 8.6), then multiply the result by the number in the first line for a class of the Fund under the heading entitled "Expenses Paid During Period" to estimate the expenses you paid on your account during this period.
Hypothetical Example for Comparison Purposes
The second line of the table below for each class of the Fund provides information about hypothetical account values and hypothetical expenses based on a Class' actual expense ratio and an assumed rate of return of 5% per year before expenses, which is not the Class' actual return. The hypothetical account values and expenses may not be used to estimate the actual ending account balance or expenses you paid for the period. You may use this information to compare the ongoing costs of investing in the Fund and other funds. To do so, compare this 5% hypothetical example with the 5% hypothetical examples that appear in the shareholder reports of the other funds.
Please note that the expenses shown in the table are meant to highlight your ongoing costs only and do not reflect any transaction costs. Therefore, the second line of the table is useful in comparing ongoing costs only, and will not help you determine the relative total costs of owning different funds. In addition, if these transactional costs were included, your costs would have been higher.
| Beginning
Account Value
February 1, 2005 | Ending
Account Value
July 31, 2005 | Expenses Paid
During Period*
February 1, 2005
to July 31, 2005 |
Class A | | | |
Actual | $ 1,000.00 | $ 1,010.10 | $ 3.99** |
HypotheticalA | $ 1,000.00 | $ 1,020.83 | $ 4.01** |
Class T | | | |
Actual | $ 1,000.00 | $ 1,009.60 | $ 4.48** |
HypotheticalA | $ 1,000.00 | $ 1,020.33 | $ 4.51** |
Class B | | | |
Actual | $ 1,000.00 | $ 1,006.30 | $ 7.71** |
HypotheticalA | $ 1,000.00 | $ 1,017.11 | $ 7.75** |
| Beginning
Account Value
February 1, 2005 | Ending
Account Value
July 31, 2005 | Expenses Paid
During Period*
February 1, 2005
to July 31, 2005 |
Class C | | | |
Actual | $ 1,000.00 | $ 1,006.70 | $ 8.21** |
HypotheticalA | $ 1,000.00 | $ 1,016.61 | $ 8.25** |
Total Bond | | | |
Actual | $ 1,000.00 | $ 1,011.40 | $ 2.89** |
HypotheticalA | $ 1,000.00 | $ 1,021.92 | $ 2.91** |
Institutional Class | | | |
Actual | $ 1,000.00 | $ 1,012.20 | $ 2.99** |
HypotheticalA | $ 1,000.00 | $ 1,021.82 | $ 3.01** |
A 5% return per year before expenses
* Expenses are equal to each Class' annualized expense ratio (shown in the table below); multiplied by the average account value over the period, multiplied by 181/365 (to reflect the one-half year period).
| Annualized
Expense Ratio |
Class A | .80%** |
Class T | .90%** |
Class B | 1.55%** |
Class C | 1.65%** |
Total Bond | .58%** |
Institutional Class | .60%** |
** If contractual expense reductions, effective June 1, 2005, had been in effect during the period, the annualized expense ratio and the expenses paid in the actual and hypothetical examples above would have been as follows:
| Annualized
Expense Ratio | Expenses Paid |
Class A | .74% | |
Actual | | $ 3.69 |
HypotheticalA | | $ 3.71 |
Class T | .82% | |
Actual | | $ 4.09 |
HypotheticalA | | $ 4.11 |
Class B | 1.47% | |
Actual | | $ 7.31 |
HypotheticalA | | $ 7.35 |
Class C | 1.61% | |
Actual | | $ 8.01 |
HypotheticalA | | $ 8.05 |
Total Bond | .45% | |
Actual | | $ 2.24 |
HypotheticalA | | $ 2.26 |
Institutional Class | .49% | |
Actual | | $ 2.45 |
HypotheticalA | | $ 2.46 |
A 5% return per year before expenses
Annual Report
Investment Changes
Quality Diversification (% of fund's net assets) |
As of July 31, 2005 | As of January 31, 2005 |
| U.S. Government
and U.S. Government Agency Obligations 56.7% | | | U.S. Government
and U.S.Government Agency Obligations 54.8% | |
 | AAA 7.7% | | | AAA 5.2% | |
 | AA 3.2% | | | AA 3.6% | |
| A 6.2% | | | A 7.4% | |
 | BBB 13.4% | | | BBB 12.9% | |
| BB and Below 9.0% | | | BB and Below 9.0% | |
 | Not Rated 0.8% | | | Not Rated 1.4% | |
| Equities 0.0% | | | Equities 0.0% | |
| Short-Term Investments
and Net Other Assets 3.0% | | | Short-Term Investments
and Net Other Assets 5.7% | |

We have used ratings from Moody's® Investors Services, Inc. Where Moody's ratings are not available, we have used S&P ® ratings. Securities rated BB or below were rated investment grade at the time of acquisition. The information in the above table is based on the combined investments of the fund and its pro-rata share of the investments of Fidelity's fixed-income central fund. |
Average Years to Maturity as of July 31, 2005 |
| | 6 months ago |
Years | 6.2 | 5.4 |
Average years to maturity is based on the average time remaining until principal payments are expected from each of the fund's bonds, weighted by dollar amount. |
Duration as of July 31, 2005 |
| | 6 months ago |
Years | 4.0 | 4.0 |
Duration shows how much a bond fund's price fluctuates with changes in comparable interest rates. If rates rise 1%, for example, a fund with a five-year duration is likely to lose about 5% of its value. Other factors also can influence a bond fund's performance and share price. Accordingly, a bond fund's actual performance may differ from this example. |
Asset Allocation (% of fund's net assets) |
As of July 31, 2005 * | As of January 31, 2005 ** |
| Corporate Bonds 22.3% | | | Corporate Bonds 23.3% | |
| U.S. Government
and U.S. Government Agency Obligations 56.7% | | | U.S. Government
and U.S. Government Agency Obligations 54.8% | |
| Asset-Backed
Securities 7.6% | | | Asset-Backed
Securities 6.2% | |
| CMOs and Other Mortgage Related Securities 7.9% | | | CMOs and Other Mortgage Related Securities 7.1% | |
| Other Investments 2.5% | | | Other Investments 2.9% | |
| Short-Term
Investments and
Net Other Assets 3.0% | | | Short-Term
Investments and
Net Other Assets 5.7% | |
* Foreign investments | 6.7% | | ** Foreign investments | 7.6% | |

* Futures and Swaps | 6.8% | | ** Futures and Swaps | 4.9% | |
The information in the above tables is based on the combined investments of the fund and its pro-rata share of the investments of Fidelity's fixed-income central fund. |
Annual Report
Investments July 31, 2005
Showing Percentage of Net Assets
Nonconvertible Bonds - 21.8% |
| Principal Amount | | Value (Note 1) |
CONSUMER DISCRETIONARY - 4.2% |
Auto Components - 0.1% |
Affinia Group, Inc. 9% 11/30/14 (e) | | $ 30,000 | | $ 24,000 |
Delco Remy International, Inc. 11% 5/1/09 | | 50,000 | | 44,000 |
Tenneco Automotive, Inc. 8.625% 11/15/14 | | 105,000 | | 108,938 |
TRW Automotive Acquisition Corp. 9.375% 2/15/13 | | 87,000 | | 97,440 |
Visteon Corp. 7% 3/10/14 | | 190,000 | | 164,350 |
| | 438,728 |
Automobiles - 0.5% |
Ford Motor Co.: | | | | |
6.625% 10/1/28 | | 125,000 | | 97,581 |
7.45% 7/16/31 | | 915,000 | | 775,789 |
General Motors Corp.: | | | | |
8.25% 7/15/23 | | 135,000 | | 120,825 |
8.375% 7/15/33 | | 1,510,000 | | 1,362,775 |
| | 2,356,970 |
Diversified Consumer Services - 0.1% |
Carriage Services, Inc. 7.875% 1/15/15 (e) | | 200,000 | | 208,500 |
Service Corp. International (SCI): | | | | |
6.5% 3/15/08 | | 75,000 | | 76,875 |
6.75% 4/1/16 | | 55,000 | | 56,169 |
| | 341,544 |
Hotels, Restaurants & Leisure - 1.0% |
Argosy Gaming Co. 7% 1/15/14 | | 80,000 | | 88,400 |
Bally Total Fitness Holding Corp.: | | | | |
9.875% 10/15/07 | | 15,000 | | 13,275 |
10.5% 7/15/11 | | 120,000 | | 121,800 |
Carrols Corp. 9% 1/15/13 (e) | | 105,000 | | 108,938 |
Domino's, Inc. 8.25% 7/1/11 | | 55,000 | | 58,850 |
Friendly Ice Cream Corp. 8.375% 6/15/12 | | 70,000 | | 68,600 |
Gaylord Entertainment Co.: | | | | |
6.75% 11/15/14 | | 50,000 | | 49,625 |
8% 11/15/13 | | 225,000 | | 239,918 |
Herbst Gaming, Inc.: | | | | |
7% 11/15/14 | | 50,000 | | 50,875 |
8.125% 6/1/12 | | 70,000 | | 74,550 |
HMH Properties, Inc. 7.875% 8/1/08 | | 45,000 | | 45,563 |
Host Marriott LP 7.125% 11/1/13 | | 35,000 | | 36,621 |
Landry's Seafood Restaurants, Inc. 7.5% 12/15/14 | | 390,000 | | 385,613 |
MGM MIRAGE: | | | | |
6% 10/1/09 | | 50,000 | | 50,125 |
Nonconvertible Bonds - continued |
| Principal Amount | | Value (Note 1) |
CONSUMER DISCRETIONARY - continued |
Hotels, Restaurants & Leisure - continued |
MGM MIRAGE: - continued | | | | |
8.375% 2/1/11 | | $ 40,000 | | $ 43,752 |
Mohegan Tribal Gaming Authority 7.125% 8/15/14 | | 40,000 | | 42,000 |
Morton's Restaurant Group, Inc. 7.5% 7/1/10 | | 65,000 | | 64,675 |
MTR Gaming Group, Inc. 9.75% 4/1/10 | | 135,000 | | 146,813 |
Park Place Entertainment Corp. 7.875% 12/15/05 | | 50,000 | | 50,625 |
Penn National Gaming, Inc.: | | | | |
6.875% 12/1/11 | | 80,000 | | 82,000 |
8.875% 3/15/10 | | 100,000 | | 106,375 |
Pinnacle Entertainment, Inc. 8.25% 3/15/12 | | 140,000 | | 147,700 |
Resorts International Hotel & Casino, Inc. 11.5% 3/15/09 | | 225,000 | | 255,375 |
Scientific Games Corp. 6.25% 12/15/12 (e) | | 30,000 | | 30,450 |
Seneca Gaming Corp.: | | | | |
7.25% 5/1/12 (Reg. S) (e) | | 70,000 | | 72,625 |
7.25% 5/1/12 | | 50,000 | | 51,875 |
Six Flags, Inc. 9.625% 6/1/14 | | 180,000 | | 174,600 |
Speedway Motorsports, Inc. 6.75% 6/1/13 | | 100,000 | | 103,625 |
Station Casinos, Inc.: | | | | |
6% 4/1/12 | | 70,000 | | 71,225 |
6.5% 2/1/14 | | 40,000 | | 41,052 |
6.875% 3/1/16 | | 100,000 | | 103,000 |
Sun International Hotels Ltd./Sun International North America, Inc. 8.875% 8/15/11 | | 325,000 | | 347,344 |
Town Sports International, Inc. 9.625% 4/15/11 | | 165,000 | | 174,900 |
Universal City Development Partners Ltd./UCDP Finance, Inc. 11.75% 4/1/10 | | 95,000 | | 109,136 |
Uno Restaurant Corp. 10% 2/15/11 (e) | | 80,000 | | 77,200 |
Vail Resorts, Inc. 6.75% 2/15/14 | | 60,000 | | 61,350 |
Virgin River Casino Corp./RBG LLC/B&BB, Inc.: | | | | |
0% 1/15/13 (c)(e) | | 40,000 | | 28,400 |
9% 1/15/12 (e) | | 30,000 | | 31,500 |
Waterford Gaming LLC/Waterford Gaming Finance Corp. 8.625% 9/15/12 (e) | | 46,000 | | 49,680 |
Wheeling Island Gaming, Inc. 10.125% 12/15/09 | | 160,000 | | 169,600 |
Wynn Las Vegas LLC/Wynn Las Vegas Capital Corp. 6.625% 12/1/14 | | 160,000 | | 156,000 |
| | 4,185,630 |
Household Durables - 0.2% |
Champion Enterprises, Inc. 7.625% 5/15/09 | | 70,000 | | 70,700 |
Nonconvertible Bonds - continued |
| Principal Amount | | Value (Note 1) |
CONSUMER DISCRETIONARY - continued |
Household Durables - continued |
Goodman Global Holdings, Inc. 7.875% 12/15/12 (e) | | $ 80,000 | | $ 76,000 |
K. Hovnanian Enterprises, Inc.: | | | | |
6.25% 1/15/15 | | 50,000 | | 49,890 |
6.5% 1/15/14 | | 100,000 | | 101,750 |
8.875% 4/1/12 | | 10,000 | | 10,800 |
Sealy Mattress Co. 8.25% 6/15/14 | | 50,000 | | 53,250 |
Technical Olympic USA, Inc.: | | | | |
7.5% 3/15/11 | | 110,000 | | 103,950 |
7.5% 1/15/15 | | 175,000 | | 161,000 |
WCI Communities, Inc. 9.125% 5/1/12 | | 35,000 | | 36,925 |
William Lyon Homes, Inc. 10.75% 4/1/13 | | 110,000 | | 121,000 |
| | 785,265 |
Media - 2.1% |
AMC Entertainment, Inc. 8.625% 8/15/12 | | 60,000 | | 62,400 |
AOL Time Warner, Inc. 7.625% 4/15/31 | | 500,000 | | 616,090 |
British Sky Broadcasting Group PLC (BSkyB) yankee 8.2% 7/15/09 | | 1,000,000 | | 1,114,287 |
Cablevision Systems Corp.: | | | | |
7.88% 4/1/09 (i) | | 40,000 | | 41,200 |
8% 4/15/12 | | 230,000 | | 230,575 |
CanWest Media, Inc. 8% 9/15/12 | | 30,000 | | 32,025 |
Charter Communications Holding II LLC/Charter Communications Holdings II Capital Corp. 10.25% 9/15/10 | | 115,000 | | 118,738 |
Charter Communications Operating LLC/Charter Communications Operating Capital Corp. 8.375% 4/30/14 (e) | | 70,000 | | 70,613 |
Cinemark, Inc. 0% 3/15/14 (c) | | 100,000 | | 68,750 |
Comcast Corp. 5.85% 1/15/10 | | 500,000 | | 520,067 |
Cox Communications, Inc.: | | | | |
4.625% 6/1/13 | | 90,000 | | 86,026 |
7.125% 10/1/12 | | 970,000 | | 1,071,758 |
CSC Holdings, Inc.: | | | | |
6.75% 4/15/12 (e) | | 160,000 | | 154,800 |
7.875% 2/15/18 | | 50,000 | | 49,813 |
8.125% 7/15/09 | | 65,000 | | 66,950 |
Dex Media, Inc.: | | | | |
0% 11/15/13 (c) | | 95,000 | | 77,663 |
0% 11/15/13 (c) | | 5,000 | | 4,088 |
8% 11/15/13 | | 10,000 | | 10,700 |
Nonconvertible Bonds - continued |
| Principal Amount | | Value (Note 1) |
CONSUMER DISCRETIONARY - continued |
Media - continued |
EchoStar DBS Corp.: | | | | |
6.375% 10/1/11 | | $ 150,000 | | $ 149,250 |
9.125% 1/15/09 | | 72,000 | | 76,680 |
Entercom Radio LLC/Entercom Capital, Inc. 7.625% 3/1/14 | | 50,000 | | 52,250 |
Granite Broadcasting Corp. 9.75% 12/1/10 | | 40,000 | | 37,100 |
Houghton Mifflin Co.: | | | | |
8.25% 2/1/11 | | 100,000 | | 105,000 |
9.875% 2/1/13 | | 145,000 | | 158,050 |
iesy Repository Gmbh 10.375% 2/15/15 (e) | | 80,000 | | 80,800 |
Innova S. de R.L. 9.375% 9/19/13 | | 85,000 | | 95,519 |
Insight Midwest LP/Insight Capital, Inc. 9.75% 10/1/09 | | 100,000 | | 103,625 |
Liberty Media Corp.: | | | | |
5.7% 5/15/13 | | 500,000 | | 462,739 |
8.25% 2/1/30 | | 740,000 | | 746,690 |
8.5% 7/15/29 | | 130,000 | | 132,621 |
LodgeNet Entertainment Corp. 9.5% 6/15/13 | | 190,000 | | 207,100 |
MediaNews Group, Inc. 6.375% 4/1/14 | | 100,000 | | 96,250 |
News America Holdings, Inc. 7.75% 12/1/45 | | 170,000 | | 205,897 |
News America, Inc. 6.2% 12/15/34 | | 330,000 | | 342,944 |
Nexstar Broadcasting, Inc.: | | | | |
7% 1/15/14 | | 130,000 | | 120,900 |
7% 1/15/14 (e) | | 70,000 | | 65,100 |
PanAmSat Corp. 9% 8/15/14 | | 84,000 | | 92,610 |
PRIMEDIA, Inc.: | | | | |
7.625% 4/1/08 | | 84,000 | | 84,840 |
8.875% 5/15/11 | | 25,000 | | 26,250 |
Rainbow National LLC & RNS Co. Corp.: | | | | |
8.75% 9/1/12 (e) | | 30,000 | | 33,000 |
10.375% 9/1/14 (e) | | 30,000 | | 34,575 |
Rogers Cable, Inc. 6.75% 3/15/15 | | 50,000 | | 51,625 |
The Reader's Digest Association, Inc. 6.5% 3/1/11 | | 70,000 | | 71,750 |
Time Warner Entertainment Co. LP 8.375% 7/15/33 | | 1,000,000 | | 1,310,939 |
| | 9,340,647 |
Specialty Retail - 0.1% |
Asbury Automotive Group, Inc.: | | | | |
8% 3/15/14 | | 60,000 | | 59,550 |
9% 6/15/12 | | 15,000 | | 15,563 |
General Nutrition Centers, Inc. 8.625% 1/15/11 | | 80,000 | | 76,100 |
Nebraska Book Co., Inc. 8.625% 3/15/12 | | 90,000 | | 85,725 |
Nonconvertible Bonds - continued |
| Principal Amount | | Value (Note 1) |
CONSUMER DISCRETIONARY - continued |
Specialty Retail - continued |
Sonic Automotive, Inc. 8.625% 8/15/13 | | $ 165,000 | | $ 169,950 |
The Pep Boys - Manny, Moe & Jack 7.5% 12/15/14 | | 55,000 | | 50,050 |
United Auto Group, Inc. 9.625% 3/15/12 | | 50,000 | | 54,000 |
| | 510,938 |
Textiles, Apparel & Luxury Goods - 0.1% |
Jostens IH Corp. 7.625% 10/1/12 | | 40,000 | | 40,700 |
Levi Strauss & Co.: | | | | |
8.2544% 4/1/12 (i) | | 70,000 | | 70,000 |
9.75% 1/15/15 | | 180,000 | | 189,000 |
12.25% 12/15/12 | | 65,000 | | 73,288 |
| | 372,988 |
TOTAL CONSUMER DISCRETIONARY | | 18,332,710 |
CONSUMER STAPLES - 0.8% |
Beverages - 0.1% |
FBG Finance Ltd. 5.125% 6/15/15 (e) | | 425,000 | | 417,587 |
Food & Staples Retailing - 0.1% |
Ahold Finance USA, Inc.: | | | | |
6.25% 5/1/09 | | 40,000 | | 40,800 |
6.875% 5/1/29 | | 170,000 | | 161,500 |
8.25% 7/15/10 | | 40,000 | | 43,800 |
Jean Coutu Group, Inc.: | | | | |
7.625% 8/1/12 | | 30,000 | | 31,200 |
8.5% 8/1/14 | | 60,000 | | 59,550 |
Rite Aid Corp. 6% 12/15/05 (e) | | 20,000 | | 20,100 |
Stater Brothers Holdings, Inc. 8.125% 6/15/12 | | 80,000 | | 80,600 |
| | 437,550 |
Food Products - 0.4% |
B&G Foods, Inc. 8% 10/1/11 | | 40,000 | | 41,300 |
Cadbury Schweppes U.S. Finance LLC: | | | | |
3.875% 10/1/08 (e) | | 90,000 | | 87,885 |
5.125% 10/1/13 (e) | | 1,060,000 | | 1,055,387 |
Del Monte Corp. 6.75% 2/15/15 (e) | | 60,000 | | 61,350 |
Doane Pet Care Co.: | | | | |
9.75% 5/15/07 | | 50,000 | | 49,250 |
10.75% 3/1/10 | | 125,000 | | 135,000 |
National Beef Packing Co. LLC/National Beef Finance Corp. 10.5% 8/1/11 | | 120,000 | | 127,500 |
Nonconvertible Bonds - continued |
| Principal Amount | | Value (Note 1) |
CONSUMER STAPLES - continued |
Food Products - continued |
Pierre Foods, Inc. 9.875% 7/15/12 | | $ 40,000 | | $ 41,800 |
United Agriculture Products, Inc. 8.25% 12/15/11 | | 147,000 | | 155,085 |
| | 1,754,557 |
Household Products - 0.1% |
Fort James Corp. 6.875% 9/15/07 | | 150,000 | | 156,563 |
Personal Products - 0.0% |
Revlon Consumer Products Corp. 9.5% 4/1/11 | | 100,000 | | 96,000 |
Tobacco - 0.1% |
Altria Group, Inc. 7% 11/4/13 | | 400,000 | | 438,346 |
TOTAL CONSUMER STAPLES | | 3,300,603 |
ENERGY - 2.1% |
Energy Equipment & Services - 0.3% |
Cooper Cameron Corp. 2.65% 4/15/07 | | 340,000 | | 328,336 |
Diamond Offshore Drilling, Inc. 4.875% 7/1/15 (e) | | 885,000 | | 866,882 |
Dresser-Rand Group, Inc. 7.375% 11/1/14 (e) | | 50,000 | | 52,375 |
Hanover Compressor Co. 8.625% 12/15/10 | | 20,000 | | 21,200 |
Hanover Equipment Trust 8.75% 9/1/11 | | 50,000 | | 53,375 |
Petronas Capital Ltd. 7% 5/22/12 (e) | | 5,000 | | 5,609 |
Universal Compression, Inc. 7.25% 5/15/10 | | 40,000 | | 41,700 |
| | 1,369,477 |
Oil, Gas & Consumable Fuels - 1.8% |
Amerada Hess Corp. 6.65% 8/15/11 | | 110,000 | | 119,464 |
ANR Pipeline, Inc. 9.625% 11/1/21 | | 100,000 | | 127,750 |
Arch Western Finance LLC 6.75% 7/1/13 | | 100,000 | | 103,500 |
Canadian Oil Sands Ltd. 4.8% 8/10/09 (e) | | 490,000 | | 486,712 |
Chesapeake Energy Corp.: | | | | |
6.875% 1/15/16 | | 50,000 | | 52,190 |
7.75% 1/15/15 | | 30,000 | | 32,550 |
El Paso Energy Corp.: | | | | |
7.375% 12/15/12 | | 5,000 | | 5,069 |
7.75% 1/15/32 | | 15,000 | | 15,150 |
8.05% 10/15/30 | | 95,000 | | 97,256 |
El Paso Production Holding Co. 7.75% 6/1/13 | | 140,000 | | 148,750 |
Empresa Nacional de Petroleo 6.75% 11/15/12 (e) | | 300,000 | | 326,272 |
EnCana Holdings Finance Corp. 5.8% 5/1/14 | | 240,000 | | 253,201 |
Enterprise Products Operating LP 5.75% 3/1/35 (e) | | 300,000 | | 286,865 |
Foundation Pennsylvania Coal Co. 7.25% 8/1/14 | | 50,000 | | 52,750 |
Nonconvertible Bonds - continued |
| Principal Amount | | Value (Note 1) |
ENERGY - continued |
Oil, Gas & Consumable Fuels - continued |
General Maritime Corp. 10% 3/15/13 | | $ 310,000 | | $ 338,675 |
Giant Industries, Inc. 8% 5/15/14 | | 130,000 | | 136,175 |
Hurricane Finance BV: | | | | |
9.625% 2/12/10 (e) | | 25,000 | | 27,438 |
9.625% 2/12/10 (Reg. S) | | 35,000 | | 38,413 |
Kinder Morgan Energy Partners LP 5.8% 3/15/35 | | 300,000 | | 298,296 |
Markwest Energy Partners LP/ Markwest Energy Finance Corp. 6.875% 11/1/14 (e) | | 146,000 | | 147,460 |
Massey Energy Co. 6.625% 11/15/10 | | 40,000 | | 41,200 |
Newfield Exploration Co. 6.625% 9/1/14 | | 90,000 | | 94,275 |
Nexen, Inc. 5.875% 3/10/35 | | 600,000 | | 595,049 |
OAO Gazprom: | | | | |
9.625% 3/1/13 | | 240,000 | | 291,600 |
10.5% 10/21/09 | | 90,000 | | 106,650 |
Overseas Shipholding Group, Inc.: | | | | |
7.5% 2/15/24 | | 55,000 | | 53,350 |
8.25% 3/15/13 | | 40,000 | | 42,600 |
Pan American Energy LLC 7.125% 10/27/09 (e) | | 100,000 | | 102,000 |
Peabody Energy Corp. 6.875% 3/15/13 | | 20,000 | | 21,150 |
Pemex Project Funding Master Trust: | | | | |
6.125% 8/15/08 | | 250,000 | | 256,250 |
6.625% 6/15/35 (e) | | 780,000 | | 752,700 |
7.375% 12/15/14 | | 500,000 | | 552,500 |
Petrobras Energia SA 9.375% 10/30/13 | | 65,000 | | 71,500 |
Range Resources Corp.: | | | | |
6.375% 3/15/15 (Reg. S) | | 90,000 | | 90,450 |
7.375% 7/15/13 | | 40,000 | | 42,600 |
Ship Finance International Ltd. 8.5% 12/15/13 | | 330,000 | | 315,975 |
Teekay Shipping Corp. 8.875% 7/15/11 | | 30,000 | | 34,350 |
The Coastal Corp.: | | | | |
6.375% 2/1/09 | | 5,000 | | 4,925 |
6.5% 6/1/08 | | 150,000 | | 149,063 |
6.7% 2/15/27 | | 65,000 | | 65,731 |
7.75% 6/15/10 | | 200,000 | | 205,750 |
Williams Co., Inc. Credit Linked Certificate Trust III 6.75% 4/15/09 (e) | | 215,000 | | 223,869 |
Williams Companies, Inc.: | | | | |
7.125% 9/1/11 | | 5,000 | | 5,450 |
7.625% 7/15/19 | | 30,000 | | 34,275 |
7.875% 9/1/21 | | 35,000 | | 40,381 |
Nonconvertible Bonds - continued |
| Principal Amount | | Value (Note 1) |
ENERGY - continued |
Oil, Gas & Consumable Fuels - continued |
Williams Companies, Inc.: - continued | | | | |
8.125% 3/15/12 | | $ 30,000 | | $ 34,650 |
8.75% 3/15/32 | | 165,000 | | 203,775 |
YPF SA: | | | | |
10% 11/2/28 | | 30,000 | | 36,300 |
yankee 9.125% 2/24/09 | | 45,000 | | 49,163 |
| | 7,611,467 |
TOTAL ENERGY | | 8,980,944 |
FINANCIALS - 6.0% |
Capital Markets - 1.5% |
Bank of New York Co., Inc.: | | | | |
3.4% 3/15/13 (i) | | 100,000 | | 96,459 |
4.25% 9/4/12 (i) | | 205,000 | | 203,356 |
Credit Suisse First Boston (USA), Inc. 4.7% 6/1/09 | | 440,000 | | 441,502 |
E*TRADE Financial Corp. 8% 6/15/11 | | 265,000 | | 279,575 |
Equinox Holdings Ltd. 9% 12/15/09 | | 90,000 | | 93,600 |
Franklin Resources, Inc. 3.7% 4/15/08 | | 1,135,000 | | 1,107,274 |
Goldman Sachs Group, Inc.: | | | | |
5.7% 9/1/12 | | 1,100,000 | | 1,147,915 |
6.6% 1/15/12 | | 500,000 | | 545,548 |
Lazard LLC 7.125% 5/15/15 (e) | | 685,000 | | 681,889 |
Legg Mason, Inc. 6.75% 7/2/08 | | 30,000 | | 31,868 |
Merrill Lynch & Co., Inc. 4.25% 2/8/10 | | 685,000 | | 672,342 |
Morgan Stanley 6.6% 4/1/12 | | 1,100,000 | | 1,199,734 |
| | 6,501,062 |
Commercial Banks - 0.7% |
Bank of America Corp. 7.4% 1/15/11 | | 780,000 | | 885,848 |
Corporacion Andina de Fomento 5.2% 5/21/13 | | 35,000 | | 35,055 |
Korea Development Bank: | | | | |
3.875% 3/2/09 | | 685,000 | | 665,324 |
4.75% 7/20/09 | | 320,000 | | 319,925 |
5.75% 9/10/13 | | 170,000 | | 178,008 |
Standard Bank London Ltd. 8.125% 9/30/09 | | 100,000 | | 104,760 |
Vimpel Communications 10% 6/16/09 (Issued by UBS Luxembourg SA for Vimpel Communications) | | 100,000 | | 107,750 |
Wachovia Bank NA 4.875% 2/1/15 | | 600,000 | | 595,542 |
Nonconvertible Bonds - continued |
| Principal Amount | | Value (Note 1) |
FINANCIALS - continued |
Commercial Banks - continued |
Wachovia Corp. 4.875% 2/15/14 | | $ 175,000 | | $ 173,732 |
Western Financial Bank 9.625% 5/15/12 | | 15,000 | | 16,500 |
| | 3,082,444 |
Consumer Finance - 0.6% |
AmeriCredit Corp. 9.25% 5/1/09 | | 65,000 | | 69,063 |
Capital One Bank 6.5% 6/13/13 | | 1,090,000 | | 1,181,679 |
Ford Motor Credit Co.: | | | | |
6.625% 6/16/08 | | 90,000 | | 90,000 |
7.375% 2/1/11 | | 1,000,000 | | 993,484 |
Household Finance Corp. 4.125% 11/16/09 | | 170,000 | | 166,008 |
Triad Acquisition Corp. 11.125% 5/1/13 (e) | | 105,000 | | 108,150 |
| | 2,608,384 |
Diversified Financial Services - 0.5% |
CCO Holdings LLC/CCO Holdings Capital Corp. 8.75% 11/15/13 | | 70,000 | | 69,475 |
Global Cash Access LLC/Global Cash Access Finance Corp. 8.75% 3/15/12 | | 105,000 | | 113,537 |
JPMorgan Chase & Co. 4.875% 3/15/14 | | 1,475,000 | | 1,458,077 |
Prime Property Funding II, Inc. 5.125% 6/1/15 (e) | | 510,000 | | 496,728 |
Refco Finance Holdings LLC/Refco Finance, Inc. 9% 8/1/12 | | 105,000 | | 113,400 |
Universal City Florida Holding Co. I/II 8.375% 5/1/10 | | 30,000 | | 31,500 |
| | 2,282,717 |
Insurance - 0.3% |
Aegon NV 4.75% 6/1/13 | | 500,000 | | 492,638 |
Marsh & McLennan Companies, Inc. 7.125% 6/15/09 | | 589,000 | | 628,114 |
UnumProvident Corp. 7.625% 3/1/11 | | 150,000 | | 158,538 |
| | 1,279,290 |
Real Estate - 1.8% |
American Real Estate Partners/American Real Estate Finance Corp.: | | | | |
7.125% 2/15/13 (e) | | 115,000 | | 115,000 |
8.125% 6/1/12 | | 85,000 | | 89,250 |
Archstone Smith Operating Trust 5.25% 5/1/15 | | 805,000 | | 803,981 |
Arden Realty LP 5.25% 3/1/15 | | 1,210,000 | | 1,186,513 |
Boston Properties, Inc. 6.25% 1/15/13 | | 365,000 | | 388,563 |
Camden Property Trust 5.875% 11/30/12 | | 200,000 | | 205,950 |
CarrAmerica Realty Corp. 5.25% 11/30/07 | | 200,000 | | 201,021 |
CB Richard Ellis Services, Inc. 9.75% 5/15/10 | | 10,000 | | 11,100 |
Nonconvertible Bonds - continued |
| Principal Amount | | Value (Note 1) |
FINANCIALS - continued |
Real Estate - continued |
Developers Diversified Realty Corp.: | | | | |
5% 5/3/10 | | $ 350,000 | | $ 348,525 |
5.25% 4/15/11 | | 205,000 | | 206,077 |
EOP Operating LP: | | | | |
4.65% 10/1/10 | | 595,000 | | 583,725 |
4.75% 3/15/14 | | 135,000 | | 130,848 |
7% 7/15/11 | | 500,000 | | 549,080 |
Gables Realty LP: | | | | |
5% 3/15/10 | | 105,000 | | 102,820 |
5.75% 7/15/07 | | 970,000 | | 985,739 |
Healthcare Realty Trust, Inc. 5.125% 4/1/14 | | 145,000 | | 140,084 |
La Quinta Properties, Inc. 7% 8/15/12 | | 50,000 | | 51,938 |
MeriStar Hospitality Corp. 8.75% 8/15/07 | | 50,000 | | 50,000 |
MeriStar Hospitality Operating Partnership LP/MeriStar Hospitality Finance Corp. II 10.5% 6/15/09 | | 100,000 | | 106,500 |
Omega Healthcare Investors, Inc. 7% 4/1/14 | | 70,000 | | 71,225 |
Senior Housing Properties Trust 7.875% 4/15/15 | | 20,000 | | 21,550 |
Simon Property Group LP: | | | | |
5.1% 6/15/15 (e) | | 485,000 | | 477,725 |
5.625% 8/15/14 | | 1,000,000 | | 1,024,214 |
Ventas Realty LP/Ventas Capital Corp. 6.625% 10/15/14 (e) | | 60,000 | | 61,500 |
| | 7,912,928 |
Thrifts & Mortgage Finance - 0.6% |
Countrywide Home Loans, Inc. 4% 3/22/11 | | 415,000 | | 394,901 |
Independence Community Bank Corp. 3.75% 4/1/14 (i) | | 120,000 | | 115,358 |
Residential Capital Corp. 6.375% 6/30/10 (e) | | 685,000 | | 695,810 |
Washington Mutual, Inc. 4.375% 1/15/08 | | 1,200,000 | | 1,194,078 |
| | 2,400,147 |
TOTAL FINANCIALS | | 26,066,972 |
HEALTH CARE - 0.4% |
Health Care Equipment & Supplies - 0.0% |
Medical Device Manufacturing, Inc. 10% 7/15/12 | | 50,000 | | 53,750 |
PerkinElmer, Inc. 8.875% 1/15/13 | | 20,000 | | 22,300 |
Spheris, Inc. 11% 12/15/12 (e) | | 50,000 | | 48,500 |
| | 124,550 |
Nonconvertible Bonds - continued |
| Principal Amount | | Value (Note 1) |
HEALTH CARE - continued |
Health Care Providers & Services - 0.3% |
AmeriPath, Inc. 10.5% 4/1/13 | | $ 80,000 | | $ 80,800 |
AMR HoldCo, Inc./ EmCare HoldCo, Inc. 10% 2/15/15 (e) | | 60,000 | | 64,200 |
Community Health Systems, Inc. 6.5% 12/15/12 | | 80,000 | | 81,000 |
Concentra Operating Corp.: | | | | |
9.125% 6/1/12 | | 10,000 | | 10,600 |
9.5% 8/15/10 | | 110,000 | | 117,150 |
DaVita, Inc.: | | | | |
6.625% 3/15/13 (e) | | 40,000 | | 41,400 |
7.25% 3/15/15 (e) | | 265,000 | | 274,275 |
HealthSouth Corp.: | | | | |
7.625% 6/1/12 | | 130,000 | | 127,400 |
8.5% 2/1/08 | | 85,000 | | 86,063 |
IASIS Healthcare LLC/IASIS Capital Corp. 8.75% 6/15/14 | | 100,000 | | 108,500 |
Psychiatric Solutions, Inc. 7.75% 7/15/15 (e) | | 50,000 | | 51,250 |
Rural/Metro Corp. 9.875% 3/15/15 (e) | | 30,000 | | 30,150 |
Tenet Healthcare Corp.: | | | | |
6.375% 12/1/11 | | 75,000 | | 71,063 |
6.5% 6/1/12 | | 15,000 | | 14,250 |
7.375% 2/1/13 | | 75,000 | | 72,938 |
U.S. Oncology, Inc.: | | | | |
9% 8/15/12 | | 30,000 | | 32,775 |
10.75% 8/15/14 | | 80,000 | | 90,000 |
| | 1,353,814 |
Pharmaceuticals - 0.1% |
CDRV Investors, Inc. 0% 1/1/15 (c) | | 100,000 | | 49,500 |
Elan Finance PLC/Elan Finance Corp. 7.75% 11/15/11 (e) | | 50,000 | | 43,000 |
Mylan Laboratories, Inc. 6.375% 8/15/15 (e) | | 60,000 | | 60,150 |
VWR International, Inc.: | | | | |
6.875% 4/15/12 | | 30,000 | | 29,625 |
8% 4/15/14 | | 30,000 | | 28,800 |
Warner Chilcott Corp. 8.75% 2/1/15 (e) | | 80,000 | | 79,600 |
| | 290,675 |
TOTAL HEALTH CARE | | 1,769,039 |
Nonconvertible Bonds - continued |
| Principal Amount | | Value (Note 1) |
INDUSTRIALS - 1.6% |
Aerospace & Defense - 0.3% |
BAE Systems Holdings, Inc. 4.75% 8/15/10 (e) | | $ 525,000 | | $ 520,787 |
BE Aerospace, Inc. 8.5% 10/1/10 | | 100,000 | | 110,500 |
Bombardier, Inc. 6.3% 5/1/14 (e) | | 340,000 | | 319,600 |
K & F Acquisition, Inc. 7.75% 11/15/14 | | 40,000 | | 41,000 |
Orbital Sciences Corp. 9% 7/15/11 | | 135,000 | | 146,475 |
| | 1,138,362 |
Airlines - 0.7% |
American Airlines, Inc. pass thru trust certificates: | | | | |
6.817% 5/23/11 | | 50,000 | | 47,875 |
6.855% 10/15/10 | | 67,869 | | 69,821 |
6.977% 11/23/22 | | 10,708 | | 9,985 |
6.978% 10/1/12 | | 137,745 | | 143,199 |
7.024% 4/15/11 | | 365,000 | | 379,361 |
7.377% 5/23/19 | | 46,728 | | 35,046 |
7.379% 5/23/16 | | 45,678 | | 34,259 |
7.8% 4/1/08 | | 65,000 | | 62,725 |
AMR Corp. 9% 8/1/12 | | 85,000 | | 68,000 |
Continental Airlines, Inc. pass thru trust certificates: | | | | |
6.648% 3/15/19 | | 360,532 | | 355,257 |
6.795% 2/2/20 | | 478,190 | | 411,244 |
Delta Air Lines, Inc.: | | | | |
7.9% 12/15/09 | | 50,000 | | 13,500 |
9.5% 11/18/08 (e) | | 61,000 | | 48,800 |
Delta Air Lines, Inc. pass thru trust certificates: | | | | |
7.111% 3/18/13 | | 340,000 | | 318,750 |
7.299% 9/18/06 | | 1,000 | | 440 |
7.57% 11/18/10 | | 705,000 | | 655,613 |
7.779% 11/18/05 | | 3,000 | | 1,800 |
7.779% 1/2/12 | | 22,350 | | 9,834 |
7.92% 5/18/12 | | 135,000 | | 79,650 |
Northwest Airlines, Inc.: | | | | |
7.875% 3/15/08 | | 25,000 | | 10,875 |
9.875% 3/15/07 | | 60,000 | | 31,200 |
Northwest Airlines, Inc. pass thru trust certificates: | | | | |
7.068% 7/2/17 | | 7,800 | | 5,304 |
7.626% 4/1/10 | | 32,062 | | 18,276 |
7.67% 1/2/15 | | 8,270 | | 5,872 |
| | 2,816,686 |
Nonconvertible Bonds - continued |
| Principal Amount | | Value (Note 1) |
INDUSTRIALS - continued |
Building Products - 0.0% |
Jacuzzi Brands, Inc. 9.625% 7/1/10 | | $ 20,000 | | $ 22,000 |
Nortek, Inc. 8.5% 9/1/14 | | 100,000 | | 97,000 |
| | 119,000 |
Commercial Services & Supplies - 0.1% |
Adesa, Inc. 7.625% 6/15/12 | | 50,000 | | 51,000 |
ALH Finance LLC/ALH Finance Corp. 8.5% 1/15/13 | | 25,000 | | 24,125 |
Allied Waste North America, Inc.: | | | | |
5.75% 2/15/11 | | 70,000 | | 66,150 |
7.875% 4/15/13 | | 20,000 | | 20,724 |
Buhrmann US, Inc. 7.875% 3/1/15 (e) | | 50,000 | | 49,375 |
Cenveo Corp. 7.875% 12/1/13 | | 60,000 | | 57,900 |
FTI Consulting, Inc. 7.625% 6/15/13 (e) | | 30,000 | | 30,450 |
| | 299,724 |
Electrical Equipment - 0.0% |
General Cable Corp. 9.5% 11/15/10 | | 20,000 | | 21,400 |
Sensus Metering Systems, Inc. 8.625% 12/15/13 | | 20,000 | | 18,700 |
| | 40,100 |
Industrial Conglomerates - 0.2% |
Hutchison Whampoa International 03/13 Ltd. 6.5% 2/13/13 (e) | | 190,000 | | 202,736 |
Hutchison Whampoa International 03/33 Ltd. 7.45% 11/24/33 (e) | | 720,000 | | 835,641 |
| | 1,038,377 |
Machinery - 0.1% |
Accuride Corp. 8.5% 2/1/15 | | 80,000 | | 83,200 |
Commercial Vehicle Group, Inc. 8% 7/1/13 (e) | | 50,000 | | 52,000 |
Dresser, Inc. 9.375% 4/15/11 | | 15,000 | | 15,750 |
Invensys PLC 9.875% 3/15/11 (e) | | 245,000 | | 243,775 |
Navistar International Corp. 7.5% 6/15/11 | | 30,000 | | 30,750 |
Park-Ohio Industries, Inc. 8.375% 11/15/14 (e) | | 60,000 | | 56,400 |
Standard Aero Holdings, Inc. 8.25% 9/1/14 (e) | | 60,000 | | 63,600 |
Terex Corp. 7.375% 1/15/14 | | 100,000 | | 105,000 |
| | 650,475 |
Marine - 0.1% |
American Commercial Lines LLC/ACL Finance Corp. 9.5% 2/15/15 | | 110,000 | | 119,900 |
H-Lines Finance Holding Corp. 0% 4/1/13 (c)(e) | | 40,000 | | 32,100 |
Nonconvertible Bonds - continued |
| Principal Amount | | Value (Note 1) |
INDUSTRIALS - continued |
Marine - continued |
Horizon Lines LLC/Holdings Corp. 9% 11/1/12 (e) | | $ 40,000 | | $ 43,000 |
OMI Corp. 7.625% 12/1/13 | | 95,000 | | 96,663 |
| | 291,663 |
Road & Rail - 0.1% |
Kansas City Southern Railway Co. 7.5% 6/15/09 | | 100,000 | | 103,000 |
Progress Rail Services Corp./Progress Metal Reclamation Co. 7.75% 4/1/12 (e) | | 100,000 | | 102,250 |
TFM SA de CV 9.375% 5/1/12 (e) | | 85,000 | | 90,950 |
| | 296,200 |
Trading Companies & Distributors - 0.0% |
Ashtead Holdings PLC 8.625% 8/1/15 (e)(f) | | 75,000 | | 77,625 |
Neff Rent LLC/Neff Finance Corp. 11.25% 6/15/12 (e) | | 50,000 | | 51,750 |
| | 129,375 |
TOTAL INDUSTRIALS | | 6,819,962 |
INFORMATION TECHNOLOGY - 0.4% |
Communications Equipment - 0.1% |
L-3 Communications Corp. 6.375% 10/15/15 (e) | | 120,000 | | 121,350 |
Nortel Networks Corp. 6.125% 2/15/06 | | 65,000 | | 65,325 |
| | 186,675 |
Electronic Equipment & Instruments - 0.0% |
Celestica, Inc. 7.875% 7/1/11 | | 100,000 | | 103,250 |
IT Services - 0.1% |
Iron Mountain, Inc. 6.625% 1/1/16 | | 120,000 | | 113,400 |
SunGard Data Systems, Inc.: | | | | |
9.125% 8/15/13 (e)(f) | | 225,000 | | 233,438 |
10.25% 8/15/15 (e)(f) | | 210,000 | | 217,875 |
| | 564,713 |
Office Electronics - 0.1% |
Xerox Capital Trust I 8% 2/1/27 | | 130,000 | | 135,200 |
Xerox Corp.: | | | | |
7.125% 6/15/10 | | 20,000 | | 21,200 |
7.2% 4/1/16 | | 165,000 | | 179,850 |
7.625% 6/15/13 | | 60,000 | | 63,900 |
| | 400,150 |
Semiconductors & Semiconductor Equipment - 0.1% |
Amkor Technology, Inc. 7.75% 5/15/13 | | 65,000 | | 55,575 |
Nonconvertible Bonds - continued |
| Principal Amount | | Value (Note 1) |
INFORMATION TECHNOLOGY - continued |
Semiconductors & Semiconductor Equipment - continued |
Freescale Semiconductor, Inc. 7.125% 7/15/14 | | $ 60,000 | | $ 64,200 |
MagnaChip Semiconductor SA/MagnaChip Semiconductor Finance Co.: | | | | |
6.875% 12/15/11 (e) | | 25,000 | | 24,750 |
8% 12/15/14 (e) | | 80,000 | | 77,400 |
New ASAT Finance Ltd. 9.25% 2/1/11 | | 60,000 | | 48,600 |
Viasystems, Inc. 10.5% 1/15/11 | | 140,000 | | 137,200 |
| | 407,725 |
TOTAL INFORMATION TECHNOLOGY | | 1,662,513 |
MATERIALS - 1.3% |
Chemicals - 0.5% |
BCP Crystal U.S. Holdings Corp. 9.625% 6/15/14 | | 110,000 | | 124,300 |
Berry Plastics Corp. 10.75% 7/15/12 | | 80,000 | | 87,600 |
Borden US Finance Corp./Nova Scotia Finance ULC: | | | | |
8.3488% 7/15/10 (e)(i) | | 70,000 | | 69,300 |
9% 7/15/14 (e) | | 70,000 | | 72,100 |
Braskem SA 11.75% 1/22/14 (e) | | 25,000 | | 29,500 |
Crystal US Holding 3 LLC/Crystal US Sub 3 Corp. Series B, 0% 10/1/14 (c) | | 100,000 | | 72,000 |
Equistar Chemicals LP: | | | | |
6.5% 2/15/06 | | 75,000 | | 75,375 |
7.55% 2/15/26 | | 100,000 | | 93,500 |
Equistar Chemicals LP/Equistar Funding Corp. 10.625% 5/1/11 | | 145,000 | | 161,313 |
Georgia Gulf Corp. 7.125% 12/15/13 | | 90,000 | | 94,500 |
Huntsman International LLC 9.875% 3/1/09 | | 115,000 | | 122,906 |
Innophos, Inc. 8.875% 8/15/14 (e) | | 30,000 | | 30,825 |
Lyondell Chemical Co.: | | | | |
9.625% 5/1/07 | | 200,000 | | 212,500 |
10.875% 5/1/09 | | 55,000 | | 56,925 |
Millennium America, Inc. 9.25% 6/15/08 | | 230,000 | | 251,275 |
Nalco Co.: | | | | |
7.75% 11/15/11 | | 130,000 | | 138,450 |
8.875% 11/15/13 | | 100,000 | | 109,000 |
Pliant Corp. 0% 6/15/09 (c) | | 60,000 | | 53,400 |
Resolution Performance Products LLC/RPP Capital Corp.: | | | | |
9.5% 4/15/10 | | 70,000 | | 72,625 |
13.5% 11/15/10 | | 35,000 | | 37,800 |
Nonconvertible Bonds - continued |
| Principal Amount | | Value (Note 1) |
MATERIALS - continued |
Chemicals - continued |
Rockwood Specialties Group, Inc. 7.5% 11/15/14 (e) | | $ 50,000 | | $ 50,250 |
Solutia, Inc. 7.375% 10/15/27 (b) | | 20,000 | | 16,400 |
| | 2,031,844 |
Construction Materials - 0.0% |
Texas Industries, Inc. 7.25% 7/15/13 (e) | | 30,000 | | 31,650 |
Containers & Packaging - 0.3% |
AEP Industries, Inc. 7.875% 3/15/13 (e) | | 30,000 | | 30,000 |
BWAY Corp. 10% 10/15/10 | | 105,000 | | 111,300 |
Crown Cork & Seal, Inc. 8% 4/15/23 | | 105,000 | | 105,000 |
Crown European Holdings SA 9.5% 3/1/11 | | 35,000 | | 38,588 |
Graham Packaging Co. LP/ GPC Capital Corp.: | | | | |
8.5% 10/15/12 (e) | | 50,000 | | 51,250 |
9.875% 10/15/14 (e) | | 95,000 | | 97,375 |
Graphic Packaging International, Inc.: | | | | |
8.5% 8/15/11 | | 120,000 | | 125,400 |
9.5% 8/15/13 | | 170,000 | | 175,100 |
Jefferson Smurfit Corp. U.S. 7.5% 6/1/13 | | 15,000 | | 14,381 |
Owens-Brockway Glass Container, Inc.: | | | | |
8.25% 5/15/13 | | 15,000 | | 16,238 |
8.875% 2/15/09 | | 50,000 | | 52,875 |
Owens-Illinois, Inc.: | | | | |
7.35% 5/15/08 | | 50,000 | | 52,125 |
7.5% 5/15/10 | | 95,000 | | 99,156 |
7.8% 5/15/18 | | 45,000 | | 46,800 |
8.1% 5/15/07 | | 110,000 | | 114,400 |
Tekni-Plex, Inc. 10.875% 8/15/12 (e) | | 40,000 | | 43,100 |
| | 1,173,088 |
Metals & Mining - 0.3% |
Aleris International, Inc. 9% 11/15/14 | | 20,000 | | 20,900 |
California Steel Industries, Inc. 6.125% 3/15/14 | | 40,000 | | 37,200 |
Century Aluminum Co. 7.5% 8/15/14 | | 40,000 | | 41,000 |
Corporacion Nacional del Cobre (Codelco) 6.375% 11/30/12 (e) | | 335,000 | | 362,849 |
CSN Islands VIII Corp. 9.75% 12/16/13 (e) | | 25,000 | | 26,563 |
Freeport-McMoRan Copper & Gold, Inc.: | | | | |
6.875% 2/1/14 | | 75,000 | | 73,969 |
10.125% 2/1/10 | | 45,000 | | 50,063 |
Gerdau AmeriSteel Corp./GUSAP Partners 10.375% 7/15/11 | | 50,000 | | 55,250 |
Nonconvertible Bonds - continued |
| Principal Amount | | Value (Note 1) |
MATERIALS - continued |
Metals & Mining - continued |
Newmont Mining Corp. 5.875% 4/1/35 | | $ 405,000 | | $ 407,120 |
Novelis, Inc. 7.25% 2/15/15 (e) | | 110,000 | | 112,200 |
Wise Metals Group LLC/Alloys Finance 10.25% 5/15/12 | | 110,000 | | 103,400 |
| | 1,290,514 |
Paper & Forest Products - 0.2% |
Boise Cascade Corp. 8% 2/24/06 | | 25,000 | | 25,625 |
Boise Cascade LLC/Boise Cascade Finance Corp.: | | | | |
6.4738% 10/15/12 (i) | | 30,000 | | 30,300 |
7.125% 10/15/14 | | 30,000 | | 29,475 |
Buckeye Technologies, Inc. 8.5% 10/1/13 | | 200,000 | | 204,250 |
Georgia-Pacific Corp.: | | | | |
7.375% 12/1/25 | | 15,000 | | 16,219 |
7.5% 5/15/06 | | 50,000 | | 51,125 |
7.75% 11/15/29 | | 10,000 | | 11,200 |
8% 1/15/24 | | 130,000 | | 149,175 |
8.125% 5/15/11 | | 5,000 | | 5,594 |
Millar Western Forest Products Ltd. 7.75% 11/15/13 | | 120,000 | | 113,400 |
Norske Skog Canada Ltd. 7.375% 3/1/14 | | 40,000 | | 39,700 |
Solo Cup Co. 8.5% 2/15/14 | | 145,000 | | 138,838 |
Stone Container Corp. 8.375% 7/1/12 | | 200,000 | | 202,500 |
| | 1,017,401 |
TOTAL MATERIALS | | 5,544,497 |
TELECOMMUNICATION SERVICES - 2.6% |
Diversified Telecommunication Services - 2.0% |
Ameritech Capital Funding Corp. 6.25% 5/18/09 | | 35,000 | | 36,726 |
BellSouth Capital Funding Corp. 7.875% 2/15/30 | | 1,800,000 | | 2,284,409 |
British Telecommunications PLC: | | | | |
8.375% 12/15/10 | | 190,000 | | 222,019 |
8.875% 12/15/30 | | 145,000 | | 203,483 |
Empresa Brasileira de Telecomm SA 11% 12/15/08 | | 158,000 | | 178,540 |
Eschelon Operating Co. 8.375% 3/15/10 | | 70,000 | | 64,400 |
GCI, Inc. 7.25% 2/15/14 | | 50,000 | | 48,750 |
Koninklijke KPN NV yankee 8% 10/1/10 | | 500,000 | | 570,223 |
MCI, Inc. 7.688% 5/1/09 | | 36,000 | | 37,530 |
New Skies Satellites BV: | | | | |
8.5388% 11/1/11 (i) | | 100,000 | | 104,000 |
9.125% 11/1/12 | | 85,000 | | 88,400 |
Nonconvertible Bonds - continued |
| Principal Amount | | Value (Note 1) |
TELECOMMUNICATION SERVICES - continued |
Diversified Telecommunication Services - continued |
NTL Cable PLC 8.75% 4/15/14 | | $ 190,000 | | $ 202,350 |
Qwest Capital Funding, Inc.: | | | | |
7% 8/3/09 | | 50,000 | | 48,750 |
7.25% 2/15/11 | | 35,000 | | 33,775 |
7.625% 8/3/21 | | 20,000 | | 18,000 |
Qwest Communications International, Inc.: | | | | |
6.7681% 2/15/09 (i) | | 40,000 | | 40,100 |
7.5% 2/15/14 (e) | | 60,000 | | 57,600 |
7.5% 2/15/14 | | 160,000 | | 154,400 |
Qwest Corp.: | | | | |
6.6706% 6/15/13 (e)(i) | | 90,000 | | 93,825 |
7.625% 6/15/15 (e) | | 110,000 | | 113,163 |
Qwest Services Corp.: | | | | |
13.5% 12/15/10 | | 20,000 | | 23,000 |
14% 12/15/14 | | 110,000 | | 133,100 |
SBC Communications, Inc.: | | | | |
6.15% 9/15/34 | | 500,000 | | 531,455 |
6.45% 6/15/34 | | 220,000 | | 242,412 |
Sprint Capital Corp. 8.375% 3/15/12 | | 600,000 | | 711,574 |
Telecom Italia Capital: | | | | |
4.95% 9/30/14 (e) | | 415,000 | | 406,778 |
6% 9/30/34 (e) | | 500,000 | | 507,292 |
Telefonica de Argentina SA 9.125% 11/7/10 | | 95,000 | | 103,075 |
Telefonos de Mexico SA de CV 4.75% 1/27/10 (e) | | 90,000 | | 88,786 |
Telenet Group Holding NV 0% 6/15/14 (c)(e) | | 80,000 | | 64,000 |
TELUS Corp. yankee 7.5% 6/1/07 | | 180,000 | | 189,293 |
Time Warner Telecom Holdings, Inc. 9.25% 2/15/14 (e) | | 80,000 | | 81,600 |
U.S. West Capital Funding, Inc. 6.375% 7/15/08 | | 125,000 | | 122,500 |
U.S. West Communications 6.875% 9/15/33 | | 165,000 | | 141,900 |
Verizon Global Funding Corp. 7.25% 12/1/10 | | 360,000 | | 401,070 |
Verizon New York, Inc. 6.875% 4/1/12 | | 120,000 | | 130,733 |
| | 8,479,011 |
Wireless Telecommunication Services - 0.6% |
America Movil SA de CV 4.125% 3/1/09 | | 285,000 | | 276,459 |
American Tower Corp. 7.5% 5/1/12 | | 105,000 | | 112,088 |
AT&T Wireless Services, Inc. 7.875% 3/1/11 | | 455,000 | | 521,200 |
Centennial Communications Corp./Centennial Cellular Operating Co. LLC/Centennial Puerto Rico Operations Corp. 8.125% 2/1/14 (i) | | 60,000 | | 64,350 |
Nonconvertible Bonds - continued |
| Principal Amount | | Value (Note 1) |
TELECOMMUNICATION SERVICES - continued |
Wireless Telecommunication Services - continued |
DirecTV Holdings LLC/DirecTV Financing, Inc.: | | | | |
6.375% 6/15/15 (e) | | $ 30,000 | | $ 29,925 |
8.375% 3/15/13 | | 33,000 | | 36,548 |
Globe Telecom, Inc. 9.75% 4/15/12 | | 30,000 | | 32,625 |
Inmarsat Finance II PLC 0% 11/15/12 (c) | | 70,000 | | 56,000 |
Inmarsat Finance PLC 7.625% 6/30/12 | | 45,438 | | 48,107 |
Intelsat Ltd.: | | | | |
6.5% 11/1/13 | | 40,000 | | 32,550 |
7.625% 4/15/12 | | 20,000 | | 17,800 |
8.625% 1/15/15 (e) | | 195,000 | | 208,650 |
Kyivstar GSM 10.375% 8/17/09 (e) | | 100,000 | | 111,630 |
Millicom International Cellular SA 10% 12/1/13 | | 140,000 | | 145,250 |
Mobile Telesystems Finance SA: | | | | |
8% 1/28/12 (e) | | 60,000 | | 61,500 |
8.375% 10/14/10 (e) | | 170,000 | | 178,075 |
Nextel Communications, Inc. 7.375% 8/1/15 | | 150,000 | | 161,250 |
Nextel Partners, Inc. 8.125% 7/1/11 | | 85,000 | | 92,650 |
Rogers Communications, Inc.: | | | | |
6.375% 3/1/14 | | 140,000 | | 142,800 |
8% 12/15/12 | | 105,000 | | 113,269 |
9.625% 5/1/11 | | 26,000 | | 30,615 |
Rural Cellular Corp. 8.25% 3/15/12 | | 60,000 | | 63,600 |
Telemig Cellular SA/Amazonia Cellular SA 8.75% 1/20/09 (e) | | 31,000 | | 32,085 |
Western Wireless Corp. 9.25% 7/15/13 | | 175,000 | | 199,500 |
| | 2,768,526 |
TOTAL TELECOMMUNICATION SERVICES | | 11,247,537 |
UTILITIES - 2.4% |
Electric Utilities - 1.2% |
AES Gener SA 7.5% 3/25/14 | | 70,000 | | 72,275 |
Cleveland Electric Illuminating Co. 5.65% 12/15/13 | | 300,000 | | 309,783 |
Duke Capital LLC 6.75% 2/15/32 | | 1,400,000 | | 1,559,447 |
Exelon Corp.: | | | | |
4.9% 6/15/15 | | 485,000 | | 475,903 |
5.625% 6/15/35 | | 90,000 | | 88,598 |
6.75% 5/1/11 | | 420,000 | | 458,365 |
FirstEnergy Corp. 6.45% 11/15/11 | | 155,000 | | 166,683 |
Nonconvertible Bonds - continued |
| Principal Amount | | Value (Note 1) |
UTILITIES - continued |
Electric Utilities - continued |
MSW Energy Holdings II LLC/MSW Finance Co. II, Inc. 7.375% 9/1/10 | | $ 40,000 | | $ 41,600 |
MSW Energy Holdings LLC/MSW Energy Finance Co., Inc. 8.5% 9/1/10 | | 10,000 | | 10,750 |
Nevada Power Co.: | | | | |
5.875% 1/15/15 (e) | | 40,000 | | 40,700 |
6.5% 4/15/12 | | 50,000 | | 52,500 |
Oncor Electric Delivery Co. 6.375% 5/1/12 | | 45,000 | | 48,651 |
Progress Energy, Inc. 7.1% 3/1/11 | | 950,000 | | 1,043,885 |
Sierra Pacific Resources 7.803% 6/15/12 | | 40,000 | | 42,800 |
TECO Energy, Inc. 7% 5/1/12 | | 80,000 | | 86,000 |
Texas Genco LLC/Texas Genco Financing Corp. 6.875% 12/15/14 (e) | | 125,000 | | 131,250 |
TXU Energy Co. LLC 7% 3/15/13 | | 480,000 | | 531,063 |
| | 5,160,253 |
Gas Utilities - 0.0% |
Colorado Interstate Gas Co. 5.95% 3/15/15 (e) | | 60,000 | | 59,550 |
El Paso Energy Corp. 6.75% 5/15/09 | | 25,000 | | 25,094 |
Sonat, Inc.: | | | | |
6.625% 2/1/08 | | 20,000 | | 20,025 |
6.75% 10/1/07 | | 15,000 | | 15,038 |
| | 119,707 |
Independent Power Producers & Energy Traders - 0.6% |
AES Corp.: | | | | |
8.75% 6/15/08 | | 2,000 | | 2,150 |
8.75% 5/15/13 (e) | | 35,000 | | 38,763 |
8.875% 2/15/11 | | 282,000 | | 312,315 |
9% 5/15/15 (e) | | 25,000 | | 27,938 |
9.375% 9/15/10 | | 7,000 | | 7,875 |
9.5% 6/1/09 | | 19,000 | | 21,066 |
Allegheny Energy Supply Co. LLC: | | | | |
7.8% 3/15/11 | | 170,000 | | 186,150 |
8.25% 4/15/12 (e) | | 90,000 | | 101,250 |
10.25% 11/15/07 (e) | | 26,657 | | 28,990 |
13% 11/15/07 (e)(i) | | 3,339 | | 3,673 |
Constellation Energy Group, Inc. 7% 4/1/12 | | 1,050,000 | | 1,163,003 |
NRG Energy, Inc. 8% 12/15/13 | | 172,000 | | 184,040 |
Nonconvertible Bonds - continued |
| Principal Amount | | Value (Note 1) |
UTILITIES - continued |
Independent Power Producers & Energy Traders - continued |
Tenaska Alabama Partners LP 7% 6/30/21 (e) | | $ 100,000 | | $ 102,750 |
TXU Corp. 5.55% 11/15/14 (e) | | 250,000 | | 243,719 |
| | 2,423,682 |
Multi-Utilities - 0.6% |
CMS Energy Corp.: | | | | |
6.3% 2/1/12 | | 60,000 | | 60,675 |
8.5% 4/15/11 | | 45,000 | | 50,231 |
9.875% 10/15/07 | | 135,000 | | 147,825 |
Dominion Resources, Inc.: | | | | |
4.75% 12/15/10 | | 535,000 | | 531,322 |
5.15% 7/15/15 | | 500,000 | | 497,526 |
5.95% 6/15/35 | | 905,000 | | 924,867 |
6.25% 6/30/12 | | 270,000 | | 288,619 |
Utilicorp Canada Finance Corp. 7.75% 6/15/11 | | 105,000 | | 109,463 |
| | 2,610,528 |
TOTAL UTILITIES | | 10,314,170 |
TOTAL NONCONVERTIBLE BONDS (Cost $92,844,009) | 94,038,947 |
U.S. Government and Government Agency Obligations - 30.4% |
|
U.S. Government Agency Obligations - 4.0% |
Fannie Mae: | | | | |
3.25% 1/15/08 | | 8,000,000 | | 7,812,344 |
4.375% 7/17/13 | | 2,205,000 | | 2,143,699 |
4.625% 5/1/13 | | 5,000,000 | | 4,944,360 |
Federal Home Loan Bank 3.75% 9/28/06 | | 40,000 | | 39,762 |
Freddie Mac: | | | | |
5.25% 11/5/12 | | 280,000 | | 279,761 |
5.875% 3/21/11 | | 2,095,000 | | 2,221,337 |
TOTAL U.S. GOVERNMENT AGENCY OBLIGATIONS | | 17,441,263 |
U.S. Treasury Inflation Protected Obligations - 4.6% |
U.S. Treasury Inflation-Indexed Bonds 2.375% 1/15/25 | | 4,434,805 | | 4,682,155 |
U.S. Government and Government Agency Obligations - continued |
| Principal Amount | | Value (Note 1) |
U.S. Treasury Inflation Protected Obligations - continued |
U.S. Treasury Inflation-Indexed Notes: | | | | |
0.875% 4/15/10 | | $ 3,078,570 | | $ 2,957,553 |
2% 1/15/14 | | 11,889,069 | | 12,019,436 |
TOTAL U.S. TREASURY INFLATION PROTECTED OBLIGATIONS | | 19,659,144 |
U.S. Treasury Obligations - 21.8% |
U.S. Treasury Bonds 6.25% 5/15/30 | | 7,720,000 | | 9,703,677 |
U.S. Treasury Notes: | | | | |
3.125% 1/31/07 | | 40,160,000 | | 39,661,094 |
3.375% 10/15/09 | | 1,000,000 | | 970,273 |
3.625% 4/30/07 | | 7,808,000 | | 7,757,373 |
3.625% 6/30/07 (f) | | 7,111,000 | | 7,059,609 |
4.25% 8/15/13 | | 10,049,000 | | 10,061,561 |
4.75% 5/15/14 | | 15,855,000 | | 16,408,688 |
6.5% 2/15/10 | | 2,170,000 | | 2,378,609 |
TOTAL U.S. TREASURY OBLIGATIONS | | 94,000,884 |
TOTAL U.S. GOVERNMENT AND GOVERNMENT AGENCY OBLIGATIONS (Cost $131,105,466) | 131,101,291 |
U.S. Government Agency - Mortgage Securities - 25.3% |
|
Fannie Mae - 24.2% |
3.463% 4/1/34 (i) | | 155,188 | | 154,598 |
3.734% 1/1/35 (i) | | 81,020 | | 80,197 |
3.753% 10/1/33 (i) | | 57,513 | | 56,675 |
3.786% 12/1/34 (i) | | 67,601 | | 66,855 |
3.793% 6/1/34 (i) | | 269,511 | | 263,211 |
3.801% 12/1/34 (i) | | 21,120 | | 20,923 |
3.828% 1/1/35 (i) | | 64,725 | | 64,163 |
3.838% 1/1/35 (i) | | 160,045 | | 159,402 |
3.867% 1/1/35 (i) | | 90,198 | | 89,698 |
3.913% 12/1/34 (i) | | 44,713 | | 44,363 |
3.937% 10/1/34 (i) | | 60,034 | | 59,588 |
3.937% 12/1/34 (i) | | 92,940 | | 92,473 |
3.963% 1/1/35 (i) | | 125,373 | | 124,133 |
3.97% 5/1/33 (i) | | 15,574 | | 15,481 |
3.975% 1/1/35 (i) | | 64,173 | | 63,554 |
3.981% 12/1/34 (i) | | 65,505 | | 64,819 |
U.S. Government Agency - Mortgage Securities - continued |
| Principal Amount | | Value (Note 1) |
Fannie Mae - continued |
4% 8/1/20 (f) | | $ 2,895,592 | | $ 2,792,437 |
4.008% 12/1/34 (i) | | 373,367 | | 372,610 |
4.011% 1/1/35 (i) | | 43,259 | | 42,826 |
4.014% 12/1/34 (i) | | 43,068 | | 42,611 |
4.023% 2/1/35 (i) | | 47,859 | | 47,446 |
4.03% 1/1/35 (i) | | 23,990 | | 23,874 |
4.032% 12/1/34 (i) | | 43,840 | | 43,751 |
4.045% 5/1/34 (i) | | 25,362 | | 25,346 |
4.049% 2/1/35 (i) | | 45,038 | | 44,699 |
4.053% 10/1/18 (i) | | 61,942 | | 61,329 |
4.054% 1/1/35 (i) | | 44,950 | | 44,529 |
4.079% 4/1/33 (i) | | 18,339 | | 18,311 |
4.098% 1/1/35 (i) | | 90,941 | | 91,282 |
4.104% 2/1/35 (i) | | 46,625 | | 46,397 |
4.11% 2/1/35 (i) | | 46,488 | | 46,325 |
4.117% 2/1/35 (i) | | 91,838 | | 91,479 |
4.118% 1/1/35 (i) | | 102,744 | | 102,288 |
4.121% 2/1/35 (i) | | 183,102 | | 182,253 |
4.124% 1/1/35 (i) | | 110,266 | | 110,771 |
4.137% 1/1/35 (i) | | 177,027 | | 176,326 |
4.138% 2/1/35 (i) | | 112,865 | | 113,284 |
4.144% 1/1/35 (i) | | 165,216 | | 165,989 |
4.15% 11/1/34 (i) | | 83,645 | | 83,189 |
4.154% 2/1/35 (i) | | 93,461 | | 93,188 |
4.178% 1/1/35 (i) | | 188,993 | | 190,793 |
4.183% 1/1/35 (i) | | 90,084 | | 89,998 |
4.189% 11/1/34 (i) | | 34,835 | | 34,773 |
4.197% 1/1/35 (i) | | 115,561 | | 114,805 |
4.232% 3/1/34 (i) | | 56,248 | | 56,058 |
4.25% 2/1/35 (i) | | 72,107 | | 71,699 |
4.258% 10/1/34 (i) | | 149,869 | | 150,753 |
4.293% 3/1/35 (i) | | 69,874 | | 69,865 |
4.297% 7/1/34 (i) | | 57,200 | | 57,342 |
4.302% 1/1/35 (i) | | 71,234 | | 70,795 |
4.306% 8/1/33 (i) | | 123,209 | | 122,720 |
4.315% 3/1/33 (i) | | 31,176 | | 31,109 |
4.323% 5/1/35 (i) | | 91,219 | | 91,093 |
4.332% 12/1/34 (i) | | 46,562 | | 46,607 |
4.335% 2/1/35 (i) | | 45,626 | | 45,509 |
4.349% 1/1/35 (i) | | 68,741 | | 68,129 |
4.351% 1/1/35 (i) | | 70,501 | | 70,245 |
U.S. Government Agency - Mortgage Securities - continued |
| Principal Amount | | Value (Note 1) |
Fannie Mae - continued |
4.367% 2/1/34 (i) | | $ 150,340 | | $ 149,954 |
4.372% 4/1/35 (i) | | 47,281 | | 47,200 |
4.401% 2/1/35 (i) | | 95,631 | | 94,944 |
4.409% 5/1/35 (i) | | 183,454 | | 183,539 |
4.451% 6/1/33 (i) | | 46,276 | | 45,765 |
4.455% 3/1/35 (i) | | 73,725 | | 73,083 |
4.467% 10/1/34 (i) | | 325,088 | | 325,221 |
4.479% 4/1/34 (i) | | 114,089 | | 114,254 |
4.489% 8/1/34 (i) | | 201,750 | | 201,656 |
4.5% 5/1/18 to 4/1/35 | | 22,521,980 | | 21,921,930 |
4.5% 8/1/20 (f) | | 3,000,000 | | 2,950,313 |
4.5% 3/1/35 (i) | | 194,189 | | 193,523 |
4.508% 1/1/35 (i) | | 108,887 | | 109,522 |
4.528% 12/1/34 (i) | | 437,452 | | 435,753 |
4.529% 3/1/35 (i) | | 170,779 | | 170,085 |
4.538% 8/1/34 (i) | | 112,544 | | 113,173 |
4.554% 7/1/35 (i) | | 225,000 | | 225,105 |
4.564% 2/1/35 (i) | | 429,539 | | 430,042 |
4.57% 2/1/35 (i) | | 63,371 | | 63,565 |
4.604% 1/1/33 (i) | | 349,267 | | 350,263 |
4.619% 2/1/35 (i) | | 183,580 | | 182,913 |
4.645% 2/1/35 (i) | | 64,103 | | 64,462 |
4.649% 11/1/34 (i) | | 220,719 | | 221,205 |
4.687% 11/1/34 (i) | | 204,340 | | 204,606 |
4.714% 3/1/35 (i) | | 521,050 | | 523,150 |
4.74% 7/1/34 (i) | | 198,906 | | 197,588 |
4.741% 3/1/35 (i) | | 94,718 | | 94,718 |
4.823% 12/1/34 (i) | | 184,753 | | 185,403 |
4.847% 12/1/34 (i) | | 67,829 | | 68,031 |
4.898% 10/1/34 (i) | | 142,962 | | 143,698 |
5% 3/1/35 to 8/1/35 | | 20,610,101 | | 20,304,630 |
5% 8/1/35 (f) | | 9,875,320 | | 9,724,104 |
5.123% 2/1/35 (i) | | 544,160 | | 543,205 |
5.137% 5/1/35 (i) | | 93,312 | | 93,440 |
5.204% 6/1/35 (i) | | 321,987 | | 326,202 |
5.366% 12/1/32 (i) | | 91,997 | | 93,032 |
5.5% 11/1/16 to 10/1/34 | | 5,196,795 | | 5,234,994 |
5.5% 8/1/35 (f) | | 18,607,798 | | 18,712,467 |
5.817% 5/1/35 (i) | | 435,730 | | 440,363 |
6% 7/1/08 to 3/1/33 | | 8,513,123 | | 8,757,925 |
U.S. Government Agency - Mortgage Securities - continued |
| Principal Amount | | Value (Note 1) |
Fannie Mae - continued |
6.5% 6/1/09 to 1/1/33 | | $ 2,320,425 | | $ 2,407,535 |
7% 9/1/25 to 8/1/29 | | 301,767 | | 318,457 |
TOTAL FANNIE MAE | | 104,705,984 |
Freddie Mac - 1.0% |
4.106% 12/1/34 (i) | | 65,639 | | 65,241 |
4.13% 12/1/34 (i) | | 109,099 | | 108,600 |
4.223% 1/1/35 (i) | | 280,789 | | 279,777 |
4.287% 1/1/35 (i) | | 255,358 | | 255,371 |
4.3% 5/1/35 (i) | | 168,933 | | 168,068 |
4.311% 12/1/34 (i) | | 94,658 | | 94,086 |
4.312% 3/1/35 (i) | | 90,473 | | 90,187 |
4.368% 3/1/35 (i) | | 123,047 | | 121,663 |
4.4% 2/1/35 (i) | | 170,490 | | 168,625 |
4.404% 2/1/35 (i) | | 191,748 | | 191,238 |
4.446% 3/1/35 (i) | | 73,623 | | 72,777 |
4.449% 2/1/34 (i) | | 100,426 | | 100,004 |
4.49% 3/1/35 (i) | | 242,950 | | 240,824 |
4.497% 6/1/35 (i) | | 98,241 | | 98,169 |
4.498% 3/1/35 (i) | | 610,000 | | 605,997 |
4.504% 3/1/35 (i) | | 98,043 | | 97,078 |
4.565% 2/1/35 (i) | | 141,902 | | 142,091 |
5.036% 4/1/35 (i) | | 525,511 | | 528,708 |
5.223% 8/1/33 (i) | | 40,373 | | 41,246 |
6% 5/1/33 | | 814,667 | | 833,767 |
TOTAL FREDDIE MAC | | 4,303,517 |
Government National Mortgage Association - 0.1% |
7% 7/15/31 to 12/15/32 | | 242,236 | | 255,890 |
TOTAL U.S. GOVERNMENT AGENCY - MORTGAGE SECURITIES (Cost $110,321,879) | 109,265,391 |
Asset-Backed Securities - 3.2% |
|
ACE Securities Corp.: | | | | |
Series 2003-FM1 Class M2, 5.31% 11/25/32 (i) | | 40,000 | | 40,471 |
Series 2004-HE1: | | | | |
Class M1, 3.96% 2/25/34 (i) | | 125,000 | | 125,044 |
Class M2, 4.56% 2/25/34 (i) | | 125,000 | | 125,063 |
Asset-Backed Securities - continued |
| Principal Amount | | Value (Note 1) |
ACE Securities Corp.: - continued | | | | |
Series 2005-SD1 Class A1, 3.86% 11/25/50 (i) | | $ 141,526 | | $ 141,700 |
American Express Credit Account Master Trust Series 2004-C Class C, 3.8881% 2/15/12 (e)(i) | | 1,559,117 | | 1,563,718 |
AmeriCredit Automobile Receivables Trust Series 2004-1 Class D, 5.07% 7/6/10 | | 290,000 | | 289,544 |
Ameriquest Mortgage Securities, Inc. Series 2004-R2: | | | | |
Class M1, 3.89% 4/25/34 (i) | | 65,000 | | 64,997 |
Class M2, 3.94% 4/25/34 (i) | | 50,000 | | 49,998 |
Asset Backed Securities Corp. Home Equity Loan Trust: | | | | |
Series 2003-HE2 Class A2, 3.7681% 4/15/33 (i) | | 7,890 | | 7,894 |
Series 2003-HE7 Class A3, 3.7481% 12/15/33 (i) | | 75,119 | | 75,396 |
Series 2004-HE2 Class M1, 4.01% 4/25/34 (i) | | 375,000 | | 375,666 |
Bank One Issuance Trust: | | | | |
Series 2002-C1 Class C1, 4.3481% 12/15/09 (i) | | 425,000 | | 429,552 |
Series 2004-B2 Class B2, 4.37% 4/15/12 | | 900,000 | | 890,715 |
Capital One Multi-Asset Execution Trust: | | | | |
Series 2003-B1 Class B1, 4.5581% 2/17/09 (i) | | 120,000 | | 120,751 |
Series 2003-B2 Class B2, 3.5% 2/17/09 | | 60,000 | | 59,651 |
Series 2003-B4 Class B4, 4.1881% 7/15/11 (i) | | 90,000 | | 91,451 |
Series 2004-6 Class B, 4.15% 7/16/12 | | 570,000 | | 559,157 |
CDC Mortgage Capital Trust Series 2003-HE2 Class M2, 5.36% 10/25/33 (i) | | 30,000 | | 30,526 |
Chase Credit Card Master Trust Series 2003-6 Class B, 3.7381% 2/15/11 (i) | | 230,000 | | 231,735 |
Chase Credit Card Owner Trust Series 2004-1 Class B, 3.5881% 5/15/09 (i) | | 220,000 | | 219,957 |
Citibank Credit Card Issuance Trust: | | | | |
Series 2000-C2 Class C2, 4.2488% 10/15/07 (i) | | 1,000,000 | | 1,000,649 |
Series 2003-C1 Class C1, 4.65% 4/7/10 (i) | | 305,000 | | 311,297 |
Countrywide Home Loans, Inc.: | | | | |
Series 2004-2 Class M1, 3.96% 5/25/34 (i) | | 275,000 | | 275,355 |
Series 2004-3 Class M1, 3.96% 6/25/34 (i) | | 75,000 | | 75,069 |
Series 2005-1: | | | | |
Class MV1, 3.86% 7/25/35 (i) | | 185,000 | | 184,718 |
Class MV2, 3.9% 7/25/35 (i) | | 220,000 | | 219,366 |
Class MV3, 3.94% 7/25/35 (i) | | 90,000 | | 89,870 |
Crown Castle Towers LLC/Crown Atlantic Holdings Sub LLC/Crown Communication, Inc. Series 2005-1: | | | | |
Class B, 4.878% 6/15/35 (e) | | 309,000 | | 311,474 |
Class C, 5.074% 6/15/35 (e) | | 281,000 | | 282,405 |
First Franklin Mortgage Loan Trust Series 2004-FF2: | | | | |
Class M3, 4.01% 3/25/34 (i) | | 25,000 | | 25,044 |
Asset-Backed Securities - continued |
| Principal Amount | | Value (Note 1) |
First Franklin Mortgage Loan Trust Series 2004-FF2: - continued | | | | |
Class M4, 4.36% 3/25/34 (i) | | $ 25,000 | | $ 25,221 |
Fremont Home Loan Trust Series 2004-A: | | | | |
Class M1, 4.01% 1/25/34 (i) | | 225,000 | | 225,144 |
Class M2, 4.61% 1/25/34 (i) | | 275,000 | | 278,153 |
GSAMP Trust Series 2004-FM2 Class M1, 3.96% 1/25/34 (i) | | 250,000 | | 249,989 |
HFC Home Equity Loan Asset Backed Certificates Series 2005-2: | | | | |
Class M1, 3.97% 1/20/34 (i) | | 185,000 | | 185,000 |
Class M2, 4% 1/20/34 (i) | | 140,000 | | 140,000 |
Home Equity Asset Trust: | | | | |
Series 2003-2: | | | | |
Class A2, 3.84% 8/25/33 (i) | | 2,448 | | 2,457 |
Class M1, 4.34% 8/25/33 (i) | | 25,000 | | 25,271 |
Series 2003-4: | | | | |
Class M1, 4.26% 10/25/33 (i) | | 40,000 | | 40,297 |
Class M2, 5.36% 10/25/33 (i) | | 45,000 | | 45,591 |
Series 2004-3 Class M2, 4.66% 8/25/34 (i) | | 120,000 | | 122,039 |
Long Beach Mortgage Loan Trust Series 2003-3 Class M2, 5.31% 7/25/33 (i) | | 45,000 | | 45,879 |
MBNA Credit Card Master Note Trust: | | | | |
Series 2003-B2 Class B2, 3.7781% 10/15/10 (i) | | 80,000 | | 80,814 |
Series 2003-B3 Class B3, 3.7631% 1/18/11 (i) | | 285,000 | | 286,352 |
Series 2003-B5 Class B5, 3.7581% 2/15/11 (i) | | 240,000 | | 241,854 |
Meritage Mortgage Loan Trust Series 2004-1: | | | | |
Class M1, 3.96% 7/25/34 (i) | | 100,000 | | 99,996 |
Class M2, 4.01% 7/25/34 (i) | | 25,000 | | 24,999 |
Class M3, 4.41% 7/25/34 (i) | | 50,000 | | 49,998 |
Class M4, 4.56% 7/25/34 (i) | | 25,000 | | 24,999 |
Morgan Stanley ABS Capital I, Inc.: | | | | |
Series 2002-HE3 Class M1, 4.56% 12/27/32 (i) | | 90,000 | | 91,161 |
Series 2003-NC8 Class M1, 4.16% 9/25/33 (i) | | 35,000 | | 35,201 |
Morgan Stanley Dean Witter Capital I Trust: | | | | |
Series 2001-NC4 Class M1, 4.46% 1/25/32 (i) | | 39,060 | | 39,202 |
Series 2002-NC1 Class M1, 4.26% 2/25/32 (e)(i) | | 138,907 | | 140,074 |
Series 2002-NC3 Class M1, 4.18% 8/25/32 (i) | | 75,000 | | 75,576 |
Series 2003-NC2 Class M2, 5.46% 2/25/33 (i) | | 40,000 | | 40,634 |
National Collegiate Funding LLC Series 2004-GT1 Class IO1, 7.87% 6/25/10 (e)(i)(l) | | 455,000 | | 153,787 |
National Collegiate Student Loan Trust Series 2005-GT1 Class AIO, 6.75% 12/25/09 (l) | | 250,000 | | 67,324 |
Asset-Backed Securities - continued |
| Principal Amount | | Value (Note 1) |
New Century Home Equity Loan Trust Series 2003-2 Class A2, 3.89% 1/25/33 (i) | | $ 3,422 | | $ 3,423 |
NovaStar Home Equity Loan Series 2004-1: | | | | |
Class M1, 3.91% 6/25/34 (i) | | 75,000 | | 75,063 |
Class M4, 4.435% 6/25/34 (i) | | 125,000 | | 125,213 |
Park Place Securities, Inc. Series 2005-WCH1: | | | | |
Class M2, 3.98% 1/25/35 (i) | | 225,000 | | 224,544 |
Class M4, 4.29% 1/25/35 (i) | | 750,000 | | 750,878 |
Sears Credit Account Master Trust II Series 2002-4 Class A, 3.5181% 8/18/09 (i) | | 100,000 | | 99,999 |
SLM Private Credit Student Loan Trust Series 2004-A Class C, 3.96% 6/15/33 (i) | | 260,000 | | 265,580 |
Volkswagen Auto Lease Trust Series 2005-A Class A4, 3.94% 10/20/10 | | 970,000 | | 959,829 |
WFS Financial Owner Trust Series 2004-3 Class D, 4.07% 2/17/12 | | 284,404 | | 282,142 |
TOTAL ASSET-BACKED SECURITIES (Cost $13,893,498) | 13,891,916 |
Collateralized Mortgage Obligations - 3.6% |
|
Private Sponsor - 3.3% |
Adjustable Rate Mortgage Trust floater: | | | | |
Series 2005-1 Class 5A2, 3.79% 5/25/35 (i) | | 333,915 | | 334,126 |
Series 2005-2 Class 6A2, 3.74% 6/25/35 (i) | | 161,688 | | 161,793 |
Bank of America Mortgage Securities, Inc.: | | | | |
Series 2003-K: | | | | |
Class 1A1, 3.3521% 12/25/33 (i) | | 168,036 | | 166,513 |
Class 2A1, 4.1867% 12/25/33 (i) | | 298,300 | | 294,569 |
Series 2004-B: | | | | |
Class 1A1, 3.4262% 3/25/34 (i) | | 664,848 | | 656,626 |
Class 2A2, 4.1351% 3/25/34 (i) | | 204,630 | | 200,155 |
Series 2004-C Class 1A1, 3.3726% 4/25/34 (i) | | 383,241 | | 378,537 |
Series 2004-D: | | | | |
Class 1A1, 3.5597% 5/25/34 (i) | | 448,999 | | 444,076 |
Class 2A2, 4.2101% 5/25/34 (i) | | 585,166 | | 576,845 |
Series 2004-G Class 2A7, 4.6058% 8/25/34 (i) | | 621,572 | | 619,487 |
Series 2004-H Class 2A1, 4.5133% 9/25/34 (i) | | 552,389 | | 547,078 |
Bear Stearns Alt-A Trust floater Series 2005-1 Class A1, 3.74% 1/25/35 (i) | | 645,482 | | 645,482 |
CS First Boston Mortgage Securities Corp. floater: | | | | |
Series 2004-AR3 Class 6A2, 3.83% 4/25/34 (i) | | 115,778 | | 115,881 |
Collateralized Mortgage Obligations - continued |
| Principal Amount | | Value (Note 1) |
Private Sponsor - continued |
CS First Boston Mortgage Securities Corp. floater: - continued | | | | |
Series 2004-AR6 Class 9A2, 3.83% 10/25/34 (i) | | $ 213,174 | | $ 213,302 |
Granite Mortgages PLC floater Series 2004-2 Class 1C, 4.13% 6/20/44 (i) | | 194,632 | | 195,032 |
Lehman Structured Securities Corp. floater Series 2005-1 Class A2, 3.67% 9/26/45 (e)(i) | | 743,244 | | 743,244 |
Master Alternative Loan Trust Series 2004-3 Class 3A1, 6% 4/25/34 | | 76,015 | | 76,870 |
Master Asset Securitization Trust Series 2004-9 Class 7A1, 6.3188% 5/25/17 (i) | | 481,596 | | 486,800 |
Master Seasoned Securitization Trust Series 2004-1 Class 1A1, 6.2437% 8/25/17 (i) | | 371,110 | | 379,522 |
Merrill Lynch Mortgage Investors, Inc.: | | | | |
floater Series 2005-B Class A2, 3.75% 6/25/30 (i) | | 629,385 | | 629,385 |
Series 2003-E Class XA1, 1% 10/25/28 (i)(l) | | 1,302,816 | | 15,846 |
Series 2003-G Class XA1, 1% 1/25/29 (l) | | 1,833,562 | | 23,767 |
Series 2003-H Class XA1, 1% 1/25/29 (e)(l) | | 1,474,148 | | 19,285 |
Opteum Mortgage Acceptance Corp. floater Series 2005-3 Class APT, 3.75% 6/25/35 (i) | | 367,832 | | 368,047 |
Residential Asset Mortgage Products, Inc. sequential pay: | | | | |
Series 2003-SL1 Class A31, 7.125% 4/25/31 | | 518,998 | | 528,368 |
Series 2004-SL2 Class A1, 6.5% 10/25/16 | | 71,407 | | 72,543 |
Residential Finance LP/Residential Finance Development Corp. floater: | | | | |
Series 2003-CB1: | | | | |
Class B3, 4.8% 6/10/35 (e)(i) | | 43,397 | | 44,156 |
Class B4, 5% 6/10/35 (e)(i) | | 38,575 | | 39,298 |
Class B5, 5.6% 6/10/35 (e)(i) | | 28,931 | | 29,546 |
Class B6, 6.1% 6/10/35 (e)(i) | | 14,466 | | 14,773 |
Series 2004-B: | | | | |
Class B4, 4.45% 2/10/36 (e)(i) | | 98,295 | | 99,770 |
Class B5, 4.9% 2/10/36 (e)(i) | | 98,295 | | 100,015 |
Class B6, 5.35% 2/10/36 (e)(i) | | 98,295 | | 100,138 |
Series 2004-C: | | | | |
Class B4, 4.3% 9/10/36 (i) | | 98,887 | | 100,123 |
Class B5, 4.7% 9/10/36 (i) | | 98,887 | | 100,000 |
Class B6, 5.1% 9/10/36 (i) | | 98,887 | | 100,370 |
Sequoia Mortgage Funding Trust Series 2003-A Class AX1, 0.8% 10/21/08 (e)(l) | | 3,273,870 | | 24,731 |
Sequoia Mortgage Trust floater Series 2005-2 Class A2, 3.36% 3/20/35 (i) | | 549,984 | | 549,984 |
Collateralized Mortgage Obligations - continued |
| Principal Amount | | Value (Note 1) |
Private Sponsor - continued |
Structured Adjustable Rate Mortgage Loan Trust floater Series 2001-14 Class A1, 3.77% 7/25/35 (i) | | $ 1,163,940 | | $ 1,163,940 |
Washington Mutual Mortgage Securities Corp. sequential pay: | | | | |
Series 2003-MS9 Class 2A1, 7.5% 12/25/33 | | 59,087 | | 61,232 |
Series 2004-RA2 Class 2A, 7% 7/25/33 | | 121,414 | | 124,065 |
Wells Fargo Mortgage Backed Securities Trust: | | | | |
Series 2004-T Class A1, 3.4526% 9/25/34 (i) | | 581,105 | | 578,530 |
Series 2005-AR10 Class 2A2, 4.111% 6/25/35 (i) | | 952,333 | | 939,034 |
Series 2005-AR12 Class 2A6, 4.322% 7/25/35 (i) | | 906,327 | | 894,687 |
Series 2005-AR9 Class 2A1, 4.3621% 5/25/35 (i) | | 395,715 | | 392,917 |
TOTAL PRIVATE SPONSOR | | 14,350,488 |
U.S. Government Agency - 0.3% |
Fannie Mae guaranteed REMIC pass thru certificates planned amortization class Series 2004-81 Class KD, 4.5% 4/25/17 | | 1,050,000 | | 1,036,840 |
Freddie Mac Multi-class participation certificates guaranteed sequential pay Series 2750 Class ZT, 5% 2/15/34 | | 391,734 | | 359,862 |
Ginnie Mae guaranteed Multi-family pass thru securities sequential pay Series 2002-35 Class C, 5.8918% 10/16/23 (i) | | 25,000 | | 25,921 |
Ginnie Mae guaranteed REMIC pass thru securities planned amortization class Series 2003-75 Class LI, 5.5% 10/20/21 (l) | | 503,202 | | 230 |
TOTAL U.S. GOVERNMENT AGENCY | | 1,422,853 |
TOTAL COLLATERALIZED MORTGAGE OBLIGATIONS (Cost $15,858,005) | 15,773,341 |
Commercial Mortgage Securities - 2.5% |
|
Banc of America Large Loan, Inc. floater: | | | | |
Series 2003-BBA2: | | | | |
Class C, 3.8581% 11/15/15 (e)(i) | | 50,000 | | 50,183 |
Class D, 3.9381% 11/15/15 (e)(i) | | 80,000 | | 80,456 |
Class F, 4.2881% 11/15/15 (e)(i) | | 60,000 | | 60,421 |
Class H, 4.7881% 11/15/15 (e)(i) | | 50,000 | | 50,297 |
Class J, 5.3381% 11/15/15 (e)(i) | | 55,000 | | 55,330 |
Class K, 5.82% 11/15/15 (e)(i) | | 50,000 | | 49,684 |
Commercial Mortgage Securities - continued |
| Principal Amount | | Value (Note 1) |
Banc of America Large Loan, Inc. floater: - continued | | | | |
Series 2005-BOCA: | | | | |
Class D, 3.7181% 12/15/16 (e)(i) | | $ 110,000 | | $ 110,055 |
Class E, 3.8081% 12/15/16 (e)(i) | | 100,000 | | 100,077 |
Class F, 3.8881% 12/15/16 (e)(i) | | 110,000 | | 110,100 |
Class H, 4.3381% 12/15/16 (e)(i) | | 120,000 | | 119,816 |
Class K, 4.7381% 12/15/16 (e)(i) | | 105,000 | | 104,868 |
Bayview Commercial Asset Trust: | | | | |
floater: | | | | |
Series 2004-1 Class A, 3.82% 4/25/34 (e)(i) | | 332,648 | | 333,233 |
Series 2004-2 Class A, 3.89% 8/25/34 (e)(i) | | 357,944 | | 359,705 |
Series 2004-3: | | | | |
Class A1, 3.83% 1/25/35 (e)(i) | | 333,894 | | 335,063 |
Class A2, 3.88% 1/25/35 (e)(i) | | 47,699 | | 47,867 |
Class M1, 3.96% 1/25/35 (e)(i) | | 47,699 | | 47,764 |
Class M2, 4.46% 1/25/35 (e)(i) | | 47,699 | | 47,983 |
Series 2004-1 Class IO, 1.25% 4/25/34 (e)(l) | | 3,635,356 | | 213,130 |
Bear Stearns Commercial Mortgage Securities, Inc.: | | | | |
sequential pay Series 2004-ESA Class A3, 4.741% 5/14/16 (e) | | 180,000 | | 180,489 |
Series 2004-ESA: | | | | |
Class B, 4.888% 5/14/16 (e) | | 325,000 | | 327,429 |
Class C, 4.937% 5/14/16 (e) | | 205,000 | | 206,951 |
Class D, 4.986% 5/14/16 (e) | | 75,000 | | 75,483 |
Class E, 5.064% 5/14/16 (e) | | 230,000 | | 231,631 |
Class F, 5.182% 5/14/16 (e) | | 55,000 | | 55,483 |
COMM floater Series 2002-FL7 Class D, 3.9581% 11/15/14 (e)(i) | | 125,000 | | 125,054 |
Commercial Mortgage pass thru certificates floater Series 2004-CNL: | | | | |
Class B, 3.7881% 9/15/14 (e)(i) | | 105,000 | | 105,042 |
Class D, 4.0281% 9/15/14 (e)(i) | | 30,000 | | 30,009 |
Class E, 4.0881% 9/15/14 (e)(i) | | 45,000 | | 45,033 |
Class F, 4.1881% 9/15/14 (e)(i) | | 35,000 | | 35,020 |
Class G, 4.3681% 9/15/14 (e)(i) | | 80,000 | | 80,032 |
Class H, 4.4681% 9/15/14 (e)(i) | | 85,000 | | 85,034 |
Class J, 4.9881% 9/15/14 (e)(i) | | 30,000 | | 30,095 |
Class K, 5.3881% 9/15/14 (e)(i) | | 45,000 | | 45,093 |
Class L, 5.5881% 9/15/14 (e)(i) | | 35,000 | | 34,983 |
CS First Boston Mortgage Securities Corp.: | | | | |
sequential pay: | | | | |
Series 1997-C2 Class A2, 6.52% 1/17/35 | | 30,736 | | 30,982 |
Series 2004-C1 Class A4, 4.75% 1/15/37 | | 695,000 | | 686,789 |
Commercial Mortgage Securities - continued |
| Principal Amount | | Value (Note 1) |
CS First Boston Mortgage Securities Corp.: - continued | | | | |
Series 2003-TFLA Class G, 3.7357% 4/15/13 (e)(i) | | $ 22,400 | | $ 22,331 |
Fannie Mae sequential pay Series 1999-10 Class MZ, 6.5% 9/17/38 | | 757,908 | | 818,204 |
Ginnie Mae guaranteed REMIC pass thru securities: | | | | |
sequential pay: | | | | |
Series 2003-22 Class B, 3.963% 5/16/32 | | 60,000 | | 57,909 |
Series 2003-36 Class C, 4.254% 2/16/31 | | 55,000 | | 53,609 |
Series 2003-47 Class C, 4.227% 10/16/27 | | 105,000 | | 103,082 |
Series 2003-59 Class D, 3.654% 10/16/27 | | 115,000 | | 108,543 |
Series 2003-47 Class XA, 0.1927% 6/16/43 (i)(l) | | 5,638,415 | | 265,400 |
GS Mortgage Securities Corp. II sequential pay: | | | | |
Series 2001-LIBA Class A2, 6.615% 2/14/16 (e) | | 385,000 | | 420,722 |
Series 2003-C1 Class A2A, 3.59% 1/10/40 | | 65,000 | | 63,719 |
Hilton Hotel Pool Trust Series 2000-HLTA Class D, 7.555% 10/3/15 (e) | | 370,000 | | 403,297 |
Host Marriot Pool Trust sequential pay Series 1999-HMTA Class D, 7.97% 8/3/15 (e) | | 110,000 | | 119,163 |
Leafs CMBS I Ltd./Leafs CMBS I Corp. Series 2002-1A Class C, 4.13% 11/20/37 (e) | | 200,000 | | 180,420 |
Morgan Stanley Capital I, Inc. Series 2005-IQ9 Class X2, 1.2036% 7/15/56 (e)(i)(l) | | 3,920,000 | | 199,369 |
Mortgage Capital Funding, Inc. sequential pay Series 1998-MC2 Class A2, 6.423% 6/18/30 | | 319,331 | | 332,253 |
Trizechahn Office Properties Trust Series 2001-TZHA: | | | | |
Class C3, 6.522% 3/15/13 (e) | | 25,000 | | 25,720 |
Class C4, 6.893% 5/15/16 (e) | | 500,000 | | 547,173 |
Class E3, 7.253% 3/15/13 (e) | | 235,000 | | 243,947 |
Wachovia Bank Commercial Mortgage Trust: | | | | |
sequential pay Series 2003-C8 Class A3, 4.445% 11/15/35 | | 785,000 | | 773,341 |
Series 2004-C15: | | | | |
Class 180A, 5.5782% 10/15/41 (e)(i) | | 1,000,000 | | 984,198 |
Class 180B, 5.5782% 10/15/41 (e)(i) | | 500,000 | | 492,099 |
TOTAL COMMERCIAL MORTGAGE SECURITIES (Cost $11,297,120) | 10,901,163 |
Foreign Government and Government Agency Obligations - 2.5% |
|
Argentine Republic: | | | | |
3% 4/30/13 (i) | | 90,000 | | 73,224 |
3.01% 8/3/12 (i) | | 400,000 | | 312,600 |
Foreign Government and Government Agency
Obligations - continued |
| Principal Amount | | Value (Note 1) |
Argentine Republic: - continued | | | | |
discount 8.28% (with partial capitalization through 12/31/2013) 12/31/33 unit (j) | | $ 215,346 | | $ 208,024 |
par 1.33% 12/31/38 unit (d)(j) | | 50,116 | | 17,942 |
Brazilian Federative Republic: | | | | |
Brady: | | | | |
debt conversion bond 4.3125% 4/15/12 (i) | | 131,766 | | 127,484 |
par Z-L 6% 4/15/24 | | 265,000 | | 251,088 |
8% 1/15/18 | | 514,000 | | 521,068 |
10.5% 7/14/14 | | 125,000 | | 145,250 |
11% 1/11/12 | | 60,000 | | 70,800 |
11% 8/17/40 | | 470,000 | | 552,250 |
12.25% 3/6/30 | | 105,000 | | 137,025 |
12.75% 1/15/20 | | 75,000 | | 99,675 |
14.5% 10/15/09 | | 75,000 | | 96,488 |
Central Bank of Nigeria promissory note 5.092% 1/5/10 | | 113,447 | | 108,728 |
Chilean Republic 7.125% 1/11/12 | | 1,250,000 | | 1,406,625 |
Colombian Republic: | | | | |
10.75% 1/15/13 | | 150,000 | | 179,250 |
11.75% 2/25/20 | | 80,000 | | 103,600 |
Dominican Republic: | | | | |
Brady 3.9425% 8/30/09 (i) | | 116,248 | | 112,761 |
4.375% 8/30/24 (i) | | 250,000 | | 231,250 |
Ecuador Republic: | | | | |
8% 8/15/30 (Reg. S) (d) | | 45,000 | | 38,700 |
12% 11/15/12 (Reg. S) | | 45,000 | | 44,213 |
euro par 5% 2/28/25 | | 15,000 | | 10,875 |
Indonesian Republic 7.25% 4/20/15 (e) | | 30,000 | | 30,300 |
Israeli State 4.625% 6/15/13 | | 20,000 | | 19,363 |
Korean Republic 4.875% 9/22/14 | | 195,000 | | 193,585 |
Lebanese Republic: | | | | |
6.77% 11/30/09 (e)(i) | | 70,000 | | 70,175 |
6.77% 11/30/09 (i) | | 235,000 | | 235,588 |
Panamanian Republic Brady discount 4.6875% 7/17/26 (i) | | 25,000 | | 23,375 |
Peruvian Republic: | | | | |
7.35% 7/21/25 | | 100,000 | | 99,750 |
9.125% 2/21/12 | | 75,000 | | 88,688 |
9.875% 2/6/15 | | 45,000 | | 55,800 |
Foreign Government and Government Agency
Obligations - continued |
| Principal Amount | | Value (Note 1) |
Philippine Republic: | | | | |
Brady principal collateralized interest reduction bond 6.5% 12/1/17 | | $ 120,000 | | $ 119,400 |
8.375% 2/15/11 | | 360,000 | | 370,350 |
9% 2/15/13 | | 100,000 | | 105,000 |
9.875% 1/15/19 | | 90,000 | | 96,863 |
10.625% 3/16/25 | | 95,000 | | 105,213 |
Republic of Serbia 3.75% 11/1/24 (d)(e) | | 50,000 | | 43,063 |
Russian Federation: | | | | |
5% 3/31/30 (Reg. S) (d) | | 762,000 | | 845,344 |
11% 7/24/18 (Reg. S) | | 35,000 | | 51,888 |
12.75% 6/24/28 (Reg. S) | | 120,000 | | 215,850 |
euro 10% 6/26/07 | | 60,000 | | 65,550 |
Turkish Republic: | | | | |
11% 1/14/13 | | 230,000 | | 290,375 |
11.5% 1/23/12 | | 25,000 | | 31,688 |
11.75% 6/15/10 | | 305,000 | | 378,200 |
11.875% 1/15/30 | | 100,000 | | 142,500 |
Ukraine Government: | | | | |
6.365% 8/5/09 (i) | | 200,000 | | 216,800 |
7.65% 6/11/13 (Reg. S) | | 100,000 | | 110,000 |
United Mexican States: | | | | |
4.625% 10/8/08 | | 70,000 | | 69,615 |
5.875% 1/15/14 | | 85,000 | | 86,998 |
6.75% 9/27/34 | | 170,000 | | 179,180 |
7.5% 1/14/12 | | 100,000 | | 111,700 |
Uruguay Republic 7.25% 2/15/11 | | 60,000 | | 61,200 |
Venezuelan Republic: | | | | |
Discount A, 4.25% 3/31/20 (i) | | 250,000 | | 246,875 |
4.64% 4/20/11 (i) | | 80,000 | | 74,200 |
5.375% 8/7/10 | | 105,000 | | 98,490 |
9.25% 9/15/27 | | 90,000 | | 93,825 |
10.75% 9/19/13 | | 240,000 | | 279,120 |
13.625% 8/15/18 | | 93,000 | | 125,085 |
euro Brady par W-B 6.75% 3/31/20 | | 250,000 | | 250,000 |
Vietnamese Socialist Republic Brady par 3.75% 3/12/28 (d) | | 90,000 | | 67,275 |
TOTAL FOREIGN GOVERNMENT AND GOVERNMENT AGENCY OBLIGATIONS (Cost $9,844,940) | 10,597,191 |
Common Stocks - 0.0% |
| | Shares | | Value (Note 1) |
CONSUMER STAPLES - 0.0% |
Personal Products - 0.0% |
Revlon, Inc. Class A (sub. vtg.) (a) | | 18,648 | | $ 69,744 |
TOTAL COMMON STOCKS (Cost $36,503) | | 69,744 |
Sovereign Loan Participations - 0.0% |
| Principal Amount | | |
Indonesian Republic loan participation: | | | | |
- Credit Suisse First Boston 4.375% 3/28/13 (i) | | $ 117,509 | | 109,871 |
- Deutsche Bank 4.375% 3/28/13 (i) | | 13,831 | | 12,932 |
TOTAL SOVEREIGN LOAN PARTICIPATIONS (Cost $113,638) | 122,803 |
Fixed-Income Funds - 12.5% |
| | Shares | | |
Fidelity Ultra-Short Central Fund (k)
(Cost $53,999,944) | | 542,844 | | 54,002,121 |
Cash Equivalents - 6.9% |
| | Maturity Amount | | |
Investments in repurchase agreements (Collateralized by U.S. Government Obligations, in a joint trading account at 3.32%, dated 7/29/05 due 8/1/05)
(Cost $29,592,000) | | $ 29,600,176 | | 29,592,000 |
TOTAL INVESTMENT PORTFOLIO - 108.7% (Cost $468,907,002) | | | 469,355,908 |
NET OTHER ASSETS - (8.7)% | | | (37,597,242) |
NET ASSETS - 100% | | $ 431,758,666 |
Swap Agreements |
| Expiration Date | | Notional Amount | | Value |
Credit Default Swap |
Receive quarterly a fixed rate of .4% multiplied by the notional amount and pay to Merrill Lynch, Inc., upon each default event of one of the issues of Dow Jones CDX N.A. Investment Grade 4, par value of the proportional notional amount (h) | June 2010 | | $ 4,500,000 | | $ (18,576) |
Receive quarterly a fixed rate of .5% multiplied by the notional amount and pay to Merrill Lynch, Inc., upon each default event of one of the issues of Dow Jones CDX N.A. Investment Grade 3, par value of the proportional notional amount (g) | March 2010 | | 1,250,000 | | 951 |
Receive quarterly a fixed rate of .65% multiplied by the notional amount and pay to Merrill Lynch, Inc., upon each default event of one of the issues of Dow Jones CDX N.A. Investment Grade 4, par value of the proportional notional amount (h) | June 2015 | | 12,500,000 | | (85,880) |
Receive quarterly a fixed rate of .7% multiplied by the notional amount and pay to Deutsche Bank, upon each default event of one of the issues of Dow Jones CDX N.A. Investment Grade 3, par value of the proportional notional amount (g) | March 2015 | | 1,250,000 | | (2,759) |
Receive quarterly notional amount multiplied by .35% and pay Goldman Sachs upon default event of Southern California Edison Co., par value of the notional amount of Southern California Edison Co. 7.625% 1/15/10 | Sept. 2010 | | 400,000 | | (157) |
Receive quarterly notional amount multiplied by .42% and pay Morgan Stanley, Inc. upon default event of Sempra Energy, par value of the notional amount of Sempra Energy 6% 2/1/13 | Sept. 2010 | | 600,000 | | 98 |
Receive quarterly notional amount multiplied by .48% and pay JPMorgan Chase, Inc. upon default event of Fannie Mae, par value of the notional amount of Fannie Mae 4.625% 5/1/13 | June 2010 | | 1,000,000 | | 9,039 |
TOTAL CREDIT DEFAULT SWAP | 21,500,000 | | (97,284) |
Swap Agreements - continued |
| Expiration Date | | Notional Amount | | Value |
Interest Rate Swap |
Receive quarterly a fixed rate equal to 4.3875% and pay quarterly a floating rate based on 3-month LIBOR with Credit Suisse First Boston | March 2010 | | $ 1,250,000 | | $ (4,655) |
Receive quarterly a fixed rate equal to 4.774% and pay quarterly a floating rate based on 3-month LIBOR with Credit Suisse First Boston | March 2015 | | 1,250,000 | | 11,777 |
Receive quarterly a fixed rate equal to 4.898% and pay quarterly a floating rate based on 3-month LIBOR with Lehman Brothers, Inc. | July 2014 | | 1,135,000 | | 19,725 |
TOTAL INTEREST RATE SWAP | 3,635,000 | | 26,847 |
Total Return Swap |
Receive monthly a return equal to Banc of America Securities LLC AAA 10 Yr Commercial Mortgage Backed Securities Daily Index and pay monthly a floating rate based on 1-month LIBOR minus 40 basis points with Bank of America | March 2006 | | 1,000,000 | | (16,398) |
Receive monthly a return equal to Lehman Brothers CMBS AAA 8.5+ Index and pay monthly a floating rate based on 1-month LIBOR minus 20 basis points with Citibank | Oct. 2005 | | 1,000,000 | | (24,809) |
Receive monthly a return equal to Lehman Brothers CMBS U.S. Aggregate Index and pay monthly a floating rate based on 1-month LIBOR minus 10 basis points with Citibank | Oct. 2005 | | 355,000 | | (5,703) |
Receive monthly a return equal to Lehman Brothers CMBS U.S. Aggregate Index and pay monthly a floating rate based on 1-month LIBOR minus 20 basis points with Lehman Brothers, Inc. | March 2006 | | 145,000 | | (2,279) |
Receive monthly a return equal to Lehman Brothers Commercial Mortgage Backed Securities AAA Daily Index and pay monthly a floating rate based on 1-month LIBOR minus 25 basis points with Bank of America | Dec. 2005 | | 600,000 | | (9,628) |
Swap Agreements - continued |
| Expiration Date | | Notional Amount | | Value |
Total Return Swap - continued |
Receive monthly a return equal to Banc of America Securities LLC AAA 10yr Commercial Mortgage Backed Securities Daily Index and pay monthly a floating rate based on 1-month LIBOR minus 20 basis points with Bank of America | July 2006 | | $ 1,000,000 | | $ (8,117) |
Receive quarterly a return equal to Banc of America Securities LLC AAA 10 Yr Commercial Mortgage Backed Securities Daily Index and pay quarterly a floating rate based on 3-month LIBOR minus 40 basis points with Bank of America | Nov. 2005 | | 2,000,000 | | (7,836) |
TOTAL TOTAL RETURN SWAP | 6,100,000 | | (74,770) |
| | $ 31,235,000 | | $ (145,207) |
Legend |
(a) Non-income producing |
(b) Non-income producing - issuer filed for bankruptcy or is in default of interest payments. |
(c) Debt obligation initially issued in zero coupon form which converts to coupon form at a specified rate and date. The rate shown is the rate at period end. |
(d) Debt obligation initially issued at one coupon which converts to a higher coupon at a specified date. The rate shown is the rate at period end. |
(e) Security exempt from registration under Rule 144A of the Securities Act of 1933. These securities may be resold in transactions exempt from registration, normally to qualified institutional buyers. At the period end, the value of these securities amounted to $28,129,389 or 6.5% of net assets. |
(f) Security or a portion of the security purchased on a delayed delivery or when-issued basis. |
(g) Dow Jones CDX N.A. Investment Grade 3 is a tradable index of credit default swaps on investment grade debt of U.S. companies. |
(h) Dow Jones CDX N.A. Investment Grade 4 is a tradable index of credit default swaps on investment grade debt of U.S. companies. |
(i) The coupon rate shown on floating or adjustable rate securities represents the rate at period end. |
(j) Includes attached Argentine Republic Gross Domestic Product-Linked Securities, expiring 12/15/35. |
(k) Affiliated fund that is available only to investment companies and other accounts managed by Fidelity Investments. A complete listing of the fixed-income central fund's holdings is provided at the end of this report. |
(l) Security represents right to receive monthly interest payments on an underlying pool of mortgages. Principal shown is the par amount of the mortgage pool. |
See accompanying notes which are an integral part of the financial statements.
Annual Report
Financial Statements
Statement of Assets and Liabilities
| July 31, 2005 |
| | |
Assets | | |
Investment in securities, at value (including repurchase agreements of $29,592,000) (cost $468,907,002) - See accompanying schedule | | $ 469,355,908 |
Cash | | 764 |
Receivable for investments sold | | 960,923 |
Receivable for fund shares sold | | 1,454,556 |
Interest receivable | | 3,810,371 |
Other receivables | | 58,931 |
Total assets | | 475,641,453 |
| | |
Liabilities | | |
Payable for investments purchased
Regular delivery | $ 1,339,322 | |
Delayed delivery | 41,984,448 | |
Payable for fund shares redeemed | 121,900 | |
Distributions payable | 60,328 | |
Swap agreements, at value | 145,207 | |
Accrued management fee | 115,609 | |
Distribution fees payable | 3,606 | |
Other affiliated payables | 75,644 | |
Other payables and accrued expenses | 36,723 | |
Total liabilities | | 43,882,787 |
| | |
Net Assets | | $ 431,758,666 |
Net Assets consist of: | | |
Paid in capital | | $ 428,201,146 |
Undistributed net investment income | | 539,146 |
Accumulated undistributed net realized gain (loss) on investments | | 2,397,425 |
Net unrealized appreciation (depreciation) on investments | | 620,949 |
Net Assets | | $ 431,758,666 |
See accompanying notes which are an integral part of the financial statements.
Annual Report
Statement of Assets and Liabilities - continued
| July 31, 2005 |
| | |
Calculation of Maximum Offering Price Class A:
Net Asset Value and redemption price per share ($2,974,166 ÷ 281,429 shares) | | $ 10.57 |
| | |
Maximum offering price per share (100/95.25 of $10.57) | | $ 11.10 |
Class T:
Net Asset Value and redemption price per share ($5,738,901 ÷ 543,558 shares) | | $ 10.56 |
| | |
Maximum offering price per share (100/96.50 of $10.56) | | $ 10.94 |
Class B:
Net Asset Value and offering price per share ($2,029,025 ÷ 191,971 shares)A | | $ 10.57 |
| | |
Class C:
Net Asset Value and offering price per share ($677,191 ÷ 64,087 shares)A | | $ 10.57 |
| | |
Total Bond:
Net Asset Value, offering price and redemption price per share ($420,225,271 ÷ 39,761,938 shares) | | $ 10.57 |
| | |
Institutional Class:
Net Asset Value, offering price and redemption price per share ($114,112 ÷ 10,800 shares) | | $ 10.57 |
A Redemption price per share is equal to net asset value less any applicable contingent deferred sales charge.
See accompanying notes which are an integral part of the financial statements.
Annual Report
Financial Statements - continued
Statement of Operations
| Year ended July 31, 2005 |
| | |
Investment Income | | |
Interest | | $ 17,207,680 |
| | |
Expenses | | |
Management fee | $ 1,558,348 | |
Transfer agent fees | 605,385 | |
Distribution fees | 21,368 | |
Accounting fees and expenses | 141,817 | |
Fund wide operations fee | 18,469 | |
Independent trustees' compensation | 1,960 | |
Custodian fees and expenses | 10,598 | |
Registration fees | 75,839 | |
Audit | 44,183 | |
Legal | 2,958 | |
Miscellaneous | 2,731 | |
Total expenses before reductions | 2,483,656 | |
Expense reductions | (119,592) | 2,364,064 |
Net investment income | | 14,843,616 |
Realized and Unrealized Gain (Loss) Net realized gain (loss) on: | | |
Investment securities | 3,976,436 | |
Swap agreements | 452,719 | |
Total net realized gain (loss) | | 4,429,155 |
Change in net unrealized appreciation (depreciation) on: Investment securities | 1,793,084 | |
Swap agreements | 72,263 | |
Total change in net unrealized appreciation (depreciation) | | 1,865,347 |
Net gain (loss) | | 6,294,502 |
Net increase (decrease) in net assets resulting from operations | | $ 21,138,118 |
See accompanying notes which are an integral part of the financial statements.
Annual Report
Statement of Changes in Net Assets
| Year ended
July 31,
2005 | Year ended
July 31,
2004 |
Increase (Decrease) in Net Assets | | |
Operations | | |
Net investment income | $ 14,843,616 | $ 8,771,927 |
Net realized gain (loss) | 4,429,155 | 937,699 |
Change in net unrealized appreciation (depreciation) | 1,865,347 | 707,007 |
Net increase (decrease) in net assets resulting
from operations | 21,138,118 | 10,416,633 |
Distributions to shareholders from net investment income | (14,221,483) | (8,644,971) |
Distributions to shareholders from net realized gain | (3,063,178) | (461,703) |
Total distributions | (17,284,661) | (9,106,674) |
Share transactions - net increase (decrease) | 53,654,454 | 292,125,223 |
Total increase (decrease) in net assets | 57,507,911 | 293,435,182 |
| | |
Net Assets | | |
Beginning of period | 374,250,755 | 80,815,573 |
End of period (including undistributed net investment income of $539,146 and undistributed net investment income of $79,241, respectively) | $ 431,758,666 | $ 374,250,755 |
See accompanying notes which are an integral part of the financial statements.
Annual Report
Financial Highlights - Class A
Years ended July 31, | 2005 | 2004F |
Selected Per-Share Data | | |
Net asset value, beginning of period | $ 10.46 | $ 10.31 |
Income from Investment Operations | | |
Net investment incomeE | .387 | .046 |
Net realized and unrealized gain (loss) | .183 | .145 |
Total from investment operations | .570 | .191 |
Distributions from net investment income | (.370) | (.041) |
Distributions from net realized gain | (.090) | - |
Total distributions | (.460) | (.041) |
Net asset value, end of period | $ 10.57 | $ 10.46 |
Total ReturnB,C,D | 5.52% | 1.85% |
Ratios to Average Net AssetsG | | |
Expenses before expense reductions | .96% | .87%A |
Expenses net of voluntary waivers, if any | .80% | .80%A |
Expenses net of all reductions | .80% | .80%A |
Net investment income | 3.69% | 3.51%A |
Supplemental Data | | |
Net assets, end of period (000 omitted) | $ 2,974 | $ 102 |
Portfolio turnover rate | 193% | 251% |
A Annualized
B Total returns for periods of less than one year are not annualized.
C Total returns would have been lower had certain expenses not been reduced during the periods shown.
D Total returns do not include the effect of the sales charges.
E Calculated based on average shares outstanding during the period.
F For the period June 16, 2004 (commencement of sale of shares) to July 31, 2004.
G Expense ratios reflect operating expenses of the class. Expenses before reductions do not reflect amounts reimbursed by the investment adviser or reductions from brokerage service arrangements or other expense offset arrangements and do not represent the amount paid by the class during periods when reimbursements or reductions occur. Expense ratios before reductions for start-up periods may not be representative of longer-term operating periods. Expenses net of any voluntary waivers reflect expenses after reimbursement by the investment adviser but prior to reductions from brokerage service arrangements or other expense offset arrangements. Expenses net of all reductions represent the net expenses paid by the class.
See accompanying notes which are an integral part of the financial statements.
Annual Report
Financial Highlights - Class T
Years ended July 31, | 2005 | 2004F |
Selected Per-Share Data | | |
Net asset value, beginning of period | $ 10.46 | $ 10.31 |
Income from Investment Operations | | |
Net investment incomeE | .377 | .045 |
Net realized and unrealized gain (loss) | .173 | .144 |
Total from investment operations | .550 | .189 |
Distributions from net investment income | (.360) | (.039) |
Distributions from net realized gain | (.090) | - |
Total distributions | (.450) | (.039) |
Net asset value, end of period | $ 10.56 | $ 10.46 |
Total ReturnB,C,D | 5.33% | 1.84% |
Ratios to Average Net AssetsG | | |
Expenses before expense reductions | 1.13% | .96%A |
Expenses net of voluntary waivers, if any | .90% | .90%A |
Expenses net of all reductions | .90% | .90%A |
Net investment income | 3.59% | 3.41%A |
Supplemental Data | | |
Net assets, end of period (000 omitted) | $ 5,739 | $ 102 |
Portfolio turnover rate | 193% | 251% |
A Annualized
B Total returns for periods of less than one year are not annualized.
C Total returns would have been lower had certain expenses not been reduced during the periods shown.
D Total returns do not include the effect of the sales charges.
E Calculated based on average shares outstanding during the period.
F For the period June 16, 2004 (commencement of sale of shares) to July 31, 2004.
G Expense ratios reflect operating expenses of the class. Expenses before reductions do not reflect amounts reimbursed by the investment adviser or reductions from brokerage service arrangements or other expense offset arrangements and do not represent the amount paid by the class during periods when reimbursements or reductions occur. Expense ratios before reductions for start-up periods may not be representative of longer-term operating periods. Expenses net of any voluntary waivers reflect expenses after reimbursement by the investment adviser but prior to reductions from brokerage service arrangements or other expense offset arrangements. Expenses net of all reductions represent the net expenses paid by the class.
See accompanying notes which are an integral part of the financial statements.
Annual Report
Financial Highlights - Class B
Years ended July 31, | 2005 | 2004F |
Selected Per-Share Data | | |
Net asset value, beginning of period | $ 10.46 | $ 10.31 |
Income from Investment Operations | | |
Net investment incomeE | .309 | .036 |
Net realized and unrealized gain (loss) | .182 | .145 |
Total from investment operations | .491 | .181 |
Distributions from net investment income | (.291) | (.031) |
Distributions from net realized gain | (.090) | - |
Total distributions | (.381) | (.031) |
Net asset value, end of period | $ 10.57 | $ 10.46 |
Total ReturnB,C,D | 4.74% | 1.76% |
Ratios to Average Net AssetsG | | |
Expenses before expense reductions | 1.75% | 1.62%A |
Expenses net of voluntary waivers, if any | 1.55% | 1.55%A |
Expenses net of all reductions | 1.55% | 1.55%A |
Net investment income | 2.94% | 2.76%A |
Supplemental Data | | |
Net assets, end of period (000 omitted) | $ 2,029 | $ 104 |
Portfolio turnover rate | 193% | 251% |
A Annualized
B Total returns for periods of less than one year are not annualized.
C Total returns would have been lower had certain expenses not been reduced during the periods shown.
D Total returns do not include the effect of the contingent deferred sales charge.
E Calculated based on average shares outstanding during the period.
F For the period June 16, 2004 (commencement of sale of shares) to July 31, 2004.
G Expense ratios reflect operating expenses of the class. Expenses before reductions do not reflect amounts reimbursed by the investment adviser or reductions from brokerage service arrangements or other expense offset arrangements and do not represent the amount paid by the class during periods when reimbursements or reductions occur. Expense ratios before reductions for start-up periods may not be representative of longer-term operating periods. Expenses net of any voluntary waivers reflect expenses after reimbursement by the investment adviser but prior to reductions from brokerage service arrangements or other expense offset arrangements. Expenses net of all reductions represent the net expenses paid by the class.
See accompanying notes which are an integral part of the financial statements.
Annual Report
Financial Highlights - Class C
Years ended July 31, | 2005 | 2004F |
Selected Per-Share Data | | |
Net asset value, beginning of period | $ 10.46 | $ 10.31 |
Income from Investment Operations | | |
Net investment incomeE | .299 | .035 |
Net realized and unrealized gain (loss) | .181 | .145 |
Total from investment operations | .480 | .180 |
Distributions from net investment income | (.280) | (.030) |
Distributions from net realized gain | (.090) | - |
Total distributions | (.370) | (.030) |
Net asset value, end of period | $ 10.57 | $ 10.46 |
Total ReturnB,C,D | 4.63% | 1.74% |
Ratios to Average Net AssetsG | | |
Expenses before expense reductions | 1.74% | 1.74%A |
Expenses net of voluntary waivers, if any | 1.65% | 1.65%A |
Expenses net of all reductions | 1.65% | 1.65%A |
Net investment income | 2.84% | 2.66%A |
Supplemental Data | | |
Net assets, end of period (000 omitted) | $ 677 | $ 142 |
Portfolio turnover rate | 193% | 251% |
A Annualized
B Total returns for periods of less than one year are not annualized.
C Total returns would have been lower had certain expenses not been reduced during the periods shown.
D Total returns do not include the effect of the contingent deferred sales charge.
E Calculated based on average shares outstanding during the period.
F For the period June 16, 2004 (commencement of sale of shares) to July 31, 2004.
G Expense ratios reflect operating expenses of the class. Expenses before reductions do not reflect amounts reimbursed by the investment adviser or reductions from brokerage service arrangements or other expense offset arrangements and do not represent the amount paid by the class during periods when reimbursements or reductions occur. Expense ratios before reductions for start-up periods may not be representative of longer-term operating periods. Expenses net of any voluntary waivers reflect expenses after reimbursement by the investment adviser but prior to reductions from brokerage service arrangements or other expense offset arrangements. Expenses net of all reductions represent the net expenses paid by the class.
See accompanying notes which are an integral part of the financial statements.
Annual Report
Financial Highlights - Total Bond
Years ended July 31, | 2005 | 2004 | 2003E |
Selected Per-Share Data | | | |
Net asset value, beginning of period | $ 10.46 | $ 10.28 | $ 10.00 |
Income from Investment Operations | | | |
Net investment incomeD | .411 | .340 | .232 |
Net realized and unrealized gain (loss) | .182 | .237 | .269 |
Total from investment operations | .593 | .577 | .501 |
Distributions from net investment income | (.393) | (.337) | (.221) |
Distributions from net realized gain | (.090) | (.060) | - |
Total distributions | (.483) | (.397) | (.221) |
Net asset value, end of period | $ 10.57 | $ 10.46 | $ 10.28 |
Total ReturnB,C | 5.75% | 5.68% | 5.01% |
Ratios to Average Net AssetsF | | | |
Expenses before expense reductions | .64% | .75% | 1.01%A |
Expenses net of voluntary waivers, if any | .61% | .65% | .65%A |
Expenses net of all reductions | .61% | .65% | .65%A |
Net investment income | 3.87% | 3.25% | 2.83%A |
Supplemental Data | | | |
Net assets, end of period (000 omitted) | $ 420,225 | $ 373,699 | $ 80,816 |
Portfolio turnover rate | 193% | 251% | 423%A |
A Annualized
B Total returns for periods of less than one year are not annualized.
C Total returns would have been lower had certain expenses not been reduced during the periods shown.
D Calculated based on average shares outstanding during the period.
E For the period October 15, 2002 (commencement of operations) to July 31, 2003.
F Expense ratios reflect operating expenses of the class. Expenses before reductions do not reflect amounts reimbursed by the investment adviser or reductions from brokerage service arrangements or other expense offset arrangements and do not represent the amount paid by the class during periods when reimbursements or reductions occur. Expense ratios before reductions for start-up periods may not be representative of longer-term operating periods. Expenses net of any voluntary waivers reflect expenses after reimbursement by the investment adviser but prior to reductions from brokerage service arrangements or other expense offset arrangements. Expenses net of all reductions represent the net expenses paid by the class.
See accompanying notes which are an integral part of the financial statements.
Annual Report
Financial Highlights - Institutional Class
Years ended July 31, | 2005 | 2004E |
Selected Per-Share Data | | |
Net asset value, beginning of period | $ 10.46 | $ 10.31 |
Income from Investment Operations | | |
Net investment incomeD | .410 | .048 |
Net realized and unrealized gain (loss) | .182 | .145 |
Total from investment operations | .592 | .193 |
Distributions from net investment income | (.392) | (.043) |
Distributions from net realized gain | (.090) | - |
Total distributions | (.482) | (.043) |
Net asset value, end of period | $ 10.57 | $ 10.46 |
Total ReturnB,C | 5.74% | 1.87% |
Ratios to Average Net AssetsF | | |
Expenses before expense reductions | .62% | .71%A |
Expenses net of voluntary waivers, if any | .62% | .65%A |
Expenses net of all reductions | .61% | .65%A |
Net investment income | 3.87% | 3.66%A |
Supplemental Data | | |
Net assets, end of period (000 omitted) | $ 114 | $ 102 |
Portfolio turnover rate | 193% | 251% |
A Annualized
B Total returns for periods of less than one year are not annualized.
C Total returns would have been lower had certain expenses not been reduced during the periods shown.
D Calculated based on average shares outstanding during the period.
E For the period June 16, 2004 (commencement of sale of shares) to July 31, 2004.
F Expense ratios reflect operating expenses of the class. Expenses before reductions do not reflect amounts reimbursed by the investment adviser or reductions from brokerage service arrangements or other expense offset arrangements and do not represent the amount paid by the class during periods when reimbursements or reductions occur. Expense ratios before reductions for start-up periods may not be representative of longer-term operating periods. Expenses net of any voluntary waivers reflect expenses after reimbursement by the investment adviser but prior to reductions from brokerage service arrangements or other expense offset arrangements. Expenses net of all reductions represent the net expenses paid by the class.
See accompanying notes which are an integral part of the financial statements.
Annual Report
Notes to Financial Statements
For the period ended July 31, 2005
1. Significant Accounting Policies.
Fidelity Total Bond Fund (the fund) is a non-diversified fund of Fidelity Income Fund (the trust) and is authorized to issue an unlimited number of shares. The trust is registered under the Investment Company Act of 1940, as amended (the 1940 Act), as an open-end management investment company organized as a Massachusetts business trust.
The fund offers Class A, Class T, Class B, Class C, Total Bond (the original class), and Institutional Class shares, each of which has equal rights as to assets and voting privileges. Each class has exclusive voting rights with respect to matters that affect that class. Class B shares will automatically convert to Class A shares after a holding period of seven years from the initial date of purchase. Investment income, realized and unrealized capital gains and losses, the common expenses of the fund, and certain fund-level expense reductions, if any, are allocated on a pro rata basis to each class based on the relative net assets of each class to the total net assets of the fund. Each class differs with respect to transfer agent and distribution and service plan fees incurred. Certain expense reductions also differ by class.
The fund may invest in affiliated money market central funds (Money Market Central Funds) and fixed-income Central Investment Portfolios (CIPs), collectively referred to as Central Funds, which are open-end investment companies available to investment companies and other accounts managed by Fidelity Management & Research Company (FMR) and its affiliates. The financial statements have been prepared in conformity with accounting principles generally accepted in the United States of America, which require management to make certain estimates and assumptions at the date of the financial statements. The following summarizes the significant accounting policies of the fund, which are also consistently followed by the Central Funds:
Security Valuation. Net asset value per share (NAV calculation) is calculated as of the close of business of the New York Stock Exchange, normally 4:00 p.m. Eastern time. Debt securities, including restricted securities, for which quotations are readily available are valued at their most recent bid prices (sales prices if the principal market is an exchange) in the principal market in which such securities are normally traded, as determined by recognized dealers in such securities, or securities are valued on the basis of information provided by a pricing service. Pricing services use valuation matrices that incorporate both dealer-supplied valuations and valuation models. Equity securities, including restricted securities, for which market quotations are available are valued at the last sale price or official closing price (closing bid price or last evaluated quote if no sale has occurred) on the primary market or exchange on which they trade. If prices are not readily available or do not accurately reflect fair value for a security, or if a security's value has been materially affected by events occurring after the close of the exchange or market on which the security is principally traded, that security may be valued by
Annual Report
1. Significant Accounting Policies - continued
Security Valuation - continued
another method that the Board of Trustees believes accurately reflects fair value. A security's valuation may differ depending on the method used for determining value. Price movements in futures contracts and ADRs, market and trading trends, the bid/ask quotes of brokers and off-exchange institutional trading may be reviewed in the course of making a good faith determination of a security's fair value. Short-term securities with remaining maturities of sixty days or less for which quotations are not readily available are valued on the basis of amortized cost. Investments in open-end investment companies, including Central Funds, are valued at their net asset value each business day.
Investment Transactions and Income. Security transactions, including the fund's investment activity in the Central Funds, are accounted for as of trade date. Gains and losses on securities sold are determined on the basis of identified cost. Interest income, including distributions from the Central Funds, is accrued as earned. Interest income includes coupon interest and amortization of premium and accretion of discount on debt securities. Debt obligations may be placed on non-accrual status and related interest income may be reduced by ceasing current accruals and writing off interest receivables when the collection of all or a portion of interest has become doubtful based on consistently applied procedures. A debt obligation is removed from non-accrual status when the issuer resumes interest payments or when collectibility of interest is reasonably assured.
Expenses. Most expenses of the trust can be directly attributed to a fund. Expenses which cannot be directly attributed are apportioned among each fund in the trust.
Income Tax Information and Distributions to Shareholders. Each year, the fund intends to qualify as a regulated investment company by distributing all of its taxable income and realized gains under Subchapter M of the Internal Revenue Code. As a result, no provision for income taxes is required in the accompanying financial statements.
Dividends are declared daily and paid monthly from net investment income. Distributions from realized gains, if any, are recorded on the ex-dividend date. Income dividends and capital gain distributions are declared separately for each class. Income and capital gain distributions are determined in accordance with income tax regulations, which may differ from generally accepted accounting principles. In addition, the fund will claim a portion of the payment made to redeeming shareholders as a distribution for income tax purposes. Capital accounts within the financial statements are adjusted for permanent book-tax differences. These adjustments have no impact on net assets or the results of operations. Temporary book-tax differences will reverse in a subsequent period.
Annual Report
Notes to Financial Statements - continued
1. Significant Accounting Policies - continued
Income Tax Information and Distributions to Shareholders - continued
Book-tax differences are primarily due to short-term capital gains, prior period premium and discount on debt securities, market discount, financing transactions and losses deferred due to wash sales.
The tax-basis components of distributable earnings and the federal tax cost as of period end were as follows:
Unrealized appreciation | $ 4,501,366 | |
Unrealized depreciation | (3,549,084) | |
Net unrealized appreciation (depreciation) | 952,282 | |
Undistributed ordinary income | 1,565,014 | |
Undistributed long-term capital gain | 634,305 | |
| | |
Cost for federal income tax purposes | $ 468,403,626 | |
The tax character of distributions paid was as follows:
| July 31, 2005 | July 31, 2004 |
Ordinary Income | $ 16,942,281 | $ 9,106,674 |
Long-term Capital Gains | 342,380 | - |
Total | $ 17,284,661 | $ 9,106,674 |
2. Operating Policies.
Repurchase Agreements. FMR has received an Exemptive Order from the Securities and Exchange Commission (the SEC) which permits the fund and other affiliated entities of FMR to transfer uninvested cash balances into joint trading accounts which are then invested in repurchase agreements. The fund may also invest directly with institutions in repurchase agreements. Repurchase agreements are collateralized by government or non-government securities. Collateral is held in segregated accounts with custodian banks and may be obtained in the event of a default of the counterparty. The fund monitors, on a daily basis, the value of the collateral to ensure it is at least equal to the principal amount of the repurchase agreement (including accrued interest). In the event of a default by the counterparty, realization of the collateral proceeds could be delayed, during which time the value of the collateral may decline.
Annual Report
2. Operating Policies - continued
Delayed Delivery Transactions and When-Issued Securities. The fund may purchase or sell securities on a delayed delivery or when-issued basis. Payment and delivery may take place after the customary settlement period for that security. The price of the underlying securities and the date when the securities will be delivered and paid for are fixed at the time the transaction is negotiated. During the time a delayed delivery sell is outstanding, the contract is marked-to-market daily and equivalent deliverable securities are held for the transaction. The value of the securities purchased on a delayed delivery or when-issued basis are identified as such in the fund's Schedule of Investments. The fund may receive compensation for interest forgone in the purchase of a delayed delivery or when-issued security. With respect to purchase commitments, the fund identifies securities as segregated in its records with a value at least equal to the amount of the commitment. Losses may arise due to changes in the value of the underlying securities or if the counterparty does not perform under the contract's terms, or if the issuer does not issue the securities due to political, economic, or other factors.
Restricted Securities. The fund may invest in securities that are subject to legal or contractual restrictions on resale. These securities generally may be resold in transactions exempt from registration or to the public if the securities are registered. Disposal of these securities may involve time-consuming negotiations and expense, and prompt sale at an acceptable price may be difficult. Information regarding restricted securities is included at the end of the fund's Schedule of Investments.
Loans and Other Direct Debt Instruments. The fund may invest in loans and loan participations, trade claims or other receivables. These investments may include standby financing commitments, including revolving credit facilities, that obligate the fund to supply additional cash to the borrower on demand. Loan participations involve a risk of insolvency of the lending bank or other financial intermediary.
Swap Agreements. The fund may invest in swaps for the purpose of managing its exposure to interest rate, credit or market risk.
Interest rate swaps are agreements to exchange cash flows periodically based on a notional principal amount, for example, the exchange of fixed rate interest payments for floating rate interest payments. Periodic payments received or made by the fund are recorded in the accompanying Statement of Operations as realized gains or losses, respectively. The primary risk associated with interest rate swaps is that unfavorable changes in the fluctuation of interest rates could adversely impact a fund.
Annual Report
Notes to Financial Statements - continued
2. Operating Policies - continued
Swap Agreements - continued
Total return swaps are agreements to exchange the return generated by one instrument or index for the return generated by another instrument, for example, the agreement to pay interest in exchange for a market-linked return based on a notional amount. To the extent the total return of the index exceeds the offsetting interest obligation, a fund will receive a payment from the counterparty. To the extent it is less, a fund will make a payment to the counterparty. Periodic payments received or made by the fund are recorded in the accompanying Statement of Operations as realized gains or losses, respectively.
Credit default swaps involve the exchange of a fixed rate premium for protection against the loss in value of an underlying debt instrument in the event of a defined credit event (such as payment default or bankruptcy). Under the terms of the swap, one party acts as a "guarantor" receiving a periodic payment that is a fixed percentage applied to a notional principal amount. In return the party agrees to purchase the notional amount of the underlying instrument, at par, if a credit event occurs during the term of the swap. The fund may enter into credit default swaps in which either it or its counterparty act as guarantors. By acting as the guarantor of a swap, a fund assumes the market and credit risk of the underlying instrument including liquidity and loss of value. Periodic payments and premiums received or made by the fund are recorded in the accompanying Statement of Operations as realized gains or losses, respectively.
Swaps are marked-to-market daily based on dealer-supplied valuations and changes in value are recorded as unrealized appreciation (depreciation). Gains or losses are realized upon early termination of the swap agreement. Collateral, in the form of cash or securities, may be required to be held in segregated accounts with a fund's custodian in compliance with swap contracts. Risks may exceed amounts recognized on the Statement of Assets and Liabilities. These risks include changes in the returns of the underlying instruments, failure of the counterparties to perform under the contracts' terms and the possible lack of liquidity with respect to the swap agreements. Details of swap agreements open at period end are included in the fund's Schedule of Investments under the caption "Swap Agreements."
Mortgage Dollar Rolls. To earn additional income, the fund may employ trading strategies which involve the sale and simultaneous agreement to repurchase similar securities ("mortgage dollar rolls") or the purchase and simultaneous agreement to sell similar securities ("reverse mortgage dollar rolls"). The securities traded are mortgage securities and bear the same interest rate but may be collateralized by different pools of mortgages. During the period between the sale and repurchase in a mortgage dollar roll transaction, a fund will not be entitled to receive interest and principal payments on the securities sold but will invest the proceeds of the sale in other securities which may
Annual Report
2. Operating Policies - continued
Mortgage Dollar Rolls - continued
enhance the yield and total return. In addition, the difference between the sale price and the future purchase price is recorded as an adjustment to investment income. During the period between the purchase and subsequent sale in a reverse mortgage dollar roll transaction a fund is entitled to interest and principal payments on the securities purchased. The price differential between the purchase and sale is recorded as an adjustment to investment income. Losses may arise due to changes in the value of the securities or if the counterparty does not perform under the terms of the agreement. If the counterparty files for bankruptcy or becomes insolvent, a fund's right to repurchase or sell securities may be limited.
3. Purchases and Sales of Investments.
Purchases and sales of securities, other than short-term securities and U.S. government securities, aggregated $104,158,635 and $90,216,988, respectively.
4. Fees and Other Transactions with Affiliates.
Management Fee. FMR and its affiliates provide the fund with investment management related services for which the fund pays a monthly management fee. The management fee is the sum of an individual fund fee rate that is based on an annual rate of .30% of the fund's average net assets (effective June 1, 2005, the fund's management contract was amended, reducing the individual fund fee rate to .20% of average net assets) and a group fee rate that averaged .12% during the period. The group fee rate is based upon the average net assets of all the mutual funds advised by FMR. The group fee rate decreases as assets under management increase and increases as assets under management decrease. For the period, the total annual management fee rate was .41% of the fund's average net assets.
Distribution and Service Plan. In accordance with Rule 12b-1 of the 1940 Act, the fund has adopted separate Distribution and Service Plans for each class of shares. Certain classes pay Fidelity Distributors Corporation (FDC), an affiliate of FMR, separate Distribution and Service Fees, each of which is based on an annual percentage of each class' average net assets. In addition, FDC may pay financial intermediaries for selling
Annual Report
Notes to Financial Statements - continued
4. Fees and Other Transactions with Affiliates - continued
Distribution and Service Plan - continued
shares of the fund and providing shareholder support services. For the period, the Distribution and Service Fee rates and the total amounts paid to and retained by FDC were as follows:
| Distribution
Fee | Service
Fee | Paid to
FDC | Retained
by FDC |
Class A | 0% | .15% | $ 1,883 | $ 146 |
Class T | 0% | .25% | 6,580 | 3,420 |
Class B | .65% | .25% | 8,844 | 6,641 |
Class C | .75% | .25% | 4,061 | 2,940 |
| | | $ 21,368 | $ 13,147 |
FDC receives a front-end sales charge of up to 4.75% for selling Class A shares, and 3.50% for selling Class T shares, some of which is paid to financial intermediaries for selling shares of the fund. FDC receives the proceeds of contingent deferred sales charges levied on Class A, Class T, Class B, and Class C redemptions. These charges depend on the holding period. The deferred sales charges range from 5% to 1% for Class B, 1% for Class C, and .25% for certain purchases of Class A and Class T shares.
For the period, sales charge amounts retained by FDC were as follows:
| Retained
by FDC |
Class A | $ 2,763 |
Class T | 768 |
Class B* | 2,261 |
Class C* | 40 |
| $ 5,832 |
* When Class B and Class C shares are initially sold, FDC pays commissions from its own resources to financial intermediaries through which the sales
are made.
Transfer Agent Fees. Fidelity Investments Institutional Operations Company, Inc. (FIIOC), an affiliate of FMR, is the transfer, dividend disbursing and shareholder servicing agent for each class of the fund, except for Total Bond. Fidelity Service Company, Inc. (FSC), an affiliate of FMR, is the transfer agent for Total Bond shares. FIIOC and FSC receive account fees and asset-based fees that vary according to the account size and type of account of the shareholders of the respective classes of the fund. FIIOC and FSC pay for typesetting, printing and mailing of shareholder reports, except proxy statements.
Annual Report
4. Fees and Other Transactions with Affiliates - continued
Transfer Agent Fees - continued
Under an amended contract effective June 1, 2005, transfer agent fees for the Total Bond class consist of an asset based fee and were reduced to a rate of .10% of average net assets. The account fees were eliminated. For the period the total transfer agent fees paid by each class to FIIOC or FSC, were as follows:
| Amount | % of
Average
Net Assets |
Class A | $ 4,554 | .36 |
Class T | 11,173 | .43 |
Class B | 3,849 | .39 |
Class C | 1,101 | .27 |
Total Bond | 584,567 | .15 |
Institutional Class | 141 | .13 |
| $ 605,385 | |
Accounting Fees. FSC maintains the fund's accounting records. The fee is based on the level of average net assets for the month. Effective June 1, 2005, FMR pays these fees.
Fundwide Operations Fee. Pursuant to a new Fundwide Operations and Expense Agreement (FWOE) effective on June 1, 2005, FMR has agreed to provide for fund level expenses (which do not include transfer agent, Rule 12b-1 fees, the compensation of the independent trustees or other extraordinary expenses) in return for a FWOE fee equal to .35% less the total amount of the management fee. The FWOE paid by the fund is reduced by an amount equal to the fees and expenses paid to the independent trustees. For the period, the FWOE fee was equivalent to .005% of average net assets.
Affiliated Central Funds. The fund may invest in Money Market Central Funds which seek preservation of capital and current income and are managed by Fidelity Investments Money Management, Inc. (FIMM) an affiliate of FMR.
The fund may also invest in CIPs managed by FIMM. The Ultra-Short Central Fund seeks to obtain a high level of current income consistent with preservation of capital by investing in U.S. dollar-denominated money market and investment grade debt securities and repurchase agreements.
The fund's Schedule of Investments lists the CIP as an investment of the fund but does not include the underlying holdings of the CIP. Based on its investment objectives, the CIP may invest or participate in various investment vehicles or strategies such as delayed delivery and when-issued securities, derivatives, financing transactions and restricted
Annual Report
Notes to Financial Statements - continued
4. Fees and Other Transactions with Affiliates - continued
Affilliated Central Funds - continued
securities. These strategies are consistent with the investment objectives of the fund and may involve certain economic risks, including the risk that a counterparty to one or more of these transactions may be unable or unwilling to comply with the terms of the governing agreement. This may result in a decline in value of the CIP and the fund.
A complete list of holdings for the CIP is available at the end of this report. In addition, a copy of the CIP's financial statements is available on the EDGAR Database on the SEC's website www.sec.gov, or at the Commission's public reference room in Washington, DC.
The Central Funds do not pay a management fee. Income distributions earned by the fund are recorded as income in the accompanying financial statements and totaled $1,272,185 for the period.
5. Committed Line of Credit.
The fund participates with other funds managed by FMR in a $4.2 billion credit facility (the "line of credit") to be utilized for temporary or emergency purposes to fund shareholder redemptions or for other short-term liquidity purposes. The fund has agreed to pay commitment fees on its pro rata portion of the line of credit. During the period, there were no borrowings on this line of credit.
6. Expense Reductions.
FMR voluntarily agreed to reimburse each class to the extent annual operating expenses exceeded certain levels of average net assets as noted in the table below. Some expenses, for example interest expense, are excluded from this reimbursement.
The following classes were in reimbursement during the period:
| Expense
Limitations | Reimbursement
from adviser |
| | |
Class A | .80% | $ 2,017 |
Class T | .90% | 5,981 |
Class B | 1.55% | 1,959 |
Class C | 1.65% | 357 |
Total Bond | .65%* | 102,259 |
Institutional Class | .65% | - |
| | $ 112,573 |
* Effective June 1, 2005 the expense limitation was eliminated for Total Bond.
Annual Report
6. Expense Reductions - continued
In addition, through arrangements with the fund's custodian, credits realized as a result of uninvested cash balances were used to reduce the fund's expenses. During the period, these credits reduced the fund's custody expenses by $7,019.
7. Other.
The fund's organizational documents provide former and current trustees and officers with a limited indemnification against liabilities arising in connection with the performance of their duties to the fund. In the normal course of business, the fund may also enter into contracts that provide general indemnifications. The fund's maximum exposure under these arrangements is unknown as this would be dependent on future claims that may be made against the fund. The risk of material loss from such claims is considered remote.
8. Distributions to Shareholders.
Distributions to shareholders of each class were as follows:
| Years ended July 31, |
| 2005 | 2004A |
From net investment income | | |
Class A | $ 44,038 | $ 394 |
Class T | 89,638 | 382 |
Class B | 27,061 | 301 |
Class C | 10,692 | 386 |
Total Bond | 14,046,106 | 8,643,095 |
Institutional Class | 3,948 | 413 |
Total | $ 14,221,483 | $ 8,644,971 |
From net realized gain | | |
Class A | $ 1,823 | $ - |
Class T | 2,706 | - |
Class B | 2,453 | - |
Class C | 2,151 | - |
Total Bond | 3,053,158 | 461,703 |
Institutional Class | 887 | - |
Total | $ 3,063,178 | $ 461,703 |
A Distributions for Class A, Class T, Class B, Class C, and Institutional Class are for the period June 16, 2004 (commencement of sale of shares) to
July 31, 2004.
Annual Report
Notes to Financial Statements - continued
9. Share Transactions.
Transactions for each class of shares were as follows:
| Shares
Years ended July 31, | Dollars
Years ended July 31, |
| 2005 | 2004A | 2005 | 2004A |
Class A | | | | |
Shares sold | 284,201 | 9,699 | $ 3,006,382 | $ 100,000 |
Reinvestment of distributions | 4,224 | 38 | 44,746 | 394 |
Shares redeemed | (16,733) | - | (177,183) | - |
Net increase (decrease) | 271,692 | 9,737 | $ 2,873,945 | $ 100,394 |
Class T | | | | |
Shares sold | 640,420 | 9,699 | $ 6,767,881 | $ 100,000 |
Reinvestment of distributions | 8,561 | 37 | 90,624 | 382 |
Shares redeemed | (115,159) | - | (1,215,824) | - |
Net increase (decrease) | 533,822 | 9,736 | $ 5,642,681 | $ 100,382 |
Class B | | | | |
Shares sold | 198,926 | 9,950 | $ 2,105,652 | $ 102,625 |
Reinvestment of distributions | 2,416 | 29 | 25,606 | 301 |
Shares redeemed | (19,350) | - | (204,667) | - |
Net increase (decrease) | 181,992 | 9,979 | $ 1,926,591 | $ 102,926 |
Class C | | | | |
Shares sold | 64,313 | 13,566 | $ 682,289 | $ 140,062 |
Reinvestment of distributions | 1,008 | 37 | 10,695 | 386 |
Shares redeemed | (14,837) | - | (156,875) | - |
Net increase (decrease) | 50,484 | 13,603 | $ 536,109 | $ 140,448 |
Total Bond | | | | |
Shares sold | 15,519,844 | 34,227,901 | $ 164,657,854 | $ 358,024,636 |
Reinvestment of distributions | 1,546,242 | 845,761 | 16,406,907 | 8,865,286 |
Shares redeemed | (13,038,155) | (7,201,869) | (138,400,918) | (75,309,262) |
Net increase (decrease) | 4,027,931 | 27,871,793 | $ 42,663,843 | $ 291,580,660 |
Institutional Class | | | | |
Shares sold | 615 | 9,699 | $ 6,559 | $ 100,000 |
Reinvestment of distributions | 453 | 40 | 4,801 | 413 |
Shares redeemed | (7) | - | (75) | - |
Net increase (decrease) | 1,061 | 9,739 | $ 11,285 | $ 100,413 |
A Share transactions for Class A, Class T, Class B, Class C, and Institutional Class are for the period June 16, 2004 (commencement of sale of shares) to July 31, 2004.
Annual Report
Report of Independent Registered Public Accounting Firm
To the Trustees of Fidelity Income Fund and the Shareholders of Fidelity Total Bond Fund:
In our opinion, the accompanying statement of assets and liabilities, including the schedule of investments, and the related statements of operations and of changes in net assets and the financial highlights present fairly, in all material respects, the financial position of Fidelity Total Bond Fund (a fund of Fidelity Income Fund) at July 31, 2005 and the results of their operations, the changes in their net assets and the financial highlights for the periods indicated, in conformity with accounting principles generally accepted in the United States of America. These financial statements and financial highlights (hereafter referred to as "financial statements") are the responsibility of the Fidelity Total Bond Fund's management; our responsibility is to express an opinion on these financial statements based on our audits. We conducted our audits of these financial statements in accordance with the standards of the Public Company Accounting Oversight Board (United States). Those standards require that we plan and perform the audit to obtain reasonable assurance about whether the financial statements are free of material misstatement. An audit includes examining, on a test basis, evidence supporting the amounts and disclosures in the financial statements, assessing the accounting principles used and significant estimates made by management, and evaluating the overall financial statement presentation. We believe that our audits, which included confirmation of securities at July 31, 2005 by correspondence with the custodian and brokers, provide a reasonable basis for our opinion.
/s/ PricewaterhouseCoopers LLP
PricewaterhouseCoopers LLP
Boston, Massachusetts
September 13, 2005
Annual Report
Trustees and Officers
The Trustees, Members of the Advisory Board, and executive officers of the trust and fund, as applicable, are listed below. The Board of Trustees governs the fund and is responsible for protecting the interests of shareholders. The Trustees are experienced executives who meet periodically throughout the year to oversee the fund's activities, review contractual arrangements with companies that provide services to the fund, and review the fund's performance. Except for William O. McCoy, Stephen P. Jonas, and Kenneth L. Wolfe, each of the Trustees oversees 320 funds advised by FMR or an affiliate. Mr. McCoy oversees 322 funds advised by FMR or an affiliate. Mr. Jonas and Mr. Wolfe oversee 311 funds advised by FMR or an affiliate.
The Trustees hold office without limit in time except that (a) any Trustee may resign; (b) any Trustee may be removed by written instrument, signed by at least two-thirds of the number of Trustees prior to such removal; (c) any Trustee who requests to be retired or who has become incapacitated by illness or injury may be retired by written instrument signed by a majority of the other Trustees; and (d) any Trustee may be removed at any special meeting of shareholders by a two-thirds vote of the outstanding voting securities of the trust. Each Trustee who is not an interested person (as defined in the 1940 Act) (Independent Trustee), shall retire not later than the last day of the calendar year in which his or her 72nd birthday occurs. The Independent Trustees may waive this mandatory retirement age policy with respect to individual Trustees. The executive officers and Advisory Board Members hold office without limit in time, except that any officer and Advisory Board Member may resign or may be removed by a vote of a majority of the Trustees at any regular meeting or any special meeting of the Trustees. Except as indicated, each individual has held the office shown or other offices in the same company for the past five years.
The fund's Statement of Additional Information (SAI) includes more information about the Trustees. To request a free copy, call Fidelity at 1-800-544-8544.
Interested Trustees*:
Correspondence intended for each Trustee who is an interested person may be sent to Fidelity Investments, 82 Devonshire Street, Boston, Massachusetts 02109.
Name, Age; Principal Occupation |
Edward C. Johnson 3d (75)** |
| Year of Election or Appointment: 1984 Mr. Johnson is Chairman of the Board of Trustees. Mr. Johnson serves as Chief Executive Officer, Chairman, and a Director of FMR Corp.; a Director and Chairman of the Board and of the Executive Committee of FMR; Chairman and a Director of Fidelity Management & Research (Far East) Inc.; Chairman and a Director of Fidelity Investments Money Management, Inc.; and Chairman (2001-present) and a Director (2000-present) of FMR Co., Inc. |
Abigail P. Johnson (43)** |
| Year of Election or Appointment: 2001 Ms. Johnson serves as President of Fidelity Employer Services Company (FESCO) (2005-present). She is President and a Director of Fidelity Investments Money Management, Inc. (2001-present), FMR Co., Inc. (2001-present), and a Director of FMR Corp. Previously, Ms. Johnson served as President and a Director of FMR (2001-2005), Senior Vice President of the Fidelity funds (2001-2005), and managed a number of Fidelity funds. |
Stephen P. Jonas (52) |
| Year of Election or Appointment: 2005 Mr. Jonas is Senior Vice President of Total Bond (2005-present). He also serves as Senior Vice President of other Fidelity funds (2005-present). Mr. Jonas is Executive Director of FMR (2005-present). Previously, Mr. Jonas served as President of Fidelity Enterprise Operations and Risk Services (2004-2005), Chief Administrative Officer (2002-2004), and Chief Financial Officer of FMR Co. (1998-2000). Mr. Jonas has been with Fidelity Investments since 1987 and has held various financial and management positions including Chief Financial Officer of FMR. In addition, he serves on the Boards of Boston Ballet (2003-present) and Simmons College (2003-present). |
Robert L. Reynolds (53) |
| Year of Election or Appointment: 2003 Mr. Reynolds is a Director (2003-present) and Chief Operating Officer (2002-present) of FMR Corp. He also serves on the Board at Fidelity Investments Canada, Ltd. (2000-present). Previously, Mr. Reynolds served as President of Fidelity Investments Institutional Retirement Group (1996-2000). |
* Trustees have been determined to be "Interested Trustees" by virtue of, among other things, their affiliation with the trust or various entities under common control with FMR.
** Edward C. Johnson 3d, Trustee, is Abigail P. Johnson's father.
Annual Report
Independent Trustees:
Correspondence intended for each Independent Trustee (that is, the Trustees other than the Interested Trustees) may be sent to Fidelity Investments, P.O. Box 55235, Boston, Massachusetts 02205-5235.
Name, Age; Principal Occupation |
Dennis J. Dirks (57) |
| Year of Election or Appointment: 2005 Prior to his retirement in May 2003, Mr. Dirks was Chief Operating Officer and a member of the Board of The Depository Trust & Clearing Corporation (DTCC) (1999-2003). He also served as President, Chief Operating Officer, and Board member of The Depository Trust Company (DTC) (1999-2003) and President and Board member of the National Securities Clearing Corporation (NSCC) (1999-2003). In addition, Mr. Dirks served as Chief Executive Officer and Board member of the Government Securities Clearing Corporation (2001-2003) and Chief Executive Officer and Board member of the Mortgage-Backed Securities Clearing Corporation (2001-2003). Mr. Dirks also serves as a Trustee of Manhattan College (2005-present). |
Robert M. Gates (61) |
| Year of Election or Appointment: 1997 Dr. Gates is Vice Chairman of the Independent Trustees (2005-present). Dr. Gates is President of Texas A&M University (2002-present). He was Director of the Central Intelligence Agency (CIA) from 1991 to 1993. From 1989 to 1991, Dr. Gates served as Assistant to the President of the United States and Deputy National Security Advisor. Dr. Gates is a Director of NACCO Industries, Inc. (mining and manufacturing), Parker Drilling Co., Inc. (drilling and rental tools for the energy industry, 2001-present), and Brinker International (restaurant management, 2003-present). Previously, Dr. Gates served as a Director of LucasVarity PLC (automotive components and diesel engines), a Director of TRW Inc. (automotive, space, defense, and information technology), and Dean of the George Bush School of Government and Public Service at Texas A&M University (1999-2001). Dr. Gates also is a Trustee of the Forum for International Policy. |
George H. Heilmeier (69) |
| Year of Election or Appointment: 2004 Dr. Heilmeier is Chairman Emeritus of Telcordia Technologies (communication software and systems), where prior to his retirement, he served as company Chairman and Chief Executive Officer. He currently serves on the Boards of Directors of The Mitre Corporation (systems engineering and information technology support for the government), and HRL Laboratories (private research and development, 2004-present). He is Chairman of the General Motors Science & Technology Advisory Board and a Life Fellow of the Institute of Electrical and Electronics Engineers (IEEE) (2000-present). Dr. Heilmeier is a member of the Defense Science Board and the National Security Agency Advisory Board. He is also a member of the National Academy of Engineering, the American Academy of Arts and Sciences, and the Board of Overseers of the School of Engineering and Applied Science of the University of Pennsylvania. Previously, Dr. Heilmeier served as a Director of TRW Inc. (automotive, space, defense, and information technology, 1992-2002), Compaq (1994-2002), Automatic Data Processing, Inc. (ADP) (technology-based business outsourcing, 1995-2002), INET Technologies Inc. (telecommunications network surveillance, 2001-2004), and Teletech Holdings (customer management services). He is the recipient of the 2005 Kyoto Prize in Advanced Technology for his invention of the liquid display. |
Marie L. Knowles (58) |
| Year of Election or Appointment: 2001 Prior to Ms. Knowles' retirement in June 2000, she served as Executive Vice President and Chief Financial Officer of Atlantic Richfield Company (ARCO) (diversified energy, 1996-2000). From 1993 to 1996, she was a Senior Vice President of ARCO and President of ARCO Transportation Company. She served as a Director of ARCO from 1996 to 1998. She currently serves as a Director of Phelps Dodge Corporation (copper mining and manufacturing) and McKesson Corporation (healthcare service, 2002-present). Ms. Knowles is a Trustee of the Brookings Institution and the Catalina Island Conservancy and also serves as a member of the Advisory Board for the School of Engineering of the University of Southern California. |
Ned C. Lautenbach (61) |
| Year of Election or Appointment: 2000 Mr. Lautenbach has been a partner of Clayton, Dubilier & Rice, Inc. (private equity investment firm) since September 1998. Previously, Mr. Lautenbach was with the International Business Machines Corporation (IBM) from 1968 until his retirement in 1998. Mr. Lautenbach serves as a Director of Italtel Holding S.p.A. (telecommunications (Milan, Italy), 2004-present) and Eaton Corporation (diversified industrial) as well as the Philharmonic Center for the Arts in Naples, Florida. He also is a member of the Board of Trustees of Fairfield University (2005-present), as well as a member of the Council on Foreign Relations. |
Marvin L. Mann (72) |
| Year of Election or Appointment: 1993 Mr. Mann is Chairman of the Independent Trustees (2001-present). He is Chairman Emeritus of Lexmark International, Inc. (computer peripherals), where he served as CEO until April 1998, retired as Chairman May 1999, and remains a member of the Board. Prior to 1991, he held the positions of Vice President of International Business Machines Corporation (IBM) and President and General Manager of various IBM divisions and subsidiaries. He is a member of the Executive Committee of the Independent Director's Council of the Investment Company Institute. In addition, Mr. Mann is a member of the President's Cabinet at the University of Alabama and the Board of Visitors of the Culverhouse College of Commerce and Business Administration at the University of Alabama. |
William O. McCoy (71) |
| Year of Election or Appointment: 1997 Prior to his retirement in December 1994, Mr. McCoy was Vice Chairman of the Board of BellSouth Corporation (telecommunications) and President of BellSouth Enterprises. He is currently a Director of Liberty Corporation (holding company), Duke Realty Corporation (real estate), and Progress Energy, Inc. (electric utility). He is also a partner of Franklin Street Partners (private investment management firm) and a member of the Research Triangle Foundation Board. In addition, Mr. McCoy served as the Interim Chancellor (1999-2000) and a member of the Board of Visitors for the University of North Carolina at Chapel Hill and currently serves on the Board of Directors of the University of North Carolina Health Care System and the Board of Visitors of the Kenan-Flagler Business School (University of North Carolina at Chapel Hill). He also served as Vice President of Finance for the University of North Carolina (16-school system). |
Cornelia M. Small (61) |
| Year of Election or Appointment: 2005 Ms. Small is a member (2000-present) and Chairperson (2002-present) of the Investment Committee, and a member (2002-present) of the Board of Trustees of Smith College. Previously, she served as Chief Investment Officer (1999-2000), Director of Global Equity Investments (1996-1999), and a member of the Board of Directors of Scudder, Stevens & Clark (1990-1997) and Scudder Kemper Investments (1997-1998). In addition, Ms. Small served as Co-Chair (2000-2003) of the Annual Fund for the Fletcher School of Law and Diplomacy. |
William S. Stavropoulos (66) |
| Year of Election or Appointment: 2001 Mr. Stavropoulos is Chairman of the Board (2000-present) and a Member of the Board of Directors of The Dow Chemical Company. Since joining The Dow Chemical Company in 1967, Mr. Stavropoulos served in numerous senior management positions, including President (1993-2000; 2002-2003), CEO (1995-2000; 2002-2004), and Chairman of the Executive Committee (2000-2004). Currently, he is a Director of NCR Corporation (data warehousing and technology solutions), BellSouth Corporation (telecommunications), Chemical Financial Corporation, Maersk Inc. (industrial conglomerate, 2002-present), and Metalmark Capital (private equity investment firm, 2005-present). He also serves as a member of the Board of Trustees of the American Enterprise Institute for Public Policy Research. In addition, Mr. Stavropoulos is a member of The Business Council, J.P. Morgan International Council and the University of Notre Dame Advisory Council for the College of Science. |
Kenneth L. Wolfe (66) |
| Year of Election or Appointment: 2005 Mr. Wolfe also serves as a Trustee (2005-present) or Member of the Advisory Board (2004-present) of other investment companies advised by FMR. Prior to his retirement in 2001, Mr. Wolfe was Chairman and Chief Executive Officer of Hershey Foods Corporation (1993-2001). He currently serves as a member of the boards of Adelphia Communications Corporation (2003-present), Bausch & Lomb, Inc., and Revlon Inc. (2004-present). |
Annual Report
Advisory Board Members and Executive Officers:
Correspondence intended for Mr. Gamper may be sent to Fidelity Investments, P.O. Box 55235, Boston, Massachusetts 02205-5235. Correspondence intended for each executive officer and Mr. Lynch may be sent to Fidelity Investments, 82 Devonshire Street, Boston, Massachusetts 02109.
Name, Age; Principal Occupation |
Albert R. Gamper, Jr. (63) |
| Year of Election or Appointment: 2005 Member of the Advisory Board of Fidelity Income Fund. Prior to his retirement in December 2004, Mr. Gamper served as Chairman of the Board of CIT Group Inc. (commercial finance). During his tenure with CIT Group Inc. Mr. Gamper served in numerous senior management positions, including Chairman (1987-1989; 1999-2001; 2002-2004), Chief Executive Officer (1987-2004), and President (1989-2002). He currently serves as a member of the Board of Directors of Public Enterprise Group (utilities, 2001-present), Chairman of the Board of Governors, Rutgers University (2004-present), and Chairman of the Board of Saint Barnabas Health Care System. |
Peter S. Lynch (61) |
| Year of Election or Appointment: 2003 Member of the Advisory Board of Fidelity Income Fund. Vice Chairman and a Director of FMR, and Vice Chairman (2001-present) and a Director (2000-present) of FMR Co., Inc. Previously, Mr. Lynch served as a Trustee of the Fidelity funds (1990-2003). In addition, he serves as a Trustee of Boston College, Massachusetts Eye & Ear Infirmary, Historic Deerfield, John F. Kennedy Library, and the Museum of Fine Arts of Boston. |
David L. Murphy (57) |
| Year of Election or Appointment: 2005 Vice President of Total Bond. Mr. Murphy also serves as Vice President of Fidelity's Money Market Funds (2002-present), certain Asset Allocation Funds (2003-present), Fidelity's Investment Grade-Bond Funds (2005-present), and Fidelity's Balanced Funds (2005-present). He serves as Senior Vice President (2000-present) and Head (2004-present) of the Fidelity Investments Fixed Income Division. Mr. Murphy is also a Senior Vice President of FIMM (2003-present) and a Vice President of FMR (2000-present). Previously, Mr. Murphy served as Money Market Group Leader (2002-2004), Bond Group Leader (2000-2002), and Vice President of Fidelity's Taxable Bond Funds (2000-2002) and Fidelity's Municipal Bond Funds (2001-2002). Mr. Murphy joined Fidelity Investments in 1989 as a portfolio manager in the Bond Group. |
Thomas J. Silvia (44) |
| Year of Election or Appointment: 2005 Vice President of Total Bond. Mr. Silvia also serves as Vice President of Fidelity's Bond Funds (2005-present) and Senior Vice President and Bond Group Leader of the Fidelity Investments Fixed-Income Division (2005-present). Previously, Mr. Silvia served as Director of Fidelity's Taxable Bond portfolio managers (2002-2004) and a portfolio manager in the Bond Group (1997-2004). |
Walter C. Donovan (43) |
| Year of Election or Appointment: 2005 Vice President of Total Bond. Mr. Donovan also serves as Vice President of Fidelity's High Income Funds (2005-present), Fidelity's Fixed-Income Funds (2005-present), certain Asset Allocation Funds (2005-present), and certain Balanced Funds (2005-present). Mr. Donovan also serves as Executive Vice President of FMR (2005-present) and FMRC (2005-present). Previously, Mr. Donovan served as Vice President and Director of Fidelity's International Equity Trading group (1998-2005). |
Ford O'Neil (43) |
| Year of Election or Appointment: 2005 Vice President Total Bond. Mr. O'Neil also serves as Vice President of other funds advised by FMR. |
Eric D. Roiter (56) |
| Year of Election or Appointment: 2002 Secretary of Total Bond. He also serves as Secretary of other Fidelity funds; Vice President, General Counsel, and Secretary of FMR Co., Inc. (2001-present) and FMR; Assistant Secretary of Fidelity Management & Research (U.K.) Inc. (2001-present), Fidelity Management & Research (Far East) Inc. (2001-present), and Fidelity Investments Money Management, Inc. (2001-present). Mr. Roiter is an Adjunct Member, Faculty of Law, at Boston College Law School (2003-present). Previously, Mr. Roiter served as Vice President and Secretary of Fidelity Distributors Corporation (FDC) (1998-2005). |
Stuart Fross (45) |
| Year of Election or Appointment: 2003 Assistant Secretary of Total Bond. Mr. Fross also serves as Assistant Secretary of other Fidelity funds (2003-present), Vice President and Secretary of FDC (2005-present), and is an employee of FMR. |
Christine Reynolds (46) |
| Year of Election or Appointment: 2004 President, Treasurer, and Anti-Money Laundering (AML) officer of Total Bond. Ms. Reynolds also serves as President, Treasurer, and AML officer of other Fidelity funds (2004) and is a Vice President (2003) and an employee (2002) of FMR. Before joining Fidelity Investments, Ms. Reynolds worked at PricewaterhouseCoopers LLP (PwC) (1980-2002), where she was most recently an audit partner with PwC's investment management practice. |
Timothy F. Hayes (54) |
| Year of Election or Appointment: 2002 Chief Financial Officer of Total Bond. Mr. Hayes also serves as Chief Financial Officer of other Fidelity funds (2002-present) and President of Fidelity Investment Operations (2005-present) which includes Fidelity Pricing and Cash Management Services Group (FPCMS), where he served as President (1998-2005). Mr. Hayes serves as President of Fidelity Service Company (2003-present) where he also serves as a Director. Mr. Hayes also served as President of Fidelity Investments Operations Group (FIOG, 2002-2005). |
Kenneth A. Rathgeber (58) |
| Year of Election or Appointment: 2004 Chief Compliance Officer of Total Bond. Mr. Rathgeber also serves as Chief Compliance Officer of other Fidelity funds (2004) and Executive Vice President of Risk Oversight for Fidelity Investments (2002). Previously, he served as Executive Vice President and Chief Operating Officer for Fidelity Investments Institutional Services Company, Inc. (1998-2002). |
John R. Hebble (47) |
| Year of Election or Appointment: 2003 Deputy Treasurer of Total Bond. Mr. Hebble also serves as Deputy Treasurer of other Fidelity funds (2003), and is an employee of FMR. Before joining Fidelity Investments, Mr. Hebble worked at Deutsche Asset Management where he served as Director of Fund Accounting (2002-2003) and Assistant Treasurer of the Scudder Funds (1998-2003). |
Bryan A. Mehrmann (44) |
| Year of Election or Appointment: 2005 Deputy Treasurer of Total Bond. Mr. Mehrmann also serves as Deputy Treasurer of other Fidelity funds (2005-present) and is an employee of FMR. Previously, Mr. Mehrmann served as Vice President of Fidelity Investments Institutional Services Group (FIIS)/Fidelity Investments Institutional Operations Corporation, Inc. (FIIOC) Client Services (1998-2004). |
Kimberley H. Monasterio (41) |
| Year of Election or Appointment: 2004 Deputy Treasurer of Total Bond. Ms. Monasterio also serves as Deputy Treasurer of other Fidelity funds (2004) and is an employee of FMR (2004). Before joining Fidelity Investments, Ms. Monasterio served as Treasurer (2000-2004) and Chief Financial Officer (2002-2004) of the Franklin Templeton Funds and Senior Vice President of Franklin Templeton Services, LLC (2000-2004). |
Kenneth B. Robins (35) |
| Year of Election or Appointment: 2005 Deputy Treasurer of Total Bond. Mr. Robins also serves as Deputy Treasurer of other Fidelity funds (2005-present) and is an employee of FMR (2004-present). Before joining Fidelity Investments, Mr. Robins worked at KPMG LLP, where he was a partner in KPMG's department of professional practice (2002-2004) and a Senior Manager (1999-2000). In addition, Mr. Robins served as Assistant Chief Accountant, United States Securities and Exchange Commission (2000-2002). |
Robert G. Byrnes (38) |
| Year of Election or Appointment: 2005 Assistant Treasurer of Total Bond. Mr. Byrnes also serves as Assistant Treasurer of other Fidelity funds (2005-present) and is an employee of FMR (2005-present). Previously, Mr. Byrnes served as Vice President of FPCMS (2003-2005). Before joining Fidelity Investments, Mr. Byrnes worked at Deutsche Asset Management where he served as Vice President of the Investment Operations Group (2000-2003). |
John H. Costello (58) |
| Year of Election or Appointment: 2002 Assistant Treasurer of Total Bond. Mr. Costello also serves as Assistant Treasurer of other Fidelity funds and is an employee of FMR. |
Peter L. Lydecker (51) |
| Year of Election or Appointment: 2004 Assistant Treasurer of Total Bond. Mr. Lydecker also serves as Assistant Treasurer of other Fidelity funds (2004) and is an employee of FMR. |
Mark Osterheld (50) |
| Year of Election or Appointment: 2002 Assistant Treasurer of Total Bond. Mr. Osterheld also serves as Assistant Treasurer of other Fidelity funds (2002) and is an employee of FMR. |
Gary W. Ryan (46) |
| Year of Election or Appointment: 2005 Assistant Treasurer of Total Bond. Mr. Ryan also serves as Assistant Treasurer of other Fidelity funds (2005-present) and is an employee of FMR (2005-present). Previously, Mr. Ryan served as Vice President of Fund Reporting in FPCMS (1999-2005). |
Salvatore Schiavone (39) |
| Year of Election or Appointment: 2005 Assistant Treasurer of Total Bond. Mr. Schiavone also serves as Assistant Treasurer of other Fidelity funds (2005-present) and is an employee of FMR (2005-present). Before joining Fidelity Investments, Mr. Schiavone worked at Deutsche Asset Management, where he most recently served as Assistant Treasurer (2003-2005) of the Scudder Funds and Vice President and Head of Fund Reporting (1996-2003). |
Annual Report
Distributions
The Board of Trustees of Fidelity Total Bond Fund voted to pay to shareholders of record at the opening of business on record date, the following distributions per share derived from capital gains realized from sales of portfolio securities:
| Pay Date | Record Date | Capital Gains |
Total Bond | 9/12/05 | 9/9/05 | $.04 |
The fund hereby designates as capital gain dividends: For dividends with respect to the taxable year ended July 31, 2005, $807,027, or, if subsequently determined to be different, the net capital gain of such year, and for dividends with respect to the taxable year ended July 31, 2004, $169,658, or, if subsequently determined to be different, the excess of: (a) the net capital gain of such year, over (b) amounts previously designated as capital gain dividends with respect to such year.
A total of 15.99% of the dividends distributed during the fiscal year was derived from interest on U.S. Government securities which is generally exempt from state income tax.
The fund will notify shareholders in January 2006 of amounts for use in preparing 2005 income tax returns.
Annual Report
Board Approval of Investment Advisory Contracts and Management Fees
Fidelity Total Bond Fund
Each year, typically in June, the Board of Trustees, including the independent Trustees (together, the Board), votes on the renewal of the management contract and sub-advisory agreements (together, the Advisory Contracts) for the fund. The Board, assisted by the advice of fund counsel and independent Trustees' counsel, requests and considers a broad range of information throughout the year.
The Board meets regularly each month except August and takes into account throughout the year matters bearing on Advisory Contracts. The Board, acting directly and through its separate committees, considers at each of its meetings factors that are relevant to the annual renewal of the fund's Advisory Contracts, including the services and support provided to the fund and its shareholders by Fidelity. At the time of the renewal, the Board had 11 standing committees, each composed of independent Trustees with varying backgrounds, to which the Board has assigned specific subject matter responsibilities in order to enhance effective decision-making by the Board. Each committee has adopted a written charter outlining the structure and purposes of the committee. One such committee, the Fixed-Income Contract Committee, meets periodically during the first six months of each year and as necessary to consider matters specifically related to the annual renewal of Advisory Contracts. The committee requests and receives information on, and makes recommendations to the independent Trustees concerning, the approval and annual review of the Advisory Contracts.
At its June 2005 meeting, the Board of Trustees, including the independent Trustees, unanimously determined to renew the Advisory Contracts for the fund. In reaching its determination, the Board considered all factors it believed relevant, including (1) the nature, extent, and quality of the services to be provided to the fund and its shareholders by Fidelity (including the investment performance of the fund); (2) the competitiveness of the management fee and total expenses of the fund; (3) the total costs of the services to be provided by and the profits to be realized by the investment adviser and its affiliates from the relationship with the fund; (4) the extent to which economies of scale would be realized as the fund grows; and (5) whether fee levels reflect these economies of scale, if any, for the benefit of fund shareholders.
In determining whether to renew the Advisory Contracts for the fund, the Board ultimately reached a determination, with the assistance of fund counsel and independent Trustees' counsel, that the renewal of the Advisory Contracts and the compensation to be received by Fidelity under the management contract is consistent with Fidelity's fiduciary duty under applicable law. In addition to evaluating the specific factors noted above, the Board, in reaching its determination, is aware that shareholders in the fund have a broad range of investment choices available to them, including a wide choice among mutual funds offered by competitors to Fidelity, and that the fund's shareholders, with the opportunity to review and weigh the disclosure provided by the fund in its prospectus and other public disclosures, have chosen to invest in this fund, managed by Fidelity.
Annual Report
Nature, Extent, and Quality of Services Provided by Fidelity. The Board considered staffing within the investment adviser, FMR, and the sub-advisers (together, the Investment Advisers), including the background of the fund's portfolio manager and the fund's investment objective and discipline. The independent Trustees also had discussions with senior management of Fidelity's investment operations and investment groups. The Board considered the structure of the portfolio manager compensation program and whether this structure provides appropriate incentives.
Fidelity Resources Dedicated to Investment Management and Support Services. The Board reviewed the size, education, and experience of the Investment Advisers' investment staff, their use of technology, and the Investment Advisers' approach to recruiting, training, and retaining portfolio managers and other research, advisory, and management personnel. The Board considered Fidelity's extensive global research capabilities that enable the Investment Advisers to aggregate data from various sources in an effort to produce positive investment results. The Board noted that Fidelity's analysts have access to a variety of technological tools that enable them to perform both fundamental and quantitative analysis and to specialize in various disciplines. The Board also considered that Fidelity's portfolio managers and analysts have access to daily portfolio attribution that allows for monitoring of a fund's portfolio, as well as an electronic communication system that provides immediate real-time access to research concerning issuers and credit enhancers.
Shareholder and Administrative Services. The Board considered the nature, extent, quality, and cost of administrative, distribution, and shareholder services performed by the Investment Advisers and their affiliates under the Advisory Contracts and under separate agreements covering transfer agency, pricing and bookkeeping, and securities lending services for the fund. The Board also considered the nature and extent of the Investment Advisers' supervision of third party service providers, principally custodians and subcustodians. The Board reviewed the allocation of fund brokerage, including allocations to brokers affiliated with the Investment Advisers. The Board also considered the resources devoted to, and the record of compliance with, the fund's compliance policies and procedures.
The Board noted that the growth of fund assets across the complex allows Fidelity to reinvest in the development of services designed to enhance the value or convenience of the Fidelity funds as investment vehicles. These services include 24-hour access to account information and market information through phone representatives and over the Internet, and investor education materials and asset allocation tools.
Investment in a Large Fund Family. The Board considered the benefits to shareholders of investing in a Fidelity fund, including the benefits of investing in a fund that is part of a large family of funds offering a variety of investment disciplines and providing for a large variety of mutual fund investor services. For example, fund shareholders are offered the privilege of exchanging shares of the fund for shares of other Fidelity funds, as set forth in the fund's prospectus, without paying an additional sales charge. The Board noted that, since the last Advisory Contract renewals in June 2004, Fidelity has taken a number of actions that benefited particular funds, including (i) voluntarily deciding in 2004 to stop using "soft" commission dollars to pay for market data and, instead, to pay for that data out of its own resources, (ii) contractually agreeing to impose management fee reductions and expense limitations on its five Spartan stock index funds and its stock index fund available through variable insurance products, (iii) contractually agreeing to eliminate the management fees on the Fidelity Freedom Funds and the Fidelity Advisor Freedom Funds, (iv) contractually agreeing to reduce the management fees on most of its investment-grade taxable bond funds, and (v) contractually agreeing to impose expense limitations on its retail and Spartan investment-grade taxable bond funds.
Annual Report
Board Approval of Investment Advisory Contracts and
Management Fees - continued
Investment Performance. The Board considered whether the fund has operated within its investment objective, as well as its record of compliance with its investment restrictions. It also reviewed the fund's absolute investment performance, as well as the fund's relative investment performance measured against (i) a broad-based securities market index, and (ii) a peer group of mutual funds deemed appropriate by the Board. Because the fund had been in existence less than three calendar years, the following chart considered by the Board shows, for the one-year period ended December 31, 2004, the return of the retail class of the fund, the return of a broad-based securities market index ("benchmark"), and a range of returns of a peer group of mutual funds identified by Lipper Inc. as having an investment objective similar to that of the fund. The return of the retail class represents the performance of a class with the lowest 12b-1 fee (not necessarily with the lowest total expenses). (The Advisor classes of the fund, which have higher 12b-1 fees, had less than one year of performance as of December 31, 2004.) The box within the chart shows the 25th percentile return (bottom of box) and the 75th percentile return (top of box) of the Lipper peer group. The percentage beaten number noted below the chart corresponds to the percentile box and represents the percentage of funds in the Lipper peer group whose performance was equal to or lower than that of the retail class.
Annual Report
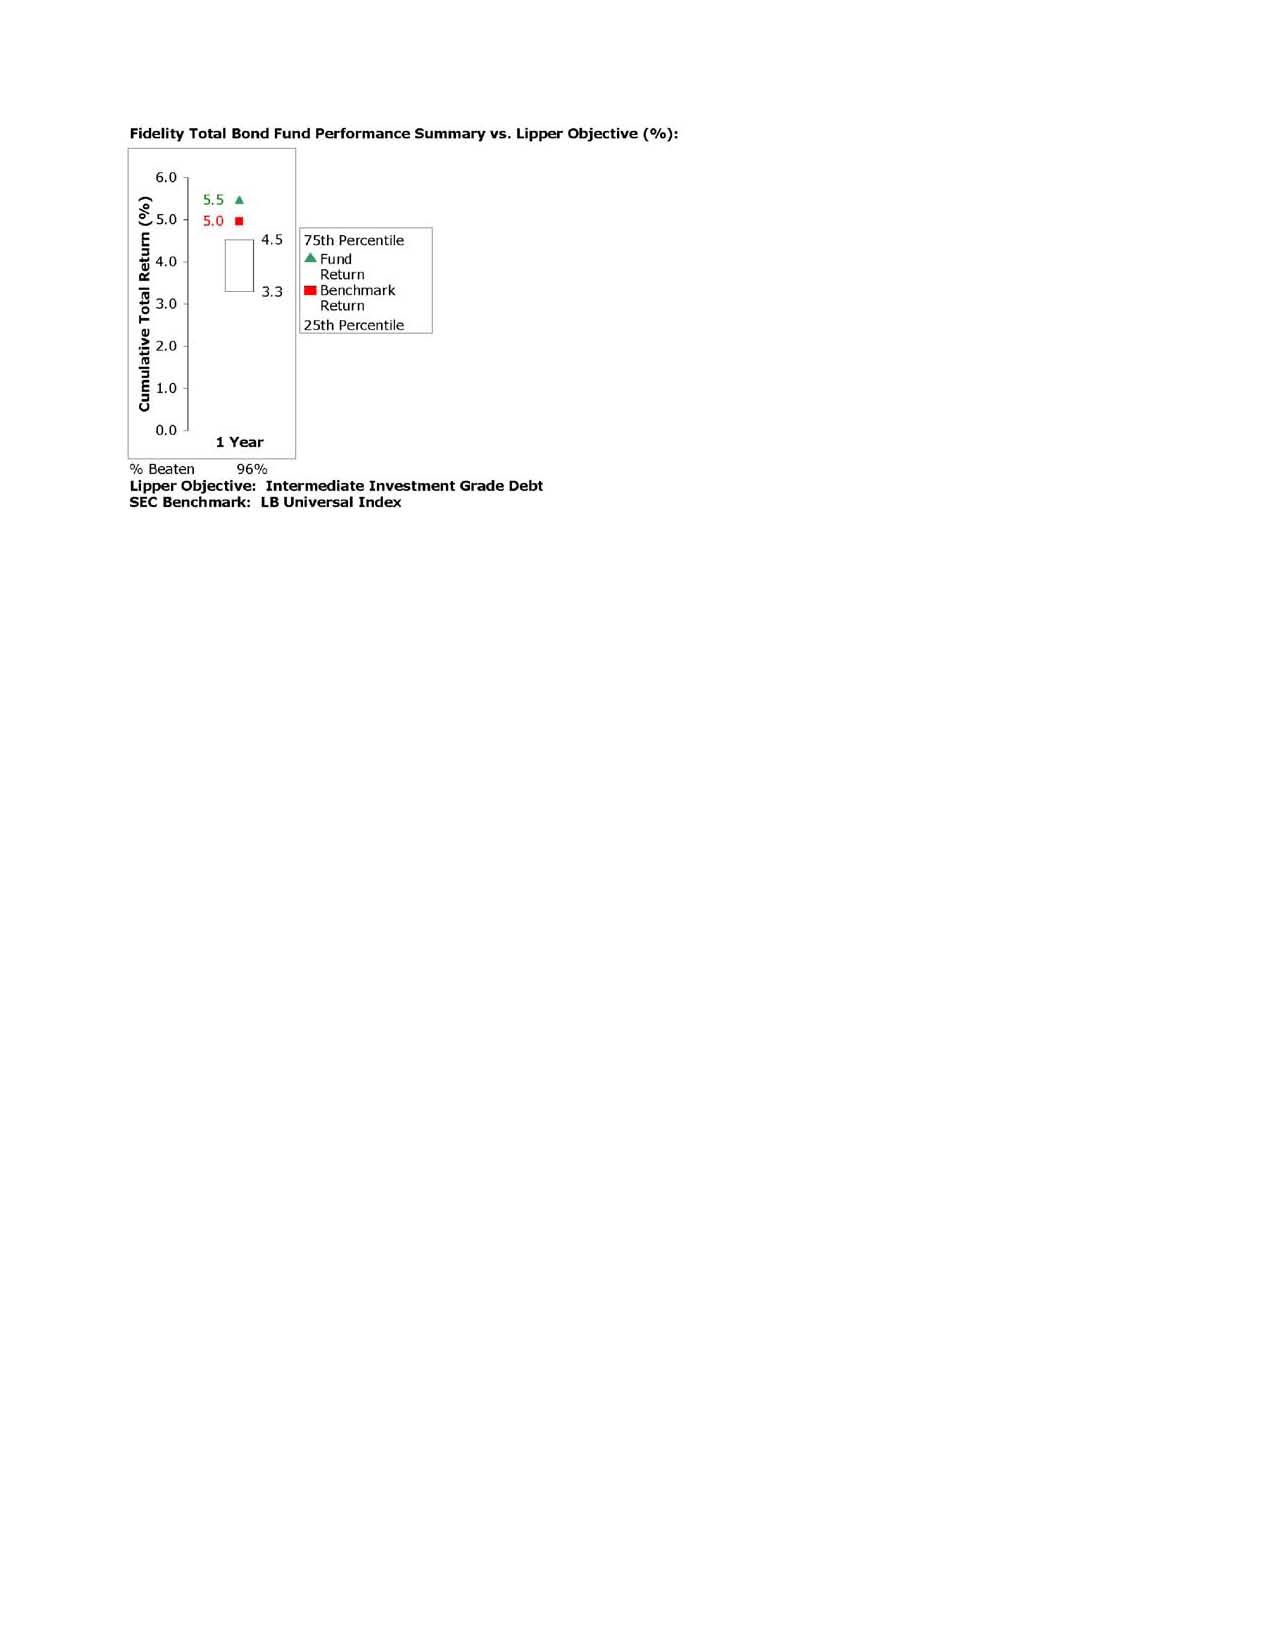
The Board noted that the relative investment performance of the retail class of the fund compared favorably to its Lipper peer group for the one-year period. The Board also noted that the relative investment performance of the retail class of the fund compared favorably to its benchmark for the one-year period.
Based on its review, and giving particular weight to the nature and quality of the resources dedicated by the Investment Advisers to maintain and improve relative performance, the Board concluded that the nature, extent, and quality of the services provided by Fidelity will benefit the fund's shareholders, particularly in light of the Board's view that the fund's shareholders benefit from investing in a fund that is part of a large family of funds offering a variety of investment disciplines and services.
Competitiveness of Management Fee and Total Fund Expenses. The Board considered the fund's management fee and total expenses compared to "mapped groups" of competitive funds and classes. Fidelity creates "mapped groups" by combining similar Lipper investment objective categories that have comparable management fee characteristics. Combining Lipper investment objective categories aids the Board's management fee and total expense comparisons by broadening the competitive group used for comparison and by reducing the number of universes to which various Fidelity funds are compared.
The Board considered two proprietary management fee comparisons for the 12-month (or shorter) periods shown in the chart below. The group of Lipper funds used by the Board for management fee comparisons is referred to below as the "Total Mapped Group" and, for the reasons explained above, is broader than the Lipper peer group used by the Board for performance comparisons. The Total Mapped Group comparison focuses on a fund's standing relative to the total universe of comparable funds available to investors, in terms of gross management fees before expense reimbursements or caps. "TMG %" represents the percentage of funds in the Total Mapped Group that had management fees that were lower than the fund's. For example, a TMG % of 22% would mean that 78% of the funds in the Total Mapped Group had higher management fees than the fund. The "Asset-Size Peer Group" (ASPG) comparison focuses on a fund's standing relative to non-Fidelity funds similar in size to the fund within the Total Mapped Group. The ASPG represents at least 15% of the funds in the Total Mapped Group with comparable asset size and management fee characteristics, subject to a minimum of 50 funds (or all funds in the Total Mapped Group if fewer than 50). Additional information, such as the ASPG quartile ("quadrant") in which the fund's management fee ranked, is also included in the chart and considered by the Board.
Annual Report
Board Approval of Investment Advisory Contracts and
Management Fees - continued
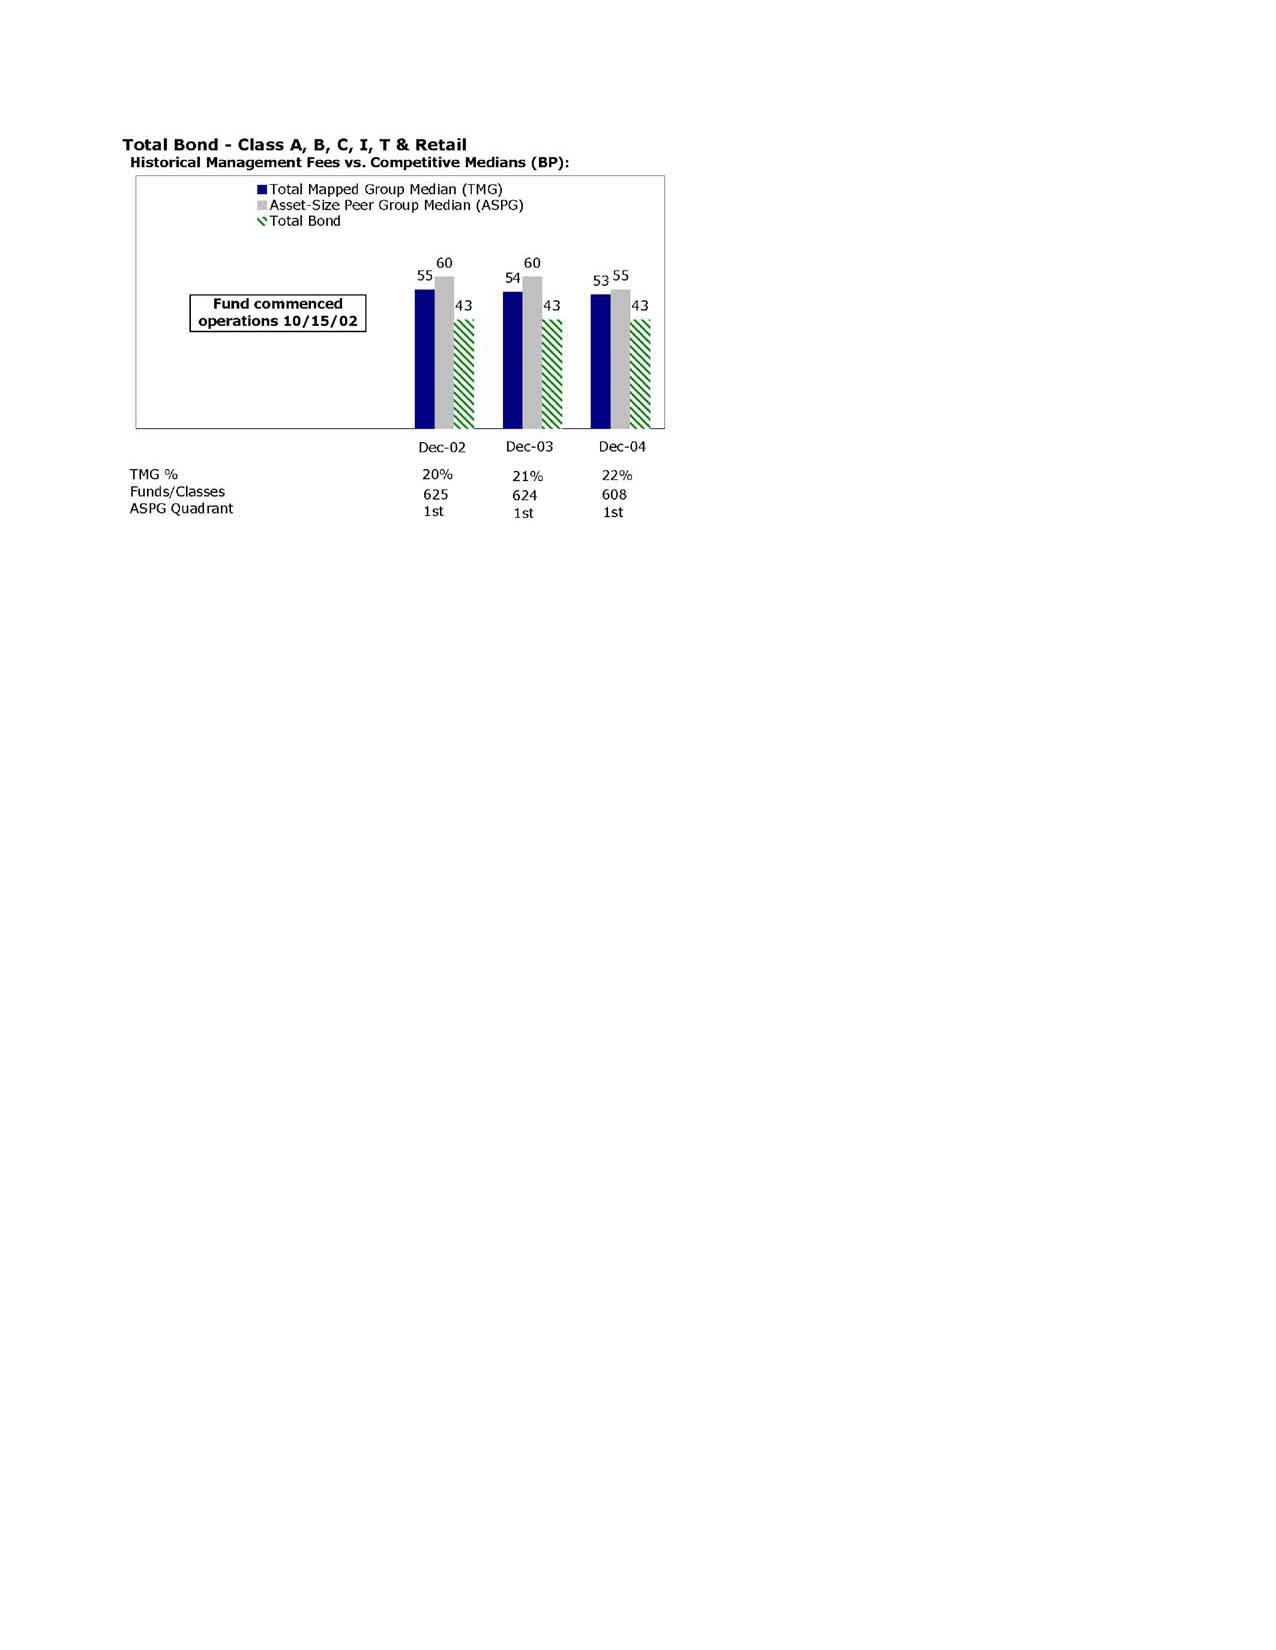
The Board noted that the fund's management fee ranked below the median of its Total Mapped Group and below the median of its ASPG for 2004.
Furthermore, the Board considered that, on May 19, 2005, after the periods shown in the chart above, it had approved an amendment (effective June 1, 2005) to the fund's management contract that lowered the fund's individual fund fee rate from 30 basis points to 20 basis points. The Board considered that, if the lower individual fund fee rate had been in effect in 2004, it would have reduced the fund's management fee rate from 43 basis points to 33 basis points.
Based on its review, the Board concluded that the fund's management fee was fair and reasonable in light of the services that the fund receives and the other factors considered.
Annual Report
In its review of each class's total expenses, the Board considered the fund's management fee as well as other fund or class expenses, as applicable, such as transfer agent fees, pricing and bookkeeping fees, fund-paid 12b-1 fees, and custodial, legal, and audit fees. The Board also noted the effects of any waivers and reimbursements on fees and expenses. As part of its review, the Board also considered current and historical total expenses of each class of the fund compared to competitive fund median expenses. Each class of the fund is compared to those funds and classes in the Total Mapped Group (used by the Board for management fee comparisons) that have a similar sales load structure.
The Board noted that each class's total expenses ranked below its competitive median for 2004. The Board considered that if the lower individual fund fee rate had been in effect in 2004, it would have reduced each class's total expenses by 10 basis points.
The Board also considered that on May 19, 2005, it had approved changes (effective June 1, 2005) in the contractual arrangements for the fund that (i) have the effect of setting the total "fund-level" expenses (including, among certain other expenses, the management fee) for each class at 35 basis points, (ii) lower and limit the "class-level" transfer agent fee for Fidelity Total Bond Fund (retail class) to 10 basis points, and (iii) limit the total expenses for Fidelity Total Bond Fund (retail class) to 45 basis points. These new contractual arrangements may not be increased without Board approval. The fund's Advisor classes continue to be subject to different class-level expenses (transfer agent fees and 12b-1 fees).
The Board recognized that the fund's management contract incorporates a "group fee" structure, which provides for lower fee rates as total fund assets under FMR's management increase, and for higher fee rates as total fund assets under FMR's management decrease. The Board noted that because the new contractual arrangements set the total fund-level expenses for each class at 35 basis points, increases or decreases in the management fee due to changes in the group fee rate will not impact total expenses. However, the Board realized that the 35 basis point fee rate was below the lowest management fee available under the old contractual arrangements. The maximum benefit that a decrease in the group fee rate could provide the fund would be a reduction in the management fee to approximately 39 basis points (compared to total fund-level expenses of 35 basis points under the new contractual arrangements).
In its review of total expenses, the Board also considered Fidelity fee structures and other information on clients that FMR and its affiliates service in other competitive markets, such as other mutual funds advised or subadvised by FMR or its affiliates, pension plan clients, and other institutional clients.
Based on its review, the Board concluded that each class's total expenses were reasonable in light of the services that the fund and its shareholders receive and the other factors considered.
Annual Report
Board Approval of Investment Advisory Contracts and
Management Fees - continued
Costs of the Services and Profitability. The Board considered the revenues earned and the expenses incurred by Fidelity in conducting the business of developing, marketing, distributing, managing, administering and servicing the fund and its shareholders. The Board also considered the level of Fidelity's profits in respect of all the Fidelity funds.
On an annual basis, FMR presents to the Board Fidelity's profitability for the fund. Fidelity calculates the profitability for each fund, as well as aggregate profitability for groups of Fidelity funds and all Fidelity funds, using a series of detailed revenue and cost allocation methodologies which originate with the audited books and records of Fidelity. The Audit Committee of the Board reviews any significant changes from the prior year's methodologies.
PricewaterhouseCoopers LLP (PwC), independent registered accounting firm and auditor to Fidelity and certain Fidelity funds, has been engaged annually by the Board as part of the Board's assessment of the results of Fidelity's profitability analysis. PwC's engagement includes the review and assessment of Fidelity's methodologies used in determining the revenues and expenses attributable to Fidelity's mutual fund business, and completion of agreed-upon procedures surrounding the mathematical accuracy of fund profitability and its conformity to allocation methodologies. After considering PwC's reports issued under the engagement and information provided by Fidelity, the Board believes that while other allocation methods may also be reasonable, Fidelity's profitability methodologies are reasonable in all material respects.
The Board has also reviewed Fidelity's non-fund businesses and any fall-out benefits related to the mutual fund business as well as cases where Fidelity's affiliates may benefit from or be related to the fund's business. In addition, a special committee of the Board reviewed services provided to Fidelity by its affiliates and determined that the fees that Fidelity paid for such services were reasonable.
The Board considered the costs of the services provided by and the profits realized by Fidelity in connection with the operation of the fund and determined that the amount of profit is a fair entrepreneurial profit for the management of the fund.
Economies of Scale. The Board considered whether there have been economies of scale in respect of the management of the Fidelity funds, whether the Fidelity funds (including the fund) have appropriately benefited from any such economies of scale, and whether there is potential for realization of any further economies of scale. The Board considered the extent to which the fund will benefit from economies of scale through increased services to the fund, through waivers or reimbursements, or through fee or expense reductions, including (Advisor classes only) reductions that occur through operation of the transfer agent agreement. The transfer agent fee varies in part based on the number of accounts in the fund. If the number of accounts decreases or the average account size increases, the overall transfer agent fee rate decreases. The Board also noted that the reduction in the fund's management fee rate from 43 basis points to 33 basis points and the reduction in each class's total expenses by 10 basis points would deliver significant economies to fund shareholders. The Board concluded that any potential economies of scale are being shared between fund shareholders and Fidelity in an appropriate manner.
Annual Report
Additional Information Requested by the Board. In order to develop fully the factual basis for consideration of the Advisory Contracts, the Board requested additional information regarding (i) Fidelity's fund profitability methodology, including additional detail on various cost allocations; (ii) fall-out benefits to Fidelity; and (iii) compensation of portfolio managers and research analysts.
Based on its evaluation of all of the conclusions noted above, and after considering all material factors, the Board ultimately concluded that the existing advisory fee structures are fair and reasonable, and that the fund's existing Advisory Contracts should be renewed.
Annual Report
The following is a complete listing of investments for Fidelity's
fixed-income central fund as of July 31, 2005 which
is a direct or indirect investment of Fidelity Total Bond Fund.
These underlying holdings of the Fidelity fixed-income central
fund are not included in the Schedule of Investments as
part of the Financial Statements.
Annual Report
Fidelity Ultra-Short Central Fund
Investments July 31, 2005 (Unaudited)
Showing Percentage of Net Assets
Nonconvertible Bonds - 3.8% |
| Principal Amount | | Value |
CONSUMER DISCRETIONARY - 1.0% |
Auto Components - 0.3% |
DaimlerChrysler NA Holding Corp.: | | | | |
3.8594% 9/10/07 (f) | | $ 16,665,000 | | $ 16,698,830 |
3.8938% 5/24/06 (f) | | 4,700,000 | | 4,713,691 |
| | 21,412,521 |
Media - 0.7% |
Continental Cablevision, Inc. 8.3% 5/15/06 | | 8,000,000 | | 8,248,640 |
Cox Communications, Inc. (Reg. S) 3.95% 12/14/07 (f) | | 12,140,000 | | 12,202,691 |
Liberty Media Corp. 4.91% 9/17/06 (f) | | 16,694,000 | | 16,786,986 |
Univision Communications, Inc. 2.875% 10/15/06 | | 8,505,000 | | 8,315,339 |
| | 45,553,656 |
TOTAL CONSUMER DISCRETIONARY | | 66,966,177 |
ENERGY - 0.2% |
Oil, Gas & Consumable Fuels - 0.2% |
Valero Energy Corp. 7.375% 3/15/06 | | 11,550,000 | | 11,735,435 |
FINANCIALS - 1.0% |
Capital Markets - 0.1% |
State Street Capital Trust II 3.7681% 2/15/08 (f) | | 10,000,000 | | 10,002,260 |
Commercial Banks - 0.3% |
Wells Fargo & Co. 3.4194% 3/10/08 (f) | | 16,600,000 | | 16,599,452 |
Consumer Finance - 0.2% |
General Motors Acceptance Corp. 4.87% 10/20/05 (f) | | 14,765,000 | | 14,786,188 |
Thrifts & Mortgage Finance - 0.4% |
Countrywide Financial Corp. 3.71% 4/11/07 (f) | | 11,025,000 | | 11,032,034 |
Residential Capital Corp. 4.835% 6/29/07 (c)(f) | | 14,150,000 | | 14,164,716 |
| | 25,196,750 |
TOTAL FINANCIALS | | 66,584,650 |
TELECOMMUNICATION SERVICES - 1.3% |
Diversified Telecommunication Services - 1.2% |
British Telecommunications PLC 7.875% 12/15/05 | | 18,145,000 | | 18,397,070 |
France Telecom SA 7.45% 3/1/06 (a) | | 5,600,000 | | 5,699,484 |
GTE Corp. 6.36% 4/15/06 | | 9,000,000 | | 9,126,405 |
SBC Communications, Inc. 4.389% 6/5/06 (c) | | 15,315,000 | | 15,319,595 |
Sprint Capital Corp. 4.78% 8/17/06 | | 6,000,000 | | 6,020,550 |
Telefonica Europe BV 7.35% 9/15/05 | | 4,500,000 | | 4,517,537 |
Nonconvertible Bonds - continued |
| Principal Amount | | Value |
TELECOMMUNICATION SERVICES - continued |
Diversified Telecommunication Services - continued |
Telefonos de Mexico SA de CV 4.5% 11/19/08 | | $ 10,240,000 | | $ 10,092,268 |
TELUS Corp. yankee 7.5% 6/1/07 | | 6,500,000 | | 6,835,569 |
| | 76,008,478 |
Wireless Telecommunication Services - 0.1% |
AT&T Wireless Services, Inc. 7.35% 3/1/06 | | 5,500,000 | | 5,596,976 |
TOTAL TELECOMMUNICATION SERVICES | | 81,605,454 |
UTILITIES - 0.3% |
Electric Utilities - 0.2% |
Pinnacle West Energy Corp. 4.0044% 4/1/07 (c)(f) | | 12,800,000 | | 12,800,794 |
Gas Utilities - 0.1% |
NiSource Finance Corp. 7.625% 11/15/05 | | 9,250,000 | | 9,342,213 |
TOTAL UTILITIES | | 22,143,007 |
TOTAL NONCONVERTIBLE BONDS (Cost $249,397,779) | 249,034,723 |
U.S. Government Agency Obligations - 0.0% |
|
Fannie Mae 0% 9/28/05 (e)
(Cost $994,579) | | 1,000,000 | | 994,635 |
Asset-Backed Securities - 35.2% |
|
Accredited Mortgage Loan Trust: | | | | |
Series 2004-2 Class A2, 3.76% 7/25/34 (f) | | 7,964,683 | | 7,978,722 |
Series 2004-3 Class 2A4, 3.81% 10/25/34 (f) | | 10,915,000 | | 10,946,584 |
Series 2004-4 Class A2D, 3.81% 1/25/35 (f) | | 3,579,364 | | 3,588,366 |
Series 2005-1: | | | | |
Class M1, 3.93% 4/25/35 (f) | | 11,280,000 | | 11,251,882 |
Class M2, 4.15% 4/25/35 (f) | | 5,275,000 | | 5,276,901 |
ACE Securities Corp.: | | | | |
Series 2002-HE1 Class M1, 4.11% 6/25/32 (f) | | 1,308,761 | | 1,318,432 |
Series 2002-HE2 Class M1, 4.31% 8/25/32 (f) | | 18,631,213 | | 18,704,611 |
Series 2003-FM1 Class M2, 5.31% 11/25/32 (f) | | 3,015,000 | | 3,050,466 |
Series 2003-HS1: | | | | |
Class M1, 4.21% 6/25/33 (f) | | 800,000 | | 803,485 |
Class M2, 5.21% 6/25/33 (f) | | 856,000 | | 871,093 |
Asset-Backed Securities - continued |
| Principal Amount | | Value |
ACE Securities Corp.: - continued | | | | |
Series 2003-NC1 Class M1, 4.24% 7/25/33 (f) | | $ 1,600,000 | | $ 1,611,660 |
Series 2004-HE1: | | | | |
Class M1, 3.96% 2/25/34 (f) | | 2,193,000 | | 2,193,772 |
Class M2, 4.56% 2/25/34 (f) | | 2,475,000 | | 2,476,241 |
Series 2004-OP1: | | | | |
Class M1, 3.98% 4/25/34 (f) | | 4,420,000 | | 4,424,344 |
Class M2, 4.51% 4/25/34 (f) | | 6,240,000 | | 6,251,080 |
Series 2005-HE2: | | | | |
Class M1, 3.9% 4/25/35 (f) | | 1,530,000 | | 1,527,965 |
Class M2, 3.91% 4/25/35 (f) | | 1,803,000 | | 1,796,836 |
Class M3, 3.94% 4/25/35 (f) | | 1,040,000 | | 1,038,647 |
Class M4, 4.1% 4/25/35 (f) | | 1,340,000 | | 1,338,268 |
Series 2005-HE3: | | | | |
Class A2A, 3.56% 5/25/35 (f) | | 8,063,511 | | 8,063,822 |
Class A2B, 3.67% 5/25/35 (f) | | 4,370,000 | | 4,366,352 |
Series 2005-SD1 Class A1, 3.86% 11/25/50 (f) | | 2,563,309 | | 2,566,464 |
Aesop Funding II LLC Series 2005-1A Class A2, 3.49% 4/20/09 (c)(f) | | 8,800,000 | | 8,765,680 |
American Express Credit Account Master Trust: | | | | |
Series 2002-6 Class B, 3.8381% 3/15/10 (f) | | 5,000,000 | | 5,030,751 |
Series 2004-1 Class B, 3.6381% 9/15/11 (f) | | 5,775,000 | | 5,797,723 |
Series 2004-C Class C, 3.8881% 2/15/12 (c)(f) | | 17,323,520 | | 17,374,643 |
Series 2005-1 Class A, 3.4181% 10/15/12 (f) | | 15,455,000 | | 15,481,600 |
AmeriCredit Automobile Receivables Trust: | | | | |
Series 2002-EM Class A4A, 3.67% 6/8/09 | | 25,000,000 | | 24,899,223 |
Series 2003-AM: | | | | |
Class A3B, 3.71% 6/6/07 (f) | | 685,806 | | 685,879 |
Class A4B, 3.81% 11/6/09 (f) | | 12,400,000 | | 12,441,657 |
Series 2003-BX Class A4B, 3.72% 1/6/10 (f) | | 3,265,000 | | 3,275,694 |
Series 2003-CF Class A3, 2.75% 10/9/07 | | 12,249,371 | | 12,210,791 |
Series 2005-1 Class C, 4.73% 7/6/10 | | 15,500,000 | | 15,451,950 |
Ameriquest Mortgage Securities, Inc.: | | | | |
Series 2002-3 Class M1, 4.16% 8/25/32 (f) | | 5,000,000 | | 5,028,248 |
Series 2003-1: | | | | |
Class A2, 3.87% 2/25/33 (f) | | 465,695 | | 465,917 |
Class M1, 4.36% 2/25/33 (f) | | 6,150,000 | | 6,197,846 |
Series 2003-3: | | | | |
Class M1, 4.26% 3/25/33 (f) | | 1,590,000 | | 1,603,481 |
Class S, 5% 9/25/05 (g) | | 4,457,447 | | 17,215 |
Series 2003-6: | | | | |
Class M1, 4.22% 8/25/33 (f) | | 7,560,000 | | 7,611,224 |
Asset-Backed Securities - continued |
| Principal Amount | | Value |
Ameriquest Mortgage Securities, Inc.: - continued | | | | |
Series 2003-6: | | | | |
Class M2, 5.31% 5/25/33 (f) | | $ 2,750,000 | | $ 2,808,476 |
Series 2003-AR1 Class M1, 4.61% 1/25/33 (f) | | 7,000,000 | | 7,072,631 |
Series 2004-R2: | | | | |
Class M1, 3.89% 4/25/34 (f) | | 1,230,000 | | 1,229,949 |
Class M2, 3.94% 4/25/34 (f) | | 950,000 | | 949,960 |
Class M3, 4.01% 4/25/34 (f) | | 3,500,000 | | 3,499,854 |
Class M4, 4.51% 4/25/34 (f) | | 4,500,000 | | 4,499,807 |
Series 2004-R9 Class A3, 3.78% 10/25/34 (f) | | 9,340,000 | | 9,359,871 |
Series 2005-R1: | | | | |
Class M1, 3.91% 3/25/35 (f) | | 5,710,000 | | 5,691,308 |
Class M2, 3.94% 3/25/35 (f) | | 1,925,000 | | 1,918,868 |
Series 2005-R2 Class M1, 3.91% 4/25/35 (f) | | 12,500,000 | | 12,482,516 |
Amortizing Residential Collateral Trust: | | | | |
Series 2002-BC3 Class A, 3.79% 6/25/32 (f) | | 2,411,175 | | 2,418,495 |
Series 2002-BC6 Class M1, 4.21% 8/25/32 (f) | | 24,900,000 | | 25,116,817 |
Series 2002-BC7: | | | | |
Class M1, 4.1144% 10/25/32 (f) | | 10,000,000 | | 10,075,000 |
Class M2, 4.36% 10/25/32 (f) | | 5,575,000 | | 5,612,067 |
Series 2003-BC1 Class M2, 4.56% 1/25/32 (f) | | 758,836 | | 762,333 |
ARG Funding Corp.: | | | | |
Series 2005-1A Class A2, 3.53% 4/20/09 (c)(f) | | 11,000,000 | | 10,975,938 |
Series 2005-2A Class A2, 3.54% 5/20/09 (c)(f) | | 5,200,000 | | 5,190,453 |
Argent Securities, Inc.: | | | | |
Series 2003-W3 Class M2, 5.26% 9/25/33 (f) | | 20,000,000 | | 20,599,990 |
Series 2003-W7 Class A2, 3.85% 3/1/34 (f) | | 4,505,856 | | 4,515,756 |
Series 2004-W5 Class M1, 4.06% 4/25/34 (f) | | 3,960,000 | | 3,964,768 |
Series 2004-W7: | | | | |
Class M1, 4.01% 5/25/34 (f) | | 4,085,000 | | 4,084,827 |
Class M2, 4.06% 5/25/34 (f) | | 3,320,000 | | 3,319,860 |
Asset Backed Securities Corp. Home Equity Loan Trust: | | | | |
Series 2003-HE2: | | | | |
Class A2, 3.7681% 4/15/33 (f) | | 1,158,706 | | 1,159,186 |
Class M1, 4.2881% 4/15/33 (f) | | 11,365,000 | | 11,429,103 |
Series 2003-HE3: | | | | |
Class M1, 4.2181% 6/15/33 (f) | | 2,185,000 | | 2,198,827 |
Class M2, 5.3881% 6/15/33 (f) | | 10,000,000 | | 10,182,465 |
Series 2003-HE4 Class M2, 5.3881% 8/15/33 (f) | | 5,695,000 | | 5,798,650 |
Series 2003-HE5 Class A2A, 3.7481% 8/15/33 (f) | | 1,380,797 | | 1,381,390 |
Series 2003-HE6 Class M1, 4.11% 11/25/33 (f) | | 3,475,000 | | 3,490,373 |
Series 2004-HE2 Class M1, 4.01% 4/25/34 (f) | | 6,060,000 | | 6,070,769 |
Series 2004-HE3: | | | | |
Class M1, 4% 6/25/34 (f) | | 1,450,000 | | 1,454,353 |
Asset-Backed Securities - continued |
| Principal Amount | | Value |
Asset Backed Securities Corp. Home Equity Loan Trust: - continued | | | | |
Series 2004-HE3: | | | | |
Class M2, 4.58% 6/25/34 (f) | | $ 3,350,000 | | $ 3,386,297 |
Series 2004-HE6 Class A2, 3.82% 6/25/34 (f) | | 17,398,791 | | 17,435,568 |
Series 2005-HE2: | | | | |
Class M1, 3.91% 3/25/35 (f) | | 8,250,000 | | 8,235,989 |
Class M2, 3.96% 3/25/35 (f) | | 2,065,000 | | 2,065,671 |
Series 2005-HE6 Class A2B, 3.76% 8/25/35 (d)(f) | | 10,000,000 | | 10,000,000 |
Bank One Issuance Trust: | | | | |
Series 2002-B1 Class B1, 3.7681% 12/15/09 (f) | | 20,655,000 | | 20,741,067 |
Series 2002-B2 Class B2, 3.7281% 5/15/08 (f) | | 15,000,000 | | 15,001,929 |
Series 2002-B3 Class B, 3.7481% 8/15/08 (f) | | 14,500,000 | | 14,505,871 |
Series 2002-C1 Class C1, 4.3481% 12/15/09 (f) | | 7,980,000 | | 8,065,464 |
Series 2002-C2 Class C2, 4.3781% 5/15/08 (f) | | 35,785,000 | | 35,817,626 |
Bayview Financial Acquisition Trust Series 2004-C Class A1, 3.9013% 5/28/44 (f) | | 8,416,440 | | 8,415,509 |
Bayview Financial Asset Trust Series 2000-F Class A, 3.9813% 9/28/43 (f) | | 9,618,786 | | 9,632,318 |
Bayview Financial Mortgage Loan Trust Series 2004-A Class A, 3.9313% 2/28/44 (f) | | 5,760,012 | | 5,771,599 |
Bear Stearns Asset Backed Securities I: | | | | |
Series 2005-HE2: | | | | |
Class M1, 3.96% 2/25/35 (f) | | 6,655,000 | | 6,639,262 |
Class M2, 4.21% 2/25/35 (f) | | 2,430,000 | | 2,432,538 |
Series 2005-HE5 Class 1A1, 3.4244% 6/25/35 (f) | | 10,884,395 | | 10,884,395 |
Capital Auto Receivables Asset Trust: | | | | |
Series 2002-5 Class B, 2.8% 4/15/08 | | 2,894,887 | | 2,868,235 |
Series 2003-1 Class B, 3.8581% 6/15/10 (c)(f) | | 5,781,229 | | 5,797,579 |
Series 2003-2 Class B, 3.6681% 1/15/09 (f) | | 2,741,542 | | 2,746,505 |
Series 2005-1 Class B, 3.7631% 6/15/10 (f) | | 5,725,000 | | 5,730,367 |
Capital One Auto Finance Trust: | | | | |
Series 2003-A Class A4B, 3.6681% 1/15/10 (f) | | 9,630,000 | | 9,654,568 |
Series 2004-B Class A4, 3.4981% 8/15/11 (f) | | 16,300,000 | | 16,303,123 |
Capital One Master Trust: | | | | |
Series 1999-3 Class B, 3.8681% 9/15/09 (f) | | 5,000,000 | | 5,004,082 |
Series 2001-1 Class B, 3.8981% 12/15/10 (f) | | 19,500,000 | | 19,638,608 |
Series 2001-8A Class B, 3.9381% 8/17/09 (f) | | 9,585,000 | | 9,634,206 |
Series 2002-4A Class B, 3.8881% 3/15/10 (f) | | 6,000,000 | | 6,028,221 |
Capital One Multi-Asset Execution Trust: | | | | |
Series 2002-B1 Class B1, 4.0681% 7/15/08 (f) | | 17,705,000 | | 17,711,976 |
Series 2003-B1 Class B1, 4.5581% 2/17/09 (f) | | 15,470,000 | | 15,566,773 |
Capital Trust Ltd. Series 2004-1: | | | | |
Class A2, 3.88% 7/20/39 (c)(f) | | 2,968,000 | | 2,968,000 |
Asset-Backed Securities - continued |
| Principal Amount | | Value |
Capital Trust Ltd. Series 2004-1: - continued | | | | |
Class B, 4.18% 7/20/39 (c)(f) | | $ 1,550,000 | | $ 1,550,000 |
Class C, 4.53% 7/20/39 (c)(f) | | 1,994,000 | | 1,994,000 |
CDC Mortgage Capital Trust: | | | | |
Series 2001-HE1 Class M1, 4.49% 1/25/32 (f) | | 4,244,221 | | 4,254,278 |
Series 2002-HE2 Class M1, 4.16% 1/25/33 (f) | | 9,278,431 | | 9,309,123 |
Series 2002-HE3: | | | | |
Class M1, 4.56% 3/25/33 (f) | | 21,339,884 | | 21,627,815 |
Class M2, 5.71% 3/25/33 (f) | | 9,968,976 | | 10,143,974 |
Series 2003-HE1: | | | | |
Class M1, 4.36% 8/25/33 (f) | | 1,989,998 | | 1,997,574 |
Class M2, 5.41% 8/25/33 (f) | | 4,369,996 | | 4,422,084 |
Series 2003-HE2 Class A, 3.81% 10/25/33 (f) | | 1,634,377 | | 1,635,405 |
Series 2003-HE3: | | | | |
Class M1, 4.16% 11/25/33 (f) | | 2,254,989 | | 2,271,960 |
Class M2, 5.21% 11/25/33 (f) | | 1,719,992 | | 1,753,552 |
Series 2004-HE2 Class M2, 4.66% 7/26/34 (f) | | 2,345,000 | | 2,365,939 |
Chase Credit Card Owner Trust: | | | | |
Series 2001-6 Class B, 3.8681% 3/16/09 (f) | | 1,305,000 | | 1,311,169 |
Series 2002-6 Class B, 3.7381% 1/15/08 (f) | | 11,850,000 | | 11,852,472 |
Series 2004-1 Class B, 3.5881% 5/15/09 (f) | | 4,105,000 | | 4,104,204 |
Citibank Credit Card Issuance Trust: | | | | |
Series 2000-C2 Class C2, 4.2488% 10/15/07 (f) | | 17,500,000 | | 17,511,349 |
Series 2001-B2 Class B2, 3.8494% 12/10/08 (f) | | 11,945,000 | | 11,995,341 |
Series 2002-B1 Class B1, 3.8% 6/25/09 (f) | | 9,010,000 | | 9,038,878 |
Series 2002-C1 Class C1, 4.2185% 2/9/09 (f) | | 17,500,000 | | 17,686,918 |
Series 2003-B1 Class B1, 3.66% 3/7/08 (f) | | 25,000,000 | | 25,022,693 |
Series 2003-C1 Class C1, 4.65% 4/7/10 (f) | | 17,785,000 | | 18,152,159 |
Citigroup Mortgage Loan Trust Series 2003-HE4 Class A, 3.87% 12/25/33 (c)(f) | | 7,985,107 | | 7,985,935 |
CNH Wholesale Master Note Trust Series 2005-1: | | | | |
Class A, 3.43% 6/15/11 (f) | | 18,000,000 | | 18,000,000 |
Class B, 3.72% 6/15/11 (f) | | 2,280,000 | | 2,280,000 |
Countrywide Home Loans, Inc.: | | | | |
Series 2002-6 Class AV1, 3.89% 5/25/33 (f) | | 1,499,863 | | 1,503,470 |
Series 2003-BC1 Class M2, 5.46% 9/25/32 (f) | | 11,065,000 | | 11,199,451 |
Series 2003-SD3 Class A1, 3.88% 12/25/32 (c)(f) | | 927,188 | | 931,926 |
Series 2004-2 Class M1, 3.96% 5/25/34 (f) | | 5,200,000 | | 5,206,719 |
Series 2004-3: | | | | |
Class 3A4, 3.71% 8/25/34 (f) | | 530,752 | | 528,596 |
Class M1, 3.96% 6/25/34 (f) | | 1,475,000 | | 1,476,356 |
Series 2004-4: | | | | |
Class A, 3.83% 8/25/34 (f) | | 2,524,088 | | 2,526,278 |
Asset-Backed Securities - continued |
| Principal Amount | | Value |
Countrywide Home Loans, Inc.: - continued | | | | |
Series 2004-4: | | | | |
Class M1, 3.94% 7/25/34 (f) | | $ 3,650,000 | | $ 3,653,189 |
Class M2, 3.99% 6/25/34 (f) | | 4,395,000 | | 4,398,536 |
Series 2005-1: | | | | |
Class 1AV2, 3.66% 7/25/35 (f) | | 8,780,000 | | 8,775,114 |
Class M1, 3.88% 8/25/35 (f) | | 19,600,000 | | 19,563,654 |
Class MV1, 3.86% 7/25/35 (f) | | 3,135,000 | | 3,130,219 |
Class MV2, 3.9% 7/25/35 (f) | | 3,765,000 | | 3,754,147 |
Class MV3, 3.94% 7/25/35 (f) | | 1,560,000 | | 1,557,748 |
Series 2005-3 Class MV1, 3.88% 8/25/35 (f) | | 11,125,000 | | 11,103,934 |
Series 2005-AB1 Class A2, 3.67% 8/25/35 (f) | | 17,520,000 | | 17,514,797 |
Series 2005-IM1 Class A1, 3.56% 8/25/34 (d)(f) | | 17,915,000 | | 17,915,000 |
CS First Boston Mortgage Securities Corp.: | | | | |
Series 2003-8 Class A2, 3.85% 4/25/34 (f) | | 2,663,075 | | 2,674,762 |
Series 2004-FRE1: | | | | |
Class A2, 3.81% 4/25/34 (f) | | 2,689,397 | | 2,689,291 |
Class M3, 4.11% 4/25/34 (f) | | 5,885,000 | | 5,884,751 |
Discover Card Master Trust I Series 2003-4 Class B1, 3.7181% 5/16/11 (f) | | 8,155,000 | | 8,196,815 |
Fannie Mae guaranteed REMIC pass thru certificates Series 2004-T5 Class AB3, 3.8305% 5/28/35 (f) | | 6,957,460 | | 6,959,877 |
Fieldstone Mortgage Investment Corp.: | | | | |
Series 2003-1: | | | | |
Class M1, 4.14% 11/25/33 (f) | | 1,300,000 | | 1,308,748 |
Class M2, 5.21% 11/25/33 (f) | | 700,000 | | 718,600 |
Series 2004-1 Class M2, 4.56% 1/25/35 (f) | | 3,700,000 | | 3,741,581 |
Series 2004-2 Class M2, 4.61% 7/25/34 (f) | | 9,890,000 | | 9,889,579 |
Series 2004-3 Class M5, 4.91% 8/25/34 (f) | | 2,000,000 | | 2,033,830 |
Series 2005-2 Class 2A1, 3.5% 7/25/36 (d)(f) | | 16,935,000 | | 16,935,000 |
First Franklin Mortgage Loan Asset Backed Certificates: | | | | |
Series 2005-FF2 Class A2A, 3.55% 3/25/35 (f) | | 7,354,604 | | 7,354,604 |
Series 2005-FF2 Class M6, 4.16% 3/25/35 (f) | | 6,950,000 | | 6,950,000 |
First Franklin Mortgage Loan Trust Series 2004-FF2: | | | | |
Class M3, 4.01% 3/25/34 (f) | | 400,000 | | 400,711 |
Class M4, 4.36% 3/25/34 (f) | | 300,000 | | 302,647 |
First USA Credit Card Master Trust Series 2001-4 Class B, 3.75% 1/12/09 (f) | | 15,000,000 | | 15,026,199 |
First USA Secured Note Trust Series 2001-3 Class C, 4.4669% 11/19/08 (c)(f) | | 11,580,000 | | 11,661,421 |
Ford Credit Auto Owner Trust Series 2003-B Class B2, 3.8181% 10/15/07 (f) | | 19,600,000 | | 19,671,950 |
Asset-Backed Securities - continued |
| Principal Amount | | Value |
Ford Credit Floorplan Master Owner Trust Series 2005-1: | | | | |
Class A, 3.5381% 5/17/10 (f) | | $ 9,590,000 | | $ 9,589,981 |
Class B, 3.6563% 5/17/10 (f) | | 2,625,000 | | 2,624,992 |
Fremont Home Loan Trust: | | | | |
Series 2004-1: | | | | |
Class 1A1, 3.68% 2/25/34 (f) | | 2,669,337 | | 2,669,232 |
Class M1, 3.91% 2/25/34 (f) | | 750,000 | | 749,968 |
Class M2, 3.96% 2/25/34 (f) | | 800,000 | | 799,966 |
Series 2004-C Class 2A2, 4.01% 8/25/34 (f) | | 10,000,000 | | 10,101,993 |
Series 2005-2 Class 2A1, 3.5913% 6/25/35 (f) | | 15,380,000 | | 15,375,194 |
Series 2005-A: | | | | |
Class 2A2, 3.7% 2/25/35 (f) | | 11,850,000 | | 11,865,657 |
Class M1, 3.89% 1/25/35 (f) | | 1,603,000 | | 1,599,854 |
Class M2, 3.92% 1/25/35 (f) | | 2,325,000 | | 2,321,531 |
Class M3, 3.95% 1/25/35 (f) | | 1,250,000 | | 1,249,947 |
Class M4, 4.14% 1/25/35 (f) | | 925,000 | | 927,535 |
GE Business Loan Trust Series 2003-1 Class A, 3.8181% 4/15/31 (c)(f) | | 5,499,865 | | 5,531,421 |
GE Capital Credit Card Master Note Trust Series 2005-2 Class B, 3.5736% 6/15/11 (f) | | 6,475,000 | | 6,473,058 |
Gracechurch Card Funding PLC: | | | | |
Series 5: | | | | |
Class B, 3.6181% 8/15/08 (f) | | 1,520,000 | | 1,521,351 |
Class C, 4.3181% 8/15/08 (f) | | 5,580,000 | | 5,601,142 |
Series 6 Class B, 3.5781% 2/17/09 (f) | | 1,030,000 | | 1,030,901 |
Series 8 Class C, 3.6721% 6/15/10 (f) | | 18,450,000 | | 18,450,000 |
GSAMP Trust: | | | | |
Series 2002-HE Class M1, 4.68% 11/20/32 (f) | | 2,882,888 | | 2,928,737 |
Series 2002-NC1: | | | | |
Class A2, 3.78% 7/25/32 (f) | | 54,777 | | 55,099 |
Class M1, 4.1% 7/25/32 (f) | | 8,861,000 | | 8,920,491 |
Series 2003-FM1 Class M1, 4.25% 3/20/33 (f) | | 15,000,000 | | 15,136,310 |
Series 2004-FM1: | | | | |
Class M1, 4.11% 11/25/33 (f) | | 2,865,000 | | 2,864,879 |
Class M2, 4.86% 11/25/33 (f) | | 1,975,000 | | 2,005,597 |
Series 2004-FM2: | | | | |
Class M1, 3.96% 1/25/34 (f) | | 3,500,000 | | 3,499,853 |
Class M2, 4.56% 1/25/34 (f) | | 1,500,000 | | 1,499,936 |
Class M3, 4.76% 1/25/34 (f) | | 1,500,000 | | 1,499,935 |
Series 2004-HE1: | | | | |
Class M1, 4.01% 5/25/34 (f) | | 4,045,000 | | 4,044,829 |
Class M2, 4.61% 5/25/34 (f) | | 1,750,000 | | 1,766,258 |
Asset-Backed Securities - continued |
| Principal Amount | | Value |
GSAMP Trust: - continued | | | | |
Series 2005-9 Class 2A1, 3.5287% 8/25/35 (f) | | $ 17,530,000 | | $ 17,530,000 |
Series 2005-FF2 Class M5, 4.09% 3/25/35 (f) | | 3,500,000 | | 3,500,000 |
Series 2005-HE2 Class M, 3.89% 3/25/35 (f) | | 8,780,000 | | 8,749,867 |
Series 2005-NC1 Class M1, 3.91% 2/25/35 (f) | | 9,010,000 | | 8,987,296 |
Guggenheim Structured Real Estate Funding Ltd. Series 2005-1 Class C, 4.3944% 5/25/30 (c)(f) | | 14,000,000 | | 13,986,652 |
HFC Home Equity Loan Asset Backed Certificates Series 2005-2: | | | | |
Class M1, 3.97% 1/20/34 (f) | | 3,225,000 | | 3,225,000 |
Class M2, 4% 1/20/34 (f) | | 2,415,000 | | 2,415,000 |
Home Equity Asset Trust: | | | | |
Series 2002-2 Class M1, 4.26% 6/25/32 (f) | | 10,000,000 | | 10,017,090 |
Series 2002-3 Class A5, 3.9% 2/25/33 (f) | | 854,528 | | 855,194 |
Series 2002-4 Class A3, 3.94% 3/25/33 (f) | | 1,237,388 | | 1,238,074 |
Series 2002-5: | | | | |
Class A3, 3.98% 5/25/33 (f) | | 2,866,793 | | 2,872,821 |
Class M1, 4.66% 5/25/33 (f) | | 13,800,000 | | 13,966,276 |
Series 2003-1: | | | | |
Class A2, 3.93% 6/25/33 (f) | | 4,229,596 | | 4,233,111 |
Class M1, 4.46% 6/25/33 (f) | | 8,335,000 | | 8,375,317 |
Series 2003-2: | | | | |
Class A2, 3.84% 8/25/33 (f) | | 228,269 | | 229,139 |
Class M1, 4.34% 8/25/33 (f) | | 2,245,000 | | 2,269,298 |
Series 2003-3: | | | | |
Class A2, 3.82% 8/25/33 (f) | | 1,624,262 | | 1,630,339 |
Class M1, 4.32% 8/25/33 (f) | | 8,185,000 | | 8,266,814 |
Series 2003-4: | | | | |
Class M1, 4.26% 10/25/33 (f) | | 3,415,000 | | 3,440,384 |
Class M2, 5.36% 10/25/33 (f) | | 4,040,000 | | 4,093,038 |
Series 2003-5: | | | | |
Class A2, 3.81% 12/25/33 (f) | | 5,822,876 | | 5,843,440 |
Class M1, 4.16% 12/25/33 (f) | | 3,175,000 | | 3,192,660 |
Class M2, 5.19% 12/25/33 (f) | | 1,345,000 | | 1,377,487 |
Series 2003-7 Class A2, 3.84% 3/25/34 (f) | | 3,430,379 | | 3,438,503 |
Series 2004-2 Class A2, 3.75% 7/25/34 (f) | | 6,172,348 | | 6,172,139 |
Series 2004-3: | | | | |
Class M1, 4.03% 8/25/34 (f) | | 2,015,000 | | 2,019,636 |
Class M2, 4.66% 8/25/34 (f) | | 2,200,000 | | 2,237,373 |
Series 2004-4 Class A2, 3.78% 10/25/34 (f) | | 8,318,527 | | 8,347,783 |
Series 2004-6 Class A2, 3.81% 12/25/34 (f) | | 9,249,309 | | 9,278,715 |
Series 2004-7 Class A3, 3.85% 1/25/35 (f) | | 2,916,946 | | 2,929,856 |
Asset-Backed Securities - continued |
| Principal Amount | | Value |
Home Equity Asset Trust: - continued | | | | |
Series 2005-1: | | | | |
Class M1, 3.89% 5/25/35 (f) | | $ 9,705,000 | | $ 9,697,565 |
Class M2, 3.91% 5/25/35 (f) | | 5,780,000 | | 5,763,067 |
Class M3, 3.96% 5/25/35 (f) | | 5,825,000 | | 5,808,344 |
Series 2005-2: | | | | |
Class 2A2, 3.66% 7/25/35 (f) | | 13,170,000 | | 13,163,182 |
Class M1, 3.91% 7/25/35 (f) | | 10,085,000 | | 10,075,362 |
Series 2005-3 Class M1, 3.87% 8/25/35 (f) | | 9,450,000 | | 9,434,700 |
Series 2005-5 Class 2A2, 3.65% 11/25/35 (d)(f) | | 15,000,000 | | 14,968,605 |
Household Affinity Credit Card Master Note Trust I Series 2003-3 Class B, 3.6781% 8/15/08 (f) | | 10,000,000 | | 10,018,071 |
Household Credit Card Master Trust I Series 2002-1 Class B, 4.0381% 7/15/08 (f) | | 22,589,000 | | 22,608,682 |
Household Home Equity Loan Trust: | | | | |
Series 2002-2 Class A, 3.73% 4/20/32 (f) | | 3,295,048 | | 3,298,089 |
Series 2002-3 Class A, 3.88% 7/20/32 (f) | | 2,678,218 | | 2,681,775 |
Series 2003-1 Class M, 4.06% 10/20/32 (f) | | 770,987 | | 771,866 |
Series 2003-2: | | | | |
Class A, 3.76% 9/20/33 (f) | | 2,892,082 | | 2,897,777 |
Class M, 4.01% 9/20/33 (f) | | 1,360,000 | | 1,362,941 |
Series 2004-1 Class M, 3.95% 9/20/33 (f) | | 2,708,464 | | 2,713,597 |
Household Mortgage Loan Trust: | | | | |
Series 2003-HC1 Class M, 4.08% 2/20/33 (f) | | 1,742,776 | | 1,748,262 |
Series 2004-HC1: | | | | |
Class A, 3.78% 2/20/34 (f) | | 5,083,992 | | 5,096,702 |
Class M, 3.93% 2/20/34 (f) | | 3,073,800 | | 3,073,443 |
Household Private Label Credit Card Master Note Trust I: | | | | |
Series 2002-1 Class B, 3.9381% 1/18/11 (f) | | 8,850,000 | | 8,867,619 |
Series 2002-2: | | | | |
Class A, 3.5581% 1/18/11 (f) | | 9,000,000 | | 9,012,218 |
Class B, 3.9381% 1/18/11 (f) | | 14,275,000 | | 14,355,952 |
Series 2002-3 Class B, 4.6381% 9/15/09 (f) | | 4,150,000 | | 4,159,262 |
Ikon Receivables Funding LLC Series 2003-1 Class A3A, 3.6213% 12/17/07 (f) | | 2,781,207 | | 2,781,863 |
IXIS Real Estate Capital Trust Series 2005-HE1: | | | | |
Class A1, 3.71% 6/25/35 (f) | | 11,646,350 | | 11,645,706 |
Class M1, 3.93% 6/25/35 (f) | | 4,100,000 | | 4,094,813 |
Class M2, 3.95% 6/25/35 (f) | | 2,775,000 | | 2,766,003 |
Class M3, 3.98% 6/25/35 (f) | | 1,975,000 | | 1,972,566 |
Keycorp Student Loan Trust Series 1999-A Class A2, 3.8% 12/27/09 (f) | | 16,169,548 | | 16,224,493 |
Asset-Backed Securities - continued |
| Principal Amount | | Value |
Long Beach Mortgage Loan Trust: | | | | |
Series 2003-2: | | | | |
Class AV, 3.78% 6/25/33 (f) | | $ 253,078 | | $ 253,185 |
Class M1, 4.28% 6/25/33 (f) | | 19,500,000 | | 19,626,153 |
Series 2003-3 Class M1, 4.21% 7/25/33 (f) | | 7,770,000 | | 7,824,625 |
Series 2004-2: | | | | |
Class M1, 3.99% 6/25/34 (f) | | 4,275,000 | | 4,285,404 |
Class M2, 4.54% 6/25/34 (f) | | 1,400,000 | | 1,416,723 |
Series 2005-2 Class 2A2, 3.64% 4/25/35 (f) | | 12,000,000 | | 11,996,998 |
MASTR Asset Backed Securities Trust: | | | | |
Series 2003-NC1: | | | | |
Class M1, 4.19% 4/25/33 (f) | | 3,500,000 | | 3,519,270 |
Class M2, 5.31% 4/25/33 (f) | | 1,500,000 | | 1,534,429 |
Series 2004-FRE1 Class M1, 4.01% 7/25/34 (f) | | 5,223,000 | | 5,238,948 |
MBNA Asset Backed Note Trust Series 2000-K Class C, 4.1881% 3/17/08 (c)(f) | | 7,250,000 | | 7,258,700 |
MBNA Credit Card Master Note Trust: | | | | |
Series 2001-B1 Class B1, 3.7631% 10/15/08 (f) | | 30,000,000 | | 30,042,072 |
Series 2001-B2 Class B2, 3.7481% 1/15/09 (f) | | 30,353,000 | | 30,429,933 |
Series 2002-B2 Class B2, 3.7681% 10/15/09 (f) | | 20,000,000 | | 20,086,600 |
Series 2002-B3 Class B3, 3.7881% 1/15/08 (f) | | 15,000,000 | | 15,000,470 |
Series 2002-B4 Class B4, 3.8881% 3/15/10 (f) | | 14,800,000 | | 14,916,873 |
Series 2003-B2 Class B2, 3.7781% 10/15/10 (f) | | 1,530,000 | | 1,545,569 |
Series 2003-B3 Class B3, 3.7631% 1/18/11 (f) | | 1,130,000 | | 1,135,362 |
Series 2003-B5 Class B5, 3.7581% 2/15/11 (f) | | 705,000 | | 710,447 |
MBNA Master Credit Card Trust II: | | | | |
Series 1998-E Class B, 3.9288% 9/15/10 (f) | | 7,800,000 | | 7,846,570 |
Series 1998-G Class B, 3.7881% 2/17/09 (f) | | 20,000,000 | | 20,043,574 |
Meritage Mortgage Loan Trust Series 2004-1: | | | | |
Class M1, 3.96% 7/25/34 (f) | | 2,125,000 | | 2,124,911 |
Class M2, 4.01% 7/25/34 (f) | | 375,000 | | 374,985 |
Class M3, 4.41% 7/25/34 (f) | | 775,000 | | 774,967 |
Class M4, 4.56% 7/25/34 (f) | | 525,000 | | 524,978 |
Merrill Lynch Mortgage Investors, Inc. Series 2003-HE1 Class M1, 4.16% 7/25/34 (f) | | 2,321,000 | | 2,330,928 |
Morgan Stanley ABS Capital I, Inc.: | | | | |
Series 2002-NC6 Class M2, 5.56% 11/25/32 (f) | | 2,370,000 | | 2,441,680 |
Series 2003-NC5 Class M2, 5.46% 4/25/33 (f) | | 2,800,000 | | 2,834,138 |
Series 2003-NC6 Class M2, 5.41% 6/27/33 (f) | | 12,835,000 | | 13,180,825 |
Series 2003-NC7 Class M1, 4.16% 6/25/33 (f) | | 1,785,000 | | 1,791,357 |
Series 2003-NC8 Class M1, 4.16% 9/25/33 (f) | | 2,350,000 | | 2,363,472 |
Series 2004-HE6 Class A2, 3.8% 8/25/34 (f) | | 7,193,690 | | 7,217,222 |
Series 2004-NC2 Class M1, 4.01% 12/25/33 (f) | | 2,595,000 | | 2,599,359 |
Asset-Backed Securities - continued |
| Principal Amount | | Value |
Morgan Stanley ABS Capital I, Inc.: - continued | | | | |
Series 2004-NC6 Class A2, 3.8% 7/25/34 (f) | | $ 3,163,358 | | $ 3,170,145 |
Series 2005-1: | | | | |
Class M2, 3.93% 12/25/34 (f) | | 4,425,000 | | 4,417,835 |
Class M3, 3.98% 12/25/34 (f) | | 4,000,000 | | 3,998,266 |
Series 2005-HE1: | | | | |
Class A3B, 3.68% 12/25/34 (f) | | 3,885,000 | | 3,889,266 |
Class M1, 3.91% 12/25/34 (f) | | 1,100,000 | | 1,102,253 |
Class M2, 3.93% 12/25/34 (f) | | 2,970,000 | | 2,966,369 |
Series 2005-HE2: | | | | |
Class M1, 3.86% 1/25/35 (f) | | 2,665,000 | | 2,670,502 |
Class M2, 3.9% 1/25/35 (f) | | 1,900,000 | | 1,893,810 |
Series 2005-NC1: | | | | |
Class M1, 3.9% 1/25/35 (f) | | 2,425,000 | | 2,432,731 |
Class M2, 3.93% 1/25/35 (f) | | 2,425,000 | | 2,421,056 |
Class M3, 3.97% 1/25/35 (f) | | 2,425,000 | | 2,425,850 |
Morgan Stanley Dean Witter Capital I Trust: | | | | |
Series 2001-AM1: | | | | |
Class M1, 4.31% 2/25/32 (f) | | 1,510,288 | | 1,513,954 |
Class M2, 4.86% 2/25/32 (f) | | 7,146,795 | | 7,171,201 |
Series 2001-NC4: | | | | |
Class M1, 4.46% 1/25/32 (f) | | 3,827,881 | | 3,841,816 |
Series 2002-AM3 Class A3, 3.95% 2/25/33 (f) | | 1,426,624 | | 1,430,581 |
Series 2002-HE1 Class M1, 4.06% 7/25/32 (f) | | 5,860,000 | | 5,893,149 |
Series 2002-HE2 Class M1, 4.16% 8/25/32 (f) | | 9,925,000 | | 9,970,606 |
Series 2002-NC3 Class A3, 3.8% 8/25/32 (f) | | 396,299 | | 397,573 |
Series 2002-OP1 Class M1, 4.21% 9/25/32 (f) | | 3,894,745 | | 3,917,849 |
Series 2003-NC1: | | | | |
Class M1, 4.51% 11/25/32 (f) | | 2,555,000 | | 2,572,380 |
Class M2, 5.51% 11/25/32 (f) | | 1,880,000 | | 1,899,041 |
New Century Home Equity Loan Trust: | | | | |
Series 2003-2: | | | | |
Class A2, 3.89% 1/25/33 (f) | | 341,254 | | 341,436 |
Class M2, 5.46% 1/25/33 (f) | | 4,600,000 | | 4,667,174 |
Series 2003-6 Class M1, 4.18% 1/25/34 (f) | | 5,180,000 | | 5,202,952 |
Series 2005-1: | | | | |
Class M1, 3.91% 3/25/35 (f) | | 4,395,000 | | 4,392,950 |
Class M2, 3.94% 3/25/35 (f) | | 4,395,000 | | 4,384,834 |
Class M3, 3.98% 3/25/35 (f) | | 2,120,000 | | 2,120,796 |
Nissan Auto Lease Trust: | | | | |
Series 2003-A Class A3A, 3.5281% 6/15/09 (f) | | 13,621,752 | | 13,633,434 |
Series 2004-A Class A4A, 3.4581% 6/15/10 (f) | | 10,570,000 | | 10,582,978 |
Asset-Backed Securities - continued |
| Principal Amount | | Value |
NovaStar Home Equity Loan Series 2004-1: | | | | |
Class M1, 3.91% 6/25/34 (f) | | $ 1,450,000 | | $ 1,451,222 |
Class M4, 4.435% 6/25/34 (f) | | 2,435,000 | | 2,439,150 |
Ocala Funding LLC Series 2005-1A Class A, 4.93% 3/20/10 (c)(f) | | 3,675,000 | | 3,675,000 |
Ownit Mortgage Loan Asste-Backed Certificates Series 2005-3 Class A2A, 3.5% 6/25/36 (f) | | 15,500,000 | | 15,500,000 |
Park Place Securities, Inc.: | | | | |
Series 2004-WCW1: | | | | |
Class M1, 4.09% 9/25/34 (f) | | 3,745,000 | | 3,756,721 |
Class M2, 4.14% 9/25/34 (f) | | 1,755,000 | | 1,764,326 |
Class M3, 4.71% 9/25/34 (f) | | 3,355,000 | | 3,396,745 |
Class M4, 4.91% 9/25/34 (f) | | 4,700,000 | | 4,767,614 |
Series 2004-WCW2 Class A2, 3.84% 10/25/34 (f) | | 7,952,623 | | 7,976,111 |
Series 2005-WCH1: | | | | |
Class A3B, 3.68% 1/25/35 (f) | | 2,775,000 | | 2,779,908 |
Class M2, 3.98% 1/25/35 (f) | | 4,175,000 | | 4,166,539 |
Class M3, 4.02% 1/25/35 (f) | | 3,290,000 | | 3,292,599 |
Class M5, 4.34% 1/25/35 (f) | | 3,095,000 | | 3,104,620 |
Series 2005-WHQ2 Class M7, 4.71% 5/25/35 (f) | | 5,950,000 | | 5,930,787 |
People's Choice Home Loan Securities Trust Series 2005-2: | | | | |
Class A1, 3.57% 9/25/24 (f) | | 7,475,790 | | 7,475,790 |
Class M4, 4.09% 5/25/35 (f) | | 6,000,000 | | 6,000,000 |
Providian Gateway Master Trust Series 2002-B Class A, 4.0881% 6/15/09 (c)(f) | | 15,000,000 | | 15,039,393 |
Residental Asset Securities Corp.: | | | | |
Series 2005-KS4 Class M2, 4.04% 4/25/35 (f) | | 1,040,000 | | 1,037,610 |
Series 2005-KS7 Class A1, 3.4781% 8/25/35 (f) | | 10,515,000 | | 10,512,897 |
Residential Asset Mortgage Products, Inc. Series 2004-RS10 Class MII2, 4.71% 10/25/34 (f) | | 5,500,000 | | 5,566,857 |
Salomon Brothers Mortgage Securities VII, Inc. Series 2003-HE1 Class A, 3.86% 4/25/33 (f) | | 818,316 | | 822,076 |
Saxon Asset Securities Trust: | | | | |
Series 2004-1 Class M1, 3.99% 3/25/35 (f) | | 4,415,000 | | 4,413,887 |
Series 2004-2 Class MV1, 4.04% 8/25/35 (f) | | 4,495,000 | | 4,501,043 |
Sears Credit Account Master Trust II: | | | | |
Series 2001-1 Class B, 3.8131% 2/15/10 (f) | | 10,000,000 | | 9,987,143 |
Series 2002-4: | | | | |
Class A, 3.5181% 8/18/09 (f) | | 27,000,000 | | 26,999,603 |
Class B, 3.8131% 8/18/09 (f) | | 33,300,000 | | 33,301,149 |
Series 2002-5 Class B, 4.6381% 11/17/09 (f) | | 30,000,000 | | 30,062,976 |
Asset-Backed Securities - continued |
| Principal Amount | | Value |
Securitized Asset Backed Receivables LLC Trust Series 2004-NC1 Class M1, 3.98% 2/25/34 (f) | | $ 2,910,000 | | $ 2,909,256 |
Specialty Underwriting & Residential Finance Series 2003-BC4 Class M1, 4.06% 11/25/34 (f) | | 1,810,000 | | 1,818,452 |
Structured Asset Securities Corp. Series 2004-GEL1 Class A, 3.82% 2/25/34 (f) | | 1,043,424 | | 1,043,422 |
Superior Wholesale Inventory Financing Trust VII Series 2003-A8 Class CTFS, 3.8381% 3/15/11 (c)(f) | | 10,835,000 | | 10,828,228 |
Superior Wholesale Inventory Financing Trust XII Series 2005-A12 Class C, 4.46% 6/15/10 (f) | | 6,840,000 | | 6,839,945 |
Terwin Mortgage Trust: | | | | |
Series 2003-4HE Class A1, 3.89% 9/25/34 (f) | | 2,878,990 | | 2,894,593 |
Series 2003-6HE Class A1, 3.93% 11/25/33 (f) | | 1,784,384 | | 1,788,543 |
Series 2005-14HE Class AF1, 3.9753% 7/25/36 (d)(f) | | 8,635,000 | | 8,633,296 |
TOTAL ASSET-BACKED SECURITIES (Cost $2,293,954,229) | 2,300,747,332 |
Collateralized Mortgage Obligations - 16.9% |
|
Private Sponsor - 13.7% |
Adjustable Rate Mortgage Trust floater: | | | | |
Series 2004-2 Class 7A3, 3.86% 2/25/35 (f) | | 9,374,471 | | 9,396,037 |
Series 2004-4 Class 5A2, 3.86% 3/25/35 (f) | | 3,780,419 | | 3,787,953 |
Series 2005-1 Class 5A2, 3.79% 5/25/35 (f) | | 6,187,250 | | 6,191,166 |
Series 2005-2: | | | | |
Class 6A2, 3.74% 6/25/35 (f) | | 2,930,592 | | 2,932,491 |
Class 6M2, 3.94% 6/25/35 (f) | | 10,145,000 | | 10,145,010 |
Series 2005-3 Class 8A2, 3.7% 7/25/35 (f) | | 19,199,197 | | 19,211,695 |
Series 2005-4 Class 7A2, 3.69% 8/25/35 (f) | | 9,011,457 | | 9,003,527 |
Series 2005-8 Class 7A2, 3.77% 11/25/35 (f) | | 7,660,000 | | 7,660,000 |
Bear Stearns Alt-A Trust floater: | | | | |
Series 2005-1 Class A1, 3.74% 1/25/35 (f) | | 20,354,186 | | 20,354,186 |
Series 2005-2 Class 1A1, 3.71% 3/25/35 (f) | | 14,961,065 | | 14,961,065 |
Series 2005-5 Class 1A1, 3.68% 7/25/35 (f) | | 18,707,862 | | 18,696,170 |
Countrywide Alternative Loan Trust planned amortization class Series 2003-5T2 Class A2, 3.86% 5/25/33 (f) | | 5,545,033 | | 5,548,017 |
Countrywide Home Loans, Inc. floater: | | | | |
Series 2004-16 Class A1, 3.86% 9/25/34 (f) | | 10,335,456 | | 10,325,843 |
Series 2005-1 Class 2A1, 3.75% 3/25/35 (f) | | 14,617,171 | | 14,617,171 |
CS First Boston Mortgage Securities Corp. floater: | | | | |
Series 2004-AR2 Class 6A1, 3.86% 3/25/34 (f) | | 5,338,263 | | 5,334,945 |
Collateralized Mortgage Obligations - continued |
| Principal Amount | | Value |
Private Sponsor - continued |
CS First Boston Mortgage Securities Corp. floater: - continued | | | | |
Series 2004-AR3 Class 6A2, 3.83% 4/25/34 (f) | | $ 2,226,193 | | $ 2,228,162 |
Series 2004-AR4 Class 5A2, 3.83% 5/25/34 (f) | | 2,066,310 | | 2,065,052 |
Series 2004-AR5 Class 11A2, 3.83% 6/25/34 (f) | | 2,987,552 | | 2,981,472 |
Series 2004-AR6 Class 9A2, 3.83% 10/25/34 (f) | | 3,981,028 | | 3,983,412 |
Series 2004-AR7 Class 6A2, 3.84% 8/25/34 (f) | | 5,801,660 | | 5,806,785 |
Series 2004-AR8 Class 8A2, 3.84% 9/25/34 (f) | | 4,630,225 | | 4,638,807 |
First Horizon Mortgage Passthru Trust floater Series 2004-FL1 Class 2A1, 3.95% 12/25/34 (f) | | 4,384,853 | | 4,379,779 |
Granite Master Issuer PLC floater: | | | | |
Series 2005-1: | | | | |
Class A3, 3.51% 12/21/24 (f) | | 5,300,000 | | 5,299,006 |
Class B1, 3.56% 12/20/54 (f) | | 7,050,000 | | 7,047,577 |
Class M1, 3.66% 12/20/54 (f) | | 5,300,000 | | 5,298,178 |
Series 2005-2 Class C1, 3.7857% 12/20/54 (f) | | 7,975,000 | | 7,972,508 |
Granite Mortgages PLC floater: | | | | |
Series 2004-1: | | | | |
Class 1B, 3.64% 3/20/44 (f) | | 1,415,000 | | 1,414,844 |
Class 1C, 4.33% 3/20/44 (f) | | 4,075,000 | | 4,091,219 |
Class 1M, 3.84% 3/20/44 (f) | | 4,935,000 | | 4,938,751 |
Series 2004-2: | | | | |
Class 1A2, 3.5% 6/20/28 (f) | | 5,384,259 | | 5,384,932 |
Class 1B, 3.6% 6/20/44 (f) | | 1,018,055 | | 1,018,309 |
Class 1C, 4.13% 6/20/44 (f) | | 3,706,295 | | 3,713,918 |
Class 1M, 3.71% 6/20/44 (f) | | 2,722,846 | | 2,724,205 |
Series 2004-3: | | | | |
Class 1B, 3.59% 9/20/44 (f) | | 2,100,000 | | 2,100,210 |
Class 1C, 4.02% 9/20/44 (f) | | 5,415,000 | | 5,426,913 |
Class 1M, 3.7% 9/20/44 (f) | | 1,200,000 | | 1,200,360 |
Harborview Mortgage Loan Trust floater Series 2005-2 Class 2A1A, 3.6369% 5/19/35 (f) | | 11,690,145 | | 11,648,134 |
Holmes Financing No. 7 PLC floater Series 2 Class M, 4.3988% 7/15/40 (f) | | 2,560,000 | | 2,564,912 |
Holmes Financing No. 8 PLC floater Series 2: | | | | |
Class A, 3.6788% 4/15/11 (f) | | 25,000,000 | | 25,000,000 |
Class B, 3.7688% 7/15/40 (f) | | 2,695,000 | | 2,696,684 |
Class C, 4.3188% 7/15/40 (f) | | 10,280,000 | | 10,328,193 |
Home Equity Asset Trust floater Series 2005-3 Class 2A1, 3.55% 8/25/35 (f) | | 7,268,025 | | 7,266,230 |
Homestar Mortgage Acceptance Corp. floater Series 2004-5 Class A1, 3.91% 10/25/34 (f) | | 4,495,430 | | 4,509,337 |
Collateralized Mortgage Obligations - continued |
| Principal Amount | | Value |
Private Sponsor - continued |
Impac CMB Trust floater: | | | | |
Series 2004-11 Class 2A2, 3.83% 3/25/35 (f) | | $ 8,638,669 | | $ 8,636,982 |
Series 2004-6 Class 1A2, 3.85% 10/25/34 (f) | | 3,481,529 | | 3,487,748 |
Series 2005-1: | | | | |
Class M1, 3.92% 4/25/35 (f) | | 3,223,929 | | 3,220,529 |
Class M2, 3.96% 4/25/35 (f) | | 5,644,146 | | 5,639,516 |
Class M3, 3.99% 4/25/35 (f) | | 1,384,927 | | 1,383,466 |
Class M4, 4.21% 4/25/35 (f) | | 817,334 | | 818,164 |
Class M5, 4.23% 4/25/35 (f) | | 817,334 | | 817,174 |
Class M6, 4.28% 4/25/35 (f) | | 1,307,734 | | 1,307,479 |
Series 2005-2 Class 1A2, 3.77% 4/25/35 (f) | | 13,211,515 | | 13,201,194 |
Series 2005-3 Class A1, 3.7% 8/25/35 (f) | | 15,176,045 | | 15,149,962 |
Series 2005-4 Class 1B1, 4.76% 6/25/35 (f) | | 5,306,886 | | 5,282,839 |
Lehman Structured Securities Corp. floater Series 2005-1 Class A2, 3.67% 9/26/45 (c)(f) | | 16,153,164 | | 16,153,164 |
MASTR Adjustable Rate Mortgages Trust: | | | | |
floater Series 2005-1 Class 1A1, 3.73% 3/25/35 (f) | | 13,405,372 | | 13,396,993 |
Series 2004-6 Class 4A2, 4.1729% 7/25/34 (f) | | 5,969,000 | | 5,946,582 |
Merrill Lynch Mortgage Investors, Inc. floater: | | | | |
Series 2003-A Class 2A1, 3.85% 3/25/28 (f) | | 8,079,308 | | 8,122,924 |
Series 2003-B Class A1, 3.8% 4/25/28 (f) | | 7,852,610 | | 7,898,403 |
Series 2003-D Class A, 3.77% 8/25/28 (f) | | 7,479,616 | | 7,494,804 |
Series 2003-E Class A2, 3.4425% 10/25/28 (f) | | 10,687,128 | | 10,687,143 |
Series 2003-F Class A2, 3.7075% 10/25/28 (f) | | 12,892,959 | | 12,891,486 |
Series 2004-A Class A2, 3.6175% 4/25/29 (f) | | 11,584,437 | | 11,556,917 |
Series 2004-B Class A2, 3.79% 6/25/29 (f) | | 8,952,030 | | 8,930,464 |
Series 2004-C Class A2, 3.95% 7/25/29 (f) | | 12,856,157 | | 12,825,407 |
Series 2004-D Class A2, 3.4725% 9/25/29 (f) | | 9,971,432 | | 9,974,033 |
Series 2004-E: | | | | |
Class A2B, 3.7275% 11/25/29 (f) | | 8,523,921 | | 8,502,874 |
Class A2D, 3.9175% 11/25/29 (f) | | 1,982,307 | | 1,991,830 |
Series 2004-G Class A2, 3.95% 11/25/29 (f) | | 3,854,828 | | 3,854,422 |
Series 2005-A Class A2, 3.38% 2/25/30 (f) | | 10,800,867 | | 10,785,319 |
Mortgage Asset Backed Securities Trust floater Series 2002-NC1 Class M1, 4.31% 10/25/32 (f) | | 4,538,551 | | 4,555,535 |
MortgageIT Trust floater: | | | | |
Series 2004-2: | | | | |
Class A1, 3.83% 12/25/34 (f) | | 4,920,628 | | 4,927,758 |
Class A2, 3.91% 12/25/34 (f) | | 6,656,800 | | 6,696,298 |
Series 2005-2 Class 1A1, 3.72% 5/25/35 (f) | | 5,093,718 | | 5,097,498 |
Opteum Mortgage Acceptance Corp. floater Series 2005-3 Class APT, 3.75% 6/25/35 (f) | | 19,112,336 | | 19,123,533 |
Collateralized Mortgage Obligations - continued |
| Principal Amount | | Value |
Private Sponsor - continued |
Permanent Financing No. 1 PLC floater Series 1 Class 2C, 4.5594% 6/10/42 (f) | | $ 1,745,000 | | $ 1,749,384 |
Permanent Financing No. 3 PLC floater Series 2 Class C, 4.4294% 6/10/42 (f) | | 4,845,000 | | 4,893,450 |
Permanent Financing No. 4 PLC floater Series 2 Class C, 4.0994% 6/10/42 (f) | | 15,400,000 | | 15,475,306 |
Permanent Financing No. 5 PLC floater: | | | | |
Series 2 Class C, 4.0294% 6/10/42 (f) | | 4,215,000 | | 4,234,760 |
Series 3 Class C, 4.1994% 6/10/42 (f) | | 8,890,000 | | 8,967,788 |
Permanent Financing No. 6 PLC floater Series 6: | | | | |
Class 1C, 3.7294% 6/10/42 (f) | | 4,000,000 | | 4,000,572 |
Class 2C, 3.8294% 6/10/42 (f) | | 5,350,000 | | 5,352,343 |
Permanent Financing No. 7 PLC floater Series 7: | | | | |
Class 1B, 3.4694% 6/10/42 (f) | | 2,000,000 | | 1,999,375 |
Class 1C, 3.6594% 6/10/42 (f) | | 3,840,000 | | 3,838,800 |
Class 2C, 3.7094% 6/10/42 (f) | | 8,065,000 | | 8,054,919 |
Permanent Financing No. 8 PLC floater Series 8: | | | | |
Class 1C, 3.7475% 6/10/42 (f) | | 7,165,000 | | 7,162,621 |
Class 2C, 3.8175% 6/10/42 (f) | | 9,945,000 | | 9,941,688 |
Residential Asset Mortgage Products, Inc. sequential pay Series 2003-SL1 Class A31, 7.125% 4/25/31 | | 4,643,507 | | 4,727,342 |
Residential Finance LP/Residential Finance Development Corp. floater Series 2003-A: | | | | |
Class B4, 5.15% 3/10/35 (c)(f) | | 5,492,986 | | 5,575,381 |
Class B5, 5.7% 3/10/35 (c)(f) | | 5,684,725 | | 5,811,417 |
Residential Funding Securities Corp.: | | | | |
Series 2003-RP1 Class A1, 3.96% 11/25/34 (f) | | 2,829,110 | | 2,840,739 |
Series 2003-RP2 Class A1, 3.93% 6/25/33 (c)(f) | | 3,866,185 | | 3,881,108 |
Sequoia Mortgage Trust floater: | | | | |
Series 2003-5 Class A2, 3.41% 9/20/33 (f) | | 10,999,101 | | 10,996,236 |
Series 2003-7 Class A2, 2.885% 1/20/34 (f) | | 9,577,708 | | 9,569,385 |
Series 2004-1 Class A, 4.15% 2/20/34 (f) | | 6,379,791 | | 6,373,993 |
Series 2004-10 Class A4, 3.6681% 11/20/34 (f) | | 10,424,803 | | 10,408,138 |
Series 2004-3 Class A, 3.5463% 5/20/34 (f) | | 10,662,486 | | 10,588,333 |
Series 2004-4 Class A, 3.5881% 5/20/34 (f) | | 13,430,919 | | 13,399,990 |
Series 2004-5 Class A3, 3.77% 6/20/34 (f) | | 8,904,038 | | 8,897,082 |
Series 2004-6: | | | | |
Class A3A, 4.1475% 6/20/35 (f) | | 8,182,127 | | 8,176,739 |
Class A3B, 3.16% 7/20/34 (f) | | 1,022,766 | | 1,021,950 |
Series 2004-7: | | | | |
Class A3A, 3.2275% 8/20/34 (f) | | 7,642,675 | | 7,636,475 |
Class A3B, 3.4525% 7/20/34 (f) | | 1,375,260 | | 1,380,167 |
Collateralized Mortgage Obligations - continued |
| Principal Amount | | Value |
Private Sponsor - continued |
Sequoia Mortgage Trust floater: - continued | | | | |
Series 2004-8 Class A2, 3.45% 9/20/34 (f) | | $ 14,155,710 | | $ 14,148,404 |
Series 2005-1 Class A2, 3.68% 2/20/35 (f) | | 7,355,282 | | 7,354,362 |
Series 2005-2 Class A2, 3.36% 3/20/35 (f) | | 13,876,523 | | 13,876,523 |
Series 2005-3 Class A1, 3.46% 5/20/35 (f) | | 9,217,677 | | 9,217,677 |
Structured Adjustable Rate Mortgage Loan Trust floater Series 2001-14 Class A1, 3.77% 7/25/35 (f) | | 11,201,095 | | 11,201,095 |
Structured Asset Securities Corp. floater Series 2004-NP1 Class A, 3.86% 9/25/33 (c)(f) | | 2,553,470 | | 2,555,084 |
Thornburg Mortgage Securities Trust floater Series 2004-3 Class A, 3.83% 9/25/34 (f) | | 22,068,069 | | 22,129,394 |
WAMU Mortgage pass thru certificates: | | | | |
floater Series 2005-AR6 Class 2A-1A, 3.5448% 4/25/45 (f) | | 6,133,307 | | 6,133,607 |
Series 2005 AR11 Class A1C1, 3.6675% 8/25/40 (d)(f) | | 14,400,000 | | 14,400,000 |
Wells Fargo Mortgage Backed Securities Trust: | | | | |
Series 2004-M Class A3, 4.7024% 8/25/34 (f) | | 19,880,000 | | 19,789,156 |
Series 2005-AR12 Class 2A1, 4.322% 7/25/35 (f) | | 31,674,772 | | 31,407,532 |
TOTAL PRIVATE SPONSOR | | 895,419,920 |
U.S. Government Agency - 3.2% |
Fannie Mae: | | | | |
floater: | | | | |
Series 2000-38 Class F, 3.76% 11/18/30 (f) | | 1,103,802 | | 1,112,055 |
Series 2000-40 Class FA, 3.8144% 7/25/30 (f) | | 2,487,156 | | 2,498,099 |
Series 2002-89 Class F, 3.6144% 1/25/33 (f) | | 3,630,895 | | 3,636,484 |
target amortization class Series G94-2 Class D, 6.45% 1/25/24 | | 4,732,822 | | 4,849,182 |
Fannie Mae guaranteed REMIC pass thru certificates: | | | | |
floater: | | | | |
Series 2001-34 Class FR, 3.66% 8/18/31 (f) | | 2,500,934 | | 2,508,899 |
Series 2001-44 Class FB, 3.6144% 9/25/31 (f) | | 2,262,040 | | 2,268,738 |
Series 2001-46 Class F, 3.66% 9/18/31 (f) | | 6,514,676 | | 6,552,090 |
Series 2002-11 Class QF, 3.8144% 3/25/32 (f) | | 4,517,951 | | 4,551,812 |
Series 2002-36 Class FT, 3.8144% 6/25/32 (f) | | 1,503,724 | | 1,516,521 |
Series 2002-64 Class FE, 3.61% 10/18/32 (f) | | 2,256,514 | | 2,266,981 |
Series 2002-65 Class FA, 3.6144% 10/25/17 (f) | | 2,585,370 | | 2,590,545 |
Series 2002-74 Class FV, 3.7644% 11/25/32 (f) | | 8,360,131 | | 8,420,920 |
Series 2003-11: | | | | |
Class DF, 3.7644% 2/25/33 (f) | | 3,173,455 | | 3,195,574 |
Class EF, 3.7644% 2/25/33 (f) | | 2,602,157 | | 2,612,658 |
Collateralized Mortgage Obligations - continued |
| Principal Amount | | Value |
U.S. Government Agency - continued |
Fannie Mae guaranteed REMIC pass thru certificates: - continued | | | | |
floater: | | | | |
Series 2003-63 Class F1, 3.6144% 11/25/27 (f) | | $ 6,387,368 | | $ 6,390,916 |
planned amortization class: | | | | |
Series 1998-63 Class PG, 6% 3/25/27 | | 1,212,661 | | 1,212,198 |
Series 2001-62 Class PG, 6.5% 10/25/30 | | 4,183,652 | | 4,194,964 |
Series 2001-76 Class UB, 5.5% 10/25/13 | | 1,378,221 | | 1,379,002 |
Series 2002-16 Class QD, 5.5% 6/25/14 | | 345,479 | | 346,552 |
Series 2002-28 Class PJ, 6.5% 3/25/31 | | 4,950,777 | | 4,957,813 |
Series 2002-8 Class PD, 6.5% 7/25/30 | | 3,569,878 | | 3,584,870 |
Freddie Mac: | | | | |
floater Series 2510 Class FE, 3.7881% 10/15/32 (f) | | 5,998,150 | | 6,032,418 |
planned amortization class: | | | | |
Series 2091 Class PP, 6% 2/15/27 | | 1,286,641 | | 1,286,029 |
Series 2353 Class PC, 6.5% 9/15/15 | | 1,363,169 | | 1,366,992 |
Freddie Mac Manufactured Housing participation certificates guaranteed floater Series 2338 Class FJ, 3.5881% 7/15/31 (f) | | 5,197,631 | | 5,199,968 |
Freddie Mac Multi-class participation certificates guaranteed: | | | | |
floater: | | | | |
Series 2474 Class FJ, 3.7381% 7/15/17 (f) | | 4,556,922 | | 4,564,198 |
Series 2526 Class FC, 3.7881% 11/15/32 (f) | | 3,597,778 | | 3,616,182 |
Series 2538 Class FB, 3.7881% 12/15/32 (f) | | 6,607,741 | | 6,651,155 |
Series 2551 Class FH, 3.8381% 1/15/33 (f) | | 3,358,821 | | 3,373,027 |
planned amortization class: | | | | |
Series 2136 Class PE, 6% 1/15/28 | | 12,190,349 | | 12,248,248 |
Series 2394 Class ND, 6% 6/15/27 | | 1,550,172 | | 1,553,415 |
Series 2395 Class PE, 6% 2/15/30 | | 5,961,413 | | 6,000,327 |
Series 2398 Class DK, 6.5% 1/15/31 | | 372,760 | | 373,347 |
Series 2410 Class ML, 6.5% 12/15/30 | | 2,168,673 | | 2,179,211 |
Series 2420 Class BE, 6.5% 12/15/30 | | 2,595,889 | | 2,604,122 |
Series 2443 Class TD, 6.5% 10/15/30 | | 2,962,497 | | 2,977,827 |
Series 2461 Class PG, 6.5% 1/15/31 | | 2,737,118 | | 2,773,721 |
Series 2466 Class EC, 6% 10/15/27 | | 257,483 | | 257,163 |
Series 2483 Class DC, 5.5% 7/15/14 | | 1,861,588 | | 1,861,466 |
Series 2556 Class PM, 5.5% 2/15/16 | | 1,160,963 | | 1,159,984 |
Series 2776 Class UJ, 4.5% 5/15/20 (g) | | 7,104,375 | | 367,384 |
Series 2828 Class JA, 4.5% 1/15/10 | | 11,880,000 | | 11,903,044 |
sequential pay: | | | | |
Series 2430 Class ZE, 6.5% 8/15/27 | | 648,803 | | 649,120 |
Series 2480 Class QW, 5.75% 2/15/30 | | 871,905 | | 871,370 |
Collateralized Mortgage Obligations - continued |
| Principal Amount | | Value |
U.S. Government Agency - continued |
Freddie Mac Multi-class participation certificates guaranteed: - continued | | | | |
Series 2406: | | | | |
Class FP, 4.3681% 1/15/32 (f) | | $ 10,270,000 | | $ 10,502,819 |
Class PF, 4.3681% 12/15/31 (f) | | 8,125,000 | | 8,337,955 |
Series 2410 Class PF, 4.3681% 2/15/32 (f) | | 18,644,444 | | 19,070,154 |
Ginnie Mae guaranteed REMIC pass thru securities floater: | | | | |
Series 2001-46 Class FB, 3.7381% 5/16/23 (f) | | 2,988,811 | | 3,001,292 |
Series 2001-50 Class FV, 3.5881% 9/16/27 (f) | | 9,114,548 | | 9,113,939 |
Series 2002-24 Class FX, 3.9381% 4/16/32 (f) | | 2,630,687 | | 2,652,779 |
Series 2002-31 Class FW, 3.7881% 6/16/31 (f) | | 3,614,097 | | 3,633,687 |
Series 2002-5 Class KF, 3.7881% 8/16/26 (f) | | 617,815 | | 618,278 |
TOTAL U.S. GOVERNMENT AGENCY | | 207,447,494 |
TOTAL COLLATERALIZED MORTGAGE OBLIGATIONS (Cost $1,104,119,465) | 1,102,867,414 |
Commercial Mortgage Securities - 5.8% |
|
1301 Avenue of The Americas Trust Series 2000-1301: | | | | |
Class C, 7.44% 8/3/10 (c)(f) | | 5,025,000 | | 5,024,881 |
Class D, 7.54% 8/3/10 (c)(f) | | 6,695,000 | | 6,694,844 |
Banc of America Large Loan, Inc. floater: | | | | |
Series 2003-BBA2 Class A3, 3.7081% 11/15/15 (c)(f) | | 5,038,226 | | 5,041,400 |
Series 2005-BOCA: | | | | |
Class H, 4.3381% 12/15/16 (c)(f) | | 2,065,000 | | 2,061,834 |
Class J, 4.4881% 12/15/16 (c)(f) | | 1,020,000 | | 1,018,438 |
Class K, 4.7381% 12/15/16 (c)(f) | | 6,659,000 | | 6,650,611 |
Bayview Commercial Asset Trust floater: | | | | |
Series 2003-1 Class A, 4.04% 8/25/33 (c)(f) | | 6,644,316 | | 6,723,250 |
Series 2003-2: | | | | |
Class A, 4.04% 12/25/33 (c)(f) | | 13,522,369 | | 13,687,661 |
Class M1, 4.31% 12/25/33 (c)(f) | | 2,200,548 | | 2,236,841 |
Series 2004-1: | | | | |
Class A, 3.82% 4/25/34 (c)(f) | | 6,403,472 | | 6,414,728 |
Class B, 5.36% 4/25/34 (c)(f) | | 665,296 | | 672,910 |
Class M1, 4.02% 4/25/34 (c)(f) | | 582,134 | | 584,681 |
Class M2, 4.66% 4/25/34 (c)(f) | | 498,972 | | 504,819 |
Commercial Mortgage Securities - continued |
| Principal Amount | | Value |
Bayview Commercial Asset Trust floater: - continued | | | | |
Series 2004-2: | | | | |
Class A, 3.89% 8/25/34 (c)(f) | | $ 6,299,807 | | $ 6,330,814 |
Class M1, 4.04% 8/25/34 (c)(f) | | 2,031,330 | | 2,039,265 |
Series 2004-3: | | | | |
Class A1, 3.83% 1/25/35 (c)(f) | | 6,582,479 | | 6,605,519 |
Class A2, 3.88% 1/25/35 (c)(f) | | 914,869 | | 918,092 |
Class M1, 3.96% 1/25/35 (c)(f) | | 1,097,080 | | 1,098,564 |
Class M2, 4.46% 1/25/35 (c)(f) | | 715,487 | | 719,742 |
Series 2005-2A: | | | | |
Class M1, 3.73% 8/25/35 (c)(f) | | 1,297,812 | | 1,297,812 |
Class M2, 3.78% 8/25/35 (c)(f) | | 2,136,399 | | 2,136,399 |
Class M3, 3.8% 8/25/35 (c)(f) | | 1,183,006 | | 1,183,006 |
Class M4, 3.91% 8/25/35 (c)(f) | | 1,088,166 | | 1,088,166 |
Bear Stearns Commercial Mortgage Securities, Inc. floater: | | | | |
Series 2003-BA1A: | | | | |
Class JFCM, 4.98% 4/14/15 (c)(f) | | 1,344,296 | | 1,350,087 |
Class JMM, 4.88% 4/14/15 (c)(f) | | 1,384,053 | | 1,385,065 |
Class KFCM, 5.23% 4/14/15 (c)(f) | | 1,436,661 | | 1,443,179 |
Class KMM, 5.13% 4/14/15 (c)(f) | | 1,253,767 | | 1,254,776 |
Class LFCM, 5.63% 4/14/15 (c)(f) | | 1,601,905 | | 1,602,545 |
Class MFCM, 5.93% 4/14/15 (c)(f) | | 2,218,251 | | 2,219,234 |
Series 2004-BBA3 Class E, 4.0881% 6/15/17 (c)(f) | | 10,415,000 | | 10,415,949 |
Chase Commercial Mortgage Securities Corp. floater Series 2000-FL1A: | | | | |
Class B, 3.81% 12/12/13 (c)(f) | | 896,672 | | 897,536 |
Class C, 4.16% 12/12/13 (c)(f) | | 1,793,345 | | 1,801,374 |
COMM floater: | | | | |
Series 2001-FL5A Class E, 4.8881% 11/15/13 (c)(f) | | 3,049,546 | | 3,048,573 |
Series 2002-FL6: | | | | |
Class F, 4.8381% 6/14/14 (c)(f) | | 11,163,000 | | 11,190,451 |
Class G, 5.2881% 6/14/14 (c)(f) | | 5,000,000 | | 5,000,444 |
Series 2003-FL9 Class B, 3.8881% 11/15/15 (c)(f) | | 10,354,700 | | 10,383,149 |
Commercial Mortgage pass thru certificates floater: | | | | |
Series 2004-CNL: | | | | |
Class A2, 3.6881% 9/15/14 (c)(f) | | 3,570,000 | | 3,573,440 |
Class G, 4.3681% 9/15/14 (c)(f) | | 1,345,000 | | 1,345,538 |
Class H, 4.4681% 9/15/14 (c)(f) | | 1,430,000 | | 1,430,571 |
Class J, 4.9881% 9/15/14 (c)(f) | | 490,000 | | 491,560 |
Class K, 5.3881% 9/15/14 (c)(f) | | 770,000 | | 771,587 |
Class L, 5.5881% 9/15/14 (c)(f) | | 625,000 | | 624,693 |
Commercial Mortgage Securities - continued |
| Principal Amount | | Value |
Commercial Mortgage pass thru certificates floater: - continued | | | | |
Series 2004-HTL1: | | | | |
Class B, 3.8381% 7/15/16 (c)(f) | | $ 495,379 | | $ 495,732 |
Class D, 3.9381% 7/15/16 (c)(f) | | 1,125,628 | | 1,125,788 |
Class E, 4.1381% 7/15/16 (c)(f) | | 805,726 | | 806,031 |
Class F, 4.1881% 7/15/16 (c)(f) | | 852,671 | | 853,207 |
Class H, 4.6881% 7/15/16 (c)(f) | | 2,472,312 | | 2,473,143 |
Class J, 4.8381% 7/15/16 (c)(f) | | 950,314 | | 950,633 |
Class K, 5.7381% 7/15/16 (c)(f) | | 1,069,720 | | 1,069,257 |
Commercial Mortgage Pass-Through Certificates floater Series 2005-F10A: | | | | |
Class B, 3.6181% 4/15/17 (c)(f) | | 7,080,000 | | 7,080,000 |
Class C, 3.6581% 4/15/17 (c)(f) | | 3,006,000 | | 3,006,000 |
Class D, 3.6981% 4/15/17 (c)(f) | | 2,440,000 | | 2,440,000 |
Class E, 3.7581% 4/15/17 (c)(f) | | 1,821,000 | | 1,821,000 |
Class F, 3.7981% 4/15/17 (c)(f) | | 1,035,000 | | 1,035,000 |
Class G, 3.9381% 4/15/17 (c)(f) | | 1,035,000 | | 1,035,000 |
Class H, 4.0081% 4/15/17 (c)(f) | | 1,035,000 | | 1,035,000 |
Class I, 4.2381% 4/15/17 (c)(f) | | 335,000 | | 335,000 |
Class MOA3, 3.6881% 3/15/20 (c)(f) | | 4,590,000 | | 4,590,000 |
CS First Boston Mortgage Securities Corp.: | | | | |
floater: | | | | |
Series 2001-TFLA Class G, 5.1381% 12/15/11 (c)(f) | | 3,720,000 | | 3,702,795 |
Series 2002-TFLA Class C, 3.9688% 11/18/12 (c)(f) | | 3,675,000 | | 3,674,923 |
Series 2003-TF2A Class A2, 3.7081% 11/15/14 (c)(f) | | 9,500,000 | | 9,507,100 |
Series 2004-FL1 Class B, 3.8381% 5/15/14 (c)(f) | | 11,230,000 | | 11,235,571 |
Series 2004-HC1: | | | | |
Class A2, 3.8881% 12/15/21 (c)(f) | | 1,475,000 | | 1,474,997 |
Class B, 4.1381% 12/15/21 (c)(f) | | 3,835,000 | | 3,834,992 |
Series 2004-TF2A Class E, 3.8081% 11/15/19 (c)(f) | | 4,450,000 | | 4,456,884 |
Series 2004-TFL1: | | | | |
Class A2, 3.5781% 2/15/14 (c)(f) | | 7,005,000 | | 7,007,087 |
Class E, 3.9381% 2/15/14 (c)(f) | | 2,800,000 | | 2,806,033 |
Class F, 3.9881% 2/15/14 (c)(f) | | 2,325,000 | | 2,330,394 |
Class G, 4.2381% 2/15/14 (c)(f) | | 1,875,000 | | 1,880,617 |
Class H, 4.4881% 2/15/14 (c)(f) | | 1,400,000 | | 1,403,733 |
Class J, 4.7881% 2/15/14 (c)(f) | | 750,000 | | 753,724 |
Commercial Mortgage Securities - continued |
| Principal Amount | | Value |
CS First Boston Mortgage Securities Corp.: - continued | | | | |
Series 2005-TF2A Class F, 3.8881% 11/15/19 (c)(f) | | $ 1,540,000 | | $ 1,542,381 |
Series 2005-TFLA: | | | | |
Class C, 3.6281% 2/15/20 (c)(f) | | 5,650,000 | | 5,649,989 |
Class E, 3.7181% 2/15/20 (c)(f) | | 3,955,000 | | 3,954,992 |
Class F, 3.7681% 2/15/20 (c)(f) | | 1,745,000 | | 1,744,997 |
Class G, 3.9081% 2/15/20 (c)(f) | | 505,000 | | 504,998 |
Class H, 4.1381% 2/15/20 (c)(f) | | 715,000 | | 714,998 |
sequential pay Series 1997-C2 Class A2, 6.52% 1/17/35 | | 518,675 | | 522,823 |
Series 2003-TFLA Class G, 3.7357% 4/15/13 (c)(f) | | 446,933 | | 445,553 |
GMAC Commercial Mortgage Securities, Inc. floater Series 2001-FL1A Class E, 4.2% 2/11/11 (c)(f) | | 264,524 | | 264,175 |
GS Mortgage Securities Corp. II floater Series 2005-FL7A Class A1, 3.5% 11/6/19 (c)(f) | | 10,526,054 | | 10,527,180 |
ISTAR Asset Receivables Trust floater Series 2002-1A Class A2, 3.8613% 5/28/20 (c)(f) | | 2,727,545 | | 2,728,117 |
John Hancock Tower Mortgage Trust floater Series 2003-C5A Class B, 5.6585% 4/10/15 (c)(f) | | 8,245,000 | | 8,150,339 |
JP Morgan Chase Commercial Mortgage Security Corp.: | | | | |
floater Series 2005-FL1A: | | | | |
Class WH, 3.97% 6/15/19 (c)(f) | | 3,325,000 | | 3,325,100 |
Class WJ, 4.17% 6/15/19 (c)(f) | | 2,045,000 | | 2,045,061 |
Class WK, 4.57% 6/15/19 (c)(f) | | 3,065,000 | | 3,065,092 |
Series 2005-FL1A Class WX1, 1.2068% 6/15/19 (c)(f)(g) | | 240,000,000 | | 2,596,800 |
Lehman Brothers Floating Rate Commercial Mortgage Trust: | | | | |
floater: | | | | |
Series 2003-C4A: | | | | |
Class F, 5.6% 7/11/15 (c)(f) | | 813,387 | | 813,822 |
Class H, 6.35% 7/11/15 (c)(f) | | 8,267,264 | | 8,287,932 |
Series 2003-LLFA: | | | | |
Class A2, 3.77% 12/16/14 (c)(f) | | 11,700,000 | | 11,707,744 |
Class B, 3.98% 12/16/14 (c)(f) | | 4,615,000 | | 4,626,299 |
Class C, 4.08% 12/16/14 (c)(f) | | 4,982,000 | | 4,997,311 |
Series 2005-LLFA Class FAIR, 5.1138% 7/15/19 (c)(d)(f) | | 4,360,000 | | 4,360,000 |
Morgan Stanley Dean Witter Capital I Trust floater Series 2002-XLF Class F, 5.49% 8/5/14 (c)(f) | | 7,603,983 | | 7,603,972 |
Commercial Mortgage Securities - continued |
| Principal Amount | | Value |
Salomon Brothers Mortgage Securities VII, Inc.: | | | | |
floater: | | | | |
Series 2001-CDCA: | | | | |
Class C, 4.1881% 2/15/13 (c)(f) | | $ 10,495,000 | | $ 10,291,568 |
Class D, 4.1881% 2/15/13 (c)(f) | | 4,000,000 | | 3,891,288 |
Series 2003-CDCA: | | | | |
Class HEXB, 5.2881% 2/15/15 (c)(f) | | 770,000 | | 771,001 |
Class JEXB, 5.4881% 2/15/15 (c)(f) | | 1,300,000 | | 1,301,690 |
Class KEXB, 5.8881% 2/15/15 (c)(f) | | 960,000 | | 961,248 |
Series 2000-NL1 Class E, 7.0607% 10/15/30 (c)(f) | | 3,657,956 | | 3,672,236 |
SDG Macerich Properties LP floater Series 2000-1 Class A3, 3.7281% 5/15/09 (c)(f) | | 18,000,000 | | 18,008,086 |
STRIPS III Ltd./STRIPS III Corp. floater Series 2004-1A Class A, 3.78% 3/24/18 (c)(f) | | 7,263,029 | | 7,263,029 |
Wachovia Bank Commercial Mortgage Trust floater: | | | | |
Series 2004-WHL3: | | | | |
Class A2, 3.5681% 3/15/14 (c)(f) | | 3,510,000 | | 3,511,290 |
Class E, 3.8881% 3/15/14 (c)(f) | | 2,190,000 | | 2,192,749 |
Class F, 3.9381% 3/15/14 (c)(f) | | 1,755,000 | | 1,757,120 |
Class G, 4% 3/15/14 (c)(f) | | 875,000 | | 876,363 |
Series 2005-WL5A: | | | | |
Class KHP1, 3.7381% 1/15/18 (c)(f) | | 1,745,000 | | 1,745,000 |
Class KHP2, 3.9381% 1/15/18 (c)(f) | | 1,745,000 | | 1,745,000 |
Class KHP3, 4.2381% 1/15/18 (c)(f) | | 2,060,000 | | 2,060,000 |
Class KHP4, 4.3381% 1/15/18 (c)(f) | | 1,600,000 | | 1,600,000 |
Class KHP5, 4.5381% 1/15/18 (c)(f) | | 1,855,000 | | 1,855,000 |
TOTAL COMMERCIAL MORTGAGE SECURITIES (Cost $378,363,353) | 378,866,012 |
Interfund Loans - 0.1% |
| | | |
With Fidelity Equity-Income Fund, at 3.43442% due 8/1/05 (b) (Cost $8,443,000) | | 8,443,000 | | 8,443,000 |
Cash Equivalents - 40.4% |
| | Maturity
Amount | | Value |
Investments in repurchase agreements (Collateralized by U.S. Government Obligations, in a joint trading account at 3.32%, dated 7/29/05 due 8/1/05) (i) | | $ 2,354,814,398 | | $ 2,354,164,000 |
With Goldman Sachs & Co. at 3.41%, dated 7/1/05 due 8/23/05 (Collateralized by Mortgage Loan Obligations valued at $295,800,001, 0.9%- 10.36%, 4/18/17 - 6/25/44) (f)(h) | | 291,455,881 | | 289,998,492 |
TOTAL CASH EQUIVALENTS (Cost $2,644,164,000) | | 2,644,162,492 |
TOTAL INVESTMENT PORTFOLIO - 102.2% (Cost $6,679,436,405) | | | 6,685,115,608 |
NET OTHER ASSETS - (2.2)% | | | (140,968,200) |
NET ASSETS - 100% | | $ 6,544,147,408 |
Futures Contracts |
| Expiration Date | | Underlying Face Amount at Value | | Unrealized Appreciation/
(Depreciation) |
Sold |
Eurodollar Contracts |
73 Eurodollar 90 Day Index Contracts | Dec. 2005 | | $ 72,221,638 | | $ 34,806 |
49 Eurodollar 90 Day Index Contracts | March 2006 | | 48,464,675 | | 28,036 |
32 Eurodollar 90 Day Index Contracts | June 2006 | | 31,645,600 | | 16,247 |
27 Eurodollar 90 Day Index Contracts | Sept. 2006 | | 26,698,612 | | 16,355 |
26 Eurodollar 90 Day Index Contracts | Dec. 2006 | | 25,707,500 | | 14,421 |
24 Eurodollar 90 Day Index Contracts | March 2007 | | 23,729,700 | | 12,329 |
17 Eurodollar 90 Day Index Contracts | June 2007 | | 16,807,688 | | 5,970 |
16 Eurodollar 90 Day Index Contracts | Sept. 2007 | | 15,818,200 | | 5,711 |
15 Eurodollar 90 Day Index Contracts | Dec. 2007 | | 14,828,250 | | 5,590 |
15 Eurodollar 90 Day Index Contracts | March 2008 | | 14,827,875 | | 5,015 |
8 Eurodollar 90 Day Index Contracts | June 2008 | | 7,907,800 | | 7,518 |
7 Eurodollar 90 Day Index Contracts | Sept. 2008 | | 6,918,888 | | 6,885 |
TOTAL EURODOLLAR CONTRACTS | | 158,883 |
Swap Agreements |
| | | Notional Amount | | Value |
Credit Default Swap |
Receive from Citibank, upon default event of DaimlerChrysler NA Holding Corp., par value of the notional amount of DaimlerChrysler NA Holding Corp. 6.5% 11/15/13, and pay quarterly notional amount multiplied by .8% | June 2007 | | $ 14,000,000 | | $ (135,972) |
Receive quarterly notional amount multiplied by 1.12% and pay Morgan Stanley, Inc. upon default of Comcast Cable Communications, Inc., par value of the notional amount of Comcast Cable Communications, Inc. 6.75% 1/30/11 | June 2006 | | 10,000,000 | | 102,057 |
TOTAL CREDIT DEFAULT SWAP | 24,000,000 | | (33,915) |
Swap Agreements - continued |
| Expiration Date | | Notional Amount | | Value |
Total Return Swap |
Receive monthly notional amount multiplied by the nominal spread appreciation of the Lehman Brothers CMBS U.S. Aggregate Index adjusted by a modified duration factor plus 10 basis points and pay monthly notional amount multiplied by the nominal spread depreciation of the Lehman Brothers CMBS U.S. Aggregate Index adjusted by a modified duration factor with Lehman Brothers, Inc. | Oct. 2005 | | $ 48,200,000 | | $ 46,335 |
Receive monthly notional amount multiplied by the nominal spread appreciation of the Lehman Brothers CMBS U.S. Aggregate Index adjusted by a modified duration factor plus 25 basis points and pay monthly notional amount multiplied by the nominal spread depreciation of the Lehman Brothers CMBS U.S. Aggregate Index adjusted by a modified duration factor with Lehman Brothers, Inc. | Dec. 2005 | | 30,000,000 | | 32,511 |
Receive monthly notional amount multiplied by the nominal spread appreciation of the Lehman Brothers CMBS U.S. Aggregate Index adjusted by a modified duration factor plus 30 basis points and pay monthly notional amount multiplied by the nominal spread depreciation of the Lehman Brothers CMBS U.S. Aggregate Index adjusted by a modified duration factor with Lehman Brothers, Inc. | August 2005 | | 35,100,000 | | 33,945 |
Swap Agreements - continued |
| Expiration Date | | Notional Amount | | Value |
Receive monthly notional amount multiplied by the nominal spread appreciation of the Lehman Brothers CMBS U.S. Aggregate Index adjusted by a modified duration factor plus 22 basis points and pay monthly notional amount multiplied by the nominal spread depreciation of the Lehman Brothers CMBS U.S. Aggregate Index adjusted by a modified duration factor with Lehman Brothers, Inc. | Jan. 2006 | | $ 35,100,000 | | $ 32,229 |
Receive monthly a return equal to Lehman Brothers ABS Floating Rate Index and pay monthly a floating rate based on the 1- month LIBOR minus 11.1 basis points with Lehman Brothers, Inc. | Nov. 2005 | | 30,000,000 | | 0 |
TOTAL TOTAL RETURN SWAP | 178,400,000 | | 145,020 |
| | $ 202,400,000 | | $ 111,105 |
Legend |
(a) Debt obligation initially issued at one coupon which converts to a higher coupon at a specified date. The rate shown is the rate at period end. |
(b) Affiliated entity |
(c) Security exempt from registration under Rule 144A of the Securities Act of 1933. These securities may be resold in transactions exempt from registration, normally to qualified institutional buyers. At the period end, the value of these securities amounted to $586,119,417 or 9.0% of net assets. |
(d) Security or a portion of the security purchased on a delayed delivery or when-issued basis. |
(e) Security or a portion of the security was pledged to cover margin requirements for futures contracts. At the period end, the value of securities pledged amounted to $994,635. |
(f) The coupon rate shown on floating or adjustable rate securities represents the rate at period end. |
(g) Security represents right to receive monthly interest payments on an underlying pool of mortgages. Principal shown is the par amount of the mortgage pool. |
(h) The maturity amount is based on the rate at period end. |
(i) Additional information on each counterparty to the repurchase agreement is as follows: |
Repurchase Agreement/
Counterparty | Value |
$2,354,164,000 due 8/1/05 at 3.32% | |
Banc of America Securities LLC. | $ 471,596,247 |
Bank of America, National Association | 244,985,063 |
Barclays Capital Inc. | 979,940,254 |
Countrywide Securities Corporation | 244,985,063 |
Morgan Stanley & Co. Incorporated. | 351,411,107 |
UBS Securities LLC | 61,246,266 |
| $ 2,354,164,000 |
Income Tax Information |
At July 31, 2005, the aggregate cost of investment securities for income tax purposes was $6,679,021,266. Net unrealized appreciation aggregated $6,094,342, of which $11,067,257 related to appreciated investment securities and $4,972,915 related to depreciated investment securities. |
Annual Report
Managing Your Investments
Fidelity offers several ways to conveniently manage your personal investments via your telephone or PC. You can access your account information, conduct trades and research your investments 24 hours a day.
By Phone
Fidelity Automated Service Telephone provides a single toll-free number to access account balances, positions, quotes and trading. It's easy to navigate the service, and on your first call, the system will help you create a personal identification number (PIN) for security.
(phone_graphic)
Fidelity Automated
Service Telephone (FAST®)
1-800-544-5555
Press
1 For mutual fund and brokerage trading.
2 For quotes.*
3 For account balances and holdings.
4 To review orders and mutual
fund activity.
5 To change your PIN.
*0 To speak to a Fidelity representative.
By PC
Fidelity's web site on the Internet provides a wide range of information, including daily financial news, fund performance, interactive planning tools and news about Fidelity products and services.
(computer_graphic)
Fidelity's Web Site
www.fidelity.com
* When you call the quotes line, please remember that a fund's yield and return will vary and, except for money market funds, share price will also vary. This means that you may have a gain or loss when you sell your shares. There is no assurance that money market funds will be able to maintain a stable $1 share price; an investment in a money market fund is not insured or guaranteed by the U.S. government. Total returns are historical and include changes in share price, reinvestment of dividends and capital gains, and the effects of any sales charges.
Annual Report
To Write Fidelity
We'll give your correspondence immediate attention and send you written confirmation upon completion of your request.
(letter_graphic)
Making Changes
To Your Account
(such as changing name, address, bank, etc.)
Fidelity Investments
P.O. Box 770001
Cincinnati, OH 45277-0002
(letter_graphic)
For Non-Retirement
Accounts
Buying shares
Fidelity Investments
P.O. Box 770001
Cincinnati, OH 45277-0003
Overnight Express
Fidelity Investments
Attn: Distribution Services
100 Crosby Parkway - KC1H
Covington, KY 41015
Selling shares
Fidelity Investments
P.O. Box 770001
Cincinnati, OH 45277-0035
Overnight Express
Fidelity Investments
Attn: Distribution Services
100 Crosby Parkway - KC1H
Covington, KY 41015
General Correspondence
Fidelity Investments
P.O. Box 500
Merrimack, NH 03054-0500
(letter_graphic)
For Retirement
Accounts
Buying shares
Fidelity Investments
P.O. Box 770001
Cincinnati, OH 45277-0003
Selling shares
Fidelity Investments
P.O. Box 770001
Cincinnati, OH 45277-0035
Overnight Express
Fidelity Investments
Attn: Distribution Services
100 Crosby Parkway - KC1H
Covington, KY 41015
General Correspondence
Fidelity Investments
P.O. Box 500
Merrimack, NH 03054-0500
Annual Report
To Visit Fidelity
For directions and hours,
please call 1-800-544-9797.
Arizona
7001 West Ray Road
Chandler, AZ
7373 N. Scottsdale Road
Scottsdale, AZ
California
815 East Birch Street
Brea, CA
1411 Chapin Avenue
Burlingame, CA
851 East Hamilton Avenue
Campbell, CA
19200 Von Karman Avenue
Irvine, CA
601 Larkspur Landing Circle
Larkspur, CA
10100 Santa Monica Blvd.
Los Angeles, CA
27101 Puerta Real
Mission Viejo, CA
73-575 El Paseo
Palm Desert, CA
251 University Avenue
Palo Alto, CA
123 South Lake Avenue
Pasadena, CA
16995 Bernardo Ctr. Drive
Rancho Bernardo, CA
1740 Arden Way
Sacramento, CA
7676 Hazard Center Drive
San Diego, CA
8 Montgomery Street
San Francisco, CA
3793 State Street
Santa Barbara, CA
21701 Hawthorne Boulevard
Torrance, CA
2001 North Main Street
Walnut Creek, CA
6300 Canoga Avenue
Woodland Hills, CA
Colorado
1625 Broadway
Denver, CO
9185 East Westview Road
Littleton, CO
Connecticut
48 West Putnam Avenue
Greenwich, CT
265 Church Street
New Haven, CT
300 Atlantic Street
Stamford, CT
29 South Main Street
West Hartford, CT
Delaware
222 Delaware Avenue
Wilmington, DE
Florida
4400 N. Federal Highway
Boca Raton, FL
121 Alhambra Plaza
Coral Gables, FL
2948 N. Federal Highway
Ft. Lauderdale, FL
1907 West State Road 434
Longwood, FL
8880 Tamiami Trail, North
Naples, FL
3550 Tamiami Trail, South
Sarasota, FL
1502 N. Westshore Blvd.
Tampa, FL
2465 State Road 7
Wellington, FL
3501 PGA Boulevard
West Palm Beach, FL
Georgia
3445 Peachtree Road, N.E.
Atlanta, GA
1000 Abernathy Road
Atlanta, GA
Illinois
One North LaSalle Street
Chicago, IL
875 North Michigan Ave.
Chicago, IL
1415 West 22nd Street
Oak Brook, IL
1700 East Golf Road
Schaumburg, IL
3232 Lake Avenue
Wilmette, IL
Indiana
4729 East 82nd Street
Indianapolis, IN
Kansas
5400 College Boulevard
Overland Park, KS
Maine
Three Canal Plaza
Portland, ME
Maryland
7315 Wisconsin Avenue
Bethesda, MD
One W. Pennsylvania Ave.
Towson, MD
Massachusetts
801 Boylston Street
Boston, MA
155 Congress Street
Boston, MA
300 Granite Street
Braintree, MA
44 Mall Road
Burlington, MA
405 Cochituate Road
Framingham, MA
416 Belmont Street
Worcester, MA
Michigan
500 E. Eisenhower Pkwy.
Ann Arbor, MI
280 Old N. Woodward Ave.
Birmingham, MI
43420 Grand River Avenue
Novi, MI
29155 Northwestern Hwy.
Southfield, MI
Minnesota
7600 France Avenue South
Edina, MN
Missouri
8885 Ladue Road
Ladue, MO
Annual Report
Nevada
2225 Village Walk Drive
Henderson, NV
New Jersey
150 Essex Street
Millburn, NJ
56 South Street
Morristown, NJ
396 Route 17, North
Paramus, NJ
3518 Route 1 North
Princeton, NJ
530 Highway 35
Shrewsbury, NJ
New York
1055 Franklin Avenue
Garden City, NY
37 West Jericho Turnpike
Huntington Station, NY
1271 Avenue of the Americas
New York, NY
61 Broadway
New York, NY
350 Park Avenue
New York, NY
200 Fifth Avenue
New York, NY
733 Third Avenue
New York, NY
11 Penn Plaza
New York, NY
2070 Broadway
New York, NY
1075 Northern Blvd.
Roslyn, NY
North Carolina
4611 Sharon Road
Charlotte, NC
Ohio
3805 Edwards Road
Cincinnati, OH
1324 Polaris Parkway
Columbus, OH
28699 Chagrin Boulevard
Woodmere Village, OH
Oregon
16850 SW 72nd Avenue
Tigard, OR
Pennsylvania
600 West DeKalb Pike
King of Prussia, PA
1735 Market Street
Philadelphia, PA
12001 Perry Highway
Wexford, PA
Rhode Island
47 Providence Place
Providence, RI
Tennessee
6150 Poplar Avenue
Memphis, TN
Texas
10000 Research Boulevard
Austin, TX
4001 Northwest Parkway
Dallas, TX
12532 Memorial Drive
Houston, TX
2701 Drexel Drive
Houston, TX
6500 N. MacArthur Blvd.
Irving, TX
6005 West Park Boulevard
Plano, TX
14100 San Pedro
San Antonio, TX
1576 East Southlake Blvd.
Southlake, TX
19740 IH 45 North
Spring, TX
Utah
215 South State Street
Salt Lake City, UT
Virginia
1861 International Drive
McLean, VA
Washington
411 108th Avenue, N.E.
Bellevue, WA
1518 6th Avenue
Seattle, WA
Washington, DC
1900 K Street, N.W.
Washington, DC
Wisconsin
595 North Barker Road
Brookfield, WI
Fidelity Brokerage Services, Inc., 100 Summer St., Boston, MA 02110 Member NYSE/SIPC
Annual Report
Annual Report
Annual Report
Investment Adviser
Fidelity Management & Research Company
Boston, MA
Investment Sub-Advisers
FMR Co., Inc.
Fidelity Management & Research
(U.K.) Inc.
Fidelity Management & Research
(Far East) Inc.
Fidelity Investments
Money Management, Inc.
Fidelity Investments Japan Limited
Fidelity International
Investment Advisors
Fidelity International
Investment Advisors (U.K.) Limited
General Distributor
Fidelity Distributors Corporation
Boston, MA
Transfer and Service Agent
Fidelity Service Company, Inc.
Boston, MA
Custodian
Citibank, N.A.
New York, NY
The Fidelity Telephone Connection
Mutual Fund 24-Hour Service
Exchanges/Redemptions
and Account Assistance 1-800-544-6666
Product Information 1-800-544-6666
Retirement Accounts 1-800-544-4774
(8 a.m. - 9 p.m.)
TDD Service 1-800-544-0118
for the deaf and hearing impaired
(9 a.m. - 9 p.m. Eastern time)
Fidelity Automated Service
Telephone (FAST®) (automated graphic) 1-800-544-5555
(automated graphic) Automated line for quickest service
TBD-UANN-0905
1.789712.102
(Fidelity Investment logo)(registered trademark)
Corporate Headquarters
82 Devonshire St., Boston, MA 02109
www.fidelity.com
(Fidelity Investment logo)(registered trademark)
Fidelity Advisor
Total Bond
Fund - Class A, Class T, Class B
and Class C
Annual Report
July 31, 2005
Class A, Class T, Class B,
and Class C are classes of
Fidelity Total Bond Fund
(2_fidelity_logos) (Registered_Trademark)
Contents
Chairman's Message | <Click Here> | Ned Johnson's message to shareholders. |
Performance | <Click Here> | How the fund has done over time. |
Management's Discussion | <Click Here> | The manager's review of fund performance, strategy and outlook. |
Shareholder Expense Example | <Click Here> | An example of shareholder expenses. |
Investment Changes | <Click Here> | A summary of major shifts in the fund's investments over the past six months. |
Investments | <Click Here> | A complete list of the fund's investments with their market values. |
Financial Statements | <Click Here> | Statements of assets and liabilities, operations, and changes in net assets,
as well as financial highlights. |
Notes | <Click Here> | Notes to the financial statements. |
Report of Independent Registered Public Accounting Firm | <Click Here> | |
Trustees and Officers | <Click Here> | |
Distributions | <Click Here> | |
Board Approval of Investment Advisory Contracts and Management Fees | <Click Here> | |
Central Fund Investments | <Click Here> | Complete list of investments for Fidelity's fixed-income central funds. |
To view a fund's proxy voting guidelines and proxy voting record for the 12-month period ended June 30, visit www.fidelity.com/proxyvotingresults or visit the Securities and Exchange Commission's (SEC) web site at www.sec.gov. You may also call 1-877-208-0098 to request a free copy of the proxy voting guidelines.
Standard & Poor's, S&P and S&P 500 are registered service marks of The McGraw-Hill Companies, Inc. and have been licensed for use by Fidelity Distributors Corporation.
Other third party marks appearing herein are the property of their respective owners.
All other marks appearing herein are registered or unregistered trademarks or service marks of FMR Corp. or an affiliated company.
Annual Report
This report and the financial statements contained herein are submitted for the general information of the shareholders of the fund. This report is not authorized for distribution to prospective investors in the fund unless preceded or accompanied by an effective prospectus.
A fund files its complete schedule of portfolio holdings with the SEC for the first and third quarters of each fiscal year on Form N-Q. Forms N-Q are available on the SEC's web site at http://www.sec.gov. A fund's Forms N-Q may be reviewed and copied at the SEC's Public Reference Room in Washington, DC. Information regarding the operation of the SEC's Public Reference Room may be obtained by calling 1-800-SEC-0330. For a complete list of a fund's portfolio holdings, view the most recent quarterly holdings report, semiannual report, or annual report on Fidelity's web site at http://www.advisor.fidelity.com.
NOT FDIC INSURED · MAY LOSE VALUE · NO BANK GUARANTEE
Neither the fund nor Fidelity Distributors Corporation is a bank.
Annual Report
Chairman's Message
(photo_of_Edward_C_Johnson_3d)
Dear Shareholder:
During the past year or so, much has been reported about the mutual fund industry, and much of it has been more critical than I believe is warranted. Allegations that some companies have been less than forthright with their shareholders have cast a shadow on the entire industry. I continue to find these reports disturbing, and assert that they do not create an accurate picture of the industry overall. Therefore, I would like to remind everyone where Fidelity stands on these issues. I will say two things specifically regarding allegations that some mutual fund companies were in violation of the Securities and Exchange Commission's forward pricing rules or were involved in so-called "market timing" activities.
First, Fidelity has no agreements that permit customers who buy fund shares after 4 p.m. to obtain the 4 p.m. price. This is not a new policy. This is not to say that someone could not deceive the company through fraudulent acts. However, we are extremely diligent in preventing fraud from occurring in this manner - and in every other. But I underscore again that Fidelity has no so-called "agreements" that sanction illegal practices.
Second, Fidelity continues to stand on record, as we have for years, in opposition to predatory short-term trading that adversely affects shareholders in a mutual fund. Back in the 1980s, we initiated a fee - which is returned to the fund and, therefore, to investors - to discourage this activity. Further, we took the lead several years ago in developing a Fair Value Pricing Policy to prevent market timing on foreign securities in our funds. I am confident we will find other ways to make it more difficult for predatory traders to operate. However, this will only be achieved through close cooperation among regulators, legislators and the industry.
Yes, there have been unfortunate instances of unethical and illegal activity within the mutual fund industry from time to time. That is true of any industry. When this occurs, confessed or convicted offenders should be dealt with appropriately. But we are still concerned about the risk of over-regulation and the quick application of simplistic solutions to intricate problems. Every system can be improved, and we support and applaud well thought out improvements by regulators, legislators and industry representatives that achieve the common goal of building and protecting the value of investors' holdings.
For nearly 60 years, Fidelity has worked very hard to improve its products and service to justify your trust. When our family founded this company in 1946, we had only a few hundred customers. Today, we serve more than 18 million customers including individual investors and participants in retirement plans across America.
Let me close by saying that we do not take your trust in us for granted, and we realize that we must always work to improve all aspects of our service to you. In turn, we urge you to continue your active participation with your financial matters, so that your interests can be well served.
Best regards,
/s/Edward C. Johnson 3d
Edward C. Johnson 3d
Annual Report
Performance: The Bottom Line
Average annual total return reflects the change in the value of an investment, assuming reinvestment of the class' dividend income and capital gains (the profits earned upon the sale of securities that have grown in value) and assuming a constant rate of performance each year. The $10,000 table and the fund's returns do not reflect the deduction of taxes that a shareholder would pay on fund distributions or the redemption of fund shares. During periods of reimbursement by Fidelity, a fund's total return will be greater than it would be had the reimbursement not occurred. How a fund did yesterday is no guarantee of how it will do tomorrow.
Average Annual Total Returns
Periods ended July 31, 2005 | | Past 1
year | Life of
fund A |
Class A (incl. 4.75% sales charge) B | | 0.51% | 3.98% |
Class T (incl. 3.50% sales charge) C | | 1.64% | 4.39% |
Class B (incl. contingent deferred sales charge) D | | -0.26% | 4.50% |
Class C (incl. contingent deferred sales charge) E | | 3.63% | 5.44% |
A From October 15, 2002.
B Class A shares bear a 0.15% 12b-1 fee. The initial offering of Class A shares took place on June 16, 2004. Returns prior to June 16, 2004 are those of Total Bond, the original retail class of the fund, which does not bear a 12b-1 fee. Had Class A shares' 12b-1 fee been reflected, returns prior to June 16, 2004 would have been lower.
C Class T shares bear a 0.25% 12b-1 fee. The initial offering of Class T shares took place on June 16, 2004. Returns prior to June 16, 2004 are those of Total Bond, the original retail class of the fund, which does not bear a 12b-1 fee. Had Class T shares' 12b-1 fee been reflected, returns prior to June 16, 2004 would have been lower.
D Class B shares bear a 0.90% 12b-1 fee. The initial offering of Class B shares took place on June 16, 2004. Returns prior to June 16, 2004 are those of Total Bond, the original retail class of the fund, which does not bear a 12b-1 fee. Had Class B shares' 12b-1 fee been reflected, returns prior to June 16, 2004 would have been lower. Class B shares' contingent deferred sales charges included in past one year and life of fund total return figures are 4% and 3%, respectively.
E Class C shares bear a 1.00% 12b-1 fee. The initial offering of Class C shares took place on June 16, 2004. Returns prior to June 16, 2004 are those of Fidelity Total Bond, the original retail class of the fund, which does not bear a 12b-1 fee. Had Class C shares' 12b-1 fee been reflected, returns prior to June 16, 2004 would have been lower. Class C shares' contingent deferred sales charges included in the past one year and life of fund total return figures are 1% and 0%, respectively.
Annual Report
$10,000 Over Life of Fund
Let's say hypothetically that $10,000 was invested in Fidelity Advisor Total Bond Fund - Class T on October 15, 2002, when the fund started, and the current 3.50% sales charge was paid. The chart shows how the value of your investment would have changed, and also shows how the Lehman Brothers® U.S. Universal Index performed over the same period.

Annual Report
Management's Discussion of Fund Performance
Comments from Ford O'Neil, Portfolio Manager of Fidelity Advisor Total Bond Fund
Not unlike the domestic equity markets, taxable bonds swung up and down during the 12 months ending July 31, 2005, rallying early in the period, selling off in late winter, only to advance again in the spring. During the one-year period, the Lehman Brothers® Aggregate Bond Index - a measure of the overall investment-grade bond universe - - rose 4.79%. Much of this gain came on the strength of returns from higher-yielding spread sectors, such as investment-grade corporates, reflected in the 5.76% return of the Lehman Brothers Credit Bond Index over the 12-month period. Mortgage-backed securities were spurred on by the relative stability of long-term interest rates, and the Lehman Brothers Mortgage-Backed Securities gained 4.67%. Treasuries also bolstered the overall market, as illustrated by the 4.62% return of the Lehman Brothers U.S. Treasury Index, which moved ahead on a flight to quality as investors continued to ponder the future direction of the U.S. economy. The Lehman Brothers U.S. Agency Index returned a more modest 3.88%.
During the past year, the fund's Class A, Class T, Class B and Class C shares returned 5.52%, 5.33%, 4.74% and 4.63%, respectively. In comparison, the Lehman Brothers U.S. Universal Index and the LipperSM Intermediate Investment Grade Debt Funds Average rose 5.53% and 4.36%, respectively. Benefiting the fund's performance was our sector selection. In particular, the decision to overweight high-yield corporate bonds and emerging-markets debt worked out well relative to the index, as these segments were boosted by a combination of strong demand for higher-yielding securities and improving creditworthiness. Security selection in both sectors also generally was advantageous. Within the investment-grade portion of the portfolio - which accounted for the majority of the fund's net assets and was the main driver of its absolute and relative returns - - our yield-curve positioning helped as the curve flattened. Security selection among investment-grade bonds also added value, with the fund's corporate bond holdings leading the way. However, positions in auto-related companies disappointed. Elsewhere, the decision to invest in high-quality securitized products - namely mortgage securities and asset-backed securities - worked in our favor, as did security selection within those segments. An allocation to Treasury Inflation-Protected Securities (TIPS) also contributed, as they posted strong gains throughout most of the year, although an underweighting in nominal Treasuries detracted from results.
The views expressed in this statement reflect those of the portfolio manager only through the end of the period of the report as stated on the cover and do not necessarily represent the views of Fidelity or any other person in the Fidelity organization. Any such views are subject to change at any time based upon market or other conditions and Fidelity disclaims any responsibility to update such views. These views may not be relied on as investment advice and, because investment decisions for a Fidelity fund are based on numerous factors, may not be relied on as an indication of trading intent on behalf of any Fidelity fund.
Annual Report
Shareholder Expense Example
As a shareholder of the Fund, you incur two types of costs: (1) transaction costs, including sales charges (loads) on purchase payments or redemption proceeds, and (2) ongoing costs, including management fees, distribution and/or service (12b-1) fees and other Fund expenses. This Example is intended to help you understand your ongoing costs (in dollars) of investing in the Fund and to compare these costs with the ongoing costs of investing in other mutual funds.
The Example is based on an investment of $1,000 invested at the beginning of the period and held for the entire period (February 1, 2005 to July 31, 2005).
Actual Expenses
The first line of the table below for each class of the Fund provides information about actual account values and actual expenses. You may use the information in this line, together with the amount you invested, to estimate the expenses that you paid over the period. Simply divide your account value by $1,000.00 (for example, an $8,600 account value divided by $1,000.00 = 8.6), then multiply the result by the number in the first line for a class of the Fund under the heading entitled "Expenses Paid During Period" to estimate the expenses you paid on your account during this period.
Hypothetical Example for Comparison Purposes
The second line of the table below for each class of the Fund provides information about hypothetical account values and hypothetical expenses based on a Class' actual expense ratio and an assumed rate of return of 5% per year before expenses, which is not the Class' actual return. The hypothetical account values and expenses may not be used to estimate the actual ending account balance or expenses you paid for the period. You may use this information to compare the ongoing costs of investing in the Fund and other funds. To do so, compare this 5% hypothetical example with the 5% hypothetical examples that appear in the shareholder reports of the other funds.
Please note that the expenses shown in the table are meant to highlight your ongoing costs only and do not reflect any transaction costs. Therefore, the second line of the table is useful in comparing ongoing costs only, and will not help you determine the relative total costs of owning different funds. In addition, if these transactional costs were included, your costs would have been higher.
| Beginning
Account Value
February 1, 2005 | Ending
Account Value
July 31, 2005 | Expenses Paid
During Period*
February 1, 2005
to July 31, 2005 |
Class A | | | |
Actual | $ 1,000.00 | $ 1,010.10 | $ 3.99** |
HypotheticalA | $ 1,000.00 | $ 1,020.83 | $ 4.01** |
Class T | | | |
Actual | $ 1,000.00 | $ 1,009.60 | $ 4.48** |
HypotheticalA | $ 1,000.00 | $ 1,020.33 | $ 4.51** |
Class B | | | |
Actual | $ 1,000.00 | $ 1,006.30 | $ 7.71** |
HypotheticalA | $ 1,000.00 | $ 1,017.11 | $ 7.75** |
| Beginning
Account Value
February 1, 2005 | Ending
Account Value
July 31, 2005 | Expenses Paid
During Period*
February 1, 2005
to July 31, 2005 |
Class C | | | |
Actual | $ 1,000.00 | $ 1,006.70 | $ 8.21** |
HypotheticalA | $ 1,000.00 | $ 1,016.61 | $ 8.25** |
Total Bond | | | |
Actual | $ 1,000.00 | $ 1,011.40 | $ 2.89** |
HypotheticalA | $ 1,000.00 | $ 1,021.92 | $ 2.91** |
Institutional Class | | | |
Actual | $ 1,000.00 | $ 1,012.20 | $ 2.99** |
HypotheticalA | $ 1,000.00 | $ 1,021.82 | $ 3.01** |
A 5% return per year before expenses
* Expenses are equal to each Class' annualized expense ratio (shown in the table below); multiplied by the average account value over the period, multiplied by 181/365 (to reflect the one-half year period).
| Annualized
Expense Ratio |
Class A | .80%** |
Class T | .90%** |
Class B | 1.55%** |
Class C | 1.65%** |
Total Bond | .58%** |
Institutional Class | .60%** |
** If contractual expense reductions, effective June 1, 2005, had been in effect during the period, the annualized expense ratio and the expenses paid in the actual and hypothetical examples above would have been as follows:
| Annualized
Expense Ratio | Expenses Paid |
Class A | .74% | |
Actual | | $ 3.69 |
HypotheticalA | | $ 3.71 |
Class T | .82% | |
Actual | | $ 4.09 |
HypotheticalA | | $ 4.11 |
Class B | 1.47% | |
Actual | | $ 7.31 |
HypotheticalA | | $ 7.35 |
Class C | 1.61% | |
Actual | | $ 8.01 |
HypotheticalA | | $ 8.05 |
Total Bond | .45% | |
Actual | | $ 2.24 |
HypotheticalA | | $ 2.26 |
Institutional Class | .49% | |
Actual | | $ 2.45 |
HypotheticalA | | $ 2.46 |
A 5% return per year before expenses
Annual Report
Investment Changes
Quality Diversification (% of fund's net assets) |
As of July 31, 2005 | As of January 31, 2005 |
| U.S. Government
and U.S. Government Agency Obligations 56.7% | | | U.S. Government
and U.S.Government Agency Obligations 54.8% | |
| AAA 7.7% | | | AAA 5.2% | |
| AA 3.2% | | | AA 3.6% | |
| A 6.2% | | | A 7.4% | |
| BBB 13.4% | | | BBB 12.9% | |
| BB and Below 9.0% | | | BB and Below 9.0% | |
| Not Rated 0.8% | | | Not Rated 1.4% | |
| Equities 0.0% | | | Equities 0.0% | |
| Short-Term Investments
and Net Other Assets 3.0% | | | Short-Term Investments
and Net Other Assets 5.7% | |

We have used ratings from Moody's® Investors Services, Inc. Where Moody's ratings are not available, we have used S&P ® ratings. Securities rated BB or below were rated investment grade at the time of acquisition. The information in the above table is based on the combined investments of the fund and its pro-rata share of the investments of Fidelity's fixed-income central fund. |
Average Years to Maturity as of July 31, 2005 |
| | 6 months ago |
Years | 6.2 | 5.4 |
Average years to maturity is based on the average time remaining until principal payments are expected from each of the fund's bonds, weighted by dollar amount. |
Duration as of July 31, 2005 |
| | 6 months ago |
Years | 4.0 | 4.0 |
Duration shows how much a bond fund's price fluctuates with changes in comparable interest rates. If rates rise 1%, for example, a fund with a five-year duration is likely to lose about 5% of its value. Other factors also can influence a bond fund's performance and share price. Accordingly, a bond fund's actual performance may differ from this example. |
Asset Allocation (% of fund's net assets) |
As of July 31, 2005 * | As of January 31, 2005 ** |
| Corporate Bonds 22.3% | | | Corporate Bonds 23.3% | |
| U.S. Government
and U.S. Government Agency Obligations 56.7% | | | U.S. Government
and U.S. Government Agency Obligations 54.8% | |
| Asset-Backed
Securities 7.6% | | | Asset-Backed
Securities 6.2% | |
| CMOs and Other Mortgage Related Securities 7.9% | | | CMOs and Other Mortgage Related Securities 7.1% | |
| Other Investments 2.5% | | | Other Investments 2.9% | |
| Short-Term
Investments and
Net Other Assets 3.0% | | | Short-Term
Investments and
Net Other Assets 5.7% | |
* Foreign investments | 6.7% | | ** Foreign investments | 7.6% | |

* Futures and Swaps | 6.8% | | ** Futures and Swaps | 4.9% | |
The information in the above tables is based on the combined investments of the fund and its pro-rata share of the investments of Fidelity's fixed-income central fund. |
Annual Report
Investments July 31, 2005
Showing Percentage of Net Assets
Nonconvertible Bonds - 21.8% |
| Principal Amount | | Value (Note 1) |
CONSUMER DISCRETIONARY - 4.2% |
Auto Components - 0.1% |
Affinia Group, Inc. 9% 11/30/14 (e) | | $ 30,000 | | $ 24,000 |
Delco Remy International, Inc. 11% 5/1/09 | | 50,000 | | 44,000 |
Tenneco Automotive, Inc. 8.625% 11/15/14 | | 105,000 | | 108,938 |
TRW Automotive Acquisition Corp. 9.375% 2/15/13 | | 87,000 | | 97,440 |
Visteon Corp. 7% 3/10/14 | | 190,000 | | 164,350 |
| | 438,728 |
Automobiles - 0.5% |
Ford Motor Co.: | | | | |
6.625% 10/1/28 | | 125,000 | | 97,581 |
7.45% 7/16/31 | | 915,000 | | 775,789 |
General Motors Corp.: | | | | |
8.25% 7/15/23 | | 135,000 | | 120,825 |
8.375% 7/15/33 | | 1,510,000 | | 1,362,775 |
| | 2,356,970 |
Diversified Consumer Services - 0.1% |
Carriage Services, Inc. 7.875% 1/15/15 (e) | | 200,000 | | 208,500 |
Service Corp. International (SCI): | | | | |
6.5% 3/15/08 | | 75,000 | | 76,875 |
6.75% 4/1/16 | | 55,000 | | 56,169 |
| | 341,544 |
Hotels, Restaurants & Leisure - 1.0% |
Argosy Gaming Co. 7% 1/15/14 | | 80,000 | | 88,400 |
Bally Total Fitness Holding Corp.: | | | | |
9.875% 10/15/07 | | 15,000 | | 13,275 |
10.5% 7/15/11 | | 120,000 | | 121,800 |
Carrols Corp. 9% 1/15/13 (e) | | 105,000 | | 108,938 |
Domino's, Inc. 8.25% 7/1/11 | | 55,000 | | 58,850 |
Friendly Ice Cream Corp. 8.375% 6/15/12 | | 70,000 | | 68,600 |
Gaylord Entertainment Co.: | | | | |
6.75% 11/15/14 | | 50,000 | | 49,625 |
8% 11/15/13 | | 225,000 | | 239,918 |
Herbst Gaming, Inc.: | | | | |
7% 11/15/14 | | 50,000 | | 50,875 |
8.125% 6/1/12 | | 70,000 | | 74,550 |
HMH Properties, Inc. 7.875% 8/1/08 | | 45,000 | | 45,563 |
Host Marriott LP 7.125% 11/1/13 | | 35,000 | | 36,621 |
Landry's Seafood Restaurants, Inc. 7.5% 12/15/14 | | 390,000 | | 385,613 |
MGM MIRAGE: | | | | |
6% 10/1/09 | | 50,000 | | 50,125 |
Nonconvertible Bonds - continued |
| Principal Amount | | Value (Note 1) |
CONSUMER DISCRETIONARY - continued |
Hotels, Restaurants & Leisure - continued |
MGM MIRAGE: - continued | | | | |
8.375% 2/1/11 | | $ 40,000 | | $ 43,752 |
Mohegan Tribal Gaming Authority 7.125% 8/15/14 | | 40,000 | | 42,000 |
Morton's Restaurant Group, Inc. 7.5% 7/1/10 | | 65,000 | | 64,675 |
MTR Gaming Group, Inc. 9.75% 4/1/10 | | 135,000 | | 146,813 |
Park Place Entertainment Corp. 7.875% 12/15/05 | | 50,000 | | 50,625 |
Penn National Gaming, Inc.: | | | | |
6.875% 12/1/11 | | 80,000 | | 82,000 |
8.875% 3/15/10 | | 100,000 | | 106,375 |
Pinnacle Entertainment, Inc. 8.25% 3/15/12 | | 140,000 | | 147,700 |
Resorts International Hotel & Casino, Inc. 11.5% 3/15/09 | | 225,000 | | 255,375 |
Scientific Games Corp. 6.25% 12/15/12 (e) | | 30,000 | | 30,450 |
Seneca Gaming Corp.: | | | | |
7.25% 5/1/12 (Reg. S) (e) | | 70,000 | | 72,625 |
7.25% 5/1/12 | | 50,000 | | 51,875 |
Six Flags, Inc. 9.625% 6/1/14 | | 180,000 | | 174,600 |
Speedway Motorsports, Inc. 6.75% 6/1/13 | | 100,000 | | 103,625 |
Station Casinos, Inc.: | | | | |
6% 4/1/12 | | 70,000 | | 71,225 |
6.5% 2/1/14 | | 40,000 | | 41,052 |
6.875% 3/1/16 | | 100,000 | | 103,000 |
Sun International Hotels Ltd./Sun International North America, Inc. 8.875% 8/15/11 | | 325,000 | | 347,344 |
Town Sports International, Inc. 9.625% 4/15/11 | | 165,000 | | 174,900 |
Universal City Development Partners Ltd./UCDP Finance, Inc. 11.75% 4/1/10 | | 95,000 | | 109,136 |
Uno Restaurant Corp. 10% 2/15/11 (e) | | 80,000 | | 77,200 |
Vail Resorts, Inc. 6.75% 2/15/14 | | 60,000 | | 61,350 |
Virgin River Casino Corp./RBG LLC/B&BB, Inc.: | | | | |
0% 1/15/13 (c)(e) | | 40,000 | | 28,400 |
9% 1/15/12 (e) | | 30,000 | | 31,500 |
Waterford Gaming LLC/Waterford Gaming Finance Corp. 8.625% 9/15/12 (e) | | 46,000 | | 49,680 |
Wheeling Island Gaming, Inc. 10.125% 12/15/09 | | 160,000 | | 169,600 |
Wynn Las Vegas LLC/Wynn Las Vegas Capital Corp. 6.625% 12/1/14 | | 160,000 | | 156,000 |
| | 4,185,630 |
Household Durables - 0.2% |
Champion Enterprises, Inc. 7.625% 5/15/09 | | 70,000 | | 70,700 |
Nonconvertible Bonds - continued |
| Principal Amount | | Value (Note 1) |
CONSUMER DISCRETIONARY - continued |
Household Durables - continued |
Goodman Global Holdings, Inc. 7.875% 12/15/12 (e) | | $ 80,000 | | $ 76,000 |
K. Hovnanian Enterprises, Inc.: | | | | |
6.25% 1/15/15 | | 50,000 | | 49,890 |
6.5% 1/15/14 | | 100,000 | | 101,750 |
8.875% 4/1/12 | | 10,000 | | 10,800 |
Sealy Mattress Co. 8.25% 6/15/14 | | 50,000 | | 53,250 |
Technical Olympic USA, Inc.: | | | | |
7.5% 3/15/11 | | 110,000 | | 103,950 |
7.5% 1/15/15 | | 175,000 | | 161,000 |
WCI Communities, Inc. 9.125% 5/1/12 | | 35,000 | | 36,925 |
William Lyon Homes, Inc. 10.75% 4/1/13 | | 110,000 | | 121,000 |
| | 785,265 |
Media - 2.1% |
AMC Entertainment, Inc. 8.625% 8/15/12 | | 60,000 | | 62,400 |
AOL Time Warner, Inc. 7.625% 4/15/31 | | 500,000 | | 616,090 |
British Sky Broadcasting Group PLC (BSkyB) yankee 8.2% 7/15/09 | | 1,000,000 | | 1,114,287 |
Cablevision Systems Corp.: | | | | |
7.88% 4/1/09 (i) | | 40,000 | | 41,200 |
8% 4/15/12 | | 230,000 | | 230,575 |
CanWest Media, Inc. 8% 9/15/12 | | 30,000 | | 32,025 |
Charter Communications Holding II LLC/Charter Communications Holdings II Capital Corp. 10.25% 9/15/10 | | 115,000 | | 118,738 |
Charter Communications Operating LLC/Charter Communications Operating Capital Corp. 8.375% 4/30/14 (e) | | 70,000 | | 70,613 |
Cinemark, Inc. 0% 3/15/14 (c) | | 100,000 | | 68,750 |
Comcast Corp. 5.85% 1/15/10 | | 500,000 | | 520,067 |
Cox Communications, Inc.: | | | | |
4.625% 6/1/13 | | 90,000 | | 86,026 |
7.125% 10/1/12 | | 970,000 | | 1,071,758 |
CSC Holdings, Inc.: | | | | |
6.75% 4/15/12 (e) | | 160,000 | | 154,800 |
7.875% 2/15/18 | | 50,000 | | 49,813 |
8.125% 7/15/09 | | 65,000 | | 66,950 |
Dex Media, Inc.: | | | | |
0% 11/15/13 (c) | | 95,000 | | 77,663 |
0% 11/15/13 (c) | | 5,000 | | 4,088 |
8% 11/15/13 | | 10,000 | | 10,700 |
Nonconvertible Bonds - continued |
| Principal Amount | | Value (Note 1) |
CONSUMER DISCRETIONARY - continued |
Media - continued |
EchoStar DBS Corp.: | | | | |
6.375% 10/1/11 | | $ 150,000 | | $ 149,250 |
9.125% 1/15/09 | | 72,000 | | 76,680 |
Entercom Radio LLC/Entercom Capital, Inc. 7.625% 3/1/14 | | 50,000 | | 52,250 |
Granite Broadcasting Corp. 9.75% 12/1/10 | | 40,000 | | 37,100 |
Houghton Mifflin Co.: | | | | |
8.25% 2/1/11 | | 100,000 | | 105,000 |
9.875% 2/1/13 | | 145,000 | | 158,050 |
iesy Repository Gmbh 10.375% 2/15/15 (e) | | 80,000 | | 80,800 |
Innova S. de R.L. 9.375% 9/19/13 | | 85,000 | | 95,519 |
Insight Midwest LP/Insight Capital, Inc. 9.75% 10/1/09 | | 100,000 | | 103,625 |
Liberty Media Corp.: | | | | |
5.7% 5/15/13 | | 500,000 | | 462,739 |
8.25% 2/1/30 | | 740,000 | | 746,690 |
8.5% 7/15/29 | | 130,000 | | 132,621 |
LodgeNet Entertainment Corp. 9.5% 6/15/13 | | 190,000 | | 207,100 |
MediaNews Group, Inc. 6.375% 4/1/14 | | 100,000 | | 96,250 |
News America Holdings, Inc. 7.75% 12/1/45 | | 170,000 | | 205,897 |
News America, Inc. 6.2% 12/15/34 | | 330,000 | | 342,944 |
Nexstar Broadcasting, Inc.: | | | | |
7% 1/15/14 | | 130,000 | | 120,900 |
7% 1/15/14 (e) | | 70,000 | | 65,100 |
PanAmSat Corp. 9% 8/15/14 | | 84,000 | | 92,610 |
PRIMEDIA, Inc.: | | | | |
7.625% 4/1/08 | | 84,000 | | 84,840 |
8.875% 5/15/11 | | 25,000 | | 26,250 |
Rainbow National LLC & RNS Co. Corp.: | | | | |
8.75% 9/1/12 (e) | | 30,000 | | 33,000 |
10.375% 9/1/14 (e) | | 30,000 | | 34,575 |
Rogers Cable, Inc. 6.75% 3/15/15 | | 50,000 | | 51,625 |
The Reader's Digest Association, Inc. 6.5% 3/1/11 | | 70,000 | | 71,750 |
Time Warner Entertainment Co. LP 8.375% 7/15/33 | | 1,000,000 | | 1,310,939 |
| | 9,340,647 |
Specialty Retail - 0.1% |
Asbury Automotive Group, Inc.: | | | | |
8% 3/15/14 | | 60,000 | | 59,550 |
9% 6/15/12 | | 15,000 | | 15,563 |
General Nutrition Centers, Inc. 8.625% 1/15/11 | | 80,000 | | 76,100 |
Nebraska Book Co., Inc. 8.625% 3/15/12 | | 90,000 | | 85,725 |
Nonconvertible Bonds - continued |
| Principal Amount | | Value (Note 1) |
CONSUMER DISCRETIONARY - continued |
Specialty Retail - continued |
Sonic Automotive, Inc. 8.625% 8/15/13 | | $ 165,000 | | $ 169,950 |
The Pep Boys - Manny, Moe & Jack 7.5% 12/15/14 | | 55,000 | | 50,050 |
United Auto Group, Inc. 9.625% 3/15/12 | | 50,000 | | 54,000 |
| | 510,938 |
Textiles, Apparel & Luxury Goods - 0.1% |
Jostens IH Corp. 7.625% 10/1/12 | | 40,000 | | 40,700 |
Levi Strauss & Co.: | | | | |
8.2544% 4/1/12 (i) | | 70,000 | | 70,000 |
9.75% 1/15/15 | | 180,000 | | 189,000 |
12.25% 12/15/12 | | 65,000 | | 73,288 |
| | 372,988 |
TOTAL CONSUMER DISCRETIONARY | | 18,332,710 |
CONSUMER STAPLES - 0.8% |
Beverages - 0.1% |
FBG Finance Ltd. 5.125% 6/15/15 (e) | | 425,000 | | 417,587 |
Food & Staples Retailing - 0.1% |
Ahold Finance USA, Inc.: | | | | |
6.25% 5/1/09 | | 40,000 | | 40,800 |
6.875% 5/1/29 | | 170,000 | | 161,500 |
8.25% 7/15/10 | | 40,000 | | 43,800 |
Jean Coutu Group, Inc.: | | | | |
7.625% 8/1/12 | | 30,000 | | 31,200 |
8.5% 8/1/14 | | 60,000 | | 59,550 |
Rite Aid Corp. 6% 12/15/05 (e) | | 20,000 | | 20,100 |
Stater Brothers Holdings, Inc. 8.125% 6/15/12 | | 80,000 | | 80,600 |
| | 437,550 |
Food Products - 0.4% |
B&G Foods, Inc. 8% 10/1/11 | | 40,000 | | 41,300 |
Cadbury Schweppes U.S. Finance LLC: | | | | |
3.875% 10/1/08 (e) | | 90,000 | | 87,885 |
5.125% 10/1/13 (e) | | 1,060,000 | | 1,055,387 |
Del Monte Corp. 6.75% 2/15/15 (e) | | 60,000 | | 61,350 |
Doane Pet Care Co.: | | | | |
9.75% 5/15/07 | | 50,000 | | 49,250 |
10.75% 3/1/10 | | 125,000 | | 135,000 |
National Beef Packing Co. LLC/National Beef Finance Corp. 10.5% 8/1/11 | | 120,000 | | 127,500 |
Nonconvertible Bonds - continued |
| Principal Amount | | Value (Note 1) |
CONSUMER STAPLES - continued |
Food Products - continued |
Pierre Foods, Inc. 9.875% 7/15/12 | | $ 40,000 | | $ 41,800 |
United Agriculture Products, Inc. 8.25% 12/15/11 | | 147,000 | | 155,085 |
| | 1,754,557 |
Household Products - 0.1% |
Fort James Corp. 6.875% 9/15/07 | | 150,000 | | 156,563 |
Personal Products - 0.0% |
Revlon Consumer Products Corp. 9.5% 4/1/11 | | 100,000 | | 96,000 |
Tobacco - 0.1% |
Altria Group, Inc. 7% 11/4/13 | | 400,000 | | 438,346 |
TOTAL CONSUMER STAPLES | | 3,300,603 |
ENERGY - 2.1% |
Energy Equipment & Services - 0.3% |
Cooper Cameron Corp. 2.65% 4/15/07 | | 340,000 | | 328,336 |
Diamond Offshore Drilling, Inc. 4.875% 7/1/15 (e) | | 885,000 | | 866,882 |
Dresser-Rand Group, Inc. 7.375% 11/1/14 (e) | | 50,000 | | 52,375 |
Hanover Compressor Co. 8.625% 12/15/10 | | 20,000 | | 21,200 |
Hanover Equipment Trust 8.75% 9/1/11 | | 50,000 | | 53,375 |
Petronas Capital Ltd. 7% 5/22/12 (e) | | 5,000 | | 5,609 |
Universal Compression, Inc. 7.25% 5/15/10 | | 40,000 | | 41,700 |
| | 1,369,477 |
Oil, Gas & Consumable Fuels - 1.8% |
Amerada Hess Corp. 6.65% 8/15/11 | | 110,000 | | 119,464 |
ANR Pipeline, Inc. 9.625% 11/1/21 | | 100,000 | | 127,750 |
Arch Western Finance LLC 6.75% 7/1/13 | | 100,000 | | 103,500 |
Canadian Oil Sands Ltd. 4.8% 8/10/09 (e) | | 490,000 | | 486,712 |
Chesapeake Energy Corp.: | | | | |
6.875% 1/15/16 | | 50,000 | | 52,190 |
7.75% 1/15/15 | | 30,000 | | 32,550 |
El Paso Energy Corp.: | | | | |
7.375% 12/15/12 | | 5,000 | | 5,069 |
7.75% 1/15/32 | | 15,000 | | 15,150 |
8.05% 10/15/30 | | 95,000 | | 97,256 |
El Paso Production Holding Co. 7.75% 6/1/13 | | 140,000 | | 148,750 |
Empresa Nacional de Petroleo 6.75% 11/15/12 (e) | | 300,000 | | 326,272 |
EnCana Holdings Finance Corp. 5.8% 5/1/14 | | 240,000 | | 253,201 |
Enterprise Products Operating LP 5.75% 3/1/35 (e) | | 300,000 | | 286,865 |
Foundation Pennsylvania Coal Co. 7.25% 8/1/14 | | 50,000 | | 52,750 |
Nonconvertible Bonds - continued |
| Principal Amount | | Value (Note 1) |
ENERGY - continued |
Oil, Gas & Consumable Fuels - continued |
General Maritime Corp. 10% 3/15/13 | | $ 310,000 | | $ 338,675 |
Giant Industries, Inc. 8% 5/15/14 | | 130,000 | | 136,175 |
Hurricane Finance BV: | | | | |
9.625% 2/12/10 (e) | | 25,000 | | 27,438 |
9.625% 2/12/10 (Reg. S) | | 35,000 | | 38,413 |
Kinder Morgan Energy Partners LP 5.8% 3/15/35 | | 300,000 | | 298,296 |
Markwest Energy Partners LP/ Markwest Energy Finance Corp. 6.875% 11/1/14 (e) | | 146,000 | | 147,460 |
Massey Energy Co. 6.625% 11/15/10 | | 40,000 | | 41,200 |
Newfield Exploration Co. 6.625% 9/1/14 | | 90,000 | | 94,275 |
Nexen, Inc. 5.875% 3/10/35 | | 600,000 | | 595,049 |
OAO Gazprom: | | | | |
9.625% 3/1/13 | | 240,000 | | 291,600 |
10.5% 10/21/09 | | 90,000 | | 106,650 |
Overseas Shipholding Group, Inc.: | | | | |
7.5% 2/15/24 | | 55,000 | | 53,350 |
8.25% 3/15/13 | | 40,000 | | 42,600 |
Pan American Energy LLC 7.125% 10/27/09 (e) | | 100,000 | | 102,000 |
Peabody Energy Corp. 6.875% 3/15/13 | | 20,000 | | 21,150 |
Pemex Project Funding Master Trust: | | | | |
6.125% 8/15/08 | | 250,000 | | 256,250 |
6.625% 6/15/35 (e) | | 780,000 | | 752,700 |
7.375% 12/15/14 | | 500,000 | | 552,500 |
Petrobras Energia SA 9.375% 10/30/13 | | 65,000 | | 71,500 |
Range Resources Corp.: | | | | |
6.375% 3/15/15 (Reg. S) | | 90,000 | | 90,450 |
7.375% 7/15/13 | | 40,000 | | 42,600 |
Ship Finance International Ltd. 8.5% 12/15/13 | | 330,000 | | 315,975 |
Teekay Shipping Corp. 8.875% 7/15/11 | | 30,000 | | 34,350 |
The Coastal Corp.: | | | | |
6.375% 2/1/09 | | 5,000 | | 4,925 |
6.5% 6/1/08 | | 150,000 | | 149,063 |
6.7% 2/15/27 | | 65,000 | | 65,731 |
7.75% 6/15/10 | | 200,000 | | 205,750 |
Williams Co., Inc. Credit Linked Certificate Trust III 6.75% 4/15/09 (e) | | 215,000 | | 223,869 |
Williams Companies, Inc.: | | | | |
7.125% 9/1/11 | | 5,000 | | 5,450 |
7.625% 7/15/19 | | 30,000 | | 34,275 |
7.875% 9/1/21 | | 35,000 | | 40,381 |
Nonconvertible Bonds - continued |
| Principal Amount | | Value (Note 1) |
ENERGY - continued |
Oil, Gas & Consumable Fuels - continued |
Williams Companies, Inc.: - continued | | | | |
8.125% 3/15/12 | | $ 30,000 | | $ 34,650 |
8.75% 3/15/32 | | 165,000 | | 203,775 |
YPF SA: | | | | |
10% 11/2/28 | | 30,000 | | 36,300 |
yankee 9.125% 2/24/09 | | 45,000 | | 49,163 |
| | 7,611,467 |
TOTAL ENERGY | | 8,980,944 |
FINANCIALS - 6.0% |
Capital Markets - 1.5% |
Bank of New York Co., Inc.: | | | | |
3.4% 3/15/13 (i) | | 100,000 | | 96,459 |
4.25% 9/4/12 (i) | | 205,000 | | 203,356 |
Credit Suisse First Boston (USA), Inc. 4.7% 6/1/09 | | 440,000 | | 441,502 |
E*TRADE Financial Corp. 8% 6/15/11 | | 265,000 | | 279,575 |
Equinox Holdings Ltd. 9% 12/15/09 | | 90,000 | | 93,600 |
Franklin Resources, Inc. 3.7% 4/15/08 | | 1,135,000 | | 1,107,274 |
Goldman Sachs Group, Inc.: | | | | |
5.7% 9/1/12 | | 1,100,000 | | 1,147,915 |
6.6% 1/15/12 | | 500,000 | | 545,548 |
Lazard LLC 7.125% 5/15/15 (e) | | 685,000 | | 681,889 |
Legg Mason, Inc. 6.75% 7/2/08 | | 30,000 | | 31,868 |
Merrill Lynch & Co., Inc. 4.25% 2/8/10 | | 685,000 | | 672,342 |
Morgan Stanley 6.6% 4/1/12 | | 1,100,000 | | 1,199,734 |
| | 6,501,062 |
Commercial Banks - 0.7% |
Bank of America Corp. 7.4% 1/15/11 | | 780,000 | | 885,848 |
Corporacion Andina de Fomento 5.2% 5/21/13 | | 35,000 | | 35,055 |
Korea Development Bank: | | | | |
3.875% 3/2/09 | | 685,000 | | 665,324 |
4.75% 7/20/09 | | 320,000 | | 319,925 |
5.75% 9/10/13 | | 170,000 | | 178,008 |
Standard Bank London Ltd. 8.125% 9/30/09 | | 100,000 | | 104,760 |
Vimpel Communications 10% 6/16/09 (Issued by UBS Luxembourg SA for Vimpel Communications) | | 100,000 | | 107,750 |
Wachovia Bank NA 4.875% 2/1/15 | | 600,000 | | 595,542 |
Nonconvertible Bonds - continued |
| Principal Amount | | Value (Note 1) |
FINANCIALS - continued |
Commercial Banks - continued |
Wachovia Corp. 4.875% 2/15/14 | | $ 175,000 | | $ 173,732 |
Western Financial Bank 9.625% 5/15/12 | | 15,000 | | 16,500 |
| | 3,082,444 |
Consumer Finance - 0.6% |
AmeriCredit Corp. 9.25% 5/1/09 | | 65,000 | | 69,063 |
Capital One Bank 6.5% 6/13/13 | | 1,090,000 | | 1,181,679 |
Ford Motor Credit Co.: | | | | |
6.625% 6/16/08 | | 90,000 | | 90,000 |
7.375% 2/1/11 | | 1,000,000 | | 993,484 |
Household Finance Corp. 4.125% 11/16/09 | | 170,000 | | 166,008 |
Triad Acquisition Corp. 11.125% 5/1/13 (e) | | 105,000 | | 108,150 |
| | 2,608,384 |
Diversified Financial Services - 0.5% |
CCO Holdings LLC/CCO Holdings Capital Corp. 8.75% 11/15/13 | | 70,000 | | 69,475 |
Global Cash Access LLC/Global Cash Access Finance Corp. 8.75% 3/15/12 | | 105,000 | | 113,537 |
JPMorgan Chase & Co. 4.875% 3/15/14 | | 1,475,000 | | 1,458,077 |
Prime Property Funding II, Inc. 5.125% 6/1/15 (e) | | 510,000 | | 496,728 |
Refco Finance Holdings LLC/Refco Finance, Inc. 9% 8/1/12 | | 105,000 | | 113,400 |
Universal City Florida Holding Co. I/II 8.375% 5/1/10 | | 30,000 | | 31,500 |
| | 2,282,717 |
Insurance - 0.3% |
Aegon NV 4.75% 6/1/13 | | 500,000 | | 492,638 |
Marsh & McLennan Companies, Inc. 7.125% 6/15/09 | | 589,000 | | 628,114 |
UnumProvident Corp. 7.625% 3/1/11 | | 150,000 | | 158,538 |
| | 1,279,290 |
Real Estate - 1.8% |
American Real Estate Partners/American Real Estate Finance Corp.: | | | | |
7.125% 2/15/13 (e) | | 115,000 | | 115,000 |
8.125% 6/1/12 | | 85,000 | | 89,250 |
Archstone Smith Operating Trust 5.25% 5/1/15 | | 805,000 | | 803,981 |
Arden Realty LP 5.25% 3/1/15 | | 1,210,000 | | 1,186,513 |
Boston Properties, Inc. 6.25% 1/15/13 | | 365,000 | | 388,563 |
Camden Property Trust 5.875% 11/30/12 | | 200,000 | | 205,950 |
CarrAmerica Realty Corp. 5.25% 11/30/07 | | 200,000 | | 201,021 |
CB Richard Ellis Services, Inc. 9.75% 5/15/10 | | 10,000 | | 11,100 |
Nonconvertible Bonds - continued |
| Principal Amount | | Value (Note 1) |
FINANCIALS - continued |
Real Estate - continued |
Developers Diversified Realty Corp.: | | | | |
5% 5/3/10 | | $ 350,000 | | $ 348,525 |
5.25% 4/15/11 | | 205,000 | | 206,077 |
EOP Operating LP: | | | | |
4.65% 10/1/10 | | 595,000 | | 583,725 |
4.75% 3/15/14 | | 135,000 | | 130,848 |
7% 7/15/11 | | 500,000 | | 549,080 |
Gables Realty LP: | | | | |
5% 3/15/10 | | 105,000 | | 102,820 |
5.75% 7/15/07 | | 970,000 | | 985,739 |
Healthcare Realty Trust, Inc. 5.125% 4/1/14 | | 145,000 | | 140,084 |
La Quinta Properties, Inc. 7% 8/15/12 | | 50,000 | | 51,938 |
MeriStar Hospitality Corp. 8.75% 8/15/07 | | 50,000 | | 50,000 |
MeriStar Hospitality Operating Partnership LP/MeriStar Hospitality Finance Corp. II 10.5% 6/15/09 | | 100,000 | | 106,500 |
Omega Healthcare Investors, Inc. 7% 4/1/14 | | 70,000 | | 71,225 |
Senior Housing Properties Trust 7.875% 4/15/15 | | 20,000 | | 21,550 |
Simon Property Group LP: | | | | |
5.1% 6/15/15 (e) | | 485,000 | | 477,725 |
5.625% 8/15/14 | | 1,000,000 | | 1,024,214 |
Ventas Realty LP/Ventas Capital Corp. 6.625% 10/15/14 (e) | | 60,000 | | 61,500 |
| | 7,912,928 |
Thrifts & Mortgage Finance - 0.6% |
Countrywide Home Loans, Inc. 4% 3/22/11 | | 415,000 | | 394,901 |
Independence Community Bank Corp. 3.75% 4/1/14 (i) | | 120,000 | | 115,358 |
Residential Capital Corp. 6.375% 6/30/10 (e) | | 685,000 | | 695,810 |
Washington Mutual, Inc. 4.375% 1/15/08 | | 1,200,000 | | 1,194,078 |
| | 2,400,147 |
TOTAL FINANCIALS | | 26,066,972 |
HEALTH CARE - 0.4% |
Health Care Equipment & Supplies - 0.0% |
Medical Device Manufacturing, Inc. 10% 7/15/12 | | 50,000 | | 53,750 |
PerkinElmer, Inc. 8.875% 1/15/13 | | 20,000 | | 22,300 |
Spheris, Inc. 11% 12/15/12 (e) | | 50,000 | | 48,500 |
| | 124,550 |
Nonconvertible Bonds - continued |
| Principal Amount | | Value (Note 1) |
HEALTH CARE - continued |
Health Care Providers & Services - 0.3% |
AmeriPath, Inc. 10.5% 4/1/13 | | $ 80,000 | | $ 80,800 |
AMR HoldCo, Inc./ EmCare HoldCo, Inc. 10% 2/15/15 (e) | | 60,000 | | 64,200 |
Community Health Systems, Inc. 6.5% 12/15/12 | | 80,000 | | 81,000 |
Concentra Operating Corp.: | | | | |
9.125% 6/1/12 | | 10,000 | | 10,600 |
9.5% 8/15/10 | | 110,000 | | 117,150 |
DaVita, Inc.: | | | | |
6.625% 3/15/13 (e) | | 40,000 | | 41,400 |
7.25% 3/15/15 (e) | | 265,000 | | 274,275 |
HealthSouth Corp.: | | | | |
7.625% 6/1/12 | | 130,000 | | 127,400 |
8.5% 2/1/08 | | 85,000 | | 86,063 |
IASIS Healthcare LLC/IASIS Capital Corp. 8.75% 6/15/14 | | 100,000 | | 108,500 |
Psychiatric Solutions, Inc. 7.75% 7/15/15 (e) | | 50,000 | | 51,250 |
Rural/Metro Corp. 9.875% 3/15/15 (e) | | 30,000 | | 30,150 |
Tenet Healthcare Corp.: | | | | |
6.375% 12/1/11 | | 75,000 | | 71,063 |
6.5% 6/1/12 | | 15,000 | | 14,250 |
7.375% 2/1/13 | | 75,000 | | 72,938 |
U.S. Oncology, Inc.: | | | | |
9% 8/15/12 | | 30,000 | | 32,775 |
10.75% 8/15/14 | | 80,000 | | 90,000 |
| | 1,353,814 |
Pharmaceuticals - 0.1% |
CDRV Investors, Inc. 0% 1/1/15 (c) | | 100,000 | | 49,500 |
Elan Finance PLC/Elan Finance Corp. 7.75% 11/15/11 (e) | | 50,000 | | 43,000 |
Mylan Laboratories, Inc. 6.375% 8/15/15 (e) | | 60,000 | | 60,150 |
VWR International, Inc.: | | | | |
6.875% 4/15/12 | | 30,000 | | 29,625 |
8% 4/15/14 | | 30,000 | | 28,800 |
Warner Chilcott Corp. 8.75% 2/1/15 (e) | | 80,000 | | 79,600 |
| | 290,675 |
TOTAL HEALTH CARE | | 1,769,039 |
Nonconvertible Bonds - continued |
| Principal Amount | | Value (Note 1) |
INDUSTRIALS - 1.6% |
Aerospace & Defense - 0.3% |
BAE Systems Holdings, Inc. 4.75% 8/15/10 (e) | | $ 525,000 | | $ 520,787 |
BE Aerospace, Inc. 8.5% 10/1/10 | | 100,000 | | 110,500 |
Bombardier, Inc. 6.3% 5/1/14 (e) | | 340,000 | | 319,600 |
K & F Acquisition, Inc. 7.75% 11/15/14 | | 40,000 | | 41,000 |
Orbital Sciences Corp. 9% 7/15/11 | | 135,000 | | 146,475 |
| | 1,138,362 |
Airlines - 0.7% |
American Airlines, Inc. pass thru trust certificates: | | | | |
6.817% 5/23/11 | | 50,000 | | 47,875 |
6.855% 10/15/10 | | 67,869 | | 69,821 |
6.977% 11/23/22 | | 10,708 | | 9,985 |
6.978% 10/1/12 | | 137,745 | | 143,199 |
7.024% 4/15/11 | | 365,000 | | 379,361 |
7.377% 5/23/19 | | 46,728 | | 35,046 |
7.379% 5/23/16 | | 45,678 | | 34,259 |
7.8% 4/1/08 | | 65,000 | | 62,725 |
AMR Corp. 9% 8/1/12 | | 85,000 | | 68,000 |
Continental Airlines, Inc. pass thru trust certificates: | | | | |
6.648% 3/15/19 | | 360,532 | | 355,257 |
6.795% 2/2/20 | | 478,190 | | 411,244 |
Delta Air Lines, Inc.: | | | | |
7.9% 12/15/09 | | 50,000 | | 13,500 |
9.5% 11/18/08 (e) | | 61,000 | | 48,800 |
Delta Air Lines, Inc. pass thru trust certificates: | | | | |
7.111% 3/18/13 | | 340,000 | | 318,750 |
7.299% 9/18/06 | | 1,000 | | 440 |
7.57% 11/18/10 | | 705,000 | | 655,613 |
7.779% 11/18/05 | | 3,000 | | 1,800 |
7.779% 1/2/12 | | 22,350 | | 9,834 |
7.92% 5/18/12 | | 135,000 | | 79,650 |
Northwest Airlines, Inc.: | | | | |
7.875% 3/15/08 | | 25,000 | | 10,875 |
9.875% 3/15/07 | | 60,000 | | 31,200 |
Northwest Airlines, Inc. pass thru trust certificates: | | | | |
7.068% 7/2/17 | | 7,800 | | 5,304 |
7.626% 4/1/10 | | 32,062 | | 18,276 |
7.67% 1/2/15 | | 8,270 | | 5,872 |
| | 2,816,686 |
Nonconvertible Bonds - continued |
| Principal Amount | | Value (Note 1) |
INDUSTRIALS - continued |
Building Products - 0.0% |
Jacuzzi Brands, Inc. 9.625% 7/1/10 | | $ 20,000 | | $ 22,000 |
Nortek, Inc. 8.5% 9/1/14 | | 100,000 | | 97,000 |
| | 119,000 |
Commercial Services & Supplies - 0.1% |
Adesa, Inc. 7.625% 6/15/12 | | 50,000 | | 51,000 |
ALH Finance LLC/ALH Finance Corp. 8.5% 1/15/13 | | 25,000 | | 24,125 |
Allied Waste North America, Inc.: | | | | |
5.75% 2/15/11 | | 70,000 | | 66,150 |
7.875% 4/15/13 | | 20,000 | | 20,724 |
Buhrmann US, Inc. 7.875% 3/1/15 (e) | | 50,000 | | 49,375 |
Cenveo Corp. 7.875% 12/1/13 | | 60,000 | | 57,900 |
FTI Consulting, Inc. 7.625% 6/15/13 (e) | | 30,000 | | 30,450 |
| | 299,724 |
Electrical Equipment - 0.0% |
General Cable Corp. 9.5% 11/15/10 | | 20,000 | | 21,400 |
Sensus Metering Systems, Inc. 8.625% 12/15/13 | | 20,000 | | 18,700 |
| | 40,100 |
Industrial Conglomerates - 0.2% |
Hutchison Whampoa International 03/13 Ltd. 6.5% 2/13/13 (e) | | 190,000 | | 202,736 |
Hutchison Whampoa International 03/33 Ltd. 7.45% 11/24/33 (e) | | 720,000 | | 835,641 |
| | 1,038,377 |
Machinery - 0.1% |
Accuride Corp. 8.5% 2/1/15 | | 80,000 | | 83,200 |
Commercial Vehicle Group, Inc. 8% 7/1/13 (e) | | 50,000 | | 52,000 |
Dresser, Inc. 9.375% 4/15/11 | | 15,000 | | 15,750 |
Invensys PLC 9.875% 3/15/11 (e) | | 245,000 | | 243,775 |
Navistar International Corp. 7.5% 6/15/11 | | 30,000 | | 30,750 |
Park-Ohio Industries, Inc. 8.375% 11/15/14 (e) | | 60,000 | | 56,400 |
Standard Aero Holdings, Inc. 8.25% 9/1/14 (e) | | 60,000 | | 63,600 |
Terex Corp. 7.375% 1/15/14 | | 100,000 | | 105,000 |
| | 650,475 |
Marine - 0.1% |
American Commercial Lines LLC/ACL Finance Corp. 9.5% 2/15/15 | | 110,000 | | 119,900 |
H-Lines Finance Holding Corp. 0% 4/1/13 (c)(e) | | 40,000 | | 32,100 |
Nonconvertible Bonds - continued |
| Principal Amount | | Value (Note 1) |
INDUSTRIALS - continued |
Marine - continued |
Horizon Lines LLC/Holdings Corp. 9% 11/1/12 (e) | | $ 40,000 | | $ 43,000 |
OMI Corp. 7.625% 12/1/13 | | 95,000 | | 96,663 |
| | 291,663 |
Road & Rail - 0.1% |
Kansas City Southern Railway Co. 7.5% 6/15/09 | | 100,000 | | 103,000 |
Progress Rail Services Corp./Progress Metal Reclamation Co. 7.75% 4/1/12 (e) | | 100,000 | | 102,250 |
TFM SA de CV 9.375% 5/1/12 (e) | | 85,000 | | 90,950 |
| | 296,200 |
Trading Companies & Distributors - 0.0% |
Ashtead Holdings PLC 8.625% 8/1/15 (e)(f) | | 75,000 | | 77,625 |
Neff Rent LLC/Neff Finance Corp. 11.25% 6/15/12 (e) | | 50,000 | | 51,750 |
| | 129,375 |
TOTAL INDUSTRIALS | | 6,819,962 |
INFORMATION TECHNOLOGY - 0.4% |
Communications Equipment - 0.1% |
L-3 Communications Corp. 6.375% 10/15/15 (e) | | 120,000 | | 121,350 |
Nortel Networks Corp. 6.125% 2/15/06 | | 65,000 | | 65,325 |
| | 186,675 |
Electronic Equipment & Instruments - 0.0% |
Celestica, Inc. 7.875% 7/1/11 | | 100,000 | | 103,250 |
IT Services - 0.1% |
Iron Mountain, Inc. 6.625% 1/1/16 | | 120,000 | | 113,400 |
SunGard Data Systems, Inc.: | | | | |
9.125% 8/15/13 (e)(f) | | 225,000 | | 233,438 |
10.25% 8/15/15 (e)(f) | | 210,000 | | 217,875 |
| | 564,713 |
Office Electronics - 0.1% |
Xerox Capital Trust I 8% 2/1/27 | | 130,000 | | 135,200 |
Xerox Corp.: | | | | |
7.125% 6/15/10 | | 20,000 | | 21,200 |
7.2% 4/1/16 | | 165,000 | | 179,850 |
7.625% 6/15/13 | | 60,000 | | 63,900 |
| | 400,150 |
Semiconductors & Semiconductor Equipment - 0.1% |
Amkor Technology, Inc. 7.75% 5/15/13 | | 65,000 | | 55,575 |
Nonconvertible Bonds - continued |
| Principal Amount | | Value (Note 1) |
INFORMATION TECHNOLOGY - continued |
Semiconductors & Semiconductor Equipment - continued |
Freescale Semiconductor, Inc. 7.125% 7/15/14 | | $ 60,000 | | $ 64,200 |
MagnaChip Semiconductor SA/MagnaChip Semiconductor Finance Co.: | | | | |
6.875% 12/15/11 (e) | | 25,000 | | 24,750 |
8% 12/15/14 (e) | | 80,000 | | 77,400 |
New ASAT Finance Ltd. 9.25% 2/1/11 | | 60,000 | | 48,600 |
Viasystems, Inc. 10.5% 1/15/11 | | 140,000 | | 137,200 |
| | 407,725 |
TOTAL INFORMATION TECHNOLOGY | | 1,662,513 |
MATERIALS - 1.3% |
Chemicals - 0.5% |
BCP Crystal U.S. Holdings Corp. 9.625% 6/15/14 | | 110,000 | | 124,300 |
Berry Plastics Corp. 10.75% 7/15/12 | | 80,000 | | 87,600 |
Borden US Finance Corp./Nova Scotia Finance ULC: | | | | |
8.3488% 7/15/10 (e)(i) | | 70,000 | | 69,300 |
9% 7/15/14 (e) | | 70,000 | | 72,100 |
Braskem SA 11.75% 1/22/14 (e) | | 25,000 | | 29,500 |
Crystal US Holding 3 LLC/Crystal US Sub 3 Corp. Series B, 0% 10/1/14 (c) | | 100,000 | | 72,000 |
Equistar Chemicals LP: | | | | |
6.5% 2/15/06 | | 75,000 | | 75,375 |
7.55% 2/15/26 | | 100,000 | | 93,500 |
Equistar Chemicals LP/Equistar Funding Corp. 10.625% 5/1/11 | | 145,000 | | 161,313 |
Georgia Gulf Corp. 7.125% 12/15/13 | | 90,000 | | 94,500 |
Huntsman International LLC 9.875% 3/1/09 | | 115,000 | | 122,906 |
Innophos, Inc. 8.875% 8/15/14 (e) | | 30,000 | | 30,825 |
Lyondell Chemical Co.: | | | | |
9.625% 5/1/07 | | 200,000 | | 212,500 |
10.875% 5/1/09 | | 55,000 | | 56,925 |
Millennium America, Inc. 9.25% 6/15/08 | | 230,000 | | 251,275 |
Nalco Co.: | | | | |
7.75% 11/15/11 | | 130,000 | | 138,450 |
8.875% 11/15/13 | | 100,000 | | 109,000 |
Pliant Corp. 0% 6/15/09 (c) | | 60,000 | | 53,400 |
Resolution Performance Products LLC/RPP Capital Corp.: | | | | |
9.5% 4/15/10 | | 70,000 | | 72,625 |
13.5% 11/15/10 | | 35,000 | | 37,800 |
Nonconvertible Bonds - continued |
| Principal Amount | | Value (Note 1) |
MATERIALS - continued |
Chemicals - continued |
Rockwood Specialties Group, Inc. 7.5% 11/15/14 (e) | | $ 50,000 | | $ 50,250 |
Solutia, Inc. 7.375% 10/15/27 (b) | | 20,000 | | 16,400 |
| | 2,031,844 |
Construction Materials - 0.0% |
Texas Industries, Inc. 7.25% 7/15/13 (e) | | 30,000 | | 31,650 |
Containers & Packaging - 0.3% |
AEP Industries, Inc. 7.875% 3/15/13 (e) | | 30,000 | | 30,000 |
BWAY Corp. 10% 10/15/10 | | 105,000 | | 111,300 |
Crown Cork & Seal, Inc. 8% 4/15/23 | | 105,000 | | 105,000 |
Crown European Holdings SA 9.5% 3/1/11 | | 35,000 | | 38,588 |
Graham Packaging Co. LP/ GPC Capital Corp.: | | | | |
8.5% 10/15/12 (e) | | 50,000 | | 51,250 |
9.875% 10/15/14 (e) | | 95,000 | | 97,375 |
Graphic Packaging International, Inc.: | | | | |
8.5% 8/15/11 | | 120,000 | | 125,400 |
9.5% 8/15/13 | | 170,000 | | 175,100 |
Jefferson Smurfit Corp. U.S. 7.5% 6/1/13 | | 15,000 | | 14,381 |
Owens-Brockway Glass Container, Inc.: | | | | |
8.25% 5/15/13 | | 15,000 | | 16,238 |
8.875% 2/15/09 | | 50,000 | | 52,875 |
Owens-Illinois, Inc.: | | | | |
7.35% 5/15/08 | | 50,000 | | 52,125 |
7.5% 5/15/10 | | 95,000 | | 99,156 |
7.8% 5/15/18 | | 45,000 | | 46,800 |
8.1% 5/15/07 | | 110,000 | | 114,400 |
Tekni-Plex, Inc. 10.875% 8/15/12 (e) | | 40,000 | | 43,100 |
| | 1,173,088 |
Metals & Mining - 0.3% |
Aleris International, Inc. 9% 11/15/14 | | 20,000 | | 20,900 |
California Steel Industries, Inc. 6.125% 3/15/14 | | 40,000 | | 37,200 |
Century Aluminum Co. 7.5% 8/15/14 | | 40,000 | | 41,000 |
Corporacion Nacional del Cobre (Codelco) 6.375% 11/30/12 (e) | | 335,000 | | 362,849 |
CSN Islands VIII Corp. 9.75% 12/16/13 (e) | | 25,000 | | 26,563 |
Freeport-McMoRan Copper & Gold, Inc.: | | | | |
6.875% 2/1/14 | | 75,000 | | 73,969 |
10.125% 2/1/10 | | 45,000 | | 50,063 |
Gerdau AmeriSteel Corp./GUSAP Partners 10.375% 7/15/11 | | 50,000 | | 55,250 |
Nonconvertible Bonds - continued |
| Principal Amount | | Value (Note 1) |
MATERIALS - continued |
Metals & Mining - continued |
Newmont Mining Corp. 5.875% 4/1/35 | | $ 405,000 | | $ 407,120 |
Novelis, Inc. 7.25% 2/15/15 (e) | | 110,000 | | 112,200 |
Wise Metals Group LLC/Alloys Finance 10.25% 5/15/12 | | 110,000 | | 103,400 |
| | 1,290,514 |
Paper & Forest Products - 0.2% |
Boise Cascade Corp. 8% 2/24/06 | | 25,000 | | 25,625 |
Boise Cascade LLC/Boise Cascade Finance Corp.: | | | | |
6.4738% 10/15/12 (i) | | 30,000 | | 30,300 |
7.125% 10/15/14 | | 30,000 | | 29,475 |
Buckeye Technologies, Inc. 8.5% 10/1/13 | | 200,000 | | 204,250 |
Georgia-Pacific Corp.: | | | | |
7.375% 12/1/25 | | 15,000 | | 16,219 |
7.5% 5/15/06 | | 50,000 | | 51,125 |
7.75% 11/15/29 | | 10,000 | | 11,200 |
8% 1/15/24 | | 130,000 | | 149,175 |
8.125% 5/15/11 | | 5,000 | | 5,594 |
Millar Western Forest Products Ltd. 7.75% 11/15/13 | | 120,000 | | 113,400 |
Norske Skog Canada Ltd. 7.375% 3/1/14 | | 40,000 | | 39,700 |
Solo Cup Co. 8.5% 2/15/14 | | 145,000 | | 138,838 |
Stone Container Corp. 8.375% 7/1/12 | | 200,000 | | 202,500 |
| | 1,017,401 |
TOTAL MATERIALS | | 5,544,497 |
TELECOMMUNICATION SERVICES - 2.6% |
Diversified Telecommunication Services - 2.0% |
Ameritech Capital Funding Corp. 6.25% 5/18/09 | | 35,000 | | 36,726 |
BellSouth Capital Funding Corp. 7.875% 2/15/30 | | 1,800,000 | | 2,284,409 |
British Telecommunications PLC: | | | | |
8.375% 12/15/10 | | 190,000 | | 222,019 |
8.875% 12/15/30 | | 145,000 | | 203,483 |
Empresa Brasileira de Telecomm SA 11% 12/15/08 | | 158,000 | | 178,540 |
Eschelon Operating Co. 8.375% 3/15/10 | | 70,000 | | 64,400 |
GCI, Inc. 7.25% 2/15/14 | | 50,000 | | 48,750 |
Koninklijke KPN NV yankee 8% 10/1/10 | | 500,000 | | 570,223 |
MCI, Inc. 7.688% 5/1/09 | | 36,000 | | 37,530 |
New Skies Satellites BV: | | | | |
8.5388% 11/1/11 (i) | | 100,000 | | 104,000 |
9.125% 11/1/12 | | 85,000 | | 88,400 |
Nonconvertible Bonds - continued |
| Principal Amount | | Value (Note 1) |
TELECOMMUNICATION SERVICES - continued |
Diversified Telecommunication Services - continued |
NTL Cable PLC 8.75% 4/15/14 | | $ 190,000 | | $ 202,350 |
Qwest Capital Funding, Inc.: | | | | |
7% 8/3/09 | | 50,000 | | 48,750 |
7.25% 2/15/11 | | 35,000 | | 33,775 |
7.625% 8/3/21 | | 20,000 | | 18,000 |
Qwest Communications International, Inc.: | | | | |
6.7681% 2/15/09 (i) | | 40,000 | | 40,100 |
7.5% 2/15/14 (e) | | 60,000 | | 57,600 |
7.5% 2/15/14 | | 160,000 | | 154,400 |
Qwest Corp.: | | | | |
6.6706% 6/15/13 (e)(i) | | 90,000 | | 93,825 |
7.625% 6/15/15 (e) | | 110,000 | | 113,163 |
Qwest Services Corp.: | | | | |
13.5% 12/15/10 | | 20,000 | | 23,000 |
14% 12/15/14 | | 110,000 | | 133,100 |
SBC Communications, Inc.: | | | | |
6.15% 9/15/34 | | 500,000 | | 531,455 |
6.45% 6/15/34 | | 220,000 | | 242,412 |
Sprint Capital Corp. 8.375% 3/15/12 | | 600,000 | | 711,574 |
Telecom Italia Capital: | | | | |
4.95% 9/30/14 (e) | | 415,000 | | 406,778 |
6% 9/30/34 (e) | | 500,000 | | 507,292 |
Telefonica de Argentina SA 9.125% 11/7/10 | | 95,000 | | 103,075 |
Telefonos de Mexico SA de CV 4.75% 1/27/10 (e) | | 90,000 | | 88,786 |
Telenet Group Holding NV 0% 6/15/14 (c)(e) | | 80,000 | | 64,000 |
TELUS Corp. yankee 7.5% 6/1/07 | | 180,000 | | 189,293 |
Time Warner Telecom Holdings, Inc. 9.25% 2/15/14 (e) | | 80,000 | | 81,600 |
U.S. West Capital Funding, Inc. 6.375% 7/15/08 | | 125,000 | | 122,500 |
U.S. West Communications 6.875% 9/15/33 | | 165,000 | | 141,900 |
Verizon Global Funding Corp. 7.25% 12/1/10 | | 360,000 | | 401,070 |
Verizon New York, Inc. 6.875% 4/1/12 | | 120,000 | | 130,733 |
| | 8,479,011 |
Wireless Telecommunication Services - 0.6% |
America Movil SA de CV 4.125% 3/1/09 | | 285,000 | | 276,459 |
American Tower Corp. 7.5% 5/1/12 | | 105,000 | | 112,088 |
AT&T Wireless Services, Inc. 7.875% 3/1/11 | | 455,000 | | 521,200 |
Centennial Communications Corp./Centennial Cellular Operating Co. LLC/Centennial Puerto Rico Operations Corp. 8.125% 2/1/14 (i) | | 60,000 | | 64,350 |
Nonconvertible Bonds - continued |
| Principal Amount | | Value (Note 1) |
TELECOMMUNICATION SERVICES - continued |
Wireless Telecommunication Services - continued |
DirecTV Holdings LLC/DirecTV Financing, Inc.: | | | | |
6.375% 6/15/15 (e) | | $ 30,000 | | $ 29,925 |
8.375% 3/15/13 | | 33,000 | | 36,548 |
Globe Telecom, Inc. 9.75% 4/15/12 | | 30,000 | | 32,625 |
Inmarsat Finance II PLC 0% 11/15/12 (c) | | 70,000 | | 56,000 |
Inmarsat Finance PLC 7.625% 6/30/12 | | 45,438 | | 48,107 |
Intelsat Ltd.: | | | | |
6.5% 11/1/13 | | 40,000 | | 32,550 |
7.625% 4/15/12 | | 20,000 | | 17,800 |
8.625% 1/15/15 (e) | | 195,000 | | 208,650 |
Kyivstar GSM 10.375% 8/17/09 (e) | | 100,000 | | 111,630 |
Millicom International Cellular SA 10% 12/1/13 | | 140,000 | | 145,250 |
Mobile Telesystems Finance SA: | | | | |
8% 1/28/12 (e) | | 60,000 | | 61,500 |
8.375% 10/14/10 (e) | | 170,000 | | 178,075 |
Nextel Communications, Inc. 7.375% 8/1/15 | | 150,000 | | 161,250 |
Nextel Partners, Inc. 8.125% 7/1/11 | | 85,000 | | 92,650 |
Rogers Communications, Inc.: | | | | |
6.375% 3/1/14 | | 140,000 | | 142,800 |
8% 12/15/12 | | 105,000 | | 113,269 |
9.625% 5/1/11 | | 26,000 | | 30,615 |
Rural Cellular Corp. 8.25% 3/15/12 | | 60,000 | | 63,600 |
Telemig Cellular SA/Amazonia Cellular SA 8.75% 1/20/09 (e) | | 31,000 | | 32,085 |
Western Wireless Corp. 9.25% 7/15/13 | | 175,000 | | 199,500 |
| | 2,768,526 |
TOTAL TELECOMMUNICATION SERVICES | | 11,247,537 |
UTILITIES - 2.4% |
Electric Utilities - 1.2% |
AES Gener SA 7.5% 3/25/14 | | 70,000 | | 72,275 |
Cleveland Electric Illuminating Co. 5.65% 12/15/13 | | 300,000 | | 309,783 |
Duke Capital LLC 6.75% 2/15/32 | | 1,400,000 | | 1,559,447 |
Exelon Corp.: | | | | |
4.9% 6/15/15 | | 485,000 | | 475,903 |
5.625% 6/15/35 | | 90,000 | | 88,598 |
6.75% 5/1/11 | | 420,000 | | 458,365 |
FirstEnergy Corp. 6.45% 11/15/11 | | 155,000 | | 166,683 |
Nonconvertible Bonds - continued |
| Principal Amount | | Value (Note 1) |
UTILITIES - continued |
Electric Utilities - continued |
MSW Energy Holdings II LLC/MSW Finance Co. II, Inc. 7.375% 9/1/10 | | $ 40,000 | | $ 41,600 |
MSW Energy Holdings LLC/MSW Energy Finance Co., Inc. 8.5% 9/1/10 | | 10,000 | | 10,750 |
Nevada Power Co.: | | | | |
5.875% 1/15/15 (e) | | 40,000 | | 40,700 |
6.5% 4/15/12 | | 50,000 | | 52,500 |
Oncor Electric Delivery Co. 6.375% 5/1/12 | | 45,000 | | 48,651 |
Progress Energy, Inc. 7.1% 3/1/11 | | 950,000 | | 1,043,885 |
Sierra Pacific Resources 7.803% 6/15/12 | | 40,000 | | 42,800 |
TECO Energy, Inc. 7% 5/1/12 | | 80,000 | | 86,000 |
Texas Genco LLC/Texas Genco Financing Corp. 6.875% 12/15/14 (e) | | 125,000 | | 131,250 |
TXU Energy Co. LLC 7% 3/15/13 | | 480,000 | | 531,063 |
| | 5,160,253 |
Gas Utilities - 0.0% |
Colorado Interstate Gas Co. 5.95% 3/15/15 (e) | | 60,000 | | 59,550 |
El Paso Energy Corp. 6.75% 5/15/09 | | 25,000 | | 25,094 |
Sonat, Inc.: | | | | |
6.625% 2/1/08 | | 20,000 | | 20,025 |
6.75% 10/1/07 | | 15,000 | | 15,038 |
| | 119,707 |
Independent Power Producers & Energy Traders - 0.6% |
AES Corp.: | | | | |
8.75% 6/15/08 | | 2,000 | | 2,150 |
8.75% 5/15/13 (e) | | 35,000 | | 38,763 |
8.875% 2/15/11 | | 282,000 | | 312,315 |
9% 5/15/15 (e) | | 25,000 | | 27,938 |
9.375% 9/15/10 | | 7,000 | | 7,875 |
9.5% 6/1/09 | | 19,000 | | 21,066 |
Allegheny Energy Supply Co. LLC: | | | | |
7.8% 3/15/11 | | 170,000 | | 186,150 |
8.25% 4/15/12 (e) | | 90,000 | | 101,250 |
10.25% 11/15/07 (e) | | 26,657 | | 28,990 |
13% 11/15/07 (e)(i) | | 3,339 | | 3,673 |
Constellation Energy Group, Inc. 7% 4/1/12 | | 1,050,000 | | 1,163,003 |
NRG Energy, Inc. 8% 12/15/13 | | 172,000 | | 184,040 |
Nonconvertible Bonds - continued |
| Principal Amount | | Value (Note 1) |
UTILITIES - continued |
Independent Power Producers & Energy Traders - continued |
Tenaska Alabama Partners LP 7% 6/30/21 (e) | | $ 100,000 | | $ 102,750 |
TXU Corp. 5.55% 11/15/14 (e) | | 250,000 | | 243,719 |
| | 2,423,682 |
Multi-Utilities - 0.6% |
CMS Energy Corp.: | | | | |
6.3% 2/1/12 | | 60,000 | | 60,675 |
8.5% 4/15/11 | | 45,000 | | 50,231 |
9.875% 10/15/07 | | 135,000 | | 147,825 |
Dominion Resources, Inc.: | | | | |
4.75% 12/15/10 | | 535,000 | | 531,322 |
5.15% 7/15/15 | | 500,000 | | 497,526 |
5.95% 6/15/35 | | 905,000 | | 924,867 |
6.25% 6/30/12 | | 270,000 | | 288,619 |
Utilicorp Canada Finance Corp. 7.75% 6/15/11 | | 105,000 | | 109,463 |
| | 2,610,528 |
TOTAL UTILITIES | | 10,314,170 |
TOTAL NONCONVERTIBLE BONDS (Cost $92,844,009) | 94,038,947 |
U.S. Government and Government Agency Obligations - 30.4% |
|
U.S. Government Agency Obligations - 4.0% |
Fannie Mae: | | | | |
3.25% 1/15/08 | | 8,000,000 | | 7,812,344 |
4.375% 7/17/13 | | 2,205,000 | | 2,143,699 |
4.625% 5/1/13 | | 5,000,000 | | 4,944,360 |
Federal Home Loan Bank 3.75% 9/28/06 | | 40,000 | | 39,762 |
Freddie Mac: | | | | |
5.25% 11/5/12 | | 280,000 | | 279,761 |
5.875% 3/21/11 | | 2,095,000 | | 2,221,337 |
TOTAL U.S. GOVERNMENT AGENCY OBLIGATIONS | | 17,441,263 |
U.S. Treasury Inflation Protected Obligations - 4.6% |
U.S. Treasury Inflation-Indexed Bonds 2.375% 1/15/25 | | 4,434,805 | | 4,682,155 |
U.S. Government and Government Agency Obligations - continued |
| Principal Amount | | Value (Note 1) |
U.S. Treasury Inflation Protected Obligations - continued |
U.S. Treasury Inflation-Indexed Notes: | | | | |
0.875% 4/15/10 | | $ 3,078,570 | | $ 2,957,553 |
2% 1/15/14 | | 11,889,069 | | 12,019,436 |
TOTAL U.S. TREASURY INFLATION PROTECTED OBLIGATIONS | | 19,659,144 |
U.S. Treasury Obligations - 21.8% |
U.S. Treasury Bonds 6.25% 5/15/30 | | 7,720,000 | | 9,703,677 |
U.S. Treasury Notes: | | | | |
3.125% 1/31/07 | | 40,160,000 | | 39,661,094 |
3.375% 10/15/09 | | 1,000,000 | | 970,273 |
3.625% 4/30/07 | | 7,808,000 | | 7,757,373 |
3.625% 6/30/07 (f) | | 7,111,000 | | 7,059,609 |
4.25% 8/15/13 | | 10,049,000 | | 10,061,561 |
4.75% 5/15/14 | | 15,855,000 | | 16,408,688 |
6.5% 2/15/10 | | 2,170,000 | | 2,378,609 |
TOTAL U.S. TREASURY OBLIGATIONS | | 94,000,884 |
TOTAL U.S. GOVERNMENT AND GOVERNMENT AGENCY OBLIGATIONS (Cost $131,105,466) | 131,101,291 |
U.S. Government Agency - Mortgage Securities - 25.3% |
|
Fannie Mae - 24.2% |
3.463% 4/1/34 (i) | | 155,188 | | 154,598 |
3.734% 1/1/35 (i) | | 81,020 | | 80,197 |
3.753% 10/1/33 (i) | | 57,513 | | 56,675 |
3.786% 12/1/34 (i) | | 67,601 | | 66,855 |
3.793% 6/1/34 (i) | | 269,511 | | 263,211 |
3.801% 12/1/34 (i) | | 21,120 | | 20,923 |
3.828% 1/1/35 (i) | | 64,725 | | 64,163 |
3.838% 1/1/35 (i) | | 160,045 | | 159,402 |
3.867% 1/1/35 (i) | | 90,198 | | 89,698 |
3.913% 12/1/34 (i) | | 44,713 | | 44,363 |
3.937% 10/1/34 (i) | | 60,034 | | 59,588 |
3.937% 12/1/34 (i) | | 92,940 | | 92,473 |
3.963% 1/1/35 (i) | | 125,373 | | 124,133 |
3.97% 5/1/33 (i) | | 15,574 | | 15,481 |
3.975% 1/1/35 (i) | | 64,173 | | 63,554 |
3.981% 12/1/34 (i) | | 65,505 | | 64,819 |
U.S. Government Agency - Mortgage Securities - continued |
| Principal Amount | | Value (Note 1) |
Fannie Mae - continued |
4% 8/1/20 (f) | | $ 2,895,592 | | $ 2,792,437 |
4.008% 12/1/34 (i) | | 373,367 | | 372,610 |
4.011% 1/1/35 (i) | | 43,259 | | 42,826 |
4.014% 12/1/34 (i) | | 43,068 | | 42,611 |
4.023% 2/1/35 (i) | | 47,859 | | 47,446 |
4.03% 1/1/35 (i) | | 23,990 | | 23,874 |
4.032% 12/1/34 (i) | | 43,840 | | 43,751 |
4.045% 5/1/34 (i) | | 25,362 | | 25,346 |
4.049% 2/1/35 (i) | | 45,038 | | 44,699 |
4.053% 10/1/18 (i) | | 61,942 | | 61,329 |
4.054% 1/1/35 (i) | | 44,950 | | 44,529 |
4.079% 4/1/33 (i) | | 18,339 | | 18,311 |
4.098% 1/1/35 (i) | | 90,941 | | 91,282 |
4.104% 2/1/35 (i) | | 46,625 | | 46,397 |
4.11% 2/1/35 (i) | | 46,488 | | 46,325 |
4.117% 2/1/35 (i) | | 91,838 | | 91,479 |
4.118% 1/1/35 (i) | | 102,744 | | 102,288 |
4.121% 2/1/35 (i) | | 183,102 | | 182,253 |
4.124% 1/1/35 (i) | | 110,266 | | 110,771 |
4.137% 1/1/35 (i) | | 177,027 | | 176,326 |
4.138% 2/1/35 (i) | | 112,865 | | 113,284 |
4.144% 1/1/35 (i) | | 165,216 | | 165,989 |
4.15% 11/1/34 (i) | | 83,645 | | 83,189 |
4.154% 2/1/35 (i) | | 93,461 | | 93,188 |
4.178% 1/1/35 (i) | | 188,993 | | 190,793 |
4.183% 1/1/35 (i) | | 90,084 | | 89,998 |
4.189% 11/1/34 (i) | | 34,835 | | 34,773 |
4.197% 1/1/35 (i) | | 115,561 | | 114,805 |
4.232% 3/1/34 (i) | | 56,248 | | 56,058 |
4.25% 2/1/35 (i) | | 72,107 | | 71,699 |
4.258% 10/1/34 (i) | | 149,869 | | 150,753 |
4.293% 3/1/35 (i) | | 69,874 | | 69,865 |
4.297% 7/1/34 (i) | | 57,200 | | 57,342 |
4.302% 1/1/35 (i) | | 71,234 | | 70,795 |
4.306% 8/1/33 (i) | | 123,209 | | 122,720 |
4.315% 3/1/33 (i) | | 31,176 | | 31,109 |
4.323% 5/1/35 (i) | | 91,219 | | 91,093 |
4.332% 12/1/34 (i) | | 46,562 | | 46,607 |
4.335% 2/1/35 (i) | | 45,626 | | 45,509 |
4.349% 1/1/35 (i) | | 68,741 | | 68,129 |
4.351% 1/1/35 (i) | | 70,501 | | 70,245 |
U.S. Government Agency - Mortgage Securities - continued |
| Principal Amount | | Value (Note 1) |
Fannie Mae - continued |
4.367% 2/1/34 (i) | | $ 150,340 | | $ 149,954 |
4.372% 4/1/35 (i) | | 47,281 | | 47,200 |
4.401% 2/1/35 (i) | | 95,631 | | 94,944 |
4.409% 5/1/35 (i) | | 183,454 | | 183,539 |
4.451% 6/1/33 (i) | | 46,276 | | 45,765 |
4.455% 3/1/35 (i) | | 73,725 | | 73,083 |
4.467% 10/1/34 (i) | | 325,088 | | 325,221 |
4.479% 4/1/34 (i) | | 114,089 | | 114,254 |
4.489% 8/1/34 (i) | | 201,750 | | 201,656 |
4.5% 5/1/18 to 4/1/35 | | 22,521,980 | | 21,921,930 |
4.5% 8/1/20 (f) | | 3,000,000 | | 2,950,313 |
4.5% 3/1/35 (i) | | 194,189 | | 193,523 |
4.508% 1/1/35 (i) | | 108,887 | | 109,522 |
4.528% 12/1/34 (i) | | 437,452 | | 435,753 |
4.529% 3/1/35 (i) | | 170,779 | | 170,085 |
4.538% 8/1/34 (i) | | 112,544 | | 113,173 |
4.554% 7/1/35 (i) | | 225,000 | | 225,105 |
4.564% 2/1/35 (i) | | 429,539 | | 430,042 |
4.57% 2/1/35 (i) | | 63,371 | | 63,565 |
4.604% 1/1/33 (i) | | 349,267 | | 350,263 |
4.619% 2/1/35 (i) | | 183,580 | | 182,913 |
4.645% 2/1/35 (i) | | 64,103 | | 64,462 |
4.649% 11/1/34 (i) | | 220,719 | | 221,205 |
4.687% 11/1/34 (i) | | 204,340 | | 204,606 |
4.714% 3/1/35 (i) | | 521,050 | | 523,150 |
4.74% 7/1/34 (i) | | 198,906 | | 197,588 |
4.741% 3/1/35 (i) | | 94,718 | | 94,718 |
4.823% 12/1/34 (i) | | 184,753 | | 185,403 |
4.847% 12/1/34 (i) | | 67,829 | | 68,031 |
4.898% 10/1/34 (i) | | 142,962 | | 143,698 |
5% 3/1/35 to 8/1/35 | | 20,610,101 | | 20,304,630 |
5% 8/1/35 (f) | | 9,875,320 | | 9,724,104 |
5.123% 2/1/35 (i) | | 544,160 | | 543,205 |
5.137% 5/1/35 (i) | | 93,312 | | 93,440 |
5.204% 6/1/35 (i) | | 321,987 | | 326,202 |
5.366% 12/1/32 (i) | | 91,997 | | 93,032 |
5.5% 11/1/16 to 10/1/34 | | 5,196,795 | | 5,234,994 |
5.5% 8/1/35 (f) | | 18,607,798 | | 18,712,467 |
5.817% 5/1/35 (i) | | 435,730 | | 440,363 |
6% 7/1/08 to 3/1/33 | | 8,513,123 | | 8,757,925 |
U.S. Government Agency - Mortgage Securities - continued |
| Principal Amount | | Value (Note 1) |
Fannie Mae - continued |
6.5% 6/1/09 to 1/1/33 | | $ 2,320,425 | | $ 2,407,535 |
7% 9/1/25 to 8/1/29 | | 301,767 | | 318,457 |
TOTAL FANNIE MAE | | 104,705,984 |
Freddie Mac - 1.0% |
4.106% 12/1/34 (i) | | 65,639 | | 65,241 |
4.13% 12/1/34 (i) | | 109,099 | | 108,600 |
4.223% 1/1/35 (i) | | 280,789 | | 279,777 |
4.287% 1/1/35 (i) | | 255,358 | | 255,371 |
4.3% 5/1/35 (i) | | 168,933 | | 168,068 |
4.311% 12/1/34 (i) | | 94,658 | | 94,086 |
4.312% 3/1/35 (i) | | 90,473 | | 90,187 |
4.368% 3/1/35 (i) | | 123,047 | | 121,663 |
4.4% 2/1/35 (i) | | 170,490 | | 168,625 |
4.404% 2/1/35 (i) | | 191,748 | | 191,238 |
4.446% 3/1/35 (i) | | 73,623 | | 72,777 |
4.449% 2/1/34 (i) | | 100,426 | | 100,004 |
4.49% 3/1/35 (i) | | 242,950 | | 240,824 |
4.497% 6/1/35 (i) | | 98,241 | | 98,169 |
4.498% 3/1/35 (i) | | 610,000 | | 605,997 |
4.504% 3/1/35 (i) | | 98,043 | | 97,078 |
4.565% 2/1/35 (i) | | 141,902 | | 142,091 |
5.036% 4/1/35 (i) | | 525,511 | | 528,708 |
5.223% 8/1/33 (i) | | 40,373 | | 41,246 |
6% 5/1/33 | | 814,667 | | 833,767 |
TOTAL FREDDIE MAC | | 4,303,517 |
Government National Mortgage Association - 0.1% |
7% 7/15/31 to 12/15/32 | | 242,236 | | 255,890 |
TOTAL U.S. GOVERNMENT AGENCY - MORTGAGE SECURITIES (Cost $110,321,879) | 109,265,391 |
Asset-Backed Securities - 3.2% |
|
ACE Securities Corp.: | | | | |
Series 2003-FM1 Class M2, 5.31% 11/25/32 (i) | | 40,000 | | 40,471 |
Series 2004-HE1: | | | | |
Class M1, 3.96% 2/25/34 (i) | | 125,000 | | 125,044 |
Class M2, 4.56% 2/25/34 (i) | | 125,000 | | 125,063 |
Asset-Backed Securities - continued |
| Principal Amount | | Value (Note 1) |
ACE Securities Corp.: - continued | | | | |
Series 2005-SD1 Class A1, 3.86% 11/25/50 (i) | | $ 141,526 | | $ 141,700 |
American Express Credit Account Master Trust Series 2004-C Class C, 3.8881% 2/15/12 (e)(i) | | 1,559,117 | | 1,563,718 |
AmeriCredit Automobile Receivables Trust Series 2004-1 Class D, 5.07% 7/6/10 | | 290,000 | | 289,544 |
Ameriquest Mortgage Securities, Inc. Series 2004-R2: | | | | |
Class M1, 3.89% 4/25/34 (i) | | 65,000 | | 64,997 |
Class M2, 3.94% 4/25/34 (i) | | 50,000 | | 49,998 |
Asset Backed Securities Corp. Home Equity Loan Trust: | | | | |
Series 2003-HE2 Class A2, 3.7681% 4/15/33 (i) | | 7,890 | | 7,894 |
Series 2003-HE7 Class A3, 3.7481% 12/15/33 (i) | | 75,119 | | 75,396 |
Series 2004-HE2 Class M1, 4.01% 4/25/34 (i) | | 375,000 | | 375,666 |
Bank One Issuance Trust: | | | | |
Series 2002-C1 Class C1, 4.3481% 12/15/09 (i) | | 425,000 | | 429,552 |
Series 2004-B2 Class B2, 4.37% 4/15/12 | | 900,000 | | 890,715 |
Capital One Multi-Asset Execution Trust: | | | | |
Series 2003-B1 Class B1, 4.5581% 2/17/09 (i) | | 120,000 | | 120,751 |
Series 2003-B2 Class B2, 3.5% 2/17/09 | | 60,000 | | 59,651 |
Series 2003-B4 Class B4, 4.1881% 7/15/11 (i) | | 90,000 | | 91,451 |
Series 2004-6 Class B, 4.15% 7/16/12 | | 570,000 | | 559,157 |
CDC Mortgage Capital Trust Series 2003-HE2 Class M2, 5.36% 10/25/33 (i) | | 30,000 | | 30,526 |
Chase Credit Card Master Trust Series 2003-6 Class B, 3.7381% 2/15/11 (i) | | 230,000 | | 231,735 |
Chase Credit Card Owner Trust Series 2004-1 Class B, 3.5881% 5/15/09 (i) | | 220,000 | | 219,957 |
Citibank Credit Card Issuance Trust: | | | | |
Series 2000-C2 Class C2, 4.2488% 10/15/07 (i) | | 1,000,000 | | 1,000,649 |
Series 2003-C1 Class C1, 4.65% 4/7/10 (i) | | 305,000 | | 311,297 |
Countrywide Home Loans, Inc.: | | | | |
Series 2004-2 Class M1, 3.96% 5/25/34 (i) | | 275,000 | | 275,355 |
Series 2004-3 Class M1, 3.96% 6/25/34 (i) | | 75,000 | | 75,069 |
Series 2005-1: | | | | |
Class MV1, 3.86% 7/25/35 (i) | | 185,000 | | 184,718 |
Class MV2, 3.9% 7/25/35 (i) | | 220,000 | | 219,366 |
Class MV3, 3.94% 7/25/35 (i) | | 90,000 | | 89,870 |
Crown Castle Towers LLC/Crown Atlantic Holdings Sub LLC/Crown Communication, Inc. Series 2005-1: | | | | |
Class B, 4.878% 6/15/35 (e) | | 309,000 | | 311,474 |
Class C, 5.074% 6/15/35 (e) | | 281,000 | | 282,405 |
First Franklin Mortgage Loan Trust Series 2004-FF2: | | | | |
Class M3, 4.01% 3/25/34 (i) | | 25,000 | | 25,044 |
Asset-Backed Securities - continued |
| Principal Amount | | Value (Note 1) |
First Franklin Mortgage Loan Trust Series 2004-FF2: - continued | | | | |
Class M4, 4.36% 3/25/34 (i) | | $ 25,000 | | $ 25,221 |
Fremont Home Loan Trust Series 2004-A: | | | | |
Class M1, 4.01% 1/25/34 (i) | | 225,000 | | 225,144 |
Class M2, 4.61% 1/25/34 (i) | | 275,000 | | 278,153 |
GSAMP Trust Series 2004-FM2 Class M1, 3.96% 1/25/34 (i) | | 250,000 | | 249,989 |
HFC Home Equity Loan Asset Backed Certificates Series 2005-2: | | | | |
Class M1, 3.97% 1/20/34 (i) | | 185,000 | | 185,000 |
Class M2, 4% 1/20/34 (i) | | 140,000 | | 140,000 |
Home Equity Asset Trust: | | | | |
Series 2003-2: | | | | |
Class A2, 3.84% 8/25/33 (i) | | 2,448 | | 2,457 |
Class M1, 4.34% 8/25/33 (i) | | 25,000 | | 25,271 |
Series 2003-4: | | | | |
Class M1, 4.26% 10/25/33 (i) | | 40,000 | | 40,297 |
Class M2, 5.36% 10/25/33 (i) | | 45,000 | | 45,591 |
Series 2004-3 Class M2, 4.66% 8/25/34 (i) | | 120,000 | | 122,039 |
Long Beach Mortgage Loan Trust Series 2003-3 Class M2, 5.31% 7/25/33 (i) | | 45,000 | | 45,879 |
MBNA Credit Card Master Note Trust: | | | | |
Series 2003-B2 Class B2, 3.7781% 10/15/10 (i) | | 80,000 | | 80,814 |
Series 2003-B3 Class B3, 3.7631% 1/18/11 (i) | | 285,000 | | 286,352 |
Series 2003-B5 Class B5, 3.7581% 2/15/11 (i) | | 240,000 | | 241,854 |
Meritage Mortgage Loan Trust Series 2004-1: | | | | |
Class M1, 3.96% 7/25/34 (i) | | 100,000 | | 99,996 |
Class M2, 4.01% 7/25/34 (i) | | 25,000 | | 24,999 |
Class M3, 4.41% 7/25/34 (i) | | 50,000 | | 49,998 |
Class M4, 4.56% 7/25/34 (i) | | 25,000 | | 24,999 |
Morgan Stanley ABS Capital I, Inc.: | | | | |
Series 2002-HE3 Class M1, 4.56% 12/27/32 (i) | | 90,000 | | 91,161 |
Series 2003-NC8 Class M1, 4.16% 9/25/33 (i) | | 35,000 | | 35,201 |
Morgan Stanley Dean Witter Capital I Trust: | | | | |
Series 2001-NC4 Class M1, 4.46% 1/25/32 (i) | | 39,060 | | 39,202 |
Series 2002-NC1 Class M1, 4.26% 2/25/32 (e)(i) | | 138,907 | | 140,074 |
Series 2002-NC3 Class M1, 4.18% 8/25/32 (i) | | 75,000 | | 75,576 |
Series 2003-NC2 Class M2, 5.46% 2/25/33 (i) | | 40,000 | | 40,634 |
National Collegiate Funding LLC Series 2004-GT1 Class IO1, 7.87% 6/25/10 (e)(i)(l) | | 455,000 | | 153,787 |
National Collegiate Student Loan Trust Series 2005-GT1 Class AIO, 6.75% 12/25/09 (l) | | 250,000 | | 67,324 |
Asset-Backed Securities - continued |
| Principal Amount | | Value (Note 1) |
New Century Home Equity Loan Trust Series 2003-2 Class A2, 3.89% 1/25/33 (i) | | $ 3,422 | | $ 3,423 |
NovaStar Home Equity Loan Series 2004-1: | | | | |
Class M1, 3.91% 6/25/34 (i) | | 75,000 | | 75,063 |
Class M4, 4.435% 6/25/34 (i) | | 125,000 | | 125,213 |
Park Place Securities, Inc. Series 2005-WCH1: | | | | |
Class M2, 3.98% 1/25/35 (i) | | 225,000 | | 224,544 |
Class M4, 4.29% 1/25/35 (i) | | 750,000 | | 750,878 |
Sears Credit Account Master Trust II Series 2002-4 Class A, 3.5181% 8/18/09 (i) | | 100,000 | | 99,999 |
SLM Private Credit Student Loan Trust Series 2004-A Class C, 3.96% 6/15/33 (i) | | 260,000 | | 265,580 |
Volkswagen Auto Lease Trust Series 2005-A Class A4, 3.94% 10/20/10 | | 970,000 | | 959,829 |
WFS Financial Owner Trust Series 2004-3 Class D, 4.07% 2/17/12 | | 284,404 | | 282,142 |
TOTAL ASSET-BACKED SECURITIES (Cost $13,893,498) | 13,891,916 |
Collateralized Mortgage Obligations - 3.6% |
|
Private Sponsor - 3.3% |
Adjustable Rate Mortgage Trust floater: | | | | |
Series 2005-1 Class 5A2, 3.79% 5/25/35 (i) | | 333,915 | | 334,126 |
Series 2005-2 Class 6A2, 3.74% 6/25/35 (i) | | 161,688 | | 161,793 |
Bank of America Mortgage Securities, Inc.: | | | | |
Series 2003-K: | | | | |
Class 1A1, 3.3521% 12/25/33 (i) | | 168,036 | | 166,513 |
Class 2A1, 4.1867% 12/25/33 (i) | | 298,300 | | 294,569 |
Series 2004-B: | | | | |
Class 1A1, 3.4262% 3/25/34 (i) | | 664,848 | | 656,626 |
Class 2A2, 4.1351% 3/25/34 (i) | | 204,630 | | 200,155 |
Series 2004-C Class 1A1, 3.3726% 4/25/34 (i) | | 383,241 | | 378,537 |
Series 2004-D: | | | | |
Class 1A1, 3.5597% 5/25/34 (i) | | 448,999 | | 444,076 |
Class 2A2, 4.2101% 5/25/34 (i) | | 585,166 | | 576,845 |
Series 2004-G Class 2A7, 4.6058% 8/25/34 (i) | | 621,572 | | 619,487 |
Series 2004-H Class 2A1, 4.5133% 9/25/34 (i) | | 552,389 | | 547,078 |
Bear Stearns Alt-A Trust floater Series 2005-1 Class A1, 3.74% 1/25/35 (i) | | 645,482 | | 645,482 |
CS First Boston Mortgage Securities Corp. floater: | | | | |
Series 2004-AR3 Class 6A2, 3.83% 4/25/34 (i) | | 115,778 | | 115,881 |
Collateralized Mortgage Obligations - continued |
| Principal Amount | | Value (Note 1) |
Private Sponsor - continued |
CS First Boston Mortgage Securities Corp. floater: - continued | | | | |
Series 2004-AR6 Class 9A2, 3.83% 10/25/34 (i) | | $ 213,174 | | $ 213,302 |
Granite Mortgages PLC floater Series 2004-2 Class 1C, 4.13% 6/20/44 (i) | | 194,632 | | 195,032 |
Lehman Structured Securities Corp. floater Series 2005-1 Class A2, 3.67% 9/26/45 (e)(i) | | 743,244 | | 743,244 |
Master Alternative Loan Trust Series 2004-3 Class 3A1, 6% 4/25/34 | | 76,015 | | 76,870 |
Master Asset Securitization Trust Series 2004-9 Class 7A1, 6.3188% 5/25/17 (i) | | 481,596 | | 486,800 |
Master Seasoned Securitization Trust Series 2004-1 Class 1A1, 6.2437% 8/25/17 (i) | | 371,110 | | 379,522 |
Merrill Lynch Mortgage Investors, Inc.: | | | | |
floater Series 2005-B Class A2, 3.75% 6/25/30 (i) | | 629,385 | | 629,385 |
Series 2003-E Class XA1, 1% 10/25/28 (i)(l) | | 1,302,816 | | 15,846 |
Series 2003-G Class XA1, 1% 1/25/29 (l) | | 1,833,562 | | 23,767 |
Series 2003-H Class XA1, 1% 1/25/29 (e)(l) | | 1,474,148 | | 19,285 |
Opteum Mortgage Acceptance Corp. floater Series 2005-3 Class APT, 3.75% 6/25/35 (i) | | 367,832 | | 368,047 |
Residential Asset Mortgage Products, Inc. sequential pay: | | | | |
Series 2003-SL1 Class A31, 7.125% 4/25/31 | | 518,998 | | 528,368 |
Series 2004-SL2 Class A1, 6.5% 10/25/16 | | 71,407 | | 72,543 |
Residential Finance LP/Residential Finance Development Corp. floater: | | | | |
Series 2003-CB1: | | | | |
Class B3, 4.8% 6/10/35 (e)(i) | | 43,397 | | 44,156 |
Class B4, 5% 6/10/35 (e)(i) | | 38,575 | | 39,298 |
Class B5, 5.6% 6/10/35 (e)(i) | | 28,931 | | 29,546 |
Class B6, 6.1% 6/10/35 (e)(i) | | 14,466 | | 14,773 |
Series 2004-B: | | | | |
Class B4, 4.45% 2/10/36 (e)(i) | | 98,295 | | 99,770 |
Class B5, 4.9% 2/10/36 (e)(i) | | 98,295 | | 100,015 |
Class B6, 5.35% 2/10/36 (e)(i) | | 98,295 | | 100,138 |
Series 2004-C: | | | | |
Class B4, 4.3% 9/10/36 (i) | | 98,887 | | 100,123 |
Class B5, 4.7% 9/10/36 (i) | | 98,887 | | 100,000 |
Class B6, 5.1% 9/10/36 (i) | | 98,887 | | 100,370 |
Sequoia Mortgage Funding Trust Series 2003-A Class AX1, 0.8% 10/21/08 (e)(l) | | 3,273,870 | | 24,731 |
Sequoia Mortgage Trust floater Series 2005-2 Class A2, 3.36% 3/20/35 (i) | | 549,984 | | 549,984 |
Collateralized Mortgage Obligations - continued |
| Principal Amount | | Value (Note 1) |
Private Sponsor - continued |
Structured Adjustable Rate Mortgage Loan Trust floater Series 2001-14 Class A1, 3.77% 7/25/35 (i) | | $ 1,163,940 | | $ 1,163,940 |
Washington Mutual Mortgage Securities Corp. sequential pay: | | | | |
Series 2003-MS9 Class 2A1, 7.5% 12/25/33 | | 59,087 | | 61,232 |
Series 2004-RA2 Class 2A, 7% 7/25/33 | | 121,414 | | 124,065 |
Wells Fargo Mortgage Backed Securities Trust: | | | | |
Series 2004-T Class A1, 3.4526% 9/25/34 (i) | | 581,105 | | 578,530 |
Series 2005-AR10 Class 2A2, 4.111% 6/25/35 (i) | | 952,333 | | 939,034 |
Series 2005-AR12 Class 2A6, 4.322% 7/25/35 (i) | | 906,327 | | 894,687 |
Series 2005-AR9 Class 2A1, 4.3621% 5/25/35 (i) | | 395,715 | | 392,917 |
TOTAL PRIVATE SPONSOR | | 14,350,488 |
U.S. Government Agency - 0.3% |
Fannie Mae guaranteed REMIC pass thru certificates planned amortization class Series 2004-81 Class KD, 4.5% 4/25/17 | | 1,050,000 | | 1,036,840 |
Freddie Mac Multi-class participation certificates guaranteed sequential pay Series 2750 Class ZT, 5% 2/15/34 | | 391,734 | | 359,862 |
Ginnie Mae guaranteed Multi-family pass thru securities sequential pay Series 2002-35 Class C, 5.8918% 10/16/23 (i) | | 25,000 | | 25,921 |
Ginnie Mae guaranteed REMIC pass thru securities planned amortization class Series 2003-75 Class LI, 5.5% 10/20/21 (l) | | 503,202 | | 230 |
TOTAL U.S. GOVERNMENT AGENCY | | 1,422,853 |
TOTAL COLLATERALIZED MORTGAGE OBLIGATIONS (Cost $15,858,005) | 15,773,341 |
Commercial Mortgage Securities - 2.5% |
|
Banc of America Large Loan, Inc. floater: | | | | |
Series 2003-BBA2: | | | | |
Class C, 3.8581% 11/15/15 (e)(i) | | 50,000 | | 50,183 |
Class D, 3.9381% 11/15/15 (e)(i) | | 80,000 | | 80,456 |
Class F, 4.2881% 11/15/15 (e)(i) | | 60,000 | | 60,421 |
Class H, 4.7881% 11/15/15 (e)(i) | | 50,000 | | 50,297 |
Class J, 5.3381% 11/15/15 (e)(i) | | 55,000 | | 55,330 |
Class K, 5.82% 11/15/15 (e)(i) | | 50,000 | | 49,684 |
Commercial Mortgage Securities - continued |
| Principal Amount | | Value (Note 1) |
Banc of America Large Loan, Inc. floater: - continued | | | | |
Series 2005-BOCA: | | | | |
Class D, 3.7181% 12/15/16 (e)(i) | | $ 110,000 | | $ 110,055 |
Class E, 3.8081% 12/15/16 (e)(i) | | 100,000 | | 100,077 |
Class F, 3.8881% 12/15/16 (e)(i) | | 110,000 | | 110,100 |
Class H, 4.3381% 12/15/16 (e)(i) | | 120,000 | | 119,816 |
Class K, 4.7381% 12/15/16 (e)(i) | | 105,000 | | 104,868 |
Bayview Commercial Asset Trust: | | | | |
floater: | | | | |
Series 2004-1 Class A, 3.82% 4/25/34 (e)(i) | | 332,648 | | 333,233 |
Series 2004-2 Class A, 3.89% 8/25/34 (e)(i) | | 357,944 | | 359,705 |
Series 2004-3: | | | | |
Class A1, 3.83% 1/25/35 (e)(i) | | 333,894 | | 335,063 |
Class A2, 3.88% 1/25/35 (e)(i) | | 47,699 | | 47,867 |
Class M1, 3.96% 1/25/35 (e)(i) | | 47,699 | | 47,764 |
Class M2, 4.46% 1/25/35 (e)(i) | | 47,699 | | 47,983 |
Series 2004-1 Class IO, 1.25% 4/25/34 (e)(l) | | 3,635,356 | | 213,130 |
Bear Stearns Commercial Mortgage Securities, Inc.: | | | | |
sequential pay Series 2004-ESA Class A3, 4.741% 5/14/16 (e) | | 180,000 | | 180,489 |
Series 2004-ESA: | | | | |
Class B, 4.888% 5/14/16 (e) | | 325,000 | | 327,429 |
Class C, 4.937% 5/14/16 (e) | | 205,000 | | 206,951 |
Class D, 4.986% 5/14/16 (e) | | 75,000 | | 75,483 |
Class E, 5.064% 5/14/16 (e) | | 230,000 | | 231,631 |
Class F, 5.182% 5/14/16 (e) | | 55,000 | | 55,483 |
COMM floater Series 2002-FL7 Class D, 3.9581% 11/15/14 (e)(i) | | 125,000 | | 125,054 |
Commercial Mortgage pass thru certificates floater Series 2004-CNL: | | | | |
Class B, 3.7881% 9/15/14 (e)(i) | | 105,000 | | 105,042 |
Class D, 4.0281% 9/15/14 (e)(i) | | 30,000 | | 30,009 |
Class E, 4.0881% 9/15/14 (e)(i) | | 45,000 | | 45,033 |
Class F, 4.1881% 9/15/14 (e)(i) | | 35,000 | | 35,020 |
Class G, 4.3681% 9/15/14 (e)(i) | | 80,000 | | 80,032 |
Class H, 4.4681% 9/15/14 (e)(i) | | 85,000 | | 85,034 |
Class J, 4.9881% 9/15/14 (e)(i) | | 30,000 | | 30,095 |
Class K, 5.3881% 9/15/14 (e)(i) | | 45,000 | | 45,093 |
Class L, 5.5881% 9/15/14 (e)(i) | | 35,000 | | 34,983 |
CS First Boston Mortgage Securities Corp.: | | | | |
sequential pay: | | | | |
Series 1997-C2 Class A2, 6.52% 1/17/35 | | 30,736 | | 30,982 |
Series 2004-C1 Class A4, 4.75% 1/15/37 | | 695,000 | | 686,789 |
Commercial Mortgage Securities - continued |
| Principal Amount | | Value (Note 1) |
CS First Boston Mortgage Securities Corp.: - continued | | | | |
Series 2003-TFLA Class G, 3.7357% 4/15/13 (e)(i) | | $ 22,400 | | $ 22,331 |
Fannie Mae sequential pay Series 1999-10 Class MZ, 6.5% 9/17/38 | | 757,908 | | 818,204 |
Ginnie Mae guaranteed REMIC pass thru securities: | | | | |
sequential pay: | | | | |
Series 2003-22 Class B, 3.963% 5/16/32 | | 60,000 | | 57,909 |
Series 2003-36 Class C, 4.254% 2/16/31 | | 55,000 | | 53,609 |
Series 2003-47 Class C, 4.227% 10/16/27 | | 105,000 | | 103,082 |
Series 2003-59 Class D, 3.654% 10/16/27 | | 115,000 | | 108,543 |
Series 2003-47 Class XA, 0.1927% 6/16/43 (i)(l) | | 5,638,415 | | 265,400 |
GS Mortgage Securities Corp. II sequential pay: | | | | |
Series 2001-LIBA Class A2, 6.615% 2/14/16 (e) | | 385,000 | | 420,722 |
Series 2003-C1 Class A2A, 3.59% 1/10/40 | | 65,000 | | 63,719 |
Hilton Hotel Pool Trust Series 2000-HLTA Class D, 7.555% 10/3/15 (e) | | 370,000 | | 403,297 |
Host Marriot Pool Trust sequential pay Series 1999-HMTA Class D, 7.97% 8/3/15 (e) | | 110,000 | | 119,163 |
Leafs CMBS I Ltd./Leafs CMBS I Corp. Series 2002-1A Class C, 4.13% 11/20/37 (e) | | 200,000 | | 180,420 |
Morgan Stanley Capital I, Inc. Series 2005-IQ9 Class X2, 1.2036% 7/15/56 (e)(i)(l) | | 3,920,000 | | 199,369 |
Mortgage Capital Funding, Inc. sequential pay Series 1998-MC2 Class A2, 6.423% 6/18/30 | | 319,331 | | 332,253 |
Trizechahn Office Properties Trust Series 2001-TZHA: | | | | |
Class C3, 6.522% 3/15/13 (e) | | 25,000 | | 25,720 |
Class C4, 6.893% 5/15/16 (e) | | 500,000 | | 547,173 |
Class E3, 7.253% 3/15/13 (e) | | 235,000 | | 243,947 |
Wachovia Bank Commercial Mortgage Trust: | | | | |
sequential pay Series 2003-C8 Class A3, 4.445% 11/15/35 | | 785,000 | | 773,341 |
Series 2004-C15: | | | | |
Class 180A, 5.5782% 10/15/41 (e)(i) | | 1,000,000 | | 984,198 |
Class 180B, 5.5782% 10/15/41 (e)(i) | | 500,000 | | 492,099 |
TOTAL COMMERCIAL MORTGAGE SECURITIES (Cost $11,297,120) | 10,901,163 |
Foreign Government and Government Agency Obligations - 2.5% |
|
Argentine Republic: | | | | |
3% 4/30/13 (i) | | 90,000 | | 73,224 |
3.01% 8/3/12 (i) | | 400,000 | | 312,600 |
Foreign Government and Government Agency
Obligations - continued |
| Principal Amount | | Value (Note 1) |
Argentine Republic: - continued | | | | |
discount 8.28% (with partial capitalization through 12/31/2013) 12/31/33 unit (j) | | $ 215,346 | | $ 208,024 |
par 1.33% 12/31/38 unit (d)(j) | | 50,116 | | 17,942 |
Brazilian Federative Republic: | | | | |
Brady: | | | | |
debt conversion bond 4.3125% 4/15/12 (i) | | 131,766 | | 127,484 |
par Z-L 6% 4/15/24 | | 265,000 | | 251,088 |
8% 1/15/18 | | 514,000 | | 521,068 |
10.5% 7/14/14 | | 125,000 | | 145,250 |
11% 1/11/12 | | 60,000 | | 70,800 |
11% 8/17/40 | | 470,000 | | 552,250 |
12.25% 3/6/30 | | 105,000 | | 137,025 |
12.75% 1/15/20 | | 75,000 | | 99,675 |
14.5% 10/15/09 | | 75,000 | | 96,488 |
Central Bank of Nigeria promissory note 5.092% 1/5/10 | | 113,447 | | 108,728 |
Chilean Republic 7.125% 1/11/12 | | 1,250,000 | | 1,406,625 |
Colombian Republic: | | | | |
10.75% 1/15/13 | | 150,000 | | 179,250 |
11.75% 2/25/20 | | 80,000 | | 103,600 |
Dominican Republic: | | | | |
Brady 3.9425% 8/30/09 (i) | | 116,248 | | 112,761 |
4.375% 8/30/24 (i) | | 250,000 | | 231,250 |
Ecuador Republic: | | | | |
8% 8/15/30 (Reg. S) (d) | | 45,000 | | 38,700 |
12% 11/15/12 (Reg. S) | | 45,000 | | 44,213 |
euro par 5% 2/28/25 | | 15,000 | | 10,875 |
Indonesian Republic 7.25% 4/20/15 (e) | | 30,000 | | 30,300 |
Israeli State 4.625% 6/15/13 | | 20,000 | | 19,363 |
Korean Republic 4.875% 9/22/14 | | 195,000 | | 193,585 |
Lebanese Republic: | | | | |
6.77% 11/30/09 (e)(i) | | 70,000 | | 70,175 |
6.77% 11/30/09 (i) | | 235,000 | | 235,588 |
Panamanian Republic Brady discount 4.6875% 7/17/26 (i) | | 25,000 | | 23,375 |
Peruvian Republic: | | | | |
7.35% 7/21/25 | | 100,000 | | 99,750 |
9.125% 2/21/12 | | 75,000 | | 88,688 |
9.875% 2/6/15 | | 45,000 | | 55,800 |
Foreign Government and Government Agency
Obligations - continued |
| Principal Amount | | Value (Note 1) |
Philippine Republic: | | | | |
Brady principal collateralized interest reduction bond 6.5% 12/1/17 | | $ 120,000 | | $ 119,400 |
8.375% 2/15/11 | | 360,000 | | 370,350 |
9% 2/15/13 | | 100,000 | | 105,000 |
9.875% 1/15/19 | | 90,000 | | 96,863 |
10.625% 3/16/25 | | 95,000 | | 105,213 |
Republic of Serbia 3.75% 11/1/24 (d)(e) | | 50,000 | | 43,063 |
Russian Federation: | | | | |
5% 3/31/30 (Reg. S) (d) | | 762,000 | | 845,344 |
11% 7/24/18 (Reg. S) | | 35,000 | | 51,888 |
12.75% 6/24/28 (Reg. S) | | 120,000 | | 215,850 |
euro 10% 6/26/07 | | 60,000 | | 65,550 |
Turkish Republic: | | | | |
11% 1/14/13 | | 230,000 | | 290,375 |
11.5% 1/23/12 | | 25,000 | | 31,688 |
11.75% 6/15/10 | | 305,000 | | 378,200 |
11.875% 1/15/30 | | 100,000 | | 142,500 |
Ukraine Government: | | | | |
6.365% 8/5/09 (i) | | 200,000 | | 216,800 |
7.65% 6/11/13 (Reg. S) | | 100,000 | | 110,000 |
United Mexican States: | | | | |
4.625% 10/8/08 | | 70,000 | | 69,615 |
5.875% 1/15/14 | | 85,000 | | 86,998 |
6.75% 9/27/34 | | 170,000 | | 179,180 |
7.5% 1/14/12 | | 100,000 | | 111,700 |
Uruguay Republic 7.25% 2/15/11 | | 60,000 | | 61,200 |
Venezuelan Republic: | | | | |
Discount A, 4.25% 3/31/20 (i) | | 250,000 | | 246,875 |
4.64% 4/20/11 (i) | | 80,000 | | 74,200 |
5.375% 8/7/10 | | 105,000 | | 98,490 |
9.25% 9/15/27 | | 90,000 | | 93,825 |
10.75% 9/19/13 | | 240,000 | | 279,120 |
13.625% 8/15/18 | | 93,000 | | 125,085 |
euro Brady par W-B 6.75% 3/31/20 | | 250,000 | | 250,000 |
Vietnamese Socialist Republic Brady par 3.75% 3/12/28 (d) | | 90,000 | | 67,275 |
TOTAL FOREIGN GOVERNMENT AND GOVERNMENT AGENCY OBLIGATIONS (Cost $9,844,940) | 10,597,191 |
Common Stocks - 0.0% |
| | Shares | | Value (Note 1) |
CONSUMER STAPLES - 0.0% |
Personal Products - 0.0% |
Revlon, Inc. Class A (sub. vtg.) (a) | | 18,648 | | $ 69,744 |
TOTAL COMMON STOCKS (Cost $36,503) | | 69,744 |
Sovereign Loan Participations - 0.0% |
| Principal Amount | | |
Indonesian Republic loan participation: | | | | |
- Credit Suisse First Boston 4.375% 3/28/13 (i) | | $ 117,509 | | 109,871 |
- Deutsche Bank 4.375% 3/28/13 (i) | | 13,831 | | 12,932 |
TOTAL SOVEREIGN LOAN PARTICIPATIONS (Cost $113,638) | 122,803 |
Fixed-Income Funds - 12.5% |
| | Shares | | |
Fidelity Ultra-Short Central Fund (k)
(Cost $53,999,944) | | 542,844 | | 54,002,121 |
Cash Equivalents - 6.9% |
| | Maturity Amount | | |
Investments in repurchase agreements (Collateralized by U.S. Government Obligations, in a joint trading account at 3.32%, dated 7/29/05 due 8/1/05)
(Cost $29,592,000) | | $ 29,600,176 | | 29,592,000 |
TOTAL INVESTMENT PORTFOLIO - 108.7% (Cost $468,907,002) | | | 469,355,908 |
NET OTHER ASSETS - (8.7)% | | | (37,597,242) |
NET ASSETS - 100% | | $ 431,758,666 |
Swap Agreements |
| Expiration Date | | Notional Amount | | Value |
Credit Default Swap |
Receive quarterly a fixed rate of .4% multiplied by the notional amount and pay to Merrill Lynch, Inc., upon each default event of one of the issues of Dow Jones CDX N.A. Investment Grade 4, par value of the proportional notional amount (h) | June 2010 | | $ 4,500,000 | | $ (18,576) |
Receive quarterly a fixed rate of .5% multiplied by the notional amount and pay to Merrill Lynch, Inc., upon each default event of one of the issues of Dow Jones CDX N.A. Investment Grade 3, par value of the proportional notional amount (g) | March 2010 | | 1,250,000 | | 951 |
Receive quarterly a fixed rate of .65% multiplied by the notional amount and pay to Merrill Lynch, Inc., upon each default event of one of the issues of Dow Jones CDX N.A. Investment Grade 4, par value of the proportional notional amount (h) | June 2015 | | 12,500,000 | | (85,880) |
Receive quarterly a fixed rate of .7% multiplied by the notional amount and pay to Deutsche Bank, upon each default event of one of the issues of Dow Jones CDX N.A. Investment Grade 3, par value of the proportional notional amount (g) | March 2015 | | 1,250,000 | | (2,759) |
Receive quarterly notional amount multiplied by .35% and pay Goldman Sachs upon default event of Southern California Edison Co., par value of the notional amount of Southern California Edison Co. 7.625% 1/15/10 | Sept. 2010 | | 400,000 | | (157) |
Receive quarterly notional amount multiplied by .42% and pay Morgan Stanley, Inc. upon default event of Sempra Energy, par value of the notional amount of Sempra Energy 6% 2/1/13 | Sept. 2010 | | 600,000 | | 98 |
Receive quarterly notional amount multiplied by .48% and pay JPMorgan Chase, Inc. upon default event of Fannie Mae, par value of the notional amount of Fannie Mae 4.625% 5/1/13 | June 2010 | | 1,000,000 | | 9,039 |
TOTAL CREDIT DEFAULT SWAP | 21,500,000 | | (97,284) |
Swap Agreements - continued |
| Expiration Date | | Notional Amount | | Value |
Interest Rate Swap |
Receive quarterly a fixed rate equal to 4.3875% and pay quarterly a floating rate based on 3-month LIBOR with Credit Suisse First Boston | March 2010 | | $ 1,250,000 | | $ (4,655) |
Receive quarterly a fixed rate equal to 4.774% and pay quarterly a floating rate based on 3-month LIBOR with Credit Suisse First Boston | March 2015 | | 1,250,000 | | 11,777 |
Receive quarterly a fixed rate equal to 4.898% and pay quarterly a floating rate based on 3-month LIBOR with Lehman Brothers, Inc. | July 2014 | | 1,135,000 | | 19,725 |
TOTAL INTEREST RATE SWAP | 3,635,000 | | 26,847 |
Total Return Swap |
Receive monthly a return equal to Banc of America Securities LLC AAA 10 Yr Commercial Mortgage Backed Securities Daily Index and pay monthly a floating rate based on 1-month LIBOR minus 40 basis points with Bank of America | March 2006 | | 1,000,000 | | (16,398) |
Receive monthly a return equal to Lehman Brothers CMBS AAA 8.5+ Index and pay monthly a floating rate based on 1-month LIBOR minus 20 basis points with Citibank | Oct. 2005 | | 1,000,000 | | (24,809) |
Receive monthly a return equal to Lehman Brothers CMBS U.S. Aggregate Index and pay monthly a floating rate based on 1-month LIBOR minus 10 basis points with Citibank | Oct. 2005 | | 355,000 | | (5,703) |
Receive monthly a return equal to Lehman Brothers CMBS U.S. Aggregate Index and pay monthly a floating rate based on 1-month LIBOR minus 20 basis points with Lehman Brothers, Inc. | March 2006 | | 145,000 | | (2,279) |
Receive monthly a return equal to Lehman Brothers Commercial Mortgage Backed Securities AAA Daily Index and pay monthly a floating rate based on 1-month LIBOR minus 25 basis points with Bank of America | Dec. 2005 | | 600,000 | | (9,628) |
Swap Agreements - continued |
| Expiration Date | | Notional Amount | | Value |
Total Return Swap - continued |
Receive monthly a return equal to Banc of America Securities LLC AAA 10yr Commercial Mortgage Backed Securities Daily Index and pay monthly a floating rate based on 1-month LIBOR minus 20 basis points with Bank of America | July 2006 | | $ 1,000,000 | | $ (8,117) |
Receive quarterly a return equal to Banc of America Securities LLC AAA 10 Yr Commercial Mortgage Backed Securities Daily Index and pay quarterly a floating rate based on 3-month LIBOR minus 40 basis points with Bank of America | Nov. 2005 | | 2,000,000 | | (7,836) |
TOTAL TOTAL RETURN SWAP | 6,100,000 | | (74,770) |
| | $ 31,235,000 | | $ (145,207) |
Legend |
(a) Non-income producing |
(b) Non-income producing - issuer filed for bankruptcy or is in default of interest payments. |
(c) Debt obligation initially issued in zero coupon form which converts to coupon form at a specified rate and date. The rate shown is the rate at period end. |
(d) Debt obligation initially issued at one coupon which converts to a higher coupon at a specified date. The rate shown is the rate at period end. |
(e) Security exempt from registration under Rule 144A of the Securities Act of 1933. These securities may be resold in transactions exempt from registration, normally to qualified institutional buyers. At the period end, the value of these securities amounted to $28,129,389 or 6.5% of net assets. |
(f) Security or a portion of the security purchased on a delayed delivery or when-issued basis. |
(g) Dow Jones CDX N.A. Investment Grade 3 is a tradable index of credit default swaps on investment grade debt of U.S. companies. |
(h) Dow Jones CDX N.A. Investment Grade 4 is a tradable index of credit default swaps on investment grade debt of U.S. companies. |
(i) The coupon rate shown on floating or adjustable rate securities represents the rate at period end. |
(j) Includes attached Argentine Republic Gross Domestic Product-Linked Securities, expiring 12/15/35. |
(k) Affiliated fund that is available only to investment companies and other accounts managed by Fidelity Investments. A complete listing of the fixed-income central fund's holdings is provided at the end of this report. |
(l) Security represents right to receive monthly interest payments on an underlying pool of mortgages. Principal shown is the par amount of the mortgage pool. |
See accompanying notes which are an integral part of the financial statements.
Annual Report
Financial Statements
Statement of Assets and Liabilities
| July 31, 2005 |
| | |
Assets | | |
Investment in securities, at value (including repurchase agreements of $29,592,000) (cost $468,907,002) - See accompanying schedule | | $ 469,355,908 |
Cash | | 764 |
Receivable for investments sold | | 960,923 |
Receivable for fund shares sold | | 1,454,556 |
Interest receivable | | 3,810,371 |
Other receivables | | 58,931 |
Total assets | | 475,641,453 |
| | |
Liabilities | | |
Payable for investments purchased
Regular delivery | $ 1,339,322 | |
Delayed delivery | 41,984,448 | |
Payable for fund shares redeemed | 121,900 | |
Distributions payable | 60,328 | |
Swap agreements, at value | 145,207 | |
Accrued management fee | 115,609 | |
Distribution fees payable | 3,606 | |
Other affiliated payables | 75,644 | |
Other payables and accrued expenses | 36,723 | |
Total liabilities | | 43,882,787 |
| | |
Net Assets | | $ 431,758,666 |
Net Assets consist of: | | |
Paid in capital | | $ 428,201,146 |
Undistributed net investment income | | 539,146 |
Accumulated undistributed net realized gain (loss) on investments | | 2,397,425 |
Net unrealized appreciation (depreciation) on investments | | 620,949 |
Net Assets | | $ 431,758,666 |
See accompanying notes which are an integral part of the financial statements.
Annual Report
Financial Statements - continued
Statement of Assets and Liabilities - continued
| July 31, 2005 |
| | |
Calculation of Maximum Offering Price Class A:
Net Asset Value and redemption price per share ($2,974,166 ÷ 281,429 shares) | | $ 10.57 |
| | |
Maximum offering price per share (100/95.25 of $10.57) | | $ 11.10 |
Class T:
Net Asset Value and redemption price per share ($5,738,901 ÷ 543,558 shares) | | $ 10.56 |
| | |
Maximum offering price per share (100/96.50 of $10.56) | | $ 10.94 |
Class B:
Net Asset Value and offering price per share ($2,029,025 ÷ 191,971 shares)A | | $ 10.57 |
| | |
Class C:
Net Asset Value and offering price per share ($677,191 ÷ 64,087 shares)A | | $ 10.57 |
| | |
Total Bond:
Net Asset Value, offering price and redemption price per share ($420,225,271 ÷ 39,761,938 shares) | | $ 10.57 |
| | |
Institutional Class:
Net Asset Value, offering price and redemption price per share ($114,112 ÷ 10,800 shares) | | $ 10.57 |
A Redemption price per share is equal to net asset value less any applicable contingent deferred sales charge.
See accompanying notes which are an integral part of the financial statements.
Annual Report
Statement of Operations
| Year ended July 31, 2005 |
| | |
Investment Income | | |
Interest | | $ 17,207,680 |
| | |
Expenses | | |
Management fee | $ 1,558,348 | |
Transfer agent fees | 605,385 | |
Distribution fees | 21,368 | |
Accounting fees and expenses | 141,817 | |
Fund wide operations fee | 18,469 | |
Independent trustees' compensation | 1,960 | |
Custodian fees and expenses | 10,598 | |
Registration fees | 75,839 | |
Audit | 44,183 | |
Legal | 2,958 | |
Miscellaneous | 2,731 | |
Total expenses before reductions | 2,483,656 | |
Expense reductions | (119,592) | 2,364,064 |
Net investment income | | 14,843,616 |
Realized and Unrealized Gain (Loss) Net realized gain (loss) on: | | |
Investment securities | 3,976,436 | |
Swap agreements | 452,719 | |
Total net realized gain (loss) | | 4,429,155 |
Change in net unrealized appreciation (depreciation) on: Investment securities | 1,793,084 | |
Swap agreements | 72,263 | |
Total change in net unrealized appreciation (depreciation) | | 1,865,347 |
Net gain (loss) | | 6,294,502 |
Net increase (decrease) in net assets resulting from operations | | $ 21,138,118 |
See accompanying notes which are an integral part of the financial statements.
Annual Report
Financial Statements - continued
Statement of Changes in Net Assets
| Year ended
July 31,
2005 | Year ended
July 31,
2004 |
Increase (Decrease) in Net Assets | | |
Operations | | |
Net investment income | $ 14,843,616 | $ 8,771,927 |
Net realized gain (loss) | 4,429,155 | 937,699 |
Change in net unrealized appreciation (depreciation) | 1,865,347 | 707,007 |
Net increase (decrease) in net assets resulting
from operations | 21,138,118 | 10,416,633 |
Distributions to shareholders from net investment income | (14,221,483) | (8,644,971) |
Distributions to shareholders from net realized gain | (3,063,178) | (461,703) |
Total distributions | (17,284,661) | (9,106,674) |
Share transactions - net increase (decrease) | 53,654,454 | 292,125,223 |
Total increase (decrease) in net assets | 57,507,911 | 293,435,182 |
| | |
Net Assets | | |
Beginning of period | 374,250,755 | 80,815,573 |
End of period (including undistributed net investment income of $539,146 and undistributed net investment income of $79,241, respectively) | $ 431,758,666 | $ 374,250,755 |
See accompanying notes which are an integral part of the financial statements.
Annual Report
Financial Highlights - Class A
Years ended July 31, | 2005 | 2004F |
Selected Per-Share Data | | |
Net asset value, beginning of period | $ 10.46 | $ 10.31 |
Income from Investment Operations | | |
Net investment incomeE | .387 | .046 |
Net realized and unrealized gain (loss) | .183 | .145 |
Total from investment operations | .570 | .191 |
Distributions from net investment income | (.370) | (.041) |
Distributions from net realized gain | (.090) | - |
Total distributions | (.460) | (.041) |
Net asset value, end of period | $ 10.57 | $ 10.46 |
Total ReturnB,C,D | 5.52% | 1.85% |
Ratios to Average Net AssetsG | | |
Expenses before expense reductions | .96% | .87%A |
Expenses net of voluntary waivers, if any | .80% | .80%A |
Expenses net of all reductions | .80% | .80%A |
Net investment income | 3.69% | 3.51%A |
Supplemental Data | | |
Net assets, end of period (000 omitted) | $ 2,974 | $ 102 |
Portfolio turnover rate | 193% | 251% |
A Annualized
B Total returns for periods of less than one year are not annualized.
C Total returns would have been lower had certain expenses not been reduced during the periods shown.
D Total returns do not include the effect of the sales charges.
E Calculated based on average shares outstanding during the period.
F For the period June 16, 2004 (commencement of sale of shares) to July 31, 2004.
G Expense ratios reflect operating expenses of the class. Expenses before reductions do not reflect amounts reimbursed by the investment adviser or reductions from brokerage service arrangements or other expense offset arrangements and do not represent the amount paid by the class during periods when reimbursements or reductions occur. Expense ratios before reductions for start-up periods may not be representative of longer-term operating periods. Expenses net of any voluntary waivers reflect expenses after reimbursement by the investment adviser but prior to reductions from brokerage service arrangements or other expense offset arrangements. Expenses net of all reductions represent the net expenses paid by the class.
See accompanying notes which are an integral part of the financial statements.
Annual Report
Financial Highlights - Class T
Years ended July 31, | 2005 | 2004F |
Selected Per-Share Data | | |
Net asset value, beginning of period | $ 10.46 | $ 10.31 |
Income from Investment Operations | | |
Net investment incomeE | .377 | .045 |
Net realized and unrealized gain (loss) | .173 | .144 |
Total from investment operations | .550 | .189 |
Distributions from net investment income | (.360) | (.039) |
Distributions from net realized gain | (.090) | - |
Total distributions | (.450) | (.039) |
Net asset value, end of period | $ 10.56 | $ 10.46 |
Total ReturnB,C,D | 5.33% | 1.84% |
Ratios to Average Net AssetsG | | |
Expenses before expense reductions | 1.13% | .96%A |
Expenses net of voluntary waivers, if any | .90% | .90%A |
Expenses net of all reductions | .90% | .90%A |
Net investment income | 3.59% | 3.41%A |
Supplemental Data | | |
Net assets, end of period (000 omitted) | $ 5,739 | $ 102 |
Portfolio turnover rate | 193% | 251% |
A Annualized
B Total returns for periods of less than one year are not annualized.
C Total returns would have been lower had certain expenses not been reduced during the periods shown.
D Total returns do not include the effect of the sales charges.
E Calculated based on average shares outstanding during the period.
F For the period June 16, 2004 (commencement of sale of shares) to July 31, 2004.
G Expense ratios reflect operating expenses of the class. Expenses before reductions do not reflect amounts reimbursed by the investment adviser or reductions from brokerage service arrangements or other expense offset arrangements and do not represent the amount paid by the class during periods when reimbursements or reductions occur. Expense ratios before reductions for start-up periods may not be representative of longer-term operating periods. Expenses net of any voluntary waivers reflect expenses after reimbursement by the investment adviser but prior to reductions from brokerage service arrangements or other expense offset arrangements. Expenses net of all reductions represent the net expenses paid by the class.
See accompanying notes which are an integral part of the financial statements.
Annual Report
Financial Highlights - Class B
Years ended July 31, | 2005 | 2004F |
Selected Per-Share Data | | |
Net asset value, beginning of period | $ 10.46 | $ 10.31 |
Income from Investment Operations | | |
Net investment incomeE | .309 | .036 |
Net realized and unrealized gain (loss) | .182 | .145 |
Total from investment operations | .491 | .181 |
Distributions from net investment income | (.291) | (.031) |
Distributions from net realized gain | (.090) | - |
Total distributions | (.381) | (.031) |
Net asset value, end of period | $ 10.57 | $ 10.46 |
Total ReturnB,C,D | 4.74% | 1.76% |
Ratios to Average Net AssetsG | | |
Expenses before expense reductions | 1.75% | 1.62%A |
Expenses net of voluntary waivers, if any | 1.55% | 1.55%A |
Expenses net of all reductions | 1.55% | 1.55%A |
Net investment income | 2.94% | 2.76%A |
Supplemental Data | | |
Net assets, end of period (000 omitted) | $ 2,029 | $ 104 |
Portfolio turnover rate | 193% | 251% |
A Annualized
B Total returns for periods of less than one year are not annualized.
C Total returns would have been lower had certain expenses not been reduced during the periods shown.
D Total returns do not include the effect of the contingent deferred sales charge.
E Calculated based on average shares outstanding during the period.
F For the period June 16, 2004 (commencement of sale of shares) to July 31, 2004.
G Expense ratios reflect operating expenses of the class. Expenses before reductions do not reflect amounts reimbursed by the investment adviser or reductions from brokerage service arrangements or other expense offset arrangements and do not represent the amount paid by the class during periods when reimbursements or reductions occur. Expense ratios before reductions for start-up periods may not be representative of longer-term operating periods. Expenses net of any voluntary waivers reflect expenses after reimbursement by the investment adviser but prior to reductions from brokerage service arrangements or other expense offset arrangements. Expenses net of all reductions represent the net expenses paid by the class.
See accompanying notes which are an integral part of the financial statements.
Annual Report
Financial Highlights - Class C
Years ended July 31, | 2005 | 2004F |
Selected Per-Share Data | | |
Net asset value, beginning of period | $ 10.46 | $ 10.31 |
Income from Investment Operations | | |
Net investment incomeE | .299 | .035 |
Net realized and unrealized gain (loss) | .181 | .145 |
Total from investment operations | .480 | .180 |
Distributions from net investment income | (.280) | (.030) |
Distributions from net realized gain | (.090) | - |
Total distributions | (.370) | (.030) |
Net asset value, end of period | $ 10.57 | $ 10.46 |
Total ReturnB,C,D | 4.63% | 1.74% |
Ratios to Average Net AssetsG | | |
Expenses before expense reductions | 1.74% | 1.74%A |
Expenses net of voluntary waivers, if any | 1.65% | 1.65%A |
Expenses net of all reductions | 1.65% | 1.65%A |
Net investment income | 2.84% | 2.66%A |
Supplemental Data | | |
Net assets, end of period (000 omitted) | $ 677 | $ 142 |
Portfolio turnover rate | 193% | 251% |
A Annualized
B Total returns for periods of less than one year are not annualized.
C Total returns would have been lower had certain expenses not been reduced during the periods shown.
D Total returns do not include the effect of the contingent deferred sales charge.
E Calculated based on average shares outstanding during the period.
F For the period June 16, 2004 (commencement of sale of shares) to July 31, 2004.
G Expense ratios reflect operating expenses of the class. Expenses before reductions do not reflect amounts reimbursed by the investment adviser or reductions from brokerage service arrangements or other expense offset arrangements and do not represent the amount paid by the class during periods when reimbursements or reductions occur. Expense ratios before reductions for start-up periods may not be representative of longer-term operating periods. Expenses net of any voluntary waivers reflect expenses after reimbursement by the investment adviser but prior to reductions from brokerage service arrangements or other expense offset arrangements. Expenses net of all reductions represent the net expenses paid by the class.
See accompanying notes which are an integral part of the financial statements.
Annual Report
Financial Highlights - Total Bond
Years ended July 31, | 2005 | 2004 | 2003E |
Selected Per-Share Data | | | |
Net asset value, beginning of period | $ 10.46 | $ 10.28 | $ 10.00 |
Income from Investment Operations | | | |
Net investment incomeD | .411 | .340 | .232 |
Net realized and unrealized gain (loss) | .182 | .237 | .269 |
Total from investment operations | .593 | .577 | .501 |
Distributions from net investment income | (.393) | (.337) | (.221) |
Distributions from net realized gain | (.090) | (.060) | - |
Total distributions | (.483) | (.397) | (.221) |
Net asset value, end of period | $ 10.57 | $ 10.46 | $ 10.28 |
Total ReturnB,C | 5.75% | 5.68% | 5.01% |
Ratios to Average Net AssetsF | | | |
Expenses before expense reductions | .64% | .75% | 1.01%A |
Expenses net of voluntary waivers, if any | .61% | .65% | .65%A |
Expenses net of all reductions | .61% | .65% | .65%A |
Net investment income | 3.87% | 3.25% | 2.83%A |
Supplemental Data | | | |
Net assets, end of period (000 omitted) | $ 420,225 | $ 373,699 | $ 80,816 |
Portfolio turnover rate | 193% | 251% | 423%A |
A Annualized
B Total returns for periods of less than one year are not annualized.
C Total returns would have been lower had certain expenses not been reduced during the periods shown.
D Calculated based on average shares outstanding during the period.
E For the period October 15, 2002 (commencement of operations) to July 31, 2003.
F Expense ratios reflect operating expenses of the class. Expenses before reductions do not reflect amounts reimbursed by the investment adviser or reductions from brokerage service arrangements or other expense offset arrangements and do not represent the amount paid by the class during periods when reimbursements or reductions occur. Expense ratios before reductions for start-up periods may not be representative of longer-term operating periods. Expenses net of any voluntary waivers reflect expenses after reimbursement by the investment adviser but prior to reductions from brokerage service arrangements or other expense offset arrangements. Expenses net of all reductions represent the net expenses paid by the class.
See accompanying notes which are an integral part of the financial statements.
Annual Report
Financial Highlights - Institutional Class
Years ended July 31, | 2005 | 2004E |
Selected Per-Share Data | | |
Net asset value, beginning of period | $ 10.46 | $ 10.31 |
Income from Investment Operations | | |
Net investment incomeD | .410 | .048 |
Net realized and unrealized gain (loss) | .182 | .145 |
Total from investment operations | .592 | .193 |
Distributions from net investment income | (.392) | (.043) |
Distributions from net realized gain | (.090) | - |
Total distributions | (.482) | (.043) |
Net asset value, end of period | $ 10.57 | $ 10.46 |
Total ReturnB,C | 5.74% | 1.87% |
Ratios to Average Net AssetsF | | |
Expenses before expense reductions | .62% | .71%A |
Expenses net of voluntary waivers, if any | .62% | .65%A |
Expenses net of all reductions | .61% | .65%A |
Net investment income | 3.87% | 3.66%A |
Supplemental Data | | |
Net assets, end of period (000 omitted) | $ 114 | $ 102 |
Portfolio turnover rate | 193% | 251% |
A Annualized
B Total returns for periods of less than one year are not annualized.
C Total returns would have been lower had certain expenses not been reduced during the periods shown.
D Calculated based on average shares outstanding during the period.
E For the period June 16, 2004 (commencement of sale of shares) to July 31, 2004.
F Expense ratios reflect operating expenses of the class. Expenses before reductions do not reflect amounts reimbursed by the investment adviser or reductions from brokerage service arrangements or other expense offset arrangements and do not represent the amount paid by the class during periods when reimbursements or reductions occur. Expense ratios before reductions for start-up periods may not be representative of longer-term operating periods. Expenses net of any voluntary waivers reflect expenses after reimbursement by the investment adviser but prior to reductions from brokerage service arrangements or other expense offset arrangements. Expenses net of all reductions represent the net expenses paid by the class.
See accompanying notes which are an integral part of the financial statements.
Annual Report
Notes to Financial Statements
For the period ended July 31, 2005
1. Significant Accounting Policies.
Fidelity Total Bond Fund (the fund) is a non-diversified fund of Fidelity Income Fund (the trust) and is authorized to issue an unlimited number of shares. The trust is registered under the Investment Company Act of 1940, as amended (the 1940 Act), as an open-end management investment company organized as a Massachusetts business trust.
The fund offers Class A, Class T, Class B, Class C, Total Bond (the original class), and Institutional Class shares, each of which has equal rights as to assets and voting privileges. Each class has exclusive voting rights with respect to matters that affect that class. Class B shares will automatically convert to Class A shares after a holding period of seven years from the initial date of purchase. Investment income, realized and unrealized capital gains and losses, the common expenses of the fund, and certain fund-level expense reductions, if any, are allocated on a pro rata basis to each class based on the relative net assets of each class to the total net assets of the fund. Each class differs with respect to transfer agent and distribution and service plan fees incurred. Certain expense reductions also differ by class.
The fund may invest in affiliated money market central funds (Money Market Central Funds) and fixed-income Central Investment Portfolios (CIPs), collectively referred to as Central Funds, which are open-end investment companies available to investment companies and other accounts managed by Fidelity Management & Research Company (FMR) and its affiliates. The financial statements have been prepared in conformity with accounting principles generally accepted in the United States of America, which require management to make certain estimates and assumptions at the date of the financial statements. The following summarizes the significant accounting policies of the fund, which are also consistently followed by the Central Funds:
Security Valuation. Net asset value per share (NAV calculation) is calculated as of the close of business of the New York Stock Exchange, normally 4:00 p.m. Eastern time. Debt securities, including restricted securities, for which quotations are readily available are valued at their most recent bid prices (sales prices if the principal market is an exchange) in the principal market in which such securities are normally traded, as determined by recognized dealers in such securities, or securities are valued on the basis of information provided by a pricing service. Pricing services use valuation matrices that incorporate both dealer-supplied valuations and valuation models. Equity securities, including restricted securities, for which market quotations are available are valued at the last sale price or official closing price (closing bid price or last evaluated quote if no sale has occurred) on the primary market or exchange on which they trade. If prices are not readily available or do not accurately reflect fair value for a security, or if a security's value has been materially affected by events occurring after the close of the exchange or market on which the security is principally traded, that security may be valued by
Annual Report
Notes to Financial Statements - continued
1. Significant Accounting Policies - continued
Security Valuation - continued
another method that the Board of Trustees believes accurately reflects fair value. A security's valuation may differ depending on the method used for determining value. Price movements in futures contracts and ADRs, market and trading trends, the bid/ask quotes of brokers and off-exchange institutional trading may be reviewed in the course of making a good faith determination of a security's fair value. Short-term securities with remaining maturities of sixty days or less for which quotations are not readily available are valued on the basis of amortized cost. Investments in open-end investment companies, including Central Funds, are valued at their net asset value each business day.
Investment Transactions and Income. Security transactions, including the fund's investment activity in the Central Funds, are accounted for as of trade date. Gains and losses on securities sold are determined on the basis of identified cost. Interest income, including distributions from the Central Funds, is accrued as earned. Interest income includes coupon interest and amortization of premium and accretion of discount on debt securities. Debt obligations may be placed on non-accrual status and related interest income may be reduced by ceasing current accruals and writing off interest receivables when the collection of all or a portion of interest has become doubtful based on consistently applied procedures. A debt obligation is removed from non-accrual status when the issuer resumes interest payments or when collectibility of interest is reasonably assured.
Expenses. Most expenses of the trust can be directly attributed to a fund. Expenses which cannot be directly attributed are apportioned among each fund in the trust.
Income Tax Information and Distributions to Shareholders. Each year, the fund intends to qualify as a regulated investment company by distributing all of its taxable income and realized gains under Subchapter M of the Internal Revenue Code. As a result, no provision for income taxes is required in the accompanying financial statements.
Dividends are declared daily and paid monthly from net investment income. Distributions from realized gains, if any, are recorded on the ex-dividend date. Income dividends and capital gain distributions are declared separately for each class. Income and capital gain distributions are determined in accordance with income tax regulations, which may differ from generally accepted accounting principles. In addition, the fund will claim a portion of the payment made to redeeming shareholders as a distribution for income tax purposes. Capital accounts within the financial statements are adjusted for permanent book-tax differences. These adjustments have no impact on net assets or the results of operations. Temporary book-tax differences will reverse in a subsequent period.
Annual Report
1. Significant Accounting Policies - continued
Income Tax Information and Distributions to Shareholders - continued
Book-tax differences are primarily due to short-term capital gains, prior period premium and discount on debt securities, market discount, financing transactions and losses deferred due to wash sales.
The tax-basis components of distributable earnings and the federal tax cost as of period end were as follows:
Unrealized appreciation | $ 4,501,366 | |
Unrealized depreciation | (3,549,084) | |
Net unrealized appreciation (depreciation) | 952,282 | |
Undistributed ordinary income | 1,565,014 | |
Undistributed long-term capital gain | 634,305 | |
| | |
Cost for federal income tax purposes | $ 468,403,626 | |
The tax character of distributions paid was as follows:
| July 31, 2005 | July 31, 2004 |
Ordinary Income | $ 16,942,281 | $ 9,106,674 |
Long-term Capital Gains | 342,380 | - |
Total | $ 17,284,661 | $ 9,106,674 |
2. Operating Policies.
Repurchase Agreements. FMR has received an Exemptive Order from the Securities and Exchange Commission (the SEC) which permits the fund and other affiliated entities of FMR to transfer uninvested cash balances into joint trading accounts which are then invested in repurchase agreements. The fund may also invest directly with institutions in repurchase agreements. Repurchase agreements are collateralized by government or non-government securities. Collateral is held in segregated accounts with custodian banks and may be obtained in the event of a default of the counterparty. The fund monitors, on a daily basis, the value of the collateral to ensure it is at least equal to the principal amount of the repurchase agreement (including accrued interest). In the event of a default by the counterparty, realization of the collateral proceeds could be delayed, during which time the value of the collateral may decline.
Annual Report
Notes to Financial Statements - continued
2. Operating Policies - continued
Delayed Delivery Transactions and When-Issued Securities. The fund may purchase or sell securities on a delayed delivery or when-issued basis. Payment and delivery may take place after the customary settlement period for that security. The price of the underlying securities and the date when the securities will be delivered and paid for are fixed at the time the transaction is negotiated. During the time a delayed delivery sell is outstanding, the contract is marked-to-market daily and equivalent deliverable securities are held for the transaction. The value of the securities purchased on a delayed delivery or when-issued basis are identified as such in the fund's Schedule of Investments. The fund may receive compensation for interest forgone in the purchase of a delayed delivery or when-issued security. With respect to purchase commitments, the fund identifies securities as segregated in its records with a value at least equal to the amount of the commitment. Losses may arise due to changes in the value of the underlying securities or if the counterparty does not perform under the contract's terms, or if the issuer does not issue the securities due to political, economic, or other factors.
Restricted Securities. The fund may invest in securities that are subject to legal or contractual restrictions on resale. These securities generally may be resold in transactions exempt from registration or to the public if the securities are registered. Disposal of these securities may involve time-consuming negotiations and expense, and prompt sale at an acceptable price may be difficult. Information regarding restricted securities is included at the end of the fund's Schedule of Investments.
Loans and Other Direct Debt Instruments. The fund may invest in loans and loan participations, trade claims or other receivables. These investments may include standby financing commitments, including revolving credit facilities, that obligate the fund to supply additional cash to the borrower on demand. Loan participations involve a risk of insolvency of the lending bank or other financial intermediary.
Swap Agreements. The fund may invest in swaps for the purpose of managing its exposure to interest rate, credit or market risk.
Interest rate swaps are agreements to exchange cash flows periodically based on a notional principal amount, for example, the exchange of fixed rate interest payments for floating rate interest payments. Periodic payments received or made by the fund are recorded in the accompanying Statement of Operations as realized gains or losses, respectively. The primary risk associated with interest rate swaps is that unfavorable changes in the fluctuation of interest rates could adversely impact a fund.
Annual Report
2. Operating Policies - continued
Swap Agreements - continued
Total return swaps are agreements to exchange the return generated by one instrument or index for the return generated by another instrument, for example, the agreement to pay interest in exchange for a market-linked return based on a notional amount. To the extent the total return of the index exceeds the offsetting interest obligation, a fund will receive a payment from the counterparty. To the extent it is less, a fund will make a payment to the counterparty. Periodic payments received or made by the fund are recorded in the accompanying Statement of Operations as realized gains or losses, respectively.
Credit default swaps involve the exchange of a fixed rate premium for protection against the loss in value of an underlying debt instrument in the event of a defined credit event (such as payment default or bankruptcy). Under the terms of the swap, one party acts as a "guarantor" receiving a periodic payment that is a fixed percentage applied to a notional principal amount. In return the party agrees to purchase the notional amount of the underlying instrument, at par, if a credit event occurs during the term of the swap. The fund may enter into credit default swaps in which either it or its counterparty act as guarantors. By acting as the guarantor of a swap, a fund assumes the market and credit risk of the underlying instrument including liquidity and loss of value. Periodic payments and premiums received or made by the fund are recorded in the accompanying Statement of Operations as realized gains or losses, respectively.
Swaps are marked-to-market daily based on dealer-supplied valuations and changes in value are recorded as unrealized appreciation (depreciation). Gains or losses are realized upon early termination of the swap agreement. Collateral, in the form of cash or securities, may be required to be held in segregated accounts with a fund's custodian in compliance with swap contracts. Risks may exceed amounts recognized on the Statement of Assets and Liabilities. These risks include changes in the returns of the underlying instruments, failure of the counterparties to perform under the contracts' terms and the possible lack of liquidity with respect to the swap agreements. Details of swap agreements open at period end are included in the fund's Schedule of Investments under the caption "Swap Agreements."
Mortgage Dollar Rolls. To earn additional income, the fund may employ trading strategies which involve the sale and simultaneous agreement to repurchase similar securities ("mortgage dollar rolls") or the purchase and simultaneous agreement to sell similar securities ("reverse mortgage dollar rolls"). The securities traded are mortgage securities and bear the same interest rate but may be collateralized by different pools of mortgages. During the period between the sale and repurchase in a mortgage dollar roll transaction, a fund will not be entitled to receive interest and principal payments on the securities sold but will invest the proceeds of the sale in other securities which may
Annual Report
Notes to Financial Statements - continued
2. Operating Policies - continued
Mortgage Dollar Rolls - continued
enhance the yield and total return. In addition, the difference between the sale price and the future purchase price is recorded as an adjustment to investment income. During the period between the purchase and subsequent sale in a reverse mortgage dollar roll transaction a fund is entitled to interest and principal payments on the securities purchased. The price differential between the purchase and sale is recorded as an adjustment to investment income. Losses may arise due to changes in the value of the securities or if the counterparty does not perform under the terms of the agreement. If the counterparty files for bankruptcy or becomes insolvent, a fund's right to repurchase or sell securities may be limited.
3. Purchases and Sales of Investments.
Purchases and sales of securities, other than short-term securities and U.S. government securities, aggregated $104,158,635 and $90,216,988, respectively.
4. Fees and Other Transactions with Affiliates.
Management Fee. FMR and its affiliates provide the fund with investment management related services for which the fund pays a monthly management fee. The management fee is the sum of an individual fund fee rate that is based on an annual rate of .30% of the fund's average net assets (effective June 1, 2005, the fund's management contract was amended, reducing the individual fund fee rate to .20% of average net assets) and a group fee rate that averaged .12% during the period. The group fee rate is based upon the average net assets of all the mutual funds advised by FMR. The group fee rate decreases as assets under management increase and increases as assets under management decrease. For the period, the total annual management fee rate was .41% of the fund's average net assets.
Distribution and Service Plan. In accordance with Rule 12b-1 of the 1940 Act, the fund has adopted separate Distribution and Service Plans for each class of shares. Certain classes pay Fidelity Distributors Corporation (FDC), an affiliate of FMR, separate Distribution and Service Fees, each of which is based on an annual percentage of each class' average net assets. In addition, FDC may pay financial intermediaries for selling
Annual Report
4. Fees and Other Transactions with Affiliates - continued
Distribution and Service Plan - continued
shares of the fund and providing shareholder support services. For the period, the Distribution and Service Fee rates and the total amounts paid to and retained by FDC were as follows:
| Distribution
Fee | Service
Fee | Paid to
FDC | Retained
by FDC |
Class A | 0% | .15% | $ 1,883 | $ 146 |
Class T | 0% | .25% | 6,580 | 3,420 |
Class B | .65% | .25% | 8,844 | 6,641 |
Class C | .75% | .25% | 4,061 | 2,940 |
| | | $ 21,368 | $ 13,147 |
FDC receives a front-end sales charge of up to 4.75% for selling Class A shares, and 3.50% for selling Class T shares, some of which is paid to financial intermediaries for selling shares of the fund. FDC receives the proceeds of contingent deferred sales charges levied on Class A, Class T, Class B, and Class C redemptions. These charges depend on the holding period. The deferred sales charges range from 5% to 1% for Class B, 1% for Class C, and .25% for certain purchases of Class A and Class T shares.
For the period, sales charge amounts retained by FDC were as follows:
| Retained
by FDC |
Class A | $ 2,763 |
Class T | 768 |
Class B* | 2,261 |
Class C* | 40 |
| $ 5,832 |
* When Class B and Class C shares are initially sold, FDC pays commissions from its own resources to financial intermediaries through which the sales are made.
Transfer Agent Fees. Fidelity Investments Institutional Operations Company, Inc. (FIIOC), an affiliate of FMR, is the transfer, dividend disbursing and shareholder servicing agent for each class of the fund, except for Total Bond. Fidelity Service Company, Inc. (FSC), an affiliate of FMR, is the transfer agent for Total Bond shares. FIIOC and FSC receive account fees and asset-based fees that vary according to the account size and type of account of the shareholders of the respective classes of the fund. FIIOC and FSC pay for typesetting, printing and mailing of shareholder reports, except proxy statements.
Annual Report
Notes to Financial Statements - continued
4. Fees and Other Transactions with Affiliates - continued
Transfer Agent Fees - continued
Under an amended contract effective June 1, 2005, transfer agent fees for the Total Bond class consist of an asset based fee and were reduced to a rate of .10% of average net assets. The account fees were eliminated. For the period the total transfer agent fees paid by each class to FIIOC or FSC, were as follows:
| Amount | % of
Average
Net Assets |
Class A | $ 4,554 | .36 |
Class T | 11,173 | .43 |
Class B | 3,849 | .39 |
Class C | 1,101 | .27 |
Total Bond | 584,567 | .15 |
Institutional Class | 141 | .13 |
| $ 605,385 | |
Accounting Fees. FSC maintains the fund's accounting records. The fee is based on the level of average net assets for the month. Effective June 1, 2005, FMR pays these fees.
Fundwide Operations Fee. Pursuant to a new Fundwide Operations and Expense Agreement (FWOE) effective on June 1, 2005, FMR has agreed to provide for fund level expenses (which do not include transfer agent, Rule 12b-1 fees, the compensation of the independent trustees or other extraordinary expenses) in return for a FWOE fee equal to .35% less the total amount of the management fee. The FWOE paid by the fund is reduced by an amount equal to the fees and expenses paid to the independent trustees. For the period, the FWOE fee was equivalent to .005% of average net assets.
Affiliated Central Funds. The fund may invest in Money Market Central Funds which seek preservation of capital and current income and are managed by Fidelity Investments Money Management, Inc. (FIMM) an affiliate of FMR.
The fund may also invest in CIPs managed by FIMM. The Ultra-Short Central Fund seeks to obtain a high level of current income consistent with preservation of capital by investing in U.S. dollar-denominated money market and investment grade debt securities and repurchase agreements.
The fund's Schedule of Investments lists the CIP as an investment of the fund but does not include the underlying holdings of the CIP. Based on its investment objectives, the CIP may invest or participate in various investment vehicles or strategies such as delayed delivery and when-issued securities, derivatives, financing transactions and restricted
Annual Report
4. Fees and Other Transactions with Affiliates - continued
Affilliated Central Funds - continued
securities. These strategies are consistent with the investment objectives of the fund and may involve certain economic risks, including the risk that a counterparty to one or more of these transactions may be unable or unwilling to comply with the terms of the governing agreement. This may result in a decline in value of the CIP and the fund.
A complete list of holdings for the CIP is available at the end of this report. In addition, a copy of the CIP's financial statements is available on the EDGAR Database on the SEC's website www.sec.gov, or at the Commission's public reference room in Washington, DC.
The Central Funds do not pay a management fee. Income distributions earned by the fund are recorded as income in the accompanying financial statements and totaled $1,272,185 for the period.
5. Committed Line of Credit.
The fund participates with other funds managed by FMR in a $4.2 billion credit facility (the "line of credit") to be utilized for temporary or emergency purposes to fund shareholder redemptions or for other short-term liquidity purposes. The fund has agreed to pay commitment fees on its pro rata portion of the line of credit. During the period, there were no borrowings on this line of credit.
6. Expense Reductions.
FMR voluntarily agreed to reimburse each class to the extent annual operating expenses exceeded certain levels of average net assets as noted in the table below. Some expenses, for example interest expense, are excluded from this reimbursement.
The following classes were in reimbursement during the period:
| Expense
Limitations | Reimbursement
from adviser |
| | |
Class A | .80% | $ 2,017 |
Class T | .90% | 5,981 |
Class B | 1.55% | 1,959 |
Class C | 1.65% | 357 |
Total Bond | .65%* | 102,259 |
Institutional Class | .65% | - |
| | $ 112,573 |
* Effective June 1, 2005 the expense limitation was eliminated for Total Bond.
Annual Report
Notes to Financial Statements - continued
6. Expense Reductions - continued
In addition, through arrangements with the fund's custodian, credits realized as a result of uninvested cash balances were used to reduce the fund's expenses. During the period, these credits reduced the fund's custody expenses by $7,019.
7. Other.
The fund's organizational documents provide former and current trustees and officers with a limited indemnification against liabilities arising in connection with the performance of their duties to the fund. In the normal course of business, the fund may also enter into contracts that provide general indemnifications. The fund's maximum exposure under these arrangements is unknown as this would be dependent on future claims that may be made against the fund. The risk of material loss from such claims is considered remote.
8. Distributions to Shareholders.
Distributions to shareholders of each class were as follows:
| Years ended July 31, |
| 2005 | 2004A |
From net investment income | | |
Class A | $ 44,038 | $ 394 |
Class T | 89,638 | 382 |
Class B | 27,061 | 301 |
Class C | 10,692 | 386 |
Total Bond | 14,046,106 | 8,643,095 |
Institutional Class | 3,948 | 413 |
Total | $ 14,221,483 | $ 8,644,971 |
From net realized gain | | |
Class A | $ 1,823 | $ - |
Class T | 2,706 | - |
Class B | 2,453 | - |
Class C | 2,151 | - |
Total Bond | 3,053,158 | 461,703 |
Institutional Class | 887 | - |
Total | $ 3,063,178 | $ 461,703 |
A Distributions for Class A, Class T, Class B, Class C, and Institutional Class are for the period June 16, 2004 (commencement of sale of shares) to July 31, 2004.
Annual Report
9. Share Transactions.
Transactions for each class of shares were as follows:
| Shares
Years ended July 31, | Dollars
Years ended July 31, |
| 2005 | 2004A | 2005 | 2004A |
Class A | | | | |
Shares sold | 284,201 | 9,699 | $ 3,006,382 | $ 100,000 |
Reinvestment of distributions | 4,224 | 38 | 44,746 | 394 |
Shares redeemed | (16,733) | - | (177,183) | - |
Net increase (decrease) | 271,692 | 9,737 | $ 2,873,945 | $ 100,394 |
Class T | | | | |
Shares sold | 640,420 | 9,699 | $ 6,767,881 | $ 100,000 |
Reinvestment of distributions | 8,561 | 37 | 90,624 | 382 |
Shares redeemed | (115,159) | - | (1,215,824) | - |
Net increase (decrease) | 533,822 | 9,736 | $ 5,642,681 | $ 100,382 |
Class B | | | | |
Shares sold | 198,926 | 9,950 | $ 2,105,652 | $ 102,625 |
Reinvestment of distributions | 2,416 | 29 | 25,606 | 301 |
Shares redeemed | (19,350) | - | (204,667) | - |
Net increase (decrease) | 181,992 | 9,979 | $ 1,926,591 | $ 102,926 |
Class C | | | | |
Shares sold | 64,313 | 13,566 | $ 682,289 | $ 140,062 |
Reinvestment of distributions | 1,008 | 37 | 10,695 | 386 |
Shares redeemed | (14,837) | - | (156,875) | - |
Net increase (decrease) | 50,484 | 13,603 | $ 536,109 | $ 140,448 |
Total Bond | | | | |
Shares sold | 15,519,844 | 34,227,901 | $ 164,657,854 | $ 358,024,636 |
Reinvestment of distributions | 1,546,242 | 845,761 | 16,406,907 | 8,865,286 |
Shares redeemed | (13,038,155) | (7,201,869) | (138,400,918) | (75,309,262) |
Net increase (decrease) | 4,027,931 | 27,871,793 | $ 42,663,843 | $ 291,580,660 |
Institutional Class | | | | |
Shares sold | 615 | 9,699 | $ 6,559 | $ 100,000 |
Reinvestment of distributions | 453 | 40 | 4,801 | 413 |
Shares redeemed | (7) | - | (75) | - |
Net increase (decrease) | 1,061 | 9,739 | $ 11,285 | $ 100,413 |
A Share transactions for Class A, Class T, Class B, Class C, and Institutional Class are for the period June 16, 2004 (commencement of sale of shares) to July 31, 2004.
Annual Report
Report of Independent Registered Public Accounting Firm
To the Trustees of Fidelity Income Fund and the Shareholders of Fidelity Total Bond Fund:
In our opinion, the accompanying statement of assets and liabilities, including the schedule of investments, and the related statements of operations and of changes in net assets and the financial highlights present fairly, in all material respects, the financial position of Fidelity Total Bond Fund (a fund of Fidelity Income Fund) at July 31, 2005 and the results of their operations, the changes in their net assets and the financial highlights for the periods indicated, in conformity with accounting principles generally accepted in the United States of America. These financial statements and financial highlights (hereafter referred to as "financial statements") are the responsibility of the Fidelity Total Bond Fund's management; our responsibility is to express an opinion on these financial statements based on our audits. We conducted our audits of these financial statements in accordance with the standards of the Public Company Accounting Oversight Board (United States). Those standards require that we plan and perform the audit to obtain reasonable assurance about whether the financial statements are free of material misstatement. An audit includes examining, on a test basis, evidence supporting the amounts and disclosures in the financial statements, assessing the accounting principles used and significant estimates made by management, and evaluating the overall financial statement presentation. We believe that our audits, which included confirmation of securities at July 31, 2005 by correspondence with the custodian and brokers, provide a reasonable basis for our opinion.
/s/ PricewaterhouseCoopers LLP
PricewaterhouseCoopers LLP
Boston, Massachusetts
September 13, 2005
Annual Report
Trustees and Officers
The Trustees, Members of the Advisory Board, and executive officers of the trust and fund, as applicable, are listed below. The Board of Trustees governs the fund and is responsible for protecting the interests of shareholders. The Trustees are experienced executives who meet periodically throughout the year to oversee the fund's activities, review contractual arrangements with companies that provide services to the fund, and review the fund's performance. Except for William O. McCoy, Stephen P. Jonas, and Kenneth L. Wolfe, each of the Trustees oversees 320 funds advised by FMR or an affiliate. Mr. McCoy oversees 322 funds advised by FMR or an affiliate. Mr. Jonas and Mr. Wolfe oversee 311 funds advised by FMR or an affiliate.
The Trustees hold office without limit in time except that (a) any Trustee may resign; (b) any Trustee may be removed by written instrument, signed by at least two-thirds of the number of Trustees prior to such removal; (c) any Trustee who requests to be retired or who has become incapacitated by illness or injury may be retired by written instrument signed by a majority of the other Trustees; and (d) any Trustee may be removed at any special meeting of shareholders by a two-thirds vote of the outstanding voting securities of the trust. Each Trustee who is not an interested person (as defined in the 1940 Act) (Independent Trustee), shall retire not later than the last day of the calendar year in which his or her 72nd birthday occurs. The Independent Trustees may waive this mandatory retirement age policy with respect to individual Trustees. The executive officers and Advisory Board Members hold office without limit in time, except that any officer and Advisory Board Member may resign or may be removed by a vote of a majority of the Trustees at any regular meeting or any special meeting of the Trustees. Except as indicated, each individual has held the office shown or other offices in the same company for the past five years.
The fund's Statement of Additional Information (SAI) includes more information about the Trustees. To request a free copy, call Fidelity at 1-877-208-0098.
Interested Trustees*:
Correspondence intended for each Trustee who is an interested person may be sent to Fidelity Investments, 82 Devonshire Street, Boston, Massachusetts 02109.
Name, Age; Principal Occupation |
Edward C. Johnson 3d (75)** |
| Year of Election or Appointment:1984 Mr. Johnson is Chairman of the Board of Trustees. Mr. Johnson serves as Chief Executive Officer, Chairman, and a Director of FMR Corp.; a Director and Chairman of the Board and of the Executive Committee of FMR; Chairman and a Director of Fidelity Management & Research (Far East) Inc.; Chairman and a Director of Fidelity Investments Money Management, Inc.; and Chairman (2001-present) and a Director (2000-present) of FMR Co., Inc. |
Abigail P. Johnson (43)** |
| Year of Election or Appointment: 2001 Ms. Johnson serves as President of Fidelity Employer Services Company (FESCO) (2005-present). She is President and a Director of Fidelity Investments Money Management, Inc. (2001-present), FMR Co., Inc. (2001-present), and a Director of FMR Corp. Previously, Ms. Johnson served as President and a Director of FMR (2001-2005), Senior Vice President of the Fidelity funds (2001-2005), and managed a number of Fidelity funds. |
Stephen P. Jonas (52) |
| Year of Election or Appointment: 2005 Mr. Jonas is Senior Vice President of the fund (2005-present). He also serves as Senior Vice President of other Fidelity funds (2005-present). Mr. Jonas is Executive Director of FMR (2005-present). Previously, Mr. Jonas served as President of Fidelity Enterprise Operations and Risk Services (2004-2005), Chief Administrative Officer (2002-2004), and Chief Financial Officer of FMR Co. (1998-2000). Mr. Jonas has been with Fidelity Investments since 1987 and has held various financial and management positions including Chief Financial Officer of FMR. In addition, he serves on the Boards of Boston Ballet (2003-present) and Simmons College (2003-present). |
Robert L. Reynolds (53) |
| Year of Election or Appointment: 2003 Mr. Reynolds is a Director (2003-present) and Chief Operating Officer (2002-present) of FMR Corp. He also serves on the Board at Fidelity Investments Canada, Ltd. (2000-present). Previously, Mr. Reynolds served as President of Fidelity Investments Institutional Retirement Group (1996-2000). |
* Trustees have been determined to be "Interested Trustees" by virtue of, among other things, their affiliation with the trust or various entities under common control with FMR.
** Edward C. Johnson 3d, Trustee, is Abigail P. Johnson's father.
Annual Report
Independent Trustees:
Correspondence intended for each Independent Trustee (that is, the Trustees other than the Interested Trustees) may be sent to Fidelity Investments, P.O. Box 55235, Boston, Massachusetts 02205-5235.
Name, Age; Principal Occupation |
Dennis J. Dirks (57) |
| Year of Election or Appointment: 2005 Prior to his retirement in May 2003, Mr. Dirks was Chief Operating Officer and a member of the Board of The Depository Trust & Clearing Corporation (DTCC) (1999-2003). He also served as President, Chief Operating Officer, and Board member of The Depository Trust Company (DTC) (1999-2003) and President and Board member of the National Securities Clearing Corporation (NSCC) (1999-2003). In addition, Mr. Dirks served as Chief Executive Officer and Board member of the Government Securities Clearing Corporation (2001-2003) and Chief Executive Officer and Board member of the Mortgage-Backed Securities Clearing Corporation (2001-2003). Mr. Dirks also serves as a Trustee of Manhattan College (2005-present). |
Robert M. Gates (61) |
| Year of Election or Appointment: 1997 Dr. Gates is Vice Chairman of the Independent Trustees (2005-present). Dr. Gates is President of Texas A&M University (2002-present). He was Director of the Central Intelligence Agency (CIA) from 1991 to 1993. From 1989 to 1991, Dr. Gates served as Assistant to the President of the United States and Deputy National Security Advisor. Dr. Gates is a Director of NACCO Industries, Inc. (mining and manufacturing), Parker Drilling Co., Inc. (drilling and rental tools for the energy industry, 2001-present), and Brinker International (restaurant management, 2003-present). Previously, Dr. Gates served as a Director of LucasVarity PLC (automotive components and diesel engines), a Director of TRW Inc. (automotive, space, defense, and information technology), and Dean of the George Bush School of Government and Public Service at Texas A&M University (1999-2001). Dr. Gates also is a Trustee of the Forum for International Policy. |
George H. Heilmeier (69) |
| Year of Election or Appointment: 2004 Dr. Heilmeier is Chairman Emeritus of Telcordia Technologies (communication software and systems), where prior to his retirement, he served as company Chairman and Chief Executive Officer. He currently serves on the Boards of Directors of The Mitre Corporation (systems engineering and information technology support for the government), and HRL Laboratories (private research and development, 2004-present). He is Chairman of the General Motors Science & Technology Advisory Board and a Life Fellow of the Institute of Electrical and Electronics Engineers (IEEE) (2000-present). Dr. Heilmeier is a member of the Defense Science Board and the National Security Agency Advisory Board. He is also a member of the National Academy of Engineering, the American Academy of Arts and Sciences, and the Board of Overseers of the School of Engineering and Applied Science of the University of Pennsylvania. Previously, Dr. Heilmeier served as a Director of TRW Inc. (automotive, space, defense, and information technology, 1992-2002), Compaq (1994-2002), Automatic Data Processing, Inc. (ADP) (technology-based business outsourcing, 1995-2002), INET Technologies Inc. (telecommunications network surveillance, 2001-2004), and Teletech Holdings (customer management services). He is the recipient of the 2005 Kyoto Prize in Advanced Technology for his invention of the liquid display. |
Marie L. Knowles (58) |
| Year of Election or Appointment: 2001 Prior to Ms. Knowles' retirement in June 2000, she served as Executive Vice President and Chief Financial Officer of Atlantic Richfield Company (ARCO) (diversified energy, 1996-2000). From 1993 to 1996, she was a Senior Vice President of ARCO and President of ARCO Transportation Company. She served as a Director of ARCO from 1996 to 1998. She currently serves as a Director of Phelps Dodge Corporation (copper mining and manufacturing) and McKesson Corporation (healthcare service, 2002-present). Ms. Knowles is a Trustee of the Brookings Institution and the Catalina Island Conservancy and also serves as a member of the Advisory Board for the School of Engineering of the University of Southern California. |
Ned C. Lautenbach (61) |
| Year of Election or Appointment: 2000 Mr. Lautenbach has been a partner of Clayton, Dubilier & Rice, Inc. (private equity investment firm) since September 1998. Previously, Mr. Lautenbach was with the International Business Machines Corporation (IBM) from 1968 until his retirement in 1998. Mr. Lautenbach serves as a Director of Italtel Holding S.p.A. (telecommunications (Milan, Italy), 2004-present) and Eaton Corporation (diversified industrial) as well as the Philharmonic Center for the Arts in Naples, Florida. He also is a member of the Board of Trustees of Fairfield University (2005-present), as well as a member of the Council on Foreign Relations. |
Marvin L. Mann (72) |
| Year of Election or Appointment: 1993 Mr. Mann is Chairman of the Independent Trustees (2001-present). He is Chairman Emeritus of Lexmark International, Inc. (computer peripherals), where he served as CEO until April 1998, retired as Chairman May 1999, and remains a member of the Board. Prior to 1991, he held the positions of Vice President of International Business Machines Corporation (IBM) and President and General Manager of various IBM divisions and subsidiaries. He is a member of the Executive Committee of the Independent Director's Council of the Investment Company Institute. In addition, Mr. Mann is a member of the President's Cabinet at the University of Alabama and the Board of Visitors of the Culverhouse College of Commerce and Business Administration at the University of Alabama. |
William O. McCoy (71) |
| Year of Election or Appointment: 1997 Prior to his retirement in December 1994, Mr. McCoy was Vice Chairman of the Board of BellSouth Corporation (telecommunications) and President of BellSouth Enterprises. He is currently a Director of Liberty Corporation (holding company), Duke Realty Corporation (real estate), and Progress Energy, Inc. (electric utility). He is also a partner of Franklin Street Partners (private investment management firm) and a member of the Research Triangle Foundation Board. In addition, Mr. McCoy served as the Interim Chancellor (1999-2000) and a member of the Board of Visitors for the University of North Carolina at Chapel Hill and currently serves on the Board of Directors of the University of North Carolina Health Care System and the Board of Visitors of the Kenan-Flagler Business School (University of North Carolina at Chapel Hill). He also served as Vice President of Finance for the University of North Carolina (16-school system). |
Cornelia M. Small (61) |
| Year of Election or Appointment: 2005 Ms. Small is a member (2000-present) and Chairperson (2002-present) of the Investment Committee, and a member (2002-present) of the Board of Trustees of Smith College. Previously, she served as Chief Investment Officer (1999-2000), Director of Global Equity Investments (1996-1999), and a member of the Board of Directors of Scudder, Stevens & Clark (1990-1997) and Scudder Kemper Investments (1997-1998). In addition, Ms. Small served as Co-Chair (2000-2003) of the Annual Fund for the Fletcher School of Law and Diplomacy. |
William S. Stavropoulos (66) |
| Year of Election or Appointment: 2001 Mr. Stavropoulos is Chairman of the Board (2000-present) and a Member of the Board of Directors of The Dow Chemical Company. Since joining The Dow Chemical Company in 1967, Mr. Stavropoulos served in numerous senior management positions, including President (1993-2000; 2002-2003), CEO (1995-2000; 2002-2004), and Chairman of the Executive Committee (2000-2004). Currently, he is a Director of NCR Corporation (data warehousing and technology solutions), BellSouth Corporation (telecommunications), Chemical Financial Corporation, Maersk Inc. (industrial conglomerate, 2002-present), and Metalmark Capital (private equity investment firm, 2005-present). He also serves as a member of the Board of Trustees of the American Enterprise Institute for Public Policy Research. In addition, Mr. Stavropoulos is a member of The Business Council, J.P. Morgan International Council and the University of Notre Dame Advisory Council for the College of Science. |
Kenneth L. Wolfe (66) |
| Year of Election or Appointment: 2005 Mr. Wolfe also serves as a Trustee (2005-present) or Member of the Advisory Board (2004-present) of other investment companies advised by FMR. Prior to his retirement in 2001, Mr. Wolfe was Chairman and Chief Executive Officer of Hershey Foods Corporation (1993-2001). He currently serves as a member of the boards of Adelphia Communications Corporation (2003-present), Bausch & Lomb, Inc., and Revlon Inc. (2004-present). |
Annual Report
Advisory Board Members and Executive Officers:
Correspondence intended for Mr. Gamper may be sent to Fidelity Investments, P.O. Box 55235, Boston, Massachusetts 02205-5235. Correspondence intended for each executive officer and Mr. Lynch may be sent to Fidelity Investments, 82 Devonshire Street, Boston, Massachusetts 02109.
Name, Age; Principal Occupation |
Albert R. Gamper, Jr. (63) |
| Year of Election or Appointment: 2005 Member of the Advisory Board of Fidelity Income Fund. Prior to his retirement in December 2004, Mr. Gamper served as Chairman of the Board of CIT Group Inc. (commercial finance). During his tenure with CIT Group Inc. Mr. Gamper served in numerous senior management positions, including Chairman (1987-1989; 1999-2001; 2002-2004), Chief Executive Officer (1987-2004), and President (1989-2002). He currently serves as a member of the Board of Directors of Public Enterprise Group (utilities, 2001-present), Chairman of the Board of Governors, Rutgers University (2004-present), and Chairman of the Board of Saint Barnabas Health Care System. |
Peter S. Lynch (61) |
| Year of Election or Appointment: 2003 Member of the Advisory Board of Fidelity Income Fund. Vice Chairman and a Director of FMR, and Vice Chairman (2001-present) and a Director (2000-present) of FMR Co., Inc. Previously, Mr. Lynch served as a Trustee of the Fidelity funds (1990-2003). In addition, he serves as a Trustee of Boston College, Massachusetts Eye & Ear Infirmary, Historic Deerfield, John F. Kennedy Library, and the Museum of Fine Arts of Boston. |
David L. Murphy (57) |
| Year of Election or Appointment: 2005 Vice President of the fund. Mr. Murphy also serves as Vice President of Fidelity's Money Market Funds (2002-present), certain Asset Allocation Funds (2003-present), Fidelity's Investment Grade-Bond Funds (2005-present), and Fidelity's Balanced Funds (2005-present). He serves as Senior Vice President (2000-present) and Head (2004-present) of the Fidelity Investments Fixed Income Division. Mr. Murphy is also a Senior Vice President of FIMM (2003-present) and a Vice President of FMR (2000-present). Previously, Mr. Murphy served as Money Market Group Leader (2002-2004), Bond Group Leader (2000-2002), and Vice President of Fidelity's Taxable Bond Funds (2000-2002) and Fidelity's Municipal Bond Funds (2001-2002). Mr. Murphy joined Fidelity Investments in 1989 as a portfolio manager in the Bond Group. |
Thomas J. Silvia (44) |
| Year of Election or Appointment: 2005 Vice President of the fund. Mr. Silvia also serves as Vice President of Fidelity's Bond Funds (2005-present) and Senior Vice President and Bond Group Leader of the Fidelity Investments Fixed-Income Division (2005-present). Previously, Mr. Silvia served as Director of Fidelity's Taxable Bond portfolio managers (2002-2004) and a portfolio manager in the Bond Group (1997-2004). |
Walter C. Donovan (43) |
| Year of Election or Appointment: 2005 Vice President of the fund. Mr. Donovan also serves as Vice President of Fidelity's High Income Funds (2005-present), Fidelity's Fixed-Income Funds (2005-present), certain Asset Allocation Funds (2005-present), and certain Balanced Funds (2005-present). Mr. Donovan also serves as Executive Vice President of FMR (2005-present) and FMRC (2005-present). Previously, Mr. Donovan served as Vice President and Director of Fidelity's International Equity Trading group (1998-2005). |
Ford E. O'Neil (43) |
| Year of Election or Appointment: 2005 Vice President of the fund. Mr. O'Neil also serves as Vice President of other funds advised by FMR. |
Eric D. Roiter (56) |
| Year of Election or Appointment: 2002 Secretary of the fund. He also serves as Secretary of other Fidelity funds; Vice President, General Counsel, and Secretary of FMR Co., Inc. (2001-present) and FMR; Assistant Secretary of Fidelity Management & Research (U.K.) Inc. (2001-present), Fidelity Management & Research (Far East) Inc. (2001-present), and Fidelity Investments Money Management, Inc. (2001-present). Mr. Roiter is an Adjunct Member, Faculty of Law, at Boston College Law School (2003-present). Previously, Mr. Roiter served as Vice President and Secretary of Fidelity Distributors Corporation (FDC) (1998-2005). |
Stuart Fross (45) |
| Year of Election or Appointment: 2003 Assistant Secretary of the fund. Mr. Fross also serves as Assistant Secretary of other Fidelity funds (2003-present), Vice President and Secretary of FDC (2005-present), and is an employee of FMR. |
Christine Reynolds (46) |
| Year of Election or Appointment: 2004 President, Treasurer, and Anti-Money Laundering (AML) officer of the fund. Ms. Reynolds also serves as President, Treasurer, and AML officer of other Fidelity funds (2004) and is a Vice President (2003) and an employee (2002) of FMR. Before joining Fidelity Investments, Ms. Reynolds worked at PricewaterhouseCoopers LLP (PwC) (1980-2002), where she was most recently an audit partner with PwC's investment management practice. |
Timothy F. Hayes (54) |
| Year of Election or Appointment: 2002 Chief Financial Officer of the fund. Mr. Hayes also serves as Chief Financial Officer of other Fidelity funds (2002-present) and President of Fidelity Investment Operations (2005-present) which includes Fidelity Pricing and Cash Management Services Group (FPCMS), where he served as President (1998-2005). Mr. Hayes serves as President of Fidelity Service Company (2003-present) where he also serves as a Director. Mr. Hayes also served as President of Fidelity Investments Operations Group (FIOG, 2002-2005). |
Kenneth A. Rathgeber (58) |
| Year of Election or Appointment: 2004 Chief Compliance Officer of the fund. Mr. Rathgeber also serves as Chief Compliance Officer of other Fidelity funds (2004) and Executive Vice President of Risk Oversight for Fidelity Investments (2002). Previously, he served as Executive Vice President and Chief Operating Officer for Fidelity Investments Institutional Services Company, Inc. (1998-2002). |
John R. Hebble (47) |
| Year of Election or Appointment: 2003 Deputy Treasurer of the fund. Mr. Hebble also serves as Deputy Treasurer of other Fidelity funds (2003), and is an employee of FMR. Before joining Fidelity Investments, Mr. Hebble worked at Deutsche Asset Management where he served as Director of Fund Accounting (2002-2003) and Assistant Treasurer of the Scudder Funds (1998-2003). |
Bryan A. Mehrmann (44) |
| Year of Election or Appointment: 2005 Deputy Treasurer of the fund. Mr. Mehrmann also serves as Deputy Treasurer of other Fidelity funds (2005-present) and is an employee of FMR. Previously, Mr. Mehrmann served as Vice President of Fidelity Investments Institutional Services Group (FIIS)/Fidelity Investments Institutional Operations Corporation, Inc. (FIIOC) Client Services (1998-2004). |
Kimberley H. Monasterio (41) |
| Year of Election or Appointment: 2004 Deputy Treasurer of the fund. Ms. Monasterio also serves as Deputy Treasurer of other Fidelity funds (2004) and is an employee of FMR (2004). Before joining Fidelity Investments, Ms. Monasterio served as Treasurer (2000-2004) and Chief Financial Officer (2002-2004) of the Franklin Templeton Funds and Senior Vice President of Franklin Templeton Services, LLC (2000-2004). |
Kenneth B. Robins (35) |
| Year of Election or Appointment: 2005 Deputy Treasurer of the fund. Mr. Robins also serves as Deputy Treasurer of other Fidelity funds (2005-present) and is an employee of FMR (2004-present). Before joining Fidelity Investments, Mr. Robins worked at KPMG LLP, where he was a partner in KPMG's department of professional practice (2002-2004) and a Senior Manager (1999-2000). In addition, Mr. Robins served as Assistant Chief Accountant, United States Securities and Exchange Commission (2000-2002). |
Robert G. Byrnes (38) |
| Year of Election or Appointment: 2005 Assistant Treasurer of the fund. Mr. Byrnes also serves as Assistant Treasurer of other Fidelity funds (2005-present) and is an employee of FMR (2005-present). Previously, Mr. Byrnes served as Vice President of FPCMS (2003-2005). Before joining Fidelity Investments, Mr. Byrnes worked at Deutsche Asset Management where he served as Vice President of the Investment Operations Group (2000-2003). |
John H. Costello (58) |
| Year of Election or Appointment: 2002 Assistant Treasurer of the fund. Mr. Costello also serves as Assistant Treasurer of other Fidelity funds and is an employee of FMR. |
Peter L. Lydecker (51) |
| Year of Election or Appointment: 2004 Assistant Treasurer of the fund. Mr. Lydecker also serves as Assistant Treasurer of other Fidelity funds (2004) and is an employee of FMR. |
Mark Osterheld (50) |
| Year of Election or Appointment: 2002 Assistant Treasurer of the fund. Mr. Osterheld also serves as Assistant Treasurer of other Fidelity funds (2002) and is an employee of FMR. |
Gary W. Ryan (46) |
| Year of Election or Appointment: 2005 Assistant Treasurer of the fund. Mr. Ryan also serves as Assistant Treasurer of other Fidelity funds (2005-present) and is an employee of FMR (2005-present). Previously, Mr. Ryan served as Vice President of Fund Reporting in FPCMS (1999-2005). |
Salvatore Schiavone (39) |
| Year of Election or Appointment: 2005 Assistant Treasurer of the fund. Mr. Schiavone also serves as Assistant Treasurer of other Fidelity funds (2005-present) and is an employee of FMR (2005-present). Before joining Fidelity Investments, Mr. Schiavone worked at Deutsche Asset Management, where he most recently served as Assistant Treasurer (2003-2005) of the Scudder Funds and Vice President and Head of Fund Reporting (1996-2003). |
Annual Report
Distributions
The Board of Trustees of Fidelity Total Bond Fund voted to pay to shareholders of record at the opening of business on record date, the following distributions per share derived from capital gains realized from sales of portfolio securities:
| Pay Date | Record Date | Capital Gains |
Class A | 9/12/05 | 9/9/05 | $.04 |
Class T | 9/12/05 | 9/9/05 | $.04 |
Class B | 9/12/05 | 9/9/05 | $.04 |
Class C | 9/12/05 | 9/9/05 | $.04 |
The fund hereby designates as capital gain dividends: For dividends with respect to the taxable year ended July 31, 2005, $807,027, or, if subsequently determined to be different, the net capital gain of such year, and for dividends with respect to the taxable year ended July 31, 2004, $169,658, or, if subsequently determined to be different, the excess of: (a) the net capital gain of such year, over (b) amounts previously designated as capital gain dividends with respect to such year.
A total of 15.99% of the dividends distributed during the fiscal year was derived from interest on U.S. Government securities which is generally exempt from state income tax.
The fund will notify shareholders in January 2006 of amounts for use in preparing 2005 income tax returns.
Annual Report
Board Approval of Investment Advisory Contracts and Management Fees
Fidelity Total Bond Fund
Each year, typically in June, the Board of Trustees, including the independent Trustees (together, the Board), votes on the renewal of the management contract and sub-advisory agreements (together, the Advisory Contracts) for the fund. The Board, assisted by the advice of fund counsel and independent Trustees' counsel, requests and considers a broad range of information throughout the year.
The Board meets regularly each month except August and takes into account throughout the year matters bearing on Advisory Contracts. The Board, acting directly and through its separate committees, considers at each of its meetings factors that are relevant to the annual renewal of the fund's Advisory Contracts, including the services and support provided to the fund and its shareholders by Fidelity. At the time of the renewal, the Board had 11 standing committees, each composed of independent Trustees with varying backgrounds, to which the Board has assigned specific subject matter responsibilities in order to enhance effective decision-making by the Board. Each committee has adopted a written charter outlining the structure and purposes of the committee. One such committee, the Fixed-Income Contract Committee, meets periodically during the first six months of each year and as necessary to consider matters specifically related to the annual renewal of Advisory Contracts. The committee requests and receives information on, and makes recommendations to the independent Trustees concerning, the approval and annual review of the Advisory Contracts.
At its June 2005 meeting, the Board of Trustees, including the independent Trustees, unanimously determined to renew the Advisory Contracts for the fund. In reaching its determination, the Board considered all factors it believed relevant, including (1) the nature, extent, and quality of the services to be provided to the fund and its shareholders by Fidelity (including the investment performance of the fund); (2) the competitiveness of the management fee and total expenses of the fund; (3) the total costs of the services to be provided by and the profits to be realized by the investment adviser and its affiliates from the relationship with the fund; (4) the extent to which economies of scale would be realized as the fund grows; and (5) whether fee levels reflect these economies of scale, if any, for the benefit of fund shareholders.
In determining whether to renew the Advisory Contracts for the fund, the Board ultimately reached a determination, with the assistance of fund counsel and independent Trustees' counsel, that the renewal of the Advisory Contracts and the compensation to be received by Fidelity under the management contract is consistent with Fidelity's fiduciary duty under applicable law. In addition to evaluating the specific factors noted above, the Board, in reaching its determination, is aware that shareholders in the fund have a broad range of investment choices available to them, including a wide choice among mutual funds offered by competitors to Fidelity, and that the fund's shareholders, with the opportunity to review and weigh the disclosure provided by the fund in its prospectus and other public disclosures, have chosen to invest in this fund, managed by Fidelity.
Annual Report
Board Approval of Investment Advisory Contracts and
Management Fees - continued
Nature, Extent, and Quality of Services Provided by Fidelity. The Board considered staffing within the investment adviser, FMR, and the sub-advisers (together, the Investment Advisers), including the background of the fund's portfolio manager and the fund's investment objective and discipline. The independent Trustees also had discussions with senior management of Fidelity's investment operations and investment groups. The Board considered the structure of the portfolio manager compensation program and whether this structure provides appropriate incentives.
Fidelity Resources Dedicated to Investment Management and Support Services. The Board reviewed the size, education, and experience of the Investment Advisers' investment staff, their use of technology, and the Investment Advisers' approach to recruiting, training, and retaining portfolio managers and other research, advisory, and management personnel. The Board considered Fidelity's extensive global research capabilities that enable the Investment Advisers to aggregate data from various sources in an effort to produce positive investment results. The Board noted that Fidelity's analysts have access to a variety of technological tools that enable them to perform both fundamental and quantitative analysis and to specialize in various disciplines. The Board also considered that Fidelity's portfolio managers and analysts have access to daily portfolio attribution that allows for monitoring of a fund's portfolio, as well as an electronic communication system that provides immediate real-time access to research concerning issuers and credit enhancers.
Shareholder and Administrative Services. The Board considered the nature, extent, quality, and cost of administrative, distribution, and shareholder services performed by the Investment Advisers and their affiliates under the Advisory Contracts and under separate agreements covering transfer agency, pricing and bookkeeping, and securities lending services for the fund. The Board also considered the nature and extent of the Investment Advisers' supervision of third party service providers, principally custodians and subcustodians. The Board reviewed the allocation of fund brokerage, including allocations to brokers affiliated with the Investment Advisers. The Board also considered the resources devoted to, and the record of compliance with, the fund's compliance policies and procedures.
The Board noted that the growth of fund assets across the complex allows Fidelity to reinvest in the development of services designed to enhance the value or convenience of the Fidelity funds as investment vehicles. These services include 24-hour access to account information and market information through phone representatives and over the Internet, and investor education materials and asset allocation tools.
Investment in a Large Fund Family. The Board considered the benefits to shareholders of investing in a Fidelity fund, including the benefits of investing in a fund that is part of a large family of funds offering a variety of investment disciplines and providing for a large variety of mutual fund investor services. For example, fund shareholders are offered the privilege of exchanging shares of the fund for shares of other Fidelity funds, as set forth in the fund's prospectus, without paying an additional sales charge. The Board noted that, since the last Advisory Contract renewals in June 2004, Fidelity has taken a number of actions that benefited particular funds, including (i) voluntarily deciding in 2004 to stop using "soft" commission dollars to pay for market data and, instead, to pay for that data out of its own resources, (ii) contractually agreeing to impose management fee reductions and expense limitations on its five Spartan stock index funds and its stock index fund available through variable insurance products, (iii) contractually agreeing to eliminate the management fees on the Fidelity Freedom Funds and the Fidelity Advisor Freedom Funds, (iv) contractually agreeing to reduce the management fees on most of its investment-grade taxable bond funds, and (v) contractually agreeing to impose expense limitations on its retail and Spartan investment-grade taxable bond funds.
Annual Report
Investment Performance. The Board considered whether the fund has operated within its investment objective, as well as its record of compliance with its investment restrictions. It also reviewed the fund's absolute investment performance, as well as the fund's relative investment performance measured against (i) a broad-based securities market index, and (ii) a peer group of mutual funds deemed appropriate by the Board. Because the fund had been in existence less than three calendar years, the following chart considered by the Board shows, for the one-year period ended December 31, 2004, the return of the retail class of the fund, the return of a broad-based securities market index ("benchmark"), and a range of returns of a peer group of mutual funds identified by Lipper Inc. as having an investment objective similar to that of the fund. The return of the retail class represents the performance of a class with the lowest 12b-1 fee (not necessarily with the lowest total expenses). (The Advisor classes of the fund, which have higher 12b-1 fees, had less than one year of performance as of December 31, 2004.) The box within the chart shows the 25th percentile return (bottom of box) and the 75th percentile return (top of box) of the Lipper peer group. The percentage beaten number noted below the chart corresponds to the percentile box and represents the percentage of funds in the Lipper peer group whose performance was equal to or lower than that of the retail class.
Annual Report
Board Approval of Investment Advisory Contracts and
Management Fees - continued
The Board noted that the relative investment performance of the retail class of the fund compared favorably to its Lipper peer group for the one-year period. The Board also noted that the relative investment performance of the retail class of the fund compared favorably to its benchmark for the one-year period.
Based on its review, and giving particular weight to the nature and quality of the resources dedicated by the Investment Advisers to maintain and improve relative performance, the Board concluded that the nature, extent, and quality of the services provided by Fidelity will benefit the fund's shareholders, particularly in light of the Board's view that the fund's shareholders benefit from investing in a fund that is part of a large family of funds offering a variety of investment disciplines and services.
Competitiveness of Management Fee and Total Fund Expenses. The Board considered the fund's management fee and total expenses compared to "mapped groups" of competitive funds and classes. Fidelity creates "mapped groups" by combining similar Lipper investment objective categories that have comparable management fee characteristics. Combining Lipper investment objective categories aids the Board's management fee and total expense comparisons by broadening the competitive group used for comparison and by reducing the number of universes to which various Fidelity funds are compared.
The Board considered two proprietary management fee comparisons for the 12-month (or shorter) periods shown in the chart below. The group of Lipper funds used by the Board for management fee comparisons is referred to below as the "Total Mapped Group" and, for the reasons explained above, is broader than the Lipper peer group used by the Board for performance comparisons. The Total Mapped Group comparison focuses on a fund's standing relative to the total universe of comparable funds available to investors, in terms of gross management fees before expense reimbursements or caps. "TMG %" represents the percentage of funds in the Total Mapped Group that had management fees that were lower than the fund's. For example, a TMG % of 22% would mean that 78% of the funds in the Total Mapped Group had higher management fees than the fund. The "Asset-Size Peer Group" (ASPG) comparison focuses on a fund's standing relative to non-Fidelity funds similar in size to the fund within the Total Mapped Group. The ASPG represents at least 15% of the funds in the Total Mapped Group with comparable asset size and management fee characteristics, subject to a minimum of 50 funds (or all funds in the Total Mapped Group if fewer than 50). Additional information, such as the ASPG quartile ("quadrant") in which the fund's management fee ranked, is also included in the chart and considered by the Board.
Annual Report
The Board noted that the fund's management fee ranked below the median of its Total Mapped Group and below the median of its ASPG for 2004.
Furthermore, the Board considered that, on May 19, 2005, after the periods shown in the chart above, it had approved an amendment (effective June 1, 2005) to the fund's management contract that lowered the fund's individual fund fee rate from 30 basis points to 20 basis points. The Board considered that, if the lower individual fund fee rate had been in effect in 2004, it would have reduced the fund's management fee rate from 43 basis points to 33 basis points.
Based on its review, the Board concluded that the fund's management fee was fair and reasonable in light of the services that the fund receives and the other factors considered.
Annual Report
Board Approval of Investment Advisory Contracts and
Management Fees - continued
In its review of each class's total expenses, the Board considered the fund's management fee as well as other fund or class expenses, as applicable, such as transfer agent fees, pricing and bookkeeping fees, fund-paid 12b-1 fees, and custodial, legal, and audit fees. The Board also noted the effects of any waivers and reimbursements on fees and expenses. As part of its review, the Board also considered current and historical total expenses of each class of the fund compared to competitive fund median expenses. Each class of the fund is compared to those funds and classes in the Total Mapped Group (used by the Board for management fee comparisons) that have a similar sales load structure.
The Board noted that each class's total expenses ranked below its competitive median for 2004. The Board considered that if the lower individual fund fee rate had been in effect in 2004, it would have reduced each class's total expenses by 10 basis points.
The Board also considered that on May 19, 2005, it had approved changes (effective June 1, 2005) in the contractual arrangements for the fund that (i) have the effect of setting the total "fund-level" expenses (including, among certain other expenses, the management fee) for each class at 35 basis points, (ii) lower and limit the "class-level" transfer agent fee for Fidelity Total Bond Fund (retail class) to 10 basis points, and (iii) limit the total expenses for Fidelity Total Bond Fund (retail class) to 45 basis points. These new contractual arrangements may not be increased without Board approval. The fund's Advisor classes continue to be subject to different class-level expenses (transfer agent fees and 12b-1 fees).
The Board recognized that the fund's management contract incorporates a "group fee" structure, which provides for lower fee rates as total fund assets under FMR's management increase, and for higher fee rates as total fund assets under FMR's management decrease. The Board noted that because the new contractual arrangements set the total fund-level expenses for each class at 35 basis points, increases or decreases in the management fee due to changes in the group fee rate will not impact total expenses. However, the Board realized that the 35 basis point fee rate was below the lowest management fee available under the old contractual arrangements. The maximum benefit that a decrease in the group fee rate could provide the fund would be a reduction in the management fee to approximately 39 basis points (compared to total fund-level expenses of 35 basis points under the new contractual arrangements).
In its review of total expenses, the Board also considered Fidelity fee structures and other information on clients that FMR and its affiliates service in other competitive markets, such as other mutual funds advised or subadvised by FMR or its affiliates, pension plan clients, and other institutional clients.
Based on its review, the Board concluded that each class's total expenses were reasonable in light of the services that the fund and its shareholders receive and the other factors considered.
Annual Report
Costs of the Services and Profitability. The Board considered the revenues earned and the expenses incurred by Fidelity in conducting the business of developing, marketing, distributing, managing, administering and servicing the fund and its shareholders. The Board also considered the level of Fidelity's profits in respect of all the Fidelity funds.
On an annual basis, FMR presents to the Board Fidelity's profitability for the fund. Fidelity calculates the profitability for each fund, as well as aggregate profitability for groups of Fidelity funds and all Fidelity funds, using a series of detailed revenue and cost allocation methodologies which originate with the audited books and records of Fidelity. The Audit Committee of the Board reviews any significant changes from the prior year's methodologies.
PricewaterhouseCoopers LLP (PwC), independent registered accounting firm and auditor to Fidelity and certain Fidelity funds, has been engaged annually by the Board as part of the Board's assessment of the results of Fidelity's profitability analysis. PwC's engagement includes the review and assessment of Fidelity's methodologies used in determining the revenues and expenses attributable to Fidelity's mutual fund business, and completion of agreed-upon procedures surrounding the mathematical accuracy of fund profitability and its conformity to allocation methodologies. After considering PwC's reports issued under the engagement and information provided by Fidelity, the Board believes that while other allocation methods may also be reasonable, Fidelity's profitability methodologies are reasonable in all material respects.
The Board has also reviewed Fidelity's non-fund businesses and any fall-out benefits related to the mutual fund business as well as cases where Fidelity's affiliates may benefit from or be related to the fund's business. In addition, a special committee of the Board reviewed services provided to Fidelity by its affiliates and determined that the fees that Fidelity paid for such services were reasonable.
The Board considered the costs of the services provided by and the profits realized by Fidelity in connection with the operation of the fund and determined that the amount of profit is a fair entrepreneurial profit for the management of the fund.
Economies of Scale. The Board considered whether there have been economies of scale in respect of the management of the Fidelity funds, whether the Fidelity funds (including the fund) have appropriately benefited from any such economies of scale, and whether there is potential for realization of any further economies of scale. The Board considered the extent to which the fund will benefit from economies of scale through increased services to the fund, through waivers or reimbursements, or through fee or expense reductions, including (Advisor classes only) reductions that occur through operation of the transfer agent agreement. The transfer agent fee varies in part based on the number of accounts in the fund. If the number of accounts decreases or the average account size increases, the overall transfer agent fee rate decreases. The Board also noted that the reduction in the fund's management fee rate from 43 basis points to 33 basis points and the reduction in each class's total expenses by 10 basis points would deliver significant economies to fund shareholders. The Board concluded that any potential economies of scale are being shared between fund shareholders and Fidelity in an appropriate manner.
Annual Report
Board Approval of Investment Advisory Contracts and
Management Fees - continued
Additional Information Requested by the Board. In order to develop fully the factual basis for consideration of the Advisory Contracts, the Board requested additional information regarding (i) Fidelity's fund profitability methodology, including additional detail on various cost allocations; (ii) fall-out benefits to Fidelity; and (iii) compensation of portfolio managers and research analysts.
Based on its evaluation of all of the conclusions noted above, and after considering all material factors, the Board ultimately concluded that the existing advisory fee structures are fair and reasonable, and that the fund's existing Advisory Contracts should be renewed.
Annual Report
The following is a complete listing of investments for Fidelity's
fixed-income central fund as of July 31, 2005 which
is a direct or indirect investment of Fidelity Total Bond Fund.
These underlying holdings of the Fidelity fixed-income central
fund are not included in the Schedule of Investments as
part of the Financial Statements.
Annual Report
Fidelity Ultra-Short Central Fund
Investments July 31, 2005 (Unaudited)
Showing Percentage of Net Assets
Nonconvertible Bonds - 3.8% |
| Principal Amount | | Value |
CONSUMER DISCRETIONARY - 1.0% |
Auto Components - 0.3% |
DaimlerChrysler NA Holding Corp.: | | | | |
3.8594% 9/10/07 (f) | | $ 16,665,000 | | $ 16,698,830 |
3.8938% 5/24/06 (f) | | 4,700,000 | | 4,713,691 |
| | 21,412,521 |
Media - 0.7% |
Continental Cablevision, Inc. 8.3% 5/15/06 | | 8,000,000 | | 8,248,640 |
Cox Communications, Inc. (Reg. S) 3.95% 12/14/07 (f) | | 12,140,000 | | 12,202,691 |
Liberty Media Corp. 4.91% 9/17/06 (f) | | 16,694,000 | | 16,786,986 |
Univision Communications, Inc. 2.875% 10/15/06 | | 8,505,000 | | 8,315,339 |
| | 45,553,656 |
TOTAL CONSUMER DISCRETIONARY | | 66,966,177 |
ENERGY - 0.2% |
Oil, Gas & Consumable Fuels - 0.2% |
Valero Energy Corp. 7.375% 3/15/06 | | 11,550,000 | | 11,735,435 |
FINANCIALS - 1.0% |
Capital Markets - 0.1% |
State Street Capital Trust II 3.7681% 2/15/08 (f) | | 10,000,000 | | 10,002,260 |
Commercial Banks - 0.3% |
Wells Fargo & Co. 3.4194% 3/10/08 (f) | | 16,600,000 | | 16,599,452 |
Consumer Finance - 0.2% |
General Motors Acceptance Corp. 4.87% 10/20/05 (f) | | 14,765,000 | | 14,786,188 |
Thrifts & Mortgage Finance - 0.4% |
Countrywide Financial Corp. 3.71% 4/11/07 (f) | | 11,025,000 | | 11,032,034 |
Residential Capital Corp. 4.835% 6/29/07 (c)(f) | | 14,150,000 | | 14,164,716 |
| | 25,196,750 |
TOTAL FINANCIALS | | 66,584,650 |
TELECOMMUNICATION SERVICES - 1.3% |
Diversified Telecommunication Services - 1.2% |
British Telecommunications PLC 7.875% 12/15/05 | | 18,145,000 | | 18,397,070 |
France Telecom SA 7.45% 3/1/06 (a) | | 5,600,000 | | 5,699,484 |
GTE Corp. 6.36% 4/15/06 | | 9,000,000 | | 9,126,405 |
SBC Communications, Inc. 4.389% 6/5/06 (c) | | 15,315,000 | | 15,319,595 |
Sprint Capital Corp. 4.78% 8/17/06 | | 6,000,000 | | 6,020,550 |
Telefonica Europe BV 7.35% 9/15/05 | | 4,500,000 | | 4,517,537 |
Nonconvertible Bonds - continued |
| Principal Amount | | Value |
TELECOMMUNICATION SERVICES - continued |
Diversified Telecommunication Services - continued |
Telefonos de Mexico SA de CV 4.5% 11/19/08 | | $ 10,240,000 | | $ 10,092,268 |
TELUS Corp. yankee 7.5% 6/1/07 | | 6,500,000 | | 6,835,569 |
| | 76,008,478 |
Wireless Telecommunication Services - 0.1% |
AT&T Wireless Services, Inc. 7.35% 3/1/06 | | 5,500,000 | | 5,596,976 |
TOTAL TELECOMMUNICATION SERVICES | | 81,605,454 |
UTILITIES - 0.3% |
Electric Utilities - 0.2% |
Pinnacle West Energy Corp. 4.0044% 4/1/07 (c)(f) | | 12,800,000 | | 12,800,794 |
Gas Utilities - 0.1% |
NiSource Finance Corp. 7.625% 11/15/05 | | 9,250,000 | | 9,342,213 |
TOTAL UTILITIES | | 22,143,007 |
TOTAL NONCONVERTIBLE BONDS (Cost $249,397,779) | 249,034,723 |
U.S. Government Agency Obligations - 0.0% |
|
Fannie Mae 0% 9/28/05 (e)
(Cost $994,579) | | 1,000,000 | | 994,635 |
Asset-Backed Securities - 35.2% |
|
Accredited Mortgage Loan Trust: | | | | |
Series 2004-2 Class A2, 3.76% 7/25/34 (f) | | 7,964,683 | | 7,978,722 |
Series 2004-3 Class 2A4, 3.81% 10/25/34 (f) | | 10,915,000 | | 10,946,584 |
Series 2004-4 Class A2D, 3.81% 1/25/35 (f) | | 3,579,364 | | 3,588,366 |
Series 2005-1: | | | | |
Class M1, 3.93% 4/25/35 (f) | | 11,280,000 | | 11,251,882 |
Class M2, 4.15% 4/25/35 (f) | | 5,275,000 | | 5,276,901 |
ACE Securities Corp.: | | | | |
Series 2002-HE1 Class M1, 4.11% 6/25/32 (f) | | 1,308,761 | | 1,318,432 |
Series 2002-HE2 Class M1, 4.31% 8/25/32 (f) | | 18,631,213 | | 18,704,611 |
Series 2003-FM1 Class M2, 5.31% 11/25/32 (f) | | 3,015,000 | | 3,050,466 |
Series 2003-HS1: | | | | |
Class M1, 4.21% 6/25/33 (f) | | 800,000 | | 803,485 |
Class M2, 5.21% 6/25/33 (f) | | 856,000 | | 871,093 |
Asset-Backed Securities - continued |
| Principal Amount | | Value |
ACE Securities Corp.: - continued | | | | |
Series 2003-NC1 Class M1, 4.24% 7/25/33 (f) | | $ 1,600,000 | | $ 1,611,660 |
Series 2004-HE1: | | | | |
Class M1, 3.96% 2/25/34 (f) | | 2,193,000 | | 2,193,772 |
Class M2, 4.56% 2/25/34 (f) | | 2,475,000 | | 2,476,241 |
Series 2004-OP1: | | | | |
Class M1, 3.98% 4/25/34 (f) | | 4,420,000 | | 4,424,344 |
Class M2, 4.51% 4/25/34 (f) | | 6,240,000 | | 6,251,080 |
Series 2005-HE2: | | | | |
Class M1, 3.9% 4/25/35 (f) | | 1,530,000 | | 1,527,965 |
Class M2, 3.91% 4/25/35 (f) | | 1,803,000 | | 1,796,836 |
Class M3, 3.94% 4/25/35 (f) | | 1,040,000 | | 1,038,647 |
Class M4, 4.1% 4/25/35 (f) | | 1,340,000 | | 1,338,268 |
Series 2005-HE3: | | | | |
Class A2A, 3.56% 5/25/35 (f) | | 8,063,511 | | 8,063,822 |
Class A2B, 3.67% 5/25/35 (f) | | 4,370,000 | | 4,366,352 |
Series 2005-SD1 Class A1, 3.86% 11/25/50 (f) | | 2,563,309 | | 2,566,464 |
Aesop Funding II LLC Series 2005-1A Class A2, 3.49% 4/20/09 (c)(f) | | 8,800,000 | | 8,765,680 |
American Express Credit Account Master Trust: | | | | |
Series 2002-6 Class B, 3.8381% 3/15/10 (f) | | 5,000,000 | | 5,030,751 |
Series 2004-1 Class B, 3.6381% 9/15/11 (f) | | 5,775,000 | | 5,797,723 |
Series 2004-C Class C, 3.8881% 2/15/12 (c)(f) | | 17,323,520 | | 17,374,643 |
Series 2005-1 Class A, 3.4181% 10/15/12 (f) | | 15,455,000 | | 15,481,600 |
AmeriCredit Automobile Receivables Trust: | | | | |
Series 2002-EM Class A4A, 3.67% 6/8/09 | | 25,000,000 | | 24,899,223 |
Series 2003-AM: | | | | |
Class A3B, 3.71% 6/6/07 (f) | | 685,806 | | 685,879 |
Class A4B, 3.81% 11/6/09 (f) | | 12,400,000 | | 12,441,657 |
Series 2003-BX Class A4B, 3.72% 1/6/10 (f) | | 3,265,000 | | 3,275,694 |
Series 2003-CF Class A3, 2.75% 10/9/07 | | 12,249,371 | | 12,210,791 |
Series 2005-1 Class C, 4.73% 7/6/10 | | 15,500,000 | | 15,451,950 |
Ameriquest Mortgage Securities, Inc.: | | | | |
Series 2002-3 Class M1, 4.16% 8/25/32 (f) | | 5,000,000 | | 5,028,248 |
Series 2003-1: | | | | |
Class A2, 3.87% 2/25/33 (f) | | 465,695 | | 465,917 |
Class M1, 4.36% 2/25/33 (f) | | 6,150,000 | | 6,197,846 |
Series 2003-3: | | | | |
Class M1, 4.26% 3/25/33 (f) | | 1,590,000 | | 1,603,481 |
Class S, 5% 9/25/05 (g) | | 4,457,447 | | 17,215 |
Series 2003-6: | | | | |
Class M1, 4.22% 8/25/33 (f) | | 7,560,000 | | 7,611,224 |
Asset-Backed Securities - continued |
| Principal Amount | | Value |
Ameriquest Mortgage Securities, Inc.: - continued | | | | |
Series 2003-6: | | | | |
Class M2, 5.31% 5/25/33 (f) | | $ 2,750,000 | | $ 2,808,476 |
Series 2003-AR1 Class M1, 4.61% 1/25/33 (f) | | 7,000,000 | | 7,072,631 |
Series 2004-R2: | | | | |
Class M1, 3.89% 4/25/34 (f) | | 1,230,000 | | 1,229,949 |
Class M2, 3.94% 4/25/34 (f) | | 950,000 | | 949,960 |
Class M3, 4.01% 4/25/34 (f) | | 3,500,000 | | 3,499,854 |
Class M4, 4.51% 4/25/34 (f) | | 4,500,000 | | 4,499,807 |
Series 2004-R9 Class A3, 3.78% 10/25/34 (f) | | 9,340,000 | | 9,359,871 |
Series 2005-R1: | | | | |
Class M1, 3.91% 3/25/35 (f) | | 5,710,000 | | 5,691,308 |
Class M2, 3.94% 3/25/35 (f) | | 1,925,000 | | 1,918,868 |
Series 2005-R2 Class M1, 3.91% 4/25/35 (f) | | 12,500,000 | | 12,482,516 |
Amortizing Residential Collateral Trust: | | | | |
Series 2002-BC3 Class A, 3.79% 6/25/32 (f) | | 2,411,175 | | 2,418,495 |
Series 2002-BC6 Class M1, 4.21% 8/25/32 (f) | | 24,900,000 | | 25,116,817 |
Series 2002-BC7: | | | | |
Class M1, 4.1144% 10/25/32 (f) | | 10,000,000 | | 10,075,000 |
Class M2, 4.36% 10/25/32 (f) | | 5,575,000 | | 5,612,067 |
Series 2003-BC1 Class M2, 4.56% 1/25/32 (f) | | 758,836 | | 762,333 |
ARG Funding Corp.: | | | | |
Series 2005-1A Class A2, 3.53% 4/20/09 (c)(f) | | 11,000,000 | | 10,975,938 |
Series 2005-2A Class A2, 3.54% 5/20/09 (c)(f) | | 5,200,000 | | 5,190,453 |
Argent Securities, Inc.: | | | | |
Series 2003-W3 Class M2, 5.26% 9/25/33 (f) | | 20,000,000 | | 20,599,990 |
Series 2003-W7 Class A2, 3.85% 3/1/34 (f) | | 4,505,856 | | 4,515,756 |
Series 2004-W5 Class M1, 4.06% 4/25/34 (f) | | 3,960,000 | | 3,964,768 |
Series 2004-W7: | | | | |
Class M1, 4.01% 5/25/34 (f) | | 4,085,000 | | 4,084,827 |
Class M2, 4.06% 5/25/34 (f) | | 3,320,000 | | 3,319,860 |
Asset Backed Securities Corp. Home Equity Loan Trust: | | | | |
Series 2003-HE2: | | | | |
Class A2, 3.7681% 4/15/33 (f) | | 1,158,706 | | 1,159,186 |
Class M1, 4.2881% 4/15/33 (f) | | 11,365,000 | | 11,429,103 |
Series 2003-HE3: | | | | |
Class M1, 4.2181% 6/15/33 (f) | | 2,185,000 | | 2,198,827 |
Class M2, 5.3881% 6/15/33 (f) | | 10,000,000 | | 10,182,465 |
Series 2003-HE4 Class M2, 5.3881% 8/15/33 (f) | | 5,695,000 | | 5,798,650 |
Series 2003-HE5 Class A2A, 3.7481% 8/15/33 (f) | | 1,380,797 | | 1,381,390 |
Series 2003-HE6 Class M1, 4.11% 11/25/33 (f) | | 3,475,000 | | 3,490,373 |
Series 2004-HE2 Class M1, 4.01% 4/25/34 (f) | | 6,060,000 | | 6,070,769 |
Series 2004-HE3: | | | | |
Class M1, 4% 6/25/34 (f) | | 1,450,000 | | 1,454,353 |
Asset-Backed Securities - continued |
| Principal Amount | | Value |
Asset Backed Securities Corp. Home Equity Loan Trust: - continued | | | | |
Series 2004-HE3: | | | | |
Class M2, 4.58% 6/25/34 (f) | | $ 3,350,000 | | $ 3,386,297 |
Series 2004-HE6 Class A2, 3.82% 6/25/34 (f) | | 17,398,791 | | 17,435,568 |
Series 2005-HE2: | | | | |
Class M1, 3.91% 3/25/35 (f) | | 8,250,000 | | 8,235,989 |
Class M2, 3.96% 3/25/35 (f) | | 2,065,000 | | 2,065,671 |
Series 2005-HE6 Class A2B, 3.76% 8/25/35 (d)(f) | | 10,000,000 | | 10,000,000 |
Bank One Issuance Trust: | | | | |
Series 2002-B1 Class B1, 3.7681% 12/15/09 (f) | | 20,655,000 | | 20,741,067 |
Series 2002-B2 Class B2, 3.7281% 5/15/08 (f) | | 15,000,000 | | 15,001,929 |
Series 2002-B3 Class B, 3.7481% 8/15/08 (f) | | 14,500,000 | | 14,505,871 |
Series 2002-C1 Class C1, 4.3481% 12/15/09 (f) | | 7,980,000 | | 8,065,464 |
Series 2002-C2 Class C2, 4.3781% 5/15/08 (f) | | 35,785,000 | | 35,817,626 |
Bayview Financial Acquisition Trust Series 2004-C Class A1, 3.9013% 5/28/44 (f) | | 8,416,440 | | 8,415,509 |
Bayview Financial Asset Trust Series 2000-F Class A, 3.9813% 9/28/43 (f) | | 9,618,786 | | 9,632,318 |
Bayview Financial Mortgage Loan Trust Series 2004-A Class A, 3.9313% 2/28/44 (f) | | 5,760,012 | | 5,771,599 |
Bear Stearns Asset Backed Securities I: | | | | |
Series 2005-HE2: | | | | |
Class M1, 3.96% 2/25/35 (f) | | 6,655,000 | | 6,639,262 |
Class M2, 4.21% 2/25/35 (f) | | 2,430,000 | | 2,432,538 |
Series 2005-HE5 Class 1A1, 3.4244% 6/25/35 (f) | | 10,884,395 | | 10,884,395 |
Capital Auto Receivables Asset Trust: | | | | |
Series 2002-5 Class B, 2.8% 4/15/08 | | 2,894,887 | | 2,868,235 |
Series 2003-1 Class B, 3.8581% 6/15/10 (c)(f) | | 5,781,229 | | 5,797,579 |
Series 2003-2 Class B, 3.6681% 1/15/09 (f) | | 2,741,542 | | 2,746,505 |
Series 2005-1 Class B, 3.7631% 6/15/10 (f) | | 5,725,000 | | 5,730,367 |
Capital One Auto Finance Trust: | | | | |
Series 2003-A Class A4B, 3.6681% 1/15/10 (f) | | 9,630,000 | | 9,654,568 |
Series 2004-B Class A4, 3.4981% 8/15/11 (f) | | 16,300,000 | | 16,303,123 |
Capital One Master Trust: | | | | |
Series 1999-3 Class B, 3.8681% 9/15/09 (f) | | 5,000,000 | | 5,004,082 |
Series 2001-1 Class B, 3.8981% 12/15/10 (f) | | 19,500,000 | | 19,638,608 |
Series 2001-8A Class B, 3.9381% 8/17/09 (f) | | 9,585,000 | | 9,634,206 |
Series 2002-4A Class B, 3.8881% 3/15/10 (f) | | 6,000,000 | | 6,028,221 |
Capital One Multi-Asset Execution Trust: | | | | |
Series 2002-B1 Class B1, 4.0681% 7/15/08 (f) | | 17,705,000 | | 17,711,976 |
Series 2003-B1 Class B1, 4.5581% 2/17/09 (f) | | 15,470,000 | | 15,566,773 |
Capital Trust Ltd. Series 2004-1: | | | | |
Class A2, 3.88% 7/20/39 (c)(f) | | 2,968,000 | | 2,968,000 |
Asset-Backed Securities - continued |
| Principal Amount | | Value |
Capital Trust Ltd. Series 2004-1: - continued | | | | |
Class B, 4.18% 7/20/39 (c)(f) | | $ 1,550,000 | | $ 1,550,000 |
Class C, 4.53% 7/20/39 (c)(f) | | 1,994,000 | | 1,994,000 |
CDC Mortgage Capital Trust: | | | | |
Series 2001-HE1 Class M1, 4.49% 1/25/32 (f) | | 4,244,221 | | 4,254,278 |
Series 2002-HE2 Class M1, 4.16% 1/25/33 (f) | | 9,278,431 | | 9,309,123 |
Series 2002-HE3: | | | | |
Class M1, 4.56% 3/25/33 (f) | | 21,339,884 | | 21,627,815 |
Class M2, 5.71% 3/25/33 (f) | | 9,968,976 | | 10,143,974 |
Series 2003-HE1: | | | | |
Class M1, 4.36% 8/25/33 (f) | | 1,989,998 | | 1,997,574 |
Class M2, 5.41% 8/25/33 (f) | | 4,369,996 | | 4,422,084 |
Series 2003-HE2 Class A, 3.81% 10/25/33 (f) | | 1,634,377 | | 1,635,405 |
Series 2003-HE3: | | | | |
Class M1, 4.16% 11/25/33 (f) | | 2,254,989 | | 2,271,960 |
Class M2, 5.21% 11/25/33 (f) | | 1,719,992 | | 1,753,552 |
Series 2004-HE2 Class M2, 4.66% 7/26/34 (f) | | 2,345,000 | | 2,365,939 |
Chase Credit Card Owner Trust: | | | | |
Series 2001-6 Class B, 3.8681% 3/16/09 (f) | | 1,305,000 | | 1,311,169 |
Series 2002-6 Class B, 3.7381% 1/15/08 (f) | | 11,850,000 | | 11,852,472 |
Series 2004-1 Class B, 3.5881% 5/15/09 (f) | | 4,105,000 | | 4,104,204 |
Citibank Credit Card Issuance Trust: | | | | |
Series 2000-C2 Class C2, 4.2488% 10/15/07 (f) | | 17,500,000 | | 17,511,349 |
Series 2001-B2 Class B2, 3.8494% 12/10/08 (f) | | 11,945,000 | | 11,995,341 |
Series 2002-B1 Class B1, 3.8% 6/25/09 (f) | | 9,010,000 | | 9,038,878 |
Series 2002-C1 Class C1, 4.2185% 2/9/09 (f) | | 17,500,000 | | 17,686,918 |
Series 2003-B1 Class B1, 3.66% 3/7/08 (f) | | 25,000,000 | | 25,022,693 |
Series 2003-C1 Class C1, 4.65% 4/7/10 (f) | | 17,785,000 | | 18,152,159 |
Citigroup Mortgage Loan Trust Series 2003-HE4 Class A, 3.87% 12/25/33 (c)(f) | | 7,985,107 | | 7,985,935 |
CNH Wholesale Master Note Trust Series 2005-1: | | | | |
Class A, 3.43% 6/15/11 (f) | | 18,000,000 | | 18,000,000 |
Class B, 3.72% 6/15/11 (f) | | 2,280,000 | | 2,280,000 |
Countrywide Home Loans, Inc.: | | | | |
Series 2002-6 Class AV1, 3.89% 5/25/33 (f) | | 1,499,863 | | 1,503,470 |
Series 2003-BC1 Class M2, 5.46% 9/25/32 (f) | | 11,065,000 | | 11,199,451 |
Series 2003-SD3 Class A1, 3.88% 12/25/32 (c)(f) | | 927,188 | | 931,926 |
Series 2004-2 Class M1, 3.96% 5/25/34 (f) | | 5,200,000 | | 5,206,719 |
Series 2004-3: | | | | |
Class 3A4, 3.71% 8/25/34 (f) | | 530,752 | | 528,596 |
Class M1, 3.96% 6/25/34 (f) | | 1,475,000 | | 1,476,356 |
Series 2004-4: | | | | |
Class A, 3.83% 8/25/34 (f) | | 2,524,088 | | 2,526,278 |
Asset-Backed Securities - continued |
| Principal Amount | | Value |
Countrywide Home Loans, Inc.: - continued | | | | |
Series 2004-4: | | | | |
Class M1, 3.94% 7/25/34 (f) | | $ 3,650,000 | | $ 3,653,189 |
Class M2, 3.99% 6/25/34 (f) | | 4,395,000 | | 4,398,536 |
Series 2005-1: | | | | |
Class 1AV2, 3.66% 7/25/35 (f) | | 8,780,000 | | 8,775,114 |
Class M1, 3.88% 8/25/35 (f) | | 19,600,000 | | 19,563,654 |
Class MV1, 3.86% 7/25/35 (f) | | 3,135,000 | | 3,130,219 |
Class MV2, 3.9% 7/25/35 (f) | | 3,765,000 | | 3,754,147 |
Class MV3, 3.94% 7/25/35 (f) | | 1,560,000 | | 1,557,748 |
Series 2005-3 Class MV1, 3.88% 8/25/35 (f) | | 11,125,000 | | 11,103,934 |
Series 2005-AB1 Class A2, 3.67% 8/25/35 (f) | | 17,520,000 | | 17,514,797 |
Series 2005-IM1 Class A1, 3.56% 8/25/34 (d)(f) | | 17,915,000 | | 17,915,000 |
CS First Boston Mortgage Securities Corp.: | | | | |
Series 2003-8 Class A2, 3.85% 4/25/34 (f) | | 2,663,075 | | 2,674,762 |
Series 2004-FRE1: | | | | |
Class A2, 3.81% 4/25/34 (f) | | 2,689,397 | | 2,689,291 |
Class M3, 4.11% 4/25/34 (f) | | 5,885,000 | | 5,884,751 |
Discover Card Master Trust I Series 2003-4 Class B1, 3.7181% 5/16/11 (f) | | 8,155,000 | | 8,196,815 |
Fannie Mae guaranteed REMIC pass thru certificates Series 2004-T5 Class AB3, 3.8305% 5/28/35 (f) | | 6,957,460 | | 6,959,877 |
Fieldstone Mortgage Investment Corp.: | | | | |
Series 2003-1: | | | | |
Class M1, 4.14% 11/25/33 (f) | | 1,300,000 | | 1,308,748 |
Class M2, 5.21% 11/25/33 (f) | | 700,000 | | 718,600 |
Series 2004-1 Class M2, 4.56% 1/25/35 (f) | | 3,700,000 | | 3,741,581 |
Series 2004-2 Class M2, 4.61% 7/25/34 (f) | | 9,890,000 | | 9,889,579 |
Series 2004-3 Class M5, 4.91% 8/25/34 (f) | | 2,000,000 | | 2,033,830 |
Series 2005-2 Class 2A1, 3.5% 7/25/36 (d)(f) | | 16,935,000 | | 16,935,000 |
First Franklin Mortgage Loan Asset Backed Certificates: | | | | |
Series 2005-FF2 Class A2A, 3.55% 3/25/35 (f) | | 7,354,604 | | 7,354,604 |
Series 2005-FF2 Class M6, 4.16% 3/25/35 (f) | | 6,950,000 | | 6,950,000 |
First Franklin Mortgage Loan Trust Series 2004-FF2: | | | | |
Class M3, 4.01% 3/25/34 (f) | | 400,000 | | 400,711 |
Class M4, 4.36% 3/25/34 (f) | | 300,000 | | 302,647 |
First USA Credit Card Master Trust Series 2001-4 Class B, 3.75% 1/12/09 (f) | | 15,000,000 | | 15,026,199 |
First USA Secured Note Trust Series 2001-3 Class C, 4.4669% 11/19/08 (c)(f) | | 11,580,000 | | 11,661,421 |
Ford Credit Auto Owner Trust Series 2003-B Class B2, 3.8181% 10/15/07 (f) | | 19,600,000 | | 19,671,950 |
Asset-Backed Securities - continued |
| Principal Amount | | Value |
Ford Credit Floorplan Master Owner Trust Series 2005-1: | | | | |
Class A, 3.5381% 5/17/10 (f) | | $ 9,590,000 | | $ 9,589,981 |
Class B, 3.6563% 5/17/10 (f) | | 2,625,000 | | 2,624,992 |
Fremont Home Loan Trust: | | | | |
Series 2004-1: | | | | |
Class 1A1, 3.68% 2/25/34 (f) | | 2,669,337 | | 2,669,232 |
Class M1, 3.91% 2/25/34 (f) | | 750,000 | | 749,968 |
Class M2, 3.96% 2/25/34 (f) | | 800,000 | | 799,966 |
Series 2004-C Class 2A2, 4.01% 8/25/34 (f) | | 10,000,000 | | 10,101,993 |
Series 2005-2 Class 2A1, 3.5913% 6/25/35 (f) | | 15,380,000 | | 15,375,194 |
Series 2005-A: | | | | |
Class 2A2, 3.7% 2/25/35 (f) | | 11,850,000 | | 11,865,657 |
Class M1, 3.89% 1/25/35 (f) | | 1,603,000 | | 1,599,854 |
Class M2, 3.92% 1/25/35 (f) | | 2,325,000 | | 2,321,531 |
Class M3, 3.95% 1/25/35 (f) | | 1,250,000 | | 1,249,947 |
Class M4, 4.14% 1/25/35 (f) | | 925,000 | | 927,535 |
GE Business Loan Trust Series 2003-1 Class A, 3.8181% 4/15/31 (c)(f) | | 5,499,865 | | 5,531,421 |
GE Capital Credit Card Master Note Trust Series 2005-2 Class B, 3.5736% 6/15/11 (f) | | 6,475,000 | | 6,473,058 |
Gracechurch Card Funding PLC: | | | | |
Series 5: | | | | |
Class B, 3.6181% 8/15/08 (f) | | 1,520,000 | | 1,521,351 |
Class C, 4.3181% 8/15/08 (f) | | 5,580,000 | | 5,601,142 |
Series 6 Class B, 3.5781% 2/17/09 (f) | | 1,030,000 | | 1,030,901 |
Series 8 Class C, 3.6721% 6/15/10 (f) | | 18,450,000 | | 18,450,000 |
GSAMP Trust: | | | | |
Series 2002-HE Class M1, 4.68% 11/20/32 (f) | | 2,882,888 | | 2,928,737 |
Series 2002-NC1: | | | | |
Class A2, 3.78% 7/25/32 (f) | | 54,777 | | 55,099 |
Class M1, 4.1% 7/25/32 (f) | | 8,861,000 | | 8,920,491 |
Series 2003-FM1 Class M1, 4.25% 3/20/33 (f) | | 15,000,000 | | 15,136,310 |
Series 2004-FM1: | | | | |
Class M1, 4.11% 11/25/33 (f) | | 2,865,000 | | 2,864,879 |
Class M2, 4.86% 11/25/33 (f) | | 1,975,000 | | 2,005,597 |
Series 2004-FM2: | | | | |
Class M1, 3.96% 1/25/34 (f) | | 3,500,000 | | 3,499,853 |
Class M2, 4.56% 1/25/34 (f) | | 1,500,000 | | 1,499,936 |
Class M3, 4.76% 1/25/34 (f) | | 1,500,000 | | 1,499,935 |
Series 2004-HE1: | | | | |
Class M1, 4.01% 5/25/34 (f) | | 4,045,000 | | 4,044,829 |
Class M2, 4.61% 5/25/34 (f) | | 1,750,000 | | 1,766,258 |
Asset-Backed Securities - continued |
| Principal Amount | | Value |
GSAMP Trust: - continued | | | | |
Series 2005-9 Class 2A1, 3.5287% 8/25/35 (f) | | $ 17,530,000 | | $ 17,530,000 |
Series 2005-FF2 Class M5, 4.09% 3/25/35 (f) | | 3,500,000 | | 3,500,000 |
Series 2005-HE2 Class M, 3.89% 3/25/35 (f) | | 8,780,000 | | 8,749,867 |
Series 2005-NC1 Class M1, 3.91% 2/25/35 (f) | | 9,010,000 | | 8,987,296 |
Guggenheim Structured Real Estate Funding Ltd. Series 2005-1 Class C, 4.3944% 5/25/30 (c)(f) | | 14,000,000 | | 13,986,652 |
HFC Home Equity Loan Asset Backed Certificates Series 2005-2: | | | | |
Class M1, 3.97% 1/20/34 (f) | | 3,225,000 | | 3,225,000 |
Class M2, 4% 1/20/34 (f) | | 2,415,000 | | 2,415,000 |
Home Equity Asset Trust: | | | | |
Series 2002-2 Class M1, 4.26% 6/25/32 (f) | | 10,000,000 | | 10,017,090 |
Series 2002-3 Class A5, 3.9% 2/25/33 (f) | | 854,528 | | 855,194 |
Series 2002-4 Class A3, 3.94% 3/25/33 (f) | | 1,237,388 | | 1,238,074 |
Series 2002-5: | | | | |
Class A3, 3.98% 5/25/33 (f) | | 2,866,793 | | 2,872,821 |
Class M1, 4.66% 5/25/33 (f) | | 13,800,000 | | 13,966,276 |
Series 2003-1: | | | | |
Class A2, 3.93% 6/25/33 (f) | | 4,229,596 | | 4,233,111 |
Class M1, 4.46% 6/25/33 (f) | | 8,335,000 | | 8,375,317 |
Series 2003-2: | | | | |
Class A2, 3.84% 8/25/33 (f) | | 228,269 | | 229,139 |
Class M1, 4.34% 8/25/33 (f) | | 2,245,000 | | 2,269,298 |
Series 2003-3: | | | | |
Class A2, 3.82% 8/25/33 (f) | | 1,624,262 | | 1,630,339 |
Class M1, 4.32% 8/25/33 (f) | | 8,185,000 | | 8,266,814 |
Series 2003-4: | | | | |
Class M1, 4.26% 10/25/33 (f) | | 3,415,000 | | 3,440,384 |
Class M2, 5.36% 10/25/33 (f) | | 4,040,000 | | 4,093,038 |
Series 2003-5: | | | | |
Class A2, 3.81% 12/25/33 (f) | | 5,822,876 | | 5,843,440 |
Class M1, 4.16% 12/25/33 (f) | | 3,175,000 | | 3,192,660 |
Class M2, 5.19% 12/25/33 (f) | | 1,345,000 | | 1,377,487 |
Series 2003-7 Class A2, 3.84% 3/25/34 (f) | | 3,430,379 | | 3,438,503 |
Series 2004-2 Class A2, 3.75% 7/25/34 (f) | | 6,172,348 | | 6,172,139 |
Series 2004-3: | | | | |
Class M1, 4.03% 8/25/34 (f) | | 2,015,000 | | 2,019,636 |
Class M2, 4.66% 8/25/34 (f) | | 2,200,000 | | 2,237,373 |
Series 2004-4 Class A2, 3.78% 10/25/34 (f) | | 8,318,527 | | 8,347,783 |
Series 2004-6 Class A2, 3.81% 12/25/34 (f) | | 9,249,309 | | 9,278,715 |
Series 2004-7 Class A3, 3.85% 1/25/35 (f) | | 2,916,946 | | 2,929,856 |
Asset-Backed Securities - continued |
| Principal Amount | | Value |
Home Equity Asset Trust: - continued | | | | |
Series 2005-1: | | | | |
Class M1, 3.89% 5/25/35 (f) | | $ 9,705,000 | | $ 9,697,565 |
Class M2, 3.91% 5/25/35 (f) | | 5,780,000 | | 5,763,067 |
Class M3, 3.96% 5/25/35 (f) | | 5,825,000 | | 5,808,344 |
Series 2005-2: | | | | |
Class 2A2, 3.66% 7/25/35 (f) | | 13,170,000 | | 13,163,182 |
Class M1, 3.91% 7/25/35 (f) | | 10,085,000 | | 10,075,362 |
Series 2005-3 Class M1, 3.87% 8/25/35 (f) | | 9,450,000 | | 9,434,700 |
Series 2005-5 Class 2A2, 3.65% 11/25/35 (d)(f) | | 15,000,000 | | 14,968,605 |
Household Affinity Credit Card Master Note Trust I Series 2003-3 Class B, 3.6781% 8/15/08 (f) | | 10,000,000 | | 10,018,071 |
Household Credit Card Master Trust I Series 2002-1 Class B, 4.0381% 7/15/08 (f) | | 22,589,000 | | 22,608,682 |
Household Home Equity Loan Trust: | | | | |
Series 2002-2 Class A, 3.73% 4/20/32 (f) | | 3,295,048 | | 3,298,089 |
Series 2002-3 Class A, 3.88% 7/20/32 (f) | | 2,678,218 | | 2,681,775 |
Series 2003-1 Class M, 4.06% 10/20/32 (f) | | 770,987 | | 771,866 |
Series 2003-2: | | | | |
Class A, 3.76% 9/20/33 (f) | | 2,892,082 | | 2,897,777 |
Class M, 4.01% 9/20/33 (f) | | 1,360,000 | | 1,362,941 |
Series 2004-1 Class M, 3.95% 9/20/33 (f) | | 2,708,464 | | 2,713,597 |
Household Mortgage Loan Trust: | | | | |
Series 2003-HC1 Class M, 4.08% 2/20/33 (f) | | 1,742,776 | | 1,748,262 |
Series 2004-HC1: | | | | |
Class A, 3.78% 2/20/34 (f) | | 5,083,992 | | 5,096,702 |
Class M, 3.93% 2/20/34 (f) | | 3,073,800 | | 3,073,443 |
Household Private Label Credit Card Master Note Trust I: | | | | |
Series 2002-1 Class B, 3.9381% 1/18/11 (f) | | 8,850,000 | | 8,867,619 |
Series 2002-2: | | | | |
Class A, 3.5581% 1/18/11 (f) | | 9,000,000 | | 9,012,218 |
Class B, 3.9381% 1/18/11 (f) | | 14,275,000 | | 14,355,952 |
Series 2002-3 Class B, 4.6381% 9/15/09 (f) | | 4,150,000 | | 4,159,262 |
Ikon Receivables Funding LLC Series 2003-1 Class A3A, 3.6213% 12/17/07 (f) | | 2,781,207 | | 2,781,863 |
IXIS Real Estate Capital Trust Series 2005-HE1: | | | | |
Class A1, 3.71% 6/25/35 (f) | | 11,646,350 | | 11,645,706 |
Class M1, 3.93% 6/25/35 (f) | | 4,100,000 | | 4,094,813 |
Class M2, 3.95% 6/25/35 (f) | | 2,775,000 | | 2,766,003 |
Class M3, 3.98% 6/25/35 (f) | | 1,975,000 | | 1,972,566 |
Keycorp Student Loan Trust Series 1999-A Class A2, 3.8% 12/27/09 (f) | | 16,169,548 | | 16,224,493 |
Asset-Backed Securities - continued |
| Principal Amount | | Value |
Long Beach Mortgage Loan Trust: | | | | |
Series 2003-2: | | | | |
Class AV, 3.78% 6/25/33 (f) | | $ 253,078 | | $ 253,185 |
Class M1, 4.28% 6/25/33 (f) | | 19,500,000 | | 19,626,153 |
Series 2003-3 Class M1, 4.21% 7/25/33 (f) | | 7,770,000 | | 7,824,625 |
Series 2004-2: | | | | |
Class M1, 3.99% 6/25/34 (f) | | 4,275,000 | | 4,285,404 |
Class M2, 4.54% 6/25/34 (f) | | 1,400,000 | | 1,416,723 |
Series 2005-2 Class 2A2, 3.64% 4/25/35 (f) | | 12,000,000 | | 11,996,998 |
MASTR Asset Backed Securities Trust: | | | | |
Series 2003-NC1: | | | | |
Class M1, 4.19% 4/25/33 (f) | | 3,500,000 | | 3,519,270 |
Class M2, 5.31% 4/25/33 (f) | | 1,500,000 | | 1,534,429 |
Series 2004-FRE1 Class M1, 4.01% 7/25/34 (f) | | 5,223,000 | | 5,238,948 |
MBNA Asset Backed Note Trust Series 2000-K Class C, 4.1881% 3/17/08 (c)(f) | | 7,250,000 | | 7,258,700 |
MBNA Credit Card Master Note Trust: | | | | |
Series 2001-B1 Class B1, 3.7631% 10/15/08 (f) | | 30,000,000 | | 30,042,072 |
Series 2001-B2 Class B2, 3.7481% 1/15/09 (f) | | 30,353,000 | | 30,429,933 |
Series 2002-B2 Class B2, 3.7681% 10/15/09 (f) | | 20,000,000 | | 20,086,600 |
Series 2002-B3 Class B3, 3.7881% 1/15/08 (f) | | 15,000,000 | | 15,000,470 |
Series 2002-B4 Class B4, 3.8881% 3/15/10 (f) | | 14,800,000 | | 14,916,873 |
Series 2003-B2 Class B2, 3.7781% 10/15/10 (f) | | 1,530,000 | | 1,545,569 |
Series 2003-B3 Class B3, 3.7631% 1/18/11 (f) | | 1,130,000 | | 1,135,362 |
Series 2003-B5 Class B5, 3.7581% 2/15/11 (f) | | 705,000 | | 710,447 |
MBNA Master Credit Card Trust II: | | | | |
Series 1998-E Class B, 3.9288% 9/15/10 (f) | | 7,800,000 | | 7,846,570 |
Series 1998-G Class B, 3.7881% 2/17/09 (f) | | 20,000,000 | | 20,043,574 |
Meritage Mortgage Loan Trust Series 2004-1: | | | | |
Class M1, 3.96% 7/25/34 (f) | | 2,125,000 | | 2,124,911 |
Class M2, 4.01% 7/25/34 (f) | | 375,000 | | 374,985 |
Class M3, 4.41% 7/25/34 (f) | | 775,000 | | 774,967 |
Class M4, 4.56% 7/25/34 (f) | | 525,000 | | 524,978 |
Merrill Lynch Mortgage Investors, Inc. Series 2003-HE1 Class M1, 4.16% 7/25/34 (f) | | 2,321,000 | | 2,330,928 |
Morgan Stanley ABS Capital I, Inc.: | | | | |
Series 2002-NC6 Class M2, 5.56% 11/25/32 (f) | | 2,370,000 | | 2,441,680 |
Series 2003-NC5 Class M2, 5.46% 4/25/33 (f) | | 2,800,000 | | 2,834,138 |
Series 2003-NC6 Class M2, 5.41% 6/27/33 (f) | | 12,835,000 | | 13,180,825 |
Series 2003-NC7 Class M1, 4.16% 6/25/33 (f) | | 1,785,000 | | 1,791,357 |
Series 2003-NC8 Class M1, 4.16% 9/25/33 (f) | | 2,350,000 | | 2,363,472 |
Series 2004-HE6 Class A2, 3.8% 8/25/34 (f) | | 7,193,690 | | 7,217,222 |
Series 2004-NC2 Class M1, 4.01% 12/25/33 (f) | | 2,595,000 | | 2,599,359 |
Asset-Backed Securities - continued |
| Principal Amount | | Value |
Morgan Stanley ABS Capital I, Inc.: - continued | | | | |
Series 2004-NC6 Class A2, 3.8% 7/25/34 (f) | | $ 3,163,358 | | $ 3,170,145 |
Series 2005-1: | | | | |
Class M2, 3.93% 12/25/34 (f) | | 4,425,000 | | 4,417,835 |
Class M3, 3.98% 12/25/34 (f) | | 4,000,000 | | 3,998,266 |
Series 2005-HE1: | | | | |
Class A3B, 3.68% 12/25/34 (f) | | 3,885,000 | | 3,889,266 |
Class M1, 3.91% 12/25/34 (f) | | 1,100,000 | | 1,102,253 |
Class M2, 3.93% 12/25/34 (f) | | 2,970,000 | | 2,966,369 |
Series 2005-HE2: | | | | |
Class M1, 3.86% 1/25/35 (f) | | 2,665,000 | | 2,670,502 |
Class M2, 3.9% 1/25/35 (f) | | 1,900,000 | | 1,893,810 |
Series 2005-NC1: | | | | |
Class M1, 3.9% 1/25/35 (f) | | 2,425,000 | | 2,432,731 |
Class M2, 3.93% 1/25/35 (f) | | 2,425,000 | | 2,421,056 |
Class M3, 3.97% 1/25/35 (f) | | 2,425,000 | | 2,425,850 |
Morgan Stanley Dean Witter Capital I Trust: | | | | |
Series 2001-AM1: | | | | |
Class M1, 4.31% 2/25/32 (f) | | 1,510,288 | | 1,513,954 |
Class M2, 4.86% 2/25/32 (f) | | 7,146,795 | | 7,171,201 |
Series 2001-NC4: | | | | |
Class M1, 4.46% 1/25/32 (f) | | 3,827,881 | | 3,841,816 |
Series 2002-AM3 Class A3, 3.95% 2/25/33 (f) | | 1,426,624 | | 1,430,581 |
Series 2002-HE1 Class M1, 4.06% 7/25/32 (f) | | 5,860,000 | | 5,893,149 |
Series 2002-HE2 Class M1, 4.16% 8/25/32 (f) | | 9,925,000 | | 9,970,606 |
Series 2002-NC3 Class A3, 3.8% 8/25/32 (f) | | 396,299 | | 397,573 |
Series 2002-OP1 Class M1, 4.21% 9/25/32 (f) | | 3,894,745 | | 3,917,849 |
Series 2003-NC1: | | | | |
Class M1, 4.51% 11/25/32 (f) | | 2,555,000 | | 2,572,380 |
Class M2, 5.51% 11/25/32 (f) | | 1,880,000 | | 1,899,041 |
New Century Home Equity Loan Trust: | | | | |
Series 2003-2: | | | | |
Class A2, 3.89% 1/25/33 (f) | | 341,254 | | 341,436 |
Class M2, 5.46% 1/25/33 (f) | | 4,600,000 | | 4,667,174 |
Series 2003-6 Class M1, 4.18% 1/25/34 (f) | | 5,180,000 | | 5,202,952 |
Series 2005-1: | | | | |
Class M1, 3.91% 3/25/35 (f) | | 4,395,000 | | 4,392,950 |
Class M2, 3.94% 3/25/35 (f) | | 4,395,000 | | 4,384,834 |
Class M3, 3.98% 3/25/35 (f) | | 2,120,000 | | 2,120,796 |
Nissan Auto Lease Trust: | | | | |
Series 2003-A Class A3A, 3.5281% 6/15/09 (f) | | 13,621,752 | | 13,633,434 |
Series 2004-A Class A4A, 3.4581% 6/15/10 (f) | | 10,570,000 | | 10,582,978 |
Asset-Backed Securities - continued |
| Principal Amount | | Value |
NovaStar Home Equity Loan Series 2004-1: | | | | |
Class M1, 3.91% 6/25/34 (f) | | $ 1,450,000 | | $ 1,451,222 |
Class M4, 4.435% 6/25/34 (f) | | 2,435,000 | | 2,439,150 |
Ocala Funding LLC Series 2005-1A Class A, 4.93% 3/20/10 (c)(f) | | 3,675,000 | | 3,675,000 |
Ownit Mortgage Loan Asste-Backed Certificates Series 2005-3 Class A2A, 3.5% 6/25/36 (f) | | 15,500,000 | | 15,500,000 |
Park Place Securities, Inc.: | | | | |
Series 2004-WCW1: | | | | |
Class M1, 4.09% 9/25/34 (f) | | 3,745,000 | | 3,756,721 |
Class M2, 4.14% 9/25/34 (f) | | 1,755,000 | | 1,764,326 |
Class M3, 4.71% 9/25/34 (f) | | 3,355,000 | | 3,396,745 |
Class M4, 4.91% 9/25/34 (f) | | 4,700,000 | | 4,767,614 |
Series 2004-WCW2 Class A2, 3.84% 10/25/34 (f) | | 7,952,623 | | 7,976,111 |
Series 2005-WCH1: | | | | |
Class A3B, 3.68% 1/25/35 (f) | | 2,775,000 | | 2,779,908 |
Class M2, 3.98% 1/25/35 (f) | | 4,175,000 | | 4,166,539 |
Class M3, 4.02% 1/25/35 (f) | | 3,290,000 | | 3,292,599 |
Class M5, 4.34% 1/25/35 (f) | | 3,095,000 | | 3,104,620 |
Series 2005-WHQ2 Class M7, 4.71% 5/25/35 (f) | | 5,950,000 | | 5,930,787 |
People's Choice Home Loan Securities Trust Series 2005-2: | | | | |
Class A1, 3.57% 9/25/24 (f) | | 7,475,790 | | 7,475,790 |
Class M4, 4.09% 5/25/35 (f) | | 6,000,000 | | 6,000,000 |
Providian Gateway Master Trust Series 2002-B Class A, 4.0881% 6/15/09 (c)(f) | | 15,000,000 | | 15,039,393 |
Residental Asset Securities Corp.: | | | | |
Series 2005-KS4 Class M2, 4.04% 4/25/35 (f) | | 1,040,000 | | 1,037,610 |
Series 2005-KS7 Class A1, 3.4781% 8/25/35 (f) | | 10,515,000 | | 10,512,897 |
Residential Asset Mortgage Products, Inc. Series 2004-RS10 Class MII2, 4.71% 10/25/34 (f) | | 5,500,000 | | 5,566,857 |
Salomon Brothers Mortgage Securities VII, Inc. Series 2003-HE1 Class A, 3.86% 4/25/33 (f) | | 818,316 | | 822,076 |
Saxon Asset Securities Trust: | | | | |
Series 2004-1 Class M1, 3.99% 3/25/35 (f) | | 4,415,000 | | 4,413,887 |
Series 2004-2 Class MV1, 4.04% 8/25/35 (f) | | 4,495,000 | | 4,501,043 |
Sears Credit Account Master Trust II: | | | | |
Series 2001-1 Class B, 3.8131% 2/15/10 (f) | | 10,000,000 | | 9,987,143 |
Series 2002-4: | | | | |
Class A, 3.5181% 8/18/09 (f) | | 27,000,000 | | 26,999,603 |
Class B, 3.8131% 8/18/09 (f) | | 33,300,000 | | 33,301,149 |
Series 2002-5 Class B, 4.6381% 11/17/09 (f) | | 30,000,000 | | 30,062,976 |
Asset-Backed Securities - continued |
| Principal Amount | | Value |
Securitized Asset Backed Receivables LLC Trust Series 2004-NC1 Class M1, 3.98% 2/25/34 (f) | | $ 2,910,000 | | $ 2,909,256 |
Specialty Underwriting & Residential Finance Series 2003-BC4 Class M1, 4.06% 11/25/34 (f) | | 1,810,000 | | 1,818,452 |
Structured Asset Securities Corp. Series 2004-GEL1 Class A, 3.82% 2/25/34 (f) | | 1,043,424 | | 1,043,422 |
Superior Wholesale Inventory Financing Trust VII Series 2003-A8 Class CTFS, 3.8381% 3/15/11 (c)(f) | | 10,835,000 | | 10,828,228 |
Superior Wholesale Inventory Financing Trust XII Series 2005-A12 Class C, 4.46% 6/15/10 (f) | | 6,840,000 | | 6,839,945 |
Terwin Mortgage Trust: | | | | |
Series 2003-4HE Class A1, 3.89% 9/25/34 (f) | | 2,878,990 | | 2,894,593 |
Series 2003-6HE Class A1, 3.93% 11/25/33 (f) | | 1,784,384 | | 1,788,543 |
Series 2005-14HE Class AF1, 3.9753% 7/25/36 (d)(f) | | 8,635,000 | | 8,633,296 |
TOTAL ASSET-BACKED SECURITIES (Cost $2,293,954,229) | 2,300,747,332 |
Collateralized Mortgage Obligations - 16.9% |
|
Private Sponsor - 13.7% |
Adjustable Rate Mortgage Trust floater: | | | | |
Series 2004-2 Class 7A3, 3.86% 2/25/35 (f) | | 9,374,471 | | 9,396,037 |
Series 2004-4 Class 5A2, 3.86% 3/25/35 (f) | | 3,780,419 | | 3,787,953 |
Series 2005-1 Class 5A2, 3.79% 5/25/35 (f) | | 6,187,250 | | 6,191,166 |
Series 2005-2: | | | | |
Class 6A2, 3.74% 6/25/35 (f) | | 2,930,592 | | 2,932,491 |
Class 6M2, 3.94% 6/25/35 (f) | | 10,145,000 | | 10,145,010 |
Series 2005-3 Class 8A2, 3.7% 7/25/35 (f) | | 19,199,197 | | 19,211,695 |
Series 2005-4 Class 7A2, 3.69% 8/25/35 (f) | | 9,011,457 | | 9,003,527 |
Series 2005-8 Class 7A2, 3.77% 11/25/35 (f) | | 7,660,000 | | 7,660,000 |
Bear Stearns Alt-A Trust floater: | | | | |
Series 2005-1 Class A1, 3.74% 1/25/35 (f) | | 20,354,186 | | 20,354,186 |
Series 2005-2 Class 1A1, 3.71% 3/25/35 (f) | | 14,961,065 | | 14,961,065 |
Series 2005-5 Class 1A1, 3.68% 7/25/35 (f) | | 18,707,862 | | 18,696,170 |
Countrywide Alternative Loan Trust planned amortization class Series 2003-5T2 Class A2, 3.86% 5/25/33 (f) | | 5,545,033 | | 5,548,017 |
Countrywide Home Loans, Inc. floater: | | | | |
Series 2004-16 Class A1, 3.86% 9/25/34 (f) | | 10,335,456 | | 10,325,843 |
Series 2005-1 Class 2A1, 3.75% 3/25/35 (f) | | 14,617,171 | | 14,617,171 |
CS First Boston Mortgage Securities Corp. floater: | | | | |
Series 2004-AR2 Class 6A1, 3.86% 3/25/34 (f) | | 5,338,263 | | 5,334,945 |
Collateralized Mortgage Obligations - continued |
| Principal Amount | | Value |
Private Sponsor - continued |
CS First Boston Mortgage Securities Corp. floater: - continued | | | | |
Series 2004-AR3 Class 6A2, 3.83% 4/25/34 (f) | | $ 2,226,193 | | $ 2,228,162 |
Series 2004-AR4 Class 5A2, 3.83% 5/25/34 (f) | | 2,066,310 | | 2,065,052 |
Series 2004-AR5 Class 11A2, 3.83% 6/25/34 (f) | | 2,987,552 | | 2,981,472 |
Series 2004-AR6 Class 9A2, 3.83% 10/25/34 (f) | | 3,981,028 | | 3,983,412 |
Series 2004-AR7 Class 6A2, 3.84% 8/25/34 (f) | | 5,801,660 | | 5,806,785 |
Series 2004-AR8 Class 8A2, 3.84% 9/25/34 (f) | | 4,630,225 | | 4,638,807 |
First Horizon Mortgage Passthru Trust floater Series 2004-FL1 Class 2A1, 3.95% 12/25/34 (f) | | 4,384,853 | | 4,379,779 |
Granite Master Issuer PLC floater: | | | | |
Series 2005-1: | | | | |
Class A3, 3.51% 12/21/24 (f) | | 5,300,000 | | 5,299,006 |
Class B1, 3.56% 12/20/54 (f) | | 7,050,000 | | 7,047,577 |
Class M1, 3.66% 12/20/54 (f) | | 5,300,000 | | 5,298,178 |
Series 2005-2 Class C1, 3.7857% 12/20/54 (f) | | 7,975,000 | | 7,972,508 |
Granite Mortgages PLC floater: | | | | |
Series 2004-1: | | | | |
Class 1B, 3.64% 3/20/44 (f) | | 1,415,000 | | 1,414,844 |
Class 1C, 4.33% 3/20/44 (f) | | 4,075,000 | | 4,091,219 |
Class 1M, 3.84% 3/20/44 (f) | | 4,935,000 | | 4,938,751 |
Series 2004-2: | | | | |
Class 1A2, 3.5% 6/20/28 (f) | | 5,384,259 | | 5,384,932 |
Class 1B, 3.6% 6/20/44 (f) | | 1,018,055 | | 1,018,309 |
Class 1C, 4.13% 6/20/44 (f) | | 3,706,295 | | 3,713,918 |
Class 1M, 3.71% 6/20/44 (f) | | 2,722,846 | | 2,724,205 |
Series 2004-3: | | | | |
Class 1B, 3.59% 9/20/44 (f) | | 2,100,000 | | 2,100,210 |
Class 1C, 4.02% 9/20/44 (f) | | 5,415,000 | | 5,426,913 |
Class 1M, 3.7% 9/20/44 (f) | | 1,200,000 | | 1,200,360 |
Harborview Mortgage Loan Trust floater Series 2005-2 Class 2A1A, 3.6369% 5/19/35 (f) | | 11,690,145 | | 11,648,134 |
Holmes Financing No. 7 PLC floater Series 2 Class M, 4.3988% 7/15/40 (f) | | 2,560,000 | | 2,564,912 |
Holmes Financing No. 8 PLC floater Series 2: | | | | |
Class A, 3.6788% 4/15/11 (f) | | 25,000,000 | | 25,000,000 |
Class B, 3.7688% 7/15/40 (f) | | 2,695,000 | | 2,696,684 |
Class C, 4.3188% 7/15/40 (f) | | 10,280,000 | | 10,328,193 |
Home Equity Asset Trust floater Series 2005-3 Class 2A1, 3.55% 8/25/35 (f) | | 7,268,025 | | 7,266,230 |
Homestar Mortgage Acceptance Corp. floater Series 2004-5 Class A1, 3.91% 10/25/34 (f) | | 4,495,430 | | 4,509,337 |
Collateralized Mortgage Obligations - continued |
| Principal Amount | | Value |
Private Sponsor - continued |
Impac CMB Trust floater: | | | | |
Series 2004-11 Class 2A2, 3.83% 3/25/35 (f) | | $ 8,638,669 | | $ 8,636,982 |
Series 2004-6 Class 1A2, 3.85% 10/25/34 (f) | | 3,481,529 | | 3,487,748 |
Series 2005-1: | | | | |
Class M1, 3.92% 4/25/35 (f) | | 3,223,929 | | 3,220,529 |
Class M2, 3.96% 4/25/35 (f) | | 5,644,146 | | 5,639,516 |
Class M3, 3.99% 4/25/35 (f) | | 1,384,927 | | 1,383,466 |
Class M4, 4.21% 4/25/35 (f) | | 817,334 | | 818,164 |
Class M5, 4.23% 4/25/35 (f) | | 817,334 | | 817,174 |
Class M6, 4.28% 4/25/35 (f) | | 1,307,734 | | 1,307,479 |
Series 2005-2 Class 1A2, 3.77% 4/25/35 (f) | | 13,211,515 | | 13,201,194 |
Series 2005-3 Class A1, 3.7% 8/25/35 (f) | | 15,176,045 | | 15,149,962 |
Series 2005-4 Class 1B1, 4.76% 6/25/35 (f) | | 5,306,886 | | 5,282,839 |
Lehman Structured Securities Corp. floater Series 2005-1 Class A2, 3.67% 9/26/45 (c)(f) | | 16,153,164 | | 16,153,164 |
MASTR Adjustable Rate Mortgages Trust: | | | | |
floater Series 2005-1 Class 1A1, 3.73% 3/25/35 (f) | | 13,405,372 | | 13,396,993 |
Series 2004-6 Class 4A2, 4.1729% 7/25/34 (f) | | 5,969,000 | | 5,946,582 |
Merrill Lynch Mortgage Investors, Inc. floater: | | | | |
Series 2003-A Class 2A1, 3.85% 3/25/28 (f) | | 8,079,308 | | 8,122,924 |
Series 2003-B Class A1, 3.8% 4/25/28 (f) | | 7,852,610 | | 7,898,403 |
Series 2003-D Class A, 3.77% 8/25/28 (f) | | 7,479,616 | | 7,494,804 |
Series 2003-E Class A2, 3.4425% 10/25/28 (f) | | 10,687,128 | | 10,687,143 |
Series 2003-F Class A2, 3.7075% 10/25/28 (f) | | 12,892,959 | | 12,891,486 |
Series 2004-A Class A2, 3.6175% 4/25/29 (f) | | 11,584,437 | | 11,556,917 |
Series 2004-B Class A2, 3.79% 6/25/29 (f) | | 8,952,030 | | 8,930,464 |
Series 2004-C Class A2, 3.95% 7/25/29 (f) | | 12,856,157 | | 12,825,407 |
Series 2004-D Class A2, 3.4725% 9/25/29 (f) | | 9,971,432 | | 9,974,033 |
Series 2004-E: | | | | |
Class A2B, 3.7275% 11/25/29 (f) | | 8,523,921 | | 8,502,874 |
Class A2D, 3.9175% 11/25/29 (f) | | 1,982,307 | | 1,991,830 |
Series 2004-G Class A2, 3.95% 11/25/29 (f) | | 3,854,828 | | 3,854,422 |
Series 2005-A Class A2, 3.38% 2/25/30 (f) | | 10,800,867 | | 10,785,319 |
Mortgage Asset Backed Securities Trust floater Series 2002-NC1 Class M1, 4.31% 10/25/32 (f) | | 4,538,551 | | 4,555,535 |
MortgageIT Trust floater: | | | | |
Series 2004-2: | | | | |
Class A1, 3.83% 12/25/34 (f) | | 4,920,628 | | 4,927,758 |
Class A2, 3.91% 12/25/34 (f) | | 6,656,800 | | 6,696,298 |
Series 2005-2 Class 1A1, 3.72% 5/25/35 (f) | | 5,093,718 | | 5,097,498 |
Opteum Mortgage Acceptance Corp. floater Series 2005-3 Class APT, 3.75% 6/25/35 (f) | | 19,112,336 | | 19,123,533 |
Collateralized Mortgage Obligations - continued |
| Principal Amount | | Value |
Private Sponsor - continued |
Permanent Financing No. 1 PLC floater Series 1 Class 2C, 4.5594% 6/10/42 (f) | | $ 1,745,000 | | $ 1,749,384 |
Permanent Financing No. 3 PLC floater Series 2 Class C, 4.4294% 6/10/42 (f) | | 4,845,000 | | 4,893,450 |
Permanent Financing No. 4 PLC floater Series 2 Class C, 4.0994% 6/10/42 (f) | | 15,400,000 | | 15,475,306 |
Permanent Financing No. 5 PLC floater: | | | | |
Series 2 Class C, 4.0294% 6/10/42 (f) | | 4,215,000 | | 4,234,760 |
Series 3 Class C, 4.1994% 6/10/42 (f) | | 8,890,000 | | 8,967,788 |
Permanent Financing No. 6 PLC floater Series 6: | | | | |
Class 1C, 3.7294% 6/10/42 (f) | | 4,000,000 | | 4,000,572 |
Class 2C, 3.8294% 6/10/42 (f) | | 5,350,000 | | 5,352,343 |
Permanent Financing No. 7 PLC floater Series 7: | | | | |
Class 1B, 3.4694% 6/10/42 (f) | | 2,000,000 | | 1,999,375 |
Class 1C, 3.6594% 6/10/42 (f) | | 3,840,000 | | 3,838,800 |
Class 2C, 3.7094% 6/10/42 (f) | | 8,065,000 | | 8,054,919 |
Permanent Financing No. 8 PLC floater Series 8: | | | | |
Class 1C, 3.7475% 6/10/42 (f) | | 7,165,000 | | 7,162,621 |
Class 2C, 3.8175% 6/10/42 (f) | | 9,945,000 | | 9,941,688 |
Residential Asset Mortgage Products, Inc. sequential pay Series 2003-SL1 Class A31, 7.125% 4/25/31 | | 4,643,507 | | 4,727,342 |
Residential Finance LP/Residential Finance Development Corp. floater Series 2003-A: | | | | |
Class B4, 5.15% 3/10/35 (c)(f) | | 5,492,986 | | 5,575,381 |
Class B5, 5.7% 3/10/35 (c)(f) | | 5,684,725 | | 5,811,417 |
Residential Funding Securities Corp.: | | | | |
Series 2003-RP1 Class A1, 3.96% 11/25/34 (f) | | 2,829,110 | | 2,840,739 |
Series 2003-RP2 Class A1, 3.93% 6/25/33 (c)(f) | | 3,866,185 | | 3,881,108 |
Sequoia Mortgage Trust floater: | | | | |
Series 2003-5 Class A2, 3.41% 9/20/33 (f) | | 10,999,101 | | 10,996,236 |
Series 2003-7 Class A2, 2.885% 1/20/34 (f) | | 9,577,708 | | 9,569,385 |
Series 2004-1 Class A, 4.15% 2/20/34 (f) | | 6,379,791 | | 6,373,993 |
Series 2004-10 Class A4, 3.6681% 11/20/34 (f) | | 10,424,803 | | 10,408,138 |
Series 2004-3 Class A, 3.5463% 5/20/34 (f) | | 10,662,486 | | 10,588,333 |
Series 2004-4 Class A, 3.5881% 5/20/34 (f) | | 13,430,919 | | 13,399,990 |
Series 2004-5 Class A3, 3.77% 6/20/34 (f) | | 8,904,038 | | 8,897,082 |
Series 2004-6: | | | | |
Class A3A, 4.1475% 6/20/35 (f) | | 8,182,127 | | 8,176,739 |
Class A3B, 3.16% 7/20/34 (f) | | 1,022,766 | | 1,021,950 |
Series 2004-7: | | | | |
Class A3A, 3.2275% 8/20/34 (f) | | 7,642,675 | | 7,636,475 |
Class A3B, 3.4525% 7/20/34 (f) | | 1,375,260 | | 1,380,167 |
Collateralized Mortgage Obligations - continued |
| Principal Amount | | Value |
Private Sponsor - continued |
Sequoia Mortgage Trust floater: - continued | | | | |
Series 2004-8 Class A2, 3.45% 9/20/34 (f) | | $ 14,155,710 | | $ 14,148,404 |
Series 2005-1 Class A2, 3.68% 2/20/35 (f) | | 7,355,282 | | 7,354,362 |
Series 2005-2 Class A2, 3.36% 3/20/35 (f) | | 13,876,523 | | 13,876,523 |
Series 2005-3 Class A1, 3.46% 5/20/35 (f) | | 9,217,677 | | 9,217,677 |
Structured Adjustable Rate Mortgage Loan Trust floater Series 2001-14 Class A1, 3.77% 7/25/35 (f) | | 11,201,095 | | 11,201,095 |
Structured Asset Securities Corp. floater Series 2004-NP1 Class A, 3.86% 9/25/33 (c)(f) | | 2,553,470 | | 2,555,084 |
Thornburg Mortgage Securities Trust floater Series 2004-3 Class A, 3.83% 9/25/34 (f) | | 22,068,069 | | 22,129,394 |
WAMU Mortgage pass thru certificates: | | | | |
floater Series 2005-AR6 Class 2A-1A, 3.5448% 4/25/45 (f) | | 6,133,307 | | 6,133,607 |
Series 2005 AR11 Class A1C1, 3.6675% 8/25/40 (d)(f) | | 14,400,000 | | 14,400,000 |
Wells Fargo Mortgage Backed Securities Trust: | | | | |
Series 2004-M Class A3, 4.7024% 8/25/34 (f) | | 19,880,000 | | 19,789,156 |
Series 2005-AR12 Class 2A1, 4.322% 7/25/35 (f) | | 31,674,772 | | 31,407,532 |
TOTAL PRIVATE SPONSOR | | 895,419,920 |
U.S. Government Agency - 3.2% |
Fannie Mae: | | | | |
floater: | | | | |
Series 2000-38 Class F, 3.76% 11/18/30 (f) | | 1,103,802 | | 1,112,055 |
Series 2000-40 Class FA, 3.8144% 7/25/30 (f) | | 2,487,156 | | 2,498,099 |
Series 2002-89 Class F, 3.6144% 1/25/33 (f) | | 3,630,895 | | 3,636,484 |
target amortization class Series G94-2 Class D, 6.45% 1/25/24 | | 4,732,822 | | 4,849,182 |
Fannie Mae guaranteed REMIC pass thru certificates: | | | | |
floater: | | | | |
Series 2001-34 Class FR, 3.66% 8/18/31 (f) | | 2,500,934 | | 2,508,899 |
Series 2001-44 Class FB, 3.6144% 9/25/31 (f) | | 2,262,040 | | 2,268,738 |
Series 2001-46 Class F, 3.66% 9/18/31 (f) | | 6,514,676 | | 6,552,090 |
Series 2002-11 Class QF, 3.8144% 3/25/32 (f) | | 4,517,951 | | 4,551,812 |
Series 2002-36 Class FT, 3.8144% 6/25/32 (f) | | 1,503,724 | | 1,516,521 |
Series 2002-64 Class FE, 3.61% 10/18/32 (f) | | 2,256,514 | | 2,266,981 |
Series 2002-65 Class FA, 3.6144% 10/25/17 (f) | | 2,585,370 | | 2,590,545 |
Series 2002-74 Class FV, 3.7644% 11/25/32 (f) | | 8,360,131 | | 8,420,920 |
Series 2003-11: | | | | |
Class DF, 3.7644% 2/25/33 (f) | | 3,173,455 | | 3,195,574 |
Class EF, 3.7644% 2/25/33 (f) | | 2,602,157 | | 2,612,658 |
Collateralized Mortgage Obligations - continued |
| Principal Amount | | Value |
U.S. Government Agency - continued |
Fannie Mae guaranteed REMIC pass thru certificates: - continued | | | | |
floater: | | | | |
Series 2003-63 Class F1, 3.6144% 11/25/27 (f) | | $ 6,387,368 | | $ 6,390,916 |
planned amortization class: | | | | |
Series 1998-63 Class PG, 6% 3/25/27 | | 1,212,661 | | 1,212,198 |
Series 2001-62 Class PG, 6.5% 10/25/30 | | 4,183,652 | | 4,194,964 |
Series 2001-76 Class UB, 5.5% 10/25/13 | | 1,378,221 | | 1,379,002 |
Series 2002-16 Class QD, 5.5% 6/25/14 | | 345,479 | | 346,552 |
Series 2002-28 Class PJ, 6.5% 3/25/31 | | 4,950,777 | | 4,957,813 |
Series 2002-8 Class PD, 6.5% 7/25/30 | | 3,569,878 | | 3,584,870 |
Freddie Mac: | | | | |
floater Series 2510 Class FE, 3.7881% 10/15/32 (f) | | 5,998,150 | | 6,032,418 |
planned amortization class: | | | | |
Series 2091 Class PP, 6% 2/15/27 | | 1,286,641 | | 1,286,029 |
Series 2353 Class PC, 6.5% 9/15/15 | | 1,363,169 | | 1,366,992 |
Freddie Mac Manufactured Housing participation certificates guaranteed floater Series 2338 Class FJ, 3.5881% 7/15/31 (f) | | 5,197,631 | | 5,199,968 |
Freddie Mac Multi-class participation certificates guaranteed: | | | | |
floater: | | | | |
Series 2474 Class FJ, 3.7381% 7/15/17 (f) | | 4,556,922 | | 4,564,198 |
Series 2526 Class FC, 3.7881% 11/15/32 (f) | | 3,597,778 | | 3,616,182 |
Series 2538 Class FB, 3.7881% 12/15/32 (f) | | 6,607,741 | | 6,651,155 |
Series 2551 Class FH, 3.8381% 1/15/33 (f) | | 3,358,821 | | 3,373,027 |
planned amortization class: | | | | |
Series 2136 Class PE, 6% 1/15/28 | | 12,190,349 | | 12,248,248 |
Series 2394 Class ND, 6% 6/15/27 | | 1,550,172 | | 1,553,415 |
Series 2395 Class PE, 6% 2/15/30 | | 5,961,413 | | 6,000,327 |
Series 2398 Class DK, 6.5% 1/15/31 | | 372,760 | | 373,347 |
Series 2410 Class ML, 6.5% 12/15/30 | | 2,168,673 | | 2,179,211 |
Series 2420 Class BE, 6.5% 12/15/30 | | 2,595,889 | | 2,604,122 |
Series 2443 Class TD, 6.5% 10/15/30 | | 2,962,497 | | 2,977,827 |
Series 2461 Class PG, 6.5% 1/15/31 | | 2,737,118 | | 2,773,721 |
Series 2466 Class EC, 6% 10/15/27 | | 257,483 | | 257,163 |
Series 2483 Class DC, 5.5% 7/15/14 | | 1,861,588 | | 1,861,466 |
Series 2556 Class PM, 5.5% 2/15/16 | | 1,160,963 | | 1,159,984 |
Series 2776 Class UJ, 4.5% 5/15/20 (g) | | 7,104,375 | | 367,384 |
Series 2828 Class JA, 4.5% 1/15/10 | | 11,880,000 | | 11,903,044 |
sequential pay: | | | | |
Series 2430 Class ZE, 6.5% 8/15/27 | | 648,803 | | 649,120 |
Series 2480 Class QW, 5.75% 2/15/30 | | 871,905 | | 871,370 |
Collateralized Mortgage Obligations - continued |
| Principal Amount | | Value |
U.S. Government Agency - continued |
Freddie Mac Multi-class participation certificates guaranteed: - continued | | | | |
Series 2406: | | | | |
Class FP, 4.3681% 1/15/32 (f) | | $ 10,270,000 | | $ 10,502,819 |
Class PF, 4.3681% 12/15/31 (f) | | 8,125,000 | | 8,337,955 |
Series 2410 Class PF, 4.3681% 2/15/32 (f) | | 18,644,444 | | 19,070,154 |
Ginnie Mae guaranteed REMIC pass thru securities floater: | | | | |
Series 2001-46 Class FB, 3.7381% 5/16/23 (f) | | 2,988,811 | | 3,001,292 |
Series 2001-50 Class FV, 3.5881% 9/16/27 (f) | | 9,114,548 | | 9,113,939 |
Series 2002-24 Class FX, 3.9381% 4/16/32 (f) | | 2,630,687 | | 2,652,779 |
Series 2002-31 Class FW, 3.7881% 6/16/31 (f) | | 3,614,097 | | 3,633,687 |
Series 2002-5 Class KF, 3.7881% 8/16/26 (f) | | 617,815 | | 618,278 |
TOTAL U.S. GOVERNMENT AGENCY | | 207,447,494 |
TOTAL COLLATERALIZED MORTGAGE OBLIGATIONS (Cost $1,104,119,465) | 1,102,867,414 |
Commercial Mortgage Securities - 5.8% |
|
1301 Avenue of The Americas Trust Series 2000-1301: | | | | |
Class C, 7.44% 8/3/10 (c)(f) | | 5,025,000 | | 5,024,881 |
Class D, 7.54% 8/3/10 (c)(f) | | 6,695,000 | | 6,694,844 |
Banc of America Large Loan, Inc. floater: | | | | |
Series 2003-BBA2 Class A3, 3.7081% 11/15/15 (c)(f) | | 5,038,226 | | 5,041,400 |
Series 2005-BOCA: | | | | |
Class H, 4.3381% 12/15/16 (c)(f) | | 2,065,000 | | 2,061,834 |
Class J, 4.4881% 12/15/16 (c)(f) | | 1,020,000 | | 1,018,438 |
Class K, 4.7381% 12/15/16 (c)(f) | | 6,659,000 | | 6,650,611 |
Bayview Commercial Asset Trust floater: | | | | |
Series 2003-1 Class A, 4.04% 8/25/33 (c)(f) | | 6,644,316 | | 6,723,250 |
Series 2003-2: | | | | |
Class A, 4.04% 12/25/33 (c)(f) | | 13,522,369 | | 13,687,661 |
Class M1, 4.31% 12/25/33 (c)(f) | | 2,200,548 | | 2,236,841 |
Series 2004-1: | | | | |
Class A, 3.82% 4/25/34 (c)(f) | | 6,403,472 | | 6,414,728 |
Class B, 5.36% 4/25/34 (c)(f) | | 665,296 | | 672,910 |
Class M1, 4.02% 4/25/34 (c)(f) | | 582,134 | | 584,681 |
Class M2, 4.66% 4/25/34 (c)(f) | | 498,972 | | 504,819 |
Commercial Mortgage Securities - continued |
| Principal Amount | | Value |
Bayview Commercial Asset Trust floater: - continued | | | | |
Series 2004-2: | | | | |
Class A, 3.89% 8/25/34 (c)(f) | | $ 6,299,807 | | $ 6,330,814 |
Class M1, 4.04% 8/25/34 (c)(f) | | 2,031,330 | | 2,039,265 |
Series 2004-3: | | | | |
Class A1, 3.83% 1/25/35 (c)(f) | | 6,582,479 | | 6,605,519 |
Class A2, 3.88% 1/25/35 (c)(f) | | 914,869 | | 918,092 |
Class M1, 3.96% 1/25/35 (c)(f) | | 1,097,080 | | 1,098,564 |
Class M2, 4.46% 1/25/35 (c)(f) | | 715,487 | | 719,742 |
Series 2005-2A: | | | | |
Class M1, 3.73% 8/25/35 (c)(f) | | 1,297,812 | | 1,297,812 |
Class M2, 3.78% 8/25/35 (c)(f) | | 2,136,399 | | 2,136,399 |
Class M3, 3.8% 8/25/35 (c)(f) | | 1,183,006 | | 1,183,006 |
Class M4, 3.91% 8/25/35 (c)(f) | | 1,088,166 | | 1,088,166 |
Bear Stearns Commercial Mortgage Securities, Inc. floater: | | | | |
Series 2003-BA1A: | | | | |
Class JFCM, 4.98% 4/14/15 (c)(f) | | 1,344,296 | | 1,350,087 |
Class JMM, 4.88% 4/14/15 (c)(f) | | 1,384,053 | | 1,385,065 |
Class KFCM, 5.23% 4/14/15 (c)(f) | | 1,436,661 | | 1,443,179 |
Class KMM, 5.13% 4/14/15 (c)(f) | | 1,253,767 | | 1,254,776 |
Class LFCM, 5.63% 4/14/15 (c)(f) | | 1,601,905 | | 1,602,545 |
Class MFCM, 5.93% 4/14/15 (c)(f) | | 2,218,251 | | 2,219,234 |
Series 2004-BBA3 Class E, 4.0881% 6/15/17 (c)(f) | | 10,415,000 | | 10,415,949 |
Chase Commercial Mortgage Securities Corp. floater Series 2000-FL1A: | | | | |
Class B, 3.81% 12/12/13 (c)(f) | | 896,672 | | 897,536 |
Class C, 4.16% 12/12/13 (c)(f) | | 1,793,345 | | 1,801,374 |
COMM floater: | | | | |
Series 2001-FL5A Class E, 4.8881% 11/15/13 (c)(f) | | 3,049,546 | | 3,048,573 |
Series 2002-FL6: | | | | |
Class F, 4.8381% 6/14/14 (c)(f) | | 11,163,000 | | 11,190,451 |
Class G, 5.2881% 6/14/14 (c)(f) | | 5,000,000 | | 5,000,444 |
Series 2003-FL9 Class B, 3.8881% 11/15/15 (c)(f) | | 10,354,700 | | 10,383,149 |
Commercial Mortgage pass thru certificates floater: | | | | |
Series 2004-CNL: | | | | |
Class A2, 3.6881% 9/15/14 (c)(f) | | 3,570,000 | | 3,573,440 |
Class G, 4.3681% 9/15/14 (c)(f) | | 1,345,000 | | 1,345,538 |
Class H, 4.4681% 9/15/14 (c)(f) | | 1,430,000 | | 1,430,571 |
Class J, 4.9881% 9/15/14 (c)(f) | | 490,000 | | 491,560 |
Class K, 5.3881% 9/15/14 (c)(f) | | 770,000 | | 771,587 |
Class L, 5.5881% 9/15/14 (c)(f) | | 625,000 | | 624,693 |
Commercial Mortgage Securities - continued |
| Principal Amount | | Value |
Commercial Mortgage pass thru certificates floater: - continued | | | | |
Series 2004-HTL1: | | | | |
Class B, 3.8381% 7/15/16 (c)(f) | | $ 495,379 | | $ 495,732 |
Class D, 3.9381% 7/15/16 (c)(f) | | 1,125,628 | | 1,125,788 |
Class E, 4.1381% 7/15/16 (c)(f) | | 805,726 | | 806,031 |
Class F, 4.1881% 7/15/16 (c)(f) | | 852,671 | | 853,207 |
Class H, 4.6881% 7/15/16 (c)(f) | | 2,472,312 | | 2,473,143 |
Class J, 4.8381% 7/15/16 (c)(f) | | 950,314 | | 950,633 |
Class K, 5.7381% 7/15/16 (c)(f) | | 1,069,720 | | 1,069,257 |
Commercial Mortgage Pass-Through Certificates floater Series 2005-F10A: | | | | |
Class B, 3.6181% 4/15/17 (c)(f) | | 7,080,000 | | 7,080,000 |
Class C, 3.6581% 4/15/17 (c)(f) | | 3,006,000 | | 3,006,000 |
Class D, 3.6981% 4/15/17 (c)(f) | | 2,440,000 | | 2,440,000 |
Class E, 3.7581% 4/15/17 (c)(f) | | 1,821,000 | | 1,821,000 |
Class F, 3.7981% 4/15/17 (c)(f) | | 1,035,000 | | 1,035,000 |
Class G, 3.9381% 4/15/17 (c)(f) | | 1,035,000 | | 1,035,000 |
Class H, 4.0081% 4/15/17 (c)(f) | | 1,035,000 | | 1,035,000 |
Class I, 4.2381% 4/15/17 (c)(f) | | 335,000 | | 335,000 |
Class MOA3, 3.6881% 3/15/20 (c)(f) | | 4,590,000 | | 4,590,000 |
CS First Boston Mortgage Securities Corp.: | | | | |
floater: | | | | |
Series 2001-TFLA Class G, 5.1381% 12/15/11 (c)(f) | | 3,720,000 | | 3,702,795 |
Series 2002-TFLA Class C, 3.9688% 11/18/12 (c)(f) | | 3,675,000 | | 3,674,923 |
Series 2003-TF2A Class A2, 3.7081% 11/15/14 (c)(f) | | 9,500,000 | | 9,507,100 |
Series 2004-FL1 Class B, 3.8381% 5/15/14 (c)(f) | | 11,230,000 | | 11,235,571 |
Series 2004-HC1: | | | | |
Class A2, 3.8881% 12/15/21 (c)(f) | | 1,475,000 | | 1,474,997 |
Class B, 4.1381% 12/15/21 (c)(f) | | 3,835,000 | | 3,834,992 |
Series 2004-TF2A Class E, 3.8081% 11/15/19 (c)(f) | | 4,450,000 | | 4,456,884 |
Series 2004-TFL1: | | | | |
Class A2, 3.5781% 2/15/14 (c)(f) | | 7,005,000 | | 7,007,087 |
Class E, 3.9381% 2/15/14 (c)(f) | | 2,800,000 | | 2,806,033 |
Class F, 3.9881% 2/15/14 (c)(f) | | 2,325,000 | | 2,330,394 |
Class G, 4.2381% 2/15/14 (c)(f) | | 1,875,000 | | 1,880,617 |
Class H, 4.4881% 2/15/14 (c)(f) | | 1,400,000 | | 1,403,733 |
Class J, 4.7881% 2/15/14 (c)(f) | | 750,000 | | 753,724 |
Commercial Mortgage Securities - continued |
| Principal Amount | | Value |
CS First Boston Mortgage Securities Corp.: - continued | | | | |
Series 2005-TF2A Class F, 3.8881% 11/15/19 (c)(f) | | $ 1,540,000 | | $ 1,542,381 |
Series 2005-TFLA: | | | | |
Class C, 3.6281% 2/15/20 (c)(f) | | 5,650,000 | | 5,649,989 |
Class E, 3.7181% 2/15/20 (c)(f) | | 3,955,000 | | 3,954,992 |
Class F, 3.7681% 2/15/20 (c)(f) | | 1,745,000 | | 1,744,997 |
Class G, 3.9081% 2/15/20 (c)(f) | | 505,000 | | 504,998 |
Class H, 4.1381% 2/15/20 (c)(f) | | 715,000 | | 714,998 |
sequential pay Series 1997-C2 Class A2, 6.52% 1/17/35 | | 518,675 | | 522,823 |
Series 2003-TFLA Class G, 3.7357% 4/15/13 (c)(f) | | 446,933 | | 445,553 |
GMAC Commercial Mortgage Securities, Inc. floater Series 2001-FL1A Class E, 4.2% 2/11/11 (c)(f) | | 264,524 | | 264,175 |
GS Mortgage Securities Corp. II floater Series 2005-FL7A Class A1, 3.5% 11/6/19 (c)(f) | | 10,526,054 | | 10,527,180 |
ISTAR Asset Receivables Trust floater Series 2002-1A Class A2, 3.8613% 5/28/20 (c)(f) | | 2,727,545 | | 2,728,117 |
John Hancock Tower Mortgage Trust floater Series 2003-C5A Class B, 5.6585% 4/10/15 (c)(f) | | 8,245,000 | | 8,150,339 |
JP Morgan Chase Commercial Mortgage Security Corp.: | | | | |
floater Series 2005-FL1A: | | | | |
Class WH, 3.97% 6/15/19 (c)(f) | | 3,325,000 | | 3,325,100 |
Class WJ, 4.17% 6/15/19 (c)(f) | | 2,045,000 | | 2,045,061 |
Class WK, 4.57% 6/15/19 (c)(f) | | 3,065,000 | | 3,065,092 |
Series 2005-FL1A Class WX1, 1.2068% 6/15/19 (c)(f)(g) | | 240,000,000 | | 2,596,800 |
Lehman Brothers Floating Rate Commercial Mortgage Trust: | | | | |
floater: | | | | |
Series 2003-C4A: | | | | |
Class F, 5.6% 7/11/15 (c)(f) | | 813,387 | | 813,822 |
Class H, 6.35% 7/11/15 (c)(f) | | 8,267,264 | | 8,287,932 |
Series 2003-LLFA: | | | | |
Class A2, 3.77% 12/16/14 (c)(f) | | 11,700,000 | | 11,707,744 |
Class B, 3.98% 12/16/14 (c)(f) | | 4,615,000 | | 4,626,299 |
Class C, 4.08% 12/16/14 (c)(f) | | 4,982,000 | | 4,997,311 |
Series 2005-LLFA Class FAIR, 5.1138% 7/15/19 (c)(d)(f) | | 4,360,000 | | 4,360,000 |
Morgan Stanley Dean Witter Capital I Trust floater Series 2002-XLF Class F, 5.49% 8/5/14 (c)(f) | | 7,603,983 | | 7,603,972 |
Commercial Mortgage Securities - continued |
| Principal Amount | | Value |
Salomon Brothers Mortgage Securities VII, Inc.: | | | | |
floater: | | | | |
Series 2001-CDCA: | | | | |
Class C, 4.1881% 2/15/13 (c)(f) | | $ 10,495,000 | | $ 10,291,568 |
Class D, 4.1881% 2/15/13 (c)(f) | | 4,000,000 | | 3,891,288 |
Series 2003-CDCA: | | | | |
Class HEXB, 5.2881% 2/15/15 (c)(f) | | 770,000 | | 771,001 |
Class JEXB, 5.4881% 2/15/15 (c)(f) | | 1,300,000 | | 1,301,690 |
Class KEXB, 5.8881% 2/15/15 (c)(f) | | 960,000 | | 961,248 |
Series 2000-NL1 Class E, 7.0607% 10/15/30 (c)(f) | | 3,657,956 | | 3,672,236 |
SDG Macerich Properties LP floater Series 2000-1 Class A3, 3.7281% 5/15/09 (c)(f) | | 18,000,000 | | 18,008,086 |
STRIPS III Ltd./STRIPS III Corp. floater Series 2004-1A Class A, 3.78% 3/24/18 (c)(f) | | 7,263,029 | | 7,263,029 |
Wachovia Bank Commercial Mortgage Trust floater: | | | | |
Series 2004-WHL3: | | | | |
Class A2, 3.5681% 3/15/14 (c)(f) | | 3,510,000 | | 3,511,290 |
Class E, 3.8881% 3/15/14 (c)(f) | | 2,190,000 | | 2,192,749 |
Class F, 3.9381% 3/15/14 (c)(f) | | 1,755,000 | | 1,757,120 |
Class G, 4% 3/15/14 (c)(f) | | 875,000 | | 876,363 |
Series 2005-WL5A: | | | | |
Class KHP1, 3.7381% 1/15/18 (c)(f) | | 1,745,000 | | 1,745,000 |
Class KHP2, 3.9381% 1/15/18 (c)(f) | | 1,745,000 | | 1,745,000 |
Class KHP3, 4.2381% 1/15/18 (c)(f) | | 2,060,000 | | 2,060,000 |
Class KHP4, 4.3381% 1/15/18 (c)(f) | | 1,600,000 | | 1,600,000 |
Class KHP5, 4.5381% 1/15/18 (c)(f) | | 1,855,000 | | 1,855,000 |
TOTAL COMMERCIAL MORTGAGE SECURITIES (Cost $378,363,353) | 378,866,012 |
Interfund Loans - 0.1% |
| | | |
With Fidelity Equity-Income Fund, at 3.43442% due 8/1/05 (b) (Cost $8,443,000) | | 8,443,000 | | 8,443,000 |
Cash Equivalents - 40.4% |
| | Maturity
Amount | | Value |
Investments in repurchase agreements (Collateralized by U.S. Government Obligations, in a joint trading account at 3.32%, dated 7/29/05 due 8/1/05) (i) | | $ 2,354,814,398 | | $ 2,354,164,000 |
With Goldman Sachs & Co. at 3.41%, dated 7/1/05 due 8/23/05 (Collateralized by Mortgage Loan Obligations valued at $295,800,001, 0.9%- 10.36%, 4/18/17 - 6/25/44) (f)(h) | | 291,455,881 | | 289,998,492 |
TOTAL CASH EQUIVALENTS (Cost $2,644,164,000) | | 2,644,162,492 |
TOTAL INVESTMENT PORTFOLIO - 102.2% (Cost $6,679,436,405) | | | 6,685,115,608 |
NET OTHER ASSETS - (2.2)% | | | (140,968,200) |
NET ASSETS - 100% | | $ 6,544,147,408 |
Futures Contracts |
| Expiration Date | | Underlying Face Amount at Value | | Unrealized Appreciation/
(Depreciation) |
Sold |
Eurodollar Contracts |
73 Eurodollar 90 Day Index Contracts | Dec. 2005 | | $ 72,221,638 | | $ 34,806 |
49 Eurodollar 90 Day Index Contracts | March 2006 | | 48,464,675 | | 28,036 |
32 Eurodollar 90 Day Index Contracts | June 2006 | | 31,645,600 | | 16,247 |
27 Eurodollar 90 Day Index Contracts | Sept. 2006 | | 26,698,612 | | 16,355 |
26 Eurodollar 90 Day Index Contracts | Dec. 2006 | | 25,707,500 | | 14,421 |
24 Eurodollar 90 Day Index Contracts | March 2007 | | 23,729,700 | | 12,329 |
17 Eurodollar 90 Day Index Contracts | June 2007 | | 16,807,688 | | 5,970 |
16 Eurodollar 90 Day Index Contracts | Sept. 2007 | | 15,818,200 | | 5,711 |
15 Eurodollar 90 Day Index Contracts | Dec. 2007 | | 14,828,250 | | 5,590 |
15 Eurodollar 90 Day Index Contracts | March 2008 | | 14,827,875 | | 5,015 |
8 Eurodollar 90 Day Index Contracts | June 2008 | | 7,907,800 | | 7,518 |
7 Eurodollar 90 Day Index Contracts | Sept. 2008 | | 6,918,888 | | 6,885 |
TOTAL EURODOLLAR CONTRACTS | | 158,883 |
Swap Agreements |
| | | Notional Amount | | Value |
Credit Default Swap |
Receive from Citibank, upon default event of DaimlerChrysler NA Holding Corp., par value of the notional amount of DaimlerChrysler NA Holding Corp. 6.5% 11/15/13, and pay quarterly notional amount multiplied by .8% | June 2007 | | $ 14,000,000 | | $ (135,972) |
Receive quarterly notional amount multiplied by 1.12% and pay Morgan Stanley, Inc. upon default of Comcast Cable Communications, Inc., par value of the notional amount of Comcast Cable Communications, Inc. 6.75% 1/30/11 | June 2006 | | 10,000,000 | | 102,057 |
TOTAL CREDIT DEFAULT SWAP | 24,000,000 | | (33,915) |
Swap Agreements - continued |
| Expiration Date | | Notional Amount | | Value |
Total Return Swap |
Receive monthly notional amount multiplied by the nominal spread appreciation of the Lehman Brothers CMBS U.S. Aggregate Index adjusted by a modified duration factor plus 10 basis points and pay monthly notional amount multiplied by the nominal spread depreciation of the Lehman Brothers CMBS U.S. Aggregate Index adjusted by a modified duration factor with Lehman Brothers, Inc. | Oct. 2005 | | $ 48,200,000 | | $ 46,335 |
Receive monthly notional amount multiplied by the nominal spread appreciation of the Lehman Brothers CMBS U.S. Aggregate Index adjusted by a modified duration factor plus 25 basis points and pay monthly notional amount multiplied by the nominal spread depreciation of the Lehman Brothers CMBS U.S. Aggregate Index adjusted by a modified duration factor with Lehman Brothers, Inc. | Dec. 2005 | | 30,000,000 | | 32,511 |
Receive monthly notional amount multiplied by the nominal spread appreciation of the Lehman Brothers CMBS U.S. Aggregate Index adjusted by a modified duration factor plus 30 basis points and pay monthly notional amount multiplied by the nominal spread depreciation of the Lehman Brothers CMBS U.S. Aggregate Index adjusted by a modified duration factor with Lehman Brothers, Inc. | August 2005 | | 35,100,000 | | 33,945 |
Swap Agreements - continued |
| Expiration Date | | Notional Amount | | Value |
Receive monthly notional amount multiplied by the nominal spread appreciation of the Lehman Brothers CMBS U.S. Aggregate Index adjusted by a modified duration factor plus 22 basis points and pay monthly notional amount multiplied by the nominal spread depreciation of the Lehman Brothers CMBS U.S. Aggregate Index adjusted by a modified duration factor with Lehman Brothers, Inc. | Jan. 2006 | | $ 35,100,000 | | $ 32,229 |
Receive monthly a return equal to Lehman Brothers ABS Floating Rate Index and pay monthly a floating rate based on the 1- month LIBOR minus 11.1 basis points with Lehman Brothers, Inc. | Nov. 2005 | | 30,000,000 | | 0 |
TOTAL TOTAL RETURN SWAP | 178,400,000 | | 145,020 |
| | $ 202,400,000 | | $ 111,105 |
Legend |
(a) Debt obligation initially issued at one coupon which converts to a higher coupon at a specified date. The rate shown is the rate at period end. |
(b) Affiliated entity |
(c) Security exempt from registration under Rule 144A of the Securities Act of 1933. These securities may be resold in transactions exempt from registration, normally to qualified institutional buyers. At the period end, the value of these securities amounted to $586,119,417 or 9.0% of net assets. |
(d) Security or a portion of the security purchased on a delayed delivery or when-issued basis. |
(e) Security or a portion of the security was pledged to cover margin requirements for futures contracts. At the period end, the value of securities pledged amounted to $994,635. |
(f) The coupon rate shown on floating or adjustable rate securities represents the rate at period end. |
(g) Security represents right to receive monthly interest payments on an underlying pool of mortgages. Principal shown is the par amount of the mortgage pool. |
(h) The maturity amount is based on the rate at period end. |
(i) Additional information on each counterparty to the repurchase agreement is as follows: |
Repurchase Agreement/
Counterparty | Value |
$2,354,164,000 due 8/1/05 at 3.32% | |
Banc of America Securities LLC. | $ 471,596,247 |
Bank of America, National Association | 244,985,063 |
Barclays Capital Inc. | 979,940,254 |
Countrywide Securities Corporation | 244,985,063 |
Morgan Stanley & Co. Incorporated. | 351,411,107 |
UBS Securities LLC | 61,246,266 |
| $ 2,354,164,000 |
Income Tax Information |
At July 31, 2005, the aggregate cost of investment securities for income tax purposes was $6,679,021,266. Net unrealized appreciation aggregated $6,094,342, of which $11,067,257 related to appreciated investment securities and $4,972,915 related to depreciated investment securities. |
Annual Report
Annual Report
Annual Report
Annual Report
Investment Adviser
Fidelity Management & Research Company
Boston, MA
Investment Sub-Advisers
FMR Co. Inc.
Fidelity Management & Research
(U.K.) Inc.
Fidelity Management & Research
(Far East) Inc.
Fidelity Investments
Money Management, Inc.
Fidelity Investments Japan Limited
Fidelity International Investment Advisors
Fidelity International Investment Advisors
(U.K.) Limited
General Distributor
Fidelity Distributors Corporation
Boston, MA
Transfer and Service Agents
Fidelity Investments Institutional Operations Company, Inc.
Boston, MA
Fidelity Service Company, Inc.
Boston, MA
Custodian
Citibank, N.A.
New York, NY
ATB-UANN-0905
1.804574.101
(Fidelity Investment logo)(registered trademark)
Corporate Headquarters
82 Devonshire St., Boston, MA 02109
www.fidelity.com
(Fidelity Investment logo)(registered trademark)
Fidelity Advisor
Total Bond
Fund - Institutional Class
Annual Report
July 31, 2005
Institutional Class is a class of Fidelity Total Bond Fund
(2_fidelity_logos) (Registered_Trademark)
Contents
Chairman's Message | <Click Here> | Ned Johnson's message to shareholders. |
Performance | <Click Here> | How the fund has done over time. |
Management's Discussion | <Click Here> | The manager's review of fund performance, strategy and outlook. |
Shareholder Expense Example | <Click Here> | An example of shareholder expenses. |
Investment Changes | <Click Here> | A summary of major shifts in the fund's investments over the past six months. |
Investments | <Click Here> | A complete list of the fund's investments with their market values. |
Financial Statements | <Click Here> | Statements of assets and liabilities, operations, and changes in net assets,
as well as financial highlights. |
Notes | <Click Here> | Notes to the financial statements. |
Report of Independent Registered Public Accounting Firm | <Click Here> | |
Trustees and Officers | <Click Here> | |
Distributions | <Click Here> | |
Board Approval of Investment Advisory Contracts and Management Fees | <Click Here> | |
Central Fund Investments | <Click Here> | Complete list of investments for Fidelity's fixed-income central funds. |
To view a fund's proxy voting guidelines and proxy voting record for the 12-month period ended June 30, visit www.fidelity.com/proxyvotingresults or visit the Securities and Exchange Commission's (SEC) web site at www.sec.gov. You may also call 1-877-208-0098 to request a free copy of the proxy voting guidelines.
Standard & Poor's, S&P and S&P 500 are registered service marks of The McGraw-Hill Companies, Inc. and have been licensed for use by Fidelity Distributors Corporation.
Other third party marks appearing herein are the property of their respective owners.
All other marks appearing herein are registered or unregistered trademarks or service marks of FMR Corp. or an affiliated company.
Annual Report
This report and the financial statements contained herein are submitted for the general information of the shareholders of the fund. This report is not authorized for distribution to prospective investors in the fund unless preceded or accompanied by an effective prospectus.
A fund files its complete schedule of portfolio holdings with the SEC for the first and third quarters of each fiscal year on Form N-Q. Forms N-Q are available on the SEC's web site at http://www.sec.gov. A fund's Forms N-Q may be reviewed and copied at the SEC's Public Reference Room in Washington, DC. Information regarding the operation of the SEC's Public Reference Room may be obtained by calling 1-800-SEC-0330. For a complete list of a fund's portfolio holdings, view the most recent quarterly holdings report, semiannual report, or annual report on Fidelity's web site at http://www.advisor.fidelity.com.
NOT FDIC INSURED · MAY LOSE VALUE · NO BANK GUARANTEE
Neither the fund nor Fidelity Distributors Corporation is a bank.
Annual Report
Chairman's Message
(photo_of_Edward_C_Johnson_3d)
Dear Shareholder:
During the past year or so, much has been reported about the mutual fund industry, and much of it has been more critical than I believe is warranted. Allegations that some companies have been less than forthright with their shareholders have cast a shadow on the entire industry. I continue to find these reports disturbing, and assert that they do not create an accurate picture of the industry overall. Therefore, I would like to remind everyone where Fidelity stands on these issues. I will say two things specifically regarding allegations that some mutual fund companies were in violation of the Securities and Exchange Commission's forward pricing rules or were involved in so-called "market timing" activities.
First, Fidelity has no agreements that permit customers who buy fund shares after 4 p.m. to obtain the 4 p.m. price. This is not a new policy. This is not to say that someone could not deceive the company through fraudulent acts. However, we are extremely diligent in preventing fraud from occurring in this manner - and in every other. But I underscore again that Fidelity has no so-called "agreements" that sanction illegal practices.
Second, Fidelity continues to stand on record, as we have for years, in opposition to predatory short-term trading that adversely affects shareholders in a mutual fund. Back in the 1980s, we initiated a fee - which is returned to the fund and, therefore, to investors - to discourage this activity. Further, we took the lead several years ago in developing a Fair Value Pricing Policy to prevent market timing on foreign securities in our funds. I am confident we will find other ways to make it more difficult for predatory traders to operate. However, this will only be achieved through close cooperation among regulators, legislators and the industry.
Yes, there have been unfortunate instances of unethical and illegal activity within the mutual fund industry from time to time. That is true of any industry. When this occurs, confessed or convicted offenders should be dealt with appropriately. But we are still concerned about the risk of over-regulation and the quick application of simplistic solutions to intricate problems. Every system can be improved, and we support and applaud well thought out improvements by regulators, legislators and industry representatives that achieve the common goal of building and protecting the value of investors' holdings.
For nearly 60 years, Fidelity has worked very hard to improve its products and service to justify your trust. When our family founded this company in 1946, we had only a few hundred customers. Today, we serve more than 18 million customers including individual investors and participants in retirement plans across America.
Let me close by saying that we do not take your trust in us for granted, and we realize that we must always work to improve all aspects of our service to you. In turn, we urge you to continue your active participation with your financial matters, so that your interests can be well served.
Best regards,
/s/Edward C. Johnson 3d
Edward C. Johnson 3d
Annual Report
Performance: The Bottom Line
Average annual total return reflects the change in the value of an investment, assuming reinvestment of the class' dividend income and capital gains (the profits earned upon the sale of securities that have grown in value) and assuming a constant rate of performance each year. The $10,000 table and the fund's returns do not reflect the deduction of taxes that a shareholder would pay on fund distributions or the redemption of fund shares. During periods of reimbursement by Fidelity, a fund's total return will be greater than it would be had the reimbursement not occurred. How a fund did yesterday is no guarantee of how it will do tomorrow.
Average Annual Total Returns
Periods ended July 31, 2005 | | Past 1
year | Life of
fundA |
Institutional Class B | | 5.74% | 5.89% |
A From October 15, 2002.
B The initial offering of Institutional Class shares took place on June 16, 2004. Returns prior to June 16, 2004 are those of Total Bond, the original retail class of the fund, which does not bear a 12b-1 fee.
$10,000 Over Life of Fund
Let's say hypothetically that $10,000 was invested in Fidelity Advisor Total Bond Fund - Institutional Class on October 15, 2002, when the fund started. The chart shows how the value of your investment would have changed, and also shows how the Lehman Brothers® U.S. Universal Index performed over the same period.
Annual Report
Management's Discussion of Fund Performance
Comments from Ford O'Neil, Portfolio Manager of Fidelity Advisor Total Bond Fund
Not unlike the domestic equity markets, taxable bonds swung up and down during the 12 months ending July 31, 2005, rallying early in the period, selling off in late winter, only to advance again in the spring. During the one-year period, the Lehman Brothers® Aggregate Bond Index - a measure of the overall investment-grade bond universe - - rose 4.79%. Much of this gain came on the strength of returns from higher-yielding spread sectors, such as investment-grade corporates, reflected in the 5.76% return of the Lehman Brothers Credit Bond Index over the 12-month period. Mortgage-backed securities were spurred on by the relative stability of long-term interest rates, and the Lehman Brothers Mortgage-Backed Securities gained 4.67%. Treasuries also bolstered the overall market, as illustrated by the 4.62% return of the Lehman Brothers U.S. Treasury Index, which moved ahead on a flight to quality as investors continued to ponder the future direction of the U.S. economy. The Lehman Brothers U.S. Agency Index returned a more modest 3.88%.
During the past year, the fund's Institutional Class shares returned 5.74%, while the Lehman Brothers U.S. Universal Index and the LipperSM Intermediate Investment Grade Debt Funds Average rose 5.53% and 4.36%, respectively. Benefiting the fund's performance was our sector selection. In particular, the decision to overweight high-yield corporate bonds and emerging-markets debt worked out well relative to the index, as these segments were boosted by a combination of strong demand for higher-yielding securities and improving creditworthiness. Security selection in both sectors also generally was advantageous. Within the investment-grade portion of the portfolio - which accounted for the majority of the fund's net assets and was the main driver of its absolute and relative returns - our yield-curve positioning helped as the curve flattened. Security selection among investment-grade bonds also added value, with the fund's corporate bond holdings leading the way. However, positions in auto-related companies disappointed. Elsewhere, the decision to invest in high-quality securitized products - namely mortgage securities and asset-backed securities - worked in our favor, as did security selection within those segments. An allocation to Treasury Inflation-Protected Securities (TIPS) also contributed, as they posted strong gains throughout most of the year, although an underweighting in nominal Treasuries detracted from results.
The views expressed in this statement reflect those of the portfolio manager only through the end of the period of the report as stated on the cover and do not necessarily represent the views of Fidelity or any other person in the Fidelity organization. Any such views are subject to change at any time based upon market or other conditions and Fidelity disclaims any responsibility to update such views. These views may not be relied on as investment advice and, because investment decisions for a Fidelity fund are based on numerous factors, may not be relied on as an indication of trading intent on behalf of any Fidelity fund.
Annual Report
Shareholder Expense Example
As a shareholder of the Fund, you incur two types of costs: (1) transaction costs, including sales charges (loads) on purchase payments or redemption proceeds, and (2) ongoing costs, including management fees, distribution and/or service (12b-1) fees and other Fund expenses. This Example is intended to help you understand your ongoing costs (in dollars) of investing in the Fund and to compare these costs with the ongoing costs of investing in other mutual funds.
The Example is based on an investment of $1,000 invested at the beginning of the period and held for the entire period (February 1, 2005 to July 31, 2005).
Actual Expenses
The first line of the table below for each class of the Fund provides information about actual account values and actual expenses. You may use the information in this line, together with the amount you invested, to estimate the expenses that you paid over the period. Simply divide your account value by $1,000.00 (for example, an $8,600 account value divided by $1,000.00 = 8.6), then multiply the result by the number in the first line for a class of the Fund under the heading entitled "Expenses Paid During Period" to estimate the expenses you paid on your account during this period.
Hypothetical Example for Comparison Purposes
The second line of the table below for each class of the Fund provides information about hypothetical account values and hypothetical expenses based on a Class' actual expense ratio and an assumed rate of return of 5% per year before expenses, which is not the Class' actual return. The hypothetical account values and expenses may not be used to estimate the actual ending account balance or expenses you paid for the period. You may use this information to compare the ongoing costs of investing in the Fund and other funds. To do so, compare this 5% hypothetical example with the 5% hypothetical examples that appear in the shareholder reports of the other funds.
Please note that the expenses shown in the table are meant to highlight your ongoing costs only and do not reflect any transaction costs. Therefore, the second line of the table is useful in comparing ongoing costs only, and will not help you determine the relative total costs of owning different funds. In addition, if these transactional costs were included, your costs would have been higher.
| Beginning
Account Value
February 1, 2005 | Ending
Account Value
July 31, 2005 | Expenses Paid
During Period*
February 1, 2005
to July 31, 2005 |
Class A | | | |
Actual | $ 1,000.00 | $ 1,010.10 | $ 3.99** |
HypotheticalA | $ 1,000.00 | $ 1,020.83 | $ 4.01** |
Class T | | | |
Actual | $ 1,000.00 | $ 1,009.60 | $ 4.48** |
HypotheticalA | $ 1,000.00 | $ 1,020.33 | $ 4.51** |
Class B | | | |
Actual | $ 1,000.00 | $ 1,006.30 | $ 7.71** |
HypotheticalA | $ 1,000.00 | $ 1,017.11 | $ 7.75** |
| Beginning
Account Value
February 1, 2005 | Ending
Account Value
July 31, 2005 | Expenses Paid
During Period*
February 1, 2005
to July 31, 2005 |
Class C | | | |
Actual | $ 1,000.00 | $ 1,006.70 | $ 8.21** |
HypotheticalA | $ 1,000.00 | $ 1,016.61 | $ 8.25** |
Total Bond | | | |
Actual | $ 1,000.00 | $ 1,011.40 | $ 2.89** |
HypotheticalA | $ 1,000.00 | $ 1,021.92 | $ 2.91** |
Institutional Class | | | |
Actual | $ 1,000.00 | $ 1,012.20 | $ 2.99** |
HypotheticalA | $ 1,000.00 | $ 1,021.82 | $ 3.01** |
A 5% return per year before expenses
* Expenses are equal to each Class' annualized expense ratio (shown in the table below); multiplied by the average account value over the period, multiplied by 181/365 (to reflect the one-half year period).
| Annualized
Expense Ratio |
Class A | .80%** |
Class T | .90%** |
Class B | 1.55%** |
Class C | 1.65%** |
Total Bond | .58%** |
Institutional Class | .60%** |
** If contractual expense reductions, effective June 1, 2005, had been in effect during the period, the annualized expense ratio and the expenses paid in the actual and hypothetical examples above would have been as follows:
| Annualized
Expense Ratio | Expenses Paid |
Class A | .74% | |
Actual | | $ 3.69 |
HypotheticalA | | $ 3.71 |
Class T | .82% | |
Actual | | $ 4.09 |
HypotheticalA | | $ 4.11 |
Class B | 1.47% | |
Actual | | $ 7.31 |
HypotheticalA | | $ 7.35 |
Class C | 1.61% | |
Actual | | $ 8.01 |
HypotheticalA | | $ 8.05 |
Total Bond | .45% | |
Actual | | $ 2.24 |
HypotheticalA | | $ 2.26 |
Institutional Class | .49% | |
Actual | | $ 2.45 |
HypotheticalA | | $ 2.46 |
A 5% return per year before expenses
Annual Report
Investment Changes
Quality Diversification (% of fund's net assets) |
As of July 31, 2005 | As of January 31, 2005 |
| U.S. Government
and U.S. Government Agency Obligations 56.7% | | | U.S. Government
and U.S.Government Agency Obligations 54.8% | |
| AAA 7.7% | | | AAA 5.2% | |
| AA 3.2% | | | AA 3.6% | |
| A 6.2% | | | A 7.4% | |
| BBB 13.4% | | | BBB 12.9% | |
| BB and Below 9.0% | | | BB and Below 9.0% | |
| Not Rated 0.8% | | | Not Rated 1.4% | |
| Equities 0.0% | | | Equities 0.0% | |
| Short-Term Investments
and Net Other Assets 3.0% | | | Short-Term Investments
and Net Other Assets 5.7% | |

We have used ratings from Moody's® Investors Services, Inc. Where Moody's ratings are not available, we have used S&P ® ratings. Securities rated BB or below were rated investment grade at the time of acquisition. The information in the above table is based on the combined investments of the fund and its pro-rata share of the investments of Fidelity's fixed-income central fund. |
Average Years to Maturity as of July 31, 2005 |
| | 6 months ago |
Years | 6.2 | 5.4 |
Average years to maturity is based on the average time remaining until principal payments are expected from each of the fund's bonds, weighted by dollar amount. |
Duration as of July 31, 2005 |
| | 6 months ago |
Years | 4.0 | 4.0 |
Duration shows how much a bond fund's price fluctuates with changes in comparable interest rates. If rates rise 1%, for example, a fund with a five-year duration is likely to lose about 5% of its value. Other factors also can influence a bond fund's performance and share price. Accordingly, a bond fund's actual performance may differ from this example. |
Asset Allocation (% of fund's net assets) |
As of July 31, 2005 * | As of January 31, 2005 ** |
| Corporate Bonds 22.3% | | | Corporate Bonds 23.3% | |
| U.S. Government
and U.S. Government Agency Obligations 56.7% | | | U.S. Government
and U.S. Government Agency Obligations 54.8% | |
| Asset-Backed
Securities 7.6% | | | Asset-Backed
Securities 6.2% | |
| CMOs and Other Mortgage Related Securities 7.9% | | | CMOs and Other Mortgage Related Securities 7.1% | |
| Other Investments 2.5% | | | Other Investments 2.9% | |
| Short-Term
Investments and
Net Other Assets 3.0% | | | Short-Term
Investments and
Net Other Assets 5.7% | |
* Foreign investments | 6.7% | | ** Foreign investments | 7.6% | |

* Futures and Swaps | 6.8% | | ** Futures and Swaps | 4.9% | |
The information in the above tables is based on the combined investments of the fund and its pro-rata share of the investments of Fidelity's fixed-income central fund. |
Annual Report
Investments July 31, 2005
Showing Percentage of Net Assets
Nonconvertible Bonds - 21.8% |
| Principal Amount | | Value (Note 1) |
CONSUMER DISCRETIONARY - 4.2% |
Auto Components - 0.1% |
Affinia Group, Inc. 9% 11/30/14 (e) | | $ 30,000 | | $ 24,000 |
Delco Remy International, Inc. 11% 5/1/09 | | 50,000 | | 44,000 |
Tenneco Automotive, Inc. 8.625% 11/15/14 | | 105,000 | | 108,938 |
TRW Automotive Acquisition Corp. 9.375% 2/15/13 | | 87,000 | | 97,440 |
Visteon Corp. 7% 3/10/14 | | 190,000 | | 164,350 |
| | 438,728 |
Automobiles - 0.5% |
Ford Motor Co.: | | | | |
6.625% 10/1/28 | | 125,000 | | 97,581 |
7.45% 7/16/31 | | 915,000 | | 775,789 |
General Motors Corp.: | | | | |
8.25% 7/15/23 | | 135,000 | | 120,825 |
8.375% 7/15/33 | | 1,510,000 | | 1,362,775 |
| | 2,356,970 |
Diversified Consumer Services - 0.1% |
Carriage Services, Inc. 7.875% 1/15/15 (e) | | 200,000 | | 208,500 |
Service Corp. International (SCI): | | | | |
6.5% 3/15/08 | | 75,000 | | 76,875 |
6.75% 4/1/16 | | 55,000 | | 56,169 |
| | 341,544 |
Hotels, Restaurants & Leisure - 1.0% |
Argosy Gaming Co. 7% 1/15/14 | | 80,000 | | 88,400 |
Bally Total Fitness Holding Corp.: | | | | |
9.875% 10/15/07 | | 15,000 | | 13,275 |
10.5% 7/15/11 | | 120,000 | | 121,800 |
Carrols Corp. 9% 1/15/13 (e) | | 105,000 | | 108,938 |
Domino's, Inc. 8.25% 7/1/11 | | 55,000 | | 58,850 |
Friendly Ice Cream Corp. 8.375% 6/15/12 | | 70,000 | | 68,600 |
Gaylord Entertainment Co.: | | | | |
6.75% 11/15/14 | | 50,000 | | 49,625 |
8% 11/15/13 | | 225,000 | | 239,918 |
Herbst Gaming, Inc.: | | | | |
7% 11/15/14 | | 50,000 | | 50,875 |
8.125% 6/1/12 | | 70,000 | | 74,550 |
HMH Properties, Inc. 7.875% 8/1/08 | | 45,000 | | 45,563 |
Host Marriott LP 7.125% 11/1/13 | | 35,000 | | 36,621 |
Landry's Seafood Restaurants, Inc. 7.5% 12/15/14 | | 390,000 | | 385,613 |
MGM MIRAGE: | | | | |
6% 10/1/09 | | 50,000 | | 50,125 |
Nonconvertible Bonds - continued |
| Principal Amount | | Value (Note 1) |
CONSUMER DISCRETIONARY - continued |
Hotels, Restaurants & Leisure - continued |
MGM MIRAGE: - continued | | | | |
8.375% 2/1/11 | | $ 40,000 | | $ 43,752 |
Mohegan Tribal Gaming Authority 7.125% 8/15/14 | | 40,000 | | 42,000 |
Morton's Restaurant Group, Inc. 7.5% 7/1/10 | | 65,000 | | 64,675 |
MTR Gaming Group, Inc. 9.75% 4/1/10 | | 135,000 | | 146,813 |
Park Place Entertainment Corp. 7.875% 12/15/05 | | 50,000 | | 50,625 |
Penn National Gaming, Inc.: | | | | |
6.875% 12/1/11 | | 80,000 | | 82,000 |
8.875% 3/15/10 | | 100,000 | | 106,375 |
Pinnacle Entertainment, Inc. 8.25% 3/15/12 | | 140,000 | | 147,700 |
Resorts International Hotel & Casino, Inc. 11.5% 3/15/09 | | 225,000 | | 255,375 |
Scientific Games Corp. 6.25% 12/15/12 (e) | | 30,000 | | 30,450 |
Seneca Gaming Corp.: | | | | |
7.25% 5/1/12 (Reg. S) (e) | | 70,000 | | 72,625 |
7.25% 5/1/12 | | 50,000 | | 51,875 |
Six Flags, Inc. 9.625% 6/1/14 | | 180,000 | | 174,600 |
Speedway Motorsports, Inc. 6.75% 6/1/13 | | 100,000 | | 103,625 |
Station Casinos, Inc.: | | | | |
6% 4/1/12 | | 70,000 | | 71,225 |
6.5% 2/1/14 | | 40,000 | | 41,052 |
6.875% 3/1/16 | | 100,000 | | 103,000 |
Sun International Hotels Ltd./Sun International North America, Inc. 8.875% 8/15/11 | | 325,000 | | 347,344 |
Town Sports International, Inc. 9.625% 4/15/11 | | 165,000 | | 174,900 |
Universal City Development Partners Ltd./UCDP Finance, Inc. 11.75% 4/1/10 | | 95,000 | | 109,136 |
Uno Restaurant Corp. 10% 2/15/11 (e) | | 80,000 | | 77,200 |
Vail Resorts, Inc. 6.75% 2/15/14 | | 60,000 | | 61,350 |
Virgin River Casino Corp./RBG LLC/B&BB, Inc.: | | | | |
0% 1/15/13 (c)(e) | | 40,000 | | 28,400 |
9% 1/15/12 (e) | | 30,000 | | 31,500 |
Waterford Gaming LLC/Waterford Gaming Finance Corp. 8.625% 9/15/12 (e) | | 46,000 | | 49,680 |
Wheeling Island Gaming, Inc. 10.125% 12/15/09 | | 160,000 | | 169,600 |
Wynn Las Vegas LLC/Wynn Las Vegas Capital Corp. 6.625% 12/1/14 | | 160,000 | | 156,000 |
| | 4,185,630 |
Household Durables - 0.2% |
Champion Enterprises, Inc. 7.625% 5/15/09 | | 70,000 | | 70,700 |
Nonconvertible Bonds - continued |
| Principal Amount | | Value (Note 1) |
CONSUMER DISCRETIONARY - continued |
Household Durables - continued |
Goodman Global Holdings, Inc. 7.875% 12/15/12 (e) | | $ 80,000 | | $ 76,000 |
K. Hovnanian Enterprises, Inc.: | | | | |
6.25% 1/15/15 | | 50,000 | | 49,890 |
6.5% 1/15/14 | | 100,000 | | 101,750 |
8.875% 4/1/12 | | 10,000 | | 10,800 |
Sealy Mattress Co. 8.25% 6/15/14 | | 50,000 | | 53,250 |
Technical Olympic USA, Inc.: | | | | |
7.5% 3/15/11 | | 110,000 | | 103,950 |
7.5% 1/15/15 | | 175,000 | | 161,000 |
WCI Communities, Inc. 9.125% 5/1/12 | | 35,000 | | 36,925 |
William Lyon Homes, Inc. 10.75% 4/1/13 | | 110,000 | | 121,000 |
| | 785,265 |
Media - 2.1% |
AMC Entertainment, Inc. 8.625% 8/15/12 | | 60,000 | | 62,400 |
AOL Time Warner, Inc. 7.625% 4/15/31 | | 500,000 | | 616,090 |
British Sky Broadcasting Group PLC (BSkyB) yankee 8.2% 7/15/09 | | 1,000,000 | | 1,114,287 |
Cablevision Systems Corp.: | | | | |
7.88% 4/1/09 (i) | | 40,000 | | 41,200 |
8% 4/15/12 | | 230,000 | | 230,575 |
CanWest Media, Inc. 8% 9/15/12 | | 30,000 | | 32,025 |
Charter Communications Holding II LLC/Charter Communications Holdings II Capital Corp. 10.25% 9/15/10 | | 115,000 | | 118,738 |
Charter Communications Operating LLC/Charter Communications Operating Capital Corp. 8.375% 4/30/14 (e) | | 70,000 | | 70,613 |
Cinemark, Inc. 0% 3/15/14 (c) | | 100,000 | | 68,750 |
Comcast Corp. 5.85% 1/15/10 | | 500,000 | | 520,067 |
Cox Communications, Inc.: | | | | |
4.625% 6/1/13 | | 90,000 | | 86,026 |
7.125% 10/1/12 | | 970,000 | | 1,071,758 |
CSC Holdings, Inc.: | | | | |
6.75% 4/15/12 (e) | | 160,000 | | 154,800 |
7.875% 2/15/18 | | 50,000 | | 49,813 |
8.125% 7/15/09 | | 65,000 | | 66,950 |
Dex Media, Inc.: | | | | |
0% 11/15/13 (c) | | 95,000 | | 77,663 |
0% 11/15/13 (c) | | 5,000 | | 4,088 |
8% 11/15/13 | | 10,000 | | 10,700 |
Nonconvertible Bonds - continued |
| Principal Amount | | Value (Note 1) |
CONSUMER DISCRETIONARY - continued |
Media - continued |
EchoStar DBS Corp.: | | | | |
6.375% 10/1/11 | | $ 150,000 | | $ 149,250 |
9.125% 1/15/09 | | 72,000 | | 76,680 |
Entercom Radio LLC/Entercom Capital, Inc. 7.625% 3/1/14 | | 50,000 | | 52,250 |
Granite Broadcasting Corp. 9.75% 12/1/10 | | 40,000 | | 37,100 |
Houghton Mifflin Co.: | | | | |
8.25% 2/1/11 | | 100,000 | | 105,000 |
9.875% 2/1/13 | | 145,000 | | 158,050 |
iesy Repository Gmbh 10.375% 2/15/15 (e) | | 80,000 | | 80,800 |
Innova S. de R.L. 9.375% 9/19/13 | | 85,000 | | 95,519 |
Insight Midwest LP/Insight Capital, Inc. 9.75% 10/1/09 | | 100,000 | | 103,625 |
Liberty Media Corp.: | | | | |
5.7% 5/15/13 | | 500,000 | | 462,739 |
8.25% 2/1/30 | | 740,000 | | 746,690 |
8.5% 7/15/29 | | 130,000 | | 132,621 |
LodgeNet Entertainment Corp. 9.5% 6/15/13 | | 190,000 | | 207,100 |
MediaNews Group, Inc. 6.375% 4/1/14 | | 100,000 | | 96,250 |
News America Holdings, Inc. 7.75% 12/1/45 | | 170,000 | | 205,897 |
News America, Inc. 6.2% 12/15/34 | | 330,000 | | 342,944 |
Nexstar Broadcasting, Inc.: | | | | |
7% 1/15/14 | | 130,000 | | 120,900 |
7% 1/15/14 (e) | | 70,000 | | 65,100 |
PanAmSat Corp. 9% 8/15/14 | | 84,000 | | 92,610 |
PRIMEDIA, Inc.: | | | | |
7.625% 4/1/08 | | 84,000 | | 84,840 |
8.875% 5/15/11 | | 25,000 | | 26,250 |
Rainbow National LLC & RNS Co. Corp.: | | | | |
8.75% 9/1/12 (e) | | 30,000 | | 33,000 |
10.375% 9/1/14 (e) | | 30,000 | | 34,575 |
Rogers Cable, Inc. 6.75% 3/15/15 | | 50,000 | | 51,625 |
The Reader's Digest Association, Inc. 6.5% 3/1/11 | | 70,000 | | 71,750 |
Time Warner Entertainment Co. LP 8.375% 7/15/33 | | 1,000,000 | | 1,310,939 |
| | 9,340,647 |
Specialty Retail - 0.1% |
Asbury Automotive Group, Inc.: | | | | |
8% 3/15/14 | | 60,000 | | 59,550 |
9% 6/15/12 | | 15,000 | | 15,563 |
General Nutrition Centers, Inc. 8.625% 1/15/11 | | 80,000 | | 76,100 |
Nebraska Book Co., Inc. 8.625% 3/15/12 | | 90,000 | | 85,725 |
Nonconvertible Bonds - continued |
| Principal Amount | | Value (Note 1) |
CONSUMER DISCRETIONARY - continued |
Specialty Retail - continued |
Sonic Automotive, Inc. 8.625% 8/15/13 | | $ 165,000 | | $ 169,950 |
The Pep Boys - Manny, Moe & Jack 7.5% 12/15/14 | | 55,000 | | 50,050 |
United Auto Group, Inc. 9.625% 3/15/12 | | 50,000 | | 54,000 |
| | 510,938 |
Textiles, Apparel & Luxury Goods - 0.1% |
Jostens IH Corp. 7.625% 10/1/12 | | 40,000 | | 40,700 |
Levi Strauss & Co.: | | | | |
8.2544% 4/1/12 (i) | | 70,000 | | 70,000 |
9.75% 1/15/15 | | 180,000 | | 189,000 |
12.25% 12/15/12 | | 65,000 | | 73,288 |
| | 372,988 |
TOTAL CONSUMER DISCRETIONARY | | 18,332,710 |
CONSUMER STAPLES - 0.8% |
Beverages - 0.1% |
FBG Finance Ltd. 5.125% 6/15/15 (e) | | 425,000 | | 417,587 |
Food & Staples Retailing - 0.1% |
Ahold Finance USA, Inc.: | | | | |
6.25% 5/1/09 | | 40,000 | | 40,800 |
6.875% 5/1/29 | | 170,000 | | 161,500 |
8.25% 7/15/10 | | 40,000 | | 43,800 |
Jean Coutu Group, Inc.: | | | | |
7.625% 8/1/12 | | 30,000 | | 31,200 |
8.5% 8/1/14 | | 60,000 | | 59,550 |
Rite Aid Corp. 6% 12/15/05 (e) | | 20,000 | | 20,100 |
Stater Brothers Holdings, Inc. 8.125% 6/15/12 | | 80,000 | | 80,600 |
| | 437,550 |
Food Products - 0.4% |
B&G Foods, Inc. 8% 10/1/11 | | 40,000 | | 41,300 |
Cadbury Schweppes U.S. Finance LLC: | | | | |
3.875% 10/1/08 (e) | | 90,000 | | 87,885 |
5.125% 10/1/13 (e) | | 1,060,000 | | 1,055,387 |
Del Monte Corp. 6.75% 2/15/15 (e) | | 60,000 | | 61,350 |
Doane Pet Care Co.: | | | | |
9.75% 5/15/07 | | 50,000 | | 49,250 |
10.75% 3/1/10 | | 125,000 | | 135,000 |
National Beef Packing Co. LLC/National Beef Finance Corp. 10.5% 8/1/11 | | 120,000 | | 127,500 |
Nonconvertible Bonds - continued |
| Principal Amount | | Value (Note 1) |
CONSUMER STAPLES - continued |
Food Products - continued |
Pierre Foods, Inc. 9.875% 7/15/12 | | $ 40,000 | | $ 41,800 |
United Agriculture Products, Inc. 8.25% 12/15/11 | | 147,000 | | 155,085 |
| | 1,754,557 |
Household Products - 0.1% |
Fort James Corp. 6.875% 9/15/07 | | 150,000 | | 156,563 |
Personal Products - 0.0% |
Revlon Consumer Products Corp. 9.5% 4/1/11 | | 100,000 | | 96,000 |
Tobacco - 0.1% |
Altria Group, Inc. 7% 11/4/13 | | 400,000 | | 438,346 |
TOTAL CONSUMER STAPLES | | 3,300,603 |
ENERGY - 2.1% |
Energy Equipment & Services - 0.3% |
Cooper Cameron Corp. 2.65% 4/15/07 | | 340,000 | | 328,336 |
Diamond Offshore Drilling, Inc. 4.875% 7/1/15 (e) | | 885,000 | | 866,882 |
Dresser-Rand Group, Inc. 7.375% 11/1/14 (e) | | 50,000 | | 52,375 |
Hanover Compressor Co. 8.625% 12/15/10 | | 20,000 | | 21,200 |
Hanover Equipment Trust 8.75% 9/1/11 | | 50,000 | | 53,375 |
Petronas Capital Ltd. 7% 5/22/12 (e) | | 5,000 | | 5,609 |
Universal Compression, Inc. 7.25% 5/15/10 | | 40,000 | | 41,700 |
| | 1,369,477 |
Oil, Gas & Consumable Fuels - 1.8% |
Amerada Hess Corp. 6.65% 8/15/11 | | 110,000 | | 119,464 |
ANR Pipeline, Inc. 9.625% 11/1/21 | | 100,000 | | 127,750 |
Arch Western Finance LLC 6.75% 7/1/13 | | 100,000 | | 103,500 |
Canadian Oil Sands Ltd. 4.8% 8/10/09 (e) | | 490,000 | | 486,712 |
Chesapeake Energy Corp.: | | | | |
6.875% 1/15/16 | | 50,000 | | 52,190 |
7.75% 1/15/15 | | 30,000 | | 32,550 |
El Paso Energy Corp.: | | | | |
7.375% 12/15/12 | | 5,000 | | 5,069 |
7.75% 1/15/32 | | 15,000 | | 15,150 |
8.05% 10/15/30 | | 95,000 | | 97,256 |
El Paso Production Holding Co. 7.75% 6/1/13 | | 140,000 | | 148,750 |
Empresa Nacional de Petroleo 6.75% 11/15/12 (e) | | 300,000 | | 326,272 |
EnCana Holdings Finance Corp. 5.8% 5/1/14 | | 240,000 | | 253,201 |
Enterprise Products Operating LP 5.75% 3/1/35 (e) | | 300,000 | | 286,865 |
Foundation Pennsylvania Coal Co. 7.25% 8/1/14 | | 50,000 | | 52,750 |
Nonconvertible Bonds - continued |
| Principal Amount | | Value (Note 1) |
ENERGY - continued |
Oil, Gas & Consumable Fuels - continued |
General Maritime Corp. 10% 3/15/13 | | $ 310,000 | | $ 338,675 |
Giant Industries, Inc. 8% 5/15/14 | | 130,000 | | 136,175 |
Hurricane Finance BV: | | | | |
9.625% 2/12/10 (e) | | 25,000 | | 27,438 |
9.625% 2/12/10 (Reg. S) | | 35,000 | | 38,413 |
Kinder Morgan Energy Partners LP 5.8% 3/15/35 | | 300,000 | | 298,296 |
Markwest Energy Partners LP/ Markwest Energy Finance Corp. 6.875% 11/1/14 (e) | | 146,000 | | 147,460 |
Massey Energy Co. 6.625% 11/15/10 | | 40,000 | | 41,200 |
Newfield Exploration Co. 6.625% 9/1/14 | | 90,000 | | 94,275 |
Nexen, Inc. 5.875% 3/10/35 | | 600,000 | | 595,049 |
OAO Gazprom: | | | | |
9.625% 3/1/13 | | 240,000 | | 291,600 |
10.5% 10/21/09 | | 90,000 | | 106,650 |
Overseas Shipholding Group, Inc.: | | | | |
7.5% 2/15/24 | | 55,000 | | 53,350 |
8.25% 3/15/13 | | 40,000 | | 42,600 |
Pan American Energy LLC 7.125% 10/27/09 (e) | | 100,000 | | 102,000 |
Peabody Energy Corp. 6.875% 3/15/13 | | 20,000 | | 21,150 |
Pemex Project Funding Master Trust: | | | | |
6.125% 8/15/08 | | 250,000 | | 256,250 |
6.625% 6/15/35 (e) | | 780,000 | | 752,700 |
7.375% 12/15/14 | | 500,000 | | 552,500 |
Petrobras Energia SA 9.375% 10/30/13 | | 65,000 | | 71,500 |
Range Resources Corp.: | | | | |
6.375% 3/15/15 (Reg. S) | | 90,000 | | 90,450 |
7.375% 7/15/13 | | 40,000 | | 42,600 |
Ship Finance International Ltd. 8.5% 12/15/13 | | 330,000 | | 315,975 |
Teekay Shipping Corp. 8.875% 7/15/11 | | 30,000 | | 34,350 |
The Coastal Corp.: | | | | |
6.375% 2/1/09 | | 5,000 | | 4,925 |
6.5% 6/1/08 | | 150,000 | | 149,063 |
6.7% 2/15/27 | | 65,000 | | 65,731 |
7.75% 6/15/10 | | 200,000 | | 205,750 |
Williams Co., Inc. Credit Linked Certificate Trust III 6.75% 4/15/09 (e) | | 215,000 | | 223,869 |
Williams Companies, Inc.: | | | | |
7.125% 9/1/11 | | 5,000 | | 5,450 |
7.625% 7/15/19 | | 30,000 | | 34,275 |
7.875% 9/1/21 | | 35,000 | | 40,381 |
Nonconvertible Bonds - continued |
| Principal Amount | | Value (Note 1) |
ENERGY - continued |
Oil, Gas & Consumable Fuels - continued |
Williams Companies, Inc.: - continued | | | | |
8.125% 3/15/12 | | $ 30,000 | | $ 34,650 |
8.75% 3/15/32 | | 165,000 | | 203,775 |
YPF SA: | | | | |
10% 11/2/28 | | 30,000 | | 36,300 |
yankee 9.125% 2/24/09 | | 45,000 | | 49,163 |
| | 7,611,467 |
TOTAL ENERGY | | 8,980,944 |
FINANCIALS - 6.0% |
Capital Markets - 1.5% |
Bank of New York Co., Inc.: | | | | |
3.4% 3/15/13 (i) | | 100,000 | | 96,459 |
4.25% 9/4/12 (i) | | 205,000 | | 203,356 |
Credit Suisse First Boston (USA), Inc. 4.7% 6/1/09 | | 440,000 | | 441,502 |
E*TRADE Financial Corp. 8% 6/15/11 | | 265,000 | | 279,575 |
Equinox Holdings Ltd. 9% 12/15/09 | | 90,000 | | 93,600 |
Franklin Resources, Inc. 3.7% 4/15/08 | | 1,135,000 | | 1,107,274 |
Goldman Sachs Group, Inc.: | | | | |
5.7% 9/1/12 | | 1,100,000 | | 1,147,915 |
6.6% 1/15/12 | | 500,000 | | 545,548 |
Lazard LLC 7.125% 5/15/15 (e) | | 685,000 | | 681,889 |
Legg Mason, Inc. 6.75% 7/2/08 | | 30,000 | | 31,868 |
Merrill Lynch & Co., Inc. 4.25% 2/8/10 | | 685,000 | | 672,342 |
Morgan Stanley 6.6% 4/1/12 | | 1,100,000 | | 1,199,734 |
| | 6,501,062 |
Commercial Banks - 0.7% |
Bank of America Corp. 7.4% 1/15/11 | | 780,000 | | 885,848 |
Corporacion Andina de Fomento 5.2% 5/21/13 | | 35,000 | | 35,055 |
Korea Development Bank: | | | | |
3.875% 3/2/09 | | 685,000 | | 665,324 |
4.75% 7/20/09 | | 320,000 | | 319,925 |
5.75% 9/10/13 | | 170,000 | | 178,008 |
Standard Bank London Ltd. 8.125% 9/30/09 | | 100,000 | | 104,760 |
Vimpel Communications 10% 6/16/09 (Issued by UBS Luxembourg SA for Vimpel Communications) | | 100,000 | | 107,750 |
Wachovia Bank NA 4.875% 2/1/15 | | 600,000 | | 595,542 |
Nonconvertible Bonds - continued |
| Principal Amount | | Value (Note 1) |
FINANCIALS - continued |
Commercial Banks - continued |
Wachovia Corp. 4.875% 2/15/14 | | $ 175,000 | | $ 173,732 |
Western Financial Bank 9.625% 5/15/12 | | 15,000 | | 16,500 |
| | 3,082,444 |
Consumer Finance - 0.6% |
AmeriCredit Corp. 9.25% 5/1/09 | | 65,000 | | 69,063 |
Capital One Bank 6.5% 6/13/13 | | 1,090,000 | | 1,181,679 |
Ford Motor Credit Co.: | | | | |
6.625% 6/16/08 | | 90,000 | | 90,000 |
7.375% 2/1/11 | | 1,000,000 | | 993,484 |
Household Finance Corp. 4.125% 11/16/09 | | 170,000 | | 166,008 |
Triad Acquisition Corp. 11.125% 5/1/13 (e) | | 105,000 | | 108,150 |
| | 2,608,384 |
Diversified Financial Services - 0.5% |
CCO Holdings LLC/CCO Holdings Capital Corp. 8.75% 11/15/13 | | 70,000 | | 69,475 |
Global Cash Access LLC/Global Cash Access Finance Corp. 8.75% 3/15/12 | | 105,000 | | 113,537 |
JPMorgan Chase & Co. 4.875% 3/15/14 | | 1,475,000 | | 1,458,077 |
Prime Property Funding II, Inc. 5.125% 6/1/15 (e) | | 510,000 | | 496,728 |
Refco Finance Holdings LLC/Refco Finance, Inc. 9% 8/1/12 | | 105,000 | | 113,400 |
Universal City Florida Holding Co. I/II 8.375% 5/1/10 | | 30,000 | | 31,500 |
| | 2,282,717 |
Insurance - 0.3% |
Aegon NV 4.75% 6/1/13 | | 500,000 | | 492,638 |
Marsh & McLennan Companies, Inc. 7.125% 6/15/09 | | 589,000 | | 628,114 |
UnumProvident Corp. 7.625% 3/1/11 | | 150,000 | | 158,538 |
| | 1,279,290 |
Real Estate - 1.8% |
American Real Estate Partners/American Real Estate Finance Corp.: | | | | |
7.125% 2/15/13 (e) | | 115,000 | | 115,000 |
8.125% 6/1/12 | | 85,000 | | 89,250 |
Archstone Smith Operating Trust 5.25% 5/1/15 | | 805,000 | | 803,981 |
Arden Realty LP 5.25% 3/1/15 | | 1,210,000 | | 1,186,513 |
Boston Properties, Inc. 6.25% 1/15/13 | | 365,000 | | 388,563 |
Camden Property Trust 5.875% 11/30/12 | | 200,000 | | 205,950 |
CarrAmerica Realty Corp. 5.25% 11/30/07 | | 200,000 | | 201,021 |
CB Richard Ellis Services, Inc. 9.75% 5/15/10 | | 10,000 | | 11,100 |
Nonconvertible Bonds - continued |
| Principal Amount | | Value (Note 1) |
FINANCIALS - continued |
Real Estate - continued |
Developers Diversified Realty Corp.: | | | | |
5% 5/3/10 | | $ 350,000 | | $ 348,525 |
5.25% 4/15/11 | | 205,000 | | 206,077 |
EOP Operating LP: | | | | |
4.65% 10/1/10 | | 595,000 | | 583,725 |
4.75% 3/15/14 | | 135,000 | | 130,848 |
7% 7/15/11 | | 500,000 | | 549,080 |
Gables Realty LP: | | | | |
5% 3/15/10 | | 105,000 | | 102,820 |
5.75% 7/15/07 | | 970,000 | | 985,739 |
Healthcare Realty Trust, Inc. 5.125% 4/1/14 | | 145,000 | | 140,084 |
La Quinta Properties, Inc. 7% 8/15/12 | | 50,000 | | 51,938 |
MeriStar Hospitality Corp. 8.75% 8/15/07 | | 50,000 | | 50,000 |
MeriStar Hospitality Operating Partnership LP/MeriStar Hospitality Finance Corp. II 10.5% 6/15/09 | | 100,000 | | 106,500 |
Omega Healthcare Investors, Inc. 7% 4/1/14 | | 70,000 | | 71,225 |
Senior Housing Properties Trust 7.875% 4/15/15 | | 20,000 | | 21,550 |
Simon Property Group LP: | | | | |
5.1% 6/15/15 (e) | | 485,000 | | 477,725 |
5.625% 8/15/14 | | 1,000,000 | | 1,024,214 |
Ventas Realty LP/Ventas Capital Corp. 6.625% 10/15/14 (e) | | 60,000 | | 61,500 |
| | 7,912,928 |
Thrifts & Mortgage Finance - 0.6% |
Countrywide Home Loans, Inc. 4% 3/22/11 | | 415,000 | | 394,901 |
Independence Community Bank Corp. 3.75% 4/1/14 (i) | | 120,000 | | 115,358 |
Residential Capital Corp. 6.375% 6/30/10 (e) | | 685,000 | | 695,810 |
Washington Mutual, Inc. 4.375% 1/15/08 | | 1,200,000 | | 1,194,078 |
| | 2,400,147 |
TOTAL FINANCIALS | | 26,066,972 |
HEALTH CARE - 0.4% |
Health Care Equipment & Supplies - 0.0% |
Medical Device Manufacturing, Inc. 10% 7/15/12 | | 50,000 | | 53,750 |
PerkinElmer, Inc. 8.875% 1/15/13 | | 20,000 | | 22,300 |
Spheris, Inc. 11% 12/15/12 (e) | | 50,000 | | 48,500 |
| | 124,550 |
Nonconvertible Bonds - continued |
| Principal Amount | | Value (Note 1) |
HEALTH CARE - continued |
Health Care Providers & Services - 0.3% |
AmeriPath, Inc. 10.5% 4/1/13 | | $ 80,000 | | $ 80,800 |
AMR HoldCo, Inc./ EmCare HoldCo, Inc. 10% 2/15/15 (e) | | 60,000 | | 64,200 |
Community Health Systems, Inc. 6.5% 12/15/12 | | 80,000 | | 81,000 |
Concentra Operating Corp.: | | | | |
9.125% 6/1/12 | | 10,000 | | 10,600 |
9.5% 8/15/10 | | 110,000 | | 117,150 |
DaVita, Inc.: | | | | |
6.625% 3/15/13 (e) | | 40,000 | | 41,400 |
7.25% 3/15/15 (e) | | 265,000 | | 274,275 |
HealthSouth Corp.: | | | | |
7.625% 6/1/12 | | 130,000 | | 127,400 |
8.5% 2/1/08 | | 85,000 | | 86,063 |
IASIS Healthcare LLC/IASIS Capital Corp. 8.75% 6/15/14 | | 100,000 | | 108,500 |
Psychiatric Solutions, Inc. 7.75% 7/15/15 (e) | | 50,000 | | 51,250 |
Rural/Metro Corp. 9.875% 3/15/15 (e) | | 30,000 | | 30,150 |
Tenet Healthcare Corp.: | | | | |
6.375% 12/1/11 | | 75,000 | | 71,063 |
6.5% 6/1/12 | | 15,000 | | 14,250 |
7.375% 2/1/13 | | 75,000 | | 72,938 |
U.S. Oncology, Inc.: | | | | |
9% 8/15/12 | | 30,000 | | 32,775 |
10.75% 8/15/14 | | 80,000 | | 90,000 |
| | 1,353,814 |
Pharmaceuticals - 0.1% |
CDRV Investors, Inc. 0% 1/1/15 (c) | | 100,000 | | 49,500 |
Elan Finance PLC/Elan Finance Corp. 7.75% 11/15/11 (e) | | 50,000 | | 43,000 |
Mylan Laboratories, Inc. 6.375% 8/15/15 (e) | | 60,000 | | 60,150 |
VWR International, Inc.: | | | | |
6.875% 4/15/12 | | 30,000 | | 29,625 |
8% 4/15/14 | | 30,000 | | 28,800 |
Warner Chilcott Corp. 8.75% 2/1/15 (e) | | 80,000 | | 79,600 |
| | 290,675 |
TOTAL HEALTH CARE | | 1,769,039 |
Nonconvertible Bonds - continued |
| Principal Amount | | Value (Note 1) |
INDUSTRIALS - 1.6% |
Aerospace & Defense - 0.3% |
BAE Systems Holdings, Inc. 4.75% 8/15/10 (e) | | $ 525,000 | | $ 520,787 |
BE Aerospace, Inc. 8.5% 10/1/10 | | 100,000 | | 110,500 |
Bombardier, Inc. 6.3% 5/1/14 (e) | | 340,000 | | 319,600 |
K & F Acquisition, Inc. 7.75% 11/15/14 | | 40,000 | | 41,000 |
Orbital Sciences Corp. 9% 7/15/11 | | 135,000 | | 146,475 |
| | 1,138,362 |
Airlines - 0.7% |
American Airlines, Inc. pass thru trust certificates: | | | | |
6.817% 5/23/11 | | 50,000 | | 47,875 |
6.855% 10/15/10 | | 67,869 | | 69,821 |
6.977% 11/23/22 | | 10,708 | | 9,985 |
6.978% 10/1/12 | | 137,745 | | 143,199 |
7.024% 4/15/11 | | 365,000 | | 379,361 |
7.377% 5/23/19 | | 46,728 | | 35,046 |
7.379% 5/23/16 | | 45,678 | | 34,259 |
7.8% 4/1/08 | | 65,000 | | 62,725 |
AMR Corp. 9% 8/1/12 | | 85,000 | | 68,000 |
Continental Airlines, Inc. pass thru trust certificates: | | | | |
6.648% 3/15/19 | | 360,532 | | 355,257 |
6.795% 2/2/20 | | 478,190 | | 411,244 |
Delta Air Lines, Inc.: | | | | |
7.9% 12/15/09 | | 50,000 | | 13,500 |
9.5% 11/18/08 (e) | | 61,000 | | 48,800 |
Delta Air Lines, Inc. pass thru trust certificates: | | | | |
7.111% 3/18/13 | | 340,000 | | 318,750 |
7.299% 9/18/06 | | 1,000 | | 440 |
7.57% 11/18/10 | | 705,000 | | 655,613 |
7.779% 11/18/05 | | 3,000 | | 1,800 |
7.779% 1/2/12 | | 22,350 | | 9,834 |
7.92% 5/18/12 | | 135,000 | | 79,650 |
Northwest Airlines, Inc.: | | | | |
7.875% 3/15/08 | | 25,000 | | 10,875 |
9.875% 3/15/07 | | 60,000 | | 31,200 |
Northwest Airlines, Inc. pass thru trust certificates: | | | | |
7.068% 7/2/17 | | 7,800 | | 5,304 |
7.626% 4/1/10 | | 32,062 | | 18,276 |
7.67% 1/2/15 | | 8,270 | | 5,872 |
| | 2,816,686 |
Nonconvertible Bonds - continued |
| Principal Amount | | Value (Note 1) |
INDUSTRIALS - continued |
Building Products - 0.0% |
Jacuzzi Brands, Inc. 9.625% 7/1/10 | | $ 20,000 | | $ 22,000 |
Nortek, Inc. 8.5% 9/1/14 | | 100,000 | | 97,000 |
| | 119,000 |
Commercial Services & Supplies - 0.1% |
Adesa, Inc. 7.625% 6/15/12 | | 50,000 | | 51,000 |
ALH Finance LLC/ALH Finance Corp. 8.5% 1/15/13 | | 25,000 | | 24,125 |
Allied Waste North America, Inc.: | | | | |
5.75% 2/15/11 | | 70,000 | | 66,150 |
7.875% 4/15/13 | | 20,000 | | 20,724 |
Buhrmann US, Inc. 7.875% 3/1/15 (e) | | 50,000 | | 49,375 |
Cenveo Corp. 7.875% 12/1/13 | | 60,000 | | 57,900 |
FTI Consulting, Inc. 7.625% 6/15/13 (e) | | 30,000 | | 30,450 |
| | 299,724 |
Electrical Equipment - 0.0% |
General Cable Corp. 9.5% 11/15/10 | | 20,000 | | 21,400 |
Sensus Metering Systems, Inc. 8.625% 12/15/13 | | 20,000 | | 18,700 |
| | 40,100 |
Industrial Conglomerates - 0.2% |
Hutchison Whampoa International 03/13 Ltd. 6.5% 2/13/13 (e) | | 190,000 | | 202,736 |
Hutchison Whampoa International 03/33 Ltd. 7.45% 11/24/33 (e) | | 720,000 | | 835,641 |
| | 1,038,377 |
Machinery - 0.1% |
Accuride Corp. 8.5% 2/1/15 | | 80,000 | | 83,200 |
Commercial Vehicle Group, Inc. 8% 7/1/13 (e) | | 50,000 | | 52,000 |
Dresser, Inc. 9.375% 4/15/11 | | 15,000 | | 15,750 |
Invensys PLC 9.875% 3/15/11 (e) | | 245,000 | | 243,775 |
Navistar International Corp. 7.5% 6/15/11 | | 30,000 | | 30,750 |
Park-Ohio Industries, Inc. 8.375% 11/15/14 (e) | | 60,000 | | 56,400 |
Standard Aero Holdings, Inc. 8.25% 9/1/14 (e) | | 60,000 | | 63,600 |
Terex Corp. 7.375% 1/15/14 | | 100,000 | | 105,000 |
| | 650,475 |
Marine - 0.1% |
American Commercial Lines LLC/ACL Finance Corp. 9.5% 2/15/15 | | 110,000 | | 119,900 |
H-Lines Finance Holding Corp. 0% 4/1/13 (c)(e) | | 40,000 | | 32,100 |
Nonconvertible Bonds - continued |
| Principal Amount | | Value (Note 1) |
INDUSTRIALS - continued |
Marine - continued |
Horizon Lines LLC/Holdings Corp. 9% 11/1/12 (e) | | $ 40,000 | | $ 43,000 |
OMI Corp. 7.625% 12/1/13 | | 95,000 | | 96,663 |
| | 291,663 |
Road & Rail - 0.1% |
Kansas City Southern Railway Co. 7.5% 6/15/09 | | 100,000 | | 103,000 |
Progress Rail Services Corp./Progress Metal Reclamation Co. 7.75% 4/1/12 (e) | | 100,000 | | 102,250 |
TFM SA de CV 9.375% 5/1/12 (e) | | 85,000 | | 90,950 |
| | 296,200 |
Trading Companies & Distributors - 0.0% |
Ashtead Holdings PLC 8.625% 8/1/15 (e)(f) | | 75,000 | | 77,625 |
Neff Rent LLC/Neff Finance Corp. 11.25% 6/15/12 (e) | | 50,000 | | 51,750 |
| | 129,375 |
TOTAL INDUSTRIALS | | 6,819,962 |
INFORMATION TECHNOLOGY - 0.4% |
Communications Equipment - 0.1% |
L-3 Communications Corp. 6.375% 10/15/15 (e) | | 120,000 | | 121,350 |
Nortel Networks Corp. 6.125% 2/15/06 | | 65,000 | | 65,325 |
| | 186,675 |
Electronic Equipment & Instruments - 0.0% |
Celestica, Inc. 7.875% 7/1/11 | | 100,000 | | 103,250 |
IT Services - 0.1% |
Iron Mountain, Inc. 6.625% 1/1/16 | | 120,000 | | 113,400 |
SunGard Data Systems, Inc.: | | | | |
9.125% 8/15/13 (e)(f) | | 225,000 | | 233,438 |
10.25% 8/15/15 (e)(f) | | 210,000 | | 217,875 |
| | 564,713 |
Office Electronics - 0.1% |
Xerox Capital Trust I 8% 2/1/27 | | 130,000 | | 135,200 |
Xerox Corp.: | | | | |
7.125% 6/15/10 | | 20,000 | | 21,200 |
7.2% 4/1/16 | | 165,000 | | 179,850 |
7.625% 6/15/13 | | 60,000 | | 63,900 |
| | 400,150 |
Semiconductors & Semiconductor Equipment - 0.1% |
Amkor Technology, Inc. 7.75% 5/15/13 | | 65,000 | | 55,575 |
Nonconvertible Bonds - continued |
| Principal Amount | | Value (Note 1) |
INFORMATION TECHNOLOGY - continued |
Semiconductors & Semiconductor Equipment - continued |
Freescale Semiconductor, Inc. 7.125% 7/15/14 | | $ 60,000 | | $ 64,200 |
MagnaChip Semiconductor SA/MagnaChip Semiconductor Finance Co.: | | | | |
6.875% 12/15/11 (e) | | 25,000 | | 24,750 |
8% 12/15/14 (e) | | 80,000 | | 77,400 |
New ASAT Finance Ltd. 9.25% 2/1/11 | | 60,000 | | 48,600 |
Viasystems, Inc. 10.5% 1/15/11 | | 140,000 | | 137,200 |
| | 407,725 |
TOTAL INFORMATION TECHNOLOGY | | 1,662,513 |
MATERIALS - 1.3% |
Chemicals - 0.5% |
BCP Crystal U.S. Holdings Corp. 9.625% 6/15/14 | | 110,000 | | 124,300 |
Berry Plastics Corp. 10.75% 7/15/12 | | 80,000 | | 87,600 |
Borden US Finance Corp./Nova Scotia Finance ULC: | | | | |
8.3488% 7/15/10 (e)(i) | | 70,000 | | 69,300 |
9% 7/15/14 (e) | | 70,000 | | 72,100 |
Braskem SA 11.75% 1/22/14 (e) | | 25,000 | | 29,500 |
Crystal US Holding 3 LLC/Crystal US Sub 3 Corp. Series B, 0% 10/1/14 (c) | | 100,000 | | 72,000 |
Equistar Chemicals LP: | | | | |
6.5% 2/15/06 | | 75,000 | | 75,375 |
7.55% 2/15/26 | | 100,000 | | 93,500 |
Equistar Chemicals LP/Equistar Funding Corp. 10.625% 5/1/11 | | 145,000 | | 161,313 |
Georgia Gulf Corp. 7.125% 12/15/13 | | 90,000 | | 94,500 |
Huntsman International LLC 9.875% 3/1/09 | | 115,000 | | 122,906 |
Innophos, Inc. 8.875% 8/15/14 (e) | | 30,000 | | 30,825 |
Lyondell Chemical Co.: | | | | |
9.625% 5/1/07 | | 200,000 | | 212,500 |
10.875% 5/1/09 | | 55,000 | | 56,925 |
Millennium America, Inc. 9.25% 6/15/08 | | 230,000 | | 251,275 |
Nalco Co.: | | | | |
7.75% 11/15/11 | | 130,000 | | 138,450 |
8.875% 11/15/13 | | 100,000 | | 109,000 |
Pliant Corp. 0% 6/15/09 (c) | | 60,000 | | 53,400 |
Resolution Performance Products LLC/RPP Capital Corp.: | | | | |
9.5% 4/15/10 | | 70,000 | | 72,625 |
13.5% 11/15/10 | | 35,000 | | 37,800 |
Nonconvertible Bonds - continued |
| Principal Amount | | Value (Note 1) |
MATERIALS - continued |
Chemicals - continued |
Rockwood Specialties Group, Inc. 7.5% 11/15/14 (e) | | $ 50,000 | | $ 50,250 |
Solutia, Inc. 7.375% 10/15/27 (b) | | 20,000 | | 16,400 |
| | 2,031,844 |
Construction Materials - 0.0% |
Texas Industries, Inc. 7.25% 7/15/13 (e) | | 30,000 | | 31,650 |
Containers & Packaging - 0.3% |
AEP Industries, Inc. 7.875% 3/15/13 (e) | | 30,000 | | 30,000 |
BWAY Corp. 10% 10/15/10 | | 105,000 | | 111,300 |
Crown Cork & Seal, Inc. 8% 4/15/23 | | 105,000 | | 105,000 |
Crown European Holdings SA 9.5% 3/1/11 | | 35,000 | | 38,588 |
Graham Packaging Co. LP/ GPC Capital Corp.: | | | | |
8.5% 10/15/12 (e) | | 50,000 | | 51,250 |
9.875% 10/15/14 (e) | | 95,000 | | 97,375 |
Graphic Packaging International, Inc.: | | | | |
8.5% 8/15/11 | | 120,000 | | 125,400 |
9.5% 8/15/13 | | 170,000 | | 175,100 |
Jefferson Smurfit Corp. U.S. 7.5% 6/1/13 | | 15,000 | | 14,381 |
Owens-Brockway Glass Container, Inc.: | | | | |
8.25% 5/15/13 | | 15,000 | | 16,238 |
8.875% 2/15/09 | | 50,000 | | 52,875 |
Owens-Illinois, Inc.: | | | | |
7.35% 5/15/08 | | 50,000 | | 52,125 |
7.5% 5/15/10 | | 95,000 | | 99,156 |
7.8% 5/15/18 | | 45,000 | | 46,800 |
8.1% 5/15/07 | | 110,000 | | 114,400 |
Tekni-Plex, Inc. 10.875% 8/15/12 (e) | | 40,000 | | 43,100 |
| | 1,173,088 |
Metals & Mining - 0.3% |
Aleris International, Inc. 9% 11/15/14 | | 20,000 | | 20,900 |
California Steel Industries, Inc. 6.125% 3/15/14 | | 40,000 | | 37,200 |
Century Aluminum Co. 7.5% 8/15/14 | | 40,000 | | 41,000 |
Corporacion Nacional del Cobre (Codelco) 6.375% 11/30/12 (e) | | 335,000 | | 362,849 |
CSN Islands VIII Corp. 9.75% 12/16/13 (e) | | 25,000 | | 26,563 |
Freeport-McMoRan Copper & Gold, Inc.: | | | | |
6.875% 2/1/14 | | 75,000 | | 73,969 |
10.125% 2/1/10 | | 45,000 | | 50,063 |
Gerdau AmeriSteel Corp./GUSAP Partners 10.375% 7/15/11 | | 50,000 | | 55,250 |
Nonconvertible Bonds - continued |
| Principal Amount | | Value (Note 1) |
MATERIALS - continued |
Metals & Mining - continued |
Newmont Mining Corp. 5.875% 4/1/35 | | $ 405,000 | | $ 407,120 |
Novelis, Inc. 7.25% 2/15/15 (e) | | 110,000 | | 112,200 |
Wise Metals Group LLC/Alloys Finance 10.25% 5/15/12 | | 110,000 | | 103,400 |
| | 1,290,514 |
Paper & Forest Products - 0.2% |
Boise Cascade Corp. 8% 2/24/06 | | 25,000 | | 25,625 |
Boise Cascade LLC/Boise Cascade Finance Corp.: | | | | |
6.4738% 10/15/12 (i) | | 30,000 | | 30,300 |
7.125% 10/15/14 | | 30,000 | | 29,475 |
Buckeye Technologies, Inc. 8.5% 10/1/13 | | 200,000 | | 204,250 |
Georgia-Pacific Corp.: | | | | |
7.375% 12/1/25 | | 15,000 | | 16,219 |
7.5% 5/15/06 | | 50,000 | | 51,125 |
7.75% 11/15/29 | | 10,000 | | 11,200 |
8% 1/15/24 | | 130,000 | | 149,175 |
8.125% 5/15/11 | | 5,000 | | 5,594 |
Millar Western Forest Products Ltd. 7.75% 11/15/13 | | 120,000 | | 113,400 |
Norske Skog Canada Ltd. 7.375% 3/1/14 | | 40,000 | | 39,700 |
Solo Cup Co. 8.5% 2/15/14 | | 145,000 | | 138,838 |
Stone Container Corp. 8.375% 7/1/12 | | 200,000 | | 202,500 |
| | 1,017,401 |
TOTAL MATERIALS | | 5,544,497 |
TELECOMMUNICATION SERVICES - 2.6% |
Diversified Telecommunication Services - 2.0% |
Ameritech Capital Funding Corp. 6.25% 5/18/09 | | 35,000 | | 36,726 |
BellSouth Capital Funding Corp. 7.875% 2/15/30 | | 1,800,000 | | 2,284,409 |
British Telecommunications PLC: | | | | |
8.375% 12/15/10 | | 190,000 | | 222,019 |
8.875% 12/15/30 | | 145,000 | | 203,483 |
Empresa Brasileira de Telecomm SA 11% 12/15/08 | | 158,000 | | 178,540 |
Eschelon Operating Co. 8.375% 3/15/10 | | 70,000 | | 64,400 |
GCI, Inc. 7.25% 2/15/14 | | 50,000 | | 48,750 |
Koninklijke KPN NV yankee 8% 10/1/10 | | 500,000 | | 570,223 |
MCI, Inc. 7.688% 5/1/09 | | 36,000 | | 37,530 |
New Skies Satellites BV: | | | | |
8.5388% 11/1/11 (i) | | 100,000 | | 104,000 |
9.125% 11/1/12 | | 85,000 | | 88,400 |
Nonconvertible Bonds - continued |
| Principal Amount | | Value (Note 1) |
TELECOMMUNICATION SERVICES - continued |
Diversified Telecommunication Services - continued |
NTL Cable PLC 8.75% 4/15/14 | | $ 190,000 | | $ 202,350 |
Qwest Capital Funding, Inc.: | | | | |
7% 8/3/09 | | 50,000 | | 48,750 |
7.25% 2/15/11 | | 35,000 | | 33,775 |
7.625% 8/3/21 | | 20,000 | | 18,000 |
Qwest Communications International, Inc.: | | | | |
6.7681% 2/15/09 (i) | | 40,000 | | 40,100 |
7.5% 2/15/14 (e) | | 60,000 | | 57,600 |
7.5% 2/15/14 | | 160,000 | | 154,400 |
Qwest Corp.: | | | | |
6.6706% 6/15/13 (e)(i) | | 90,000 | | 93,825 |
7.625% 6/15/15 (e) | | 110,000 | | 113,163 |
Qwest Services Corp.: | | | | |
13.5% 12/15/10 | | 20,000 | | 23,000 |
14% 12/15/14 | | 110,000 | | 133,100 |
SBC Communications, Inc.: | | | | |
6.15% 9/15/34 | | 500,000 | | 531,455 |
6.45% 6/15/34 | | 220,000 | | 242,412 |
Sprint Capital Corp. 8.375% 3/15/12 | | 600,000 | | 711,574 |
Telecom Italia Capital: | | | | |
4.95% 9/30/14 (e) | | 415,000 | | 406,778 |
6% 9/30/34 (e) | | 500,000 | | 507,292 |
Telefonica de Argentina SA 9.125% 11/7/10 | | 95,000 | | 103,075 |
Telefonos de Mexico SA de CV 4.75% 1/27/10 (e) | | 90,000 | | 88,786 |
Telenet Group Holding NV 0% 6/15/14 (c)(e) | | 80,000 | | 64,000 |
TELUS Corp. yankee 7.5% 6/1/07 | | 180,000 | | 189,293 |
Time Warner Telecom Holdings, Inc. 9.25% 2/15/14 (e) | | 80,000 | | 81,600 |
U.S. West Capital Funding, Inc. 6.375% 7/15/08 | | 125,000 | | 122,500 |
U.S. West Communications 6.875% 9/15/33 | | 165,000 | | 141,900 |
Verizon Global Funding Corp. 7.25% 12/1/10 | | 360,000 | | 401,070 |
Verizon New York, Inc. 6.875% 4/1/12 | | 120,000 | | 130,733 |
| | 8,479,011 |
Wireless Telecommunication Services - 0.6% |
America Movil SA de CV 4.125% 3/1/09 | | 285,000 | | 276,459 |
American Tower Corp. 7.5% 5/1/12 | | 105,000 | | 112,088 |
AT&T Wireless Services, Inc. 7.875% 3/1/11 | | 455,000 | | 521,200 |
Centennial Communications Corp./Centennial Cellular Operating Co. LLC/Centennial Puerto Rico Operations Corp. 8.125% 2/1/14 (i) | | 60,000 | | 64,350 |
Nonconvertible Bonds - continued |
| Principal Amount | | Value (Note 1) |
TELECOMMUNICATION SERVICES - continued |
Wireless Telecommunication Services - continued |
DirecTV Holdings LLC/DirecTV Financing, Inc.: | | | | |
6.375% 6/15/15 (e) | | $ 30,000 | | $ 29,925 |
8.375% 3/15/13 | | 33,000 | | 36,548 |
Globe Telecom, Inc. 9.75% 4/15/12 | | 30,000 | | 32,625 |
Inmarsat Finance II PLC 0% 11/15/12 (c) | | 70,000 | | 56,000 |
Inmarsat Finance PLC 7.625% 6/30/12 | | 45,438 | | 48,107 |
Intelsat Ltd.: | | | | |
6.5% 11/1/13 | | 40,000 | | 32,550 |
7.625% 4/15/12 | | 20,000 | | 17,800 |
8.625% 1/15/15 (e) | | 195,000 | | 208,650 |
Kyivstar GSM 10.375% 8/17/09 (e) | | 100,000 | | 111,630 |
Millicom International Cellular SA 10% 12/1/13 | | 140,000 | | 145,250 |
Mobile Telesystems Finance SA: | | | | |
8% 1/28/12 (e) | | 60,000 | | 61,500 |
8.375% 10/14/10 (e) | | 170,000 | | 178,075 |
Nextel Communications, Inc. 7.375% 8/1/15 | | 150,000 | | 161,250 |
Nextel Partners, Inc. 8.125% 7/1/11 | | 85,000 | | 92,650 |
Rogers Communications, Inc.: | | | | |
6.375% 3/1/14 | | 140,000 | | 142,800 |
8% 12/15/12 | | 105,000 | | 113,269 |
9.625% 5/1/11 | | 26,000 | | 30,615 |
Rural Cellular Corp. 8.25% 3/15/12 | | 60,000 | | 63,600 |
Telemig Cellular SA/Amazonia Cellular SA 8.75% 1/20/09 (e) | | 31,000 | | 32,085 |
Western Wireless Corp. 9.25% 7/15/13 | | 175,000 | | 199,500 |
| | 2,768,526 |
TOTAL TELECOMMUNICATION SERVICES | | 11,247,537 |
UTILITIES - 2.4% |
Electric Utilities - 1.2% |
AES Gener SA 7.5% 3/25/14 | | 70,000 | | 72,275 |
Cleveland Electric Illuminating Co. 5.65% 12/15/13 | | 300,000 | | 309,783 |
Duke Capital LLC 6.75% 2/15/32 | | 1,400,000 | | 1,559,447 |
Exelon Corp.: | | | | |
4.9% 6/15/15 | | 485,000 | | 475,903 |
5.625% 6/15/35 | | 90,000 | | 88,598 |
6.75% 5/1/11 | | 420,000 | | 458,365 |
FirstEnergy Corp. 6.45% 11/15/11 | | 155,000 | | 166,683 |
Nonconvertible Bonds - continued |
| Principal Amount | | Value (Note 1) |
UTILITIES - continued |
Electric Utilities - continued |
MSW Energy Holdings II LLC/MSW Finance Co. II, Inc. 7.375% 9/1/10 | | $ 40,000 | | $ 41,600 |
MSW Energy Holdings LLC/MSW Energy Finance Co., Inc. 8.5% 9/1/10 | | 10,000 | | 10,750 |
Nevada Power Co.: | | | | |
5.875% 1/15/15 (e) | | 40,000 | | 40,700 |
6.5% 4/15/12 | | 50,000 | | 52,500 |
Oncor Electric Delivery Co. 6.375% 5/1/12 | | 45,000 | | 48,651 |
Progress Energy, Inc. 7.1% 3/1/11 | | 950,000 | | 1,043,885 |
Sierra Pacific Resources 7.803% 6/15/12 | | 40,000 | | 42,800 |
TECO Energy, Inc. 7% 5/1/12 | | 80,000 | | 86,000 |
Texas Genco LLC/Texas Genco Financing Corp. 6.875% 12/15/14 (e) | | 125,000 | | 131,250 |
TXU Energy Co. LLC 7% 3/15/13 | | 480,000 | | 531,063 |
| | 5,160,253 |
Gas Utilities - 0.0% |
Colorado Interstate Gas Co. 5.95% 3/15/15 (e) | | 60,000 | | 59,550 |
El Paso Energy Corp. 6.75% 5/15/09 | | 25,000 | | 25,094 |
Sonat, Inc.: | | | | |
6.625% 2/1/08 | | 20,000 | | 20,025 |
6.75% 10/1/07 | | 15,000 | | 15,038 |
| | 119,707 |
Independent Power Producers & Energy Traders - 0.6% |
AES Corp.: | | | | |
8.75% 6/15/08 | | 2,000 | | 2,150 |
8.75% 5/15/13 (e) | | 35,000 | | 38,763 |
8.875% 2/15/11 | | 282,000 | | 312,315 |
9% 5/15/15 (e) | | 25,000 | | 27,938 |
9.375% 9/15/10 | | 7,000 | | 7,875 |
9.5% 6/1/09 | | 19,000 | | 21,066 |
Allegheny Energy Supply Co. LLC: | | | | |
7.8% 3/15/11 | | 170,000 | | 186,150 |
8.25% 4/15/12 (e) | | 90,000 | | 101,250 |
10.25% 11/15/07 (e) | | 26,657 | | 28,990 |
13% 11/15/07 (e)(i) | | 3,339 | | 3,673 |
Constellation Energy Group, Inc. 7% 4/1/12 | | 1,050,000 | | 1,163,003 |
NRG Energy, Inc. 8% 12/15/13 | | 172,000 | | 184,040 |
Nonconvertible Bonds - continued |
| Principal Amount | | Value (Note 1) |
UTILITIES - continued |
Independent Power Producers & Energy Traders - continued |
Tenaska Alabama Partners LP 7% 6/30/21 (e) | | $ 100,000 | | $ 102,750 |
TXU Corp. 5.55% 11/15/14 (e) | | 250,000 | | 243,719 |
| | 2,423,682 |
Multi-Utilities - 0.6% |
CMS Energy Corp.: | | | | |
6.3% 2/1/12 | | 60,000 | | 60,675 |
8.5% 4/15/11 | | 45,000 | | 50,231 |
9.875% 10/15/07 | | 135,000 | | 147,825 |
Dominion Resources, Inc.: | | | | |
4.75% 12/15/10 | | 535,000 | | 531,322 |
5.15% 7/15/15 | | 500,000 | | 497,526 |
5.95% 6/15/35 | | 905,000 | | 924,867 |
6.25% 6/30/12 | | 270,000 | | 288,619 |
Utilicorp Canada Finance Corp. 7.75% 6/15/11 | | 105,000 | | 109,463 |
| | 2,610,528 |
TOTAL UTILITIES | | 10,314,170 |
TOTAL NONCONVERTIBLE BONDS (Cost $92,844,009) | 94,038,947 |
U.S. Government and Government Agency Obligations - 30.4% |
|
U.S. Government Agency Obligations - 4.0% |
Fannie Mae: | | | | |
3.25% 1/15/08 | | 8,000,000 | | 7,812,344 |
4.375% 7/17/13 | | 2,205,000 | | 2,143,699 |
4.625% 5/1/13 | | 5,000,000 | | 4,944,360 |
Federal Home Loan Bank 3.75% 9/28/06 | | 40,000 | | 39,762 |
Freddie Mac: | | | | |
5.25% 11/5/12 | | 280,000 | | 279,761 |
5.875% 3/21/11 | | 2,095,000 | | 2,221,337 |
TOTAL U.S. GOVERNMENT AGENCY OBLIGATIONS | | 17,441,263 |
U.S. Treasury Inflation Protected Obligations - 4.6% |
U.S. Treasury Inflation-Indexed Bonds 2.375% 1/15/25 | | 4,434,805 | | 4,682,155 |
U.S. Government and Government Agency Obligations - continued |
| Principal Amount | | Value (Note 1) |
U.S. Treasury Inflation Protected Obligations - continued |
U.S. Treasury Inflation-Indexed Notes: | | | | |
0.875% 4/15/10 | | $ 3,078,570 | | $ 2,957,553 |
2% 1/15/14 | | 11,889,069 | | 12,019,436 |
TOTAL U.S. TREASURY INFLATION PROTECTED OBLIGATIONS | | 19,659,144 |
U.S. Treasury Obligations - 21.8% |
U.S. Treasury Bonds 6.25% 5/15/30 | | 7,720,000 | | 9,703,677 |
U.S. Treasury Notes: | | | | |
3.125% 1/31/07 | | 40,160,000 | | 39,661,094 |
3.375% 10/15/09 | | 1,000,000 | | 970,273 |
3.625% 4/30/07 | | 7,808,000 | | 7,757,373 |
3.625% 6/30/07 (f) | | 7,111,000 | | 7,059,609 |
4.25% 8/15/13 | | 10,049,000 | | 10,061,561 |
4.75% 5/15/14 | | 15,855,000 | | 16,408,688 |
6.5% 2/15/10 | | 2,170,000 | | 2,378,609 |
TOTAL U.S. TREASURY OBLIGATIONS | | 94,000,884 |
TOTAL U.S. GOVERNMENT AND GOVERNMENT AGENCY OBLIGATIONS (Cost $131,105,466) | 131,101,291 |
U.S. Government Agency - Mortgage Securities - 25.3% |
|
Fannie Mae - 24.2% |
3.463% 4/1/34 (i) | | 155,188 | | 154,598 |
3.734% 1/1/35 (i) | | 81,020 | | 80,197 |
3.753% 10/1/33 (i) | | 57,513 | | 56,675 |
3.786% 12/1/34 (i) | | 67,601 | | 66,855 |
3.793% 6/1/34 (i) | | 269,511 | | 263,211 |
3.801% 12/1/34 (i) | | 21,120 | | 20,923 |
3.828% 1/1/35 (i) | | 64,725 | | 64,163 |
3.838% 1/1/35 (i) | | 160,045 | | 159,402 |
3.867% 1/1/35 (i) | | 90,198 | | 89,698 |
3.913% 12/1/34 (i) | | 44,713 | | 44,363 |
3.937% 10/1/34 (i) | | 60,034 | | 59,588 |
3.937% 12/1/34 (i) | | 92,940 | | 92,473 |
3.963% 1/1/35 (i) | | 125,373 | | 124,133 |
3.97% 5/1/33 (i) | | 15,574 | | 15,481 |
3.975% 1/1/35 (i) | | 64,173 | | 63,554 |
3.981% 12/1/34 (i) | | 65,505 | | 64,819 |
U.S. Government Agency - Mortgage Securities - continued |
| Principal Amount | | Value (Note 1) |
Fannie Mae - continued |
4% 8/1/20 (f) | | $ 2,895,592 | | $ 2,792,437 |
4.008% 12/1/34 (i) | | 373,367 | | 372,610 |
4.011% 1/1/35 (i) | | 43,259 | | 42,826 |
4.014% 12/1/34 (i) | | 43,068 | | 42,611 |
4.023% 2/1/35 (i) | | 47,859 | | 47,446 |
4.03% 1/1/35 (i) | | 23,990 | | 23,874 |
4.032% 12/1/34 (i) | | 43,840 | | 43,751 |
4.045% 5/1/34 (i) | | 25,362 | | 25,346 |
4.049% 2/1/35 (i) | | 45,038 | | 44,699 |
4.053% 10/1/18 (i) | | 61,942 | | 61,329 |
4.054% 1/1/35 (i) | | 44,950 | | 44,529 |
4.079% 4/1/33 (i) | | 18,339 | | 18,311 |
4.098% 1/1/35 (i) | | 90,941 | | 91,282 |
4.104% 2/1/35 (i) | | 46,625 | | 46,397 |
4.11% 2/1/35 (i) | | 46,488 | | 46,325 |
4.117% 2/1/35 (i) | | 91,838 | | 91,479 |
4.118% 1/1/35 (i) | | 102,744 | | 102,288 |
4.121% 2/1/35 (i) | | 183,102 | | 182,253 |
4.124% 1/1/35 (i) | | 110,266 | | 110,771 |
4.137% 1/1/35 (i) | | 177,027 | | 176,326 |
4.138% 2/1/35 (i) | | 112,865 | | 113,284 |
4.144% 1/1/35 (i) | | 165,216 | | 165,989 |
4.15% 11/1/34 (i) | | 83,645 | | 83,189 |
4.154% 2/1/35 (i) | | 93,461 | | 93,188 |
4.178% 1/1/35 (i) | | 188,993 | | 190,793 |
4.183% 1/1/35 (i) | | 90,084 | | 89,998 |
4.189% 11/1/34 (i) | | 34,835 | | 34,773 |
4.197% 1/1/35 (i) | | 115,561 | | 114,805 |
4.232% 3/1/34 (i) | | 56,248 | | 56,058 |
4.25% 2/1/35 (i) | | 72,107 | | 71,699 |
4.258% 10/1/34 (i) | | 149,869 | | 150,753 |
4.293% 3/1/35 (i) | | 69,874 | | 69,865 |
4.297% 7/1/34 (i) | | 57,200 | | 57,342 |
4.302% 1/1/35 (i) | | 71,234 | | 70,795 |
4.306% 8/1/33 (i) | | 123,209 | | 122,720 |
4.315% 3/1/33 (i) | | 31,176 | | 31,109 |
4.323% 5/1/35 (i) | | 91,219 | | 91,093 |
4.332% 12/1/34 (i) | | 46,562 | | 46,607 |
4.335% 2/1/35 (i) | | 45,626 | | 45,509 |
4.349% 1/1/35 (i) | | 68,741 | | 68,129 |
4.351% 1/1/35 (i) | | 70,501 | | 70,245 |
U.S. Government Agency - Mortgage Securities - continued |
| Principal Amount | | Value (Note 1) |
Fannie Mae - continued |
4.367% 2/1/34 (i) | | $ 150,340 | | $ 149,954 |
4.372% 4/1/35 (i) | | 47,281 | | 47,200 |
4.401% 2/1/35 (i) | | 95,631 | | 94,944 |
4.409% 5/1/35 (i) | | 183,454 | | 183,539 |
4.451% 6/1/33 (i) | | 46,276 | | 45,765 |
4.455% 3/1/35 (i) | | 73,725 | | 73,083 |
4.467% 10/1/34 (i) | | 325,088 | | 325,221 |
4.479% 4/1/34 (i) | | 114,089 | | 114,254 |
4.489% 8/1/34 (i) | | 201,750 | | 201,656 |
4.5% 5/1/18 to 4/1/35 | | 22,521,980 | | 21,921,930 |
4.5% 8/1/20 (f) | | 3,000,000 | | 2,950,313 |
4.5% 3/1/35 (i) | | 194,189 | | 193,523 |
4.508% 1/1/35 (i) | | 108,887 | | 109,522 |
4.528% 12/1/34 (i) | | 437,452 | | 435,753 |
4.529% 3/1/35 (i) | | 170,779 | | 170,085 |
4.538% 8/1/34 (i) | | 112,544 | | 113,173 |
4.554% 7/1/35 (i) | | 225,000 | | 225,105 |
4.564% 2/1/35 (i) | | 429,539 | | 430,042 |
4.57% 2/1/35 (i) | | 63,371 | | 63,565 |
4.604% 1/1/33 (i) | | 349,267 | | 350,263 |
4.619% 2/1/35 (i) | | 183,580 | | 182,913 |
4.645% 2/1/35 (i) | | 64,103 | | 64,462 |
4.649% 11/1/34 (i) | | 220,719 | | 221,205 |
4.687% 11/1/34 (i) | | 204,340 | | 204,606 |
4.714% 3/1/35 (i) | | 521,050 | | 523,150 |
4.74% 7/1/34 (i) | | 198,906 | | 197,588 |
4.741% 3/1/35 (i) | | 94,718 | | 94,718 |
4.823% 12/1/34 (i) | | 184,753 | | 185,403 |
4.847% 12/1/34 (i) | | 67,829 | | 68,031 |
4.898% 10/1/34 (i) | | 142,962 | | 143,698 |
5% 3/1/35 to 8/1/35 | | 20,610,101 | | 20,304,630 |
5% 8/1/35 (f) | | 9,875,320 | | 9,724,104 |
5.123% 2/1/35 (i) | | 544,160 | | 543,205 |
5.137% 5/1/35 (i) | | 93,312 | | 93,440 |
5.204% 6/1/35 (i) | | 321,987 | | 326,202 |
5.366% 12/1/32 (i) | | 91,997 | | 93,032 |
5.5% 11/1/16 to 10/1/34 | | 5,196,795 | | 5,234,994 |
5.5% 8/1/35 (f) | | 18,607,798 | | 18,712,467 |
5.817% 5/1/35 (i) | | 435,730 | | 440,363 |
6% 7/1/08 to 3/1/33 | | 8,513,123 | | 8,757,925 |
U.S. Government Agency - Mortgage Securities - continued |
| Principal Amount | | Value (Note 1) |
Fannie Mae - continued |
6.5% 6/1/09 to 1/1/33 | | $ 2,320,425 | | $ 2,407,535 |
7% 9/1/25 to 8/1/29 | | 301,767 | | 318,457 |
TOTAL FANNIE MAE | | 104,705,984 |
Freddie Mac - 1.0% |
4.106% 12/1/34 (i) | | 65,639 | | 65,241 |
4.13% 12/1/34 (i) | | 109,099 | | 108,600 |
4.223% 1/1/35 (i) | | 280,789 | | 279,777 |
4.287% 1/1/35 (i) | | 255,358 | | 255,371 |
4.3% 5/1/35 (i) | | 168,933 | | 168,068 |
4.311% 12/1/34 (i) | | 94,658 | | 94,086 |
4.312% 3/1/35 (i) | | 90,473 | | 90,187 |
4.368% 3/1/35 (i) | | 123,047 | | 121,663 |
4.4% 2/1/35 (i) | | 170,490 | | 168,625 |
4.404% 2/1/35 (i) | | 191,748 | | 191,238 |
4.446% 3/1/35 (i) | | 73,623 | | 72,777 |
4.449% 2/1/34 (i) | | 100,426 | | 100,004 |
4.49% 3/1/35 (i) | | 242,950 | | 240,824 |
4.497% 6/1/35 (i) | | 98,241 | | 98,169 |
4.498% 3/1/35 (i) | | 610,000 | | 605,997 |
4.504% 3/1/35 (i) | | 98,043 | | 97,078 |
4.565% 2/1/35 (i) | | 141,902 | | 142,091 |
5.036% 4/1/35 (i) | | 525,511 | | 528,708 |
5.223% 8/1/33 (i) | | 40,373 | | 41,246 |
6% 5/1/33 | | 814,667 | | 833,767 |
TOTAL FREDDIE MAC | | 4,303,517 |
Government National Mortgage Association - 0.1% |
7% 7/15/31 to 12/15/32 | | 242,236 | | 255,890 |
TOTAL U.S. GOVERNMENT AGENCY - MORTGAGE SECURITIES (Cost $110,321,879) | 109,265,391 |
Asset-Backed Securities - 3.2% |
|
ACE Securities Corp.: | | | | |
Series 2003-FM1 Class M2, 5.31% 11/25/32 (i) | | 40,000 | | 40,471 |
Series 2004-HE1: | | | | |
Class M1, 3.96% 2/25/34 (i) | | 125,000 | | 125,044 |
Class M2, 4.56% 2/25/34 (i) | | 125,000 | | 125,063 |
Asset-Backed Securities - continued |
| Principal Amount | | Value (Note 1) |
ACE Securities Corp.: - continued | | | | |
Series 2005-SD1 Class A1, 3.86% 11/25/50 (i) | | $ 141,526 | | $ 141,700 |
American Express Credit Account Master Trust Series 2004-C Class C, 3.8881% 2/15/12 (e)(i) | | 1,559,117 | | 1,563,718 |
AmeriCredit Automobile Receivables Trust Series 2004-1 Class D, 5.07% 7/6/10 | | 290,000 | | 289,544 |
Ameriquest Mortgage Securities, Inc. Series 2004-R2: | | | | |
Class M1, 3.89% 4/25/34 (i) | | 65,000 | | 64,997 |
Class M2, 3.94% 4/25/34 (i) | | 50,000 | | 49,998 |
Asset Backed Securities Corp. Home Equity Loan Trust: | | | | |
Series 2003-HE2 Class A2, 3.7681% 4/15/33 (i) | | 7,890 | | 7,894 |
Series 2003-HE7 Class A3, 3.7481% 12/15/33 (i) | | 75,119 | | 75,396 |
Series 2004-HE2 Class M1, 4.01% 4/25/34 (i) | | 375,000 | | 375,666 |
Bank One Issuance Trust: | | | | |
Series 2002-C1 Class C1, 4.3481% 12/15/09 (i) | | 425,000 | | 429,552 |
Series 2004-B2 Class B2, 4.37% 4/15/12 | | 900,000 | | 890,715 |
Capital One Multi-Asset Execution Trust: | | | | |
Series 2003-B1 Class B1, 4.5581% 2/17/09 (i) | | 120,000 | | 120,751 |
Series 2003-B2 Class B2, 3.5% 2/17/09 | | 60,000 | | 59,651 |
Series 2003-B4 Class B4, 4.1881% 7/15/11 (i) | | 90,000 | | 91,451 |
Series 2004-6 Class B, 4.15% 7/16/12 | | 570,000 | | 559,157 |
CDC Mortgage Capital Trust Series 2003-HE2 Class M2, 5.36% 10/25/33 (i) | | 30,000 | | 30,526 |
Chase Credit Card Master Trust Series 2003-6 Class B, 3.7381% 2/15/11 (i) | | 230,000 | | 231,735 |
Chase Credit Card Owner Trust Series 2004-1 Class B, 3.5881% 5/15/09 (i) | | 220,000 | | 219,957 |
Citibank Credit Card Issuance Trust: | | | | |
Series 2000-C2 Class C2, 4.2488% 10/15/07 (i) | | 1,000,000 | | 1,000,649 |
Series 2003-C1 Class C1, 4.65% 4/7/10 (i) | | 305,000 | | 311,297 |
Countrywide Home Loans, Inc.: | | | | |
Series 2004-2 Class M1, 3.96% 5/25/34 (i) | | 275,000 | | 275,355 |
Series 2004-3 Class M1, 3.96% 6/25/34 (i) | | 75,000 | | 75,069 |
Series 2005-1: | | | | |
Class MV1, 3.86% 7/25/35 (i) | | 185,000 | | 184,718 |
Class MV2, 3.9% 7/25/35 (i) | | 220,000 | | 219,366 |
Class MV3, 3.94% 7/25/35 (i) | | 90,000 | | 89,870 |
Crown Castle Towers LLC/Crown Atlantic Holdings Sub LLC/Crown Communication, Inc. Series 2005-1: | | | | |
Class B, 4.878% 6/15/35 (e) | | 309,000 | | 311,474 |
Class C, 5.074% 6/15/35 (e) | | 281,000 | | 282,405 |
First Franklin Mortgage Loan Trust Series 2004-FF2: | | | | |
Class M3, 4.01% 3/25/34 (i) | | 25,000 | | 25,044 |
Asset-Backed Securities - continued |
| Principal Amount | | Value (Note 1) |
First Franklin Mortgage Loan Trust Series 2004-FF2: - continued | | | | |
Class M4, 4.36% 3/25/34 (i) | | $ 25,000 | | $ 25,221 |
Fremont Home Loan Trust Series 2004-A: | | | | |
Class M1, 4.01% 1/25/34 (i) | | 225,000 | | 225,144 |
Class M2, 4.61% 1/25/34 (i) | | 275,000 | | 278,153 |
GSAMP Trust Series 2004-FM2 Class M1, 3.96% 1/25/34 (i) | | 250,000 | | 249,989 |
HFC Home Equity Loan Asset Backed Certificates Series 2005-2: | | | | |
Class M1, 3.97% 1/20/34 (i) | | 185,000 | | 185,000 |
Class M2, 4% 1/20/34 (i) | | 140,000 | | 140,000 |
Home Equity Asset Trust: | | | | |
Series 2003-2: | | | | |
Class A2, 3.84% 8/25/33 (i) | | 2,448 | | 2,457 |
Class M1, 4.34% 8/25/33 (i) | | 25,000 | | 25,271 |
Series 2003-4: | | | | |
Class M1, 4.26% 10/25/33 (i) | | 40,000 | | 40,297 |
Class M2, 5.36% 10/25/33 (i) | | 45,000 | | 45,591 |
Series 2004-3 Class M2, 4.66% 8/25/34 (i) | | 120,000 | | 122,039 |
Long Beach Mortgage Loan Trust Series 2003-3 Class M2, 5.31% 7/25/33 (i) | | 45,000 | | 45,879 |
MBNA Credit Card Master Note Trust: | | | | |
Series 2003-B2 Class B2, 3.7781% 10/15/10 (i) | | 80,000 | | 80,814 |
Series 2003-B3 Class B3, 3.7631% 1/18/11 (i) | | 285,000 | | 286,352 |
Series 2003-B5 Class B5, 3.7581% 2/15/11 (i) | | 240,000 | | 241,854 |
Meritage Mortgage Loan Trust Series 2004-1: | | | | |
Class M1, 3.96% 7/25/34 (i) | | 100,000 | | 99,996 |
Class M2, 4.01% 7/25/34 (i) | | 25,000 | | 24,999 |
Class M3, 4.41% 7/25/34 (i) | | 50,000 | | 49,998 |
Class M4, 4.56% 7/25/34 (i) | | 25,000 | | 24,999 |
Morgan Stanley ABS Capital I, Inc.: | | | | |
Series 2002-HE3 Class M1, 4.56% 12/27/32 (i) | | 90,000 | | 91,161 |
Series 2003-NC8 Class M1, 4.16% 9/25/33 (i) | | 35,000 | | 35,201 |
Morgan Stanley Dean Witter Capital I Trust: | | | | |
Series 2001-NC4 Class M1, 4.46% 1/25/32 (i) | | 39,060 | | 39,202 |
Series 2002-NC1 Class M1, 4.26% 2/25/32 (e)(i) | | 138,907 | | 140,074 |
Series 2002-NC3 Class M1, 4.18% 8/25/32 (i) | | 75,000 | | 75,576 |
Series 2003-NC2 Class M2, 5.46% 2/25/33 (i) | | 40,000 | | 40,634 |
National Collegiate Funding LLC Series 2004-GT1 Class IO1, 7.87% 6/25/10 (e)(i)(l) | | 455,000 | | 153,787 |
National Collegiate Student Loan Trust Series 2005-GT1 Class AIO, 6.75% 12/25/09 (l) | | 250,000 | | 67,324 |
Asset-Backed Securities - continued |
| Principal Amount | | Value (Note 1) |
New Century Home Equity Loan Trust Series 2003-2 Class A2, 3.89% 1/25/33 (i) | | $ 3,422 | | $ 3,423 |
NovaStar Home Equity Loan Series 2004-1: | | | | |
Class M1, 3.91% 6/25/34 (i) | | 75,000 | | 75,063 |
Class M4, 4.435% 6/25/34 (i) | | 125,000 | | 125,213 |
Park Place Securities, Inc. Series 2005-WCH1: | | | | |
Class M2, 3.98% 1/25/35 (i) | | 225,000 | | 224,544 |
Class M4, 4.29% 1/25/35 (i) | | 750,000 | | 750,878 |
Sears Credit Account Master Trust II Series 2002-4 Class A, 3.5181% 8/18/09 (i) | | 100,000 | | 99,999 |
SLM Private Credit Student Loan Trust Series 2004-A Class C, 3.96% 6/15/33 (i) | | 260,000 | | 265,580 |
Volkswagen Auto Lease Trust Series 2005-A Class A4, 3.94% 10/20/10 | | 970,000 | | 959,829 |
WFS Financial Owner Trust Series 2004-3 Class D, 4.07% 2/17/12 | | 284,404 | | 282,142 |
TOTAL ASSET-BACKED SECURITIES (Cost $13,893,498) | 13,891,916 |
Collateralized Mortgage Obligations - 3.6% |
|
Private Sponsor - 3.3% |
Adjustable Rate Mortgage Trust floater: | | | | |
Series 2005-1 Class 5A2, 3.79% 5/25/35 (i) | | 333,915 | | 334,126 |
Series 2005-2 Class 6A2, 3.74% 6/25/35 (i) | | 161,688 | | 161,793 |
Bank of America Mortgage Securities, Inc.: | | | | |
Series 2003-K: | | | | |
Class 1A1, 3.3521% 12/25/33 (i) | | 168,036 | | 166,513 |
Class 2A1, 4.1867% 12/25/33 (i) | | 298,300 | | 294,569 |
Series 2004-B: | | | | |
Class 1A1, 3.4262% 3/25/34 (i) | | 664,848 | | 656,626 |
Class 2A2, 4.1351% 3/25/34 (i) | | 204,630 | | 200,155 |
Series 2004-C Class 1A1, 3.3726% 4/25/34 (i) | | 383,241 | | 378,537 |
Series 2004-D: | | | | |
Class 1A1, 3.5597% 5/25/34 (i) | | 448,999 | | 444,076 |
Class 2A2, 4.2101% 5/25/34 (i) | | 585,166 | | 576,845 |
Series 2004-G Class 2A7, 4.6058% 8/25/34 (i) | | 621,572 | | 619,487 |
Series 2004-H Class 2A1, 4.5133% 9/25/34 (i) | | 552,389 | | 547,078 |
Bear Stearns Alt-A Trust floater Series 2005-1 Class A1, 3.74% 1/25/35 (i) | | 645,482 | | 645,482 |
CS First Boston Mortgage Securities Corp. floater: | | | | |
Series 2004-AR3 Class 6A2, 3.83% 4/25/34 (i) | | 115,778 | | 115,881 |
Collateralized Mortgage Obligations - continued |
| Principal Amount | | Value (Note 1) |
Private Sponsor - continued |
CS First Boston Mortgage Securities Corp. floater: - continued | | | | |
Series 2004-AR6 Class 9A2, 3.83% 10/25/34 (i) | | $ 213,174 | | $ 213,302 |
Granite Mortgages PLC floater Series 2004-2 Class 1C, 4.13% 6/20/44 (i) | | 194,632 | | 195,032 |
Lehman Structured Securities Corp. floater Series 2005-1 Class A2, 3.67% 9/26/45 (e)(i) | | 743,244 | | 743,244 |
Master Alternative Loan Trust Series 2004-3 Class 3A1, 6% 4/25/34 | | 76,015 | | 76,870 |
Master Asset Securitization Trust Series 2004-9 Class 7A1, 6.3188% 5/25/17 (i) | | 481,596 | | 486,800 |
Master Seasoned Securitization Trust Series 2004-1 Class 1A1, 6.2437% 8/25/17 (i) | | 371,110 | | 379,522 |
Merrill Lynch Mortgage Investors, Inc.: | | | | |
floater Series 2005-B Class A2, 3.75% 6/25/30 (i) | | 629,385 | | 629,385 |
Series 2003-E Class XA1, 1% 10/25/28 (i)(l) | | 1,302,816 | | 15,846 |
Series 2003-G Class XA1, 1% 1/25/29 (l) | | 1,833,562 | | 23,767 |
Series 2003-H Class XA1, 1% 1/25/29 (e)(l) | | 1,474,148 | | 19,285 |
Opteum Mortgage Acceptance Corp. floater Series 2005-3 Class APT, 3.75% 6/25/35 (i) | | 367,832 | | 368,047 |
Residential Asset Mortgage Products, Inc. sequential pay: | | | | |
Series 2003-SL1 Class A31, 7.125% 4/25/31 | | 518,998 | | 528,368 |
Series 2004-SL2 Class A1, 6.5% 10/25/16 | | 71,407 | | 72,543 |
Residential Finance LP/Residential Finance Development Corp. floater: | | | | |
Series 2003-CB1: | | | | |
Class B3, 4.8% 6/10/35 (e)(i) | | 43,397 | | 44,156 |
Class B4, 5% 6/10/35 (e)(i) | | 38,575 | | 39,298 |
Class B5, 5.6% 6/10/35 (e)(i) | | 28,931 | | 29,546 |
Class B6, 6.1% 6/10/35 (e)(i) | | 14,466 | | 14,773 |
Series 2004-B: | | | | |
Class B4, 4.45% 2/10/36 (e)(i) | | 98,295 | | 99,770 |
Class B5, 4.9% 2/10/36 (e)(i) | | 98,295 | | 100,015 |
Class B6, 5.35% 2/10/36 (e)(i) | | 98,295 | | 100,138 |
Series 2004-C: | | | | |
Class B4, 4.3% 9/10/36 (i) | | 98,887 | | 100,123 |
Class B5, 4.7% 9/10/36 (i) | | 98,887 | | 100,000 |
Class B6, 5.1% 9/10/36 (i) | | 98,887 | | 100,370 |
Sequoia Mortgage Funding Trust Series 2003-A Class AX1, 0.8% 10/21/08 (e)(l) | | 3,273,870 | | 24,731 |
Sequoia Mortgage Trust floater Series 2005-2 Class A2, 3.36% 3/20/35 (i) | | 549,984 | | 549,984 |
Collateralized Mortgage Obligations - continued |
| Principal Amount | | Value (Note 1) |
Private Sponsor - continued |
Structured Adjustable Rate Mortgage Loan Trust floater Series 2001-14 Class A1, 3.77% 7/25/35 (i) | | $ 1,163,940 | | $ 1,163,940 |
Washington Mutual Mortgage Securities Corp. sequential pay: | | | | |
Series 2003-MS9 Class 2A1, 7.5% 12/25/33 | | 59,087 | | 61,232 |
Series 2004-RA2 Class 2A, 7% 7/25/33 | | 121,414 | | 124,065 |
Wells Fargo Mortgage Backed Securities Trust: | | | | |
Series 2004-T Class A1, 3.4526% 9/25/34 (i) | | 581,105 | | 578,530 |
Series 2005-AR10 Class 2A2, 4.111% 6/25/35 (i) | | 952,333 | | 939,034 |
Series 2005-AR12 Class 2A6, 4.322% 7/25/35 (i) | | 906,327 | | 894,687 |
Series 2005-AR9 Class 2A1, 4.3621% 5/25/35 (i) | | 395,715 | | 392,917 |
TOTAL PRIVATE SPONSOR | | 14,350,488 |
U.S. Government Agency - 0.3% |
Fannie Mae guaranteed REMIC pass thru certificates planned amortization class Series 2004-81 Class KD, 4.5% 4/25/17 | | 1,050,000 | | 1,036,840 |
Freddie Mac Multi-class participation certificates guaranteed sequential pay Series 2750 Class ZT, 5% 2/15/34 | | 391,734 | | 359,862 |
Ginnie Mae guaranteed Multi-family pass thru securities sequential pay Series 2002-35 Class C, 5.8918% 10/16/23 (i) | | 25,000 | | 25,921 |
Ginnie Mae guaranteed REMIC pass thru securities planned amortization class Series 2003-75 Class LI, 5.5% 10/20/21 (l) | | 503,202 | | 230 |
TOTAL U.S. GOVERNMENT AGENCY | | 1,422,853 |
TOTAL COLLATERALIZED MORTGAGE OBLIGATIONS (Cost $15,858,005) | 15,773,341 |
Commercial Mortgage Securities - 2.5% |
|
Banc of America Large Loan, Inc. floater: | | | | |
Series 2003-BBA2: | | | | |
Class C, 3.8581% 11/15/15 (e)(i) | | 50,000 | | 50,183 |
Class D, 3.9381% 11/15/15 (e)(i) | | 80,000 | | 80,456 |
Class F, 4.2881% 11/15/15 (e)(i) | | 60,000 | | 60,421 |
Class H, 4.7881% 11/15/15 (e)(i) | | 50,000 | | 50,297 |
Class J, 5.3381% 11/15/15 (e)(i) | | 55,000 | | 55,330 |
Class K, 5.82% 11/15/15 (e)(i) | | 50,000 | | 49,684 |
Commercial Mortgage Securities - continued |
| Principal Amount | | Value (Note 1) |
Banc of America Large Loan, Inc. floater: - continued | | | | |
Series 2005-BOCA: | | | | |
Class D, 3.7181% 12/15/16 (e)(i) | | $ 110,000 | | $ 110,055 |
Class E, 3.8081% 12/15/16 (e)(i) | | 100,000 | | 100,077 |
Class F, 3.8881% 12/15/16 (e)(i) | | 110,000 | | 110,100 |
Class H, 4.3381% 12/15/16 (e)(i) | | 120,000 | | 119,816 |
Class K, 4.7381% 12/15/16 (e)(i) | | 105,000 | | 104,868 |
Bayview Commercial Asset Trust: | | | | |
floater: | | | | |
Series 2004-1 Class A, 3.82% 4/25/34 (e)(i) | | 332,648 | | 333,233 |
Series 2004-2 Class A, 3.89% 8/25/34 (e)(i) | | 357,944 | | 359,705 |
Series 2004-3: | | | | |
Class A1, 3.83% 1/25/35 (e)(i) | | 333,894 | | 335,063 |
Class A2, 3.88% 1/25/35 (e)(i) | | 47,699 | | 47,867 |
Class M1, 3.96% 1/25/35 (e)(i) | | 47,699 | | 47,764 |
Class M2, 4.46% 1/25/35 (e)(i) | | 47,699 | | 47,983 |
Series 2004-1 Class IO, 1.25% 4/25/34 (e)(l) | | 3,635,356 | | 213,130 |
Bear Stearns Commercial Mortgage Securities, Inc.: | | | | |
sequential pay Series 2004-ESA Class A3, 4.741% 5/14/16 (e) | | 180,000 | | 180,489 |
Series 2004-ESA: | | | | |
Class B, 4.888% 5/14/16 (e) | | 325,000 | | 327,429 |
Class C, 4.937% 5/14/16 (e) | | 205,000 | | 206,951 |
Class D, 4.986% 5/14/16 (e) | | 75,000 | | 75,483 |
Class E, 5.064% 5/14/16 (e) | | 230,000 | | 231,631 |
Class F, 5.182% 5/14/16 (e) | | 55,000 | | 55,483 |
COMM floater Series 2002-FL7 Class D, 3.9581% 11/15/14 (e)(i) | | 125,000 | | 125,054 |
Commercial Mortgage pass thru certificates floater Series 2004-CNL: | | | | |
Class B, 3.7881% 9/15/14 (e)(i) | | 105,000 | | 105,042 |
Class D, 4.0281% 9/15/14 (e)(i) | | 30,000 | | 30,009 |
Class E, 4.0881% 9/15/14 (e)(i) | | 45,000 | | 45,033 |
Class F, 4.1881% 9/15/14 (e)(i) | | 35,000 | | 35,020 |
Class G, 4.3681% 9/15/14 (e)(i) | | 80,000 | | 80,032 |
Class H, 4.4681% 9/15/14 (e)(i) | | 85,000 | | 85,034 |
Class J, 4.9881% 9/15/14 (e)(i) | | 30,000 | | 30,095 |
Class K, 5.3881% 9/15/14 (e)(i) | | 45,000 | | 45,093 |
Class L, 5.5881% 9/15/14 (e)(i) | | 35,000 | | 34,983 |
CS First Boston Mortgage Securities Corp.: | | | | |
sequential pay: | | | | |
Series 1997-C2 Class A2, 6.52% 1/17/35 | | 30,736 | | 30,982 |
Series 2004-C1 Class A4, 4.75% 1/15/37 | | 695,000 | | 686,789 |
Commercial Mortgage Securities - continued |
| Principal Amount | | Value (Note 1) |
CS First Boston Mortgage Securities Corp.: - continued | | | | |
Series 2003-TFLA Class G, 3.7357% 4/15/13 (e)(i) | | $ 22,400 | | $ 22,331 |
Fannie Mae sequential pay Series 1999-10 Class MZ, 6.5% 9/17/38 | | 757,908 | | 818,204 |
Ginnie Mae guaranteed REMIC pass thru securities: | | | | |
sequential pay: | | | | |
Series 2003-22 Class B, 3.963% 5/16/32 | | 60,000 | | 57,909 |
Series 2003-36 Class C, 4.254% 2/16/31 | | 55,000 | | 53,609 |
Series 2003-47 Class C, 4.227% 10/16/27 | | 105,000 | | 103,082 |
Series 2003-59 Class D, 3.654% 10/16/27 | | 115,000 | | 108,543 |
Series 2003-47 Class XA, 0.1927% 6/16/43 (i)(l) | | 5,638,415 | | 265,400 |
GS Mortgage Securities Corp. II sequential pay: | | | | |
Series 2001-LIBA Class A2, 6.615% 2/14/16 (e) | | 385,000 | | 420,722 |
Series 2003-C1 Class A2A, 3.59% 1/10/40 | | 65,000 | | 63,719 |
Hilton Hotel Pool Trust Series 2000-HLTA Class D, 7.555% 10/3/15 (e) | | 370,000 | | 403,297 |
Host Marriot Pool Trust sequential pay Series 1999-HMTA Class D, 7.97% 8/3/15 (e) | | 110,000 | | 119,163 |
Leafs CMBS I Ltd./Leafs CMBS I Corp. Series 2002-1A Class C, 4.13% 11/20/37 (e) | | 200,000 | | 180,420 |
Morgan Stanley Capital I, Inc. Series 2005-IQ9 Class X2, 1.2036% 7/15/56 (e)(i)(l) | | 3,920,000 | | 199,369 |
Mortgage Capital Funding, Inc. sequential pay Series 1998-MC2 Class A2, 6.423% 6/18/30 | | 319,331 | | 332,253 |
Trizechahn Office Properties Trust Series 2001-TZHA: | | | | |
Class C3, 6.522% 3/15/13 (e) | | 25,000 | | 25,720 |
Class C4, 6.893% 5/15/16 (e) | | 500,000 | | 547,173 |
Class E3, 7.253% 3/15/13 (e) | | 235,000 | | 243,947 |
Wachovia Bank Commercial Mortgage Trust: | | | | |
sequential pay Series 2003-C8 Class A3, 4.445% 11/15/35 | | 785,000 | | 773,341 |
Series 2004-C15: | | | | |
Class 180A, 5.5782% 10/15/41 (e)(i) | | 1,000,000 | | 984,198 |
Class 180B, 5.5782% 10/15/41 (e)(i) | | 500,000 | | 492,099 |
TOTAL COMMERCIAL MORTGAGE SECURITIES (Cost $11,297,120) | 10,901,163 |
Foreign Government and Government Agency Obligations - 2.5% |
|
Argentine Republic: | | | | |
3% 4/30/13 (i) | | 90,000 | | 73,224 |
3.01% 8/3/12 (i) | | 400,000 | | 312,600 |
Foreign Government and Government Agency
Obligations - continued |
| Principal Amount | | Value (Note 1) |
Argentine Republic: - continued | | | | |
discount 8.28% (with partial capitalization through 12/31/2013) 12/31/33 unit (j) | | $ 215,346 | | $ 208,024 |
par 1.33% 12/31/38 unit (d)(j) | | 50,116 | | 17,942 |
Brazilian Federative Republic: | | | | |
Brady: | | | | |
debt conversion bond 4.3125% 4/15/12 (i) | | 131,766 | | 127,484 |
par Z-L 6% 4/15/24 | | 265,000 | | 251,088 |
8% 1/15/18 | | 514,000 | | 521,068 |
10.5% 7/14/14 | | 125,000 | | 145,250 |
11% 1/11/12 | | 60,000 | | 70,800 |
11% 8/17/40 | | 470,000 | | 552,250 |
12.25% 3/6/30 | | 105,000 | | 137,025 |
12.75% 1/15/20 | | 75,000 | | 99,675 |
14.5% 10/15/09 | | 75,000 | | 96,488 |
Central Bank of Nigeria promissory note 5.092% 1/5/10 | | 113,447 | | 108,728 |
Chilean Republic 7.125% 1/11/12 | | 1,250,000 | | 1,406,625 |
Colombian Republic: | | | | |
10.75% 1/15/13 | | 150,000 | | 179,250 |
11.75% 2/25/20 | | 80,000 | | 103,600 |
Dominican Republic: | | | | |
Brady 3.9425% 8/30/09 (i) | | 116,248 | | 112,761 |
4.375% 8/30/24 (i) | | 250,000 | | 231,250 |
Ecuador Republic: | | | | |
8% 8/15/30 (Reg. S) (d) | | 45,000 | | 38,700 |
12% 11/15/12 (Reg. S) | | 45,000 | | 44,213 |
euro par 5% 2/28/25 | | 15,000 | | 10,875 |
Indonesian Republic 7.25% 4/20/15 (e) | | 30,000 | | 30,300 |
Israeli State 4.625% 6/15/13 | | 20,000 | | 19,363 |
Korean Republic 4.875% 9/22/14 | | 195,000 | | 193,585 |
Lebanese Republic: | | | | |
6.77% 11/30/09 (e)(i) | | 70,000 | | 70,175 |
6.77% 11/30/09 (i) | | 235,000 | | 235,588 |
Panamanian Republic Brady discount 4.6875% 7/17/26 (i) | | 25,000 | | 23,375 |
Peruvian Republic: | | | | |
7.35% 7/21/25 | | 100,000 | | 99,750 |
9.125% 2/21/12 | | 75,000 | | 88,688 |
9.875% 2/6/15 | | 45,000 | | 55,800 |
Foreign Government and Government Agency
Obligations - continued |
| Principal Amount | | Value (Note 1) |
Philippine Republic: | | | | |
Brady principal collateralized interest reduction bond 6.5% 12/1/17 | | $ 120,000 | | $ 119,400 |
8.375% 2/15/11 | | 360,000 | | 370,350 |
9% 2/15/13 | | 100,000 | | 105,000 |
9.875% 1/15/19 | | 90,000 | | 96,863 |
10.625% 3/16/25 | | 95,000 | | 105,213 |
Republic of Serbia 3.75% 11/1/24 (d)(e) | | 50,000 | | 43,063 |
Russian Federation: | | | | |
5% 3/31/30 (Reg. S) (d) | | 762,000 | | 845,344 |
11% 7/24/18 (Reg. S) | | 35,000 | | 51,888 |
12.75% 6/24/28 (Reg. S) | | 120,000 | | 215,850 |
euro 10% 6/26/07 | | 60,000 | | 65,550 |
Turkish Republic: | | | | |
11% 1/14/13 | | 230,000 | | 290,375 |
11.5% 1/23/12 | | 25,000 | | 31,688 |
11.75% 6/15/10 | | 305,000 | | 378,200 |
11.875% 1/15/30 | | 100,000 | | 142,500 |
Ukraine Government: | | | | |
6.365% 8/5/09 (i) | | 200,000 | | 216,800 |
7.65% 6/11/13 (Reg. S) | | 100,000 | | 110,000 |
United Mexican States: | | | | |
4.625% 10/8/08 | | 70,000 | | 69,615 |
5.875% 1/15/14 | | 85,000 | | 86,998 |
6.75% 9/27/34 | | 170,000 | | 179,180 |
7.5% 1/14/12 | | 100,000 | | 111,700 |
Uruguay Republic 7.25% 2/15/11 | | 60,000 | | 61,200 |
Venezuelan Republic: | | | | |
Discount A, 4.25% 3/31/20 (i) | | 250,000 | | 246,875 |
4.64% 4/20/11 (i) | | 80,000 | | 74,200 |
5.375% 8/7/10 | | 105,000 | | 98,490 |
9.25% 9/15/27 | | 90,000 | | 93,825 |
10.75% 9/19/13 | | 240,000 | | 279,120 |
13.625% 8/15/18 | | 93,000 | | 125,085 |
euro Brady par W-B 6.75% 3/31/20 | | 250,000 | | 250,000 |
Vietnamese Socialist Republic Brady par 3.75% 3/12/28 (d) | | 90,000 | | 67,275 |
TOTAL FOREIGN GOVERNMENT AND GOVERNMENT AGENCY OBLIGATIONS (Cost $9,844,940) | 10,597,191 |
Common Stocks - 0.0% |
| | Shares | | Value (Note 1) |
CONSUMER STAPLES - 0.0% |
Personal Products - 0.0% |
Revlon, Inc. Class A (sub. vtg.) (a) | | 18,648 | | $ 69,744 |
TOTAL COMMON STOCKS (Cost $36,503) | | 69,744 |
Sovereign Loan Participations - 0.0% |
| Principal Amount | | |
Indonesian Republic loan participation: | | | | |
- Credit Suisse First Boston 4.375% 3/28/13 (i) | | $ 117,509 | | 109,871 |
- Deutsche Bank 4.375% 3/28/13 (i) | | 13,831 | | 12,932 |
TOTAL SOVEREIGN LOAN PARTICIPATIONS (Cost $113,638) | 122,803 |
Fixed-Income Funds - 12.5% |
| | Shares | | |
Fidelity Ultra-Short Central Fund (k)
(Cost $53,999,944) | | 542,844 | | 54,002,121 |
Cash Equivalents - 6.9% |
| | Maturity Amount | | |
Investments in repurchase agreements (Collateralized by U.S. Government Obligations, in a joint trading account at 3.32%, dated 7/29/05 due 8/1/05)
(Cost $29,592,000) | | $ 29,600,176 | | 29,592,000 |
TOTAL INVESTMENT PORTFOLIO - 108.7% (Cost $468,907,002) | | | 469,355,908 |
NET OTHER ASSETS - (8.7)% | | | (37,597,242) |
NET ASSETS - 100% | | $ 431,758,666 |
Swap Agreements |
| Expiration Date | | Notional Amount | | Value |
Credit Default Swap |
Receive quarterly a fixed rate of .4% multiplied by the notional amount and pay to Merrill Lynch, Inc., upon each default event of one of the issues of Dow Jones CDX N.A. Investment Grade 4, par value of the proportional notional amount (h) | June 2010 | | $ 4,500,000 | | $ (18,576) |
Receive quarterly a fixed rate of .5% multiplied by the notional amount and pay to Merrill Lynch, Inc., upon each default event of one of the issues of Dow Jones CDX N.A. Investment Grade 3, par value of the proportional notional amount (g) | March 2010 | | 1,250,000 | | 951 |
Receive quarterly a fixed rate of .65% multiplied by the notional amount and pay to Merrill Lynch, Inc., upon each default event of one of the issues of Dow Jones CDX N.A. Investment Grade 4, par value of the proportional notional amount (h) | June 2015 | | 12,500,000 | | (85,880) |
Receive quarterly a fixed rate of .7% multiplied by the notional amount and pay to Deutsche Bank, upon each default event of one of the issues of Dow Jones CDX N.A. Investment Grade 3, par value of the proportional notional amount (g) | March 2015 | | 1,250,000 | | (2,759) |
Receive quarterly notional amount multiplied by .35% and pay Goldman Sachs upon default event of Southern California Edison Co., par value of the notional amount of Southern California Edison Co. 7.625% 1/15/10 | Sept. 2010 | | 400,000 | | (157) |
Receive quarterly notional amount multiplied by .42% and pay Morgan Stanley, Inc. upon default event of Sempra Energy, par value of the notional amount of Sempra Energy 6% 2/1/13 | Sept. 2010 | | 600,000 | | 98 |
Receive quarterly notional amount multiplied by .48% and pay JPMorgan Chase, Inc. upon default event of Fannie Mae, par value of the notional amount of Fannie Mae 4.625% 5/1/13 | June 2010 | | 1,000,000 | | 9,039 |
TOTAL CREDIT DEFAULT SWAP | 21,500,000 | | (97,284) |
Swap Agreements - continued |
| Expiration Date | | Notional Amount | | Value |
Interest Rate Swap |
Receive quarterly a fixed rate equal to 4.3875% and pay quarterly a floating rate based on 3-month LIBOR with Credit Suisse First Boston | March 2010 | | $ 1,250,000 | | $ (4,655) |
Receive quarterly a fixed rate equal to 4.774% and pay quarterly a floating rate based on 3-month LIBOR with Credit Suisse First Boston | March 2015 | | 1,250,000 | | 11,777 |
Receive quarterly a fixed rate equal to 4.898% and pay quarterly a floating rate based on 3-month LIBOR with Lehman Brothers, Inc. | July 2014 | | 1,135,000 | | 19,725 |
TOTAL INTEREST RATE SWAP | 3,635,000 | | 26,847 |
Total Return Swap |
Receive monthly a return equal to Banc of America Securities LLC AAA 10 Yr Commercial Mortgage Backed Securities Daily Index and pay monthly a floating rate based on 1-month LIBOR minus 40 basis points with Bank of America | March 2006 | | 1,000,000 | | (16,398) |
Receive monthly a return equal to Lehman Brothers CMBS AAA 8.5+ Index and pay monthly a floating rate based on 1-month LIBOR minus 20 basis points with Citibank | Oct. 2005 | | 1,000,000 | | (24,809) |
Receive monthly a return equal to Lehman Brothers CMBS U.S. Aggregate Index and pay monthly a floating rate based on 1-month LIBOR minus 10 basis points with Citibank | Oct. 2005 | | 355,000 | | (5,703) |
Receive monthly a return equal to Lehman Brothers CMBS U.S. Aggregate Index and pay monthly a floating rate based on 1-month LIBOR minus 20 basis points with Lehman Brothers, Inc. | March 2006 | | 145,000 | | (2,279) |
Receive monthly a return equal to Lehman Brothers Commercial Mortgage Backed Securities AAA Daily Index and pay monthly a floating rate based on 1-month LIBOR minus 25 basis points with Bank of America | Dec. 2005 | | 600,000 | | (9,628) |
Swap Agreements - continued |
| Expiration Date | | Notional Amount | | Value |
Total Return Swap - continued |
Receive monthly a return equal to Banc of America Securities LLC AAA 10yr Commercial Mortgage Backed Securities Daily Index and pay monthly a floating rate based on 1-month LIBOR minus 20 basis points with Bank of America | July 2006 | | $ 1,000,000 | | $ (8,117) |
Receive quarterly a return equal to Banc of America Securities LLC AAA 10 Yr Commercial Mortgage Backed Securities Daily Index and pay quarterly a floating rate based on 3-month LIBOR minus 40 basis points with Bank of America | Nov. 2005 | | 2,000,000 | | (7,836) |
TOTAL TOTAL RETURN SWAP | 6,100,000 | | (74,770) |
| | $ 31,235,000 | | $ (145,207) |
Legend |
(a) Non-income producing |
(b) Non-income producing - issuer filed for bankruptcy or is in default of interest payments. |
(c) Debt obligation initially issued in zero coupon form which converts to coupon form at a specified rate and date. The rate shown is the rate at period end. |
(d) Debt obligation initially issued at one coupon which converts to a higher coupon at a specified date. The rate shown is the rate at period end. |
(e) Security exempt from registration under Rule 144A of the Securities Act of 1933. These securities may be resold in transactions exempt from registration, normally to qualified institutional buyers. At the period end, the value of these securities amounted to $28,129,389 or 6.5% of net assets. |
(f) Security or a portion of the security purchased on a delayed delivery or when-issued basis. |
(g) Dow Jones CDX N.A. Investment Grade 3 is a tradable index of credit default swaps on investment grade debt of U.S. companies. |
(h) Dow Jones CDX N.A. Investment Grade 4 is a tradable index of credit default swaps on investment grade debt of U.S. companies. |
(i) The coupon rate shown on floating or adjustable rate securities represents the rate at period end. |
(j) Includes attached Argentine Republic Gross Domestic Product-Linked Securities, expiring 12/15/35. |
(k) Affiliated fund that is available only to investment companies and other accounts managed by Fidelity Investments. A complete listing of the fixed-income central fund's holdings is provided at the end of this report. |
(l) Security represents right to receive monthly interest payments on an underlying pool of mortgages. Principal shown is the par amount of the mortgage pool. |
See accompanying notes which are an integral part of the financial statements.
Annual Report
Financial Statements
Statement of Assets and Liabilities
| July 31, 2005 |
| | |
Assets | | |
Investment in securities, at value (including repurchase agreements of $29,592,000) (cost $468,907,002) - See accompanying schedule | | $ 469,355,908 |
Cash | | 764 |
Receivable for investments sold | | 960,923 |
Receivable for fund shares sold | | 1,454,556 |
Interest receivable | | 3,810,371 |
Other receivables | | 58,931 |
Total assets | | 475,641,453 |
| | |
Liabilities | | |
Payable for investments purchased
Regular delivery | $ 1,339,322 | |
Delayed delivery | 41,984,448 | |
Payable for fund shares redeemed | 121,900 | |
Distributions payable | 60,328 | |
Swap agreements, at value | 145,207 | |
Accrued management fee | 115,609 | |
Distribution fees payable | 3,606 | |
Other affiliated payables | 75,644 | |
Other payables and accrued expenses | 36,723 | |
Total liabilities | | 43,882,787 |
| | |
Net Assets | | $ 431,758,666 |
Net Assets consist of: | | |
Paid in capital | | $ 428,201,146 |
Undistributed net investment income | | 539,146 |
Accumulated undistributed net realized gain (loss) on investments | | 2,397,425 |
Net unrealized appreciation (depreciation) on investments | | 620,949 |
Net Assets | | $ 431,758,666 |
See accompanying notes which are an integral part of the financial statements.
Annual Report
Statement of Assets and Liabilities - continued
| July 31, 2005 |
| | |
Calculation of Maximum Offering Price Class A:
Net Asset Value and redemption price per share ($2,974,166 ÷ 281,429 shares) | | $ 10.57 |
| | |
Maximum offering price per share (100/95.25 of $10.57) | | $ 11.10 |
Class T:
Net Asset Value and redemption price per share ($5,738,901 ÷ 543,558 shares) | | $ 10.56 |
| | |
Maximum offering price per share (100/96.50 of $10.56) | | $ 10.94 |
Class B:
Net Asset Value and offering price per share ($2,029,025 ÷ 191,971 shares)A | | $ 10.57 |
| | |
Class C:
Net Asset Value and offering price per share ($677,191 ÷ 64,087 shares)A | | $ 10.57 |
| | |
Total Bond:
Net Asset Value, offering price and redemption price per share ($420,225,271 ÷ 39,761,938 shares) | | $ 10.57 |
| | |
Institutional Class:
Net Asset Value, offering price and redemption price per share ($114,112 ÷ 10,800 shares) | | $ 10.57 |
A Redemption price per share is equal to net asset value less any applicable contingent deferred sales charge.
See accompanying notes which are an integral part of the financial statements.
Annual Report
Financial Statements - continued
Statement of Operations
| Year ended July 31, 2005 |
| | |
Investment Income | | |
Interest | | $ 17,207,680 |
| | |
Expenses | | |
Management fee | $ 1,558,348 | |
Transfer agent fees | 605,385 | |
Distribution fees | 21,368 | |
Accounting fees and expenses | 141,817 | |
Fund wide operations fee | 18,469 | |
Independent trustees' compensation | 1,960 | |
Custodian fees and expenses | 10,598 | |
Registration fees | 75,839 | |
Audit | 44,183 | |
Legal | 2,958 | |
Miscellaneous | 2,731 | |
Total expenses before reductions | 2,483,656 | |
Expense reductions | (119,592) | 2,364,064 |
Net investment income | | 14,843,616 |
Realized and Unrealized Gain (Loss) Net realized gain (loss) on: | | |
Investment securities | 3,976,436 | |
Swap agreements | 452,719 | |
Total net realized gain (loss) | | 4,429,155 |
Change in net unrealized appreciation (depreciation) on: Investment securities | 1,793,084 | |
Swap agreements | 72,263 | |
Total change in net unrealized appreciation (depreciation) | | 1,865,347 |
Net gain (loss) | | 6,294,502 |
Net increase (decrease) in net assets resulting from operations | | $ 21,138,118 |
See accompanying notes which are an integral part of the financial statements.
Annual Report
Financial Statements - continued
Statement of Changes in Net Assets
| Year ended
July 31,
2005 | Year ended
July 31,
2004 |
Increase (Decrease) in Net Assets | | |
Operations | | |
Net investment income | $ 14,843,616 | $ 8,771,927 |
Net realized gain (loss) | 4,429,155 | 937,699 |
Change in net unrealized appreciation (depreciation) | 1,865,347 | 707,007 |
Net increase (decrease) in net assets resulting
from operations | 21,138,118 | 10,416,633 |
Distributions to shareholders from net investment income | (14,221,483) | (8,644,971) |
Distributions to shareholders from net realized gain | (3,063,178) | (461,703) |
Total distributions | (17,284,661) | (9,106,674) |
Share transactions - net increase (decrease) | 53,654,454 | 292,125,223 |
Total increase (decrease) in net assets | 57,507,911 | 293,435,182 |
| | |
Net Assets | | |
Beginning of period | 374,250,755 | 80,815,573 |
End of period (including undistributed net investment income of $539,146 and undistributed net investment income of $79,241, respectively) | $ 431,758,666 | $ 374,250,755 |
See accompanying notes which are an integral part of the financial statements.
Annual Report
Financial Highlights - Class A
Years ended July 31, | 2005 | 2004F |
Selected Per-Share Data | | |
Net asset value, beginning of period | $ 10.46 | $ 10.31 |
Income from Investment Operations | | |
Net investment incomeE | .387 | .046 |
Net realized and unrealized gain (loss) | .183 | .145 |
Total from investment operations | .570 | .191 |
Distributions from net investment income | (.370) | (.041) |
Distributions from net realized gain | (.090) | - |
Total distributions | (.460) | (.041) |
Net asset value, end of period | $ 10.57 | $ 10.46 |
Total ReturnB,C,D | 5.52% | 1.85% |
Ratios to Average Net AssetsG | | |
Expenses before expense reductions | .96% | .87%A |
Expenses net of voluntary waivers, if any | .80% | .80%A |
Expenses net of all reductions | .80% | .80%A |
Net investment income | 3.69% | 3.51%A |
Supplemental Data | | |
Net assets, end of period (000 omitted) | $ 2,974 | $ 102 |
Portfolio turnover rate | 193% | 251% |
A Annualized
B Total returns for periods of less than one year are not annualized.
C Total returns would have been lower had certain expenses not been reduced during the periods shown.
D Total returns do not include the effect of the sales charges.
E Calculated based on average shares outstanding during the period.
F For the period June 16, 2004 (commencement of sale of shares) to July 31, 2004.
G Expense ratios reflect operating expenses of the class. Expenses before reductions do not reflect amounts reimbursed by the investment adviser or reductions from brokerage service arrangements or other expense offset arrangements and do not represent the amount paid by the class during periods when reimbursements or reductions occur. Expense ratios before reductions for start-up periods may not be representative of longer-term operating periods. Expenses net of any voluntary waivers reflect expenses after reimbursement by the investment adviser but prior to reductions from brokerage service arrangements or other expense offset arrangements. Expenses net of all reductions represent the net expenses paid by the class.
See accompanying notes which are an integral part of the financial statements.
Annual Report
Financial Highlights - Class T
Years ended July 31, | 2005 | 2004F |
Selected Per-Share Data | | |
Net asset value, beginning of period | $ 10.46 | $ 10.31 |
Income from Investment Operations | | |
Net investment incomeE | .377 | .045 |
Net realized and unrealized gain (loss) | .173 | .144 |
Total from investment operations | .550 | .189 |
Distributions from net investment income | (.360) | (.039) |
Distributions from net realized gain | (.090) | - |
Total distributions | (.450) | (.039) |
Net asset value, end of period | $ 10.56 | $ 10.46 |
Total ReturnB,C,D | 5.33% | 1.84% |
Ratios to Average Net AssetsG | | |
Expenses before expense reductions | 1.13% | .96%A |
Expenses net of voluntary waivers, if any | .90% | .90%A |
Expenses net of all reductions | .90% | .90%A |
Net investment income | 3.59% | 3.41%A |
Supplemental Data | | |
Net assets, end of period (000 omitted) | $ 5,739 | $ 102 |
Portfolio turnover rate | 193% | 251% |
A Annualized
B Total returns for periods of less than one year are not annualized.
C Total returns would have been lower had certain expenses not been reduced during the periods shown.
D Total returns do not include the effect of the sales charges.
E Calculated based on average shares outstanding during the period.
F For the period June 16, 2004 (commencement of sale of shares) to July 31, 2004.
G Expense ratios reflect operating expenses of the class. Expenses before reductions do not reflect amounts reimbursed by the investment adviser or reductions from brokerage service arrangements or other expense offset arrangements and do not represent the amount paid by the class during periods when reimbursements or reductions occur. Expense ratios before reductions for start-up periods may not be representative of longer-term operating periods. Expenses net of any voluntary waivers reflect expenses after reimbursement by the investment adviser but prior to reductions from brokerage service arrangements or other expense offset arrangements. Expenses net of all reductions represent the net expenses paid by the class.
See accompanying notes which are an integral part of the financial statements.
Annual Report
Financial Highlights - Class B
Years ended July 31, | 2005 | 2004F |
Selected Per-Share Data | | |
Net asset value, beginning of period | $ 10.46 | $ 10.31 |
Income from Investment Operations | | |
Net investment incomeE | .309 | .036 |
Net realized and unrealized gain (loss) | .182 | .145 |
Total from investment operations | .491 | .181 |
Distributions from net investment income | (.291) | (.031) |
Distributions from net realized gain | (.090) | - |
Total distributions | (.381) | (.031) |
Net asset value, end of period | $ 10.57 | $ 10.46 |
Total ReturnB,C,D | 4.74% | 1.76% |
Ratios to Average Net AssetsG | | |
Expenses before expense reductions | 1.75% | 1.62%A |
Expenses net of voluntary waivers, if any | 1.55% | 1.55%A |
Expenses net of all reductions | 1.55% | 1.55%A |
Net investment income | 2.94% | 2.76%A |
Supplemental Data | | |
Net assets, end of period (000 omitted) | $ 2,029 | $ 104 |
Portfolio turnover rate | 193% | 251% |
A Annualized
B Total returns for periods of less than one year are not annualized.
C Total returns would have been lower had certain expenses not been reduced during the periods shown.
D Total returns do not include the effect of the contingent deferred sales charge.
E Calculated based on average shares outstanding during the period.
F For the period June 16, 2004 (commencement of sale of shares) to July 31, 2004.
G Expense ratios reflect operating expenses of the class. Expenses before reductions do not reflect amounts reimbursed by the investment adviser or reductions from brokerage service arrangements or other expense offset arrangements and do not represent the amount paid by the class during periods when reimbursements or reductions occur. Expense ratios before reductions for start-up periods may not be representative of longer-term operating periods. Expenses net of any voluntary waivers reflect expenses after reimbursement by the investment adviser but prior to reductions from brokerage service arrangements or other expense offset arrangements. Expenses net of all reductions represent the net expenses paid by the class.
See accompanying notes which are an integral part of the financial statements.
Annual Report
Financial Highlights - Class C
Years ended July 31, | 2005 | 2004F |
Selected Per-Share Data | | |
Net asset value, beginning of period | $ 10.46 | $ 10.31 |
Income from Investment Operations | | |
Net investment incomeE | .299 | .035 |
Net realized and unrealized gain (loss) | .181 | .145 |
Total from investment operations | .480 | .180 |
Distributions from net investment income | (.280) | (.030) |
Distributions from net realized gain | (.090) | - |
Total distributions | (.370) | (.030) |
Net asset value, end of period | $ 10.57 | $ 10.46 |
Total ReturnB,C,D | 4.63% | 1.74% |
Ratios to Average Net AssetsG | | |
Expenses before expense reductions | 1.74% | 1.74%A |
Expenses net of voluntary waivers, if any | 1.65% | 1.65%A |
Expenses net of all reductions | 1.65% | 1.65%A |
Net investment income | 2.84% | 2.66%A |
Supplemental Data | | |
Net assets, end of period (000 omitted) | $ 677 | $ 142 |
Portfolio turnover rate | 193% | 251% |
A Annualized
B Total returns for periods of less than one year are not annualized.
C Total returns would have been lower had certain expenses not been reduced during the periods shown.
D Total returns do not include the effect of the contingent deferred sales charge.
E Calculated based on average shares outstanding during the period.
F For the period June 16, 2004 (commencement of sale of shares) to July 31, 2004.
G Expense ratios reflect operating expenses of the class. Expenses before reductions do not reflect amounts reimbursed by the investment adviser or reductions from brokerage service arrangements or other expense offset arrangements and do not represent the amount paid by the class during periods when reimbursements or reductions occur. Expense ratios before reductions for start-up periods may not be representative of longer-term operating periods. Expenses net of any voluntary waivers reflect expenses after reimbursement by the investment adviser but prior to reductions from brokerage service arrangements or other expense offset arrangements. Expenses net of all reductions represent the net expenses paid by the class.
See accompanying notes which are an integral part of the financial statements.
Annual Report
Financial Highlights - Total Bond
Years ended July 31, | 2005 | 2004 | 2003E |
Selected Per-Share Data | | | |
Net asset value, beginning of period | $ 10.46 | $ 10.28 | $ 10.00 |
Income from Investment Operations | | | |
Net investment incomeD | .411 | .340 | .232 |
Net realized and unrealized gain (loss) | .182 | .237 | .269 |
Total from investment operations | .593 | .577 | .501 |
Distributions from net investment income | (.393) | (.337) | (.221) |
Distributions from net realized gain | (.090) | (.060) | - |
Total distributions | (.483) | (.397) | (.221) |
Net asset value, end of period | $ 10.57 | $ 10.46 | $ 10.28 |
Total ReturnB,C | 5.75% | 5.68% | 5.01% |
Ratios to Average Net AssetsF | | | |
Expenses before expense reductions | .64% | .75% | 1.01%A |
Expenses net of voluntary waivers, if any | .61% | .65% | .65%A |
Expenses net of all reductions | .61% | .65% | .65%A |
Net investment income | 3.87% | 3.25% | 2.83%A |
Supplemental Data | | | |
Net assets, end of period (000 omitted) | $ 420,225 | $ 373,699 | $ 80,816 |
Portfolio turnover rate | 193% | 251% | 423%A |
A Annualized
B Total returns for periods of less than one year are not annualized.
C Total returns would have been lower had certain expenses not been reduced during the periods shown.
D Calculated based on average shares outstanding during the period.
E For the period October 15, 2002 (commencement of operations) to July 31, 2003.
F Expense ratios reflect operating expenses of the class. Expenses before reductions do not reflect amounts reimbursed by the investment adviser or reductions from brokerage service arrangements or other expense offset arrangements and do not represent the amount paid by the class during periods when reimbursements or reductions occur. Expense ratios before reductions for start-up periods may not be representative of longer-term operating periods. Expenses net of any voluntary waivers reflect expenses after reimbursement by the investment adviser but prior to reductions from brokerage service arrangements or other expense offset arrangements. Expenses net of all reductions represent the net expenses paid by the class.
See accompanying notes which are an integral part of the financial statements.
Annual Report
Financial Highlights - Institutional Class
Years ended July 31, | 2005 | 2004E |
Selected Per-Share Data | | |
Net asset value, beginning of period | $ 10.46 | $ 10.31 |
Income from Investment Operations | | |
Net investment incomeD | .410 | .048 |
Net realized and unrealized gain (loss) | .182 | .145 |
Total from investment operations | .592 | .193 |
Distributions from net investment income | (.392) | (.043) |
Distributions from net realized gain | (.090) | - |
Total distributions | (.482) | (.043) |
Net asset value, end of period | $ 10.57 | $ 10.46 |
Total ReturnB,C | 5.74% | 1.87% |
Ratios to Average Net AssetsF | | |
Expenses before expense reductions | .62% | .71%A |
Expenses net of voluntary waivers, if any | .62% | .65%A |
Expenses net of all reductions | .61% | .65%A |
Net investment income | 3.87% | 3.66%A |
Supplemental Data | | |
Net assets, end of period (000 omitted) | $ 114 | $ 102 |
Portfolio turnover rate | 193% | 251% |
A Annualized
B Total returns for periods of less than one year are not annualized.
C Total returns would have been lower had certain expenses not been reduced during the periods shown.
D Calculated based on average shares outstanding during the period.
E For the period June 16, 2004 (commencement of sale of shares) to July 31, 2004.
F Expense ratios reflect operating expenses of the class. Expenses before reductions do not reflect amounts reimbursed by the investment adviser or reductions from brokerage service arrangements or other expense offset arrangements and do not represent the amount paid by the class during periods when reimbursements or reductions occur. Expense ratios before reductions for start-up periods may not be representative of longer-term operating periods. Expenses net of any voluntary waivers reflect expenses after reimbursement by the investment adviser but prior to reductions from brokerage service arrangements or other expense offset arrangements. Expenses net of all reductions represent the net expenses paid by the class.
See accompanying notes which are an integral part of the financial statements.
Annual Report
Notes to Financial Statements
For the period ended July 31, 2005
1. Significant Accounting Policies.
Fidelity Total Bond Fund (the fund) is a non-diversified fund of Fidelity Income Fund (the trust) and is authorized to issue an unlimited number of shares. The trust is registered under the Investment Company Act of 1940, as amended (the 1940 Act), as an open-end management investment company organized as a Massachusetts business trust.
The fund offers Class A, Class T, Class B, Class C, Total Bond (the original class), and Institutional Class shares, each of which has equal rights as to assets and voting privileges. Each class has exclusive voting rights with respect to matters that affect that class. Class B shares will automatically convert to Class A shares after a holding period of seven years from the initial date of purchase. Investment income, realized and unrealized capital gains and losses, the common expenses of the fund, and certain fund-level expense reductions, if any, are allocated on a pro rata basis to each class based on the relative net assets of each class to the total net assets of the fund. Each class differs with respect to transfer agent and distribution and service plan fees incurred. Certain expense reductions also differ by class.
The fund may invest in affiliated money market central funds (Money Market Central Funds) and fixed-income Central Investment Portfolios (CIPs), collectively referred to as Central Funds, which are open-end investment companies available to investment companies and other accounts managed by Fidelity Management & Research Company (FMR) and its affiliates. The financial statements have been prepared in conformity with accounting principles generally accepted in the United States of America, which require management to make certain estimates and assumptions at the date of the financial statements. The following summarizes the significant accounting policies of the fund, which are also consistently followed by the Central Funds:
Security Valuation. Net asset value per share (NAV calculation) is calculated as of the close of business of the New York Stock Exchange, normally 4:00 p.m. Eastern time. Debt securities, including restricted securities, for which quotations are readily available are valued at their most recent bid prices (sales prices if the principal market is an exchange) in the principal market in which such securities are normally traded, as determined by recognized dealers in such securities, or securities are valued on the basis of information provided by a pricing service. Pricing services use valuation matrices that incorporate both dealer-supplied valuations and valuation models. Equity securities, including restricted securities, for which market quotations are available are valued at the last sale price or official closing price (closing bid price or last evaluated quote if no sale has occurred) on the primary market or exchange on which they trade. If prices are not readily available or do not accurately reflect fair value for a security, or if a security's value has been materially affected by events occurring after the close of the exchange or market on which the security is principally traded, that security may be valued by
Annual Report
1. Significant Accounting Policies - continued
Security Valuation - continued
another method that the Board of Trustees believes accurately reflects fair value. A security's valuation may differ depending on the method used for determining value. Price movements in futures contracts and ADRs, market and trading trends, the bid/ask quotes of brokers and off-exchange institutional trading may be reviewed in the course of making a good faith determination of a security's fair value. Short-term securities with remaining maturities of sixty days or less for which quotations are not readily available are valued on the basis of amortized cost. Investments in open-end investment companies, including Central Funds, are valued at their net asset value each business day.
Investment Transactions and Income. Security transactions, including the fund's investment activity in the Central Funds, are accounted for as of trade date. Gains and losses on securities sold are determined on the basis of identified cost. Interest income, including distributions from the Central Funds, is accrued as earned. Interest income includes coupon interest and amortization of premium and accretion of discount on debt securities. Debt obligations may be placed on non-accrual status and related interest income may be reduced by ceasing current accruals and writing off interest receivables when the collection of all or a portion of interest has become doubtful based on consistently applied procedures. A debt obligation is removed from non-accrual status when the issuer resumes interest payments or when collectibility of interest is reasonably assured.
Expenses. Most expenses of the trust can be directly attributed to a fund. Expenses which cannot be directly attributed are apportioned among each fund in the trust.
Income Tax Information and Distributions to Shareholders. Each year, the fund intends to qualify as a regulated investment company by distributing all of its taxable income and realized gains under Subchapter M of the Internal Revenue Code. As a result, no provision for income taxes is required in the accompanying financial statements.
Dividends are declared daily and paid monthly from net investment income. Distributions from realized gains, if any, are recorded on the ex-dividend date. Income dividends and capital gain distributions are declared separately for each class. Income and capital gain distributions are determined in accordance with income tax regulations, which may differ from generally accepted accounting principles. In addition, the fund will claim a portion of the payment made to redeeming shareholders as a distribution for income tax purposes. Capital accounts within the financial statements are adjusted for permanent book-tax differences. These adjustments have no impact on net assets or the results of operations. Temporary book-tax differences will reverse in a subsequent period.
Annual Report
Notes to Financial Statements - continued
1. Significant Accounting Policies - continued
Income Tax Information and Distributions to Shareholders - continued
Book-tax differences are primarily due to short-term capital gains, prior period premium and discount on debt securities, market discount, financing transactions and losses deferred due to wash sales.
The tax-basis components of distributable earnings and the federal tax cost as of period end were as follows:
Unrealized appreciation | $ 4,501,366 | |
Unrealized depreciation | (3,549,084) | |
Net unrealized appreciation (depreciation) | 952,282 | |
Undistributed ordinary income | 1,565,014 | |
Undistributed long-term capital gain | 634,305 | |
| | |
Cost for federal income tax purposes | $ 468,403,626 | |
The tax character of distributions paid was as follows:
| July 31, 2005 | July 31, 2004 |
Ordinary Income | $ 16,942,281 | $ 9,106,674 |
Long-term Capital Gains | 342,380 | - |
Total | $ 17,284,661 | $ 9,106,674 |
2. Operating Policies.
Repurchase Agreements. FMR has received an Exemptive Order from the Securities and Exchange Commission (the SEC) which permits the fund and other affiliated entities of FMR to transfer uninvested cash balances into joint trading accounts which are then invested in repurchase agreements. The fund may also invest directly with institutions in repurchase agreements. Repurchase agreements are collateralized by government or non-government securities. Collateral is held in segregated accounts with custodian banks and may be obtained in the event of a default of the counterparty. The fund monitors, on a daily basis, the value of the collateral to ensure it is at least equal to the principal amount of the repurchase agreement (including accrued interest). In the event of a default by the counterparty, realization of the collateral proceeds could be delayed, during which time the value of the collateral may decline.
Annual Report
2. Operating Policies - continued
Delayed Delivery Transactions and When-Issued Securities. The fund may purchase or sell securities on a delayed delivery or when-issued basis. Payment and delivery may take place after the customary settlement period for that security. The price of the underlying securities and the date when the securities will be delivered and paid for are fixed at the time the transaction is negotiated. During the time a delayed delivery sell is outstanding, the contract is marked-to-market daily and equivalent deliverable securities are held for the transaction. The value of the securities purchased on a delayed delivery or when-issued basis are identified as such in the fund's Schedule of Investments. The fund may receive compensation for interest forgone in the purchase of a delayed delivery or when-issued security. With respect to purchase commitments, the fund identifies securities as segregated in its records with a value at least equal to the amount of the commitment. Losses may arise due to changes in the value of the underlying securities or if the counterparty does not perform under the contract's terms, or if the issuer does not issue the securities due to political, economic, or other factors.
Restricted Securities. The fund may invest in securities that are subject to legal or contractual restrictions on resale. These securities generally may be resold in transactions exempt from registration or to the public if the securities are registered. Disposal of these securities may involve time-consuming negotiations and expense, and prompt sale at an acceptable price may be difficult. Information regarding restricted securities is included at the end of the fund's Schedule of Investments.
Loans and Other Direct Debt Instruments. The fund may invest in loans and loan participations, trade claims or other receivables. These investments may include standby financing commitments, including revolving credit facilities, that obligate the fund to supply additional cash to the borrower on demand. Loan participations involve a risk of insolvency of the lending bank or other financial intermediary.
Swap Agreements. The fund may invest in swaps for the purpose of managing its exposure to interest rate, credit or market risk.
Interest rate swaps are agreements to exchange cash flows periodically based on a notional principal amount, for example, the exchange of fixed rate interest payments for floating rate interest payments. Periodic payments received or made by the fund are recorded in the accompanying Statement of Operations as realized gains or losses, respectively. The primary risk associated with interest rate swaps is that unfavorable changes in the fluctuation of interest rates could adversely impact a fund.
Annual Report
Notes to Financial Statements - continued
2. Operating Policies - continued
Swap Agreements - continued
Total return swaps are agreements to exchange the return generated by one instrument or index for the return generated by another instrument, for example, the agreement to pay interest in exchange for a market-linked return based on a notional amount. To the extent the total return of the index exceeds the offsetting interest obligation, a fund will receive a payment from the counterparty. To the extent it is less, a fund will make a payment to the counterparty. Periodic payments received or made by the fund are recorded in the accompanying Statement of Operations as realized gains or losses, respectively.
Credit default swaps involve the exchange of a fixed rate premium for protection against the loss in value of an underlying debt instrument in the event of a defined credit event (such as payment default or bankruptcy). Under the terms of the swap, one party acts as a "guarantor" receiving a periodic payment that is a fixed percentage applied to a notional principal amount. In return the party agrees to purchase the notional amount of the underlying instrument, at par, if a credit event occurs during the term of the swap. The fund may enter into credit default swaps in which either it or its counterparty act as guarantors. By acting as the guarantor of a swap, a fund assumes the market and credit risk of the underlying instrument including liquidity and loss of value. Periodic payments and premiums received or made by the fund are recorded in the accompanying Statement of Operations as realized gains or losses, respectively.
Swaps are marked-to-market daily based on dealer-supplied valuations and changes in value are recorded as unrealized appreciation (depreciation). Gains or losses are realized upon early termination of the swap agreement. Collateral, in the form of cash or securities, may be required to be held in segregated accounts with a fund's custodian in compliance with swap contracts. Risks may exceed amounts recognized on the Statement of Assets and Liabilities. These risks include changes in the returns of the underlying instruments, failure of the counterparties to perform under the contracts' terms and the possible lack of liquidity with respect to the swap agreements. Details of swap agreements open at period end are included in the fund's Schedule of Investments under the caption "Swap Agreements."
Mortgage Dollar Rolls. To earn additional income, the fund may employ trading strategies which involve the sale and simultaneous agreement to repurchase similar securities ("mortgage dollar rolls") or the purchase and simultaneous agreement to sell similar securities ("reverse mortgage dollar rolls"). The securities traded are mortgage securities and bear the same interest rate but may be collateralized by different pools of mortgages. During the period between the sale and repurchase in a mortgage dollar roll transaction, a fund will not be entitled to receive interest and principal payments on the securities sold but will invest the proceeds of the sale in other securities which may
Annual Report
2. Operating Policies - continued
Mortgage Dollar Rolls - continued
enhance the yield and total return. In addition, the difference between the sale price and the future purchase price is recorded as an adjustment to investment income. During the period between the purchase and subsequent sale in a reverse mortgage dollar roll transaction a fund is entitled to interest and principal payments on the securities purchased. The price differential between the purchase and sale is recorded as an adjustment to investment income. Losses may arise due to changes in the value of the securities or if the counterparty does not perform under the terms of the agreement. If the counterparty files for bankruptcy or becomes insolvent, a fund's right to repurchase or sell securities may be limited.
3. Purchases and Sales of Investments.
Purchases and sales of securities, other than short-term securities and U.S. government securities, aggregated $104,158,635 and $90,216,988, respectively.
4. Fees and Other Transactions with Affiliates.
Management Fee. FMR and its affiliates provide the fund with investment management related services for which the fund pays a monthly management fee. The management fee is the sum of an individual fund fee rate that is based on an annual rate of .30% of the fund's average net assets (effective June 1, 2005, the fund's management contract was amended, reducing the individual fund fee rate to .20% of average net assets) and a group fee rate that averaged .12% during the period. The group fee rate is based upon the average net assets of all the mutual funds advised by FMR. The group fee rate decreases as assets under management increase and increases as assets under management decrease. For the period, the total annual management fee rate was .41% of the fund's average net assets.
Distribution and Service Plan. In accordance with Rule 12b-1 of the 1940 Act, the fund has adopted separate Distribution and Service Plans for each class of shares. Certain classes pay Fidelity Distributors Corporation (FDC), an affiliate of FMR, separate Distribution and Service Fees, each of which is based on an annual percentage of each class' average net assets. In addition, FDC may pay financial intermediaries for selling
Annual Report
Notes to Financial Statements - continued
4. Fees and Other Transactions with Affiliates - continued
Distribution and Service Plan - continued
shares of the fund and providing shareholder support services. For the period, the Distribution and Service Fee rates and the total amounts paid to and retained by FDC were as follows:
| Distribution
Fee | Service
Fee | Paid to
FDC | Retained
by FDC |
Class A | 0% | .15% | $ 1,883 | $ 146 |
Class T | 0% | .25% | 6,580 | 3,420 |
Class B | .65% | .25% | 8,844 | 6,641 |
Class C | .75% | .25% | 4,061 | 2,940 |
| | | $ 21,368 | $ 13,147 |
FDC receives a front-end sales charge of up to 4.75% for selling Class A shares, and 3.50% for selling Class T shares, some of which is paid to financial intermediaries for selling shares of the fund. FDC receives the proceeds of contingent deferred sales charges levied on Class A, Class T, Class B, and Class C redemptions. These charges depend on the holding period. The deferred sales charges range from 5% to 1% for Class B, 1% for Class C, and .25% for certain purchases of Class A and Class T shares.
For the period, sales charge amounts retained by FDC were as follows:
| Retained
by FDC |
Class A | $ 2,763 |
Class T | 768 |
Class B* | 2,261 |
Class C* | 40 |
| $ 5,832 |
* When Class B and Class C shares are initially sold, FDC pays commissions from its own resources to financial intermediaries through which the sales are made.
Transfer Agent Fees. Fidelity Investments Institutional Operations Company, Inc. (FIIOC), an affiliate of FMR, is the transfer, dividend disbursing and shareholder servicing agent for each class of the fund, except for Total Bond. Fidelity Service Company, Inc. (FSC), an affiliate of FMR, is the transfer agent for Total Bond shares. FIIOC and FSC receive account fees and asset-based fees that vary according to the account size and type of account of the shareholders of the respective classes of the fund. FIIOC and FSC pay for typesetting, printing and mailing of shareholder reports, except proxy statements.
Annual Report
4. Fees and Other Transactions with Affiliates - continued
Transfer Agent Fees - continued
Under an amended contract effective June 1, 2005, transfer agent fees for the Total Bond class consist of an asset based fee and were reduced to a rate of .10% of average net assets. The account fees were eliminated. For the period the total transfer agent fees paid by each class to FIIOC or FSC, were as follows:
| Amount | % of
Average
Net Assets |
Class A | $ 4,554 | .36 |
Class T | 11,173 | .43 |
Class B | 3,849 | .39 |
Class C | 1,101 | .27 |
Total Bond | 584,567 | .15 |
Institutional Class | 141 | .13 |
| $ 605,385 | |
Accounting Fees. FSC maintains the fund's accounting records. The fee is based on the level of average net assets for the month. Effective June 1, 2005, FMR pays these fees.
Fundwide Operations Fee. Pursuant to a new Fundwide Operations and Expense Agreement (FWOE) effective on June 1, 2005, FMR has agreed to provide for fund level expenses (which do not include transfer agent, Rule 12b-1 fees, the compensation of the independent trustees or other extraordinary expenses) in return for a FWOE fee equal to .35% less the total amount of the management fee. The FWOE paid by the fund is reduced by an amount equal to the fees and expenses paid to the independent trustees. For the period, the FWOE fee was equivalent to .005% of average net assets.
Affiliated Central Funds. The fund may invest in Money Market Central Funds which seek preservation of capital and current income and are managed by Fidelity Investments Money Management, Inc. (FIMM) an affiliate of FMR.
The fund may also invest in CIPs managed by FIMM. The Ultra-Short Central Fund seeks to obtain a high level of current income consistent with preservation of capital by investing in U.S. dollar-denominated money market and investment grade debt securities and repurchase agreements.
The fund's Schedule of Investments lists the CIP as an investment of the fund but does not include the underlying holdings of the CIP. Based on its investment objectives, the CIP may invest or participate in various investment vehicles or strategies such as delayed delivery and when-issued securities, derivatives, financing transactions and restricted
Annual Report
Notes to Financial Statements - continued
4. Fees and Other Transactions with Affiliates - continued
Affilliated Central Funds - continued
securities. These strategies are consistent with the investment objectives of the fund and may involve certain economic risks, including the risk that a counterparty to one or more of these transactions may be unable or unwilling to comply with the terms of the governing agreement. This may result in a decline in value of the CIP and the fund.
A complete list of holdings for the CIP is available at the end of this report. In addition, a copy of the CIP's financial statements is available on the EDGAR Database on the SEC's website www.sec.gov, or at the Commission's public reference room in Washington, DC.
The Central Funds do not pay a management fee. Income distributions earned by the fund are recorded as income in the accompanying financial statements and totaled $1,272,185 for the period.
5. Committed Line of Credit.
The fund participates with other funds managed by FMR in a $4.2 billion credit facility (the "line of credit") to be utilized for temporary or emergency purposes to fund shareholder redemptions or for other short-term liquidity purposes. The fund has agreed to pay commitment fees on its pro rata portion of the line of credit. During the period, there were no borrowings on this line of credit.
6. Expense Reductions.
FMR voluntarily agreed to reimburse each class to the extent annual operating expenses exceeded certain levels of average net assets as noted in the table below. Some expenses, for example interest expense, are excluded from this reimbursement.
The following classes were in reimbursement during the period:
| Expense
Limitations | Reimbursement
from adviser |
| | |
Class A | .80% | $ 2,017 |
Class T | .90% | 5,981 |
Class B | 1.55% | 1,959 |
Class C | 1.65% | 357 |
Total Bond | .65%* | 102,259 |
Institutional Class | .65% | - |
| | $ 112,573 |
* Effective June 1, 2005 the expense limitation was eliminated for Total Bond.
Annual Report
6. Expense Reductions - continued
In addition, through arrangements with the fund's custodian, credits realized as a result of uninvested cash balances were used to reduce the fund's expenses. During the period, these credits reduced the fund's custody expenses by $7,019.
7. Other.
The fund's organizational documents provide former and current trustees and officers with a limited indemnification against liabilities arising in connection with the performance of their duties to the fund. In the normal course of business, the fund may also enter into contracts that provide general indemnifications. The fund's maximum exposure under these arrangements is unknown as this would be dependent on future claims that may be made against the fund. The risk of material loss from such claims is considered remote.
8. Distributions to Shareholders.
Distributions to shareholders of each class were as follows:
| Years ended July 31, |
| 2005 | 2004A |
From net investment income | | |
Class A | $ 44,038 | $ 394 |
Class T | 89,638 | 382 |
Class B | 27,061 | 301 |
Class C | 10,692 | 386 |
Total Bond | 14,046,106 | 8,643,095 |
Institutional Class | 3,948 | 413 |
Total | $ 14,221,483 | $ 8,644,971 |
From net realized gain | | |
Class A | $ 1,823 | $ - |
Class T | 2,706 | - |
Class B | 2,453 | - |
Class C | 2,151 | - |
Total Bond | 3,053,158 | 461,703 |
Institutional Class | 887 | - |
Total | $ 3,063,178 | $ 461,703 |
A Distributions for Class A, Class T, Class B, Class C, and Institutional Class are for the period June 16, 2004 (commencement of sale of shares) to July 31, 2004.
Annual Report
Notes to Financial Statements - continued
9. Share Transactions.
Transactions for each class of shares were as follows:
| Shares
Years ended July 31, | Dollars
Years ended July 31, |
| 2005 | 2004A | 2005 | 2004A |
Class A | | | | |
Shares sold | 284,201 | 9,699 | $ 3,006,382 | $ 100,000 |
Reinvestment of distributions | 4,224 | 38 | 44,746 | 394 |
Shares redeemed | (16,733) | - | (177,183) | - |
Net increase (decrease) | 271,692 | 9,737 | $ 2,873,945 | $ 100,394 |
Class T | | | | |
Shares sold | 640,420 | 9,699 | $ 6,767,881 | $ 100,000 |
Reinvestment of distributions | 8,561 | 37 | 90,624 | 382 |
Shares redeemed | (115,159) | - | (1,215,824) | - |
Net increase (decrease) | 533,822 | 9,736 | $ 5,642,681 | $ 100,382 |
Class B | | | | |
Shares sold | 198,926 | 9,950 | $ 2,105,652 | $ 102,625 |
Reinvestment of distributions | 2,416 | 29 | 25,606 | 301 |
Shares redeemed | (19,350) | - | (204,667) | - |
Net increase (decrease) | 181,992 | 9,979 | $ 1,926,591 | $ 102,926 |
Class C | | | | |
Shares sold | 64,313 | 13,566 | $ 682,289 | $ 140,062 |
Reinvestment of distributions | 1,008 | 37 | 10,695 | 386 |
Shares redeemed | (14,837) | - | (156,875) | - |
Net increase (decrease) | 50,484 | 13,603 | $ 536,109 | $ 140,448 |
Total Bond | | | | |
Shares sold | 15,519,844 | 34,227,901 | $ 164,657,854 | $ 358,024,636 |
Reinvestment of distributions | 1,546,242 | 845,761 | 16,406,907 | 8,865,286 |
Shares redeemed | (13,038,155) | (7,201,869) | (138,400,918) | (75,309,262) |
Net increase (decrease) | 4,027,931 | 27,871,793 | $ 42,663,843 | $ 291,580,660 |
Institutional Class | | | | |
Shares sold | 615 | 9,699 | $ 6,559 | $ 100,000 |
Reinvestment of distributions | 453 | 40 | 4,801 | 413 |
Shares redeemed | (7) | - | (75) | - |
Net increase (decrease) | 1,061 | 9,739 | $ 11,285 | $ 100,413 |
A Share transactions for Class A, Class T, Class B, Class C, and Institutional Class are for the period June 16, 2004 (commencement of sale of shares) to July 31, 2004.
Annual Report
Report of Independent Registered Public Accounting Firm
To the Trustees of Fidelity Income Fund and the Shareholders of Fidelity Total Bond Fund:
In our opinion, the accompanying statement of assets and liabilities, including the schedule of investments, and the related statements of operations and of changes in net assets and the financial highlights present fairly, in all material respects, the financial position of Fidelity Total Bond Fund (a fund of Fidelity Income Fund) at July 31, 2005 and the results of their operations, the changes in their net assets and the financial highlights for the periods indicated, in conformity with accounting principles generally accepted in the United States of America. These financial statements and financial highlights (hereafter referred to as "financial statements") are the responsibility of the Fidelity Total Bond Fund's management; our responsibility is to express an opinion on these financial statements based on our audits. We conducted our audits of these financial statements in accordance with the standards of the Public Company Accounting Oversight Board (United States). Those standards require that we plan and perform the audit to obtain reasonable assurance about whether the financial statements are free of material misstatement. An audit includes examining, on a test basis, evidence supporting the amounts and disclosures in the financial statements, assessing the accounting principles used and significant estimates made by management, and evaluating the overall financial statement presentation. We believe that our audits, which included confirmation of securities at July 31, 2005 by correspondence with the custodian and brokers, provide a reasonable basis for our opinion.
/s/ PricewaterhouseCoopers LLP
PricewaterhouseCoopers LLP
Boston, Massachusetts
September 13, 2005
Annual Report
Trustees and Officers
The Trustees, Members of the Advisory Board, and executive officers of the trust and fund, as applicable, are listed below. The Board of Trustees governs the fund and is responsible for protecting the interests of shareholders. The Trustees are experienced executives who meet periodically throughout the year to oversee the fund's activities, review contractual arrangements with companies that provide services to the fund, and review the fund's performance. Except for William O. McCoy, Stephen P. Jonas, and Kenneth L. Wolfe, each of the Trustees oversees 320 funds advised by FMR or an affiliate. Mr. McCoy oversees 322 funds advised by FMR or an affiliate. Mr. Jonas and Mr. Wolfe oversee 311 funds advised by FMR or an affiliate.
The Trustees hold office without limit in time except that (a) any Trustee may resign; (b) any Trustee may be removed by written instrument, signed by at least two-thirds of the number of Trustees prior to such removal; (c) any Trustee who requests to be retired or who has become incapacitated by illness or injury may be retired by written instrument signed by a majority of the other Trustees; and (d) any Trustee may be removed at any special meeting of shareholders by a two-thirds vote of the outstanding voting securities of the trust. Each Trustee who is not an interested person (as defined in the 1940 Act) (Independent Trustee), shall retire not later than the last day of the calendar year in which his or her 72nd birthday occurs. The Independent Trustees may waive this mandatory retirement age policy with respect to individual Trustees. The executive officers and Advisory Board Members hold office without limit in time, except that any officer and Advisory Board Member may resign or may be removed by a vote of a majority of the Trustees at any regular meeting or any special meeting of the Trustees. Except as indicated, each individual has held the office shown or other offices in the same company for the past five years.
The fund's Statement of Additional Information (SAI) includes more information about the Trustees. To request a free copy, call Fidelity at 1-877-208-0098.
Interested Trustees*:
Correspondence intended for each Trustee who is an interested person may be sent to Fidelity Investments, 82 Devonshire Street, Boston, Massachusetts 02109.
Name, Age; Principal Occupation |
Edward C. Johnson 3d (75)** |
| Year of Election or Appointment:1984 Mr. Johnson is Chairman of the Board of Trustees. Mr. Johnson serves as Chief Executive Officer, Chairman, and a Director of FMR Corp.; a Director and Chairman of the Board and of the Executive Committee of FMR; Chairman and a Director of Fidelity Management & Research (Far East) Inc.; Chairman and a Director of Fidelity Investments Money Management, Inc.; and Chairman (2001-present) and a Director (2000-present) of FMR Co., Inc. |
Abigail P. Johnson (43)** |
| Year of Election or Appointment: 2001 Ms. Johnson serves as President of Fidelity Employer Services Company (FESCO) (2005-present). She is President and a Director of Fidelity Investments Money Management, Inc. (2001-present), FMR Co., Inc. (2001-present), and a Director of FMR Corp. Previously, Ms. Johnson served as President and a Director of FMR (2001-2005), Senior Vice President of the Fidelity funds (2001-2005), and managed a number of Fidelity funds. |
Stephen P. Jonas (52) |
| Year of Election or Appointment: 2005 Mr. Jonas is Senior Vice President of the fund (2005-present). He also serves as Senior Vice President of other Fidelity funds (2005-present). Mr. Jonas is Executive Director of FMR (2005-present). Previously, Mr. Jonas served as President of Fidelity Enterprise Operations and Risk Services (2004-2005), Chief Administrative Officer (2002-2004), and Chief Financial Officer of FMR Co. (1998-2000). Mr. Jonas has been with Fidelity Investments since 1987 and has held various financial and management positions including Chief Financial Officer of FMR. In addition, he serves on the Boards of Boston Ballet (2003-present) and Simmons College (2003-present). |
Robert L. Reynolds (53) |
| Year of Election or Appointment: 2003 Mr. Reynolds is a Director (2003-present) and Chief Operating Officer (2002-present) of FMR Corp. He also serves on the Board at Fidelity Investments Canada, Ltd. (2000-present). Previously, Mr. Reynolds served as President of Fidelity Investments Institutional Retirement Group (1996-2000). |
* Trustees have been determined to be "Interested Trustees" by virtue of, among other things, their affiliation with the trust or various entities under common control with FMR.
** Edward C. Johnson 3d, Trustee, is Abigail P. Johnson's father.
Annual Report
Independent Trustees:
Correspondence intended for each Independent Trustee (that is, the Trustees other than the Interested Trustees) may be sent to Fidelity Investments, P.O. Box 55235, Boston, Massachusetts 02205-5235.
Name, Age; Principal Occupation |
Dennis J. Dirks (57) |
| Year of Election or Appointment: 2005 Prior to his retirement in May 2003, Mr. Dirks was Chief Operating Officer and a member of the Board of The Depository Trust & Clearing Corporation (DTCC) (1999-2003). He also served as President, Chief Operating Officer, and Board member of The Depository Trust Company (DTC) (1999-2003) and President and Board member of the National Securities Clearing Corporation (NSCC) (1999-2003). In addition, Mr. Dirks served as Chief Executive Officer and Board member of the Government Securities Clearing Corporation (2001-2003) and Chief Executive Officer and Board member of the Mortgage-Backed Securities Clearing Corporation (2001-2003). Mr. Dirks also serves as a Trustee of Manhattan College (2005-present). |
Robert M. Gates (61) |
| Year of Election or Appointment: 1997 Dr. Gates is Vice Chairman of the Independent Trustees (2005-present). Dr. Gates is President of Texas A&M University (2002-present). He was Director of the Central Intelligence Agency (CIA) from 1991 to 1993. From 1989 to 1991, Dr. Gates served as Assistant to the President of the United States and Deputy National Security Advisor. Dr. Gates is a Director of NACCO Industries, Inc. (mining and manufacturing), Parker Drilling Co., Inc. (drilling and rental tools for the energy industry, 2001-present), and Brinker International (restaurant management, 2003-present). Previously, Dr. Gates served as a Director of LucasVarity PLC (automotive components and diesel engines), a Director of TRW Inc. (automotive, space, defense, and information technology), and Dean of the George Bush School of Government and Public Service at Texas A&M University (1999-2001). Dr. Gates also is a Trustee of the Forum for International Policy. |
George H. Heilmeier (69) |
| Year of Election or Appointment: 2004 Dr. Heilmeier is Chairman Emeritus of Telcordia Technologies (communication software and systems), where prior to his retirement, he served as company Chairman and Chief Executive Officer. He currently serves on the Boards of Directors of The Mitre Corporation (systems engineering and information technology support for the government), and HRL Laboratories (private research and development, 2004-present). He is Chairman of the General Motors Science & Technology Advisory Board and a Life Fellow of the Institute of Electrical and Electronics Engineers (IEEE) (2000-present). Dr. Heilmeier is a member of the Defense Science Board and the National Security Agency Advisory Board. He is also a member of the National Academy of Engineering, the American Academy of Arts and Sciences, and the Board of Overseers of the School of Engineering and Applied Science of the University of Pennsylvania. Previously, Dr. Heilmeier served as a Director of TRW Inc. (automotive, space, defense, and information technology, 1992-2002), Compaq (1994-2002), Automatic Data Processing, Inc. (ADP) (technology-based business outsourcing, 1995-2002), INET Technologies Inc. (telecommunications network surveillance, 2001-2004), and Teletech Holdings (customer management services). He is the recipient of the 2005 Kyoto Prize in Advanced Technology for his invention of the liquid display. |
Marie L. Knowles (58) |
| Year of Election or Appointment: 2001 Prior to Ms. Knowles' retirement in June 2000, she served as Executive Vice President and Chief Financial Officer of Atlantic Richfield Company (ARCO) (diversified energy, 1996-2000). From 1993 to 1996, she was a Senior Vice President of ARCO and President of ARCO Transportation Company. She served as a Director of ARCO from 1996 to 1998. She currently serves as a Director of Phelps Dodge Corporation (copper mining and manufacturing) and McKesson Corporation (healthcare service, 2002-present). Ms. Knowles is a Trustee of the Brookings Institution and the Catalina Island Conservancy and also serves as a member of the Advisory Board for the School of Engineering of the University of Southern California. |
Ned C. Lautenbach (61) |
| Year of Election or Appointment: 2000 Mr. Lautenbach has been a partner of Clayton, Dubilier & Rice, Inc. (private equity investment firm) since September 1998. Previously, Mr. Lautenbach was with the International Business Machines Corporation (IBM) from 1968 until his retirement in 1998. Mr. Lautenbach serves as a Director of Italtel Holding S.p.A. (telecommunications (Milan, Italy), 2004-present) and Eaton Corporation (diversified industrial) as well as the Philharmonic Center for the Arts in Naples, Florida. He also is a member of the Board of Trustees of Fairfield University (2005-present), as well as a member of the Council on Foreign Relations. |
Marvin L. Mann (72) |
| Year of Election or Appointment: 1993 Mr. Mann is Chairman of the Independent Trustees (2001-present). He is Chairman Emeritus of Lexmark International, Inc. (computer peripherals), where he served as CEO until April 1998, retired as Chairman May 1999, and remains a member of the Board. Prior to 1991, he held the positions of Vice President of International Business Machines Corporation (IBM) and President and General Manager of various IBM divisions and subsidiaries. He is a member of the Executive Committee of the Independent Director's Council of the Investment Company Institute. In addition, Mr. Mann is a member of the President's Cabinet at the University of Alabama and the Board of Visitors of the Culverhouse College of Commerce and Business Administration at the University of Alabama. |
William O. McCoy (71) |
| Year of Election or Appointment: 1997 Prior to his retirement in December 1994, Mr. McCoy was Vice Chairman of the Board of BellSouth Corporation (telecommunications) and President of BellSouth Enterprises. He is currently a Director of Liberty Corporation (holding company), Duke Realty Corporation (real estate), and Progress Energy, Inc. (electric utility). He is also a partner of Franklin Street Partners (private investment management firm) and a member of the Research Triangle Foundation Board. In addition, Mr. McCoy served as the Interim Chancellor (1999-2000) and a member of the Board of Visitors for the University of North Carolina at Chapel Hill and currently serves on the Board of Directors of the University of North Carolina Health Care System and the Board of Visitors of the Kenan-Flagler Business School (University of North Carolina at Chapel Hill). He also served as Vice President of Finance for the University of North Carolina (16-school system). |
Cornelia M. Small (61) |
| Year of Election or Appointment: 2005 Ms. Small is a member (2000-present) and Chairperson (2002-present) of the Investment Committee, and a member (2002-present) of the Board of Trustees of Smith College. Previously, she served as Chief Investment Officer (1999-2000), Director of Global Equity Investments (1996-1999), and a member of the Board of Directors of Scudder, Stevens & Clark (1990-1997) and Scudder Kemper Investments (1997-1998). In addition, Ms. Small served as Co-Chair (2000-2003) of the Annual Fund for the Fletcher School of Law and Diplomacy. |
William S. Stavropoulos (66) |
| Year of Election or Appointment: 2001 Mr. Stavropoulos is Chairman of the Board (2000-present) and a Member of the Board of Directors of The Dow Chemical Company. Since joining The Dow Chemical Company in 1967, Mr. Stavropoulos served in numerous senior management positions, including President (1993-2000; 2002-2003), CEO (1995-2000; 2002-2004), and Chairman of the Executive Committee (2000-2004). Currently, he is a Director of NCR Corporation (data warehousing and technology solutions), BellSouth Corporation (telecommunications), Chemical Financial Corporation, Maersk Inc. (industrial conglomerate, 2002-present), and Metalmark Capital (private equity investment firm, 2005-present). He also serves as a member of the Board of Trustees of the American Enterprise Institute for Public Policy Research. In addition, Mr. Stavropoulos is a member of The Business Council, J.P. Morgan International Council and the University of Notre Dame Advisory Council for the College of Science. |
Kenneth L. Wolfe (66) |
| Year of Election or Appointment: 2005 Mr. Wolfe also serves as a Trustee (2005-present) or Member of the Advisory Board (2004-present) of other investment companies advised by FMR. Prior to his retirement in 2001, Mr. Wolfe was Chairman and Chief Executive Officer of Hershey Foods Corporation (1993-2001). He currently serves as a member of the boards of Adelphia Communications Corporation (2003-present), Bausch & Lomb, Inc., and Revlon Inc. (2004-present). |
Annual Report
Advisory Board Members and Executive Officers:
Correspondence intended for Mr. Gamper may be sent to Fidelity Investments, P.O. Box 55235, Boston, Massachusetts 02205-5235. Correspondence intended for each executive officer and Mr. Lynch may be sent to Fidelity Investments, 82 Devonshire Street, Boston, Massachusetts 02109.
Name, Age; Principal Occupation |
Albert R. Gamper, Jr. (63) |
| Year of Election or Appointment: 2005 Member of the Advisory Board of Fidelity Income Fund. Prior to his retirement in December 2004, Mr. Gamper served as Chairman of the Board of CIT Group Inc. (commercial finance). During his tenure with CIT Group Inc. Mr. Gamper served in numerous senior management positions, including Chairman (1987-1989; 1999-2001; 2002-2004), Chief Executive Officer (1987-2004), and President (1989-2002). He currently serves as a member of the Board of Directors of Public Enterprise Group (utilities, 2001-present), Chairman of the Board of Governors, Rutgers University (2004-present), and Chairman of the Board of Saint Barnabas Health Care System. |
Peter S. Lynch (61) |
| Year of Election or Appointment: 2003 Member of the Advisory Board of Fidelity Income Fund. Vice Chairman and a Director of FMR, and Vice Chairman (2001-present) and a Director (2000-present) of FMR Co., Inc. Previously, Mr. Lynch served as a Trustee of the Fidelity funds (1990-2003). In addition, he serves as a Trustee of Boston College, Massachusetts Eye & Ear Infirmary, Historic Deerfield, John F. Kennedy Library, and the Museum of Fine Arts of Boston. |
David L. Murphy (57) |
| Year of Election or Appointment: 2005 Vice President of the fund. Mr. Murphy also serves as Vice President of Fidelity's Money Market Funds (2002-present), certain Asset Allocation Funds (2003-present), Fidelity's Investment Grade-Bond Funds (2005-present), and Fidelity's Balanced Funds (2005-present). He serves as Senior Vice President (2000-present) and Head (2004-present) of the Fidelity Investments Fixed Income Division. Mr. Murphy is also a Senior Vice President of FIMM (2003-present) and a Vice President of FMR (2000-present). Previously, Mr. Murphy served as Money Market Group Leader (2002-2004), Bond Group Leader (2000-2002), and Vice President of Fidelity's Taxable Bond Funds (2000-2002) and Fidelity's Municipal Bond Funds (2001-2002). Mr. Murphy joined Fidelity Investments in 1989 as a portfolio manager in the Bond Group. |
Thomas J. Silvia (44) |
| Year of Election or Appointment: 2005 Vice President of the fund. Mr. Silvia also serves as Vice President of Fidelity's Bond Funds (2005-present) and Senior Vice President and Bond Group Leader of the Fidelity Investments Fixed-Income Division (2005-present). Previously, Mr. Silvia served as Director of Fidelity's Taxable Bond portfolio managers (2002-2004) and a portfolio manager in the Bond Group (1997-2004). |
Walter C. Donovan (43) |
| Year of Election or Appointment: 2005 Vice President of the fund. Mr. Donovan also serves as Vice President of Fidelity's High Income Funds (2005-present), Fidelity's Fixed-Income Funds (2005-present), certain Asset Allocation Funds (2005-present), and certain Balanced Funds (2005-present). Mr. Donovan also serves as Executive Vice President of FMR (2005-present) and FMRC (2005-present). Previously, Mr. Donovan served as Vice President and Director of Fidelity's International Equity Trading group (1998-2005). |
Ford E. O'Neil (43) |
| Year of Election or Appointment: 2005 Vice President of the fund. Mr. O'Neil also serves as Vice President of other funds advised by FMR. |
Eric D. Roiter (56) |
| Year of Election or Appointment: 2002 Secretary of the fund. He also serves as Secretary of other Fidelity funds; Vice President, General Counsel, and Secretary of FMR Co., Inc. (2001-present) and FMR; Assistant Secretary of Fidelity Management & Research (U.K.) Inc. (2001-present), Fidelity Management & Research (Far East) Inc. (2001-present), and Fidelity Investments Money Management, Inc. (2001-present). Mr. Roiter is an Adjunct Member, Faculty of Law, at Boston College Law School (2003-present). Previously, Mr. Roiter served as Vice President and Secretary of Fidelity Distributors Corporation (FDC) (1998-2005). |
Stuart Fross (45) |
| Year of Election or Appointment: 2003 Assistant Secretary of the fund. Mr. Fross also serves as Assistant Secretary of other Fidelity funds (2003-present), Vice President and Secretary of FDC (2005-present), and is an employee of FMR. |
Christine Reynolds (46) |
| Year of Election or Appointment: 2004 President, Treasurer, and Anti-Money Laundering (AML) officer of the fund. Ms. Reynolds also serves as President, Treasurer, and AML officer of other Fidelity funds (2004) and is a Vice President (2003) and an employee (2002) of FMR. Before joining Fidelity Investments, Ms. Reynolds worked at PricewaterhouseCoopers LLP (PwC) (1980-2002), where she was most recently an audit partner with PwC's investment management practice. |
Timothy F. Hayes (54) |
| Year of Election or Appointment: 2002 Chief Financial Officer of the fund. Mr. Hayes also serves as Chief Financial Officer of other Fidelity funds (2002-present) and President of Fidelity Investment Operations (2005-present) which includes Fidelity Pricing and Cash Management Services Group (FPCMS), where he served as President (1998-2005). Mr. Hayes serves as President of Fidelity Service Company (2003-present) where he also serves as a Director. Mr. Hayes also served as President of Fidelity Investments Operations Group (FIOG, 2002-2005). |
Kenneth A. Rathgeber (58) |
| Year of Election or Appointment: 2004 Chief Compliance Officer of the fund. Mr. Rathgeber also serves as Chief Compliance Officer of other Fidelity funds (2004) and Executive Vice President of Risk Oversight for Fidelity Investments (2002). Previously, he served as Executive Vice President and Chief Operating Officer for Fidelity Investments Institutional Services Company, Inc. (1998-2002). |
John R. Hebble (47) |
| Year of Election or Appointment: 2003 Deputy Treasurer of the fund. Mr. Hebble also serves as Deputy Treasurer of other Fidelity funds (2003), and is an employee of FMR. Before joining Fidelity Investments, Mr. Hebble worked at Deutsche Asset Management where he served as Director of Fund Accounting (2002-2003) and Assistant Treasurer of the Scudder Funds (1998-2003). |
Bryan A. Mehrmann (44) |
| Year of Election or Appointment: 2005 Deputy Treasurer of the fund. Mr. Mehrmann also serves as Deputy Treasurer of other Fidelity funds (2005-present) and is an employee of FMR. Previously, Mr. Mehrmann served as Vice President of Fidelity Investments Institutional Services Group (FIIS)/Fidelity Investments Institutional Operations Corporation, Inc. (FIIOC) Client Services (1998-2004). |
Kimberley H. Monasterio (41) |
| Year of Election or Appointment: 2004 Deputy Treasurer of the fund. Ms. Monasterio also serves as Deputy Treasurer of other Fidelity funds (2004) and is an employee of FMR (2004). Before joining Fidelity Investments, Ms. Monasterio served as Treasurer (2000-2004) and Chief Financial Officer (2002-2004) of the Franklin Templeton Funds and Senior Vice President of Franklin Templeton Services, LLC (2000-2004). |
Kenneth B. Robins (35) |
| Year of Election or Appointment: 2005 Deputy Treasurer of the fund. Mr. Robins also serves as Deputy Treasurer of other Fidelity funds (2005-present) and is an employee of FMR (2004-present). Before joining Fidelity Investments, Mr. Robins worked at KPMG LLP, where he was a partner in KPMG's department of professional practice (2002-2004) and a Senior Manager (1999-2000). In addition, Mr. Robins served as Assistant Chief Accountant, United States Securities and Exchange Commission (2000-2002). |
Robert G. Byrnes (38) |
| Year of Election or Appointment: 2005 Assistant Treasurer of the fund. Mr. Byrnes also serves as Assistant Treasurer of other Fidelity funds (2005-present) and is an employee of FMR (2005-present). Previously, Mr. Byrnes served as Vice President of FPCMS (2003-2005). Before joining Fidelity Investments, Mr. Byrnes worked at Deutsche Asset Management where he served as Vice President of the Investment Operations Group (2000-2003). |
John H. Costello (58) |
| Year of Election or Appointment: 2002 Assistant Treasurer of the fund. Mr. Costello also serves as Assistant Treasurer of other Fidelity funds and is an employee of FMR. |
Peter L. Lydecker (51) |
| Year of Election or Appointment: 2004 Assistant Treasurer of the fund. Mr. Lydecker also serves as Assistant Treasurer of other Fidelity funds (2004) and is an employee of FMR. |
Mark Osterheld (50) |
| Year of Election or Appointment: 2002 Assistant Treasurer of the fund. Mr. Osterheld also serves as Assistant Treasurer of other Fidelity funds (2002) and is an employee of FMR. |
Gary W. Ryan (46) |
| Year of Election or Appointment: 2005 Assistant Treasurer of the fund. Mr. Ryan also serves as Assistant Treasurer of other Fidelity funds (2005-present) and is an employee of FMR (2005-present). Previously, Mr. Ryan served as Vice President of Fund Reporting in FPCMS (1999-2005). |
Salvatore Schiavone (39) |
| Year of Election or Appointment: 2005 Assistant Treasurer of the fund. Mr. Schiavone also serves as Assistant Treasurer of other Fidelity funds (2005-present) and is an employee of FMR (2005-present). Before joining Fidelity Investments, Mr. Schiavone worked at Deutsche Asset Management, where he most recently served as Assistant Treasurer (2003-2005) of the Scudder Funds and Vice President and Head of Fund Reporting (1996-2003). |
Annual Report
Distributions
The Board of Trustees of Fidelity Total Bond Fund voted to pay to shareholders of record at the opening of business on record date, the following distributions per share derived from capital gains realized from sales of portfolio securities:
| Pay Date | Record Date | Capital Gains |
Institutional Class | 9/12/05 | 9/9/05 | $.04 |
The fund hereby designates as capital gain dividends: For dividends with respect to the taxable year ended July 31, 2005, $807,027, or, if subsequently determined to be different, the net capital gain of such year, and for dividends with respect to the taxable year ended July 31, 2004, $169,658, or, if subsequently determined to be different, the excess of: (a) the net capital gain of such year, over (b) amounts previously designated as capital gain dividends with respect to such year.
A total of 15.99% of the dividends distributed during the fiscal year was derived from interest on U.S. Government securities which is generally exempt from state income tax.
The fund will notify shareholders in January 2006 of amounts for use in preparing 2005 income tax returns.
Annual Report
Board Approval of Investment Advisory Contracts and Management Fees
Fidelity Total Bond Fund
Each year, typically in June, the Board of Trustees, including the independent Trustees (together, the Board), votes on the renewal of the management contract and sub-advisory agreements (together, the Advisory Contracts) for the fund. The Board, assisted by the advice of fund counsel and independent Trustees' counsel, requests and considers a broad range of information throughout the year.
The Board meets regularly each month except August and takes into account throughout the year matters bearing on Advisory Contracts. The Board, acting directly and through its separate committees, considers at each of its meetings factors that are relevant to the annual renewal of the fund's Advisory Contracts, including the services and support provided to the fund and its shareholders by Fidelity. At the time of the renewal, the Board had 11 standing committees, each composed of independent Trustees with varying backgrounds, to which the Board has assigned specific subject matter responsibilities in order to enhance effective decision-making by the Board. Each committee has adopted a written charter outlining the structure and purposes of the committee. One such committee, the Fixed-Income Contract Committee, meets periodically during the first six months of each year and as necessary to consider matters specifically related to the annual renewal of Advisory Contracts. The committee requests and receives information on, and makes recommendations to the independent Trustees concerning, the approval and annual review of the Advisory Contracts.
At its June 2005 meeting, the Board of Trustees, including the independent Trustees, unanimously determined to renew the Advisory Contracts for the fund. In reaching its determination, the Board considered all factors it believed relevant, including (1) the nature, extent, and quality of the services to be provided to the fund and its shareholders by Fidelity (including the investment performance of the fund); (2) the competitiveness of the management fee and total expenses of the fund; (3) the total costs of the services to be provided by and the profits to be realized by the investment adviser and its affiliates from the relationship with the fund; (4) the extent to which economies of scale would be realized as the fund grows; and (5) whether fee levels reflect these economies of scale, if any, for the benefit of fund shareholders.
In determining whether to renew the Advisory Contracts for the fund, the Board ultimately reached a determination, with the assistance of fund counsel and independent Trustees' counsel, that the renewal of the Advisory Contracts and the compensation to be received by Fidelity under the management contract is consistent with Fidelity's fiduciary duty under applicable law. In addition to evaluating the specific factors noted above, the Board, in reaching its determination, is aware that shareholders in the fund have a broad range of investment choices available to them, including a wide choice among mutual funds offered by competitors to Fidelity, and that the fund's shareholders, with the opportunity to review and weigh the disclosure provided by the fund in its prospectus and other public disclosures, have chosen to invest in this fund, managed by Fidelity.
Annual Report
Nature, Extent, and Quality of Services Provided by Fidelity. The Board considered staffing within the investment adviser, FMR, and the sub-advisers (together, the Investment Advisers), including the background of the fund's portfolio manager and the fund's investment objective and discipline. The independent Trustees also had discussions with senior management of Fidelity's investment operations and investment groups. The Board considered the structure of the portfolio manager compensation program and whether this structure provides appropriate incentives.
Fidelity Resources Dedicated to Investment Management and Support Services. The Board reviewed the size, education, and experience of the Investment Advisers' investment staff, their use of technology, and the Investment Advisers' approach to recruiting, training, and retaining portfolio managers and other research, advisory, and management personnel. The Board considered Fidelity's extensive global research capabilities that enable the Investment Advisers to aggregate data from various sources in an effort to produce positive investment results. The Board noted that Fidelity's analysts have access to a variety of technological tools that enable them to perform both fundamental and quantitative analysis and to specialize in various disciplines. The Board also considered that Fidelity's portfolio managers and analysts have access to daily portfolio attribution that allows for monitoring of a fund's portfolio, as well as an electronic communication system that provides immediate real-time access to research concerning issuers and credit enhancers.
Shareholder and Administrative Services. The Board considered the nature, extent, quality, and cost of administrative, distribution, and shareholder services performed by the Investment Advisers and their affiliates under the Advisory Contracts and under separate agreements covering transfer agency, pricing and bookkeeping, and securities lending services for the fund. The Board also considered the nature and extent of the Investment Advisers' supervision of third party service providers, principally custodians and subcustodians. The Board reviewed the allocation of fund brokerage, including allocations to brokers affiliated with the Investment Advisers. The Board also considered the resources devoted to, and the record of compliance with, the fund's compliance policies and procedures.
The Board noted that the growth of fund assets across the complex allows Fidelity to reinvest in the development of services designed to enhance the value or convenience of the Fidelity funds as investment vehicles. These services include 24-hour access to account information and market information through phone representatives and over the Internet, and investor education materials and asset allocation tools.
Investment in a Large Fund Family. The Board considered the benefits to shareholders of investing in a Fidelity fund, including the benefits of investing in a fund that is part of a large family of funds offering a variety of investment disciplines and providing for a large variety of mutual fund investor services. For example, fund shareholders are offered the privilege of exchanging shares of the fund for shares of other Fidelity funds, as set forth in the fund's prospectus, without paying an additional sales charge. The Board noted that, since the last Advisory Contract renewals in June 2004, Fidelity has taken a number of actions that benefited particular funds, including (i) voluntarily deciding in 2004 to stop using "soft" commission dollars to pay for market data and, instead, to pay for that data out of its own resources, (ii) contractually agreeing to impose management fee reductions and expense limitations on its five Spartan stock index funds and its stock index fund available through variable insurance products, (iii) contractually agreeing to eliminate the management fees on the Fidelity Freedom Funds and the Fidelity Advisor Freedom Funds, (iv) contractually agreeing to reduce the management fees on most of its investment-grade taxable bond funds, and (v) contractually agreeing to impose expense limitations on its retail and Spartan investment-grade taxable bond funds.
Annual Report
Board Approval of Investment Advisory Contracts and
Management Fees - continued
Investment Performance. The Board considered whether the fund has operated within its investment objective, as well as its record of compliance with its investment restrictions. It also reviewed the fund's absolute investment performance, as well as the fund's relative investment performance measured against (i) a broad-based securities market index, and (ii) a peer group of mutual funds deemed appropriate by the Board. Because the fund had been in existence less than three calendar years, the following chart considered by the Board shows, for the one-year period ended December 31, 2004, the return of the retail class of the fund, the return of a broad-based securities market index ("benchmark"), and a range of returns of a peer group of mutual funds identified by Lipper Inc. as having an investment objective similar to that of the fund. The return of the retail class represents the performance of a class with the lowest 12b-1 fee (not necessarily with the lowest total expenses). (The Advisor classes of the fund, which have higher 12b-1 fees, had less than one year of performance as of December 31, 2004.) The box within the chart shows the 25th percentile return (bottom of box) and the 75th percentile return (top of box) of the Lipper peer group. The percentage beaten number noted below the chart corresponds to the percentile box and represents the percentage of funds in the Lipper peer group whose performance was equal to or lower than that of the retail class.
Annual Report
The Board noted that the relative investment performance of the retail class of the fund compared favorably to its Lipper peer group for the one-year period. The Board also noted that the relative investment performance of the retail class of the fund compared favorably to its benchmark for the one-year period.
Based on its review, and giving particular weight to the nature and quality of the resources dedicated by the Investment Advisers to maintain and improve relative performance, the Board concluded that the nature, extent, and quality of the services provided by Fidelity will benefit the fund's shareholders, particularly in light of the Board's view that the fund's shareholders benefit from investing in a fund that is part of a large family of funds offering a variety of investment disciplines and services.
Competitiveness of Management Fee and Total Fund Expenses. The Board considered the fund's management fee and total expenses compared to "mapped groups" of competitive funds and classes. Fidelity creates "mapped groups" by combining similar Lipper investment objective categories that have comparable management fee characteristics. Combining Lipper investment objective categories aids the Board's management fee and total expense comparisons by broadening the competitive group used for comparison and by reducing the number of universes to which various Fidelity funds are compared.
The Board considered two proprietary management fee comparisons for the 12-month (or shorter) periods shown in the chart below. The group of Lipper funds used by the Board for management fee comparisons is referred to below as the "Total Mapped Group" and, for the reasons explained above, is broader than the Lipper peer group used by the Board for performance comparisons. The Total Mapped Group comparison focuses on a fund's standing relative to the total universe of comparable funds available to investors, in terms of gross management fees before expense reimbursements or caps. "TMG %" represents the percentage of funds in the Total Mapped Group that had management fees that were lower than the fund's. For example, a TMG % of 22% would mean that 78% of the funds in the Total Mapped Group had higher management fees than the fund. The "Asset-Size Peer Group" (ASPG) comparison focuses on a fund's standing relative to non-Fidelity funds similar in size to the fund within the Total Mapped Group. The ASPG represents at least 15% of the funds in the Total Mapped Group with comparable asset size and management fee characteristics, subject to a minimum of 50 funds (or all funds in the Total Mapped Group if fewer than 50). Additional information, such as the ASPG quartile ("quadrant") in which the fund's management fee ranked, is also included in the chart and considered by the Board.
Annual Report
Board Approval of Investment Advisory Contracts and
Management Fees - continued
The Board noted that the fund's management fee ranked below the median of its Total Mapped Group and below the median of its ASPG for 2004.
Furthermore, the Board considered that, on May 19, 2005, after the periods shown in the chart above, it had approved an amendment (effective June 1, 2005) to the fund's management contract that lowered the fund's individual fund fee rate from 30 basis points to 20 basis points. The Board considered that, if the lower individual fund fee rate had been in effect in 2004, it would have reduced the fund's management fee rate from 43 basis points to 33 basis points.
Based on its review, the Board concluded that the fund's management fee was fair and reasonable in light of the services that the fund receives and the other factors considered.
Annual Report
In its review of each class's total expenses, the Board considered the fund's management fee as well as other fund or class expenses, as applicable, such as transfer agent fees, pricing and bookkeeping fees, fund-paid 12b-1 fees, and custodial, legal, and audit fees. The Board also noted the effects of any waivers and reimbursements on fees and expenses. As part of its review, the Board also considered current and historical total expenses of each class of the fund compared to competitive fund median expenses. Each class of the fund is compared to those funds and classes in the Total Mapped Group (used by the Board for management fee comparisons) that have a similar sales load structure.
The Board noted that each class's total expenses ranked below its competitive median for 2004. The Board considered that if the lower individual fund fee rate had been in effect in 2004, it would have reduced each class's total expenses by 10 basis points.
The Board also considered that on May 19, 2005, it had approved changes (effective June 1, 2005) in the contractual arrangements for the fund that (i) have the effect of setting the total "fund-level" expenses (including, among certain other expenses, the management fee) for each class at 35 basis points, (ii) lower and limit the "class-level" transfer agent fee for Fidelity Total Bond Fund (retail class) to 10 basis points, and (iii) limit the total expenses for Fidelity Total Bond Fund (retail class) to 45 basis points. These new contractual arrangements may not be increased without Board approval. The fund's Advisor classes continue to be subject to different class-level expenses (transfer agent fees and 12b-1 fees).
The Board recognized that the fund's management contract incorporates a "group fee" structure, which provides for lower fee rates as total fund assets under FMR's management increase, and for higher fee rates as total fund assets under FMR's management decrease. The Board noted that because the new contractual arrangements set the total fund-level expenses for each class at 35 basis points, increases or decreases in the management fee due to changes in the group fee rate will not impact total expenses. However, the Board realized that the 35 basis point fee rate was below the lowest management fee available under the old contractual arrangements. The maximum benefit that a decrease in the group fee rate could provide the fund would be a reduction in the management fee to approximately 39 basis points (compared to total fund-level expenses of 35 basis points under the new contractual arrangements).
In its review of total expenses, the Board also considered Fidelity fee structures and other information on clients that FMR and its affiliates service in other competitive markets, such as other mutual funds advised or subadvised by FMR or its affiliates, pension plan clients, and other institutional clients.
Based on its review, the Board concluded that each class's total expenses were reasonable in light of the services that the fund and its shareholders receive and the other factors considered.
Annual Report
Board Approval of Investment Advisory Contracts and
Management Fees - continued
Costs of the Services and Profitability. The Board considered the revenues earned and the expenses incurred by Fidelity in conducting the business of developing, marketing, distributing, managing, administering and servicing the fund and its shareholders. The Board also considered the level of Fidelity's profits in respect of all the Fidelity funds.
On an annual basis, FMR presents to the Board Fidelity's profitability for the fund. Fidelity calculates the profitability for each fund, as well as aggregate profitability for groups of Fidelity funds and all Fidelity funds, using a series of detailed revenue and cost allocation methodologies which originate with the audited books and records of Fidelity. The Audit Committee of the Board reviews any significant changes from the prior year's methodologies.
PricewaterhouseCoopers LLP (PwC), independent registered accounting firm and auditor to Fidelity and certain Fidelity funds, has been engaged annually by the Board as part of the Board's assessment of the results of Fidelity's profitability analysis. PwC's engagement includes the review and assessment of Fidelity's methodologies used in determining the revenues and expenses attributable to Fidelity's mutual fund business, and completion of agreed-upon procedures surrounding the mathematical accuracy of fund profitability and its conformity to allocation methodologies. After considering PwC's reports issued under the engagement and information provided by Fidelity, the Board believes that while other allocation methods may also be reasonable, Fidelity's profitability methodologies are reasonable in all material respects.
The Board has also reviewed Fidelity's non-fund businesses and any fall-out benefits related to the mutual fund business as well as cases where Fidelity's affiliates may benefit from or be related to the fund's business. In addition, a special committee of the Board reviewed services provided to Fidelity by its affiliates and determined that the fees that Fidelity paid for such services were reasonable.
The Board considered the costs of the services provided by and the profits realized by Fidelity in connection with the operation of the fund and determined that the amount of profit is a fair entrepreneurial profit for the management of the fund.
Economies of Scale. The Board considered whether there have been economies of scale in respect of the management of the Fidelity funds, whether the Fidelity funds (including the fund) have appropriately benefited from any such economies of scale, and whether there is potential for realization of any further economies of scale. The Board considered the extent to which the fund will benefit from economies of scale through increased services to the fund, through waivers or reimbursements, or through fee or expense reductions, including (Advisor classes only) reductions that occur through operation of the transfer agent agreement. The transfer agent fee varies in part based on the number of accounts in the fund. If the number of accounts decreases or the average account size increases, the overall transfer agent fee rate decreases. The Board also noted that the reduction in the fund's management fee rate from 43 basis points to 33 basis points and the reduction in each class's total expenses by 10 basis points would deliver significant economies to fund shareholders. The Board concluded that any potential economies of scale are being shared between fund shareholders and Fidelity in an appropriate manner.
Annual Report
Additional Information Requested by the Board. In order to develop fully the factual basis for consideration of the Advisory Contracts, the Board requested additional information regarding (i) Fidelity's fund profitability methodology, including additional detail on various cost allocations; (ii) fall-out benefits to Fidelity; and (iii) compensation of portfolio managers and research analysts.
Based on its evaluation of all of the conclusions noted above, and after considering all material factors, the Board ultimately concluded that the existing advisory fee structures are fair and reasonable, and that the fund's existing Advisory Contracts should be renewed.
Annual Report
The following is a complete listing of investments for Fidelity's
fixed-income central fund as of July 31, 2005 which
is a direct or indirect investment of Fidelity Total Bond Fund.
These underlying holdings of the Fidelity fixed-income central
fund are not included in the Schedule of Investments as
part of the Financial Statements.
Annual Report
Fidelity Ultra-Short Central Fund
Investments July 31, 2005 (Unaudited)
Showing Percentage of Net Assets
Nonconvertible Bonds - 3.8% |
| Principal Amount | | Value |
CONSUMER DISCRETIONARY - 1.0% |
Auto Components - 0.3% |
DaimlerChrysler NA Holding Corp.: | | | | |
3.8594% 9/10/07 (f) | | $ 16,665,000 | | $ 16,698,830 |
3.8938% 5/24/06 (f) | | 4,700,000 | | 4,713,691 |
| | 21,412,521 |
Media - 0.7% |
Continental Cablevision, Inc. 8.3% 5/15/06 | | 8,000,000 | | 8,248,640 |
Cox Communications, Inc. (Reg. S) 3.95% 12/14/07 (f) | | 12,140,000 | | 12,202,691 |
Liberty Media Corp. 4.91% 9/17/06 (f) | | 16,694,000 | | 16,786,986 |
Univision Communications, Inc. 2.875% 10/15/06 | | 8,505,000 | | 8,315,339 |
| | 45,553,656 |
TOTAL CONSUMER DISCRETIONARY | | 66,966,177 |
ENERGY - 0.2% |
Oil, Gas & Consumable Fuels - 0.2% |
Valero Energy Corp. 7.375% 3/15/06 | | 11,550,000 | | 11,735,435 |
FINANCIALS - 1.0% |
Capital Markets - 0.1% |
State Street Capital Trust II 3.7681% 2/15/08 (f) | | 10,000,000 | | 10,002,260 |
Commercial Banks - 0.3% |
Wells Fargo & Co. 3.4194% 3/10/08 (f) | | 16,600,000 | | 16,599,452 |
Consumer Finance - 0.2% |
General Motors Acceptance Corp. 4.87% 10/20/05 (f) | | 14,765,000 | | 14,786,188 |
Thrifts & Mortgage Finance - 0.4% |
Countrywide Financial Corp. 3.71% 4/11/07 (f) | | 11,025,000 | | 11,032,034 |
Residential Capital Corp. 4.835% 6/29/07 (c)(f) | | 14,150,000 | | 14,164,716 |
| | 25,196,750 |
TOTAL FINANCIALS | | 66,584,650 |
TELECOMMUNICATION SERVICES - 1.3% |
Diversified Telecommunication Services - 1.2% |
British Telecommunications PLC 7.875% 12/15/05 | | 18,145,000 | | 18,397,070 |
France Telecom SA 7.45% 3/1/06 (a) | | 5,600,000 | | 5,699,484 |
GTE Corp. 6.36% 4/15/06 | | 9,000,000 | | 9,126,405 |
SBC Communications, Inc. 4.389% 6/5/06 (c) | | 15,315,000 | | 15,319,595 |
Sprint Capital Corp. 4.78% 8/17/06 | | 6,000,000 | | 6,020,550 |
Telefonica Europe BV 7.35% 9/15/05 | | 4,500,000 | | 4,517,537 |
Nonconvertible Bonds - continued |
| Principal Amount | | Value |
TELECOMMUNICATION SERVICES - continued |
Diversified Telecommunication Services - continued |
Telefonos de Mexico SA de CV 4.5% 11/19/08 | | $ 10,240,000 | | $ 10,092,268 |
TELUS Corp. yankee 7.5% 6/1/07 | | 6,500,000 | | 6,835,569 |
| | 76,008,478 |
Wireless Telecommunication Services - 0.1% |
AT&T Wireless Services, Inc. 7.35% 3/1/06 | | 5,500,000 | | 5,596,976 |
TOTAL TELECOMMUNICATION SERVICES | | 81,605,454 |
UTILITIES - 0.3% |
Electric Utilities - 0.2% |
Pinnacle West Energy Corp. 4.0044% 4/1/07 (c)(f) | | 12,800,000 | | 12,800,794 |
Gas Utilities - 0.1% |
NiSource Finance Corp. 7.625% 11/15/05 | | 9,250,000 | | 9,342,213 |
TOTAL UTILITIES | | 22,143,007 |
TOTAL NONCONVERTIBLE BONDS (Cost $249,397,779) | 249,034,723 |
U.S. Government Agency Obligations - 0.0% |
|
Fannie Mae 0% 9/28/05 (e)
(Cost $994,579) | | 1,000,000 | | 994,635 |
Asset-Backed Securities - 35.2% |
|
Accredited Mortgage Loan Trust: | | | | |
Series 2004-2 Class A2, 3.76% 7/25/34 (f) | | 7,964,683 | | 7,978,722 |
Series 2004-3 Class 2A4, 3.81% 10/25/34 (f) | | 10,915,000 | | 10,946,584 |
Series 2004-4 Class A2D, 3.81% 1/25/35 (f) | | 3,579,364 | | 3,588,366 |
Series 2005-1: | | | | |
Class M1, 3.93% 4/25/35 (f) | | 11,280,000 | | 11,251,882 |
Class M2, 4.15% 4/25/35 (f) | | 5,275,000 | | 5,276,901 |
ACE Securities Corp.: | | | | |
Series 2002-HE1 Class M1, 4.11% 6/25/32 (f) | | 1,308,761 | | 1,318,432 |
Series 2002-HE2 Class M1, 4.31% 8/25/32 (f) | | 18,631,213 | | 18,704,611 |
Series 2003-FM1 Class M2, 5.31% 11/25/32 (f) | | 3,015,000 | | 3,050,466 |
Series 2003-HS1: | | | | |
Class M1, 4.21% 6/25/33 (f) | | 800,000 | | 803,485 |
Class M2, 5.21% 6/25/33 (f) | | 856,000 | | 871,093 |
Asset-Backed Securities - continued |
| Principal Amount | | Value |
ACE Securities Corp.: - continued | | | | |
Series 2003-NC1 Class M1, 4.24% 7/25/33 (f) | | $ 1,600,000 | | $ 1,611,660 |
Series 2004-HE1: | | | | |
Class M1, 3.96% 2/25/34 (f) | | 2,193,000 | | 2,193,772 |
Class M2, 4.56% 2/25/34 (f) | | 2,475,000 | | 2,476,241 |
Series 2004-OP1: | | | | |
Class M1, 3.98% 4/25/34 (f) | | 4,420,000 | | 4,424,344 |
Class M2, 4.51% 4/25/34 (f) | | 6,240,000 | | 6,251,080 |
Series 2005-HE2: | | | | |
Class M1, 3.9% 4/25/35 (f) | | 1,530,000 | | 1,527,965 |
Class M2, 3.91% 4/25/35 (f) | | 1,803,000 | | 1,796,836 |
Class M3, 3.94% 4/25/35 (f) | | 1,040,000 | | 1,038,647 |
Class M4, 4.1% 4/25/35 (f) | | 1,340,000 | | 1,338,268 |
Series 2005-HE3: | | | | |
Class A2A, 3.56% 5/25/35 (f) | | 8,063,511 | | 8,063,822 |
Class A2B, 3.67% 5/25/35 (f) | | 4,370,000 | | 4,366,352 |
Series 2005-SD1 Class A1, 3.86% 11/25/50 (f) | | 2,563,309 | | 2,566,464 |
Aesop Funding II LLC Series 2005-1A Class A2, 3.49% 4/20/09 (c)(f) | | 8,800,000 | | 8,765,680 |
American Express Credit Account Master Trust: | | | | |
Series 2002-6 Class B, 3.8381% 3/15/10 (f) | | 5,000,000 | | 5,030,751 |
Series 2004-1 Class B, 3.6381% 9/15/11 (f) | | 5,775,000 | | 5,797,723 |
Series 2004-C Class C, 3.8881% 2/15/12 (c)(f) | | 17,323,520 | | 17,374,643 |
Series 2005-1 Class A, 3.4181% 10/15/12 (f) | | 15,455,000 | | 15,481,600 |
AmeriCredit Automobile Receivables Trust: | | | | |
Series 2002-EM Class A4A, 3.67% 6/8/09 | | 25,000,000 | | 24,899,223 |
Series 2003-AM: | | | | |
Class A3B, 3.71% 6/6/07 (f) | | 685,806 | | 685,879 |
Class A4B, 3.81% 11/6/09 (f) | | 12,400,000 | | 12,441,657 |
Series 2003-BX Class A4B, 3.72% 1/6/10 (f) | | 3,265,000 | | 3,275,694 |
Series 2003-CF Class A3, 2.75% 10/9/07 | | 12,249,371 | | 12,210,791 |
Series 2005-1 Class C, 4.73% 7/6/10 | | 15,500,000 | | 15,451,950 |
Ameriquest Mortgage Securities, Inc.: | | | | |
Series 2002-3 Class M1, 4.16% 8/25/32 (f) | | 5,000,000 | | 5,028,248 |
Series 2003-1: | | | | |
Class A2, 3.87% 2/25/33 (f) | | 465,695 | | 465,917 |
Class M1, 4.36% 2/25/33 (f) | | 6,150,000 | | 6,197,846 |
Series 2003-3: | | | | |
Class M1, 4.26% 3/25/33 (f) | | 1,590,000 | | 1,603,481 |
Class S, 5% 9/25/05 (g) | | 4,457,447 | | 17,215 |
Series 2003-6: | | | | |
Class M1, 4.22% 8/25/33 (f) | | 7,560,000 | | 7,611,224 |
Asset-Backed Securities - continued |
| Principal Amount | | Value |
Ameriquest Mortgage Securities, Inc.: - continued | | | | |
Series 2003-6: | | | | |
Class M2, 5.31% 5/25/33 (f) | | $ 2,750,000 | | $ 2,808,476 |
Series 2003-AR1 Class M1, 4.61% 1/25/33 (f) | | 7,000,000 | | 7,072,631 |
Series 2004-R2: | | | | |
Class M1, 3.89% 4/25/34 (f) | | 1,230,000 | | 1,229,949 |
Class M2, 3.94% 4/25/34 (f) | | 950,000 | | 949,960 |
Class M3, 4.01% 4/25/34 (f) | | 3,500,000 | | 3,499,854 |
Class M4, 4.51% 4/25/34 (f) | | 4,500,000 | | 4,499,807 |
Series 2004-R9 Class A3, 3.78% 10/25/34 (f) | | 9,340,000 | | 9,359,871 |
Series 2005-R1: | | | | |
Class M1, 3.91% 3/25/35 (f) | | 5,710,000 | | 5,691,308 |
Class M2, 3.94% 3/25/35 (f) | | 1,925,000 | | 1,918,868 |
Series 2005-R2 Class M1, 3.91% 4/25/35 (f) | | 12,500,000 | | 12,482,516 |
Amortizing Residential Collateral Trust: | | | | |
Series 2002-BC3 Class A, 3.79% 6/25/32 (f) | | 2,411,175 | | 2,418,495 |
Series 2002-BC6 Class M1, 4.21% 8/25/32 (f) | | 24,900,000 | | 25,116,817 |
Series 2002-BC7: | | | | |
Class M1, 4.1144% 10/25/32 (f) | | 10,000,000 | | 10,075,000 |
Class M2, 4.36% 10/25/32 (f) | | 5,575,000 | | 5,612,067 |
Series 2003-BC1 Class M2, 4.56% 1/25/32 (f) | | 758,836 | | 762,333 |
ARG Funding Corp.: | | | | |
Series 2005-1A Class A2, 3.53% 4/20/09 (c)(f) | | 11,000,000 | | 10,975,938 |
Series 2005-2A Class A2, 3.54% 5/20/09 (c)(f) | | 5,200,000 | | 5,190,453 |
Argent Securities, Inc.: | | | | |
Series 2003-W3 Class M2, 5.26% 9/25/33 (f) | | 20,000,000 | | 20,599,990 |
Series 2003-W7 Class A2, 3.85% 3/1/34 (f) | | 4,505,856 | | 4,515,756 |
Series 2004-W5 Class M1, 4.06% 4/25/34 (f) | | 3,960,000 | | 3,964,768 |
Series 2004-W7: | | | | |
Class M1, 4.01% 5/25/34 (f) | | 4,085,000 | | 4,084,827 |
Class M2, 4.06% 5/25/34 (f) | | 3,320,000 | | 3,319,860 |
Asset Backed Securities Corp. Home Equity Loan Trust: | | | | |
Series 2003-HE2: | | | | |
Class A2, 3.7681% 4/15/33 (f) | | 1,158,706 | | 1,159,186 |
Class M1, 4.2881% 4/15/33 (f) | | 11,365,000 | | 11,429,103 |
Series 2003-HE3: | | | | |
Class M1, 4.2181% 6/15/33 (f) | | 2,185,000 | | 2,198,827 |
Class M2, 5.3881% 6/15/33 (f) | | 10,000,000 | | 10,182,465 |
Series 2003-HE4 Class M2, 5.3881% 8/15/33 (f) | | 5,695,000 | | 5,798,650 |
Series 2003-HE5 Class A2A, 3.7481% 8/15/33 (f) | | 1,380,797 | | 1,381,390 |
Series 2003-HE6 Class M1, 4.11% 11/25/33 (f) | | 3,475,000 | | 3,490,373 |
Series 2004-HE2 Class M1, 4.01% 4/25/34 (f) | | 6,060,000 | | 6,070,769 |
Series 2004-HE3: | | | | |
Class M1, 4% 6/25/34 (f) | | 1,450,000 | | 1,454,353 |
Asset-Backed Securities - continued |
| Principal Amount | | Value |
Asset Backed Securities Corp. Home Equity Loan Trust: - continued | | | | |
Series 2004-HE3: | | | | |
Class M2, 4.58% 6/25/34 (f) | | $ 3,350,000 | | $ 3,386,297 |
Series 2004-HE6 Class A2, 3.82% 6/25/34 (f) | | 17,398,791 | | 17,435,568 |
Series 2005-HE2: | | | | |
Class M1, 3.91% 3/25/35 (f) | | 8,250,000 | | 8,235,989 |
Class M2, 3.96% 3/25/35 (f) | | 2,065,000 | | 2,065,671 |
Series 2005-HE6 Class A2B, 3.76% 8/25/35 (d)(f) | | 10,000,000 | | 10,000,000 |
Bank One Issuance Trust: | | | | |
Series 2002-B1 Class B1, 3.7681% 12/15/09 (f) | | 20,655,000 | | 20,741,067 |
Series 2002-B2 Class B2, 3.7281% 5/15/08 (f) | | 15,000,000 | | 15,001,929 |
Series 2002-B3 Class B, 3.7481% 8/15/08 (f) | | 14,500,000 | | 14,505,871 |
Series 2002-C1 Class C1, 4.3481% 12/15/09 (f) | | 7,980,000 | | 8,065,464 |
Series 2002-C2 Class C2, 4.3781% 5/15/08 (f) | | 35,785,000 | | 35,817,626 |
Bayview Financial Acquisition Trust Series 2004-C Class A1, 3.9013% 5/28/44 (f) | | 8,416,440 | | 8,415,509 |
Bayview Financial Asset Trust Series 2000-F Class A, 3.9813% 9/28/43 (f) | | 9,618,786 | | 9,632,318 |
Bayview Financial Mortgage Loan Trust Series 2004-A Class A, 3.9313% 2/28/44 (f) | | 5,760,012 | | 5,771,599 |
Bear Stearns Asset Backed Securities I: | | | | |
Series 2005-HE2: | | | | |
Class M1, 3.96% 2/25/35 (f) | | 6,655,000 | | 6,639,262 |
Class M2, 4.21% 2/25/35 (f) | | 2,430,000 | | 2,432,538 |
Series 2005-HE5 Class 1A1, 3.4244% 6/25/35 (f) | | 10,884,395 | | 10,884,395 |
Capital Auto Receivables Asset Trust: | | | | |
Series 2002-5 Class B, 2.8% 4/15/08 | | 2,894,887 | | 2,868,235 |
Series 2003-1 Class B, 3.8581% 6/15/10 (c)(f) | | 5,781,229 | | 5,797,579 |
Series 2003-2 Class B, 3.6681% 1/15/09 (f) | | 2,741,542 | | 2,746,505 |
Series 2005-1 Class B, 3.7631% 6/15/10 (f) | | 5,725,000 | | 5,730,367 |
Capital One Auto Finance Trust: | | | | |
Series 2003-A Class A4B, 3.6681% 1/15/10 (f) | | 9,630,000 | | 9,654,568 |
Series 2004-B Class A4, 3.4981% 8/15/11 (f) | | 16,300,000 | | 16,303,123 |
Capital One Master Trust: | | | | |
Series 1999-3 Class B, 3.8681% 9/15/09 (f) | | 5,000,000 | | 5,004,082 |
Series 2001-1 Class B, 3.8981% 12/15/10 (f) | | 19,500,000 | | 19,638,608 |
Series 2001-8A Class B, 3.9381% 8/17/09 (f) | | 9,585,000 | | 9,634,206 |
Series 2002-4A Class B, 3.8881% 3/15/10 (f) | | 6,000,000 | | 6,028,221 |
Capital One Multi-Asset Execution Trust: | | | | |
Series 2002-B1 Class B1, 4.0681% 7/15/08 (f) | | 17,705,000 | | 17,711,976 |
Series 2003-B1 Class B1, 4.5581% 2/17/09 (f) | | 15,470,000 | | 15,566,773 |
Capital Trust Ltd. Series 2004-1: | | | | |
Class A2, 3.88% 7/20/39 (c)(f) | | 2,968,000 | | 2,968,000 |
Asset-Backed Securities - continued |
| Principal Amount | | Value |
Capital Trust Ltd. Series 2004-1: - continued | | | | |
Class B, 4.18% 7/20/39 (c)(f) | | $ 1,550,000 | | $ 1,550,000 |
Class C, 4.53% 7/20/39 (c)(f) | | 1,994,000 | | 1,994,000 |
CDC Mortgage Capital Trust: | | | | |
Series 2001-HE1 Class M1, 4.49% 1/25/32 (f) | | 4,244,221 | | 4,254,278 |
Series 2002-HE2 Class M1, 4.16% 1/25/33 (f) | | 9,278,431 | | 9,309,123 |
Series 2002-HE3: | | | | |
Class M1, 4.56% 3/25/33 (f) | | 21,339,884 | | 21,627,815 |
Class M2, 5.71% 3/25/33 (f) | | 9,968,976 | | 10,143,974 |
Series 2003-HE1: | | | | |
Class M1, 4.36% 8/25/33 (f) | | 1,989,998 | | 1,997,574 |
Class M2, 5.41% 8/25/33 (f) | | 4,369,996 | | 4,422,084 |
Series 2003-HE2 Class A, 3.81% 10/25/33 (f) | | 1,634,377 | | 1,635,405 |
Series 2003-HE3: | | | | |
Class M1, 4.16% 11/25/33 (f) | | 2,254,989 | | 2,271,960 |
Class M2, 5.21% 11/25/33 (f) | | 1,719,992 | | 1,753,552 |
Series 2004-HE2 Class M2, 4.66% 7/26/34 (f) | | 2,345,000 | | 2,365,939 |
Chase Credit Card Owner Trust: | | | | |
Series 2001-6 Class B, 3.8681% 3/16/09 (f) | | 1,305,000 | | 1,311,169 |
Series 2002-6 Class B, 3.7381% 1/15/08 (f) | | 11,850,000 | | 11,852,472 |
Series 2004-1 Class B, 3.5881% 5/15/09 (f) | | 4,105,000 | | 4,104,204 |
Citibank Credit Card Issuance Trust: | | | | |
Series 2000-C2 Class C2, 4.2488% 10/15/07 (f) | | 17,500,000 | | 17,511,349 |
Series 2001-B2 Class B2, 3.8494% 12/10/08 (f) | | 11,945,000 | | 11,995,341 |
Series 2002-B1 Class B1, 3.8% 6/25/09 (f) | | 9,010,000 | | 9,038,878 |
Series 2002-C1 Class C1, 4.2185% 2/9/09 (f) | | 17,500,000 | | 17,686,918 |
Series 2003-B1 Class B1, 3.66% 3/7/08 (f) | | 25,000,000 | | 25,022,693 |
Series 2003-C1 Class C1, 4.65% 4/7/10 (f) | | 17,785,000 | | 18,152,159 |
Citigroup Mortgage Loan Trust Series 2003-HE4 Class A, 3.87% 12/25/33 (c)(f) | | 7,985,107 | | 7,985,935 |
CNH Wholesale Master Note Trust Series 2005-1: | | | | |
Class A, 3.43% 6/15/11 (f) | | 18,000,000 | | 18,000,000 |
Class B, 3.72% 6/15/11 (f) | | 2,280,000 | | 2,280,000 |
Countrywide Home Loans, Inc.: | | | | |
Series 2002-6 Class AV1, 3.89% 5/25/33 (f) | | 1,499,863 | | 1,503,470 |
Series 2003-BC1 Class M2, 5.46% 9/25/32 (f) | | 11,065,000 | | 11,199,451 |
Series 2003-SD3 Class A1, 3.88% 12/25/32 (c)(f) | | 927,188 | | 931,926 |
Series 2004-2 Class M1, 3.96% 5/25/34 (f) | | 5,200,000 | | 5,206,719 |
Series 2004-3: | | | | |
Class 3A4, 3.71% 8/25/34 (f) | | 530,752 | | 528,596 |
Class M1, 3.96% 6/25/34 (f) | | 1,475,000 | | 1,476,356 |
Series 2004-4: | | | | |
Class A, 3.83% 8/25/34 (f) | | 2,524,088 | | 2,526,278 |
Asset-Backed Securities - continued |
| Principal Amount | | Value |
Countrywide Home Loans, Inc.: - continued | | | | |
Series 2004-4: | | | | |
Class M1, 3.94% 7/25/34 (f) | | $ 3,650,000 | | $ 3,653,189 |
Class M2, 3.99% 6/25/34 (f) | | 4,395,000 | | 4,398,536 |
Series 2005-1: | | | | |
Class 1AV2, 3.66% 7/25/35 (f) | | 8,780,000 | | 8,775,114 |
Class M1, 3.88% 8/25/35 (f) | | 19,600,000 | | 19,563,654 |
Class MV1, 3.86% 7/25/35 (f) | | 3,135,000 | | 3,130,219 |
Class MV2, 3.9% 7/25/35 (f) | | 3,765,000 | | 3,754,147 |
Class MV3, 3.94% 7/25/35 (f) | | 1,560,000 | | 1,557,748 |
Series 2005-3 Class MV1, 3.88% 8/25/35 (f) | | 11,125,000 | | 11,103,934 |
Series 2005-AB1 Class A2, 3.67% 8/25/35 (f) | | 17,520,000 | | 17,514,797 |
Series 2005-IM1 Class A1, 3.56% 8/25/34 (d)(f) | | 17,915,000 | | 17,915,000 |
CS First Boston Mortgage Securities Corp.: | | | | |
Series 2003-8 Class A2, 3.85% 4/25/34 (f) | | 2,663,075 | | 2,674,762 |
Series 2004-FRE1: | | | | |
Class A2, 3.81% 4/25/34 (f) | | 2,689,397 | | 2,689,291 |
Class M3, 4.11% 4/25/34 (f) | | 5,885,000 | | 5,884,751 |
Discover Card Master Trust I Series 2003-4 Class B1, 3.7181% 5/16/11 (f) | | 8,155,000 | | 8,196,815 |
Fannie Mae guaranteed REMIC pass thru certificates Series 2004-T5 Class AB3, 3.8305% 5/28/35 (f) | | 6,957,460 | | 6,959,877 |
Fieldstone Mortgage Investment Corp.: | | | | |
Series 2003-1: | | | | |
Class M1, 4.14% 11/25/33 (f) | | 1,300,000 | | 1,308,748 |
Class M2, 5.21% 11/25/33 (f) | | 700,000 | | 718,600 |
Series 2004-1 Class M2, 4.56% 1/25/35 (f) | | 3,700,000 | | 3,741,581 |
Series 2004-2 Class M2, 4.61% 7/25/34 (f) | | 9,890,000 | | 9,889,579 |
Series 2004-3 Class M5, 4.91% 8/25/34 (f) | | 2,000,000 | | 2,033,830 |
Series 2005-2 Class 2A1, 3.5% 7/25/36 (d)(f) | | 16,935,000 | | 16,935,000 |
First Franklin Mortgage Loan Asset Backed Certificates: | | | | |
Series 2005-FF2 Class A2A, 3.55% 3/25/35 (f) | | 7,354,604 | | 7,354,604 |
Series 2005-FF2 Class M6, 4.16% 3/25/35 (f) | | 6,950,000 | | 6,950,000 |
First Franklin Mortgage Loan Trust Series 2004-FF2: | | | | |
Class M3, 4.01% 3/25/34 (f) | | 400,000 | | 400,711 |
Class M4, 4.36% 3/25/34 (f) | | 300,000 | | 302,647 |
First USA Credit Card Master Trust Series 2001-4 Class B, 3.75% 1/12/09 (f) | | 15,000,000 | | 15,026,199 |
First USA Secured Note Trust Series 2001-3 Class C, 4.4669% 11/19/08 (c)(f) | | 11,580,000 | | 11,661,421 |
Ford Credit Auto Owner Trust Series 2003-B Class B2, 3.8181% 10/15/07 (f) | | 19,600,000 | | 19,671,950 |
Asset-Backed Securities - continued |
| Principal Amount | | Value |
Ford Credit Floorplan Master Owner Trust Series 2005-1: | | | | |
Class A, 3.5381% 5/17/10 (f) | | $ 9,590,000 | | $ 9,589,981 |
Class B, 3.6563% 5/17/10 (f) | | 2,625,000 | | 2,624,992 |
Fremont Home Loan Trust: | | | | |
Series 2004-1: | | | | |
Class 1A1, 3.68% 2/25/34 (f) | | 2,669,337 | | 2,669,232 |
Class M1, 3.91% 2/25/34 (f) | | 750,000 | | 749,968 |
Class M2, 3.96% 2/25/34 (f) | | 800,000 | | 799,966 |
Series 2004-C Class 2A2, 4.01% 8/25/34 (f) | | 10,000,000 | | 10,101,993 |
Series 2005-2 Class 2A1, 3.5913% 6/25/35 (f) | | 15,380,000 | | 15,375,194 |
Series 2005-A: | | | | |
Class 2A2, 3.7% 2/25/35 (f) | | 11,850,000 | | 11,865,657 |
Class M1, 3.89% 1/25/35 (f) | | 1,603,000 | | 1,599,854 |
Class M2, 3.92% 1/25/35 (f) | | 2,325,000 | | 2,321,531 |
Class M3, 3.95% 1/25/35 (f) | | 1,250,000 | | 1,249,947 |
Class M4, 4.14% 1/25/35 (f) | | 925,000 | | 927,535 |
GE Business Loan Trust Series 2003-1 Class A, 3.8181% 4/15/31 (c)(f) | | 5,499,865 | | 5,531,421 |
GE Capital Credit Card Master Note Trust Series 2005-2 Class B, 3.5736% 6/15/11 (f) | | 6,475,000 | | 6,473,058 |
Gracechurch Card Funding PLC: | | | | |
Series 5: | | | | |
Class B, 3.6181% 8/15/08 (f) | | 1,520,000 | | 1,521,351 |
Class C, 4.3181% 8/15/08 (f) | | 5,580,000 | | 5,601,142 |
Series 6 Class B, 3.5781% 2/17/09 (f) | | 1,030,000 | | 1,030,901 |
Series 8 Class C, 3.6721% 6/15/10 (f) | | 18,450,000 | | 18,450,000 |
GSAMP Trust: | | | | |
Series 2002-HE Class M1, 4.68% 11/20/32 (f) | | 2,882,888 | | 2,928,737 |
Series 2002-NC1: | | | | |
Class A2, 3.78% 7/25/32 (f) | | 54,777 | | 55,099 |
Class M1, 4.1% 7/25/32 (f) | | 8,861,000 | | 8,920,491 |
Series 2003-FM1 Class M1, 4.25% 3/20/33 (f) | | 15,000,000 | | 15,136,310 |
Series 2004-FM1: | | | | |
Class M1, 4.11% 11/25/33 (f) | | 2,865,000 | | 2,864,879 |
Class M2, 4.86% 11/25/33 (f) | | 1,975,000 | | 2,005,597 |
Series 2004-FM2: | | | | |
Class M1, 3.96% 1/25/34 (f) | | 3,500,000 | | 3,499,853 |
Class M2, 4.56% 1/25/34 (f) | | 1,500,000 | | 1,499,936 |
Class M3, 4.76% 1/25/34 (f) | | 1,500,000 | | 1,499,935 |
Series 2004-HE1: | | | | |
Class M1, 4.01% 5/25/34 (f) | | 4,045,000 | | 4,044,829 |
Class M2, 4.61% 5/25/34 (f) | | 1,750,000 | | 1,766,258 |
Asset-Backed Securities - continued |
| Principal Amount | | Value |
GSAMP Trust: - continued | | | | |
Series 2005-9 Class 2A1, 3.5287% 8/25/35 (f) | | $ 17,530,000 | | $ 17,530,000 |
Series 2005-FF2 Class M5, 4.09% 3/25/35 (f) | | 3,500,000 | | 3,500,000 |
Series 2005-HE2 Class M, 3.89% 3/25/35 (f) | | 8,780,000 | | 8,749,867 |
Series 2005-NC1 Class M1, 3.91% 2/25/35 (f) | | 9,010,000 | | 8,987,296 |
Guggenheim Structured Real Estate Funding Ltd. Series 2005-1 Class C, 4.3944% 5/25/30 (c)(f) | | 14,000,000 | | 13,986,652 |
HFC Home Equity Loan Asset Backed Certificates Series 2005-2: | | | | |
Class M1, 3.97% 1/20/34 (f) | | 3,225,000 | | 3,225,000 |
Class M2, 4% 1/20/34 (f) | | 2,415,000 | | 2,415,000 |
Home Equity Asset Trust: | | | | |
Series 2002-2 Class M1, 4.26% 6/25/32 (f) | | 10,000,000 | | 10,017,090 |
Series 2002-3 Class A5, 3.9% 2/25/33 (f) | | 854,528 | | 855,194 |
Series 2002-4 Class A3, 3.94% 3/25/33 (f) | | 1,237,388 | | 1,238,074 |
Series 2002-5: | | | | |
Class A3, 3.98% 5/25/33 (f) | | 2,866,793 | | 2,872,821 |
Class M1, 4.66% 5/25/33 (f) | | 13,800,000 | | 13,966,276 |
Series 2003-1: | | | | |
Class A2, 3.93% 6/25/33 (f) | | 4,229,596 | | 4,233,111 |
Class M1, 4.46% 6/25/33 (f) | | 8,335,000 | | 8,375,317 |
Series 2003-2: | | | | |
Class A2, 3.84% 8/25/33 (f) | | 228,269 | | 229,139 |
Class M1, 4.34% 8/25/33 (f) | | 2,245,000 | | 2,269,298 |
Series 2003-3: | | | | |
Class A2, 3.82% 8/25/33 (f) | | 1,624,262 | | 1,630,339 |
Class M1, 4.32% 8/25/33 (f) | | 8,185,000 | | 8,266,814 |
Series 2003-4: | | | | |
Class M1, 4.26% 10/25/33 (f) | | 3,415,000 | | 3,440,384 |
Class M2, 5.36% 10/25/33 (f) | | 4,040,000 | | 4,093,038 |
Series 2003-5: | | | | |
Class A2, 3.81% 12/25/33 (f) | | 5,822,876 | | 5,843,440 |
Class M1, 4.16% 12/25/33 (f) | | 3,175,000 | | 3,192,660 |
Class M2, 5.19% 12/25/33 (f) | | 1,345,000 | | 1,377,487 |
Series 2003-7 Class A2, 3.84% 3/25/34 (f) | | 3,430,379 | | 3,438,503 |
Series 2004-2 Class A2, 3.75% 7/25/34 (f) | | 6,172,348 | | 6,172,139 |
Series 2004-3: | | | | |
Class M1, 4.03% 8/25/34 (f) | | 2,015,000 | | 2,019,636 |
Class M2, 4.66% 8/25/34 (f) | | 2,200,000 | | 2,237,373 |
Series 2004-4 Class A2, 3.78% 10/25/34 (f) | | 8,318,527 | | 8,347,783 |
Series 2004-6 Class A2, 3.81% 12/25/34 (f) | | 9,249,309 | | 9,278,715 |
Series 2004-7 Class A3, 3.85% 1/25/35 (f) | | 2,916,946 | | 2,929,856 |
Asset-Backed Securities - continued |
| Principal Amount | | Value |
Home Equity Asset Trust: - continued | | | | |
Series 2005-1: | | | | |
Class M1, 3.89% 5/25/35 (f) | | $ 9,705,000 | | $ 9,697,565 |
Class M2, 3.91% 5/25/35 (f) | | 5,780,000 | | 5,763,067 |
Class M3, 3.96% 5/25/35 (f) | | 5,825,000 | | 5,808,344 |
Series 2005-2: | | | | |
Class 2A2, 3.66% 7/25/35 (f) | | 13,170,000 | | 13,163,182 |
Class M1, 3.91% 7/25/35 (f) | | 10,085,000 | | 10,075,362 |
Series 2005-3 Class M1, 3.87% 8/25/35 (f) | | 9,450,000 | | 9,434,700 |
Series 2005-5 Class 2A2, 3.65% 11/25/35 (d)(f) | | 15,000,000 | | 14,968,605 |
Household Affinity Credit Card Master Note Trust I Series 2003-3 Class B, 3.6781% 8/15/08 (f) | | 10,000,000 | | 10,018,071 |
Household Credit Card Master Trust I Series 2002-1 Class B, 4.0381% 7/15/08 (f) | | 22,589,000 | | 22,608,682 |
Household Home Equity Loan Trust: | | | | |
Series 2002-2 Class A, 3.73% 4/20/32 (f) | | 3,295,048 | | 3,298,089 |
Series 2002-3 Class A, 3.88% 7/20/32 (f) | | 2,678,218 | | 2,681,775 |
Series 2003-1 Class M, 4.06% 10/20/32 (f) | | 770,987 | | 771,866 |
Series 2003-2: | | | | |
Class A, 3.76% 9/20/33 (f) | | 2,892,082 | | 2,897,777 |
Class M, 4.01% 9/20/33 (f) | | 1,360,000 | | 1,362,941 |
Series 2004-1 Class M, 3.95% 9/20/33 (f) | | 2,708,464 | | 2,713,597 |
Household Mortgage Loan Trust: | | | | |
Series 2003-HC1 Class M, 4.08% 2/20/33 (f) | | 1,742,776 | | 1,748,262 |
Series 2004-HC1: | | | | |
Class A, 3.78% 2/20/34 (f) | | 5,083,992 | | 5,096,702 |
Class M, 3.93% 2/20/34 (f) | | 3,073,800 | | 3,073,443 |
Household Private Label Credit Card Master Note Trust I: | | | | |
Series 2002-1 Class B, 3.9381% 1/18/11 (f) | | 8,850,000 | | 8,867,619 |
Series 2002-2: | | | | |
Class A, 3.5581% 1/18/11 (f) | | 9,000,000 | | 9,012,218 |
Class B, 3.9381% 1/18/11 (f) | | 14,275,000 | | 14,355,952 |
Series 2002-3 Class B, 4.6381% 9/15/09 (f) | | 4,150,000 | | 4,159,262 |
Ikon Receivables Funding LLC Series 2003-1 Class A3A, 3.6213% 12/17/07 (f) | | 2,781,207 | | 2,781,863 |
IXIS Real Estate Capital Trust Series 2005-HE1: | | | | |
Class A1, 3.71% 6/25/35 (f) | | 11,646,350 | | 11,645,706 |
Class M1, 3.93% 6/25/35 (f) | | 4,100,000 | | 4,094,813 |
Class M2, 3.95% 6/25/35 (f) | | 2,775,000 | | 2,766,003 |
Class M3, 3.98% 6/25/35 (f) | | 1,975,000 | | 1,972,566 |
Keycorp Student Loan Trust Series 1999-A Class A2, 3.8% 12/27/09 (f) | | 16,169,548 | | 16,224,493 |
Asset-Backed Securities - continued |
| Principal Amount | | Value |
Long Beach Mortgage Loan Trust: | | | | |
Series 2003-2: | | | | |
Class AV, 3.78% 6/25/33 (f) | | $ 253,078 | | $ 253,185 |
Class M1, 4.28% 6/25/33 (f) | | 19,500,000 | | 19,626,153 |
Series 2003-3 Class M1, 4.21% 7/25/33 (f) | | 7,770,000 | | 7,824,625 |
Series 2004-2: | | | | |
Class M1, 3.99% 6/25/34 (f) | | 4,275,000 | | 4,285,404 |
Class M2, 4.54% 6/25/34 (f) | | 1,400,000 | | 1,416,723 |
Series 2005-2 Class 2A2, 3.64% 4/25/35 (f) | | 12,000,000 | | 11,996,998 |
MASTR Asset Backed Securities Trust: | | | | |
Series 2003-NC1: | | | | |
Class M1, 4.19% 4/25/33 (f) | | 3,500,000 | | 3,519,270 |
Class M2, 5.31% 4/25/33 (f) | | 1,500,000 | | 1,534,429 |
Series 2004-FRE1 Class M1, 4.01% 7/25/34 (f) | | 5,223,000 | | 5,238,948 |
MBNA Asset Backed Note Trust Series 2000-K Class C, 4.1881% 3/17/08 (c)(f) | | 7,250,000 | | 7,258,700 |
MBNA Credit Card Master Note Trust: | | | | |
Series 2001-B1 Class B1, 3.7631% 10/15/08 (f) | | 30,000,000 | | 30,042,072 |
Series 2001-B2 Class B2, 3.7481% 1/15/09 (f) | | 30,353,000 | | 30,429,933 |
Series 2002-B2 Class B2, 3.7681% 10/15/09 (f) | | 20,000,000 | | 20,086,600 |
Series 2002-B3 Class B3, 3.7881% 1/15/08 (f) | | 15,000,000 | | 15,000,470 |
Series 2002-B4 Class B4, 3.8881% 3/15/10 (f) | | 14,800,000 | | 14,916,873 |
Series 2003-B2 Class B2, 3.7781% 10/15/10 (f) | | 1,530,000 | | 1,545,569 |
Series 2003-B3 Class B3, 3.7631% 1/18/11 (f) | | 1,130,000 | | 1,135,362 |
Series 2003-B5 Class B5, 3.7581% 2/15/11 (f) | | 705,000 | | 710,447 |
MBNA Master Credit Card Trust II: | | | | |
Series 1998-E Class B, 3.9288% 9/15/10 (f) | | 7,800,000 | | 7,846,570 |
Series 1998-G Class B, 3.7881% 2/17/09 (f) | | 20,000,000 | | 20,043,574 |
Meritage Mortgage Loan Trust Series 2004-1: | | | | |
Class M1, 3.96% 7/25/34 (f) | | 2,125,000 | | 2,124,911 |
Class M2, 4.01% 7/25/34 (f) | | 375,000 | | 374,985 |
Class M3, 4.41% 7/25/34 (f) | | 775,000 | | 774,967 |
Class M4, 4.56% 7/25/34 (f) | | 525,000 | | 524,978 |
Merrill Lynch Mortgage Investors, Inc. Series 2003-HE1 Class M1, 4.16% 7/25/34 (f) | | 2,321,000 | | 2,330,928 |
Morgan Stanley ABS Capital I, Inc.: | | | | |
Series 2002-NC6 Class M2, 5.56% 11/25/32 (f) | | 2,370,000 | | 2,441,680 |
Series 2003-NC5 Class M2, 5.46% 4/25/33 (f) | | 2,800,000 | | 2,834,138 |
Series 2003-NC6 Class M2, 5.41% 6/27/33 (f) | | 12,835,000 | | 13,180,825 |
Series 2003-NC7 Class M1, 4.16% 6/25/33 (f) | | 1,785,000 | | 1,791,357 |
Series 2003-NC8 Class M1, 4.16% 9/25/33 (f) | | 2,350,000 | | 2,363,472 |
Series 2004-HE6 Class A2, 3.8% 8/25/34 (f) | | 7,193,690 | | 7,217,222 |
Series 2004-NC2 Class M1, 4.01% 12/25/33 (f) | | 2,595,000 | | 2,599,359 |
Asset-Backed Securities - continued |
| Principal Amount | | Value |
Morgan Stanley ABS Capital I, Inc.: - continued | | | | |
Series 2004-NC6 Class A2, 3.8% 7/25/34 (f) | | $ 3,163,358 | | $ 3,170,145 |
Series 2005-1: | | | | |
Class M2, 3.93% 12/25/34 (f) | | 4,425,000 | | 4,417,835 |
Class M3, 3.98% 12/25/34 (f) | | 4,000,000 | | 3,998,266 |
Series 2005-HE1: | | | | |
Class A3B, 3.68% 12/25/34 (f) | | 3,885,000 | | 3,889,266 |
Class M1, 3.91% 12/25/34 (f) | | 1,100,000 | | 1,102,253 |
Class M2, 3.93% 12/25/34 (f) | | 2,970,000 | | 2,966,369 |
Series 2005-HE2: | | | | |
Class M1, 3.86% 1/25/35 (f) | | 2,665,000 | | 2,670,502 |
Class M2, 3.9% 1/25/35 (f) | | 1,900,000 | | 1,893,810 |
Series 2005-NC1: | | | | |
Class M1, 3.9% 1/25/35 (f) | | 2,425,000 | | 2,432,731 |
Class M2, 3.93% 1/25/35 (f) | | 2,425,000 | | 2,421,056 |
Class M3, 3.97% 1/25/35 (f) | | 2,425,000 | | 2,425,850 |
Morgan Stanley Dean Witter Capital I Trust: | | | | |
Series 2001-AM1: | | | | |
Class M1, 4.31% 2/25/32 (f) | | 1,510,288 | | 1,513,954 |
Class M2, 4.86% 2/25/32 (f) | | 7,146,795 | | 7,171,201 |
Series 2001-NC4: | | | | |
Class M1, 4.46% 1/25/32 (f) | | 3,827,881 | | 3,841,816 |
Series 2002-AM3 Class A3, 3.95% 2/25/33 (f) | | 1,426,624 | | 1,430,581 |
Series 2002-HE1 Class M1, 4.06% 7/25/32 (f) | | 5,860,000 | | 5,893,149 |
Series 2002-HE2 Class M1, 4.16% 8/25/32 (f) | | 9,925,000 | | 9,970,606 |
Series 2002-NC3 Class A3, 3.8% 8/25/32 (f) | | 396,299 | | 397,573 |
Series 2002-OP1 Class M1, 4.21% 9/25/32 (f) | | 3,894,745 | | 3,917,849 |
Series 2003-NC1: | | | | |
Class M1, 4.51% 11/25/32 (f) | | 2,555,000 | | 2,572,380 |
Class M2, 5.51% 11/25/32 (f) | | 1,880,000 | | 1,899,041 |
New Century Home Equity Loan Trust: | | | | |
Series 2003-2: | | | | |
Class A2, 3.89% 1/25/33 (f) | | 341,254 | | 341,436 |
Class M2, 5.46% 1/25/33 (f) | | 4,600,000 | | 4,667,174 |
Series 2003-6 Class M1, 4.18% 1/25/34 (f) | | 5,180,000 | | 5,202,952 |
Series 2005-1: | | | | |
Class M1, 3.91% 3/25/35 (f) | | 4,395,000 | | 4,392,950 |
Class M2, 3.94% 3/25/35 (f) | | 4,395,000 | | 4,384,834 |
Class M3, 3.98% 3/25/35 (f) | | 2,120,000 | | 2,120,796 |
Nissan Auto Lease Trust: | | | | |
Series 2003-A Class A3A, 3.5281% 6/15/09 (f) | | 13,621,752 | | 13,633,434 |
Series 2004-A Class A4A, 3.4581% 6/15/10 (f) | | 10,570,000 | | 10,582,978 |
Asset-Backed Securities - continued |
| Principal Amount | | Value |
NovaStar Home Equity Loan Series 2004-1: | | | | |
Class M1, 3.91% 6/25/34 (f) | | $ 1,450,000 | | $ 1,451,222 |
Class M4, 4.435% 6/25/34 (f) | | 2,435,000 | | 2,439,150 |
Ocala Funding LLC Series 2005-1A Class A, 4.93% 3/20/10 (c)(f) | | 3,675,000 | | 3,675,000 |
Ownit Mortgage Loan Asste-Backed Certificates Series 2005-3 Class A2A, 3.5% 6/25/36 (f) | | 15,500,000 | | 15,500,000 |
Park Place Securities, Inc.: | | | | |
Series 2004-WCW1: | | | | |
Class M1, 4.09% 9/25/34 (f) | | 3,745,000 | | 3,756,721 |
Class M2, 4.14% 9/25/34 (f) | | 1,755,000 | | 1,764,326 |
Class M3, 4.71% 9/25/34 (f) | | 3,355,000 | | 3,396,745 |
Class M4, 4.91% 9/25/34 (f) | | 4,700,000 | | 4,767,614 |
Series 2004-WCW2 Class A2, 3.84% 10/25/34 (f) | | 7,952,623 | | 7,976,111 |
Series 2005-WCH1: | | | | |
Class A3B, 3.68% 1/25/35 (f) | | 2,775,000 | | 2,779,908 |
Class M2, 3.98% 1/25/35 (f) | | 4,175,000 | | 4,166,539 |
Class M3, 4.02% 1/25/35 (f) | | 3,290,000 | | 3,292,599 |
Class M5, 4.34% 1/25/35 (f) | | 3,095,000 | | 3,104,620 |
Series 2005-WHQ2 Class M7, 4.71% 5/25/35 (f) | | 5,950,000 | | 5,930,787 |
People's Choice Home Loan Securities Trust Series 2005-2: | | | | |
Class A1, 3.57% 9/25/24 (f) | | 7,475,790 | | 7,475,790 |
Class M4, 4.09% 5/25/35 (f) | | 6,000,000 | | 6,000,000 |
Providian Gateway Master Trust Series 2002-B Class A, 4.0881% 6/15/09 (c)(f) | | 15,000,000 | | 15,039,393 |
Residental Asset Securities Corp.: | | | | |
Series 2005-KS4 Class M2, 4.04% 4/25/35 (f) | | 1,040,000 | | 1,037,610 |
Series 2005-KS7 Class A1, 3.4781% 8/25/35 (f) | | 10,515,000 | | 10,512,897 |
Residential Asset Mortgage Products, Inc. Series 2004-RS10 Class MII2, 4.71% 10/25/34 (f) | | 5,500,000 | | 5,566,857 |
Salomon Brothers Mortgage Securities VII, Inc. Series 2003-HE1 Class A, 3.86% 4/25/33 (f) | | 818,316 | | 822,076 |
Saxon Asset Securities Trust: | | | | |
Series 2004-1 Class M1, 3.99% 3/25/35 (f) | | 4,415,000 | | 4,413,887 |
Series 2004-2 Class MV1, 4.04% 8/25/35 (f) | | 4,495,000 | | 4,501,043 |
Sears Credit Account Master Trust II: | | | | |
Series 2001-1 Class B, 3.8131% 2/15/10 (f) | | 10,000,000 | | 9,987,143 |
Series 2002-4: | | | | |
Class A, 3.5181% 8/18/09 (f) | | 27,000,000 | | 26,999,603 |
Class B, 3.8131% 8/18/09 (f) | | 33,300,000 | | 33,301,149 |
Series 2002-5 Class B, 4.6381% 11/17/09 (f) | | 30,000,000 | | 30,062,976 |
Asset-Backed Securities - continued |
| Principal Amount | | Value |
Securitized Asset Backed Receivables LLC Trust Series 2004-NC1 Class M1, 3.98% 2/25/34 (f) | | $ 2,910,000 | | $ 2,909,256 |
Specialty Underwriting & Residential Finance Series 2003-BC4 Class M1, 4.06% 11/25/34 (f) | | 1,810,000 | | 1,818,452 |
Structured Asset Securities Corp. Series 2004-GEL1 Class A, 3.82% 2/25/34 (f) | | 1,043,424 | | 1,043,422 |
Superior Wholesale Inventory Financing Trust VII Series 2003-A8 Class CTFS, 3.8381% 3/15/11 (c)(f) | | 10,835,000 | | 10,828,228 |
Superior Wholesale Inventory Financing Trust XII Series 2005-A12 Class C, 4.46% 6/15/10 (f) | | 6,840,000 | | 6,839,945 |
Terwin Mortgage Trust: | | | | |
Series 2003-4HE Class A1, 3.89% 9/25/34 (f) | | 2,878,990 | | 2,894,593 |
Series 2003-6HE Class A1, 3.93% 11/25/33 (f) | | 1,784,384 | | 1,788,543 |
Series 2005-14HE Class AF1, 3.9753% 7/25/36 (d)(f) | | 8,635,000 | | 8,633,296 |
TOTAL ASSET-BACKED SECURITIES (Cost $2,293,954,229) | 2,300,747,332 |
Collateralized Mortgage Obligations - 16.9% |
|
Private Sponsor - 13.7% |
Adjustable Rate Mortgage Trust floater: | | | | |
Series 2004-2 Class 7A3, 3.86% 2/25/35 (f) | | 9,374,471 | | 9,396,037 |
Series 2004-4 Class 5A2, 3.86% 3/25/35 (f) | | 3,780,419 | | 3,787,953 |
Series 2005-1 Class 5A2, 3.79% 5/25/35 (f) | | 6,187,250 | | 6,191,166 |
Series 2005-2: | | | | |
Class 6A2, 3.74% 6/25/35 (f) | | 2,930,592 | | 2,932,491 |
Class 6M2, 3.94% 6/25/35 (f) | | 10,145,000 | | 10,145,010 |
Series 2005-3 Class 8A2, 3.7% 7/25/35 (f) | | 19,199,197 | | 19,211,695 |
Series 2005-4 Class 7A2, 3.69% 8/25/35 (f) | | 9,011,457 | | 9,003,527 |
Series 2005-8 Class 7A2, 3.77% 11/25/35 (f) | | 7,660,000 | | 7,660,000 |
Bear Stearns Alt-A Trust floater: | | | | |
Series 2005-1 Class A1, 3.74% 1/25/35 (f) | | 20,354,186 | | 20,354,186 |
Series 2005-2 Class 1A1, 3.71% 3/25/35 (f) | | 14,961,065 | | 14,961,065 |
Series 2005-5 Class 1A1, 3.68% 7/25/35 (f) | | 18,707,862 | | 18,696,170 |
Countrywide Alternative Loan Trust planned amortization class Series 2003-5T2 Class A2, 3.86% 5/25/33 (f) | | 5,545,033 | | 5,548,017 |
Countrywide Home Loans, Inc. floater: | | | | |
Series 2004-16 Class A1, 3.86% 9/25/34 (f) | | 10,335,456 | | 10,325,843 |
Series 2005-1 Class 2A1, 3.75% 3/25/35 (f) | | 14,617,171 | | 14,617,171 |
CS First Boston Mortgage Securities Corp. floater: | | | | |
Series 2004-AR2 Class 6A1, 3.86% 3/25/34 (f) | | 5,338,263 | | 5,334,945 |
Collateralized Mortgage Obligations - continued |
| Principal Amount | | Value |
Private Sponsor - continued |
CS First Boston Mortgage Securities Corp. floater: - continued | | | | |
Series 2004-AR3 Class 6A2, 3.83% 4/25/34 (f) | | $ 2,226,193 | | $ 2,228,162 |
Series 2004-AR4 Class 5A2, 3.83% 5/25/34 (f) | | 2,066,310 | | 2,065,052 |
Series 2004-AR5 Class 11A2, 3.83% 6/25/34 (f) | | 2,987,552 | | 2,981,472 |
Series 2004-AR6 Class 9A2, 3.83% 10/25/34 (f) | | 3,981,028 | | 3,983,412 |
Series 2004-AR7 Class 6A2, 3.84% 8/25/34 (f) | | 5,801,660 | | 5,806,785 |
Series 2004-AR8 Class 8A2, 3.84% 9/25/34 (f) | | 4,630,225 | | 4,638,807 |
First Horizon Mortgage Passthru Trust floater Series 2004-FL1 Class 2A1, 3.95% 12/25/34 (f) | | 4,384,853 | | 4,379,779 |
Granite Master Issuer PLC floater: | | | | |
Series 2005-1: | | | | |
Class A3, 3.51% 12/21/24 (f) | | 5,300,000 | | 5,299,006 |
Class B1, 3.56% 12/20/54 (f) | | 7,050,000 | | 7,047,577 |
Class M1, 3.66% 12/20/54 (f) | | 5,300,000 | | 5,298,178 |
Series 2005-2 Class C1, 3.7857% 12/20/54 (f) | | 7,975,000 | | 7,972,508 |
Granite Mortgages PLC floater: | | | | |
Series 2004-1: | | | | |
Class 1B, 3.64% 3/20/44 (f) | | 1,415,000 | | 1,414,844 |
Class 1C, 4.33% 3/20/44 (f) | | 4,075,000 | | 4,091,219 |
Class 1M, 3.84% 3/20/44 (f) | | 4,935,000 | | 4,938,751 |
Series 2004-2: | | | | |
Class 1A2, 3.5% 6/20/28 (f) | | 5,384,259 | | 5,384,932 |
Class 1B, 3.6% 6/20/44 (f) | | 1,018,055 | | 1,018,309 |
Class 1C, 4.13% 6/20/44 (f) | | 3,706,295 | | 3,713,918 |
Class 1M, 3.71% 6/20/44 (f) | | 2,722,846 | | 2,724,205 |
Series 2004-3: | | | | |
Class 1B, 3.59% 9/20/44 (f) | | 2,100,000 | | 2,100,210 |
Class 1C, 4.02% 9/20/44 (f) | | 5,415,000 | | 5,426,913 |
Class 1M, 3.7% 9/20/44 (f) | | 1,200,000 | | 1,200,360 |
Harborview Mortgage Loan Trust floater Series 2005-2 Class 2A1A, 3.6369% 5/19/35 (f) | | 11,690,145 | | 11,648,134 |
Holmes Financing No. 7 PLC floater Series 2 Class M, 4.3988% 7/15/40 (f) | | 2,560,000 | | 2,564,912 |
Holmes Financing No. 8 PLC floater Series 2: | | | | |
Class A, 3.6788% 4/15/11 (f) | | 25,000,000 | | 25,000,000 |
Class B, 3.7688% 7/15/40 (f) | | 2,695,000 | | 2,696,684 |
Class C, 4.3188% 7/15/40 (f) | | 10,280,000 | | 10,328,193 |
Home Equity Asset Trust floater Series 2005-3 Class 2A1, 3.55% 8/25/35 (f) | | 7,268,025 | | 7,266,230 |
Homestar Mortgage Acceptance Corp. floater Series 2004-5 Class A1, 3.91% 10/25/34 (f) | | 4,495,430 | | 4,509,337 |
Collateralized Mortgage Obligations - continued |
| Principal Amount | | Value |
Private Sponsor - continued |
Impac CMB Trust floater: | | | | |
Series 2004-11 Class 2A2, 3.83% 3/25/35 (f) | | $ 8,638,669 | | $ 8,636,982 |
Series 2004-6 Class 1A2, 3.85% 10/25/34 (f) | | 3,481,529 | | 3,487,748 |
Series 2005-1: | | | | |
Class M1, 3.92% 4/25/35 (f) | | 3,223,929 | | 3,220,529 |
Class M2, 3.96% 4/25/35 (f) | | 5,644,146 | | 5,639,516 |
Class M3, 3.99% 4/25/35 (f) | | 1,384,927 | | 1,383,466 |
Class M4, 4.21% 4/25/35 (f) | | 817,334 | | 818,164 |
Class M5, 4.23% 4/25/35 (f) | | 817,334 | | 817,174 |
Class M6, 4.28% 4/25/35 (f) | | 1,307,734 | | 1,307,479 |
Series 2005-2 Class 1A2, 3.77% 4/25/35 (f) | | 13,211,515 | | 13,201,194 |
Series 2005-3 Class A1, 3.7% 8/25/35 (f) | | 15,176,045 | | 15,149,962 |
Series 2005-4 Class 1B1, 4.76% 6/25/35 (f) | | 5,306,886 | | 5,282,839 |
Lehman Structured Securities Corp. floater Series 2005-1 Class A2, 3.67% 9/26/45 (c)(f) | | 16,153,164 | | 16,153,164 |
MASTR Adjustable Rate Mortgages Trust: | | | | |
floater Series 2005-1 Class 1A1, 3.73% 3/25/35 (f) | | 13,405,372 | | 13,396,993 |
Series 2004-6 Class 4A2, 4.1729% 7/25/34 (f) | | 5,969,000 | | 5,946,582 |
Merrill Lynch Mortgage Investors, Inc. floater: | | | | |
Series 2003-A Class 2A1, 3.85% 3/25/28 (f) | | 8,079,308 | | 8,122,924 |
Series 2003-B Class A1, 3.8% 4/25/28 (f) | | 7,852,610 | | 7,898,403 |
Series 2003-D Class A, 3.77% 8/25/28 (f) | | 7,479,616 | | 7,494,804 |
Series 2003-E Class A2, 3.4425% 10/25/28 (f) | | 10,687,128 | | 10,687,143 |
Series 2003-F Class A2, 3.7075% 10/25/28 (f) | | 12,892,959 | | 12,891,486 |
Series 2004-A Class A2, 3.6175% 4/25/29 (f) | | 11,584,437 | | 11,556,917 |
Series 2004-B Class A2, 3.79% 6/25/29 (f) | | 8,952,030 | | 8,930,464 |
Series 2004-C Class A2, 3.95% 7/25/29 (f) | | 12,856,157 | | 12,825,407 |
Series 2004-D Class A2, 3.4725% 9/25/29 (f) | | 9,971,432 | | 9,974,033 |
Series 2004-E: | | | | |
Class A2B, 3.7275% 11/25/29 (f) | | 8,523,921 | | 8,502,874 |
Class A2D, 3.9175% 11/25/29 (f) | | 1,982,307 | | 1,991,830 |
Series 2004-G Class A2, 3.95% 11/25/29 (f) | | 3,854,828 | | 3,854,422 |
Series 2005-A Class A2, 3.38% 2/25/30 (f) | | 10,800,867 | | 10,785,319 |
Mortgage Asset Backed Securities Trust floater Series 2002-NC1 Class M1, 4.31% 10/25/32 (f) | | 4,538,551 | | 4,555,535 |
MortgageIT Trust floater: | | | | |
Series 2004-2: | | | | |
Class A1, 3.83% 12/25/34 (f) | | 4,920,628 | | 4,927,758 |
Class A2, 3.91% 12/25/34 (f) | | 6,656,800 | | 6,696,298 |
Series 2005-2 Class 1A1, 3.72% 5/25/35 (f) | | 5,093,718 | | 5,097,498 |
Opteum Mortgage Acceptance Corp. floater Series 2005-3 Class APT, 3.75% 6/25/35 (f) | | 19,112,336 | | 19,123,533 |
Collateralized Mortgage Obligations - continued |
| Principal Amount | | Value |
Private Sponsor - continued |
Permanent Financing No. 1 PLC floater Series 1 Class 2C, 4.5594% 6/10/42 (f) | | $ 1,745,000 | | $ 1,749,384 |
Permanent Financing No. 3 PLC floater Series 2 Class C, 4.4294% 6/10/42 (f) | | 4,845,000 | | 4,893,450 |
Permanent Financing No. 4 PLC floater Series 2 Class C, 4.0994% 6/10/42 (f) | | 15,400,000 | | 15,475,306 |
Permanent Financing No. 5 PLC floater: | | | | |
Series 2 Class C, 4.0294% 6/10/42 (f) | | 4,215,000 | | 4,234,760 |
Series 3 Class C, 4.1994% 6/10/42 (f) | | 8,890,000 | | 8,967,788 |
Permanent Financing No. 6 PLC floater Series 6: | | | | |
Class 1C, 3.7294% 6/10/42 (f) | | 4,000,000 | | 4,000,572 |
Class 2C, 3.8294% 6/10/42 (f) | | 5,350,000 | | 5,352,343 |
Permanent Financing No. 7 PLC floater Series 7: | | | | |
Class 1B, 3.4694% 6/10/42 (f) | | 2,000,000 | | 1,999,375 |
Class 1C, 3.6594% 6/10/42 (f) | | 3,840,000 | | 3,838,800 |
Class 2C, 3.7094% 6/10/42 (f) | | 8,065,000 | | 8,054,919 |
Permanent Financing No. 8 PLC floater Series 8: | | | | |
Class 1C, 3.7475% 6/10/42 (f) | | 7,165,000 | | 7,162,621 |
Class 2C, 3.8175% 6/10/42 (f) | | 9,945,000 | | 9,941,688 |
Residential Asset Mortgage Products, Inc. sequential pay Series 2003-SL1 Class A31, 7.125% 4/25/31 | | 4,643,507 | | 4,727,342 |
Residential Finance LP/Residential Finance Development Corp. floater Series 2003-A: | | | | |
Class B4, 5.15% 3/10/35 (c)(f) | | 5,492,986 | | 5,575,381 |
Class B5, 5.7% 3/10/35 (c)(f) | | 5,684,725 | | 5,811,417 |
Residential Funding Securities Corp.: | | | | |
Series 2003-RP1 Class A1, 3.96% 11/25/34 (f) | | 2,829,110 | | 2,840,739 |
Series 2003-RP2 Class A1, 3.93% 6/25/33 (c)(f) | | 3,866,185 | | 3,881,108 |
Sequoia Mortgage Trust floater: | | | | |
Series 2003-5 Class A2, 3.41% 9/20/33 (f) | | 10,999,101 | | 10,996,236 |
Series 2003-7 Class A2, 2.885% 1/20/34 (f) | | 9,577,708 | | 9,569,385 |
Series 2004-1 Class A, 4.15% 2/20/34 (f) | | 6,379,791 | | 6,373,993 |
Series 2004-10 Class A4, 3.6681% 11/20/34 (f) | | 10,424,803 | | 10,408,138 |
Series 2004-3 Class A, 3.5463% 5/20/34 (f) | | 10,662,486 | | 10,588,333 |
Series 2004-4 Class A, 3.5881% 5/20/34 (f) | | 13,430,919 | | 13,399,990 |
Series 2004-5 Class A3, 3.77% 6/20/34 (f) | | 8,904,038 | | 8,897,082 |
Series 2004-6: | | | | |
Class A3A, 4.1475% 6/20/35 (f) | | 8,182,127 | | 8,176,739 |
Class A3B, 3.16% 7/20/34 (f) | | 1,022,766 | | 1,021,950 |
Series 2004-7: | | | | |
Class A3A, 3.2275% 8/20/34 (f) | | 7,642,675 | | 7,636,475 |
Class A3B, 3.4525% 7/20/34 (f) | | 1,375,260 | | 1,380,167 |
Collateralized Mortgage Obligations - continued |
| Principal Amount | | Value |
Private Sponsor - continued |
Sequoia Mortgage Trust floater: - continued | | | | |
Series 2004-8 Class A2, 3.45% 9/20/34 (f) | | $ 14,155,710 | | $ 14,148,404 |
Series 2005-1 Class A2, 3.68% 2/20/35 (f) | | 7,355,282 | | 7,354,362 |
Series 2005-2 Class A2, 3.36% 3/20/35 (f) | | 13,876,523 | | 13,876,523 |
Series 2005-3 Class A1, 3.46% 5/20/35 (f) | | 9,217,677 | | 9,217,677 |
Structured Adjustable Rate Mortgage Loan Trust floater Series 2001-14 Class A1, 3.77% 7/25/35 (f) | | 11,201,095 | | 11,201,095 |
Structured Asset Securities Corp. floater Series 2004-NP1 Class A, 3.86% 9/25/33 (c)(f) | | 2,553,470 | | 2,555,084 |
Thornburg Mortgage Securities Trust floater Series 2004-3 Class A, 3.83% 9/25/34 (f) | | 22,068,069 | | 22,129,394 |
WAMU Mortgage pass thru certificates: | | | | |
floater Series 2005-AR6 Class 2A-1A, 3.5448% 4/25/45 (f) | | 6,133,307 | | 6,133,607 |
Series 2005 AR11 Class A1C1, 3.6675% 8/25/40 (d)(f) | | 14,400,000 | | 14,400,000 |
Wells Fargo Mortgage Backed Securities Trust: | | | | |
Series 2004-M Class A3, 4.7024% 8/25/34 (f) | | 19,880,000 | | 19,789,156 |
Series 2005-AR12 Class 2A1, 4.322% 7/25/35 (f) | | 31,674,772 | | 31,407,532 |
TOTAL PRIVATE SPONSOR | | 895,419,920 |
U.S. Government Agency - 3.2% |
Fannie Mae: | | | | |
floater: | | | | |
Series 2000-38 Class F, 3.76% 11/18/30 (f) | | 1,103,802 | | 1,112,055 |
Series 2000-40 Class FA, 3.8144% 7/25/30 (f) | | 2,487,156 | | 2,498,099 |
Series 2002-89 Class F, 3.6144% 1/25/33 (f) | | 3,630,895 | | 3,636,484 |
target amortization class Series G94-2 Class D, 6.45% 1/25/24 | | 4,732,822 | | 4,849,182 |
Fannie Mae guaranteed REMIC pass thru certificates: | | | | |
floater: | | | | |
Series 2001-34 Class FR, 3.66% 8/18/31 (f) | | 2,500,934 | | 2,508,899 |
Series 2001-44 Class FB, 3.6144% 9/25/31 (f) | | 2,262,040 | | 2,268,738 |
Series 2001-46 Class F, 3.66% 9/18/31 (f) | | 6,514,676 | | 6,552,090 |
Series 2002-11 Class QF, 3.8144% 3/25/32 (f) | | 4,517,951 | | 4,551,812 |
Series 2002-36 Class FT, 3.8144% 6/25/32 (f) | | 1,503,724 | | 1,516,521 |
Series 2002-64 Class FE, 3.61% 10/18/32 (f) | | 2,256,514 | | 2,266,981 |
Series 2002-65 Class FA, 3.6144% 10/25/17 (f) | | 2,585,370 | | 2,590,545 |
Series 2002-74 Class FV, 3.7644% 11/25/32 (f) | | 8,360,131 | | 8,420,920 |
Series 2003-11: | | | | |
Class DF, 3.7644% 2/25/33 (f) | | 3,173,455 | | 3,195,574 |
Class EF, 3.7644% 2/25/33 (f) | | 2,602,157 | | 2,612,658 |
Collateralized Mortgage Obligations - continued |
| Principal Amount | | Value |
U.S. Government Agency - continued |
Fannie Mae guaranteed REMIC pass thru certificates: - continued | | | | |
floater: | | | | |
Series 2003-63 Class F1, 3.6144% 11/25/27 (f) | | $ 6,387,368 | | $ 6,390,916 |
planned amortization class: | | | | |
Series 1998-63 Class PG, 6% 3/25/27 | | 1,212,661 | | 1,212,198 |
Series 2001-62 Class PG, 6.5% 10/25/30 | | 4,183,652 | | 4,194,964 |
Series 2001-76 Class UB, 5.5% 10/25/13 | | 1,378,221 | | 1,379,002 |
Series 2002-16 Class QD, 5.5% 6/25/14 | | 345,479 | | 346,552 |
Series 2002-28 Class PJ, 6.5% 3/25/31 | | 4,950,777 | | 4,957,813 |
Series 2002-8 Class PD, 6.5% 7/25/30 | | 3,569,878 | | 3,584,870 |
Freddie Mac: | | | | |
floater Series 2510 Class FE, 3.7881% 10/15/32 (f) | | 5,998,150 | | 6,032,418 |
planned amortization class: | | | | |
Series 2091 Class PP, 6% 2/15/27 | | 1,286,641 | | 1,286,029 |
Series 2353 Class PC, 6.5% 9/15/15 | | 1,363,169 | | 1,366,992 |
Freddie Mac Manufactured Housing participation certificates guaranteed floater Series 2338 Class FJ, 3.5881% 7/15/31 (f) | | 5,197,631 | | 5,199,968 |
Freddie Mac Multi-class participation certificates guaranteed: | | | | |
floater: | | | | |
Series 2474 Class FJ, 3.7381% 7/15/17 (f) | | 4,556,922 | | 4,564,198 |
Series 2526 Class FC, 3.7881% 11/15/32 (f) | | 3,597,778 | | 3,616,182 |
Series 2538 Class FB, 3.7881% 12/15/32 (f) | | 6,607,741 | | 6,651,155 |
Series 2551 Class FH, 3.8381% 1/15/33 (f) | | 3,358,821 | | 3,373,027 |
planned amortization class: | | | | |
Series 2136 Class PE, 6% 1/15/28 | | 12,190,349 | | 12,248,248 |
Series 2394 Class ND, 6% 6/15/27 | | 1,550,172 | | 1,553,415 |
Series 2395 Class PE, 6% 2/15/30 | | 5,961,413 | | 6,000,327 |
Series 2398 Class DK, 6.5% 1/15/31 | | 372,760 | | 373,347 |
Series 2410 Class ML, 6.5% 12/15/30 | | 2,168,673 | | 2,179,211 |
Series 2420 Class BE, 6.5% 12/15/30 | | 2,595,889 | | 2,604,122 |
Series 2443 Class TD, 6.5% 10/15/30 | | 2,962,497 | | 2,977,827 |
Series 2461 Class PG, 6.5% 1/15/31 | | 2,737,118 | | 2,773,721 |
Series 2466 Class EC, 6% 10/15/27 | | 257,483 | | 257,163 |
Series 2483 Class DC, 5.5% 7/15/14 | | 1,861,588 | | 1,861,466 |
Series 2556 Class PM, 5.5% 2/15/16 | | 1,160,963 | | 1,159,984 |
Series 2776 Class UJ, 4.5% 5/15/20 (g) | | 7,104,375 | | 367,384 |
Series 2828 Class JA, 4.5% 1/15/10 | | 11,880,000 | | 11,903,044 |
sequential pay: | | | | |
Series 2430 Class ZE, 6.5% 8/15/27 | | 648,803 | | 649,120 |
Series 2480 Class QW, 5.75% 2/15/30 | | 871,905 | | 871,370 |
Collateralized Mortgage Obligations - continued |
| Principal Amount | | Value |
U.S. Government Agency - continued |
Freddie Mac Multi-class participation certificates guaranteed: - continued | | | | |
Series 2406: | | | | |
Class FP, 4.3681% 1/15/32 (f) | | $ 10,270,000 | | $ 10,502,819 |
Class PF, 4.3681% 12/15/31 (f) | | 8,125,000 | | 8,337,955 |
Series 2410 Class PF, 4.3681% 2/15/32 (f) | | 18,644,444 | | 19,070,154 |
Ginnie Mae guaranteed REMIC pass thru securities floater: | | | | |
Series 2001-46 Class FB, 3.7381% 5/16/23 (f) | | 2,988,811 | | 3,001,292 |
Series 2001-50 Class FV, 3.5881% 9/16/27 (f) | | 9,114,548 | | 9,113,939 |
Series 2002-24 Class FX, 3.9381% 4/16/32 (f) | | 2,630,687 | | 2,652,779 |
Series 2002-31 Class FW, 3.7881% 6/16/31 (f) | | 3,614,097 | | 3,633,687 |
Series 2002-5 Class KF, 3.7881% 8/16/26 (f) | | 617,815 | | 618,278 |
TOTAL U.S. GOVERNMENT AGENCY | | 207,447,494 |
TOTAL COLLATERALIZED MORTGAGE OBLIGATIONS (Cost $1,104,119,465) | 1,102,867,414 |
Commercial Mortgage Securities - 5.8% |
|
1301 Avenue of The Americas Trust Series 2000-1301: | | | | |
Class C, 7.44% 8/3/10 (c)(f) | | 5,025,000 | | 5,024,881 |
Class D, 7.54% 8/3/10 (c)(f) | | 6,695,000 | | 6,694,844 |
Banc of America Large Loan, Inc. floater: | | | | |
Series 2003-BBA2 Class A3, 3.7081% 11/15/15 (c)(f) | | 5,038,226 | | 5,041,400 |
Series 2005-BOCA: | | | | |
Class H, 4.3381% 12/15/16 (c)(f) | | 2,065,000 | | 2,061,834 |
Class J, 4.4881% 12/15/16 (c)(f) | | 1,020,000 | | 1,018,438 |
Class K, 4.7381% 12/15/16 (c)(f) | | 6,659,000 | | 6,650,611 |
Bayview Commercial Asset Trust floater: | | | | |
Series 2003-1 Class A, 4.04% 8/25/33 (c)(f) | | 6,644,316 | | 6,723,250 |
Series 2003-2: | | | | |
Class A, 4.04% 12/25/33 (c)(f) | | 13,522,369 | | 13,687,661 |
Class M1, 4.31% 12/25/33 (c)(f) | | 2,200,548 | | 2,236,841 |
Series 2004-1: | | | | |
Class A, 3.82% 4/25/34 (c)(f) | | 6,403,472 | | 6,414,728 |
Class B, 5.36% 4/25/34 (c)(f) | | 665,296 | | 672,910 |
Class M1, 4.02% 4/25/34 (c)(f) | | 582,134 | | 584,681 |
Class M2, 4.66% 4/25/34 (c)(f) | | 498,972 | | 504,819 |
Commercial Mortgage Securities - continued |
| Principal Amount | | Value |
Bayview Commercial Asset Trust floater: - continued | | | | |
Series 2004-2: | | | | |
Class A, 3.89% 8/25/34 (c)(f) | | $ 6,299,807 | | $ 6,330,814 |
Class M1, 4.04% 8/25/34 (c)(f) | | 2,031,330 | | 2,039,265 |
Series 2004-3: | | | | |
Class A1, 3.83% 1/25/35 (c)(f) | | 6,582,479 | | 6,605,519 |
Class A2, 3.88% 1/25/35 (c)(f) | | 914,869 | | 918,092 |
Class M1, 3.96% 1/25/35 (c)(f) | | 1,097,080 | | 1,098,564 |
Class M2, 4.46% 1/25/35 (c)(f) | | 715,487 | | 719,742 |
Series 2005-2A: | | | | |
Class M1, 3.73% 8/25/35 (c)(f) | | 1,297,812 | | 1,297,812 |
Class M2, 3.78% 8/25/35 (c)(f) | | 2,136,399 | | 2,136,399 |
Class M3, 3.8% 8/25/35 (c)(f) | | 1,183,006 | | 1,183,006 |
Class M4, 3.91% 8/25/35 (c)(f) | | 1,088,166 | | 1,088,166 |
Bear Stearns Commercial Mortgage Securities, Inc. floater: | | | | |
Series 2003-BA1A: | | | | |
Class JFCM, 4.98% 4/14/15 (c)(f) | | 1,344,296 | | 1,350,087 |
Class JMM, 4.88% 4/14/15 (c)(f) | | 1,384,053 | | 1,385,065 |
Class KFCM, 5.23% 4/14/15 (c)(f) | | 1,436,661 | | 1,443,179 |
Class KMM, 5.13% 4/14/15 (c)(f) | | 1,253,767 | | 1,254,776 |
Class LFCM, 5.63% 4/14/15 (c)(f) | | 1,601,905 | | 1,602,545 |
Class MFCM, 5.93% 4/14/15 (c)(f) | | 2,218,251 | | 2,219,234 |
Series 2004-BBA3 Class E, 4.0881% 6/15/17 (c)(f) | | 10,415,000 | | 10,415,949 |
Chase Commercial Mortgage Securities Corp. floater Series 2000-FL1A: | | | | |
Class B, 3.81% 12/12/13 (c)(f) | | 896,672 | | 897,536 |
Class C, 4.16% 12/12/13 (c)(f) | | 1,793,345 | | 1,801,374 |
COMM floater: | | | | |
Series 2001-FL5A Class E, 4.8881% 11/15/13 (c)(f) | | 3,049,546 | | 3,048,573 |
Series 2002-FL6: | | | | |
Class F, 4.8381% 6/14/14 (c)(f) | | 11,163,000 | | 11,190,451 |
Class G, 5.2881% 6/14/14 (c)(f) | | 5,000,000 | | 5,000,444 |
Series 2003-FL9 Class B, 3.8881% 11/15/15 (c)(f) | | 10,354,700 | | 10,383,149 |
Commercial Mortgage pass thru certificates floater: | | | | |
Series 2004-CNL: | | | | |
Class A2, 3.6881% 9/15/14 (c)(f) | | 3,570,000 | | 3,573,440 |
Class G, 4.3681% 9/15/14 (c)(f) | | 1,345,000 | | 1,345,538 |
Class H, 4.4681% 9/15/14 (c)(f) | | 1,430,000 | | 1,430,571 |
Class J, 4.9881% 9/15/14 (c)(f) | | 490,000 | | 491,560 |
Class K, 5.3881% 9/15/14 (c)(f) | | 770,000 | | 771,587 |
Class L, 5.5881% 9/15/14 (c)(f) | | 625,000 | | 624,693 |
Commercial Mortgage Securities - continued |
| Principal Amount | | Value |
Commercial Mortgage pass thru certificates floater: - continued | | | | |
Series 2004-HTL1: | | | | |
Class B, 3.8381% 7/15/16 (c)(f) | | $ 495,379 | | $ 495,732 |
Class D, 3.9381% 7/15/16 (c)(f) | | 1,125,628 | | 1,125,788 |
Class E, 4.1381% 7/15/16 (c)(f) | | 805,726 | | 806,031 |
Class F, 4.1881% 7/15/16 (c)(f) | | 852,671 | | 853,207 |
Class H, 4.6881% 7/15/16 (c)(f) | | 2,472,312 | | 2,473,143 |
Class J, 4.8381% 7/15/16 (c)(f) | | 950,314 | | 950,633 |
Class K, 5.7381% 7/15/16 (c)(f) | | 1,069,720 | | 1,069,257 |
Commercial Mortgage Pass-Through Certificates floater Series 2005-F10A: | | | | |
Class B, 3.6181% 4/15/17 (c)(f) | | 7,080,000 | | 7,080,000 |
Class C, 3.6581% 4/15/17 (c)(f) | | 3,006,000 | | 3,006,000 |
Class D, 3.6981% 4/15/17 (c)(f) | | 2,440,000 | | 2,440,000 |
Class E, 3.7581% 4/15/17 (c)(f) | | 1,821,000 | | 1,821,000 |
Class F, 3.7981% 4/15/17 (c)(f) | | 1,035,000 | | 1,035,000 |
Class G, 3.9381% 4/15/17 (c)(f) | | 1,035,000 | | 1,035,000 |
Class H, 4.0081% 4/15/17 (c)(f) | | 1,035,000 | | 1,035,000 |
Class I, 4.2381% 4/15/17 (c)(f) | | 335,000 | | 335,000 |
Class MOA3, 3.6881% 3/15/20 (c)(f) | | 4,590,000 | | 4,590,000 |
CS First Boston Mortgage Securities Corp.: | | | | |
floater: | | | | |
Series 2001-TFLA Class G, 5.1381% 12/15/11 (c)(f) | | 3,720,000 | | 3,702,795 |
Series 2002-TFLA Class C, 3.9688% 11/18/12 (c)(f) | | 3,675,000 | | 3,674,923 |
Series 2003-TF2A Class A2, 3.7081% 11/15/14 (c)(f) | | 9,500,000 | | 9,507,100 |
Series 2004-FL1 Class B, 3.8381% 5/15/14 (c)(f) | | 11,230,000 | | 11,235,571 |
Series 2004-HC1: | | | | |
Class A2, 3.8881% 12/15/21 (c)(f) | | 1,475,000 | | 1,474,997 |
Class B, 4.1381% 12/15/21 (c)(f) | | 3,835,000 | | 3,834,992 |
Series 2004-TF2A Class E, 3.8081% 11/15/19 (c)(f) | | 4,450,000 | | 4,456,884 |
Series 2004-TFL1: | | | | |
Class A2, 3.5781% 2/15/14 (c)(f) | | 7,005,000 | | 7,007,087 |
Class E, 3.9381% 2/15/14 (c)(f) | | 2,800,000 | | 2,806,033 |
Class F, 3.9881% 2/15/14 (c)(f) | | 2,325,000 | | 2,330,394 |
Class G, 4.2381% 2/15/14 (c)(f) | | 1,875,000 | | 1,880,617 |
Class H, 4.4881% 2/15/14 (c)(f) | | 1,400,000 | | 1,403,733 |
Class J, 4.7881% 2/15/14 (c)(f) | | 750,000 | | 753,724 |
Commercial Mortgage Securities - continued |
| Principal Amount | | Value |
CS First Boston Mortgage Securities Corp.: - continued | | | | |
Series 2005-TF2A Class F, 3.8881% 11/15/19 (c)(f) | | $ 1,540,000 | | $ 1,542,381 |
Series 2005-TFLA: | | | | |
Class C, 3.6281% 2/15/20 (c)(f) | | 5,650,000 | | 5,649,989 |
Class E, 3.7181% 2/15/20 (c)(f) | | 3,955,000 | | 3,954,992 |
Class F, 3.7681% 2/15/20 (c)(f) | | 1,745,000 | | 1,744,997 |
Class G, 3.9081% 2/15/20 (c)(f) | | 505,000 | | 504,998 |
Class H, 4.1381% 2/15/20 (c)(f) | | 715,000 | | 714,998 |
sequential pay Series 1997-C2 Class A2, 6.52% 1/17/35 | | 518,675 | | 522,823 |
Series 2003-TFLA Class G, 3.7357% 4/15/13 (c)(f) | | 446,933 | | 445,553 |
GMAC Commercial Mortgage Securities, Inc. floater Series 2001-FL1A Class E, 4.2% 2/11/11 (c)(f) | | 264,524 | | 264,175 |
GS Mortgage Securities Corp. II floater Series 2005-FL7A Class A1, 3.5% 11/6/19 (c)(f) | | 10,526,054 | | 10,527,180 |
ISTAR Asset Receivables Trust floater Series 2002-1A Class A2, 3.8613% 5/28/20 (c)(f) | | 2,727,545 | | 2,728,117 |
John Hancock Tower Mortgage Trust floater Series 2003-C5A Class B, 5.6585% 4/10/15 (c)(f) | | 8,245,000 | | 8,150,339 |
JP Morgan Chase Commercial Mortgage Security Corp.: | | | | |
floater Series 2005-FL1A: | | | | |
Class WH, 3.97% 6/15/19 (c)(f) | | 3,325,000 | | 3,325,100 |
Class WJ, 4.17% 6/15/19 (c)(f) | | 2,045,000 | | 2,045,061 |
Class WK, 4.57% 6/15/19 (c)(f) | | 3,065,000 | | 3,065,092 |
Series 2005-FL1A Class WX1, 1.2068% 6/15/19 (c)(f)(g) | | 240,000,000 | | 2,596,800 |
Lehman Brothers Floating Rate Commercial Mortgage Trust: | | | | |
floater: | | | | |
Series 2003-C4A: | | | | |
Class F, 5.6% 7/11/15 (c)(f) | | 813,387 | | 813,822 |
Class H, 6.35% 7/11/15 (c)(f) | | 8,267,264 | | 8,287,932 |
Series 2003-LLFA: | | | | |
Class A2, 3.77% 12/16/14 (c)(f) | | 11,700,000 | | 11,707,744 |
Class B, 3.98% 12/16/14 (c)(f) | | 4,615,000 | | 4,626,299 |
Class C, 4.08% 12/16/14 (c)(f) | | 4,982,000 | | 4,997,311 |
Series 2005-LLFA Class FAIR, 5.1138% 7/15/19 (c)(d)(f) | | 4,360,000 | | 4,360,000 |
Morgan Stanley Dean Witter Capital I Trust floater Series 2002-XLF Class F, 5.49% 8/5/14 (c)(f) | | 7,603,983 | | 7,603,972 |
Commercial Mortgage Securities - continued |
| Principal Amount | | Value |
Salomon Brothers Mortgage Securities VII, Inc.: | | | | |
floater: | | | | |
Series 2001-CDCA: | | | | |
Class C, 4.1881% 2/15/13 (c)(f) | | $ 10,495,000 | | $ 10,291,568 |
Class D, 4.1881% 2/15/13 (c)(f) | | 4,000,000 | | 3,891,288 |
Series 2003-CDCA: | | | | |
Class HEXB, 5.2881% 2/15/15 (c)(f) | | 770,000 | | 771,001 |
Class JEXB, 5.4881% 2/15/15 (c)(f) | | 1,300,000 | | 1,301,690 |
Class KEXB, 5.8881% 2/15/15 (c)(f) | | 960,000 | | 961,248 |
Series 2000-NL1 Class E, 7.0607% 10/15/30 (c)(f) | | 3,657,956 | | 3,672,236 |
SDG Macerich Properties LP floater Series 2000-1 Class A3, 3.7281% 5/15/09 (c)(f) | | 18,000,000 | | 18,008,086 |
STRIPS III Ltd./STRIPS III Corp. floater Series 2004-1A Class A, 3.78% 3/24/18 (c)(f) | | 7,263,029 | | 7,263,029 |
Wachovia Bank Commercial Mortgage Trust floater: | | | | |
Series 2004-WHL3: | | | | |
Class A2, 3.5681% 3/15/14 (c)(f) | | 3,510,000 | | 3,511,290 |
Class E, 3.8881% 3/15/14 (c)(f) | | 2,190,000 | | 2,192,749 |
Class F, 3.9381% 3/15/14 (c)(f) | | 1,755,000 | | 1,757,120 |
Class G, 4% 3/15/14 (c)(f) | | 875,000 | | 876,363 |
Series 2005-WL5A: | | | | |
Class KHP1, 3.7381% 1/15/18 (c)(f) | | 1,745,000 | | 1,745,000 |
Class KHP2, 3.9381% 1/15/18 (c)(f) | | 1,745,000 | | 1,745,000 |
Class KHP3, 4.2381% 1/15/18 (c)(f) | | 2,060,000 | | 2,060,000 |
Class KHP4, 4.3381% 1/15/18 (c)(f) | | 1,600,000 | | 1,600,000 |
Class KHP5, 4.5381% 1/15/18 (c)(f) | | 1,855,000 | | 1,855,000 |
TOTAL COMMERCIAL MORTGAGE SECURITIES (Cost $378,363,353) | 378,866,012 |
Interfund Loans - 0.1% |
| | | |
With Fidelity Equity-Income Fund, at 3.43442% due 8/1/05 (b) (Cost $8,443,000) | | 8,443,000 | | 8,443,000 |
Cash Equivalents - 40.4% |
| | Maturity
Amount | | Value |
Investments in repurchase agreements (Collateralized by U.S. Government Obligations, in a joint trading account at 3.32%, dated 7/29/05 due 8/1/05) (i) | | $ 2,354,814,398 | | $ 2,354,164,000 |
With Goldman Sachs & Co. at 3.41%, dated 7/1/05 due 8/23/05 (Collateralized by Mortgage Loan Obligations valued at $295,800,001, 0.9%- 10.36%, 4/18/17 - 6/25/44) (f)(h) | | 291,455,881 | | 289,998,492 |
TOTAL CASH EQUIVALENTS (Cost $2,644,164,000) | | 2,644,162,492 |
TOTAL INVESTMENT PORTFOLIO - 102.2% (Cost $6,679,436,405) | | | 6,685,115,608 |
NET OTHER ASSETS - (2.2)% | | | (140,968,200) |
NET ASSETS - 100% | | $ 6,544,147,408 |
Futures Contracts |
| Expiration Date | | Underlying Face Amount at Value | | Unrealized Appreciation/
(Depreciation) |
Sold |
Eurodollar Contracts |
73 Eurodollar 90 Day Index Contracts | Dec. 2005 | | $ 72,221,638 | | $ 34,806 |
49 Eurodollar 90 Day Index Contracts | March 2006 | | 48,464,675 | | 28,036 |
32 Eurodollar 90 Day Index Contracts | June 2006 | | 31,645,600 | | 16,247 |
27 Eurodollar 90 Day Index Contracts | Sept. 2006 | | 26,698,612 | | 16,355 |
26 Eurodollar 90 Day Index Contracts | Dec. 2006 | | 25,707,500 | | 14,421 |
24 Eurodollar 90 Day Index Contracts | March 2007 | | 23,729,700 | | 12,329 |
17 Eurodollar 90 Day Index Contracts | June 2007 | | 16,807,688 | | 5,970 |
16 Eurodollar 90 Day Index Contracts | Sept. 2007 | | 15,818,200 | | 5,711 |
15 Eurodollar 90 Day Index Contracts | Dec. 2007 | | 14,828,250 | | 5,590 |
15 Eurodollar 90 Day Index Contracts | March 2008 | | 14,827,875 | | 5,015 |
8 Eurodollar 90 Day Index Contracts | June 2008 | | 7,907,800 | | 7,518 |
7 Eurodollar 90 Day Index Contracts | Sept. 2008 | | 6,918,888 | | 6,885 |
TOTAL EURODOLLAR CONTRACTS | | 158,883 |
Swap Agreements |
| | | Notional Amount | | Value |
Credit Default Swap |
Receive from Citibank, upon default event of DaimlerChrysler NA Holding Corp., par value of the notional amount of DaimlerChrysler NA Holding Corp. 6.5% 11/15/13, and pay quarterly notional amount multiplied by .8% | June 2007 | | $ 14,000,000 | | $ (135,972) |
Receive quarterly notional amount multiplied by 1.12% and pay Morgan Stanley, Inc. upon default of Comcast Cable Communications, Inc., par value of the notional amount of Comcast Cable Communications, Inc. 6.75% 1/30/11 | June 2006 | | 10,000,000 | | 102,057 |
TOTAL CREDIT DEFAULT SWAP | 24,000,000 | | (33,915) |
Swap Agreements - continued |
| Expiration Date | | Notional Amount | | Value |
Total Return Swap |
Receive monthly notional amount multiplied by the nominal spread appreciation of the Lehman Brothers CMBS U.S. Aggregate Index adjusted by a modified duration factor plus 10 basis points and pay monthly notional amount multiplied by the nominal spread depreciation of the Lehman Brothers CMBS U.S. Aggregate Index adjusted by a modified duration factor with Lehman Brothers, Inc. | Oct. 2005 | | $ 48,200,000 | | $ 46,335 |
Receive monthly notional amount multiplied by the nominal spread appreciation of the Lehman Brothers CMBS U.S. Aggregate Index adjusted by a modified duration factor plus 25 basis points and pay monthly notional amount multiplied by the nominal spread depreciation of the Lehman Brothers CMBS U.S. Aggregate Index adjusted by a modified duration factor with Lehman Brothers, Inc. | Dec. 2005 | | 30,000,000 | | 32,511 |
Receive monthly notional amount multiplied by the nominal spread appreciation of the Lehman Brothers CMBS U.S. Aggregate Index adjusted by a modified duration factor plus 30 basis points and pay monthly notional amount multiplied by the nominal spread depreciation of the Lehman Brothers CMBS U.S. Aggregate Index adjusted by a modified duration factor with Lehman Brothers, Inc. | August 2005 | | 35,100,000 | | 33,945 |
Swap Agreements - continued |
| Expiration Date | | Notional Amount | | Value |
Receive monthly notional amount multiplied by the nominal spread appreciation of the Lehman Brothers CMBS U.S. Aggregate Index adjusted by a modified duration factor plus 22 basis points and pay monthly notional amount multiplied by the nominal spread depreciation of the Lehman Brothers CMBS U.S. Aggregate Index adjusted by a modified duration factor with Lehman Brothers, Inc. | Jan. 2006 | | $ 35,100,000 | | $ 32,229 |
Receive monthly a return equal to Lehman Brothers ABS Floating Rate Index and pay monthly a floating rate based on the 1- month LIBOR minus 11.1 basis points with Lehman Brothers, Inc. | Nov. 2005 | | 30,000,000 | | 0 |
TOTAL TOTAL RETURN SWAP | 178,400,000 | | 145,020 |
| | $ 202,400,000 | | $ 111,105 |
Legend |
(a) Debt obligation initially issued at one coupon which converts to a higher coupon at a specified date. The rate shown is the rate at period end. |
(b) Affiliated entity |
(c) Security exempt from registration under Rule 144A of the Securities Act of 1933. These securities may be resold in transactions exempt from registration, normally to qualified institutional buyers. At the period end, the value of these securities amounted to $586,119,417 or 9.0% of net assets. |
(d) Security or a portion of the security purchased on a delayed delivery or when-issued basis. |
(e) Security or a portion of the security was pledged to cover margin requirements for futures contracts. At the period end, the value of securities pledged amounted to $994,635. |
(f) The coupon rate shown on floating or adjustable rate securities represents the rate at period end. |
(g) Security represents right to receive monthly interest payments on an underlying pool of mortgages. Principal shown is the par amount of the mortgage pool. |
(h) The maturity amount is based on the rate at period end. |
(i) Additional information on each counterparty to the repurchase agreement is as follows: |
Repurchase Agreement/
Counterparty | Value |
$2,354,164,000 due 8/1/05 at 3.32% | |
Banc of America Securities LLC. | $ 471,596,247 |
Bank of America, National Association | 244,985,063 |
Barclays Capital Inc. | 979,940,254 |
Countrywide Securities Corporation | 244,985,063 |
Morgan Stanley & Co. Incorporated. | 351,411,107 |
UBS Securities LLC | 61,246,266 |
| $ 2,354,164,000 |
Income Tax Information |
At July 31, 2005, the aggregate cost of investment securities for income tax purposes was $6,679,021,266. Net unrealized appreciation aggregated $6,094,342, of which $11,067,257 related to appreciated investment securities and $4,972,915 related to depreciated investment securities. |
Annual Report
Annual Report
Annual Report
Annual Report
Annual Report
Annual Report
Annual Report
Investment Adviser
Fidelity Management & Research Company
Boston, MA
Investment Sub-Advisers
FMR Co. Inc.
Fidelity Management & Research
(U.K.) Inc.
Fidelity Management & Research
(Far East) Inc.
Fidelity Investments
Money Management, Inc.
Fidelity Investments Japan Limited
Fidelity International Investment Advisors
Fidelity International Investment Advisors
(U.K.) Limited
General Distributor
Fidelity Distributors Corporation
Boston, MA
Transfer and Service Agents
Fidelity Investments Institutional Operations Company, Inc.
Boston, MA
Fidelity Service Company, Inc.
Boston, MA
Custodian
Citibank, N.A.
New York, NY
ATBI-UANN-0905
1.804580.101
(Fidelity Investment logo)(registered trademark)
Corporate Headquarters
82 Devonshire St., Boston, MA 02109
www.fidelity.com
Fidelity®
Ultra-Short Bond
Fund
Annual Report
July 31, 2005
(2_fidelity_logos) (Registered_Trademark)
Contents
Chairman's Message | <Click Here> | Ned Johnson's message to shareholders. |
Performance | <Click Here> | How the fund has done over time. |
Management's Discussion | <Click Here> | The manager's review of fund performance, strategy and outlook. |
Shareholder Expense Example | <Click Here> | An example of shareholder expenses. |
Investment Changes | <Click Here> | A summary of major shifts in the fund's investments over the past six months. |
Investments | <Click Here> | A complete list of the fund's investments with their market values. |
Financial Statements | <Click Here> | Statements of assets and liabilities, operations, and changes in net assets,
as well as financial highlights. |
Notes | <Click Here> | Notes to the financial statements. |
Report of Independent Registered Public Accounting Firm | <Click Here> | |
Trustees and Officers | <Click Here> | |
Distributions | <Click Here> | |
Board Approval of Investment Advisory Contracts and Management Fees | <Click Here> | |
Central Fund Investments | <Click Here> | Complete list of investments for Fidelity's fixed-income central funds. |
To view a fund's proxy voting guidelines and proxy voting record for the 12-month period ended June 30, visit www.fidelity.com/proxyvotingresults or visit the Securities and Exchange Commission's (SEC) web site at www.sec.gov. You may also call 1-800-544-8544 to request a free copy of the proxy voting guidelines.
Standard & Poor's, S&P and S&P 500 are registered service marks of The McGraw-Hill Companies, Inc. and have been licensed for use by Fidelity Distributors Corporation.
Other third party marks appearing herein are the property of their respective owners.
All other marks appearing herein are registered or unregistered trademarks or service marks of FMR Corp. or an affiliated company.
Annual Report
This report and the financial statements contained herein are submitted for the general information of the shareholders of the fund. This report is not authorized for distribution to prospective investors in the fund unless preceded or accompanied by an effective prospectus.
A fund files its complete schedule of portfolio holdings with the SEC for the first and third quarters of each fiscal year on Form N-Q. Forms N-Q are available on the SEC's website at http://www.sec.gov. A fund's Forms N-Q may be reviewed and copied at the SEC's Public Reference Room in Washington, DC. Information regarding the operation of the SEC's Public Reference Room may be obtained by calling 1-800-SEC-0330. For a complete list of a fund's portfolio holdings, view the most recent quarterly holdings report, semiannual report, or annual report on Fidelity's web site at http://www.fidelity.com/holdings.
NOT FDIC INSURED · MAY LOSE VALUE · NO BANK GUARANTEE
Neither the fund nor Fidelity Distributors Corporation is a bank.
Annual Report
Chairman's Message
(photo_of_Edward_C_Johnson_3d)
Dear Shareholder:
During the past year or so, much has been reported about the mutual fund industry, and much of it has been more critical than I believe is warranted. Allegations that some companies have been less than forthright with their shareholders have cast a shadow on the entire industry. I continue to find these reports disturbing, and assert that they do not create an accurate picture of the industry overall. Therefore, I would like to remind everyone where Fidelity stands on these issues. I will say two things specifically regarding allegations that some mutual fund companies were in violation of the Securities and Exchange Commission's forward pricing rules or were involved in so-called "market timing" activities.
First, Fidelity has no agreements that permit customers who buy fund shares after 4 p.m. to obtain the 4 p.m. price. This is not a new policy. This is not to say that someone could not deceive the company through fraudulent acts. However, we are extremely diligent in preventing fraud from occurring in this manner - and in every other. But I underscore again that Fidelity has no so-called "agreements" that sanction illegal practices.
Second, Fidelity continues to stand on record, as we have for years, in opposition to predatory short-term trading that adversely affects shareholders in a mutual fund. Back in the 1980s, we initiated a fee - which is returned to the fund and, therefore, to investors - to discourage this activity. Further, we took the lead several years ago in developing a Fair Value Pricing Policy to prevent market timing on foreign securities in our funds. I am confident we will find other ways to make it more difficult for predatory traders to operate. However, this will only be achieved through close cooperation among regulators, legislators and the industry.
Yes, there have been unfortunate instances of unethical and illegal activity within the mutual fund industry from time to time. That is true of any industry. When this occurs, confessed or convicted offenders should be dealt with appropriately. But we are still concerned about the risk of over-regulation and the quick application of simplistic solutions to intricate problems. Every system can be improved, and we support and applaud well thought out improvements by regulators, legislators and industry representatives that achieve the common goal of building and protecting the value of investors' holdings.
For nearly 60 years, Fidelity has worked very hard to improve its products and service to justify your trust. When our family founded this company in 1946, we had only a few hundred customers. Today, we serve more than 18 million customers including individual investors and participants in retirement plans across America.
Let me close by saying that we do not take your trust in us for granted, and we realize that we must always work to improve all aspects of our service to you. In turn, we urge you to continue your active participation with your financial matters, so that your interests can be well served.
Best regards,
/s/Edward C. Johnson 3d
Edward C. Johnson 3d
Annual Report
Performance: The Bottom Line
Average annual total return reflects the change in the value of an investment, assuming reinvestment of Ultra-Short Bond's dividend income and capital gains (the profits earned upon the sale of securities that have grown in value) and assuming a constant rate of performance each year. The $10,000 table and the fund's returns do not reflect the deduction of taxes that a shareholder would pay on fund distributions or the redemption of fund shares. During periods of reimbursement by Fidelity, a fund's total return will be greater than it would be had the reimbursement not occurred. How a fund did yesterday is no guarantee of how it will do tomorrow.
Average Annual Total Returns
Periods ended July 31, 2005 | Past 1
year | Life of
fund A |
Fidelity® Ultra-Short Bond | 2.16% | 1.93% |
A From August 29, 2002.
$10,000 Over Life of Fund
Let's say hypothetically that $10,000 was invested in Fidelity Ultra-Short Bond on August 29, 2002, when the fund started. The chart shows how the value of your investment would have changed, and also shows how the Lehman Brothers® 6 Month Swap Index performed over the same period.
Annual Report
Management's Discussion of Fund Performance
Comments from Andrew Dudley, Portfolio Manager of Fidelity® Ultra-Short Bond Fund
Not unlike the domestic equity markets, taxable bonds swung up and down during the 12 months ending July 31, 2005, rallying early in the period, selling off in late winter, only to advance again in the spring. During the one-year period, the Lehman Brothers® Aggregate Bond Index - a measure of the overall investment-grade bond universe - - rose 4.79%. Much of this gain came on the strength of returns from higher-yielding spread sectors, such as investment-grade corporates, reflected in the 5.76% return of the Lehman Brothers Credit Bond Index over the 12-month period. Mortgage-backed securities were spurred on by the relative stability of long-term interest rates, and the Lehman Brothers Mortgage-Backed Securities gained 4.67%. Treasuries also bolstered the overall market, as illustrated by the 4.62% return of the Lehman Brothers U.S. Treasury Index, which moved ahead on a flight to quality as investors continued to ponder the future direction of the U.S. economy. The Lehman Brothers U.S. Agency Index returned a more modest 3.88%.
For the 12 months ending July 31, 2005, Ultra Short Bond gained 2.16%, while the Lehman Brothers 6 Month Swap Index returned 2.23% and the LipperSM Ultra-Short Obligation Funds Average returned 1.95%. Benefiting the fund's performance was my yield-curve positioning. I owned more bonds with maturities throughout the zero- to two-year range than the index, which helped as the yield curve flattened. Sector selection also generally was favorable. I kept the fund tilted heavily toward non-government bonds, which were helped by their yield advantage over Treasuries and spread tightening. I held these securities - namely asset-backed bonds and mortgage securities - directly and indirectly through the Fidelity Ultra-Short Central Fund, a diversified internal pool of short-term assets designed to outperform cash-like instruments with similar risk characteristics. Detracting from performance was a small stake in corporate bonds issued by auto companies, which were hurt by credit-rating downgrades.
The views expressed in this statement reflect those of the portfolio manager only through the end of the period of the report as stated on the cover and do not necessarily represent the views of Fidelity or any other person in the Fidelity organization. Any such views are subject to change at any time based upon market or other conditions and Fidelity disclaims any responsibility to update such views. These views may not be relied on as investment advice and, because investment decisions for a Fidelity fund are based on numerous factors, may not be relied on as an indication of trading intent on behalf of any Fidelity fund.
Annual Report
Shareholder Expense Example
As a shareholder of the Fund, you incur two types of costs: (1) transaction costs, including redemption fees, and (2) ongoing costs, including management fees, distribution and/or service (12b-1) fees and other Fund expenses. This Example is intended to help you understand your ongoing costs (in dollars) of investing in the Fund and to compare these costs with the ongoing costs of investing in other mutual funds.
The Example is based on an investment of $1,000 invested at the beginning of the period and held for the entire period (February 1, 2005 to July 31, 2005).
Actual Expenses
The first line of the table below for each class of the Fund provides information about actual account values and actual expenses. You may use the information in this line, together with the amount you invested, to estimate the expenses that you paid over the period. Simply divide your account value by $1,000.00 (for example, an $8,600 account value divided by $1,000.00 = 8.6), then multiply the result by the number in the first line for a class of the Fund under the heading entitled "Expenses Paid During Period" to estimate the expenses you paid on your account during this period.
Hypothetical Example for Comparison Purposes
The second line of the table below for each class of the Fund provides information about hypothetical account values and hypothetical expenses based on a Class' actual expense ratio and an assumed rate of return of 5% per year before expenses, which is not the Class' actual return. The hypothetical account values and expenses may not be used to estimate the actual ending account balance or expenses you paid for the period. You may use this information to compare the ongoing costs of investing in the Fund and other funds. To do so, compare this 5% hypothetical example with the 5% hypothetical examples that appear in the shareholder reports of the other funds.
Please note that the expenses shown in the table are meant to highlight your ongoing costs only and do not reflect any transaction costs. Therefore, the second line of the table is useful in comparing ongoing costs only, and will not help you determine the relative total costs of owning different funds. In addition, if these transactional costs were included, your costs would have been higher.
Annual Report
Shareholder Expense Example - continued
| Beginning
Account Value
February 1, 2005 | Ending
Account Value
July 31, 2005 | Expenses Paid
During Period*
February 1, 2005
to July 31, 2005 |
Class A | | | |
Actual | $ 1,000.00 | $ 1,012.00 | $ 3.49 |
HypotheticalA | $ 1,000.00 | $ 1,021.32 | $ 3.51 |
Class T | | | |
Actual | $ 1,000.00 | $ 1,011.90 | $ 3.49** |
HypotheticalA | $ 1,000.00 | $ 1,021.32 | $ 3.51** |
Ultra-Short Bond | | | |
Actual | $ 1,000.00 | $ 1,013.00 | $ 2.55** |
HypotheticalA | $ 1,000.00 | $ 1,022.27 | $ 2.56** |
Institutional Class | | | |
Actual | $ 1,000.00 | $ 1,012.70 | $ 2.74** |
HypotheticalA | $ 1,000.00 | $ 1,022.07 | $ 2.76** |
A 5% return per year before expenses
* Expenses are equal to each Class' annualized expense ratio (shown in the table below); multiplied by the average account value over the period, multiplied by 181/365 (to reflect the one-half year period).
| Annualized
Expense Ratio |
Class A | .70% |
Class T | .70%** |
Ultra-Short Bond | .51%** |
Institutional Class | .55%** |
** If contractual expense reductions, effective June 1, 2005, had been in effect during the period, the annualized expense ratios and the expenses paid in the actual and hypothetical examples above would have been as follows:
| Annualized
Expense Ratio
| Expenses Paid
|
Class T | .69% | |
Actual | | $ 3.44 |
HypotheticalA | | $ 3.46 |
Ultra-Short Bond | .45% | |
Actual | | $ 2.25 |
HypotheticalA | | $ 2.26 |
Institutional Class | .47% | |
Actual | | $ 2.35 |
HypotheticalA | | $ 2.36 |
A 5% return per year before expenses
Annual Report
Investment Changes
Quality Diversification (% of fund's net assets) |
As of July 31, 2005 | As of January 31, 2005 |
| U.S. Government and
U.S. Government
Agency Obligations 11.0% | | | U.S. Government and
U.S. Government
Agency Obligations 19.4% | |
| AAA 26.9% | | | AAA 23.7% | |
| AA 10.4% | | | AA 6.5% | |
| A 11.5% | | | A 11.9% | |
| BBB 11.3% | | | BBB 10.4% | |
 | BB and Below 0.2% | | | BB and Below 0.1% | |
| Not Rated 2.8% | | | Not Rated 5.2% | |
| Short-Term
Investments and
Net Other Assets 25.9% | | | Short-Term
Investments and
Net Other Assets 22.8% | |

We have used ratings from Moody's Investors Services, Inc. Where Moody's ratings are not available, we have used S&P® ratings. Securities rated BB or below were rated investment grade at the time of acquisition. The information in the above table is based on the combined investments of the fund and its pro-rata share of the investments of Fidelity's fixed-income central fund. |
Average Years to Maturity as of July 31, 2005 |
| | 6 months ago |
Years | 1.6 | 1.6 |
Average years to maturity is based on the average time remaining until principal payments are expected from each of the fund's bonds, weighted by dollar amount. |
Duration as of July 31, 2005 |
| | 6 months ago |
Years | 0.3 | 0.4 |
Duration shows how much a bond fund's price fluctuates with changes in comparable interest rates. If rates rise 1%, for example, a fund with a five-year duration is likely to lose about 5% of its value. Other factors also can influence a bond fund's performance and share price. Accordingly, a bond fund's actual performance may differ from this example. |
Asset Allocation (% of fund's net assets) |
As of July 31, 2005* | As of January 31, 2005** |
| Corporate Bonds 6.6% | | | Corporate Bonds 5.5% | |
| U.S. Government and
U.S. Government
Agency Obligations 11.0% | | | U.S. Government and
U.S. Government
Agency Obligations 19.4% | |
| Asset-Backed
Securities 33.7% | | | Asset-Backed
Securities 31.5% | |
| CMOs and Other Mortgage Related Securities 22.8% | | | CMOs and Other Mortgage Related Securities 20.8% | |
| Short-Term
Investments and
Net Other Assets 25.9% | | | Short-Term
Investments and
Net Other Assets 22.8% | |
* Foreign investments | 5.3% | | ** Foreign investments | 4.3% | |
* Futures and Swaps | 9.4% | | ** Futures and Swaps | 14.2% | |

The information in the above tables is based on the combined investments of the fund and its pro-rata share of the investment of Fidelity's fixed-income central fund. |
Annual Report
Investments July 31, 2005
Showing Percentage of Net Assets
Nonconvertible Bonds - 5.4% |
| Principal
Amount | | Value
(Note 1) |
CONSUMER DISCRETIONARY - 1.0% |
Auto Components - 0.2% |
DaimlerChrysler NA Holding Corp.: | | | | |
3.8594% 9/10/07 (f) | | $ 1,230,000 | | $ 1,232,497 |
3.8938% 5/24/06 (f) | | 800,000 | | 802,330 |
| | 2,034,827 |
Media - 0.8% |
British Sky Broadcasting Group PLC (BSkyB) yankee 7.3% 10/15/06 | | 900,000 | | 929,107 |
Continental Cablevision, Inc. 8.3% 5/15/06 | | 450,000 | | 463,986 |
Cox Communications, Inc.: | | | | |
(Reg. S) 3.95% 12/14/07 (f) | | 1,530,000 | | 1,537,901 |
7.75% 8/15/06 | | 360,000 | | 371,837 |
Liberty Media Corp. 4.91% 9/17/06 (f) | | 3,033,000 | | 3,049,894 |
Univision Communications, Inc. 2.875% 10/15/06 | | 1,210,000 | | 1,183,017 |
| | 7,535,742 |
TOTAL CONSUMER DISCRETIONARY | | 9,570,569 |
ENERGY - 0.6% |
Oil, Gas & Consumable Fuels - 0.6% |
Duke Energy Field Services LLC 7.5% 8/16/05 | | 1,000,000 | | 1,001,206 |
Enterprise Products Operating LP 4% 10/15/07 | | 2,670,000 | | 2,625,438 |
Valero Energy Corp. 7.375% 3/15/06 | | 1,700,000 | | 1,727,294 |
| | 5,353,938 |
FINANCIALS - 1.4% |
Capital Markets - 0.0% |
State Street Capital Trust II 3.7681% 2/15/08 (f) | | 300,000 | | 300,068 |
Commercial Banks - 0.3% |
Wells Fargo & Co. 3.4194% 3/10/08 (f) | | 2,300,000 | | 2,299,924 |
Consumer Finance - 0.3% |
General Motors Acceptance Corp. 4.87% 10/20/05 (f) | | 2,385,000 | | 2,388,422 |
Real Estate - 0.4% |
EOP Operating LP 8.375% 3/15/06 | | 1,325,000 | | 1,357,928 |
Simon Property Group LP 7.375% 1/20/06 | | 2,525,000 | | 2,560,416 |
| | 3,918,344 |
Thrifts & Mortgage Finance - 0.4% |
Countrywide Financial Corp. 3.71% 4/11/07 (f) | | 1,575,000 | | 1,576,005 |
Nonconvertible Bonds - continued |
| Principal
Amount | | Value
(Note 1) |
FINANCIALS - continued |
Thrifts & Mortgage Finance - continued |
Countrywide Home Loans, Inc. 3.8175% 6/2/06 (f) | | $ 500,000 | | $ 501,468 |
Residential Capital Corp. 4.835% 6/29/07 (b)(f) | | 1,995,000 | | 1,997,075 |
| | 4,074,548 |
TOTAL FINANCIALS | | 12,981,306 |
INFORMATION TECHNOLOGY - 0.2% |
Communications Equipment - 0.2% |
Motorola, Inc. 4.608% 11/16/07 | | 1,700,000 | | 1,699,546 |
TELECOMMUNICATION SERVICES - 1.3% |
Diversified Telecommunication Services - 1.2% |
British Telecommunications PLC 7.875% 12/15/05 | | 1,950,000 | | 1,977,089 |
France Telecom SA 7.45% 3/1/06 (a) | | 440,000 | | 447,817 |
GTE Corp. 6.36% 4/15/06 | | 1,000,000 | | 1,014,045 |
SBC Communications, Inc. 4.389% 6/5/06 (b) | | 2,265,000 | | 2,265,680 |
Sprint Capital Corp.: | | | | |
4.78% 8/17/06 | | 1,000,000 | | 1,003,425 |
7.125% 1/30/06 | | 500,000 | | 506,454 |
Telefonica Europe BV 7.35% 9/15/05 | | 500,000 | | 501,949 |
Telefonos de Mexico SA de CV 4.5% 11/19/08 | | 1,605,000 | | 1,581,845 |
TELUS Corp. yankee 7.5% 6/1/07 | | 2,000,000 | | 2,103,252 |
| | 11,401,556 |
Wireless Telecommunication Services - 0.1% |
AT&T Wireless Services, Inc. 7.35% 3/1/06 | | 900,000 | | 915,869 |
TOTAL TELECOMMUNICATION SERVICES | | 12,317,425 |
UTILITIES - 0.9% |
Electric Utilities - 0.7% |
DTE Energy Co. 6.45% 6/1/06 | | 165,000 | | 167,721 |
Pinnacle West Energy Corp. 4.0044% 4/1/07 (b)(f) | | 1,850,000 | | 1,850,115 |
Progress Energy, Inc. 6.75% 3/1/06 | | 4,105,000 | | 4,159,954 |
| | 6,177,790 |
Gas Utilities - 0.1% |
NiSource Finance Corp. 7.625% 11/15/05 | | 675,000 | | 681,729 |
Nonconvertible Bonds - continued |
| Principal
Amount | | Value
(Note 1) |
UTILITIES - continued |
Independent Power Producers & Energy Traders - 0.1% |
Constellation Energy Group, Inc. 6.35% 4/1/07 | | $ 910,000 | | $ 935,558 |
TOTAL UTILITIES | | 7,795,077 |
TOTAL NONCONVERTIBLE BONDS (Cost $49,879,710) | 49,717,861 |
U.S. Government Agency Obligations - 4.8% |
|
Fannie Mae: | | | | |
2.15% 4/13/06 (d) | | 9,700,000 | | 9,576,150 |
3.25% 7/31/06 | | 35,000,000 | | 34,701,930 |
TOTAL U.S. GOVERNMENT AGENCY OBLIGATIONS (Cost $44,467,346) | 44,278,080 |
U.S. Government Agency - Mortgage Securities - 1.1% |
|
Fannie Mae - 1.1% |
5.5% 11/1/16 to 2/1/19 | | 5,200,909 | | 5,307,703 |
6.5% 7/1/16 to 3/1/35 | | 3,181,350 | | 3,295,459 |
7% 8/1/17 to 5/1/32 | | 1,634,170 | | 1,713,170 |
TOTAL U.S. GOVERNMENT AGENCY - MORTGAGE SECURITIES (Cost $10,393,053) | 10,316,332 |
Asset-Backed Securities - 22.9% |
|
Accredited Mortgage Loan Trust: | | | | |
Series 2004-2 Class A2, 3.76% 7/25/34 (f) | | 659,098 | | 660,260 |
Series 2004-3 Class 2A4, 3.81% 10/25/34 (f) | | 1,200,000 | | 1,203,472 |
Series 2004-4 Class A2D, 3.81% 1/25/35 (f) | | 432,988 | | 434,077 |
Series 2005-1: | | | | |
Class M1, 3.93% 4/25/35 (f) | | 1,545,000 | | 1,541,149 |
Class M2, 4.15% 4/25/35 (f) | | 725,000 | | 725,261 |
ACE Securities Corp.: | | | | |
Series 2002-HE2 Class M1, 4.31% 8/25/32 (f) | | 151,473 | | 152,070 |
Series 2003-FM1 Class M2, 5.31% 11/25/32 (f) | | 145,000 | | 146,706 |
Series 2003-HE1: | | | | |
Class A2, 3.87% 11/25/33 (f) | | 193,312 | | 193,549 |
Class M1, 4.11% 11/25/33 (f) | | 120,000 | | 120,501 |
Class M2, 5.16% 11/25/33 (f) | | 75,000 | | 76,199 |
Asset-Backed Securities - continued |
| Principal
Amount | | Value
(Note 1) |
ACE Securities Corp.: - continued | | | | |
Series 2003-HS1: | | | | |
Class M1, 4.21% 6/25/33 (f) | | $ 50,000 | | $ 50,218 |
Class M2, 5.21% 6/25/33 (f) | | 50,000 | | 50,882 |
Series 2003-NC1 Class M1, 4.24% 7/25/33 (f) | | 100,000 | | 100,729 |
Series 2004-HE1: | | | | |
Class M1, 3.96% 2/25/34 (f) | | 150,000 | | 150,053 |
Class M2, 4.56% 2/25/34 (f) | | 175,000 | | 175,088 |
Series 2005-HE2: | | | | |
Class M1, 3.9% 4/25/35 (f) | | 215,000 | | 214,714 |
Class M2, 3.91% 4/25/35 (f) | | 250,000 | | 249,145 |
Class M3, 3.94% 4/25/35 (f) | | 145,000 | | 144,811 |
Class M4, 4.1% 4/25/35 (f) | | 185,000 | | 184,761 |
Series 2005-HE3: | | | | |
Class A2A, 3.56% 5/25/35 (f) | | 1,167,755 | | 1,167,800 |
Class A2B, 3.67% 5/25/35 (f) | | 630,000 | | 629,474 |
Series 2005-SD1 Class A1, 3.86% 11/25/50 (f) | | 330,485 | | 330,892 |
Aesop Funding II LLC Series 2005-1A Class A2, 3.49% 4/20/09 (b)(f) | | 1,200,000 | | 1,195,320 |
American Express Credit Account Master Trust: | | | | |
Series 2004-1 Class B, 3.6381% 9/15/11 (f) | | 410,000 | | 411,613 |
Series 2004-5 Class B, 3.6381% 4/16/12 (f) | | 2,150,000 | | 2,155,806 |
Series 2004-C Class C, 3.8881% 2/15/12 (b)(f) | | 1,039,411 | | 1,042,479 |
Series 2005-1 Class A, 3.4181% 10/15/12 (f) | | 2,185,000 | | 2,188,761 |
AmeriCredit Automobile Receivables Trust: | | | | |
Series 2003-AM Class A4B, 3.81% 11/6/09 (f) | | 600,000 | | 602,016 |
Series 2003-BX Class A4B, 3.72% 1/6/10 (f) | | 140,000 | | 140,459 |
Series 2003-CF Class A3, 2.75% 10/9/07 | | 699,964 | | 697,759 |
Series 2004-1 Class A3, 3.22% 7/6/08 | | 365,000 | | 362,469 |
Series 2005-1 Class C, 4.73% 7/6/10 | | 2,500,000 | | 2,492,250 |
Series 2005-BM ClassA3, 4.05% 1/6/10 | | 1,280,000 | | 1,277,160 |
Ameriquest Mortgage Securities, Inc.: | | | | |
Series 2002-4 Class M1, 4.46% 2/25/33 (f) | | 105,000 | | 105,529 |
Series 2003-1: | | | | |
Class A2, 3.87% 2/25/33 (f) | | 13,876 | | 13,883 |
Class M1, 4.36% 2/25/33 (f) | | 500,000 | | 503,890 |
Series 2003-11 Class M1, 4.15% 1/25/34 (f) | | 1,535,000 | | 1,549,684 |
Series 2003-3 Class M1, 4.26% 3/25/33 (f) | | 75,000 | | 75,636 |
Series 2003-6: | | | | |
Class M1, 4.22% 8/25/33 (f) | | 1,000,000 | | 1,006,776 |
Class S, 5% 5/25/33 (h) | | 1,779,006 | | 21,519 |
Series 2003-7 Class M1, 4.31% 8/25/33 (f) | | 140,000 | | 142,193 |
Asset-Backed Securities - continued |
| Principal
Amount | | Value
(Note 1) |
Ameriquest Mortgage Securities, Inc.: - continued | | | | |
Series 2003-AR1 Class M1, 4.61% 1/25/33 (f) | | $ 500,000 | | $ 505,188 |
Series 2004-R2: | | | | |
Class M1, 3.89% 4/25/34 (f) | | 85,000 | | 84,996 |
Class M2, 3.94% 4/25/34 (f) | | 75,000 | | 74,997 |
Series 2004-R9: | | | | |
Class A3, 3.78% 10/25/34 (f) | | 1,020,000 | | 1,022,170 |
Class M2, 4.11% 10/25/34 (f) | | 720,000 | | 721,638 |
Class M4, 4.63% 10/25/34 (f) | | 925,000 | | 939,417 |
Series 2005-R1: | | | | |
Class M1, 3.91% 3/25/35 (f) | | 770,000 | | 767,479 |
Class M2, 3.94% 3/25/35 (f) | | 260,000 | | 259,172 |
Series 2005-R2 Class M1, 3.91% 4/25/35 (f) | | 1,700,000 | | 1,697,622 |
Amortizing Residential Collateral Trust: | | | | |
Series 2002-BC6 Class M1, 4.21% 8/25/32 (f) | | 100,000 | | 100,871 |
Series 2002-BC7: | | | | |
Class M1, 4.1144% 10/25/32 (f) | | 450,000 | | 453,375 |
Class M2, 4.36% 10/25/32 (f) | | 300,000 | | 301,995 |
Series 2003-BC1 Class M2, 4.56% 1/25/32 (f) | | 53,547 | | 53,794 |
ARG Funding Corp.: | | | | |
Series 2005-1A Class A2, 3.53% 4/20/09 (b)(f) | | 1,500,000 | | 1,496,719 |
Series 2005-2A Class A2, 3.54% 5/20/09 (b)(f) | | 800,000 | | 798,531 |
Argent Securities, Inc.: | | | | |
Series 2003-W3 Class M2, 5.26% 9/25/33 (f) | | 800,000 | | 824,000 |
Series 2003-W6 Class AV2, 3.83% 1/25/34 (f) | | 219,651 | | 219,906 |
Series 2004-W7: | | | | |
Class M1, 4.01% 5/25/34 (f) | | 305,000 | | 304,987 |
Class M2, 4.06% 5/25/34 (f) | | 250,000 | | 249,989 |
Asset Backed Funding Certificates Series 2004-HE1 Class M2, 4.61% 1/25/34 (f) | | 230,000 | | 233,445 |
Asset Backed Securities Corp. Home Equity Loan Trust: | | | | |
Series 2003-HE2: | | | | |
Class A2, 3.7681% 4/15/33 (f) | | 26,038 | | 26,049 |
Class M1, 4.2881% 4/15/33 (f) | | 1,340,000 | | 1,347,558 |
Series 2003-HE3 Class A2, 3.7381% 6/15/33 (f) | | 7,668 | | 7,669 |
Series 2003-HE4 Class M2, 5.3881% 8/15/33 (f) | | 285,000 | | 290,187 |
Series 2003-HE5 Class A2A, 3.7481% 8/15/33 (f) | | 46,027 | | 46,046 |
Series 2003-HE6 Class M1, 4.11% 11/25/33 (f) | | 215,000 | | 215,951 |
Series 2003-HE7 Class A3, 3.7481% 12/15/33 (f) | | 246,585 | | 247,494 |
Series 2004-HE6 Class A2, 3.82% 6/25/34 (f) | | 1,747,159 | | 1,750,852 |
Series 2005-HE2: | | | | |
Class M1, 3.91% 3/25/35 (f) | | 1,105,000 | | 1,103,123 |
Class M2, 3.96% 3/25/35 (f) | | 275,000 | | 275,089 |
Asset-Backed Securities - continued |
| Principal
Amount | | Value
(Note 1) |
Bank One Issuance Trust: | | | | |
Series 2002-B1 Class B1, 3.7681% 12/15/09 (f) | | $ 465,000 | | $ 466,938 |
Series 2002-B2 Class B2, 3.7281% 5/15/08 (f) | | 100,000 | | 100,013 |
Series 2002-B3 Class B, 3.7481% 8/15/08 (f) | | 500,000 | | 500,202 |
Series 2002-C1 Class C1, 4.3481% 12/15/09 (f) | | 675,000 | | 682,229 |
Series 2002-C2 Class C2, 4.3781% 5/15/08 (f) | | 2,850,000 | | 2,852,599 |
Series 2004-C1 Class C1, 3.8881% 11/15/11 (f) | | 25,000 | | 25,119 |
Bayview Financial Acquisition Trust Series 2004-C Class A1, 3.9013% 5/28/44 (f) | | 890,595 | | 890,497 |
Bayview Financial Asset Trust Series 2000-F Class A, 3.9813% 9/28/43 (f) | | 240,470 | | 240,808 |
Bayview Financial Mortgage Loan Trust Series 2004-A Class A, 3.9313% 2/28/44 (f) | | 427,612 | | 428,472 |
Bear Stearns Asset Backed Securities I: | | | | |
Series 2004-BO1: | | | | |
Class M2, 4.21% 9/25/34 (f) | | 390,000 | | 392,565 |
Class M3, 4.51% 9/25/34 (f) | | 265,000 | | 266,723 |
Class M4, 4.66% 9/25/34 (f) | | 225,000 | | 227,761 |
Class M5, 4.86% 9/25/34 (f) | | 210,000 | | 213,245 |
Series 2004-HE9 Class M2, 4.66% 11/25/34 (f) | | 490,000 | | 492,153 |
Series 2005-HE2: | | | | |
Class M1, 3.96% 2/25/35 (f) | | 905,000 | | 902,860 |
Class M2, 4.21% 2/25/35 (f) | | 330,000 | | 330,345 |
Capital Auto Receivables Asset Trust: | | | | |
Series 2003-1 Class B, 3.8581% 6/15/10 (b)(f) | | 139,307 | | 139,701 |
Series 2005-1 Class B, 3.7631% 6/15/10 (f) | | 850,000 | | 850,797 |
Capital One Auto Finance Trust: | | | | |
Series 2003-A Class A4B, 3.6681% 1/15/10 (f) | | 425,000 | | 426,084 |
Series 2004-B Class A4, 3.4981% 8/15/11 (f) | | 1,700,000 | | 1,700,326 |
Capital One Master Trust: | | | | |
Series 2001-1 Class B, 3.8981% 12/15/10 (f) | | 500,000 | | 503,554 |
Series 2001-8A Class B, 3.9381% 8/17/09 (f) | | 405,000 | | 407,079 |
Capital One Multi-Asset Execution Trust: | | | | |
Series 2002-B1 Class B1, 4.0681% 7/15/08 (f) | | 1,035,000 | | 1,035,408 |
Series 2003-B1 Class B1, 4.5581% 2/17/09 (f) | | 1,135,000 | | 1,142,100 |
Series 2003-B6 Class B6, 3.9181% 9/15/11 (f) | | 1,125,000 | | 1,135,593 |
Series 2004-B1 Class B1, 3.8281% 11/15/11 (f) | | 1,180,000 | | 1,185,793 |
Capital One Prime Auto Receivable Trust Series 2004-1 Class A3, 2.02% 11/15/07 | | 15,396 | | 15,267 |
Capital Trust Ltd. Series 2004-1: | | | | |
Class A2, 3.88% 7/20/39 (b)(f) | | 265,000 | | 265,000 |
Class B, 4.18% 7/20/39 (b)(f) | | 140,000 | | 140,000 |
Class C, 4.53% 7/20/39 (b)(f) | | 180,000 | | 180,000 |
Asset-Backed Securities - continued |
| Principal
Amount | | Value
(Note 1) |
Cayman ABSC NIMS Trust Series 2004-HE2 Class A1, 6.75% 4/25/34 (b) | | $ 648,383 | | $ 649,194 |
CDC Mortgage Capital Trust: | | | | |
Series 2002-HE3: | | | | |
Class M1, 4.56% 3/25/33 (f) | | 297,766 | | 301,783 |
Class M2, 5.71% 3/25/33 (f) | | 489,999 | | 498,600 |
Series 2003-HE1 Class M2, 5.41% 8/25/33 (f) | | 215,000 | | 217,562 |
Series 2003-HE2 Class A, 3.81% 10/25/33 (f) | | 71,407 | | 71,452 |
Series 2003-HE3: | | | | |
Class M1, 4.16% 11/25/33 (f) | | 104,999 | | 105,790 |
Class M2, 5.21% 11/25/33 (f) | | 80,000 | | 81,561 |
Series 2003-HE4 Class A2, 3.69% 3/25/34 (f) | | 54,419 | | 54,424 |
Series 2004-HE2 Class M2, 4.66% 7/26/34 (f) | | 175,000 | | 176,563 |
Chase Credit Card Owner Trust: | | | | |
Series 2001-6 Class B, 3.8681% 3/16/09 (f) | | 200,000 | | 200,945 |
Series 2002-6 Class B, 3.7381% 1/15/08 (f) | | 150,000 | | 150,031 |
Series 2004-1 Class B, 3.5881% 5/15/09 (f) | | 295,000 | | 294,943 |
Chase Issuance Trust Series 2004-C3 Class C3, 3.8581% 6/15/12 (f) | | 1,645,000 | | 1,646,915 |
CIT Equipment Collateral Trust Series 2005-VT1 Class C, 4.18% 11/20/12 | | 1,186,832 | | 1,181,903 |
Citibank Credit Card Issuance Trust: | | | | |
Series 2000-C2 Class C2, 4.2488% 10/15/07 (f) | | 900,000 | | 900,584 |
Series 2001-B2 Class B2, 3.8494% 12/10/08 (f) | | 615,000 | | 617,592 |
Series 2002-B1 Class B1, 3.8% 6/25/09 (f) | | 655,000 | | 657,099 |
Series 2002-C1 Class C1, 4.2185% 2/9/09 (f) | | 900,000 | | 909,613 |
Series 2003-C1 Class C1, 4.65% 4/7/10 (f) | | 1,685,000 | | 1,719,786 |
Countrywide Home Loans, Inc.: | | | | |
Series 2002-6 Class AV1, 3.89% 5/25/33 (f) | | 62,494 | | 62,645 |
Series 2003-BC1 Class M2, 5.46% 9/25/32 (f) | | 1,025,000 | | 1,037,455 |
Series 2003-SD3 Class A1, 3.88% 12/25/32 (b)(f) | | 57,073 | | 57,365 |
Series 2004-2 Class M1, 3.96% 5/25/34 (f) | | 375,000 | | 375,485 |
Series 2004-3: | | | | |
Class 3A4, 3.71% 8/25/34 (f) | | 7,367,340 | | 7,337,420 |
Class M1, 3.96% 6/25/34 (f) | | 100,000 | | 100,092 |
Series 2005-1: | | | | |
Class 1AV2, 3.66% 7/25/35 (f) | | 1,220,000 | | 1,219,321 |
Class MV1, 3.86% 7/25/35 (f) | | 435,000 | | 434,337 |
Class MV2, 3.9% 7/25/35 (f) | | 525,000 | | 523,487 |
Class MV3, 3.94% 7/25/35 (f) | | 215,000 | | 214,690 |
Series 2005-AB1 Class A2, 3.67% 8/25/35 (f) | | 2,480,000 | | 2,479,263 |
Series 2005-IM1 Class A1, 3.56% 8/25/34 (c)(f) | | 2,520,000 | | 2,520,000 |
Asset-Backed Securities - continued |
| Principal
Amount | | Value
(Note 1) |
CS First Boston Mortgage Securities Corp.: | | | | |
Series 2003-8 Class A2, 3.85% 4/25/34 (f) | | $ 227,901 | | $ 228,901 |
Series 2004-FRE1: | | | | |
Class A2, 3.81% 4/25/34 (f) | | 277,344 | | 277,333 |
Class B1, 5.26% 4/25/34 (f) | | 605,000 | | 604,973 |
Class M3, 4.11% 4/25/34 (f) | | 610,000 | | 609,974 |
Discover Card Master Trust I Series 2003-4 Class B1, 3.7181% 5/16/11 (f) | | 550,000 | | 552,820 |
Fannie Mae guaranteed REMIC pass thru certificates Series 2004-T5: | | | | |
Class AB1, 3.674% 5/28/35 (f) | | 996,756 | | 996,055 |
Class AB3, 3.8305% 5/28/35 (f) | | 833,229 | | 833,518 |
Class AB8, 3.784% 5/28/35 (f) | | 861,407 | | 861,812 |
Fieldstone Mortgage Investment Corp.: | | | | |
Series 2003-1 Class M1, 4.14% 11/25/33 (f) | | 100,000 | | 100,673 |
Series 2004-1 Class M2, 4.56% 1/25/35 (f) | | 300,000 | | 303,371 |
Series 2004-3 Class M5, 4.91% 8/25/34 (f) | | 1,500,000 | | 1,525,372 |
Series 2005-2 Class 2A1, 3.5% 7/25/36 (f) | | 2,365,000 | | 2,365,000 |
First Franklin Mortgage Loan Asset Backed Certificates: | | | | |
Series 2005-FF2 Class A2A, 3.55% 3/25/35 (f) | | 875,548 | | 875,548 |
Series 2005-FF2 Class M6, 4.16% 3/25/35 (f) | | 1,000,000 | | 1,000,000 |
First Franklin Mortgage Loan Trust Series 2004-FF2: | | | | |
Class M3, 4.01% 3/25/34 (f) | | 25,000 | | 25,044 |
Class M4, 4.36% 3/25/34 (f) | | 25,000 | | 25,221 |
First USA Secured Note Trust Series 2001-3 Class C, 4.4669% 11/19/08 (b)(f) | | 785,000 | | 790,519 |
Ford Credit Auto Owner Trust Series 2003-B Class B2, 3.8181% 10/15/07 (f) | | 650,000 | | 652,386 |
Ford Credit Floorplan Master Owner Trust Series 2005-1: | | | | |
Class A, 3.5381% 5/17/10 (f) | | 1,375,000 | | 1,374,997 |
Class B, 3.6563% 5/17/10 (f) | | 380,000 | | 379,999 |
Fremont Home Loan Trust: | | | | |
Series 2003-B Class M6, 7.96% 12/25/33 (f) | | 960,000 | | 992,118 |
Series 2004-A Class M2, 4.61% 1/25/34 (f) | | 375,000 | | 379,299 |
Series 2004-C: | | | | |
Class 2A2, 4.01% 8/25/34 (f) | | 1,000,000 | | 1,010,199 |
Class M1, 4.11% 8/25/34 (f) | | 540,000 | | 541,931 |
Class M3, 4.61% 8/25/34 (f) | | 1,000,000 | | 1,018,991 |
Series 2005-2 Class 2A1, 3.5913% 6/25/35 (f) | | 2,165,000 | | 2,164,323 |
Series 2005-A: | | | | |
Class 2A2, 3.7% 2/25/35 (f) | | 1,625,000 | | 1,627,147 |
Class M1, 3.89% 1/25/35 (f) | | 225,000 | | 224,558 |
Class M2, 3.92% 1/25/35 (f) | | 325,000 | | 324,515 |
Asset-Backed Securities - continued |
| Principal
Amount | | Value
(Note 1) |
Fremont Home Loan Trust: - continued | | | | |
Series 2005-A: | | | | |
Class M3, 3.95% 1/25/35 (f) | | $ 175,000 | | $ 174,993 |
Class M4, 4.14% 1/25/35 (f) | | 125,000 | | 125,343 |
GE Business Loan Trust Series 2003-1 Class A, 3.8181% 4/15/31 (b)(f) | | 276,597 | | 278,184 |
GE Capital Credit Card Master Note Trust Series 2005-2 Class B, 3.5736% 6/15/11 (f) | | 925,000 | | 924,723 |
Gracechurch Card Funding PLC: | | | | |
Series 5: | | | | |
Class B, 3.6181% 8/15/08 (f) | | 80,000 | | 80,071 |
Class C, 4.3181% 8/15/08 (f) | | 295,000 | | 296,118 |
Series 6 Class B, 3.5781% 2/17/09 (f) | | 75,000 | | 75,066 |
Series 8 Class C, 3.6721% 6/15/10 (f) | | 2,650,000 | | 2,650,000 |
GSAMP Trust: | | | | |
Series 2002-NC1 Class A2, 3.78% 7/25/32 (f) | | 2,606 | | 2,621 |
Series 2003-FM1 Class M1, 4.25% 3/20/33 (f) | | 750,000 | | 756,815 |
Series 2004-AHL Class A2D, 3.82% 8/25/34 (f) | | 2,296,054 | | 2,304,562 |
Series 2004-FM1: | | | | |
Class M1, 4.11% 11/25/33 (f) | | 195,000 | | 194,992 |
Class M2, 4.86% 11/25/33 (f) | | 135,000 | | 137,091 |
Series 2004-FM2 Class M1, 3.96% 1/25/34 (f) | | 250,000 | | 249,989 |
Series 2004-HE1: | | | | |
Class M1, 4.01% 5/25/34 (f) | | 320,000 | | 319,987 |
Class M2, 4.61% 5/25/34 (f) | | 150,000 | | 151,394 |
Series 2005-6: | | | | |
Class A2, 3.67% 6/25/35 (f) | | 1,800,000 | | 1,800,000 |
Class M3, 4.11% 6/25/35 (f) | | 1,555,000 | | 1,555,000 |
Series 2005-9 Class 2A1, 3.5287% 8/25/35 (f) | | 2,470,000 | | 2,470,000 |
Series 2005-HE2 Class M, 3.89% 3/25/35 (f) | | 1,220,000 | | 1,215,813 |
Series 2005-NC1: | | | | |
Class A1, 3.58% 2/25/35 (f) | | 714,733 | | 714,884 |
Class M1, 3.91% 2/25/35 (f) | | 1,205,000 | | 1,201,964 |
Guggenheim Structured Real Estate Funding Ltd.
Series 2005-1 Class C, 4.3944% 5/25/30 (b)(f) | | 2,100,000 | | 2,097,998 |
Harwood Street Funding I LLC Series 2004-1A
Class CTFS, 5.43% 9/20/09 (b)(f) | | 1,700,000 | | 1,700,000 |
HFC Home Equity Loan Asset Backed Certificates
Series 2005-2: | | | | |
Class M1, 3.97% 1/20/34 (f) | | 450,000 | | 450,000 |
Class M2, 4% 1/20/34 (f) | | 335,000 | | 335,000 |
Home Equity Asset Trust: | | | | |
Series 2002-3 Class A5, 3.9% 2/25/33 (f) | | 4,294 | | 4,297 |
Asset-Backed Securities - continued |
| Principal
Amount | | Value
(Note 1) |
Home Equity Asset Trust: - continued | | | | |
Series 2002-4 Class A3, 3.94% 3/25/33 (f) | | $ 32,186 | | $ 32,204 |
Series 2002-5: | | | | |
Class A3, 3.98% 5/25/33 (f) | | 81,392 | | 81,563 |
Class M1, 4.66% 5/25/33 (f) | | 200,000 | | 202,410 |
Series 2003-1: | | | | |
Class A2, 3.93% 6/25/33 (f) | | 186,600 | | 186,755 |
Class M1, 4.46% 6/25/33 (f) | | 670,000 | | 673,241 |
Series 2003-2: | | | | |
Class A2, 3.84% 8/25/33 (f) | | 10,404 | | 10,443 |
Class M1, 4.34% 8/25/33 (f) | | 80,000 | | 80,866 |
Series 2003-3: | | | | |
Class A2, 3.82% 8/25/33 (f) | | 65,752 | | 65,998 |
Class M1, 4.32% 8/25/33 (f) | | 330,000 | | 333,299 |
Series 2003-4: | | | | |
Class M1, 4.26% 10/25/33 (f) | | 170,000 | | 171,264 |
Class M2, 5.36% 10/25/33 (f) | | 200,000 | | 202,626 |
Series 2003-5: | | | | |
Class A2, 3.81% 12/25/33 (f) | | 271,685 | | 272,645 |
Class M1, 4.16% 12/25/33 (f) | | 160,000 | | 160,890 |
Class M2, 5.19% 12/25/33 (f) | | 70,000 | | 71,691 |
Series 2003-7: | | | | |
Class A2, 3.84% 3/25/34 (f) | | 625,665 | | 627,147 |
Class M1, 4.11% 3/25/34 (f) | | 795,000 | | 796,953 |
Series 2003-8 Class M1, 4.18% 4/25/34 (f) | | 260,000 | | 261,345 |
Series 2004-4 Class A2, 3.78% 10/25/34 (f) | | 698,058 | | 700,513 |
Series 2004-6 Class A2, 3.81% 12/25/34 (f) | | 1,156,164 | | 1,159,839 |
Series 2005-1: | | | | |
Class M1, 3.89% 5/25/35 (f) | | 1,270,000 | | 1,269,027 |
Class M2, 3.91% 5/25/35 (f) | | 1,410,000 | | 1,405,869 |
Class M3, 3.96% 5/25/35 (f) | | 760,000 | | 757,827 |
Series 2005-2: | | | | |
Class 2A2, 3.66% 7/25/35 (f) | | 1,830,000 | | 1,829,053 |
Class M1, 3.91% 7/25/35 (f) | | 890,000 | | 889,149 |
Household Affinity Credit Card Master Note Trust I
Series 2003-3 Class B, 3.6781% 8/15/08 (f) | | 500,000 | | 500,904 |
Household Credit Card Master Trust I Series 2002-1 Class B, 4.0381% 7/15/08 (f) | | 300,000 | | 300,261 |
Household Home Equity Loan Trust: | | | | |
Series 2002-3 Class A, 3.88% 7/20/32 (f) | | 65,349 | | 65,435 |
Series 2003-1 Class M, 4.06% 10/20/32 (f) | | 39,800 | | 39,846 |
Series 2003-2: | | | | |
Class A, 3.76% 9/20/33 (f) | | 191,819 | | 192,196 |
Asset-Backed Securities - continued |
| Principal
Amount | | Value
(Note 1) |
Household Home Equity Loan Trust: - continued | | | | |
Series 2003-2: | | | | |
Class M, 4.01% 9/20/33 (f) | | $ 90,975 | | $ 91,172 |
Series 2004-1 Class M, 3.95% 9/20/33 (f) | | 249,772 | | 250,245 |
Household Mortgage Loan Trust: | | | | |
Series 2002-HC1 Class M, 4.08% 5/20/32 (f) | | 61,785 | | 61,854 |
Series 2003-HC1 Class M, 4.08% 2/20/33 (f) | | 85,634 | | 85,904 |
Series 2003-HC2 Class M, 4.03% 6/20/33 (f) | | 133,207 | | 133,343 |
Series 2004-HC1: | | | | |
Class A, 3.78% 2/20/34 (f) | | 561,710 | | 563,114 |
Class M, 3.93% 2/20/34 (f) | | 340,666 | | 340,627 |
Household Private Label Credit Card Master Note Trust I: | | | | |
Series 2002-2 Class A, 3.5581% 1/18/11 (f) | | 1,000,000 | | 1,001,358 |
Series 2002-3 Class B, 4.6381% 9/15/09 (f) | | 150,000 | | 150,335 |
Ikon Receivables Funding LLC Series 2003-1 Class A3A, 3.6213% 12/17/07 (f) | | 146,379 | | 146,414 |
IXIS Real Estate Capital Trust Series 2005-HE1: | | | | |
Class A1, 3.71% 6/25/35 (f) | | 1,585,056 | | 1,584,969 |
Class M1, 3.93% 6/25/35 (f) | | 550,000 | | 549,304 |
Class M2, 3.95% 6/25/35 (f) | | 375,000 | | 373,784 |
Class M3, 3.98% 6/25/35 (f) | | 250,000 | | 249,692 |
Keycorp Student Loan Trust Series 1999-A Class A2, 3.8% 12/27/09 (f) | | 295,527 | | 296,531 |
Long Beach Mortgage Loan Trust: | | | | |
Series 2003-2 Class M1, 4.28% 6/25/33 (f) | | 500,000 | | 503,235 |
Series 2003-3 Class M1, 4.21% 7/25/33 (f) | | 340,000 | | 342,390 |
MASTR Adjustable Rate Mortgages Trust Series 2004-11 Class 1A4, 3.95% 11/25/34 (f) | | 201,856 | | 202,942 |
MASTR Asset Backed Securities Trust: | | | | |
Series 2004-FRE1 Class M1, 4.01% 7/25/34 (f) | | 485,000 | | 486,481 |
Series 2004-HE1 Class M1, 4.11% 9/25/34 (f) | | 685,000 | | 687,439 |
MBNA Asset Backed Note Trust Series 2000-K Class C, 4.1881% 3/17/08 (b)(f) | | 1,000,000 | | 1,001,200 |
MBNA Credit Card Master Note Trust: | | | | |
Series 2001-B1 Class B1, 3.7631% 10/15/08 (f) | | 1,250,000 | | 1,251,753 |
Series 2001-B2 Class B2, 3.7481% 1/15/09 (f) | | 1,000,000 | | 1,002,535 |
Series 2002-B2 Class B2, 3.7681% 10/15/09 (f) | | 1,034,000 | | 1,038,477 |
Series 2002-B4 Class B4, 3.8881% 3/15/10 (f) | | 630,000 | | 634,975 |
Series 2003-B2 Class B2, 3.7781% 10/15/10 (f) | | 125,000 | | 126,272 |
Series 2003-B3 Class B3, 3.7631% 1/18/11 (f) | | 1,550,000 | | 1,557,355 |
Series 2003-B5 Class B5, 3.7581% 2/15/11 (f) | | 2,000,000 | | 2,015,453 |
Asset-Backed Securities - continued |
| Principal
Amount | | Value
(Note 1) |
MBNA Master Credit Card Trust II: | | | | |
Series 1998-E Class B, 3.9288% 9/15/10 (f) | | $ 200,000 | | $ 201,194 |
Series 1998-G Class B, 3.7881% 2/17/09 (f) | | 500,000 | | 501,089 |
Meritage Mortgage Loan Trust Series 2004-1: | | | | |
Class M1, 3.96% 7/25/34 (f) | | 150,000 | | 149,994 |
Class M2, 4.01% 7/25/34 (f) | | 25,000 | | 24,999 |
Class M3, 4.41% 7/25/34 (f) | | 50,000 | | 49,998 |
Class M4, 4.56% 7/25/34 (f) | | 50,000 | | 49,998 |
Merrill Lynch Mortgage Investors, Inc.: | | | | |
Series 2004-FM1 Class M2, 4.61% 1/25/35 (f) | | 150,000 | | 152,512 |
Series 2004-HE2: | | | | |
Class A1B, 3.93% 8/25/35 (f) | | 676,518 | | 678,301 |
Class A2B, 3.84% 8/25/35 (f) | | 1,510,000 | | 1,516,695 |
Series 2005-NC1 Class A2A, 3.57% 10/25/35 (f) | | 75,282 | | 75,295 |
Morgan Stanley ABS Capital I, Inc.: | | | | |
Series 2002-HE3 Class M1, 4.56% 12/27/32 (f) | | 125,000 | | 126,613 |
Series 2003-NC10 Class M1, 4.14% 10/25/33 (f) | | 830,000 | | 833,555 |
Series 2003-NC5 Class M2, 5.46% 4/25/33 (f) | | 200,000 | | 202,438 |
Series 2003-NC6 Class M2, 5.41% 6/27/33 (f) | | 630,000 | | 646,975 |
Series 2003-NC8 Class M1, 4.16% 9/25/33 (f) | | 120,000 | | 120,688 |
Series 2004-HE6 Class A2, 3.8% 8/25/34 (f) | | 1,198,948 | | 1,202,870 |
Series 2004-NC2 Class M1, 4.01% 12/25/33 (f) | | 375,000 | | 375,630 |
Series 2004-NC6 Class A2, 3.8% 7/25/34 (f) | | 318,867 | | 319,551 |
Series 2004-NC7 Class A3, 3.76% 7/25/34 (f) | | 2,000,000 | | 2,002,503 |
Series 2005-1: | | | | |
Class M2, 3.93% 12/25/34 (f) | | 570,000 | | 569,077 |
Class M3, 3.98% 12/25/34 (f) | | 525,000 | | 524,772 |
Series 2005-HE1: | | | | |
Class A3B, 3.68% 12/25/34 (f) | | 505,000 | | 505,554 |
Class M1, 3.91% 12/25/34 (f) | | 150,000 | | 150,307 |
Class M2, 3.93% 12/25/34 (f) | | 385,000 | | 384,529 |
Series 2005-HE2: | | | | |
Class M1, 3.86% 1/25/35 (f) | | 370,000 | | 370,764 |
Class M2, 3.9% 1/25/35 (f) | | 265,000 | | 264,137 |
Series 2005-NC1: | | | | |
Class M1, 3.9% 1/25/35 (f) | | 325,000 | | 326,036 |
Class M2, 3.93% 1/25/35 (f) | | 325,000 | | 324,471 |
Class M3, 3.97% 1/25/35 (f) | | 325,000 | | 325,114 |
Morgan Stanley Dean Witter Capital I Trust: | | | | |
Series 2001-AM1: | | | | |
Class M1, 4.31% 2/25/32 (f) | | 710,724 | | 712,449 |
Class M2, 4.86% 2/25/32 (f) | | 352,076 | | 353,279 |
Asset-Backed Securities - continued |
| Principal
Amount | | Value
(Note 1) |
Morgan Stanley Dean Witter Capital I Trust: - continued | | | | |
Series 2001-NC1 Class M2, 4.53% 10/25/31 (f) | | $ 42,925 | | $ 42,925 |
Series 2001-NC2 Class B1, 5.41% 1/25/32 (f) | | 191,907 | | 191,996 |
Series 2001-NC4 Class M1, 4.46% 1/25/32 (f) | | 136,710 | | 137,208 |
Series 2002-AM3 Class A3, 3.95% 2/25/33 (f) | | 28,532 | | 28,612 |
Series 2002-HE1 Class M1, 4.06% 7/25/32 (f) | | 590,000 | | 593,338 |
Series 2002-NC3 Class M1, 4.18% 8/25/32 (f) | | 100,000 | | 100,768 |
Series 2002-OP1 Class M1, 4.21% 9/25/32 (f) | | 435,350 | | 437,933 |
Series 2003-NC1 Class M2, 5.51% 11/25/32 (f) | | 130,000 | | 131,317 |
Series 2003-NC2: | | | | |
Class A3, 3.89% 2/25/33 (f) | | 250,680 | | 250,814 |
Class M2, 5.46% 2/25/33 (f) | | 165,000 | | 167,614 |
Navistar Financial Corp. Owner Trust Series 2001-B Class B, 4.83% 11/17/08 | | 380,731 | | 380,097 |
New Century Home Equity Loan Trust: | | | | |
Series 2003-2 Class A2, 3.89% 1/25/33 (f) | | 12,065 | | 12,072 |
Series 2005-1: | | | | |
Class M1, 3.91% 3/25/35 (f) | | 595,000 | | 594,722 |
Class M2, 3.94% 3/25/35 (f) | | 595,000 | | 593,624 |
Class M3, 3.98% 3/25/35 (f) | | 290,000 | | 290,109 |
Nissan Auto Lease Trust: | | | | |
Series 2003-A Class A3A, 3.5281% 6/15/09 (f) | | 681,088 | | 681,672 |
Series 2004-A Class A4A, 3.4581% 6/15/10 (f) | | 1,325,000 | | 1,326,627 |
NovaStar Home Equity Loan Series 2004-1: | | | | |
Class M1, 3.91% 6/25/34 (f) | | 100,000 | | 100,084 |
Class M4, 4.435% 6/25/34 (f) | | 170,000 | | 170,290 |
NovaStar Mortgage Funding Trust Series 2003-3
Class A3, 3.91% 12/25/33 (f) | | 355,121 | | 356,969 |
Onyx Acceptance Owner Trust Series 2003-D Class A3, 2.4% 12/15/07 | | 253,203 | | 252,146 |
Option One Mortgage Loan Trust Series 2003-6
Class M1, 4.11% 11/25/33 (f) | | 1,025,000 | | 1,029,413 |
Ownit Mortgage Loan Asste-Backed Certificates
Series 2005-3 Class A2A, 3.5% 6/25/36 (f) | | 2,200,000 | | 2,200,000 |
Park Place Securities NIM Trust Series 2004-WHQN2 Class A, 4% 2/25/35 (b) | | 703,944 | | 698,665 |
Park Place Securities Nims Trust Series 2004-MHQ1 Class B, 3.474% 12/25/34 (b) | | 122,735 | | 121,508 |
Park Place Securities, Inc.: | | | | |
Series 2004 WWF1 Class M4, 4.56% 1/25/35 (f) | | 945,000 | | 964,465 |
Series 2004-WCW1: | | | | |
Class M1, 4.09% 9/25/34 (f) | | 385,000 | | 386,205 |
Class M2, 4.14% 9/25/34 (f) | | 160,000 | | 160,850 |
Asset-Backed Securities - continued |
| Principal
Amount | | Value
(Note 1) |
Park Place Securities, Inc.: - continued | | | | |
Series 2004-WCW1: | | | | |
Class M3, 4.71% 9/25/34 (f) | | $ 310,000 | | $ 313,857 |
Class M4, 4.91% 9/25/34 (f) | | 435,000 | | 441,258 |
Series 2004-WCW2 Class A2, 3.84% 10/25/34 (f) | | 890,219 | | 892,848 |
Series 2004-WWF1 Class A5, 3.93% 1/25/35 (f) | | 482,969 | | 485,702 |
Series 2005-WCH1: | | | | |
Class A3B, 3.68% 1/25/35 (f) | | 360,000 | | 360,637 |
Class M2, 3.98% 1/25/35 (f) | | 1,130,000 | | 1,127,710 |
Class M3, 4.02% 1/25/35 (f) | | 425,000 | | 425,336 |
Class M5, 4.34% 1/25/35 (f) | | 400,000 | | 401,243 |
People's Choice Home Loan Securities Trust Series 2005-2: | | | | |
Class A1, 3.57% 9/25/24 (f) | | 1,082,642 | | 1,082,642 |
Class M4, 4.09% 5/25/35 (f) | | 870,000 | | 870,000 |
Providian Gateway Master Trust Series 2002-B Class A, 4.0881% 6/15/09 (b)(f) | | 400,000 | | 401,050 |
Residental Asset Securities Corp.: | | | | |
Series 2004-KS10 Class AI2, 3.78% 3/25/29 (f) | | 50,000 | | 50,163 |
Series 2005-KS7 Class A1, 3.4781% 8/25/35 (f) | | 1,485,000 | | 1,484,703 |
Residential Asset Mortgage Products, Inc.: | | | | |
Series 2004-RS10 Class MII2, 4.71% 10/25/34 (f) | | 1,300,000 | | 1,315,803 |
Series 2004-RS6: | | | | |
Class 2M2, 4.76% 6/25/34 (f) | | 250,000 | | 249,999 |
Class 2M3, 4.91% 6/25/34 (f) | | 250,000 | | 249,999 |
Salomon Brothers Mortgage Securities VII, Inc.
Series 2003-HE1 Class A, 3.86% 4/25/33 (f) | | 33,795 | | 33,950 |
Saxon Asset Securities Trust: | | | | |
Series 2004-1 Class M1, 3.99% 3/25/35 (f) | | 640,000 | | 639,839 |
Series 2004-2 Class MV1, 4.04% 8/25/35 (f) | | 415,000 | | 415,558 |
Sears Credit Account Master Trust II: | | | | |
Series 2002-4: | | | | |
Class A, 3.5181% 8/18/09 (f) | | 800,000 | | 799,988 |
Class B, 3.8131% 8/18/09 (f) | | 1,080,000 | | 1,080,037 |
Series 2002-5 Class B, 4.6381% 11/17/09 (f) | | 500,000 | | 501,050 |
Specialty Underwriting & Residential Finance: | | | | |
Series 2003-BC3 Class M1, 4.11% 8/25/34 (f) | | 1,000,000 | | 1,000,989 |
Series 2003-BC4 Class M1, 4.06% 11/25/34 (f) | | 260,000 | | 261,214 |
Structured Asset Securities Corp. Series 2004-GEL1 Class A, 3.82% 2/25/34 (f) | | 79,391 | | 79,391 |
Superior Wholesale Inventory Financing Trust VII
Series 2003-A8 Class CTFS, 3.8381% 3/15/11 (b)(f) | | 675,000 | | 674,578 |
Superior Wholesale Inventory Financing Trust XII
Series 2005-A12 Class C, 4.46% 6/15/10 (f) | | 980,000 | | 979,992 |
Asset-Backed Securities - continued |
| Principal
Amount | | Value
(Note 1) |
Terwin Mortgage Trust: | | | | |
Series 2003-4HE Class A1, 3.89% 9/25/34 (f) | | $ 316,689 | | $ 318,405 |
Series 2003-6HE Class A1, 3.93% 11/25/33 (f) | | 121,556 | | 121,840 |
Series 2005-14HE Class AF1, 3.9753% 7/25/36 (c)(f) | | 1,205,000 | | 1,204,762 |
Triad Automobile Receivable Owner Trust Series 2005-A Class A3, 4.05% 3/12/10 | | 1,800,000 | | 1,786,140 |
WFS Financial Owner Trust: | | | | |
Series 2004-3 Class D, 4.07% 2/17/12 | | 514,264 | | 510,174 |
Series 2004-4 Class D, 3.58% 5/17/12 | | 470,497 | | 464,431 |
Series 2005-1 Class D, 4.09% 8/15/12 | | 495,000 | | 490,205 |
TOTAL ASSET-BACKED SECURITIES (Cost $208,706,183) | 209,007,290 |
Collateralized Mortgage Obligations - 16.5% |
|
Private Sponsor - 12.7% |
Adjustable Rate Mortgage Trust floater: | | | | |
Series 2004-2 Class 7A3, 3.86% 2/25/35 (f) | | 1,442,226 | | 1,445,544 |
Series 2004-4 Class 5A2, 3.86% 3/25/35 (f) | | 457,785 | | 458,697 |
Series 2005-1 Class 5A2, 3.79% 5/25/35 (f) | | 805,325 | | 805,834 |
Series 2005-2: | | | | |
Class 6A2, 3.74% 6/25/35 (f) | | 404,220 | | 404,482 |
Class 6M2, 3.94% 6/25/35 (f) | | 1,375,000 | | 1,375,001 |
Series 2005-3 Class 8A2, 3.7% 7/25/35 (f) | | 2,667,770 | | 2,669,507 |
Series 2005-5 Class 6A2, 3.69% 9/25/35 (f) | | 1,718,837 | | 1,719,960 |
Series 2005-8 Class 7A2, 3.77% 11/25/35 (f) | | 1,080,000 | | 1,080,000 |
Bear Stearns Alt-A Trust floater: | | | | |
Series 2005-1 Class A1, 3.74% 1/25/35 (f) | | 2,624,958 | | 2,624,958 |
Series 2005-2 Class 1A1, 3.71% 3/25/35 (f) | | 2,137,295 | | 2,137,295 |
Countrywide Home Loans, Inc. floater: | | | | |
Series 2004-16 Class A1, 3.86% 9/25/34 (f) | | 861,288 | | 860,487 |
Series 2005-1 Class 2A1, 3.75% 3/25/35 (f) | | 1,999,309 | | 1,999,309 |
CS First Boston Mortgage Securities Corp. floater: | | | | |
Series 2004-AR2 Class 6A1, 3.86% 3/25/34 (f) | | 381,304 | | 381,067 |
Series 2004-AR3 Class 6A2, 3.83% 4/25/34 (f) | | 156,402 | | 156,541 |
Series 2004-AR5 Class 11A2, 3.83% 6/25/34 (f) | | 247,979 | | 247,474 |
Series 2004-AR6 Class 9A2, 3.83% 10/25/34 (f) | | 338,414 | | 338,617 |
Series 2004-AR7 Class 6A2, 3.84% 8/25/34 (f) | | 554,730 | | 555,220 |
Series 2004-AR8 Class 8A2, 3.84% 9/25/34 (f) | | 501,538 | | 502,468 |
Fieldstone Mortgage Investment Corp. floater Series 2004-1 Class 2A, 3.75% 1/25/35 (f) | | 1,470,843 | | 1,473,489 |
First Horizon Mortgage Passthru Trust floater Series 2004-FL1 Class 2A1, 3.95% 12/25/34 (f) | | 587,411 | | 586,732 |
Collateralized Mortgage Obligations - continued |
| Principal
Amount | | Value
(Note 1) |
Private Sponsor - continued |
Granite Master Issuer PLC floater: | | | | |
Series 2005-1: | | | | |
Class A3, 3.51% 12/21/24 (f) | | $ 700,000 | | $ 699,869 |
Class B1, 3.56% 12/20/54 (f) | | 950,000 | | 949,673 |
Class M1, 3.66% 12/20/54 (f) | | 700,000 | | 699,759 |
Series 2005-2 Class C1, 3.7857% 12/20/54 (f) | | 1,200,000 | | 1,199,625 |
Granite Mortgages PLC floater: | | | | |
Series 2004-1: | | | | |
Class 1B, 3.64% 3/20/44 (f) | | 95,000 | | 94,990 |
Class 1C, 4.33% 3/20/44 (f) | | 280,000 | | 281,114 |
Class 1M, 3.84% 3/20/44 (f) | | 565,000 | | 565,429 |
Series 2004-2: | | | | |
Class 1A2, 3.5% 6/20/28 (f) | | 414,174 | | 414,226 |
Class 1B, 3.6% 6/20/44 (f) | | 82,769 | | 82,790 |
Class 1C, 4.13% 6/20/44 (f) | | 302,300 | | 302,922 |
Class 1M, 3.71% 6/20/44 (f) | | 1,811,086 | | 1,811,990 |
Series 2004-3: | | | | |
Class 1B, 3.59% 9/20/44 (f) | | 200,000 | | 200,020 |
Class 1C, 4.02% 9/20/44 (f) | | 605,000 | | 606,331 |
Class 1M, 3.7% 9/20/44 (f) | | 100,000 | | 100,030 |
GSAMP Trust floater Series 2004-11 Class 2A1, 3.79% 12/20/34 (f) | | 1,902,591 | | 1,903,510 |
Holmes Financing No. 7 PLC floater Series 2 Class M, 4.3988% 7/15/40 (f) | | 195,000 | | 195,374 |
Holmes Financing No. 8 PLC floater Series 2: | | | | |
Class A, 3.6788% 4/15/11 (f) | | 1,400,000 | | 1,400,000 |
Class B, 3.7688% 7/15/40 (f) | | 190,000 | | 190,119 |
Class C, 4.3188% 7/15/40 (f) | | 775,000 | | 778,633 |
Homestar Mortgage Acceptance Corp. floater
Series 2004-5 Class A1, 3.91% 10/25/34 (f) | | 1,226,026 | | 1,229,819 |
Impac CMB Trust floater: | | | | |
Series 2004-11 Class 2A2, 3.83% 3/25/35 (f) | | 1,006,838 | | 1,006,641 |
Series 2004-6 Class 1A2, 3.85% 10/25/34 (f) | | 359,177 | | 359,819 |
Series 2005-1: | | | | |
Class M1, 3.92% 4/25/35 (f) | | 431,371 | | 430,916 |
Class M2, 3.96% 4/25/35 (f) | | 762,845 | | 762,219 |
Class M3, 3.99% 4/25/35 (f) | | 186,171 | | 185,974 |
Class M4, 4.21% 4/25/35 (f) | | 113,519 | | 113,634 |
Class M5, 4.23% 4/25/35 (f) | | 113,519 | | 113,496 |
Class M6, 4.28% 4/25/35 (f) | | 177,089 | | 177,054 |
Series 2005-2 Class 1A2, 3.77% 4/25/35 (f) | | 1,780,275 | | 1,778,884 |
Series 2005-4 Class 1B1, 4.76% 6/25/35 (f) | | 768,362 | | 764,881 |
Collateralized Mortgage Obligations - continued |
| Principal
Amount | | Value
(Note 1) |
Private Sponsor - continued |
Lehman Structured Securities Corp. floater Series 2005-1 Class A2, 3.67% 9/26/45 (b)(f) | | $ 2,279,281 | | $ 2,279,281 |
Master Seasoned Securitization Trust Series 2004-1 Class 1A1, 6.2437% 8/25/17 (f) | | 724,549 | | 740,972 |
MASTR Adjustable Rate Mortgages Trust: | | | | |
floater: | | | | |
Series 2004-11: | | | | |
Class 2A1, 3.84% 11/25/34 (f) | | 920,409 | | 922,519 |
Class 2A2, 3.9% 11/25/34 (f) | | 202,627 | | 202,989 |
Series 2005-1 Class 1A1, 3.73% 3/25/35 (f) | | 1,828,937 | | 1,827,794 |
Series 2004-6 Class 4A2, 4.1729% 7/25/34 (f) | | 3,000,000 | | 2,988,733 |
Merrill Lynch Mortgage Investors, Inc.: | | | | |
floater: | | | | |
Series 2003-A: | | | | |
Class 2A1, 3.85% 3/25/28 (f) | | 307,678 | | 309,340 |
Class 2A2, 3.5225% 3/25/28 (f) | | 109,885 | | 110,037 |
Series 2003-B Class A1, 3.8% 4/25/28 (f) | | 285,446 | | 287,110 |
Series 2003-D Class A, 3.77% 8/25/28 (f) | | 1,398,627 | | 1,401,467 |
Series 2003-E Class A2, 3.4425% 10/25/28 (f) | | 610,693 | | 610,694 |
Series 2003-F Class A2, 3.7075% 10/25/28 (f) | | 644,648 | | 644,574 |
Series 2004-A Class A2, 3.6175% 4/25/29 (f) | | 814,476 | | 812,541 |
Series 2004-B Class A2, 3.79% 6/25/29 (f) | | 773,875 | | 772,011 |
Series 2004-C Class A2, 3.95% 7/25/29 (f) | | 1,096,179 | | 1,093,557 |
Series 2004-D Class A2, 3.4725% 9/25/29 (f) | | 1,116,205 | | 1,116,496 |
Series 2004-E Class A2D, 3.9175% 11/25/29 (f) | | 1,189,384 | | 1,195,098 |
Series 2004-G Class A2, 3.95% 11/25/29 (f) | | 468,938 | | 468,889 |
Series 2005-A Class A2, 3.38% 2/25/30 (f) | | 1,468,737 | | 1,466,623 |
Series 2005-B Class A2, 3.75% 6/25/30 (f) | | 1,542,233 | | 1,542,233 |
Series 2003-G Class XA1, 1% 1/25/29 (h) | | 2,547,661 | | 33,024 |
MortgageIT Trust floater Series 2004-2: | | | | |
Class A1, 3.83% 12/25/34 (f) | | 593,487 | | 594,347 |
Class A2, 3.91% 12/25/34 (f) | | 801,651 | | 806,407 |
Opteum Mortgage Acceptance Corp. floater
Series 2005-3 Class APT, 3.75% 6/25/35 (f) | | 2,639,441 | | 2,640,987 |
Permanent Financing No. 1 PLC floater Series 1: | | | | |
Class 2C, 4.5594% 6/10/42 (f) | | 2,000,000 | | 2,005,024 |
Class 3C, 4.5794% 6/10/42 (f) | | 1,700,000 | | 1,708,127 |
Permanent Financing No. 3 PLC floater Series 2 Class C, 4.4294% 6/10/42 (f) | | 1,205,000 | | 1,217,050 |
Permanent Financing No. 4 PLC floater Series 2 Class C, 4.0994% 6/10/42 (f) | | 1,145,000 | | 1,150,599 |
Collateralized Mortgage Obligations - continued |
| Principal
Amount | | Value
(Note 1) |
Private Sponsor - continued |
Permanent Financing No. 5 PLC floater: | | | | |
Series 2 Class C, 4.0294% 6/10/42 (f) | | $ 390,000 | | $ 391,828 |
Series 3 Class C, 4.1994% 6/10/42 (f) | | 825,000 | | 832,219 |
Permanent Financing No. 6 PLC floater Series 6: | | | | |
Class 1C, 3.7294% 6/10/42 (f) | | 500,000 | | 500,072 |
Class 2C, 3.8294% 6/10/42 (f) | | 1,600,000 | | 1,600,701 |
Permanent Financing No. 7 PLC floater Series 7: | | | | |
Class 1B, 3.4694% 6/10/42 (f) | | 2,000,000 | | 1,999,375 |
Class 1C, 3.6594% 6/10/42 (f) | | 545,000 | | 544,830 |
Class 2C, 3.7094% 6/10/42 (f) | | 1,140,000 | | 1,138,575 |
Permanent Financing No. 8 PLC floater Series 8: | | | | |
Class 1C, 3.7475% 6/10/42 (f) | | 1,035,000 | | 1,034,656 |
Class 2C, 3.8175% 6/10/42 (f) | | 1,435,000 | | 1,434,522 |
Residential Asset Mortgage Products, Inc. sequential pay: | | | | |
Series 2003-SL1 Class A31, 7.125% 4/25/31 | | 299,187 | | 304,589 |
Series 2004-SL2 Class A1, 6.5% 10/25/16 | | 128,532 | | 130,577 |
Residential Finance LP/Residential Finance Development Corp. floater Series 2003-A: | | | | |
Class B4, 5.15% 3/10/35 (b)(f) | | 96,351 | | 97,797 |
Class B5, 5.7% 3/10/35 (b)(f) | | 96,351 | | 98,499 |
Residential Funding Securities Corp.: | | | | |
Series 2003-RP1 Class A1, 3.96% 11/25/34 (f) | | 119,195 | | 119,685 |
Series 2003-RP2 Class A1, 3.93% 6/25/33 (b)(f) | | 202,975 | | 203,758 |
Sequoia Mortgage Funding Trust Series 2003-A
Class AX1, 0.8% 10/21/08 (b)(h) | | 8,611,532 | | 65,052 |
Sequoia Mortgage Trust floater: | | | | |
Series 2003-5 Class A2, 3.41% 9/20/33 (f) | | 549,955 | | 549,812 |
Series 2003-7 Class A2, 2.885% 1/20/34 (f) | | 275,380 | | 275,140 |
Series 2004-1 Class A, 4.15% 2/20/34 (f) | | 434,689 | | 434,294 |
Series 2004-10 Class A4, 3.6681% 11/20/34 (f) | | 1,267,083 | | 1,265,057 |
Series 2004-12 Class 1A2, 3.93% 1/20/35 (f) | | 1,997,935 | | 2,003,410 |
Series 2004-4 Class A, 3.5881% 5/20/34 (f) | | 1,532,956 | | 1,529,426 |
Series 2004-5 Class A3, 3.77% 6/20/34 (f) | | 508,802 | | 508,405 |
Series 2004-6: | | | | |
Class A3A, 4.1475% 6/20/35 (f) | | 681,844 | | 681,395 |
Class A3B, 3.16% 7/20/34 (f) | | 1,363,688 | | 1,362,600 |
Series 2004-7: | | | | |
Class A3A, 3.2275% 8/20/34 (f) | | 724,191 | | 723,603 |
Class A3B, 3.4525% 7/20/34 (f) | | 1,406,196 | | 1,411,214 |
Series 2004-8 Class A2, 3.45% 9/20/34 (f) | | 2,235,112 | | 2,233,959 |
Series 2005-1 Class A2, 3.68% 2/20/35 (f) | | 962,779 | | 962,658 |
Collateralized Mortgage Obligations - continued |
| Principal
Amount | | Value
(Note 1) |
Private Sponsor - continued |
Sequoia Mortgage Trust floater: - continued | | | | |
Series 2005-2 Class A2, 3.36% 3/20/35 (f) | | $ 1,946,098 | | $ 1,946,098 |
Structured Asset Securities Corp. floater
Series 2004-NP1 Class A, 3.86% 9/25/33 (b)(f) | | 230,722 | | 230,868 |
Thornburg Mortgage Securities Trust floater
Series 2004-3 Class A, 3.83% 9/25/34 (f) | | 2,808,663 | | 2,816,468 |
WAMU Mortgage pass thru certificates: | | | | |
sequential pay Series 2002-S6 Class A25, 6% 10/25/32 | | 171,075 | | 171,508 |
Series 2005 AR11 Class A1C1, 3.6675% 8/25/40 (f) | | 2,100,000 | | 2,100,000 |
Washington Mutual Mortgage Securities Corp. sequential pay Series 2003-MS9 Class 2A1, 7.5% 12/25/33 | | 78,782 | | 81,643 |
Wells Fargo Mortgage Backed Securities Trust: | | | | |
Series 2004-M Class A3, 4.7024% 8/25/34 (f) | | 2,575,000 | | 2,563,233 |
Series 2005-AR10 Class 2A2, 4.111% 6/25/35 (f) | | 5,290,736 | | 5,216,856 |
Series 2005-AR12 Class 2A1, 4.322% 7/25/35 (f) | | 4,674,576 | | 4,635,136 |
TOTAL PRIVATE SPONSOR | | 116,370,464 |
U.S. Government Agency - 3.8% |
Fannie Mae: | | | | |
floater Series 2002-89 Class F, 3.6144% 1/25/33 (f) | | 151,287 | | 151,520 |
planned amortization class Series 1993-207 Class G, 6.15% 4/25/23 | | 767,885 | | 777,471 |
Fannie Mae guaranteed REMIC pass thru certificates: | | | | |
floater: | | | | |
Series 2002-11 Class QF, 3.8144% 3/25/32 (f) | | 194,320 | | 195,777 |
Series 2002-36 Class FT, 3.8144% 6/25/32 (f) | | 191,121 | | 192,747 |
Series 2002-64 Class FE, 3.61% 10/18/32 (f) | | 102,105 | | 102,578 |
Series 2002-74 Class FV, 3.7644% 11/25/32 (f) | | 124,440 | | 125,345 |
Series 2003-11: | | | | |
Class DF, 3.7644% 2/25/33 (f) | | 105,782 | | 106,519 |
Class EF, 3.7644% 2/25/33 (f) | | 75,425 | | 75,729 |
planned amortization class: | | | | |
Series 2001-62 Class PG, 6.5% 10/25/30 | | 58,759 | | 58,918 |
Series 2002-11 Class QB, 5.5% 3/25/15 | | 558,895 | | 562,833 |
Series 2002-28 Class PJ, 6.5% 3/25/31 | | 822,731 | | 823,900 |
Series 2002-52 Class PA, 6% 4/25/31 | | 22,759 | | 22,846 |
Series 2002-8 Class PD, 6.5% 7/25/30 | | 249,689 | | 250,738 |
Series 2003-32 Class PB, 3% 6/25/16 | | 675,385 | | 671,742 |
Series 2002-50 Class LE, 7% 12/25/29 | | 123,070 | | 124,803 |
Collateralized Mortgage Obligations - continued |
| Principal
Amount | | Value
(Note 1) |
U.S. Government Agency - continued |
Fannie Mae guaranteed REMIC pass thru certificates: - continued | | | | |
Series 2004-31 Class IA, 4.5% 6/25/10 (h) | | $ 542,525 | | $ 19,472 |
Series 2005-15 Class AZ, 5% 3/25/35 | | 1,387,431 | | 1,383,638 |
Series 2005-28 Class AZ, 5% 4/25/35 | | 960,396 | | 958,297 |
Freddie Mac planned amortization class: | | | | |
Series 2091 Class PP, 6% 2/15/27 | | 98,417 | | 98,370 |
Series 2162 Class PH, 6% 6/15/29 | | 1,775,787 | | 1,831,867 |
Freddie Mac Multi-class participation certificates Series 3007 Class ZN 4.5% 7/15/25 | | 1,362,420 | | 1,345,405 |
Freddie Mac Multi-class participation certificates guaranteed: | | | | |
floater: | | | | |
Series 2526 Class FC, 3.7881% 11/15/32 (f) | | 35,449 | | 35,631 |
Series 2538 Class FB, 3.7881% 12/15/32 (f) | | 220,147 | | 221,593 |
Series 2551 Class FH, 3.8381% 1/15/33 (f) | | 102,120 | | 102,552 |
planned amortization class: | | | | |
Series 2316 Class PB, 6.5% 9/15/30 | | 301,240 | | 302,017 |
Series 2394 Class ND, 6% 6/15/27 | | 114,698 | | 114,938 |
Series 2395 Class PE, 6% 2/15/30 | | 668,869 | | 673,235 |
Series 2398 Class DK, 6.5% 1/15/31 | | 93,190 | | 93,337 |
Series 2410 Class ML, 6.5% 12/15/30 | | 243,261 | | 244,443 |
Series 2420 Class BE, 6.5% 12/15/30 | | 186,022 | | 186,612 |
Series 2443 Class TD, 6.5% 10/15/30 | | 214,887 | | 215,999 |
Series 2461 Class PG, 6.5% 1/15/31 | | 191,266 | | 193,824 |
Series 2466 Class EC, 6% 10/15/27 | | 18,741 | | 18,717 |
Series 2483 Class DC, 5.5% 7/15/14 | | 133,003 | | 132,994 |
Series 2496 Class OC, 5.5% 9/15/14 | | 979,615 | | 983,554 |
Series 2543 CLass PM, 5.5% 8/15/18 | | 991,487 | | 1,000,708 |
Series 2614 Class IC, 4.5% 12/15/10 (h) | | 2,059,705 | | 71,014 |
Series 2676: | | | | |
Class KN, 3% 12/15/13 | | 1,935,811 | | 1,912,170 |
Class QA, 3% 8/15/16 | | 1,550,000 | | 1,536,448 |
Series 2683 Class UH, 3% 3/15/19 | | 3,549,254 | | 3,512,799 |
Series 2748 Class IB, 4.5% 3/15/10 (h) | | 1,265,317 | | 43,404 |
Series 2776 Class UJ, 4.5% 5/15/20 (h) | | 584,891 | | 30,246 |
Series 2828 Class JA, 4.5% 1/15/10 | | 1,615,000 | | 1,618,133 |
sequential pay: | | | | |
Series 2430 Class ZE, 6.5% 8/15/27 | | 73,596 | | 73,632 |
Series 2480 Class QW, 5.75% 2/15/30 | | 61,212 | | 61,175 |
Series 1803 Class A, 6% 12/15/08 | | 260,767 | | 265,919 |
Collateralized Mortgage Obligations - continued |
| Principal
Amount | | Value
(Note 1) |
U.S. Government Agency - continued |
Freddie Mac Multi-class participation certificates guaranteed: - continued | | | | |
Series 2406: | | | | |
Class FP, 4.3681% 1/15/32 (f) | | $ 1,435,000 | | $ 1,467,531 |
Class PF, 4.3681% 12/15/31 (f) | | 1,135,000 | | 1,164,748 |
Series 2410 Class PF, 4.3681% 2/15/32 (f) | | 2,600,000 | | 2,659,366 |
Series 2907 Class HZ, 5% 12/15/34 | | 1,090,633 | | 1,081,224 |
Series 2949 Clas ZW, 5% 3/15/35 | | 1,572,974 | | 1,574,860 |
Series 2978 Class EZ, 5.5% 11/15/34 | | 391,223 | | 388,137 |
3% 3/15/10 | | 1,804,134 | | 1,787,536 |
Ginnie Mae guaranteed REMIC pass thru securities: | | | | |
floater Series 2001-21 Class FB, 3.7881% 1/16/27 (f) | | 141,329 | | 142,154 |
planned amortization class Series 2002-5 Class PD, 6.5% 5/16/31 | | 388,532 | | 395,792 |
TOTAL U.S. GOVERNMENT AGENCY | | 34,186,957 |
TOTAL COLLATERALIZED MORTGAGE OBLIGATIONS (Cost $150,820,225) | 150,557,421 |
Commercial Mortgage Securities - 4.0% |
|
1301 Avenue of The Americas Trust Series 2000-1301: | | | | |
Class C, 7.44% 8/3/10 (b)(f) | | 565,000 | | 564,987 |
Class D, 7.54% 8/3/10 (b)(f) | | 750,000 | | 749,983 |
Banc of America Large Loan, Inc.: | | | | |
floater: | | | | |
Series 2003-BBA2: | | | | |
Class A3, 3.7081% 11/15/15 (b)(f) | | 340,000 | | 340,214 |
Class C, 3.8581% 11/15/15 (b)(f) | | 70,000 | | 70,256 |
Class D, 3.9381% 11/15/15 (b)(f) | | 110,000 | | 110,627 |
Class F, 4.2881% 11/15/15 (b)(f) | | 80,000 | | 80,562 |
Class H, 4.7881% 11/15/15 (b)(f) | | 70,000 | | 70,416 |
Class J, 5.3381% 11/15/15 (b)(f) | | 70,000 | | 70,420 |
Class K, 5.82% 11/15/15 (b)(f) | | 65,000 | | 64,589 |
Series 2005-BOCA: | | | | |
Class H, 4.3381% 12/15/16 (b)(f) | | 290,000 | | 289,555 |
Class J, 4.4881% 12/15/16 (b)(f) | | 140,000 | | 139,786 |
Class K, 4.7381% 12/15/16 (b)(f) | | 250,000 | | 249,685 |
Series 2005-BOCA Class X1, 1.0882% 12/15/16 (b)(f)(h) | | 109,061,667 | | 1,085,818 |
Commercial Mortgage Securities - continued |
| Principal
Amount | | Value
(Note 1) |
Bayview Commercial Asset Trust floater: | | | | |
Series 2003-1 Class A, 4.04% 8/25/33 (b)(f) | | $ 332,377 | | $ 336,326 |
Series 2003-2 Class A, 4.04% 12/25/33 (b)(f) | | 869,217 | | 879,842 |
Series 2004-1: | | | | |
Class A, 3.82% 4/25/34 (b)(f) | | 498,972 | | 499,849 |
Class B, 5.36% 4/25/34 (b)(f) | | 83,162 | | 84,114 |
Series 2004-2: | | | | |
Class A, 3.89% 8/25/34 (b)(f) | | 572,710 | | 575,529 |
Class M1, 4.04% 8/25/34 (b)(f) | | 183,446 | | 184,163 |
Series 2004-3: | | | | |
Class A1, 3.83% 1/25/35 (b)(f) | | 810,885 | | 813,723 |
Class A2, 3.88% 1/25/35 (b)(f) | | 95,398 | | 95,734 |
Class M1, 3.96% 1/25/35 (b)(f) | | 143,097 | | 143,291 |
Class M2, 4.46% 1/25/35 (b)(f) | | 95,398 | | 95,966 |
Series 2005-2A: | | | | |
Class M1, 3.73% 8/25/35 (b)(f) | | 184,689 | | 184,689 |
Class M2, 3.78% 8/25/35 (b)(f) | | 309,478 | | 309,478 |
Class M3, 3.8% 8/25/35 (b)(f) | | 169,714 | | 169,714 |
Class M4, 3.91% 8/25/35 (b)(f) | | 154,739 | | 154,739 |
Bear Stearns Commercial Mortgage Securities, Inc. floater Series 2004-BBA3 Class E, 4.0881% 6/15/17 (b)(f) | | 960,000 | | 960,087 |
COMM floater: | | | | |
Series 2002-FL7: | | | | |
Class C, 3.8881% 11/15/14 (b)(f) | | 351,633 | | 351,753 |
Class F, 4.6881% 11/15/14 (b)(f) | | 1,000,000 | | 1,001,383 |
Class H, 5.6381% 11/15/14 (b)(f) | | 150,000 | | 150,077 |
Series 2003-FL9 Class B, 3.8881% 11/15/15 (b)(f) | | 705,064 | | 707,001 |
Commercial Mortgage pass thru certificates floater: | | | | |
Series 2004-CNL: | | | | |
Class A2, 3.6881% 9/15/14 (b)(f) | | 635,000 | | 635,612 |
Class G, 4.3681% 9/15/14 (b)(f) | | 150,000 | | 150,060 |
Class H, 4.4681% 9/15/14 (b)(f) | | 160,000 | | 160,064 |
Class J, 4.9881% 9/15/14 (b)(f) | | 55,000 | | 55,175 |
Class K, 5.3881% 9/15/14 (b)(f) | | 85,000 | | 85,175 |
Class L, 5.5881% 9/15/14 (b)(f) | | 70,000 | | 69,966 |
Series 2004-HTL1: | | | | |
Class B, 3.8381% 7/15/16 (b)(f) | | 46,895 | | 46,928 |
Class D, 3.9381% 7/15/16 (b)(f) | | 102,330 | | 102,344 |
Class E, 4.1381% 7/15/16 (b)(f) | | 72,473 | | 72,500 |
Class F, 4.1881% 7/15/16 (b)(f) | | 76,740 | | 76,789 |
Class H, 4.6881% 7/15/16 (b)(f) | | 225,918 | | 225,994 |
Class J, 4.8381% 7/15/16 (b)(f) | | 85,230 | | 85,259 |
Commercial Mortgage Securities - continued |
| Principal
Amount | | Value
(Note 1) |
Commercial Mortgage pass thru certificates floater: - continued | | | | |
Series 2004-HTL1: | | | | |
Class K, 5.7381% 7/15/16 (b)(f) | | $ 1,470,333 | | $ 1,469,696 |
Commercial Mortgage Pass-Through Certificates floater Series 2005-F10A: | | | | |
Class B, 3.6181% 4/15/17 (b)(f) | | 1,005,000 | | 1,005,000 |
Class C, 3.6581% 4/15/17 (b)(f) | | 425,000 | | 425,000 |
Class D, 3.6981% 4/15/17 (b)(f) | | 345,000 | | 345,000 |
Class E, 3.7581% 4/15/17 (b)(f) | | 260,000 | | 260,000 |
Class F, 3.7981% 4/15/17 (b)(f) | | 145,000 | | 145,000 |
Class G, 3.9381% 4/15/17 (b)(f) | | 145,000 | | 145,000 |
Class H, 4.0081% 4/15/17 (b)(f) | | 145,000 | | 145,000 |
Class I, 4.2381% 4/15/17 (b)(f) | | 50,000 | | 50,000 |
Class MOA3, 3.6881% 3/15/20 (b)(f) | | 650,000 | | 650,000 |
CS First Boston Mortgage Securities Corp.: | | | | |
floater: | | | | |
Series 2002-TFLA Class C, 3.9688% 11/18/12 (b)(f) | | 255,000 | | 254,995 |
Series 2003-TF2A Class A2, 3.7081% 11/15/14 (b)(f) | | 700,000 | | 700,523 |
Series 2004-FL1 Class B, 3.8381% 5/15/14 (b)(f) | | 1,000,000 | | 1,000,496 |
Series 2004-HC1: | | | | |
Class A2, 3.8881% 12/15/21 (b)(f) | | 175,000 | | 175,000 |
Class B, 4.1381% 12/15/21 (b)(f) | | 455,000 | | 454,999 |
Series 2004-TF2A Class E, 3.8081% 11/15/19 (b)(f) | | 640,000 | | 640,990 |
Series 2004-TFL1: | | | | |
Class A2, 3.5781% 2/15/14 (b)(f) | | 505,000 | | 505,150 |
Class E, 3.9381% 2/15/14 (b)(f) | | 200,000 | | 200,431 |
Class F, 3.9881% 2/15/14 (b)(f) | | 175,000 | | 175,406 |
Class G, 4.2381% 2/15/14 (b)(f) | | 125,000 | | 125,374 |
Class H, 4.4881% 2/15/14 (b)(f) | | 100,000 | | 100,267 |
Class J, 4.7881% 2/15/14 (b)(f) | | 50,000 | | 50,248 |
Series 2005-TF2A Class F, 3.8881% 11/15/19 (b)(f) | | 230,000 | | 230,356 |
Series 2005-TFLA: | | | | |
Class C, 3.6281% 2/15/20 (b)(f) | | 800,000 | | 799,998 |
Class E, 3.7181% 2/15/20 (b)(f) | | 560,000 | | 559,999 |
Class F, 3.7681% 2/15/20 (b)(f) | | 250,000 | | 250,000 |
Class G, 3.9081% 2/15/20 (b)(f) | | 70,000 | | 70,000 |
Class H, 4.1381% 2/15/20 (b)(f) | | 100,000 | | 100,000 |
Series 2003-TFLA Class G, 3.7357% 4/15/13 (b)(f) | | 30,933 | | 30,838 |
Commercial Mortgage Securities - continued |
| Principal
Amount | | Value
(Note 1) |
GS Mortgage Securities Corp. II floater Series 2005-FL7A Class A1, 3.5% 11/6/19 (b)(f) | | $ 1,468,752 | | $ 1,468,909 |
John Hancock Tower Mortgage Trust floater Series 2003-C5A Class B, 5.6585% 4/10/15 (b)(f) | | 420,000 | | 415,178 |
JP Morgan Chase Commercial Mortgage Security Corp.: | | | | |
floater Series 2005-FL1A: | | | | |
Class WH, 3.97% 6/15/19 (b)(f) | | 490,000 | | 490,015 |
Class WJ, 4.17% 6/15/19 (b)(f) | | 305,000 | | 305,009 |
Class WK, 4.57% 6/15/19 (b)(f) | | 455,000 | | 455,014 |
Series 2005-FL1A Class WX1, 1.2068% 6/15/19 (b)(f)(h) | | 160,000,000 | | 1,731,200 |
Lehman Brothers Floating Rate Commercial Mortgage Trust floater: | | | | |
Series 2003-C4A Class H, 6.35% 7/11/15 (b)(f) | | 406,693 | | 407,710 |
Series 2003-LLFA: | | | | |
Class A2, 3.77% 12/16/14 (b)(f) | | 1,085,000 | | 1,085,718 |
Class C, 4.08% 12/16/14 (b)(f) | | 110,000 | | 110,338 |
Class K1, 5.93% 12/16/14 (b)(f) | | 435,000 | | 434,222 |
Merrill Lynch Mortgage Trust Series 2005-GGP1 Class X, 0.1416% 11/15/10 (b)(f)(h) | | 417,400,000 | | 593,626 |
Salomon Brothers Mortgage Securities VII, Inc.: | | | | |
floater: | | | | |
Series 2001-CDCA Class C, 4.1881% 2/15/13 (b)(f) | | 1,000,000 | | 980,616 |
Series 2003-CDCA: | | | | |
Class HEXB, 5.2881% 2/15/15 (b)(f) | | 30,000 | | 30,039 |
Class JEXB, 5.4881% 2/15/15 (b)(f) | | 50,000 | | 50,065 |
Class KEXB, 5.8881% 2/15/15 (b)(f) | | 40,000 | | 40,052 |
Series 2000-NL1 Class E, 7.0607% 10/15/30 (b)(f) | | 492,498 | | 494,421 |
SDG Macerich Properties LP floater Series 2000-1
Class A3, 3.7281% 5/15/09 (b)(f) | | 500,000 | | 500,225 |
STRIPS III Ltd./STRIPS III Corp. floater Series 2004-1A Class A, 3.78% 3/24/18 (b)(f) | | 523,978 | | 523,978 |
Wachovia Bank Commercial Mortgage Trust floater: | | | | |
Series 2004-WHL3: | | | | |
Class A2, 3.5681% 3/15/14 (b)(f) | | 255,000 | | 255,094 |
Class E, 3.8881% 3/15/14 (b)(f) | | 160,000 | | 160,201 |
Class F, 3.9381% 3/15/14 (b)(f) | | 130,000 | | 130,157 |
Class G, 4% 3/15/14 (b)(f) | | 65,000 | | 65,101 |
Series 2005-WL5A: | | | | |
Class KHP1, 3.7381% 1/15/18 (b)(f) | | 245,000 | | 245,000 |
Class KHP2, 3.9381% 1/15/18 (b)(f) | | 245,000 | | 245,000 |
Class KHP3, 4.2381% 1/15/18 (b)(f) | | 290,000 | | 290,000 |
Commercial Mortgage Securities - continued |
| Principal
Amount | | Value
(Note 1) |
Wachovia Bank Commercial Mortgage Trust floater: - continued | | | | |
Series 2005-WL5A: | | | | |
Class KHP4, 4.3381% 1/15/18 (b)(f) | | $ 225,000 | | $ 225,000 |
Class KHP5, 4.5381% 1/15/18 (b)(f) | | 260,000 | | 260,000 |
TOTAL COMMERCIAL MORTGAGE SECURITIES (Cost $36,212,804) | 36,406,876 |
Fixed-Income Funds - 31.6% |
| | Shares | | |
Fidelity Ultra-Short Central Fund (g)
(Cost $288,099,439) | | 2,897,815 | | 288,274,676 |
Cash Equivalents - 14.9% |
| | Maturity
Amount | | |
Investments in repurchase agreements (Collateralized by U.S. Government Obligations, in a joint trading account at 3.32%, dated 7/29/05 due 8/1/05) (i)
(Cost $136,501,000) | | $ 136,538,712 | | 136,501,000 |
TOTAL INVESTMENT PORTFOLIO - 101.2% (Cost $925,079,760) | | | 925,059,536 |
NET OTHER ASSETS - (1.2)% | | | (11,305,773) |
NET ASSETS - 100% | | $ 913,753,763 |
Futures Contracts |
| Expiration
Date | | Underlying
Face Amount
at Value | | Unrealized
Appreciation/
(Depreciation) |
Purchased |
Eurodollar Contracts |
114 Eurodollar 90 Day Index Contracts | Sept. 2005 | | $ 112,867,125 | | $ (230,506) |
112 Eurodollar 90 Day Index Contracts | Dec. 2005 | | 110,805,800 | | (185,111) |
112 Eurodollar 90 Day Index Contracts | March 2006 | | 110,776,400 | | (234,448) |
TOTAL EURODOLLAR CONTRACTS | | | (650,065) |
Sold |
Eurodollar Contracts |
6 Eurodollar 90 Day Index Contracts | June 2006 | | 5,933,550 | | 3,274 |
7 Eurodollar 90 Day Index Contracts | Sept. 2006 | | 6,921,862 | | 3,483 |
6 Eurodollar 90 Day Index Contracts | Dec. 2006 | | 5,932,500 | | 4,251 |
7 Eurodollar 90 Day Index Contracts | March 2007 | | 6,921,162 | | 4,960 |
5 Eurodollar 90 Day Index Contracts | June 2007 | | 4,943,438 | | 2,643 |
4 Eurodollar 90 Day Index Contracts | Sept. 2007 | | 3,954,550 | | 1,984 |
3 Eurodollar 90 Day Index Contracts | Dec. 2007 | | 2,965,650 | | 1,288 |
3 Eurodollar 90 Day Index Contracts | March 2008 | | 2,965,575 | | 1,213 |
2 Eurodollar 90 Day Index Contracts | June 2008 | | 1,976,950 | | 1,692 |
1 Eurodollar 90 Day Index Contracts | Sept. 2008 | | 988,413 | | 1,182 |
TOTAL EURODOLLAR CONTRACTS | | | 25,970 |
| | | | $ (624,095) |
Swap Agreements |
| | | Notional
Amount | | Value |
Credit Default Swap |
Receive from Citibank, upon default event of DaimlerChrysler NA Holding Corp., par value of the notional amount of DaimlerChrysler NA Holding Corp. 6.5% 11/15/13, and pay quarterly notional amount multiplied by .8% | June 2007 | | $ 1,000,000 | | $ (9,712) |
Receive quarterly a fixed rate of .5% multiplied by the notional amount and pay to Deutsche Bank, upon each default event of one of the issues of Dow Jones CDX N.A. Investment Grade 3, par value of the proportional notional amount (e) | March 2010 | | 2,000,000 | | 1,521 |
Swap Agreements - continued |
| Expiration
Date | | Notional
Amount | | Value |
Credit Default Swap - continued |
Receive quarterly a fixed rate of .5% multiplied by the notional amount and pay to Lehman Brothers, Inc., upon each default event of one of the issues of Dow Jones CDX N.A. Investment Grade 3, par value of the proportional notional amount (e) | March 2010 | | $ 2,000,000 | | $ 1,521 |
Receive quarterly notional amount multiplied by .39% and pay JPMorgan Chase, Inc. upon default event of Fannie Mae, par value of the notional amount of Fannie Mae 4.625% 5/1/13 | June 2010 | | 2,600,000 | | 12,917 |
Receive quarterly notional amount multiplied by .75% and pay Lehman Brothers, Inc. upon default event of AOL Time Warner, Inc., par value of the notional amount of AOL Time Warner, Inc. 6.875% 5/1/12 | Sept. 2009 | | 2,000,000 | | 35,867 |
TOTAL CREDIT DEFAULT SWAP | 9,600,000 | | 42,114 |
Total Return Swap |
Receive monthly notional amount multiplied by the nominal spread appreciation of the Lehman Brothers CMBS U.S. Aggregate Index adjusted by a modified duration factor plus 10 basis points and pay monthly notional amount multiplied by the nominal spread depreciation of the Lehman Brothers CMBS U.S. Aggregate Index adjusted by a modified duration factor with Lehman Brothers, Inc. | Oct. 2005 | | 6,800,000 | | 6,537 |
Receive monthly notional amount multiplied by the nominal spread appreciation of the Lehman Brothers CMBS U.S. Aggregate Index adjusted by a modified duration factor plus 25 basis points and pay monthly notional amount multiplied by the nominal spread depreciation of the Lehman Brothers CMBS U.S. Aggregate Index adjusted by a modified duration factor with Lehman Brothers, Inc. | Dec. 2005 | | 4,000,000 | | 4,335 |
Swap Agreements - continued |
| Expiration
Date | | Notional
Amount | | Value |
Total Return Swap - continued |
Receive monthly notional amount multiplied by the nominal spread appreciation of the Lehman Brothers CMBS U.S. Aggregate Index adjusted by a modified duration factor plus 30 basis points and pay monthly notional amount multiplied by the nominal spread depreciation of the Lehman Brothers CMBS U.S. Aggregate Index adjusted by a modified duration factor with Lehman Brothers, Inc. | August 2005 | | $ 4,900,000 | | $ 4,739 |
Receive monthly notional amount multiplied by the nominal spread appreciation of the Lehman Brothers CMBS U.S. Aggregate Index adjusted by a modified duration factor plus 22 basis points and pay monthly notional amount multiplied by the nominal spread depreciation of the Lehman Brothers CMBS U.S. Aggregate Index adjusted by a modified duration factor with Lehman Brothers, Inc. | Jan. 2006 | | 4,900,000 | | 4,499 |
TOTAL TOTAL RETURN SWAP | 20,600,000 | | 20,110 |
| | $ 30,200,000 | | $ 62,224 |
Legend |
(a) Debt obligation initially issued at one coupon which converts to a higher coupon at a specified date. The rate shown is the rate at period end. |
(b) Security exempt from registration under Rule 144A of the Securities Act of 1933. These securities may be resold in transactions exempt from registration, normally to qualified institutional buyers. At the period end, the value of these securities amounted to $59,223,012 or 6.5% of net assets. |
(c) Security or a portion of the security purchased on a delayed delivery or when-issued basis. |
(d) Security or a portion of the security was pledged to cover margin requirements for futures contracts. At the period end, the value of securities pledged amounted to $1,480,848. |
(e) Dow Jones CDX N.A. Investment Grade 3 is a tradable index of credit default swaps on investment grade debt of U.S. companies. |
(f) The coupon rate shown on floating or adjustable rate securities represents the rate at period end. |
(g) Affiliated fund that is available only to investment companies and other accounts managed by Fidelity Investments. A complete listing of the fixed-income central fund's holdings is provided at the end of this report. |
(h) Security represents right to receive monthly interest payments on an underlying pool of mortgages. Principal shown is the par amount of the mortgage pool. |
(i) Additional information on each counterparty to the repurchase agreement is as follows: |
Repurchase Agreement/
Counterparty | Value |
$136,501,000 due 8/1/05 at 3.32% | |
Banc of America Securities LLC. | $ 27,344,467 |
Bank of America, National Association | 14,204,918 |
Barclays Capital Inc. | 56,819,671 |
Countrywide Securities Corporation | 14,204,918 |
Morgan Stanley & Co. Incorporated. | 20,375,797 |
UBS Securities LLC | 3,551,229 |
| $ 136,501,000 |
See accompanying notes which are an integral part of the financial statements.
Annual Report
Financial Statements
Statement of Assets and Liabilities
| July 31, 2005 |
| | |
Assets | | |
Investment in securities, at value (including repurchase agreements of $136,501,000) (cost $925,079,760) - - See accompanying schedule | | $ 925,059,536 |
Cash | | 1,426,263 |
Receivable for investments sold | | 1,430,603 |
Receivable for swap agreements | | 5,737 |
Receivable for fund shares sold | | 1,664,626 |
Interest receivable | | 3,070,262 |
Swap agreements, at value | | 62,224 |
Total assets | | 932,719,251 |
| | |
Liabilities | | |
Payable for investments purchased
Regular delivery | $ 13,821,450 | |
Delayed delivery | 3,724,762 | |
Payable for fund shares redeemed | 750,791 | |
Distributions payable | 247,559 | |
Accrued management fee | 247,210 | |
Distribution fees payable | 846 | |
Payable for daily variation on futures contracts | 28,013 | |
Other affiliated payables | 116,447 | |
Other payables and accrued expenses | 28,410 | |
Total liabilities | | 18,965,488 |
| | |
Net Assets | | $ 913,753,763 |
Net Assets consist of: | | |
Paid in capital | | $ 914,861,233 |
Undistributed net investment income | | 26,805 |
Accumulated undistributed net realized gain (loss) on investments | | (557,541) |
Net unrealized appreciation (depreciation) on investments | | (576,734) |
Net Assets | | $ 913,753,763 |
See accompanying notes which are an integral part of the financial statements.
Annual Report
Financial Statements - continued
Statement of Assets and Liabilities - continued
| July 31, 2005 |
| | |
Calculation of Maximum Offering Price
Class A:
Net Asset Value and redemption price per share
($2,556,584 ÷ 254,820 shares) | | $ 10.03 |
| | |
Maximum offering price per share (100/98.50 of $10.03) | | $ 10.18 |
Class T:
Net Asset Value and redemption price per share ($4,044,195 ÷ 403,077 shares) | | $ 10.03 |
| | |
Maximum offering price per share (100/98.50 of $10.03) | | $ 10.18 |
| | |
Ultra-Short Bond:
Net Asset Value, offering price and redemption price per share ($906,644,323 ÷ 90,395,684 shares) | | $ 10.03 |
| | |
Institutional Class:
Net Asset Value, offering price and redemption price per share ($508,661 ÷ 50,716 shares) | | $ 10.03 |
See accompanying notes which are an integral part of the financial statements.
Annual Report
Statement of Operations
| Year ended July 31, 2005 |
| | |
Investment Income | | |
Interest | | $ 22,542,691 |
| | |
Expenses | | |
Management fee | $ 3,107,816 | |
Transfer agent fees | 1,002,533 | |
Distribution fees | 5,884 | |
Accounting fees and expenses | 203,379 | |
Fund wide operations fee | 39,626 | |
Independent trustees' compensation | 3,744 | |
Custodian fees and expenses | 9,001 | |
Registration fees | 82,647 | |
Audit | 33,864 | |
Legal | 6,364 | |
Miscellaneous | 4,598 | |
Total expenses before reductions | 4,499,456 | |
Expense reductions | (434,744) | 4,064,712 |
Net investment income | | 18,477,979 |
Realized and Unrealized Gain (Loss) Net realized gain (loss) on: | | |
Investment securities | (158,516) | |
Futures contracts | (402,042) | |
Swap agreements | 33,629 | |
Total net realized gain (loss) | | (526,929) |
Change in net unrealized appreciation (depreciation) on: Investment securities | (563,546) | |
Futures contracts | (393,848) | |
Swap agreements | 68,110 | |
Total change in net unrealized appreciation (depreciation) | | (889,284) |
Net gain (loss) | | (1,416,213) |
Net increase (decrease) in net assets resulting from operations | | $ 17,061,766 |
See accompanying notes which are an integral part of the financial statements.
Annual Report
Financial Statements - continued
Statement of Changes in Net Assets
| Year ended
July 31,
2005 | Year ended
July 31,
2004 |
Increase (Decrease) in Net Assets | | |
Operations | | |
Net investment income | $ 18,477,979 | $ 4,702,274 |
Net realized gain (loss) | (526,929) | 327,702 |
Change in net unrealized appreciation (depreciation) | (889,284) | 94,514 |
Net increase (decrease) in net assets resulting
from operations | 17,061,766 | 5,124,490 |
Distributions to shareholders from net investment income | (18,371,771) | (4,708,387) |
Distributions to shareholders from net realized gain | (213,972) | - |
Total distributions | (18,585,743) | (4,708,387) |
Share transactions - net increase (decrease) | 334,021,363 | 355,546,941 |
Redemption fees | 34,215 | 56,247 |
Total increase (decrease) in net assets | 332,531,601 | 356,019,291 |
| | |
Net Assets | | |
Beginning of period | 581,222,162 | 225,202,871 |
End of period (including undistributed net investment income of $26,805 and distributions in excess of net investment income of $122,365, respectively) | $ 913,753,763 | $ 581,222,162 |
See accompanying notes which are an integral part of the financial statements.
Annual Report
Financial Highlights - Class A
Years ended July 31, | 2005 | 2004 F |
Selected Per-Share Data | | |
Net asset value, beginning of period | $ 10.05 | $ 10.04 |
Income from Investment Operations | | |
Net investment income E | .223 | .013 |
Net realized and unrealized gain (loss) | (.026) | .011 |
Total from investment operations | .197 | .024 |
Distributions from net investment income | (.214) | (.014) |
Distributions from net realized gain | (.003) | - |
Total distributions | (.217) | (.014) |
Redemption fees added to paid in capital E, H | - | - |
Net asset value, end of period | $ 10.03 | $ 10.05 |
Total Return B, C, D | 1.98% | .24% |
Ratios to Average Net Assets G | | |
Expenses before expense reductions | .78% | .85% A |
Expenses net of voluntary waivers, if any | .70% | .70% A |
Expenses net of all reductions | .70% | .70% A |
Net investment income | 2.23% | 1.11% A |
Supplemental Data | | |
Net assets, end of period (000 omitted) | $ 2,557 | $ 316 |
Portfolio turnover rate | 33% | 53% |
A Annualized
B Total returns for periods of less than one year are not annualized.
C Total returns would have been lower had certain expenses not been reduced during the periods shown.
D Total returns do not include the effect of the sales charges.
E Calculated based on average shares outstanding during the period.
F For the period June 16, 2004 (commencement of sale of shares) to July 31, 2004.
G Expense ratios reflect operating expenses of the class. Expenses before reductions do not reflect amounts reimbursed by the investment adviser or reductions from brokerage service arrangements or other expense offset arrangements and do not represent the amount paid by the class during periods when reimbursements or reductions occur. Expense ratios before reductions for start-up periods may not be representative of longer-term operating periods. Expenses net of any voluntary waivers reflect expenses after reimbursement by the investment adviser but prior to reductions from brokerage service arrangements or other expense offset arrangements. Expenses net of all reductions represent the net expenses paid by the class.
H Amount represents less than $.001 per share.
See accompanying notes which are an integral part of the financial statements.
Annual Report
Financial Highlights - Class T
Years ended July 31, | 2005 | 2004 F |
Selected Per-Share Data | | |
Net asset value, beginning of period | $ 10.05 | $ 10.04 |
Income from Investment Operations | | |
Net investment income E | .222 | .013 |
Net realized and unrealized gain (loss) | (.025) | .010 |
Total from investment operations | .197 | .023 |
Distributions from net investment income | (.214) | (.013) |
Distributions from net realized gain | (.003) | - |
Total distributions | (.217) | (.013) |
Redemption fees added to paid in capital E, H | - | - |
Net asset value, end of period | $ 10.03 | $ 10.05 |
Total Return B, C, D | 1.98% | .23% |
Ratios to Average Net Assets G | | |
Expenses before expense reductions | .77% | .86% A |
Expenses net of voluntary waivers, if any | .70% | .70% A |
Expenses net of all reductions | .70% | .70% A |
Net investment income | 2.23% | 1.11% A |
Supplemental Data | | |
Net assets, end of period (000 omitted) | $ 4,044 | $ 356 |
Portfolio turnover rate | 33% | 53% |
A Annualized
B Total returns for periods of less than one year are not annualized.
C Total returns would have been lower had certain expenses not been reduced during the periods shown.
D Total returns do not include the effect of the sales charges.
E Calculated based on average shares outstanding during the period.
F For the period June 16, 2004 (commencement of sale of shares) to July 31, 2004.
G Expense ratios reflect operating expenses of the class. Expenses before reductions do not reflect amounts reimbursed by the investment adviser or reductions from brokerage service arrangements or other expense offset arrangements and do not represent the amount paid by the class during periods when reimbursements or reductions occur. Expense ratios before reductions for start-up periods may not be representative of longer-term operating periods. Expenses net of any voluntary waivers reflect expenses after reimbursement by the investment adviser but prior to reductions from brokerage service arrangements or other expense offset arrangements. Expenses net of all reductions represent the net expenses paid by the class.
H Amount represents less than $.001 per share.
See accompanying notes which are an integral part of the financial statements.
Annual Report
Financial Highlights - Ultra-Short Bond
Years ended July 31, | 2005 | 2004 | 2003 E |
Selected Per-Share Data | | | |
Net asset value, beginning of period | $ 10.05 | $ 10.02 | $ 10.00 |
Income from Investment Operations | | | |
Net investment income D | .241 | .122 | .137 |
Net realized and unrealized gain (loss) | (.026) | .029 | .052 |
Total from investment operations | .215 | .151 | .189 |
Distributions from net investment income | (.232) | (.122) | (.173) |
Distributions from net realized gain | (.003) | - | - |
Total distributions | (.235) | (.122) | (.173) |
Redemption fees added to paid in capital D | - G | .001 | .004 |
Net asset value, end of period | $ 10.03 | $ 10.05 | $ 10.02 |
Total Return B, C | 2.16% | 1.52% | 1.94% |
Ratios to Average Net Assets F | | | |
Expenses before expense reductions | .58% | .62% | .70% A |
Expenses net of voluntary waivers, if any | .53% | .55% | .55% A |
Expenses net of all reductions | .53% | .55% | .55% A |
Net investment income | 2.41% | 1.21% | 1.50% A |
Supplemental Data | | | |
Net assets, end of period (000 omitted) | $ 906,644 | $ 580,174 | $ 225,203 |
Portfolio turnover rate | 33% | 53% | 39% A |
A Annualized
B Total returns for periods of less than one year are not annualized.
C Total returns would have been lower had certain expenses not been reduced during the periods shown.
D Calculated based on average shares outstanding during the period.
E For the period August 29, 2002 (commencement of sale of shares) to July 31, 2003.
F Expense ratios reflect operating expenses of the class. Expenses before reductions do not reflect amounts reimbursed by the investment adviser or reductions from brokerage service arrangements or other expense offset arrangements and do not represent the amount paid by the class during periods when reimbursements or reductions occur. Expense ratios before reductions for start-up periods may not be representative of longer-term operating periods. Expenses net of any voluntary waivers reflect expenses after reimbursement by the investment adviser but prior to reductions from brokerage service arrangements or other expense offset arrangements. Expenses net of all reductions represent the net expenses paid by the class.
G Amount represents less than $.001 per share.
See accompanying notes which are an integral part of the financial statements.
Annual Report
Financial Highlights - Institutional Class
Years ended July 31, | 2005 | 2004 E |
Selected Per-Share Data | | |
Net asset value, beginning of period | $ 10.05 | $ 10.04 |
Income from Investment Operations | | |
Net investment income D | .240 | .015 |
Net realized and unrealized gain (loss) | (.026) | .010 |
Total from investment operations | .214 | .025 |
Distributions from net investment income | (.231) | (.015) |
Distributions from net realized gain | (.003) | - |
Total distributions | (.234) | (.015) |
Redemption fees added to paid in capital | - | - |
Net asset value, end of period D, G | $ 10.03 | $ 10.05 |
Total Return B, C | 2.15% | .25% |
Ratios to Average Net Assets F | | |
Expenses before expense reductions | .58% | .67% A |
Expenses net of voluntary waivers, if any | .55% | .55% A |
Expenses net of all reductions | .55% | .55% A |
Net investment income | 2.38% | 1.26% A |
Supplemental Data | | |
Net assets, end of period (000 omitted) | $ 509 | $ 376 |
Portfolio turnover rate | 33% | 53% |
A Annualized
B Total returns for periods of less than one year are not annualized.
C Total returns would have been lower had certain expenses not been reduced during the periods shown.
D Calculated based on average shares outstanding during the period.
E For the period June 16, 2004 (commencement of sale of shares) to July 31, 2004.
F Expense ratios reflect operating expenses of the class. Expenses before reductions do not reflect amounts reimbursed by the investment adviser or reductions from brokerage service arrangements or other expense offset arrangements and do not represent the amount paid by the class during periods when reimbursements or reductions occur. Expense ratios before reductions for start-up periods may not be representative of longer-term operating periods. Expenses net of any voluntary waivers reflect expenses after reimbursement by the investment adviser but prior to reductions from brokerage service arrangements or other expense offset arrangements. Expenses net of all reductions represent the net expenses paid by the class.
G Amount represents less than $.001 per share.
See accompanying notes which are an integral part of the financial statements.
Annual Report
Notes to Financial Statements
For the period ended July 31, 2005
1. Significant Accounting Policies.
Fidelity Ultra-Short Bond Fund (the fund) is a non-diversified fund of Fidelity Income Fund (the trust) and is authorized to issue an unlimited number of shares. The trust is registered under the Investment Company Act of 1940, as amended (the 1940 Act), as an open-end management investment company organized as a Massachusetts business trust.
The fund offers Class A, Class T, Ultra-Short Bond (the original class), and Institutional Class shares, each of which has equal rights as to assets and voting privileges. Each class has exclusive voting rights with respect to matters that affect that class. Investment income, realized and unrealized capital gains and losses, the common expenses of the fund, and certain fund-level expense reductions, if any, are allocated on a pro rata basis to each class based on the relative net assets of each class to the total net assets of the fund. Each class differs with respect to transfer agent and distribution and service plan fees incurred. Certain expense reductions also differ by class.
The fund may invest in affiliated money market central funds (Money Market Central Funds) and fixed-income Central Investment Portfolios (CIPs), collectively referred to as Central Funds, which are open-end investment companies available to investment companies and other accounts managed by Fidelity Management & Research Company (FMR) and its affiliates. The financial statements have been prepared in conformity with accounting principles generally accepted in the United States of America, which require management to make certain estimates and assumptions at the date of the financial statements. The following summarizes the significant accounting policies of the fund, which are also consistently followed by the Central Funds:
Security Valuation. Net asset value per share (NAV calculation) is calculated as of the close of business of the New York Stock Exchange, normally 4:00 p.m. Eastern time. Debt securities, including restricted securities, for which quotations are readily available are valued at their most recent bid prices (sales prices if the principal market is an exchange) in the principal market in which such securities are normally traded, as determined by recognized dealers in such securities, or securities are valued on the basis of information provided by a pricing service. Pricing services use valuation matrices that incorporate both dealer-supplied valuations and valuation models. If prices are not readily available or do not accurately reflect fair value for a security, or if a security's value has been materially affected by events occurring after the close of the exchange or market on which the security is principally traded, that security may be valued by another method that the Board of Trustees believes accurately reflects fair value. A security's valuation may differ depending on the method used for determining value. Price movements in futures contracts and ADRs, market and trading trends, the bid/ask quotes of brokers and off-exchange institutional trading may be reviewed in the course of making a good faith determination of a security's fair value. Short-term securities with remaining
Annual Report
Notes to Financial Statements - continued
1. Significant Accounting Policies - continued
Security Valuation - continued
maturities of sixty days or less for which quotations are not readily available are valued on the basis of amortized cost. Investments in open-end investment companies, including Central Funds, are valued at their net asset value each business day.
Investment Transactions and Income. Security transactions, including the fund's investment activity in the Central Funds, are accounted for as of trade date. Gains and losses on securities sold are determined on the basis of identified cost. Interest income, including distributions from the Central Funds, is accrued as earned. Interest income includes coupon interest and amortization of premium and accretion of discount on debt securities.
Expenses. Most expenses of the trust can be directly attributed to a fund. Expenses which cannot be directly attributed are apportioned among each fund in the trust.
Income Tax Information and Distributions to Shareholders. Each year, the fund intends to qualify as a regulated investment company by distributing all of its taxable income and realized gains under Subchapter M of the Internal Revenue Code. As a result, no provision for income taxes is required in the accompanying financial statements.
Dividends are declared daily and paid monthly from net investment income. Distributions from realized gains, if any, are recorded on the ex-dividend date. Income dividends and capital gain distributions are declared separately for each class. Income and capital gain distributions are determined in accordance with income tax regulations, which may differ from generally accepted accounting principles. In addition, the fund will claim a portion of the payment made to redeeming shareholders as a distribution for income tax purposes. Capital accounts within the financial statements are adjusted for permanent book-tax differences. These adjustments have no impact on net assets or the results of operations. Temporary book-tax differences will reverse in a subsequent period.
Book-tax differences are primarily due to futures transactions, swap agreements, market discount, financing transactions, losses deferred due to wash sales and excise tax regulations.
The tax-basis components of distributable earnings and the federal tax cost as of period end were as follows:
Unrealized appreciation | $ 1,412,507 | |
Unrealized depreciation | (1,060,010) | |
Net unrealized appreciation (depreciation) | 352,497 | |
Undistributed ordinary income | 65,597 | |
| | |
Cost for federal income tax purposes | $ 924,707,039 | |
Annual Report
1. Significant Accounting Policies - continued
Income Tax Information and Distributions to Shareholders - continued
The tax character of distributions paid was as follows:
| July 31, 2005 | July 31, 2004 |
Ordinary Income | $ 18,371,770 | $ 4,708,387 |
Long-term Capital Gains | 213,973 | - |
Total | $ 18,585,743 | $ 4,708,387 |
Short-Term Trading (Redemption) Fees. Shares held in the fund less than 60 days are subject to a redemption fee equal to .25% of the proceeds of the redeemed shares. All redemption fees, including any estimated redemption fees paid by FMR, are retained by the fund and accounted for as an addition to paid in capital.
2. Operating Policies.
Repurchase Agreements. FMR has received an Exemptive Order from the Securities and Exchange Commission (the SEC) which permits the fund and other affiliated entities of FMR to transfer uninvested cash balances into joint trading accounts which are then invested in repurchase agreements. The fund may also invest directly with institutions in repurchase agreements. Repurchase agreements are collateralized by government or non-government securities. Collateral is held in segregated accounts with custodian banks and may be obtained in the event of a default of the counterparty. The fund monitors, on a daily basis, the value of the collateral to ensure it is at least equal to the principal amount of the repurchase agreement (including accrued interest). In the event of a default by the counterparty, realization of the collateral proceeds could be delayed, during which time the value of the collateral may decline.
Delayed Delivery Transactions and When-Issued Securities. The fund may purchase or sell securities on a delayed delivery or when-issued basis. Payment and delivery may take place after the customary settlement period for that security. The price of the underlying securities and the date when the securities will be delivered and paid for are fixed at the time the transaction is negotiated. During the time a delayed delivery sell is outstanding, the contract is marked-to-market daily and equivalent deliverable securities are held for the transaction. The value of the securities purchased on a delayed delivery or when-issued basis are identified as such in the fund's Schedule of Investments. The fund may receive compensation for interest forgone in the purchase of a delayed delivery or when-issued security. With respect to purchase commitments, the fund identifies securities as segregated in its records with a value at least equal to the
Annual Report
Notes to Financial Statements - continued
2. Operating Policies - continued
Delayed Delivery Transactions and When-Issued Securities - continued
amount of the commitment. Losses may arise due to changes in the value of the underlying securities or if the counterparty does not perform under the contract's terms, or if the issuer does not issue the securities due to political, economic, or other factors.
Futures Contracts. The fund may use futures contracts to manage its exposure to the bond market and to fluctuations in interest rates. Buying futures tends to increase a fund's exposure to the underlying instrument, while selling futures tends to decrease a fund's exposure to the underlying instrument or hedge other fund investments. Futures contracts involve, to varying degrees, risk of loss in excess of any futures variation margin reflected in the Statement of Assets and Liabilities. The underlying face amount at value of any open futures contracts at period end is shown in the Schedule of Investments under the caption "Futures Contracts." This amount reflects each contract's exposure to the underlying instrument at period end. Losses may arise from changes in the value of the underlying instruments or if the counterparties do not perform under the contracts' terms. Gains (losses) are realized upon the expiration or closing of the futures contracts. Futures contracts are valued at the settlement price established each day by the board of trade or exchange on which they are traded.
Restricted Securities. The fund may invest in securities that are subject to legal or contractual restrictions on resale. These securities generally may be resold in transactions exempt from registration or to the public if the securities are registered. Disposal of these securities may involve time-consuming negotiations and expense, and prompt sale at an acceptable price may be difficult. Information regarding restricted securities is included at the end of the fund's Schedule of Investments.
Swap Agreements. The fund may invest in swaps for the purpose of managing its exposure to interest rate, credit or market risk.
Total return swaps are agreements to exchange the return generated by one instrument or index for the return generated by another instrument, for example, the agreement to pay interest in exchange for a market-linked return based on a notional amount. To the extent the total return of the index exceeds the offsetting interest obligation, a fund will receive a payment from the counterparty. To the extent it is less, a fund will make a payment to the counterparty. Periodic payments received or made by the fund are recorded in the accompanying Statement of Operations as realized gains or losses, respectively.
Credit default swaps involve the exchange of a fixed rate premium for protection against the loss in value of an underlying debt instrument in the event of a defined credit event (such as payment default or bankruptcy). Under the terms of the swap, one party acts as a "guarantor" receiving a periodic payment that is a fixed percentage applied to a notional principal amount. In return the party agrees to purchase the notional amount of the
Annual Report
2. Operating Policies - continued
Swap Agreements - continued
underlying instrument, at par, if a credit event occurs during the term of the swap. The fund may enter into credit default swaps in which either it or its counterparty act as guarantors. By acting as the guarantor of a swap, a fund assumes the market and credit risk of the underlying instrument including liquidity and loss of value. Periodic payments and premiums received or made by the fund are recorded in the accompanying Statement of Operations as realized gains or losses, respectively.
Swaps are marked-to-market daily based on dealer-supplied valuations and changes in value are recorded as unrealized appreciation (depreciation). Gains or losses are realized upon early termination of the swap agreement. Collateral, in the form of cash or securities, may be required to be held in segregated accounts with a fund's custodian in compliance with swap contracts. Risks may exceed amounts recognized on the Statement of Assets and Liabilities. These risks include changes in the returns of the underlying instruments, failure of the counterparties to perform under the contracts' terms and the possible lack of liquidity with respect to the swap agreements. Details of swap agreements open at period end are included in the fund's Schedule of Investments under the caption "Swap Agreements."
Mortgage Dollar Rolls. To earn additional income, the fund may employ trading strategies which involve the sale and simultaneous agreement to repurchase similar securities ("mortgage dollar rolls") or the purchase and simultaneous agreement to sell similar securities ("reverse mortgage dollar rolls"). The securities traded are mortgage securities and bear the same interest rate but may be collateralized by different pools of mortgages. During the period between the sale and repurchase in a mortgage dollar roll transaction, a fund will not be entitled to receive interest and principal payments on the securities sold but will invest the proceeds of the sale in other securities which may enhance the yield and total return. In addition, the difference between the sale price and the future purchase price is recorded as an adjustment to investment income. During the period between the purchase and subsequent sale in a reverse mortgage dollar roll transaction a fund is entitled to interest and principal payments on the securities purchased. The price differential between the purchase and sale is recorded as an adjustment to investment income. Losses may arise due to changes in the value of the securities or if the counterparty does not perform under the terms of the agreement. If the counterparty files for bankruptcy or becomes insolvent, a fund's right to repurchase or sell securities may be limited.
3. Purchases and Sales of Investments.
Purchases and sales of securities, other than short-term securities and U.S. government securities, aggregated $383,859,606 and $88,905,991, respectively.
Annual Report
Notes to Financial Statements - continued
4. Fees and Other Transactions with Affiliates.
Management Fee. FMR and its affiliates provide the fund with investment management related services for which the fund pays a monthly management fee. The management fee is the sum of an individual fund fee rate that is based on an annual rate of .30% of the fund's average net assets (effective June 1, 2005, the fund's management contract was amended, reducing the individual fund fee rate to .20% of average net assets) and a group fee rate that averaged .12% during the period. The group fee rate is based upon the average net assets of all the mutual funds advised by FMR. The group fee rate decreases as assets under management increase and increases as assets under management decrease. For the period, the total annual management fee rate was .40% of the fund's average net assets.
Distribution and Service Plan. In accordance with Rule 12b-1 of the 1940 Act, the fund has adopted separate Distribution and Service Plans for each class of shares. Certain classes pay Fidelity Distributors Corporation (FDC), an affiliate of FMR, separate Distribution and Service Fees, each of which is based on an annual percentage of each class' average net assets. In addition, FDC may pay financial intermediaries for selling shares of the fund and providing shareholder support services. For the period, the Distribution and Service Fee rates and the total amounts paid to and retained by FDC were as follows:
| Distribution
Fee | Service
Fee | Paid to
FDC | Retained
by FDC |
Class A | 0% | .15% | $ 2,731 | $ 145 |
Class T | 0% | .15% | 3,153 | 1,639 |
| | | $ 5,884 | $ 1,784 |
Sales Load. FDC receives a front-end sales charge of up to 1.50% for selling Class A and Class T shares, some of which is paid to financial intermediaries for selling shares of the fund. FDC receives the proceeds of contingent deferred sales charges levied on Class A and Class T redemptions. These charges depend on the holding period. The deferred sales charges are.25% for certain purchases of Class A and Class T shares.
For the period, sales charge amounts retained by FDC were as follows:
| Retained
by FDC |
Class A | $ 3,708 |
Class T | 2,035 |
| $ 5,743 |
Annual Report
4. Fees and Other Transactions with Affiliates - continued
Transfer Agent Fees. Fidelity Investments Institutional Operations Company, Inc. (FIIOC), an affiliate of FMR, is the transfer, dividend disbursing and shareholder servicing agent for each class of the fund, except for Ultra-Short Bond. Fidelity Service Company, Inc. (FSC), an affiliate of FMR, is the transfer agent for Ultra-Short Bond shares. FIIOC and FSC receive account fees and asset-based fees that vary according to the account size and type of account of the shareholders of the respective classes of the fund. FIIOC and FSC pay for typesetting, printing and mailing of shareholder reports, except proxy statements. Under an amended contract effective June 1, 2005, transfer agent fees for the Ultra-Short Bond class consist of an asset based fee and were reduced to a rate of .10% of average net assets. The account fees were eliminated. For the period the total transfer agent fees paid by each class to FIIOC or FSC, were as follows:
| Amount | % of
Average
Net Assets |
Class A | $ 3,425 | .19 |
Class T | 3,977 | .19 |
Fidelity Ultra-Short Bond | 993,980 | .13 |
Institutional Class | 1,151 | .11 |
| $ 1,002,533 | |
Accounting Fees. FSC maintains the fund's accounting records. The fee is based on the level of average net assets for the month. Effective June 1, 2005, FMR pays these fees.
Fundwide Operations Fee. Pursuant to a new Fundwide Operations and Expense Agreement (FWOE) effective on June 1, 2005, FMR has agreed to provide for fund level expenses (which do not include transfer agent, Rule 12b-1 fees, the compensation of the independent trustees or other extraordinary expenses) in return for a FWOE fee equal to .35% less the total amount of the management fee. The FWOE paid by the fund is reduced by an amount equal to the fees and expenses paid to the independent trustees. For the period, the FWOE fee was equivalent to .005% of average net assets.
Affiliated Central Funds. The fund may invest in Money Market Central Funds which seek preservation of capital and current income and are managed by Fidelity Investments Money Management, Inc. (FIMM) an affiliate of FMR.
The fund may also invest in CIPs managed by FIMM. The Ultra-Short Central Fund seeks to obtain a high level of current income consistent with preservation of capital by investing in U.S. dollar-denominated money market and investment grade debt securities and repurchase agreements.
Annual Report
Notes to Financial Statements - continued
4. Fees and Other Transactions with Affiliates - continued
Affiliated Central Funds - continued
The fund's Schedule of Investments lists the CIP as an investment of the fund but does not include the underlying holdings of the CIP. Based on its investment objectives, the CIP may invest or participate in various investment vehicles or strategies such as delayed delivery and when-issued securities, derivatives, financing transactions and restricted securities. These strategies are consistent with the investment objectives of the fund and may involve certain economic risks, including the risk that a counterparty to one or more of these transactions may be unable or unwilling to comply with the terms of the governing agreement. This may result in a decline in value of the CIP and the fund.
A complete list of holdings for the CIP is available at the end of this report. In addition, a copy of the CIP's financial statements is available on the EDGAR Database on the SEC's website www.sec.gov, or at the Commission's public reference room in Washington, DC.
The Central Funds do not pay a management fee. Income distributions earned by the fund are recorded as income in the accompanying financial statements and totaled $7,392,456 for the period.
5. Committed Line of Credit.
The fund participates with other funds managed by FMR in a $4.2 billion credit facility (the "line of credit") to be utilized for temporary or emergency purposes to fund shareholder redemptions or for other short-term liquidity purposes. The fund has agreed to pay commitment fees on its pro rata portion of the line of credit. During the period, there were no borrowings on this line of credit.
6. Expense Reductions.
FMR voluntarily agreed to reimburse each class to the extent annual operating expenses exceeded certain levels of average net assets as noted in the table below. Some expenses, for example interest expense, are excluded from this reimbursement.
The following classes were in reimbursement during the period:
| Expense
Limitations | Reimbursement
from adviser |
Class A | .70% | $ 1,540 |
Class T | .70% | 1,515 |
Ultra-Short Bond | .55%* | 425,319 |
Institutional Class | .55% | 295 |
| | $ 428,669 |
* Effective June 1, 2005 the expense limitation was eliminated for Ultra-Short Bond.
Annual Report
6. Expense Reductions - continued
In addition, through arrangements with the fund's custodian, credits realized as a result of uninvested cash balances were used to reduce the fund's expenses. During the period, these credits reduced the fund's custody expenses by $2,847.
| Transfer Agent
expense reduction | |
Ultra-Short Bond | $ 3,228 | |
7. Other.
The fund's organizational documents provide former and current trustees and officers with a limited indemnification against liabilities arising in connection with the performance of their duties to the fund. In the normal course of business, the fund may also enter into contracts that provide general indemnifications. The fund's maximum exposure under these arrangements is unknown as this would be dependent on future claims that may be made against the fund. The risk of material loss from such claims is considered remote.
8. Distributions to Shareholders.
Distributions to shareholders of each class were as follows:
| Years ended July 31, |
| 2005 | 2004 A |
From net investment income | | |
Class A | $ 41,869 | $ 200 |
Class T | 50,050 | 262 |
Ultra-Short Bond | 18,257,386 | 4,707,455 |
Institutional Class | 22,466 | 471 |
Total | $ 18,371,771 | $ 4,708,388 |
From net realized gain | | |
Class A | $ 407 | $ - |
Class T | 503 | - |
Ultra-Short Bond | 212,634 | - |
Institutional Class | 428 | - |
Total | $ 213,972 | - |
A Distributions for Class A, Class T, and Institutional Class are for the period June 16, 2004 (commencement of sale of shares) to July 31, 2004.
Annual Report
Notes to Financial Statements - continued
9. Share Transactions.
Transactions for each class of shares were as follows:
| Shares | Dollars |
| Years ended July 31, | Years ended July 31, |
| 2005 | 2004 A | 2005 | 2004 A |
Class A | | | | |
Shares sold | 314,954 | 31,506 | $ 3,163,548 | $ 316,495 |
Reinvestment of distributions | 3,804 | 19 | 38,189 | 195 |
Shares redeemed | (95,385) | (78) | (957,951) | (780) |
Net increase (decrease) | 223,373 | 31,447 | $ 2,243,786 | $ 315,910 |
Class T | | | | |
Shares sold | 597,602 | 35,358 | $ 6,002,298 | $ 355,050 |
Reinvestment of distributions | 4,137 | 26 | 41,523 | 262 |
Shares redeemed | (234,046) | - | (2,350,424) | - |
Net increase (decrease) | 367,693 | 35,384 | $ 3,693,397 | $ 355,312 |
Ultra-Short Bond | | | | |
Shares sold | 63,063,839 | 59,927,755 | $ 633,315,534 | $ 602,349,405 |
Reinvestment of distributions | 1,643,763 | 418,048 | 16,499,718 | 4,203,573 |
Shares redeemed | (32,055,308) | (25,071,625) | (321,868,107) | (252,053,274) |
Net increase (decrease) | 32,652,294 | 35,274,178 | $ 327,947,145 | $ 354,499,704 |
Institutional Class | | | | |
Shares sold | 296,985 | 37,405 | $ 2,986,442 | $ 375,544 |
Reinvestment of distributions | 2,113 | 47 | 21,221 | 471 |
Shares redeemed | (285,834) | - | (2,870,628) | - |
Net increase (decrease) | 13,264 | 37,452 | $ 137,035 | $ 376,015 |
A Share transactions for Class A, Class T, and Institutional Class are for the period June 16, 2004 (commencement of sale of shares) to July 31, 2004.
Annual Report
Report of Independent Registered Public Accounting Firm
To the Trustees of Fidelity Income Fund and the Shareholders of Fidelity Ultra-Short Bond Fund:
In our opinion, the accompanying statement of assets and liabilities, including the schedule of investments, and the related statements of operations and of changes in net assets and the financial highlights present fairly, in all material respects, the financial position of Fidelity Ultra-Short Bond Fund (a fund of Fidelity Income Fund) at July 31, 2005 and the results of their operations, the changes in their net assets and the financial highlights for the periods indicated, in conformity with accounting principles generally accepted in the United States of America. These financial statements and financial highlights (hereafter referred to as "financial statements") are the responsibility of the Fidelity Ultra-Short Bond Fund's management; our responsibility is to express an opinion on these financial statements based on our audits. We conducted our audits of these financial statements in accordance with the standards of the Public Company Accounting Oversight Board (United States). Those standards require that we plan and perform the audit to obtain reasonable assurance about whether the financial statements are free of material misstatement. An audit includes examining, on a test basis, evidence supporting the amounts and disclosures in the financial statements, assessing the accounting principles used and significant estimates made by management, and evaluating the overall financial statement presentation. We believe that our audits, which included confirmation of securities at July 31, 2005 by correspondence with the custodian and brokers, provide a reasonable basis for our opinion.
/s/ PricewaterhouseCoopers LLP
PricewaterhouseCoopers LLP
Boston, Massachusetts
September 13, 2005
Annual Report
Trustees and Officers
The Trustees, Members of the Advisory Board, and executive officers of the trust and fund, as applicable, are listed below. The Board of Trustees governs the fund and is responsible for protecting the interests of shareholders. The Trustees are experienced executives who meet periodically throughout the year to oversee the fund's activities, review contractual arrangements with companies that provide services to the fund, and review the fund's performance. Except for William O. McCoy, Stephen P. Jonas, and Kenneth L. Wolfe, each of the Trustees oversees 320 funds advised by FMR or an affiliate. Mr. McCoy oversees 322 funds advised by FMR or an affiliate. Mr. Jonas and Mr. Wolfe oversee 311 funds advised by FMR or an affiliate.
The Trustees hold office without limit in time except that (a) any Trustee may resign; (b) any Trustee may be removed by written instrument, signed by at least two-thirds of the number of Trustees prior to such removal; (c) any Trustee who requests to be retired or who has become incapacitated by illness or injury may be retired by written instrument signed by a majority of the other Trustees; and (d) any Trustee may be removed at any special meeting of shareholders by a two-thirds vote of the outstanding voting securities of the trust. Each Trustee who is not an interested person (as defined in the 1940 Act) (Independent Trustee), shall retire not later than the last day of the calendar year in which his or her 72nd birthday occurs. The Independent Trustees may waive this mandatory retirement age policy with respect to individual Trustees. The executive officers and Advisory Board Members hold office without limit in time, except that any officer and Advisory Board Member may resign or may be removed by a vote of a majority of the Trustees at any regular meeting or any special meeting of the Trustees. Except as indicated, each individual has held the office shown or other offices in the same company for the past five years.
The fund's Statement of Additional Information (SAI) includes more information about the Trustees. To request a free copy, call Fidelity at 1-800-544-8544.
Interested Trustees*:
Correspondence intended for each Trustee who is an interested person may be sent to Fidelity Investments, 82 Devonshire Street, Boston, Massachusetts 02109.
Name, Age; Principal Occupation |
Edward C. Johnson 3d (75)** |
| Year of Election or Appointment: 1984 Mr. Johnson is Chairman of the Board of Trustees. Mr. Johnson serves as Chief Executive Officer, Chairman, and a Director of FMR Corp.; a Director and Chairman of the Board and of the Executive Committee of FMR; Chairman and a Director of Fidelity Management & Research (Far East) Inc.; Chairman and a Director of Fidelity Investments Money Management, Inc.; and Chairman (2001-present) and a Director (2000-present) of FMR Co., Inc. |
Abigail P. Johnson (43)** |
| Year of Election or Appointment: 2001 Ms. Johnson serves as President of Fidelity Employer Services Company (FESCO) (2005-present). She is President and a Director of Fidelity Investments Money Management, Inc. (2001-present), FMR Co., Inc. (2001-present), and a Director of FMR Corp. Previously, Ms. Johnson served as President and a Director of FMR (2001-2005), Senior Vice President of the Fidelity funds (2001-2005), and managed a number of Fidelity funds. |
Stephen P. Jonas (52) |
| Year of Election or Appointment: 2005 Mr. Jonas is Senior Vice President of Ultra-Short Bond (2005-present). He also serves as Senior Vice President of other Fidelity funds (2005-present). Mr. Jonas is Executive Director of FMR (2005-present). Previously, Mr. Jonas served as President of Fidelity Enterprise Operations and Risk Services (2004-2005), Chief Administrative Officer (2002-2004), and Chief Financial Officer of FMR Co. (1998-2000). Mr. Jonas has been with Fidelity Investments since 1987 and has held various financial and management positions including Chief Financial Officer of FMR. In addition, he serves on the Boards of Boston Ballet (2003-present) and Simmons College (2003-present). |
Robert L. Reynolds (53) |
| Year of Election or Appointment: 2003 Mr. Reynolds is a Director (2003-present) and Chief Operating Officer (2002-present) of FMR Corp. He also serves on the Board at Fidelity Investments Canada, Ltd. (2000-present). Previously, Mr. Reynolds served as President of Fidelity Investments Institutional Retirement Group (1996-2000). |
* Trustees have been determined to be "Interested Trustees" by virtue of, among other things, their affiliation with the trust or various entities under common control with FMR.
** Edward C. Johnson 3d, Trustee, is Abigail P. Johnson's father.
Annual Report
Independent Trustees:
Correspondence intended for each Independent Trustee (that is, the Trustees other than the Interested Trustees) may be sent to Fidelity Investments, P.O. Box 55235, Boston, Massachusetts 02205-5235.
Name, Age; Principal Occupation |
Dennis J. Dirks (57) |
| Year of Election or Appointment: 2005 Prior to his retirement in May 2003, Mr. Dirks was Chief Operating Officer and a member of the Board of The Depository Trust & Clearing Corporation (DTCC) (1999-2003). He also served as President, Chief Operating Officer, and Board member of The Depository Trust Company (DTC) (1999-2003) and President and Board member of the National Securities Clearing Corporation (NSCC) (1999-2003). In addition, Mr. Dirks served as Chief Executive Officer and Board member of the Government Securities Clearing Corporation (2001-2003) and Chief Executive Officer and Board member of the Mortgage-Backed Securities Clearing Corporation (2001-2003). Mr. Dirks also serves as a Trustee of Manhattan College (2005-present). |
Robert M. Gates (61) |
| Year of Election or Appointment: 1997 Dr. Gates is Vice Chairman of the Independent Trustees (2005-present). Dr. Gates is President of Texas A&M University (2002-present). He was Director of the Central Intelligence Agency (CIA) from 1991 to 1993. From 1989 to 1991, Dr. Gates served as Assistant to the President of the United States and Deputy National Security Advisor. Dr. Gates is a Director of NACCO Industries, Inc. (mining and manufacturing), Parker Drilling Co., Inc. (drilling and rental tools for the energy industry, 2001-present), and Brinker International (restaurant management, 2003-present). Previously, Dr. Gates served as a Director of LucasVarity PLC (automotive components and diesel engines), a Director of TRW Inc. (automotive, space, defense, and information technology), and Dean of the George Bush School of Government and Public Service at Texas A&M University (1999-2001). Dr. Gates also is a Trustee of the Forum for International Policy. |
George H. Heilmeier (69) |
| Year of Election or Appointment: 2004 Dr. Heilmeier is Chairman Emeritus of Telcordia Technologies (communication software and systems), where prior to his retirement, he served as company Chairman and Chief Executive Officer. He currently serves on the Boards of Directors of The Mitre Corporation (systems engineering and information technology support for the government), and HRL Laboratories (private research and development, 2004-present). He is Chairman of the General Motors Science & Technology Advisory Board and a Life Fellow of the Institute of Electrical and Electronics Engineers (IEEE) (2000-present). Dr. Heilmeier is a member of the Defense Science Board and the National Security Agency Advisory Board. He is also a member of the National Academy of Engineering, the American Academy of Arts and Sciences, and the Board of Overseers of the School of Engineering and Applied Science of the University of Pennsylvania. Previously, Dr. Heilmeier served as a Director of TRW Inc. (automotive, space, defense, and information technology, 1992-2002), Compaq (1994-2002), Automatic Data Processing, Inc. (ADP) (technology-based business outsourcing, 1995-2002), INET Technologies Inc. (telecommunications network surveillance, 2001-2004), and Teletech Holdings (customer management services). He is the recipient of the 2005 Kyoto Prize in Advanced Technology for his invention of the liquid display. |
Marie L. Knowles (58) |
| Year of Election or Appointment: 2001 Prior to Ms. Knowles' retirement in June 2000, she served as Executive Vice President and Chief Financial Officer of Atlantic Richfield Company (ARCO) (diversified energy, 1996-2000). From 1993 to 1996, she was a Senior Vice President of ARCO and President of ARCO Transportation Company. She served as a Director of ARCO from 1996 to 1998. She currently serves as a Director of Phelps Dodge Corporation (copper mining and manufacturing) and McKesson Corporation (healthcare service, 2002-present). Ms. Knowles is a Trustee of the Brookings Institution and the Catalina Island Conservancy and also serves as a member of the Advisory Board for the School of Engineering of the University of Southern California. |
Ned C. Lautenbach (61) |
| Year of Election or Appointment: 2000 Mr. Lautenbach has been a partner of Clayton, Dubilier & Rice, Inc. (private equity investment firm) since September 1998. Previously, Mr. Lautenbach was with the International Business Machines Corporation (IBM) from 1968 until his retirement in 1998. Mr. Lautenbach serves as a Director of Italtel Holding S.p.A. (telecommunications (Milan, Italy), 2004-present) and Eaton Corporation (diversified industrial) as well as the Philharmonic Center for the Arts in Naples, Florida. He also is a member of the Board of Trustees of Fairfield University (2005-present), as well as a member of the Council on Foreign Relations. |
Marvin L. Mann (72) |
| Year of Election or Appointment: 1993 Mr. Mann is Chairman of the Independent Trustees (2001-present). He is Chairman Emeritus of Lexmark International, Inc. (computer peripherals), where he served as CEO until April 1998, retired as Chairman May 1999, and remains a member of the Board. Prior to 1991, he held the positions of Vice President of International Business Machines Corporation (IBM) and President and General Manager of various IBM divisions and subsidiaries. He is a member of the Executive Committee of the Independent Director's Council of the Investment Company Institute. In addition, Mr. Mann is a member of the President's Cabinet at the University of Alabama and the Board of Visitors of the Culverhouse College of Commerce and Business Administration at the University of Alabama. |
William O. McCoy (71) |
| Year of Election or Appointment: 1997 Prior to his retirement in December 1994, Mr. McCoy was Vice Chairman of the Board of BellSouth Corporation (telecommunications) and President of BellSouth Enterprises. He is currently a Director of Liberty Corporation (holding company), Duke Realty Corporation (real estate), and Progress Energy, Inc. (electric utility). He is also a partner of Franklin Street Partners (private investment management firm) and a member of the Research Triangle Foundation Board. In addition, Mr. McCoy served as the Interim Chancellor (1999-2000) and a member of the Board of Visitors for the University of North Carolina at Chapel Hill and currently serves on the Board of Directors of the University of North Carolina Health Care System and the Board of Visitors of the Kenan-Flagler Business School (University of North Carolina at Chapel Hill). He also served as Vice President of Finance for the University of North Carolina (16-school system). |
Cornelia M. Small (61) |
| Year of Election or Appointment: 2005 Ms. Small is a member (2000-present) and Chairperson (2002-present) of the Investment Committee, and a member (2002-present) of the Board of Trustees of Smith College. Previously, she served as Chief Investment Officer (1999-2000), Director of Global Equity Investments (1996-1999), and a member of the Board of Directors of Scudder, Stevens & Clark (1990-1997) and Scudder Kemper Investments (1997-1998). In addition, Ms. Small served as Co-Chair (2000-2003) of the Annual Fund for the Fletcher School of Law and Diplomacy. |
William S. Stavropoulos (66) |
| Year of Election or Appointment: 2001 Mr. Stavropoulos is Chairman of the Board (2000-present) and a Member of the Board of Directors of The Dow Chemical Company. Since joining The Dow Chemical Company in 1967, Mr. Stavropoulos served in numerous senior management positions, including President (1993-2000; 2002-2003), CEO (1995-2000; 2002-2004), and Chairman of the Executive Committee (2000-2004). Currently, he is a Director of NCR Corporation (data warehousing and technology solutions), BellSouth Corporation (telecommunications), Chemical Financial Corporation, Maersk Inc. (industrial conglomerate, 2002-present), and Metalmark Capital (private equity investment firm, 2005-present). He also serves as a member of the Board of Trustees of the American Enterprise Institute for Public Policy Research. In addition, Mr. Stavropoulos is a member of The Business Council, J.P. Morgan International Council and the University of Notre Dame Advisory Council for the College of Science. |
Kenneth L. Wolfe (66) |
| Year of Election or Appointment: 2005 Mr. Wolfe also serves as a Trustee (2005-present) or Member of the Advisory Board (2004-present) of other investment companies advised by FMR. Prior to his retirement in 2001, Mr. Wolfe was Chairman and Chief Executive Officer of Hershey Foods Corporation (1993-2001). He currently serves as a member of the boards of Adelphia Communications Corporation (2003-present), Bausch & Lomb, Inc., and Revlon Inc. (2004-present). |
Annual Report
Advisory Board Members and Executive Officers:
Correspondence intended for Mr. Gamper may be sent to Fidelity Investments, P.O. Box 55235, Boston, Massachusetts 02205-5235. Correspondence intended for each executive officer and Mr. Lynch may be sent to Fidelity Investments, 82 Devonshire Street, Boston, Massachusetts 02109.
Name, Age; Principal Occupation |
Albert R. Gamper, Jr. (63) |
| Year of Election or Appointment: 2005 Member of the Advisory Board of Fidelity Income Fund. Prior to his retirement in December 2004, Mr. Gamper served as Chairman of the Board of CIT Group Inc. (commercial finance). During his tenure with CIT Group Inc. Mr. Gamper served in numerous senior management positions, including Chairman (1987-1989; 1999-2001; 2002-2004), Chief Executive Officer (1987-2004), and President (1989-2002). He currently serves as a member of the Board of Directors of Public Service Enterprise Group (utilities, 2001-present), Chairman of the Board of Governors, Rutgers University (2004-present), and Chairman of the Board of Saint Barnabas Health Care System. |
Peter S. Lynch (61) |
| Year of Election or Appointment: 2003 Member of the Advisory Board of Fidelity Income Fund. Vice Chairman and a Director of FMR, and Vice Chairman (2001-present) and a Director (2000-present) of FMR Co., Inc. Previously, Mr. Lynch served as a Trustee of the Fidelity funds (1990-2003). In addition, he serves as a Trustee of Boston College, Massachusetts Eye & Ear Infirmary, Historic Deerfield, John F. Kennedy Library, and the Museum of Fine Arts of Boston. |
Walter C. Donovan (43) |
| Year of Election or Appointment: 2005 Vice President of the fund. Mr. Donovan also serves as Vice President of Fidelity's High Income Funds (2005-present), Fidelity's Fixed-Income Funds (2005-present), certain Asset Allocation Funds (2005-present), and certain Balanced Funds (2005-present). Mr. Donovan also serves as Executive Vice President of FMR (2005-present) and FMRC (2005-present). Previously, Mr. Donovan served as Vice President and Director of Fidelity's International Equity Trading group (1998-2005). |
David L. Murphy (57) |
| Year of Election or Appointment: 2005 Vice President of the fund. Mr. Murphy also serves as Vice President of Fidelity's Money Market Funds (2002-present), certain Asset Allocation Funds (2003-present), Fidelity's Investment Grade-Bond Funds (2005-present), and Fidelity's Balanced Funds (2005-present). He serves as Senior Vice President (2000-present) and Head (2004-present) of the Fidelity Investments Fixed Income Division. Mr. Murphy is also a Senior Vice President of FIMM (2003-present) and a Vice President of FMR (2000-present). Previously, Mr. Murphy served as Money Market Group Leader (2002-2004), Bond Group Leader (2000-2002), and Vice President of Fidelity's Taxable Bond Funds (2000-2002) and Fidelity's Municipal Bond Funds (2001-2002). Mr. Murphy joined Fidelity Investments in 1989 as a portfolio manager in the Bond Group. |
Thomas J. Silvia (44) |
| Year of Election or Appointment: 2005 Vice President of the fund. Mr. Silvia also serves as Vice President of Fidelity's Bond Funds (2005-present) and Senior Vice President and Bond Group Leader of the Fidelity Investments Fixed-Income Division (2005-present). Previously, Mr. Silvia served as Director of Fidelity's Taxable Bond portfolio managers (2002-2004) and a portfolio manager in the Bond Group (1997-2004). |
Andrew J. Dudley (41) |
| Year of Election or Appointment: 2002 Vice President of the fund. Mr. Dudley also serves as Vice President of other funds advised by FMR. Prior to assuming his current responsibilities, Mr. Dudley managed a variety of Fidelity funds. |
Eric D. Roiter (56) |
| Year of Election or Appointment: 2002 Secretary of the fund. He also serves as Secretary of other Fidelity funds; Vice President, General Counsel, and Secretary of FMR Co., Inc. (2001-present) and FMR; Assistant Secretary of Fidelity Management & Research (U.K.) Inc. (2001-present), Fidelity Management & Research (Far East) Inc. (2001-present), and Fidelity Investments Money Management, Inc. (2001-present). Mr. Roiter is an Adjunct Member, Faculty of Law, at Boston College Law School (2003-present). Previously, Mr. Roiter served as Vice President and Secretary of Fidelity Distributors Corporation (FDC) (1998-2005). |
Stuart Fross (45) |
| Year of Election or Appointment: 2003 Assistant Secretary of the fund. Mr. Fross also serves as Assistant Secretary of other Fidelity funds (2003-present), Vice President and Secretary of FDC (2005-present), and is an employee of FMR. |
Christine Reynolds (46) |
| Year of Election or Appointment: 2004 President, Treasurer, and Anti-Money Laundering (AML) officer of the fund. Ms. Reynolds also serves as President, Treasurer, and AML officer of other Fidelity funds (2004) and is a Vice President (2003) and an employee (2002) of FMR. Before joining Fidelity Investments, Ms. Reynolds worked at PricewaterhouseCoopers LLP (PwC) (1980-2002), where she was most recently an audit partner with PwC's investment management practice. |
Timothy F. Hayes (54) |
| Year of Election or Appointment: 2002 Chief Financial Officer of the fund. Mr. Hayes also serves as Chief Financial Officer of other Fidelity funds (2002-present) and President of Fidelity Investment Operations (2005-present) which includes Fidelity Pricing and Cash Management Services Group (FPCMS), where he served as President (1998-2005). Mr. Hayes serves as President of Fidelity Service Company (2003-present) where he also serves as a Director. Mr. Hayes also served as President of Fidelity Investments Operations Group (FIOG, 2002-2005). |
Kenneth A. Rathgeber (58) |
| Year of Election or Appointment: 2004 Chief Compliance Officer of the fund. Mr. Rathgeber also serves as Chief Compliance Officer of other Fidelity funds (2004) and Executive Vice President of Risk Oversight for Fidelity Investments (2002). Previously, he served as Executive Vice President and Chief Operating Officer for Fidelity Investments Institutional Services Company, Inc. (1998-2002). |
John R. Hebble (47) |
| Year of Election or Appointment: 2003 Deputy Treasurer of the fund. Mr. Hebble also serves as Deputy Treasurer of other Fidelity funds (2003), and is an employee of FMR. Before joining Fidelity Investments, Mr. Hebble worked at Deutsche Asset Management where he served as Director of Fund Accounting (2002-2003) and Assistant Treasurer of the Scudder Funds (1998-2003). |
Bryan A. Mehrmann (44) |
| Year of Election or Appointment: 2005 Deputy Treasurer of the fund. Mr. Mehrmann also serves as Deputy Treasurer of other Fidelity funds (2005-present) and is an employee of FMR. Previously, Mr. Mehrmann served as Vice President of Fidelity Investments Institutional Services Group (FIIS)/Fidelity Investments Institutional Operations Corporation, Inc. (FIIOC) Client Services (1998-2004). |
Kimberley H. Monasterio (41) |
| Year of Election or Appointment: 2004 Deputy Treasurer of the fund. Ms. Monasterio also serves as Deputy Treasurer of other Fidelity funds (2004) and is an employee of FMR (2004). Before joining Fidelity Investments, Ms. Monasterio served as Treasurer (2000-2004) and Chief Financial Officer (2002-2004) of the Franklin Templeton Funds and Senior Vice President of Franklin Templeton Services, LLC (2000-2004). |
Kenneth B. Robins (35) |
| Year of Election or Appointment: 2005 Deputy Treasurer of the fund. Mr. Robins also serves as Deputy Treasurer of other Fidelity funds (2005-present) and is an employee of FMR (2004-present). Before joining Fidelity Investments, Mr. Robins worked at KPMG LLP, where he was a partner in KPMG's department of professional practice (2002-2004) and a Senior Manager (1999-2000). In addition, Mr. Robins served as Assistant Chief Accountant, United States Securities and Exchange Commission (2000-2002). |
Robert G. Byrnes (38) |
| Year of Election or Appointment: 2005 Assistant Treasurer of the fund. Mr. Byrnes also serves as Assistant Treasurer of other Fidelity funds (2005-present) and is an employee of FMR (2005-present). Previously, Mr. Byrnes served as Vice President of FPCMS (2003-2005). Before joining Fidelity Investments, Mr. Byrnes worked at Deutsche Asset Management where he served as Vice President of the Investment Operations Group (2000-2003). |
John H. Costello (58) |
| Year of Election or Appointment: 2002 Assistant Treasurer of the fund. Mr. Costello also serves as Assistant Treasurer of other Fidelity funds and is an employee of FMR. |
Peter L. Lydecker (51) |
| Year of Election or Appointment: 2004 Assistant Treasurer of the fund. Mr. Lydecker also serves as Assistant Treasurer of other Fidelity funds (2004) and is an employee of FMR. |
Mark Osterheld (50) |
| Year of Election or Appointment: 2002 Assistant Treasurer of the fund. Mr. Osterheld also serves as Assistant Treasurer of other Fidelity funds (2002) and is an employee of FMR. |
Gary W. Ryan (46) |
| Year of Election or Appointment: 2005 Assistant Treasurer of the fund. Mr. Ryan also serves as Assistant Treasurer of other Fidelity funds (2005-present) and is an employee of FMR (2005-present). Previously, Mr. Ryan served as Vice President of Fund Reporting in FPCMS (1999-2005). |
Salvatore Schiavone (39) |
| Year of Election or Appointment: 2005 Assistant Treasurer of the fund. Mr. Schiavone also serves as Assistant Treasurer of other Fidelity funds (2005-present) and is an employee of FMR (2005-present). Before joining Fidelity Investments, Mr. Schiavone worked at Deutsche Asset Management, where he most recently served as Assistant Treasurer (2003-2005) of the Scudder Funds and Vice President and Head of Fund Reporting (1996-2003). |
Annual Report
Distributions
The fund hereby designates as capital gain dividends: For dividends with respect to the taxable year ended July 31, 2005, $217,965, or, if subsequently determined to be different, the net capital gain of such year.
A total of 1.22% of the dividends distributed during the fiscal year was derived from interest on U.S. Government securities which is generally exempt from state income tax.
The fund will notify shareholders in January 2006 of amounts for use in preparing 2005 income tax returns.
Annual Report
Board Approval of Investment Advisory Contracts and Management Fees
Fidelity Ultra-Short Bond Fund
Each year, typically in June, the Board of Trustees, including the independent Trustees (together, the Board), votes on the renewal of the management contract and sub-advisory agreements (together, the Advisory Contracts) for the fund. The Board, assisted by the advice of fund counsel and independent Trustees' counsel, requests and considers a broad range of information throughout the year.
The Board meets regularly each month except August and takes into account throughout the year matters bearing on Advisory Contracts. The Board, acting directly and through its separate committees, considers at each of its meetings factors that are relevant to the annual renewal of the fund's Advisory Contracts, including the services and support provided to the fund and its shareholders by Fidelity. At the time of the renewal, the Board had 11 standing committees, each composed of independent Trustees with varying backgrounds, to which the Board has assigned specific subject matter responsibilities in order to enhance effective decision-making by the Board. Each committee has adopted a written charter outlining the structure and purposes of the committee. One such committee, the Fixed-Income Contract Committee, meets periodically during the first six months of each year and as necessary to consider matters specifically related to the annual renewal of Advisory Contracts. The committee requests and receives information on, and makes recommendations to the independent Trustees concerning, the approval and annual review of the Advisory Contracts.
At its June 2005 meeting, the Board of Trustees, including the independent Trustees, unanimously determined to renew the Advisory Contracts for the fund. In reaching its determination, the Board considered all factors it believed relevant, including (1) the nature, extent, and quality of the services to be provided to the fund and its shareholders by Fidelity (including the investment performance of the fund); (2) the competitiveness of the management fee and total expenses of the fund; (3) the total costs of the services to be provided by and the profits to be realized by the investment adviser and its affiliates from the relationship with the fund; (4) the extent to which economies of scale would be realized as the fund grows; and (5) whether fee levels reflect these economies of scale, if any, for the benefit of fund shareholders.
In determining whether to renew the Advisory Contracts for the fund, the Board ultimately reached a determination, with the assistance of fund counsel and independent Trustees' counsel, that the renewal of the Advisory Contracts and the compensation to be received by Fidelity under the management contract is consistent with Fidelity's fiduciary duty under applicable law. In addition to evaluating the specific factors noted above, the Board, in reaching its determination, is aware that shareholders in the fund have a broad range of investment choices available to them, including a wide choice among mutual funds offered by competitors to Fidelity, and that the fund's shareholders, with the opportunity to review and weigh the disclosure provided by the fund in its prospectus and other public disclosures, have chosen to invest in this fund, managed by Fidelity.
Annual Report
Nature, Extent, and Quality of Services Provided by Fidelity. The Board considered staffing within the investment adviser, FMR, and the sub-advisers (together, the Investment Advisers), including the background of the fund's portfolio manager and the fund's investment objective and discipline. The independent Trustees also had discussions with senior management of Fidelity's investment operations and investment groups. The Board considered the structure of the portfolio manager compensation program and whether this structure provides appropriate incentives.
Fidelity Resources Dedicated to Investment Management and Support Services. The Board reviewed the size, education, and experience of the Investment Advisers' investment staff, their use of technology, and the Investment Advisers' approach to recruiting, training, and retaining portfolio managers and other research, advisory, and management personnel. The Board considered Fidelity's extensive global research capabilities that enable the Investment Advisers to aggregate data from various sources in an effort to produce positive investment results. The Board noted that Fidelity's analysts have access to a variety of technological tools that enable them to perform both fundamental and quantitative analysis and to specialize in various disciplines. The Board also considered that Fidelity's portfolio managers and analysts have access to daily portfolio attribution that allows for monitoring of a fund's portfolio, as well as an electronic communication system that provides immediate real-time access to research concerning issuers and credit enhancers.
Shareholder and Administrative Services. The Board considered the nature, extent, quality, and cost of administrative, distribution, and shareholder services performed by the Investment Advisers and their affiliates under the Advisory Contracts and under separate agreements covering transfer agency, pricing and bookkeeping, and securities lending services for the fund. The Board also considered the nature and extent of the Investment Advisers' supervision of third party service providers, principally custodians and subcustodians. The Board reviewed the allocation of fund brokerage, including allocations to brokers affiliated with the Investment Advisers. The Board also considered the resources devoted to, and the record of compliance with, the fund's compliance policies and procedures.
The Board noted that the growth of fund assets across the complex allows Fidelity to reinvest in the development of services designed to enhance the value or convenience of the Fidelity funds as investment vehicles. These services include 24-hour access to account information and market information through phone representatives and over the Internet, and investor education materials and asset allocation tools.
Investment in a Large Fund Family. The Board considered the benefits to shareholders of investing in a Fidelity fund, including the benefits of investing in a fund that is part of a large family of funds offering a variety of investment disciplines and providing for a large variety of mutual fund investor services. For example, fund shareholders are offered the privilege of exchanging shares of the fund for shares of other Fidelity funds, as set forth in the fund's prospectus, without paying an additional sales charge. The Board noted that, since the last Advisory Contract renewals in June 2004, Fidelity has taken a number of actions that benefited particular funds, including (i) voluntarily deciding in 2004 to stop using "soft" commission dollars to pay for market data and, instead, to pay for that data out of its own resources, (ii) contractually agreeing to impose management fee reductions and expense limitations on its five Spartan stock index funds and its stock index fund available through variable insurance products, (iii) contractually agreeing to eliminate the management fees on the Fidelity Freedom Funds and the Fidelity Advisor Freedom Funds, (iv) contractually agreeing to reduce the management fees on most of its investment-grade taxable bond funds, and (v) contractually agreeing to impose expense limitations on its retail and Spartan investment-grade taxable bond funds.
Annual Report
Board Approval of Investment Advisory Contracts and
Management Fees - continued
Investment Performance. The Board considered whether the fund has operated within its investment objective, as well as its record of compliance with its investment restrictions. It also reviewed the fund's absolute investment performance, as well as the fund's relative investment performance measured against (i) a broad-based securities market index, and (ii) a peer group of mutual funds deemed appropriate by the Board. Because the fund had been in existence less than three calendar years, the following chart considered by the Board shows, for the one-year period ended December 31, 2004, the return of the retail class of the fund, the return of a broad-based securities market index ("benchmark"), and a range of returns of a peer group of mutual funds identified by Lipper Inc. as having an investment objective similar to that of the fund. The return of the retail class represents the performance of a class with the lowest 12b-1 fee (not necessarily with the lowest total expenses). (The Advisor classes of the fund, which have higher 12b-1 fees, had less than one year of performance as of December 31, 2004.) The box within the chart shows the 25th percentile return (bottom of box) and the 75th percentile return (top of box) of the Lipper peer group. The percentage beaten number noted below the chart corresponds to the percentile box and represents the percentage of funds in the Lipper peer group whose performance was equal to or lower than that of the retail class.
Annual Report
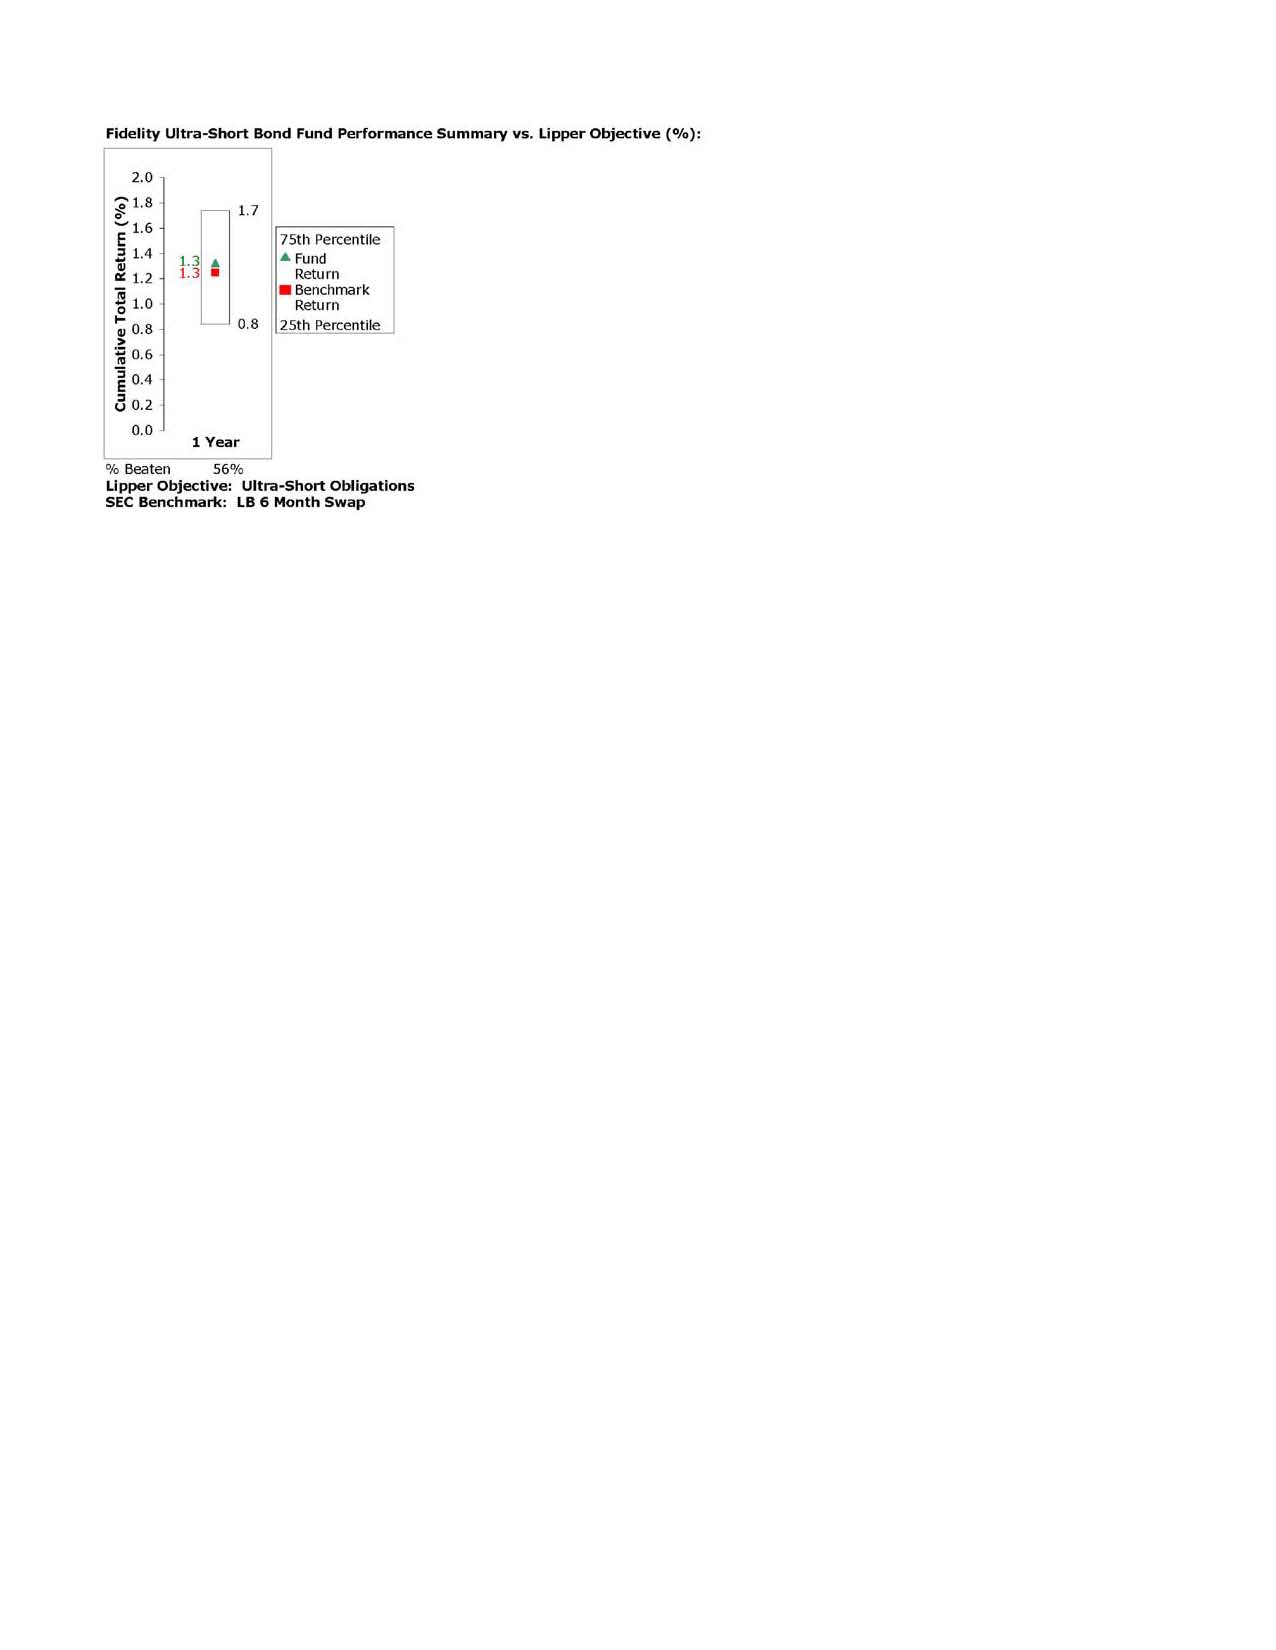
The Board noted that the relative investment performance of the retail class of the fund compared favorably to its Lipper peer group for the one-year period. The Board also noted that the relative investment performance of the retail class of the fund compared favorably to its benchmark for the one-year period.
Based on its review, and giving particular weight to the nature and quality of the resources dedicated by the Investment Advisers to maintain and improve relative performance, the Board concluded that the nature, extent, and quality of the services provided by Fidelity will benefit the fund's shareholders, particularly in light of the Board's view that the fund's shareholders benefit from investing in a fund that is part of a large family of funds offering a variety of investment disciplines and services.
Competitiveness of Management Fee and Total Fund Expenses. The Board considered the fund's management fee and total expenses compared to "mapped groups" of competitive funds and classes. Fidelity creates "mapped groups" by combining similar Lipper investment objective categories that have comparable management fee characteristics. Combining Lipper investment objective categories aids the Board's management fee and total expense comparisons by broadening the competitive group used for comparison and by reducing the number of universes to which various Fidelity funds are compared.
The Board considered two proprietary management fee comparisons for the 12-month (or shorter) periods shown in the chart below. The group of Lipper funds used by the Board for management fee comparisons is referred to below as the "Total Mapped Group" and, for the reasons explained above, is broader than the Lipper peer group used by the Board for performance comparisons. The Total Mapped Group comparison focuses on a fund's standing relative to the total universe of comparable funds available to investors, in terms of gross management fees before expense reimbursements or caps. "TMG %" represents the percentage of funds in the Total Mapped Group that had management fees that were lower than the fund's. For example, a TMG % of 35% would mean that 65% of the funds in the Total Mapped Group had higher management fees than the fund. The "Asset-Size Peer Group" (ASPG) comparison focuses on a fund's standing relative to non-Fidelity funds similar in size to the fund within the Total Mapped Group. The ASPG represents at least 15% of the funds in the Total Mapped Group with comparable asset size and management fee characteristics, subject to a minimum of 50 funds (or all funds in the Total Mapped Group if fewer than 50). Additional information, such as the ASPG quartile ("quadrant") in which the fund's management fee ranked, is also included in the chart and considered by the Board.
Annual Report
Board Approval of Investment Advisory Contracts and
Management Fees - continued
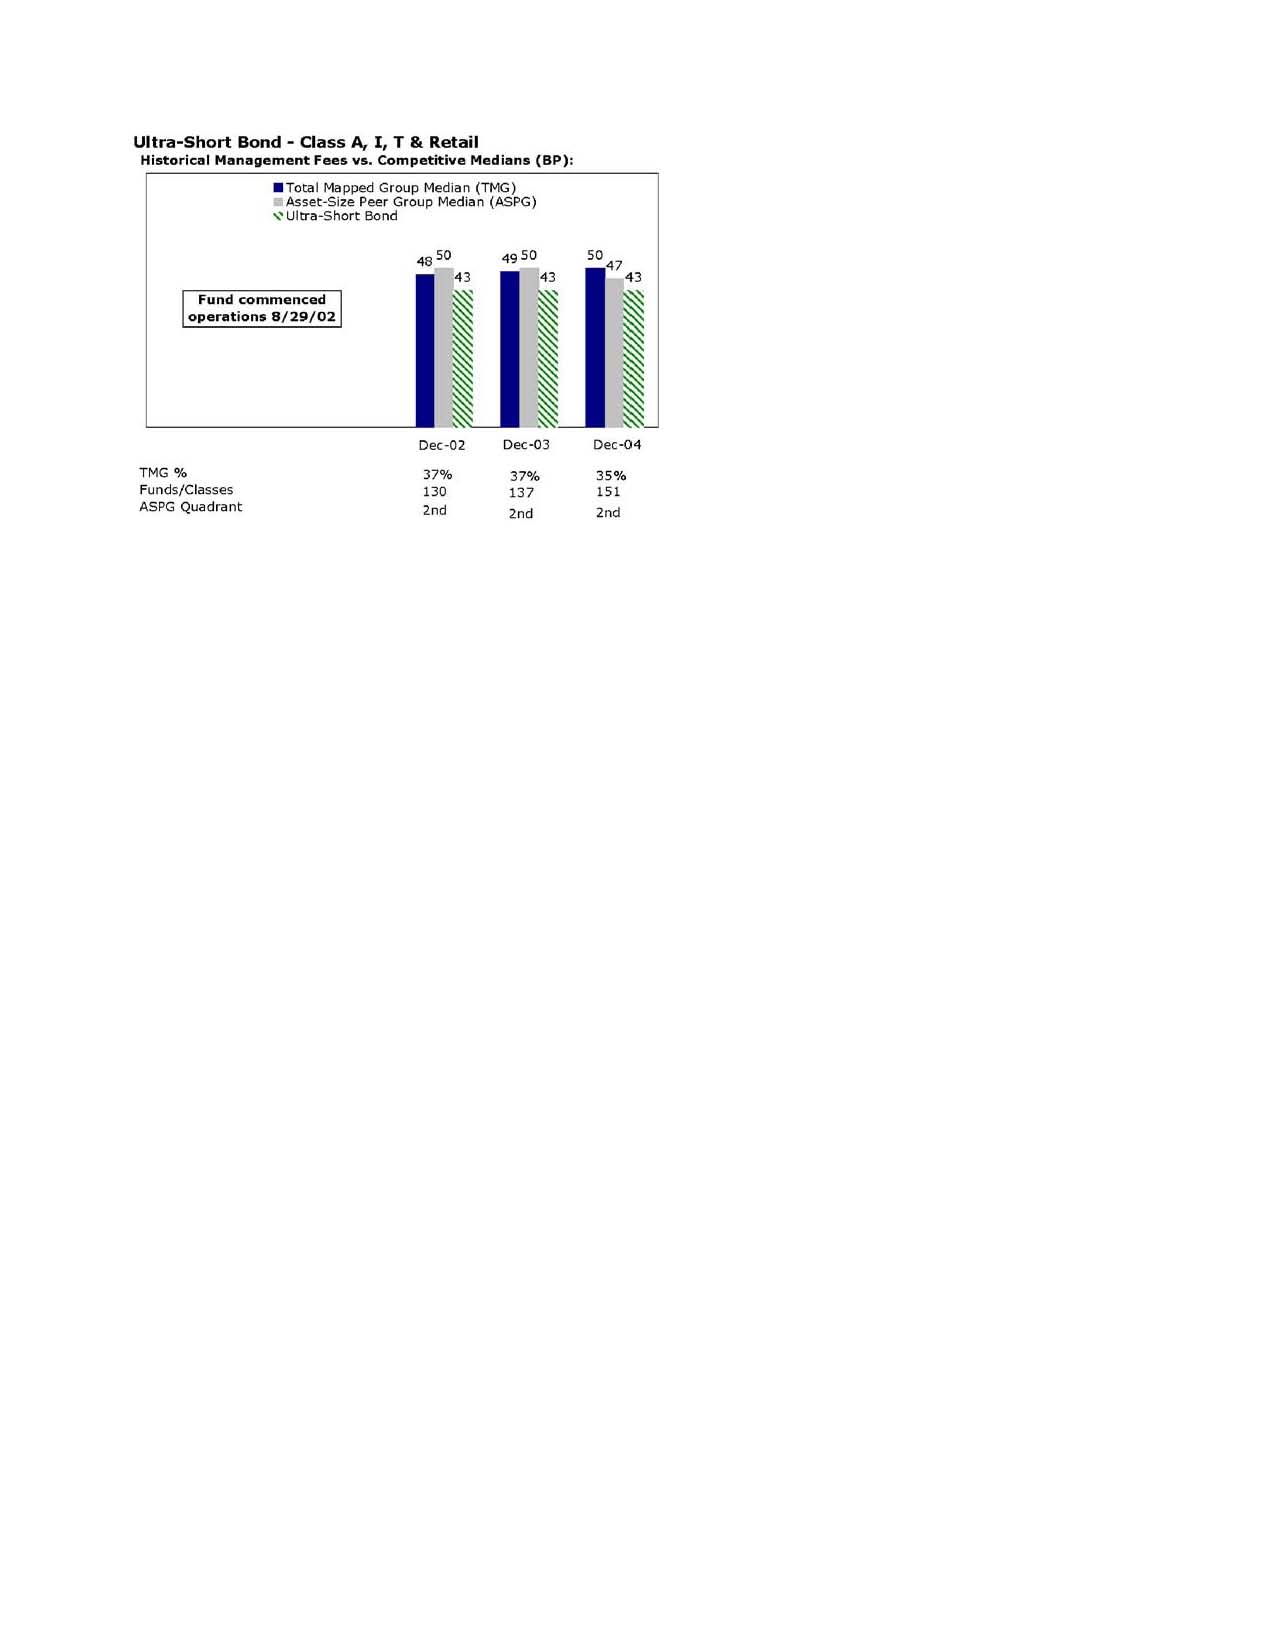
The Board noted that the fund's management fee ranked below the median of its Total Mapped Group and below the median of its ASPG for 2004.
Furthermore, the Board considered that, on May 19, 2005, after the periods shown in the chart above, it had approved an amendment (effective June 1, 2005) to the fund's management contract that lowered the fund's individual fund fee rate from 30 basis points to 20 basis points. The Board considered that, if the lower individual fund fee rate had been in effect in 2004, it would have reduced the fund's management fee rate from 43 basis points to 33 basis points.
Based on its review, the Board concluded that the fund's management fee was fair and reasonable in light of the services that the fund receives and the other factors considered.
Annual Report
In its review of each class's total expenses, the Board considered the fund's management fee as well as other fund or class expenses, as applicable, such as transfer agent fees, pricing and bookkeeping fees, fund-paid 12b-1 fees, and custodial, legal, and audit fees. The Board also noted the effects of any waivers and reimbursements on fees and expenses. As part of its review, the Board also considered current and historical total expenses of each class of the fund compared to competitive fund median expenses. Each class of the fund is compared to those funds and classes in the Total Mapped Group (used by the Board for management fee comparisons) that have a similar sales load structure.
The Board noted that the total expenses of each of Class A, Class T, and Fidelity Ultra-Short Bond Fund (retail class) ranked below its competitive median for 2004, and the total expenses of Institutional Class ranked above its competitive median for 2004. The Board noted that the fund offers multiple classes, each of which has a different sales load and 12b-1 fee structure, and that the multiple structures are intended to offer a range of pricing options for the intermediary market. The Board also noted that the total expenses of the classes vary primarily by the level of their 12b-1 fees, although differences in transfer agent fees may also cause expenses to vary from class to class. The Board considered that if the lower individual fund fee rate had been in effect in 2004, it would have reduced each class's total expenses by 10 basis points and the total expenses of Institutional Class would have ranked below the median.
The Board also considered that on May 19, 2005, it had approved changes (effective June 1, 2005) in the contractual arrangements for the fund that (i) have the effect of setting the total "fund-level" expenses (including, among certain other expenses, the management fee) for each class at 35 basis points, (ii) lower and limit the "class-level" transfer agent fee for Fidelity Ultra-Short Bond Fund (retail class) to 10 basis points, and (iii) limit the total expenses for Fidelity Ultra-Short Bond Fund (retail class) to 45 basis points. These new contractual arrangements may not be increased without Board approval. The fund's Advisor classes continue to be subject to different class-level expenses (transfer agent fees and 12b-1 fees).
The Board recognized that the fund's management contract incorporates a "group fee" structure, which provides for lower fee rates as total fund assets under FMR's management increase, and for higher fee rates as total fund assets under FMR's management decrease. The Board noted that because the new contractual arrangements set the total fund-level expenses for each class at 35 basis points, increases or decreases in the management fee due to changes in the group fee rate will not impact total expenses. However, the Board realized that the 35 basis point fee rate was below the lowest management fee available under the old contractual arrangements. The maximum benefit that a decrease in the group fee rate could provide the fund would be a reduction in the management fee to approximately 39 basis points (compared to total fund-level expenses of 35 basis points under the new contractual arrangements).
Annual Report
Board Approval of Investment Advisory Contracts and
Management Fees - continued
In its review of total expenses, the Board also considered Fidelity fee structures and other information on clients that FMR and its affiliates service in other competitive markets, such as other mutual funds advised or subadvised by FMR or its affiliates, pension plan clients, and other institutional clients.
Based on its review, the Board concluded that the total expenses for each class of the fund were reasonable, although in one case above the median of the universe presented for comparison, in light of the services that the fund and its shareholders receive and the other factors considered.
Costs of the Services and Profitability. The Board considered the revenues earned and the expenses incurred by Fidelity in conducting the business of developing, marketing, distributing, managing, administering and servicing the fund and its shareholders. The Board also considered the level of Fidelity's profits in respect of all the Fidelity funds.
On an annual basis, FMR presents to the Board Fidelity's profitability for the fund. Fidelity calculates the profitability for each fund, as well as aggregate profitability for groups of Fidelity funds and all Fidelity funds, using a series of detailed revenue and cost allocation methodologies which originate with the audited books and records of Fidelity. The Audit Committee of the Board reviews any significant changes from the prior year's methodologies.
PricewaterhouseCoopers LLP (PwC), independent registered accounting firm and auditor to Fidelity and certain Fidelity funds, has been engaged annually by the Board as part of the Board's assessment of the results of Fidelity's profitability analysis. PwC's engagement includes the review and assessment of Fidelity's methodologies used in determining the revenues and expenses attributable to Fidelity's mutual fund business, and completion of agreed-upon procedures surrounding the mathematical accuracy of fund profitability and its conformity to allocation methodologies. After considering PwC's reports issued under the engagement and information provided by Fidelity, the Board believes that while other allocation methods may also be reasonable, Fidelity's profitability methodologies are reasonable in all material respects.
The Board has also reviewed Fidelity's non-fund businesses and any fall-out benefits related to the mutual fund business as well as cases where Fidelity's affiliates may benefit from or be related to the fund's business. In addition, a special committee of the Board reviewed services provided to Fidelity by its affiliates and determined that the fees that Fidelity paid for such services were reasonable.
The Board considered the costs of the services provided by and the profits realized by Fidelity in connection with the operation of the fund and determined that the amount of profit is a fair entrepreneurial profit for the management of the fund.
Annual Report
Economies of Scale. The Board considered whether there have been economies of scale in respect of the management of the Fidelity funds, whether the Fidelity funds (including the fund) have appropriately benefited from any such economies of scale, and whether there is potential for realization of any further economies of scale. The Board considered the extent to which the fund will benefit from economies of scale through increased services to the fund, through waivers or reimbursements, or through fee or expense reductions, including (Advisor classes only) reductions that occur through operation of the transfer agent agreement. The transfer agent fee varies in part based on the number of accounts in the fund. If the number of accounts decreases or the average account size increases, the overall transfer agent fee rate decreases. The Board also noted that the reduction in the fund's management fee rate from 43 basis points to 33 basis points and the reduction in each class's total expenses by 10 basis points would deliver significant economies to fund shareholders. The Board concluded that any potential economies of scale are being shared between fund shareholders and Fidelity in an appropriate manner.
Additional Information Requested by the Board. In order to develop fully the factual basis for consideration of the Advisory Contracts, the Board requested additional information regarding (i) Fidelity's fund profitability methodology, including additional detail on various cost allocations; (ii) fall-out benefits to Fidelity; and (iii) compensation of portfolio managers and research analysts.
Based on its evaluation of all of the conclusions noted above, and after considering all material factors, the Board ultimately concluded that the existing advisory fee structures are fair and reasonable, and that the fund's existing Advisory Contracts should be renewed.
Annual Report
The following is a complete listing of investments for Fidelity's
fixed-income central fund as of July 31, 2005 which is a direct
or indirect investment of Fidelity Ultra-Short Bond Fund.
These underlying holdings of the Fidelity fixed-income central fund are not included in the Schedule of Investments as part of the Financial Statements.
Annual Report
Fidelity Ultra-Short Central Fund
Investments July 31, 2005 (Unaudited)
Showing Percentage of Net Assets
Nonconvertible Bonds - 3.8% |
| Principal Amount | | Value |
CONSUMER DISCRETIONARY - 1.0% |
Auto Components - 0.3% |
DaimlerChrysler NA Holding Corp.: | | | | |
3.8594% 9/10/07 (f) | | $ 16,665,000 | | $ 16,698,830 |
3.8938% 5/24/06 (f) | | 4,700,000 | | 4,713,691 |
| | 21,412,521 |
Media - 0.7% |
Continental Cablevision, Inc. 8.3% 5/15/06 | | 8,000,000 | | 8,248,640 |
Cox Communications, Inc. (Reg. S) 3.95% 12/14/07 (f) | | 12,140,000 | | 12,202,691 |
Liberty Media Corp. 4.91% 9/17/06 (f) | | 16,694,000 | | 16,786,986 |
Univision Communications, Inc. 2.875% 10/15/06 | | 8,505,000 | | 8,315,339 |
| | 45,553,656 |
TOTAL CONSUMER DISCRETIONARY | | 66,966,177 |
ENERGY - 0.2% |
Oil, Gas & Consumable Fuels - 0.2% |
Valero Energy Corp. 7.375% 3/15/06 | | 11,550,000 | | 11,735,435 |
FINANCIALS - 1.0% |
Capital Markets - 0.1% |
State Street Capital Trust II 3.7681% 2/15/08 (f) | | 10,000,000 | | 10,002,260 |
Commercial Banks - 0.3% |
Wells Fargo & Co. 3.4194% 3/10/08 (f) | | 16,600,000 | | 16,599,452 |
Consumer Finance - 0.2% |
General Motors Acceptance Corp. 4.87% 10/20/05 (f) | | 14,765,000 | | 14,786,188 |
Thrifts & Mortgage Finance - 0.4% |
Countrywide Financial Corp. 3.71% 4/11/07 (f) | | 11,025,000 | | 11,032,034 |
Residential Capital Corp. 4.835% 6/29/07 (c)(f) | | 14,150,000 | | 14,164,716 |
| | 25,196,750 |
TOTAL FINANCIALS | | 66,584,650 |
TELECOMMUNICATION SERVICES - 1.3% |
Diversified Telecommunication Services - 1.2% |
British Telecommunications PLC 7.875% 12/15/05 | | 18,145,000 | | 18,397,070 |
France Telecom SA 7.45% 3/1/06 (a) | | 5,600,000 | | 5,699,484 |
GTE Corp. 6.36% 4/15/06 | | 9,000,000 | | 9,126,405 |
SBC Communications, Inc. 4.389% 6/5/06 (c) | | 15,315,000 | | 15,319,595 |
Sprint Capital Corp. 4.78% 8/17/06 | | 6,000,000 | | 6,020,550 |
Telefonica Europe BV 7.35% 9/15/05 | | 4,500,000 | | 4,517,537 |
Nonconvertible Bonds - continued |
| Principal Amount | | Value |
TELECOMMUNICATION SERVICES - continued |
Diversified Telecommunication Services - continued |
Telefonos de Mexico SA de CV 4.5% 11/19/08 | | $ 10,240,000 | | $ 10,092,268 |
TELUS Corp. yankee 7.5% 6/1/07 | | 6,500,000 | | 6,835,569 |
| | 76,008,478 |
Wireless Telecommunication Services - 0.1% |
AT&T Wireless Services, Inc. 7.35% 3/1/06 | | 5,500,000 | | 5,596,976 |
TOTAL TELECOMMUNICATION SERVICES | | 81,605,454 |
UTILITIES - 0.3% |
Electric Utilities - 0.2% |
Pinnacle West Energy Corp. 4.0044% 4/1/07 (c)(f) | | 12,800,000 | | 12,800,794 |
Gas Utilities - 0.1% |
NiSource Finance Corp. 7.625% 11/15/05 | | 9,250,000 | | 9,342,213 |
TOTAL UTILITIES | | 22,143,007 |
TOTAL NONCONVERTIBLE BONDS (Cost $249,397,779) | 249,034,723 |
U.S. Government Agency Obligations - 0.0% |
|
Fannie Mae 0% 9/28/05 (e)
(Cost $994,579) | | 1,000,000 | | 994,635 |
Asset-Backed Securities - 35.2% |
|
Accredited Mortgage Loan Trust: | | | | |
Series 2004-2 Class A2, 3.76% 7/25/34 (f) | | 7,964,683 | | 7,978,722 |
Series 2004-3 Class 2A4, 3.81% 10/25/34 (f) | | 10,915,000 | | 10,946,584 |
Series 2004-4 Class A2D, 3.81% 1/25/35 (f) | | 3,579,364 | | 3,588,366 |
Series 2005-1: | | | | |
Class M1, 3.93% 4/25/35 (f) | | 11,280,000 | | 11,251,882 |
Class M2, 4.15% 4/25/35 (f) | | 5,275,000 | | 5,276,901 |
ACE Securities Corp.: | | | | |
Series 2002-HE1 Class M1, 4.11% 6/25/32 (f) | | 1,308,761 | | 1,318,432 |
Series 2002-HE2 Class M1, 4.31% 8/25/32 (f) | | 18,631,213 | | 18,704,611 |
Series 2003-FM1 Class M2, 5.31% 11/25/32 (f) | | 3,015,000 | | 3,050,466 |
Series 2003-HS1: | | | | |
Class M1, 4.21% 6/25/33 (f) | | 800,000 | | 803,485 |
Class M2, 5.21% 6/25/33 (f) | | 856,000 | | 871,093 |
Asset-Backed Securities - continued |
| Principal Amount | | Value |
ACE Securities Corp.: - continued | | | | |
Series 2003-NC1 Class M1, 4.24% 7/25/33 (f) | | $ 1,600,000 | | $ 1,611,660 |
Series 2004-HE1: | | | | |
Class M1, 3.96% 2/25/34 (f) | | 2,193,000 | | 2,193,772 |
Class M2, 4.56% 2/25/34 (f) | | 2,475,000 | | 2,476,241 |
Series 2004-OP1: | | | | |
Class M1, 3.98% 4/25/34 (f) | | 4,420,000 | | 4,424,344 |
Class M2, 4.51% 4/25/34 (f) | | 6,240,000 | | 6,251,080 |
Series 2005-HE2: | | | | |
Class M1, 3.9% 4/25/35 (f) | | 1,530,000 | | 1,527,965 |
Class M2, 3.91% 4/25/35 (f) | | 1,803,000 | | 1,796,836 |
Class M3, 3.94% 4/25/35 (f) | | 1,040,000 | | 1,038,647 |
Class M4, 4.1% 4/25/35 (f) | | 1,340,000 | | 1,338,268 |
Series 2005-HE3: | | | | |
Class A2A, 3.56% 5/25/35 (f) | | 8,063,511 | | 8,063,822 |
Class A2B, 3.67% 5/25/35 (f) | | 4,370,000 | | 4,366,352 |
Series 2005-SD1 Class A1, 3.86% 11/25/50 (f) | | 2,563,309 | | 2,566,464 |
Aesop Funding II LLC Series 2005-1A Class A2, 3.49% 4/20/09 (c)(f) | | 8,800,000 | | 8,765,680 |
American Express Credit Account Master Trust: | | | | |
Series 2002-6 Class B, 3.8381% 3/15/10 (f) | | 5,000,000 | | 5,030,751 |
Series 2004-1 Class B, 3.6381% 9/15/11 (f) | | 5,775,000 | | 5,797,723 |
Series 2004-C Class C, 3.8881% 2/15/12 (c)(f) | | 17,323,520 | | 17,374,643 |
Series 2005-1 Class A, 3.4181% 10/15/12 (f) | | 15,455,000 | | 15,481,600 |
AmeriCredit Automobile Receivables Trust: | | | | |
Series 2002-EM Class A4A, 3.67% 6/8/09 | | 25,000,000 | | 24,899,223 |
Series 2003-AM: | | | | |
Class A3B, 3.71% 6/6/07 (f) | | 685,806 | | 685,879 |
Class A4B, 3.81% 11/6/09 (f) | | 12,400,000 | | 12,441,657 |
Series 2003-BX Class A4B, 3.72% 1/6/10 (f) | | 3,265,000 | | 3,275,694 |
Series 2003-CF Class A3, 2.75% 10/9/07 | | 12,249,371 | | 12,210,791 |
Series 2005-1 Class C, 4.73% 7/6/10 | | 15,500,000 | | 15,451,950 |
Ameriquest Mortgage Securities, Inc.: | | | | |
Series 2002-3 Class M1, 4.16% 8/25/32 (f) | | 5,000,000 | | 5,028,248 |
Series 2003-1: | | | | |
Class A2, 3.87% 2/25/33 (f) | | 465,695 | | 465,917 |
Class M1, 4.36% 2/25/33 (f) | | 6,150,000 | | 6,197,846 |
Series 2003-3: | | | | |
Class M1, 4.26% 3/25/33 (f) | | 1,590,000 | | 1,603,481 |
Class S, 5% 9/25/05 (g) | | 4,457,447 | | 17,215 |
Series 2003-6: | | | | |
Class M1, 4.22% 8/25/33 (f) | | 7,560,000 | | 7,611,224 |
Asset-Backed Securities - continued |
| Principal Amount | | Value |
Ameriquest Mortgage Securities, Inc.: - continued | | | | |
Series 2003-6: | | | | |
Class M2, 5.31% 5/25/33 (f) | | $ 2,750,000 | | $ 2,808,476 |
Series 2003-AR1 Class M1, 4.61% 1/25/33 (f) | | 7,000,000 | | 7,072,631 |
Series 2004-R2: | | | | |
Class M1, 3.89% 4/25/34 (f) | | 1,230,000 | | 1,229,949 |
Class M2, 3.94% 4/25/34 (f) | | 950,000 | | 949,960 |
Class M3, 4.01% 4/25/34 (f) | | 3,500,000 | | 3,499,854 |
Class M4, 4.51% 4/25/34 (f) | | 4,500,000 | | 4,499,807 |
Series 2004-R9 Class A3, 3.78% 10/25/34 (f) | | 9,340,000 | | 9,359,871 |
Series 2005-R1: | | | | |
Class M1, 3.91% 3/25/35 (f) | | 5,710,000 | | 5,691,308 |
Class M2, 3.94% 3/25/35 (f) | | 1,925,000 | | 1,918,868 |
Series 2005-R2 Class M1, 3.91% 4/25/35 (f) | | 12,500,000 | | 12,482,516 |
Amortizing Residential Collateral Trust: | | | | |
Series 2002-BC3 Class A, 3.79% 6/25/32 (f) | | 2,411,175 | | 2,418,495 |
Series 2002-BC6 Class M1, 4.21% 8/25/32 (f) | | 24,900,000 | | 25,116,817 |
Series 2002-BC7: | | | | |
Class M1, 4.1144% 10/25/32 (f) | | 10,000,000 | | 10,075,000 |
Class M2, 4.36% 10/25/32 (f) | | 5,575,000 | | 5,612,067 |
Series 2003-BC1 Class M2, 4.56% 1/25/32 (f) | | 758,836 | | 762,333 |
ARG Funding Corp.: | | | | |
Series 2005-1A Class A2, 3.53% 4/20/09 (c)(f) | | 11,000,000 | | 10,975,938 |
Series 2005-2A Class A2, 3.54% 5/20/09 (c)(f) | | 5,200,000 | | 5,190,453 |
Argent Securities, Inc.: | | | | |
Series 2003-W3 Class M2, 5.26% 9/25/33 (f) | | 20,000,000 | | 20,599,990 |
Series 2003-W7 Class A2, 3.85% 3/1/34 (f) | | 4,505,856 | | 4,515,756 |
Series 2004-W5 Class M1, 4.06% 4/25/34 (f) | | 3,960,000 | | 3,964,768 |
Series 2004-W7: | | | | |
Class M1, 4.01% 5/25/34 (f) | | 4,085,000 | | 4,084,827 |
Class M2, 4.06% 5/25/34 (f) | | 3,320,000 | | 3,319,860 |
Asset Backed Securities Corp. Home Equity Loan Trust: | | | | |
Series 2003-HE2: | | | | |
Class A2, 3.7681% 4/15/33 (f) | | 1,158,706 | | 1,159,186 |
Class M1, 4.2881% 4/15/33 (f) | | 11,365,000 | | 11,429,103 |
Series 2003-HE3: | | | | |
Class M1, 4.2181% 6/15/33 (f) | | 2,185,000 | | 2,198,827 |
Class M2, 5.3881% 6/15/33 (f) | | 10,000,000 | | 10,182,465 |
Series 2003-HE4 Class M2, 5.3881% 8/15/33 (f) | | 5,695,000 | | 5,798,650 |
Series 2003-HE5 Class A2A, 3.7481% 8/15/33 (f) | | 1,380,797 | | 1,381,390 |
Series 2003-HE6 Class M1, 4.11% 11/25/33 (f) | | 3,475,000 | | 3,490,373 |
Series 2004-HE2 Class M1, 4.01% 4/25/34 (f) | | 6,060,000 | | 6,070,769 |
Series 2004-HE3: | | | | |
Class M1, 4% 6/25/34 (f) | | 1,450,000 | | 1,454,353 |
Asset-Backed Securities - continued |
| Principal Amount | | Value |
Asset Backed Securities Corp. Home Equity Loan Trust: - continued | | | | |
Series 2004-HE3: | | | | |
Class M2, 4.58% 6/25/34 (f) | | $ 3,350,000 | | $ 3,386,297 |
Series 2004-HE6 Class A2, 3.82% 6/25/34 (f) | | 17,398,791 | | 17,435,568 |
Series 2005-HE2: | | | | |
Class M1, 3.91% 3/25/35 (f) | | 8,250,000 | | 8,235,989 |
Class M2, 3.96% 3/25/35 (f) | | 2,065,000 | | 2,065,671 |
Series 2005-HE6 Class A2B, 3.76% 8/25/35 (d)(f) | | 10,000,000 | | 10,000,000 |
Bank One Issuance Trust: | | | | |
Series 2002-B1 Class B1, 3.7681% 12/15/09 (f) | | 20,655,000 | | 20,741,067 |
Series 2002-B2 Class B2, 3.7281% 5/15/08 (f) | | 15,000,000 | | 15,001,929 |
Series 2002-B3 Class B, 3.7481% 8/15/08 (f) | | 14,500,000 | | 14,505,871 |
Series 2002-C1 Class C1, 4.3481% 12/15/09 (f) | | 7,980,000 | | 8,065,464 |
Series 2002-C2 Class C2, 4.3781% 5/15/08 (f) | | 35,785,000 | | 35,817,626 |
Bayview Financial Acquisition Trust Series 2004-C Class A1, 3.9013% 5/28/44 (f) | | 8,416,440 | | 8,415,509 |
Bayview Financial Asset Trust Series 2000-F Class A, 3.9813% 9/28/43 (f) | | 9,618,786 | | 9,632,318 |
Bayview Financial Mortgage Loan Trust Series 2004-A Class A, 3.9313% 2/28/44 (f) | | 5,760,012 | | 5,771,599 |
Bear Stearns Asset Backed Securities I: | | | | |
Series 2005-HE2: | | | | |
Class M1, 3.96% 2/25/35 (f) | | 6,655,000 | | 6,639,262 |
Class M2, 4.21% 2/25/35 (f) | | 2,430,000 | | 2,432,538 |
Series 2005-HE5 Class 1A1, 3.4244% 6/25/35 (f) | | 10,884,395 | | 10,884,395 |
Capital Auto Receivables Asset Trust: | | | | |
Series 2002-5 Class B, 2.8% 4/15/08 | | 2,894,887 | | 2,868,235 |
Series 2003-1 Class B, 3.8581% 6/15/10 (c)(f) | | 5,781,229 | | 5,797,579 |
Series 2003-2 Class B, 3.6681% 1/15/09 (f) | | 2,741,542 | | 2,746,505 |
Series 2005-1 Class B, 3.7631% 6/15/10 (f) | | 5,725,000 | | 5,730,367 |
Capital One Auto Finance Trust: | | | | |
Series 2003-A Class A4B, 3.6681% 1/15/10 (f) | | 9,630,000 | | 9,654,568 |
Series 2004-B Class A4, 3.4981% 8/15/11 (f) | | 16,300,000 | | 16,303,123 |
Capital One Master Trust: | | | | |
Series 1999-3 Class B, 3.8681% 9/15/09 (f) | | 5,000,000 | | 5,004,082 |
Series 2001-1 Class B, 3.8981% 12/15/10 (f) | | 19,500,000 | | 19,638,608 |
Series 2001-8A Class B, 3.9381% 8/17/09 (f) | | 9,585,000 | | 9,634,206 |
Series 2002-4A Class B, 3.8881% 3/15/10 (f) | | 6,000,000 | | 6,028,221 |
Capital One Multi-Asset Execution Trust: | | | | |
Series 2002-B1 Class B1, 4.0681% 7/15/08 (f) | | 17,705,000 | | 17,711,976 |
Series 2003-B1 Class B1, 4.5581% 2/17/09 (f) | | 15,470,000 | | 15,566,773 |
Capital Trust Ltd. Series 2004-1: | | | | |
Class A2, 3.88% 7/20/39 (c)(f) | | 2,968,000 | | 2,968,000 |
Asset-Backed Securities - continued |
| Principal Amount | | Value |
Capital Trust Ltd. Series 2004-1: - continued | | | | |
Class B, 4.18% 7/20/39 (c)(f) | | $ 1,550,000 | | $ 1,550,000 |
Class C, 4.53% 7/20/39 (c)(f) | | 1,994,000 | | 1,994,000 |
CDC Mortgage Capital Trust: | | | | |
Series 2001-HE1 Class M1, 4.49% 1/25/32 (f) | | 4,244,221 | | 4,254,278 |
Series 2002-HE2 Class M1, 4.16% 1/25/33 (f) | | 9,278,431 | | 9,309,123 |
Series 2002-HE3: | | | | |
Class M1, 4.56% 3/25/33 (f) | | 21,339,884 | | 21,627,815 |
Class M2, 5.71% 3/25/33 (f) | | 9,968,976 | | 10,143,974 |
Series 2003-HE1: | | | | |
Class M1, 4.36% 8/25/33 (f) | | 1,989,998 | | 1,997,574 |
Class M2, 5.41% 8/25/33 (f) | | 4,369,996 | | 4,422,084 |
Series 2003-HE2 Class A, 3.81% 10/25/33 (f) | | 1,634,377 | | 1,635,405 |
Series 2003-HE3: | | | | |
Class M1, 4.16% 11/25/33 (f) | | 2,254,989 | | 2,271,960 |
Class M2, 5.21% 11/25/33 (f) | | 1,719,992 | | 1,753,552 |
Series 2004-HE2 Class M2, 4.66% 7/26/34 (f) | | 2,345,000 | | 2,365,939 |
Chase Credit Card Owner Trust: | | | | |
Series 2001-6 Class B, 3.8681% 3/16/09 (f) | | 1,305,000 | | 1,311,169 |
Series 2002-6 Class B, 3.7381% 1/15/08 (f) | | 11,850,000 | | 11,852,472 |
Series 2004-1 Class B, 3.5881% 5/15/09 (f) | | 4,105,000 | | 4,104,204 |
Citibank Credit Card Issuance Trust: | | | | |
Series 2000-C2 Class C2, 4.2488% 10/15/07 (f) | | 17,500,000 | | 17,511,349 |
Series 2001-B2 Class B2, 3.8494% 12/10/08 (f) | | 11,945,000 | | 11,995,341 |
Series 2002-B1 Class B1, 3.8% 6/25/09 (f) | | 9,010,000 | | 9,038,878 |
Series 2002-C1 Class C1, 4.2185% 2/9/09 (f) | | 17,500,000 | | 17,686,918 |
Series 2003-B1 Class B1, 3.66% 3/7/08 (f) | | 25,000,000 | | 25,022,693 |
Series 2003-C1 Class C1, 4.65% 4/7/10 (f) | | 17,785,000 | | 18,152,159 |
Citigroup Mortgage Loan Trust Series 2003-HE4 Class A, 3.87% 12/25/33 (c)(f) | | 7,985,107 | | 7,985,935 |
CNH Wholesale Master Note Trust Series 2005-1: | | | | |
Class A, 3.43% 6/15/11 (f) | | 18,000,000 | | 18,000,000 |
Class B, 3.72% 6/15/11 (f) | | 2,280,000 | | 2,280,000 |
Countrywide Home Loans, Inc.: | | | | |
Series 2002-6 Class AV1, 3.89% 5/25/33 (f) | | 1,499,863 | | 1,503,470 |
Series 2003-BC1 Class M2, 5.46% 9/25/32 (f) | | 11,065,000 | | 11,199,451 |
Series 2003-SD3 Class A1, 3.88% 12/25/32 (c)(f) | | 927,188 | | 931,926 |
Series 2004-2 Class M1, 3.96% 5/25/34 (f) | | 5,200,000 | | 5,206,719 |
Series 2004-3: | | | | |
Class 3A4, 3.71% 8/25/34 (f) | | 530,752 | | 528,596 |
Class M1, 3.96% 6/25/34 (f) | | 1,475,000 | | 1,476,356 |
Series 2004-4: | | | | |
Class A, 3.83% 8/25/34 (f) | | 2,524,088 | | 2,526,278 |
Asset-Backed Securities - continued |
| Principal Amount | | Value |
Countrywide Home Loans, Inc.: - continued | | | | |
Series 2004-4: | | | | |
Class M1, 3.94% 7/25/34 (f) | | $ 3,650,000 | | $ 3,653,189 |
Class M2, 3.99% 6/25/34 (f) | | 4,395,000 | | 4,398,536 |
Series 2005-1: | | | | |
Class 1AV2, 3.66% 7/25/35 (f) | | 8,780,000 | | 8,775,114 |
Class M1, 3.88% 8/25/35 (f) | | 19,600,000 | | 19,563,654 |
Class MV1, 3.86% 7/25/35 (f) | | 3,135,000 | | 3,130,219 |
Class MV2, 3.9% 7/25/35 (f) | | 3,765,000 | | 3,754,147 |
Class MV3, 3.94% 7/25/35 (f) | | 1,560,000 | | 1,557,748 |
Series 2005-3 Class MV1, 3.88% 8/25/35 (f) | | 11,125,000 | | 11,103,934 |
Series 2005-AB1 Class A2, 3.67% 8/25/35 (f) | | 17,520,000 | | 17,514,797 |
Series 2005-IM1 Class A1, 3.56% 8/25/34 (d)(f) | | 17,915,000 | | 17,915,000 |
CS First Boston Mortgage Securities Corp.: | | | | |
Series 2003-8 Class A2, 3.85% 4/25/34 (f) | | 2,663,075 | | 2,674,762 |
Series 2004-FRE1: | | | | |
Class A2, 3.81% 4/25/34 (f) | | 2,689,397 | | 2,689,291 |
Class M3, 4.11% 4/25/34 (f) | | 5,885,000 | | 5,884,751 |
Discover Card Master Trust I Series 2003-4 Class B1, 3.7181% 5/16/11 (f) | | 8,155,000 | | 8,196,815 |
Fannie Mae guaranteed REMIC pass thru certificates Series 2004-T5 Class AB3, 3.8305% 5/28/35 (f) | | 6,957,460 | | 6,959,877 |
Fieldstone Mortgage Investment Corp.: | | | | |
Series 2003-1: | | | | |
Class M1, 4.14% 11/25/33 (f) | | 1,300,000 | | 1,308,748 |
Class M2, 5.21% 11/25/33 (f) | | 700,000 | | 718,600 |
Series 2004-1 Class M2, 4.56% 1/25/35 (f) | | 3,700,000 | | 3,741,581 |
Series 2004-2 Class M2, 4.61% 7/25/34 (f) | | 9,890,000 | | 9,889,579 |
Series 2004-3 Class M5, 4.91% 8/25/34 (f) | | 2,000,000 | | 2,033,830 |
Series 2005-2 Class 2A1, 3.5% 7/25/36 (d)(f) | | 16,935,000 | | 16,935,000 |
First Franklin Mortgage Loan Asset Backed Certificates: | | | | |
Series 2005-FF2 Class A2A, 3.55% 3/25/35 (f) | | 7,354,604 | | 7,354,604 |
Series 2005-FF2 Class M6, 4.16% 3/25/35 (f) | | 6,950,000 | | 6,950,000 |
First Franklin Mortgage Loan Trust Series 2004-FF2: | | | | |
Class M3, 4.01% 3/25/34 (f) | | 400,000 | | 400,711 |
Class M4, 4.36% 3/25/34 (f) | | 300,000 | | 302,647 |
First USA Credit Card Master Trust Series 2001-4 Class B, 3.75% 1/12/09 (f) | | 15,000,000 | | 15,026,199 |
First USA Secured Note Trust Series 2001-3 Class C, 4.4669% 11/19/08 (c)(f) | | 11,580,000 | | 11,661,421 |
Ford Credit Auto Owner Trust Series 2003-B Class B2, 3.8181% 10/15/07 (f) | | 19,600,000 | | 19,671,950 |
Asset-Backed Securities - continued |
| Principal Amount | | Value |
Ford Credit Floorplan Master Owner Trust Series 2005-1: | | | | |
Class A, 3.5381% 5/17/10 (f) | | $ 9,590,000 | | $ 9,589,981 |
Class B, 3.6563% 5/17/10 (f) | | 2,625,000 | | 2,624,992 |
Fremont Home Loan Trust: | | | | |
Series 2004-1: | | | | |
Class 1A1, 3.68% 2/25/34 (f) | | 2,669,337 | | 2,669,232 |
Class M1, 3.91% 2/25/34 (f) | | 750,000 | | 749,968 |
Class M2, 3.96% 2/25/34 (f) | | 800,000 | | 799,966 |
Series 2004-C Class 2A2, 4.01% 8/25/34 (f) | | 10,000,000 | | 10,101,993 |
Series 2005-2 Class 2A1, 3.5913% 6/25/35 (f) | | 15,380,000 | | 15,375,194 |
Series 2005-A: | | | | |
Class 2A2, 3.7% 2/25/35 (f) | | 11,850,000 | | 11,865,657 |
Class M1, 3.89% 1/25/35 (f) | | 1,603,000 | | 1,599,854 |
Class M2, 3.92% 1/25/35 (f) | | 2,325,000 | | 2,321,531 |
Class M3, 3.95% 1/25/35 (f) | | 1,250,000 | | 1,249,947 |
Class M4, 4.14% 1/25/35 (f) | | 925,000 | | 927,535 |
GE Business Loan Trust Series 2003-1 Class A, 3.8181% 4/15/31 (c)(f) | | 5,499,865 | | 5,531,421 |
GE Capital Credit Card Master Note Trust Series 2005-2 Class B, 3.5736% 6/15/11 (f) | | 6,475,000 | | 6,473,058 |
Gracechurch Card Funding PLC: | | | | |
Series 5: | | | | |
Class B, 3.6181% 8/15/08 (f) | | 1,520,000 | | 1,521,351 |
Class C, 4.3181% 8/15/08 (f) | | 5,580,000 | | 5,601,142 |
Series 6 Class B, 3.5781% 2/17/09 (f) | | 1,030,000 | | 1,030,901 |
Series 8 Class C, 3.6721% 6/15/10 (f) | | 18,450,000 | | 18,450,000 |
GSAMP Trust: | | | | |
Series 2002-HE Class M1, 4.68% 11/20/32 (f) | | 2,882,888 | | 2,928,737 |
Series 2002-NC1: | | | | |
Class A2, 3.78% 7/25/32 (f) | | 54,777 | | 55,099 |
Class M1, 4.1% 7/25/32 (f) | | 8,861,000 | | 8,920,491 |
Series 2003-FM1 Class M1, 4.25% 3/20/33 (f) | | 15,000,000 | | 15,136,310 |
Series 2004-FM1: | | | | |
Class M1, 4.11% 11/25/33 (f) | | 2,865,000 | | 2,864,879 |
Class M2, 4.86% 11/25/33 (f) | | 1,975,000 | | 2,005,597 |
Series 2004-FM2: | | | | |
Class M1, 3.96% 1/25/34 (f) | | 3,500,000 | | 3,499,853 |
Class M2, 4.56% 1/25/34 (f) | | 1,500,000 | | 1,499,936 |
Class M3, 4.76% 1/25/34 (f) | | 1,500,000 | | 1,499,935 |
Series 2004-HE1: | | | | |
Class M1, 4.01% 5/25/34 (f) | | 4,045,000 | | 4,044,829 |
Class M2, 4.61% 5/25/34 (f) | | 1,750,000 | | 1,766,258 |
Asset-Backed Securities - continued |
| Principal Amount | | Value |
GSAMP Trust: - continued | | | | |
Series 2005-9 Class 2A1, 3.5287% 8/25/35 (f) | | $ 17,530,000 | | $ 17,530,000 |
Series 2005-FF2 Class M5, 4.09% 3/25/35 (f) | | 3,500,000 | | 3,500,000 |
Series 2005-HE2 Class M, 3.89% 3/25/35 (f) | | 8,780,000 | | 8,749,867 |
Series 2005-NC1 Class M1, 3.91% 2/25/35 (f) | | 9,010,000 | | 8,987,296 |
Guggenheim Structured Real Estate Funding Ltd. Series 2005-1 Class C, 4.3944% 5/25/30 (c)(f) | | 14,000,000 | | 13,986,652 |
HFC Home Equity Loan Asset Backed Certificates Series 2005-2: | | | | |
Class M1, 3.97% 1/20/34 (f) | | 3,225,000 | | 3,225,000 |
Class M2, 4% 1/20/34 (f) | | 2,415,000 | | 2,415,000 |
Home Equity Asset Trust: | | | | |
Series 2002-2 Class M1, 4.26% 6/25/32 (f) | | 10,000,000 | | 10,017,090 |
Series 2002-3 Class A5, 3.9% 2/25/33 (f) | | 854,528 | | 855,194 |
Series 2002-4 Class A3, 3.94% 3/25/33 (f) | | 1,237,388 | | 1,238,074 |
Series 2002-5: | | | | |
Class A3, 3.98% 5/25/33 (f) | | 2,866,793 | | 2,872,821 |
Class M1, 4.66% 5/25/33 (f) | | 13,800,000 | | 13,966,276 |
Series 2003-1: | | | | |
Class A2, 3.93% 6/25/33 (f) | | 4,229,596 | | 4,233,111 |
Class M1, 4.46% 6/25/33 (f) | | 8,335,000 | | 8,375,317 |
Series 2003-2: | | | | |
Class A2, 3.84% 8/25/33 (f) | | 228,269 | | 229,139 |
Class M1, 4.34% 8/25/33 (f) | | 2,245,000 | | 2,269,298 |
Series 2003-3: | | | | |
Class A2, 3.82% 8/25/33 (f) | | 1,624,262 | | 1,630,339 |
Class M1, 4.32% 8/25/33 (f) | | 8,185,000 | | 8,266,814 |
Series 2003-4: | | | | |
Class M1, 4.26% 10/25/33 (f) | | 3,415,000 | | 3,440,384 |
Class M2, 5.36% 10/25/33 (f) | | 4,040,000 | | 4,093,038 |
Series 2003-5: | | | | |
Class A2, 3.81% 12/25/33 (f) | | 5,822,876 | | 5,843,440 |
Class M1, 4.16% 12/25/33 (f) | | 3,175,000 | | 3,192,660 |
Class M2, 5.19% 12/25/33 (f) | | 1,345,000 | | 1,377,487 |
Series 2003-7 Class A2, 3.84% 3/25/34 (f) | | 3,430,379 | | 3,438,503 |
Series 2004-2 Class A2, 3.75% 7/25/34 (f) | | 6,172,348 | | 6,172,139 |
Series 2004-3: | | | | |
Class M1, 4.03% 8/25/34 (f) | | 2,015,000 | | 2,019,636 |
Class M2, 4.66% 8/25/34 (f) | | 2,200,000 | | 2,237,373 |
Series 2004-4 Class A2, 3.78% 10/25/34 (f) | | 8,318,527 | | 8,347,783 |
Series 2004-6 Class A2, 3.81% 12/25/34 (f) | | 9,249,309 | | 9,278,715 |
Series 2004-7 Class A3, 3.85% 1/25/35 (f) | | 2,916,946 | | 2,929,856 |
Asset-Backed Securities - continued |
| Principal Amount | | Value |
Home Equity Asset Trust: - continued | | | | |
Series 2005-1: | | | | |
Class M1, 3.89% 5/25/35 (f) | | $ 9,705,000 | | $ 9,697,565 |
Class M2, 3.91% 5/25/35 (f) | | 5,780,000 | | 5,763,067 |
Class M3, 3.96% 5/25/35 (f) | | 5,825,000 | | 5,808,344 |
Series 2005-2: | | | | |
Class 2A2, 3.66% 7/25/35 (f) | | 13,170,000 | | 13,163,182 |
Class M1, 3.91% 7/25/35 (f) | | 10,085,000 | | 10,075,362 |
Series 2005-3 Class M1, 3.87% 8/25/35 (f) | | 9,450,000 | | 9,434,700 |
Series 2005-5 Class 2A2, 3.65% 11/25/35 (d)(f) | | 15,000,000 | | 14,968,605 |
Household Affinity Credit Card Master Note Trust I Series 2003-3 Class B, 3.6781% 8/15/08 (f) | | 10,000,000 | | 10,018,071 |
Household Credit Card Master Trust I Series 2002-1 Class B, 4.0381% 7/15/08 (f) | | 22,589,000 | | 22,608,682 |
Household Home Equity Loan Trust: | | | | |
Series 2002-2 Class A, 3.73% 4/20/32 (f) | | 3,295,048 | | 3,298,089 |
Series 2002-3 Class A, 3.88% 7/20/32 (f) | | 2,678,218 | | 2,681,775 |
Series 2003-1 Class M, 4.06% 10/20/32 (f) | | 770,987 | | 771,866 |
Series 2003-2: | | | | |
Class A, 3.76% 9/20/33 (f) | | 2,892,082 | | 2,897,777 |
Class M, 4.01% 9/20/33 (f) | | 1,360,000 | | 1,362,941 |
Series 2004-1 Class M, 3.95% 9/20/33 (f) | | 2,708,464 | | 2,713,597 |
Household Mortgage Loan Trust: | | | | |
Series 2003-HC1 Class M, 4.08% 2/20/33 (f) | | 1,742,776 | | 1,748,262 |
Series 2004-HC1: | | | | |
Class A, 3.78% 2/20/34 (f) | | 5,083,992 | | 5,096,702 |
Class M, 3.93% 2/20/34 (f) | | 3,073,800 | | 3,073,443 |
Household Private Label Credit Card Master Note Trust I: | | | | |
Series 2002-1 Class B, 3.9381% 1/18/11 (f) | | 8,850,000 | | 8,867,619 |
Series 2002-2: | | | | |
Class A, 3.5581% 1/18/11 (f) | | 9,000,000 | | 9,012,218 |
Class B, 3.9381% 1/18/11 (f) | | 14,275,000 | | 14,355,952 |
Series 2002-3 Class B, 4.6381% 9/15/09 (f) | | 4,150,000 | | 4,159,262 |
Ikon Receivables Funding LLC Series 2003-1 Class A3A, 3.6213% 12/17/07 (f) | | 2,781,207 | | 2,781,863 |
IXIS Real Estate Capital Trust Series 2005-HE1: | | | | |
Class A1, 3.71% 6/25/35 (f) | | 11,646,350 | | 11,645,706 |
Class M1, 3.93% 6/25/35 (f) | | 4,100,000 | | 4,094,813 |
Class M2, 3.95% 6/25/35 (f) | | 2,775,000 | | 2,766,003 |
Class M3, 3.98% 6/25/35 (f) | | 1,975,000 | | 1,972,566 |
Keycorp Student Loan Trust Series 1999-A Class A2, 3.8% 12/27/09 (f) | | 16,169,548 | | 16,224,493 |
Asset-Backed Securities - continued |
| Principal Amount | | Value |
Long Beach Mortgage Loan Trust: | | | | |
Series 2003-2: | | | | |
Class AV, 3.78% 6/25/33 (f) | | $ 253,078 | | $ 253,185 |
Class M1, 4.28% 6/25/33 (f) | | 19,500,000 | | 19,626,153 |
Series 2003-3 Class M1, 4.21% 7/25/33 (f) | | 7,770,000 | | 7,824,625 |
Series 2004-2: | | | | |
Class M1, 3.99% 6/25/34 (f) | | 4,275,000 | | 4,285,404 |
Class M2, 4.54% 6/25/34 (f) | | 1,400,000 | | 1,416,723 |
Series 2005-2 Class 2A2, 3.64% 4/25/35 (f) | | 12,000,000 | | 11,996,998 |
MASTR Asset Backed Securities Trust: | | | | |
Series 2003-NC1: | | | | |
Class M1, 4.19% 4/25/33 (f) | | 3,500,000 | | 3,519,270 |
Class M2, 5.31% 4/25/33 (f) | | 1,500,000 | | 1,534,429 |
Series 2004-FRE1 Class M1, 4.01% 7/25/34 (f) | | 5,223,000 | | 5,238,948 |
MBNA Asset Backed Note Trust Series 2000-K Class C, 4.1881% 3/17/08 (c)(f) | | 7,250,000 | | 7,258,700 |
MBNA Credit Card Master Note Trust: | | | | |
Series 2001-B1 Class B1, 3.7631% 10/15/08 (f) | | 30,000,000 | | 30,042,072 |
Series 2001-B2 Class B2, 3.7481% 1/15/09 (f) | | 30,353,000 | | 30,429,933 |
Series 2002-B2 Class B2, 3.7681% 10/15/09 (f) | | 20,000,000 | | 20,086,600 |
Series 2002-B3 Class B3, 3.7881% 1/15/08 (f) | | 15,000,000 | | 15,000,470 |
Series 2002-B4 Class B4, 3.8881% 3/15/10 (f) | | 14,800,000 | | 14,916,873 |
Series 2003-B2 Class B2, 3.7781% 10/15/10 (f) | | 1,530,000 | | 1,545,569 |
Series 2003-B3 Class B3, 3.7631% 1/18/11 (f) | | 1,130,000 | | 1,135,362 |
Series 2003-B5 Class B5, 3.7581% 2/15/11 (f) | | 705,000 | | 710,447 |
MBNA Master Credit Card Trust II: | | | | |
Series 1998-E Class B, 3.9288% 9/15/10 (f) | | 7,800,000 | | 7,846,570 |
Series 1998-G Class B, 3.7881% 2/17/09 (f) | | 20,000,000 | | 20,043,574 |
Meritage Mortgage Loan Trust Series 2004-1: | | | | |
Class M1, 3.96% 7/25/34 (f) | | 2,125,000 | | 2,124,911 |
Class M2, 4.01% 7/25/34 (f) | | 375,000 | | 374,985 |
Class M3, 4.41% 7/25/34 (f) | | 775,000 | | 774,967 |
Class M4, 4.56% 7/25/34 (f) | | 525,000 | | 524,978 |
Merrill Lynch Mortgage Investors, Inc. Series 2003-HE1 Class M1, 4.16% 7/25/34 (f) | | 2,321,000 | | 2,330,928 |
Morgan Stanley ABS Capital I, Inc.: | | | | |
Series 2002-NC6 Class M2, 5.56% 11/25/32 (f) | | 2,370,000 | | 2,441,680 |
Series 2003-NC5 Class M2, 5.46% 4/25/33 (f) | | 2,800,000 | | 2,834,138 |
Series 2003-NC6 Class M2, 5.41% 6/27/33 (f) | | 12,835,000 | | 13,180,825 |
Series 2003-NC7 Class M1, 4.16% 6/25/33 (f) | | 1,785,000 | | 1,791,357 |
Series 2003-NC8 Class M1, 4.16% 9/25/33 (f) | | 2,350,000 | | 2,363,472 |
Series 2004-HE6 Class A2, 3.8% 8/25/34 (f) | | 7,193,690 | | 7,217,222 |
Series 2004-NC2 Class M1, 4.01% 12/25/33 (f) | | 2,595,000 | | 2,599,359 |
Asset-Backed Securities - continued |
| Principal Amount | | Value |
Morgan Stanley ABS Capital I, Inc.: - continued | | | | |
Series 2004-NC6 Class A2, 3.8% 7/25/34 (f) | | $ 3,163,358 | | $ 3,170,145 |
Series 2005-1: | | | | |
Class M2, 3.93% 12/25/34 (f) | | 4,425,000 | | 4,417,835 |
Class M3, 3.98% 12/25/34 (f) | | 4,000,000 | | 3,998,266 |
Series 2005-HE1: | | | | |
Class A3B, 3.68% 12/25/34 (f) | | 3,885,000 | | 3,889,266 |
Class M1, 3.91% 12/25/34 (f) | | 1,100,000 | | 1,102,253 |
Class M2, 3.93% 12/25/34 (f) | | 2,970,000 | | 2,966,369 |
Series 2005-HE2: | | | | |
Class M1, 3.86% 1/25/35 (f) | | 2,665,000 | | 2,670,502 |
Class M2, 3.9% 1/25/35 (f) | | 1,900,000 | | 1,893,810 |
Series 2005-NC1: | | | | |
Class M1, 3.9% 1/25/35 (f) | | 2,425,000 | | 2,432,731 |
Class M2, 3.93% 1/25/35 (f) | | 2,425,000 | | 2,421,056 |
Class M3, 3.97% 1/25/35 (f) | | 2,425,000 | | 2,425,850 |
Morgan Stanley Dean Witter Capital I Trust: | | | | |
Series 2001-AM1: | | | | |
Class M1, 4.31% 2/25/32 (f) | | 1,510,288 | | 1,513,954 |
Class M2, 4.86% 2/25/32 (f) | | 7,146,795 | | 7,171,201 |
Series 2001-NC4: | | | | |
Class M1, 4.46% 1/25/32 (f) | | 3,827,881 | | 3,841,816 |
Series 2002-AM3 Class A3, 3.95% 2/25/33 (f) | | 1,426,624 | | 1,430,581 |
Series 2002-HE1 Class M1, 4.06% 7/25/32 (f) | | 5,860,000 | | 5,893,149 |
Series 2002-HE2 Class M1, 4.16% 8/25/32 (f) | | 9,925,000 | | 9,970,606 |
Series 2002-NC3 Class A3, 3.8% 8/25/32 (f) | | 396,299 | | 397,573 |
Series 2002-OP1 Class M1, 4.21% 9/25/32 (f) | | 3,894,745 | | 3,917,849 |
Series 2003-NC1: | | | | |
Class M1, 4.51% 11/25/32 (f) | | 2,555,000 | | 2,572,380 |
Class M2, 5.51% 11/25/32 (f) | | 1,880,000 | | 1,899,041 |
New Century Home Equity Loan Trust: | | | | |
Series 2003-2: | | | | |
Class A2, 3.89% 1/25/33 (f) | | 341,254 | | 341,436 |
Class M2, 5.46% 1/25/33 (f) | | 4,600,000 | | 4,667,174 |
Series 2003-6 Class M1, 4.18% 1/25/34 (f) | | 5,180,000 | | 5,202,952 |
Series 2005-1: | | | | |
Class M1, 3.91% 3/25/35 (f) | | 4,395,000 | | 4,392,950 |
Class M2, 3.94% 3/25/35 (f) | | 4,395,000 | | 4,384,834 |
Class M3, 3.98% 3/25/35 (f) | | 2,120,000 | | 2,120,796 |
Nissan Auto Lease Trust: | | | | |
Series 2003-A Class A3A, 3.5281% 6/15/09 (f) | | 13,621,752 | | 13,633,434 |
Series 2004-A Class A4A, 3.4581% 6/15/10 (f) | | 10,570,000 | | 10,582,978 |
Asset-Backed Securities - continued |
| Principal Amount | | Value |
NovaStar Home Equity Loan Series 2004-1: | | | | |
Class M1, 3.91% 6/25/34 (f) | | $ 1,450,000 | | $ 1,451,222 |
Class M4, 4.435% 6/25/34 (f) | | 2,435,000 | | 2,439,150 |
Ocala Funding LLC Series 2005-1A Class A, 4.93% 3/20/10 (c)(f) | | 3,675,000 | | 3,675,000 |
Ownit Mortgage Loan Asste-Backed Certificates Series 2005-3 Class A2A, 3.5% 6/25/36 (f) | | 15,500,000 | | 15,500,000 |
Park Place Securities, Inc.: | | | | |
Series 2004-WCW1: | | | | |
Class M1, 4.09% 9/25/34 (f) | | 3,745,000 | | 3,756,721 |
Class M2, 4.14% 9/25/34 (f) | | 1,755,000 | | 1,764,326 |
Class M3, 4.71% 9/25/34 (f) | | 3,355,000 | | 3,396,745 |
Class M4, 4.91% 9/25/34 (f) | | 4,700,000 | | 4,767,614 |
Series 2004-WCW2 Class A2, 3.84% 10/25/34 (f) | | 7,952,623 | | 7,976,111 |
Series 2005-WCH1: | | | | |
Class A3B, 3.68% 1/25/35 (f) | | 2,775,000 | | 2,779,908 |
Class M2, 3.98% 1/25/35 (f) | | 4,175,000 | | 4,166,539 |
Class M3, 4.02% 1/25/35 (f) | | 3,290,000 | | 3,292,599 |
Class M5, 4.34% 1/25/35 (f) | | 3,095,000 | | 3,104,620 |
Series 2005-WHQ2 Class M7, 4.71% 5/25/35 (f) | | 5,950,000 | | 5,930,787 |
People's Choice Home Loan Securities Trust Series 2005-2: | | | | |
Class A1, 3.57% 9/25/24 (f) | | 7,475,790 | | 7,475,790 |
Class M4, 4.09% 5/25/35 (f) | | 6,000,000 | | 6,000,000 |
Providian Gateway Master Trust Series 2002-B Class A, 4.0881% 6/15/09 (c)(f) | | 15,000,000 | | 15,039,393 |
Residental Asset Securities Corp.: | | | | |
Series 2005-KS4 Class M2, 4.04% 4/25/35 (f) | | 1,040,000 | | 1,037,610 |
Series 2005-KS7 Class A1, 3.4781% 8/25/35 (f) | | 10,515,000 | | 10,512,897 |
Residential Asset Mortgage Products, Inc. Series 2004-RS10 Class MII2, 4.71% 10/25/34 (f) | | 5,500,000 | | 5,566,857 |
Salomon Brothers Mortgage Securities VII, Inc. Series 2003-HE1 Class A, 3.86% 4/25/33 (f) | | 818,316 | | 822,076 |
Saxon Asset Securities Trust: | | | | |
Series 2004-1 Class M1, 3.99% 3/25/35 (f) | | 4,415,000 | | 4,413,887 |
Series 2004-2 Class MV1, 4.04% 8/25/35 (f) | | 4,495,000 | | 4,501,043 |
Sears Credit Account Master Trust II: | | | | |
Series 2001-1 Class B, 3.8131% 2/15/10 (f) | | 10,000,000 | | 9,987,143 |
Series 2002-4: | | | | |
Class A, 3.5181% 8/18/09 (f) | | 27,000,000 | | 26,999,603 |
Class B, 3.8131% 8/18/09 (f) | | 33,300,000 | | 33,301,149 |
Series 2002-5 Class B, 4.6381% 11/17/09 (f) | | 30,000,000 | | 30,062,976 |
Asset-Backed Securities - continued |
| Principal Amount | | Value |
Securitized Asset Backed Receivables LLC Trust Series 2004-NC1 Class M1, 3.98% 2/25/34 (f) | | $ 2,910,000 | | $ 2,909,256 |
Specialty Underwriting & Residential Finance Series 2003-BC4 Class M1, 4.06% 11/25/34 (f) | | 1,810,000 | | 1,818,452 |
Structured Asset Securities Corp. Series 2004-GEL1 Class A, 3.82% 2/25/34 (f) | | 1,043,424 | | 1,043,422 |
Superior Wholesale Inventory Financing Trust VII Series 2003-A8 Class CTFS, 3.8381% 3/15/11 (c)(f) | | 10,835,000 | | 10,828,228 |
Superior Wholesale Inventory Financing Trust XII Series 2005-A12 Class C, 4.46% 6/15/10 (f) | | 6,840,000 | | 6,839,945 |
Terwin Mortgage Trust: | | | | |
Series 2003-4HE Class A1, 3.89% 9/25/34 (f) | | 2,878,990 | | 2,894,593 |
Series 2003-6HE Class A1, 3.93% 11/25/33 (f) | | 1,784,384 | | 1,788,543 |
Series 2005-14HE Class AF1, 3.9753% 7/25/36 (d)(f) | | 8,635,000 | | 8,633,296 |
TOTAL ASSET-BACKED SECURITIES (Cost $2,293,954,229) | 2,300,747,332 |
Collateralized Mortgage Obligations - 16.9% |
|
Private Sponsor - 13.7% |
Adjustable Rate Mortgage Trust floater: | | | | |
Series 2004-2 Class 7A3, 3.86% 2/25/35 (f) | | 9,374,471 | | 9,396,037 |
Series 2004-4 Class 5A2, 3.86% 3/25/35 (f) | | 3,780,419 | | 3,787,953 |
Series 2005-1 Class 5A2, 3.79% 5/25/35 (f) | | 6,187,250 | | 6,191,166 |
Series 2005-2: | | | | |
Class 6A2, 3.74% 6/25/35 (f) | | 2,930,592 | | 2,932,491 |
Class 6M2, 3.94% 6/25/35 (f) | | 10,145,000 | | 10,145,010 |
Series 2005-3 Class 8A2, 3.7% 7/25/35 (f) | | 19,199,197 | | 19,211,695 |
Series 2005-4 Class 7A2, 3.69% 8/25/35 (f) | | 9,011,457 | | 9,003,527 |
Series 2005-8 Class 7A2, 3.77% 11/25/35 (f) | | 7,660,000 | | 7,660,000 |
Bear Stearns Alt-A Trust floater: | | | | |
Series 2005-1 Class A1, 3.74% 1/25/35 (f) | | 20,354,186 | | 20,354,186 |
Series 2005-2 Class 1A1, 3.71% 3/25/35 (f) | | 14,961,065 | | 14,961,065 |
Series 2005-5 Class 1A1, 3.68% 7/25/35 (f) | | 18,707,862 | | 18,696,170 |
Countrywide Alternative Loan Trust planned amortization class Series 2003-5T2 Class A2, 3.86% 5/25/33 (f) | | 5,545,033 | | 5,548,017 |
Countrywide Home Loans, Inc. floater: | | | | |
Series 2004-16 Class A1, 3.86% 9/25/34 (f) | | 10,335,456 | | 10,325,843 |
Series 2005-1 Class 2A1, 3.75% 3/25/35 (f) | | 14,617,171 | | 14,617,171 |
CS First Boston Mortgage Securities Corp. floater: | | | | |
Series 2004-AR2 Class 6A1, 3.86% 3/25/34 (f) | | 5,338,263 | | 5,334,945 |
Collateralized Mortgage Obligations - continued |
| Principal Amount | | Value |
Private Sponsor - continued |
CS First Boston Mortgage Securities Corp. floater: - continued | | | | |
Series 2004-AR3 Class 6A2, 3.83% 4/25/34 (f) | | $ 2,226,193 | | $ 2,228,162 |
Series 2004-AR4 Class 5A2, 3.83% 5/25/34 (f) | | 2,066,310 | | 2,065,052 |
Series 2004-AR5 Class 11A2, 3.83% 6/25/34 (f) | | 2,987,552 | | 2,981,472 |
Series 2004-AR6 Class 9A2, 3.83% 10/25/34 (f) | | 3,981,028 | | 3,983,412 |
Series 2004-AR7 Class 6A2, 3.84% 8/25/34 (f) | | 5,801,660 | | 5,806,785 |
Series 2004-AR8 Class 8A2, 3.84% 9/25/34 (f) | | 4,630,225 | | 4,638,807 |
First Horizon Mortgage Passthru Trust floater Series 2004-FL1 Class 2A1, 3.95% 12/25/34 (f) | | 4,384,853 | | 4,379,779 |
Granite Master Issuer PLC floater: | | | | |
Series 2005-1: | | | | |
Class A3, 3.51% 12/21/24 (f) | | 5,300,000 | | 5,299,006 |
Class B1, 3.56% 12/20/54 (f) | | 7,050,000 | | 7,047,577 |
Class M1, 3.66% 12/20/54 (f) | | 5,300,000 | | 5,298,178 |
Series 2005-2 Class C1, 3.7857% 12/20/54 (f) | | 7,975,000 | | 7,972,508 |
Granite Mortgages PLC floater: | | | | |
Series 2004-1: | | | | |
Class 1B, 3.64% 3/20/44 (f) | | 1,415,000 | | 1,414,844 |
Class 1C, 4.33% 3/20/44 (f) | | 4,075,000 | | 4,091,219 |
Class 1M, 3.84% 3/20/44 (f) | | 4,935,000 | | 4,938,751 |
Series 2004-2: | | | | |
Class 1A2, 3.5% 6/20/28 (f) | | 5,384,259 | | 5,384,932 |
Class 1B, 3.6% 6/20/44 (f) | | 1,018,055 | | 1,018,309 |
Class 1C, 4.13% 6/20/44 (f) | | 3,706,295 | | 3,713,918 |
Class 1M, 3.71% 6/20/44 (f) | | 2,722,846 | | 2,724,205 |
Series 2004-3: | | | | |
Class 1B, 3.59% 9/20/44 (f) | | 2,100,000 | | 2,100,210 |
Class 1C, 4.02% 9/20/44 (f) | | 5,415,000 | | 5,426,913 |
Class 1M, 3.7% 9/20/44 (f) | | 1,200,000 | | 1,200,360 |
Harborview Mortgage Loan Trust floater Series 2005-2 Class 2A1A, 3.6369% 5/19/35 (f) | | 11,690,145 | | 11,648,134 |
Holmes Financing No. 7 PLC floater Series 2 Class M, 4.3988% 7/15/40 (f) | | 2,560,000 | | 2,564,912 |
Holmes Financing No. 8 PLC floater Series 2: | | | | |
Class A, 3.6788% 4/15/11 (f) | | 25,000,000 | | 25,000,000 |
Class B, 3.7688% 7/15/40 (f) | | 2,695,000 | | 2,696,684 |
Class C, 4.3188% 7/15/40 (f) | | 10,280,000 | | 10,328,193 |
Home Equity Asset Trust floater Series 2005-3 Class 2A1, 3.55% 8/25/35 (f) | | 7,268,025 | | 7,266,230 |
Homestar Mortgage Acceptance Corp. floater Series 2004-5 Class A1, 3.91% 10/25/34 (f) | | 4,495,430 | | 4,509,337 |
Collateralized Mortgage Obligations - continued |
| Principal Amount | | Value |
Private Sponsor - continued |
Impac CMB Trust floater: | | | | |
Series 2004-11 Class 2A2, 3.83% 3/25/35 (f) | | $ 8,638,669 | | $ 8,636,982 |
Series 2004-6 Class 1A2, 3.85% 10/25/34 (f) | | 3,481,529 | | 3,487,748 |
Series 2005-1: | | | | |
Class M1, 3.92% 4/25/35 (f) | | 3,223,929 | | 3,220,529 |
Class M2, 3.96% 4/25/35 (f) | | 5,644,146 | | 5,639,516 |
Class M3, 3.99% 4/25/35 (f) | | 1,384,927 | | 1,383,466 |
Class M4, 4.21% 4/25/35 (f) | | 817,334 | | 818,164 |
Class M5, 4.23% 4/25/35 (f) | | 817,334 | | 817,174 |
Class M6, 4.28% 4/25/35 (f) | | 1,307,734 | | 1,307,479 |
Series 2005-2 Class 1A2, 3.77% 4/25/35 (f) | | 13,211,515 | | 13,201,194 |
Series 2005-3 Class A1, 3.7% 8/25/35 (f) | | 15,176,045 | | 15,149,962 |
Series 2005-4 Class 1B1, 4.76% 6/25/35 (f) | | 5,306,886 | | 5,282,839 |
Lehman Structured Securities Corp. floater Series 2005-1 Class A2, 3.67% 9/26/45 (c)(f) | | 16,153,164 | | 16,153,164 |
MASTR Adjustable Rate Mortgages Trust: | | | | |
floater Series 2005-1 Class 1A1, 3.73% 3/25/35 (f) | | 13,405,372 | | 13,396,993 |
Series 2004-6 Class 4A2, 4.1729% 7/25/34 (f) | | 5,969,000 | | 5,946,582 |
Merrill Lynch Mortgage Investors, Inc. floater: | | | | |
Series 2003-A Class 2A1, 3.85% 3/25/28 (f) | | 8,079,308 | | 8,122,924 |
Series 2003-B Class A1, 3.8% 4/25/28 (f) | | 7,852,610 | | 7,898,403 |
Series 2003-D Class A, 3.77% 8/25/28 (f) | | 7,479,616 | | 7,494,804 |
Series 2003-E Class A2, 3.4425% 10/25/28 (f) | | 10,687,128 | | 10,687,143 |
Series 2003-F Class A2, 3.7075% 10/25/28 (f) | | 12,892,959 | | 12,891,486 |
Series 2004-A Class A2, 3.6175% 4/25/29 (f) | | 11,584,437 | | 11,556,917 |
Series 2004-B Class A2, 3.79% 6/25/29 (f) | | 8,952,030 | | 8,930,464 |
Series 2004-C Class A2, 3.95% 7/25/29 (f) | | 12,856,157 | | 12,825,407 |
Series 2004-D Class A2, 3.4725% 9/25/29 (f) | | 9,971,432 | | 9,974,033 |
Series 2004-E: | | | | |
Class A2B, 3.7275% 11/25/29 (f) | | 8,523,921 | | 8,502,874 |
Class A2D, 3.9175% 11/25/29 (f) | | 1,982,307 | | 1,991,830 |
Series 2004-G Class A2, 3.95% 11/25/29 (f) | | 3,854,828 | | 3,854,422 |
Series 2005-A Class A2, 3.38% 2/25/30 (f) | | 10,800,867 | | 10,785,319 |
Mortgage Asset Backed Securities Trust floater Series 2002-NC1 Class M1, 4.31% 10/25/32 (f) | | 4,538,551 | | 4,555,535 |
MortgageIT Trust floater: | | | | |
Series 2004-2: | | | | |
Class A1, 3.83% 12/25/34 (f) | | 4,920,628 | | 4,927,758 |
Class A2, 3.91% 12/25/34 (f) | | 6,656,800 | | 6,696,298 |
Series 2005-2 Class 1A1, 3.72% 5/25/35 (f) | | 5,093,718 | | 5,097,498 |
Opteum Mortgage Acceptance Corp. floater Series 2005-3 Class APT, 3.75% 6/25/35 (f) | | 19,112,336 | | 19,123,533 |
Collateralized Mortgage Obligations - continued |
| Principal Amount | | Value |
Private Sponsor - continued |
Permanent Financing No. 1 PLC floater Series 1 Class 2C, 4.5594% 6/10/42 (f) | | $ 1,745,000 | | $ 1,749,384 |
Permanent Financing No. 3 PLC floater Series 2 Class C, 4.4294% 6/10/42 (f) | | 4,845,000 | | 4,893,450 |
Permanent Financing No. 4 PLC floater Series 2 Class C, 4.0994% 6/10/42 (f) | | 15,400,000 | | 15,475,306 |
Permanent Financing No. 5 PLC floater: | | | | |
Series 2 Class C, 4.0294% 6/10/42 (f) | | 4,215,000 | | 4,234,760 |
Series 3 Class C, 4.1994% 6/10/42 (f) | | 8,890,000 | | 8,967,788 |
Permanent Financing No. 6 PLC floater Series 6: | | | | |
Class 1C, 3.7294% 6/10/42 (f) | | 4,000,000 | | 4,000,572 |
Class 2C, 3.8294% 6/10/42 (f) | | 5,350,000 | | 5,352,343 |
Permanent Financing No. 7 PLC floater Series 7: | | | | |
Class 1B, 3.4694% 6/10/42 (f) | | 2,000,000 | | 1,999,375 |
Class 1C, 3.6594% 6/10/42 (f) | | 3,840,000 | | 3,838,800 |
Class 2C, 3.7094% 6/10/42 (f) | | 8,065,000 | | 8,054,919 |
Permanent Financing No. 8 PLC floater Series 8: | | | | |
Class 1C, 3.7475% 6/10/42 (f) | | 7,165,000 | | 7,162,621 |
Class 2C, 3.8175% 6/10/42 (f) | | 9,945,000 | | 9,941,688 |
Residential Asset Mortgage Products, Inc. sequential pay Series 2003-SL1 Class A31, 7.125% 4/25/31 | | 4,643,507 | | 4,727,342 |
Residential Finance LP/Residential Finance Development Corp. floater Series 2003-A: | | | | |
Class B4, 5.15% 3/10/35 (c)(f) | | 5,492,986 | | 5,575,381 |
Class B5, 5.7% 3/10/35 (c)(f) | | 5,684,725 | | 5,811,417 |
Residential Funding Securities Corp.: | | | | |
Series 2003-RP1 Class A1, 3.96% 11/25/34 (f) | | 2,829,110 | | 2,840,739 |
Series 2003-RP2 Class A1, 3.93% 6/25/33 (c)(f) | | 3,866,185 | | 3,881,108 |
Sequoia Mortgage Trust floater: | | | | |
Series 2003-5 Class A2, 3.41% 9/20/33 (f) | | 10,999,101 | | 10,996,236 |
Series 2003-7 Class A2, 2.885% 1/20/34 (f) | | 9,577,708 | | 9,569,385 |
Series 2004-1 Class A, 4.15% 2/20/34 (f) | | 6,379,791 | | 6,373,993 |
Series 2004-10 Class A4, 3.6681% 11/20/34 (f) | | 10,424,803 | | 10,408,138 |
Series 2004-3 Class A, 3.5463% 5/20/34 (f) | | 10,662,486 | | 10,588,333 |
Series 2004-4 Class A, 3.5881% 5/20/34 (f) | | 13,430,919 | | 13,399,990 |
Series 2004-5 Class A3, 3.77% 6/20/34 (f) | | 8,904,038 | | 8,897,082 |
Series 2004-6: | | | | |
Class A3A, 4.1475% 6/20/35 (f) | | 8,182,127 | | 8,176,739 |
Class A3B, 3.16% 7/20/34 (f) | | 1,022,766 | | 1,021,950 |
Series 2004-7: | | | | |
Class A3A, 3.2275% 8/20/34 (f) | | 7,642,675 | | 7,636,475 |
Class A3B, 3.4525% 7/20/34 (f) | | 1,375,260 | | 1,380,167 |
Collateralized Mortgage Obligations - continued |
| Principal Amount | | Value |
Private Sponsor - continued |
Sequoia Mortgage Trust floater: - continued | | | | |
Series 2004-8 Class A2, 3.45% 9/20/34 (f) | | $ 14,155,710 | | $ 14,148,404 |
Series 2005-1 Class A2, 3.68% 2/20/35 (f) | | 7,355,282 | | 7,354,362 |
Series 2005-2 Class A2, 3.36% 3/20/35 (f) | | 13,876,523 | | 13,876,523 |
Series 2005-3 Class A1, 3.46% 5/20/35 (f) | | 9,217,677 | | 9,217,677 |
Structured Adjustable Rate Mortgage Loan Trust floater Series 2001-14 Class A1, 3.77% 7/25/35 (f) | | 11,201,095 | | 11,201,095 |
Structured Asset Securities Corp. floater Series 2004-NP1 Class A, 3.86% 9/25/33 (c)(f) | | 2,553,470 | | 2,555,084 |
Thornburg Mortgage Securities Trust floater Series 2004-3 Class A, 3.83% 9/25/34 (f) | | 22,068,069 | | 22,129,394 |
WAMU Mortgage pass thru certificates: | | | | |
floater Series 2005-AR6 Class 2A-1A, 3.5448% 4/25/45 (f) | | 6,133,307 | | 6,133,607 |
Series 2005 AR11 Class A1C1, 3.6675% 8/25/40 (d)(f) | | 14,400,000 | | 14,400,000 |
Wells Fargo Mortgage Backed Securities Trust: | | | | |
Series 2004-M Class A3, 4.7024% 8/25/34 (f) | | 19,880,000 | | 19,789,156 |
Series 2005-AR12 Class 2A1, 4.322% 7/25/35 (f) | | 31,674,772 | | 31,407,532 |
TOTAL PRIVATE SPONSOR | | 895,419,920 |
U.S. Government Agency - 3.2% |
Fannie Mae: | | | | |
floater: | | | | |
Series 2000-38 Class F, 3.76% 11/18/30 (f) | | 1,103,802 | | 1,112,055 |
Series 2000-40 Class FA, 3.8144% 7/25/30 (f) | | 2,487,156 | | 2,498,099 |
Series 2002-89 Class F, 3.6144% 1/25/33 (f) | | 3,630,895 | | 3,636,484 |
target amortization class Series G94-2 Class D, 6.45% 1/25/24 | | 4,732,822 | | 4,849,182 |
Fannie Mae guaranteed REMIC pass thru certificates: | | | | |
floater: | | | | |
Series 2001-34 Class FR, 3.66% 8/18/31 (f) | | 2,500,934 | | 2,508,899 |
Series 2001-44 Class FB, 3.6144% 9/25/31 (f) | | 2,262,040 | | 2,268,738 |
Series 2001-46 Class F, 3.66% 9/18/31 (f) | | 6,514,676 | | 6,552,090 |
Series 2002-11 Class QF, 3.8144% 3/25/32 (f) | | 4,517,951 | | 4,551,812 |
Series 2002-36 Class FT, 3.8144% 6/25/32 (f) | | 1,503,724 | | 1,516,521 |
Series 2002-64 Class FE, 3.61% 10/18/32 (f) | | 2,256,514 | | 2,266,981 |
Series 2002-65 Class FA, 3.6144% 10/25/17 (f) | | 2,585,370 | | 2,590,545 |
Series 2002-74 Class FV, 3.7644% 11/25/32 (f) | | 8,360,131 | | 8,420,920 |
Series 2003-11: | | | | |
Class DF, 3.7644% 2/25/33 (f) | | 3,173,455 | | 3,195,574 |
Class EF, 3.7644% 2/25/33 (f) | | 2,602,157 | | 2,612,658 |
Collateralized Mortgage Obligations - continued |
| Principal Amount | | Value |
U.S. Government Agency - continued |
Fannie Mae guaranteed REMIC pass thru certificates: - continued | | | | |
floater: | | | | |
Series 2003-63 Class F1, 3.6144% 11/25/27 (f) | | $ 6,387,368 | | $ 6,390,916 |
planned amortization class: | | | | |
Series 1998-63 Class PG, 6% 3/25/27 | | 1,212,661 | | 1,212,198 |
Series 2001-62 Class PG, 6.5% 10/25/30 | | 4,183,652 | | 4,194,964 |
Series 2001-76 Class UB, 5.5% 10/25/13 | | 1,378,221 | | 1,379,002 |
Series 2002-16 Class QD, 5.5% 6/25/14 | | 345,479 | | 346,552 |
Series 2002-28 Class PJ, 6.5% 3/25/31 | | 4,950,777 | | 4,957,813 |
Series 2002-8 Class PD, 6.5% 7/25/30 | | 3,569,878 | | 3,584,870 |
Freddie Mac: | | | | |
floater Series 2510 Class FE, 3.7881% 10/15/32 (f) | | 5,998,150 | | 6,032,418 |
planned amortization class: | | | | |
Series 2091 Class PP, 6% 2/15/27 | | 1,286,641 | | 1,286,029 |
Series 2353 Class PC, 6.5% 9/15/15 | | 1,363,169 | | 1,366,992 |
Freddie Mac Manufactured Housing participation certificates guaranteed floater Series 2338 Class FJ, 3.5881% 7/15/31 (f) | | 5,197,631 | | 5,199,968 |
Freddie Mac Multi-class participation certificates guaranteed: | | | | |
floater: | | | | |
Series 2474 Class FJ, 3.7381% 7/15/17 (f) | | 4,556,922 | | 4,564,198 |
Series 2526 Class FC, 3.7881% 11/15/32 (f) | | 3,597,778 | | 3,616,182 |
Series 2538 Class FB, 3.7881% 12/15/32 (f) | | 6,607,741 | | 6,651,155 |
Series 2551 Class FH, 3.8381% 1/15/33 (f) | | 3,358,821 | | 3,373,027 |
planned amortization class: | | | | |
Series 2136 Class PE, 6% 1/15/28 | | 12,190,349 | | 12,248,248 |
Series 2394 Class ND, 6% 6/15/27 | | 1,550,172 | | 1,553,415 |
Series 2395 Class PE, 6% 2/15/30 | | 5,961,413 | | 6,000,327 |
Series 2398 Class DK, 6.5% 1/15/31 | | 372,760 | | 373,347 |
Series 2410 Class ML, 6.5% 12/15/30 | | 2,168,673 | | 2,179,211 |
Series 2420 Class BE, 6.5% 12/15/30 | | 2,595,889 | | 2,604,122 |
Series 2443 Class TD, 6.5% 10/15/30 | | 2,962,497 | | 2,977,827 |
Series 2461 Class PG, 6.5% 1/15/31 | | 2,737,118 | | 2,773,721 |
Series 2466 Class EC, 6% 10/15/27 | | 257,483 | | 257,163 |
Series 2483 Class DC, 5.5% 7/15/14 | | 1,861,588 | | 1,861,466 |
Series 2556 Class PM, 5.5% 2/15/16 | | 1,160,963 | | 1,159,984 |
Series 2776 Class UJ, 4.5% 5/15/20 (g) | | 7,104,375 | | 367,384 |
Series 2828 Class JA, 4.5% 1/15/10 | | 11,880,000 | | 11,903,044 |
sequential pay: | | | | |
Series 2430 Class ZE, 6.5% 8/15/27 | | 648,803 | | 649,120 |
Series 2480 Class QW, 5.75% 2/15/30 | | 871,905 | | 871,370 |
Collateralized Mortgage Obligations - continued |
| Principal Amount | | Value |
U.S. Government Agency - continued |
Freddie Mac Multi-class participation certificates guaranteed: - continued | | | | |
Series 2406: | | | | |
Class FP, 4.3681% 1/15/32 (f) | | $ 10,270,000 | | $ 10,502,819 |
Class PF, 4.3681% 12/15/31 (f) | | 8,125,000 | | 8,337,955 |
Series 2410 Class PF, 4.3681% 2/15/32 (f) | | 18,644,444 | | 19,070,154 |
Ginnie Mae guaranteed REMIC pass thru securities floater: | | | | |
Series 2001-46 Class FB, 3.7381% 5/16/23 (f) | | 2,988,811 | | 3,001,292 |
Series 2001-50 Class FV, 3.5881% 9/16/27 (f) | | 9,114,548 | | 9,113,939 |
Series 2002-24 Class FX, 3.9381% 4/16/32 (f) | | 2,630,687 | | 2,652,779 |
Series 2002-31 Class FW, 3.7881% 6/16/31 (f) | | 3,614,097 | | 3,633,687 |
Series 2002-5 Class KF, 3.7881% 8/16/26 (f) | | 617,815 | | 618,278 |
TOTAL U.S. GOVERNMENT AGENCY | | 207,447,494 |
TOTAL COLLATERALIZED MORTGAGE OBLIGATIONS (Cost $1,104,119,465) | 1,102,867,414 |
Commercial Mortgage Securities - 5.8% |
|
1301 Avenue of The Americas Trust Series 2000-1301: | | | | |
Class C, 7.44% 8/3/10 (c)(f) | | 5,025,000 | | 5,024,881 |
Class D, 7.54% 8/3/10 (c)(f) | | 6,695,000 | | 6,694,844 |
Banc of America Large Loan, Inc. floater: | | | | |
Series 2003-BBA2 Class A3, 3.7081% 11/15/15 (c)(f) | | 5,038,226 | | 5,041,400 |
Series 2005-BOCA: | | | | |
Class H, 4.3381% 12/15/16 (c)(f) | | 2,065,000 | | 2,061,834 |
Class J, 4.4881% 12/15/16 (c)(f) | | 1,020,000 | | 1,018,438 |
Class K, 4.7381% 12/15/16 (c)(f) | | 6,659,000 | | 6,650,611 |
Bayview Commercial Asset Trust floater: | | | | |
Series 2003-1 Class A, 4.04% 8/25/33 (c)(f) | | 6,644,316 | | 6,723,250 |
Series 2003-2: | | | | |
Class A, 4.04% 12/25/33 (c)(f) | | 13,522,369 | | 13,687,661 |
Class M1, 4.31% 12/25/33 (c)(f) | | 2,200,548 | | 2,236,841 |
Series 2004-1: | | | | |
Class A, 3.82% 4/25/34 (c)(f) | | 6,403,472 | | 6,414,728 |
Class B, 5.36% 4/25/34 (c)(f) | | 665,296 | | 672,910 |
Class M1, 4.02% 4/25/34 (c)(f) | | 582,134 | | 584,681 |
Class M2, 4.66% 4/25/34 (c)(f) | | 498,972 | | 504,819 |
Commercial Mortgage Securities - continued |
| Principal Amount | | Value |
Bayview Commercial Asset Trust floater: - continued | | | | |
Series 2004-2: | | | | |
Class A, 3.89% 8/25/34 (c)(f) | | $ 6,299,807 | | $ 6,330,814 |
Class M1, 4.04% 8/25/34 (c)(f) | | 2,031,330 | | 2,039,265 |
Series 2004-3: | | | | |
Class A1, 3.83% 1/25/35 (c)(f) | | 6,582,479 | | 6,605,519 |
Class A2, 3.88% 1/25/35 (c)(f) | | 914,869 | | 918,092 |
Class M1, 3.96% 1/25/35 (c)(f) | | 1,097,080 | | 1,098,564 |
Class M2, 4.46% 1/25/35 (c)(f) | | 715,487 | | 719,742 |
Series 2005-2A: | | | | |
Class M1, 3.73% 8/25/35 (c)(f) | | 1,297,812 | | 1,297,812 |
Class M2, 3.78% 8/25/35 (c)(f) | | 2,136,399 | | 2,136,399 |
Class M3, 3.8% 8/25/35 (c)(f) | | 1,183,006 | | 1,183,006 |
Class M4, 3.91% 8/25/35 (c)(f) | | 1,088,166 | | 1,088,166 |
Bear Stearns Commercial Mortgage Securities, Inc. floater: | | | | |
Series 2003-BA1A: | | | | |
Class JFCM, 4.98% 4/14/15 (c)(f) | | 1,344,296 | | 1,350,087 |
Class JMM, 4.88% 4/14/15 (c)(f) | | 1,384,053 | | 1,385,065 |
Class KFCM, 5.23% 4/14/15 (c)(f) | | 1,436,661 | | 1,443,179 |
Class KMM, 5.13% 4/14/15 (c)(f) | | 1,253,767 | | 1,254,776 |
Class LFCM, 5.63% 4/14/15 (c)(f) | | 1,601,905 | | 1,602,545 |
Class MFCM, 5.93% 4/14/15 (c)(f) | | 2,218,251 | | 2,219,234 |
Series 2004-BBA3 Class E, 4.0881% 6/15/17 (c)(f) | | 10,415,000 | | 10,415,949 |
Chase Commercial Mortgage Securities Corp. floater Series 2000-FL1A: | | | | |
Class B, 3.81% 12/12/13 (c)(f) | | 896,672 | | 897,536 |
Class C, 4.16% 12/12/13 (c)(f) | | 1,793,345 | | 1,801,374 |
COMM floater: | | | | |
Series 2001-FL5A Class E, 4.8881% 11/15/13 (c)(f) | | 3,049,546 | | 3,048,573 |
Series 2002-FL6: | | | | |
Class F, 4.8381% 6/14/14 (c)(f) | | 11,163,000 | | 11,190,451 |
Class G, 5.2881% 6/14/14 (c)(f) | | 5,000,000 | | 5,000,444 |
Series 2003-FL9 Class B, 3.8881% 11/15/15 (c)(f) | | 10,354,700 | | 10,383,149 |
Commercial Mortgage pass thru certificates floater: | | | | |
Series 2004-CNL: | | | | |
Class A2, 3.6881% 9/15/14 (c)(f) | | 3,570,000 | | 3,573,440 |
Class G, 4.3681% 9/15/14 (c)(f) | | 1,345,000 | | 1,345,538 |
Class H, 4.4681% 9/15/14 (c)(f) | | 1,430,000 | | 1,430,571 |
Class J, 4.9881% 9/15/14 (c)(f) | | 490,000 | | 491,560 |
Class K, 5.3881% 9/15/14 (c)(f) | | 770,000 | | 771,587 |
Class L, 5.5881% 9/15/14 (c)(f) | | 625,000 | | 624,693 |
Commercial Mortgage Securities - continued |
| Principal Amount | | Value |
Commercial Mortgage pass thru certificates floater: - continued | | | | |
Series 2004-HTL1: | | | | |
Class B, 3.8381% 7/15/16 (c)(f) | | $ 495,379 | | $ 495,732 |
Class D, 3.9381% 7/15/16 (c)(f) | | 1,125,628 | | 1,125,788 |
Class E, 4.1381% 7/15/16 (c)(f) | | 805,726 | | 806,031 |
Class F, 4.1881% 7/15/16 (c)(f) | | 852,671 | | 853,207 |
Class H, 4.6881% 7/15/16 (c)(f) | | 2,472,312 | | 2,473,143 |
Class J, 4.8381% 7/15/16 (c)(f) | | 950,314 | | 950,633 |
Class K, 5.7381% 7/15/16 (c)(f) | | 1,069,720 | | 1,069,257 |
Commercial Mortgage Pass-Through Certificates floater Series 2005-F10A: | | | | |
Class B, 3.6181% 4/15/17 (c)(f) | | 7,080,000 | | 7,080,000 |
Class C, 3.6581% 4/15/17 (c)(f) | | 3,006,000 | | 3,006,000 |
Class D, 3.6981% 4/15/17 (c)(f) | | 2,440,000 | | 2,440,000 |
Class E, 3.7581% 4/15/17 (c)(f) | | 1,821,000 | | 1,821,000 |
Class F, 3.7981% 4/15/17 (c)(f) | | 1,035,000 | | 1,035,000 |
Class G, 3.9381% 4/15/17 (c)(f) | | 1,035,000 | | 1,035,000 |
Class H, 4.0081% 4/15/17 (c)(f) | | 1,035,000 | | 1,035,000 |
Class I, 4.2381% 4/15/17 (c)(f) | | 335,000 | | 335,000 |
Class MOA3, 3.6881% 3/15/20 (c)(f) | | 4,590,000 | | 4,590,000 |
CS First Boston Mortgage Securities Corp.: | | | | |
floater: | | | | |
Series 2001-TFLA Class G, 5.1381% 12/15/11 (c)(f) | | 3,720,000 | | 3,702,795 |
Series 2002-TFLA Class C, 3.9688% 11/18/12 (c)(f) | | 3,675,000 | | 3,674,923 |
Series 2003-TF2A Class A2, 3.7081% 11/15/14 (c)(f) | | 9,500,000 | | 9,507,100 |
Series 2004-FL1 Class B, 3.8381% 5/15/14 (c)(f) | | 11,230,000 | | 11,235,571 |
Series 2004-HC1: | | | | |
Class A2, 3.8881% 12/15/21 (c)(f) | | 1,475,000 | | 1,474,997 |
Class B, 4.1381% 12/15/21 (c)(f) | | 3,835,000 | | 3,834,992 |
Series 2004-TF2A Class E, 3.8081% 11/15/19 (c)(f) | | 4,450,000 | | 4,456,884 |
Series 2004-TFL1: | | | | |
Class A2, 3.5781% 2/15/14 (c)(f) | | 7,005,000 | | 7,007,087 |
Class E, 3.9381% 2/15/14 (c)(f) | | 2,800,000 | | 2,806,033 |
Class F, 3.9881% 2/15/14 (c)(f) | | 2,325,000 | | 2,330,394 |
Class G, 4.2381% 2/15/14 (c)(f) | | 1,875,000 | | 1,880,617 |
Class H, 4.4881% 2/15/14 (c)(f) | | 1,400,000 | | 1,403,733 |
Class J, 4.7881% 2/15/14 (c)(f) | | 750,000 | | 753,724 |
Commercial Mortgage Securities - continued |
| Principal Amount | | Value |
CS First Boston Mortgage Securities Corp.: - continued | | | | |
Series 2005-TF2A Class F, 3.8881% 11/15/19 (c)(f) | | $ 1,540,000 | | $ 1,542,381 |
Series 2005-TFLA: | | | | |
Class C, 3.6281% 2/15/20 (c)(f) | | 5,650,000 | | 5,649,989 |
Class E, 3.7181% 2/15/20 (c)(f) | | 3,955,000 | | 3,954,992 |
Class F, 3.7681% 2/15/20 (c)(f) | | 1,745,000 | | 1,744,997 |
Class G, 3.9081% 2/15/20 (c)(f) | | 505,000 | | 504,998 |
Class H, 4.1381% 2/15/20 (c)(f) | | 715,000 | | 714,998 |
sequential pay Series 1997-C2 Class A2, 6.52% 1/17/35 | | 518,675 | | 522,823 |
Series 2003-TFLA Class G, 3.7357% 4/15/13 (c)(f) | | 446,933 | | 445,553 |
GMAC Commercial Mortgage Securities, Inc. floater Series 2001-FL1A Class E, 4.2% 2/11/11 (c)(f) | | 264,524 | | 264,175 |
GS Mortgage Securities Corp. II floater Series 2005-FL7A Class A1, 3.5% 11/6/19 (c)(f) | | 10,526,054 | | 10,527,180 |
ISTAR Asset Receivables Trust floater Series 2002-1A Class A2, 3.8613% 5/28/20 (c)(f) | | 2,727,545 | | 2,728,117 |
John Hancock Tower Mortgage Trust floater Series 2003-C5A Class B, 5.6585% 4/10/15 (c)(f) | | 8,245,000 | | 8,150,339 |
JP Morgan Chase Commercial Mortgage Security Corp.: | | | | |
floater Series 2005-FL1A: | | | | |
Class WH, 3.97% 6/15/19 (c)(f) | | 3,325,000 | | 3,325,100 |
Class WJ, 4.17% 6/15/19 (c)(f) | | 2,045,000 | | 2,045,061 |
Class WK, 4.57% 6/15/19 (c)(f) | | 3,065,000 | | 3,065,092 |
Series 2005-FL1A Class WX1, 1.2068% 6/15/19 (c)(f)(g) | | 240,000,000 | | 2,596,800 |
Lehman Brothers Floating Rate Commercial Mortgage Trust: | | | | |
floater: | | | | |
Series 2003-C4A: | | | | |
Class F, 5.6% 7/11/15 (c)(f) | | 813,387 | | 813,822 |
Class H, 6.35% 7/11/15 (c)(f) | | 8,267,264 | | 8,287,932 |
Series 2003-LLFA: | | | | |
Class A2, 3.77% 12/16/14 (c)(f) | | 11,700,000 | | 11,707,744 |
Class B, 3.98% 12/16/14 (c)(f) | | 4,615,000 | | 4,626,299 |
Class C, 4.08% 12/16/14 (c)(f) | | 4,982,000 | | 4,997,311 |
Series 2005-LLFA Class FAIR, 5.1138% 7/15/19 (c)(d)(f) | | 4,360,000 | | 4,360,000 |
Morgan Stanley Dean Witter Capital I Trust floater Series 2002-XLF Class F, 5.49% 8/5/14 (c)(f) | | 7,603,983 | | 7,603,972 |
Commercial Mortgage Securities - continued |
| Principal Amount | | Value |
Salomon Brothers Mortgage Securities VII, Inc.: | | | | |
floater: | | | | |
Series 2001-CDCA: | | | | |
Class C, 4.1881% 2/15/13 (c)(f) | | $ 10,495,000 | | $ 10,291,568 |
Class D, 4.1881% 2/15/13 (c)(f) | | 4,000,000 | | 3,891,288 |
Series 2003-CDCA: | | | | |
Class HEXB, 5.2881% 2/15/15 (c)(f) | | 770,000 | | 771,001 |
Class JEXB, 5.4881% 2/15/15 (c)(f) | | 1,300,000 | | 1,301,690 |
Class KEXB, 5.8881% 2/15/15 (c)(f) | | 960,000 | | 961,248 |
Series 2000-NL1 Class E, 7.0607% 10/15/30 (c)(f) | | 3,657,956 | | 3,672,236 |
SDG Macerich Properties LP floater Series 2000-1 Class A3, 3.7281% 5/15/09 (c)(f) | | 18,000,000 | | 18,008,086 |
STRIPS III Ltd./STRIPS III Corp. floater Series 2004-1A Class A, 3.78% 3/24/18 (c)(f) | | 7,263,029 | | 7,263,029 |
Wachovia Bank Commercial Mortgage Trust floater: | | | | |
Series 2004-WHL3: | | | | |
Class A2, 3.5681% 3/15/14 (c)(f) | | 3,510,000 | | 3,511,290 |
Class E, 3.8881% 3/15/14 (c)(f) | | 2,190,000 | | 2,192,749 |
Class F, 3.9381% 3/15/14 (c)(f) | | 1,755,000 | | 1,757,120 |
Class G, 4% 3/15/14 (c)(f) | | 875,000 | | 876,363 |
Series 2005-WL5A: | | | | |
Class KHP1, 3.7381% 1/15/18 (c)(f) | | 1,745,000 | | 1,745,000 |
Class KHP2, 3.9381% 1/15/18 (c)(f) | | 1,745,000 | | 1,745,000 |
Class KHP3, 4.2381% 1/15/18 (c)(f) | | 2,060,000 | | 2,060,000 |
Class KHP4, 4.3381% 1/15/18 (c)(f) | | 1,600,000 | | 1,600,000 |
Class KHP5, 4.5381% 1/15/18 (c)(f) | | 1,855,000 | | 1,855,000 |
TOTAL COMMERCIAL MORTGAGE SECURITIES (Cost $378,363,353) | 378,866,012 |
Interfund Loans - 0.1% |
| | | |
With Fidelity Equity-Income Fund, at 3.43442% due 8/1/05 (b) (Cost $8,443,000) | | 8,443,000 | | 8,443,000 |
Cash Equivalents - 40.4% |
| | Maturity
Amount | | Value |
Investments in repurchase agreements (Collateralized by U.S. Government Obligations, in a joint trading account at 3.32%, dated 7/29/05 due 8/1/05) (i) | | $ 2,354,814,398 | | $ 2,354,164,000 |
With Goldman Sachs & Co. at 3.41%, dated 7/1/05 due 8/23/05 (Collateralized by Mortgage Loan Obligations valued at $295,800,001, 0.9%- 10.36%, 4/18/17 - 6/25/44) (f)(h) | | 291,455,881 | | 289,998,492 |
TOTAL CASH EQUIVALENTS (Cost $2,644,164,000) | | 2,644,162,492 |
TOTAL INVESTMENT PORTFOLIO - 102.2% (Cost $6,679,436,405) | | | 6,685,115,608 |
NET OTHER ASSETS - (2.2)% | | | (140,968,200) |
NET ASSETS - 100% | | $ 6,544,147,408 |
Futures Contracts |
| Expiration Date | | Underlying Face Amount at Value | | Unrealized Appreciation/
(Depreciation) |
Sold |
Eurodollar Contracts |
73 Eurodollar 90 Day Index Contracts | Dec. 2005 | | $ 72,221,638 | | $ 34,806 |
49 Eurodollar 90 Day Index Contracts | March 2006 | | 48,464,675 | | 28,036 |
32 Eurodollar 90 Day Index Contracts | June 2006 | | 31,645,600 | | 16,247 |
27 Eurodollar 90 Day Index Contracts | Sept. 2006 | | 26,698,612 | | 16,355 |
26 Eurodollar 90 Day Index Contracts | Dec. 2006 | | 25,707,500 | | 14,421 |
24 Eurodollar 90 Day Index Contracts | March 2007 | | 23,729,700 | | 12,329 |
17 Eurodollar 90 Day Index Contracts | June 2007 | | 16,807,688 | | 5,970 |
16 Eurodollar 90 Day Index Contracts | Sept. 2007 | | 15,818,200 | | 5,711 |
15 Eurodollar 90 Day Index Contracts | Dec. 2007 | | 14,828,250 | | 5,590 |
15 Eurodollar 90 Day Index Contracts | March 2008 | | 14,827,875 | | 5,015 |
8 Eurodollar 90 Day Index Contracts | June 2008 | | 7,907,800 | | 7,518 |
7 Eurodollar 90 Day Index Contracts | Sept. 2008 | | 6,918,888 | | 6,885 |
TOTAL EURODOLLAR CONTRACTS | | 158,883 |
Swap Agreements |
| | | Notional Amount | | Value |
Credit Default Swap |
Receive from Citibank, upon default event of DaimlerChrysler NA Holding Corp., par value of the notional amount of DaimlerChrysler NA Holding Corp. 6.5% 11/15/13, and pay quarterly notional amount multiplied by .8% | June 2007 | | $ 14,000,000 | | $ (135,972) |
Receive quarterly notional amount multiplied by 1.12% and pay Morgan Stanley, Inc. upon default of Comcast Cable Communications, Inc., par value of the notional amount of Comcast Cable Communications, Inc. 6.75% 1/30/11 | June 2006 | | 10,000,000 | | 102,057 |
TOTAL CREDIT DEFAULT SWAP | 24,000,000 | | (33,915) |
Swap Agreements - continued |
| Expiration Date | | Notional Amount | | Value |
Total Return Swap |
Receive monthly notional amount multiplied by the nominal spread appreciation of the Lehman Brothers CMBS U.S. Aggregate Index adjusted by a modified duration factor plus 10 basis points and pay monthly notional amount multiplied by the nominal spread depreciation of the Lehman Brothers CMBS U.S. Aggregate Index adjusted by a modified duration factor with Lehman Brothers, Inc. | Oct. 2005 | | $ 48,200,000 | | $ 46,335 |
Receive monthly notional amount multiplied by the nominal spread appreciation of the Lehman Brothers CMBS U.S. Aggregate Index adjusted by a modified duration factor plus 25 basis points and pay monthly notional amount multiplied by the nominal spread depreciation of the Lehman Brothers CMBS U.S. Aggregate Index adjusted by a modified duration factor with Lehman Brothers, Inc. | Dec. 2005 | | 30,000,000 | | 32,511 |
Receive monthly notional amount multiplied by the nominal spread appreciation of the Lehman Brothers CMBS U.S. Aggregate Index adjusted by a modified duration factor plus 30 basis points and pay monthly notional amount multiplied by the nominal spread depreciation of the Lehman Brothers CMBS U.S. Aggregate Index adjusted by a modified duration factor with Lehman Brothers, Inc. | August 2005 | | 35,100,000 | | 33,945 |
Swap Agreements - continued |
| Expiration Date | | Notional Amount | | Value |
Receive monthly notional amount multiplied by the nominal spread appreciation of the Lehman Brothers CMBS U.S. Aggregate Index adjusted by a modified duration factor plus 22 basis points and pay monthly notional amount multiplied by the nominal spread depreciation of the Lehman Brothers CMBS U.S. Aggregate Index adjusted by a modified duration factor with Lehman Brothers, Inc. | Jan. 2006 | | $ 35,100,000 | | $ 32,229 |
Receive monthly a return equal to Lehman Brothers ABS Floating Rate Index and pay monthly a floating rate based on the 1- month LIBOR minus 11.1 basis points with Lehman Brothers, Inc. | Nov. 2005 | | 30,000,000 | | 0 |
TOTAL TOTAL RETURN SWAP | 178,400,000 | | 145,020 |
| | $ 202,400,000 | | $ 111,105 |
Legend |
(a) Debt obligation initially issued at one coupon which converts to a higher coupon at a specified date. The rate shown is the rate at period end. |
(b) Affiliated entity |
(c) Security exempt from registration under Rule 144A of the Securities Act of 1933. These securities may be resold in transactions exempt from registration, normally to qualified institutional buyers. At the period end, the value of these securities amounted to $586,119,417 or 9.0% of net assets. |
(d) Security or a portion of the security purchased on a delayed delivery or when-issued basis. |
(e) Security or a portion of the security was pledged to cover margin requirements for futures contracts. At the period end, the value of securities pledged amounted to $994,635. |
(f) The coupon rate shown on floating or adjustable rate securities represents the rate at period end. |
(g) Security represents right to receive monthly interest payments on an underlying pool of mortgages. Principal shown is the par amount of the mortgage pool. |
(h) The maturity amount is based on the rate at period end. |
(i) Additional information on each counterparty to the repurchase agreement is as follows: |
Repurchase Agreement/
Counterparty | Value |
$2,354,164,000 due 8/1/05 at 3.32% | |
Banc of America Securities LLC. | $ 471,596,247 |
Bank of America, National Association | 244,985,063 |
Barclays Capital Inc. | 979,940,254 |
Countrywide Securities Corporation | 244,985,063 |
Morgan Stanley & Co. Incorporated. | 351,411,107 |
UBS Securities LLC | 61,246,266 |
| $ 2,354,164,000 |
Income Tax Information |
At July 31, 2005, the aggregate cost of investment securities for income tax purposes was $6,679,021,266. Net unrealized appreciation aggregated $6,094,342, of which $11,067,257 related to appreciated investment securities and $4,972,915 related to depreciated investment securities. |
Annual Report
Managing Your Investments
Fidelity offers several ways to conveniently manage your personal investments via your telephone or PC. You can access your account information, conduct trades and research your investments 24 hours a day.
By Phone
Fidelity Automated Service Telephone provides a single toll-free number to access account balances, positions, quotes and trading. It's easy to navigate the service, and on your first call, the system will help you create a personal identification number (PIN) for security.
(phone_graphic)
Fidelity Automated
Service Telephone (FAST®)
1-800-544-5555
Press
1 For mutual fund and brokerage trading.
2 For quotes.*
3 For account balances and holdings.
4 To review orders and mutual
fund activity.
5 To change your PIN.
*0 To speak to a Fidelity representative.
By PC
Fidelity's web site on the Internet provides a wide range of information, including daily financial news, fund performance, interactive planning tools and news about Fidelity products and services.
(computer_graphic)
Fidelity's Web Site
www.fidelity.com
* When you call the quotes line, please remember that a fund's yield and return will vary and, except for money market funds, share price will also vary. This means that you may have a gain or loss when you sell your shares. There is no assurance that money market funds will be able to maintain a stable $1 share price; an investment in a money market fund is not insured or guaranteed by the U.S. government. Total returns are historical and include changes in share price, reinvestment of dividends and capital gains, and the effects of any sales charges.
Annual Report
To Write Fidelity
We'll give your correspondence immediate attention and send you written confirmation upon completion of your request.
(letter_graphic)
Making Changes
To Your Account
(such as changing name, address, bank, etc.)
Fidelity Investments
P.O. Box 770001
Cincinnati, OH 45277-0002
(letter_graphic)
For Non-Retirement
Accounts
Buying shares
Fidelity Investments
P.O. Box 770001
Cincinnati, OH 45277-0003
Overnight Express
Fidelity Investments
Attn: Distribution Services
100 Crosby Parkway - KC1H
Covington, KY 41015
Selling shares
Fidelity Investments
P.O. Box 770001
Cincinnati, OH 45277-0035
Overnight Express
Fidelity Investments
Attn: Distribution Services
100 Crosby Parkway - KC1H
Covington, KY 41015
General Correspondence
Fidelity Investments
P.O. Box 500
Merrimack, NH 03054-0500
(letter_graphic)
For Retirement
Accounts
Buying shares
Fidelity Investments
P.O. Box 770001
Cincinnati, OH 45277-0003
Selling shares
Fidelity Investments
P.O. Box 770001
Cincinnati, OH 45277-0035
Overnight Express
Fidelity Investments
Attn: Distribution Services
100 Crosby Parkway - KC1H
Covington, KY 41015
General Correspondence
Fidelity Investments
P.O. Box 500
Merrimack, NH 03054-0500
Annual Report
Investment Adviser
Fidelity Management & Research Company
Boston, MA
Investment Sub-Advisers
Fidelity Investments
Money Management, Inc.
Fidelity International Investment Advisors
Fidelity International Investment Advisors
(U.K.) Limited
General Distributor
Fidelity Distributors Corporation
Boston, MA
Transfer and Service Agent
Fidelity Service Company, Inc.
Boston, MA
Custodian
Citibank, N.A.
New York, NY
The Fidelity Telephone Connection
Mutual Fund 24-Hour Service
Exchanges/Redemptions
and Account Assistance 1-800-544-6666
Product Information 1-800-544-6666
Retirement Accounts 1-800-544-4774
(8 a.m. - 9 p.m.)
TDD Service 1-800-544-0118
for the deaf and hearing impaired
(9 a.m. - 9 p.m. Eastern time)
Fidelity Automated Service
Telephone (FAST®) (automated graphic) 1-800-544-5555
(automated graphic) Automated line for quickest service
ULB-UANN-0905
1.789713.102
(Fidelity Investment logo)(registered trademark)
Corporate Headquarters
82 Devonshire St., Boston, MA 02109
www.fidelity.com
(Fidelity Investment logo)(registered trademark)
Fidelity Advisor
Ultra-Short Bond
Fund - Class A and Class T
Annual Report
July 31, 2005
Class A and Class T
are classes of
Fidelity® Ultra-Short Bond Fund
(2_fidelity_logos) (Registered_Trademark)
Contents
Chairman's Message | <Click Here> | Ned Johnson's message to shareholders. |
Performance | <Click Here> | How the fund has done over time. |
Management's Discussion | <Click Here> | The manager's review of fund performance, strategy and outlook. |
Shareholder Expense Example | <Click Here> | An example of shareholder expenses. |
Investment Changes | <Click Here> | A summary of major shifts in the fund's investments over the past six months. |
Investments | <Click Here> | A complete list of the fund's investments with their market values. |
Financial Statements | <Click Here> | Statements of assets and liabilities, operations, and changes in net assets,
as well as financial highlights. |
Notes | <Click Here> | Notes to the financial statements. |
Report of Independent Registered Public Accounting Firm | <Click Here> | |
Trustees and Officers | <Click Here> | |
Distributions | <Click Here> | |
Board Approval of Investment Advisory Contracts and Management Fees | <Click Here> | |
Central Fund Investments | <Click Here> | Complete list of investments for Fidelity's fixed-income central funds. |
To view a fund's proxy voting guidelines and proxy voting record for the 12-month period ended June 30, visit www.fidelity.com/proxyvotingresults or visit the Securities and Exchange Commission's (SEC) web site at www.sec.gov. You may also call 1-877-208-0098 to request a free copy of the proxy voting guidelines.
Standard & Poor's, S&P and S&P 500 are registered service marks of The McGraw-Hill Companies, Inc. and have been licensed for use by Fidelity Distributors Corporation.
Other third party marks appearing herein are the property of their respective owners.
All other marks appearing herein are registered or unregistered trademarks or service marks of FMR Corp. or an affiliated company.
Annual Report
This report and the financial statements contained herein are submitted for the general information of the shareholders of the fund. This report is not authorized for distribution to prospective investors in the fund unless preceded or accompanied by an effective prospectus.
A fund files its complete schedule of portfolio holdings with the SEC for the first and third quarters of each fiscal year on Form N-Q. Forms N-Q are available on the SEC's website at http://www.sec.gov. A fund's Forms N-Q may be reviewed and copied at the SEC's Public Reference Room in Washington, DC. Information regarding the operation of the SEC's Public Reference Room may be obtained by calling 1-800-SEC-0330. For a complete list of a fund's portfolio holdings, view the most recent quarterly holdings report, semiannual report, or annual report on Fidelity's web site at http://www.advisor.fidelity.com.
NOT FDIC INSURED · MAY LOSE VALUE · NO BANK GUARANTEE
Neither the fund nor Fidelity Distributors Corporation is a bank.
Annual Report
Chairman's Message
(photo_of_Edward_C_Johnson_3d)
Dear Shareholder:
During the past year or so, much has been reported about the mutual fund industry, and much of it has been more critical than I believe is warranted. Allegations that some companies have been less than forthright with their shareholders have cast a shadow on the entire industry. I continue to find these reports disturbing, and assert that they do not create an accurate picture of the industry overall. Therefore, I would like to remind everyone where Fidelity stands on these issues. I will say two things specifically regarding allegations that some mutual fund companies were in violation of the Securities and Exchange Commission's forward pricing rules or were involved in so-called "market timing" activities.
First, Fidelity has no agreements that permit customers who buy fund shares after 4 p.m. to obtain the 4 p.m. price. This is not a new policy. This is not to say that someone could not deceive the company through fraudulent acts. However, we are extremely diligent in preventing fraud from occurring in this manner - and in every other. But I underscore again that Fidelity has no so-called "agreements" that sanction illegal practices.
Second, Fidelity continues to stand on record, as we have for years, in opposition to predatory short-term trading that adversely affects shareholders in a mutual fund. Back in the 1980s, we initiated a fee - which is returned to the fund and, therefore, to investors - to discourage this activity. Further, we took the lead several years ago in developing a Fair Value Pricing Policy to prevent market timing on foreign securities in our funds. I am confident we will find other ways to make it more difficult for predatory traders to operate. However, this will only be achieved through close cooperation among regulators, legislators and the industry.
Yes, there have been unfortunate instances of unethical and illegal activity within the mutual fund industry from time to time. That is true of any industry. When this occurs, confessed or convicted offenders should be dealt with appropriately. But we are still concerned about the risk of over-regulation and the quick application of simplistic solutions to intricate problems. Every system can be improved, and we support and applaud well thought out improvements by regulators, legislators and industry representatives that achieve the common goal of building and protecting the value of investors' holdings.
For nearly 60 years, Fidelity has worked very hard to improve its products and service to justify your trust. When our family founded this company in 1946, we had only a few hundred customers. Today, we serve more than 18 million customers including individual investors and participants in retirement plans across America.
Let me close by saying that we do not take your trust in us for granted, and we realize that we must always work to improve all aspects of our service to you. In turn, we urge you to continue your active participation with your financial matters, so that your interests can be well served.
Best regards,
/s/Edward C. Johnson 3d
Edward C. Johnson 3d
Annual Report
Performance: The Bottom Line
Average annual total return reflects the change in the value of an investment, assuming reinvestment of the class' dividend income and capital gains (the profits earned upon the sale of securities that have grown in value) and assuming a constant rate of performance each year. The $10,000 table and the fund's returns do not reflect the deduction of taxes that a shareholder would pay on fund distributions or the redemption of fund shares. During periods of reimbursement by Fidelity, a fund's total return will be greater than it would be had the reimbursement not occurred. How a fund did yesterday is no guarantee of how it will do tomorrow.
Average Annual Total Returns
Periods ended July 31, 2005 | | Past 1
year | Life of
fundA |
Class A (incl. 1.50%
sales charge) B | | 0.45% | 1.33% |
Class T (incl. 1.50%
sales charge) C | | 0.45% | 1.33% |
A Since August 29, 2002
B Class A shares bear a 0.15% 12b-1 fee. The initial offering of Class A shares took place on June 16, 2004. Returns prior to June 16, 2004 are those of Fidelity Ultra-Short Bond, the original retail class of the fund, which does not bear a 12b-1 fee. Had Class A shares' 12b-1 fee been reflected, returns prior to June 16, 2004 would have been lower.
C Class T shares bear a 0.15% 12b-1 fee. The initial offering of Class T shares took place on June 16, 2004. Returns prior to June 16, 2004 are those of Fidelity Ultra-Short Bond, the original retail class of the fund, which does not bear a 12b-1 fee. Had Class T shares' 12b-1 fee been reflected, returns prior to June 16, 2004 would have been lower.
Annual Report
$10,000 Over Life of Fund
Let's say hypothetically that $10,000 was invested in Fidelity® Advisor Ultra-Short Bond Fund - Class T on August 29, 2002, when the fund started, and the current 1.50% sales charge was paid. The chart shows how the value of your investment would have changed, and also shows how the Lehman Brothers® 6 Month Swap Index performed over the same period.
Annual Report
Management's Discussion of Fund Performance
Comments from Andrew Dudley, Portfolio Manager of Fidelity Advisor Ultra-Short Bond Fund
Not unlike the domestic equity markets, taxable bonds swung up and down during the 12 months ending July 31, 2005, rallying early in the period, selling off in late winter, only to advance again in the spring. During the one-year period, the Lehman Brothers® Aggregate Bond Index - a measure of the overall investment-grade bond universe - - rose 4.79%. Much of this gain came on the strength of returns from higher-yielding spread sectors, such as investment-grade corporates, reflected in the 5.76% return of the Lehman Brothers Credit Bond Index over the 12-month period. Mortgage-backed securities were spurred on by the relative stability of long-term interest rates, and the Lehman Brothers Mortgage-Backed Securities gained 4.67%. Treasuries also bolstered the overall market, as illustrated by the 4.62% return of the Lehman Brothers U.S. Treasury Index, which moved ahead on a flight to quality as investors continued to ponder the future direction of the U.S. economy. The Lehman Brothers U.S. Agency Index returned a more modest 3.88%.
For the 12 months ending July 31, 2005, the fund's Class A and Class T shares each gained 1.98%, while the Lehman Brothers 6 Month Swap Index returned 2.23% and the LipperSM Ultra-Short Obligation Funds Average returned 1.95%. Benefiting the fund's performance was my yield-curve positioning. I owned more bonds with maturities throughout the zero- to two-year range than the index, which helped as the yield curve flattened. Sector selection also generally was favorable. I kept the fund tilted heavily toward non-government bonds, which were helped by their yield advantage over Treasuries and spread tightening. I held these securities - namely asset-backed bonds and mortgage securities - directly and indirectly through the Fidelity Ultra-Short Central Fund, a diversified internal pool of short-term assets designed to outperform cash-like instruments with similar risk characteristics. Detracting from performance was a small stake in corporate bonds issued by auto companies, which were hurt by credit-rating downgrades.
The views expressed in this statement reflect those of the portfolio manager only through the end of the period of the report as stated on the cover and do not necessarily represent the views of Fidelity or any other person in the Fidelity organization. Any such views are subject to change at any time based upon market or other conditions and Fidelity disclaims any responsibility to update such views. These views may not be relied on as investment advice and, because investment decisions for a Fidelity fund are based on numerous factors, may not be relied on as an indication of trading intent on behalf of any Fidelity fund.
Annual Report
Shareholder Expense Example
As a shareholder of the Fund, you incur two types of costs: (1) transaction costs, including redemption fees, and (2) ongoing costs, including management fees, distribution and/or service (12b-1) fees and other Fund expenses. This Example is intended to help you understand your ongoing costs (in dollars) of investing in the Fund and to compare these costs with the ongoing costs of investing in other mutual funds.
The Example is based on an investment of $1,000 invested at the beginning of the period and held for the entire period (February 1, 2005 to July 31, 2005).
Actual Expenses
The first line of the table below for each class of the Fund provides information about actual account values and actual expenses. You may use the information in this line, together with the amount you invested, to estimate the expenses that you paid over the period. Simply divide your account value by $1,000.00 (for example, an $8,600 account value divided by $1,000.00 = 8.6), then multiply the result by the number in the first line for a class of the Fund under the heading entitled "Expenses Paid During Period" to estimate the expenses you paid on your account during this period.
Hypothetical Example for Comparison Purposes
The second line of the table below for each class of the Fund provides information about hypothetical account values and hypothetical expenses based on a Class' actual expense ratio and an assumed rate of return of 5% per year before expenses, which is not the Class' actual return. The hypothetical account values and expenses may not be used to estimate the actual ending account balance or expenses you paid for the period. You may use this information to compare the ongoing costs of investing in the Fund and other funds. To do so, compare this 5% hypothetical example with the 5% hypothetical examples that appear in the shareholder reports of the other funds.
Please note that the expenses shown in the table are meant to highlight your ongoing costs only and do not reflect any transaction costs. Therefore, the second line of the table is useful in comparing ongoing costs only, and will not help you determine the relative total costs of owning different funds. In addition, if these transactional costs were included, your costs would have been higher.
Annual Report
| Beginning
Account Value
February 1, 2005 | Ending
Account Value
July 31, 2005 | Expenses Paid
During Period*
February 1, 2005
to July 31, 2005 |
Class A | | | |
Actual | $ 1,000.00 | $ 1,012.00 | $ 3.49 |
HypotheticalA | $ 1,000.00 | $ 1,021.32 | $ 3.51 |
Class T | | | |
Actual | $ 1,000.00 | $ 1,011.90 | $ 3.49** |
HypotheticalA | $ 1,000.00 | $ 1,021.32 | $ 3.51** |
Ultra-Short Bond | | | |
Actual | $ 1,000.00 | $ 1,013.00 | $ 2.55** |
HypotheticalA | $ 1,000.00 | $ 1,022.27 | $ 2.56** |
Institutional Class | | | |
Actual | $ 1,000.00 | $ 1,012.70 | $ 2.74** |
HypotheticalA | $ 1,000.00 | $ 1,022.07 | $ 2.76** |
A 5% return per year before expenses
* Expenses are equal to each Class' annualized expense ratio (shown in the table below); multiplied by the average account value over the period, multiplied by 181/365 (to reflect the one-half year period).
| Annualized
Expense Ratio |
Class A | .70% |
Class T | .70%** |
Ultra-Short Bond | .51%** |
Institutional Class | .55%** |
** If contractual expense reductions, effective June 1, 2005, had been in effect during the period, the annualized expense ratios and the expenses paid in the actual and hypothetical examples above would have been as follows:
| Annualized
Expense Ratio
| Expenses Paid
|
Class T | .69% | |
Actual | | $ 3.44 |
HypotheticalA | | $ 3.46 |
Ultra-Short Bond | .45% | |
Actual | | $ 2.25 |
HypotheticalA | | $ 2.26 |
Institutional Class | .47% | |
Actual | | $ 2.35 |
HypotheticalA | | $ 2.36 |
A 5% return per year before expenses
Annual Report
Investment Changes
Quality Diversification (% of fund's net assets) |
As of July 31, 2005 | As of January 31, 2005 |
| U.S. Government and
U.S. Government
Agency Obligations 11.0% | | | U.S. Government and
U.S. Government
Agency Obligations 19.4% | |
| AAA 26.9% | | | AAA 23.7% | |
| AA 10.4% | | | AA 6.5% | |
| A 11.5% | | | A 11.9% | |
| BBB 11.3% | | | BBB 10.4% | |
| BB and Below 0.2% | | | BB and Below 0.1% | |
| Not Rated 2.8% | | | Not Rated 5.2% | |
| Short-Term
Investments and
Net Other Assets 25.9% | | | Short-Term
Investments and
Net Other Assets 22.8% | |
We have used ratings from Moody's Investors Services, Inc. Where Moody's ratings are not available, we have used S&P® ratings. Securities rated BB or below were rated investment grade at the time of acquisition. The information in the above table is based on the combined investments of the fund and its pro-rata share of the investments of Fidelity's fixed-income central fund. |
Average Years to Maturity as of July 31, 2005 |
| | 6 months ago |
Years | 1.6 | 1.6 |
Average years to maturity is based on the average time remaining until principal payments are expected from each of the fund's bonds, weighted by dollar amount. |
Duration as of July 31, 2005 |
| | 6 months ago |
Years | 0.3 | 0.4 |
Duration shows how much a bond fund's price fluctuates with changes in comparable interest rates. If rates rise 1%, for example, a fund with a five-year duration is likely to lose about 5% of its value. Other factors also can influence a bond fund's performance and share price. Accordingly, a bond fund's actual performance may differ from this example. |
Asset Allocation (% of fund's net assets) |
As of July 31, 2005* | As of January 31, 2005** |
| Corporate Bonds 6.6% | | | Corporate Bonds 5.5% | |
| U.S. Government and
U.S. Government
Agency Obligations 11.0% | | | U.S. Government and
U.S. Government
Agency Obligations 19.4% | |
| Asset-Backed
Securities 33.7% | | | Asset-Backed
Securities 31.5% | |
| CMOs and Other Mortgage Related Securities 22.8% | | | CMOs and Other Mortgage Related Securities 20.8% | |
| Short-Term
Investments and
Net Other Assets 25.9% | | | Short-Term
Investments and
Net Other Assets 22.8% | |
* Foreign investments | 5.3% | | ** Foreign investments | 4.3% | |
* Futures and Swaps | 9.4% | | ** Futures and Swaps | 14.2% | |

The information in the above tables is based on the combined investments of the fund and its pro-rata share of the investment of Fidelity's fixed-income central fund. |
Annual Report
Investments July 31, 2005
Showing Percentage of Net Assets
Nonconvertible Bonds - 5.4% |
| Principal
Amount | | Value
(Note 1) |
CONSUMER DISCRETIONARY - 1.0% |
Auto Components - 0.2% |
DaimlerChrysler NA Holding Corp.: | | | | |
3.8594% 9/10/07 (f) | | $ 1,230,000 | | $ 1,232,497 |
3.8938% 5/24/06 (f) | | 800,000 | | 802,330 |
| | 2,034,827 |
Media - 0.8% |
British Sky Broadcasting Group PLC (BSkyB) yankee 7.3% 10/15/06 | | 900,000 | | 929,107 |
Continental Cablevision, Inc. 8.3% 5/15/06 | | 450,000 | | 463,986 |
Cox Communications, Inc.: | | | | |
(Reg. S) 3.95% 12/14/07 (f) | | 1,530,000 | | 1,537,901 |
7.75% 8/15/06 | | 360,000 | | 371,837 |
Liberty Media Corp. 4.91% 9/17/06 (f) | | 3,033,000 | | 3,049,894 |
Univision Communications, Inc. 2.875% 10/15/06 | | 1,210,000 | | 1,183,017 |
| | 7,535,742 |
TOTAL CONSUMER DISCRETIONARY | | 9,570,569 |
ENERGY - 0.6% |
Oil, Gas & Consumable Fuels - 0.6% |
Duke Energy Field Services LLC 7.5% 8/16/05 | | 1,000,000 | | 1,001,206 |
Enterprise Products Operating LP 4% 10/15/07 | | 2,670,000 | | 2,625,438 |
Valero Energy Corp. 7.375% 3/15/06 | | 1,700,000 | | 1,727,294 |
| | 5,353,938 |
FINANCIALS - 1.4% |
Capital Markets - 0.0% |
State Street Capital Trust II 3.7681% 2/15/08 (f) | | 300,000 | | 300,068 |
Commercial Banks - 0.3% |
Wells Fargo & Co. 3.4194% 3/10/08 (f) | | 2,300,000 | | 2,299,924 |
Consumer Finance - 0.3% |
General Motors Acceptance Corp. 4.87% 10/20/05 (f) | | 2,385,000 | | 2,388,422 |
Real Estate - 0.4% |
EOP Operating LP 8.375% 3/15/06 | | 1,325,000 | | 1,357,928 |
Simon Property Group LP 7.375% 1/20/06 | | 2,525,000 | | 2,560,416 |
| | 3,918,344 |
Thrifts & Mortgage Finance - 0.4% |
Countrywide Financial Corp. 3.71% 4/11/07 (f) | | 1,575,000 | | 1,576,005 |
Nonconvertible Bonds - continued |
| Principal
Amount | | Value
(Note 1) |
FINANCIALS - continued |
Thrifts & Mortgage Finance - continued |
Countrywide Home Loans, Inc. 3.8175% 6/2/06 (f) | | $ 500,000 | | $ 501,468 |
Residential Capital Corp. 4.835% 6/29/07 (b)(f) | | 1,995,000 | | 1,997,075 |
| | 4,074,548 |
TOTAL FINANCIALS | | 12,981,306 |
INFORMATION TECHNOLOGY - 0.2% |
Communications Equipment - 0.2% |
Motorola, Inc. 4.608% 11/16/07 | | 1,700,000 | | 1,699,546 |
TELECOMMUNICATION SERVICES - 1.3% |
Diversified Telecommunication Services - 1.2% |
British Telecommunications PLC 7.875% 12/15/05 | | 1,950,000 | | 1,977,089 |
France Telecom SA 7.45% 3/1/06 (a) | | 440,000 | | 447,817 |
GTE Corp. 6.36% 4/15/06 | | 1,000,000 | | 1,014,045 |
SBC Communications, Inc. 4.389% 6/5/06 (b) | | 2,265,000 | | 2,265,680 |
Sprint Capital Corp.: | | | | |
4.78% 8/17/06 | | 1,000,000 | | 1,003,425 |
7.125% 1/30/06 | | 500,000 | | 506,454 |
Telefonica Europe BV 7.35% 9/15/05 | | 500,000 | | 501,949 |
Telefonos de Mexico SA de CV 4.5% 11/19/08 | | 1,605,000 | | 1,581,845 |
TELUS Corp. yankee 7.5% 6/1/07 | | 2,000,000 | | 2,103,252 |
| | 11,401,556 |
Wireless Telecommunication Services - 0.1% |
AT&T Wireless Services, Inc. 7.35% 3/1/06 | | 900,000 | | 915,869 |
TOTAL TELECOMMUNICATION SERVICES | | 12,317,425 |
UTILITIES - 0.9% |
Electric Utilities - 0.7% |
DTE Energy Co. 6.45% 6/1/06 | | 165,000 | | 167,721 |
Pinnacle West Energy Corp. 4.0044% 4/1/07 (b)(f) | | 1,850,000 | | 1,850,115 |
Progress Energy, Inc. 6.75% 3/1/06 | | 4,105,000 | | 4,159,954 |
| | 6,177,790 |
Gas Utilities - 0.1% |
NiSource Finance Corp. 7.625% 11/15/05 | | 675,000 | | 681,729 |
Nonconvertible Bonds - continued |
| Principal
Amount | | Value
(Note 1) |
UTILITIES - continued |
Independent Power Producers & Energy Traders - 0.1% |
Constellation Energy Group, Inc. 6.35% 4/1/07 | | $ 910,000 | | $ 935,558 |
TOTAL UTILITIES | | 7,795,077 |
TOTAL NONCONVERTIBLE BONDS (Cost $49,879,710) | 49,717,861 |
U.S. Government Agency Obligations - 4.8% |
|
Fannie Mae: | | | | |
2.15% 4/13/06 (d) | | 9,700,000 | | 9,576,150 |
3.25% 7/31/06 | | 35,000,000 | | 34,701,930 |
TOTAL U.S. GOVERNMENT AGENCY OBLIGATIONS (Cost $44,467,346) | 44,278,080 |
U.S. Government Agency - Mortgage Securities - 1.1% |
|
Fannie Mae - 1.1% |
5.5% 11/1/16 to 2/1/19 | | 5,200,909 | | 5,307,703 |
6.5% 7/1/16 to 3/1/35 | | 3,181,350 | | 3,295,459 |
7% 8/1/17 to 5/1/32 | | 1,634,170 | | 1,713,170 |
TOTAL U.S. GOVERNMENT AGENCY - MORTGAGE SECURITIES (Cost $10,393,053) | 10,316,332 |
Asset-Backed Securities - 22.9% |
|
Accredited Mortgage Loan Trust: | | | | |
Series 2004-2 Class A2, 3.76% 7/25/34 (f) | | 659,098 | | 660,260 |
Series 2004-3 Class 2A4, 3.81% 10/25/34 (f) | | 1,200,000 | | 1,203,472 |
Series 2004-4 Class A2D, 3.81% 1/25/35 (f) | | 432,988 | | 434,077 |
Series 2005-1: | | | | |
Class M1, 3.93% 4/25/35 (f) | | 1,545,000 | | 1,541,149 |
Class M2, 4.15% 4/25/35 (f) | | 725,000 | | 725,261 |
ACE Securities Corp.: | | | | |
Series 2002-HE2 Class M1, 4.31% 8/25/32 (f) | | 151,473 | | 152,070 |
Series 2003-FM1 Class M2, 5.31% 11/25/32 (f) | | 145,000 | | 146,706 |
Series 2003-HE1: | | | | |
Class A2, 3.87% 11/25/33 (f) | | 193,312 | | 193,549 |
Class M1, 4.11% 11/25/33 (f) | | 120,000 | | 120,501 |
Class M2, 5.16% 11/25/33 (f) | | 75,000 | | 76,199 |
Asset-Backed Securities - continued |
| Principal
Amount | | Value
(Note 1) |
ACE Securities Corp.: - continued | | | | |
Series 2003-HS1: | | | | |
Class M1, 4.21% 6/25/33 (f) | | $ 50,000 | | $ 50,218 |
Class M2, 5.21% 6/25/33 (f) | | 50,000 | | 50,882 |
Series 2003-NC1 Class M1, 4.24% 7/25/33 (f) | | 100,000 | | 100,729 |
Series 2004-HE1: | | | | |
Class M1, 3.96% 2/25/34 (f) | | 150,000 | | 150,053 |
Class M2, 4.56% 2/25/34 (f) | | 175,000 | | 175,088 |
Series 2005-HE2: | | | | |
Class M1, 3.9% 4/25/35 (f) | | 215,000 | | 214,714 |
Class M2, 3.91% 4/25/35 (f) | | 250,000 | | 249,145 |
Class M3, 3.94% 4/25/35 (f) | | 145,000 | | 144,811 |
Class M4, 4.1% 4/25/35 (f) | | 185,000 | | 184,761 |
Series 2005-HE3: | | | | |
Class A2A, 3.56% 5/25/35 (f) | | 1,167,755 | | 1,167,800 |
Class A2B, 3.67% 5/25/35 (f) | | 630,000 | | 629,474 |
Series 2005-SD1 Class A1, 3.86% 11/25/50 (f) | | 330,485 | | 330,892 |
Aesop Funding II LLC Series 2005-1A Class A2, 3.49% 4/20/09 (b)(f) | | 1,200,000 | | 1,195,320 |
American Express Credit Account Master Trust: | | | | |
Series 2004-1 Class B, 3.6381% 9/15/11 (f) | | 410,000 | | 411,613 |
Series 2004-5 Class B, 3.6381% 4/16/12 (f) | | 2,150,000 | | 2,155,806 |
Series 2004-C Class C, 3.8881% 2/15/12 (b)(f) | | 1,039,411 | | 1,042,479 |
Series 2005-1 Class A, 3.4181% 10/15/12 (f) | | 2,185,000 | | 2,188,761 |
AmeriCredit Automobile Receivables Trust: | | | | |
Series 2003-AM Class A4B, 3.81% 11/6/09 (f) | | 600,000 | | 602,016 |
Series 2003-BX Class A4B, 3.72% 1/6/10 (f) | | 140,000 | | 140,459 |
Series 2003-CF Class A3, 2.75% 10/9/07 | | 699,964 | | 697,759 |
Series 2004-1 Class A3, 3.22% 7/6/08 | | 365,000 | | 362,469 |
Series 2005-1 Class C, 4.73% 7/6/10 | | 2,500,000 | | 2,492,250 |
Series 2005-BM ClassA3, 4.05% 1/6/10 | | 1,280,000 | | 1,277,160 |
Ameriquest Mortgage Securities, Inc.: | | | | |
Series 2002-4 Class M1, 4.46% 2/25/33 (f) | | 105,000 | | 105,529 |
Series 2003-1: | | | | |
Class A2, 3.87% 2/25/33 (f) | | 13,876 | | 13,883 |
Class M1, 4.36% 2/25/33 (f) | | 500,000 | | 503,890 |
Series 2003-11 Class M1, 4.15% 1/25/34 (f) | | 1,535,000 | | 1,549,684 |
Series 2003-3 Class M1, 4.26% 3/25/33 (f) | | 75,000 | | 75,636 |
Series 2003-6: | | | | |
Class M1, 4.22% 8/25/33 (f) | | 1,000,000 | | 1,006,776 |
Class S, 5% 5/25/33 (h) | | 1,779,006 | | 21,519 |
Series 2003-7 Class M1, 4.31% 8/25/33 (f) | | 140,000 | | 142,193 |
Asset-Backed Securities - continued |
| Principal
Amount | | Value
(Note 1) |
Ameriquest Mortgage Securities, Inc.: - continued | | | | |
Series 2003-AR1 Class M1, 4.61% 1/25/33 (f) | | $ 500,000 | | $ 505,188 |
Series 2004-R2: | | | | |
Class M1, 3.89% 4/25/34 (f) | | 85,000 | | 84,996 |
Class M2, 3.94% 4/25/34 (f) | | 75,000 | | 74,997 |
Series 2004-R9: | | | | |
Class A3, 3.78% 10/25/34 (f) | | 1,020,000 | | 1,022,170 |
Class M2, 4.11% 10/25/34 (f) | | 720,000 | | 721,638 |
Class M4, 4.63% 10/25/34 (f) | | 925,000 | | 939,417 |
Series 2005-R1: | | | | |
Class M1, 3.91% 3/25/35 (f) | | 770,000 | | 767,479 |
Class M2, 3.94% 3/25/35 (f) | | 260,000 | | 259,172 |
Series 2005-R2 Class M1, 3.91% 4/25/35 (f) | | 1,700,000 | | 1,697,622 |
Amortizing Residential Collateral Trust: | | | | |
Series 2002-BC6 Class M1, 4.21% 8/25/32 (f) | | 100,000 | | 100,871 |
Series 2002-BC7: | | | | |
Class M1, 4.1144% 10/25/32 (f) | | 450,000 | | 453,375 |
Class M2, 4.36% 10/25/32 (f) | | 300,000 | | 301,995 |
Series 2003-BC1 Class M2, 4.56% 1/25/32 (f) | | 53,547 | | 53,794 |
ARG Funding Corp.: | | | | |
Series 2005-1A Class A2, 3.53% 4/20/09 (b)(f) | | 1,500,000 | | 1,496,719 |
Series 2005-2A Class A2, 3.54% 5/20/09 (b)(f) | | 800,000 | | 798,531 |
Argent Securities, Inc.: | | | | |
Series 2003-W3 Class M2, 5.26% 9/25/33 (f) | | 800,000 | | 824,000 |
Series 2003-W6 Class AV2, 3.83% 1/25/34 (f) | | 219,651 | | 219,906 |
Series 2004-W7: | | | | |
Class M1, 4.01% 5/25/34 (f) | | 305,000 | | 304,987 |
Class M2, 4.06% 5/25/34 (f) | | 250,000 | | 249,989 |
Asset Backed Funding Certificates Series 2004-HE1 Class M2, 4.61% 1/25/34 (f) | | 230,000 | | 233,445 |
Asset Backed Securities Corp. Home Equity Loan Trust: | | | | |
Series 2003-HE2: | | | | |
Class A2, 3.7681% 4/15/33 (f) | | 26,038 | | 26,049 |
Class M1, 4.2881% 4/15/33 (f) | | 1,340,000 | | 1,347,558 |
Series 2003-HE3 Class A2, 3.7381% 6/15/33 (f) | | 7,668 | | 7,669 |
Series 2003-HE4 Class M2, 5.3881% 8/15/33 (f) | | 285,000 | | 290,187 |
Series 2003-HE5 Class A2A, 3.7481% 8/15/33 (f) | | 46,027 | | 46,046 |
Series 2003-HE6 Class M1, 4.11% 11/25/33 (f) | | 215,000 | | 215,951 |
Series 2003-HE7 Class A3, 3.7481% 12/15/33 (f) | | 246,585 | | 247,494 |
Series 2004-HE6 Class A2, 3.82% 6/25/34 (f) | | 1,747,159 | | 1,750,852 |
Series 2005-HE2: | | | | |
Class M1, 3.91% 3/25/35 (f) | | 1,105,000 | | 1,103,123 |
Class M2, 3.96% 3/25/35 (f) | | 275,000 | | 275,089 |
Asset-Backed Securities - continued |
| Principal
Amount | | Value
(Note 1) |
Bank One Issuance Trust: | | | | |
Series 2002-B1 Class B1, 3.7681% 12/15/09 (f) | | $ 465,000 | | $ 466,938 |
Series 2002-B2 Class B2, 3.7281% 5/15/08 (f) | | 100,000 | | 100,013 |
Series 2002-B3 Class B, 3.7481% 8/15/08 (f) | | 500,000 | | 500,202 |
Series 2002-C1 Class C1, 4.3481% 12/15/09 (f) | | 675,000 | | 682,229 |
Series 2002-C2 Class C2, 4.3781% 5/15/08 (f) | | 2,850,000 | | 2,852,599 |
Series 2004-C1 Class C1, 3.8881% 11/15/11 (f) | | 25,000 | | 25,119 |
Bayview Financial Acquisition Trust Series 2004-C Class A1, 3.9013% 5/28/44 (f) | | 890,595 | | 890,497 |
Bayview Financial Asset Trust Series 2000-F Class A, 3.9813% 9/28/43 (f) | | 240,470 | | 240,808 |
Bayview Financial Mortgage Loan Trust Series 2004-A Class A, 3.9313% 2/28/44 (f) | | 427,612 | | 428,472 |
Bear Stearns Asset Backed Securities I: | | | | |
Series 2004-BO1: | | | | |
Class M2, 4.21% 9/25/34 (f) | | 390,000 | | 392,565 |
Class M3, 4.51% 9/25/34 (f) | | 265,000 | | 266,723 |
Class M4, 4.66% 9/25/34 (f) | | 225,000 | | 227,761 |
Class M5, 4.86% 9/25/34 (f) | | 210,000 | | 213,245 |
Series 2004-HE9 Class M2, 4.66% 11/25/34 (f) | | 490,000 | | 492,153 |
Series 2005-HE2: | | | | |
Class M1, 3.96% 2/25/35 (f) | | 905,000 | | 902,860 |
Class M2, 4.21% 2/25/35 (f) | | 330,000 | | 330,345 |
Capital Auto Receivables Asset Trust: | | | | |
Series 2003-1 Class B, 3.8581% 6/15/10 (b)(f) | | 139,307 | | 139,701 |
Series 2005-1 Class B, 3.7631% 6/15/10 (f) | | 850,000 | | 850,797 |
Capital One Auto Finance Trust: | | | | |
Series 2003-A Class A4B, 3.6681% 1/15/10 (f) | | 425,000 | | 426,084 |
Series 2004-B Class A4, 3.4981% 8/15/11 (f) | | 1,700,000 | | 1,700,326 |
Capital One Master Trust: | | | | |
Series 2001-1 Class B, 3.8981% 12/15/10 (f) | | 500,000 | | 503,554 |
Series 2001-8A Class B, 3.9381% 8/17/09 (f) | | 405,000 | | 407,079 |
Capital One Multi-Asset Execution Trust: | | | | |
Series 2002-B1 Class B1, 4.0681% 7/15/08 (f) | | 1,035,000 | | 1,035,408 |
Series 2003-B1 Class B1, 4.5581% 2/17/09 (f) | | 1,135,000 | | 1,142,100 |
Series 2003-B6 Class B6, 3.9181% 9/15/11 (f) | | 1,125,000 | | 1,135,593 |
Series 2004-B1 Class B1, 3.8281% 11/15/11 (f) | | 1,180,000 | | 1,185,793 |
Capital One Prime Auto Receivable Trust Series 2004-1 Class A3, 2.02% 11/15/07 | | 15,396 | | 15,267 |
Capital Trust Ltd. Series 2004-1: | | | | |
Class A2, 3.88% 7/20/39 (b)(f) | | 265,000 | | 265,000 |
Class B, 4.18% 7/20/39 (b)(f) | | 140,000 | | 140,000 |
Class C, 4.53% 7/20/39 (b)(f) | | 180,000 | | 180,000 |
Asset-Backed Securities - continued |
| Principal
Amount | | Value
(Note 1) |
Cayman ABSC NIMS Trust Series 2004-HE2 Class A1, 6.75% 4/25/34 (b) | | $ 648,383 | | $ 649,194 |
CDC Mortgage Capital Trust: | | | | |
Series 2002-HE3: | | | | |
Class M1, 4.56% 3/25/33 (f) | | 297,766 | | 301,783 |
Class M2, 5.71% 3/25/33 (f) | | 489,999 | | 498,600 |
Series 2003-HE1 Class M2, 5.41% 8/25/33 (f) | | 215,000 | | 217,562 |
Series 2003-HE2 Class A, 3.81% 10/25/33 (f) | | 71,407 | | 71,452 |
Series 2003-HE3: | | | | |
Class M1, 4.16% 11/25/33 (f) | | 104,999 | | 105,790 |
Class M2, 5.21% 11/25/33 (f) | | 80,000 | | 81,561 |
Series 2003-HE4 Class A2, 3.69% 3/25/34 (f) | | 54,419 | | 54,424 |
Series 2004-HE2 Class M2, 4.66% 7/26/34 (f) | | 175,000 | | 176,563 |
Chase Credit Card Owner Trust: | | | | |
Series 2001-6 Class B, 3.8681% 3/16/09 (f) | | 200,000 | | 200,945 |
Series 2002-6 Class B, 3.7381% 1/15/08 (f) | | 150,000 | | 150,031 |
Series 2004-1 Class B, 3.5881% 5/15/09 (f) | | 295,000 | | 294,943 |
Chase Issuance Trust Series 2004-C3 Class C3, 3.8581% 6/15/12 (f) | | 1,645,000 | | 1,646,915 |
CIT Equipment Collateral Trust Series 2005-VT1 Class C, 4.18% 11/20/12 | | 1,186,832 | | 1,181,903 |
Citibank Credit Card Issuance Trust: | | | | |
Series 2000-C2 Class C2, 4.2488% 10/15/07 (f) | | 900,000 | | 900,584 |
Series 2001-B2 Class B2, 3.8494% 12/10/08 (f) | | 615,000 | | 617,592 |
Series 2002-B1 Class B1, 3.8% 6/25/09 (f) | | 655,000 | | 657,099 |
Series 2002-C1 Class C1, 4.2185% 2/9/09 (f) | | 900,000 | | 909,613 |
Series 2003-C1 Class C1, 4.65% 4/7/10 (f) | | 1,685,000 | | 1,719,786 |
Countrywide Home Loans, Inc.: | | | | |
Series 2002-6 Class AV1, 3.89% 5/25/33 (f) | | 62,494 | | 62,645 |
Series 2003-BC1 Class M2, 5.46% 9/25/32 (f) | | 1,025,000 | | 1,037,455 |
Series 2003-SD3 Class A1, 3.88% 12/25/32 (b)(f) | | 57,073 | | 57,365 |
Series 2004-2 Class M1, 3.96% 5/25/34 (f) | | 375,000 | | 375,485 |
Series 2004-3: | | | | |
Class 3A4, 3.71% 8/25/34 (f) | | 7,367,340 | | 7,337,420 |
Class M1, 3.96% 6/25/34 (f) | | 100,000 | | 100,092 |
Series 2005-1: | | | | |
Class 1AV2, 3.66% 7/25/35 (f) | | 1,220,000 | | 1,219,321 |
Class MV1, 3.86% 7/25/35 (f) | | 435,000 | | 434,337 |
Class MV2, 3.9% 7/25/35 (f) | | 525,000 | | 523,487 |
Class MV3, 3.94% 7/25/35 (f) | | 215,000 | | 214,690 |
Series 2005-AB1 Class A2, 3.67% 8/25/35 (f) | | 2,480,000 | | 2,479,263 |
Series 2005-IM1 Class A1, 3.56% 8/25/34 (c)(f) | | 2,520,000 | | 2,520,000 |
Asset-Backed Securities - continued |
| Principal
Amount | | Value
(Note 1) |
CS First Boston Mortgage Securities Corp.: | | | | |
Series 2003-8 Class A2, 3.85% 4/25/34 (f) | | $ 227,901 | | $ 228,901 |
Series 2004-FRE1: | | | | |
Class A2, 3.81% 4/25/34 (f) | | 277,344 | | 277,333 |
Class B1, 5.26% 4/25/34 (f) | | 605,000 | | 604,973 |
Class M3, 4.11% 4/25/34 (f) | | 610,000 | | 609,974 |
Discover Card Master Trust I Series 2003-4 Class B1, 3.7181% 5/16/11 (f) | | 550,000 | | 552,820 |
Fannie Mae guaranteed REMIC pass thru certificates Series 2004-T5: | | | | |
Class AB1, 3.674% 5/28/35 (f) | | 996,756 | | 996,055 |
Class AB3, 3.8305% 5/28/35 (f) | | 833,229 | | 833,518 |
Class AB8, 3.784% 5/28/35 (f) | | 861,407 | | 861,812 |
Fieldstone Mortgage Investment Corp.: | | | | |
Series 2003-1 Class M1, 4.14% 11/25/33 (f) | | 100,000 | | 100,673 |
Series 2004-1 Class M2, 4.56% 1/25/35 (f) | | 300,000 | | 303,371 |
Series 2004-3 Class M5, 4.91% 8/25/34 (f) | | 1,500,000 | | 1,525,372 |
Series 2005-2 Class 2A1, 3.5% 7/25/36 (f) | | 2,365,000 | | 2,365,000 |
First Franklin Mortgage Loan Asset Backed Certificates: | | | | |
Series 2005-FF2 Class A2A, 3.55% 3/25/35 (f) | | 875,548 | | 875,548 |
Series 2005-FF2 Class M6, 4.16% 3/25/35 (f) | | 1,000,000 | | 1,000,000 |
First Franklin Mortgage Loan Trust Series 2004-FF2: | | | | |
Class M3, 4.01% 3/25/34 (f) | | 25,000 | | 25,044 |
Class M4, 4.36% 3/25/34 (f) | | 25,000 | | 25,221 |
First USA Secured Note Trust Series 2001-3 Class C, 4.4669% 11/19/08 (b)(f) | | 785,000 | | 790,519 |
Ford Credit Auto Owner Trust Series 2003-B Class B2, 3.8181% 10/15/07 (f) | | 650,000 | | 652,386 |
Ford Credit Floorplan Master Owner Trust Series 2005-1: | | | | |
Class A, 3.5381% 5/17/10 (f) | | 1,375,000 | | 1,374,997 |
Class B, 3.6563% 5/17/10 (f) | | 380,000 | | 379,999 |
Fremont Home Loan Trust: | | | | |
Series 2003-B Class M6, 7.96% 12/25/33 (f) | | 960,000 | | 992,118 |
Series 2004-A Class M2, 4.61% 1/25/34 (f) | | 375,000 | | 379,299 |
Series 2004-C: | | | | |
Class 2A2, 4.01% 8/25/34 (f) | | 1,000,000 | | 1,010,199 |
Class M1, 4.11% 8/25/34 (f) | | 540,000 | | 541,931 |
Class M3, 4.61% 8/25/34 (f) | | 1,000,000 | | 1,018,991 |
Series 2005-2 Class 2A1, 3.5913% 6/25/35 (f) | | 2,165,000 | | 2,164,323 |
Series 2005-A: | | | | |
Class 2A2, 3.7% 2/25/35 (f) | | 1,625,000 | | 1,627,147 |
Class M1, 3.89% 1/25/35 (f) | | 225,000 | | 224,558 |
Class M2, 3.92% 1/25/35 (f) | | 325,000 | | 324,515 |
Asset-Backed Securities - continued |
| Principal
Amount | | Value
(Note 1) |
Fremont Home Loan Trust: - continued | | | | |
Series 2005-A: | | | | |
Class M3, 3.95% 1/25/35 (f) | | $ 175,000 | | $ 174,993 |
Class M4, 4.14% 1/25/35 (f) | | 125,000 | | 125,343 |
GE Business Loan Trust Series 2003-1 Class A, 3.8181% 4/15/31 (b)(f) | | 276,597 | | 278,184 |
GE Capital Credit Card Master Note Trust Series 2005-2 Class B, 3.5736% 6/15/11 (f) | | 925,000 | | 924,723 |
Gracechurch Card Funding PLC: | | | | |
Series 5: | | | | |
Class B, 3.6181% 8/15/08 (f) | | 80,000 | | 80,071 |
Class C, 4.3181% 8/15/08 (f) | | 295,000 | | 296,118 |
Series 6 Class B, 3.5781% 2/17/09 (f) | | 75,000 | | 75,066 |
Series 8 Class C, 3.6721% 6/15/10 (f) | | 2,650,000 | | 2,650,000 |
GSAMP Trust: | | | | |
Series 2002-NC1 Class A2, 3.78% 7/25/32 (f) | | 2,606 | | 2,621 |
Series 2003-FM1 Class M1, 4.25% 3/20/33 (f) | | 750,000 | | 756,815 |
Series 2004-AHL Class A2D, 3.82% 8/25/34 (f) | | 2,296,054 | | 2,304,562 |
Series 2004-FM1: | | | | |
Class M1, 4.11% 11/25/33 (f) | | 195,000 | | 194,992 |
Class M2, 4.86% 11/25/33 (f) | | 135,000 | | 137,091 |
Series 2004-FM2 Class M1, 3.96% 1/25/34 (f) | | 250,000 | | 249,989 |
Series 2004-HE1: | | | | |
Class M1, 4.01% 5/25/34 (f) | | 320,000 | | 319,987 |
Class M2, 4.61% 5/25/34 (f) | | 150,000 | | 151,394 |
Series 2005-6: | | | | |
Class A2, 3.67% 6/25/35 (f) | | 1,800,000 | | 1,800,000 |
Class M3, 4.11% 6/25/35 (f) | | 1,555,000 | | 1,555,000 |
Series 2005-9 Class 2A1, 3.5287% 8/25/35 (f) | | 2,470,000 | | 2,470,000 |
Series 2005-HE2 Class M, 3.89% 3/25/35 (f) | | 1,220,000 | | 1,215,813 |
Series 2005-NC1: | | | | |
Class A1, 3.58% 2/25/35 (f) | | 714,733 | | 714,884 |
Class M1, 3.91% 2/25/35 (f) | | 1,205,000 | | 1,201,964 |
Guggenheim Structured Real Estate Funding Ltd.
Series 2005-1 Class C, 4.3944% 5/25/30 (b)(f) | | 2,100,000 | | 2,097,998 |
Harwood Street Funding I LLC Series 2004-1A
Class CTFS, 5.43% 9/20/09 (b)(f) | | 1,700,000 | | 1,700,000 |
HFC Home Equity Loan Asset Backed Certificates
Series 2005-2: | | | | |
Class M1, 3.97% 1/20/34 (f) | | 450,000 | | 450,000 |
Class M2, 4% 1/20/34 (f) | | 335,000 | | 335,000 |
Home Equity Asset Trust: | | | | |
Series 2002-3 Class A5, 3.9% 2/25/33 (f) | | 4,294 | | 4,297 |
Asset-Backed Securities - continued |
| Principal
Amount | | Value
(Note 1) |
Home Equity Asset Trust: - continued | | | | |
Series 2002-4 Class A3, 3.94% 3/25/33 (f) | | $ 32,186 | | $ 32,204 |
Series 2002-5: | | | | |
Class A3, 3.98% 5/25/33 (f) | | 81,392 | | 81,563 |
Class M1, 4.66% 5/25/33 (f) | | 200,000 | | 202,410 |
Series 2003-1: | | | | |
Class A2, 3.93% 6/25/33 (f) | | 186,600 | | 186,755 |
Class M1, 4.46% 6/25/33 (f) | | 670,000 | | 673,241 |
Series 2003-2: | | | | |
Class A2, 3.84% 8/25/33 (f) | | 10,404 | | 10,443 |
Class M1, 4.34% 8/25/33 (f) | | 80,000 | | 80,866 |
Series 2003-3: | | | | |
Class A2, 3.82% 8/25/33 (f) | | 65,752 | | 65,998 |
Class M1, 4.32% 8/25/33 (f) | | 330,000 | | 333,299 |
Series 2003-4: | | | | |
Class M1, 4.26% 10/25/33 (f) | | 170,000 | | 171,264 |
Class M2, 5.36% 10/25/33 (f) | | 200,000 | | 202,626 |
Series 2003-5: | | | | |
Class A2, 3.81% 12/25/33 (f) | | 271,685 | | 272,645 |
Class M1, 4.16% 12/25/33 (f) | | 160,000 | | 160,890 |
Class M2, 5.19% 12/25/33 (f) | | 70,000 | | 71,691 |
Series 2003-7: | | | | |
Class A2, 3.84% 3/25/34 (f) | | 625,665 | | 627,147 |
Class M1, 4.11% 3/25/34 (f) | | 795,000 | | 796,953 |
Series 2003-8 Class M1, 4.18% 4/25/34 (f) | | 260,000 | | 261,345 |
Series 2004-4 Class A2, 3.78% 10/25/34 (f) | | 698,058 | | 700,513 |
Series 2004-6 Class A2, 3.81% 12/25/34 (f) | | 1,156,164 | | 1,159,839 |
Series 2005-1: | | | | |
Class M1, 3.89% 5/25/35 (f) | | 1,270,000 | | 1,269,027 |
Class M2, 3.91% 5/25/35 (f) | | 1,410,000 | | 1,405,869 |
Class M3, 3.96% 5/25/35 (f) | | 760,000 | | 757,827 |
Series 2005-2: | | | | |
Class 2A2, 3.66% 7/25/35 (f) | | 1,830,000 | | 1,829,053 |
Class M1, 3.91% 7/25/35 (f) | | 890,000 | | 889,149 |
Household Affinity Credit Card Master Note Trust I
Series 2003-3 Class B, 3.6781% 8/15/08 (f) | | 500,000 | | 500,904 |
Household Credit Card Master Trust I Series 2002-1 Class B, 4.0381% 7/15/08 (f) | | 300,000 | | 300,261 |
Household Home Equity Loan Trust: | | | | |
Series 2002-3 Class A, 3.88% 7/20/32 (f) | | 65,349 | | 65,435 |
Series 2003-1 Class M, 4.06% 10/20/32 (f) | | 39,800 | | 39,846 |
Series 2003-2: | | | | |
Class A, 3.76% 9/20/33 (f) | | 191,819 | | 192,196 |
Asset-Backed Securities - continued |
| Principal
Amount | | Value
(Note 1) |
Household Home Equity Loan Trust: - continued | | | | |
Series 2003-2: | | | | |
Class M, 4.01% 9/20/33 (f) | | $ 90,975 | | $ 91,172 |
Series 2004-1 Class M, 3.95% 9/20/33 (f) | | 249,772 | | 250,245 |
Household Mortgage Loan Trust: | | | | |
Series 2002-HC1 Class M, 4.08% 5/20/32 (f) | | 61,785 | | 61,854 |
Series 2003-HC1 Class M, 4.08% 2/20/33 (f) | | 85,634 | | 85,904 |
Series 2003-HC2 Class M, 4.03% 6/20/33 (f) | | 133,207 | | 133,343 |
Series 2004-HC1: | | | | |
Class A, 3.78% 2/20/34 (f) | | 561,710 | | 563,114 |
Class M, 3.93% 2/20/34 (f) | | 340,666 | | 340,627 |
Household Private Label Credit Card Master Note Trust I: | | | | |
Series 2002-2 Class A, 3.5581% 1/18/11 (f) | | 1,000,000 | | 1,001,358 |
Series 2002-3 Class B, 4.6381% 9/15/09 (f) | | 150,000 | | 150,335 |
Ikon Receivables Funding LLC Series 2003-1 Class A3A, 3.6213% 12/17/07 (f) | | 146,379 | | 146,414 |
IXIS Real Estate Capital Trust Series 2005-HE1: | | | | |
Class A1, 3.71% 6/25/35 (f) | | 1,585,056 | | 1,584,969 |
Class M1, 3.93% 6/25/35 (f) | | 550,000 | | 549,304 |
Class M2, 3.95% 6/25/35 (f) | | 375,000 | | 373,784 |
Class M3, 3.98% 6/25/35 (f) | | 250,000 | | 249,692 |
Keycorp Student Loan Trust Series 1999-A Class A2, 3.8% 12/27/09 (f) | | 295,527 | | 296,531 |
Long Beach Mortgage Loan Trust: | | | | |
Series 2003-2 Class M1, 4.28% 6/25/33 (f) | | 500,000 | | 503,235 |
Series 2003-3 Class M1, 4.21% 7/25/33 (f) | | 340,000 | | 342,390 |
MASTR Adjustable Rate Mortgages Trust Series 2004-11 Class 1A4, 3.95% 11/25/34 (f) | | 201,856 | | 202,942 |
MASTR Asset Backed Securities Trust: | | | | |
Series 2004-FRE1 Class M1, 4.01% 7/25/34 (f) | | 485,000 | | 486,481 |
Series 2004-HE1 Class M1, 4.11% 9/25/34 (f) | | 685,000 | | 687,439 |
MBNA Asset Backed Note Trust Series 2000-K Class C, 4.1881% 3/17/08 (b)(f) | | 1,000,000 | | 1,001,200 |
MBNA Credit Card Master Note Trust: | | | | |
Series 2001-B1 Class B1, 3.7631% 10/15/08 (f) | | 1,250,000 | | 1,251,753 |
Series 2001-B2 Class B2, 3.7481% 1/15/09 (f) | | 1,000,000 | | 1,002,535 |
Series 2002-B2 Class B2, 3.7681% 10/15/09 (f) | | 1,034,000 | | 1,038,477 |
Series 2002-B4 Class B4, 3.8881% 3/15/10 (f) | | 630,000 | | 634,975 |
Series 2003-B2 Class B2, 3.7781% 10/15/10 (f) | | 125,000 | | 126,272 |
Series 2003-B3 Class B3, 3.7631% 1/18/11 (f) | | 1,550,000 | | 1,557,355 |
Series 2003-B5 Class B5, 3.7581% 2/15/11 (f) | | 2,000,000 | | 2,015,453 |
Asset-Backed Securities - continued |
| Principal
Amount | | Value
(Note 1) |
MBNA Master Credit Card Trust II: | | | | |
Series 1998-E Class B, 3.9288% 9/15/10 (f) | | $ 200,000 | | $ 201,194 |
Series 1998-G Class B, 3.7881% 2/17/09 (f) | | 500,000 | | 501,089 |
Meritage Mortgage Loan Trust Series 2004-1: | | | | |
Class M1, 3.96% 7/25/34 (f) | | 150,000 | | 149,994 |
Class M2, 4.01% 7/25/34 (f) | | 25,000 | | 24,999 |
Class M3, 4.41% 7/25/34 (f) | | 50,000 | | 49,998 |
Class M4, 4.56% 7/25/34 (f) | | 50,000 | | 49,998 |
Merrill Lynch Mortgage Investors, Inc.: | | | | |
Series 2004-FM1 Class M2, 4.61% 1/25/35 (f) | | 150,000 | | 152,512 |
Series 2004-HE2: | | | | |
Class A1B, 3.93% 8/25/35 (f) | | 676,518 | | 678,301 |
Class A2B, 3.84% 8/25/35 (f) | | 1,510,000 | | 1,516,695 |
Series 2005-NC1 Class A2A, 3.57% 10/25/35 (f) | | 75,282 | | 75,295 |
Morgan Stanley ABS Capital I, Inc.: | | | | |
Series 2002-HE3 Class M1, 4.56% 12/27/32 (f) | | 125,000 | | 126,613 |
Series 2003-NC10 Class M1, 4.14% 10/25/33 (f) | | 830,000 | | 833,555 |
Series 2003-NC5 Class M2, 5.46% 4/25/33 (f) | | 200,000 | | 202,438 |
Series 2003-NC6 Class M2, 5.41% 6/27/33 (f) | | 630,000 | | 646,975 |
Series 2003-NC8 Class M1, 4.16% 9/25/33 (f) | | 120,000 | | 120,688 |
Series 2004-HE6 Class A2, 3.8% 8/25/34 (f) | | 1,198,948 | | 1,202,870 |
Series 2004-NC2 Class M1, 4.01% 12/25/33 (f) | | 375,000 | | 375,630 |
Series 2004-NC6 Class A2, 3.8% 7/25/34 (f) | | 318,867 | | 319,551 |
Series 2004-NC7 Class A3, 3.76% 7/25/34 (f) | | 2,000,000 | | 2,002,503 |
Series 2005-1: | | | | |
Class M2, 3.93% 12/25/34 (f) | | 570,000 | | 569,077 |
Class M3, 3.98% 12/25/34 (f) | | 525,000 | | 524,772 |
Series 2005-HE1: | | | | |
Class A3B, 3.68% 12/25/34 (f) | | 505,000 | | 505,554 |
Class M1, 3.91% 12/25/34 (f) | | 150,000 | | 150,307 |
Class M2, 3.93% 12/25/34 (f) | | 385,000 | | 384,529 |
Series 2005-HE2: | | | | |
Class M1, 3.86% 1/25/35 (f) | | 370,000 | | 370,764 |
Class M2, 3.9% 1/25/35 (f) | | 265,000 | | 264,137 |
Series 2005-NC1: | | | | |
Class M1, 3.9% 1/25/35 (f) | | 325,000 | | 326,036 |
Class M2, 3.93% 1/25/35 (f) | | 325,000 | | 324,471 |
Class M3, 3.97% 1/25/35 (f) | | 325,000 | | 325,114 |
Morgan Stanley Dean Witter Capital I Trust: | | | | |
Series 2001-AM1: | | | | |
Class M1, 4.31% 2/25/32 (f) | | 710,724 | | 712,449 |
Class M2, 4.86% 2/25/32 (f) | | 352,076 | | 353,279 |
Asset-Backed Securities - continued |
| Principal
Amount | | Value
(Note 1) |
Morgan Stanley Dean Witter Capital I Trust: - continued | | | | |
Series 2001-NC1 Class M2, 4.53% 10/25/31 (f) | | $ 42,925 | | $ 42,925 |
Series 2001-NC2 Class B1, 5.41% 1/25/32 (f) | | 191,907 | | 191,996 |
Series 2001-NC4 Class M1, 4.46% 1/25/32 (f) | | 136,710 | | 137,208 |
Series 2002-AM3 Class A3, 3.95% 2/25/33 (f) | | 28,532 | | 28,612 |
Series 2002-HE1 Class M1, 4.06% 7/25/32 (f) | | 590,000 | | 593,338 |
Series 2002-NC3 Class M1, 4.18% 8/25/32 (f) | | 100,000 | | 100,768 |
Series 2002-OP1 Class M1, 4.21% 9/25/32 (f) | | 435,350 | | 437,933 |
Series 2003-NC1 Class M2, 5.51% 11/25/32 (f) | | 130,000 | | 131,317 |
Series 2003-NC2: | | | | |
Class A3, 3.89% 2/25/33 (f) | | 250,680 | | 250,814 |
Class M2, 5.46% 2/25/33 (f) | | 165,000 | | 167,614 |
Navistar Financial Corp. Owner Trust Series 2001-B Class B, 4.83% 11/17/08 | | 380,731 | | 380,097 |
New Century Home Equity Loan Trust: | | | | |
Series 2003-2 Class A2, 3.89% 1/25/33 (f) | | 12,065 | | 12,072 |
Series 2005-1: | | | | |
Class M1, 3.91% 3/25/35 (f) | | 595,000 | | 594,722 |
Class M2, 3.94% 3/25/35 (f) | | 595,000 | | 593,624 |
Class M3, 3.98% 3/25/35 (f) | | 290,000 | | 290,109 |
Nissan Auto Lease Trust: | | | | |
Series 2003-A Class A3A, 3.5281% 6/15/09 (f) | | 681,088 | | 681,672 |
Series 2004-A Class A4A, 3.4581% 6/15/10 (f) | | 1,325,000 | | 1,326,627 |
NovaStar Home Equity Loan Series 2004-1: | | | | |
Class M1, 3.91% 6/25/34 (f) | | 100,000 | | 100,084 |
Class M4, 4.435% 6/25/34 (f) | | 170,000 | | 170,290 |
NovaStar Mortgage Funding Trust Series 2003-3
Class A3, 3.91% 12/25/33 (f) | | 355,121 | | 356,969 |
Onyx Acceptance Owner Trust Series 2003-D Class A3, 2.4% 12/15/07 | | 253,203 | | 252,146 |
Option One Mortgage Loan Trust Series 2003-6
Class M1, 4.11% 11/25/33 (f) | | 1,025,000 | | 1,029,413 |
Ownit Mortgage Loan Asste-Backed Certificates
Series 2005-3 Class A2A, 3.5% 6/25/36 (f) | | 2,200,000 | | 2,200,000 |
Park Place Securities NIM Trust Series 2004-WHQN2 Class A, 4% 2/25/35 (b) | | 703,944 | | 698,665 |
Park Place Securities Nims Trust Series 2004-MHQ1 Class B, 3.474% 12/25/34 (b) | | 122,735 | | 121,508 |
Park Place Securities, Inc.: | | | | |
Series 2004 WWF1 Class M4, 4.56% 1/25/35 (f) | | 945,000 | | 964,465 |
Series 2004-WCW1: | | | | |
Class M1, 4.09% 9/25/34 (f) | | 385,000 | | 386,205 |
Class M2, 4.14% 9/25/34 (f) | | 160,000 | | 160,850 |
Asset-Backed Securities - continued |
| Principal
Amount | | Value
(Note 1) |
Park Place Securities, Inc.: - continued | | | | |
Series 2004-WCW1: | | | | |
Class M3, 4.71% 9/25/34 (f) | | $ 310,000 | | $ 313,857 |
Class M4, 4.91% 9/25/34 (f) | | 435,000 | | 441,258 |
Series 2004-WCW2 Class A2, 3.84% 10/25/34 (f) | | 890,219 | | 892,848 |
Series 2004-WWF1 Class A5, 3.93% 1/25/35 (f) | | 482,969 | | 485,702 |
Series 2005-WCH1: | | | | |
Class A3B, 3.68% 1/25/35 (f) | | 360,000 | | 360,637 |
Class M2, 3.98% 1/25/35 (f) | | 1,130,000 | | 1,127,710 |
Class M3, 4.02% 1/25/35 (f) | | 425,000 | | 425,336 |
Class M5, 4.34% 1/25/35 (f) | | 400,000 | | 401,243 |
People's Choice Home Loan Securities Trust Series 2005-2: | | | | |
Class A1, 3.57% 9/25/24 (f) | | 1,082,642 | | 1,082,642 |
Class M4, 4.09% 5/25/35 (f) | | 870,000 | | 870,000 |
Providian Gateway Master Trust Series 2002-B Class A, 4.0881% 6/15/09 (b)(f) | | 400,000 | | 401,050 |
Residental Asset Securities Corp.: | | | | |
Series 2004-KS10 Class AI2, 3.78% 3/25/29 (f) | | 50,000 | | 50,163 |
Series 2005-KS7 Class A1, 3.4781% 8/25/35 (f) | | 1,485,000 | | 1,484,703 |
Residential Asset Mortgage Products, Inc.: | | | | |
Series 2004-RS10 Class MII2, 4.71% 10/25/34 (f) | | 1,300,000 | | 1,315,803 |
Series 2004-RS6: | | | | |
Class 2M2, 4.76% 6/25/34 (f) | | 250,000 | | 249,999 |
Class 2M3, 4.91% 6/25/34 (f) | | 250,000 | | 249,999 |
Salomon Brothers Mortgage Securities VII, Inc.
Series 2003-HE1 Class A, 3.86% 4/25/33 (f) | | 33,795 | | 33,950 |
Saxon Asset Securities Trust: | | | | |
Series 2004-1 Class M1, 3.99% 3/25/35 (f) | | 640,000 | | 639,839 |
Series 2004-2 Class MV1, 4.04% 8/25/35 (f) | | 415,000 | | 415,558 |
Sears Credit Account Master Trust II: | | | | |
Series 2002-4: | | | | |
Class A, 3.5181% 8/18/09 (f) | | 800,000 | | 799,988 |
Class B, 3.8131% 8/18/09 (f) | | 1,080,000 | | 1,080,037 |
Series 2002-5 Class B, 4.6381% 11/17/09 (f) | | 500,000 | | 501,050 |
Specialty Underwriting & Residential Finance: | | | | |
Series 2003-BC3 Class M1, 4.11% 8/25/34 (f) | | 1,000,000 | | 1,000,989 |
Series 2003-BC4 Class M1, 4.06% 11/25/34 (f) | | 260,000 | | 261,214 |
Structured Asset Securities Corp. Series 2004-GEL1 Class A, 3.82% 2/25/34 (f) | | 79,391 | | 79,391 |
Superior Wholesale Inventory Financing Trust VII
Series 2003-A8 Class CTFS, 3.8381% 3/15/11 (b)(f) | | 675,000 | | 674,578 |
Superior Wholesale Inventory Financing Trust XII
Series 2005-A12 Class C, 4.46% 6/15/10 (f) | | 980,000 | | 979,992 |
Asset-Backed Securities - continued |
| Principal
Amount | | Value
(Note 1) |
Terwin Mortgage Trust: | | | | |
Series 2003-4HE Class A1, 3.89% 9/25/34 (f) | | $ 316,689 | | $ 318,405 |
Series 2003-6HE Class A1, 3.93% 11/25/33 (f) | | 121,556 | | 121,840 |
Series 2005-14HE Class AF1, 3.9753% 7/25/36 (c)(f) | | 1,205,000 | | 1,204,762 |
Triad Automobile Receivable Owner Trust Series 2005-A Class A3, 4.05% 3/12/10 | | 1,800,000 | | 1,786,140 |
WFS Financial Owner Trust: | | | | |
Series 2004-3 Class D, 4.07% 2/17/12 | | 514,264 | | 510,174 |
Series 2004-4 Class D, 3.58% 5/17/12 | | 470,497 | | 464,431 |
Series 2005-1 Class D, 4.09% 8/15/12 | | 495,000 | | 490,205 |
TOTAL ASSET-BACKED SECURITIES (Cost $208,706,183) | 209,007,290 |
Collateralized Mortgage Obligations - 16.5% |
|
Private Sponsor - 12.7% |
Adjustable Rate Mortgage Trust floater: | | | | |
Series 2004-2 Class 7A3, 3.86% 2/25/35 (f) | | 1,442,226 | | 1,445,544 |
Series 2004-4 Class 5A2, 3.86% 3/25/35 (f) | | 457,785 | | 458,697 |
Series 2005-1 Class 5A2, 3.79% 5/25/35 (f) | | 805,325 | | 805,834 |
Series 2005-2: | | | | |
Class 6A2, 3.74% 6/25/35 (f) | | 404,220 | | 404,482 |
Class 6M2, 3.94% 6/25/35 (f) | | 1,375,000 | | 1,375,001 |
Series 2005-3 Class 8A2, 3.7% 7/25/35 (f) | | 2,667,770 | | 2,669,507 |
Series 2005-5 Class 6A2, 3.69% 9/25/35 (f) | | 1,718,837 | | 1,719,960 |
Series 2005-8 Class 7A2, 3.77% 11/25/35 (f) | | 1,080,000 | | 1,080,000 |
Bear Stearns Alt-A Trust floater: | | | | |
Series 2005-1 Class A1, 3.74% 1/25/35 (f) | | 2,624,958 | | 2,624,958 |
Series 2005-2 Class 1A1, 3.71% 3/25/35 (f) | | 2,137,295 | | 2,137,295 |
Countrywide Home Loans, Inc. floater: | | | | |
Series 2004-16 Class A1, 3.86% 9/25/34 (f) | | 861,288 | | 860,487 |
Series 2005-1 Class 2A1, 3.75% 3/25/35 (f) | | 1,999,309 | | 1,999,309 |
CS First Boston Mortgage Securities Corp. floater: | | | | |
Series 2004-AR2 Class 6A1, 3.86% 3/25/34 (f) | | 381,304 | | 381,067 |
Series 2004-AR3 Class 6A2, 3.83% 4/25/34 (f) | | 156,402 | | 156,541 |
Series 2004-AR5 Class 11A2, 3.83% 6/25/34 (f) | | 247,979 | | 247,474 |
Series 2004-AR6 Class 9A2, 3.83% 10/25/34 (f) | | 338,414 | | 338,617 |
Series 2004-AR7 Class 6A2, 3.84% 8/25/34 (f) | | 554,730 | | 555,220 |
Series 2004-AR8 Class 8A2, 3.84% 9/25/34 (f) | | 501,538 | | 502,468 |
Fieldstone Mortgage Investment Corp. floater Series 2004-1 Class 2A, 3.75% 1/25/35 (f) | | 1,470,843 | | 1,473,489 |
First Horizon Mortgage Passthru Trust floater Series 2004-FL1 Class 2A1, 3.95% 12/25/34 (f) | | 587,411 | | 586,732 |
Collateralized Mortgage Obligations - continued |
| Principal
Amount | | Value
(Note 1) |
Private Sponsor - continued |
Granite Master Issuer PLC floater: | | | | |
Series 2005-1: | | | | |
Class A3, 3.51% 12/21/24 (f) | | $ 700,000 | | $ 699,869 |
Class B1, 3.56% 12/20/54 (f) | | 950,000 | | 949,673 |
Class M1, 3.66% 12/20/54 (f) | | 700,000 | | 699,759 |
Series 2005-2 Class C1, 3.7857% 12/20/54 (f) | | 1,200,000 | | 1,199,625 |
Granite Mortgages PLC floater: | | | | |
Series 2004-1: | | | | |
Class 1B, 3.64% 3/20/44 (f) | | 95,000 | | 94,990 |
Class 1C, 4.33% 3/20/44 (f) | | 280,000 | | 281,114 |
Class 1M, 3.84% 3/20/44 (f) | | 565,000 | | 565,429 |
Series 2004-2: | | | | |
Class 1A2, 3.5% 6/20/28 (f) | | 414,174 | | 414,226 |
Class 1B, 3.6% 6/20/44 (f) | | 82,769 | | 82,790 |
Class 1C, 4.13% 6/20/44 (f) | | 302,300 | | 302,922 |
Class 1M, 3.71% 6/20/44 (f) | | 1,811,086 | | 1,811,990 |
Series 2004-3: | | | | |
Class 1B, 3.59% 9/20/44 (f) | | 200,000 | | 200,020 |
Class 1C, 4.02% 9/20/44 (f) | | 605,000 | | 606,331 |
Class 1M, 3.7% 9/20/44 (f) | | 100,000 | | 100,030 |
GSAMP Trust floater Series 2004-11 Class 2A1, 3.79% 12/20/34 (f) | | 1,902,591 | | 1,903,510 |
Holmes Financing No. 7 PLC floater Series 2 Class M, 4.3988% 7/15/40 (f) | | 195,000 | | 195,374 |
Holmes Financing No. 8 PLC floater Series 2: | | | | |
Class A, 3.6788% 4/15/11 (f) | | 1,400,000 | | 1,400,000 |
Class B, 3.7688% 7/15/40 (f) | | 190,000 | | 190,119 |
Class C, 4.3188% 7/15/40 (f) | | 775,000 | | 778,633 |
Homestar Mortgage Acceptance Corp. floater
Series 2004-5 Class A1, 3.91% 10/25/34 (f) | | 1,226,026 | | 1,229,819 |
Impac CMB Trust floater: | | | | |
Series 2004-11 Class 2A2, 3.83% 3/25/35 (f) | | 1,006,838 | | 1,006,641 |
Series 2004-6 Class 1A2, 3.85% 10/25/34 (f) | | 359,177 | | 359,819 |
Series 2005-1: | | | | |
Class M1, 3.92% 4/25/35 (f) | | 431,371 | | 430,916 |
Class M2, 3.96% 4/25/35 (f) | | 762,845 | | 762,219 |
Class M3, 3.99% 4/25/35 (f) | | 186,171 | | 185,974 |
Class M4, 4.21% 4/25/35 (f) | | 113,519 | | 113,634 |
Class M5, 4.23% 4/25/35 (f) | | 113,519 | | 113,496 |
Class M6, 4.28% 4/25/35 (f) | | 177,089 | | 177,054 |
Series 2005-2 Class 1A2, 3.77% 4/25/35 (f) | | 1,780,275 | | 1,778,884 |
Series 2005-4 Class 1B1, 4.76% 6/25/35 (f) | | 768,362 | | 764,881 |
Collateralized Mortgage Obligations - continued |
| Principal
Amount | | Value
(Note 1) |
Private Sponsor - continued |
Lehman Structured Securities Corp. floater Series 2005-1 Class A2, 3.67% 9/26/45 (b)(f) | | $ 2,279,281 | | $ 2,279,281 |
Master Seasoned Securitization Trust Series 2004-1 Class 1A1, 6.2437% 8/25/17 (f) | | 724,549 | | 740,972 |
MASTR Adjustable Rate Mortgages Trust: | | | | |
floater: | | | | |
Series 2004-11: | | | | |
Class 2A1, 3.84% 11/25/34 (f) | | 920,409 | | 922,519 |
Class 2A2, 3.9% 11/25/34 (f) | | 202,627 | | 202,989 |
Series 2005-1 Class 1A1, 3.73% 3/25/35 (f) | | 1,828,937 | | 1,827,794 |
Series 2004-6 Class 4A2, 4.1729% 7/25/34 (f) | | 3,000,000 | | 2,988,733 |
Merrill Lynch Mortgage Investors, Inc.: | | | | |
floater: | | | | |
Series 2003-A: | | | | |
Class 2A1, 3.85% 3/25/28 (f) | | 307,678 | | 309,340 |
Class 2A2, 3.5225% 3/25/28 (f) | | 109,885 | | 110,037 |
Series 2003-B Class A1, 3.8% 4/25/28 (f) | | 285,446 | | 287,110 |
Series 2003-D Class A, 3.77% 8/25/28 (f) | | 1,398,627 | | 1,401,467 |
Series 2003-E Class A2, 3.4425% 10/25/28 (f) | | 610,693 | | 610,694 |
Series 2003-F Class A2, 3.7075% 10/25/28 (f) | | 644,648 | | 644,574 |
Series 2004-A Class A2, 3.6175% 4/25/29 (f) | | 814,476 | | 812,541 |
Series 2004-B Class A2, 3.79% 6/25/29 (f) | | 773,875 | | 772,011 |
Series 2004-C Class A2, 3.95% 7/25/29 (f) | | 1,096,179 | | 1,093,557 |
Series 2004-D Class A2, 3.4725% 9/25/29 (f) | | 1,116,205 | | 1,116,496 |
Series 2004-E Class A2D, 3.9175% 11/25/29 (f) | | 1,189,384 | | 1,195,098 |
Series 2004-G Class A2, 3.95% 11/25/29 (f) | | 468,938 | | 468,889 |
Series 2005-A Class A2, 3.38% 2/25/30 (f) | | 1,468,737 | | 1,466,623 |
Series 2005-B Class A2, 3.75% 6/25/30 (f) | | 1,542,233 | | 1,542,233 |
Series 2003-G Class XA1, 1% 1/25/29 (h) | | 2,547,661 | | 33,024 |
MortgageIT Trust floater Series 2004-2: | | | | |
Class A1, 3.83% 12/25/34 (f) | | 593,487 | | 594,347 |
Class A2, 3.91% 12/25/34 (f) | | 801,651 | | 806,407 |
Opteum Mortgage Acceptance Corp. floater
Series 2005-3 Class APT, 3.75% 6/25/35 (f) | | 2,639,441 | | 2,640,987 |
Permanent Financing No. 1 PLC floater Series 1: | | | | |
Class 2C, 4.5594% 6/10/42 (f) | | 2,000,000 | | 2,005,024 |
Class 3C, 4.5794% 6/10/42 (f) | | 1,700,000 | | 1,708,127 |
Permanent Financing No. 3 PLC floater Series 2 Class C, 4.4294% 6/10/42 (f) | | 1,205,000 | | 1,217,050 |
Permanent Financing No. 4 PLC floater Series 2 Class C, 4.0994% 6/10/42 (f) | | 1,145,000 | | 1,150,599 |
Collateralized Mortgage Obligations - continued |
| Principal
Amount | | Value
(Note 1) |
Private Sponsor - continued |
Permanent Financing No. 5 PLC floater: | | | | |
Series 2 Class C, 4.0294% 6/10/42 (f) | | $ 390,000 | | $ 391,828 |
Series 3 Class C, 4.1994% 6/10/42 (f) | | 825,000 | | 832,219 |
Permanent Financing No. 6 PLC floater Series 6: | | | | |
Class 1C, 3.7294% 6/10/42 (f) | | 500,000 | | 500,072 |
Class 2C, 3.8294% 6/10/42 (f) | | 1,600,000 | | 1,600,701 |
Permanent Financing No. 7 PLC floater Series 7: | | | | |
Class 1B, 3.4694% 6/10/42 (f) | | 2,000,000 | | 1,999,375 |
Class 1C, 3.6594% 6/10/42 (f) | | 545,000 | | 544,830 |
Class 2C, 3.7094% 6/10/42 (f) | | 1,140,000 | | 1,138,575 |
Permanent Financing No. 8 PLC floater Series 8: | | | | |
Class 1C, 3.7475% 6/10/42 (f) | | 1,035,000 | | 1,034,656 |
Class 2C, 3.8175% 6/10/42 (f) | | 1,435,000 | | 1,434,522 |
Residential Asset Mortgage Products, Inc. sequential pay: | | | | |
Series 2003-SL1 Class A31, 7.125% 4/25/31 | | 299,187 | | 304,589 |
Series 2004-SL2 Class A1, 6.5% 10/25/16 | | 128,532 | | 130,577 |
Residential Finance LP/Residential Finance Development Corp. floater Series 2003-A: | | | | |
Class B4, 5.15% 3/10/35 (b)(f) | | 96,351 | | 97,797 |
Class B5, 5.7% 3/10/35 (b)(f) | | 96,351 | | 98,499 |
Residential Funding Securities Corp.: | | | | |
Series 2003-RP1 Class A1, 3.96% 11/25/34 (f) | | 119,195 | | 119,685 |
Series 2003-RP2 Class A1, 3.93% 6/25/33 (b)(f) | | 202,975 | | 203,758 |
Sequoia Mortgage Funding Trust Series 2003-A
Class AX1, 0.8% 10/21/08 (b)(h) | | 8,611,532 | | 65,052 |
Sequoia Mortgage Trust floater: | | | | |
Series 2003-5 Class A2, 3.41% 9/20/33 (f) | | 549,955 | | 549,812 |
Series 2003-7 Class A2, 2.885% 1/20/34 (f) | | 275,380 | | 275,140 |
Series 2004-1 Class A, 4.15% 2/20/34 (f) | | 434,689 | | 434,294 |
Series 2004-10 Class A4, 3.6681% 11/20/34 (f) | | 1,267,083 | | 1,265,057 |
Series 2004-12 Class 1A2, 3.93% 1/20/35 (f) | | 1,997,935 | | 2,003,410 |
Series 2004-4 Class A, 3.5881% 5/20/34 (f) | | 1,532,956 | | 1,529,426 |
Series 2004-5 Class A3, 3.77% 6/20/34 (f) | | 508,802 | | 508,405 |
Series 2004-6: | | | | |
Class A3A, 4.1475% 6/20/35 (f) | | 681,844 | | 681,395 |
Class A3B, 3.16% 7/20/34 (f) | | 1,363,688 | | 1,362,600 |
Series 2004-7: | | | | |
Class A3A, 3.2275% 8/20/34 (f) | | 724,191 | | 723,603 |
Class A3B, 3.4525% 7/20/34 (f) | | 1,406,196 | | 1,411,214 |
Series 2004-8 Class A2, 3.45% 9/20/34 (f) | | 2,235,112 | | 2,233,959 |
Series 2005-1 Class A2, 3.68% 2/20/35 (f) | | 962,779 | | 962,658 |
Collateralized Mortgage Obligations - continued |
| Principal
Amount | | Value
(Note 1) |
Private Sponsor - continued |
Sequoia Mortgage Trust floater: - continued | | | | |
Series 2005-2 Class A2, 3.36% 3/20/35 (f) | | $ 1,946,098 | | $ 1,946,098 |
Structured Asset Securities Corp. floater
Series 2004-NP1 Class A, 3.86% 9/25/33 (b)(f) | | 230,722 | | 230,868 |
Thornburg Mortgage Securities Trust floater
Series 2004-3 Class A, 3.83% 9/25/34 (f) | | 2,808,663 | | 2,816,468 |
WAMU Mortgage pass thru certificates: | | | | |
sequential pay Series 2002-S6 Class A25, 6% 10/25/32 | | 171,075 | | 171,508 |
Series 2005 AR11 Class A1C1, 3.6675% 8/25/40 (f) | | 2,100,000 | | 2,100,000 |
Washington Mutual Mortgage Securities Corp. sequential pay Series 2003-MS9 Class 2A1, 7.5% 12/25/33 | | 78,782 | | 81,643 |
Wells Fargo Mortgage Backed Securities Trust: | | | | |
Series 2004-M Class A3, 4.7024% 8/25/34 (f) | | 2,575,000 | | 2,563,233 |
Series 2005-AR10 Class 2A2, 4.111% 6/25/35 (f) | | 5,290,736 | | 5,216,856 |
Series 2005-AR12 Class 2A1, 4.322% 7/25/35 (f) | | 4,674,576 | | 4,635,136 |
TOTAL PRIVATE SPONSOR | | 116,370,464 |
U.S. Government Agency - 3.8% |
Fannie Mae: | | | | |
floater Series 2002-89 Class F, 3.6144% 1/25/33 (f) | | 151,287 | | 151,520 |
planned amortization class Series 1993-207 Class G, 6.15% 4/25/23 | | 767,885 | | 777,471 |
Fannie Mae guaranteed REMIC pass thru certificates: | | | | |
floater: | | | | |
Series 2002-11 Class QF, 3.8144% 3/25/32 (f) | | 194,320 | | 195,777 |
Series 2002-36 Class FT, 3.8144% 6/25/32 (f) | | 191,121 | | 192,747 |
Series 2002-64 Class FE, 3.61% 10/18/32 (f) | | 102,105 | | 102,578 |
Series 2002-74 Class FV, 3.7644% 11/25/32 (f) | | 124,440 | | 125,345 |
Series 2003-11: | | | | |
Class DF, 3.7644% 2/25/33 (f) | | 105,782 | | 106,519 |
Class EF, 3.7644% 2/25/33 (f) | | 75,425 | | 75,729 |
planned amortization class: | | | | |
Series 2001-62 Class PG, 6.5% 10/25/30 | | 58,759 | | 58,918 |
Series 2002-11 Class QB, 5.5% 3/25/15 | | 558,895 | | 562,833 |
Series 2002-28 Class PJ, 6.5% 3/25/31 | | 822,731 | | 823,900 |
Series 2002-52 Class PA, 6% 4/25/31 | | 22,759 | | 22,846 |
Series 2002-8 Class PD, 6.5% 7/25/30 | | 249,689 | | 250,738 |
Series 2003-32 Class PB, 3% 6/25/16 | | 675,385 | | 671,742 |
Series 2002-50 Class LE, 7% 12/25/29 | | 123,070 | | 124,803 |
Collateralized Mortgage Obligations - continued |
| Principal
Amount | | Value
(Note 1) |
U.S. Government Agency - continued |
Fannie Mae guaranteed REMIC pass thru certificates: - continued | | | | |
Series 2004-31 Class IA, 4.5% 6/25/10 (h) | | $ 542,525 | | $ 19,472 |
Series 2005-15 Class AZ, 5% 3/25/35 | | 1,387,431 | | 1,383,638 |
Series 2005-28 Class AZ, 5% 4/25/35 | | 960,396 | | 958,297 |
Freddie Mac planned amortization class: | | | | |
Series 2091 Class PP, 6% 2/15/27 | | 98,417 | | 98,370 |
Series 2162 Class PH, 6% 6/15/29 | | 1,775,787 | | 1,831,867 |
Freddie Mac Multi-class participation certificates Series 3007 Class ZN 4.5% 7/15/25 | | 1,362,420 | | 1,345,405 |
Freddie Mac Multi-class participation certificates guaranteed: | | | | |
floater: | | | | |
Series 2526 Class FC, 3.7881% 11/15/32 (f) | | 35,449 | | 35,631 |
Series 2538 Class FB, 3.7881% 12/15/32 (f) | | 220,147 | | 221,593 |
Series 2551 Class FH, 3.8381% 1/15/33 (f) | | 102,120 | | 102,552 |
planned amortization class: | | | | |
Series 2316 Class PB, 6.5% 9/15/30 | | 301,240 | | 302,017 |
Series 2394 Class ND, 6% 6/15/27 | | 114,698 | | 114,938 |
Series 2395 Class PE, 6% 2/15/30 | | 668,869 | | 673,235 |
Series 2398 Class DK, 6.5% 1/15/31 | | 93,190 | | 93,337 |
Series 2410 Class ML, 6.5% 12/15/30 | | 243,261 | | 244,443 |
Series 2420 Class BE, 6.5% 12/15/30 | | 186,022 | | 186,612 |
Series 2443 Class TD, 6.5% 10/15/30 | | 214,887 | | 215,999 |
Series 2461 Class PG, 6.5% 1/15/31 | | 191,266 | | 193,824 |
Series 2466 Class EC, 6% 10/15/27 | | 18,741 | | 18,717 |
Series 2483 Class DC, 5.5% 7/15/14 | | 133,003 | | 132,994 |
Series 2496 Class OC, 5.5% 9/15/14 | | 979,615 | | 983,554 |
Series 2543 CLass PM, 5.5% 8/15/18 | | 991,487 | | 1,000,708 |
Series 2614 Class IC, 4.5% 12/15/10 (h) | | 2,059,705 | | 71,014 |
Series 2676: | | | | |
Class KN, 3% 12/15/13 | | 1,935,811 | | 1,912,170 |
Class QA, 3% 8/15/16 | | 1,550,000 | | 1,536,448 |
Series 2683 Class UH, 3% 3/15/19 | | 3,549,254 | | 3,512,799 |
Series 2748 Class IB, 4.5% 3/15/10 (h) | | 1,265,317 | | 43,404 |
Series 2776 Class UJ, 4.5% 5/15/20 (h) | | 584,891 | | 30,246 |
Series 2828 Class JA, 4.5% 1/15/10 | | 1,615,000 | | 1,618,133 |
sequential pay: | | | | |
Series 2430 Class ZE, 6.5% 8/15/27 | | 73,596 | | 73,632 |
Series 2480 Class QW, 5.75% 2/15/30 | | 61,212 | | 61,175 |
Series 1803 Class A, 6% 12/15/08 | | 260,767 | | 265,919 |
Collateralized Mortgage Obligations - continued |
| Principal
Amount | | Value
(Note 1) |
U.S. Government Agency - continued |
Freddie Mac Multi-class participation certificates guaranteed: - continued | | | | |
Series 2406: | | | | |
Class FP, 4.3681% 1/15/32 (f) | | $ 1,435,000 | | $ 1,467,531 |
Class PF, 4.3681% 12/15/31 (f) | | 1,135,000 | | 1,164,748 |
Series 2410 Class PF, 4.3681% 2/15/32 (f) | | 2,600,000 | | 2,659,366 |
Series 2907 Class HZ, 5% 12/15/34 | | 1,090,633 | | 1,081,224 |
Series 2949 Clas ZW, 5% 3/15/35 | | 1,572,974 | | 1,574,860 |
Series 2978 Class EZ, 5.5% 11/15/34 | | 391,223 | | 388,137 |
3% 3/15/10 | | 1,804,134 | | 1,787,536 |
Ginnie Mae guaranteed REMIC pass thru securities: | | | | |
floater Series 2001-21 Class FB, 3.7881% 1/16/27 (f) | | 141,329 | | 142,154 |
planned amortization class Series 2002-5 Class PD, 6.5% 5/16/31 | | 388,532 | | 395,792 |
TOTAL U.S. GOVERNMENT AGENCY | | 34,186,957 |
TOTAL COLLATERALIZED MORTGAGE OBLIGATIONS (Cost $150,820,225) | 150,557,421 |
Commercial Mortgage Securities - 4.0% |
|
1301 Avenue of The Americas Trust Series 2000-1301: | | | | |
Class C, 7.44% 8/3/10 (b)(f) | | 565,000 | | 564,987 |
Class D, 7.54% 8/3/10 (b)(f) | | 750,000 | | 749,983 |
Banc of America Large Loan, Inc.: | | | | |
floater: | | | | |
Series 2003-BBA2: | | | | |
Class A3, 3.7081% 11/15/15 (b)(f) | | 340,000 | | 340,214 |
Class C, 3.8581% 11/15/15 (b)(f) | | 70,000 | | 70,256 |
Class D, 3.9381% 11/15/15 (b)(f) | | 110,000 | | 110,627 |
Class F, 4.2881% 11/15/15 (b)(f) | | 80,000 | | 80,562 |
Class H, 4.7881% 11/15/15 (b)(f) | | 70,000 | | 70,416 |
Class J, 5.3381% 11/15/15 (b)(f) | | 70,000 | | 70,420 |
Class K, 5.82% 11/15/15 (b)(f) | | 65,000 | | 64,589 |
Series 2005-BOCA: | | | | |
Class H, 4.3381% 12/15/16 (b)(f) | | 290,000 | | 289,555 |
Class J, 4.4881% 12/15/16 (b)(f) | | 140,000 | | 139,786 |
Class K, 4.7381% 12/15/16 (b)(f) | | 250,000 | | 249,685 |
Series 2005-BOCA Class X1, 1.0882% 12/15/16 (b)(f)(h) | | 109,061,667 | | 1,085,818 |
Commercial Mortgage Securities - continued |
| Principal
Amount | | Value
(Note 1) |
Bayview Commercial Asset Trust floater: | | | | |
Series 2003-1 Class A, 4.04% 8/25/33 (b)(f) | | $ 332,377 | | $ 336,326 |
Series 2003-2 Class A, 4.04% 12/25/33 (b)(f) | | 869,217 | | 879,842 |
Series 2004-1: | | | | |
Class A, 3.82% 4/25/34 (b)(f) | | 498,972 | | 499,849 |
Class B, 5.36% 4/25/34 (b)(f) | | 83,162 | | 84,114 |
Series 2004-2: | | | | |
Class A, 3.89% 8/25/34 (b)(f) | | 572,710 | | 575,529 |
Class M1, 4.04% 8/25/34 (b)(f) | | 183,446 | | 184,163 |
Series 2004-3: | | | | |
Class A1, 3.83% 1/25/35 (b)(f) | | 810,885 | | 813,723 |
Class A2, 3.88% 1/25/35 (b)(f) | | 95,398 | | 95,734 |
Class M1, 3.96% 1/25/35 (b)(f) | | 143,097 | | 143,291 |
Class M2, 4.46% 1/25/35 (b)(f) | | 95,398 | | 95,966 |
Series 2005-2A: | | | | |
Class M1, 3.73% 8/25/35 (b)(f) | | 184,689 | | 184,689 |
Class M2, 3.78% 8/25/35 (b)(f) | | 309,478 | | 309,478 |
Class M3, 3.8% 8/25/35 (b)(f) | | 169,714 | | 169,714 |
Class M4, 3.91% 8/25/35 (b)(f) | | 154,739 | | 154,739 |
Bear Stearns Commercial Mortgage Securities, Inc. floater Series 2004-BBA3 Class E, 4.0881% 6/15/17 (b)(f) | | 960,000 | | 960,087 |
COMM floater: | | | | |
Series 2002-FL7: | | | | |
Class C, 3.8881% 11/15/14 (b)(f) | | 351,633 | | 351,753 |
Class F, 4.6881% 11/15/14 (b)(f) | | 1,000,000 | | 1,001,383 |
Class H, 5.6381% 11/15/14 (b)(f) | | 150,000 | | 150,077 |
Series 2003-FL9 Class B, 3.8881% 11/15/15 (b)(f) | | 705,064 | | 707,001 |
Commercial Mortgage pass thru certificates floater: | | | | |
Series 2004-CNL: | | | | |
Class A2, 3.6881% 9/15/14 (b)(f) | | 635,000 | | 635,612 |
Class G, 4.3681% 9/15/14 (b)(f) | | 150,000 | | 150,060 |
Class H, 4.4681% 9/15/14 (b)(f) | | 160,000 | | 160,064 |
Class J, 4.9881% 9/15/14 (b)(f) | | 55,000 | | 55,175 |
Class K, 5.3881% 9/15/14 (b)(f) | | 85,000 | | 85,175 |
Class L, 5.5881% 9/15/14 (b)(f) | | 70,000 | | 69,966 |
Series 2004-HTL1: | | | | |
Class B, 3.8381% 7/15/16 (b)(f) | | 46,895 | | 46,928 |
Class D, 3.9381% 7/15/16 (b)(f) | | 102,330 | | 102,344 |
Class E, 4.1381% 7/15/16 (b)(f) | | 72,473 | | 72,500 |
Class F, 4.1881% 7/15/16 (b)(f) | | 76,740 | | 76,789 |
Class H, 4.6881% 7/15/16 (b)(f) | | 225,918 | | 225,994 |
Class J, 4.8381% 7/15/16 (b)(f) | | 85,230 | | 85,259 |
Commercial Mortgage Securities - continued |
| Principal
Amount | | Value
(Note 1) |
Commercial Mortgage pass thru certificates floater: - continued | | | | |
Series 2004-HTL1: | | | | |
Class K, 5.7381% 7/15/16 (b)(f) | | $ 1,470,333 | | $ 1,469,696 |
Commercial Mortgage Pass-Through Certificates floater Series 2005-F10A: | | | | |
Class B, 3.6181% 4/15/17 (b)(f) | | 1,005,000 | | 1,005,000 |
Class C, 3.6581% 4/15/17 (b)(f) | | 425,000 | | 425,000 |
Class D, 3.6981% 4/15/17 (b)(f) | | 345,000 | | 345,000 |
Class E, 3.7581% 4/15/17 (b)(f) | | 260,000 | | 260,000 |
Class F, 3.7981% 4/15/17 (b)(f) | | 145,000 | | 145,000 |
Class G, 3.9381% 4/15/17 (b)(f) | | 145,000 | | 145,000 |
Class H, 4.0081% 4/15/17 (b)(f) | | 145,000 | | 145,000 |
Class I, 4.2381% 4/15/17 (b)(f) | | 50,000 | | 50,000 |
Class MOA3, 3.6881% 3/15/20 (b)(f) | | 650,000 | | 650,000 |
CS First Boston Mortgage Securities Corp.: | | | | |
floater: | | | | |
Series 2002-TFLA Class C, 3.9688% 11/18/12 (b)(f) | | 255,000 | | 254,995 |
Series 2003-TF2A Class A2, 3.7081% 11/15/14 (b)(f) | | 700,000 | | 700,523 |
Series 2004-FL1 Class B, 3.8381% 5/15/14 (b)(f) | | 1,000,000 | | 1,000,496 |
Series 2004-HC1: | | | | |
Class A2, 3.8881% 12/15/21 (b)(f) | | 175,000 | | 175,000 |
Class B, 4.1381% 12/15/21 (b)(f) | | 455,000 | | 454,999 |
Series 2004-TF2A Class E, 3.8081% 11/15/19 (b)(f) | | 640,000 | | 640,990 |
Series 2004-TFL1: | | | | |
Class A2, 3.5781% 2/15/14 (b)(f) | | 505,000 | | 505,150 |
Class E, 3.9381% 2/15/14 (b)(f) | | 200,000 | | 200,431 |
Class F, 3.9881% 2/15/14 (b)(f) | | 175,000 | | 175,406 |
Class G, 4.2381% 2/15/14 (b)(f) | | 125,000 | | 125,374 |
Class H, 4.4881% 2/15/14 (b)(f) | | 100,000 | | 100,267 |
Class J, 4.7881% 2/15/14 (b)(f) | | 50,000 | | 50,248 |
Series 2005-TF2A Class F, 3.8881% 11/15/19 (b)(f) | | 230,000 | | 230,356 |
Series 2005-TFLA: | | | | |
Class C, 3.6281% 2/15/20 (b)(f) | | 800,000 | | 799,998 |
Class E, 3.7181% 2/15/20 (b)(f) | | 560,000 | | 559,999 |
Class F, 3.7681% 2/15/20 (b)(f) | | 250,000 | | 250,000 |
Class G, 3.9081% 2/15/20 (b)(f) | | 70,000 | | 70,000 |
Class H, 4.1381% 2/15/20 (b)(f) | | 100,000 | | 100,000 |
Series 2003-TFLA Class G, 3.7357% 4/15/13 (b)(f) | | 30,933 | | 30,838 |
Commercial Mortgage Securities - continued |
| Principal
Amount | | Value
(Note 1) |
GS Mortgage Securities Corp. II floater Series 2005-FL7A Class A1, 3.5% 11/6/19 (b)(f) | | $ 1,468,752 | | $ 1,468,909 |
John Hancock Tower Mortgage Trust floater Series 2003-C5A Class B, 5.6585% 4/10/15 (b)(f) | | 420,000 | | 415,178 |
JP Morgan Chase Commercial Mortgage Security Corp.: | | | | |
floater Series 2005-FL1A: | | | | |
Class WH, 3.97% 6/15/19 (b)(f) | | 490,000 | | 490,015 |
Class WJ, 4.17% 6/15/19 (b)(f) | | 305,000 | | 305,009 |
Class WK, 4.57% 6/15/19 (b)(f) | | 455,000 | | 455,014 |
Series 2005-FL1A Class WX1, 1.2068% 6/15/19 (b)(f)(h) | | 160,000,000 | | 1,731,200 |
Lehman Brothers Floating Rate Commercial Mortgage Trust floater: | | | | |
Series 2003-C4A Class H, 6.35% 7/11/15 (b)(f) | | 406,693 | | 407,710 |
Series 2003-LLFA: | | | | |
Class A2, 3.77% 12/16/14 (b)(f) | | 1,085,000 | | 1,085,718 |
Class C, 4.08% 12/16/14 (b)(f) | | 110,000 | | 110,338 |
Class K1, 5.93% 12/16/14 (b)(f) | | 435,000 | | 434,222 |
Merrill Lynch Mortgage Trust Series 2005-GGP1 Class X, 0.1416% 11/15/10 (b)(f)(h) | | 417,400,000 | | 593,626 |
Salomon Brothers Mortgage Securities VII, Inc.: | | | | |
floater: | | | | |
Series 2001-CDCA Class C, 4.1881% 2/15/13 (b)(f) | | 1,000,000 | | 980,616 |
Series 2003-CDCA: | | | | |
Class HEXB, 5.2881% 2/15/15 (b)(f) | | 30,000 | | 30,039 |
Class JEXB, 5.4881% 2/15/15 (b)(f) | | 50,000 | | 50,065 |
Class KEXB, 5.8881% 2/15/15 (b)(f) | | 40,000 | | 40,052 |
Series 2000-NL1 Class E, 7.0607% 10/15/30 (b)(f) | | 492,498 | | 494,421 |
SDG Macerich Properties LP floater Series 2000-1
Class A3, 3.7281% 5/15/09 (b)(f) | | 500,000 | | 500,225 |
STRIPS III Ltd./STRIPS III Corp. floater Series 2004-1A Class A, 3.78% 3/24/18 (b)(f) | | 523,978 | | 523,978 |
Wachovia Bank Commercial Mortgage Trust floater: | | | | |
Series 2004-WHL3: | | | | |
Class A2, 3.5681% 3/15/14 (b)(f) | | 255,000 | | 255,094 |
Class E, 3.8881% 3/15/14 (b)(f) | | 160,000 | | 160,201 |
Class F, 3.9381% 3/15/14 (b)(f) | | 130,000 | | 130,157 |
Class G, 4% 3/15/14 (b)(f) | | 65,000 | | 65,101 |
Series 2005-WL5A: | | | | |
Class KHP1, 3.7381% 1/15/18 (b)(f) | | 245,000 | | 245,000 |
Class KHP2, 3.9381% 1/15/18 (b)(f) | | 245,000 | | 245,000 |
Class KHP3, 4.2381% 1/15/18 (b)(f) | | 290,000 | | 290,000 |
Commercial Mortgage Securities - continued |
| Principal
Amount | | Value
(Note 1) |
Wachovia Bank Commercial Mortgage Trust floater: - continued | | | | |
Series 2005-WL5A: | | | | |
Class KHP4, 4.3381% 1/15/18 (b)(f) | | $ 225,000 | | $ 225,000 |
Class KHP5, 4.5381% 1/15/18 (b)(f) | | 260,000 | | 260,000 |
TOTAL COMMERCIAL MORTGAGE SECURITIES (Cost $36,212,804) | 36,406,876 |
Fixed-Income Funds - 31.6% |
| | Shares | | |
Fidelity Ultra-Short Central Fund (g)
(Cost $288,099,439) | | 2,897,815 | | 288,274,676 |
Cash Equivalents - 14.9% |
| | Maturity
Amount | | |
Investments in repurchase agreements (Collateralized by U.S. Government Obligations, in a joint trading account at 3.32%, dated 7/29/05 due 8/1/05) (i)
(Cost $136,501,000) | | $ 136,538,712 | | 136,501,000 |
TOTAL INVESTMENT PORTFOLIO - 101.2% (Cost $925,079,760) | | | 925,059,536 |
NET OTHER ASSETS - (1.2)% | | | (11,305,773) |
NET ASSETS - 100% | | $ 913,753,763 |
Futures Contracts |
| Expiration
Date | | Underlying
Face Amount
at Value | | Unrealized
Appreciation/
(Depreciation) |
Purchased |
Eurodollar Contracts |
114 Eurodollar 90 Day Index Contracts | Sept. 2005 | | $ 112,867,125 | | $ (230,506) |
112 Eurodollar 90 Day Index Contracts | Dec. 2005 | | 110,805,800 | | (185,111) |
112 Eurodollar 90 Day Index Contracts | March 2006 | | 110,776,400 | | (234,448) |
TOTAL EURODOLLAR CONTRACTS | | | (650,065) |
Sold |
Eurodollar Contracts |
6 Eurodollar 90 Day Index Contracts | June 2006 | | 5,933,550 | | 3,274 |
7 Eurodollar 90 Day Index Contracts | Sept. 2006 | | 6,921,862 | | 3,483 |
6 Eurodollar 90 Day Index Contracts | Dec. 2006 | | 5,932,500 | | 4,251 |
7 Eurodollar 90 Day Index Contracts | March 2007 | | 6,921,162 | | 4,960 |
5 Eurodollar 90 Day Index Contracts | June 2007 | | 4,943,438 | | 2,643 |
4 Eurodollar 90 Day Index Contracts | Sept. 2007 | | 3,954,550 | | 1,984 |
3 Eurodollar 90 Day Index Contracts | Dec. 2007 | | 2,965,650 | | 1,288 |
3 Eurodollar 90 Day Index Contracts | March 2008 | | 2,965,575 | | 1,213 |
2 Eurodollar 90 Day Index Contracts | June 2008 | | 1,976,950 | | 1,692 |
1 Eurodollar 90 Day Index Contracts | Sept. 2008 | | 988,413 | | 1,182 |
TOTAL EURODOLLAR CONTRACTS | | | 25,970 |
| | | | $ (624,095) |
Swap Agreements |
| | | Notional
Amount | | Value |
Credit Default Swap |
Receive from Citibank, upon default event of DaimlerChrysler NA Holding Corp., par value of the notional amount of DaimlerChrysler NA Holding Corp. 6.5% 11/15/13, and pay quarterly notional amount multiplied by .8% | June 2007 | | $ 1,000,000 | | $ (9,712) |
Receive quarterly a fixed rate of .5% multiplied by the notional amount and pay to Deutsche Bank, upon each default event of one of the issues of Dow Jones CDX N.A. Investment Grade 3, par value of the proportional notional amount (e) | March 2010 | | 2,000,000 | | 1,521 |
Swap Agreements - continued |
| Expiration
Date | | Notional
Amount | | Value |
Credit Default Swap - continued |
Receive quarterly a fixed rate of .5% multiplied by the notional amount and pay to Lehman Brothers, Inc., upon each default event of one of the issues of Dow Jones CDX N.A. Investment Grade 3, par value of the proportional notional amount (e) | March 2010 | | $ 2,000,000 | | $ 1,521 |
Receive quarterly notional amount multiplied by .39% and pay JPMorgan Chase, Inc. upon default event of Fannie Mae, par value of the notional amount of Fannie Mae 4.625% 5/1/13 | June 2010 | | 2,600,000 | | 12,917 |
Receive quarterly notional amount multiplied by .75% and pay Lehman Brothers, Inc. upon default event of AOL Time Warner, Inc., par value of the notional amount of AOL Time Warner, Inc. 6.875% 5/1/12 | Sept. 2009 | | 2,000,000 | | 35,867 |
TOTAL CREDIT DEFAULT SWAP | 9,600,000 | | 42,114 |
Total Return Swap |
Receive monthly notional amount multiplied by the nominal spread appreciation of the Lehman Brothers CMBS U.S. Aggregate Index adjusted by a modified duration factor plus 10 basis points and pay monthly notional amount multiplied by the nominal spread depreciation of the Lehman Brothers CMBS U.S. Aggregate Index adjusted by a modified duration factor with Lehman Brothers, Inc. | Oct. 2005 | | 6,800,000 | | 6,537 |
Receive monthly notional amount multiplied by the nominal spread appreciation of the Lehman Brothers CMBS U.S. Aggregate Index adjusted by a modified duration factor plus 25 basis points and pay monthly notional amount multiplied by the nominal spread depreciation of the Lehman Brothers CMBS U.S. Aggregate Index adjusted by a modified duration factor with Lehman Brothers, Inc. | Dec. 2005 | | 4,000,000 | | 4,335 |
Swap Agreements - continued |
| Expiration
Date | | Notional
Amount | | Value |
Total Return Swap - continued |
Receive monthly notional amount multiplied by the nominal spread appreciation of the Lehman Brothers CMBS U.S. Aggregate Index adjusted by a modified duration factor plus 30 basis points and pay monthly notional amount multiplied by the nominal spread depreciation of the Lehman Brothers CMBS U.S. Aggregate Index adjusted by a modified duration factor with Lehman Brothers, Inc. | August 2005 | | $ 4,900,000 | | $ 4,739 |
Receive monthly notional amount multiplied by the nominal spread appreciation of the Lehman Brothers CMBS U.S. Aggregate Index adjusted by a modified duration factor plus 22 basis points and pay monthly notional amount multiplied by the nominal spread depreciation of the Lehman Brothers CMBS U.S. Aggregate Index adjusted by a modified duration factor with Lehman Brothers, Inc. | Jan. 2006 | | 4,900,000 | | 4,499 |
TOTAL TOTAL RETURN SWAP | 20,600,000 | | 20,110 |
| | $ 30,200,000 | | $ 62,224 |
Legend |
(a) Debt obligation initially issued at one coupon which converts to a higher coupon at a specified date. The rate shown is the rate at period end. |
(b) Security exempt from registration under Rule 144A of the Securities Act of 1933. These securities may be resold in transactions exempt from registration, normally to qualified institutional buyers. At the period end, the value of these securities amounted to $59,223,012 or 6.5% of net assets. |
(c) Security or a portion of the security purchased on a delayed delivery or when-issued basis. |
(d) Security or a portion of the security was pledged to cover margin requirements for futures contracts. At the period end, the value of securities pledged amounted to $1,480,848. |
(e) Dow Jones CDX N.A. Investment Grade 3 is a tradable index of credit default swaps on investment grade debt of U.S. companies. |
(f) The coupon rate shown on floating or adjustable rate securities represents the rate at period end. |
(g) Affiliated fund that is available only to investment companies and other accounts managed by Fidelity Investments. A complete listing of the fixed-income central fund's holdings is provided at the end of this report. |
(h) Security represents right to receive monthly interest payments on an underlying pool of mortgages. Principal shown is the par amount of the mortgage pool. |
(i) Additional information on each counterparty to the repurchase agreement is as follows: |
Repurchase Agreement/
Counterparty | Value |
$136,501,000 due 8/1/05 at 3.32% | |
Banc of America Securities LLC. | $ 27,344,467 |
Bank of America, National Association | 14,204,918 |
Barclays Capital Inc. | 56,819,671 |
Countrywide Securities Corporation | 14,204,918 |
Morgan Stanley & Co. Incorporated. | 20,375,797 |
UBS Securities LLC | 3,551,229 |
| $ 136,501,000 |
See accompanying notes which are an integral part of the financial statements.
Annual Report
Financial Statements
Statement of Assets and Liabilities
| July 31, 2005 |
| | |
Assets | | |
Investment in securities, at value (including repurchase agreements of $136,501,000) (cost $925,079,760) - - See accompanying schedule | | $ 925,059,536 |
Cash | | 1,426,263 |
Receivable for investments sold | | 1,430,603 |
Receivable for swap agreements | | 5,737 |
Receivable for fund shares sold | | 1,664,626 |
Interest receivable | | 3,070,262 |
Swap agreements, at value | | 62,224 |
Total assets | | 932,719,251 |
| | |
Liabilities | | |
Payable for investments purchased
Regular delivery | $ 13,821,450 | |
Delayed delivery | 3,724,762 | |
Payable for fund shares redeemed | 750,791 | |
Distributions payable | 247,559 | |
Accrued management fee | 247,210 | |
Distribution fees payable | 846 | |
Payable for daily variation on futures contracts | 28,013 | |
Other affiliated payables | 116,447 | |
Other payables and accrued expenses | 28,410 | |
Total liabilities | | 18,965,488 |
| | |
Net Assets | | $ 913,753,763 |
Net Assets consist of: | | |
Paid in capital | | $ 914,861,233 |
Undistributed net investment income | | 26,805 |
Accumulated undistributed net realized gain (loss) on investments | | (557,541) |
Net unrealized appreciation (depreciation) on investments | | (576,734) |
Net Assets | | $ 913,753,763 |
See accompanying notes which are an integral part of the financial statements.
Annual Report
Statement of Assets and Liabilities - continued
| July 31, 2005 |
| | |
Calculation of Maximum Offering Price
Class A:
Net Asset Value and redemption price per share
($2,556,584 ÷ 254,820 shares) | | $ 10.03 |
| | |
Maximum offering price per share (100/98.50 of $10.03) | | $ 10.18 |
Class T:
Net Asset Value and redemption price per share ($4,044,195 ÷ 403,077 shares) | | $ 10.03 |
| | |
Maximum offering price per share (100/98.50 of $10.03) | | $ 10.18 |
| | |
Ultra-Short Bond:
Net Asset Value, offering price and redemption price per share ($906,644,323 ÷ 90,395,684 shares) | | $ 10.03 |
| | |
Institutional Class:
Net Asset Value, offering price and redemption price per share ($508,661 ÷ 50,716 shares) | | $ 10.03 |
See accompanying notes which are an integral part of the financial statements.
Annual Report
Financial Statements - continued
Statement of Operations
| Year ended July 31, 2005 |
| | |
Investment Income | | |
Interest | | $ 22,542,691 |
| | |
Expenses | | |
Management fee | $ 3,107,816 | |
Transfer agent fees | 1,002,533 | |
Distribution fees | 5,884 | |
Accounting fees and expenses | 203,379 | |
Fund wide operations fee | 39,626 | |
Independent trustees' compensation | 3,744 | |
Custodian fees and expenses | 9,001 | |
Registration fees | 82,647 | |
Audit | 33,864 | |
Legal | 6,364 | |
Miscellaneous | 4,598 | |
Total expenses before reductions | 4,499,456 | |
Expense reductions | (434,744) | 4,064,712 |
Net investment income | | 18,477,979 |
Realized and Unrealized Gain (Loss) Net realized gain (loss) on: | | |
Investment securities | (158,516) | |
Futures contracts | (402,042) | |
Swap agreements | 33,629 | |
Total net realized gain (loss) | | (526,929) |
Change in net unrealized appreciation (depreciation) on: Investment securities | (563,546) | |
Futures contracts | (393,848) | |
Swap agreements | 68,110 | |
Total change in net unrealized appreciation (depreciation) | | (889,284) |
Net gain (loss) | | (1,416,213) |
Net increase (decrease) in net assets resulting from operations | | $ 17,061,766 |
See accompanying notes which are an integral part of the financial statements.
Annual Report
Statement of Changes in Net Assets
| Year ended
July 31,
2005 | Year ended
July 31,
2004 |
Increase (Decrease) in Net Assets | | |
Operations | | |
Net investment income | $ 18,477,979 | $ 4,702,274 |
Net realized gain (loss) | (526,929) | 327,702 |
Change in net unrealized appreciation (depreciation) | (889,284) | 94,514 |
Net increase (decrease) in net assets resulting
from operations | 17,061,766 | 5,124,490 |
Distributions to shareholders from net investment income | (18,371,771) | (4,708,387) |
Distributions to shareholders from net realized gain | (213,972) | - |
Total distributions | (18,585,743) | (4,708,387) |
Share transactions - net increase (decrease) | 334,021,363 | 355,546,941 |
Redemption fees | 34,215 | 56,247 |
Total increase (decrease) in net assets | 332,531,601 | 356,019,291 |
| | |
Net Assets | | |
Beginning of period | 581,222,162 | 225,202,871 |
End of period (including undistributed net investment income of $26,805 and distributions in excess of net investment income of $122,365, respectively) | $ 913,753,763 | $ 581,222,162 |
See accompanying notes which are an integral part of the financial statements.
Annual Report
Financial Highlights - Class A
Years ended July 31, | 2005 | 2004 F |
Selected Per-Share Data | | |
Net asset value, beginning of period | $ 10.05 | $ 10.04 |
Income from Investment Operations | | |
Net investment income E | .223 | .013 |
Net realized and unrealized gain (loss) | (.026) | .011 |
Total from investment operations | .197 | .024 |
Distributions from net investment income | (.214) | (.014) |
Distributions from net realized gain | (.003) | - |
Total distributions | (.217) | (.014) |
Redemption fees added to paid in capital E, H | - | - |
Net asset value, end of period | $ 10.03 | $ 10.05 |
Total Return B, C, D | 1.98% | .24% |
Ratios to Average Net Assets G | | |
Expenses before expense reductions | .78% | .85% A |
Expenses net of voluntary waivers, if any | .70% | .70% A |
Expenses net of all reductions | .70% | .70% A |
Net investment income | 2.23% | 1.11% A |
Supplemental Data | | |
Net assets, end of period (000 omitted) | $ 2,557 | $ 316 |
Portfolio turnover rate | 33% | 53% |
A Annualized
B Total returns for periods of less than one year are not annualized.
C Total returns would have been lower had certain expenses not been reduced during the periods shown.
D Total returns do not include the effect of the sales charges.
E Calculated based on average shares outstanding during the period.
F For the period June 16, 2004 (commencement of sale of shares) to July 31, 2004.
G Expense ratios reflect operating expenses of the class. Expenses before reductions do not reflect amounts reimbursed by the investment adviser or reductions from brokerage service arrangements or other expense offset arrangements and do not represent the amount paid by the class during periods when reimbursements or reductions occur. Expense ratios before reductions for start-up periods may not be representative of longer-term operating periods. Expenses net of any voluntary waivers reflect expenses after reimbursement by the investment adviser but prior to reductions from brokerage service arrangements or other expense offset arrangements. Expenses net of all reductions represent the net expenses paid by the class.
H Amount represents less than $.001 per share.
See accompanying notes which are an integral part of the financial statements.
Annual Report
Financial Highlights - Class T
Years ended July 31, | 2005 | 2004 F |
Selected Per-Share Data | | |
Net asset value, beginning of period | $ 10.05 | $ 10.04 |
Income from Investment Operations | | |
Net investment income E | .222 | .013 |
Net realized and unrealized gain (loss) | (.025) | .010 |
Total from investment operations | .197 | .023 |
Distributions from net investment income | (.214) | (.013) |
Distributions from net realized gain | (.003) | - |
Total distributions | (.217) | (.013) |
Redemption fees added to paid in capital E, H | - | - |
Net asset value, end of period | $ 10.03 | $ 10.05 |
Total Return B, C, D | 1.98% | .23% |
Ratios to Average Net Assets G | | |
Expenses before expense reductions | .77% | .86% A |
Expenses net of voluntary waivers, if any | .70% | .70% A |
Expenses net of all reductions | .70% | .70% A |
Net investment income | 2.23% | 1.11% A |
Supplemental Data | | |
Net assets, end of period (000 omitted) | $ 4,044 | $ 356 |
Portfolio turnover rate | 33% | 53% |
A Annualized
B Total returns for periods of less than one year are not annualized.
C Total returns would have been lower had certain expenses not been reduced during the periods shown.
D Total returns do not include the effect of the sales charges.
E Calculated based on average shares outstanding during the period.
F For the period June 16, 2004 (commencement of sale of shares) to July 31, 2004.
G Expense ratios reflect operating expenses of the class. Expenses before reductions do not reflect amounts reimbursed by the investment adviser or reductions from brokerage service arrangements or other expense offset arrangements and do not represent the amount paid by the class during periods when reimbursements or reductions occur. Expense ratios before reductions for start-up periods may not be representative of longer-term operating periods. Expenses net of any voluntary waivers reflect expenses after reimbursement by the investment adviser but prior to reductions from brokerage service arrangements or other expense offset arrangements. Expenses net of all reductions represent the net expenses paid by the class.
H Amount represents less than $.001 per share.
See accompanying notes which are an integral part of the financial statements.
Annual Report
Financial Highlights - Ultra-Short Bond
Years ended July 31, | 2005 | 2004 | 2003 E |
Selected Per-Share Data | | | |
Net asset value, beginning of period | $ 10.05 | $ 10.02 | $ 10.00 |
Income from Investment Operations | | | |
Net investment income D | .241 | .122 | .137 |
Net realized and unrealized gain (loss) | (.026) | .029 | .052 |
Total from investment operations | .215 | .151 | .189 |
Distributions from net investment income | (.232) | (.122) | (.173) |
Distributions from net realized gain | (.003) | - | - |
Total distributions | (.235) | (.122) | (.173) |
Redemption fees added to paid in capital D | - G | .001 | .004 |
Net asset value, end of period | $ 10.03 | $ 10.05 | $ 10.02 |
Total Return B, C | 2.16% | 1.52% | 1.94% |
Ratios to Average Net Assets F | | | |
Expenses before expense reductions | .58% | .62% | .70% A |
Expenses net of voluntary waivers, if any | .53% | .55% | .55% A |
Expenses net of all reductions | .53% | .55% | .55% A |
Net investment income | 2.41% | 1.21% | 1.50% A |
Supplemental Data | | | |
Net assets, end of period (000 omitted) | $ 906,644 | $ 580,174 | $ 225,203 |
Portfolio turnover rate | 33% | 53% | 39% A |
A Annualized
B Total returns for periods of less than one year are not annualized.
C Total returns would have been lower had certain expenses not been reduced during the periods shown.
D Calculated based on average shares outstanding during the period.
E For the period August 29, 2002 (commencement of sale of shares) to July 31, 2003.
F Expense ratios reflect operating expenses of the class. Expenses before reductions do not reflect amounts reimbursed by the investment adviser or reductions from brokerage service arrangements or other expense offset arrangements and do not represent the amount paid by the class during periods when reimbursements or reductions occur. Expense ratios before reductions for start-up periods may not be representative of longer-term operating periods. Expenses net of any voluntary waivers reflect expenses after reimbursement by the investment adviser but prior to reductions from brokerage service arrangements or other expense offset arrangements. Expenses net of all reductions represent the net expenses paid by the class.
G Amount represents less than $.001 per share.
See accompanying notes which are an integral part of the financial statements.
Annual Report
Financial Highlights - Institutional Class
Years ended July 31, | 2005 | 2004 E |
Selected Per-Share Data | | |
Net asset value, beginning of period | $ 10.05 | $ 10.04 |
Income from Investment Operations | | |
Net investment income D | .240 | .015 |
Net realized and unrealized gain (loss) | (.026) | .010 |
Total from investment operations | .214 | .025 |
Distributions from net investment income | (.231) | (.015) |
Distributions from net realized gain | (.003) | - |
Total distributions | (.234) | (.015) |
Redemption fees added to paid in capital | - | - |
Net asset value, end of period D, G | $ 10.03 | $ 10.05 |
Total Return B, C | 2.15% | .25% |
Ratios to Average Net Assets F | | |
Expenses before expense reductions | .58% | .67% A |
Expenses net of voluntary waivers, if any | .55% | .55% A |
Expenses net of all reductions | .55% | .55% A |
Net investment income | 2.38% | 1.26% A |
Supplemental Data | | |
Net assets, end of period (000 omitted) | $ 509 | $ 376 |
Portfolio turnover rate | 33% | 53% |
A Annualized
B Total returns for periods of less than one year are not annualized.
C Total returns would have been lower had certain expenses not been reduced during the periods shown.
D Calculated based on average shares outstanding during the period.
E For the period June 16, 2004 (commencement of sale of shares) to July 31, 2004.
F Expense ratios reflect operating expenses of the class. Expenses before reductions do not reflect amounts reimbursed by the investment adviser or reductions from brokerage service arrangements or other expense offset arrangements and do not represent the amount paid by the class during periods when reimbursements or reductions occur. Expense ratios before reductions for start-up periods may not be representative of longer-term operating periods. Expenses net of any voluntary waivers reflect expenses after reimbursement by the investment adviser but prior to reductions from brokerage service arrangements or other expense offset arrangements. Expenses net of all reductions represent the net expenses paid by the class.
G Amount represents less than $.001 per share.
See accompanying notes which are an integral part of the financial statements.
Annual Report
Notes to Financial Statements
For the period ended July 31, 2005
1. Significant Accounting Policies.
Fidelity Ultra-Short Bond Fund (the fund) is a non-diversified fund of Fidelity Income Fund (the trust) and is authorized to issue an unlimited number of shares. The trust is registered under the Investment Company Act of 1940, as amended (the 1940 Act), as an open-end management investment company organized as a Massachusetts business trust.
The fund offers Class A, Class T, Ultra-Short Bond (the original class), and Institutional Class shares, each of which has equal rights as to assets and voting privileges. Each class has exclusive voting rights with respect to matters that affect that class. Investment income, realized and unrealized capital gains and losses, the common expenses of the fund, and certain fund-level expense reductions, if any, are allocated on a pro rata basis to each class based on the relative net assets of each class to the total net assets of the fund. Each class differs with respect to transfer agent and distribution and service plan fees incurred. Certain expense reductions also differ by class.
The fund may invest in affiliated money market central funds (Money Market Central Funds) and fixed-income Central Investment Portfolios (CIPs), collectively referred to as Central Funds, which are open-end investment companies available to investment companies and other accounts managed by Fidelity Management & Research Company (FMR) and its affiliates. The financial statements have been prepared in conformity with accounting principles generally accepted in the United States of America, which require management to make certain estimates and assumptions at the date of the financial statements. The following summarizes the significant accounting policies of the fund, which are also consistently followed by the Central Funds:
Security Valuation. Net asset value per share (NAV calculation) is calculated as of the close of business of the New York Stock Exchange, normally 4:00 p.m. Eastern time. Debt securities, including restricted securities, for which quotations are readily available are valued at their most recent bid prices (sales prices if the principal market is an exchange) in the principal market in which such securities are normally traded, as determined by recognized dealers in such securities, or securities are valued on the basis of information provided by a pricing service. Pricing services use valuation matrices that incorporate both dealer-supplied valuations and valuation models. If prices are not readily available or do not accurately reflect fair value for a security, or if a security's value has been materially affected by events occurring after the close of the exchange or market on which the security is principally traded, that security may be valued by another method that the Board of Trustees believes accurately reflects fair value. A security's valuation may differ depending on the method used for determining value. Price movements in futures contracts and ADRs, market and trading trends, the bid/ask quotes of brokers and off-exchange institutional trading may be reviewed in the course of making a good faith determination of a security's fair value. Short-term securities with remaining
Annual Report
1. Significant Accounting Policies - continued
Security Valuation - continued
maturities of sixty days or less for which quotations are not readily available are valued on the basis of amortized cost. Investments in open-end investment companies, including Central Funds, are valued at their net asset value each business day.
Investment Transactions and Income. Security transactions, including the fund's investment activity in the Central Funds, are accounted for as of trade date. Gains and losses on securities sold are determined on the basis of identified cost. Interest income, including distributions from the Central Funds, is accrued as earned. Interest income includes coupon interest and amortization of premium and accretion of discount on debt securities.
Expenses. Most expenses of the trust can be directly attributed to a fund. Expenses which cannot be directly attributed are apportioned among each fund in the trust.
Income Tax Information and Distributions to Shareholders. Each year, the fund intends to qualify as a regulated investment company by distributing all of its taxable income and realized gains under Subchapter M of the Internal Revenue Code. As a result, no provision for income taxes is required in the accompanying financial statements.
Dividends are declared daily and paid monthly from net investment income. Distributions from realized gains, if any, are recorded on the ex-dividend date. Income dividends and capital gain distributions are declared separately for each class. Income and capital gain distributions are determined in accordance with income tax regulations, which may differ from generally accepted accounting principles. In addition, the fund will claim a portion of the payment made to redeeming shareholders as a distribution for income tax purposes. Capital accounts within the financial statements are adjusted for permanent book-tax differences. These adjustments have no impact on net assets or the results of operations. Temporary book-tax differences will reverse in a subsequent period.
Book-tax differences are primarily due to futures transactions, swap agreements, market discount, financing transactions, losses deferred due to wash sales and excise tax regulations.
The tax-basis components of distributable earnings and the federal tax cost as of period end were as follows:
Unrealized appreciation | $ 1,412,507 | |
Unrealized depreciation | (1,060,010) | |
Net unrealized appreciation (depreciation) | 352,497 | |
Undistributed ordinary income | 65,597 | |
| | |
Cost for federal income tax purposes | $ 924,707,039 | |
Annual Report
Notes to Financial Statements - continued
1. Significant Accounting Policies - continued
Income Tax Information and Distributions to Shareholders - continued
The tax character of distributions paid was as follows:
| July 31, 2005 | July 31, 2004 |
Ordinary Income | $ 18,371,770 | $ 4,708,387 |
Long-term Capital Gains | 213,973 | - |
Total | $ 18,585,743 | $ 4,708,387 |
Short-Term Trading (Redemption) Fees. Shares held in the fund less than 60 days are subject to a redemption fee equal to .25% of the proceeds of the redeemed shares. All redemption fees, including any estimated redemption fees paid by FMR, are retained by the fund and accounted for as an addition to paid in capital.
2. Operating Policies.
Repurchase Agreements. FMR has received an Exemptive Order from the Securities and Exchange Commission (the SEC) which permits the fund and other affiliated entities of FMR to transfer uninvested cash balances into joint trading accounts which are then invested in repurchase agreements. The fund may also invest directly with institutions in repurchase agreements. Repurchase agreements are collateralized by government or non-government securities. Collateral is held in segregated accounts with custodian banks and may be obtained in the event of a default of the counterparty. The fund monitors, on a daily basis, the value of the collateral to ensure it is at least equal to the principal amount of the repurchase agreement (including accrued interest). In the event of a default by the counterparty, realization of the collateral proceeds could be delayed, during which time the value of the collateral may decline.
Delayed Delivery Transactions and When-Issued Securities. The fund may purchase or sell securities on a delayed delivery or when-issued basis. Payment and delivery may take place after the customary settlement period for that security. The price of the underlying securities and the date when the securities will be delivered and paid for are fixed at the time the transaction is negotiated. During the time a delayed delivery sell is outstanding, the contract is marked-to-market daily and equivalent deliverable securities are held for the transaction. The value of the securities purchased on a delayed delivery or when-issued basis are identified as such in the fund's Schedule of Investments. The fund may receive compensation for interest forgone in the purchase of a delayed delivery or when-issued security. With respect to purchase commitments, the fund identifies securities as segregated in its records with a value at least equal to the
Annual Report
2. Operating Policies - continued
Delayed Delivery Transactions and When-Issued Securities - continued
amount of the commitment. Losses may arise due to changes in the value of the underlying securities or if the counterparty does not perform under the contract's terms, or if the issuer does not issue the securities due to political, economic, or other factors.
Futures Contracts. The fund may use futures contracts to manage its exposure to the bond market and to fluctuations in interest rates. Buying futures tends to increase a fund's exposure to the underlying instrument, while selling futures tends to decrease a fund's exposure to the underlying instrument or hedge other fund investments. Futures contracts involve, to varying degrees, risk of loss in excess of any futures variation margin reflected in the Statement of Assets and Liabilities. The underlying face amount at value of any open futures contracts at period end is shown in the Schedule of Investments under the caption "Futures Contracts." This amount reflects each contract's exposure to the underlying instrument at period end. Losses may arise from changes in the value of the underlying instruments or if the counterparties do not perform under the contracts' terms. Gains (losses) are realized upon the expiration or closing of the futures contracts. Futures contracts are valued at the settlement price established each day by the board of trade or exchange on which they are traded.
Restricted Securities. The fund may invest in securities that are subject to legal or contractual restrictions on resale. These securities generally may be resold in transactions exempt from registration or to the public if the securities are registered. Disposal of these securities may involve time-consuming negotiations and expense, and prompt sale at an acceptable price may be difficult. Information regarding restricted securities is included at the end of the fund's Schedule of Investments.
Swap Agreements. The fund may invest in swaps for the purpose of managing its exposure to interest rate, credit or market risk.
Total return swaps are agreements to exchange the return generated by one instrument or index for the return generated by another instrument, for example, the agreement to pay interest in exchange for a market-linked return based on a notional amount. To the extent the total return of the index exceeds the offsetting interest obligation, a fund will receive a payment from the counterparty. To the extent it is less, a fund will make a payment to the counterparty. Periodic payments received or made by the fund are recorded in the accompanying Statement of Operations as realized gains or losses, respectively.
Credit default swaps involve the exchange of a fixed rate premium for protection against the loss in value of an underlying debt instrument in the event of a defined credit event (such as payment default or bankruptcy). Under the terms of the swap, one party acts as a "guarantor" receiving a periodic payment that is a fixed percentage applied to a notional principal amount. In return the party agrees to purchase the notional amount of the
Annual Report
Notes to Financial Statements - continued
2. Operating Policies - continued
Swap Agreements - continued
underlying instrument, at par, if a credit event occurs during the term of the swap. The fund may enter into credit default swaps in which either it or its counterparty act as guarantors. By acting as the guarantor of a swap, a fund assumes the market and credit risk of the underlying instrument including liquidity and loss of value. Periodic payments and premiums received or made by the fund are recorded in the accompanying Statement of Operations as realized gains or losses, respectively.
Swaps are marked-to-market daily based on dealer-supplied valuations and changes in value are recorded as unrealized appreciation (depreciation). Gains or losses are realized upon early termination of the swap agreement. Collateral, in the form of cash or securities, may be required to be held in segregated accounts with a fund's custodian in compliance with swap contracts. Risks may exceed amounts recognized on the Statement of Assets and Liabilities. These risks include changes in the returns of the underlying instruments, failure of the counterparties to perform under the contracts' terms and the possible lack of liquidity with respect to the swap agreements. Details of swap agreements open at period end are included in the fund's Schedule of Investments under the caption "Swap Agreements."
Mortgage Dollar Rolls. To earn additional income, the fund may employ trading strategies which involve the sale and simultaneous agreement to repurchase similar securities ("mortgage dollar rolls") or the purchase and simultaneous agreement to sell similar securities ("reverse mortgage dollar rolls"). The securities traded are mortgage securities and bear the same interest rate but may be collateralized by different pools of mortgages. During the period between the sale and repurchase in a mortgage dollar roll transaction, a fund will not be entitled to receive interest and principal payments on the securities sold but will invest the proceeds of the sale in other securities which may enhance the yield and total return. In addition, the difference between the sale price and the future purchase price is recorded as an adjustment to investment income. During the period between the purchase and subsequent sale in a reverse mortgage dollar roll transaction a fund is entitled to interest and principal payments on the securities purchased. The price differential between the purchase and sale is recorded as an adjustment to investment income. Losses may arise due to changes in the value of the securities or if the counterparty does not perform under the terms of the agreement. If the counterparty files for bankruptcy or becomes insolvent, a fund's right to repurchase or sell securities may be limited.
3. Purchases and Sales of Investments.
Purchases and sales of securities, other than short-term securities and U.S. government securities, aggregated $383,859,606 and $88,905,991, respectively.
Annual Report
4. Fees and Other Transactions with Affiliates.
Management Fee. FMR and its affiliates provide the fund with investment management related services for which the fund pays a monthly management fee. The management fee is the sum of an individual fund fee rate that is based on an annual rate of .30% of the fund's average net assets (effective June 1, 2005, the fund's management contract was amended, reducing the individual fund fee rate to .20% of average net assets) and a group fee rate that averaged .12% during the period. The group fee rate is based upon the average net assets of all the mutual funds advised by FMR. The group fee rate decreases as assets under management increase and increases as assets under management decrease. For the period, the total annual management fee rate was .40% of the fund's average net assets.
Distribution and Service Plan. In accordance with Rule 12b-1 of the 1940 Act, the fund has adopted separate Distribution and Service Plans for each class of shares. Certain classes pay Fidelity Distributors Corporation (FDC), an affiliate of FMR, separate Distribution and Service Fees, each of which is based on an annual percentage of each class' average net assets. In addition, FDC may pay financial intermediaries for selling shares of the fund and providing shareholder support services. For the period, the Distribution and Service Fee rates and the total amounts paid to and retained by FDC were as follows:
| Distribution
Fee | Service
Fee | Paid to
FDC | Retained
by FDC |
Class A | 0% | .15% | $ 2,731 | $ 145 |
Class T | 0% | .15% | 3,153 | 1,639 |
| | | $ 5,884 | $ 1,784 |
Sales Load. FDC receives a front-end sales charge of up to 1.50% for selling Class A and Class T shares, some of which is paid to financial intermediaries for selling shares of the fund. FDC receives the proceeds of contingent deferred sales charges levied on Class A and Class T redemptions. These charges depend on the holding period. The deferred sales charges are.25% for certain purchases of Class A and Class T shares.
For the period, sales charge amounts retained by FDC were as follows:
| Retained
by FDC |
Class A | $ 3,708 |
Class T | 2,035 |
| $ 5,743 |
Annual Report
Notes to Financial Statements - continued
4. Fees and Other Transactions with Affiliates - continued
Transfer Agent Fees. Fidelity Investments Institutional Operations Company, Inc. (FIIOC), an affiliate of FMR, is the transfer, dividend disbursing and shareholder servicing agent for each class of the fund, except for Ultra-Short Bond. Fidelity Service Company, Inc. (FSC), an affiliate of FMR, is the transfer agent for Ultra-Short Bond shares. FIIOC and FSC receive account fees and asset-based fees that vary according to the account size and type of account of the shareholders of the respective classes of the fund. FIIOC and FSC pay for typesetting, printing and mailing of shareholder reports, except proxy statements. Under an amended contract effective June 1, 2005, transfer agent fees for the Ultra-Short Bond class consist of an asset based fee and were reduced to a rate of .10% of average net assets. The account fees were eliminated. For the period the total transfer agent fees paid by each class to FIIOC or FSC, were as follows:
| Amount | % of
Average
Net Assets |
Class A | $ 3,425 | .19 |
Class T | 3,977 | .19 |
Fidelity Ultra-Short Bond | 993,980 | .13 |
Institutional Class | 1,151 | .11 |
| $ 1,002,533 | |
Accounting Fees. FSC maintains the fund's accounting records. The fee is based on the level of average net assets for the month. Effective June 1, 2005, FMR pays these fees.
Fundwide Operations Fee. Pursuant to a new Fundwide Operations and Expense Agreement (FWOE) effective on June 1, 2005, FMR has agreed to provide for fund level expenses (which do not include transfer agent, Rule 12b-1 fees, the compensation of the independent trustees or other extraordinary expenses) in return for a FWOE fee equal to .35% less the total amount of the management fee. The FWOE paid by the fund is reduced by an amount equal to the fees and expenses paid to the independent trustees. For the period, the FWOE fee was equivalent to .005% of average net assets.
Affiliated Central Funds. The fund may invest in Money Market Central Funds which seek preservation of capital and current income and are managed by Fidelity Investments Money Management, Inc. (FIMM) an affiliate of FMR.
The fund may also invest in CIPs managed by FIMM. The Ultra-Short Central Fund seeks to obtain a high level of current income consistent with preservation of capital by investing in U.S. dollar-denominated money market and investment grade debt securities and repurchase agreements.
Annual Report
4. Fees and Other Transactions with Affiliates - continued
Affiliated Central Funds - continued
The fund's Schedule of Investments lists the CIP as an investment of the fund but does not include the underlying holdings of the CIP. Based on its investment objectives, the CIP may invest or participate in various investment vehicles or strategies such as delayed delivery and when-issued securities, derivatives, financing transactions and restricted securities. These strategies are consistent with the investment objectives of the fund and may involve certain economic risks, including the risk that a counterparty to one or more of these transactions may be unable or unwilling to comply with the terms of the governing agreement. This may result in a decline in value of the CIP and the fund.
A complete list of holdings for the CIP is available at the end of this report. In addition, a copy of the CIP's financial statements is available on the EDGAR Database on the SEC's website www.sec.gov, or at the Commission's public reference room in Washington, DC.
The Central Funds do not pay a management fee. Income distributions earned by the fund are recorded as income in the accompanying financial statements and totaled $7,392,456 for the period.
5. Committed Line of Credit.
The fund participates with other funds managed by FMR in a $4.2 billion credit facility (the "line of credit") to be utilized for temporary or emergency purposes to fund shareholder redemptions or for other short-term liquidity purposes. The fund has agreed to pay commitment fees on its pro rata portion of the line of credit. During the period, there were no borrowings on this line of credit.
6. Expense Reductions.
FMR voluntarily agreed to reimburse each class to the extent annual operating expenses exceeded certain levels of average net assets as noted in the table below. Some expenses, for example interest expense, are excluded from this reimbursement.
The following classes were in reimbursement during the period:
| Expense
Limitations | Reimbursement
from adviser |
Class A | .70% | $ 1,540 |
Class T | .70% | 1,515 |
Ultra-Short Bond | .55%* | 425,319 |
Institutional Class | .55% | 295 |
| | $ 428,669 |
* Effective June 1, 2005 the expense limitation was eliminated for Ultra-Short Bond.
Annual Report
Notes to Financial Statements - continued
6. Expense Reductions - continued
In addition, through arrangements with the fund's custodian, credits realized as a result of uninvested cash balances were used to reduce the fund's expenses. During the period, these credits reduced the fund's custody expenses by $2,847.
| Transfer Agent
expense reduction | |
Ultra-Short Bond | $ 3,228 | |
7. Other.
The fund's organizational documents provide former and current trustees and officers with a limited indemnification against liabilities arising in connection with the performance of their duties to the fund. In the normal course of business, the fund may also enter into contracts that provide general indemnifications. The fund's maximum exposure under these arrangements is unknown as this would be dependent on future claims that may be made against the fund. The risk of material loss from such claims is considered remote.
8. Distributions to Shareholders.
Distributions to shareholders of each class were as follows:
| Years ended July 31, |
| 2005 | 2004 A |
From net investment income | | |
Class A | $ 41,869 | $ 200 |
Class T | 50,050 | 262 |
Ultra-Short Bond | 18,257,386 | 4,707,455 |
Institutional Class | 22,466 | 471 |
Total | $ 18,371,771 | $ 4,708,388 |
From net realized gain | | |
Class A | $ 407 | $ - |
Class T | 503 | - |
Ultra-Short Bond | 212,634 | - |
Institutional Class | 428 | - |
Total | $ 213,972 | - |
A Distributions for Class A, Class T, and Institutional Class are for the period June 16, 2004 (commencement of sale of shares) to July 31, 2004.
Annual Report
9. Share Transactions.
Transactions for each class of shares were as follows:
| Shares | Dollars |
| Years ended July 31, | Years ended July 31, |
| 2005 | 2004 A | 2005 | 2004 A |
Class A | | | | |
Shares sold | 314,954 | 31,506 | $ 3,163,548 | $ 316,495 |
Reinvestment of distributions | 3,804 | 19 | 38,189 | 195 |
Shares redeemed | (95,385) | (78) | (957,951) | (780) |
Net increase (decrease) | 223,373 | 31,447 | $ 2,243,786 | $ 315,910 |
Class T | | | | |
Shares sold | 597,602 | 35,358 | $ 6,002,298 | $ 355,050 |
Reinvestment of distributions | 4,137 | 26 | 41,523 | 262 |
Shares redeemed | (234,046) | - | (2,350,424) | - |
Net increase (decrease) | 367,693 | 35,384 | $ 3,693,397 | $ 355,312 |
Ultra-Short Bond | | | | |
Shares sold | 63,063,839 | 59,927,755 | $ 633,315,534 | $ 602,349,405 |
Reinvestment of distributions | 1,643,763 | 418,048 | 16,499,718 | 4,203,573 |
Shares redeemed | (32,055,308) | (25,071,625) | (321,868,107) | (252,053,274) |
Net increase (decrease) | 32,652,294 | 35,274,178 | $ 327,947,145 | $ 354,499,704 |
Institutional Class | | | | |
Shares sold | 296,985 | 37,405 | $ 2,986,442 | $ 375,544 |
Reinvestment of distributions | 2,113 | 47 | 21,221 | 471 |
Shares redeemed | (285,834) | - | (2,870,628) | - |
Net increase (decrease) | 13,264 | 37,452 | $ 137,035 | $ 376,015 |
A Share transactions for Class A, Class T, and Institutional Class are for the period June 16, 2004 (commencement of sale of shares) to July 31, 2004.
Annual Report
Report of Independent Registered Public Accounting Firm
To the Trustees of Fidelity Income Fund and the Shareholders of Fidelity Ultra-Short Bond Fund:
In our opinion, the accompanying statement of assets and liabilities, including the schedule of investments, and the related statements of operations and of changes in net assets and the financial highlights present fairly, in all material respects, the financial position of Fidelity Ultra-Short Bond Fund (a fund of Fidelity Income Fund) at July 31, 2005 and the results of their operations, the changes in their net assets and the financial highlights for the periods indicated, in conformity with accounting principles generally accepted in the United States of America. These financial statements and financial highlights (hereafter referred to as "financial statements") are the responsibility of the Fidelity Ultra-Short Bond Fund's management; our responsibility is to express an opinion on these financial statements based on our audits. We conducted our audits of these financial statements in accordance with the standards of the Public Company Accounting Oversight Board (United States). Those standards require that we plan and perform the audit to obtain reasonable assurance about whether the financial statements are free of material misstatement. An audit includes examining, on a test basis, evidence supporting the amounts and disclosures in the financial statements, assessing the accounting principles used and significant estimates made by management, and evaluating the overall financial statement presentation. We believe that our audits, which included confirmation of securities at July 31, 2005 by correspondence with the custodian and brokers, provide a reasonable basis for our opinion.
/s/ PricewaterhouseCoopers LLP
PricewaterhouseCoopers LLP
Boston, Massachusetts
September 13, 2005
Annual Report
Trustees and Officers
The Trustees, Members of the Advisory Board, and executive officers of the trust and fund, as applicable, are listed below. The Board of Trustees governs the fund and is responsible for protecting the interests of shareholders. The Trustees are experienced executives who meet periodically throughout the year to oversee the fund's activities, review contractual arrangements with companies that provide services to the fund, and review the fund's performance. Except for William O. McCoy, Stephen P. Jonas, and Kenneth L. Wolfe, each of the Trustees oversees 320 funds advised by FMR or an affiliate. Mr. McCoy oversees 322 funds advised by FMR or an affiliate. Mr. Jonas and Mr. Wolfe oversee 311 funds advised by FMR or an affiliate.
The Trustees hold office without limit in time except that (a) any Trustee may resign; (b) any Trustee may be removed by written instrument, signed by at least two-thirds of the number of Trustees prior to such removal; (c) any Trustee who requests to be retired or who has become incapacitated by illness or injury may be retired by written instrument signed by a majority of the other Trustees; and (d) any Trustee may be removed at any special meeting of shareholders by a two-thirds vote of the outstanding voting securities of the trust. Each Trustee who is not an interested person (as defined in the 1940 Act) (Independent Trustee), shall retire not later than the last day of the calendar year in which his or her 72nd birthday occurs. The Independent Trustees may waive this mandatory retirement age policy with respect to individual Trustees. The executive officers and Advisory Board Members hold office without limit in time, except that any officer and Advisory Board Member may resign or may be removed by a vote of a majority of the Trustees at any regular meeting or any special meeting of the Trustees. Except as indicated, each individual has held the office shown or other offices in the same company for the past five years.
The fund's Statement of Additional Information (SAI) includes more information about the Trustees. To request a free copy, call Fidelity at 1-800-208-0098.
Interested Trustees*:
Correspondence intended for each Trustee who is an interested person may be sent to Fidelity Investments, 82 Devonshire Street, Boston, Massachusetts 02109.
Name, Age; Principal Occupation |
Edward C. Johnson 3d (75)** |
| Year of Election or Appointment: 1984 Mr. Johnson is Chairman of the Board of Trustees. Mr. Johnson serves as Chief Executive Officer, Chairman, and a Director of FMR Corp.; a Director and Chairman of the Board and of the Executive Committee of FMR; Chairman and a Director of Fidelity Management & Research (Far East) Inc.; Chairman and a Director of Fidelity Investments Money Management, Inc.; and Chairman (2001-present) and a Director (2000-present) of FMR Co., Inc. |
Abigail P. Johnson (43)** |
| Year of Election or Appointment: 2001 Ms. Johnson serves as President of Fidelity Employer Services Company (FESCO) (2005-present). She is President and a Director of Fidelity Investments Money Management, Inc. (2001-present), FMR Co., Inc. (2001-present), and a Director of FMR Corp. Previously, Ms. Johnson served as President and a Director of FMR (2001-2005), Senior Vice President of the Fidelity funds (2001-2005), and managed a number of Fidelity funds. |
Stephen P. Jonas (52) |
| Year of Election or Appointment: 2005 Mr. Jonas is Senior Vice President of the fund (2005-present). He also serves as Senior Vice President of other Fidelity funds (2005-present). Mr. Jonas is Executive Director of FMR (2005-present). Previously, Mr. Jonas served as President of Fidelity Enterprise Operations and Risk Services (2004-2005), Chief Administrative Officer (2002-2004), and Chief Financial Officer of FMR Co. (1998-2000). Mr. Jonas has been with Fidelity Investments since 1987 and has held various financial and management positions including Chief Financial Officer of FMR. In addition, he serves on the Boards of Boston Ballet (2003-present) and Simmons College (2003-present). |
Robert L. Reynolds (53) |
| Year of Election or Appointment: 2003 Mr. Reynolds is a Director (2003-present) and Chief Operating Officer (2002-present) of FMR Corp. He also serves on the Board at Fidelity Investments Canada, Ltd. (2000-present). Previously, Mr. Reynolds served as President of Fidelity Investments Institutional Retirement Group (1996-2000). |
* Trustees have been determined to be "Interested Trustees" by virtue of, among other things, their affiliation with the trust or various entities under common control with FMR.
** Edward C. Johnson 3d, Trustee, is Abigail P. Johnson's father.
Annual Report
Independent Trustees:
Correspondence intended for each Independent Trustee (that is, the Trustees other than the Interested Trustees) may be sent to Fidelity Investments, P.O. Box 55235, Boston, Massachusetts 02205-5235.
Name, Age; Principal Occupation |
Dennis J. Dirks (57) |
| Year of Election or Appointment: 2005 Prior to his retirement in May 2003, Mr. Dirks was Chief Operating Officer and a member of the Board of The Depository Trust & Clearing Corporation (DTCC) (1999-2003). He also served as President, Chief Operating Officer, and Board member of The Depository Trust Company (DTC) (1999-2003) and President and Board member of the National Securities Clearing Corporation (NSCC) (1999-2003). In addition, Mr. Dirks served as Chief Executive Officer and Board member of the Government Securities Clearing Corporation (2001-2003) and Chief Executive Officer and Board member of the Mortgage-Backed Securities Clearing Corporation (2001-2003). Mr. Dirks also serves as a Trustee of Manhattan College (2005-present). |
Robert M. Gates (61) |
| Year of Election or Appointment: 1997 Dr. Gates is Vice Chairman of the Independent Trustees (2005-present). Dr. Gates is President of Texas A&M University (2002-present). He was Director of the Central Intelligence Agency (CIA) from 1991 to 1993. From 1989 to 1991, Dr. Gates served as Assistant to the President of the United States and Deputy National Security Advisor. Dr. Gates is a Director of NACCO Industries, Inc. (mining and manufacturing), Parker Drilling Co., Inc. (drilling and rental tools for the energy industry, 2001-present), and Brinker International (restaurant management, 2003-present). Previously, Dr. Gates served as a Director of LucasVarity PLC (automotive components and diesel engines), a Director of TRW Inc. (automotive, space, defense, and information technology), and Dean of the George Bush School of Government and Public Service at Texas A&M University (1999-2001). Dr. Gates also is a Trustee of the Forum for International Policy. |
George H. Heilmeier (69) |
| Year of Election or Appointment: 2004 Dr. Heilmeier is Chairman Emeritus of Telcordia Technologies (communication software and systems), where prior to his retirement, he served as company Chairman and Chief Executive Officer. He currently serves on the Boards of Directors of The Mitre Corporation (systems engineering and information technology support for the government), and HRL Laboratories (private research and development, 2004-present). He is Chairman of the General Motors Science & Technology Advisory Board and a Life Fellow of the Institute of Electrical and Electronics Engineers (IEEE) (2000-present). Dr. Heilmeier is a member of the Defense Science Board and the National Security Agency Advisory Board. He is also a member of the National Academy of Engineering, the American Academy of Arts and Sciences, and the Board of Overseers of the School of Engineering and Applied Science of the University of Pennsylvania. Previously, Dr. Heilmeier served as a Director of TRW Inc. (automotive, space, defense, and information technology, 1992-2002), Compaq (1994-2002), Automatic Data Processing, Inc. (ADP) (technology-based business outsourcing, 1995-2002), INET Technologies Inc. (telecommunications network surveillance, 2001-2004), and Teletech Holdings (customer management services). He is the recipient of the 2005 Kyoto Prize in Advanced Technology for his invention of the liquid display. |
Marie L. Knowles (58) |
| Year of Election or Appointment: 2001 Prior to Ms. Knowles' retirement in June 2000, she served as Executive Vice President and Chief Financial Officer of Atlantic Richfield Company (ARCO) (diversified energy, 1996-2000). From 1993 to 1996, she was a Senior Vice President of ARCO and President of ARCO Transportation Company. She served as a Director of ARCO from 1996 to 1998. She currently serves as a Director of Phelps Dodge Corporation (copper mining and manufacturing) and McKesson Corporation (healthcare service, 2002-present). Ms. Knowles is a Trustee of the Brookings Institution and the Catalina Island Conservancy and also serves as a member of the Advisory Board for the School of Engineering of the University of Southern California. |
Ned C. Lautenbach (61) |
| Year of Election or Appointment: 2000 Mr. Lautenbach has been a partner of Clayton, Dubilier & Rice, Inc. (private equity investment firm) since September 1998. Previously, Mr. Lautenbach was with the International Business Machines Corporation (IBM) from 1968 until his retirement in 1998. Mr. Lautenbach serves as a Director of Italtel Holding S.p.A. (telecommunications (Milan, Italy), 2004-present) and Eaton Corporation (diversified industrial) as well as the Philharmonic Center for the Arts in Naples, Florida. He also is a member of the Board of Trustees of Fairfield University (2005-present), as well as a member of the Council on Foreign Relations. |
Marvin L. Mann (72) |
| Year of Election or Appointment: 1993 Mr. Mann is Chairman of the Independent Trustees (2001-present). He is Chairman Emeritus of Lexmark International, Inc. (computer peripherals), where he served as CEO until April 1998, retired as Chairman May 1999, and remains a member of the Board. Prior to 1991, he held the positions of Vice President of International Business Machines Corporation (IBM) and President and General Manager of various IBM divisions and subsidiaries. He is a member of the Executive Committee of the Independent Director's Council of the Investment Company Institute. In addition, Mr. Mann is a member of the President's Cabinet at the University of Alabama and the Board of Visitors of the Culverhouse College of Commerce and Business Administration at the University of Alabama. |
William O. McCoy (71) |
| Year of Election or Appointment: 1997 Prior to his retirement in December 1994, Mr. McCoy was Vice Chairman of the Board of BellSouth Corporation (telecommunications) and President of BellSouth Enterprises. He is currently a Director of Liberty Corporation (holding company), Duke Realty Corporation (real estate), and Progress Energy, Inc. (electric utility). He is also a partner of Franklin Street Partners (private investment management firm) and a member of the Research Triangle Foundation Board. In addition, Mr. McCoy served as the Interim Chancellor (1999-2000) and a member of the Board of Visitors for the University of North Carolina at Chapel Hill and currently serves on the Board of Directors of the University of North Carolina Health Care System and the Board of Visitors of the Kenan-Flagler Business School (University of North Carolina at Chapel Hill). He also served as Vice President of Finance for the University of North Carolina (16-school system). |
Cornelia M. Small (61) |
| Year of Election or Appointment: 2005 Ms. Small is a member (2000-present) and Chairperson (2002-present) of the Investment Committee, and a member (2002-present) of the Board of Trustees of Smith College. Previously, she served as Chief Investment Officer (1999-2000), Director of Global Equity Investments (1996-1999), and a member of the Board of Directors of Scudder, Stevens & Clark (1990-1997) and Scudder Kemper Investments (1997-1998). In addition, Ms. Small served as Co-Chair (2000-2003) of the Annual Fund for the Fletcher School of Law and Diplomacy. |
William S. Stavropoulos (66) |
| Year of Election or Appointment: 2001 Mr. Stavropoulos is Chairman of the Board (2000-present) and a Member of the Board of Directors of The Dow Chemical Company. Since joining The Dow Chemical Company in 1967, Mr. Stavropoulos served in numerous senior management positions, including President (1993-2000; 2002-2003), CEO (1995-2000; 2002-2004), and Chairman of the Executive Committee (2000-2004). Currently, he is a Director of NCR Corporation (data warehousing and technology solutions), BellSouth Corporation (telecommunications), Chemical Financial Corporation, Maersk Inc. (industrial conglomerate, 2002-present), and Metalmark Capital (private equity investment firm, 2005-present). He also serves as a member of the Board of Trustees of the American Enterprise Institute for Public Policy Research. In addition, Mr. Stavropoulos is a member of The Business Council, J.P. Morgan International Council and the University of Notre Dame Advisory Council for the College of Science. |
Kenneth L. Wolfe (66) |
| Year of Election or Appointment: 2005 Mr. Wolfe also serves as a Trustee (2005-present) or Member of the Advisory Board (2004-present) of other investment companies advised by FMR. Prior to his retirement in 2001, Mr. Wolfe was Chairman and Chief Executive Officer of Hershey Foods Corporation (1993-2001). He currently serves as a member of the boards of Adelphia Communications Corporation (2003-present), Bausch & Lomb, Inc., and Revlon Inc. (2004-present). |
Annual Report
Advisory Board Members and Executive Officers:
Correspondence intended for Mr. Gamper may be sent to Fidelity Investments, P.O. Box 55235, Boston, Massachusetts 02205-5235. Correspondence intended for each executive officer and Mr. Lynch may be sent to Fidelity Investments, 82 Devonshire Street, Boston, Massachusetts 02109.
Name, Age; Principal Occupation |
Albert R. Gamper, Jr. (63) |
| Year of Election or Appointment: 2005 Member of the Advisory Board of Fidelity Income Fund. Prior to his retirement in December 2004, Mr. Gamper served as Chairman of the Board of CIT Group Inc. (commercial finance). During his tenure with CIT Group Inc. Mr. Gamper served in numerous senior management positions, including Chairman (1987-1989; 1999-2001; 2002-2004), Chief Executive Officer (1987-2004), and President (1989-2002). He currently serves as a member of the Board of Directors of Public Service Enterprise Group (utilities, 2001-present), Chairman of the Board of Governors, Rutgers University (2004-present), and Chairman of the Board of Saint Barnabas Health Care System. |
Peter S. Lynch (61) |
| Year of Election or Appointment: 2003 Member of the Advisory Board of Fidelity Income Fund. Vice Chairman and a Director of FMR, and Vice Chairman (2001-present) and a Director (2000-present) of FMR Co., Inc. Previously, Mr. Lynch served as a Trustee of the Fidelity funds (1990-2003). In addition, he serves as a Trustee of Boston College, Massachusetts Eye & Ear Infirmary, Historic Deerfield, John F. Kennedy Library, and the Museum of Fine Arts of Boston. |
Walter C. Donovan (43) |
| Year of Election or Appointment: 2005 Vice President of the fund. Mr. Donovan also serves as Vice President of Fidelity's High Income Funds (2005-present), Fidelity's Fixed-Income Funds (2005-present), certain Asset Allocation Funds (2005-present), and certain Balanced Funds (2005-present). Mr. Donovan also serves as Executive Vice President of FMR (2005-present) and FMRC (2005-present). Previously, Mr. Donovan served as Vice President and Director of Fidelity's International Equity Trading group (1998-2005). |
David L. Murphy (57) |
| Year of Election or Appointment: 2005 Vice President of the fund. Mr. Murphy also serves as Vice President of Fidelity's Money Market Funds (2002-present), certain Asset Allocation Funds (2003-present), Fidelity's Investment Grade-Bond Funds (2005-present), and Fidelity's Balanced Funds (2005-present). He serves as Senior Vice President (2000-present) and Head (2004-present) of the Fidelity Investments Fixed Income Division. Mr. Murphy is also a Senior Vice President of FIMM (2003-present) and a Vice President of FMR (2000-present). Previously, Mr. Murphy served as Money Market Group Leader (2002-2004), Bond Group Leader (2000-2002), and Vice President of Fidelity's Taxable Bond Funds (2000-2002) and Fidelity's Municipal Bond Funds (2001-2002). Mr. Murphy joined Fidelity Investments in 1989 as a portfolio manager in the Bond Group. |
Thomas J. Silvia (44) |
| Year of Election or Appointment: 2005 Vice President of the fund. Mr. Silvia also serves as Vice President of Fidelity's Bond Funds (2005-present) and Senior Vice President and Bond Group Leader of the Fidelity Investments Fixed-Income Division (2005-present). Previously, Mr. Silvia served as Director of Fidelity's Taxable Bond portfolio managers (2002-2004) and a portfolio manager in the Bond Group (1997-2004). |
Andrew J. Dudley (41) |
| Year of Election or Appointment: 2002 Vice President of the fund. Mr. Dudley also serves as Vice President of other funds advised by FMR. Prior to assuming his current responsibilities, Mr. Dudley managed a variety of Fidelity funds. |
Eric D. Roiter (56) |
| Year of Election or Appointment: 2004 Secretary of the fund. He also serves as Secretary of other Fidelity funds; Vice President, General Counsel, and Secretary of FMR Co., Inc. (2001-present) and FMR; Assistant Secretary of Fidelity Management & Research (U.K.) Inc. (2001-present), Fidelity Management & Research (Far East) Inc. (2001-present), and Fidelity Investments Money Management, Inc. (2001-present). Mr. Roiter is an Adjunct Member, Faculty of Law, at Boston College Law School (2003-present). Previously, Mr. Roiter served as Vice President and Secretary of Fidelity Distributors Corporation (FDC) (1998-2005). |
Stuart Fross (45) |
| Year of Election or Appointment: 2004 Assistant Secretary of the fund. Mr. Fross also serves as Assistant Secretary of other Fidelity funds (2003-present), Vice President and Secretary of FDC (2005-present), and is an employee of FMR. |
Christine Reynolds (46) |
| Year of Election or Appointment: 2004 President, Treasurer, and Anti-Money Laundering (AML) officer of the fund. Ms. Reynolds also serves as President, Treasurer, and AML officer of other Fidelity funds (2004) and is a Vice President (2003) and an employee (2002) of FMR. Before joining Fidelity Investments, Ms. Reynolds worked at PricewaterhouseCoopers LLP (PwC) (1980-2002), where she was most recently an audit partner with PwC's investment management practice. |
Timothy F. Hayes (54) |
| Year of Election or Appointment: 2004 Chief Financial Officer of the fund. Mr. Hayes also serves as Chief Financial Officer of other Fidelity funds (2002-present) and President of Fidelity Investment Operations (2005-present) which includes Fidelity Pricing and Cash Management Services Group (FPCMS), where he served as President (1998-2005). Mr. Hayes serves as President of Fidelity Service Company (2003-present) where he also serves as a Director. Mr. Hayes also served as President of Fidelity Investments Operations Group (FIOG, 2002-2005). |
Kenneth A. Rathgeber (58) |
| Year of Election or Appointment: 2004 Chief Compliance Officer of the fund. Mr. Rathgeber also serves as Chief Compliance Officer of other Fidelity funds (2004) and Executive Vice President of Risk Oversight for Fidelity Investments (2002). Previously, he served as Executive Vice President and Chief Operating Officer for Fidelity Investments Institutional Services Company, Inc. (1998-2002). |
John R. Hebble (47) |
| Year of Election or Appointment: 2004 Deputy Treasurer of the fund. Mr. Hebble also serves as Deputy Treasurer of other Fidelity funds (2003), and is an employee of FMR. Before joining Fidelity Investments, Mr. Hebble worked at Deutsche Asset Management where he served as Director of Fund Accounting (2002-2003) and Assistant Treasurer of the Scudder Funds (1998-2003). |
Bryan A. Mehrmann (44) |
| Year of Election or Appointment: 2005 Deputy Treasurer of the fund. Mr. Mehrmann also serves as Deputy Treasurer of other Fidelity funds (2005-present) and is an employee of FMR. Previously, Mr. Mehrmann served as Vice President of Fidelity Investments Institutional Services Group (FIIS)/Fidelity Investments Institutional Operations Corporation, Inc. (FIIOC) Client Services (1998-2004). |
Kimberley H. Monasterio (41) |
| Year of Election or Appointment: 2004 Deputy Treasurer of the fund. Ms. Monasterio also serves as Deputy Treasurer of other Fidelity funds (2004) and is an employee of FMR (2004). Before joining Fidelity Investments, Ms. Monasterio served as Treasurer (2000-2004) and Chief Financial Officer (2002-2004) of the Franklin Templeton Funds and Senior Vice President of Franklin Templeton Services, LLC (2000-2004). |
Kenneth B. Robins (35) |
| Year of Election or Appointment: 2005 Deputy Treasurer of the fund. Mr. Robins also serves as Deputy Treasurer of other Fidelity funds (2005-present) and is an employee of FMR (2004-present). Before joining Fidelity Investments, Mr. Robins worked at KPMG LLP, where he was a partner in KPMG's department of professional practice (2002-2004) and a Senior Manager (1999-2000). In addition, Mr. Robins served as Assistant Chief Accountant, United States Securities and Exchange Commission (2000-2002). |
Robert G. Byrnes (38) |
| Year of Election or Appointment: 2005 Assistant Treasurer of the fund. Mr. Byrnes also serves as Assistant Treasurer of other Fidelity funds (2005-present) and is an employee of FMR (2005-present). Previously, Mr. Byrnes served as Vice President of FPCMS (2003-2005). Before joining Fidelity Investments, Mr. Byrnes worked at Deutsche Asset Management where he served as Vice President of the Investment Operations Group (2000-2003). |
John H. Costello (58) |
| Year of Election or Appointment: 2004 Assistant Treasurer of the fund. Mr. Costello also serves as Assistant Treasurer of other Fidelity funds and is an employee of FMR. |
Peter L. Lydecker (51) |
| Year of Election or Appointment: 2004 Assistant Treasurer of the fund. Mr. Lydecker also serves as Assistant Treasurer of other Fidelity funds (2004) and is an employee of FMR. |
Mark Osterheld (50) |
| Year of Election or Appointment: 2004 Assistant Treasurer of the fund. Mr. Osterheld also serves as Assistant Treasurer of other Fidelity funds (2002) and is an employee of FMR. |
Gary W. Ryan (46) |
| Year of Election or Appointment: 2005 Assistant Treasurer of the fund. Mr. Ryan also serves as Assistant Treasurer of other Fidelity funds (2005-present) and is an employee of FMR (2005-present). Previously, Mr. Ryan served as Vice President of Fund Reporting in FPCMS (1999-2005). |
Salvatore Schiavone (39) |
| Year of Election or Appointment: 2005 Assistant Treasurer of the fund. Mr. Schiavone also serves as Assistant Treasurer of other Fidelity funds (2005-present) and is an employee of FMR (2005-present). Before joining Fidelity Investments, Mr. Schiavone worked at Deutsche Asset Management, where he most recently served as Assistant Treasurer (2003-2005) of the Scudder Funds and Vice President and Head of Fund Reporting (1996-2003). |
Annual Report
Distributions
The fund hereby designates as capital gain dividends: For dividends with respect to the taxable year ended July 31, 2005, $217,965, or, if subsequently determined to be different, the net capital gain of such year.
A total of 1.22% of the dividends distributed during the fiscal year was derived from interest on U.S. Government securities which is generally exempt from state income tax.
The fund will notify shareholders in January 2006 of amounts for use in preparing 2005 income tax returns.
Annual Report
Board Approval of Investment Advisory Contracts and Management Fees
Fidelity Ultra-Short Bond Fund
Each year, typically in June, the Board of Trustees, including the independent Trustees (together, the Board), votes on the renewal of the management contract and sub-advisory agreements (together, the Advisory Contracts) for the fund. The Board, assisted by the advice of fund counsel and independent Trustees' counsel, requests and considers a broad range of information throughout the year.
The Board meets regularly each month except August and takes into account throughout the year matters bearing on Advisory Contracts. The Board, acting directly and through its separate committees, considers at each of its meetings factors that are relevant to the annual renewal of the fund's Advisory Contracts, including the services and support provided to the fund and its shareholders by Fidelity. At the time of the renewal, the Board had 11 standing committees, each composed of independent Trustees with varying backgrounds, to which the Board has assigned specific subject matter responsibilities in order to enhance effective decision-making by the Board. Each committee has adopted a written charter outlining the structure and purposes of the committee. One such committee, the Fixed-Income Contract Committee, meets periodically during the first six months of each year and as necessary to consider matters specifically related to the annual renewal of Advisory Contracts. The committee requests and receives information on, and makes recommendations to the independent Trustees concerning, the approval and annual review of the Advisory Contracts.
At its June 2005 meeting, the Board of Trustees, including the independent Trustees, unanimously determined to renew the Advisory Contracts for the fund. In reaching its determination, the Board considered all factors it believed relevant, including (1) the nature, extent, and quality of the services to be provided to the fund and its shareholders by Fidelity (including the investment performance of the fund); (2) the competitiveness of the management fee and total expenses of the fund; (3) the total costs of the services to be provided by and the profits to be realized by the investment adviser and its affiliates from the relationship with the fund; (4) the extent to which economies of scale would be realized as the fund grows; and (5) whether fee levels reflect these economies of scale, if any, for the benefit of fund shareholders.
In determining whether to renew the Advisory Contracts for the fund, the Board ultimately reached a determination, with the assistance of fund counsel and independent Trustees' counsel, that the renewal of the Advisory Contracts and the compensation to be received by Fidelity under the management contract is consistent with Fidelity's fiduciary duty under applicable law. In addition to evaluating the specific factors noted above, the Board, in reaching its determination, is aware that shareholders in the fund have a broad range of investment choices available to them, including a wide choice among mutual funds offered by competitors to Fidelity, and that the fund's shareholders, with the opportunity to review and weigh the disclosure provided by the fund in its prospectus and other public disclosures, have chosen to invest in this fund, managed by Fidelity.
Annual Report
Board Approval of Investment Advisory Contracts and
Management Fees - continued
Nature, Extent, and Quality of Services Provided by Fidelity. The Board considered staffing within the investment adviser, FMR, and the sub-advisers (together, the Investment Advisers), including the background of the fund's portfolio manager and the fund's investment objective and discipline. The independent Trustees also had discussions with senior management of Fidelity's investment operations and investment groups. The Board considered the structure of the portfolio manager compensation program and whether this structure provides appropriate incentives.
Fidelity Resources Dedicated to Investment Management and Support Services. The Board reviewed the size, education, and experience of the Investment Advisers' investment staff, their use of technology, and the Investment Advisers' approach to recruiting, training, and retaining portfolio managers and other research, advisory, and management personnel. The Board considered Fidelity's extensive global research capabilities that enable the Investment Advisers to aggregate data from various sources in an effort to produce positive investment results. The Board noted that Fidelity's analysts have access to a variety of technological tools that enable them to perform both fundamental and quantitative analysis and to specialize in various disciplines. The Board also considered that Fidelity's portfolio managers and analysts have access to daily portfolio attribution that allows for monitoring of a fund's portfolio, as well as an electronic communication system that provides immediate real-time access to research concerning issuers and credit enhancers.
Shareholder and Administrative Services. The Board considered the nature, extent, quality, and cost of administrative, distribution, and shareholder services performed by the Investment Advisers and their affiliates under the Advisory Contracts and under separate agreements covering transfer agency, pricing and bookkeeping, and securities lending services for the fund. The Board also considered the nature and extent of the Investment Advisers' supervision of third party service providers, principally custodians and subcustodians. The Board reviewed the allocation of fund brokerage, including allocations to brokers affiliated with the Investment Advisers. The Board also considered the resources devoted to, and the record of compliance with, the fund's compliance policies and procedures.
The Board noted that the growth of fund assets across the complex allows Fidelity to reinvest in the development of services designed to enhance the value or convenience of the Fidelity funds as investment vehicles. These services include 24-hour access to account information and market information through phone representatives and over the Internet, and investor education materials and asset allocation tools.
Investment in a Large Fund Family. The Board considered the benefits to shareholders of investing in a Fidelity fund, including the benefits of investing in a fund that is part of a large family of funds offering a variety of investment disciplines and providing for a large variety of mutual fund investor services. For example, fund shareholders are offered the privilege of exchanging shares of the fund for shares of other Fidelity funds, as set forth in the fund's prospectus, without paying an additional sales charge. The Board noted that, since the last Advisory Contract renewals in June 2004, Fidelity has taken a number of actions that benefited particular funds, including (i) voluntarily deciding in 2004 to stop using "soft" commission dollars to pay for market data and, instead, to pay for that data out of its own resources, (ii) contractually agreeing to impose management fee reductions and expense limitations on its five Spartan stock index funds and its stock index fund available through variable insurance products, (iii) contractually agreeing to eliminate the management fees on the Fidelity Freedom Funds and the Fidelity Advisor Freedom Funds, (iv) contractually agreeing to reduce the management fees on most of its investment-grade taxable bond funds, and (v) contractually agreeing to impose expense limitations on its retail and Spartan investment-grade taxable bond funds.
Annual Report
Investment Performance. The Board considered whether the fund has operated within its investment objective, as well as its record of compliance with its investment restrictions. It also reviewed the fund's absolute investment performance, as well as the fund's relative investment performance measured against (i) a broad-based securities market index, and (ii) a peer group of mutual funds deemed appropriate by the Board. Because the fund had been in existence less than three calendar years, the following chart considered by the Board shows, for the one-year period ended December 31, 2004, the return of the retail class of the fund, the return of a broad-based securities market index ("benchmark"), and a range of returns of a peer group of mutual funds identified by Lipper Inc. as having an investment objective similar to that of the fund. The return of the retail class represents the performance of a class with the lowest 12b-1 fee (not necessarily with the lowest total expenses). (The Advisor classes of the fund, which have higher 12b-1 fees, had less than one year of performance as of December 31, 2004.) The box within the chart shows the 25th percentile return (bottom of box) and the 75th percentile return (top of box) of the Lipper peer group. The percentage beaten number noted below the chart corresponds to the percentile box and represents the percentage of funds in the Lipper peer group whose performance was equal to or lower than that of the retail class.
Annual Report
Board Approval of Investment Advisory Contracts and
Management Fees - continued
The Board noted that the relative investment performance of the retail class of the fund compared favorably to its Lipper peer group for the one-year period. The Board also noted that the relative investment performance of the retail class of the fund compared favorably to its benchmark for the one-year period.
Based on its review, and giving particular weight to the nature and quality of the resources dedicated by the Investment Advisers to maintain and improve relative performance, the Board concluded that the nature, extent, and quality of the services provided by Fidelity will benefit the fund's shareholders, particularly in light of the Board's view that the fund's shareholders benefit from investing in a fund that is part of a large family of funds offering a variety of investment disciplines and services.
Competitiveness of Management Fee and Total Fund Expenses. The Board considered the fund's management fee and total expenses compared to "mapped groups" of competitive funds and classes. Fidelity creates "mapped groups" by combining similar Lipper investment objective categories that have comparable management fee characteristics. Combining Lipper investment objective categories aids the Board's management fee and total expense comparisons by broadening the competitive group used for comparison and by reducing the number of universes to which various Fidelity funds are compared.
The Board considered two proprietary management fee comparisons for the 12-month (or shorter) periods shown in the chart below. The group of Lipper funds used by the Board for management fee comparisons is referred to below as the "Total Mapped Group" and, for the reasons explained above, is broader than the Lipper peer group used by the Board for performance comparisons. The Total Mapped Group comparison focuses on a fund's standing relative to the total universe of comparable funds available to investors, in terms of gross management fees before expense reimbursements or caps. "TMG %" represents the percentage of funds in the Total Mapped Group that had management fees that were lower than the fund's. For example, a TMG % of 35% would mean that 65% of the funds in the Total Mapped Group had higher management fees than the fund. The "Asset-Size Peer Group" (ASPG) comparison focuses on a fund's standing relative to non-Fidelity funds similar in size to the fund within the Total Mapped Group. The ASPG represents at least 15% of the funds in the Total Mapped Group with comparable asset size and management fee characteristics, subject to a minimum of 50 funds (or all funds in the Total Mapped Group if fewer than 50). Additional information, such as the ASPG quartile ("quadrant") in which the fund's management fee ranked, is also included in the chart and considered by the Board.
Annual Report
The Board noted that the fund's management fee ranked below the median of its Total Mapped Group and below the median of its ASPG for 2004.
Furthermore, the Board considered that, on May 19, 2005, after the periods shown in the chart above, it had approved an amendment (effective June 1, 2005) to the fund's management contract that lowered the fund's individual fund fee rate from 30 basis points to 20 basis points. The Board considered that, if the lower individual fund fee rate had been in effect in 2004, it would have reduced the fund's management fee rate from 43 basis points to 33 basis points.
Based on its review, the Board concluded that the fund's management fee was fair and reasonable in light of the services that the fund receives and the other factors considered.
Annual Report
Board Approval of Investment Advisory Contracts and
Management Fees - continued
In its review of each class's total expenses, the Board considered the fund's management fee as well as other fund or class expenses, as applicable, such as transfer agent fees, pricing and bookkeeping fees, fund-paid 12b-1 fees, and custodial, legal, and audit fees. The Board also noted the effects of any waivers and reimbursements on fees and expenses. As part of its review, the Board also considered current and historical total expenses of each class of the fund compared to competitive fund median expenses. Each class of the fund is compared to those funds and classes in the Total Mapped Group (used by the Board for management fee comparisons) that have a similar sales load structure.
The Board noted that the total expenses of each of Class A, Class T, and Fidelity Ultra-Short Bond Fund (retail class) ranked below its competitive median for 2004, and the total expenses of Institutional Class ranked above its competitive median for 2004. The Board noted that the fund offers multiple classes, each of which has a different sales load and 12b-1 fee structure, and that the multiple structures are intended to offer a range of pricing options for the intermediary market. The Board also noted that the total expenses of the classes vary primarily by the level of their 12b-1 fees, although differences in transfer agent fees may also cause expenses to vary from class to class. The Board considered that if the lower individual fund fee rate had been in effect in 2004, it would have reduced each class's total expenses by 10 basis points and the total expenses of Institutional Class would have ranked below the median.
The Board also considered that on May 19, 2005, it had approved changes (effective June 1, 2005) in the contractual arrangements for the fund that (i) have the effect of setting the total "fund-level" expenses (including, among certain other expenses, the management fee) for each class at 35 basis points, (ii) lower and limit the "class-level" transfer agent fee for Fidelity Ultra-Short Bond Fund (retail class) to 10 basis points, and (iii) limit the total expenses for Fidelity Ultra-Short Bond Fund (retail class) to 45 basis points. These new contractual arrangements may not be increased without Board approval. The fund's Advisor classes continue to be subject to different class-level expenses (transfer agent fees and 12b-1 fees).
The Board recognized that the fund's management contract incorporates a "group fee" structure, which provides for lower fee rates as total fund assets under FMR's management increase, and for higher fee rates as total fund assets under FMR's management decrease. The Board noted that because the new contractual arrangements set the total fund-level expenses for each class at 35 basis points, increases or decreases in the management fee due to changes in the group fee rate will not impact total expenses. However, the Board realized that the 35 basis point fee rate was below the lowest management fee available under the old contractual arrangements. The maximum benefit that a decrease in the group fee rate could provide the fund would be a reduction in the management fee to approximately 39 basis points (compared to total fund-level expenses of 35 basis points under the new contractual arrangements).
Annual Report
In its review of total expenses, the Board also considered Fidelity fee structures and other information on clients that FMR and its affiliates service in other competitive markets, such as other mutual funds advised or subadvised by FMR or its affiliates, pension plan clients, and other institutional clients.
Based on its review, the Board concluded that the total expenses for each class of the fund were reasonable, although in one case above the median of the universe presented for comparison, in light of the services that the fund and its shareholders receive and the other factors considered.
Costs of the Services and Profitability. The Board considered the revenues earned and the expenses incurred by Fidelity in conducting the business of developing, marketing, distributing, managing, administering and servicing the fund and its shareholders. The Board also considered the level of Fidelity's profits in respect of all the Fidelity funds.
On an annual basis, FMR presents to the Board Fidelity's profitability for the fund. Fidelity calculates the profitability for each fund, as well as aggregate profitability for groups of Fidelity funds and all Fidelity funds, using a series of detailed revenue and cost allocation methodologies which originate with the audited books and records of Fidelity. The Audit Committee of the Board reviews any significant changes from the prior year's methodologies.
PricewaterhouseCoopers LLP (PwC), independent registered accounting firm and auditor to Fidelity and certain Fidelity funds, has been engaged annually by the Board as part of the Board's assessment of the results of Fidelity's profitability analysis. PwC's engagement includes the review and assessment of Fidelity's methodologies used in determining the revenues and expenses attributable to Fidelity's mutual fund business, and completion of agreed-upon procedures surrounding the mathematical accuracy of fund profitability and its conformity to allocation methodologies. After considering PwC's reports issued under the engagement and information provided by Fidelity, the Board believes that while other allocation methods may also be reasonable, Fidelity's profitability methodologies are reasonable in all material respects.
The Board has also reviewed Fidelity's non-fund businesses and any fall-out benefits related to the mutual fund business as well as cases where Fidelity's affiliates may benefit from or be related to the fund's business. In addition, a special committee of the Board reviewed services provided to Fidelity by its affiliates and determined that the fees that Fidelity paid for such services were reasonable.
The Board considered the costs of the services provided by and the profits realized by Fidelity in connection with the operation of the fund and determined that the amount of profit is a fair entrepreneurial profit for the management of the fund.
Annual Report
Board Approval of Investment Advisory Contracts and
Management Fees - continued
Economies of Scale. The Board considered whether there have been economies of scale in respect of the management of the Fidelity funds, whether the Fidelity funds (including the fund) have appropriately benefited from any such economies of scale, and whether there is potential for realization of any further economies of scale. The Board considered the extent to which the fund will benefit from economies of scale through increased services to the fund, through waivers or reimbursements, or through fee or expense reductions, including (Advisor classes only) reductions that occur through operation of the transfer agent agreement. The transfer agent fee varies in part based on the number of accounts in the fund. If the number of accounts decreases or the average account size increases, the overall transfer agent fee rate decreases. The Board also noted that the reduction in the fund's management fee rate from 43 basis points to 33 basis points and the reduction in each class's total expenses by 10 basis points would deliver significant economies to fund shareholders. The Board concluded that any potential economies of scale are being shared between fund shareholders and Fidelity in an appropriate manner.
Additional Information Requested by the Board. In order to develop fully the factual basis for consideration of the Advisory Contracts, the Board requested additional information regarding (i) Fidelity's fund profitability methodology, including additional detail on various cost allocations; (ii) fall-out benefits to Fidelity; and (iii) compensation of portfolio managers and research analysts.
Based on its evaluation of all of the conclusions noted above, and after considering all material factors, the Board ultimately concluded that the existing advisory fee structures are fair and reasonable, and that the fund's existing Advisory Contracts should be renewed.
Annual Report
The following is a complete listing of investments for Fidelity's
fixed-income central fund as of July 31, 2005 which is a direct
or indirect investment of Fidelity Ultra-Short Bond Fund.
These underlying holdings of the Fidelity fixed-income central fund are not included in the Schedule of Investments as part of the Financial Statements.
Annual Report
Fidelity Ultra-Short Central Fund
Investments July 31, 2005 (Unaudited)
Showing Percentage of Net Assets
Nonconvertible Bonds - 3.8% |
| Principal Amount | | Value |
CONSUMER DISCRETIONARY - 1.0% |
Auto Components - 0.3% |
DaimlerChrysler NA Holding Corp.: | | | | |
3.8594% 9/10/07 (f) | | $ 16,665,000 | | $ 16,698,830 |
3.8938% 5/24/06 (f) | | 4,700,000 | | 4,713,691 |
| | 21,412,521 |
Media - 0.7% |
Continental Cablevision, Inc. 8.3% 5/15/06 | | 8,000,000 | | 8,248,640 |
Cox Communications, Inc. (Reg. S) 3.95% 12/14/07 (f) | | 12,140,000 | | 12,202,691 |
Liberty Media Corp. 4.91% 9/17/06 (f) | | 16,694,000 | | 16,786,986 |
Univision Communications, Inc. 2.875% 10/15/06 | | 8,505,000 | | 8,315,339 |
| | 45,553,656 |
TOTAL CONSUMER DISCRETIONARY | | 66,966,177 |
ENERGY - 0.2% |
Oil, Gas & Consumable Fuels - 0.2% |
Valero Energy Corp. 7.375% 3/15/06 | | 11,550,000 | | 11,735,435 |
FINANCIALS - 1.0% |
Capital Markets - 0.1% |
State Street Capital Trust II 3.7681% 2/15/08 (f) | | 10,000,000 | | 10,002,260 |
Commercial Banks - 0.3% |
Wells Fargo & Co. 3.4194% 3/10/08 (f) | | 16,600,000 | | 16,599,452 |
Consumer Finance - 0.2% |
General Motors Acceptance Corp. 4.87% 10/20/05 (f) | | 14,765,000 | | 14,786,188 |
Thrifts & Mortgage Finance - 0.4% |
Countrywide Financial Corp. 3.71% 4/11/07 (f) | | 11,025,000 | | 11,032,034 |
Residential Capital Corp. 4.835% 6/29/07 (c)(f) | | 14,150,000 | | 14,164,716 |
| | 25,196,750 |
TOTAL FINANCIALS | | 66,584,650 |
TELECOMMUNICATION SERVICES - 1.3% |
Diversified Telecommunication Services - 1.2% |
British Telecommunications PLC 7.875% 12/15/05 | | 18,145,000 | | 18,397,070 |
France Telecom SA 7.45% 3/1/06 (a) | | 5,600,000 | | 5,699,484 |
GTE Corp. 6.36% 4/15/06 | | 9,000,000 | | 9,126,405 |
SBC Communications, Inc. 4.389% 6/5/06 (c) | | 15,315,000 | | 15,319,595 |
Sprint Capital Corp. 4.78% 8/17/06 | | 6,000,000 | | 6,020,550 |
Telefonica Europe BV 7.35% 9/15/05 | | 4,500,000 | | 4,517,537 |
Nonconvertible Bonds - continued |
| Principal Amount | | Value |
TELECOMMUNICATION SERVICES - continued |
Diversified Telecommunication Services - continued |
Telefonos de Mexico SA de CV 4.5% 11/19/08 | | $ 10,240,000 | | $ 10,092,268 |
TELUS Corp. yankee 7.5% 6/1/07 | | 6,500,000 | | 6,835,569 |
| | 76,008,478 |
Wireless Telecommunication Services - 0.1% |
AT&T Wireless Services, Inc. 7.35% 3/1/06 | | 5,500,000 | | 5,596,976 |
TOTAL TELECOMMUNICATION SERVICES | | 81,605,454 |
UTILITIES - 0.3% |
Electric Utilities - 0.2% |
Pinnacle West Energy Corp. 4.0044% 4/1/07 (c)(f) | | 12,800,000 | | 12,800,794 |
Gas Utilities - 0.1% |
NiSource Finance Corp. 7.625% 11/15/05 | | 9,250,000 | | 9,342,213 |
TOTAL UTILITIES | | 22,143,007 |
TOTAL NONCONVERTIBLE BONDS (Cost $249,397,779) | 249,034,723 |
U.S. Government Agency Obligations - 0.0% |
|
Fannie Mae 0% 9/28/05 (e)
(Cost $994,579) | | 1,000,000 | | 994,635 |
Asset-Backed Securities - 35.2% |
|
Accredited Mortgage Loan Trust: | | | | |
Series 2004-2 Class A2, 3.76% 7/25/34 (f) | | 7,964,683 | | 7,978,722 |
Series 2004-3 Class 2A4, 3.81% 10/25/34 (f) | | 10,915,000 | | 10,946,584 |
Series 2004-4 Class A2D, 3.81% 1/25/35 (f) | | 3,579,364 | | 3,588,366 |
Series 2005-1: | | | | |
Class M1, 3.93% 4/25/35 (f) | | 11,280,000 | | 11,251,882 |
Class M2, 4.15% 4/25/35 (f) | | 5,275,000 | | 5,276,901 |
ACE Securities Corp.: | | | | |
Series 2002-HE1 Class M1, 4.11% 6/25/32 (f) | | 1,308,761 | | 1,318,432 |
Series 2002-HE2 Class M1, 4.31% 8/25/32 (f) | | 18,631,213 | | 18,704,611 |
Series 2003-FM1 Class M2, 5.31% 11/25/32 (f) | | 3,015,000 | | 3,050,466 |
Series 2003-HS1: | | | | |
Class M1, 4.21% 6/25/33 (f) | | 800,000 | | 803,485 |
Class M2, 5.21% 6/25/33 (f) | | 856,000 | | 871,093 |
Asset-Backed Securities - continued |
| Principal Amount | | Value |
ACE Securities Corp.: - continued | | | | |
Series 2003-NC1 Class M1, 4.24% 7/25/33 (f) | | $ 1,600,000 | | $ 1,611,660 |
Series 2004-HE1: | | | | |
Class M1, 3.96% 2/25/34 (f) | | 2,193,000 | | 2,193,772 |
Class M2, 4.56% 2/25/34 (f) | | 2,475,000 | | 2,476,241 |
Series 2004-OP1: | | | | |
Class M1, 3.98% 4/25/34 (f) | | 4,420,000 | | 4,424,344 |
Class M2, 4.51% 4/25/34 (f) | | 6,240,000 | | 6,251,080 |
Series 2005-HE2: | | | | |
Class M1, 3.9% 4/25/35 (f) | | 1,530,000 | | 1,527,965 |
Class M2, 3.91% 4/25/35 (f) | | 1,803,000 | | 1,796,836 |
Class M3, 3.94% 4/25/35 (f) | | 1,040,000 | | 1,038,647 |
Class M4, 4.1% 4/25/35 (f) | | 1,340,000 | | 1,338,268 |
Series 2005-HE3: | | | | |
Class A2A, 3.56% 5/25/35 (f) | | 8,063,511 | | 8,063,822 |
Class A2B, 3.67% 5/25/35 (f) | | 4,370,000 | | 4,366,352 |
Series 2005-SD1 Class A1, 3.86% 11/25/50 (f) | | 2,563,309 | | 2,566,464 |
Aesop Funding II LLC Series 2005-1A Class A2, 3.49% 4/20/09 (c)(f) | | 8,800,000 | | 8,765,680 |
American Express Credit Account Master Trust: | | | | |
Series 2002-6 Class B, 3.8381% 3/15/10 (f) | | 5,000,000 | | 5,030,751 |
Series 2004-1 Class B, 3.6381% 9/15/11 (f) | | 5,775,000 | | 5,797,723 |
Series 2004-C Class C, 3.8881% 2/15/12 (c)(f) | | 17,323,520 | | 17,374,643 |
Series 2005-1 Class A, 3.4181% 10/15/12 (f) | | 15,455,000 | | 15,481,600 |
AmeriCredit Automobile Receivables Trust: | | | | |
Series 2002-EM Class A4A, 3.67% 6/8/09 | | 25,000,000 | | 24,899,223 |
Series 2003-AM: | | | | |
Class A3B, 3.71% 6/6/07 (f) | | 685,806 | | 685,879 |
Class A4B, 3.81% 11/6/09 (f) | | 12,400,000 | | 12,441,657 |
Series 2003-BX Class A4B, 3.72% 1/6/10 (f) | | 3,265,000 | | 3,275,694 |
Series 2003-CF Class A3, 2.75% 10/9/07 | | 12,249,371 | | 12,210,791 |
Series 2005-1 Class C, 4.73% 7/6/10 | | 15,500,000 | | 15,451,950 |
Ameriquest Mortgage Securities, Inc.: | | | | |
Series 2002-3 Class M1, 4.16% 8/25/32 (f) | | 5,000,000 | | 5,028,248 |
Series 2003-1: | | | | |
Class A2, 3.87% 2/25/33 (f) | | 465,695 | | 465,917 |
Class M1, 4.36% 2/25/33 (f) | | 6,150,000 | | 6,197,846 |
Series 2003-3: | | | | |
Class M1, 4.26% 3/25/33 (f) | | 1,590,000 | | 1,603,481 |
Class S, 5% 9/25/05 (g) | | 4,457,447 | | 17,215 |
Series 2003-6: | | | | |
Class M1, 4.22% 8/25/33 (f) | | 7,560,000 | | 7,611,224 |
Asset-Backed Securities - continued |
| Principal Amount | | Value |
Ameriquest Mortgage Securities, Inc.: - continued | | | | |
Series 2003-6: | | | | |
Class M2, 5.31% 5/25/33 (f) | | $ 2,750,000 | | $ 2,808,476 |
Series 2003-AR1 Class M1, 4.61% 1/25/33 (f) | | 7,000,000 | | 7,072,631 |
Series 2004-R2: | | | | |
Class M1, 3.89% 4/25/34 (f) | | 1,230,000 | | 1,229,949 |
Class M2, 3.94% 4/25/34 (f) | | 950,000 | | 949,960 |
Class M3, 4.01% 4/25/34 (f) | | 3,500,000 | | 3,499,854 |
Class M4, 4.51% 4/25/34 (f) | | 4,500,000 | | 4,499,807 |
Series 2004-R9 Class A3, 3.78% 10/25/34 (f) | | 9,340,000 | | 9,359,871 |
Series 2005-R1: | | | | |
Class M1, 3.91% 3/25/35 (f) | | 5,710,000 | | 5,691,308 |
Class M2, 3.94% 3/25/35 (f) | | 1,925,000 | | 1,918,868 |
Series 2005-R2 Class M1, 3.91% 4/25/35 (f) | | 12,500,000 | | 12,482,516 |
Amortizing Residential Collateral Trust: | | | | |
Series 2002-BC3 Class A, 3.79% 6/25/32 (f) | | 2,411,175 | | 2,418,495 |
Series 2002-BC6 Class M1, 4.21% 8/25/32 (f) | | 24,900,000 | | 25,116,817 |
Series 2002-BC7: | | | | |
Class M1, 4.1144% 10/25/32 (f) | | 10,000,000 | | 10,075,000 |
Class M2, 4.36% 10/25/32 (f) | | 5,575,000 | | 5,612,067 |
Series 2003-BC1 Class M2, 4.56% 1/25/32 (f) | | 758,836 | | 762,333 |
ARG Funding Corp.: | | | | |
Series 2005-1A Class A2, 3.53% 4/20/09 (c)(f) | | 11,000,000 | | 10,975,938 |
Series 2005-2A Class A2, 3.54% 5/20/09 (c)(f) | | 5,200,000 | | 5,190,453 |
Argent Securities, Inc.: | | | | |
Series 2003-W3 Class M2, 5.26% 9/25/33 (f) | | 20,000,000 | | 20,599,990 |
Series 2003-W7 Class A2, 3.85% 3/1/34 (f) | | 4,505,856 | | 4,515,756 |
Series 2004-W5 Class M1, 4.06% 4/25/34 (f) | | 3,960,000 | | 3,964,768 |
Series 2004-W7: | | | | |
Class M1, 4.01% 5/25/34 (f) | | 4,085,000 | | 4,084,827 |
Class M2, 4.06% 5/25/34 (f) | | 3,320,000 | | 3,319,860 |
Asset Backed Securities Corp. Home Equity Loan Trust: | | | | |
Series 2003-HE2: | | | | |
Class A2, 3.7681% 4/15/33 (f) | | 1,158,706 | | 1,159,186 |
Class M1, 4.2881% 4/15/33 (f) | | 11,365,000 | | 11,429,103 |
Series 2003-HE3: | | | | |
Class M1, 4.2181% 6/15/33 (f) | | 2,185,000 | | 2,198,827 |
Class M2, 5.3881% 6/15/33 (f) | | 10,000,000 | | 10,182,465 |
Series 2003-HE4 Class M2, 5.3881% 8/15/33 (f) | | 5,695,000 | | 5,798,650 |
Series 2003-HE5 Class A2A, 3.7481% 8/15/33 (f) | | 1,380,797 | | 1,381,390 |
Series 2003-HE6 Class M1, 4.11% 11/25/33 (f) | | 3,475,000 | | 3,490,373 |
Series 2004-HE2 Class M1, 4.01% 4/25/34 (f) | | 6,060,000 | | 6,070,769 |
Series 2004-HE3: | | | | |
Class M1, 4% 6/25/34 (f) | | 1,450,000 | | 1,454,353 |
Asset-Backed Securities - continued |
| Principal Amount | | Value |
Asset Backed Securities Corp. Home Equity Loan Trust: - continued | | | | |
Series 2004-HE3: | | | | |
Class M2, 4.58% 6/25/34 (f) | | $ 3,350,000 | | $ 3,386,297 |
Series 2004-HE6 Class A2, 3.82% 6/25/34 (f) | | 17,398,791 | | 17,435,568 |
Series 2005-HE2: | | | | |
Class M1, 3.91% 3/25/35 (f) | | 8,250,000 | | 8,235,989 |
Class M2, 3.96% 3/25/35 (f) | | 2,065,000 | | 2,065,671 |
Series 2005-HE6 Class A2B, 3.76% 8/25/35 (d)(f) | | 10,000,000 | | 10,000,000 |
Bank One Issuance Trust: | | | | |
Series 2002-B1 Class B1, 3.7681% 12/15/09 (f) | | 20,655,000 | | 20,741,067 |
Series 2002-B2 Class B2, 3.7281% 5/15/08 (f) | | 15,000,000 | | 15,001,929 |
Series 2002-B3 Class B, 3.7481% 8/15/08 (f) | | 14,500,000 | | 14,505,871 |
Series 2002-C1 Class C1, 4.3481% 12/15/09 (f) | | 7,980,000 | | 8,065,464 |
Series 2002-C2 Class C2, 4.3781% 5/15/08 (f) | | 35,785,000 | | 35,817,626 |
Bayview Financial Acquisition Trust Series 2004-C Class A1, 3.9013% 5/28/44 (f) | | 8,416,440 | | 8,415,509 |
Bayview Financial Asset Trust Series 2000-F Class A, 3.9813% 9/28/43 (f) | | 9,618,786 | | 9,632,318 |
Bayview Financial Mortgage Loan Trust Series 2004-A Class A, 3.9313% 2/28/44 (f) | | 5,760,012 | | 5,771,599 |
Bear Stearns Asset Backed Securities I: | | | | |
Series 2005-HE2: | | | | |
Class M1, 3.96% 2/25/35 (f) | | 6,655,000 | | 6,639,262 |
Class M2, 4.21% 2/25/35 (f) | | 2,430,000 | | 2,432,538 |
Series 2005-HE5 Class 1A1, 3.4244% 6/25/35 (f) | | 10,884,395 | | 10,884,395 |
Capital Auto Receivables Asset Trust: | | | | |
Series 2002-5 Class B, 2.8% 4/15/08 | | 2,894,887 | | 2,868,235 |
Series 2003-1 Class B, 3.8581% 6/15/10 (c)(f) | | 5,781,229 | | 5,797,579 |
Series 2003-2 Class B, 3.6681% 1/15/09 (f) | | 2,741,542 | | 2,746,505 |
Series 2005-1 Class B, 3.7631% 6/15/10 (f) | | 5,725,000 | | 5,730,367 |
Capital One Auto Finance Trust: | | | | |
Series 2003-A Class A4B, 3.6681% 1/15/10 (f) | | 9,630,000 | | 9,654,568 |
Series 2004-B Class A4, 3.4981% 8/15/11 (f) | | 16,300,000 | | 16,303,123 |
Capital One Master Trust: | | | | |
Series 1999-3 Class B, 3.8681% 9/15/09 (f) | | 5,000,000 | | 5,004,082 |
Series 2001-1 Class B, 3.8981% 12/15/10 (f) | | 19,500,000 | | 19,638,608 |
Series 2001-8A Class B, 3.9381% 8/17/09 (f) | | 9,585,000 | | 9,634,206 |
Series 2002-4A Class B, 3.8881% 3/15/10 (f) | | 6,000,000 | | 6,028,221 |
Capital One Multi-Asset Execution Trust: | | | | |
Series 2002-B1 Class B1, 4.0681% 7/15/08 (f) | | 17,705,000 | | 17,711,976 |
Series 2003-B1 Class B1, 4.5581% 2/17/09 (f) | | 15,470,000 | | 15,566,773 |
Capital Trust Ltd. Series 2004-1: | | | | |
Class A2, 3.88% 7/20/39 (c)(f) | | 2,968,000 | | 2,968,000 |
Asset-Backed Securities - continued |
| Principal Amount | | Value |
Capital Trust Ltd. Series 2004-1: - continued | | | | |
Class B, 4.18% 7/20/39 (c)(f) | | $ 1,550,000 | | $ 1,550,000 |
Class C, 4.53% 7/20/39 (c)(f) | | 1,994,000 | | 1,994,000 |
CDC Mortgage Capital Trust: | | | | |
Series 2001-HE1 Class M1, 4.49% 1/25/32 (f) | | 4,244,221 | | 4,254,278 |
Series 2002-HE2 Class M1, 4.16% 1/25/33 (f) | | 9,278,431 | | 9,309,123 |
Series 2002-HE3: | | | | |
Class M1, 4.56% 3/25/33 (f) | | 21,339,884 | | 21,627,815 |
Class M2, 5.71% 3/25/33 (f) | | 9,968,976 | | 10,143,974 |
Series 2003-HE1: | | | | |
Class M1, 4.36% 8/25/33 (f) | | 1,989,998 | | 1,997,574 |
Class M2, 5.41% 8/25/33 (f) | | 4,369,996 | | 4,422,084 |
Series 2003-HE2 Class A, 3.81% 10/25/33 (f) | | 1,634,377 | | 1,635,405 |
Series 2003-HE3: | | | | |
Class M1, 4.16% 11/25/33 (f) | | 2,254,989 | | 2,271,960 |
Class M2, 5.21% 11/25/33 (f) | | 1,719,992 | | 1,753,552 |
Series 2004-HE2 Class M2, 4.66% 7/26/34 (f) | | 2,345,000 | | 2,365,939 |
Chase Credit Card Owner Trust: | | | | |
Series 2001-6 Class B, 3.8681% 3/16/09 (f) | | 1,305,000 | | 1,311,169 |
Series 2002-6 Class B, 3.7381% 1/15/08 (f) | | 11,850,000 | | 11,852,472 |
Series 2004-1 Class B, 3.5881% 5/15/09 (f) | | 4,105,000 | | 4,104,204 |
Citibank Credit Card Issuance Trust: | | | | |
Series 2000-C2 Class C2, 4.2488% 10/15/07 (f) | | 17,500,000 | | 17,511,349 |
Series 2001-B2 Class B2, 3.8494% 12/10/08 (f) | | 11,945,000 | | 11,995,341 |
Series 2002-B1 Class B1, 3.8% 6/25/09 (f) | | 9,010,000 | | 9,038,878 |
Series 2002-C1 Class C1, 4.2185% 2/9/09 (f) | | 17,500,000 | | 17,686,918 |
Series 2003-B1 Class B1, 3.66% 3/7/08 (f) | | 25,000,000 | | 25,022,693 |
Series 2003-C1 Class C1, 4.65% 4/7/10 (f) | | 17,785,000 | | 18,152,159 |
Citigroup Mortgage Loan Trust Series 2003-HE4 Class A, 3.87% 12/25/33 (c)(f) | | 7,985,107 | | 7,985,935 |
CNH Wholesale Master Note Trust Series 2005-1: | | | | |
Class A, 3.43% 6/15/11 (f) | | 18,000,000 | | 18,000,000 |
Class B, 3.72% 6/15/11 (f) | | 2,280,000 | | 2,280,000 |
Countrywide Home Loans, Inc.: | | | | |
Series 2002-6 Class AV1, 3.89% 5/25/33 (f) | | 1,499,863 | | 1,503,470 |
Series 2003-BC1 Class M2, 5.46% 9/25/32 (f) | | 11,065,000 | | 11,199,451 |
Series 2003-SD3 Class A1, 3.88% 12/25/32 (c)(f) | | 927,188 | | 931,926 |
Series 2004-2 Class M1, 3.96% 5/25/34 (f) | | 5,200,000 | | 5,206,719 |
Series 2004-3: | | | | |
Class 3A4, 3.71% 8/25/34 (f) | | 530,752 | | 528,596 |
Class M1, 3.96% 6/25/34 (f) | | 1,475,000 | | 1,476,356 |
Series 2004-4: | | | | |
Class A, 3.83% 8/25/34 (f) | | 2,524,088 | | 2,526,278 |
Asset-Backed Securities - continued |
| Principal Amount | | Value |
Countrywide Home Loans, Inc.: - continued | | | | |
Series 2004-4: | | | | |
Class M1, 3.94% 7/25/34 (f) | | $ 3,650,000 | | $ 3,653,189 |
Class M2, 3.99% 6/25/34 (f) | | 4,395,000 | | 4,398,536 |
Series 2005-1: | | | | |
Class 1AV2, 3.66% 7/25/35 (f) | | 8,780,000 | | 8,775,114 |
Class M1, 3.88% 8/25/35 (f) | | 19,600,000 | | 19,563,654 |
Class MV1, 3.86% 7/25/35 (f) | | 3,135,000 | | 3,130,219 |
Class MV2, 3.9% 7/25/35 (f) | | 3,765,000 | | 3,754,147 |
Class MV3, 3.94% 7/25/35 (f) | | 1,560,000 | | 1,557,748 |
Series 2005-3 Class MV1, 3.88% 8/25/35 (f) | | 11,125,000 | | 11,103,934 |
Series 2005-AB1 Class A2, 3.67% 8/25/35 (f) | | 17,520,000 | | 17,514,797 |
Series 2005-IM1 Class A1, 3.56% 8/25/34 (d)(f) | | 17,915,000 | | 17,915,000 |
CS First Boston Mortgage Securities Corp.: | | | | |
Series 2003-8 Class A2, 3.85% 4/25/34 (f) | | 2,663,075 | | 2,674,762 |
Series 2004-FRE1: | | | | |
Class A2, 3.81% 4/25/34 (f) | | 2,689,397 | | 2,689,291 |
Class M3, 4.11% 4/25/34 (f) | | 5,885,000 | | 5,884,751 |
Discover Card Master Trust I Series 2003-4 Class B1, 3.7181% 5/16/11 (f) | | 8,155,000 | | 8,196,815 |
Fannie Mae guaranteed REMIC pass thru certificates Series 2004-T5 Class AB3, 3.8305% 5/28/35 (f) | | 6,957,460 | | 6,959,877 |
Fieldstone Mortgage Investment Corp.: | | | | |
Series 2003-1: | | | | |
Class M1, 4.14% 11/25/33 (f) | | 1,300,000 | | 1,308,748 |
Class M2, 5.21% 11/25/33 (f) | | 700,000 | | 718,600 |
Series 2004-1 Class M2, 4.56% 1/25/35 (f) | | 3,700,000 | | 3,741,581 |
Series 2004-2 Class M2, 4.61% 7/25/34 (f) | | 9,890,000 | | 9,889,579 |
Series 2004-3 Class M5, 4.91% 8/25/34 (f) | | 2,000,000 | | 2,033,830 |
Series 2005-2 Class 2A1, 3.5% 7/25/36 (d)(f) | | 16,935,000 | | 16,935,000 |
First Franklin Mortgage Loan Asset Backed Certificates: | | | | |
Series 2005-FF2 Class A2A, 3.55% 3/25/35 (f) | | 7,354,604 | | 7,354,604 |
Series 2005-FF2 Class M6, 4.16% 3/25/35 (f) | | 6,950,000 | | 6,950,000 |
First Franklin Mortgage Loan Trust Series 2004-FF2: | | | | |
Class M3, 4.01% 3/25/34 (f) | | 400,000 | | 400,711 |
Class M4, 4.36% 3/25/34 (f) | | 300,000 | | 302,647 |
First USA Credit Card Master Trust Series 2001-4 Class B, 3.75% 1/12/09 (f) | | 15,000,000 | | 15,026,199 |
First USA Secured Note Trust Series 2001-3 Class C, 4.4669% 11/19/08 (c)(f) | | 11,580,000 | | 11,661,421 |
Ford Credit Auto Owner Trust Series 2003-B Class B2, 3.8181% 10/15/07 (f) | | 19,600,000 | | 19,671,950 |
Asset-Backed Securities - continued |
| Principal Amount | | Value |
Ford Credit Floorplan Master Owner Trust Series 2005-1: | | | | |
Class A, 3.5381% 5/17/10 (f) | | $ 9,590,000 | | $ 9,589,981 |
Class B, 3.6563% 5/17/10 (f) | | 2,625,000 | | 2,624,992 |
Fremont Home Loan Trust: | | | | |
Series 2004-1: | | | | |
Class 1A1, 3.68% 2/25/34 (f) | | 2,669,337 | | 2,669,232 |
Class M1, 3.91% 2/25/34 (f) | | 750,000 | | 749,968 |
Class M2, 3.96% 2/25/34 (f) | | 800,000 | | 799,966 |
Series 2004-C Class 2A2, 4.01% 8/25/34 (f) | | 10,000,000 | | 10,101,993 |
Series 2005-2 Class 2A1, 3.5913% 6/25/35 (f) | | 15,380,000 | | 15,375,194 |
Series 2005-A: | | | | |
Class 2A2, 3.7% 2/25/35 (f) | | 11,850,000 | | 11,865,657 |
Class M1, 3.89% 1/25/35 (f) | | 1,603,000 | | 1,599,854 |
Class M2, 3.92% 1/25/35 (f) | | 2,325,000 | | 2,321,531 |
Class M3, 3.95% 1/25/35 (f) | | 1,250,000 | | 1,249,947 |
Class M4, 4.14% 1/25/35 (f) | | 925,000 | | 927,535 |
GE Business Loan Trust Series 2003-1 Class A, 3.8181% 4/15/31 (c)(f) | | 5,499,865 | | 5,531,421 |
GE Capital Credit Card Master Note Trust Series 2005-2 Class B, 3.5736% 6/15/11 (f) | | 6,475,000 | | 6,473,058 |
Gracechurch Card Funding PLC: | | | | |
Series 5: | | | | |
Class B, 3.6181% 8/15/08 (f) | | 1,520,000 | | 1,521,351 |
Class C, 4.3181% 8/15/08 (f) | | 5,580,000 | | 5,601,142 |
Series 6 Class B, 3.5781% 2/17/09 (f) | | 1,030,000 | | 1,030,901 |
Series 8 Class C, 3.6721% 6/15/10 (f) | | 18,450,000 | | 18,450,000 |
GSAMP Trust: | | | | |
Series 2002-HE Class M1, 4.68% 11/20/32 (f) | | 2,882,888 | | 2,928,737 |
Series 2002-NC1: | | | | |
Class A2, 3.78% 7/25/32 (f) | | 54,777 | | 55,099 |
Class M1, 4.1% 7/25/32 (f) | | 8,861,000 | | 8,920,491 |
Series 2003-FM1 Class M1, 4.25% 3/20/33 (f) | | 15,000,000 | | 15,136,310 |
Series 2004-FM1: | | | | |
Class M1, 4.11% 11/25/33 (f) | | 2,865,000 | | 2,864,879 |
Class M2, 4.86% 11/25/33 (f) | | 1,975,000 | | 2,005,597 |
Series 2004-FM2: | | | | |
Class M1, 3.96% 1/25/34 (f) | | 3,500,000 | | 3,499,853 |
Class M2, 4.56% 1/25/34 (f) | | 1,500,000 | | 1,499,936 |
Class M3, 4.76% 1/25/34 (f) | | 1,500,000 | | 1,499,935 |
Series 2004-HE1: | | | | |
Class M1, 4.01% 5/25/34 (f) | | 4,045,000 | | 4,044,829 |
Class M2, 4.61% 5/25/34 (f) | | 1,750,000 | | 1,766,258 |
Asset-Backed Securities - continued |
| Principal Amount | | Value |
GSAMP Trust: - continued | | | | |
Series 2005-9 Class 2A1, 3.5287% 8/25/35 (f) | | $ 17,530,000 | | $ 17,530,000 |
Series 2005-FF2 Class M5, 4.09% 3/25/35 (f) | | 3,500,000 | | 3,500,000 |
Series 2005-HE2 Class M, 3.89% 3/25/35 (f) | | 8,780,000 | | 8,749,867 |
Series 2005-NC1 Class M1, 3.91% 2/25/35 (f) | | 9,010,000 | | 8,987,296 |
Guggenheim Structured Real Estate Funding Ltd. Series 2005-1 Class C, 4.3944% 5/25/30 (c)(f) | | 14,000,000 | | 13,986,652 |
HFC Home Equity Loan Asset Backed Certificates Series 2005-2: | | | | |
Class M1, 3.97% 1/20/34 (f) | | 3,225,000 | | 3,225,000 |
Class M2, 4% 1/20/34 (f) | | 2,415,000 | | 2,415,000 |
Home Equity Asset Trust: | | | | |
Series 2002-2 Class M1, 4.26% 6/25/32 (f) | | 10,000,000 | | 10,017,090 |
Series 2002-3 Class A5, 3.9% 2/25/33 (f) | | 854,528 | | 855,194 |
Series 2002-4 Class A3, 3.94% 3/25/33 (f) | | 1,237,388 | | 1,238,074 |
Series 2002-5: | | | | |
Class A3, 3.98% 5/25/33 (f) | | 2,866,793 | | 2,872,821 |
Class M1, 4.66% 5/25/33 (f) | | 13,800,000 | | 13,966,276 |
Series 2003-1: | | | | |
Class A2, 3.93% 6/25/33 (f) | | 4,229,596 | | 4,233,111 |
Class M1, 4.46% 6/25/33 (f) | | 8,335,000 | | 8,375,317 |
Series 2003-2: | | | | |
Class A2, 3.84% 8/25/33 (f) | | 228,269 | | 229,139 |
Class M1, 4.34% 8/25/33 (f) | | 2,245,000 | | 2,269,298 |
Series 2003-3: | | | | |
Class A2, 3.82% 8/25/33 (f) | | 1,624,262 | | 1,630,339 |
Class M1, 4.32% 8/25/33 (f) | | 8,185,000 | | 8,266,814 |
Series 2003-4: | | | | |
Class M1, 4.26% 10/25/33 (f) | | 3,415,000 | | 3,440,384 |
Class M2, 5.36% 10/25/33 (f) | | 4,040,000 | | 4,093,038 |
Series 2003-5: | | | | |
Class A2, 3.81% 12/25/33 (f) | | 5,822,876 | | 5,843,440 |
Class M1, 4.16% 12/25/33 (f) | | 3,175,000 | | 3,192,660 |
Class M2, 5.19% 12/25/33 (f) | | 1,345,000 | | 1,377,487 |
Series 2003-7 Class A2, 3.84% 3/25/34 (f) | | 3,430,379 | | 3,438,503 |
Series 2004-2 Class A2, 3.75% 7/25/34 (f) | | 6,172,348 | | 6,172,139 |
Series 2004-3: | | | | |
Class M1, 4.03% 8/25/34 (f) | | 2,015,000 | | 2,019,636 |
Class M2, 4.66% 8/25/34 (f) | | 2,200,000 | | 2,237,373 |
Series 2004-4 Class A2, 3.78% 10/25/34 (f) | | 8,318,527 | | 8,347,783 |
Series 2004-6 Class A2, 3.81% 12/25/34 (f) | | 9,249,309 | | 9,278,715 |
Series 2004-7 Class A3, 3.85% 1/25/35 (f) | | 2,916,946 | | 2,929,856 |
Asset-Backed Securities - continued |
| Principal Amount | | Value |
Home Equity Asset Trust: - continued | | | | |
Series 2005-1: | | | | |
Class M1, 3.89% 5/25/35 (f) | | $ 9,705,000 | | $ 9,697,565 |
Class M2, 3.91% 5/25/35 (f) | | 5,780,000 | | 5,763,067 |
Class M3, 3.96% 5/25/35 (f) | | 5,825,000 | | 5,808,344 |
Series 2005-2: | | | | |
Class 2A2, 3.66% 7/25/35 (f) | | 13,170,000 | | 13,163,182 |
Class M1, 3.91% 7/25/35 (f) | | 10,085,000 | | 10,075,362 |
Series 2005-3 Class M1, 3.87% 8/25/35 (f) | | 9,450,000 | | 9,434,700 |
Series 2005-5 Class 2A2, 3.65% 11/25/35 (d)(f) | | 15,000,000 | | 14,968,605 |
Household Affinity Credit Card Master Note Trust I Series 2003-3 Class B, 3.6781% 8/15/08 (f) | | 10,000,000 | | 10,018,071 |
Household Credit Card Master Trust I Series 2002-1 Class B, 4.0381% 7/15/08 (f) | | 22,589,000 | | 22,608,682 |
Household Home Equity Loan Trust: | | | | |
Series 2002-2 Class A, 3.73% 4/20/32 (f) | | 3,295,048 | | 3,298,089 |
Series 2002-3 Class A, 3.88% 7/20/32 (f) | | 2,678,218 | | 2,681,775 |
Series 2003-1 Class M, 4.06% 10/20/32 (f) | | 770,987 | | 771,866 |
Series 2003-2: | | | | |
Class A, 3.76% 9/20/33 (f) | | 2,892,082 | | 2,897,777 |
Class M, 4.01% 9/20/33 (f) | | 1,360,000 | | 1,362,941 |
Series 2004-1 Class M, 3.95% 9/20/33 (f) | | 2,708,464 | | 2,713,597 |
Household Mortgage Loan Trust: | | | | |
Series 2003-HC1 Class M, 4.08% 2/20/33 (f) | | 1,742,776 | | 1,748,262 |
Series 2004-HC1: | | | | |
Class A, 3.78% 2/20/34 (f) | | 5,083,992 | | 5,096,702 |
Class M, 3.93% 2/20/34 (f) | | 3,073,800 | | 3,073,443 |
Household Private Label Credit Card Master Note Trust I: | | | | |
Series 2002-1 Class B, 3.9381% 1/18/11 (f) | | 8,850,000 | | 8,867,619 |
Series 2002-2: | | | | |
Class A, 3.5581% 1/18/11 (f) | | 9,000,000 | | 9,012,218 |
Class B, 3.9381% 1/18/11 (f) | | 14,275,000 | | 14,355,952 |
Series 2002-3 Class B, 4.6381% 9/15/09 (f) | | 4,150,000 | | 4,159,262 |
Ikon Receivables Funding LLC Series 2003-1 Class A3A, 3.6213% 12/17/07 (f) | | 2,781,207 | | 2,781,863 |
IXIS Real Estate Capital Trust Series 2005-HE1: | | | | |
Class A1, 3.71% 6/25/35 (f) | | 11,646,350 | | 11,645,706 |
Class M1, 3.93% 6/25/35 (f) | | 4,100,000 | | 4,094,813 |
Class M2, 3.95% 6/25/35 (f) | | 2,775,000 | | 2,766,003 |
Class M3, 3.98% 6/25/35 (f) | | 1,975,000 | | 1,972,566 |
Keycorp Student Loan Trust Series 1999-A Class A2, 3.8% 12/27/09 (f) | | 16,169,548 | | 16,224,493 |
Asset-Backed Securities - continued |
| Principal Amount | | Value |
Long Beach Mortgage Loan Trust: | | | | |
Series 2003-2: | | | | |
Class AV, 3.78% 6/25/33 (f) | | $ 253,078 | | $ 253,185 |
Class M1, 4.28% 6/25/33 (f) | | 19,500,000 | | 19,626,153 |
Series 2003-3 Class M1, 4.21% 7/25/33 (f) | | 7,770,000 | | 7,824,625 |
Series 2004-2: | | | | |
Class M1, 3.99% 6/25/34 (f) | | 4,275,000 | | 4,285,404 |
Class M2, 4.54% 6/25/34 (f) | | 1,400,000 | | 1,416,723 |
Series 2005-2 Class 2A2, 3.64% 4/25/35 (f) | | 12,000,000 | | 11,996,998 |
MASTR Asset Backed Securities Trust: | | | | |
Series 2003-NC1: | | | | |
Class M1, 4.19% 4/25/33 (f) | | 3,500,000 | | 3,519,270 |
Class M2, 5.31% 4/25/33 (f) | | 1,500,000 | | 1,534,429 |
Series 2004-FRE1 Class M1, 4.01% 7/25/34 (f) | | 5,223,000 | | 5,238,948 |
MBNA Asset Backed Note Trust Series 2000-K Class C, 4.1881% 3/17/08 (c)(f) | | 7,250,000 | | 7,258,700 |
MBNA Credit Card Master Note Trust: | | | | |
Series 2001-B1 Class B1, 3.7631% 10/15/08 (f) | | 30,000,000 | | 30,042,072 |
Series 2001-B2 Class B2, 3.7481% 1/15/09 (f) | | 30,353,000 | | 30,429,933 |
Series 2002-B2 Class B2, 3.7681% 10/15/09 (f) | | 20,000,000 | | 20,086,600 |
Series 2002-B3 Class B3, 3.7881% 1/15/08 (f) | | 15,000,000 | | 15,000,470 |
Series 2002-B4 Class B4, 3.8881% 3/15/10 (f) | | 14,800,000 | | 14,916,873 |
Series 2003-B2 Class B2, 3.7781% 10/15/10 (f) | | 1,530,000 | | 1,545,569 |
Series 2003-B3 Class B3, 3.7631% 1/18/11 (f) | | 1,130,000 | | 1,135,362 |
Series 2003-B5 Class B5, 3.7581% 2/15/11 (f) | | 705,000 | | 710,447 |
MBNA Master Credit Card Trust II: | | | | |
Series 1998-E Class B, 3.9288% 9/15/10 (f) | | 7,800,000 | | 7,846,570 |
Series 1998-G Class B, 3.7881% 2/17/09 (f) | | 20,000,000 | | 20,043,574 |
Meritage Mortgage Loan Trust Series 2004-1: | | | | |
Class M1, 3.96% 7/25/34 (f) | | 2,125,000 | | 2,124,911 |
Class M2, 4.01% 7/25/34 (f) | | 375,000 | | 374,985 |
Class M3, 4.41% 7/25/34 (f) | | 775,000 | | 774,967 |
Class M4, 4.56% 7/25/34 (f) | | 525,000 | | 524,978 |
Merrill Lynch Mortgage Investors, Inc. Series 2003-HE1 Class M1, 4.16% 7/25/34 (f) | | 2,321,000 | | 2,330,928 |
Morgan Stanley ABS Capital I, Inc.: | | | | |
Series 2002-NC6 Class M2, 5.56% 11/25/32 (f) | | 2,370,000 | | 2,441,680 |
Series 2003-NC5 Class M2, 5.46% 4/25/33 (f) | | 2,800,000 | | 2,834,138 |
Series 2003-NC6 Class M2, 5.41% 6/27/33 (f) | | 12,835,000 | | 13,180,825 |
Series 2003-NC7 Class M1, 4.16% 6/25/33 (f) | | 1,785,000 | | 1,791,357 |
Series 2003-NC8 Class M1, 4.16% 9/25/33 (f) | | 2,350,000 | | 2,363,472 |
Series 2004-HE6 Class A2, 3.8% 8/25/34 (f) | | 7,193,690 | | 7,217,222 |
Series 2004-NC2 Class M1, 4.01% 12/25/33 (f) | | 2,595,000 | | 2,599,359 |
Asset-Backed Securities - continued |
| Principal Amount | | Value |
Morgan Stanley ABS Capital I, Inc.: - continued | | | | |
Series 2004-NC6 Class A2, 3.8% 7/25/34 (f) | | $ 3,163,358 | | $ 3,170,145 |
Series 2005-1: | | | | |
Class M2, 3.93% 12/25/34 (f) | | 4,425,000 | | 4,417,835 |
Class M3, 3.98% 12/25/34 (f) | | 4,000,000 | | 3,998,266 |
Series 2005-HE1: | | | | |
Class A3B, 3.68% 12/25/34 (f) | | 3,885,000 | | 3,889,266 |
Class M1, 3.91% 12/25/34 (f) | | 1,100,000 | | 1,102,253 |
Class M2, 3.93% 12/25/34 (f) | | 2,970,000 | | 2,966,369 |
Series 2005-HE2: | | | | |
Class M1, 3.86% 1/25/35 (f) | | 2,665,000 | | 2,670,502 |
Class M2, 3.9% 1/25/35 (f) | | 1,900,000 | | 1,893,810 |
Series 2005-NC1: | | | | |
Class M1, 3.9% 1/25/35 (f) | | 2,425,000 | | 2,432,731 |
Class M2, 3.93% 1/25/35 (f) | | 2,425,000 | | 2,421,056 |
Class M3, 3.97% 1/25/35 (f) | | 2,425,000 | | 2,425,850 |
Morgan Stanley Dean Witter Capital I Trust: | | | | |
Series 2001-AM1: | | | | |
Class M1, 4.31% 2/25/32 (f) | | 1,510,288 | | 1,513,954 |
Class M2, 4.86% 2/25/32 (f) | | 7,146,795 | | 7,171,201 |
Series 2001-NC4: | | | | |
Class M1, 4.46% 1/25/32 (f) | | 3,827,881 | | 3,841,816 |
Series 2002-AM3 Class A3, 3.95% 2/25/33 (f) | | 1,426,624 | | 1,430,581 |
Series 2002-HE1 Class M1, 4.06% 7/25/32 (f) | | 5,860,000 | | 5,893,149 |
Series 2002-HE2 Class M1, 4.16% 8/25/32 (f) | | 9,925,000 | | 9,970,606 |
Series 2002-NC3 Class A3, 3.8% 8/25/32 (f) | | 396,299 | | 397,573 |
Series 2002-OP1 Class M1, 4.21% 9/25/32 (f) | | 3,894,745 | | 3,917,849 |
Series 2003-NC1: | | | | |
Class M1, 4.51% 11/25/32 (f) | | 2,555,000 | | 2,572,380 |
Class M2, 5.51% 11/25/32 (f) | | 1,880,000 | | 1,899,041 |
New Century Home Equity Loan Trust: | | | | |
Series 2003-2: | | | | |
Class A2, 3.89% 1/25/33 (f) | | 341,254 | | 341,436 |
Class M2, 5.46% 1/25/33 (f) | | 4,600,000 | | 4,667,174 |
Series 2003-6 Class M1, 4.18% 1/25/34 (f) | | 5,180,000 | | 5,202,952 |
Series 2005-1: | | | | |
Class M1, 3.91% 3/25/35 (f) | | 4,395,000 | | 4,392,950 |
Class M2, 3.94% 3/25/35 (f) | | 4,395,000 | | 4,384,834 |
Class M3, 3.98% 3/25/35 (f) | | 2,120,000 | | 2,120,796 |
Nissan Auto Lease Trust: | | | | |
Series 2003-A Class A3A, 3.5281% 6/15/09 (f) | | 13,621,752 | | 13,633,434 |
Series 2004-A Class A4A, 3.4581% 6/15/10 (f) | | 10,570,000 | | 10,582,978 |
Asset-Backed Securities - continued |
| Principal Amount | | Value |
NovaStar Home Equity Loan Series 2004-1: | | | | |
Class M1, 3.91% 6/25/34 (f) | | $ 1,450,000 | | $ 1,451,222 |
Class M4, 4.435% 6/25/34 (f) | | 2,435,000 | | 2,439,150 |
Ocala Funding LLC Series 2005-1A Class A, 4.93% 3/20/10 (c)(f) | | 3,675,000 | | 3,675,000 |
Ownit Mortgage Loan Asste-Backed Certificates Series 2005-3 Class A2A, 3.5% 6/25/36 (f) | | 15,500,000 | | 15,500,000 |
Park Place Securities, Inc.: | | | | |
Series 2004-WCW1: | | | | |
Class M1, 4.09% 9/25/34 (f) | | 3,745,000 | | 3,756,721 |
Class M2, 4.14% 9/25/34 (f) | | 1,755,000 | | 1,764,326 |
Class M3, 4.71% 9/25/34 (f) | | 3,355,000 | | 3,396,745 |
Class M4, 4.91% 9/25/34 (f) | | 4,700,000 | | 4,767,614 |
Series 2004-WCW2 Class A2, 3.84% 10/25/34 (f) | | 7,952,623 | | 7,976,111 |
Series 2005-WCH1: | | | | |
Class A3B, 3.68% 1/25/35 (f) | | 2,775,000 | | 2,779,908 |
Class M2, 3.98% 1/25/35 (f) | | 4,175,000 | | 4,166,539 |
Class M3, 4.02% 1/25/35 (f) | | 3,290,000 | | 3,292,599 |
Class M5, 4.34% 1/25/35 (f) | | 3,095,000 | | 3,104,620 |
Series 2005-WHQ2 Class M7, 4.71% 5/25/35 (f) | | 5,950,000 | | 5,930,787 |
People's Choice Home Loan Securities Trust Series 2005-2: | | | | |
Class A1, 3.57% 9/25/24 (f) | | 7,475,790 | | 7,475,790 |
Class M4, 4.09% 5/25/35 (f) | | 6,000,000 | | 6,000,000 |
Providian Gateway Master Trust Series 2002-B Class A, 4.0881% 6/15/09 (c)(f) | | 15,000,000 | | 15,039,393 |
Residental Asset Securities Corp.: | | | | |
Series 2005-KS4 Class M2, 4.04% 4/25/35 (f) | | 1,040,000 | | 1,037,610 |
Series 2005-KS7 Class A1, 3.4781% 8/25/35 (f) | | 10,515,000 | | 10,512,897 |
Residential Asset Mortgage Products, Inc. Series 2004-RS10 Class MII2, 4.71% 10/25/34 (f) | | 5,500,000 | | 5,566,857 |
Salomon Brothers Mortgage Securities VII, Inc. Series 2003-HE1 Class A, 3.86% 4/25/33 (f) | | 818,316 | | 822,076 |
Saxon Asset Securities Trust: | | | | |
Series 2004-1 Class M1, 3.99% 3/25/35 (f) | | 4,415,000 | | 4,413,887 |
Series 2004-2 Class MV1, 4.04% 8/25/35 (f) | | 4,495,000 | | 4,501,043 |
Sears Credit Account Master Trust II: | | | | |
Series 2001-1 Class B, 3.8131% 2/15/10 (f) | | 10,000,000 | | 9,987,143 |
Series 2002-4: | | | | |
Class A, 3.5181% 8/18/09 (f) | | 27,000,000 | | 26,999,603 |
Class B, 3.8131% 8/18/09 (f) | | 33,300,000 | | 33,301,149 |
Series 2002-5 Class B, 4.6381% 11/17/09 (f) | | 30,000,000 | | 30,062,976 |
Asset-Backed Securities - continued |
| Principal Amount | | Value |
Securitized Asset Backed Receivables LLC Trust Series 2004-NC1 Class M1, 3.98% 2/25/34 (f) | | $ 2,910,000 | | $ 2,909,256 |
Specialty Underwriting & Residential Finance Series 2003-BC4 Class M1, 4.06% 11/25/34 (f) | | 1,810,000 | | 1,818,452 |
Structured Asset Securities Corp. Series 2004-GEL1 Class A, 3.82% 2/25/34 (f) | | 1,043,424 | | 1,043,422 |
Superior Wholesale Inventory Financing Trust VII Series 2003-A8 Class CTFS, 3.8381% 3/15/11 (c)(f) | | 10,835,000 | | 10,828,228 |
Superior Wholesale Inventory Financing Trust XII Series 2005-A12 Class C, 4.46% 6/15/10 (f) | | 6,840,000 | | 6,839,945 |
Terwin Mortgage Trust: | | | | |
Series 2003-4HE Class A1, 3.89% 9/25/34 (f) | | 2,878,990 | | 2,894,593 |
Series 2003-6HE Class A1, 3.93% 11/25/33 (f) | | 1,784,384 | | 1,788,543 |
Series 2005-14HE Class AF1, 3.9753% 7/25/36 (d)(f) | | 8,635,000 | | 8,633,296 |
TOTAL ASSET-BACKED SECURITIES (Cost $2,293,954,229) | 2,300,747,332 |
Collateralized Mortgage Obligations - 16.9% |
|
Private Sponsor - 13.7% |
Adjustable Rate Mortgage Trust floater: | | | | |
Series 2004-2 Class 7A3, 3.86% 2/25/35 (f) | | 9,374,471 | | 9,396,037 |
Series 2004-4 Class 5A2, 3.86% 3/25/35 (f) | | 3,780,419 | | 3,787,953 |
Series 2005-1 Class 5A2, 3.79% 5/25/35 (f) | | 6,187,250 | | 6,191,166 |
Series 2005-2: | | | | |
Class 6A2, 3.74% 6/25/35 (f) | | 2,930,592 | | 2,932,491 |
Class 6M2, 3.94% 6/25/35 (f) | | 10,145,000 | | 10,145,010 |
Series 2005-3 Class 8A2, 3.7% 7/25/35 (f) | | 19,199,197 | | 19,211,695 |
Series 2005-4 Class 7A2, 3.69% 8/25/35 (f) | | 9,011,457 | | 9,003,527 |
Series 2005-8 Class 7A2, 3.77% 11/25/35 (f) | | 7,660,000 | | 7,660,000 |
Bear Stearns Alt-A Trust floater: | | | | |
Series 2005-1 Class A1, 3.74% 1/25/35 (f) | | 20,354,186 | | 20,354,186 |
Series 2005-2 Class 1A1, 3.71% 3/25/35 (f) | | 14,961,065 | | 14,961,065 |
Series 2005-5 Class 1A1, 3.68% 7/25/35 (f) | | 18,707,862 | | 18,696,170 |
Countrywide Alternative Loan Trust planned amortization class Series 2003-5T2 Class A2, 3.86% 5/25/33 (f) | | 5,545,033 | | 5,548,017 |
Countrywide Home Loans, Inc. floater: | | | | |
Series 2004-16 Class A1, 3.86% 9/25/34 (f) | | 10,335,456 | | 10,325,843 |
Series 2005-1 Class 2A1, 3.75% 3/25/35 (f) | | 14,617,171 | | 14,617,171 |
CS First Boston Mortgage Securities Corp. floater: | | | | |
Series 2004-AR2 Class 6A1, 3.86% 3/25/34 (f) | | 5,338,263 | | 5,334,945 |
Collateralized Mortgage Obligations - continued |
| Principal Amount | | Value |
Private Sponsor - continued |
CS First Boston Mortgage Securities Corp. floater: - continued | | | | |
Series 2004-AR3 Class 6A2, 3.83% 4/25/34 (f) | | $ 2,226,193 | | $ 2,228,162 |
Series 2004-AR4 Class 5A2, 3.83% 5/25/34 (f) | | 2,066,310 | | 2,065,052 |
Series 2004-AR5 Class 11A2, 3.83% 6/25/34 (f) | | 2,987,552 | | 2,981,472 |
Series 2004-AR6 Class 9A2, 3.83% 10/25/34 (f) | | 3,981,028 | | 3,983,412 |
Series 2004-AR7 Class 6A2, 3.84% 8/25/34 (f) | | 5,801,660 | | 5,806,785 |
Series 2004-AR8 Class 8A2, 3.84% 9/25/34 (f) | | 4,630,225 | | 4,638,807 |
First Horizon Mortgage Passthru Trust floater Series 2004-FL1 Class 2A1, 3.95% 12/25/34 (f) | | 4,384,853 | | 4,379,779 |
Granite Master Issuer PLC floater: | | | | |
Series 2005-1: | | | | |
Class A3, 3.51% 12/21/24 (f) | | 5,300,000 | | 5,299,006 |
Class B1, 3.56% 12/20/54 (f) | | 7,050,000 | | 7,047,577 |
Class M1, 3.66% 12/20/54 (f) | | 5,300,000 | | 5,298,178 |
Series 2005-2 Class C1, 3.7857% 12/20/54 (f) | | 7,975,000 | | 7,972,508 |
Granite Mortgages PLC floater: | | | | |
Series 2004-1: | | | | |
Class 1B, 3.64% 3/20/44 (f) | | 1,415,000 | | 1,414,844 |
Class 1C, 4.33% 3/20/44 (f) | | 4,075,000 | | 4,091,219 |
Class 1M, 3.84% 3/20/44 (f) | | 4,935,000 | | 4,938,751 |
Series 2004-2: | | | | |
Class 1A2, 3.5% 6/20/28 (f) | | 5,384,259 | | 5,384,932 |
Class 1B, 3.6% 6/20/44 (f) | | 1,018,055 | | 1,018,309 |
Class 1C, 4.13% 6/20/44 (f) | | 3,706,295 | | 3,713,918 |
Class 1M, 3.71% 6/20/44 (f) | | 2,722,846 | | 2,724,205 |
Series 2004-3: | | | | |
Class 1B, 3.59% 9/20/44 (f) | | 2,100,000 | | 2,100,210 |
Class 1C, 4.02% 9/20/44 (f) | | 5,415,000 | | 5,426,913 |
Class 1M, 3.7% 9/20/44 (f) | | 1,200,000 | | 1,200,360 |
Harborview Mortgage Loan Trust floater Series 2005-2 Class 2A1A, 3.6369% 5/19/35 (f) | | 11,690,145 | | 11,648,134 |
Holmes Financing No. 7 PLC floater Series 2 Class M, 4.3988% 7/15/40 (f) | | 2,560,000 | | 2,564,912 |
Holmes Financing No. 8 PLC floater Series 2: | | | | |
Class A, 3.6788% 4/15/11 (f) | | 25,000,000 | | 25,000,000 |
Class B, 3.7688% 7/15/40 (f) | | 2,695,000 | | 2,696,684 |
Class C, 4.3188% 7/15/40 (f) | | 10,280,000 | | 10,328,193 |
Home Equity Asset Trust floater Series 2005-3 Class 2A1, 3.55% 8/25/35 (f) | | 7,268,025 | | 7,266,230 |
Homestar Mortgage Acceptance Corp. floater Series 2004-5 Class A1, 3.91% 10/25/34 (f) | | 4,495,430 | | 4,509,337 |
Collateralized Mortgage Obligations - continued |
| Principal Amount | | Value |
Private Sponsor - continued |
Impac CMB Trust floater: | | | | |
Series 2004-11 Class 2A2, 3.83% 3/25/35 (f) | | $ 8,638,669 | | $ 8,636,982 |
Series 2004-6 Class 1A2, 3.85% 10/25/34 (f) | | 3,481,529 | | 3,487,748 |
Series 2005-1: | | | | |
Class M1, 3.92% 4/25/35 (f) | | 3,223,929 | | 3,220,529 |
Class M2, 3.96% 4/25/35 (f) | | 5,644,146 | | 5,639,516 |
Class M3, 3.99% 4/25/35 (f) | | 1,384,927 | | 1,383,466 |
Class M4, 4.21% 4/25/35 (f) | | 817,334 | | 818,164 |
Class M5, 4.23% 4/25/35 (f) | | 817,334 | | 817,174 |
Class M6, 4.28% 4/25/35 (f) | | 1,307,734 | | 1,307,479 |
Series 2005-2 Class 1A2, 3.77% 4/25/35 (f) | | 13,211,515 | | 13,201,194 |
Series 2005-3 Class A1, 3.7% 8/25/35 (f) | | 15,176,045 | | 15,149,962 |
Series 2005-4 Class 1B1, 4.76% 6/25/35 (f) | | 5,306,886 | | 5,282,839 |
Lehman Structured Securities Corp. floater Series 2005-1 Class A2, 3.67% 9/26/45 (c)(f) | | 16,153,164 | | 16,153,164 |
MASTR Adjustable Rate Mortgages Trust: | | | | |
floater Series 2005-1 Class 1A1, 3.73% 3/25/35 (f) | | 13,405,372 | | 13,396,993 |
Series 2004-6 Class 4A2, 4.1729% 7/25/34 (f) | | 5,969,000 | | 5,946,582 |
Merrill Lynch Mortgage Investors, Inc. floater: | | | | |
Series 2003-A Class 2A1, 3.85% 3/25/28 (f) | | 8,079,308 | | 8,122,924 |
Series 2003-B Class A1, 3.8% 4/25/28 (f) | | 7,852,610 | | 7,898,403 |
Series 2003-D Class A, 3.77% 8/25/28 (f) | | 7,479,616 | | 7,494,804 |
Series 2003-E Class A2, 3.4425% 10/25/28 (f) | | 10,687,128 | | 10,687,143 |
Series 2003-F Class A2, 3.7075% 10/25/28 (f) | | 12,892,959 | | 12,891,486 |
Series 2004-A Class A2, 3.6175% 4/25/29 (f) | | 11,584,437 | | 11,556,917 |
Series 2004-B Class A2, 3.79% 6/25/29 (f) | | 8,952,030 | | 8,930,464 |
Series 2004-C Class A2, 3.95% 7/25/29 (f) | | 12,856,157 | | 12,825,407 |
Series 2004-D Class A2, 3.4725% 9/25/29 (f) | | 9,971,432 | | 9,974,033 |
Series 2004-E: | | | | |
Class A2B, 3.7275% 11/25/29 (f) | | 8,523,921 | | 8,502,874 |
Class A2D, 3.9175% 11/25/29 (f) | | 1,982,307 | | 1,991,830 |
Series 2004-G Class A2, 3.95% 11/25/29 (f) | | 3,854,828 | | 3,854,422 |
Series 2005-A Class A2, 3.38% 2/25/30 (f) | | 10,800,867 | | 10,785,319 |
Mortgage Asset Backed Securities Trust floater Series 2002-NC1 Class M1, 4.31% 10/25/32 (f) | | 4,538,551 | | 4,555,535 |
MortgageIT Trust floater: | | | | |
Series 2004-2: | | | | |
Class A1, 3.83% 12/25/34 (f) | | 4,920,628 | | 4,927,758 |
Class A2, 3.91% 12/25/34 (f) | | 6,656,800 | | 6,696,298 |
Series 2005-2 Class 1A1, 3.72% 5/25/35 (f) | | 5,093,718 | | 5,097,498 |
Opteum Mortgage Acceptance Corp. floater Series 2005-3 Class APT, 3.75% 6/25/35 (f) | | 19,112,336 | | 19,123,533 |
Collateralized Mortgage Obligations - continued |
| Principal Amount | | Value |
Private Sponsor - continued |
Permanent Financing No. 1 PLC floater Series 1 Class 2C, 4.5594% 6/10/42 (f) | | $ 1,745,000 | | $ 1,749,384 |
Permanent Financing No. 3 PLC floater Series 2 Class C, 4.4294% 6/10/42 (f) | | 4,845,000 | | 4,893,450 |
Permanent Financing No. 4 PLC floater Series 2 Class C, 4.0994% 6/10/42 (f) | | 15,400,000 | | 15,475,306 |
Permanent Financing No. 5 PLC floater: | | | | |
Series 2 Class C, 4.0294% 6/10/42 (f) | | 4,215,000 | | 4,234,760 |
Series 3 Class C, 4.1994% 6/10/42 (f) | | 8,890,000 | | 8,967,788 |
Permanent Financing No. 6 PLC floater Series 6: | | | | |
Class 1C, 3.7294% 6/10/42 (f) | | 4,000,000 | | 4,000,572 |
Class 2C, 3.8294% 6/10/42 (f) | | 5,350,000 | | 5,352,343 |
Permanent Financing No. 7 PLC floater Series 7: | | | | |
Class 1B, 3.4694% 6/10/42 (f) | | 2,000,000 | | 1,999,375 |
Class 1C, 3.6594% 6/10/42 (f) | | 3,840,000 | | 3,838,800 |
Class 2C, 3.7094% 6/10/42 (f) | | 8,065,000 | | 8,054,919 |
Permanent Financing No. 8 PLC floater Series 8: | | | | |
Class 1C, 3.7475% 6/10/42 (f) | | 7,165,000 | | 7,162,621 |
Class 2C, 3.8175% 6/10/42 (f) | | 9,945,000 | | 9,941,688 |
Residential Asset Mortgage Products, Inc. sequential pay Series 2003-SL1 Class A31, 7.125% 4/25/31 | | 4,643,507 | | 4,727,342 |
Residential Finance LP/Residential Finance Development Corp. floater Series 2003-A: | | | | |
Class B4, 5.15% 3/10/35 (c)(f) | | 5,492,986 | | 5,575,381 |
Class B5, 5.7% 3/10/35 (c)(f) | | 5,684,725 | | 5,811,417 |
Residential Funding Securities Corp.: | | | | |
Series 2003-RP1 Class A1, 3.96% 11/25/34 (f) | | 2,829,110 | | 2,840,739 |
Series 2003-RP2 Class A1, 3.93% 6/25/33 (c)(f) | | 3,866,185 | | 3,881,108 |
Sequoia Mortgage Trust floater: | | | | |
Series 2003-5 Class A2, 3.41% 9/20/33 (f) | | 10,999,101 | | 10,996,236 |
Series 2003-7 Class A2, 2.885% 1/20/34 (f) | | 9,577,708 | | 9,569,385 |
Series 2004-1 Class A, 4.15% 2/20/34 (f) | | 6,379,791 | | 6,373,993 |
Series 2004-10 Class A4, 3.6681% 11/20/34 (f) | | 10,424,803 | | 10,408,138 |
Series 2004-3 Class A, 3.5463% 5/20/34 (f) | | 10,662,486 | | 10,588,333 |
Series 2004-4 Class A, 3.5881% 5/20/34 (f) | | 13,430,919 | | 13,399,990 |
Series 2004-5 Class A3, 3.77% 6/20/34 (f) | | 8,904,038 | | 8,897,082 |
Series 2004-6: | | | | |
Class A3A, 4.1475% 6/20/35 (f) | | 8,182,127 | | 8,176,739 |
Class A3B, 3.16% 7/20/34 (f) | | 1,022,766 | | 1,021,950 |
Series 2004-7: | | | | |
Class A3A, 3.2275% 8/20/34 (f) | | 7,642,675 | | 7,636,475 |
Class A3B, 3.4525% 7/20/34 (f) | | 1,375,260 | | 1,380,167 |
Collateralized Mortgage Obligations - continued |
| Principal Amount | | Value |
Private Sponsor - continued |
Sequoia Mortgage Trust floater: - continued | | | | |
Series 2004-8 Class A2, 3.45% 9/20/34 (f) | | $ 14,155,710 | | $ 14,148,404 |
Series 2005-1 Class A2, 3.68% 2/20/35 (f) | | 7,355,282 | | 7,354,362 |
Series 2005-2 Class A2, 3.36% 3/20/35 (f) | | 13,876,523 | | 13,876,523 |
Series 2005-3 Class A1, 3.46% 5/20/35 (f) | | 9,217,677 | | 9,217,677 |
Structured Adjustable Rate Mortgage Loan Trust floater Series 2001-14 Class A1, 3.77% 7/25/35 (f) | | 11,201,095 | | 11,201,095 |
Structured Asset Securities Corp. floater Series 2004-NP1 Class A, 3.86% 9/25/33 (c)(f) | | 2,553,470 | | 2,555,084 |
Thornburg Mortgage Securities Trust floater Series 2004-3 Class A, 3.83% 9/25/34 (f) | | 22,068,069 | | 22,129,394 |
WAMU Mortgage pass thru certificates: | | | | |
floater Series 2005-AR6 Class 2A-1A, 3.5448% 4/25/45 (f) | | 6,133,307 | | 6,133,607 |
Series 2005 AR11 Class A1C1, 3.6675% 8/25/40 (d)(f) | | 14,400,000 | | 14,400,000 |
Wells Fargo Mortgage Backed Securities Trust: | | | | |
Series 2004-M Class A3, 4.7024% 8/25/34 (f) | | 19,880,000 | | 19,789,156 |
Series 2005-AR12 Class 2A1, 4.322% 7/25/35 (f) | | 31,674,772 | | 31,407,532 |
TOTAL PRIVATE SPONSOR | | 895,419,920 |
U.S. Government Agency - 3.2% |
Fannie Mae: | | | | |
floater: | | | | |
Series 2000-38 Class F, 3.76% 11/18/30 (f) | | 1,103,802 | | 1,112,055 |
Series 2000-40 Class FA, 3.8144% 7/25/30 (f) | | 2,487,156 | | 2,498,099 |
Series 2002-89 Class F, 3.6144% 1/25/33 (f) | | 3,630,895 | | 3,636,484 |
target amortization class Series G94-2 Class D, 6.45% 1/25/24 | | 4,732,822 | | 4,849,182 |
Fannie Mae guaranteed REMIC pass thru certificates: | | | | |
floater: | | | | |
Series 2001-34 Class FR, 3.66% 8/18/31 (f) | | 2,500,934 | | 2,508,899 |
Series 2001-44 Class FB, 3.6144% 9/25/31 (f) | | 2,262,040 | | 2,268,738 |
Series 2001-46 Class F, 3.66% 9/18/31 (f) | | 6,514,676 | | 6,552,090 |
Series 2002-11 Class QF, 3.8144% 3/25/32 (f) | | 4,517,951 | | 4,551,812 |
Series 2002-36 Class FT, 3.8144% 6/25/32 (f) | | 1,503,724 | | 1,516,521 |
Series 2002-64 Class FE, 3.61% 10/18/32 (f) | | 2,256,514 | | 2,266,981 |
Series 2002-65 Class FA, 3.6144% 10/25/17 (f) | | 2,585,370 | | 2,590,545 |
Series 2002-74 Class FV, 3.7644% 11/25/32 (f) | | 8,360,131 | | 8,420,920 |
Series 2003-11: | | | | |
Class DF, 3.7644% 2/25/33 (f) | | 3,173,455 | | 3,195,574 |
Class EF, 3.7644% 2/25/33 (f) | | 2,602,157 | | 2,612,658 |
Collateralized Mortgage Obligations - continued |
| Principal Amount | | Value |
U.S. Government Agency - continued |
Fannie Mae guaranteed REMIC pass thru certificates: - continued | | | | |
floater: | | | | |
Series 2003-63 Class F1, 3.6144% 11/25/27 (f) | | $ 6,387,368 | | $ 6,390,916 |
planned amortization class: | | | | |
Series 1998-63 Class PG, 6% 3/25/27 | | 1,212,661 | | 1,212,198 |
Series 2001-62 Class PG, 6.5% 10/25/30 | | 4,183,652 | | 4,194,964 |
Series 2001-76 Class UB, 5.5% 10/25/13 | | 1,378,221 | | 1,379,002 |
Series 2002-16 Class QD, 5.5% 6/25/14 | | 345,479 | | 346,552 |
Series 2002-28 Class PJ, 6.5% 3/25/31 | | 4,950,777 | | 4,957,813 |
Series 2002-8 Class PD, 6.5% 7/25/30 | | 3,569,878 | | 3,584,870 |
Freddie Mac: | | | | |
floater Series 2510 Class FE, 3.7881% 10/15/32 (f) | | 5,998,150 | | 6,032,418 |
planned amortization class: | | | | |
Series 2091 Class PP, 6% 2/15/27 | | 1,286,641 | | 1,286,029 |
Series 2353 Class PC, 6.5% 9/15/15 | | 1,363,169 | | 1,366,992 |
Freddie Mac Manufactured Housing participation certificates guaranteed floater Series 2338 Class FJ, 3.5881% 7/15/31 (f) | | 5,197,631 | | 5,199,968 |
Freddie Mac Multi-class participation certificates guaranteed: | | | | |
floater: | | | | |
Series 2474 Class FJ, 3.7381% 7/15/17 (f) | | 4,556,922 | | 4,564,198 |
Series 2526 Class FC, 3.7881% 11/15/32 (f) | | 3,597,778 | | 3,616,182 |
Series 2538 Class FB, 3.7881% 12/15/32 (f) | | 6,607,741 | | 6,651,155 |
Series 2551 Class FH, 3.8381% 1/15/33 (f) | | 3,358,821 | | 3,373,027 |
planned amortization class: | | | | |
Series 2136 Class PE, 6% 1/15/28 | | 12,190,349 | | 12,248,248 |
Series 2394 Class ND, 6% 6/15/27 | | 1,550,172 | | 1,553,415 |
Series 2395 Class PE, 6% 2/15/30 | | 5,961,413 | | 6,000,327 |
Series 2398 Class DK, 6.5% 1/15/31 | | 372,760 | | 373,347 |
Series 2410 Class ML, 6.5% 12/15/30 | | 2,168,673 | | 2,179,211 |
Series 2420 Class BE, 6.5% 12/15/30 | | 2,595,889 | | 2,604,122 |
Series 2443 Class TD, 6.5% 10/15/30 | | 2,962,497 | | 2,977,827 |
Series 2461 Class PG, 6.5% 1/15/31 | | 2,737,118 | | 2,773,721 |
Series 2466 Class EC, 6% 10/15/27 | | 257,483 | | 257,163 |
Series 2483 Class DC, 5.5% 7/15/14 | | 1,861,588 | | 1,861,466 |
Series 2556 Class PM, 5.5% 2/15/16 | | 1,160,963 | | 1,159,984 |
Series 2776 Class UJ, 4.5% 5/15/20 (g) | | 7,104,375 | | 367,384 |
Series 2828 Class JA, 4.5% 1/15/10 | | 11,880,000 | | 11,903,044 |
sequential pay: | | | | |
Series 2430 Class ZE, 6.5% 8/15/27 | | 648,803 | | 649,120 |
Series 2480 Class QW, 5.75% 2/15/30 | | 871,905 | | 871,370 |
Collateralized Mortgage Obligations - continued |
| Principal Amount | | Value |
U.S. Government Agency - continued |
Freddie Mac Multi-class participation certificates guaranteed: - continued | | | | |
Series 2406: | | | | |
Class FP, 4.3681% 1/15/32 (f) | | $ 10,270,000 | | $ 10,502,819 |
Class PF, 4.3681% 12/15/31 (f) | | 8,125,000 | | 8,337,955 |
Series 2410 Class PF, 4.3681% 2/15/32 (f) | | 18,644,444 | | 19,070,154 |
Ginnie Mae guaranteed REMIC pass thru securities floater: | | | | |
Series 2001-46 Class FB, 3.7381% 5/16/23 (f) | | 2,988,811 | | 3,001,292 |
Series 2001-50 Class FV, 3.5881% 9/16/27 (f) | | 9,114,548 | | 9,113,939 |
Series 2002-24 Class FX, 3.9381% 4/16/32 (f) | | 2,630,687 | | 2,652,779 |
Series 2002-31 Class FW, 3.7881% 6/16/31 (f) | | 3,614,097 | | 3,633,687 |
Series 2002-5 Class KF, 3.7881% 8/16/26 (f) | | 617,815 | | 618,278 |
TOTAL U.S. GOVERNMENT AGENCY | | 207,447,494 |
TOTAL COLLATERALIZED MORTGAGE OBLIGATIONS (Cost $1,104,119,465) | 1,102,867,414 |
Commercial Mortgage Securities - 5.8% |
|
1301 Avenue of The Americas Trust Series 2000-1301: | | | | |
Class C, 7.44% 8/3/10 (c)(f) | | 5,025,000 | | 5,024,881 |
Class D, 7.54% 8/3/10 (c)(f) | | 6,695,000 | | 6,694,844 |
Banc of America Large Loan, Inc. floater: | | | | |
Series 2003-BBA2 Class A3, 3.7081% 11/15/15 (c)(f) | | 5,038,226 | | 5,041,400 |
Series 2005-BOCA: | | | | |
Class H, 4.3381% 12/15/16 (c)(f) | | 2,065,000 | | 2,061,834 |
Class J, 4.4881% 12/15/16 (c)(f) | | 1,020,000 | | 1,018,438 |
Class K, 4.7381% 12/15/16 (c)(f) | | 6,659,000 | | 6,650,611 |
Bayview Commercial Asset Trust floater: | | | | |
Series 2003-1 Class A, 4.04% 8/25/33 (c)(f) | | 6,644,316 | | 6,723,250 |
Series 2003-2: | | | | |
Class A, 4.04% 12/25/33 (c)(f) | | 13,522,369 | | 13,687,661 |
Class M1, 4.31% 12/25/33 (c)(f) | | 2,200,548 | | 2,236,841 |
Series 2004-1: | | | | |
Class A, 3.82% 4/25/34 (c)(f) | | 6,403,472 | | 6,414,728 |
Class B, 5.36% 4/25/34 (c)(f) | | 665,296 | | 672,910 |
Class M1, 4.02% 4/25/34 (c)(f) | | 582,134 | | 584,681 |
Class M2, 4.66% 4/25/34 (c)(f) | | 498,972 | | 504,819 |
Commercial Mortgage Securities - continued |
| Principal Amount | | Value |
Bayview Commercial Asset Trust floater: - continued | | | | |
Series 2004-2: | | | | |
Class A, 3.89% 8/25/34 (c)(f) | | $ 6,299,807 | | $ 6,330,814 |
Class M1, 4.04% 8/25/34 (c)(f) | | 2,031,330 | | 2,039,265 |
Series 2004-3: | | | | |
Class A1, 3.83% 1/25/35 (c)(f) | | 6,582,479 | | 6,605,519 |
Class A2, 3.88% 1/25/35 (c)(f) | | 914,869 | | 918,092 |
Class M1, 3.96% 1/25/35 (c)(f) | | 1,097,080 | | 1,098,564 |
Class M2, 4.46% 1/25/35 (c)(f) | | 715,487 | | 719,742 |
Series 2005-2A: | | | | |
Class M1, 3.73% 8/25/35 (c)(f) | | 1,297,812 | | 1,297,812 |
Class M2, 3.78% 8/25/35 (c)(f) | | 2,136,399 | | 2,136,399 |
Class M3, 3.8% 8/25/35 (c)(f) | | 1,183,006 | | 1,183,006 |
Class M4, 3.91% 8/25/35 (c)(f) | | 1,088,166 | | 1,088,166 |
Bear Stearns Commercial Mortgage Securities, Inc. floater: | | | | |
Series 2003-BA1A: | | | | |
Class JFCM, 4.98% 4/14/15 (c)(f) | | 1,344,296 | | 1,350,087 |
Class JMM, 4.88% 4/14/15 (c)(f) | | 1,384,053 | | 1,385,065 |
Class KFCM, 5.23% 4/14/15 (c)(f) | | 1,436,661 | | 1,443,179 |
Class KMM, 5.13% 4/14/15 (c)(f) | | 1,253,767 | | 1,254,776 |
Class LFCM, 5.63% 4/14/15 (c)(f) | | 1,601,905 | | 1,602,545 |
Class MFCM, 5.93% 4/14/15 (c)(f) | | 2,218,251 | | 2,219,234 |
Series 2004-BBA3 Class E, 4.0881% 6/15/17 (c)(f) | | 10,415,000 | | 10,415,949 |
Chase Commercial Mortgage Securities Corp. floater Series 2000-FL1A: | | | | |
Class B, 3.81% 12/12/13 (c)(f) | | 896,672 | | 897,536 |
Class C, 4.16% 12/12/13 (c)(f) | | 1,793,345 | | 1,801,374 |
COMM floater: | | | | |
Series 2001-FL5A Class E, 4.8881% 11/15/13 (c)(f) | | 3,049,546 | | 3,048,573 |
Series 2002-FL6: | | | | |
Class F, 4.8381% 6/14/14 (c)(f) | | 11,163,000 | | 11,190,451 |
Class G, 5.2881% 6/14/14 (c)(f) | | 5,000,000 | | 5,000,444 |
Series 2003-FL9 Class B, 3.8881% 11/15/15 (c)(f) | | 10,354,700 | | 10,383,149 |
Commercial Mortgage pass thru certificates floater: | | | | |
Series 2004-CNL: | | | | |
Class A2, 3.6881% 9/15/14 (c)(f) | | 3,570,000 | | 3,573,440 |
Class G, 4.3681% 9/15/14 (c)(f) | | 1,345,000 | | 1,345,538 |
Class H, 4.4681% 9/15/14 (c)(f) | | 1,430,000 | | 1,430,571 |
Class J, 4.9881% 9/15/14 (c)(f) | | 490,000 | | 491,560 |
Class K, 5.3881% 9/15/14 (c)(f) | | 770,000 | | 771,587 |
Class L, 5.5881% 9/15/14 (c)(f) | | 625,000 | | 624,693 |
Commercial Mortgage Securities - continued |
| Principal Amount | | Value |
Commercial Mortgage pass thru certificates floater: - continued | | | | |
Series 2004-HTL1: | | | | |
Class B, 3.8381% 7/15/16 (c)(f) | | $ 495,379 | | $ 495,732 |
Class D, 3.9381% 7/15/16 (c)(f) | | 1,125,628 | | 1,125,788 |
Class E, 4.1381% 7/15/16 (c)(f) | | 805,726 | | 806,031 |
Class F, 4.1881% 7/15/16 (c)(f) | | 852,671 | | 853,207 |
Class H, 4.6881% 7/15/16 (c)(f) | | 2,472,312 | | 2,473,143 |
Class J, 4.8381% 7/15/16 (c)(f) | | 950,314 | | 950,633 |
Class K, 5.7381% 7/15/16 (c)(f) | | 1,069,720 | | 1,069,257 |
Commercial Mortgage Pass-Through Certificates floater Series 2005-F10A: | | | | |
Class B, 3.6181% 4/15/17 (c)(f) | | 7,080,000 | | 7,080,000 |
Class C, 3.6581% 4/15/17 (c)(f) | | 3,006,000 | | 3,006,000 |
Class D, 3.6981% 4/15/17 (c)(f) | | 2,440,000 | | 2,440,000 |
Class E, 3.7581% 4/15/17 (c)(f) | | 1,821,000 | | 1,821,000 |
Class F, 3.7981% 4/15/17 (c)(f) | | 1,035,000 | | 1,035,000 |
Class G, 3.9381% 4/15/17 (c)(f) | | 1,035,000 | | 1,035,000 |
Class H, 4.0081% 4/15/17 (c)(f) | | 1,035,000 | | 1,035,000 |
Class I, 4.2381% 4/15/17 (c)(f) | | 335,000 | | 335,000 |
Class MOA3, 3.6881% 3/15/20 (c)(f) | | 4,590,000 | | 4,590,000 |
CS First Boston Mortgage Securities Corp.: | | | | |
floater: | | | | |
Series 2001-TFLA Class G, 5.1381% 12/15/11 (c)(f) | | 3,720,000 | | 3,702,795 |
Series 2002-TFLA Class C, 3.9688% 11/18/12 (c)(f) | | 3,675,000 | | 3,674,923 |
Series 2003-TF2A Class A2, 3.7081% 11/15/14 (c)(f) | | 9,500,000 | | 9,507,100 |
Series 2004-FL1 Class B, 3.8381% 5/15/14 (c)(f) | | 11,230,000 | | 11,235,571 |
Series 2004-HC1: | | | | |
Class A2, 3.8881% 12/15/21 (c)(f) | | 1,475,000 | | 1,474,997 |
Class B, 4.1381% 12/15/21 (c)(f) | | 3,835,000 | | 3,834,992 |
Series 2004-TF2A Class E, 3.8081% 11/15/19 (c)(f) | | 4,450,000 | | 4,456,884 |
Series 2004-TFL1: | | | | |
Class A2, 3.5781% 2/15/14 (c)(f) | | 7,005,000 | | 7,007,087 |
Class E, 3.9381% 2/15/14 (c)(f) | | 2,800,000 | | 2,806,033 |
Class F, 3.9881% 2/15/14 (c)(f) | | 2,325,000 | | 2,330,394 |
Class G, 4.2381% 2/15/14 (c)(f) | | 1,875,000 | | 1,880,617 |
Class H, 4.4881% 2/15/14 (c)(f) | | 1,400,000 | | 1,403,733 |
Class J, 4.7881% 2/15/14 (c)(f) | | 750,000 | | 753,724 |
Commercial Mortgage Securities - continued |
| Principal Amount | | Value |
CS First Boston Mortgage Securities Corp.: - continued | | | | |
Series 2005-TF2A Class F, 3.8881% 11/15/19 (c)(f) | | $ 1,540,000 | | $ 1,542,381 |
Series 2005-TFLA: | | | | |
Class C, 3.6281% 2/15/20 (c)(f) | | 5,650,000 | | 5,649,989 |
Class E, 3.7181% 2/15/20 (c)(f) | | 3,955,000 | | 3,954,992 |
Class F, 3.7681% 2/15/20 (c)(f) | | 1,745,000 | | 1,744,997 |
Class G, 3.9081% 2/15/20 (c)(f) | | 505,000 | | 504,998 |
Class H, 4.1381% 2/15/20 (c)(f) | | 715,000 | | 714,998 |
sequential pay Series 1997-C2 Class A2, 6.52% 1/17/35 | | 518,675 | | 522,823 |
Series 2003-TFLA Class G, 3.7357% 4/15/13 (c)(f) | | 446,933 | | 445,553 |
GMAC Commercial Mortgage Securities, Inc. floater Series 2001-FL1A Class E, 4.2% 2/11/11 (c)(f) | | 264,524 | | 264,175 |
GS Mortgage Securities Corp. II floater Series 2005-FL7A Class A1, 3.5% 11/6/19 (c)(f) | | 10,526,054 | | 10,527,180 |
ISTAR Asset Receivables Trust floater Series 2002-1A Class A2, 3.8613% 5/28/20 (c)(f) | | 2,727,545 | | 2,728,117 |
John Hancock Tower Mortgage Trust floater Series 2003-C5A Class B, 5.6585% 4/10/15 (c)(f) | | 8,245,000 | | 8,150,339 |
JP Morgan Chase Commercial Mortgage Security Corp.: | | | | |
floater Series 2005-FL1A: | | | | |
Class WH, 3.97% 6/15/19 (c)(f) | | 3,325,000 | | 3,325,100 |
Class WJ, 4.17% 6/15/19 (c)(f) | | 2,045,000 | | 2,045,061 |
Class WK, 4.57% 6/15/19 (c)(f) | | 3,065,000 | | 3,065,092 |
Series 2005-FL1A Class WX1, 1.2068% 6/15/19 (c)(f)(g) | | 240,000,000 | | 2,596,800 |
Lehman Brothers Floating Rate Commercial Mortgage Trust: | | | | |
floater: | | | | |
Series 2003-C4A: | | | | |
Class F, 5.6% 7/11/15 (c)(f) | | 813,387 | | 813,822 |
Class H, 6.35% 7/11/15 (c)(f) | | 8,267,264 | | 8,287,932 |
Series 2003-LLFA: | | | | |
Class A2, 3.77% 12/16/14 (c)(f) | | 11,700,000 | | 11,707,744 |
Class B, 3.98% 12/16/14 (c)(f) | | 4,615,000 | | 4,626,299 |
Class C, 4.08% 12/16/14 (c)(f) | | 4,982,000 | | 4,997,311 |
Series 2005-LLFA Class FAIR, 5.1138% 7/15/19 (c)(d)(f) | | 4,360,000 | | 4,360,000 |
Morgan Stanley Dean Witter Capital I Trust floater Series 2002-XLF Class F, 5.49% 8/5/14 (c)(f) | | 7,603,983 | | 7,603,972 |
Commercial Mortgage Securities - continued |
| Principal Amount | | Value |
Salomon Brothers Mortgage Securities VII, Inc.: | | | | |
floater: | | | | |
Series 2001-CDCA: | | | | |
Class C, 4.1881% 2/15/13 (c)(f) | | $ 10,495,000 | | $ 10,291,568 |
Class D, 4.1881% 2/15/13 (c)(f) | | 4,000,000 | | 3,891,288 |
Series 2003-CDCA: | | | | |
Class HEXB, 5.2881% 2/15/15 (c)(f) | | 770,000 | | 771,001 |
Class JEXB, 5.4881% 2/15/15 (c)(f) | | 1,300,000 | | 1,301,690 |
Class KEXB, 5.8881% 2/15/15 (c)(f) | | 960,000 | | 961,248 |
Series 2000-NL1 Class E, 7.0607% 10/15/30 (c)(f) | | 3,657,956 | | 3,672,236 |
SDG Macerich Properties LP floater Series 2000-1 Class A3, 3.7281% 5/15/09 (c)(f) | | 18,000,000 | | 18,008,086 |
STRIPS III Ltd./STRIPS III Corp. floater Series 2004-1A Class A, 3.78% 3/24/18 (c)(f) | | 7,263,029 | | 7,263,029 |
Wachovia Bank Commercial Mortgage Trust floater: | | | | |
Series 2004-WHL3: | | | | |
Class A2, 3.5681% 3/15/14 (c)(f) | | 3,510,000 | | 3,511,290 |
Class E, 3.8881% 3/15/14 (c)(f) | | 2,190,000 | | 2,192,749 |
Class F, 3.9381% 3/15/14 (c)(f) | | 1,755,000 | | 1,757,120 |
Class G, 4% 3/15/14 (c)(f) | | 875,000 | | 876,363 |
Series 2005-WL5A: | | | | |
Class KHP1, 3.7381% 1/15/18 (c)(f) | | 1,745,000 | | 1,745,000 |
Class KHP2, 3.9381% 1/15/18 (c)(f) | | 1,745,000 | | 1,745,000 |
Class KHP3, 4.2381% 1/15/18 (c)(f) | | 2,060,000 | | 2,060,000 |
Class KHP4, 4.3381% 1/15/18 (c)(f) | | 1,600,000 | | 1,600,000 |
Class KHP5, 4.5381% 1/15/18 (c)(f) | | 1,855,000 | | 1,855,000 |
TOTAL COMMERCIAL MORTGAGE SECURITIES (Cost $378,363,353) | 378,866,012 |
Interfund Loans - 0.1% |
| | | |
With Fidelity Equity-Income Fund, at 3.43442% due 8/1/05 (b) (Cost $8,443,000) | | 8,443,000 | | 8,443,000 |
Cash Equivalents - 40.4% |
| | Maturity
Amount | | Value |
Investments in repurchase agreements (Collateralized by U.S. Government Obligations, in a joint trading account at 3.32%, dated 7/29/05 due 8/1/05) (i) | | $ 2,354,814,398 | | $ 2,354,164,000 |
With Goldman Sachs & Co. at 3.41%, dated 7/1/05 due 8/23/05 (Collateralized by Mortgage Loan Obligations valued at $295,800,001, 0.9%- 10.36%, 4/18/17 - 6/25/44) (f)(h) | | 291,455,881 | | 289,998,492 |
TOTAL CASH EQUIVALENTS (Cost $2,644,164,000) | | 2,644,162,492 |
TOTAL INVESTMENT PORTFOLIO - 102.2% (Cost $6,679,436,405) | | | 6,685,115,608 |
NET OTHER ASSETS - (2.2)% | | | (140,968,200) |
NET ASSETS - 100% | | $ 6,544,147,408 |
Futures Contracts |
| Expiration Date | | Underlying Face Amount at Value | | Unrealized Appreciation/
(Depreciation) |
Sold |
Eurodollar Contracts |
73 Eurodollar 90 Day Index Contracts | Dec. 2005 | | $ 72,221,638 | | $ 34,806 |
49 Eurodollar 90 Day Index Contracts | March 2006 | | 48,464,675 | | 28,036 |
32 Eurodollar 90 Day Index Contracts | June 2006 | | 31,645,600 | | 16,247 |
27 Eurodollar 90 Day Index Contracts | Sept. 2006 | | 26,698,612 | | 16,355 |
26 Eurodollar 90 Day Index Contracts | Dec. 2006 | | 25,707,500 | | 14,421 |
24 Eurodollar 90 Day Index Contracts | March 2007 | | 23,729,700 | | 12,329 |
17 Eurodollar 90 Day Index Contracts | June 2007 | | 16,807,688 | | 5,970 |
16 Eurodollar 90 Day Index Contracts | Sept. 2007 | | 15,818,200 | | 5,711 |
15 Eurodollar 90 Day Index Contracts | Dec. 2007 | | 14,828,250 | | 5,590 |
15 Eurodollar 90 Day Index Contracts | March 2008 | | 14,827,875 | | 5,015 |
8 Eurodollar 90 Day Index Contracts | June 2008 | | 7,907,800 | | 7,518 |
7 Eurodollar 90 Day Index Contracts | Sept. 2008 | | 6,918,888 | | 6,885 |
TOTAL EURODOLLAR CONTRACTS | | 158,883 |
Swap Agreements |
| | | Notional Amount | | Value |
Credit Default Swap |
Receive from Citibank, upon default event of DaimlerChrysler NA Holding Corp., par value of the notional amount of DaimlerChrysler NA Holding Corp. 6.5% 11/15/13, and pay quarterly notional amount multiplied by .8% | June 2007 | | $ 14,000,000 | | $ (135,972) |
Receive quarterly notional amount multiplied by 1.12% and pay Morgan Stanley, Inc. upon default of Comcast Cable Communications, Inc., par value of the notional amount of Comcast Cable Communications, Inc. 6.75% 1/30/11 | June 2006 | | 10,000,000 | | 102,057 |
TOTAL CREDIT DEFAULT SWAP | 24,000,000 | | (33,915) |
Swap Agreements - continued |
| Expiration Date | | Notional Amount | | Value |
Total Return Swap |
Receive monthly notional amount multiplied by the nominal spread appreciation of the Lehman Brothers CMBS U.S. Aggregate Index adjusted by a modified duration factor plus 10 basis points and pay monthly notional amount multiplied by the nominal spread depreciation of the Lehman Brothers CMBS U.S. Aggregate Index adjusted by a modified duration factor with Lehman Brothers, Inc. | Oct. 2005 | | $ 48,200,000 | | $ 46,335 |
Receive monthly notional amount multiplied by the nominal spread appreciation of the Lehman Brothers CMBS U.S. Aggregate Index adjusted by a modified duration factor plus 25 basis points and pay monthly notional amount multiplied by the nominal spread depreciation of the Lehman Brothers CMBS U.S. Aggregate Index adjusted by a modified duration factor with Lehman Brothers, Inc. | Dec. 2005 | | 30,000,000 | | 32,511 |
Receive monthly notional amount multiplied by the nominal spread appreciation of the Lehman Brothers CMBS U.S. Aggregate Index adjusted by a modified duration factor plus 30 basis points and pay monthly notional amount multiplied by the nominal spread depreciation of the Lehman Brothers CMBS U.S. Aggregate Index adjusted by a modified duration factor with Lehman Brothers, Inc. | August 2005 | | 35,100,000 | | 33,945 |
Swap Agreements - continued |
| Expiration Date | | Notional Amount | | Value |
Receive monthly notional amount multiplied by the nominal spread appreciation of the Lehman Brothers CMBS U.S. Aggregate Index adjusted by a modified duration factor plus 22 basis points and pay monthly notional amount multiplied by the nominal spread depreciation of the Lehman Brothers CMBS U.S. Aggregate Index adjusted by a modified duration factor with Lehman Brothers, Inc. | Jan. 2006 | | $ 35,100,000 | | $ 32,229 |
Receive monthly a return equal to Lehman Brothers ABS Floating Rate Index and pay monthly a floating rate based on the 1- month LIBOR minus 11.1 basis points with Lehman Brothers, Inc. | Nov. 2005 | | 30,000,000 | | 0 |
TOTAL TOTAL RETURN SWAP | 178,400,000 | | 145,020 |
| | $ 202,400,000 | | $ 111,105 |
Legend |
(a) Debt obligation initially issued at one coupon which converts to a higher coupon at a specified date. The rate shown is the rate at period end. |
(b) Affiliated entity |
(c) Security exempt from registration under Rule 144A of the Securities Act of 1933. These securities may be resold in transactions exempt from registration, normally to qualified institutional buyers. At the period end, the value of these securities amounted to $586,119,417 or 9.0% of net assets. |
(d) Security or a portion of the security purchased on a delayed delivery or when-issued basis. |
(e) Security or a portion of the security was pledged to cover margin requirements for futures contracts. At the period end, the value of securities pledged amounted to $994,635. |
(f) The coupon rate shown on floating or adjustable rate securities represents the rate at period end. |
(g) Security represents right to receive monthly interest payments on an underlying pool of mortgages. Principal shown is the par amount of the mortgage pool. |
(h) The maturity amount is based on the rate at period end. |
(i) Additional information on each counterparty to the repurchase agreement is as follows: |
Repurchase Agreement/
Counterparty | Value |
$2,354,164,000 due 8/1/05 at 3.32% | |
Banc of America Securities LLC. | $ 471,596,247 |
Bank of America, National Association | 244,985,063 |
Barclays Capital Inc. | 979,940,254 |
Countrywide Securities Corporation | 244,985,063 |
Morgan Stanley & Co. Incorporated. | 351,411,107 |
UBS Securities LLC | 61,246,266 |
| $ 2,354,164,000 |
Income Tax Information |
At July 31, 2005, the aggregate cost of investment securities for income tax purposes was $6,679,021,266. Net unrealized appreciation aggregated $6,094,342, of which $11,067,257 related to appreciated investment securities and $4,972,915 related to depreciated investment securities. |
Annual Report
Annual Report
Investment Adviser
Fidelity Management & Research Company
Boston, MA
Investment Sub-Advisers
Fidelity Investments
Money Management, Inc.
Fidelity International Investment Advisors
Fidelity International Investment Advisors
(U.K.) Limited
General Distributor
Fidelity Distributors Corporation
Boston, MA
Transfer and Service Agent
Fidelity Investments Institutional
Operations Company, Inc.
Boston, MA
Custodian
Citibank, N.A.
New York, NY
AUSB-UANN-0905
1.804587.101
(Fidelity Investment logo)(registered trademark)
Corporate Headquarters
82 Devonshire St., Boston, MA 02109
www.fidelity.com
(Fidelity Investment logo)(registered trademark)
Fidelity Advisor
Ultra-Short Bond
Fund - Institutional Class
Annual Report
July 31, 2005
Institutional Class
is a class of
Fidelity® Ultra-Short Bond Fund
(2_fidelity_logos) (Registered_Trademark)
Contents
Chairman's Message | <Click Here> | Ned Johnson's message to shareholders. |
Performance | <Click Here> | How the fund has done over time. |
Management's Discussion | <Click Here> | The manager's review of fund performance, strategy and outlook. |
Shareholder Expense Example | <Click Here> | An example of shareholder expenses. |
Investment Changes | <Click Here> | A summary of major shifts in the fund's investments over the past six months. |
Investments | <Click Here> | A complete list of the fund's investments with their market values. |
Financial Statements | <Click Here> | Statements of assets and liabilities, operations, and changes in net assets,
as well as financial highlights. |
Notes | <Click Here> | Notes to the financial statements. |
Report of Independent Registered Public Accounting Firm | <Click Here> | |
Trustees and Officers | <Click Here> | |
Distributions | <Click Here> | |
Board Approval of Investment Advisory Contracts and Management Fees | <Click Here> | |
Central Fund Investments | <Click Here> | Complete list of investments for Fidelity's fixed-income central funds. |
To view a fund's proxy voting guidelines and proxy voting record for the 12-month period ended June 30, visit www.fidelity.com/proxyvotingresults or visit the Securities and Exchange Commission's (SEC) web site at www.sec.gov. You may also call 1-877-208-0098 to request a free copy of the proxy voting guidelines.
Standard & Poor's, S&P and S&P 500 are registered service marks of The McGraw-Hill Companies, Inc. and have been licensed for use by Fidelity Distributors Corporation.
Other third party marks appearing herein are the property of their respective owners.
All other marks appearing herein are registered or unregistered trademarks or service marks of FMR Corp. or an affiliated company.
Annual Report
This report and the financial statements contained herein are submitted for the general information of the shareholders of the fund. This report is not authorized for distribution to prospective investors in the fund unless preceded or accompanied by an effective prospectus.
A fund files its complete schedule of portfolio holdings with the SEC for the first and third quarters of each fiscal year on Form N-Q. Forms N-Q are available on the SEC's website at http://www.sec.gov. A fund's Forms N-Q may be reviewed and copied at the SEC's Public Reference Room in Washington, DC. Information regarding the operation of the SEC's Public Reference Room may be obtained by calling 1-800-SEC-0330. For a complete list of a fund's portfolio holdings, view the most recent quarterly holdings report, semiannual report, or annual report on Fidelity's web site at http://www.advisor.fidelity.com.
NOT FDIC INSURED · MAY LOSE VALUE · NO BANK GUARANTEE
Neither the fund nor Fidelity Distributors Corporation is a bank.
Annual Report
Chairman's Message
(photo_of_Edward_C_Johnson_3d)
Dear Shareholder:
During the past year or so, much has been reported about the mutual fund industry, and much of it has been more critical than I believe is warranted. Allegations that some companies have been less than forthright with their shareholders have cast a shadow on the entire industry. I continue to find these reports disturbing, and assert that they do not create an accurate picture of the industry overall. Therefore, I would like to remind everyone where Fidelity stands on these issues. I will say two things specifically regarding allegations that some mutual fund companies were in violation of the Securities and Exchange Commission's forward pricing rules or were involved in so-called "market timing" activities.
First, Fidelity has no agreements that permit customers who buy fund shares after 4 p.m. to obtain the 4 p.m. price. This is not a new policy. This is not to say that someone could not deceive the company through fraudulent acts. However, we are extremely diligent in preventing fraud from occurring in this manner - and in every other. But I underscore again that Fidelity has no so-called "agreements" that sanction illegal practices.
Second, Fidelity continues to stand on record, as we have for years, in opposition to predatory short-term trading that adversely affects shareholders in a mutual fund. Back in the 1980s, we initiated a fee - which is returned to the fund and, therefore, to investors - to discourage this activity. Further, we took the lead several years ago in developing a Fair Value Pricing Policy to prevent market timing on foreign securities in our funds. I am confident we will find other ways to make it more difficult for predatory traders to operate. However, this will only be achieved through close cooperation among regulators, legislators and the industry.
Yes, there have been unfortunate instances of unethical and illegal activity within the mutual fund industry from time to time. That is true of any industry. When this occurs, confessed or convicted offenders should be dealt with appropriately. But we are still concerned about the risk of over-regulation and the quick application of simplistic solutions to intricate problems. Every system can be improved, and we support and applaud well thought out improvements by regulators, legislators and industry representatives that achieve the common goal of building and protecting the value of investors' holdings.
For nearly 60 years, Fidelity has worked very hard to improve its products and service to justify your trust. When our family founded this company in 1946, we had only a few hundred customers. Today, we serve more than 18 million customers including individual investors and participants in retirement plans across America.
Let me close by saying that we do not take your trust in us for granted, and we realize that we must always work to improve all aspects of our service to you. In turn, we urge you to continue your active participation with your financial matters, so that your interests can be well served.
Best regards,
/s/Edward C. Johnson 3d
Edward C. Johnson 3d
Annual Report
Performance: The Bottom Line
Average annual total return reflects the change in the value of an investment, assuming reinvestment of the class' dividend income and capital gains (the profits earned upon the sale of securities that have grown in value) and assuming a constant rate of performance each year. The $10,000 table and the fund's returns do not reflect the deduction of taxes that a shareholder would pay on fund distributions or the redemption of fund shares. During periods of reimbursement by Fidelity, a fund's total return will be greater than it would be had the reimbursement not occurred. How a fund did yesterday is no guarantee of how it will do tomorrow.
Average Annual Total Returns
Periods ended July 31, 2005 | | Past 1
year | Life of
fund A |
Institutional Class B | | 2.15% | 1.92% |
A From August 29, 2002
B Institutional Class shares are sold to eligible investors without a sales load or 12b-1 fee. The initial offering of Institutional Class shares took place on June 16, 2004. Returns prior to June 16, 2004 are those of Fidelity Ultra-Short Bond, the original retail class of the fund.
$10,000 Over Life of Fund
Let's say hypothetically that $10,000 was invested in Fidelity® Ultra-Short Bond Fund - Institutional Class on August 29, 2002, when the fund started. The chart shows how the value of your investment would have changed, and also shows how the Lehman Brothers® 6 Month Swap Index performed over the same period.
Annual Report
Management's Discussion of Fund Performance
Comments from Andrew Dudley, Portfolio Manager of Fidelity Advisor Ultra-Short Bond Fund
Not unlike the domestic equity markets, taxable bonds swung up and down during the 12 months ending July 31, 2005, rallying early in the period, selling off in late winter, only to advance again in the spring. During the one-year period, the Lehman Brothers® Aggregate Bond Index - a measure of the overall investment-grade bond universe - - rose 4.79%. Much of this gain came on the strength of returns from higher-yielding spread sectors, such as investment-grade corporates, reflected in the 5.76% return of the Lehman Brothers Credit Bond Index over the 12-month period. Mortgage-backed securities were spurred on by the relative stability of long-term interest rates, and the Lehman Brothers Mortgage-Backed Securities gained 4.67%. Treasuries also bolstered the overall market, as illustrated by the 4.62% return of the Lehman Brothers U.S. Treasury Index, which moved ahead on a flight to quality as investors continued to ponder the future direction of the U.S. economy. The Lehman Brothers U.S. Agency Index returned a more modest 3.88%.
For the 12 months ending July 31, 2005, the fund's Institutional Class shares gained 2.15%, while the Lehman Brothers 6 Month Swap Index returned 2.23% and the LipperSM Ultra-Short Obligation Funds Average returned 1.95%. Benefiting the fund's performance was my yield-curve positioning. I owned more bonds with maturities throughout the zero- to two-year range than the index, which helped as the yield curve flattened. Sector selection also generally was favorable. I kept the fund tilted heavily toward non-government bonds, which were helped by their yield advantage over Treasuries and spread tightening. I held these securities - namely asset-backed bonds and mortgage securities - directly and indirectly through the Fidelity Ultra-Short Central Fund, a diversified internal pool of short-term assets designed to outperform cash-like instruments with similar risk characteristics. Detracting from performance was a small stake in corporate bonds issued by auto companies, which were hurt by credit-rating downgrades.
The views expressed in this statement reflect those of the portfolio manager only through the end of the period of the report as stated on the cover and do not necessarily represent the views of Fidelity or any other person in the Fidelity organization. Any such views are subject to change at any time based upon market or other conditions and Fidelity disclaims any responsibility to update such views. These views may not be relied on as investment advice and, because investment decisions for a Fidelity fund are based on numerous factors, may not be relied on as an indication of trading intent on behalf of any Fidelity fund.
Annual Report
Shareholder Expense Example
As a shareholder of the Fund, you incur two types of costs: (1) transaction costs, including redemption fees, and (2) ongoing costs, including management fees, distribution and/or service (12b-1) fees and other Fund expenses. This Example is intended to help you understand your ongoing costs (in dollars) of investing in the Fund and to compare these costs with the ongoing costs of investing in other mutual funds.
The Example is based on an investment of $1,000 invested at the beginning of the period and held for the entire period (February 1, 2005 to July 31, 2005).
Actual Expenses
The first line of the table below for each class of the Fund provides information about actual account values and actual expenses. You may use the information in this line, together with the amount you invested, to estimate the expenses that you paid over the period. Simply divide your account value by $1,000.00 (for example, an $8,600 account value divided by $1,000.00 = 8.6), then multiply the result by the number in the first line for a class of the Fund under the heading entitled "Expenses Paid During Period" to estimate the expenses you paid on your account during this period.
Hypothetical Example for Comparison Purposes
The second line of the table below for each class of the Fund provides information about hypothetical account values and hypothetical expenses based on a Class' actual expense ratio and an assumed rate of return of 5% per year before expenses, which is not the Class' actual return. The hypothetical account values and expenses may not be used to estimate the actual ending account balance or expenses you paid for the period. You may use this information to compare the ongoing costs of investing in the Fund and other funds. To do so, compare this 5% hypothetical example with the 5% hypothetical examples that appear in the shareholder reports of the other funds.
Please note that the expenses shown in the table are meant to highlight your ongoing costs only and do not reflect any transaction costs. Therefore, the second line of the table is useful in comparing ongoing costs only, and will not help you determine the relative total costs of owning different funds. In addition, if these transactional costs were included, your costs would have been higher.
Annual Report
Shareholder Expense Example - continued
| Beginning
Account Value
February 1, 2005 | Ending
Account Value
July 31, 2005 | Expenses Paid
During Period*
February 1, 2005
to July 31, 2005 |
Class A | | | |
Actual | $ 1,000.00 | $ 1,012.00 | $ 3.49 |
HypotheticalA | $ 1,000.00 | $ 1,021.32 | $ 3.51 |
Class T | | | |
Actual | $ 1,000.00 | $ 1,011.90 | $ 3.49** |
HypotheticalA | $ 1,000.00 | $ 1,021.32 | $ 3.51** |
Ultra-Short Bond | | | |
Actual | $ 1,000.00 | $ 1,013.00 | $ 2.55** |
HypotheticalA | $ 1,000.00 | $ 1,022.27 | $ 2.56** |
Institutional Class | | | |
Actual | $ 1,000.00 | $ 1,012.70 | $ 2.74** |
HypotheticalA | $ 1,000.00 | $ 1,022.07 | $ 2.76** |
A 5% return per year before expenses
* Expenses are equal to each Class' annualized expense ratio (shown in the table below); multiplied by the average account value over the period, multiplied by 181/365 (to reflect the one-half year period).
| Annualized
Expense Ratio |
Class A | .70% |
Class T | .70%** |
Ultra-Short Bond | .51%** |
Institutional Class | .55%** |
** If contractual expense reductions, effective June 1, 2005, had been in effect during the period, the annualized expense ratios and the expenses paid in the actual and hypothetical examples above would have been as follows:
| Annualized
Expense Ratio
| Expenses Paid
|
Class T | .69% | |
Actual | | $ 3.44 |
HypotheticalA | | $ 3.46 |
Ultra-Short Bond | .45% | |
Actual | | $ 2.25 |
HypotheticalA | | $ 2.26 |
Institutional Class | .47% | |
Actual | | $ 2.35 |
HypotheticalA | | $ 2.36 |
A 5% return per year before expenses
Annual Report
Investment Changes
Quality Diversification (% of fund's net assets) |
As of July 31, 2005 | As of January 31, 2005 |
| U.S. Government and
U.S. Government
Agency Obligations 11.0% | | | U.S. Government and
U.S. Government
Agency Obligations 19.4% | |
| AAA 26.9% | | | AAA 23.7% | |
| AA 10.4% | | | AA 6.5% | |
| A 11.5% | | | A 11.9% | |
| BBB 11.3% | | | BBB 10.4% | |
| BB and Below 0.2% | | | BB and Below 0.1% | |
| Not Rated 2.8% | | | Not Rated 5.2% | |
| Short-Term
Investments and
Net Other Assets 25.9% | | | Short-Term
Investments and
Net Other Assets 22.8% | |
We have used ratings from Moody's Investors Services, Inc. Where Moody's ratings are not available, we have used S&P® ratings. Securities rated BB or below were rated investment grade at the time of acquisition. The information in the above table is based on the combined investments of the fund and its pro-rata share of the investments of Fidelity's fixed-income central fund. |
Average Years to Maturity as of July 31, 2005 |
| | 6 months ago |
Years | 1.6 | 1.6 |
Average years to maturity is based on the average time remaining until principal payments are expected from each of the fund's bonds, weighted by dollar amount. |
Duration as of July 31, 2005 |
| | 6 months ago |
Years | 0.3 | 0.4 |
Duration shows how much a bond fund's price fluctuates with changes in comparable interest rates. If rates rise 1%, for example, a fund with a five-year duration is likely to lose about 5% of its value. Other factors also can influence a bond fund's performance and share price. Accordingly, a bond fund's actual performance may differ from this example. |
Asset Allocation (% of fund's net assets) |
As of July 31, 2005* | As of January 31, 2005** |
| Corporate Bonds 6.6% | | | Corporate Bonds 5.5% | |
 | U.S. Government and
U.S. Government
Agency Obligations 11.0% | | | U.S. Government and
U.S. Government
Agency Obligations 19.4% | |
| Asset-Backed
Securities 33.7% | | | Asset-Backed
Securities 31.5% | |
| CMOs and Other Mortgage Related Securities 22.8% | | | CMOs and Other Mortgage Related Securities 20.8% | |
| Short-Term
Investments and
Net Other Assets 25.9% | | | Short-Term
Investments and
Net Other Assets 22.8% | |
* Foreign investments | 5.3% | | ** Foreign investments | 4.3% | |
* Futures and Swaps | 9.4% | | ** Futures and Swaps | 14.2% | |

The information in the above tables is based on the combined investments of the fund and its pro-rata share of the investment of Fidelity's fixed-income central fund. |
Annual Report
Investments July 31, 2005
Showing Percentage of Net Assets
Nonconvertible Bonds - 5.4% |
| Principal
Amount | | Value
(Note 1) |
CONSUMER DISCRETIONARY - 1.0% |
Auto Components - 0.2% |
DaimlerChrysler NA Holding Corp.: | | | | |
3.8594% 9/10/07 (f) | | $ 1,230,000 | | $ 1,232,497 |
3.8938% 5/24/06 (f) | | 800,000 | | 802,330 |
| | 2,034,827 |
Media - 0.8% |
British Sky Broadcasting Group PLC (BSkyB) yankee 7.3% 10/15/06 | | 900,000 | | 929,107 |
Continental Cablevision, Inc. 8.3% 5/15/06 | | 450,000 | | 463,986 |
Cox Communications, Inc.: | | | | |
(Reg. S) 3.95% 12/14/07 (f) | | 1,530,000 | | 1,537,901 |
7.75% 8/15/06 | | 360,000 | | 371,837 |
Liberty Media Corp. 4.91% 9/17/06 (f) | | 3,033,000 | | 3,049,894 |
Univision Communications, Inc. 2.875% 10/15/06 | | 1,210,000 | | 1,183,017 |
| | 7,535,742 |
TOTAL CONSUMER DISCRETIONARY | | 9,570,569 |
ENERGY - 0.6% |
Oil, Gas & Consumable Fuels - 0.6% |
Duke Energy Field Services LLC 7.5% 8/16/05 | | 1,000,000 | | 1,001,206 |
Enterprise Products Operating LP 4% 10/15/07 | | 2,670,000 | | 2,625,438 |
Valero Energy Corp. 7.375% 3/15/06 | | 1,700,000 | | 1,727,294 |
| | 5,353,938 |
FINANCIALS - 1.4% |
Capital Markets - 0.0% |
State Street Capital Trust II 3.7681% 2/15/08 (f) | | 300,000 | | 300,068 |
Commercial Banks - 0.3% |
Wells Fargo & Co. 3.4194% 3/10/08 (f) | | 2,300,000 | | 2,299,924 |
Consumer Finance - 0.3% |
General Motors Acceptance Corp. 4.87% 10/20/05 (f) | | 2,385,000 | | 2,388,422 |
Real Estate - 0.4% |
EOP Operating LP 8.375% 3/15/06 | | 1,325,000 | | 1,357,928 |
Simon Property Group LP 7.375% 1/20/06 | | 2,525,000 | | 2,560,416 |
| | 3,918,344 |
Thrifts & Mortgage Finance - 0.4% |
Countrywide Financial Corp. 3.71% 4/11/07 (f) | | 1,575,000 | | 1,576,005 |
Nonconvertible Bonds - continued |
| Principal
Amount | | Value
(Note 1) |
FINANCIALS - continued |
Thrifts & Mortgage Finance - continued |
Countrywide Home Loans, Inc. 3.8175% 6/2/06 (f) | | $ 500,000 | | $ 501,468 |
Residential Capital Corp. 4.835% 6/29/07 (b)(f) | | 1,995,000 | | 1,997,075 |
| | 4,074,548 |
TOTAL FINANCIALS | | 12,981,306 |
INFORMATION TECHNOLOGY - 0.2% |
Communications Equipment - 0.2% |
Motorola, Inc. 4.608% 11/16/07 | | 1,700,000 | | 1,699,546 |
TELECOMMUNICATION SERVICES - 1.3% |
Diversified Telecommunication Services - 1.2% |
British Telecommunications PLC 7.875% 12/15/05 | | 1,950,000 | | 1,977,089 |
France Telecom SA 7.45% 3/1/06 (a) | | 440,000 | | 447,817 |
GTE Corp. 6.36% 4/15/06 | | 1,000,000 | | 1,014,045 |
SBC Communications, Inc. 4.389% 6/5/06 (b) | | 2,265,000 | | 2,265,680 |
Sprint Capital Corp.: | | | | |
4.78% 8/17/06 | | 1,000,000 | | 1,003,425 |
7.125% 1/30/06 | | 500,000 | | 506,454 |
Telefonica Europe BV 7.35% 9/15/05 | | 500,000 | | 501,949 |
Telefonos de Mexico SA de CV 4.5% 11/19/08 | | 1,605,000 | | 1,581,845 |
TELUS Corp. yankee 7.5% 6/1/07 | | 2,000,000 | | 2,103,252 |
| | 11,401,556 |
Wireless Telecommunication Services - 0.1% |
AT&T Wireless Services, Inc. 7.35% 3/1/06 | | 900,000 | | 915,869 |
TOTAL TELECOMMUNICATION SERVICES | | 12,317,425 |
UTILITIES - 0.9% |
Electric Utilities - 0.7% |
DTE Energy Co. 6.45% 6/1/06 | | 165,000 | | 167,721 |
Pinnacle West Energy Corp. 4.0044% 4/1/07 (b)(f) | | 1,850,000 | | 1,850,115 |
Progress Energy, Inc. 6.75% 3/1/06 | | 4,105,000 | | 4,159,954 |
| | 6,177,790 |
Gas Utilities - 0.1% |
NiSource Finance Corp. 7.625% 11/15/05 | | 675,000 | | 681,729 |
Nonconvertible Bonds - continued |
| Principal
Amount | | Value
(Note 1) |
UTILITIES - continued |
Independent Power Producers & Energy Traders - 0.1% |
Constellation Energy Group, Inc. 6.35% 4/1/07 | | $ 910,000 | | $ 935,558 |
TOTAL UTILITIES | | 7,795,077 |
TOTAL NONCONVERTIBLE BONDS (Cost $49,879,710) | 49,717,861 |
U.S. Government Agency Obligations - 4.8% |
|
Fannie Mae: | | | | |
2.15% 4/13/06 (d) | | 9,700,000 | | 9,576,150 |
3.25% 7/31/06 | | 35,000,000 | | 34,701,930 |
TOTAL U.S. GOVERNMENT AGENCY OBLIGATIONS (Cost $44,467,346) | 44,278,080 |
U.S. Government Agency - Mortgage Securities - 1.1% |
|
Fannie Mae - 1.1% |
5.5% 11/1/16 to 2/1/19 | | 5,200,909 | | 5,307,703 |
6.5% 7/1/16 to 3/1/35 | | 3,181,350 | | 3,295,459 |
7% 8/1/17 to 5/1/32 | | 1,634,170 | | 1,713,170 |
TOTAL U.S. GOVERNMENT AGENCY - MORTGAGE SECURITIES (Cost $10,393,053) | 10,316,332 |
Asset-Backed Securities - 22.9% |
|
Accredited Mortgage Loan Trust: | | | | |
Series 2004-2 Class A2, 3.76% 7/25/34 (f) | | 659,098 | | 660,260 |
Series 2004-3 Class 2A4, 3.81% 10/25/34 (f) | | 1,200,000 | | 1,203,472 |
Series 2004-4 Class A2D, 3.81% 1/25/35 (f) | | 432,988 | | 434,077 |
Series 2005-1: | | | | |
Class M1, 3.93% 4/25/35 (f) | | 1,545,000 | | 1,541,149 |
Class M2, 4.15% 4/25/35 (f) | | 725,000 | | 725,261 |
ACE Securities Corp.: | | | | |
Series 2002-HE2 Class M1, 4.31% 8/25/32 (f) | | 151,473 | | 152,070 |
Series 2003-FM1 Class M2, 5.31% 11/25/32 (f) | | 145,000 | | 146,706 |
Series 2003-HE1: | | | | |
Class A2, 3.87% 11/25/33 (f) | | 193,312 | | 193,549 |
Class M1, 4.11% 11/25/33 (f) | | 120,000 | | 120,501 |
Class M2, 5.16% 11/25/33 (f) | | 75,000 | | 76,199 |
Asset-Backed Securities - continued |
| Principal
Amount | | Value
(Note 1) |
ACE Securities Corp.: - continued | | | | |
Series 2003-HS1: | | | | |
Class M1, 4.21% 6/25/33 (f) | | $ 50,000 | | $ 50,218 |
Class M2, 5.21% 6/25/33 (f) | | 50,000 | | 50,882 |
Series 2003-NC1 Class M1, 4.24% 7/25/33 (f) | | 100,000 | | 100,729 |
Series 2004-HE1: | | | | |
Class M1, 3.96% 2/25/34 (f) | | 150,000 | | 150,053 |
Class M2, 4.56% 2/25/34 (f) | | 175,000 | | 175,088 |
Series 2005-HE2: | | | | |
Class M1, 3.9% 4/25/35 (f) | | 215,000 | | 214,714 |
Class M2, 3.91% 4/25/35 (f) | | 250,000 | | 249,145 |
Class M3, 3.94% 4/25/35 (f) | | 145,000 | | 144,811 |
Class M4, 4.1% 4/25/35 (f) | | 185,000 | | 184,761 |
Series 2005-HE3: | | | | |
Class A2A, 3.56% 5/25/35 (f) | | 1,167,755 | | 1,167,800 |
Class A2B, 3.67% 5/25/35 (f) | | 630,000 | | 629,474 |
Series 2005-SD1 Class A1, 3.86% 11/25/50 (f) | | 330,485 | | 330,892 |
Aesop Funding II LLC Series 2005-1A Class A2, 3.49% 4/20/09 (b)(f) | | 1,200,000 | | 1,195,320 |
American Express Credit Account Master Trust: | | | | |
Series 2004-1 Class B, 3.6381% 9/15/11 (f) | | 410,000 | | 411,613 |
Series 2004-5 Class B, 3.6381% 4/16/12 (f) | | 2,150,000 | | 2,155,806 |
Series 2004-C Class C, 3.8881% 2/15/12 (b)(f) | | 1,039,411 | | 1,042,479 |
Series 2005-1 Class A, 3.4181% 10/15/12 (f) | | 2,185,000 | | 2,188,761 |
AmeriCredit Automobile Receivables Trust: | | | | |
Series 2003-AM Class A4B, 3.81% 11/6/09 (f) | | 600,000 | | 602,016 |
Series 2003-BX Class A4B, 3.72% 1/6/10 (f) | | 140,000 | | 140,459 |
Series 2003-CF Class A3, 2.75% 10/9/07 | | 699,964 | | 697,759 |
Series 2004-1 Class A3, 3.22% 7/6/08 | | 365,000 | | 362,469 |
Series 2005-1 Class C, 4.73% 7/6/10 | | 2,500,000 | | 2,492,250 |
Series 2005-BM ClassA3, 4.05% 1/6/10 | | 1,280,000 | | 1,277,160 |
Ameriquest Mortgage Securities, Inc.: | | | | |
Series 2002-4 Class M1, 4.46% 2/25/33 (f) | | 105,000 | | 105,529 |
Series 2003-1: | | | | |
Class A2, 3.87% 2/25/33 (f) | | 13,876 | | 13,883 |
Class M1, 4.36% 2/25/33 (f) | | 500,000 | | 503,890 |
Series 2003-11 Class M1, 4.15% 1/25/34 (f) | | 1,535,000 | | 1,549,684 |
Series 2003-3 Class M1, 4.26% 3/25/33 (f) | | 75,000 | | 75,636 |
Series 2003-6: | | | | |
Class M1, 4.22% 8/25/33 (f) | | 1,000,000 | | 1,006,776 |
Class S, 5% 5/25/33 (h) | | 1,779,006 | | 21,519 |
Series 2003-7 Class M1, 4.31% 8/25/33 (f) | | 140,000 | | 142,193 |
Asset-Backed Securities - continued |
| Principal
Amount | | Value
(Note 1) |
Ameriquest Mortgage Securities, Inc.: - continued | | | | |
Series 2003-AR1 Class M1, 4.61% 1/25/33 (f) | | $ 500,000 | | $ 505,188 |
Series 2004-R2: | | | | |
Class M1, 3.89% 4/25/34 (f) | | 85,000 | | 84,996 |
Class M2, 3.94% 4/25/34 (f) | | 75,000 | | 74,997 |
Series 2004-R9: | | | | |
Class A3, 3.78% 10/25/34 (f) | | 1,020,000 | | 1,022,170 |
Class M2, 4.11% 10/25/34 (f) | | 720,000 | | 721,638 |
Class M4, 4.63% 10/25/34 (f) | | 925,000 | | 939,417 |
Series 2005-R1: | | | | |
Class M1, 3.91% 3/25/35 (f) | | 770,000 | | 767,479 |
Class M2, 3.94% 3/25/35 (f) | | 260,000 | | 259,172 |
Series 2005-R2 Class M1, 3.91% 4/25/35 (f) | | 1,700,000 | | 1,697,622 |
Amortizing Residential Collateral Trust: | | | | |
Series 2002-BC6 Class M1, 4.21% 8/25/32 (f) | | 100,000 | | 100,871 |
Series 2002-BC7: | | | | |
Class M1, 4.1144% 10/25/32 (f) | | 450,000 | | 453,375 |
Class M2, 4.36% 10/25/32 (f) | | 300,000 | | 301,995 |
Series 2003-BC1 Class M2, 4.56% 1/25/32 (f) | | 53,547 | | 53,794 |
ARG Funding Corp.: | | | | |
Series 2005-1A Class A2, 3.53% 4/20/09 (b)(f) | | 1,500,000 | | 1,496,719 |
Series 2005-2A Class A2, 3.54% 5/20/09 (b)(f) | | 800,000 | | 798,531 |
Argent Securities, Inc.: | | | | |
Series 2003-W3 Class M2, 5.26% 9/25/33 (f) | | 800,000 | | 824,000 |
Series 2003-W6 Class AV2, 3.83% 1/25/34 (f) | | 219,651 | | 219,906 |
Series 2004-W7: | | | | |
Class M1, 4.01% 5/25/34 (f) | | 305,000 | | 304,987 |
Class M2, 4.06% 5/25/34 (f) | | 250,000 | | 249,989 |
Asset Backed Funding Certificates Series 2004-HE1 Class M2, 4.61% 1/25/34 (f) | | 230,000 | | 233,445 |
Asset Backed Securities Corp. Home Equity Loan Trust: | | | | |
Series 2003-HE2: | | | | |
Class A2, 3.7681% 4/15/33 (f) | | 26,038 | | 26,049 |
Class M1, 4.2881% 4/15/33 (f) | | 1,340,000 | | 1,347,558 |
Series 2003-HE3 Class A2, 3.7381% 6/15/33 (f) | | 7,668 | | 7,669 |
Series 2003-HE4 Class M2, 5.3881% 8/15/33 (f) | | 285,000 | | 290,187 |
Series 2003-HE5 Class A2A, 3.7481% 8/15/33 (f) | | 46,027 | | 46,046 |
Series 2003-HE6 Class M1, 4.11% 11/25/33 (f) | | 215,000 | | 215,951 |
Series 2003-HE7 Class A3, 3.7481% 12/15/33 (f) | | 246,585 | | 247,494 |
Series 2004-HE6 Class A2, 3.82% 6/25/34 (f) | | 1,747,159 | | 1,750,852 |
Series 2005-HE2: | | | | |
Class M1, 3.91% 3/25/35 (f) | | 1,105,000 | | 1,103,123 |
Class M2, 3.96% 3/25/35 (f) | | 275,000 | | 275,089 |
Asset-Backed Securities - continued |
| Principal
Amount | | Value
(Note 1) |
Bank One Issuance Trust: | | | | |
Series 2002-B1 Class B1, 3.7681% 12/15/09 (f) | | $ 465,000 | | $ 466,938 |
Series 2002-B2 Class B2, 3.7281% 5/15/08 (f) | | 100,000 | | 100,013 |
Series 2002-B3 Class B, 3.7481% 8/15/08 (f) | | 500,000 | | 500,202 |
Series 2002-C1 Class C1, 4.3481% 12/15/09 (f) | | 675,000 | | 682,229 |
Series 2002-C2 Class C2, 4.3781% 5/15/08 (f) | | 2,850,000 | | 2,852,599 |
Series 2004-C1 Class C1, 3.8881% 11/15/11 (f) | | 25,000 | | 25,119 |
Bayview Financial Acquisition Trust Series 2004-C Class A1, 3.9013% 5/28/44 (f) | | 890,595 | | 890,497 |
Bayview Financial Asset Trust Series 2000-F Class A, 3.9813% 9/28/43 (f) | | 240,470 | | 240,808 |
Bayview Financial Mortgage Loan Trust Series 2004-A Class A, 3.9313% 2/28/44 (f) | | 427,612 | | 428,472 |
Bear Stearns Asset Backed Securities I: | | | | |
Series 2004-BO1: | | | | |
Class M2, 4.21% 9/25/34 (f) | | 390,000 | | 392,565 |
Class M3, 4.51% 9/25/34 (f) | | 265,000 | | 266,723 |
Class M4, 4.66% 9/25/34 (f) | | 225,000 | | 227,761 |
Class M5, 4.86% 9/25/34 (f) | | 210,000 | | 213,245 |
Series 2004-HE9 Class M2, 4.66% 11/25/34 (f) | | 490,000 | | 492,153 |
Series 2005-HE2: | | | | |
Class M1, 3.96% 2/25/35 (f) | | 905,000 | | 902,860 |
Class M2, 4.21% 2/25/35 (f) | | 330,000 | | 330,345 |
Capital Auto Receivables Asset Trust: | | | | |
Series 2003-1 Class B, 3.8581% 6/15/10 (b)(f) | | 139,307 | | 139,701 |
Series 2005-1 Class B, 3.7631% 6/15/10 (f) | | 850,000 | | 850,797 |
Capital One Auto Finance Trust: | | | | |
Series 2003-A Class A4B, 3.6681% 1/15/10 (f) | | 425,000 | | 426,084 |
Series 2004-B Class A4, 3.4981% 8/15/11 (f) | | 1,700,000 | | 1,700,326 |
Capital One Master Trust: | | | | |
Series 2001-1 Class B, 3.8981% 12/15/10 (f) | | 500,000 | | 503,554 |
Series 2001-8A Class B, 3.9381% 8/17/09 (f) | | 405,000 | | 407,079 |
Capital One Multi-Asset Execution Trust: | | | | |
Series 2002-B1 Class B1, 4.0681% 7/15/08 (f) | | 1,035,000 | | 1,035,408 |
Series 2003-B1 Class B1, 4.5581% 2/17/09 (f) | | 1,135,000 | | 1,142,100 |
Series 2003-B6 Class B6, 3.9181% 9/15/11 (f) | | 1,125,000 | | 1,135,593 |
Series 2004-B1 Class B1, 3.8281% 11/15/11 (f) | | 1,180,000 | | 1,185,793 |
Capital One Prime Auto Receivable Trust Series 2004-1 Class A3, 2.02% 11/15/07 | | 15,396 | | 15,267 |
Capital Trust Ltd. Series 2004-1: | | | | |
Class A2, 3.88% 7/20/39 (b)(f) | | 265,000 | | 265,000 |
Class B, 4.18% 7/20/39 (b)(f) | | 140,000 | | 140,000 |
Class C, 4.53% 7/20/39 (b)(f) | | 180,000 | | 180,000 |
Asset-Backed Securities - continued |
| Principal
Amount | | Value
(Note 1) |
Cayman ABSC NIMS Trust Series 2004-HE2 Class A1, 6.75% 4/25/34 (b) | | $ 648,383 | | $ 649,194 |
CDC Mortgage Capital Trust: | | | | |
Series 2002-HE3: | | | | |
Class M1, 4.56% 3/25/33 (f) | | 297,766 | | 301,783 |
Class M2, 5.71% 3/25/33 (f) | | 489,999 | | 498,600 |
Series 2003-HE1 Class M2, 5.41% 8/25/33 (f) | | 215,000 | | 217,562 |
Series 2003-HE2 Class A, 3.81% 10/25/33 (f) | | 71,407 | | 71,452 |
Series 2003-HE3: | | | | |
Class M1, 4.16% 11/25/33 (f) | | 104,999 | | 105,790 |
Class M2, 5.21% 11/25/33 (f) | | 80,000 | | 81,561 |
Series 2003-HE4 Class A2, 3.69% 3/25/34 (f) | | 54,419 | | 54,424 |
Series 2004-HE2 Class M2, 4.66% 7/26/34 (f) | | 175,000 | | 176,563 |
Chase Credit Card Owner Trust: | | | | |
Series 2001-6 Class B, 3.8681% 3/16/09 (f) | | 200,000 | | 200,945 |
Series 2002-6 Class B, 3.7381% 1/15/08 (f) | | 150,000 | | 150,031 |
Series 2004-1 Class B, 3.5881% 5/15/09 (f) | | 295,000 | | 294,943 |
Chase Issuance Trust Series 2004-C3 Class C3, 3.8581% 6/15/12 (f) | | 1,645,000 | | 1,646,915 |
CIT Equipment Collateral Trust Series 2005-VT1 Class C, 4.18% 11/20/12 | | 1,186,832 | | 1,181,903 |
Citibank Credit Card Issuance Trust: | | | | |
Series 2000-C2 Class C2, 4.2488% 10/15/07 (f) | | 900,000 | | 900,584 |
Series 2001-B2 Class B2, 3.8494% 12/10/08 (f) | | 615,000 | | 617,592 |
Series 2002-B1 Class B1, 3.8% 6/25/09 (f) | | 655,000 | | 657,099 |
Series 2002-C1 Class C1, 4.2185% 2/9/09 (f) | | 900,000 | | 909,613 |
Series 2003-C1 Class C1, 4.65% 4/7/10 (f) | | 1,685,000 | | 1,719,786 |
Countrywide Home Loans, Inc.: | | | | |
Series 2002-6 Class AV1, 3.89% 5/25/33 (f) | | 62,494 | | 62,645 |
Series 2003-BC1 Class M2, 5.46% 9/25/32 (f) | | 1,025,000 | | 1,037,455 |
Series 2003-SD3 Class A1, 3.88% 12/25/32 (b)(f) | | 57,073 | | 57,365 |
Series 2004-2 Class M1, 3.96% 5/25/34 (f) | | 375,000 | | 375,485 |
Series 2004-3: | | | | |
Class 3A4, 3.71% 8/25/34 (f) | | 7,367,340 | | 7,337,420 |
Class M1, 3.96% 6/25/34 (f) | | 100,000 | | 100,092 |
Series 2005-1: | | | | |
Class 1AV2, 3.66% 7/25/35 (f) | | 1,220,000 | | 1,219,321 |
Class MV1, 3.86% 7/25/35 (f) | | 435,000 | | 434,337 |
Class MV2, 3.9% 7/25/35 (f) | | 525,000 | | 523,487 |
Class MV3, 3.94% 7/25/35 (f) | | 215,000 | | 214,690 |
Series 2005-AB1 Class A2, 3.67% 8/25/35 (f) | | 2,480,000 | | 2,479,263 |
Series 2005-IM1 Class A1, 3.56% 8/25/34 (c)(f) | | 2,520,000 | | 2,520,000 |
Asset-Backed Securities - continued |
| Principal
Amount | | Value
(Note 1) |
CS First Boston Mortgage Securities Corp.: | | | | |
Series 2003-8 Class A2, 3.85% 4/25/34 (f) | | $ 227,901 | | $ 228,901 |
Series 2004-FRE1: | | | | |
Class A2, 3.81% 4/25/34 (f) | | 277,344 | | 277,333 |
Class B1, 5.26% 4/25/34 (f) | | 605,000 | | 604,973 |
Class M3, 4.11% 4/25/34 (f) | | 610,000 | | 609,974 |
Discover Card Master Trust I Series 2003-4 Class B1, 3.7181% 5/16/11 (f) | | 550,000 | | 552,820 |
Fannie Mae guaranteed REMIC pass thru certificates Series 2004-T5: | | | | |
Class AB1, 3.674% 5/28/35 (f) | | 996,756 | | 996,055 |
Class AB3, 3.8305% 5/28/35 (f) | | 833,229 | | 833,518 |
Class AB8, 3.784% 5/28/35 (f) | | 861,407 | | 861,812 |
Fieldstone Mortgage Investment Corp.: | | | | |
Series 2003-1 Class M1, 4.14% 11/25/33 (f) | | 100,000 | | 100,673 |
Series 2004-1 Class M2, 4.56% 1/25/35 (f) | | 300,000 | | 303,371 |
Series 2004-3 Class M5, 4.91% 8/25/34 (f) | | 1,500,000 | | 1,525,372 |
Series 2005-2 Class 2A1, 3.5% 7/25/36 (f) | | 2,365,000 | | 2,365,000 |
First Franklin Mortgage Loan Asset Backed Certificates: | | | | |
Series 2005-FF2 Class A2A, 3.55% 3/25/35 (f) | | 875,548 | | 875,548 |
Series 2005-FF2 Class M6, 4.16% 3/25/35 (f) | | 1,000,000 | | 1,000,000 |
First Franklin Mortgage Loan Trust Series 2004-FF2: | | | | |
Class M3, 4.01% 3/25/34 (f) | | 25,000 | | 25,044 |
Class M4, 4.36% 3/25/34 (f) | | 25,000 | | 25,221 |
First USA Secured Note Trust Series 2001-3 Class C, 4.4669% 11/19/08 (b)(f) | | 785,000 | | 790,519 |
Ford Credit Auto Owner Trust Series 2003-B Class B2, 3.8181% 10/15/07 (f) | | 650,000 | | 652,386 |
Ford Credit Floorplan Master Owner Trust Series 2005-1: | | | | |
Class A, 3.5381% 5/17/10 (f) | | 1,375,000 | | 1,374,997 |
Class B, 3.6563% 5/17/10 (f) | | 380,000 | | 379,999 |
Fremont Home Loan Trust: | | | | |
Series 2003-B Class M6, 7.96% 12/25/33 (f) | | 960,000 | | 992,118 |
Series 2004-A Class M2, 4.61% 1/25/34 (f) | | 375,000 | | 379,299 |
Series 2004-C: | | | | |
Class 2A2, 4.01% 8/25/34 (f) | | 1,000,000 | | 1,010,199 |
Class M1, 4.11% 8/25/34 (f) | | 540,000 | | 541,931 |
Class M3, 4.61% 8/25/34 (f) | | 1,000,000 | | 1,018,991 |
Series 2005-2 Class 2A1, 3.5913% 6/25/35 (f) | | 2,165,000 | | 2,164,323 |
Series 2005-A: | | | | |
Class 2A2, 3.7% 2/25/35 (f) | | 1,625,000 | | 1,627,147 |
Class M1, 3.89% 1/25/35 (f) | | 225,000 | | 224,558 |
Class M2, 3.92% 1/25/35 (f) | | 325,000 | | 324,515 |
Asset-Backed Securities - continued |
| Principal
Amount | | Value
(Note 1) |
Fremont Home Loan Trust: - continued | | | | |
Series 2005-A: | | | | |
Class M3, 3.95% 1/25/35 (f) | | $ 175,000 | | $ 174,993 |
Class M4, 4.14% 1/25/35 (f) | | 125,000 | | 125,343 |
GE Business Loan Trust Series 2003-1 Class A, 3.8181% 4/15/31 (b)(f) | | 276,597 | | 278,184 |
GE Capital Credit Card Master Note Trust Series 2005-2 Class B, 3.5736% 6/15/11 (f) | | 925,000 | | 924,723 |
Gracechurch Card Funding PLC: | | | | |
Series 5: | | | | |
Class B, 3.6181% 8/15/08 (f) | | 80,000 | | 80,071 |
Class C, 4.3181% 8/15/08 (f) | | 295,000 | | 296,118 |
Series 6 Class B, 3.5781% 2/17/09 (f) | | 75,000 | | 75,066 |
Series 8 Class C, 3.6721% 6/15/10 (f) | | 2,650,000 | | 2,650,000 |
GSAMP Trust: | | | | |
Series 2002-NC1 Class A2, 3.78% 7/25/32 (f) | | 2,606 | | 2,621 |
Series 2003-FM1 Class M1, 4.25% 3/20/33 (f) | | 750,000 | | 756,815 |
Series 2004-AHL Class A2D, 3.82% 8/25/34 (f) | | 2,296,054 | | 2,304,562 |
Series 2004-FM1: | | | | |
Class M1, 4.11% 11/25/33 (f) | | 195,000 | | 194,992 |
Class M2, 4.86% 11/25/33 (f) | | 135,000 | | 137,091 |
Series 2004-FM2 Class M1, 3.96% 1/25/34 (f) | | 250,000 | | 249,989 |
Series 2004-HE1: | | | | |
Class M1, 4.01% 5/25/34 (f) | | 320,000 | | 319,987 |
Class M2, 4.61% 5/25/34 (f) | | 150,000 | | 151,394 |
Series 2005-6: | | | | |
Class A2, 3.67% 6/25/35 (f) | | 1,800,000 | | 1,800,000 |
Class M3, 4.11% 6/25/35 (f) | | 1,555,000 | | 1,555,000 |
Series 2005-9 Class 2A1, 3.5287% 8/25/35 (f) | | 2,470,000 | | 2,470,000 |
Series 2005-HE2 Class M, 3.89% 3/25/35 (f) | | 1,220,000 | | 1,215,813 |
Series 2005-NC1: | | | | |
Class A1, 3.58% 2/25/35 (f) | | 714,733 | | 714,884 |
Class M1, 3.91% 2/25/35 (f) | | 1,205,000 | | 1,201,964 |
Guggenheim Structured Real Estate Funding Ltd.
Series 2005-1 Class C, 4.3944% 5/25/30 (b)(f) | | 2,100,000 | | 2,097,998 |
Harwood Street Funding I LLC Series 2004-1A
Class CTFS, 5.43% 9/20/09 (b)(f) | | 1,700,000 | | 1,700,000 |
HFC Home Equity Loan Asset Backed Certificates
Series 2005-2: | | | | |
Class M1, 3.97% 1/20/34 (f) | | 450,000 | | 450,000 |
Class M2, 4% 1/20/34 (f) | | 335,000 | | 335,000 |
Home Equity Asset Trust: | | | | |
Series 2002-3 Class A5, 3.9% 2/25/33 (f) | | 4,294 | | 4,297 |
Asset-Backed Securities - continued |
| Principal
Amount | | Value
(Note 1) |
Home Equity Asset Trust: - continued | | | | |
Series 2002-4 Class A3, 3.94% 3/25/33 (f) | | $ 32,186 | | $ 32,204 |
Series 2002-5: | | | | |
Class A3, 3.98% 5/25/33 (f) | | 81,392 | | 81,563 |
Class M1, 4.66% 5/25/33 (f) | | 200,000 | | 202,410 |
Series 2003-1: | | | | |
Class A2, 3.93% 6/25/33 (f) | | 186,600 | | 186,755 |
Class M1, 4.46% 6/25/33 (f) | | 670,000 | | 673,241 |
Series 2003-2: | | | | |
Class A2, 3.84% 8/25/33 (f) | | 10,404 | | 10,443 |
Class M1, 4.34% 8/25/33 (f) | | 80,000 | | 80,866 |
Series 2003-3: | | | | |
Class A2, 3.82% 8/25/33 (f) | | 65,752 | | 65,998 |
Class M1, 4.32% 8/25/33 (f) | | 330,000 | | 333,299 |
Series 2003-4: | | | | |
Class M1, 4.26% 10/25/33 (f) | | 170,000 | | 171,264 |
Class M2, 5.36% 10/25/33 (f) | | 200,000 | | 202,626 |
Series 2003-5: | | | | |
Class A2, 3.81% 12/25/33 (f) | | 271,685 | | 272,645 |
Class M1, 4.16% 12/25/33 (f) | | 160,000 | | 160,890 |
Class M2, 5.19% 12/25/33 (f) | | 70,000 | | 71,691 |
Series 2003-7: | | | | |
Class A2, 3.84% 3/25/34 (f) | | 625,665 | | 627,147 |
Class M1, 4.11% 3/25/34 (f) | | 795,000 | | 796,953 |
Series 2003-8 Class M1, 4.18% 4/25/34 (f) | | 260,000 | | 261,345 |
Series 2004-4 Class A2, 3.78% 10/25/34 (f) | | 698,058 | | 700,513 |
Series 2004-6 Class A2, 3.81% 12/25/34 (f) | | 1,156,164 | | 1,159,839 |
Series 2005-1: | | | | |
Class M1, 3.89% 5/25/35 (f) | | 1,270,000 | | 1,269,027 |
Class M2, 3.91% 5/25/35 (f) | | 1,410,000 | | 1,405,869 |
Class M3, 3.96% 5/25/35 (f) | | 760,000 | | 757,827 |
Series 2005-2: | | | | |
Class 2A2, 3.66% 7/25/35 (f) | | 1,830,000 | | 1,829,053 |
Class M1, 3.91% 7/25/35 (f) | | 890,000 | | 889,149 |
Household Affinity Credit Card Master Note Trust I
Series 2003-3 Class B, 3.6781% 8/15/08 (f) | | 500,000 | | 500,904 |
Household Credit Card Master Trust I Series 2002-1 Class B, 4.0381% 7/15/08 (f) | | 300,000 | | 300,261 |
Household Home Equity Loan Trust: | | | | |
Series 2002-3 Class A, 3.88% 7/20/32 (f) | | 65,349 | | 65,435 |
Series 2003-1 Class M, 4.06% 10/20/32 (f) | | 39,800 | | 39,846 |
Series 2003-2: | | | | |
Class A, 3.76% 9/20/33 (f) | | 191,819 | | 192,196 |
Asset-Backed Securities - continued |
| Principal
Amount | | Value
(Note 1) |
Household Home Equity Loan Trust: - continued | | | | |
Series 2003-2: | | | | |
Class M, 4.01% 9/20/33 (f) | | $ 90,975 | | $ 91,172 |
Series 2004-1 Class M, 3.95% 9/20/33 (f) | | 249,772 | | 250,245 |
Household Mortgage Loan Trust: | | | | |
Series 2002-HC1 Class M, 4.08% 5/20/32 (f) | | 61,785 | | 61,854 |
Series 2003-HC1 Class M, 4.08% 2/20/33 (f) | | 85,634 | | 85,904 |
Series 2003-HC2 Class M, 4.03% 6/20/33 (f) | | 133,207 | | 133,343 |
Series 2004-HC1: | | | | |
Class A, 3.78% 2/20/34 (f) | | 561,710 | | 563,114 |
Class M, 3.93% 2/20/34 (f) | | 340,666 | | 340,627 |
Household Private Label Credit Card Master Note Trust I: | | | | |
Series 2002-2 Class A, 3.5581% 1/18/11 (f) | | 1,000,000 | | 1,001,358 |
Series 2002-3 Class B, 4.6381% 9/15/09 (f) | | 150,000 | | 150,335 |
Ikon Receivables Funding LLC Series 2003-1 Class A3A, 3.6213% 12/17/07 (f) | | 146,379 | | 146,414 |
IXIS Real Estate Capital Trust Series 2005-HE1: | | | | |
Class A1, 3.71% 6/25/35 (f) | | 1,585,056 | | 1,584,969 |
Class M1, 3.93% 6/25/35 (f) | | 550,000 | | 549,304 |
Class M2, 3.95% 6/25/35 (f) | | 375,000 | | 373,784 |
Class M3, 3.98% 6/25/35 (f) | | 250,000 | | 249,692 |
Keycorp Student Loan Trust Series 1999-A Class A2, 3.8% 12/27/09 (f) | | 295,527 | | 296,531 |
Long Beach Mortgage Loan Trust: | | | | |
Series 2003-2 Class M1, 4.28% 6/25/33 (f) | | 500,000 | | 503,235 |
Series 2003-3 Class M1, 4.21% 7/25/33 (f) | | 340,000 | | 342,390 |
MASTR Adjustable Rate Mortgages Trust Series 2004-11 Class 1A4, 3.95% 11/25/34 (f) | | 201,856 | | 202,942 |
MASTR Asset Backed Securities Trust: | | | | |
Series 2004-FRE1 Class M1, 4.01% 7/25/34 (f) | | 485,000 | | 486,481 |
Series 2004-HE1 Class M1, 4.11% 9/25/34 (f) | | 685,000 | | 687,439 |
MBNA Asset Backed Note Trust Series 2000-K Class C, 4.1881% 3/17/08 (b)(f) | | 1,000,000 | | 1,001,200 |
MBNA Credit Card Master Note Trust: | | | | |
Series 2001-B1 Class B1, 3.7631% 10/15/08 (f) | | 1,250,000 | | 1,251,753 |
Series 2001-B2 Class B2, 3.7481% 1/15/09 (f) | | 1,000,000 | | 1,002,535 |
Series 2002-B2 Class B2, 3.7681% 10/15/09 (f) | | 1,034,000 | | 1,038,477 |
Series 2002-B4 Class B4, 3.8881% 3/15/10 (f) | | 630,000 | | 634,975 |
Series 2003-B2 Class B2, 3.7781% 10/15/10 (f) | | 125,000 | | 126,272 |
Series 2003-B3 Class B3, 3.7631% 1/18/11 (f) | | 1,550,000 | | 1,557,355 |
Series 2003-B5 Class B5, 3.7581% 2/15/11 (f) | | 2,000,000 | | 2,015,453 |
Asset-Backed Securities - continued |
| Principal
Amount | | Value
(Note 1) |
MBNA Master Credit Card Trust II: | | | | |
Series 1998-E Class B, 3.9288% 9/15/10 (f) | | $ 200,000 | | $ 201,194 |
Series 1998-G Class B, 3.7881% 2/17/09 (f) | | 500,000 | | 501,089 |
Meritage Mortgage Loan Trust Series 2004-1: | | | | |
Class M1, 3.96% 7/25/34 (f) | | 150,000 | | 149,994 |
Class M2, 4.01% 7/25/34 (f) | | 25,000 | | 24,999 |
Class M3, 4.41% 7/25/34 (f) | | 50,000 | | 49,998 |
Class M4, 4.56% 7/25/34 (f) | | 50,000 | | 49,998 |
Merrill Lynch Mortgage Investors, Inc.: | | | | |
Series 2004-FM1 Class M2, 4.61% 1/25/35 (f) | | 150,000 | | 152,512 |
Series 2004-HE2: | | | | |
Class A1B, 3.93% 8/25/35 (f) | | 676,518 | | 678,301 |
Class A2B, 3.84% 8/25/35 (f) | | 1,510,000 | | 1,516,695 |
Series 2005-NC1 Class A2A, 3.57% 10/25/35 (f) | | 75,282 | | 75,295 |
Morgan Stanley ABS Capital I, Inc.: | | | | |
Series 2002-HE3 Class M1, 4.56% 12/27/32 (f) | | 125,000 | | 126,613 |
Series 2003-NC10 Class M1, 4.14% 10/25/33 (f) | | 830,000 | | 833,555 |
Series 2003-NC5 Class M2, 5.46% 4/25/33 (f) | | 200,000 | | 202,438 |
Series 2003-NC6 Class M2, 5.41% 6/27/33 (f) | | 630,000 | | 646,975 |
Series 2003-NC8 Class M1, 4.16% 9/25/33 (f) | | 120,000 | | 120,688 |
Series 2004-HE6 Class A2, 3.8% 8/25/34 (f) | | 1,198,948 | | 1,202,870 |
Series 2004-NC2 Class M1, 4.01% 12/25/33 (f) | | 375,000 | | 375,630 |
Series 2004-NC6 Class A2, 3.8% 7/25/34 (f) | | 318,867 | | 319,551 |
Series 2004-NC7 Class A3, 3.76% 7/25/34 (f) | | 2,000,000 | | 2,002,503 |
Series 2005-1: | | | | |
Class M2, 3.93% 12/25/34 (f) | | 570,000 | | 569,077 |
Class M3, 3.98% 12/25/34 (f) | | 525,000 | | 524,772 |
Series 2005-HE1: | | | | |
Class A3B, 3.68% 12/25/34 (f) | | 505,000 | | 505,554 |
Class M1, 3.91% 12/25/34 (f) | | 150,000 | | 150,307 |
Class M2, 3.93% 12/25/34 (f) | | 385,000 | | 384,529 |
Series 2005-HE2: | | | | |
Class M1, 3.86% 1/25/35 (f) | | 370,000 | | 370,764 |
Class M2, 3.9% 1/25/35 (f) | | 265,000 | | 264,137 |
Series 2005-NC1: | | | | |
Class M1, 3.9% 1/25/35 (f) | | 325,000 | | 326,036 |
Class M2, 3.93% 1/25/35 (f) | | 325,000 | | 324,471 |
Class M3, 3.97% 1/25/35 (f) | | 325,000 | | 325,114 |
Morgan Stanley Dean Witter Capital I Trust: | | | | |
Series 2001-AM1: | | | | |
Class M1, 4.31% 2/25/32 (f) | | 710,724 | | 712,449 |
Class M2, 4.86% 2/25/32 (f) | | 352,076 | | 353,279 |
Asset-Backed Securities - continued |
| Principal
Amount | | Value
(Note 1) |
Morgan Stanley Dean Witter Capital I Trust: - continued | | | | |
Series 2001-NC1 Class M2, 4.53% 10/25/31 (f) | | $ 42,925 | | $ 42,925 |
Series 2001-NC2 Class B1, 5.41% 1/25/32 (f) | | 191,907 | | 191,996 |
Series 2001-NC4 Class M1, 4.46% 1/25/32 (f) | | 136,710 | | 137,208 |
Series 2002-AM3 Class A3, 3.95% 2/25/33 (f) | | 28,532 | | 28,612 |
Series 2002-HE1 Class M1, 4.06% 7/25/32 (f) | | 590,000 | | 593,338 |
Series 2002-NC3 Class M1, 4.18% 8/25/32 (f) | | 100,000 | | 100,768 |
Series 2002-OP1 Class M1, 4.21% 9/25/32 (f) | | 435,350 | | 437,933 |
Series 2003-NC1 Class M2, 5.51% 11/25/32 (f) | | 130,000 | | 131,317 |
Series 2003-NC2: | | | | |
Class A3, 3.89% 2/25/33 (f) | | 250,680 | | 250,814 |
Class M2, 5.46% 2/25/33 (f) | | 165,000 | | 167,614 |
Navistar Financial Corp. Owner Trust Series 2001-B Class B, 4.83% 11/17/08 | | 380,731 | | 380,097 |
New Century Home Equity Loan Trust: | | | | |
Series 2003-2 Class A2, 3.89% 1/25/33 (f) | | 12,065 | | 12,072 |
Series 2005-1: | | | | |
Class M1, 3.91% 3/25/35 (f) | | 595,000 | | 594,722 |
Class M2, 3.94% 3/25/35 (f) | | 595,000 | | 593,624 |
Class M3, 3.98% 3/25/35 (f) | | 290,000 | | 290,109 |
Nissan Auto Lease Trust: | | | | |
Series 2003-A Class A3A, 3.5281% 6/15/09 (f) | | 681,088 | | 681,672 |
Series 2004-A Class A4A, 3.4581% 6/15/10 (f) | | 1,325,000 | | 1,326,627 |
NovaStar Home Equity Loan Series 2004-1: | | | | |
Class M1, 3.91% 6/25/34 (f) | | 100,000 | | 100,084 |
Class M4, 4.435% 6/25/34 (f) | | 170,000 | | 170,290 |
NovaStar Mortgage Funding Trust Series 2003-3
Class A3, 3.91% 12/25/33 (f) | | 355,121 | | 356,969 |
Onyx Acceptance Owner Trust Series 2003-D Class A3, 2.4% 12/15/07 | | 253,203 | | 252,146 |
Option One Mortgage Loan Trust Series 2003-6
Class M1, 4.11% 11/25/33 (f) | | 1,025,000 | | 1,029,413 |
Ownit Mortgage Loan Asste-Backed Certificates
Series 2005-3 Class A2A, 3.5% 6/25/36 (f) | | 2,200,000 | | 2,200,000 |
Park Place Securities NIM Trust Series 2004-WHQN2 Class A, 4% 2/25/35 (b) | | 703,944 | | 698,665 |
Park Place Securities Nims Trust Series 2004-MHQ1 Class B, 3.474% 12/25/34 (b) | | 122,735 | | 121,508 |
Park Place Securities, Inc.: | | | | |
Series 2004 WWF1 Class M4, 4.56% 1/25/35 (f) | | 945,000 | | 964,465 |
Series 2004-WCW1: | | | | |
Class M1, 4.09% 9/25/34 (f) | | 385,000 | | 386,205 |
Class M2, 4.14% 9/25/34 (f) | | 160,000 | | 160,850 |
Asset-Backed Securities - continued |
| Principal
Amount | | Value
(Note 1) |
Park Place Securities, Inc.: - continued | | | | |
Series 2004-WCW1: | | | | |
Class M3, 4.71% 9/25/34 (f) | | $ 310,000 | | $ 313,857 |
Class M4, 4.91% 9/25/34 (f) | | 435,000 | | 441,258 |
Series 2004-WCW2 Class A2, 3.84% 10/25/34 (f) | | 890,219 | | 892,848 |
Series 2004-WWF1 Class A5, 3.93% 1/25/35 (f) | | 482,969 | | 485,702 |
Series 2005-WCH1: | | | | |
Class A3B, 3.68% 1/25/35 (f) | | 360,000 | | 360,637 |
Class M2, 3.98% 1/25/35 (f) | | 1,130,000 | | 1,127,710 |
Class M3, 4.02% 1/25/35 (f) | | 425,000 | | 425,336 |
Class M5, 4.34% 1/25/35 (f) | | 400,000 | | 401,243 |
People's Choice Home Loan Securities Trust Series 2005-2: | | | | |
Class A1, 3.57% 9/25/24 (f) | | 1,082,642 | | 1,082,642 |
Class M4, 4.09% 5/25/35 (f) | | 870,000 | | 870,000 |
Providian Gateway Master Trust Series 2002-B Class A, 4.0881% 6/15/09 (b)(f) | | 400,000 | | 401,050 |
Residental Asset Securities Corp.: | | | | |
Series 2004-KS10 Class AI2, 3.78% 3/25/29 (f) | | 50,000 | | 50,163 |
Series 2005-KS7 Class A1, 3.4781% 8/25/35 (f) | | 1,485,000 | | 1,484,703 |
Residential Asset Mortgage Products, Inc.: | | | | |
Series 2004-RS10 Class MII2, 4.71% 10/25/34 (f) | | 1,300,000 | | 1,315,803 |
Series 2004-RS6: | | | | |
Class 2M2, 4.76% 6/25/34 (f) | | 250,000 | | 249,999 |
Class 2M3, 4.91% 6/25/34 (f) | | 250,000 | | 249,999 |
Salomon Brothers Mortgage Securities VII, Inc.
Series 2003-HE1 Class A, 3.86% 4/25/33 (f) | | 33,795 | | 33,950 |
Saxon Asset Securities Trust: | | | | |
Series 2004-1 Class M1, 3.99% 3/25/35 (f) | | 640,000 | | 639,839 |
Series 2004-2 Class MV1, 4.04% 8/25/35 (f) | | 415,000 | | 415,558 |
Sears Credit Account Master Trust II: | | | | |
Series 2002-4: | | | | |
Class A, 3.5181% 8/18/09 (f) | | 800,000 | | 799,988 |
Class B, 3.8131% 8/18/09 (f) | | 1,080,000 | | 1,080,037 |
Series 2002-5 Class B, 4.6381% 11/17/09 (f) | | 500,000 | | 501,050 |
Specialty Underwriting & Residential Finance: | | | | |
Series 2003-BC3 Class M1, 4.11% 8/25/34 (f) | | 1,000,000 | | 1,000,989 |
Series 2003-BC4 Class M1, 4.06% 11/25/34 (f) | | 260,000 | | 261,214 |
Structured Asset Securities Corp. Series 2004-GEL1 Class A, 3.82% 2/25/34 (f) | | 79,391 | | 79,391 |
Superior Wholesale Inventory Financing Trust VII
Series 2003-A8 Class CTFS, 3.8381% 3/15/11 (b)(f) | | 675,000 | | 674,578 |
Superior Wholesale Inventory Financing Trust XII
Series 2005-A12 Class C, 4.46% 6/15/10 (f) | | 980,000 | | 979,992 |
Asset-Backed Securities - continued |
| Principal
Amount | | Value
(Note 1) |
Terwin Mortgage Trust: | | | | |
Series 2003-4HE Class A1, 3.89% 9/25/34 (f) | | $ 316,689 | | $ 318,405 |
Series 2003-6HE Class A1, 3.93% 11/25/33 (f) | | 121,556 | | 121,840 |
Series 2005-14HE Class AF1, 3.9753% 7/25/36 (c)(f) | | 1,205,000 | | 1,204,762 |
Triad Automobile Receivable Owner Trust Series 2005-A Class A3, 4.05% 3/12/10 | | 1,800,000 | | 1,786,140 |
WFS Financial Owner Trust: | | | | |
Series 2004-3 Class D, 4.07% 2/17/12 | | 514,264 | | 510,174 |
Series 2004-4 Class D, 3.58% 5/17/12 | | 470,497 | | 464,431 |
Series 2005-1 Class D, 4.09% 8/15/12 | | 495,000 | | 490,205 |
TOTAL ASSET-BACKED SECURITIES (Cost $208,706,183) | 209,007,290 |
Collateralized Mortgage Obligations - 16.5% |
|
Private Sponsor - 12.7% |
Adjustable Rate Mortgage Trust floater: | | | | |
Series 2004-2 Class 7A3, 3.86% 2/25/35 (f) | | 1,442,226 | | 1,445,544 |
Series 2004-4 Class 5A2, 3.86% 3/25/35 (f) | | 457,785 | | 458,697 |
Series 2005-1 Class 5A2, 3.79% 5/25/35 (f) | | 805,325 | | 805,834 |
Series 2005-2: | | | | |
Class 6A2, 3.74% 6/25/35 (f) | | 404,220 | | 404,482 |
Class 6M2, 3.94% 6/25/35 (f) | | 1,375,000 | | 1,375,001 |
Series 2005-3 Class 8A2, 3.7% 7/25/35 (f) | | 2,667,770 | | 2,669,507 |
Series 2005-5 Class 6A2, 3.69% 9/25/35 (f) | | 1,718,837 | | 1,719,960 |
Series 2005-8 Class 7A2, 3.77% 11/25/35 (f) | | 1,080,000 | | 1,080,000 |
Bear Stearns Alt-A Trust floater: | | | | |
Series 2005-1 Class A1, 3.74% 1/25/35 (f) | | 2,624,958 | | 2,624,958 |
Series 2005-2 Class 1A1, 3.71% 3/25/35 (f) | | 2,137,295 | | 2,137,295 |
Countrywide Home Loans, Inc. floater: | | | | |
Series 2004-16 Class A1, 3.86% 9/25/34 (f) | | 861,288 | | 860,487 |
Series 2005-1 Class 2A1, 3.75% 3/25/35 (f) | | 1,999,309 | | 1,999,309 |
CS First Boston Mortgage Securities Corp. floater: | | | | |
Series 2004-AR2 Class 6A1, 3.86% 3/25/34 (f) | | 381,304 | | 381,067 |
Series 2004-AR3 Class 6A2, 3.83% 4/25/34 (f) | | 156,402 | | 156,541 |
Series 2004-AR5 Class 11A2, 3.83% 6/25/34 (f) | | 247,979 | | 247,474 |
Series 2004-AR6 Class 9A2, 3.83% 10/25/34 (f) | | 338,414 | | 338,617 |
Series 2004-AR7 Class 6A2, 3.84% 8/25/34 (f) | | 554,730 | | 555,220 |
Series 2004-AR8 Class 8A2, 3.84% 9/25/34 (f) | | 501,538 | | 502,468 |
Fieldstone Mortgage Investment Corp. floater Series 2004-1 Class 2A, 3.75% 1/25/35 (f) | | 1,470,843 | | 1,473,489 |
First Horizon Mortgage Passthru Trust floater Series 2004-FL1 Class 2A1, 3.95% 12/25/34 (f) | | 587,411 | | 586,732 |
Collateralized Mortgage Obligations - continued |
| Principal
Amount | | Value
(Note 1) |
Private Sponsor - continued |
Granite Master Issuer PLC floater: | | | | |
Series 2005-1: | | | | |
Class A3, 3.51% 12/21/24 (f) | | $ 700,000 | | $ 699,869 |
Class B1, 3.56% 12/20/54 (f) | | 950,000 | | 949,673 |
Class M1, 3.66% 12/20/54 (f) | | 700,000 | | 699,759 |
Series 2005-2 Class C1, 3.7857% 12/20/54 (f) | | 1,200,000 | | 1,199,625 |
Granite Mortgages PLC floater: | | | | |
Series 2004-1: | | | | |
Class 1B, 3.64% 3/20/44 (f) | | 95,000 | | 94,990 |
Class 1C, 4.33% 3/20/44 (f) | | 280,000 | | 281,114 |
Class 1M, 3.84% 3/20/44 (f) | | 565,000 | | 565,429 |
Series 2004-2: | | | | |
Class 1A2, 3.5% 6/20/28 (f) | | 414,174 | | 414,226 |
Class 1B, 3.6% 6/20/44 (f) | | 82,769 | | 82,790 |
Class 1C, 4.13% 6/20/44 (f) | | 302,300 | | 302,922 |
Class 1M, 3.71% 6/20/44 (f) | | 1,811,086 | | 1,811,990 |
Series 2004-3: | | | | |
Class 1B, 3.59% 9/20/44 (f) | | 200,000 | | 200,020 |
Class 1C, 4.02% 9/20/44 (f) | | 605,000 | | 606,331 |
Class 1M, 3.7% 9/20/44 (f) | | 100,000 | | 100,030 |
GSAMP Trust floater Series 2004-11 Class 2A1, 3.79% 12/20/34 (f) | | 1,902,591 | | 1,903,510 |
Holmes Financing No. 7 PLC floater Series 2 Class M, 4.3988% 7/15/40 (f) | | 195,000 | | 195,374 |
Holmes Financing No. 8 PLC floater Series 2: | | | | |
Class A, 3.6788% 4/15/11 (f) | | 1,400,000 | | 1,400,000 |
Class B, 3.7688% 7/15/40 (f) | | 190,000 | | 190,119 |
Class C, 4.3188% 7/15/40 (f) | | 775,000 | | 778,633 |
Homestar Mortgage Acceptance Corp. floater
Series 2004-5 Class A1, 3.91% 10/25/34 (f) | | 1,226,026 | | 1,229,819 |
Impac CMB Trust floater: | | | | |
Series 2004-11 Class 2A2, 3.83% 3/25/35 (f) | | 1,006,838 | | 1,006,641 |
Series 2004-6 Class 1A2, 3.85% 10/25/34 (f) | | 359,177 | | 359,819 |
Series 2005-1: | | | | |
Class M1, 3.92% 4/25/35 (f) | | 431,371 | | 430,916 |
Class M2, 3.96% 4/25/35 (f) | | 762,845 | | 762,219 |
Class M3, 3.99% 4/25/35 (f) | | 186,171 | | 185,974 |
Class M4, 4.21% 4/25/35 (f) | | 113,519 | | 113,634 |
Class M5, 4.23% 4/25/35 (f) | | 113,519 | | 113,496 |
Class M6, 4.28% 4/25/35 (f) | | 177,089 | | 177,054 |
Series 2005-2 Class 1A2, 3.77% 4/25/35 (f) | | 1,780,275 | | 1,778,884 |
Series 2005-4 Class 1B1, 4.76% 6/25/35 (f) | | 768,362 | | 764,881 |
Collateralized Mortgage Obligations - continued |
| Principal
Amount | | Value
(Note 1) |
Private Sponsor - continued |
Lehman Structured Securities Corp. floater Series 2005-1 Class A2, 3.67% 9/26/45 (b)(f) | | $ 2,279,281 | | $ 2,279,281 |
Master Seasoned Securitization Trust Series 2004-1 Class 1A1, 6.2437% 8/25/17 (f) | | 724,549 | | 740,972 |
MASTR Adjustable Rate Mortgages Trust: | | | | |
floater: | | | | |
Series 2004-11: | | | | |
Class 2A1, 3.84% 11/25/34 (f) | | 920,409 | | 922,519 |
Class 2A2, 3.9% 11/25/34 (f) | | 202,627 | | 202,989 |
Series 2005-1 Class 1A1, 3.73% 3/25/35 (f) | | 1,828,937 | | 1,827,794 |
Series 2004-6 Class 4A2, 4.1729% 7/25/34 (f) | | 3,000,000 | | 2,988,733 |
Merrill Lynch Mortgage Investors, Inc.: | | | | |
floater: | | | | |
Series 2003-A: | | | | |
Class 2A1, 3.85% 3/25/28 (f) | | 307,678 | | 309,340 |
Class 2A2, 3.5225% 3/25/28 (f) | | 109,885 | | 110,037 |
Series 2003-B Class A1, 3.8% 4/25/28 (f) | | 285,446 | | 287,110 |
Series 2003-D Class A, 3.77% 8/25/28 (f) | | 1,398,627 | | 1,401,467 |
Series 2003-E Class A2, 3.4425% 10/25/28 (f) | | 610,693 | | 610,694 |
Series 2003-F Class A2, 3.7075% 10/25/28 (f) | | 644,648 | | 644,574 |
Series 2004-A Class A2, 3.6175% 4/25/29 (f) | | 814,476 | | 812,541 |
Series 2004-B Class A2, 3.79% 6/25/29 (f) | | 773,875 | | 772,011 |
Series 2004-C Class A2, 3.95% 7/25/29 (f) | | 1,096,179 | | 1,093,557 |
Series 2004-D Class A2, 3.4725% 9/25/29 (f) | | 1,116,205 | | 1,116,496 |
Series 2004-E Class A2D, 3.9175% 11/25/29 (f) | | 1,189,384 | | 1,195,098 |
Series 2004-G Class A2, 3.95% 11/25/29 (f) | | 468,938 | | 468,889 |
Series 2005-A Class A2, 3.38% 2/25/30 (f) | | 1,468,737 | | 1,466,623 |
Series 2005-B Class A2, 3.75% 6/25/30 (f) | | 1,542,233 | | 1,542,233 |
Series 2003-G Class XA1, 1% 1/25/29 (h) | | 2,547,661 | | 33,024 |
MortgageIT Trust floater Series 2004-2: | | | | |
Class A1, 3.83% 12/25/34 (f) | | 593,487 | | 594,347 |
Class A2, 3.91% 12/25/34 (f) | | 801,651 | | 806,407 |
Opteum Mortgage Acceptance Corp. floater
Series 2005-3 Class APT, 3.75% 6/25/35 (f) | | 2,639,441 | | 2,640,987 |
Permanent Financing No. 1 PLC floater Series 1: | | | | |
Class 2C, 4.5594% 6/10/42 (f) | | 2,000,000 | | 2,005,024 |
Class 3C, 4.5794% 6/10/42 (f) | | 1,700,000 | | 1,708,127 |
Permanent Financing No. 3 PLC floater Series 2 Class C, 4.4294% 6/10/42 (f) | | 1,205,000 | | 1,217,050 |
Permanent Financing No. 4 PLC floater Series 2 Class C, 4.0994% 6/10/42 (f) | | 1,145,000 | | 1,150,599 |
Collateralized Mortgage Obligations - continued |
| Principal
Amount | | Value
(Note 1) |
Private Sponsor - continued |
Permanent Financing No. 5 PLC floater: | | | | |
Series 2 Class C, 4.0294% 6/10/42 (f) | | $ 390,000 | | $ 391,828 |
Series 3 Class C, 4.1994% 6/10/42 (f) | | 825,000 | | 832,219 |
Permanent Financing No. 6 PLC floater Series 6: | | | | |
Class 1C, 3.7294% 6/10/42 (f) | | 500,000 | | 500,072 |
Class 2C, 3.8294% 6/10/42 (f) | | 1,600,000 | | 1,600,701 |
Permanent Financing No. 7 PLC floater Series 7: | | | | |
Class 1B, 3.4694% 6/10/42 (f) | | 2,000,000 | | 1,999,375 |
Class 1C, 3.6594% 6/10/42 (f) | | 545,000 | | 544,830 |
Class 2C, 3.7094% 6/10/42 (f) | | 1,140,000 | | 1,138,575 |
Permanent Financing No. 8 PLC floater Series 8: | | | | |
Class 1C, 3.7475% 6/10/42 (f) | | 1,035,000 | | 1,034,656 |
Class 2C, 3.8175% 6/10/42 (f) | | 1,435,000 | | 1,434,522 |
Residential Asset Mortgage Products, Inc. sequential pay: | | | | |
Series 2003-SL1 Class A31, 7.125% 4/25/31 | | 299,187 | | 304,589 |
Series 2004-SL2 Class A1, 6.5% 10/25/16 | | 128,532 | | 130,577 |
Residential Finance LP/Residential Finance Development Corp. floater Series 2003-A: | | | | |
Class B4, 5.15% 3/10/35 (b)(f) | | 96,351 | | 97,797 |
Class B5, 5.7% 3/10/35 (b)(f) | | 96,351 | | 98,499 |
Residential Funding Securities Corp.: | | | | |
Series 2003-RP1 Class A1, 3.96% 11/25/34 (f) | | 119,195 | | 119,685 |
Series 2003-RP2 Class A1, 3.93% 6/25/33 (b)(f) | | 202,975 | | 203,758 |
Sequoia Mortgage Funding Trust Series 2003-A
Class AX1, 0.8% 10/21/08 (b)(h) | | 8,611,532 | | 65,052 |
Sequoia Mortgage Trust floater: | | | | |
Series 2003-5 Class A2, 3.41% 9/20/33 (f) | | 549,955 | | 549,812 |
Series 2003-7 Class A2, 2.885% 1/20/34 (f) | | 275,380 | | 275,140 |
Series 2004-1 Class A, 4.15% 2/20/34 (f) | | 434,689 | | 434,294 |
Series 2004-10 Class A4, 3.6681% 11/20/34 (f) | | 1,267,083 | | 1,265,057 |
Series 2004-12 Class 1A2, 3.93% 1/20/35 (f) | | 1,997,935 | | 2,003,410 |
Series 2004-4 Class A, 3.5881% 5/20/34 (f) | | 1,532,956 | | 1,529,426 |
Series 2004-5 Class A3, 3.77% 6/20/34 (f) | | 508,802 | | 508,405 |
Series 2004-6: | | | | |
Class A3A, 4.1475% 6/20/35 (f) | | 681,844 | | 681,395 |
Class A3B, 3.16% 7/20/34 (f) | | 1,363,688 | | 1,362,600 |
Series 2004-7: | | | | |
Class A3A, 3.2275% 8/20/34 (f) | | 724,191 | | 723,603 |
Class A3B, 3.4525% 7/20/34 (f) | | 1,406,196 | | 1,411,214 |
Series 2004-8 Class A2, 3.45% 9/20/34 (f) | | 2,235,112 | | 2,233,959 |
Series 2005-1 Class A2, 3.68% 2/20/35 (f) | | 962,779 | | 962,658 |
Collateralized Mortgage Obligations - continued |
| Principal
Amount | | Value
(Note 1) |
Private Sponsor - continued |
Sequoia Mortgage Trust floater: - continued | | | | |
Series 2005-2 Class A2, 3.36% 3/20/35 (f) | | $ 1,946,098 | | $ 1,946,098 |
Structured Asset Securities Corp. floater
Series 2004-NP1 Class A, 3.86% 9/25/33 (b)(f) | | 230,722 | | 230,868 |
Thornburg Mortgage Securities Trust floater
Series 2004-3 Class A, 3.83% 9/25/34 (f) | | 2,808,663 | | 2,816,468 |
WAMU Mortgage pass thru certificates: | | | | |
sequential pay Series 2002-S6 Class A25, 6% 10/25/32 | | 171,075 | | 171,508 |
Series 2005 AR11 Class A1C1, 3.6675% 8/25/40 (f) | | 2,100,000 | | 2,100,000 |
Washington Mutual Mortgage Securities Corp. sequential pay Series 2003-MS9 Class 2A1, 7.5% 12/25/33 | | 78,782 | | 81,643 |
Wells Fargo Mortgage Backed Securities Trust: | | | | |
Series 2004-M Class A3, 4.7024% 8/25/34 (f) | | 2,575,000 | | 2,563,233 |
Series 2005-AR10 Class 2A2, 4.111% 6/25/35 (f) | | 5,290,736 | | 5,216,856 |
Series 2005-AR12 Class 2A1, 4.322% 7/25/35 (f) | | 4,674,576 | | 4,635,136 |
TOTAL PRIVATE SPONSOR | | 116,370,464 |
U.S. Government Agency - 3.8% |
Fannie Mae: | | | | |
floater Series 2002-89 Class F, 3.6144% 1/25/33 (f) | | 151,287 | | 151,520 |
planned amortization class Series 1993-207 Class G, 6.15% 4/25/23 | | 767,885 | | 777,471 |
Fannie Mae guaranteed REMIC pass thru certificates: | | | | |
floater: | | | | |
Series 2002-11 Class QF, 3.8144% 3/25/32 (f) | | 194,320 | | 195,777 |
Series 2002-36 Class FT, 3.8144% 6/25/32 (f) | | 191,121 | | 192,747 |
Series 2002-64 Class FE, 3.61% 10/18/32 (f) | | 102,105 | | 102,578 |
Series 2002-74 Class FV, 3.7644% 11/25/32 (f) | | 124,440 | | 125,345 |
Series 2003-11: | | | | |
Class DF, 3.7644% 2/25/33 (f) | | 105,782 | | 106,519 |
Class EF, 3.7644% 2/25/33 (f) | | 75,425 | | 75,729 |
planned amortization class: | | | | |
Series 2001-62 Class PG, 6.5% 10/25/30 | | 58,759 | | 58,918 |
Series 2002-11 Class QB, 5.5% 3/25/15 | | 558,895 | | 562,833 |
Series 2002-28 Class PJ, 6.5% 3/25/31 | | 822,731 | | 823,900 |
Series 2002-52 Class PA, 6% 4/25/31 | | 22,759 | | 22,846 |
Series 2002-8 Class PD, 6.5% 7/25/30 | | 249,689 | | 250,738 |
Series 2003-32 Class PB, 3% 6/25/16 | | 675,385 | | 671,742 |
Series 2002-50 Class LE, 7% 12/25/29 | | 123,070 | | 124,803 |
Collateralized Mortgage Obligations - continued |
| Principal
Amount | | Value
(Note 1) |
U.S. Government Agency - continued |
Fannie Mae guaranteed REMIC pass thru certificates: - continued | | | | |
Series 2004-31 Class IA, 4.5% 6/25/10 (h) | | $ 542,525 | | $ 19,472 |
Series 2005-15 Class AZ, 5% 3/25/35 | | 1,387,431 | | 1,383,638 |
Series 2005-28 Class AZ, 5% 4/25/35 | | 960,396 | | 958,297 |
Freddie Mac planned amortization class: | | | | |
Series 2091 Class PP, 6% 2/15/27 | | 98,417 | | 98,370 |
Series 2162 Class PH, 6% 6/15/29 | | 1,775,787 | | 1,831,867 |
Freddie Mac Multi-class participation certificates Series 3007 Class ZN 4.5% 7/15/25 | | 1,362,420 | | 1,345,405 |
Freddie Mac Multi-class participation certificates guaranteed: | | | | |
floater: | | | | |
Series 2526 Class FC, 3.7881% 11/15/32 (f) | | 35,449 | | 35,631 |
Series 2538 Class FB, 3.7881% 12/15/32 (f) | | 220,147 | | 221,593 |
Series 2551 Class FH, 3.8381% 1/15/33 (f) | | 102,120 | | 102,552 |
planned amortization class: | | | | |
Series 2316 Class PB, 6.5% 9/15/30 | | 301,240 | | 302,017 |
Series 2394 Class ND, 6% 6/15/27 | | 114,698 | | 114,938 |
Series 2395 Class PE, 6% 2/15/30 | | 668,869 | | 673,235 |
Series 2398 Class DK, 6.5% 1/15/31 | | 93,190 | | 93,337 |
Series 2410 Class ML, 6.5% 12/15/30 | | 243,261 | | 244,443 |
Series 2420 Class BE, 6.5% 12/15/30 | | 186,022 | | 186,612 |
Series 2443 Class TD, 6.5% 10/15/30 | | 214,887 | | 215,999 |
Series 2461 Class PG, 6.5% 1/15/31 | | 191,266 | | 193,824 |
Series 2466 Class EC, 6% 10/15/27 | | 18,741 | | 18,717 |
Series 2483 Class DC, 5.5% 7/15/14 | | 133,003 | | 132,994 |
Series 2496 Class OC, 5.5% 9/15/14 | | 979,615 | | 983,554 |
Series 2543 CLass PM, 5.5% 8/15/18 | | 991,487 | | 1,000,708 |
Series 2614 Class IC, 4.5% 12/15/10 (h) | | 2,059,705 | | 71,014 |
Series 2676: | | | | |
Class KN, 3% 12/15/13 | | 1,935,811 | | 1,912,170 |
Class QA, 3% 8/15/16 | | 1,550,000 | | 1,536,448 |
Series 2683 Class UH, 3% 3/15/19 | | 3,549,254 | | 3,512,799 |
Series 2748 Class IB, 4.5% 3/15/10 (h) | | 1,265,317 | | 43,404 |
Series 2776 Class UJ, 4.5% 5/15/20 (h) | | 584,891 | | 30,246 |
Series 2828 Class JA, 4.5% 1/15/10 | | 1,615,000 | | 1,618,133 |
sequential pay: | | | | |
Series 2430 Class ZE, 6.5% 8/15/27 | | 73,596 | | 73,632 |
Series 2480 Class QW, 5.75% 2/15/30 | | 61,212 | | 61,175 |
Series 1803 Class A, 6% 12/15/08 | | 260,767 | | 265,919 |
Collateralized Mortgage Obligations - continued |
| Principal
Amount | | Value
(Note 1) |
U.S. Government Agency - continued |
Freddie Mac Multi-class participation certificates guaranteed: - continued | | | | |
Series 2406: | | | | |
Class FP, 4.3681% 1/15/32 (f) | | $ 1,435,000 | | $ 1,467,531 |
Class PF, 4.3681% 12/15/31 (f) | | 1,135,000 | | 1,164,748 |
Series 2410 Class PF, 4.3681% 2/15/32 (f) | | 2,600,000 | | 2,659,366 |
Series 2907 Class HZ, 5% 12/15/34 | | 1,090,633 | | 1,081,224 |
Series 2949 Clas ZW, 5% 3/15/35 | | 1,572,974 | | 1,574,860 |
Series 2978 Class EZ, 5.5% 11/15/34 | | 391,223 | | 388,137 |
3% 3/15/10 | | 1,804,134 | | 1,787,536 |
Ginnie Mae guaranteed REMIC pass thru securities: | | | | |
floater Series 2001-21 Class FB, 3.7881% 1/16/27 (f) | | 141,329 | | 142,154 |
planned amortization class Series 2002-5 Class PD, 6.5% 5/16/31 | | 388,532 | | 395,792 |
TOTAL U.S. GOVERNMENT AGENCY | | 34,186,957 |
TOTAL COLLATERALIZED MORTGAGE OBLIGATIONS (Cost $150,820,225) | 150,557,421 |
Commercial Mortgage Securities - 4.0% |
|
1301 Avenue of The Americas Trust Series 2000-1301: | | | | |
Class C, 7.44% 8/3/10 (b)(f) | | 565,000 | | 564,987 |
Class D, 7.54% 8/3/10 (b)(f) | | 750,000 | | 749,983 |
Banc of America Large Loan, Inc.: | | | | |
floater: | | | | |
Series 2003-BBA2: | | | | |
Class A3, 3.7081% 11/15/15 (b)(f) | | 340,000 | | 340,214 |
Class C, 3.8581% 11/15/15 (b)(f) | | 70,000 | | 70,256 |
Class D, 3.9381% 11/15/15 (b)(f) | | 110,000 | | 110,627 |
Class F, 4.2881% 11/15/15 (b)(f) | | 80,000 | | 80,562 |
Class H, 4.7881% 11/15/15 (b)(f) | | 70,000 | | 70,416 |
Class J, 5.3381% 11/15/15 (b)(f) | | 70,000 | | 70,420 |
Class K, 5.82% 11/15/15 (b)(f) | | 65,000 | | 64,589 |
Series 2005-BOCA: | | | | |
Class H, 4.3381% 12/15/16 (b)(f) | | 290,000 | | 289,555 |
Class J, 4.4881% 12/15/16 (b)(f) | | 140,000 | | 139,786 |
Class K, 4.7381% 12/15/16 (b)(f) | | 250,000 | | 249,685 |
Series 2005-BOCA Class X1, 1.0882% 12/15/16 (b)(f)(h) | | 109,061,667 | | 1,085,818 |
Commercial Mortgage Securities - continued |
| Principal
Amount | | Value
(Note 1) |
Bayview Commercial Asset Trust floater: | | | | |
Series 2003-1 Class A, 4.04% 8/25/33 (b)(f) | | $ 332,377 | | $ 336,326 |
Series 2003-2 Class A, 4.04% 12/25/33 (b)(f) | | 869,217 | | 879,842 |
Series 2004-1: | | | | |
Class A, 3.82% 4/25/34 (b)(f) | | 498,972 | | 499,849 |
Class B, 5.36% 4/25/34 (b)(f) | | 83,162 | | 84,114 |
Series 2004-2: | | | | |
Class A, 3.89% 8/25/34 (b)(f) | | 572,710 | | 575,529 |
Class M1, 4.04% 8/25/34 (b)(f) | | 183,446 | | 184,163 |
Series 2004-3: | | | | |
Class A1, 3.83% 1/25/35 (b)(f) | | 810,885 | | 813,723 |
Class A2, 3.88% 1/25/35 (b)(f) | | 95,398 | | 95,734 |
Class M1, 3.96% 1/25/35 (b)(f) | | 143,097 | | 143,291 |
Class M2, 4.46% 1/25/35 (b)(f) | | 95,398 | | 95,966 |
Series 2005-2A: | | | | |
Class M1, 3.73% 8/25/35 (b)(f) | | 184,689 | | 184,689 |
Class M2, 3.78% 8/25/35 (b)(f) | | 309,478 | | 309,478 |
Class M3, 3.8% 8/25/35 (b)(f) | | 169,714 | | 169,714 |
Class M4, 3.91% 8/25/35 (b)(f) | | 154,739 | | 154,739 |
Bear Stearns Commercial Mortgage Securities, Inc. floater Series 2004-BBA3 Class E, 4.0881% 6/15/17 (b)(f) | | 960,000 | | 960,087 |
COMM floater: | | | | |
Series 2002-FL7: | | | | |
Class C, 3.8881% 11/15/14 (b)(f) | | 351,633 | | 351,753 |
Class F, 4.6881% 11/15/14 (b)(f) | | 1,000,000 | | 1,001,383 |
Class H, 5.6381% 11/15/14 (b)(f) | | 150,000 | | 150,077 |
Series 2003-FL9 Class B, 3.8881% 11/15/15 (b)(f) | | 705,064 | | 707,001 |
Commercial Mortgage pass thru certificates floater: | | | | |
Series 2004-CNL: | | | | |
Class A2, 3.6881% 9/15/14 (b)(f) | | 635,000 | | 635,612 |
Class G, 4.3681% 9/15/14 (b)(f) | | 150,000 | | 150,060 |
Class H, 4.4681% 9/15/14 (b)(f) | | 160,000 | | 160,064 |
Class J, 4.9881% 9/15/14 (b)(f) | | 55,000 | | 55,175 |
Class K, 5.3881% 9/15/14 (b)(f) | | 85,000 | | 85,175 |
Class L, 5.5881% 9/15/14 (b)(f) | | 70,000 | | 69,966 |
Series 2004-HTL1: | | | | |
Class B, 3.8381% 7/15/16 (b)(f) | | 46,895 | | 46,928 |
Class D, 3.9381% 7/15/16 (b)(f) | | 102,330 | | 102,344 |
Class E, 4.1381% 7/15/16 (b)(f) | | 72,473 | | 72,500 |
Class F, 4.1881% 7/15/16 (b)(f) | | 76,740 | | 76,789 |
Class H, 4.6881% 7/15/16 (b)(f) | | 225,918 | | 225,994 |
Class J, 4.8381% 7/15/16 (b)(f) | | 85,230 | | 85,259 |
Commercial Mortgage Securities - continued |
| Principal
Amount | | Value
(Note 1) |
Commercial Mortgage pass thru certificates floater: - continued | | | | |
Series 2004-HTL1: | | | | |
Class K, 5.7381% 7/15/16 (b)(f) | | $ 1,470,333 | | $ 1,469,696 |
Commercial Mortgage Pass-Through Certificates floater Series 2005-F10A: | | | | |
Class B, 3.6181% 4/15/17 (b)(f) | | 1,005,000 | | 1,005,000 |
Class C, 3.6581% 4/15/17 (b)(f) | | 425,000 | | 425,000 |
Class D, 3.6981% 4/15/17 (b)(f) | | 345,000 | | 345,000 |
Class E, 3.7581% 4/15/17 (b)(f) | | 260,000 | | 260,000 |
Class F, 3.7981% 4/15/17 (b)(f) | | 145,000 | | 145,000 |
Class G, 3.9381% 4/15/17 (b)(f) | | 145,000 | | 145,000 |
Class H, 4.0081% 4/15/17 (b)(f) | | 145,000 | | 145,000 |
Class I, 4.2381% 4/15/17 (b)(f) | | 50,000 | | 50,000 |
Class MOA3, 3.6881% 3/15/20 (b)(f) | | 650,000 | | 650,000 |
CS First Boston Mortgage Securities Corp.: | | | | |
floater: | | | | |
Series 2002-TFLA Class C, 3.9688% 11/18/12 (b)(f) | | 255,000 | | 254,995 |
Series 2003-TF2A Class A2, 3.7081% 11/15/14 (b)(f) | | 700,000 | | 700,523 |
Series 2004-FL1 Class B, 3.8381% 5/15/14 (b)(f) | | 1,000,000 | | 1,000,496 |
Series 2004-HC1: | | | | |
Class A2, 3.8881% 12/15/21 (b)(f) | | 175,000 | | 175,000 |
Class B, 4.1381% 12/15/21 (b)(f) | | 455,000 | | 454,999 |
Series 2004-TF2A Class E, 3.8081% 11/15/19 (b)(f) | | 640,000 | | 640,990 |
Series 2004-TFL1: | | | | |
Class A2, 3.5781% 2/15/14 (b)(f) | | 505,000 | | 505,150 |
Class E, 3.9381% 2/15/14 (b)(f) | | 200,000 | | 200,431 |
Class F, 3.9881% 2/15/14 (b)(f) | | 175,000 | | 175,406 |
Class G, 4.2381% 2/15/14 (b)(f) | | 125,000 | | 125,374 |
Class H, 4.4881% 2/15/14 (b)(f) | | 100,000 | | 100,267 |
Class J, 4.7881% 2/15/14 (b)(f) | | 50,000 | | 50,248 |
Series 2005-TF2A Class F, 3.8881% 11/15/19 (b)(f) | | 230,000 | | 230,356 |
Series 2005-TFLA: | | | | |
Class C, 3.6281% 2/15/20 (b)(f) | | 800,000 | | 799,998 |
Class E, 3.7181% 2/15/20 (b)(f) | | 560,000 | | 559,999 |
Class F, 3.7681% 2/15/20 (b)(f) | | 250,000 | | 250,000 |
Class G, 3.9081% 2/15/20 (b)(f) | | 70,000 | | 70,000 |
Class H, 4.1381% 2/15/20 (b)(f) | | 100,000 | | 100,000 |
Series 2003-TFLA Class G, 3.7357% 4/15/13 (b)(f) | | 30,933 | | 30,838 |
Commercial Mortgage Securities - continued |
| Principal
Amount | | Value
(Note 1) |
GS Mortgage Securities Corp. II floater Series 2005-FL7A Class A1, 3.5% 11/6/19 (b)(f) | | $ 1,468,752 | | $ 1,468,909 |
John Hancock Tower Mortgage Trust floater Series 2003-C5A Class B, 5.6585% 4/10/15 (b)(f) | | 420,000 | | 415,178 |
JP Morgan Chase Commercial Mortgage Security Corp.: | | | | |
floater Series 2005-FL1A: | | | | |
Class WH, 3.97% 6/15/19 (b)(f) | | 490,000 | | 490,015 |
Class WJ, 4.17% 6/15/19 (b)(f) | | 305,000 | | 305,009 |
Class WK, 4.57% 6/15/19 (b)(f) | | 455,000 | | 455,014 |
Series 2005-FL1A Class WX1, 1.2068% 6/15/19 (b)(f)(h) | | 160,000,000 | | 1,731,200 |
Lehman Brothers Floating Rate Commercial Mortgage Trust floater: | | | | |
Series 2003-C4A Class H, 6.35% 7/11/15 (b)(f) | | 406,693 | | 407,710 |
Series 2003-LLFA: | | | | |
Class A2, 3.77% 12/16/14 (b)(f) | | 1,085,000 | | 1,085,718 |
Class C, 4.08% 12/16/14 (b)(f) | | 110,000 | | 110,338 |
Class K1, 5.93% 12/16/14 (b)(f) | | 435,000 | | 434,222 |
Merrill Lynch Mortgage Trust Series 2005-GGP1 Class X, 0.1416% 11/15/10 (b)(f)(h) | | 417,400,000 | | 593,626 |
Salomon Brothers Mortgage Securities VII, Inc.: | | | | |
floater: | | | | |
Series 2001-CDCA Class C, 4.1881% 2/15/13 (b)(f) | | 1,000,000 | | 980,616 |
Series 2003-CDCA: | | | | |
Class HEXB, 5.2881% 2/15/15 (b)(f) | | 30,000 | | 30,039 |
Class JEXB, 5.4881% 2/15/15 (b)(f) | | 50,000 | | 50,065 |
Class KEXB, 5.8881% 2/15/15 (b)(f) | | 40,000 | | 40,052 |
Series 2000-NL1 Class E, 7.0607% 10/15/30 (b)(f) | | 492,498 | | 494,421 |
SDG Macerich Properties LP floater Series 2000-1
Class A3, 3.7281% 5/15/09 (b)(f) | | 500,000 | | 500,225 |
STRIPS III Ltd./STRIPS III Corp. floater Series 2004-1A Class A, 3.78% 3/24/18 (b)(f) | | 523,978 | | 523,978 |
Wachovia Bank Commercial Mortgage Trust floater: | | | | |
Series 2004-WHL3: | | | | |
Class A2, 3.5681% 3/15/14 (b)(f) | | 255,000 | | 255,094 |
Class E, 3.8881% 3/15/14 (b)(f) | | 160,000 | | 160,201 |
Class F, 3.9381% 3/15/14 (b)(f) | | 130,000 | | 130,157 |
Class G, 4% 3/15/14 (b)(f) | | 65,000 | | 65,101 |
Series 2005-WL5A: | | | | |
Class KHP1, 3.7381% 1/15/18 (b)(f) | | 245,000 | | 245,000 |
Class KHP2, 3.9381% 1/15/18 (b)(f) | | 245,000 | | 245,000 |
Class KHP3, 4.2381% 1/15/18 (b)(f) | | 290,000 | | 290,000 |
Commercial Mortgage Securities - continued |
| Principal
Amount | | Value
(Note 1) |
Wachovia Bank Commercial Mortgage Trust floater: - continued | | | | |
Series 2005-WL5A: | | | | |
Class KHP4, 4.3381% 1/15/18 (b)(f) | | $ 225,000 | | $ 225,000 |
Class KHP5, 4.5381% 1/15/18 (b)(f) | | 260,000 | | 260,000 |
TOTAL COMMERCIAL MORTGAGE SECURITIES (Cost $36,212,804) | 36,406,876 |
Fixed-Income Funds - 31.6% |
| | Shares | | |
Fidelity Ultra-Short Central Fund (g)
(Cost $288,099,439) | | 2,897,815 | | 288,274,676 |
Cash Equivalents - 14.9% |
| | Maturity
Amount | | |
Investments in repurchase agreements (Collateralized by U.S. Government Obligations, in a joint trading account at 3.32%, dated 7/29/05 due 8/1/05) (i)
(Cost $136,501,000) | | $ 136,538,712 | | 136,501,000 |
TOTAL INVESTMENT PORTFOLIO - 101.2% (Cost $925,079,760) | | | 925,059,536 |
NET OTHER ASSETS - (1.2)% | | | (11,305,773) |
NET ASSETS - 100% | | $ 913,753,763 |
Futures Contracts |
| Expiration
Date | | Underlying
Face Amount
at Value | | Unrealized
Appreciation/
(Depreciation) |
Purchased |
Eurodollar Contracts |
114 Eurodollar 90 Day Index Contracts | Sept. 2005 | | $ 112,867,125 | | $ (230,506) |
112 Eurodollar 90 Day Index Contracts | Dec. 2005 | | 110,805,800 | | (185,111) |
112 Eurodollar 90 Day Index Contracts | March 2006 | | 110,776,400 | | (234,448) |
TOTAL EURODOLLAR CONTRACTS | | | (650,065) |
Sold |
Eurodollar Contracts |
6 Eurodollar 90 Day Index Contracts | June 2006 | | 5,933,550 | | 3,274 |
7 Eurodollar 90 Day Index Contracts | Sept. 2006 | | 6,921,862 | | 3,483 |
6 Eurodollar 90 Day Index Contracts | Dec. 2006 | | 5,932,500 | | 4,251 |
7 Eurodollar 90 Day Index Contracts | March 2007 | | 6,921,162 | | 4,960 |
5 Eurodollar 90 Day Index Contracts | June 2007 | | 4,943,438 | | 2,643 |
4 Eurodollar 90 Day Index Contracts | Sept. 2007 | | 3,954,550 | | 1,984 |
3 Eurodollar 90 Day Index Contracts | Dec. 2007 | | 2,965,650 | | 1,288 |
3 Eurodollar 90 Day Index Contracts | March 2008 | | 2,965,575 | | 1,213 |
2 Eurodollar 90 Day Index Contracts | June 2008 | | 1,976,950 | | 1,692 |
1 Eurodollar 90 Day Index Contracts | Sept. 2008 | | 988,413 | | 1,182 |
TOTAL EURODOLLAR CONTRACTS | | | 25,970 |
| | | | $ (624,095) |
Swap Agreements |
| | | Notional
Amount | | Value |
Credit Default Swap |
Receive from Citibank, upon default event of DaimlerChrysler NA Holding Corp., par value of the notional amount of DaimlerChrysler NA Holding Corp. 6.5% 11/15/13, and pay quarterly notional amount multiplied by .8% | June 2007 | | $ 1,000,000 | | $ (9,712) |
Receive quarterly a fixed rate of .5% multiplied by the notional amount and pay to Deutsche Bank, upon each default event of one of the issues of Dow Jones CDX N.A. Investment Grade 3, par value of the proportional notional amount (e) | March 2010 | | 2,000,000 | | 1,521 |
Swap Agreements - continued |
| Expiration
Date | | Notional
Amount | | Value |
Credit Default Swap - continued |
Receive quarterly a fixed rate of .5% multiplied by the notional amount and pay to Lehman Brothers, Inc., upon each default event of one of the issues of Dow Jones CDX N.A. Investment Grade 3, par value of the proportional notional amount (e) | March 2010 | | $ 2,000,000 | | $ 1,521 |
Receive quarterly notional amount multiplied by .39% and pay JPMorgan Chase, Inc. upon default event of Fannie Mae, par value of the notional amount of Fannie Mae 4.625% 5/1/13 | June 2010 | | 2,600,000 | | 12,917 |
Receive quarterly notional amount multiplied by .75% and pay Lehman Brothers, Inc. upon default event of AOL Time Warner, Inc., par value of the notional amount of AOL Time Warner, Inc. 6.875% 5/1/12 | Sept. 2009 | | 2,000,000 | | 35,867 |
TOTAL CREDIT DEFAULT SWAP | 9,600,000 | | 42,114 |
Total Return Swap |
Receive monthly notional amount multiplied by the nominal spread appreciation of the Lehman Brothers CMBS U.S. Aggregate Index adjusted by a modified duration factor plus 10 basis points and pay monthly notional amount multiplied by the nominal spread depreciation of the Lehman Brothers CMBS U.S. Aggregate Index adjusted by a modified duration factor with Lehman Brothers, Inc. | Oct. 2005 | | 6,800,000 | | 6,537 |
Receive monthly notional amount multiplied by the nominal spread appreciation of the Lehman Brothers CMBS U.S. Aggregate Index adjusted by a modified duration factor plus 25 basis points and pay monthly notional amount multiplied by the nominal spread depreciation of the Lehman Brothers CMBS U.S. Aggregate Index adjusted by a modified duration factor with Lehman Brothers, Inc. | Dec. 2005 | | 4,000,000 | | 4,335 |
Swap Agreements - continued |
| Expiration
Date | | Notional
Amount | | Value |
Total Return Swap - continued |
Receive monthly notional amount multiplied by the nominal spread appreciation of the Lehman Brothers CMBS U.S. Aggregate Index adjusted by a modified duration factor plus 30 basis points and pay monthly notional amount multiplied by the nominal spread depreciation of the Lehman Brothers CMBS U.S. Aggregate Index adjusted by a modified duration factor with Lehman Brothers, Inc. | August 2005 | | $ 4,900,000 | | $ 4,739 |
Receive monthly notional amount multiplied by the nominal spread appreciation of the Lehman Brothers CMBS U.S. Aggregate Index adjusted by a modified duration factor plus 22 basis points and pay monthly notional amount multiplied by the nominal spread depreciation of the Lehman Brothers CMBS U.S. Aggregate Index adjusted by a modified duration factor with Lehman Brothers, Inc. | Jan. 2006 | | 4,900,000 | | 4,499 |
TOTAL TOTAL RETURN SWAP | 20,600,000 | | 20,110 |
| | $ 30,200,000 | | $ 62,224 |
Legend |
(a) Debt obligation initially issued at one coupon which converts to a higher coupon at a specified date. The rate shown is the rate at period end. |
(b) Security exempt from registration under Rule 144A of the Securities Act of 1933. These securities may be resold in transactions exempt from registration, normally to qualified institutional buyers. At the period end, the value of these securities amounted to $59,223,012 or 6.5% of net assets. |
(c) Security or a portion of the security purchased on a delayed delivery or when-issued basis. |
(d) Security or a portion of the security was pledged to cover margin requirements for futures contracts. At the period end, the value of securities pledged amounted to $1,480,848. |
(e) Dow Jones CDX N.A. Investment Grade 3 is a tradable index of credit default swaps on investment grade debt of U.S. companies. |
(f) The coupon rate shown on floating or adjustable rate securities represents the rate at period end. |
(g) Affiliated fund that is available only to investment companies and other accounts managed by Fidelity Investments. A complete listing of the fixed-income central fund's holdings is provided at the end of this report. |
(h) Security represents right to receive monthly interest payments on an underlying pool of mortgages. Principal shown is the par amount of the mortgage pool. |
(i) Additional information on each counterparty to the repurchase agreement is as follows: |
Repurchase Agreement/
Counterparty | Value |
$136,501,000 due 8/1/05 at 3.32% | |
Banc of America Securities LLC. | $ 27,344,467 |
Bank of America, National Association | 14,204,918 |
Barclays Capital Inc. | 56,819,671 |
Countrywide Securities Corporation | 14,204,918 |
Morgan Stanley & Co. Incorporated. | 20,375,797 |
UBS Securities LLC | 3,551,229 |
| $ 136,501,000 |
See accompanying notes which are an integral part of the financial statements.
Annual Report
Financial Statements
Statement of Assets and Liabilities
| July 31, 2005 |
| | |
Assets | | |
Investment in securities, at value (including repurchase agreements of $136,501,000) (cost $925,079,760) - - See accompanying schedule | | $ 925,059,536 |
Cash | | 1,426,263 |
Receivable for investments sold | | 1,430,603 |
Receivable for swap agreements | | 5,737 |
Receivable for fund shares sold | | 1,664,626 |
Interest receivable | | 3,070,262 |
Swap agreements, at value | | 62,224 |
Total assets | | 932,719,251 |
| | |
Liabilities | | |
Payable for investments purchased
Regular delivery | $ 13,821,450 | |
Delayed delivery | 3,724,762 | |
Payable for fund shares redeemed | 750,791 | |
Distributions payable | 247,559 | |
Accrued management fee | 247,210 | |
Distribution fees payable | 846 | |
Payable for daily variation on futures contracts | 28,013 | |
Other affiliated payables | 116,447 | |
Other payables and accrued expenses | 28,410 | |
Total liabilities | | 18,965,488 |
| | |
Net Assets | | $ 913,753,763 |
Net Assets consist of: | | |
Paid in capital | | $ 914,861,233 |
Undistributed net investment income | | 26,805 |
Accumulated undistributed net realized gain (loss) on investments | | (557,541) |
Net unrealized appreciation (depreciation) on investments | | (576,734) |
Net Assets | | $ 913,753,763 |
See accompanying notes which are an integral part of the financial statements.
Annual Report
Financial Statements - continued
Statement of Assets and Liabilities - continued
| July 31, 2005 |
| | |
Calculation of Maximum Offering Price
Class A:
Net Asset Value and redemption price per share
($2,556,584 ÷ 254,820 shares) | | $ 10.03 |
| | |
Maximum offering price per share (100/98.50 of $10.03) | | $ 10.18 |
Class T:
Net Asset Value and redemption price per share ($4,044,195 ÷ 403,077 shares) | | $ 10.03 |
| | |
Maximum offering price per share (100/98.50 of $10.03) | | $ 10.18 |
| | |
Ultra-Short Bond:
Net Asset Value, offering price and redemption price per share ($906,644,323 ÷ 90,395,684 shares) | | $ 10.03 |
| | |
Institutional Class:
Net Asset Value, offering price and redemption price per share ($508,661 ÷ 50,716 shares) | | $ 10.03 |
See accompanying notes which are an integral part of the financial statements.
Annual Report
Statement of Operations
| Year ended July 31, 2005 |
| | |
Investment Income | | |
Interest | | $ 22,542,691 |
| | |
Expenses | | |
Management fee | $ 3,107,816 | |
Transfer agent fees | 1,002,533 | |
Distribution fees | 5,884 | |
Accounting fees and expenses | 203,379 | |
Fund wide operations fee | 39,626 | |
Independent trustees' compensation | 3,744 | |
Custodian fees and expenses | 9,001 | |
Registration fees | 82,647 | |
Audit | 33,864 | |
Legal | 6,364 | |
Miscellaneous | 4,598 | |
Total expenses before reductions | 4,499,456 | |
Expense reductions | (434,744) | 4,064,712 |
Net investment income | | 18,477,979 |
Realized and Unrealized Gain (Loss) Net realized gain (loss) on: | | |
Investment securities | (158,516) | |
Futures contracts | (402,042) | |
Swap agreements | 33,629 | |
Total net realized gain (loss) | | (526,929) |
Change in net unrealized appreciation (depreciation) on: Investment securities | (563,546) | |
Futures contracts | (393,848) | |
Swap agreements | 68,110 | |
Total change in net unrealized appreciation (depreciation) | | (889,284) |
Net gain (loss) | | (1,416,213) |
Net increase (decrease) in net assets resulting from operations | | $ 17,061,766 |
See accompanying notes which are an integral part of the financial statements.
Annual Report
Financial Statements - continued
Statement of Changes in Net Assets
| Year ended
July 31,
2005 | Year ended
July 31,
2004 |
Increase (Decrease) in Net Assets | | |
Operations | | |
Net investment income | $ 18,477,979 | $ 4,702,274 |
Net realized gain (loss) | (526,929) | 327,702 |
Change in net unrealized appreciation (depreciation) | (889,284) | 94,514 |
Net increase (decrease) in net assets resulting
from operations | 17,061,766 | 5,124,490 |
Distributions to shareholders from net investment income | (18,371,771) | (4,708,387) |
Distributions to shareholders from net realized gain | (213,972) | - |
Total distributions | (18,585,743) | (4,708,387) |
Share transactions - net increase (decrease) | 334,021,363 | 355,546,941 |
Redemption fees | 34,215 | 56,247 |
Total increase (decrease) in net assets | 332,531,601 | 356,019,291 |
| | |
Net Assets | | |
Beginning of period | 581,222,162 | 225,202,871 |
End of period (including undistributed net investment income of $26,805 and distributions in excess of net investment income of $122,365, respectively) | $ 913,753,763 | $ 581,222,162 |
See accompanying notes which are an integral part of the financial statements.
Annual Report
Financial Highlights - Class A
Years ended July 31, | 2005 | 2004 F |
Selected Per-Share Data | | |
Net asset value, beginning of period | $ 10.05 | $ 10.04 |
Income from Investment Operations | | |
Net investment income E | .223 | .013 |
Net realized and unrealized gain (loss) | (.026) | .011 |
Total from investment operations | .197 | .024 |
Distributions from net investment income | (.214) | (.014) |
Distributions from net realized gain | (.003) | - |
Total distributions | (.217) | (.014) |
Redemption fees added to paid in capital E, H | - | - |
Net asset value, end of period | $ 10.03 | $ 10.05 |
Total Return B, C, D | 1.98% | .24% |
Ratios to Average Net Assets G | | |
Expenses before expense reductions | .78% | .85% A |
Expenses net of voluntary waivers, if any | .70% | .70% A |
Expenses net of all reductions | .70% | .70% A |
Net investment income | 2.23% | 1.11% A |
Supplemental Data | | |
Net assets, end of period (000 omitted) | $ 2,557 | $ 316 |
Portfolio turnover rate | 33% | 53% |
A Annualized
B Total returns for periods of less than one year are not annualized.
C Total returns would have been lower had certain expenses not been reduced during the periods shown.
D Total returns do not include the effect of the sales charges.
E Calculated based on average shares outstanding during the period.
F For the period June 16, 2004 (commencement of sale of shares) to July 31, 2004.
G Expense ratios reflect operating expenses of the class. Expenses before reductions do not reflect amounts reimbursed by the investment adviser or reductions from brokerage service arrangements or other expense offset arrangements and do not represent the amount paid by the class during periods when reimbursements or reductions occur. Expense ratios before reductions for start-up periods may not be representative of longer-term operating periods. Expenses net of any voluntary waivers reflect expenses after reimbursement by the investment adviser but prior to reductions from brokerage service arrangements or other expense offset arrangements. Expenses net of all reductions represent the net expenses paid by the class.
H Amount represents less than $.001 per share.
See accompanying notes which are an integral part of the financial statements.
Annual Report
Financial Highlights - Class T
Years ended July 31, | 2005 | 2004 F |
Selected Per-Share Data | | |
Net asset value, beginning of period | $ 10.05 | $ 10.04 |
Income from Investment Operations | | |
Net investment income E | .222 | .013 |
Net realized and unrealized gain (loss) | (.025) | .010 |
Total from investment operations | .197 | .023 |
Distributions from net investment income | (.214) | (.013) |
Distributions from net realized gain | (.003) | - |
Total distributions | (.217) | (.013) |
Redemption fees added to paid in capital E, H | - | - |
Net asset value, end of period | $ 10.03 | $ 10.05 |
Total Return B, C, D | 1.98% | .23% |
Ratios to Average Net Assets G | | |
Expenses before expense reductions | .77% | .86% A |
Expenses net of voluntary waivers, if any | .70% | .70% A |
Expenses net of all reductions | .70% | .70% A |
Net investment income | 2.23% | 1.11% A |
Supplemental Data | | |
Net assets, end of period (000 omitted) | $ 4,044 | $ 356 |
Portfolio turnover rate | 33% | 53% |
A Annualized
B Total returns for periods of less than one year are not annualized.
C Total returns would have been lower had certain expenses not been reduced during the periods shown.
D Total returns do not include the effect of the sales charges.
E Calculated based on average shares outstanding during the period.
F For the period June 16, 2004 (commencement of sale of shares) to July 31, 2004.
G Expense ratios reflect operating expenses of the class. Expenses before reductions do not reflect amounts reimbursed by the investment adviser or reductions from brokerage service arrangements or other expense offset arrangements and do not represent the amount paid by the class during periods when reimbursements or reductions occur. Expense ratios before reductions for start-up periods may not be representative of longer-term operating periods. Expenses net of any voluntary waivers reflect expenses after reimbursement by the investment adviser but prior to reductions from brokerage service arrangements or other expense offset arrangements. Expenses net of all reductions represent the net expenses paid by the class.
H Amount represents less than $.001 per share.
See accompanying notes which are an integral part of the financial statements.
Annual Report
Financial Highlights - Ultra-Short Bond
Years ended July 31, | 2005 | 2004 | 2003 E |
Selected Per-Share Data | | | |
Net asset value, beginning of period | $ 10.05 | $ 10.02 | $ 10.00 |
Income from Investment Operations | | | |
Net investment income D | .241 | .122 | .137 |
Net realized and unrealized gain (loss) | (.026) | .029 | .052 |
Total from investment operations | .215 | .151 | .189 |
Distributions from net investment income | (.232) | (.122) | (.173) |
Distributions from net realized gain | (.003) | - | - |
Total distributions | (.235) | (.122) | (.173) |
Redemption fees added to paid in capital D | - G | .001 | .004 |
Net asset value, end of period | $ 10.03 | $ 10.05 | $ 10.02 |
Total Return B, C | 2.16% | 1.52% | 1.94% |
Ratios to Average Net Assets F | | | |
Expenses before expense reductions | .58% | .62% | .70% A |
Expenses net of voluntary waivers, if any | .53% | .55% | .55% A |
Expenses net of all reductions | .53% | .55% | .55% A |
Net investment income | 2.41% | 1.21% | 1.50% A |
Supplemental Data | | | |
Net assets, end of period (000 omitted) | $ 906,644 | $ 580,174 | $ 225,203 |
Portfolio turnover rate | 33% | 53% | 39% A |
A Annualized
B Total returns for periods of less than one year are not annualized.
C Total returns would have been lower had certain expenses not been reduced during the periods shown.
D Calculated based on average shares outstanding during the period.
E For the period August 29, 2002 (commencement of sale of shares) to July 31, 2003.
F Expense ratios reflect operating expenses of the class. Expenses before reductions do not reflect amounts reimbursed by the investment adviser or reductions from brokerage service arrangements or other expense offset arrangements and do not represent the amount paid by the class during periods when reimbursements or reductions occur. Expense ratios before reductions for start-up periods may not be representative of longer-term operating periods. Expenses net of any voluntary waivers reflect expenses after reimbursement by the investment adviser but prior to reductions from brokerage service arrangements or other expense offset arrangements. Expenses net of all reductions represent the net expenses paid by the class.
G Amount represents less than $.001 per share.
See accompanying notes which are an integral part of the financial statements.
Annual Report
Financial Highlights - Institutional Class
Years ended July 31, | 2005 | 2004 E |
Selected Per-Share Data | | |
Net asset value, beginning of period | $ 10.05 | $ 10.04 |
Income from Investment Operations | | |
Net investment income D | .240 | .015 |
Net realized and unrealized gain (loss) | (.026) | .010 |
Total from investment operations | .214 | .025 |
Distributions from net investment income | (.231) | (.015) |
Distributions from net realized gain | (.003) | - |
Total distributions | (.234) | (.015) |
Redemption fees added to paid in capital | - | - |
Net asset value, end of period D, G | $ 10.03 | $ 10.05 |
Total Return B, C | 2.15% | .25% |
Ratios to Average Net Assets F | | |
Expenses before expense reductions | .58% | .67% A |
Expenses net of voluntary waivers, if any | .55% | .55% A |
Expenses net of all reductions | .55% | .55% A |
Net investment income | 2.38% | 1.26% A |
Supplemental Data | | |
Net assets, end of period (000 omitted) | $ 509 | $ 376 |
Portfolio turnover rate | 33% | 53% |
A Annualized
B Total returns for periods of less than one year are not annualized.
C Total returns would have been lower had certain expenses not been reduced during the periods shown.
D Calculated based on average shares outstanding during the period.
E For the period June 16, 2004 (commencement of sale of shares) to July 31, 2004.
F Expense ratios reflect operating expenses of the class. Expenses before reductions do not reflect amounts reimbursed by the investment adviser or reductions from brokerage service arrangements or other expense offset arrangements and do not represent the amount paid by the class during periods when reimbursements or reductions occur. Expense ratios before reductions for start-up periods may not be representative of longer-term operating periods. Expenses net of any voluntary waivers reflect expenses after reimbursement by the investment adviser but prior to reductions from brokerage service arrangements or other expense offset arrangements. Expenses net of all reductions represent the net expenses paid by the class.
G Amount represents less than $.001 per share.
See accompanying notes which are an integral part of the financial statements.
Annual Report
Notes to Financial Statements
For the period ended July 31, 2005
1. Significant Accounting Policies.
Fidelity Ultra-Short Bond Fund (the fund) is a non-diversified fund of Fidelity Income Fund (the trust) and is authorized to issue an unlimited number of shares. The trust is registered under the Investment Company Act of 1940, as amended (the 1940 Act), as an open-end management investment company organized as a Massachusetts business trust.
The fund offers Class A, Class T, Ultra-Short Bond (the original class), and Institutional Class shares, each of which has equal rights as to assets and voting privileges. Each class has exclusive voting rights with respect to matters that affect that class. Investment income, realized and unrealized capital gains and losses, the common expenses of the fund, and certain fund-level expense reductions, if any, are allocated on a pro rata basis to each class based on the relative net assets of each class to the total net assets of the fund. Each class differs with respect to transfer agent and distribution and service plan fees incurred. Certain expense reductions also differ by class.
The fund may invest in affiliated money market central funds (Money Market Central Funds) and fixed-income Central Investment Portfolios (CIPs), collectively referred to as Central Funds, which are open-end investment companies available to investment companies and other accounts managed by Fidelity Management & Research Company (FMR) and its affiliates. The financial statements have been prepared in conformity with accounting principles generally accepted in the United States of America, which require management to make certain estimates and assumptions at the date of the financial statements. The following summarizes the significant accounting policies of the fund, which are also consistently followed by the Central Funds:
Security Valuation. Net asset value per share (NAV calculation) is calculated as of the close of business of the New York Stock Exchange, normally 4:00 p.m. Eastern time. Debt securities, including restricted securities, for which quotations are readily available are valued at their most recent bid prices (sales prices if the principal market is an exchange) in the principal market in which such securities are normally traded, as determined by recognized dealers in such securities, or securities are valued on the basis of information provided by a pricing service. Pricing services use valuation matrices that incorporate both dealer-supplied valuations and valuation models. If prices are not readily available or do not accurately reflect fair value for a security, or if a security's value has been materially affected by events occurring after the close of the exchange or market on which the security is principally traded, that security may be valued by another method that the Board of Trustees believes accurately reflects fair value. A security's valuation may differ depending on the method used for determining value. Price movements in futures contracts and ADRs, market and trading trends, the bid/ask quotes of brokers and off-exchange institutional trading may be reviewed in the course of making a good faith determination of a security's fair value. Short-term securities with remaining
Annual Report
Notes to Financial Statements - continued
1. Significant Accounting Policies - continued
Security Valuation - continued
maturities of sixty days or less for which quotations are not readily available are valued on the basis of amortized cost. Investments in open-end investment companies, including Central Funds, are valued at their net asset value each business day.
Investment Transactions and Income. Security transactions, including the fund's investment activity in the Central Funds, are accounted for as of trade date. Gains and losses on securities sold are determined on the basis of identified cost. Interest income, including distributions from the Central Funds, is accrued as earned. Interest income includes coupon interest and amortization of premium and accretion of discount on debt securities.
Expenses. Most expenses of the trust can be directly attributed to a fund. Expenses which cannot be directly attributed are apportioned among each fund in the trust.
Income Tax Information and Distributions to Shareholders. Each year, the fund intends to qualify as a regulated investment company by distributing all of its taxable income and realized gains under Subchapter M of the Internal Revenue Code. As a result, no provision for income taxes is required in the accompanying financial statements.
Dividends are declared daily and paid monthly from net investment income. Distributions from realized gains, if any, are recorded on the ex-dividend date. Income dividends and capital gain distributions are declared separately for each class. Income and capital gain distributions are determined in accordance with income tax regulations, which may differ from generally accepted accounting principles. In addition, the fund will claim a portion of the payment made to redeeming shareholders as a distribution for income tax purposes. Capital accounts within the financial statements are adjusted for permanent book-tax differences. These adjustments have no impact on net assets or the results of operations. Temporary book-tax differences will reverse in a subsequent period.
Book-tax differences are primarily due to futures transactions, swap agreements, market discount, financing transactions, losses deferred due to wash sales and excise tax regulations.
The tax-basis components of distributable earnings and the federal tax cost as of period end were as follows:
Unrealized appreciation | $ 1,412,507 | |
Unrealized depreciation | (1,060,010) | |
Net unrealized appreciation (depreciation) | 352,497 | |
Undistributed ordinary income | 65,597 | |
| | |
Cost for federal income tax purposes | $ 924,707,039 | |
Annual Report
1. Significant Accounting Policies - continued
Income Tax Information and Distributions to Shareholders - continued
The tax character of distributions paid was as follows:
| July 31, 2005 | July 31, 2004 |
Ordinary Income | $ 18,371,770 | $ 4,708,387 |
Long-term Capital Gains | 213,973 | - |
Total | $ 18,585,743 | $ 4,708,387 |
Short-Term Trading (Redemption) Fees. Shares held in the fund less than 60 days are subject to a redemption fee equal to .25% of the proceeds of the redeemed shares. All redemption fees, including any estimated redemption fees paid by FMR, are retained by the fund and accounted for as an addition to paid in capital.
2. Operating Policies.
Repurchase Agreements. FMR has received an Exemptive Order from the Securities and Exchange Commission (the SEC) which permits the fund and other affiliated entities of FMR to transfer uninvested cash balances into joint trading accounts which are then invested in repurchase agreements. The fund may also invest directly with institutions in repurchase agreements. Repurchase agreements are collateralized by government or non-government securities. Collateral is held in segregated accounts with custodian banks and may be obtained in the event of a default of the counterparty. The fund monitors, on a daily basis, the value of the collateral to ensure it is at least equal to the principal amount of the repurchase agreement (including accrued interest). In the event of a default by the counterparty, realization of the collateral proceeds could be delayed, during which time the value of the collateral may decline.
Delayed Delivery Transactions and When-Issued Securities. The fund may purchase or sell securities on a delayed delivery or when-issued basis. Payment and delivery may take place after the customary settlement period for that security. The price of the underlying securities and the date when the securities will be delivered and paid for are fixed at the time the transaction is negotiated. During the time a delayed delivery sell is outstanding, the contract is marked-to-market daily and equivalent deliverable securities are held for the transaction. The value of the securities purchased on a delayed delivery or when-issued basis are identified as such in the fund's Schedule of Investments. The fund may receive compensation for interest forgone in the purchase of a delayed delivery or when-issued security. With respect to purchase commitments, the fund identifies securities as segregated in its records with a value at least equal to the
Annual Report
Notes to Financial Statements - continued
2. Operating Policies - continued
Delayed Delivery Transactions and When-Issued Securities - continued
amount of the commitment. Losses may arise due to changes in the value of the underlying securities or if the counterparty does not perform under the contract's terms, or if the issuer does not issue the securities due to political, economic, or other factors.
Futures Contracts. The fund may use futures contracts to manage its exposure to the bond market and to fluctuations in interest rates. Buying futures tends to increase a fund's exposure to the underlying instrument, while selling futures tends to decrease a fund's exposure to the underlying instrument or hedge other fund investments. Futures contracts involve, to varying degrees, risk of loss in excess of any futures variation margin reflected in the Statement of Assets and Liabilities. The underlying face amount at value of any open futures contracts at period end is shown in the Schedule of Investments under the caption "Futures Contracts." This amount reflects each contract's exposure to the underlying instrument at period end. Losses may arise from changes in the value of the underlying instruments or if the counterparties do not perform under the contracts' terms. Gains (losses) are realized upon the expiration or closing of the futures contracts. Futures contracts are valued at the settlement price established each day by the board of trade or exchange on which they are traded.
Restricted Securities. The fund may invest in securities that are subject to legal or contractual restrictions on resale. These securities generally may be resold in transactions exempt from registration or to the public if the securities are registered. Disposal of these securities may involve time-consuming negotiations and expense, and prompt sale at an acceptable price may be difficult. Information regarding restricted securities is included at the end of the fund's Schedule of Investments.
Swap Agreements. The fund may invest in swaps for the purpose of managing its exposure to interest rate, credit or market risk.
Total return swaps are agreements to exchange the return generated by one instrument or index for the return generated by another instrument, for example, the agreement to pay interest in exchange for a market-linked return based on a notional amount. To the extent the total return of the index exceeds the offsetting interest obligation, a fund will receive a payment from the counterparty. To the extent it is less, a fund will make a payment to the counterparty. Periodic payments received or made by the fund are recorded in the accompanying Statement of Operations as realized gains or losses, respectively.
Credit default swaps involve the exchange of a fixed rate premium for protection against the loss in value of an underlying debt instrument in the event of a defined credit event (such as payment default or bankruptcy). Under the terms of the swap, one party acts as a "guarantor" receiving a periodic payment that is a fixed percentage applied to a notional principal amount. In return the party agrees to purchase the notional amount of the
Annual Report
2. Operating Policies - continued
Swap Agreements - continued
underlying instrument, at par, if a credit event occurs during the term of the swap. The fund may enter into credit default swaps in which either it or its counterparty act as guarantors. By acting as the guarantor of a swap, a fund assumes the market and credit risk of the underlying instrument including liquidity and loss of value. Periodic payments and premiums received or made by the fund are recorded in the accompanying Statement of Operations as realized gains or losses, respectively.
Swaps are marked-to-market daily based on dealer-supplied valuations and changes in value are recorded as unrealized appreciation (depreciation). Gains or losses are realized upon early termination of the swap agreement. Collateral, in the form of cash or securities, may be required to be held in segregated accounts with a fund's custodian in compliance with swap contracts. Risks may exceed amounts recognized on the Statement of Assets and Liabilities. These risks include changes in the returns of the underlying instruments, failure of the counterparties to perform under the contracts' terms and the possible lack of liquidity with respect to the swap agreements. Details of swap agreements open at period end are included in the fund's Schedule of Investments under the caption "Swap Agreements."
Mortgage Dollar Rolls. To earn additional income, the fund may employ trading strategies which involve the sale and simultaneous agreement to repurchase similar securities ("mortgage dollar rolls") or the purchase and simultaneous agreement to sell similar securities ("reverse mortgage dollar rolls"). The securities traded are mortgage securities and bear the same interest rate but may be collateralized by different pools of mortgages. During the period between the sale and repurchase in a mortgage dollar roll transaction, a fund will not be entitled to receive interest and principal payments on the securities sold but will invest the proceeds of the sale in other securities which may enhance the yield and total return. In addition, the difference between the sale price and the future purchase price is recorded as an adjustment to investment income. During the period between the purchase and subsequent sale in a reverse mortgage dollar roll transaction a fund is entitled to interest and principal payments on the securities purchased. The price differential between the purchase and sale is recorded as an adjustment to investment income. Losses may arise due to changes in the value of the securities or if the counterparty does not perform under the terms of the agreement. If the counterparty files for bankruptcy or becomes insolvent, a fund's right to repurchase or sell securities may be limited.
3. Purchases and Sales of Investments.
Purchases and sales of securities, other than short-term securities and U.S. government securities, aggregated $383,859,606 and $88,905,991, respectively.
Annual Report
Notes to Financial Statements - continued
4. Fees and Other Transactions with Affiliates.
Management Fee. FMR and its affiliates provide the fund with investment management related services for which the fund pays a monthly management fee. The management fee is the sum of an individual fund fee rate that is based on an annual rate of .30% of the fund's average net assets (effective June 1, 2005, the fund's management contract was amended, reducing the individual fund fee rate to .20% of average net assets) and a group fee rate that averaged .12% during the period. The group fee rate is based upon the average net assets of all the mutual funds advised by FMR. The group fee rate decreases as assets under management increase and increases as assets under management decrease. For the period, the total annual management fee rate was .40% of the fund's average net assets.
Distribution and Service Plan. In accordance with Rule 12b-1 of the 1940 Act, the fund has adopted separate Distribution and Service Plans for each class of shares. Certain classes pay Fidelity Distributors Corporation (FDC), an affiliate of FMR, separate Distribution and Service Fees, each of which is based on an annual percentage of each class' average net assets. In addition, FDC may pay financial intermediaries for selling shares of the fund and providing shareholder support services. For the period, the Distribution and Service Fee rates and the total amounts paid to and retained by FDC were as follows:
| Distribution
Fee | Service
Fee | Paid to
FDC | Retained
by FDC |
Class A | 0% | .15% | $ 2,731 | $ 145 |
Class T | 0% | .15% | 3,153 | 1,639 |
| | | $ 5,884 | $ 1,784 |
Sales Load. FDC receives a front-end sales charge of up to 1.50% for selling Class A and Class T shares, some of which is paid to financial intermediaries for selling shares of the fund. FDC receives the proceeds of contingent deferred sales charges levied on Class A and Class T redemptions. These charges depend on the holding period. The deferred sales charges are.25% for certain purchases of Class A and Class T shares.
For the period, sales charge amounts retained by FDC were as follows:
| Retained
by FDC |
Class A | $ 3,708 |
Class T | 2,035 |
| $ 5,743 |
Annual Report
4. Fees and Other Transactions with Affiliates - continued
Transfer Agent Fees. Fidelity Investments Institutional Operations Company, Inc. (FIIOC), an affiliate of FMR, is the transfer, dividend disbursing and shareholder servicing agent for each class of the fund, except for Ultra-Short Bond. Fidelity Service Company, Inc. (FSC), an affiliate of FMR, is the transfer agent for Ultra-Short Bond shares. FIIOC and FSC receive account fees and asset-based fees that vary according to the account size and type of account of the shareholders of the respective classes of the fund. FIIOC and FSC pay for typesetting, printing and mailing of shareholder reports, except proxy statements. Under an amended contract effective June 1, 2005, transfer agent fees for the Ultra-Short Bond class consist of an asset based fee and were reduced to a rate of .10% of average net assets. The account fees were eliminated. For the period the total transfer agent fees paid by each class to FIIOC or FSC, were as follows:
| Amount | % of
Average
Net Assets |
Class A | $ 3,425 | .19 |
Class T | 3,977 | .19 |
Fidelity Ultra-Short Bond | 993,980 | .13 |
Institutional Class | 1,151 | .11 |
| $ 1,002,533 | |
Accounting Fees. FSC maintains the fund's accounting records. The fee is based on the level of average net assets for the month. Effective June 1, 2005, FMR pays these fees.
Fundwide Operations Fee. Pursuant to a new Fundwide Operations and Expense Agreement (FWOE) effective on June 1, 2005, FMR has agreed to provide for fund level expenses (which do not include transfer agent, Rule 12b-1 fees, the compensation of the independent trustees or other extraordinary expenses) in return for a FWOE fee equal to .35% less the total amount of the management fee. The FWOE paid by the fund is reduced by an amount equal to the fees and expenses paid to the independent trustees. For the period, the FWOE fee was equivalent to .005% of average net assets.
Affiliated Central Funds. The fund may invest in Money Market Central Funds which seek preservation of capital and current income and are managed by Fidelity Investments Money Management, Inc. (FIMM) an affiliate of FMR.
The fund may also invest in CIPs managed by FIMM. The Ultra-Short Central Fund seeks to obtain a high level of current income consistent with preservation of capital by investing in U.S. dollar-denominated money market and investment grade debt securities and repurchase agreements.
Annual Report
Notes to Financial Statements - continued
4. Fees and Other Transactions with Affiliates - continued
Affiliated Central Funds - continued
The fund's Schedule of Investments lists the CIP as an investment of the fund but does not include the underlying holdings of the CIP. Based on its investment objectives, the CIP may invest or participate in various investment vehicles or strategies such as delayed delivery and when-issued securities, derivatives, financing transactions and restricted securities. These strategies are consistent with the investment objectives of the fund and may involve certain economic risks, including the risk that a counterparty to one or more of these transactions may be unable or unwilling to comply with the terms of the governing agreement. This may result in a decline in value of the CIP and the fund.
A complete list of holdings for the CIP is available at the end of this report. In addition, a copy of the CIP's financial statements is available on the EDGAR Database on the SEC's website www.sec.gov, or at the Commission's public reference room in Washington, DC.
The Central Funds do not pay a management fee. Income distributions earned by the fund are recorded as income in the accompanying financial statements and totaled $7,392,456 for the period.
5. Committed Line of Credit.
The fund participates with other funds managed by FMR in a $4.2 billion credit facility (the "line of credit") to be utilized for temporary or emergency purposes to fund shareholder redemptions or for other short-term liquidity purposes. The fund has agreed to pay commitment fees on its pro rata portion of the line of credit. During the period, there were no borrowings on this line of credit.
6. Expense Reductions.
FMR voluntarily agreed to reimburse each class to the extent annual operating expenses exceeded certain levels of average net assets as noted in the table below. Some expenses, for example interest expense, are excluded from this reimbursement.
The following classes were in reimbursement during the period:
| Expense
Limitations | Reimbursement
from adviser |
Class A | .70% | $ 1,540 |
Class T | .70% | 1,515 |
Ultra-Short Bond | .55%* | 425,319 |
Institutional Class | .55% | 295 |
| | $ 428,669 |
* Effective June 1, 2005 the expense limitation was eliminated for Ultra-Short Bond.
Annual Report
6. Expense Reductions - continued
In addition, through arrangements with the fund's custodian, credits realized as a result of uninvested cash balances were used to reduce the fund's expenses. During the period, these credits reduced the fund's custody expenses by $2,847.
| Transfer Agent
expense reduction | |
Ultra-Short Bond | $ 3,228 | |
7. Other.
The fund's organizational documents provide former and current trustees and officers with a limited indemnification against liabilities arising in connection with the performance of their duties to the fund. In the normal course of business, the fund may also enter into contracts that provide general indemnifications. The fund's maximum exposure under these arrangements is unknown as this would be dependent on future claims that may be made against the fund. The risk of material loss from such claims is considered remote.
8. Distributions to Shareholders.
Distributions to shareholders of each class were as follows:
| Years ended July 31, |
| 2005 | 2004 A |
From net investment income | | |
Class A | $ 41,869 | $ 200 |
Class T | 50,050 | 262 |
Ultra-Short Bond | 18,257,386 | 4,707,455 |
Institutional Class | 22,466 | 471 |
Total | $ 18,371,771 | $ 4,708,388 |
From net realized gain | | |
Class A | $ 407 | $ - |
Class T | 503 | - |
Ultra-Short Bond | 212,634 | - |
Institutional Class | 428 | - |
Total | $ 213,972 | - |
A Distributions for Class A, Class T, and Institutional Class are for the period June 16, 2004 (commencement of sale of shares) to July 31, 2004.
Annual Report
Notes to Financial Statements - continued
9. Share Transactions.
Transactions for each class of shares were as follows:
| Shares | Dollars |
| Years ended July 31, | Years ended July 31, |
| 2005 | 2004 A | 2005 | 2004 A |
Class A | | | | |
Shares sold | 314,954 | 31,506 | $ 3,163,548 | $ 316,495 |
Reinvestment of distributions | 3,804 | 19 | 38,189 | 195 |
Shares redeemed | (95,385) | (78) | (957,951) | (780) |
Net increase (decrease) | 223,373 | 31,447 | $ 2,243,786 | $ 315,910 |
Class T | | | | |
Shares sold | 597,602 | 35,358 | $ 6,002,298 | $ 355,050 |
Reinvestment of distributions | 4,137 | 26 | 41,523 | 262 |
Shares redeemed | (234,046) | - | (2,350,424) | - |
Net increase (decrease) | 367,693 | 35,384 | $ 3,693,397 | $ 355,312 |
Ultra-Short Bond | | | | |
Shares sold | 63,063,839 | 59,927,755 | $ 633,315,534 | $ 602,349,405 |
Reinvestment of distributions | 1,643,763 | 418,048 | 16,499,718 | 4,203,573 |
Shares redeemed | (32,055,308) | (25,071,625) | (321,868,107) | (252,053,274) |
Net increase (decrease) | 32,652,294 | 35,274,178 | $ 327,947,145 | $ 354,499,704 |
Institutional Class | | | | |
Shares sold | 296,985 | 37,405 | $ 2,986,442 | $ 375,544 |
Reinvestment of distributions | 2,113 | 47 | 21,221 | 471 |
Shares redeemed | (285,834) | - | (2,870,628) | - |
Net increase (decrease) | 13,264 | 37,452 | $ 137,035 | $ 376,015 |
A Share transactions for Class A, Class T, and Institutional Class are for the period June 16, 2004 (commencement of sale of shares) to July 31, 2004.
Annual Report
Report of Independent Registered Public Accounting Firm
To the Trustees of Fidelity Income Fund and the Shareholders of Fidelity Ultra-Short Bond Fund:
In our opinion, the accompanying statement of assets and liabilities, including the schedule of investments, and the related statements of operations and of changes in net assets and the financial highlights present fairly, in all material respects, the financial position of Fidelity Ultra-Short Bond Fund (a fund of Fidelity Income Fund) at July 31, 2005 and the results of their operations, the changes in their net assets and the financial highlights for the periods indicated, in conformity with accounting principles generally accepted in the United States of America. These financial statements and financial highlights (hereafter referred to as "financial statements") are the responsibility of the Fidelity Ultra-Short Bond Fund's management; our responsibility is to express an opinion on these financial statements based on our audits. We conducted our audits of these financial statements in accordance with the standards of the Public Company Accounting Oversight Board (United States). Those standards require that we plan and perform the audit to obtain reasonable assurance about whether the financial statements are free of material misstatement. An audit includes examining, on a test basis, evidence supporting the amounts and disclosures in the financial statements, assessing the accounting principles used and significant estimates made by management, and evaluating the overall financial statement presentation. We believe that our audits, which included confirmation of securities at July 31, 2005 by correspondence with the custodian and brokers, provide a reasonable basis for our opinion.
/s/ PricewaterhouseCoopers LLP
PricewaterhouseCoopers LLP
Boston, Massachusetts
September 13, 2005
Annual Report
Trustees and Officers
The Trustees, Members of the Advisory Board, and executive officers of the trust and fund, as applicable, are listed below. The Board of Trustees governs the fund and is responsible for protecting the interests of shareholders. The Trustees are experienced executives who meet periodically throughout the year to oversee the fund's activities, review contractual arrangements with companies that provide services to the fund, and review the fund's performance. Except for William O. McCoy, Stephen P. Jonas, and Kenneth L. Wolfe, each of the Trustees oversees 320 funds advised by FMR or an affiliate. Mr. McCoy oversees 322 funds advised by FMR or an affiliate. Mr. Jonas and Mr. Wolfe oversee 311 funds advised by FMR or an affiliate.
The Trustees hold office without limit in time except that (a) any Trustee may resign; (b) any Trustee may be removed by written instrument, signed by at least two-thirds of the number of Trustees prior to such removal; (c) any Trustee who requests to be retired or who has become incapacitated by illness or injury may be retired by written instrument signed by a majority of the other Trustees; and (d) any Trustee may be removed at any special meeting of shareholders by a two-thirds vote of the outstanding voting securities of the trust. Each Trustee who is not an interested person (as defined in the 1940 Act) (Independent Trustee), shall retire not later than the last day of the calendar year in which his or her 72nd birthday occurs. The Independent Trustees may waive this mandatory retirement age policy with respect to individual Trustees. The executive officers and Advisory Board Members hold office without limit in time, except that any officer and Advisory Board Member may resign or may be removed by a vote of a majority of the Trustees at any regular meeting or any special meeting of the Trustees. Except as indicated, each individual has held the office shown or other offices in the same company for the past five years.
The fund's Statement of Additional Information (SAI) includes more information about the Trustees. To request a free copy, call Fidelity at 1-800-208-0098.
Interested Trustees*:
Correspondence intended for each Trustee who is an interested person may be sent to Fidelity Investments, 82 Devonshire Street, Boston, Massachusetts 02109.
Name, Age; Principal Occupation |
Edward C. Johnson 3d (75)** |
| Year of Election or Appointment: 1984 Mr. Johnson is Chairman of the Board of Trustees. Mr. Johnson serves as Chief Executive Officer, Chairman, and a Director of FMR Corp.; a Director and Chairman of the Board and of the Executive Committee of FMR; Chairman and a Director of Fidelity Management & Research (Far East) Inc.; Chairman and a Director of Fidelity Investments Money Management, Inc.; and Chairman (2001-present) and a Director (2000-present) of FMR Co., Inc. |
Abigail P. Johnson (43)** |
| Year of Election or Appointment: 2001 Ms. Johnson serves as President of Fidelity Employer Services Company (FESCO) (2005-present). She is President and a Director of Fidelity Investments Money Management, Inc. (2001-present), FMR Co., Inc. (2001-present), and a Director of FMR Corp. Previously, Ms. Johnson served as President and a Director of FMR (2001-2005), Senior Vice President of the Fidelity funds (2001-2005), and managed a number of Fidelity funds. |
Stephen P. Jonas (52) |
| Year of Election or Appointment: 2005 Mr. Jonas is Senior Vice President of the fund (2005-present). He also serves as Senior Vice President of other Fidelity funds (2005-present). Mr. Jonas is Executive Director of FMR (2005-present). Previously, Mr. Jonas served as President of Fidelity Enterprise Operations and Risk Services (2004-2005), Chief Administrative Officer (2002-2004), and Chief Financial Officer of FMR Co. (1998-2000). Mr. Jonas has been with Fidelity Investments since 1987 and has held various financial and management positions including Chief Financial Officer of FMR. In addition, he serves on the Boards of Boston Ballet (2003-present) and Simmons College (2003-present). |
Robert L. Reynolds (53) |
| Year of Election or Appointment: 2003 Mr. Reynolds is a Director (2003-present) and Chief Operating Officer (2002-present) of FMR Corp. He also serves on the Board at Fidelity Investments Canada, Ltd. (2000-present). Previously, Mr. Reynolds served as President of Fidelity Investments Institutional Retirement Group (1996-2000). |
* Trustees have been determined to be "Interested Trustees" by virtue of, among other things, their affiliation with the trust or various entities under common control with FMR.
** Edward C. Johnson 3d, Trustee, is Abigail P. Johnson's father.
Annual Report
Independent Trustees:
Correspondence intended for each Independent Trustee (that is, the Trustees other than the Interested Trustees) may be sent to Fidelity Investments, P.O. Box 55235, Boston, Massachusetts 02205-5235.
Name, Age; Principal Occupation |
Dennis J. Dirks (57) |
| Year of Election or Appointment: 2005 Prior to his retirement in May 2003, Mr. Dirks was Chief Operating Officer and a member of the Board of The Depository Trust & Clearing Corporation (DTCC) (1999-2003). He also served as President, Chief Operating Officer, and Board member of The Depository Trust Company (DTC) (1999-2003) and President and Board member of the National Securities Clearing Corporation (NSCC) (1999-2003). In addition, Mr. Dirks served as Chief Executive Officer and Board member of the Government Securities Clearing Corporation (2001-2003) and Chief Executive Officer and Board member of the Mortgage-Backed Securities Clearing Corporation (2001-2003). Mr. Dirks also serves as a Trustee of Manhattan College (2005-present). |
Robert M. Gates (61) |
| Year of Election or Appointment: 1997 Dr. Gates is Vice Chairman of the Independent Trustees (2005-present). Dr. Gates is President of Texas A&M University (2002-present). He was Director of the Central Intelligence Agency (CIA) from 1991 to 1993. From 1989 to 1991, Dr. Gates served as Assistant to the President of the United States and Deputy National Security Advisor. Dr. Gates is a Director of NACCO Industries, Inc. (mining and manufacturing), Parker Drilling Co., Inc. (drilling and rental tools for the energy industry, 2001-present), and Brinker International (restaurant management, 2003-present). Previously, Dr. Gates served as a Director of LucasVarity PLC (automotive components and diesel engines), a Director of TRW Inc. (automotive, space, defense, and information technology), and Dean of the George Bush School of Government and Public Service at Texas A&M University (1999-2001). Dr. Gates also is a Trustee of the Forum for International Policy. |
George H. Heilmeier (69) |
| Year of Election or Appointment: 2004 Dr. Heilmeier is Chairman Emeritus of Telcordia Technologies (communication software and systems), where prior to his retirement, he served as company Chairman and Chief Executive Officer. He currently serves on the Boards of Directors of The Mitre Corporation (systems engineering and information technology support for the government), and HRL Laboratories (private research and development, 2004-present). He is Chairman of the General Motors Science & Technology Advisory Board and a Life Fellow of the Institute of Electrical and Electronics Engineers (IEEE) (2000-present). Dr. Heilmeier is a member of the Defense Science Board and the National Security Agency Advisory Board. He is also a member of the National Academy of Engineering, the American Academy of Arts and Sciences, and the Board of Overseers of the School of Engineering and Applied Science of the University of Pennsylvania. Previously, Dr. Heilmeier served as a Director of TRW Inc. (automotive, space, defense, and information technology, 1992-2002), Compaq (1994-2002), Automatic Data Processing, Inc. (ADP) (technology-based business outsourcing, 1995-2002), INET Technologies Inc. (telecommunications network surveillance, 2001-2004), and Teletech Holdings (customer management services). He is the recipient of the 2005 Kyoto Prize in Advanced Technology for his invention of the liquid display. |
Marie L. Knowles (58) |
| Year of Election or Appointment: 2001 Prior to Ms. Knowles' retirement in June 2000, she served as Executive Vice President and Chief Financial Officer of Atlantic Richfield Company (ARCO) (diversified energy, 1996-2000). From 1993 to 1996, she was a Senior Vice President of ARCO and President of ARCO Transportation Company. She served as a Director of ARCO from 1996 to 1998. She currently serves as a Director of Phelps Dodge Corporation (copper mining and manufacturing) and McKesson Corporation (healthcare service, 2002-present). Ms. Knowles is a Trustee of the Brookings Institution and the Catalina Island Conservancy and also serves as a member of the Advisory Board for the School of Engineering of the University of Southern California. |
Ned C. Lautenbach (61) |
| Year of Election or Appointment: 2000 Mr. Lautenbach has been a partner of Clayton, Dubilier & Rice, Inc. (private equity investment firm) since September 1998. Previously, Mr. Lautenbach was with the International Business Machines Corporation (IBM) from 1968 until his retirement in 1998. Mr. Lautenbach serves as a Director of Italtel Holding S.p.A. (telecommunications (Milan, Italy), 2004-present) and Eaton Corporation (diversified industrial) as well as the Philharmonic Center for the Arts in Naples, Florida. He also is a member of the Board of Trustees of Fairfield University (2005-present), as well as a member of the Council on Foreign Relations. |
Marvin L. Mann (72) |
| Year of Election or Appointment: 1993 Mr. Mann is Chairman of the Independent Trustees (2001-present). He is Chairman Emeritus of Lexmark International, Inc. (computer peripherals), where he served as CEO until April 1998, retired as Chairman May 1999, and remains a member of the Board. Prior to 1991, he held the positions of Vice President of International Business Machines Corporation (IBM) and President and General Manager of various IBM divisions and subsidiaries. He is a member of the Executive Committee of the Independent Director's Council of the Investment Company Institute. In addition, Mr. Mann is a member of the President's Cabinet at the University of Alabama and the Board of Visitors of the Culverhouse College of Commerce and Business Administration at the University of Alabama. |
William O. McCoy (71) |
| Year of Election or Appointment: 1997 Prior to his retirement in December 1994, Mr. McCoy was Vice Chairman of the Board of BellSouth Corporation (telecommunications) and President of BellSouth Enterprises. He is currently a Director of Liberty Corporation (holding company), Duke Realty Corporation (real estate), and Progress Energy, Inc. (electric utility). He is also a partner of Franklin Street Partners (private investment management firm) and a member of the Research Triangle Foundation Board. In addition, Mr. McCoy served as the Interim Chancellor (1999-2000) and a member of the Board of Visitors for the University of North Carolina at Chapel Hill and currently serves on the Board of Directors of the University of North Carolina Health Care System and the Board of Visitors of the Kenan-Flagler Business School (University of North Carolina at Chapel Hill). He also served as Vice President of Finance for the University of North Carolina (16-school system). |
Cornelia M. Small (61) |
| Year of Election or Appointment: 2005 Ms. Small is a member (2000-present) and Chairperson (2002-present) of the Investment Committee, and a member (2002-present) of the Board of Trustees of Smith College. Previously, she served as Chief Investment Officer (1999-2000), Director of Global Equity Investments (1996-1999), and a member of the Board of Directors of Scudder, Stevens & Clark (1990-1997) and Scudder Kemper Investments (1997-1998). In addition, Ms. Small served as Co-Chair (2000-2003) of the Annual Fund for the Fletcher School of Law and Diplomacy. |
William S. Stavropoulos (66) |
| Year of Election or Appointment: 2001 Mr. Stavropoulos is Chairman of the Board (2000-present) and a Member of the Board of Directors of The Dow Chemical Company. Since joining The Dow Chemical Company in 1967, Mr. Stavropoulos served in numerous senior management positions, including President (1993-2000; 2002-2003), CEO (1995-2000; 2002-2004), and Chairman of the Executive Committee (2000-2004). Currently, he is a Director of NCR Corporation (data warehousing and technology solutions), BellSouth Corporation (telecommunications), Chemical Financial Corporation, Maersk Inc. (industrial conglomerate, 2002-present), and Metalmark Capital (private equity investment firm, 2005-present). He also serves as a member of the Board of Trustees of the American Enterprise Institute for Public Policy Research. In addition, Mr. Stavropoulos is a member of The Business Council, J.P. Morgan International Council and the University of Notre Dame Advisory Council for the College of Science. |
Kenneth L. Wolfe (66) |
| Year of Election or Appointment: 2005 Mr. Wolfe also serves as a Trustee (2005-present) or Member of the Advisory Board (2004-present) of other investment companies advised by FMR. Prior to his retirement in 2001, Mr. Wolfe was Chairman and Chief Executive Officer of Hershey Foods Corporation (1993-2001). He currently serves as a member of the boards of Adelphia Communications Corporation (2003-present), Bausch & Lomb, Inc., and Revlon Inc. (2004-present). |
Annual Report
Advisory Board Members and Executive Officers:
Correspondence intended for Mr. Gamper may be sent to Fidelity Investments, P.O. Box 55235, Boston, Massachusetts 02205-5235. Correspondence intended for each executive officer and Mr. Lynch may be sent to Fidelity Investments, 82 Devonshire Street, Boston, Massachusetts 02109.
Name, Age; Principal Occupation |
Albert R. Gamper, Jr. (63) |
| Year of Election or Appointment: 2005 Member of the Advisory Board of Fidelity Income Fund. Prior to his retirement in December 2004, Mr. Gamper served as Chairman of the Board of CIT Group Inc. (commercial finance). During his tenure with CIT Group Inc. Mr. Gamper served in numerous senior management positions, including Chairman (1987-1989; 1999-2001; 2002-2004), Chief Executive Officer (1987-2004), and President (1989-2002). He currently serves as a member of the Board of Directors of Public Service Enterprise Group (utilities, 2001-present), Chairman of the Board of Governors, Rutgers University (2004-present), and Chairman of the Board of Saint Barnabas Health Care System. |
Peter S. Lynch (61) |
| Year of Election or Appointment: 2003 Member of the Advisory Board of Fidelity Income Fund. Vice Chairman and a Director of FMR, and Vice Chairman (2001-present) and a Director (2000-present) of FMR Co., Inc. Previously, Mr. Lynch served as a Trustee of the Fidelity funds (1990-2003). In addition, he serves as a Trustee of Boston College, Massachusetts Eye & Ear Infirmary, Historic Deerfield, John F. Kennedy Library, and the Museum of Fine Arts of Boston. |
Walter C. Donovan (43) |
| Year of Election or Appointment: 2005 Vice President of the fund. Mr. Donovan also serves as Vice President of Fidelity's High Income Funds (2005-present), Fidelity's Fixed-Income Funds (2005-present), certain Asset Allocation Funds (2005-present), and certain Balanced Funds (2005-present). Mr. Donovan also serves as Executive Vice President of FMR (2005-present) and FMRC (2005-present). Previously, Mr. Donovan served as Vice President and Director of Fidelity's International Equity Trading group (1998-2005). |
David L. Murphy (57) |
| Year of Election or Appointment: 2005 Vice President of the fund. Mr. Murphy also serves as Vice President of Fidelity's Money Market Funds (2002-present), certain Asset Allocation Funds (2003-present), Fidelity's Investment Grade-Bond Funds (2005-present), and Fidelity's Balanced Funds (2005-present). He serves as Senior Vice President (2000-present) and Head (2004-present) of the Fidelity Investments Fixed Income Division. Mr. Murphy is also a Senior Vice President of FIMM (2003-present) and a Vice President of FMR (2000-present). Previously, Mr. Murphy served as Money Market Group Leader (2002-2004), Bond Group Leader (2000-2002), and Vice President of Fidelity's Taxable Bond Funds (2000-2002) and Fidelity's Municipal Bond Funds (2001-2002). Mr. Murphy joined Fidelity Investments in 1989 as a portfolio manager in the Bond Group. |
Thomas J. Silvia (44) |
| Year of Election or Appointment: 2005 Vice President of the fund. Mr. Silvia also serves as Vice President of Fidelity's Bond Funds (2005-present) and Senior Vice President and Bond Group Leader of the Fidelity Investments Fixed-Income Division (2005-present). Previously, Mr. Silvia served as Director of Fidelity's Taxable Bond portfolio managers (2002-2004) and a portfolio manager in the Bond Group (1997-2004). |
Andrew J. Dudley (41) |
| Year of Election or Appointment: 2002 Vice President of the fund. Mr. Dudley also serves as Vice President of other funds advised by FMR. Prior to assuming his current responsibilities, Mr. Dudley managed a variety of Fidelity funds. |
Eric D. Roiter (56) |
| Year of Election or Appointment: 2004 Secretary of the fund. He also serves as Secretary of other Fidelity funds; Vice President, General Counsel, and Secretary of FMR Co., Inc. (2001-present) and FMR; Assistant Secretary of Fidelity Management & Research (U.K.) Inc. (2001-present), Fidelity Management & Research (Far East) Inc. (2001-present), and Fidelity Investments Money Management, Inc. (2001-present). Mr. Roiter is an Adjunct Member, Faculty of Law, at Boston College Law School (2003-present). Previously, Mr. Roiter served as Vice President and Secretary of Fidelity Distributors Corporation (FDC) (1998-2005). |
Stuart Fross (45) |
| Year of Election or Appointment: 2004 Assistant Secretary of the fund. Mr. Fross also serves as Assistant Secretary of other Fidelity funds (2003-present), Vice President and Secretary of FDC (2005-present), and is an employee of FMR. |
Christine Reynolds (46) |
| Year of Election or Appointment: 2004 President, Treasurer, and Anti-Money Laundering (AML) officer of the fund. Ms. Reynolds also serves as President, Treasurer, and AML officer of other Fidelity funds (2004) and is a Vice President (2003) and an employee (2002) of FMR. Before joining Fidelity Investments, Ms. Reynolds worked at PricewaterhouseCoopers LLP (PwC) (1980-2002), where she was most recently an audit partner with PwC's investment management practice. |
Timothy F. Hayes (54) |
| Year of Election or Appointment: 2004 Chief Financial Officer of the fund. Mr. Hayes also serves as Chief Financial Officer of other Fidelity funds (2002-present) and President of Fidelity Investment Operations (2005-present) which includes Fidelity Pricing and Cash Management Services Group (FPCMS), where he served as President (1998-2005). Mr. Hayes serves as President of Fidelity Service Company (2003-present) where he also serves as a Director. Mr. Hayes also served as President of Fidelity Investments Operations Group (FIOG, 2002-2005). |
Kenneth A. Rathgeber (58) |
| Year of Election or Appointment: 2004 Chief Compliance Officer of the fund. Mr. Rathgeber also serves as Chief Compliance Officer of other Fidelity funds (2004) and Executive Vice President of Risk Oversight for Fidelity Investments (2002). Previously, he served as Executive Vice President and Chief Operating Officer for Fidelity Investments Institutional Services Company, Inc. (1998-2002). |
John R. Hebble (47) |
| Year of Election or Appointment: 2004 Deputy Treasurer of the fund. Mr. Hebble also serves as Deputy Treasurer of other Fidelity funds (2003), and is an employee of FMR. Before joining Fidelity Investments, Mr. Hebble worked at Deutsche Asset Management where he served as Director of Fund Accounting (2002-2003) and Assistant Treasurer of the Scudder Funds (1998-2003). |
Bryan A. Mehrmann (44) |
| Year of Election or Appointment: 2005 Deputy Treasurer of the fund. Mr. Mehrmann also serves as Deputy Treasurer of other Fidelity funds (2005-present) and is an employee of FMR. Previously, Mr. Mehrmann served as Vice President of Fidelity Investments Institutional Services Group (FIIS)/Fidelity Investments Institutional Operations Corporation, Inc. (FIIOC) Client Services (1998-2004). |
Kimberley H. Monasterio (41) |
| Year of Election or Appointment: 2004 Deputy Treasurer of the fund. Ms. Monasterio also serves as Deputy Treasurer of other Fidelity funds (2004) and is an employee of FMR (2004). Before joining Fidelity Investments, Ms. Monasterio served as Treasurer (2000-2004) and Chief Financial Officer (2002-2004) of the Franklin Templeton Funds and Senior Vice President of Franklin Templeton Services, LLC (2000-2004). |
Kenneth B. Robins (35) |
| Year of Election or Appointment: 2005 Deputy Treasurer of the fund. Mr. Robins also serves as Deputy Treasurer of other Fidelity funds (2005-present) and is an employee of FMR (2004-present). Before joining Fidelity Investments, Mr. Robins worked at KPMG LLP, where he was a partner in KPMG's department of professional practice (2002-2004) and a Senior Manager (1999-2000). In addition, Mr. Robins served as Assistant Chief Accountant, United States Securities and Exchange Commission (2000-2002). |
Robert G. Byrnes (38) |
| Year of Election or Appointment: 2005 Assistant Treasurer of the fund. Mr. Byrnes also serves as Assistant Treasurer of other Fidelity funds (2005-present) and is an employee of FMR (2005-present). Previously, Mr. Byrnes served as Vice President of FPCMS (2003-2005). Before joining Fidelity Investments, Mr. Byrnes worked at Deutsche Asset Management where he served as Vice President of the Investment Operations Group (2000-2003). |
John H. Costello (58) |
| Year of Election or Appointment: 2004 Assistant Treasurer of the fund. Mr. Costello also serves as Assistant Treasurer of other Fidelity funds and is an employee of FMR. |
Peter L. Lydecker (51) |
| Year of Election or Appointment: 2004 Assistant Treasurer of the fund. Mr. Lydecker also serves as Assistant Treasurer of other Fidelity funds (2004) and is an employee of FMR. |
Mark Osterheld (50) |
| Year of Election or Appointment: 2004 Assistant Treasurer of the fund. Mr. Osterheld also serves as Assistant Treasurer of other Fidelity funds (2002) and is an employee of FMR. |
Gary W. Ryan (46) |
| Year of Election or Appointment: 2005 Assistant Treasurer of the fund. Mr. Ryan also serves as Assistant Treasurer of other Fidelity funds (2005-present) and is an employee of FMR (2005-present). Previously, Mr. Ryan served as Vice President of Fund Reporting in FPCMS (1999-2005). |
Salvatore Schiavone (39) |
| Year of Election or Appointment: 2005 Assistant Treasurer of the fund. Mr. Schiavone also serves as Assistant Treasurer of other Fidelity funds (2005-present) and is an employee of FMR (2005-present). Before joining Fidelity Investments, Mr. Schiavone worked at Deutsche Asset Management, where he most recently served as Assistant Treasurer (2003-2005) of the Scudder Funds and Vice President and Head of Fund Reporting (1996-2003). |
Annual Report
Distributions
The fund hereby designates as capital gain dividends: For dividends with respect to the taxable year ended July 31, 2005, $217,965, or, if subsequently determined to be different, the net capital gain of such year.
A total of 1.22% of the dividends distributed during the fiscal year was derived from interest on U.S. Government securities which is generally exempt from state income tax.
The fund will notify shareholders in January 2006 of amounts for use in preparing 2005 income tax returns.
Annual Report
Board Approval of Investment Advisory Contracts and Management Fees
Fidelity Ultra-Short Bond Fund
Each year, typically in June, the Board of Trustees, including the independent Trustees (together, the Board), votes on the renewal of the management contract and sub-advisory agreements (together, the Advisory Contracts) for the fund. The Board, assisted by the advice of fund counsel and independent Trustees' counsel, requests and considers a broad range of information throughout the year.
The Board meets regularly each month except August and takes into account throughout the year matters bearing on Advisory Contracts. The Board, acting directly and through its separate committees, considers at each of its meetings factors that are relevant to the annual renewal of the fund's Advisory Contracts, including the services and support provided to the fund and its shareholders by Fidelity. At the time of the renewal, the Board had 11 standing committees, each composed of independent Trustees with varying backgrounds, to which the Board has assigned specific subject matter responsibilities in order to enhance effective decision-making by the Board. Each committee has adopted a written charter outlining the structure and purposes of the committee. One such committee, the Fixed-Income Contract Committee, meets periodically during the first six months of each year and as necessary to consider matters specifically related to the annual renewal of Advisory Contracts. The committee requests and receives information on, and makes recommendations to the independent Trustees concerning, the approval and annual review of the Advisory Contracts.
At its June 2005 meeting, the Board of Trustees, including the independent Trustees, unanimously determined to renew the Advisory Contracts for the fund. In reaching its determination, the Board considered all factors it believed relevant, including (1) the nature, extent, and quality of the services to be provided to the fund and its shareholders by Fidelity (including the investment performance of the fund); (2) the competitiveness of the management fee and total expenses of the fund; (3) the total costs of the services to be provided by and the profits to be realized by the investment adviser and its affiliates from the relationship with the fund; (4) the extent to which economies of scale would be realized as the fund grows; and (5) whether fee levels reflect these economies of scale, if any, for the benefit of fund shareholders.
In determining whether to renew the Advisory Contracts for the fund, the Board ultimately reached a determination, with the assistance of fund counsel and independent Trustees' counsel, that the renewal of the Advisory Contracts and the compensation to be received by Fidelity under the management contract is consistent with Fidelity's fiduciary duty under applicable law. In addition to evaluating the specific factors noted above, the Board, in reaching its determination, is aware that shareholders in the fund have a broad range of investment choices available to them, including a wide choice among mutual funds offered by competitors to Fidelity, and that the fund's shareholders, with the opportunity to review and weigh the disclosure provided by the fund in its prospectus and other public disclosures, have chosen to invest in this fund, managed by Fidelity.
Annual Report
Nature, Extent, and Quality of Services Provided by Fidelity. The Board considered staffing within the investment adviser, FMR, and the sub-advisers (together, the Investment Advisers), including the background of the fund's portfolio manager and the fund's investment objective and discipline. The independent Trustees also had discussions with senior management of Fidelity's investment operations and investment groups. The Board considered the structure of the portfolio manager compensation program and whether this structure provides appropriate incentives.
Fidelity Resources Dedicated to Investment Management and Support Services. The Board reviewed the size, education, and experience of the Investment Advisers' investment staff, their use of technology, and the Investment Advisers' approach to recruiting, training, and retaining portfolio managers and other research, advisory, and management personnel. The Board considered Fidelity's extensive global research capabilities that enable the Investment Advisers to aggregate data from various sources in an effort to produce positive investment results. The Board noted that Fidelity's analysts have access to a variety of technological tools that enable them to perform both fundamental and quantitative analysis and to specialize in various disciplines. The Board also considered that Fidelity's portfolio managers and analysts have access to daily portfolio attribution that allows for monitoring of a fund's portfolio, as well as an electronic communication system that provides immediate real-time access to research concerning issuers and credit enhancers.
Shareholder and Administrative Services. The Board considered the nature, extent, quality, and cost of administrative, distribution, and shareholder services performed by the Investment Advisers and their affiliates under the Advisory Contracts and under separate agreements covering transfer agency, pricing and bookkeeping, and securities lending services for the fund. The Board also considered the nature and extent of the Investment Advisers' supervision of third party service providers, principally custodians and subcustodians. The Board reviewed the allocation of fund brokerage, including allocations to brokers affiliated with the Investment Advisers. The Board also considered the resources devoted to, and the record of compliance with, the fund's compliance policies and procedures.
The Board noted that the growth of fund assets across the complex allows Fidelity to reinvest in the development of services designed to enhance the value or convenience of the Fidelity funds as investment vehicles. These services include 24-hour access to account information and market information through phone representatives and over the Internet, and investor education materials and asset allocation tools.
Investment in a Large Fund Family. The Board considered the benefits to shareholders of investing in a Fidelity fund, including the benefits of investing in a fund that is part of a large family of funds offering a variety of investment disciplines and providing for a large variety of mutual fund investor services. For example, fund shareholders are offered the privilege of exchanging shares of the fund for shares of other Fidelity funds, as set forth in the fund's prospectus, without paying an additional sales charge. The Board noted that, since the last Advisory Contract renewals in June 2004, Fidelity has taken a number of actions that benefited particular funds, including (i) voluntarily deciding in 2004 to stop using "soft" commission dollars to pay for market data and, instead, to pay for that data out of its own resources, (ii) contractually agreeing to impose management fee reductions and expense limitations on its five Spartan stock index funds and its stock index fund available through variable insurance products, (iii) contractually agreeing to eliminate the management fees on the Fidelity Freedom Funds and the Fidelity Advisor Freedom Funds, (iv) contractually agreeing to reduce the management fees on most of its investment-grade taxable bond funds, and (v) contractually agreeing to impose expense limitations on its retail and Spartan investment-grade taxable bond funds.
Annual Report
Board Approval of Investment Advisory Contracts and
Management Fees - continued
Investment Performance. The Board considered whether the fund has operated within its investment objective, as well as its record of compliance with its investment restrictions. It also reviewed the fund's absolute investment performance, as well as the fund's relative investment performance measured against (i) a broad-based securities market index, and (ii) a peer group of mutual funds deemed appropriate by the Board. Because the fund had been in existence less than three calendar years, the following chart considered by the Board shows, for the one-year period ended December 31, 2004, the return of the retail class of the fund, the return of a broad-based securities market index ("benchmark"), and a range of returns of a peer group of mutual funds identified by Lipper Inc. as having an investment objective similar to that of the fund. The return of the retail class represents the performance of a class with the lowest 12b-1 fee (not necessarily with the lowest total expenses). (The Advisor classes of the fund, which have higher 12b-1 fees, had less than one year of performance as of December 31, 2004.) The box within the chart shows the 25th percentile return (bottom of box) and the 75th percentile return (top of box) of the Lipper peer group. The percentage beaten number noted below the chart corresponds to the percentile box and represents the percentage of funds in the Lipper peer group whose performance was equal to or lower than that of the retail class.
Annual Report
The Board noted that the relative investment performance of the retail class of the fund compared favorably to its Lipper peer group for the one-year period. The Board also noted that the relative investment performance of the retail class of the fund compared favorably to its benchmark for the one-year period.
Based on its review, and giving particular weight to the nature and quality of the resources dedicated by the Investment Advisers to maintain and improve relative performance, the Board concluded that the nature, extent, and quality of the services provided by Fidelity will benefit the fund's shareholders, particularly in light of the Board's view that the fund's shareholders benefit from investing in a fund that is part of a large family of funds offering a variety of investment disciplines and services.
Competitiveness of Management Fee and Total Fund Expenses. The Board considered the fund's management fee and total expenses compared to "mapped groups" of competitive funds and classes. Fidelity creates "mapped groups" by combining similar Lipper investment objective categories that have comparable management fee characteristics. Combining Lipper investment objective categories aids the Board's management fee and total expense comparisons by broadening the competitive group used for comparison and by reducing the number of universes to which various Fidelity funds are compared.
The Board considered two proprietary management fee comparisons for the 12-month (or shorter) periods shown in the chart below. The group of Lipper funds used by the Board for management fee comparisons is referred to below as the "Total Mapped Group" and, for the reasons explained above, is broader than the Lipper peer group used by the Board for performance comparisons. The Total Mapped Group comparison focuses on a fund's standing relative to the total universe of comparable funds available to investors, in terms of gross management fees before expense reimbursements or caps. "TMG %" represents the percentage of funds in the Total Mapped Group that had management fees that were lower than the fund's. For example, a TMG % of 35% would mean that 65% of the funds in the Total Mapped Group had higher management fees than the fund. The "Asset-Size Peer Group" (ASPG) comparison focuses on a fund's standing relative to non-Fidelity funds similar in size to the fund within the Total Mapped Group. The ASPG represents at least 15% of the funds in the Total Mapped Group with comparable asset size and management fee characteristics, subject to a minimum of 50 funds (or all funds in the Total Mapped Group if fewer than 50). Additional information, such as the ASPG quartile ("quadrant") in which the fund's management fee ranked, is also included in the chart and considered by the Board.
Annual Report
Board Approval of Investment Advisory Contracts and
Management Fees - continued
The Board noted that the fund's management fee ranked below the median of its Total Mapped Group and below the median of its ASPG for 2004.
Furthermore, the Board considered that, on May 19, 2005, after the periods shown in the chart above, it had approved an amendment (effective June 1, 2005) to the fund's management contract that lowered the fund's individual fund fee rate from 30 basis points to 20 basis points. The Board considered that, if the lower individual fund fee rate had been in effect in 2004, it would have reduced the fund's management fee rate from 43 basis points to 33 basis points.
Based on its review, the Board concluded that the fund's management fee was fair and reasonable in light of the services that the fund receives and the other factors considered.
Annual Report
In its review of each class's total expenses, the Board considered the fund's management fee as well as other fund or class expenses, as applicable, such as transfer agent fees, pricing and bookkeeping fees, fund-paid 12b-1 fees, and custodial, legal, and audit fees. The Board also noted the effects of any waivers and reimbursements on fees and expenses. As part of its review, the Board also considered current and historical total expenses of each class of the fund compared to competitive fund median expenses. Each class of the fund is compared to those funds and classes in the Total Mapped Group (used by the Board for management fee comparisons) that have a similar sales load structure.
The Board noted that the total expenses of each of Class A, Class T, and Fidelity Ultra-Short Bond Fund (retail class) ranked below its competitive median for 2004, and the total expenses of Institutional Class ranked above its competitive median for 2004. The Board noted that the fund offers multiple classes, each of which has a different sales load and 12b-1 fee structure, and that the multiple structures are intended to offer a range of pricing options for the intermediary market. The Board also noted that the total expenses of the classes vary primarily by the level of their 12b-1 fees, although differences in transfer agent fees may also cause expenses to vary from class to class. The Board considered that if the lower individual fund fee rate had been in effect in 2004, it would have reduced each class's total expenses by 10 basis points and the total expenses of Institutional Class would have ranked below the median.
The Board also considered that on May 19, 2005, it had approved changes (effective June 1, 2005) in the contractual arrangements for the fund that (i) have the effect of setting the total "fund-level" expenses (including, among certain other expenses, the management fee) for each class at 35 basis points, (ii) lower and limit the "class-level" transfer agent fee for Fidelity Ultra-Short Bond Fund (retail class) to 10 basis points, and (iii) limit the total expenses for Fidelity Ultra-Short Bond Fund (retail class) to 45 basis points. These new contractual arrangements may not be increased without Board approval. The fund's Advisor classes continue to be subject to different class-level expenses (transfer agent fees and 12b-1 fees).
The Board recognized that the fund's management contract incorporates a "group fee" structure, which provides for lower fee rates as total fund assets under FMR's management increase, and for higher fee rates as total fund assets under FMR's management decrease. The Board noted that because the new contractual arrangements set the total fund-level expenses for each class at 35 basis points, increases or decreases in the management fee due to changes in the group fee rate will not impact total expenses. However, the Board realized that the 35 basis point fee rate was below the lowest management fee available under the old contractual arrangements. The maximum benefit that a decrease in the group fee rate could provide the fund would be a reduction in the management fee to approximately 39 basis points (compared to total fund-level expenses of 35 basis points under the new contractual arrangements).
Annual Report
Board Approval of Investment Advisory Contracts and
Management Fees - continued
In its review of total expenses, the Board also considered Fidelity fee structures and other information on clients that FMR and its affiliates service in other competitive markets, such as other mutual funds advised or subadvised by FMR or its affiliates, pension plan clients, and other institutional clients.
Based on its review, the Board concluded that the total expenses for each class of the fund were reasonable, although in one case above the median of the universe presented for comparison, in light of the services that the fund and its shareholders receive and the other factors considered.
Costs of the Services and Profitability. The Board considered the revenues earned and the expenses incurred by Fidelity in conducting the business of developing, marketing, distributing, managing, administering and servicing the fund and its shareholders. The Board also considered the level of Fidelity's profits in respect of all the Fidelity funds.
On an annual basis, FMR presents to the Board Fidelity's profitability for the fund. Fidelity calculates the profitability for each fund, as well as aggregate profitability for groups of Fidelity funds and all Fidelity funds, using a series of detailed revenue and cost allocation methodologies which originate with the audited books and records of Fidelity. The Audit Committee of the Board reviews any significant changes from the prior year's methodologies.
PricewaterhouseCoopers LLP (PwC), independent registered accounting firm and auditor to Fidelity and certain Fidelity funds, has been engaged annually by the Board as part of the Board's assessment of the results of Fidelity's profitability analysis. PwC's engagement includes the review and assessment of Fidelity's methodologies used in determining the revenues and expenses attributable to Fidelity's mutual fund business, and completion of agreed-upon procedures surrounding the mathematical accuracy of fund profitability and its conformity to allocation methodologies. After considering PwC's reports issued under the engagement and information provided by Fidelity, the Board believes that while other allocation methods may also be reasonable, Fidelity's profitability methodologies are reasonable in all material respects.
The Board has also reviewed Fidelity's non-fund businesses and any fall-out benefits related to the mutual fund business as well as cases where Fidelity's affiliates may benefit from or be related to the fund's business. In addition, a special committee of the Board reviewed services provided to Fidelity by its affiliates and determined that the fees that Fidelity paid for such services were reasonable.
The Board considered the costs of the services provided by and the profits realized by Fidelity in connection with the operation of the fund and determined that the amount of profit is a fair entrepreneurial profit for the management of the fund.
Annual Report
Economies of Scale. The Board considered whether there have been economies of scale in respect of the management of the Fidelity funds, whether the Fidelity funds (including the fund) have appropriately benefited from any such economies of scale, and whether there is potential for realization of any further economies of scale. The Board considered the extent to which the fund will benefit from economies of scale through increased services to the fund, through waivers or reimbursements, or through fee or expense reductions, including (Advisor classes only) reductions that occur through operation of the transfer agent agreement. The transfer agent fee varies in part based on the number of accounts in the fund. If the number of accounts decreases or the average account size increases, the overall transfer agent fee rate decreases. The Board also noted that the reduction in the fund's management fee rate from 43 basis points to 33 basis points and the reduction in each class's total expenses by 10 basis points would deliver significant economies to fund shareholders. The Board concluded that any potential economies of scale are being shared between fund shareholders and Fidelity in an appropriate manner.
Additional Information Requested by the Board. In order to develop fully the factual basis for consideration of the Advisory Contracts, the Board requested additional information regarding (i) Fidelity's fund profitability methodology, including additional detail on various cost allocations; (ii) fall-out benefits to Fidelity; and (iii) compensation of portfolio managers and research analysts.
Based on its evaluation of all of the conclusions noted above, and after considering all material factors, the Board ultimately concluded that the existing advisory fee structures are fair and reasonable, and that the fund's existing Advisory Contracts should be renewed.
Annual Report
The following is a complete listing of investments for Fidelity's
fixed-income central fund as of July 31, 2005 which is a direct
or indirect investment of Fidelity Ultra-Short Bond Fund.
These underlying holdings of the Fidelity fixed-income central fund are not included in the Schedule of Investments as part of the Financial Statements.
Annual Report
Fidelity Ultra-Short Central Fund
Investments July 31, 2005 (Unaudited)
Showing Percentage of Net Assets
Nonconvertible Bonds - 3.8% |
| Principal Amount | | Value |
CONSUMER DISCRETIONARY - 1.0% |
Auto Components - 0.3% |
DaimlerChrysler NA Holding Corp.: | | | | |
3.8594% 9/10/07 (f) | | $ 16,665,000 | | $ 16,698,830 |
3.8938% 5/24/06 (f) | | 4,700,000 | | 4,713,691 |
| | 21,412,521 |
Media - 0.7% |
Continental Cablevision, Inc. 8.3% 5/15/06 | | 8,000,000 | | 8,248,640 |
Cox Communications, Inc. (Reg. S) 3.95% 12/14/07 (f) | | 12,140,000 | | 12,202,691 |
Liberty Media Corp. 4.91% 9/17/06 (f) | | 16,694,000 | | 16,786,986 |
Univision Communications, Inc. 2.875% 10/15/06 | | 8,505,000 | | 8,315,339 |
| | 45,553,656 |
TOTAL CONSUMER DISCRETIONARY | | 66,966,177 |
ENERGY - 0.2% |
Oil, Gas & Consumable Fuels - 0.2% |
Valero Energy Corp. 7.375% 3/15/06 | | 11,550,000 | | 11,735,435 |
FINANCIALS - 1.0% |
Capital Markets - 0.1% |
State Street Capital Trust II 3.7681% 2/15/08 (f) | | 10,000,000 | | 10,002,260 |
Commercial Banks - 0.3% |
Wells Fargo & Co. 3.4194% 3/10/08 (f) | | 16,600,000 | | 16,599,452 |
Consumer Finance - 0.2% |
General Motors Acceptance Corp. 4.87% 10/20/05 (f) | | 14,765,000 | | 14,786,188 |
Thrifts & Mortgage Finance - 0.4% |
Countrywide Financial Corp. 3.71% 4/11/07 (f) | | 11,025,000 | | 11,032,034 |
Residential Capital Corp. 4.835% 6/29/07 (c)(f) | | 14,150,000 | | 14,164,716 |
| | 25,196,750 |
TOTAL FINANCIALS | | 66,584,650 |
TELECOMMUNICATION SERVICES - 1.3% |
Diversified Telecommunication Services - 1.2% |
British Telecommunications PLC 7.875% 12/15/05 | | 18,145,000 | | 18,397,070 |
France Telecom SA 7.45% 3/1/06 (a) | | 5,600,000 | | 5,699,484 |
GTE Corp. 6.36% 4/15/06 | | 9,000,000 | | 9,126,405 |
SBC Communications, Inc. 4.389% 6/5/06 (c) | | 15,315,000 | | 15,319,595 |
Sprint Capital Corp. 4.78% 8/17/06 | | 6,000,000 | | 6,020,550 |
Telefonica Europe BV 7.35% 9/15/05 | | 4,500,000 | | 4,517,537 |
Nonconvertible Bonds - continued |
| Principal Amount | | Value |
TELECOMMUNICATION SERVICES - continued |
Diversified Telecommunication Services - continued |
Telefonos de Mexico SA de CV 4.5% 11/19/08 | | $ 10,240,000 | | $ 10,092,268 |
TELUS Corp. yankee 7.5% 6/1/07 | | 6,500,000 | | 6,835,569 |
| | 76,008,478 |
Wireless Telecommunication Services - 0.1% |
AT&T Wireless Services, Inc. 7.35% 3/1/06 | | 5,500,000 | | 5,596,976 |
TOTAL TELECOMMUNICATION SERVICES | | 81,605,454 |
UTILITIES - 0.3% |
Electric Utilities - 0.2% |
Pinnacle West Energy Corp. 4.0044% 4/1/07 (c)(f) | | 12,800,000 | | 12,800,794 |
Gas Utilities - 0.1% |
NiSource Finance Corp. 7.625% 11/15/05 | | 9,250,000 | | 9,342,213 |
TOTAL UTILITIES | | 22,143,007 |
TOTAL NONCONVERTIBLE BONDS (Cost $249,397,779) | 249,034,723 |
U.S. Government Agency Obligations - 0.0% |
|
Fannie Mae 0% 9/28/05 (e)
(Cost $994,579) | | 1,000,000 | | 994,635 |
Asset-Backed Securities - 35.2% |
|
Accredited Mortgage Loan Trust: | | | | |
Series 2004-2 Class A2, 3.76% 7/25/34 (f) | | 7,964,683 | | 7,978,722 |
Series 2004-3 Class 2A4, 3.81% 10/25/34 (f) | | 10,915,000 | | 10,946,584 |
Series 2004-4 Class A2D, 3.81% 1/25/35 (f) | | 3,579,364 | | 3,588,366 |
Series 2005-1: | | | | |
Class M1, 3.93% 4/25/35 (f) | | 11,280,000 | | 11,251,882 |
Class M2, 4.15% 4/25/35 (f) | | 5,275,000 | | 5,276,901 |
ACE Securities Corp.: | | | | |
Series 2002-HE1 Class M1, 4.11% 6/25/32 (f) | | 1,308,761 | | 1,318,432 |
Series 2002-HE2 Class M1, 4.31% 8/25/32 (f) | | 18,631,213 | | 18,704,611 |
Series 2003-FM1 Class M2, 5.31% 11/25/32 (f) | | 3,015,000 | | 3,050,466 |
Series 2003-HS1: | | | | |
Class M1, 4.21% 6/25/33 (f) | | 800,000 | | 803,485 |
Class M2, 5.21% 6/25/33 (f) | | 856,000 | | 871,093 |
Asset-Backed Securities - continued |
| Principal Amount | | Value |
ACE Securities Corp.: - continued | | | | |
Series 2003-NC1 Class M1, 4.24% 7/25/33 (f) | | $ 1,600,000 | | $ 1,611,660 |
Series 2004-HE1: | | | | |
Class M1, 3.96% 2/25/34 (f) | | 2,193,000 | | 2,193,772 |
Class M2, 4.56% 2/25/34 (f) | | 2,475,000 | | 2,476,241 |
Series 2004-OP1: | | | | |
Class M1, 3.98% 4/25/34 (f) | | 4,420,000 | | 4,424,344 |
Class M2, 4.51% 4/25/34 (f) | | 6,240,000 | | 6,251,080 |
Series 2005-HE2: | | | | |
Class M1, 3.9% 4/25/35 (f) | | 1,530,000 | | 1,527,965 |
Class M2, 3.91% 4/25/35 (f) | | 1,803,000 | | 1,796,836 |
Class M3, 3.94% 4/25/35 (f) | | 1,040,000 | | 1,038,647 |
Class M4, 4.1% 4/25/35 (f) | | 1,340,000 | | 1,338,268 |
Series 2005-HE3: | | | | |
Class A2A, 3.56% 5/25/35 (f) | | 8,063,511 | | 8,063,822 |
Class A2B, 3.67% 5/25/35 (f) | | 4,370,000 | | 4,366,352 |
Series 2005-SD1 Class A1, 3.86% 11/25/50 (f) | | 2,563,309 | | 2,566,464 |
Aesop Funding II LLC Series 2005-1A Class A2, 3.49% 4/20/09 (c)(f) | | 8,800,000 | | 8,765,680 |
American Express Credit Account Master Trust: | | | | |
Series 2002-6 Class B, 3.8381% 3/15/10 (f) | | 5,000,000 | | 5,030,751 |
Series 2004-1 Class B, 3.6381% 9/15/11 (f) | | 5,775,000 | | 5,797,723 |
Series 2004-C Class C, 3.8881% 2/15/12 (c)(f) | | 17,323,520 | | 17,374,643 |
Series 2005-1 Class A, 3.4181% 10/15/12 (f) | | 15,455,000 | | 15,481,600 |
AmeriCredit Automobile Receivables Trust: | | | | |
Series 2002-EM Class A4A, 3.67% 6/8/09 | | 25,000,000 | | 24,899,223 |
Series 2003-AM: | | | | |
Class A3B, 3.71% 6/6/07 (f) | | 685,806 | | 685,879 |
Class A4B, 3.81% 11/6/09 (f) | | 12,400,000 | | 12,441,657 |
Series 2003-BX Class A4B, 3.72% 1/6/10 (f) | | 3,265,000 | | 3,275,694 |
Series 2003-CF Class A3, 2.75% 10/9/07 | | 12,249,371 | | 12,210,791 |
Series 2005-1 Class C, 4.73% 7/6/10 | | 15,500,000 | | 15,451,950 |
Ameriquest Mortgage Securities, Inc.: | | | | |
Series 2002-3 Class M1, 4.16% 8/25/32 (f) | | 5,000,000 | | 5,028,248 |
Series 2003-1: | | | | |
Class A2, 3.87% 2/25/33 (f) | | 465,695 | | 465,917 |
Class M1, 4.36% 2/25/33 (f) | | 6,150,000 | | 6,197,846 |
Series 2003-3: | | | | |
Class M1, 4.26% 3/25/33 (f) | | 1,590,000 | | 1,603,481 |
Class S, 5% 9/25/05 (g) | | 4,457,447 | | 17,215 |
Series 2003-6: | | | | |
Class M1, 4.22% 8/25/33 (f) | | 7,560,000 | | 7,611,224 |
Asset-Backed Securities - continued |
| Principal Amount | | Value |
Ameriquest Mortgage Securities, Inc.: - continued | | | | |
Series 2003-6: | | | | |
Class M2, 5.31% 5/25/33 (f) | | $ 2,750,000 | | $ 2,808,476 |
Series 2003-AR1 Class M1, 4.61% 1/25/33 (f) | | 7,000,000 | | 7,072,631 |
Series 2004-R2: | | | | |
Class M1, 3.89% 4/25/34 (f) | | 1,230,000 | | 1,229,949 |
Class M2, 3.94% 4/25/34 (f) | | 950,000 | | 949,960 |
Class M3, 4.01% 4/25/34 (f) | | 3,500,000 | | 3,499,854 |
Class M4, 4.51% 4/25/34 (f) | | 4,500,000 | | 4,499,807 |
Series 2004-R9 Class A3, 3.78% 10/25/34 (f) | | 9,340,000 | | 9,359,871 |
Series 2005-R1: | | | | |
Class M1, 3.91% 3/25/35 (f) | | 5,710,000 | | 5,691,308 |
Class M2, 3.94% 3/25/35 (f) | | 1,925,000 | | 1,918,868 |
Series 2005-R2 Class M1, 3.91% 4/25/35 (f) | | 12,500,000 | | 12,482,516 |
Amortizing Residential Collateral Trust: | | | | |
Series 2002-BC3 Class A, 3.79% 6/25/32 (f) | | 2,411,175 | | 2,418,495 |
Series 2002-BC6 Class M1, 4.21% 8/25/32 (f) | | 24,900,000 | | 25,116,817 |
Series 2002-BC7: | | | | |
Class M1, 4.1144% 10/25/32 (f) | | 10,000,000 | | 10,075,000 |
Class M2, 4.36% 10/25/32 (f) | | 5,575,000 | | 5,612,067 |
Series 2003-BC1 Class M2, 4.56% 1/25/32 (f) | | 758,836 | | 762,333 |
ARG Funding Corp.: | | | | |
Series 2005-1A Class A2, 3.53% 4/20/09 (c)(f) | | 11,000,000 | | 10,975,938 |
Series 2005-2A Class A2, 3.54% 5/20/09 (c)(f) | | 5,200,000 | | 5,190,453 |
Argent Securities, Inc.: | | | | |
Series 2003-W3 Class M2, 5.26% 9/25/33 (f) | | 20,000,000 | | 20,599,990 |
Series 2003-W7 Class A2, 3.85% 3/1/34 (f) | | 4,505,856 | | 4,515,756 |
Series 2004-W5 Class M1, 4.06% 4/25/34 (f) | | 3,960,000 | | 3,964,768 |
Series 2004-W7: | | | | |
Class M1, 4.01% 5/25/34 (f) | | 4,085,000 | | 4,084,827 |
Class M2, 4.06% 5/25/34 (f) | | 3,320,000 | | 3,319,860 |
Asset Backed Securities Corp. Home Equity Loan Trust: | | | | |
Series 2003-HE2: | | | | |
Class A2, 3.7681% 4/15/33 (f) | | 1,158,706 | | 1,159,186 |
Class M1, 4.2881% 4/15/33 (f) | | 11,365,000 | | 11,429,103 |
Series 2003-HE3: | | | | |
Class M1, 4.2181% 6/15/33 (f) | | 2,185,000 | | 2,198,827 |
Class M2, 5.3881% 6/15/33 (f) | | 10,000,000 | | 10,182,465 |
Series 2003-HE4 Class M2, 5.3881% 8/15/33 (f) | | 5,695,000 | | 5,798,650 |
Series 2003-HE5 Class A2A, 3.7481% 8/15/33 (f) | | 1,380,797 | | 1,381,390 |
Series 2003-HE6 Class M1, 4.11% 11/25/33 (f) | | 3,475,000 | | 3,490,373 |
Series 2004-HE2 Class M1, 4.01% 4/25/34 (f) | | 6,060,000 | | 6,070,769 |
Series 2004-HE3: | | | | |
Class M1, 4% 6/25/34 (f) | | 1,450,000 | | 1,454,353 |
Asset-Backed Securities - continued |
| Principal Amount | | Value |
Asset Backed Securities Corp. Home Equity Loan Trust: - continued | | | | |
Series 2004-HE3: | | | | |
Class M2, 4.58% 6/25/34 (f) | | $ 3,350,000 | | $ 3,386,297 |
Series 2004-HE6 Class A2, 3.82% 6/25/34 (f) | | 17,398,791 | | 17,435,568 |
Series 2005-HE2: | | | | |
Class M1, 3.91% 3/25/35 (f) | | 8,250,000 | | 8,235,989 |
Class M2, 3.96% 3/25/35 (f) | | 2,065,000 | | 2,065,671 |
Series 2005-HE6 Class A2B, 3.76% 8/25/35 (d)(f) | | 10,000,000 | | 10,000,000 |
Bank One Issuance Trust: | | | | |
Series 2002-B1 Class B1, 3.7681% 12/15/09 (f) | | 20,655,000 | | 20,741,067 |
Series 2002-B2 Class B2, 3.7281% 5/15/08 (f) | | 15,000,000 | | 15,001,929 |
Series 2002-B3 Class B, 3.7481% 8/15/08 (f) | | 14,500,000 | | 14,505,871 |
Series 2002-C1 Class C1, 4.3481% 12/15/09 (f) | | 7,980,000 | | 8,065,464 |
Series 2002-C2 Class C2, 4.3781% 5/15/08 (f) | | 35,785,000 | | 35,817,626 |
Bayview Financial Acquisition Trust Series 2004-C Class A1, 3.9013% 5/28/44 (f) | | 8,416,440 | | 8,415,509 |
Bayview Financial Asset Trust Series 2000-F Class A, 3.9813% 9/28/43 (f) | | 9,618,786 | | 9,632,318 |
Bayview Financial Mortgage Loan Trust Series 2004-A Class A, 3.9313% 2/28/44 (f) | | 5,760,012 | | 5,771,599 |
Bear Stearns Asset Backed Securities I: | | | | |
Series 2005-HE2: | | | | |
Class M1, 3.96% 2/25/35 (f) | | 6,655,000 | | 6,639,262 |
Class M2, 4.21% 2/25/35 (f) | | 2,430,000 | | 2,432,538 |
Series 2005-HE5 Class 1A1, 3.4244% 6/25/35 (f) | | 10,884,395 | | 10,884,395 |
Capital Auto Receivables Asset Trust: | | | | |
Series 2002-5 Class B, 2.8% 4/15/08 | | 2,894,887 | | 2,868,235 |
Series 2003-1 Class B, 3.8581% 6/15/10 (c)(f) | | 5,781,229 | | 5,797,579 |
Series 2003-2 Class B, 3.6681% 1/15/09 (f) | | 2,741,542 | | 2,746,505 |
Series 2005-1 Class B, 3.7631% 6/15/10 (f) | | 5,725,000 | | 5,730,367 |
Capital One Auto Finance Trust: | | | | |
Series 2003-A Class A4B, 3.6681% 1/15/10 (f) | | 9,630,000 | | 9,654,568 |
Series 2004-B Class A4, 3.4981% 8/15/11 (f) | | 16,300,000 | | 16,303,123 |
Capital One Master Trust: | | | | |
Series 1999-3 Class B, 3.8681% 9/15/09 (f) | | 5,000,000 | | 5,004,082 |
Series 2001-1 Class B, 3.8981% 12/15/10 (f) | | 19,500,000 | | 19,638,608 |
Series 2001-8A Class B, 3.9381% 8/17/09 (f) | | 9,585,000 | | 9,634,206 |
Series 2002-4A Class B, 3.8881% 3/15/10 (f) | | 6,000,000 | | 6,028,221 |
Capital One Multi-Asset Execution Trust: | | | | |
Series 2002-B1 Class B1, 4.0681% 7/15/08 (f) | | 17,705,000 | | 17,711,976 |
Series 2003-B1 Class B1, 4.5581% 2/17/09 (f) | | 15,470,000 | | 15,566,773 |
Capital Trust Ltd. Series 2004-1: | | | | |
Class A2, 3.88% 7/20/39 (c)(f) | | 2,968,000 | | 2,968,000 |
Asset-Backed Securities - continued |
| Principal Amount | | Value |
Capital Trust Ltd. Series 2004-1: - continued | | | | |
Class B, 4.18% 7/20/39 (c)(f) | | $ 1,550,000 | | $ 1,550,000 |
Class C, 4.53% 7/20/39 (c)(f) | | 1,994,000 | | 1,994,000 |
CDC Mortgage Capital Trust: | | | | |
Series 2001-HE1 Class M1, 4.49% 1/25/32 (f) | | 4,244,221 | | 4,254,278 |
Series 2002-HE2 Class M1, 4.16% 1/25/33 (f) | | 9,278,431 | | 9,309,123 |
Series 2002-HE3: | | | | |
Class M1, 4.56% 3/25/33 (f) | | 21,339,884 | | 21,627,815 |
Class M2, 5.71% 3/25/33 (f) | | 9,968,976 | | 10,143,974 |
Series 2003-HE1: | | | | |
Class M1, 4.36% 8/25/33 (f) | | 1,989,998 | | 1,997,574 |
Class M2, 5.41% 8/25/33 (f) | | 4,369,996 | | 4,422,084 |
Series 2003-HE2 Class A, 3.81% 10/25/33 (f) | | 1,634,377 | | 1,635,405 |
Series 2003-HE3: | | | | |
Class M1, 4.16% 11/25/33 (f) | | 2,254,989 | | 2,271,960 |
Class M2, 5.21% 11/25/33 (f) | | 1,719,992 | | 1,753,552 |
Series 2004-HE2 Class M2, 4.66% 7/26/34 (f) | | 2,345,000 | | 2,365,939 |
Chase Credit Card Owner Trust: | | | | |
Series 2001-6 Class B, 3.8681% 3/16/09 (f) | | 1,305,000 | | 1,311,169 |
Series 2002-6 Class B, 3.7381% 1/15/08 (f) | | 11,850,000 | | 11,852,472 |
Series 2004-1 Class B, 3.5881% 5/15/09 (f) | | 4,105,000 | | 4,104,204 |
Citibank Credit Card Issuance Trust: | | | | |
Series 2000-C2 Class C2, 4.2488% 10/15/07 (f) | | 17,500,000 | | 17,511,349 |
Series 2001-B2 Class B2, 3.8494% 12/10/08 (f) | | 11,945,000 | | 11,995,341 |
Series 2002-B1 Class B1, 3.8% 6/25/09 (f) | | 9,010,000 | | 9,038,878 |
Series 2002-C1 Class C1, 4.2185% 2/9/09 (f) | | 17,500,000 | | 17,686,918 |
Series 2003-B1 Class B1, 3.66% 3/7/08 (f) | | 25,000,000 | | 25,022,693 |
Series 2003-C1 Class C1, 4.65% 4/7/10 (f) | | 17,785,000 | | 18,152,159 |
Citigroup Mortgage Loan Trust Series 2003-HE4 Class A, 3.87% 12/25/33 (c)(f) | | 7,985,107 | | 7,985,935 |
CNH Wholesale Master Note Trust Series 2005-1: | | | | |
Class A, 3.43% 6/15/11 (f) | | 18,000,000 | | 18,000,000 |
Class B, 3.72% 6/15/11 (f) | | 2,280,000 | | 2,280,000 |
Countrywide Home Loans, Inc.: | | | | |
Series 2002-6 Class AV1, 3.89% 5/25/33 (f) | | 1,499,863 | | 1,503,470 |
Series 2003-BC1 Class M2, 5.46% 9/25/32 (f) | | 11,065,000 | | 11,199,451 |
Series 2003-SD3 Class A1, 3.88% 12/25/32 (c)(f) | | 927,188 | | 931,926 |
Series 2004-2 Class M1, 3.96% 5/25/34 (f) | | 5,200,000 | | 5,206,719 |
Series 2004-3: | | | | |
Class 3A4, 3.71% 8/25/34 (f) | | 530,752 | | 528,596 |
Class M1, 3.96% 6/25/34 (f) | | 1,475,000 | | 1,476,356 |
Series 2004-4: | | | | |
Class A, 3.83% 8/25/34 (f) | | 2,524,088 | | 2,526,278 |
Asset-Backed Securities - continued |
| Principal Amount | | Value |
Countrywide Home Loans, Inc.: - continued | | | | |
Series 2004-4: | | | | |
Class M1, 3.94% 7/25/34 (f) | | $ 3,650,000 | | $ 3,653,189 |
Class M2, 3.99% 6/25/34 (f) | | 4,395,000 | | 4,398,536 |
Series 2005-1: | | | | |
Class 1AV2, 3.66% 7/25/35 (f) | | 8,780,000 | | 8,775,114 |
Class M1, 3.88% 8/25/35 (f) | | 19,600,000 | | 19,563,654 |
Class MV1, 3.86% 7/25/35 (f) | | 3,135,000 | | 3,130,219 |
Class MV2, 3.9% 7/25/35 (f) | | 3,765,000 | | 3,754,147 |
Class MV3, 3.94% 7/25/35 (f) | | 1,560,000 | | 1,557,748 |
Series 2005-3 Class MV1, 3.88% 8/25/35 (f) | | 11,125,000 | | 11,103,934 |
Series 2005-AB1 Class A2, 3.67% 8/25/35 (f) | | 17,520,000 | | 17,514,797 |
Series 2005-IM1 Class A1, 3.56% 8/25/34 (d)(f) | | 17,915,000 | | 17,915,000 |
CS First Boston Mortgage Securities Corp.: | | | | |
Series 2003-8 Class A2, 3.85% 4/25/34 (f) | | 2,663,075 | | 2,674,762 |
Series 2004-FRE1: | | | | |
Class A2, 3.81% 4/25/34 (f) | | 2,689,397 | | 2,689,291 |
Class M3, 4.11% 4/25/34 (f) | | 5,885,000 | | 5,884,751 |
Discover Card Master Trust I Series 2003-4 Class B1, 3.7181% 5/16/11 (f) | | 8,155,000 | | 8,196,815 |
Fannie Mae guaranteed REMIC pass thru certificates Series 2004-T5 Class AB3, 3.8305% 5/28/35 (f) | | 6,957,460 | | 6,959,877 |
Fieldstone Mortgage Investment Corp.: | | | | |
Series 2003-1: | | | | |
Class M1, 4.14% 11/25/33 (f) | | 1,300,000 | | 1,308,748 |
Class M2, 5.21% 11/25/33 (f) | | 700,000 | | 718,600 |
Series 2004-1 Class M2, 4.56% 1/25/35 (f) | | 3,700,000 | | 3,741,581 |
Series 2004-2 Class M2, 4.61% 7/25/34 (f) | | 9,890,000 | | 9,889,579 |
Series 2004-3 Class M5, 4.91% 8/25/34 (f) | | 2,000,000 | | 2,033,830 |
Series 2005-2 Class 2A1, 3.5% 7/25/36 (d)(f) | | 16,935,000 | | 16,935,000 |
First Franklin Mortgage Loan Asset Backed Certificates: | | | | |
Series 2005-FF2 Class A2A, 3.55% 3/25/35 (f) | | 7,354,604 | | 7,354,604 |
Series 2005-FF2 Class M6, 4.16% 3/25/35 (f) | | 6,950,000 | | 6,950,000 |
First Franklin Mortgage Loan Trust Series 2004-FF2: | | | | |
Class M3, 4.01% 3/25/34 (f) | | 400,000 | | 400,711 |
Class M4, 4.36% 3/25/34 (f) | | 300,000 | | 302,647 |
First USA Credit Card Master Trust Series 2001-4 Class B, 3.75% 1/12/09 (f) | | 15,000,000 | | 15,026,199 |
First USA Secured Note Trust Series 2001-3 Class C, 4.4669% 11/19/08 (c)(f) | | 11,580,000 | | 11,661,421 |
Ford Credit Auto Owner Trust Series 2003-B Class B2, 3.8181% 10/15/07 (f) | | 19,600,000 | | 19,671,950 |
Asset-Backed Securities - continued |
| Principal Amount | | Value |
Ford Credit Floorplan Master Owner Trust Series 2005-1: | | | | |
Class A, 3.5381% 5/17/10 (f) | | $ 9,590,000 | | $ 9,589,981 |
Class B, 3.6563% 5/17/10 (f) | | 2,625,000 | | 2,624,992 |
Fremont Home Loan Trust: | | | | |
Series 2004-1: | | | | |
Class 1A1, 3.68% 2/25/34 (f) | | 2,669,337 | | 2,669,232 |
Class M1, 3.91% 2/25/34 (f) | | 750,000 | | 749,968 |
Class M2, 3.96% 2/25/34 (f) | | 800,000 | | 799,966 |
Series 2004-C Class 2A2, 4.01% 8/25/34 (f) | | 10,000,000 | | 10,101,993 |
Series 2005-2 Class 2A1, 3.5913% 6/25/35 (f) | | 15,380,000 | | 15,375,194 |
Series 2005-A: | | | | |
Class 2A2, 3.7% 2/25/35 (f) | | 11,850,000 | | 11,865,657 |
Class M1, 3.89% 1/25/35 (f) | | 1,603,000 | | 1,599,854 |
Class M2, 3.92% 1/25/35 (f) | | 2,325,000 | | 2,321,531 |
Class M3, 3.95% 1/25/35 (f) | | 1,250,000 | | 1,249,947 |
Class M4, 4.14% 1/25/35 (f) | | 925,000 | | 927,535 |
GE Business Loan Trust Series 2003-1 Class A, 3.8181% 4/15/31 (c)(f) | | 5,499,865 | | 5,531,421 |
GE Capital Credit Card Master Note Trust Series 2005-2 Class B, 3.5736% 6/15/11 (f) | | 6,475,000 | | 6,473,058 |
Gracechurch Card Funding PLC: | | | | |
Series 5: | | | | |
Class B, 3.6181% 8/15/08 (f) | | 1,520,000 | | 1,521,351 |
Class C, 4.3181% 8/15/08 (f) | | 5,580,000 | | 5,601,142 |
Series 6 Class B, 3.5781% 2/17/09 (f) | | 1,030,000 | | 1,030,901 |
Series 8 Class C, 3.6721% 6/15/10 (f) | | 18,450,000 | | 18,450,000 |
GSAMP Trust: | | | | |
Series 2002-HE Class M1, 4.68% 11/20/32 (f) | | 2,882,888 | | 2,928,737 |
Series 2002-NC1: | | | | |
Class A2, 3.78% 7/25/32 (f) | | 54,777 | | 55,099 |
Class M1, 4.1% 7/25/32 (f) | | 8,861,000 | | 8,920,491 |
Series 2003-FM1 Class M1, 4.25% 3/20/33 (f) | | 15,000,000 | | 15,136,310 |
Series 2004-FM1: | | | | |
Class M1, 4.11% 11/25/33 (f) | | 2,865,000 | | 2,864,879 |
Class M2, 4.86% 11/25/33 (f) | | 1,975,000 | | 2,005,597 |
Series 2004-FM2: | | | | |
Class M1, 3.96% 1/25/34 (f) | | 3,500,000 | | 3,499,853 |
Class M2, 4.56% 1/25/34 (f) | | 1,500,000 | | 1,499,936 |
Class M3, 4.76% 1/25/34 (f) | | 1,500,000 | | 1,499,935 |
Series 2004-HE1: | | | | |
Class M1, 4.01% 5/25/34 (f) | | 4,045,000 | | 4,044,829 |
Class M2, 4.61% 5/25/34 (f) | | 1,750,000 | | 1,766,258 |
Asset-Backed Securities - continued |
| Principal Amount | | Value |
GSAMP Trust: - continued | | | | |
Series 2005-9 Class 2A1, 3.5287% 8/25/35 (f) | | $ 17,530,000 | | $ 17,530,000 |
Series 2005-FF2 Class M5, 4.09% 3/25/35 (f) | | 3,500,000 | | 3,500,000 |
Series 2005-HE2 Class M, 3.89% 3/25/35 (f) | | 8,780,000 | | 8,749,867 |
Series 2005-NC1 Class M1, 3.91% 2/25/35 (f) | | 9,010,000 | | 8,987,296 |
Guggenheim Structured Real Estate Funding Ltd. Series 2005-1 Class C, 4.3944% 5/25/30 (c)(f) | | 14,000,000 | | 13,986,652 |
HFC Home Equity Loan Asset Backed Certificates Series 2005-2: | | | | |
Class M1, 3.97% 1/20/34 (f) | | 3,225,000 | | 3,225,000 |
Class M2, 4% 1/20/34 (f) | | 2,415,000 | | 2,415,000 |
Home Equity Asset Trust: | | | | |
Series 2002-2 Class M1, 4.26% 6/25/32 (f) | | 10,000,000 | | 10,017,090 |
Series 2002-3 Class A5, 3.9% 2/25/33 (f) | | 854,528 | | 855,194 |
Series 2002-4 Class A3, 3.94% 3/25/33 (f) | | 1,237,388 | | 1,238,074 |
Series 2002-5: | | | | |
Class A3, 3.98% 5/25/33 (f) | | 2,866,793 | | 2,872,821 |
Class M1, 4.66% 5/25/33 (f) | | 13,800,000 | | 13,966,276 |
Series 2003-1: | | | | |
Class A2, 3.93% 6/25/33 (f) | | 4,229,596 | | 4,233,111 |
Class M1, 4.46% 6/25/33 (f) | | 8,335,000 | | 8,375,317 |
Series 2003-2: | | | | |
Class A2, 3.84% 8/25/33 (f) | | 228,269 | | 229,139 |
Class M1, 4.34% 8/25/33 (f) | | 2,245,000 | | 2,269,298 |
Series 2003-3: | | | | |
Class A2, 3.82% 8/25/33 (f) | | 1,624,262 | | 1,630,339 |
Class M1, 4.32% 8/25/33 (f) | | 8,185,000 | | 8,266,814 |
Series 2003-4: | | | | |
Class M1, 4.26% 10/25/33 (f) | | 3,415,000 | | 3,440,384 |
Class M2, 5.36% 10/25/33 (f) | | 4,040,000 | | 4,093,038 |
Series 2003-5: | | | | |
Class A2, 3.81% 12/25/33 (f) | | 5,822,876 | | 5,843,440 |
Class M1, 4.16% 12/25/33 (f) | | 3,175,000 | | 3,192,660 |
Class M2, 5.19% 12/25/33 (f) | | 1,345,000 | | 1,377,487 |
Series 2003-7 Class A2, 3.84% 3/25/34 (f) | | 3,430,379 | | 3,438,503 |
Series 2004-2 Class A2, 3.75% 7/25/34 (f) | | 6,172,348 | | 6,172,139 |
Series 2004-3: | | | | |
Class M1, 4.03% 8/25/34 (f) | | 2,015,000 | | 2,019,636 |
Class M2, 4.66% 8/25/34 (f) | | 2,200,000 | | 2,237,373 |
Series 2004-4 Class A2, 3.78% 10/25/34 (f) | | 8,318,527 | | 8,347,783 |
Series 2004-6 Class A2, 3.81% 12/25/34 (f) | | 9,249,309 | | 9,278,715 |
Series 2004-7 Class A3, 3.85% 1/25/35 (f) | | 2,916,946 | | 2,929,856 |
Asset-Backed Securities - continued |
| Principal Amount | | Value |
Home Equity Asset Trust: - continued | | | | |
Series 2005-1: | | | | |
Class M1, 3.89% 5/25/35 (f) | | $ 9,705,000 | | $ 9,697,565 |
Class M2, 3.91% 5/25/35 (f) | | 5,780,000 | | 5,763,067 |
Class M3, 3.96% 5/25/35 (f) | | 5,825,000 | | 5,808,344 |
Series 2005-2: | | | | |
Class 2A2, 3.66% 7/25/35 (f) | | 13,170,000 | | 13,163,182 |
Class M1, 3.91% 7/25/35 (f) | | 10,085,000 | | 10,075,362 |
Series 2005-3 Class M1, 3.87% 8/25/35 (f) | | 9,450,000 | | 9,434,700 |
Series 2005-5 Class 2A2, 3.65% 11/25/35 (d)(f) | | 15,000,000 | | 14,968,605 |
Household Affinity Credit Card Master Note Trust I Series 2003-3 Class B, 3.6781% 8/15/08 (f) | | 10,000,000 | | 10,018,071 |
Household Credit Card Master Trust I Series 2002-1 Class B, 4.0381% 7/15/08 (f) | | 22,589,000 | | 22,608,682 |
Household Home Equity Loan Trust: | | | | |
Series 2002-2 Class A, 3.73% 4/20/32 (f) | | 3,295,048 | | 3,298,089 |
Series 2002-3 Class A, 3.88% 7/20/32 (f) | | 2,678,218 | | 2,681,775 |
Series 2003-1 Class M, 4.06% 10/20/32 (f) | | 770,987 | | 771,866 |
Series 2003-2: | | | | |
Class A, 3.76% 9/20/33 (f) | | 2,892,082 | | 2,897,777 |
Class M, 4.01% 9/20/33 (f) | | 1,360,000 | | 1,362,941 |
Series 2004-1 Class M, 3.95% 9/20/33 (f) | | 2,708,464 | | 2,713,597 |
Household Mortgage Loan Trust: | | | | |
Series 2003-HC1 Class M, 4.08% 2/20/33 (f) | | 1,742,776 | | 1,748,262 |
Series 2004-HC1: | | | | |
Class A, 3.78% 2/20/34 (f) | | 5,083,992 | | 5,096,702 |
Class M, 3.93% 2/20/34 (f) | | 3,073,800 | | 3,073,443 |
Household Private Label Credit Card Master Note Trust I: | | | | |
Series 2002-1 Class B, 3.9381% 1/18/11 (f) | | 8,850,000 | | 8,867,619 |
Series 2002-2: | | | | |
Class A, 3.5581% 1/18/11 (f) | | 9,000,000 | | 9,012,218 |
Class B, 3.9381% 1/18/11 (f) | | 14,275,000 | | 14,355,952 |
Series 2002-3 Class B, 4.6381% 9/15/09 (f) | | 4,150,000 | | 4,159,262 |
Ikon Receivables Funding LLC Series 2003-1 Class A3A, 3.6213% 12/17/07 (f) | | 2,781,207 | | 2,781,863 |
IXIS Real Estate Capital Trust Series 2005-HE1: | | | | |
Class A1, 3.71% 6/25/35 (f) | | 11,646,350 | | 11,645,706 |
Class M1, 3.93% 6/25/35 (f) | | 4,100,000 | | 4,094,813 |
Class M2, 3.95% 6/25/35 (f) | | 2,775,000 | | 2,766,003 |
Class M3, 3.98% 6/25/35 (f) | | 1,975,000 | | 1,972,566 |
Keycorp Student Loan Trust Series 1999-A Class A2, 3.8% 12/27/09 (f) | | 16,169,548 | | 16,224,493 |
Asset-Backed Securities - continued |
| Principal Amount | | Value |
Long Beach Mortgage Loan Trust: | | | | |
Series 2003-2: | | | | |
Class AV, 3.78% 6/25/33 (f) | | $ 253,078 | | $ 253,185 |
Class M1, 4.28% 6/25/33 (f) | | 19,500,000 | | 19,626,153 |
Series 2003-3 Class M1, 4.21% 7/25/33 (f) | | 7,770,000 | | 7,824,625 |
Series 2004-2: | | | | |
Class M1, 3.99% 6/25/34 (f) | | 4,275,000 | | 4,285,404 |
Class M2, 4.54% 6/25/34 (f) | | 1,400,000 | | 1,416,723 |
Series 2005-2 Class 2A2, 3.64% 4/25/35 (f) | | 12,000,000 | | 11,996,998 |
MASTR Asset Backed Securities Trust: | | | | |
Series 2003-NC1: | | | | |
Class M1, 4.19% 4/25/33 (f) | | 3,500,000 | | 3,519,270 |
Class M2, 5.31% 4/25/33 (f) | | 1,500,000 | | 1,534,429 |
Series 2004-FRE1 Class M1, 4.01% 7/25/34 (f) | | 5,223,000 | | 5,238,948 |
MBNA Asset Backed Note Trust Series 2000-K Class C, 4.1881% 3/17/08 (c)(f) | | 7,250,000 | | 7,258,700 |
MBNA Credit Card Master Note Trust: | | | | |
Series 2001-B1 Class B1, 3.7631% 10/15/08 (f) | | 30,000,000 | | 30,042,072 |
Series 2001-B2 Class B2, 3.7481% 1/15/09 (f) | | 30,353,000 | | 30,429,933 |
Series 2002-B2 Class B2, 3.7681% 10/15/09 (f) | | 20,000,000 | | 20,086,600 |
Series 2002-B3 Class B3, 3.7881% 1/15/08 (f) | | 15,000,000 | | 15,000,470 |
Series 2002-B4 Class B4, 3.8881% 3/15/10 (f) | | 14,800,000 | | 14,916,873 |
Series 2003-B2 Class B2, 3.7781% 10/15/10 (f) | | 1,530,000 | | 1,545,569 |
Series 2003-B3 Class B3, 3.7631% 1/18/11 (f) | | 1,130,000 | | 1,135,362 |
Series 2003-B5 Class B5, 3.7581% 2/15/11 (f) | | 705,000 | | 710,447 |
MBNA Master Credit Card Trust II: | | | | |
Series 1998-E Class B, 3.9288% 9/15/10 (f) | | 7,800,000 | | 7,846,570 |
Series 1998-G Class B, 3.7881% 2/17/09 (f) | | 20,000,000 | | 20,043,574 |
Meritage Mortgage Loan Trust Series 2004-1: | | | | |
Class M1, 3.96% 7/25/34 (f) | | 2,125,000 | | 2,124,911 |
Class M2, 4.01% 7/25/34 (f) | | 375,000 | | 374,985 |
Class M3, 4.41% 7/25/34 (f) | | 775,000 | | 774,967 |
Class M4, 4.56% 7/25/34 (f) | | 525,000 | | 524,978 |
Merrill Lynch Mortgage Investors, Inc. Series 2003-HE1 Class M1, 4.16% 7/25/34 (f) | | 2,321,000 | | 2,330,928 |
Morgan Stanley ABS Capital I, Inc.: | | | | |
Series 2002-NC6 Class M2, 5.56% 11/25/32 (f) | | 2,370,000 | | 2,441,680 |
Series 2003-NC5 Class M2, 5.46% 4/25/33 (f) | | 2,800,000 | | 2,834,138 |
Series 2003-NC6 Class M2, 5.41% 6/27/33 (f) | | 12,835,000 | | 13,180,825 |
Series 2003-NC7 Class M1, 4.16% 6/25/33 (f) | | 1,785,000 | | 1,791,357 |
Series 2003-NC8 Class M1, 4.16% 9/25/33 (f) | | 2,350,000 | | 2,363,472 |
Series 2004-HE6 Class A2, 3.8% 8/25/34 (f) | | 7,193,690 | | 7,217,222 |
Series 2004-NC2 Class M1, 4.01% 12/25/33 (f) | | 2,595,000 | | 2,599,359 |
Asset-Backed Securities - continued |
| Principal Amount | | Value |
Morgan Stanley ABS Capital I, Inc.: - continued | | | | |
Series 2004-NC6 Class A2, 3.8% 7/25/34 (f) | | $ 3,163,358 | | $ 3,170,145 |
Series 2005-1: | | | | |
Class M2, 3.93% 12/25/34 (f) | | 4,425,000 | | 4,417,835 |
Class M3, 3.98% 12/25/34 (f) | | 4,000,000 | | 3,998,266 |
Series 2005-HE1: | | | | |
Class A3B, 3.68% 12/25/34 (f) | | 3,885,000 | | 3,889,266 |
Class M1, 3.91% 12/25/34 (f) | | 1,100,000 | | 1,102,253 |
Class M2, 3.93% 12/25/34 (f) | | 2,970,000 | | 2,966,369 |
Series 2005-HE2: | | | | |
Class M1, 3.86% 1/25/35 (f) | | 2,665,000 | | 2,670,502 |
Class M2, 3.9% 1/25/35 (f) | | 1,900,000 | | 1,893,810 |
Series 2005-NC1: | | | | |
Class M1, 3.9% 1/25/35 (f) | | 2,425,000 | | 2,432,731 |
Class M2, 3.93% 1/25/35 (f) | | 2,425,000 | | 2,421,056 |
Class M3, 3.97% 1/25/35 (f) | | 2,425,000 | | 2,425,850 |
Morgan Stanley Dean Witter Capital I Trust: | | | | |
Series 2001-AM1: | | | | |
Class M1, 4.31% 2/25/32 (f) | | 1,510,288 | | 1,513,954 |
Class M2, 4.86% 2/25/32 (f) | | 7,146,795 | | 7,171,201 |
Series 2001-NC4: | | | | |
Class M1, 4.46% 1/25/32 (f) | | 3,827,881 | | 3,841,816 |
Series 2002-AM3 Class A3, 3.95% 2/25/33 (f) | | 1,426,624 | | 1,430,581 |
Series 2002-HE1 Class M1, 4.06% 7/25/32 (f) | | 5,860,000 | | 5,893,149 |
Series 2002-HE2 Class M1, 4.16% 8/25/32 (f) | | 9,925,000 | | 9,970,606 |
Series 2002-NC3 Class A3, 3.8% 8/25/32 (f) | | 396,299 | | 397,573 |
Series 2002-OP1 Class M1, 4.21% 9/25/32 (f) | | 3,894,745 | | 3,917,849 |
Series 2003-NC1: | | | | |
Class M1, 4.51% 11/25/32 (f) | | 2,555,000 | | 2,572,380 |
Class M2, 5.51% 11/25/32 (f) | | 1,880,000 | | 1,899,041 |
New Century Home Equity Loan Trust: | | | | |
Series 2003-2: | | | | |
Class A2, 3.89% 1/25/33 (f) | | 341,254 | | 341,436 |
Class M2, 5.46% 1/25/33 (f) | | 4,600,000 | | 4,667,174 |
Series 2003-6 Class M1, 4.18% 1/25/34 (f) | | 5,180,000 | | 5,202,952 |
Series 2005-1: | | | | |
Class M1, 3.91% 3/25/35 (f) | | 4,395,000 | | 4,392,950 |
Class M2, 3.94% 3/25/35 (f) | | 4,395,000 | | 4,384,834 |
Class M3, 3.98% 3/25/35 (f) | | 2,120,000 | | 2,120,796 |
Nissan Auto Lease Trust: | | | | |
Series 2003-A Class A3A, 3.5281% 6/15/09 (f) | | 13,621,752 | | 13,633,434 |
Series 2004-A Class A4A, 3.4581% 6/15/10 (f) | | 10,570,000 | | 10,582,978 |
Asset-Backed Securities - continued |
| Principal Amount | | Value |
NovaStar Home Equity Loan Series 2004-1: | | | | |
Class M1, 3.91% 6/25/34 (f) | | $ 1,450,000 | | $ 1,451,222 |
Class M4, 4.435% 6/25/34 (f) | | 2,435,000 | | 2,439,150 |
Ocala Funding LLC Series 2005-1A Class A, 4.93% 3/20/10 (c)(f) | | 3,675,000 | | 3,675,000 |
Ownit Mortgage Loan Asste-Backed Certificates Series 2005-3 Class A2A, 3.5% 6/25/36 (f) | | 15,500,000 | | 15,500,000 |
Park Place Securities, Inc.: | | | | |
Series 2004-WCW1: | | | | |
Class M1, 4.09% 9/25/34 (f) | | 3,745,000 | | 3,756,721 |
Class M2, 4.14% 9/25/34 (f) | | 1,755,000 | | 1,764,326 |
Class M3, 4.71% 9/25/34 (f) | | 3,355,000 | | 3,396,745 |
Class M4, 4.91% 9/25/34 (f) | | 4,700,000 | | 4,767,614 |
Series 2004-WCW2 Class A2, 3.84% 10/25/34 (f) | | 7,952,623 | | 7,976,111 |
Series 2005-WCH1: | | | | |
Class A3B, 3.68% 1/25/35 (f) | | 2,775,000 | | 2,779,908 |
Class M2, 3.98% 1/25/35 (f) | | 4,175,000 | | 4,166,539 |
Class M3, 4.02% 1/25/35 (f) | | 3,290,000 | | 3,292,599 |
Class M5, 4.34% 1/25/35 (f) | | 3,095,000 | | 3,104,620 |
Series 2005-WHQ2 Class M7, 4.71% 5/25/35 (f) | | 5,950,000 | | 5,930,787 |
People's Choice Home Loan Securities Trust Series 2005-2: | | | | |
Class A1, 3.57% 9/25/24 (f) | | 7,475,790 | | 7,475,790 |
Class M4, 4.09% 5/25/35 (f) | | 6,000,000 | | 6,000,000 |
Providian Gateway Master Trust Series 2002-B Class A, 4.0881% 6/15/09 (c)(f) | | 15,000,000 | | 15,039,393 |
Residental Asset Securities Corp.: | | | | |
Series 2005-KS4 Class M2, 4.04% 4/25/35 (f) | | 1,040,000 | | 1,037,610 |
Series 2005-KS7 Class A1, 3.4781% 8/25/35 (f) | | 10,515,000 | | 10,512,897 |
Residential Asset Mortgage Products, Inc. Series 2004-RS10 Class MII2, 4.71% 10/25/34 (f) | | 5,500,000 | | 5,566,857 |
Salomon Brothers Mortgage Securities VII, Inc. Series 2003-HE1 Class A, 3.86% 4/25/33 (f) | | 818,316 | | 822,076 |
Saxon Asset Securities Trust: | | | | |
Series 2004-1 Class M1, 3.99% 3/25/35 (f) | | 4,415,000 | | 4,413,887 |
Series 2004-2 Class MV1, 4.04% 8/25/35 (f) | | 4,495,000 | | 4,501,043 |
Sears Credit Account Master Trust II: | | | | |
Series 2001-1 Class B, 3.8131% 2/15/10 (f) | | 10,000,000 | | 9,987,143 |
Series 2002-4: | | | | |
Class A, 3.5181% 8/18/09 (f) | | 27,000,000 | | 26,999,603 |
Class B, 3.8131% 8/18/09 (f) | | 33,300,000 | | 33,301,149 |
Series 2002-5 Class B, 4.6381% 11/17/09 (f) | | 30,000,000 | | 30,062,976 |
Asset-Backed Securities - continued |
| Principal Amount | | Value |
Securitized Asset Backed Receivables LLC Trust Series 2004-NC1 Class M1, 3.98% 2/25/34 (f) | | $ 2,910,000 | | $ 2,909,256 |
Specialty Underwriting & Residential Finance Series 2003-BC4 Class M1, 4.06% 11/25/34 (f) | | 1,810,000 | | 1,818,452 |
Structured Asset Securities Corp. Series 2004-GEL1 Class A, 3.82% 2/25/34 (f) | | 1,043,424 | | 1,043,422 |
Superior Wholesale Inventory Financing Trust VII Series 2003-A8 Class CTFS, 3.8381% 3/15/11 (c)(f) | | 10,835,000 | | 10,828,228 |
Superior Wholesale Inventory Financing Trust XII Series 2005-A12 Class C, 4.46% 6/15/10 (f) | | 6,840,000 | | 6,839,945 |
Terwin Mortgage Trust: | | | | |
Series 2003-4HE Class A1, 3.89% 9/25/34 (f) | | 2,878,990 | | 2,894,593 |
Series 2003-6HE Class A1, 3.93% 11/25/33 (f) | | 1,784,384 | | 1,788,543 |
Series 2005-14HE Class AF1, 3.9753% 7/25/36 (d)(f) | | 8,635,000 | | 8,633,296 |
TOTAL ASSET-BACKED SECURITIES (Cost $2,293,954,229) | 2,300,747,332 |
Collateralized Mortgage Obligations - 16.9% |
|
Private Sponsor - 13.7% |
Adjustable Rate Mortgage Trust floater: | | | | |
Series 2004-2 Class 7A3, 3.86% 2/25/35 (f) | | 9,374,471 | | 9,396,037 |
Series 2004-4 Class 5A2, 3.86% 3/25/35 (f) | | 3,780,419 | | 3,787,953 |
Series 2005-1 Class 5A2, 3.79% 5/25/35 (f) | | 6,187,250 | | 6,191,166 |
Series 2005-2: | | | | |
Class 6A2, 3.74% 6/25/35 (f) | | 2,930,592 | | 2,932,491 |
Class 6M2, 3.94% 6/25/35 (f) | | 10,145,000 | | 10,145,010 |
Series 2005-3 Class 8A2, 3.7% 7/25/35 (f) | | 19,199,197 | | 19,211,695 |
Series 2005-4 Class 7A2, 3.69% 8/25/35 (f) | | 9,011,457 | | 9,003,527 |
Series 2005-8 Class 7A2, 3.77% 11/25/35 (f) | | 7,660,000 | | 7,660,000 |
Bear Stearns Alt-A Trust floater: | | | | |
Series 2005-1 Class A1, 3.74% 1/25/35 (f) | | 20,354,186 | | 20,354,186 |
Series 2005-2 Class 1A1, 3.71% 3/25/35 (f) | | 14,961,065 | | 14,961,065 |
Series 2005-5 Class 1A1, 3.68% 7/25/35 (f) | | 18,707,862 | | 18,696,170 |
Countrywide Alternative Loan Trust planned amortization class Series 2003-5T2 Class A2, 3.86% 5/25/33 (f) | | 5,545,033 | | 5,548,017 |
Countrywide Home Loans, Inc. floater: | | | | |
Series 2004-16 Class A1, 3.86% 9/25/34 (f) | | 10,335,456 | | 10,325,843 |
Series 2005-1 Class 2A1, 3.75% 3/25/35 (f) | | 14,617,171 | | 14,617,171 |
CS First Boston Mortgage Securities Corp. floater: | | | | |
Series 2004-AR2 Class 6A1, 3.86% 3/25/34 (f) | | 5,338,263 | | 5,334,945 |
Collateralized Mortgage Obligations - continued |
| Principal Amount | | Value |
Private Sponsor - continued |
CS First Boston Mortgage Securities Corp. floater: - continued | | | | |
Series 2004-AR3 Class 6A2, 3.83% 4/25/34 (f) | | $ 2,226,193 | | $ 2,228,162 |
Series 2004-AR4 Class 5A2, 3.83% 5/25/34 (f) | | 2,066,310 | | 2,065,052 |
Series 2004-AR5 Class 11A2, 3.83% 6/25/34 (f) | | 2,987,552 | | 2,981,472 |
Series 2004-AR6 Class 9A2, 3.83% 10/25/34 (f) | | 3,981,028 | | 3,983,412 |
Series 2004-AR7 Class 6A2, 3.84% 8/25/34 (f) | | 5,801,660 | | 5,806,785 |
Series 2004-AR8 Class 8A2, 3.84% 9/25/34 (f) | | 4,630,225 | | 4,638,807 |
First Horizon Mortgage Passthru Trust floater Series 2004-FL1 Class 2A1, 3.95% 12/25/34 (f) | | 4,384,853 | | 4,379,779 |
Granite Master Issuer PLC floater: | | | | |
Series 2005-1: | | | | |
Class A3, 3.51% 12/21/24 (f) | | 5,300,000 | | 5,299,006 |
Class B1, 3.56% 12/20/54 (f) | | 7,050,000 | | 7,047,577 |
Class M1, 3.66% 12/20/54 (f) | | 5,300,000 | | 5,298,178 |
Series 2005-2 Class C1, 3.7857% 12/20/54 (f) | | 7,975,000 | | 7,972,508 |
Granite Mortgages PLC floater: | | | | |
Series 2004-1: | | | | |
Class 1B, 3.64% 3/20/44 (f) | | 1,415,000 | | 1,414,844 |
Class 1C, 4.33% 3/20/44 (f) | | 4,075,000 | | 4,091,219 |
Class 1M, 3.84% 3/20/44 (f) | | 4,935,000 | | 4,938,751 |
Series 2004-2: | | | | |
Class 1A2, 3.5% 6/20/28 (f) | | 5,384,259 | | 5,384,932 |
Class 1B, 3.6% 6/20/44 (f) | | 1,018,055 | | 1,018,309 |
Class 1C, 4.13% 6/20/44 (f) | | 3,706,295 | | 3,713,918 |
Class 1M, 3.71% 6/20/44 (f) | | 2,722,846 | | 2,724,205 |
Series 2004-3: | | | | |
Class 1B, 3.59% 9/20/44 (f) | | 2,100,000 | | 2,100,210 |
Class 1C, 4.02% 9/20/44 (f) | | 5,415,000 | | 5,426,913 |
Class 1M, 3.7% 9/20/44 (f) | | 1,200,000 | | 1,200,360 |
Harborview Mortgage Loan Trust floater Series 2005-2 Class 2A1A, 3.6369% 5/19/35 (f) | | 11,690,145 | | 11,648,134 |
Holmes Financing No. 7 PLC floater Series 2 Class M, 4.3988% 7/15/40 (f) | | 2,560,000 | | 2,564,912 |
Holmes Financing No. 8 PLC floater Series 2: | | | | |
Class A, 3.6788% 4/15/11 (f) | | 25,000,000 | | 25,000,000 |
Class B, 3.7688% 7/15/40 (f) | | 2,695,000 | | 2,696,684 |
Class C, 4.3188% 7/15/40 (f) | | 10,280,000 | | 10,328,193 |
Home Equity Asset Trust floater Series 2005-3 Class 2A1, 3.55% 8/25/35 (f) | | 7,268,025 | | 7,266,230 |
Homestar Mortgage Acceptance Corp. floater Series 2004-5 Class A1, 3.91% 10/25/34 (f) | | 4,495,430 | | 4,509,337 |
Collateralized Mortgage Obligations - continued |
| Principal Amount | | Value |
Private Sponsor - continued |
Impac CMB Trust floater: | | | | |
Series 2004-11 Class 2A2, 3.83% 3/25/35 (f) | | $ 8,638,669 | | $ 8,636,982 |
Series 2004-6 Class 1A2, 3.85% 10/25/34 (f) | | 3,481,529 | | 3,487,748 |
Series 2005-1: | | | | |
Class M1, 3.92% 4/25/35 (f) | | 3,223,929 | | 3,220,529 |
Class M2, 3.96% 4/25/35 (f) | | 5,644,146 | | 5,639,516 |
Class M3, 3.99% 4/25/35 (f) | | 1,384,927 | | 1,383,466 |
Class M4, 4.21% 4/25/35 (f) | | 817,334 | | 818,164 |
Class M5, 4.23% 4/25/35 (f) | | 817,334 | | 817,174 |
Class M6, 4.28% 4/25/35 (f) | | 1,307,734 | | 1,307,479 |
Series 2005-2 Class 1A2, 3.77% 4/25/35 (f) | | 13,211,515 | | 13,201,194 |
Series 2005-3 Class A1, 3.7% 8/25/35 (f) | | 15,176,045 | | 15,149,962 |
Series 2005-4 Class 1B1, 4.76% 6/25/35 (f) | | 5,306,886 | | 5,282,839 |
Lehman Structured Securities Corp. floater Series 2005-1 Class A2, 3.67% 9/26/45 (c)(f) | | 16,153,164 | | 16,153,164 |
MASTR Adjustable Rate Mortgages Trust: | | | | |
floater Series 2005-1 Class 1A1, 3.73% 3/25/35 (f) | | 13,405,372 | | 13,396,993 |
Series 2004-6 Class 4A2, 4.1729% 7/25/34 (f) | | 5,969,000 | | 5,946,582 |
Merrill Lynch Mortgage Investors, Inc. floater: | | | | |
Series 2003-A Class 2A1, 3.85% 3/25/28 (f) | | 8,079,308 | | 8,122,924 |
Series 2003-B Class A1, 3.8% 4/25/28 (f) | | 7,852,610 | | 7,898,403 |
Series 2003-D Class A, 3.77% 8/25/28 (f) | | 7,479,616 | | 7,494,804 |
Series 2003-E Class A2, 3.4425% 10/25/28 (f) | | 10,687,128 | | 10,687,143 |
Series 2003-F Class A2, 3.7075% 10/25/28 (f) | | 12,892,959 | | 12,891,486 |
Series 2004-A Class A2, 3.6175% 4/25/29 (f) | | 11,584,437 | | 11,556,917 |
Series 2004-B Class A2, 3.79% 6/25/29 (f) | | 8,952,030 | | 8,930,464 |
Series 2004-C Class A2, 3.95% 7/25/29 (f) | | 12,856,157 | | 12,825,407 |
Series 2004-D Class A2, 3.4725% 9/25/29 (f) | | 9,971,432 | | 9,974,033 |
Series 2004-E: | | | | |
Class A2B, 3.7275% 11/25/29 (f) | | 8,523,921 | | 8,502,874 |
Class A2D, 3.9175% 11/25/29 (f) | | 1,982,307 | | 1,991,830 |
Series 2004-G Class A2, 3.95% 11/25/29 (f) | | 3,854,828 | | 3,854,422 |
Series 2005-A Class A2, 3.38% 2/25/30 (f) | | 10,800,867 | | 10,785,319 |
Mortgage Asset Backed Securities Trust floater Series 2002-NC1 Class M1, 4.31% 10/25/32 (f) | | 4,538,551 | | 4,555,535 |
MortgageIT Trust floater: | | | | |
Series 2004-2: | | | | |
Class A1, 3.83% 12/25/34 (f) | | 4,920,628 | | 4,927,758 |
Class A2, 3.91% 12/25/34 (f) | | 6,656,800 | | 6,696,298 |
Series 2005-2 Class 1A1, 3.72% 5/25/35 (f) | | 5,093,718 | | 5,097,498 |
Opteum Mortgage Acceptance Corp. floater Series 2005-3 Class APT, 3.75% 6/25/35 (f) | | 19,112,336 | | 19,123,533 |
Collateralized Mortgage Obligations - continued |
| Principal Amount | | Value |
Private Sponsor - continued |
Permanent Financing No. 1 PLC floater Series 1 Class 2C, 4.5594% 6/10/42 (f) | | $ 1,745,000 | | $ 1,749,384 |
Permanent Financing No. 3 PLC floater Series 2 Class C, 4.4294% 6/10/42 (f) | | 4,845,000 | | 4,893,450 |
Permanent Financing No. 4 PLC floater Series 2 Class C, 4.0994% 6/10/42 (f) | | 15,400,000 | | 15,475,306 |
Permanent Financing No. 5 PLC floater: | | | | |
Series 2 Class C, 4.0294% 6/10/42 (f) | | 4,215,000 | | 4,234,760 |
Series 3 Class C, 4.1994% 6/10/42 (f) | | 8,890,000 | | 8,967,788 |
Permanent Financing No. 6 PLC floater Series 6: | | | | |
Class 1C, 3.7294% 6/10/42 (f) | | 4,000,000 | | 4,000,572 |
Class 2C, 3.8294% 6/10/42 (f) | | 5,350,000 | | 5,352,343 |
Permanent Financing No. 7 PLC floater Series 7: | | | | |
Class 1B, 3.4694% 6/10/42 (f) | | 2,000,000 | | 1,999,375 |
Class 1C, 3.6594% 6/10/42 (f) | | 3,840,000 | | 3,838,800 |
Class 2C, 3.7094% 6/10/42 (f) | | 8,065,000 | | 8,054,919 |
Permanent Financing No. 8 PLC floater Series 8: | | | | |
Class 1C, 3.7475% 6/10/42 (f) | | 7,165,000 | | 7,162,621 |
Class 2C, 3.8175% 6/10/42 (f) | | 9,945,000 | | 9,941,688 |
Residential Asset Mortgage Products, Inc. sequential pay Series 2003-SL1 Class A31, 7.125% 4/25/31 | | 4,643,507 | | 4,727,342 |
Residential Finance LP/Residential Finance Development Corp. floater Series 2003-A: | | | | |
Class B4, 5.15% 3/10/35 (c)(f) | | 5,492,986 | | 5,575,381 |
Class B5, 5.7% 3/10/35 (c)(f) | | 5,684,725 | | 5,811,417 |
Residential Funding Securities Corp.: | | | | |
Series 2003-RP1 Class A1, 3.96% 11/25/34 (f) | | 2,829,110 | | 2,840,739 |
Series 2003-RP2 Class A1, 3.93% 6/25/33 (c)(f) | | 3,866,185 | | 3,881,108 |
Sequoia Mortgage Trust floater: | | | | |
Series 2003-5 Class A2, 3.41% 9/20/33 (f) | | 10,999,101 | | 10,996,236 |
Series 2003-7 Class A2, 2.885% 1/20/34 (f) | | 9,577,708 | | 9,569,385 |
Series 2004-1 Class A, 4.15% 2/20/34 (f) | | 6,379,791 | | 6,373,993 |
Series 2004-10 Class A4, 3.6681% 11/20/34 (f) | | 10,424,803 | | 10,408,138 |
Series 2004-3 Class A, 3.5463% 5/20/34 (f) | | 10,662,486 | | 10,588,333 |
Series 2004-4 Class A, 3.5881% 5/20/34 (f) | | 13,430,919 | | 13,399,990 |
Series 2004-5 Class A3, 3.77% 6/20/34 (f) | | 8,904,038 | | 8,897,082 |
Series 2004-6: | | | | |
Class A3A, 4.1475% 6/20/35 (f) | | 8,182,127 | | 8,176,739 |
Class A3B, 3.16% 7/20/34 (f) | | 1,022,766 | | 1,021,950 |
Series 2004-7: | | | | |
Class A3A, 3.2275% 8/20/34 (f) | | 7,642,675 | | 7,636,475 |
Class A3B, 3.4525% 7/20/34 (f) | | 1,375,260 | | 1,380,167 |
Collateralized Mortgage Obligations - continued |
| Principal Amount | | Value |
Private Sponsor - continued |
Sequoia Mortgage Trust floater: - continued | | | | |
Series 2004-8 Class A2, 3.45% 9/20/34 (f) | | $ 14,155,710 | | $ 14,148,404 |
Series 2005-1 Class A2, 3.68% 2/20/35 (f) | | 7,355,282 | | 7,354,362 |
Series 2005-2 Class A2, 3.36% 3/20/35 (f) | | 13,876,523 | | 13,876,523 |
Series 2005-3 Class A1, 3.46% 5/20/35 (f) | | 9,217,677 | | 9,217,677 |
Structured Adjustable Rate Mortgage Loan Trust floater Series 2001-14 Class A1, 3.77% 7/25/35 (f) | | 11,201,095 | | 11,201,095 |
Structured Asset Securities Corp. floater Series 2004-NP1 Class A, 3.86% 9/25/33 (c)(f) | | 2,553,470 | | 2,555,084 |
Thornburg Mortgage Securities Trust floater Series 2004-3 Class A, 3.83% 9/25/34 (f) | | 22,068,069 | | 22,129,394 |
WAMU Mortgage pass thru certificates: | | | | |
floater Series 2005-AR6 Class 2A-1A, 3.5448% 4/25/45 (f) | | 6,133,307 | | 6,133,607 |
Series 2005 AR11 Class A1C1, 3.6675% 8/25/40 (d)(f) | | 14,400,000 | | 14,400,000 |
Wells Fargo Mortgage Backed Securities Trust: | | | | |
Series 2004-M Class A3, 4.7024% 8/25/34 (f) | | 19,880,000 | | 19,789,156 |
Series 2005-AR12 Class 2A1, 4.322% 7/25/35 (f) | | 31,674,772 | | 31,407,532 |
TOTAL PRIVATE SPONSOR | | 895,419,920 |
U.S. Government Agency - 3.2% |
Fannie Mae: | | | | |
floater: | | | | |
Series 2000-38 Class F, 3.76% 11/18/30 (f) | | 1,103,802 | | 1,112,055 |
Series 2000-40 Class FA, 3.8144% 7/25/30 (f) | | 2,487,156 | | 2,498,099 |
Series 2002-89 Class F, 3.6144% 1/25/33 (f) | | 3,630,895 | | 3,636,484 |
target amortization class Series G94-2 Class D, 6.45% 1/25/24 | | 4,732,822 | | 4,849,182 |
Fannie Mae guaranteed REMIC pass thru certificates: | | | | |
floater: | | | | |
Series 2001-34 Class FR, 3.66% 8/18/31 (f) | | 2,500,934 | | 2,508,899 |
Series 2001-44 Class FB, 3.6144% 9/25/31 (f) | | 2,262,040 | | 2,268,738 |
Series 2001-46 Class F, 3.66% 9/18/31 (f) | | 6,514,676 | | 6,552,090 |
Series 2002-11 Class QF, 3.8144% 3/25/32 (f) | | 4,517,951 | | 4,551,812 |
Series 2002-36 Class FT, 3.8144% 6/25/32 (f) | | 1,503,724 | | 1,516,521 |
Series 2002-64 Class FE, 3.61% 10/18/32 (f) | | 2,256,514 | | 2,266,981 |
Series 2002-65 Class FA, 3.6144% 10/25/17 (f) | | 2,585,370 | | 2,590,545 |
Series 2002-74 Class FV, 3.7644% 11/25/32 (f) | | 8,360,131 | | 8,420,920 |
Series 2003-11: | | | | |
Class DF, 3.7644% 2/25/33 (f) | | 3,173,455 | | 3,195,574 |
Class EF, 3.7644% 2/25/33 (f) | | 2,602,157 | | 2,612,658 |
Collateralized Mortgage Obligations - continued |
| Principal Amount | | Value |
U.S. Government Agency - continued |
Fannie Mae guaranteed REMIC pass thru certificates: - continued | | | | |
floater: | | | | |
Series 2003-63 Class F1, 3.6144% 11/25/27 (f) | | $ 6,387,368 | | $ 6,390,916 |
planned amortization class: | | | | |
Series 1998-63 Class PG, 6% 3/25/27 | | 1,212,661 | | 1,212,198 |
Series 2001-62 Class PG, 6.5% 10/25/30 | | 4,183,652 | | 4,194,964 |
Series 2001-76 Class UB, 5.5% 10/25/13 | | 1,378,221 | | 1,379,002 |
Series 2002-16 Class QD, 5.5% 6/25/14 | | 345,479 | | 346,552 |
Series 2002-28 Class PJ, 6.5% 3/25/31 | | 4,950,777 | | 4,957,813 |
Series 2002-8 Class PD, 6.5% 7/25/30 | | 3,569,878 | | 3,584,870 |
Freddie Mac: | | | | |
floater Series 2510 Class FE, 3.7881% 10/15/32 (f) | | 5,998,150 | | 6,032,418 |
planned amortization class: | | | | |
Series 2091 Class PP, 6% 2/15/27 | | 1,286,641 | | 1,286,029 |
Series 2353 Class PC, 6.5% 9/15/15 | | 1,363,169 | | 1,366,992 |
Freddie Mac Manufactured Housing participation certificates guaranteed floater Series 2338 Class FJ, 3.5881% 7/15/31 (f) | | 5,197,631 | | 5,199,968 |
Freddie Mac Multi-class participation certificates guaranteed: | | | | |
floater: | | | | |
Series 2474 Class FJ, 3.7381% 7/15/17 (f) | | 4,556,922 | | 4,564,198 |
Series 2526 Class FC, 3.7881% 11/15/32 (f) | | 3,597,778 | | 3,616,182 |
Series 2538 Class FB, 3.7881% 12/15/32 (f) | | 6,607,741 | | 6,651,155 |
Series 2551 Class FH, 3.8381% 1/15/33 (f) | | 3,358,821 | | 3,373,027 |
planned amortization class: | | | | |
Series 2136 Class PE, 6% 1/15/28 | | 12,190,349 | | 12,248,248 |
Series 2394 Class ND, 6% 6/15/27 | | 1,550,172 | | 1,553,415 |
Series 2395 Class PE, 6% 2/15/30 | | 5,961,413 | | 6,000,327 |
Series 2398 Class DK, 6.5% 1/15/31 | | 372,760 | | 373,347 |
Series 2410 Class ML, 6.5% 12/15/30 | | 2,168,673 | | 2,179,211 |
Series 2420 Class BE, 6.5% 12/15/30 | | 2,595,889 | | 2,604,122 |
Series 2443 Class TD, 6.5% 10/15/30 | | 2,962,497 | | 2,977,827 |
Series 2461 Class PG, 6.5% 1/15/31 | | 2,737,118 | | 2,773,721 |
Series 2466 Class EC, 6% 10/15/27 | | 257,483 | | 257,163 |
Series 2483 Class DC, 5.5% 7/15/14 | | 1,861,588 | | 1,861,466 |
Series 2556 Class PM, 5.5% 2/15/16 | | 1,160,963 | | 1,159,984 |
Series 2776 Class UJ, 4.5% 5/15/20 (g) | | 7,104,375 | | 367,384 |
Series 2828 Class JA, 4.5% 1/15/10 | | 11,880,000 | | 11,903,044 |
sequential pay: | | | | |
Series 2430 Class ZE, 6.5% 8/15/27 | | 648,803 | | 649,120 |
Series 2480 Class QW, 5.75% 2/15/30 | | 871,905 | | 871,370 |
Collateralized Mortgage Obligations - continued |
| Principal Amount | | Value |
U.S. Government Agency - continued |
Freddie Mac Multi-class participation certificates guaranteed: - continued | | | | |
Series 2406: | | | | |
Class FP, 4.3681% 1/15/32 (f) | | $ 10,270,000 | | $ 10,502,819 |
Class PF, 4.3681% 12/15/31 (f) | | 8,125,000 | | 8,337,955 |
Series 2410 Class PF, 4.3681% 2/15/32 (f) | | 18,644,444 | | 19,070,154 |
Ginnie Mae guaranteed REMIC pass thru securities floater: | | | | |
Series 2001-46 Class FB, 3.7381% 5/16/23 (f) | | 2,988,811 | | 3,001,292 |
Series 2001-50 Class FV, 3.5881% 9/16/27 (f) | | 9,114,548 | | 9,113,939 |
Series 2002-24 Class FX, 3.9381% 4/16/32 (f) | | 2,630,687 | | 2,652,779 |
Series 2002-31 Class FW, 3.7881% 6/16/31 (f) | | 3,614,097 | | 3,633,687 |
Series 2002-5 Class KF, 3.7881% 8/16/26 (f) | | 617,815 | | 618,278 |
TOTAL U.S. GOVERNMENT AGENCY | | 207,447,494 |
TOTAL COLLATERALIZED MORTGAGE OBLIGATIONS (Cost $1,104,119,465) | 1,102,867,414 |
Commercial Mortgage Securities - 5.8% |
|
1301 Avenue of The Americas Trust Series 2000-1301: | | | | |
Class C, 7.44% 8/3/10 (c)(f) | | 5,025,000 | | 5,024,881 |
Class D, 7.54% 8/3/10 (c)(f) | | 6,695,000 | | 6,694,844 |
Banc of America Large Loan, Inc. floater: | | | | |
Series 2003-BBA2 Class A3, 3.7081% 11/15/15 (c)(f) | | 5,038,226 | | 5,041,400 |
Series 2005-BOCA: | | | | |
Class H, 4.3381% 12/15/16 (c)(f) | | 2,065,000 | | 2,061,834 |
Class J, 4.4881% 12/15/16 (c)(f) | | 1,020,000 | | 1,018,438 |
Class K, 4.7381% 12/15/16 (c)(f) | | 6,659,000 | | 6,650,611 |
Bayview Commercial Asset Trust floater: | | | | |
Series 2003-1 Class A, 4.04% 8/25/33 (c)(f) | | 6,644,316 | | 6,723,250 |
Series 2003-2: | | | | |
Class A, 4.04% 12/25/33 (c)(f) | | 13,522,369 | | 13,687,661 |
Class M1, 4.31% 12/25/33 (c)(f) | | 2,200,548 | | 2,236,841 |
Series 2004-1: | | | | |
Class A, 3.82% 4/25/34 (c)(f) | | 6,403,472 | | 6,414,728 |
Class B, 5.36% 4/25/34 (c)(f) | | 665,296 | | 672,910 |
Class M1, 4.02% 4/25/34 (c)(f) | | 582,134 | | 584,681 |
Class M2, 4.66% 4/25/34 (c)(f) | | 498,972 | | 504,819 |
Commercial Mortgage Securities - continued |
| Principal Amount | | Value |
Bayview Commercial Asset Trust floater: - continued | | | | |
Series 2004-2: | | | | |
Class A, 3.89% 8/25/34 (c)(f) | | $ 6,299,807 | | $ 6,330,814 |
Class M1, 4.04% 8/25/34 (c)(f) | | 2,031,330 | | 2,039,265 |
Series 2004-3: | | | | |
Class A1, 3.83% 1/25/35 (c)(f) | | 6,582,479 | | 6,605,519 |
Class A2, 3.88% 1/25/35 (c)(f) | | 914,869 | | 918,092 |
Class M1, 3.96% 1/25/35 (c)(f) | | 1,097,080 | | 1,098,564 |
Class M2, 4.46% 1/25/35 (c)(f) | | 715,487 | | 719,742 |
Series 2005-2A: | | | | |
Class M1, 3.73% 8/25/35 (c)(f) | | 1,297,812 | | 1,297,812 |
Class M2, 3.78% 8/25/35 (c)(f) | | 2,136,399 | | 2,136,399 |
Class M3, 3.8% 8/25/35 (c)(f) | | 1,183,006 | | 1,183,006 |
Class M4, 3.91% 8/25/35 (c)(f) | | 1,088,166 | | 1,088,166 |
Bear Stearns Commercial Mortgage Securities, Inc. floater: | | | | |
Series 2003-BA1A: | | | | |
Class JFCM, 4.98% 4/14/15 (c)(f) | | 1,344,296 | | 1,350,087 |
Class JMM, 4.88% 4/14/15 (c)(f) | | 1,384,053 | | 1,385,065 |
Class KFCM, 5.23% 4/14/15 (c)(f) | | 1,436,661 | | 1,443,179 |
Class KMM, 5.13% 4/14/15 (c)(f) | | 1,253,767 | | 1,254,776 |
Class LFCM, 5.63% 4/14/15 (c)(f) | | 1,601,905 | | 1,602,545 |
Class MFCM, 5.93% 4/14/15 (c)(f) | | 2,218,251 | | 2,219,234 |
Series 2004-BBA3 Class E, 4.0881% 6/15/17 (c)(f) | | 10,415,000 | | 10,415,949 |
Chase Commercial Mortgage Securities Corp. floater Series 2000-FL1A: | | | | |
Class B, 3.81% 12/12/13 (c)(f) | | 896,672 | | 897,536 |
Class C, 4.16% 12/12/13 (c)(f) | | 1,793,345 | | 1,801,374 |
COMM floater: | | | | |
Series 2001-FL5A Class E, 4.8881% 11/15/13 (c)(f) | | 3,049,546 | | 3,048,573 |
Series 2002-FL6: | | | | |
Class F, 4.8381% 6/14/14 (c)(f) | | 11,163,000 | | 11,190,451 |
Class G, 5.2881% 6/14/14 (c)(f) | | 5,000,000 | | 5,000,444 |
Series 2003-FL9 Class B, 3.8881% 11/15/15 (c)(f) | | 10,354,700 | | 10,383,149 |
Commercial Mortgage pass thru certificates floater: | | | | |
Series 2004-CNL: | | | | |
Class A2, 3.6881% 9/15/14 (c)(f) | | 3,570,000 | | 3,573,440 |
Class G, 4.3681% 9/15/14 (c)(f) | | 1,345,000 | | 1,345,538 |
Class H, 4.4681% 9/15/14 (c)(f) | | 1,430,000 | | 1,430,571 |
Class J, 4.9881% 9/15/14 (c)(f) | | 490,000 | | 491,560 |
Class K, 5.3881% 9/15/14 (c)(f) | | 770,000 | | 771,587 |
Class L, 5.5881% 9/15/14 (c)(f) | | 625,000 | | 624,693 |
Commercial Mortgage Securities - continued |
| Principal Amount | | Value |
Commercial Mortgage pass thru certificates floater: - continued | | | | |
Series 2004-HTL1: | | | | |
Class B, 3.8381% 7/15/16 (c)(f) | | $ 495,379 | | $ 495,732 |
Class D, 3.9381% 7/15/16 (c)(f) | | 1,125,628 | | 1,125,788 |
Class E, 4.1381% 7/15/16 (c)(f) | | 805,726 | | 806,031 |
Class F, 4.1881% 7/15/16 (c)(f) | | 852,671 | | 853,207 |
Class H, 4.6881% 7/15/16 (c)(f) | | 2,472,312 | | 2,473,143 |
Class J, 4.8381% 7/15/16 (c)(f) | | 950,314 | | 950,633 |
Class K, 5.7381% 7/15/16 (c)(f) | | 1,069,720 | | 1,069,257 |
Commercial Mortgage Pass-Through Certificates floater Series 2005-F10A: | | | | |
Class B, 3.6181% 4/15/17 (c)(f) | | 7,080,000 | | 7,080,000 |
Class C, 3.6581% 4/15/17 (c)(f) | | 3,006,000 | | 3,006,000 |
Class D, 3.6981% 4/15/17 (c)(f) | | 2,440,000 | | 2,440,000 |
Class E, 3.7581% 4/15/17 (c)(f) | | 1,821,000 | | 1,821,000 |
Class F, 3.7981% 4/15/17 (c)(f) | | 1,035,000 | | 1,035,000 |
Class G, 3.9381% 4/15/17 (c)(f) | | 1,035,000 | | 1,035,000 |
Class H, 4.0081% 4/15/17 (c)(f) | | 1,035,000 | | 1,035,000 |
Class I, 4.2381% 4/15/17 (c)(f) | | 335,000 | | 335,000 |
Class MOA3, 3.6881% 3/15/20 (c)(f) | | 4,590,000 | | 4,590,000 |
CS First Boston Mortgage Securities Corp.: | | | | |
floater: | | | | |
Series 2001-TFLA Class G, 5.1381% 12/15/11 (c)(f) | | 3,720,000 | | 3,702,795 |
Series 2002-TFLA Class C, 3.9688% 11/18/12 (c)(f) | | 3,675,000 | | 3,674,923 |
Series 2003-TF2A Class A2, 3.7081% 11/15/14 (c)(f) | | 9,500,000 | | 9,507,100 |
Series 2004-FL1 Class B, 3.8381% 5/15/14 (c)(f) | | 11,230,000 | | 11,235,571 |
Series 2004-HC1: | | | | |
Class A2, 3.8881% 12/15/21 (c)(f) | | 1,475,000 | | 1,474,997 |
Class B, 4.1381% 12/15/21 (c)(f) | | 3,835,000 | | 3,834,992 |
Series 2004-TF2A Class E, 3.8081% 11/15/19 (c)(f) | | 4,450,000 | | 4,456,884 |
Series 2004-TFL1: | | | | |
Class A2, 3.5781% 2/15/14 (c)(f) | | 7,005,000 | | 7,007,087 |
Class E, 3.9381% 2/15/14 (c)(f) | | 2,800,000 | | 2,806,033 |
Class F, 3.9881% 2/15/14 (c)(f) | | 2,325,000 | | 2,330,394 |
Class G, 4.2381% 2/15/14 (c)(f) | | 1,875,000 | | 1,880,617 |
Class H, 4.4881% 2/15/14 (c)(f) | | 1,400,000 | | 1,403,733 |
Class J, 4.7881% 2/15/14 (c)(f) | | 750,000 | | 753,724 |
Commercial Mortgage Securities - continued |
| Principal Amount | | Value |
CS First Boston Mortgage Securities Corp.: - continued | | | | |
Series 2005-TF2A Class F, 3.8881% 11/15/19 (c)(f) | | $ 1,540,000 | | $ 1,542,381 |
Series 2005-TFLA: | | | | |
Class C, 3.6281% 2/15/20 (c)(f) | | 5,650,000 | | 5,649,989 |
Class E, 3.7181% 2/15/20 (c)(f) | | 3,955,000 | | 3,954,992 |
Class F, 3.7681% 2/15/20 (c)(f) | | 1,745,000 | | 1,744,997 |
Class G, 3.9081% 2/15/20 (c)(f) | | 505,000 | | 504,998 |
Class H, 4.1381% 2/15/20 (c)(f) | | 715,000 | | 714,998 |
sequential pay Series 1997-C2 Class A2, 6.52% 1/17/35 | | 518,675 | | 522,823 |
Series 2003-TFLA Class G, 3.7357% 4/15/13 (c)(f) | | 446,933 | | 445,553 |
GMAC Commercial Mortgage Securities, Inc. floater Series 2001-FL1A Class E, 4.2% 2/11/11 (c)(f) | | 264,524 | | 264,175 |
GS Mortgage Securities Corp. II floater Series 2005-FL7A Class A1, 3.5% 11/6/19 (c)(f) | | 10,526,054 | | 10,527,180 |
ISTAR Asset Receivables Trust floater Series 2002-1A Class A2, 3.8613% 5/28/20 (c)(f) | | 2,727,545 | | 2,728,117 |
John Hancock Tower Mortgage Trust floater Series 2003-C5A Class B, 5.6585% 4/10/15 (c)(f) | | 8,245,000 | | 8,150,339 |
JP Morgan Chase Commercial Mortgage Security Corp.: | | | | |
floater Series 2005-FL1A: | | | | |
Class WH, 3.97% 6/15/19 (c)(f) | | 3,325,000 | | 3,325,100 |
Class WJ, 4.17% 6/15/19 (c)(f) | | 2,045,000 | | 2,045,061 |
Class WK, 4.57% 6/15/19 (c)(f) | | 3,065,000 | | 3,065,092 |
Series 2005-FL1A Class WX1, 1.2068% 6/15/19 (c)(f)(g) | | 240,000,000 | | 2,596,800 |
Lehman Brothers Floating Rate Commercial Mortgage Trust: | | | | |
floater: | | | | |
Series 2003-C4A: | | | | |
Class F, 5.6% 7/11/15 (c)(f) | | 813,387 | | 813,822 |
Class H, 6.35% 7/11/15 (c)(f) | | 8,267,264 | | 8,287,932 |
Series 2003-LLFA: | | | | |
Class A2, 3.77% 12/16/14 (c)(f) | | 11,700,000 | | 11,707,744 |
Class B, 3.98% 12/16/14 (c)(f) | | 4,615,000 | | 4,626,299 |
Class C, 4.08% 12/16/14 (c)(f) | | 4,982,000 | | 4,997,311 |
Series 2005-LLFA Class FAIR, 5.1138% 7/15/19 (c)(d)(f) | | 4,360,000 | | 4,360,000 |
Morgan Stanley Dean Witter Capital I Trust floater Series 2002-XLF Class F, 5.49% 8/5/14 (c)(f) | | 7,603,983 | | 7,603,972 |
Commercial Mortgage Securities - continued |
| Principal Amount | | Value |
Salomon Brothers Mortgage Securities VII, Inc.: | | | | |
floater: | | | | |
Series 2001-CDCA: | | | | |
Class C, 4.1881% 2/15/13 (c)(f) | | $ 10,495,000 | | $ 10,291,568 |
Class D, 4.1881% 2/15/13 (c)(f) | | 4,000,000 | | 3,891,288 |
Series 2003-CDCA: | | | | |
Class HEXB, 5.2881% 2/15/15 (c)(f) | | 770,000 | | 771,001 |
Class JEXB, 5.4881% 2/15/15 (c)(f) | | 1,300,000 | | 1,301,690 |
Class KEXB, 5.8881% 2/15/15 (c)(f) | | 960,000 | | 961,248 |
Series 2000-NL1 Class E, 7.0607% 10/15/30 (c)(f) | | 3,657,956 | | 3,672,236 |
SDG Macerich Properties LP floater Series 2000-1 Class A3, 3.7281% 5/15/09 (c)(f) | | 18,000,000 | | 18,008,086 |
STRIPS III Ltd./STRIPS III Corp. floater Series 2004-1A Class A, 3.78% 3/24/18 (c)(f) | | 7,263,029 | | 7,263,029 |
Wachovia Bank Commercial Mortgage Trust floater: | | | | |
Series 2004-WHL3: | | | | |
Class A2, 3.5681% 3/15/14 (c)(f) | | 3,510,000 | | 3,511,290 |
Class E, 3.8881% 3/15/14 (c)(f) | | 2,190,000 | | 2,192,749 |
Class F, 3.9381% 3/15/14 (c)(f) | | 1,755,000 | | 1,757,120 |
Class G, 4% 3/15/14 (c)(f) | | 875,000 | | 876,363 |
Series 2005-WL5A: | | | | |
Class KHP1, 3.7381% 1/15/18 (c)(f) | | 1,745,000 | | 1,745,000 |
Class KHP2, 3.9381% 1/15/18 (c)(f) | | 1,745,000 | | 1,745,000 |
Class KHP3, 4.2381% 1/15/18 (c)(f) | | 2,060,000 | | 2,060,000 |
Class KHP4, 4.3381% 1/15/18 (c)(f) | | 1,600,000 | | 1,600,000 |
Class KHP5, 4.5381% 1/15/18 (c)(f) | | 1,855,000 | | 1,855,000 |
TOTAL COMMERCIAL MORTGAGE SECURITIES (Cost $378,363,353) | 378,866,012 |
Interfund Loans - 0.1% |
| | | |
With Fidelity Equity-Income Fund, at 3.43442% due 8/1/05 (b) (Cost $8,443,000) | | 8,443,000 | | 8,443,000 |
Cash Equivalents - 40.4% |
| | Maturity
Amount | | Value |
Investments in repurchase agreements (Collateralized by U.S. Government Obligations, in a joint trading account at 3.32%, dated 7/29/05 due 8/1/05) (i) | | $ 2,354,814,398 | | $ 2,354,164,000 |
With Goldman Sachs & Co. at 3.41%, dated 7/1/05 due 8/23/05 (Collateralized by Mortgage Loan Obligations valued at $295,800,001, 0.9%- 10.36%, 4/18/17 - 6/25/44) (f)(h) | | 291,455,881 | | 289,998,492 |
TOTAL CASH EQUIVALENTS (Cost $2,644,164,000) | | 2,644,162,492 |
TOTAL INVESTMENT PORTFOLIO - 102.2% (Cost $6,679,436,405) | | | 6,685,115,608 |
NET OTHER ASSETS - (2.2)% | | | (140,968,200) |
NET ASSETS - 100% | | $ 6,544,147,408 |
Futures Contracts |
| Expiration Date | | Underlying Face Amount at Value | | Unrealized Appreciation/
(Depreciation) |
Sold |
Eurodollar Contracts |
73 Eurodollar 90 Day Index Contracts | Dec. 2005 | | $ 72,221,638 | | $ 34,806 |
49 Eurodollar 90 Day Index Contracts | March 2006 | | 48,464,675 | | 28,036 |
32 Eurodollar 90 Day Index Contracts | June 2006 | | 31,645,600 | | 16,247 |
27 Eurodollar 90 Day Index Contracts | Sept. 2006 | | 26,698,612 | | 16,355 |
26 Eurodollar 90 Day Index Contracts | Dec. 2006 | | 25,707,500 | | 14,421 |
24 Eurodollar 90 Day Index Contracts | March 2007 | | 23,729,700 | | 12,329 |
17 Eurodollar 90 Day Index Contracts | June 2007 | | 16,807,688 | | 5,970 |
16 Eurodollar 90 Day Index Contracts | Sept. 2007 | | 15,818,200 | | 5,711 |
15 Eurodollar 90 Day Index Contracts | Dec. 2007 | | 14,828,250 | | 5,590 |
15 Eurodollar 90 Day Index Contracts | March 2008 | | 14,827,875 | | 5,015 |
8 Eurodollar 90 Day Index Contracts | June 2008 | | 7,907,800 | | 7,518 |
7 Eurodollar 90 Day Index Contracts | Sept. 2008 | | 6,918,888 | | 6,885 |
TOTAL EURODOLLAR CONTRACTS | | 158,883 |
Swap Agreements |
| | | Notional Amount | | Value |
Credit Default Swap |
Receive from Citibank, upon default event of DaimlerChrysler NA Holding Corp., par value of the notional amount of DaimlerChrysler NA Holding Corp. 6.5% 11/15/13, and pay quarterly notional amount multiplied by .8% | June 2007 | | $ 14,000,000 | | $ (135,972) |
Receive quarterly notional amount multiplied by 1.12% and pay Morgan Stanley, Inc. upon default of Comcast Cable Communications, Inc., par value of the notional amount of Comcast Cable Communications, Inc. 6.75% 1/30/11 | June 2006 | | 10,000,000 | | 102,057 |
TOTAL CREDIT DEFAULT SWAP | 24,000,000 | | (33,915) |
Swap Agreements - continued |
| Expiration Date | | Notional Amount | | Value |
Total Return Swap |
Receive monthly notional amount multiplied by the nominal spread appreciation of the Lehman Brothers CMBS U.S. Aggregate Index adjusted by a modified duration factor plus 10 basis points and pay monthly notional amount multiplied by the nominal spread depreciation of the Lehman Brothers CMBS U.S. Aggregate Index adjusted by a modified duration factor with Lehman Brothers, Inc. | Oct. 2005 | | $ 48,200,000 | | $ 46,335 |
Receive monthly notional amount multiplied by the nominal spread appreciation of the Lehman Brothers CMBS U.S. Aggregate Index adjusted by a modified duration factor plus 25 basis points and pay monthly notional amount multiplied by the nominal spread depreciation of the Lehman Brothers CMBS U.S. Aggregate Index adjusted by a modified duration factor with Lehman Brothers, Inc. | Dec. 2005 | | 30,000,000 | | 32,511 |
Receive monthly notional amount multiplied by the nominal spread appreciation of the Lehman Brothers CMBS U.S. Aggregate Index adjusted by a modified duration factor plus 30 basis points and pay monthly notional amount multiplied by the nominal spread depreciation of the Lehman Brothers CMBS U.S. Aggregate Index adjusted by a modified duration factor with Lehman Brothers, Inc. | August 2005 | | 35,100,000 | | 33,945 |
Swap Agreements - continued |
| Expiration Date | | Notional Amount | | Value |
Receive monthly notional amount multiplied by the nominal spread appreciation of the Lehman Brothers CMBS U.S. Aggregate Index adjusted by a modified duration factor plus 22 basis points and pay monthly notional amount multiplied by the nominal spread depreciation of the Lehman Brothers CMBS U.S. Aggregate Index adjusted by a modified duration factor with Lehman Brothers, Inc. | Jan. 2006 | | $ 35,100,000 | | $ 32,229 |
Receive monthly a return equal to Lehman Brothers ABS Floating Rate Index and pay monthly a floating rate based on the 1- month LIBOR minus 11.1 basis points with Lehman Brothers, Inc. | Nov. 2005 | | 30,000,000 | | 0 |
TOTAL TOTAL RETURN SWAP | 178,400,000 | | 145,020 |
| | $ 202,400,000 | | $ 111,105 |
Legend |
(a) Debt obligation initially issued at one coupon which converts to a higher coupon at a specified date. The rate shown is the rate at period end. |
(b) Affiliated entity |
(c) Security exempt from registration under Rule 144A of the Securities Act of 1933. These securities may be resold in transactions exempt from registration, normally to qualified institutional buyers. At the period end, the value of these securities amounted to $586,119,417 or 9.0% of net assets. |
(d) Security or a portion of the security purchased on a delayed delivery or when-issued basis. |
(e) Security or a portion of the security was pledged to cover margin requirements for futures contracts. At the period end, the value of securities pledged amounted to $994,635. |
(f) The coupon rate shown on floating or adjustable rate securities represents the rate at period end. |
(g) Security represents right to receive monthly interest payments on an underlying pool of mortgages. Principal shown is the par amount of the mortgage pool. |
(h) The maturity amount is based on the rate at period end. |
(i) Additional information on each counterparty to the repurchase agreement is as follows: |
Repurchase Agreement/
Counterparty | Value |
$2,354,164,000 due 8/1/05 at 3.32% | |
Banc of America Securities LLC. | $ 471,596,247 |
Bank of America, National Association | 244,985,063 |
Barclays Capital Inc. | 979,940,254 |
Countrywide Securities Corporation | 244,985,063 |
Morgan Stanley & Co. Incorporated. | 351,411,107 |
UBS Securities LLC | 61,246,266 |
| $ 2,354,164,000 |
Income Tax Information |
At July 31, 2005, the aggregate cost of investment securities for income tax purposes was $6,679,021,266. Net unrealized appreciation aggregated $6,094,342, of which $11,067,257 related to appreciated investment securities and $4,972,915 related to depreciated investment securities. |
Annual Report
Annual Report
Annual Report
Investment Adviser
Fidelity Management & Research Company
Boston, MA
Investment Sub-Advisers
Fidelity Investments
Money Management, Inc.
Fidelity International Investment Advisors
Fidelity International Investment Advisors
(U.K.) Limited
General Distributor
Fidelity Distributors Corporation
Boston, MA
Transfer and Service Agent
Fidelity Investments Institutional
Operations Company, Inc.
Boston, MA
Custodian
Citibank, N.A.
New York, NY
AUSBI-UANN-0905
1.804593.101
(Fidelity Investment logo)(registered trademark)
Corporate Headquarters
82 Devonshire St., Boston, MA 02109
www.fidelity.com
Item 2. Code of Ethics
As of the end of the period, July 31, 2005, Fidelity Income Fund (the trust) has adopted a code of ethics, as defined in Item 2 of Form N-CSR, that applies to its President and Treasurer and its Chief Financial Officer. A copy of the code of ethics is filed as an exhibit to this Form N-CSR.
Item 3. Audit Committee Financial Expert
The Board of Trustees of the trust has determined that Marie L. Knowles is an audit committee financial expert, as defined in Item 3 of Form N-CSR. Ms. Knowles is independent for purposes of Item 3 of Form N-CSR.
Item 4. Principal Accountant Fees and Services
(a) Audit Fees.
For the fiscal years ended July 31, 2005 and July 31, 2004, the aggregate Audit Fees billed by PricewaterhouseCoopers LLP (PwC) for professional services rendered for the audits of the financial statements, or services that are normally provided in connection with statutory and regulatory filings or engagements for those fiscal years, for the Fidelity Ginnie Mae Fund, Fidelity Government Income Fund, Fidelity Intermediate Government Income Fund, Fidelity Total Bond Fund and Fidelity Ultra-Short Bond Fund (the funds) and for all funds in the Fidelity Group of Funds are shown in the table below.
Fund | 2005A | 2004A |
Fidelity Ginnie Mae Fund | $99,000 | $80,000 |
Fidelity Government Income Fund | $61,000 | $64,000 |
Fidelity Intermediate Government Income Fund | $56,000 | $62,000 |
Fidelity Total Bond Fund | $46,000 | $49,000 |
Fidelity Ultra-Short Bond Fund | $33,000 | $39,000 |
All funds in the Fidelity Group of Funds audited by PwC | $11,600,000 | $10,600,000 |
A | Aggregate amounts may reflect rounding. |
(b) Audit-Related Fees.
In each of the fiscal years ended July 31, 2005 and July 31, 2004 the aggregate Audit-Related Fees billed by PwC for services rendered for assurance and related services to each fund that are reasonably related to the performance of the audit or review of the fund's financial statements, but not reported as Audit Fees, are shown in the table below.
Fund | 2005A | 2004A |
Fidelity Ginnie Mae Fund | $0 | $0 |
Fidelity Government Income Fund | $0 | $0 |
Fidelity Intermediate Government Income Fund | $0 | $0 |
Fidelity Total Bond Fund | $0 | $0 |
Fidelity Ultra-Short Bond Fund | $0 | $0 |
A | Aggregate amounts may reflect rounding. |
In each of the fiscal years ended July 31, 2005 and July 31, 2004, the aggregate Audit-Related Fees that were billed by PwC that were required to be approved by the Audit Committee for services rendered on behalf of Fidelity Management & Research Company (FMR) and entities controlling, controlled by, or under common control with FMR (not including any sub-adviser whose role is primarily portfolio management and is subcontracted with or overseen by another investment adviser) that provide ongoing services to the funds ("Fund Service Providers") for assurance and related services that relate directly to the operations and financial reporting of each fund that are reasonably related to the performance of the audit or review of the fund's financial statements, but not reported as Audit Fees, are shown in the table below.
Billed By | 2005A | 2004A |
PwC | $0 | $50,000 |
A | Aggregate amounts may reflect rounding. |
Fees included in the audit-related category comprise assurance and related services (e.g., due diligence services) that are traditionally performed by the independent registered public accounting firm. These audit-related services include due diligence related to mergers and acquisitions, accounting consultations and audits in connection with acquisitions, internal control reviews, attest services that are not required by statute or regulation and consultation concerning financial accounting and reporting standards.
(c) Tax Fees.
In each of the fiscal years ended July 31, 2005 and July 31, 2004, the aggregate Tax Fees billed by PwC for professional services rendered for tax compliance, tax advice, and tax planning for each fund is shown in the table below.
Fund | 2005A | 2004A |
Fidelity Ginnie Mae Fund | $2,500 | $2,300 |
Fidelity Government Income Fund | $2,500 | $2,300 |
Fidelity Intermediate Government Income Fund | $2,500 | $2,300 |
Fidelity Total Bond Fund | $2,500 | $2,100 |
Fidelity Ultra-Short Bond Fund | $2,500 | $2,100 |
A | Aggregate amounts may reflect rounding. |
In each of the fiscal years ended July 31, 2005 and July 31, 2004, the aggregate Tax Fees billed by PwC that were required to be approved by the Audit Committee for professional services rendered on behalf of the Fund Service Providers for tax compliance, tax advice, and tax planning that relate directly to the operations and financial reporting of each fund is shown in the table below.
Billed By | 2005A | 2004A |
PwC | $0 | $0 |
A | Aggregate amounts may reflect rounding. |
Fees included in the Tax Fees category comprise all services performed by professional staff in the independent registered public accounting firm's tax division except those services related to the audit. Typically, this category would include fees for tax compliance, tax planning, and tax advice. Tax compliance, tax advice, and tax planning services include preparation of original and amended tax returns, claims for refund and tax payment-planning services, assistance with tax audits and appeals, tax advice related to mergers and acquisitions and requests for rulings or technical advice from taxing authorities.
(d) All Other Fees.
In each of the fiscal years ended July 31, 2005 and July 31, 2004, the aggregate Other Fees billed by PwC for all other non-audit services rendered to the funds is shown in the table below.
Fund | 2005A | 2004A |
Fidelity Ginnie Mae Fund | $4,900 | $5,200 |
Fidelity Government Income Fund | $5,400 | $4,500 |
Fidelity Intermediate Government Income Fund | $2,200 | $2,200 |
Fidelity Total Bond Fund | $1,700 | $1,400 |
Fidelity Ultra-Short Bond Fund | $2,000 | $1,500 |
A | Aggregate amounts may reflect rounding. |
In each of the fiscal years ended July 31, 2005 and July 31, 2004, the aggregate Other Fees billed by PwC that were required to be approved by the Audit Committee for all other non-audit services rendered on behalf of the Fund Service Providers that relate directly to the operations and financial reporting of each fund is shown in the table below.
Billed By | 2005A | 2004A |
PwC | $280,000 | $280,000 |
A | Aggregate amounts may reflect rounding. |
Fees included in the All Other Fees category include services related to internal control reviews, strategy and other consulting, financial information systems design and implementation, consulting on other information systems, and other tax services unrelated to the fund.
(e) (1) | Audit Committee Pre-Approval Policies and Procedures: |
The trust's Audit Committee must pre-approve all audit and non-audit services provided by the independent registered public accounting firm relating to the operations or financial reporting of the funds. Prior to the commencement of any audit or non-audit services to a fund, the Audit Committee reviews the services to determine whether they are appropriate and permissible under applicable law.
The trust's Audit Committee has adopted policies and procedures to, among other purposes, provide a framework for the Committee's consideration of non-audit services by the audit firms that audit the Fidelity funds. The policies and procedures require that any non-audit service provided by a fund audit firm to a Fidelity Fund and any non-audit service provided by a fund auditor to a Fund Service Provider that relates directly to the operations and financial reporting of a Fidelity fund (Covered Service) are subject to approval by the Audit Committee before such service is provided. Non-audit services provided by a fund audit firm for a Fund Service Provider that do not relate directly to the operations and financial reporting of a Fidelity fund (Non-Covered Service) but that are expected to exceed $50,000 are also subject to pre-approval by the Audit Committee.
All Covered Services, as well as Non-Covered Services that are expected to exceed $50,000, must be approved in advance of provision of the service either: (i) by formal resolution of the Audit Committee, or (ii) by oral or written approval of the service by the Chair of the Audit Committee (or if the Chair is unavailable, such other member of the Audit Committee as may be designated by the Chair to act in the Chair's absence). The approval contemplated by (ii) above is permitted where the Treasurer determines that action on such an engagement is necessary before the next meeting of the Audit Committee. Neither pre-approval nor advance notice of Non-Covered Service engagements for which fees are not expected to exceed $50,000 is required; such engagements are to be reported to the Audit Committee monthly.
(e) (2) | Services approved pursuant to paragraph (c)(7)(i)(C) of Rule 2-01 of Regulation S-X: |
Audit-Related Fees:
There were no amounts that were approved by the Audit Committee pursuant to the de minimis exception for the fiscal years ended July 31, 2005 and July 31, 2004 on behalf of each fund.
There were no amounts that were required to be approved by the Audit Committee pursuant to the de minimis exception for the fiscal years ended July 31, 2005 and July 31, 2004 on behalf of the Fund Service Providers that relate directly to the operations and financial reporting of each fund.
Tax Fees:
There were no amounts that were approved by the Audit Committee pursuant to the de minimis exception for the fiscal years ended July 31, 2005 and July 31, 2004 on behalf of each fund.
There were no amounts that were required to be approved by the Audit Committee pursuant to the de minimis exception for the fiscal years ended July 31, 2005 and July 31, 2004 on behalf of the Fund Service Providers that relate directly to the operations and financial reporting of each fund.
All Other Fees:
There were no amounts that were approved by the Audit Committee pursuant to the de minimis exception for the fiscal years ended July 31, 2005 and July 31, 2004 on behalf of each fund.
There were no amounts that were required to be approved by the Audit Committee pursuant to the de minimis exception for the fiscal years ended July 31, 2005 and July 31, 2004 on behalf of the Fund Service Providers that relate directly to the operations and financial reporting of each fund.
(f) According to PwC for the fiscal year ended July 31, 2005, the percentage of hours spent on the audit of each fund's financial statements for the most recent fiscal year that were attributed to work performed by persons who are not full-time, permanent employees of PwC is as follows:
Fund | 2005 |
Fidelity Ginnie Mae Fund | 0% |
Fidelity Government Income Fund | 0% |
Fidelity Intermediate Government Income Fund | 0% |
Fidelity Total Bond Fund | 0% |
Fidelity Ultra-Short Bond Fund | 0% |
(g) For the fiscal years ended July 31, 2005 and July 31, 2004, the aggregate fees billed by PwC of $3,600,000A and $1,900,000A for non-audit services rendered on behalf of the funds, FMR (not including any sub-adviser whose role is primarily portfolio management and is subcontracted with or overseen by another investment adviser) and Fund Service Providers relating to Covered Services and Non-Covered Services are shown in the table below.
| 2005A | 2004A |
Covered Services | $350,000 | $400,000 |
Non-Covered Services | $3,250,000 | $1,500,000 |
A | Aggregate amounts may reflect rounding. |
(h) The trust's Audit Committee has considered Non-Covered Services that were not pre-approved that were provided by PwC to Fund Service Providers to be compatible with maintaining the independence of PwC in its audit of the funds, taking into account representations from PwC, in accordance with Independence Standards Board Standard No.1, regarding its independence from the funds and their related entities.
Item 5. Audit Committee of Listed Registrants
Not applicable.
Item 6. Schedule of Investments
Not applicable.
Item 7. Disclosure of Proxy Voting Policies and Procedures for Closed-End Management Investment Companies
Not applicable.
Item 8. Portfolio Managers of Closed-End Management Investment Companies
Not applicable.
Item 9. Purchase of Equity Securities by Closed-End Management Investment Company and Affiliated Purchasers
Not applicable.
Item 10. Submission of Matters to a Vote of Security Holders
There were no material changes to the procedures by which shareholders may recommend nominees to the trust's Board of Trustees.
Item 11. Controls and Procedures
(a)(i) The President and Treasurer and the Chief Financial Officer have concluded that the trust's disclosure controls and procedures (as defined in Rule 30a-3(c) under the Investment Company Act) provide reasonable assurances that material information relating to the trust is made known to them by the appropriate persons, based on their evaluation of these controls and procedures as of a date within 90 days of the filing date of this report.
(a)(ii) There was no change in the trust's internal control over financial reporting (as defined in Rule 30a-3(d) under the Investment Company Act) that occurred during the second fiscal quarter of the period covered by this report that has materially affected, or is reasonably likely to materially affect, the trust's internal control over financial reporting.
Item 12. Exhibits
(a) | (1) | Code of Ethics pursuant to Item 2 of Form N-CSR is filed and attached hereto as EX-99.CODE ETH. |
(a) | (2) | Certification pursuant to Rule 30a-2(a) under the Investment Company Act of 1940 (17 CFR 270.30a-2(a)) is filed and attached hereto as Exhibit 99.CERT. |
(a) | (3) | Not applicable. |
(b) | | Certification pursuant to Rule 30a-2(b) under the Investment Company Act of 1940 (17 CFR 270.30a-2(b)) is furnished and attached hereto as Exhibit 99.906CERT. |
SIGNATURES
Pursuant to the requirements of the Securities Exchange Act of 1934 and the Investment Company Act of 1940, the registrant has duly caused this report to be signed on its behalf by the undersigned, thereunto duly authorized.
Fidelity Income Fund
By: | /s/Christine Reynolds |
| Christine Reynolds |
| President and Treasurer |
| |
Date: | September 21, 2005 |
Pursuant to the requirements of the Securities Exchange Act of 1934 and the Investment Company Act of 1940, this report has been signed below by the following persons on behalf of the registrant and in the capacities and on the dates indicated.
By: | /s/Christine Reynolds |
| Christine Reynolds |
| President and Treasurer |
| |
Date: | September 21, 2005 |
By: | /s/Timothy F. Hayes |
| Timothy F. Hayes |
| Chief Financial Officer |
| |
Date: | September 21, 2005 |