UNITED STATES
SECURITIES AND EXCHANGE COMMISSION
Washington, D.C. 20549
FORM N-CSR
CERTIFIED SHAREHOLDER REPORT OF REGISTERED
MANAGEMENT INVESTMENT COMPANIES
Investment Company Act file number 811-04085
Fidelity Income Fund
(Exact name of registrant as specified in charter)
245 Summer St., Boston, Massachusetts 02210
(Address of principal executive offices) (Zip code)
Margaret Carey, Secretary
245 Summer St.
Boston, Massachusetts 02210
(Name and address of agent for service)
Registrant's telephone number, including area code:
617-563-7000
Date of fiscal year end: | July 31 |
Date of reporting period: | July 31, 2024 |
Item 1.
Reports to Stockholders
ANNUAL SHAREHOLDER REPORT | AS OF JULY 31, 2024 | ||
| | Fidelity Managed Retirement 2035 Fund℠ Fidelity Managed Retirement 2035 Fund℠ Class K : FMRZX | |
| Costs of a $10,000 investment | Costs paid as a percentage of a $10,000 investment | ||
| Class K | $ 40 | 0.38% |
Class K | $10,000 | $10,812 | $11,956 |
Fidelity Managed Retirement 2035 Composite Index | $10,000 | $10,787 | $11,909 |
S&P 500® Index | $10,000 | $11,898 | $14,533 |
Bloomberg U.S. Aggregate Bond Index | $10,000 | $9,962 | $10,470 |
| 2022 | 2023 | 2024 |
 |
| 1 Year | Life of Fund A | |
| Class K | 10.58% | 11.60% |
| Fidelity Managed Retirement 2035 Composite Index | 10.39% | 11.33% |
| S&P 500® Index | 24.56% | 26.43% |
| Bloomberg U.S. Aggregate Bond Index | 5.10% | 2.86% |
Visit www.401k.com for more recent performance information. |
The Fund's past performance is not a good predictor of the Fund's future performance. The graph and table do not reflect the deduction of taxes that a shareholder would pay on fund distributions or redemption of fund shares. |
KEY FACTS | ||
| Fund Size | $10,439,772 | |
| Number of Holdings | 32 | |
| Total Advisory Fee | $16,710 | |
| Portfolio Turnover | 60% |
(as of July 31, 2024)
| Bond Funds | 36.9 |
| Domestic Equity Funds | 27.5 |
| International Equity Funds | 25.8 |
| Inflation-Protected Bond Funds | 9.8 |
| Short-Term Funds | 0.0 |
| Short-Term Investments and Net Other Assets (Liabilities) | 0.0 |
ASSET ALLOCATION (% of Fund's net assets) |
 |
TOP HOLDINGS (% of Fund's net assets) | ||
| Fidelity Series 5+ Year Inflation-Protected Bond Index Fund | 8.4 | |
| Fidelity Series Government Bond Index Fund | 8.2 | |
| Fidelity Series Investment Grade Bond Fund | 8.0 | |
| Fidelity Series Large Cap Value Index Fund | 7.4 | |
| Fidelity Series Emerging Markets Opportunities Fund | 7.3 | |
| Fidelity Series Blue Chip Growth Fund | 6.2 | |
| Fidelity Series Corporate Bond Fund | 5.3 | |
| Fidelity Series Investment Grade Securitized Fund | 5.2 | |
| Fidelity Series Long-Term Treasury Bond Index Fund | 4.8 | |
| Fidelity Series International Growth Fund | 4.1 | |
| 64.9 |
| Fidelity, the Fidelity Investments Logo and all other Fidelity trademarks or service marks used herein are trademarks or service marks of FMR LLC. Any third-party marks that are used herein are trademarks or service marks of their respective owners. © 2024 FMR LLC. All rights reserved. | ||
 | For additional information about the Fund; including its prospectus, financial information, holdings and proxy information, scan the QR code or visit fundresearch.fidelity.com/prospectus/sec 1.9913578.100 7307-TSRA-0924 | |
ANNUAL SHAREHOLDER REPORT | AS OF JULY 31, 2024 | ||
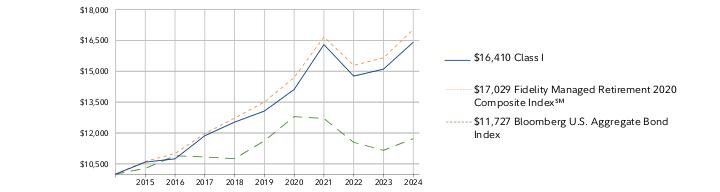
| | Fidelity Managed Retirement 2020 Fund℠ Fidelity Advisor Managed Retirement 2020 Fund℠ Class I : FIIVX | |
| Costs of a $10,000 investment | Costs paid as a percentage of a $10,000 investment | ||
| Class I | $ 49 | 0.47% |
Class I | $10,000 | $10,584 | $10,745 | $11,868 | $12,530 | $13,065 | $14,116 | $16,296 | $14,764 | $15,103 | $16,410 |
Fidelity Managed Retirement 2020 Composite Index℠ | $10,000 | $10,619 | $11,003 | $11,968 | $12,723 | $13,505 | $14,696 | $16,666 | $15,291 | $15,651 | $17,029 |
Bloomberg U.S. Aggregate Bond Index | $10,000 | $10,282 | $10,893 | $10,837 | $10,750 | $11,619 | $12,795 | $12,705 | $11,547 | $11,158 | $11,727 |
| 2014 | 2015 | 2016 | 2017 | 2018 | 2019 | 2020 | 2021 | 2022 | 2023 | 2024 |
 |
| 1 Year | 5 Year | 10 Year | |
| Class I | 8.65% | 4.67% | 5.08% |
| Fidelity Managed Retirement 2020 Composite Index℠ | 8.80% | 4.75% | 5.47% |
| Bloomberg U.S. Aggregate Bond Index | 5.10% | 0.19% | 1.61% |
Visit institutional.fidelity.com for more recent performance information. |
The Fund's past performance is not a good predictor of the Fund's future performance. The graph and table do not reflect the deduction of taxes that a shareholder would pay on fund distributions or redemption of fund shares. |
KEY FACTS | ||
| Fund Size | $8,371,922 | |
| Number of Holdings | 33 | |
| Total Advisory Fee | $38,515 | |
| Portfolio Turnover | 32% |
(as of July 31, 2024)
| Bond Funds | 45.9 |
| International Equity Funds | 19.3 |
| Domestic Equity Funds | 17.9 |
| Inflation-Protected Bond Funds | 15.8 |
| Short-Term Funds | 0.9 |
| Short-Term Investments and Net Other Assets (Liabilities) | 0.2 |
ASSET ALLOCATION (% of Fund's net assets) |
 |
TOP HOLDINGS (% of Fund's net assets) | ||
| Fidelity Series Government Bond Index Fund | 11.5 | |
| Fidelity Series Investment Grade Bond Fund | 11.2 | |
| Fidelity Series 0-5 Year Inflation-Protected Bond Index Fund | 11.1 | |
| Fidelity Series Corporate Bond Fund | 7.5 | |
| Fidelity Series Investment Grade Securitized Fund | 7.3 | |
| Fidelity Series Emerging Markets Opportunities Fund | 5.9 | |
| Fidelity Series Large Cap Value Index Fund | 4.8 | |
| Fidelity Series 5+ Year Inflation-Protected Bond Index Fund | 4.7 | |
| Fidelity Series International Developed Markets Bond Index Fund | 4.0 | |
| Fidelity Series Blue Chip Growth Fund | 3.9 | |
| 71.9 | ||
| Fidelity, the Fidelity Investments Logo and all other Fidelity trademarks or service marks used herein are trademarks or service marks of FMR LLC. Any third-party marks that are used herein are trademarks or service marks of their respective owners. © 2024 FMR LLC. All rights reserved. | ||
 | For additional information about the Fund; including its prospectus, financial information, holdings and proxy information, scan the QR code or visit fundresearch.fidelity.com/prospectus/sec 1.9913502.100 2000-TSRA-0924 | |
ANNUAL SHAREHOLDER REPORT | AS OF JULY 31, 2024 | This report describes changes to the Fund that occurred during the reporting period. | |
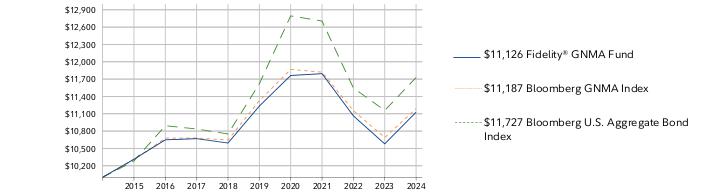
| | Fidelity® GNMA Fund Fidelity® GNMA Fund : FGMNX | |
| Costs of a $10,000 investment | Costs paid as a percentage of a $10,000 investment | ||
| Fidelity® GNMA Fund | $ 46 | 0.45% |
- •U.S. taxable investment-grade bonds achieved a solid gain for the 12 months ending July 31, 2024. The period was marked by high levels of volatility, as investors anxiously awaited the arrival of interest-rate reductions by the U.S. Federal Reserve.
- •Against this backdrop, positioning in GNMA securities was the primary contributor to the fund's performance versus the benchmark, the Bloomberg GNMA Index, for the fiscal year. This relative gain was led by a timely overweight established last fall after GNMA securities suffered sharp selloffs in September and October. The bond class then rebounded through the end of 2023.
- •Picks among GNMAs, particularly overweights to securities with coupons 3% and below and 5% and above, also boosted the fund's relative performance.
- •The fund's non-benchmark exposure to 15- and 20-year Fannie Mae/Freddie Mac mortgage-backed securities provided another performance lift.
- •Overweights to MBS made up of reverse mortgages (including home equity conversion mortgages insured by the Federal Housing Administration) added value as well.
- •An overweight to government-agency securities made up of commercial mortgages was another notable contributor. These CMBS were among the mortgage market's best performers the past 12 months.
- •In contrast, the biggest detractor from relative performance was an untimely decision to reduce exposure to securities with coupons 5% and above in the fall of 2023.
Fidelity® GNMA Fund | $10,000 | $10,313 | $10,649 | $10,669 | $10,593 | $11,233 | $11,762 | $11,794 | $11,064 | $10,579 | $11,126 |
Bloomberg GNMA Index | $10,000 | $10,305 | $10,678 | $10,681 | $10,644 | $11,326 | $11,868 | $11,820 | $11,155 | $10,688 | $11,187 |
Bloomberg U.S. Aggregate Bond Index | $10,000 | $10,282 | $10,893 | $10,837 | $10,750 | $11,619 | $12,795 | $12,705 | $11,547 | $11,158 | $11,727 |
| 2014 | 2015 | 2016 | 2017 | 2018 | 2019 | 2020 | 2021 | 2022 | 2023 | 2024 |
 |
| 1 Year | 5 Year | 10 Year | |
| Fidelity® GNMA Fund | 5.17% | -0.19% | 1.07% |
| Bloomberg GNMA Index | 4.67% | -0.25% | 1.13% |
| Bloomberg U.S. Aggregate Bond Index | 5.10% | 0.19% | 1.61% |
Visit www.fidelity.com for more recent performance information. |
The Fund's past performance is not a good predictor of the Fund's future performance. The graph and table do not reflect the deduction of taxes that a shareholder would pay on fund distributions or redemption of fund shares. |
KEY FACTS | ||
| Fund Size | $2,053,126,666 | |
| Number of Holdings | 2,223 | |
| Total Advisory Fee | $6,162,344 | |
| Portfolio Turnover | 781% |
(as of July 31, 2024)
COUPON DISTRIBUTION (% of Fund's net assets) | ||
| 0.01 - 0.99% | 0.0 | |
| 1 - 1.99% | 1.6 | |
| 2 - 2.99% | 43.6 | |
| 3 - 3.99% | 36.0 | |
| 4 - 4.99% | 19.1 | |
| 5 - 5.99% | 12.2 | |
| 6 - 6.99% | 10.6 | |
| 7 - 7.99% | 0.0 | |
| 8 - 8.99% | 0.0 | |
| 9 - 9.99% | 0.0 | |
| U.S. Government Agency - Mortgage Securities | 101.4 |
| CMOs and Other Mortgage Related Securities | 13.3 |
| U.S. Treasury Obligations | 8.4 |
ASSET ALLOCATION (% of Fund's net assets) |
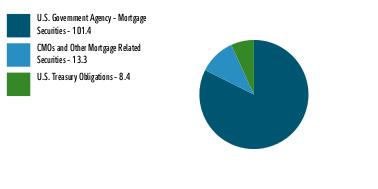 |
| Short-Term Investments and Net Other Assets (Liabilities) - (23.1)% |
TOP HOLDINGS (% of Fund's net assets) | ||
| Ginnie Mae II Pool | 67.0 | |
| Ginnie Mae I Pool | 28.3 | |
| US Treasury Notes | 7.0 | |
| Ginnie Mae REMIC pass-thru certificates | 6.9 | |
| Fannie Mae Mortgage pass-thru certificates | 4.3 | |
| Freddie Mac Gold Pool | 2.7 | |
| Freddie Mac Multifamily Structured Pass Through Certificates | 2.6 | |
| Ginnie Mae Mortgage pass-thru certificates | 2.0 | |
| Fannie Mae Guaranteed REMICS | 1.7 | |
| US Treasury Bonds | 1.4 | |
| 123.9 | ||
The fund's contractural management fee was reduced during the reporting period. |
| Fidelity, the Fidelity Investments Logo and all other Fidelity trademarks or service marks used herein are trademarks or service marks of FMR LLC. Any third-party marks that are used herein are trademarks or service marks of their respective owners. © 2024 FMR LLC. All rights reserved. | ||
 | For additional information about the Fund; including its prospectus, financial information, holdings and proxy information, scan the QR code or visit fundresearch.fidelity.com/prospectus/sec 1.9913382.100 15-TSRA-0924 | |
ANNUAL SHAREHOLDER REPORT | AS OF JULY 31, 2024 | ||
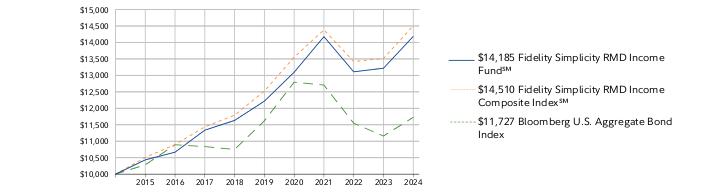
| | Fidelity Simplicity RMD Income Fund℠ Fidelity Simplicity RMD Income Fund℠ : FIRNX | |
| Costs of a $10,000 investment | Costs paid as a percentage of a $10,000 investment | ||
| Fidelity Simplicity RMD Income Fund℠ | $ 48 | 0.46% |
Fidelity Simplicity RMD Income Fund℠ | $10,000 | $10,433 | $10,667 | $11,335 | $11,631 | $12,217 | $13,095 | $14,177 | $13,108 | $13,217 | $14,185 |
Fidelity Simplicity RMD Income Composite Index℠ | $10,000 | $10,506 | $10,897 | $11,438 | $11,791 | $12,521 | $13,555 | $14,381 | $13,423 | $13,512 | $14,510 |
Bloomberg U.S. Aggregate Bond Index | $10,000 | $10,282 | $10,893 | $10,837 | $10,750 | $11,619 | $12,795 | $12,705 | $11,547 | $11,158 | $11,727 |
| 2014 | 2015 | 2016 | 2017 | 2018 | 2019 | 2020 | 2021 | 2022 | 2023 | 2024 |
 |
| 1 Year | 5 Year | 10 Year | |
| Fidelity Simplicity RMD Income Fund℠ | 7.32% | 3.03% | 3.56% |
| Fidelity Simplicity RMD Income Composite Index℠ | 7.39% | 2.99% | 3.79% |
| Bloomberg U.S. Aggregate Bond Index | 5.10% | 0.19% | 1.61% |
Visit www.fidelity.com for more recent performance information. |
The Fund's past performance is not a good predictor of the Fund's future performance. The graph and table do not reflect the deduction of taxes that a shareholder would pay on fund distributions or redemption of fund shares. |
KEY FACTS | ||
| Fund Size | $29,144,265 | |
| Number of Holdings | 33 | |
| Total Advisory Fee | $143,976 | |
| Portfolio Turnover | 20% |
(as of July 31, 2024)
| Bond Funds | 51.2 |
| Inflation-Protected Bond Funds | 20.5 |
| International Equity Funds | 13.6 |
| Domestic Equity Funds | 9.3 |
| Short-Term Funds | 1.1 |
| Short-Term Investments and Net Other Assets (Liabilities) | 4.3 |
ASSET ALLOCATION (% of Fund's net assets) |
 |
TOP HOLDINGS (% of Fund's net assets) | ||
| Fidelity Series Investment Grade Bond Fund | 43.1 | |
| Fidelity Series 0-5 Year Inflation-Protected Bond Index Fund | 19.9 | |
| Fidelity Series Emerging Markets Opportunities Fund | 4.5 | |
| Fidelity Series International Developed Markets Bond Index Fund | 3.9 | |
| Fidelity Series Long-Term Treasury Bond Index Fund | 2.7 | |
| Fidelity Series International Growth Fund | 2.0 | |
| Fidelity Series International Value Fund | 1.9 | |
| Fidelity Series Overseas Fund | 1.9 | |
| Fidelity Series Growth Company Fund | 1.7 | |
| Fidelity Series International Small Cap Fund | 1.5 | |
| 83.1 | ||
| Fidelity, the Fidelity Investments Logo and all other Fidelity trademarks or service marks used herein are trademarks or service marks of FMR LLC. Any third-party marks that are used herein are trademarks or service marks of their respective owners. © 2024 FMR LLC. All rights reserved. | ||
 | For additional information about the Fund; including its prospectus, financial information, holdings and proxy information, scan the QR code or visit fundresearch.fidelity.com/prospectus/sec 1.9913485.100 1888-TSRA-0924 | |
ANNUAL SHAREHOLDER REPORT | AS OF JULY 31, 2024 | ||
| | Fidelity Managed Retirement 2030 Fund℠ Fidelity Managed Retirement 2030 Fund℠ Class K : FMREX | |
| Costs of a $10,000 investment | Costs paid as a percentage of a $10,000 investment | ||
| Class K | $ 41 | 0.39% |
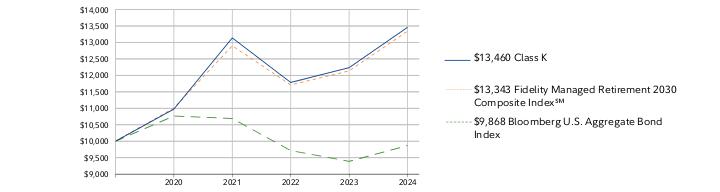
Class K | $10,000 | $10,977 | $13,138 | $11,785 | $12,235 | $13,460 |
Fidelity Managed Retirement 2030 Composite Index℠ | $10,000 | $11,008 | $12,899 | $11,710 | $12,137 | $13,343 |
Bloomberg U.S. Aggregate Bond Index | $10,000 | $10,766 | $10,690 | $9,716 | $9,389 | $9,868 |
| 2019 | 2020 | 2021 | 2022 | 2023 | 2024 |
 |
| 1 Year | Life of Fund A | |
| Class K | 10.01% | 6.17% |
| Fidelity Managed Retirement 2030 Composite Index℠ | 9.94% | 5.99% |
| Bloomberg U.S. Aggregate Bond Index | 5.10% | -0.27% |
Visit www.401k.com for more recent performance information. |
The Fund's past performance is not a good predictor of the Fund's future performance. The graph and table do not reflect the deduction of taxes that a shareholder would pay on fund distributions or redemption of fund shares. |
KEY FACTS | ||
| Fund Size | $42,605,634 | |
| Number of Holdings | 33 | |
| Total Advisory Fee | $175,975 | |
| Portfolio Turnover | 40% |
(as of July 31, 2024)
| Bond Funds | 39.6 |
| Domestic Equity Funds | 24.8 |
| International Equity Funds | 24.0 |
| Inflation-Protected Bond Funds | 11.6 |
| Short-Term Funds | 0.0 |
| Short-Term Investments and Net Other Assets (Liabilities) | 0.0 |
ASSET ALLOCATION (% of Fund's net assets) |
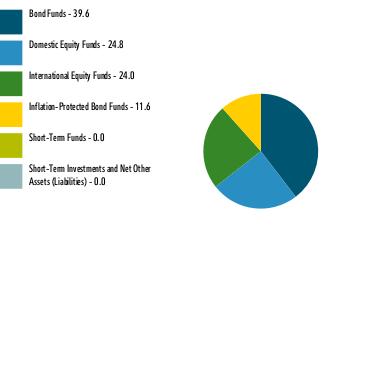 |
TOP HOLDINGS (% of Fund's net assets) | ||
| Fidelity Series Government Bond Index Fund | 9.2 | |
| Fidelity Series Investment Grade Bond Fund | 9.0 | |
| Fidelity Series 5+ Year Inflation-Protected Bond Index Fund | 7.7 | |
| Fidelity Series Emerging Markets Opportunities Fund | 6.8 | |
| Fidelity Series Large Cap Value Index Fund | 6.7 | |
| Fidelity Series Corporate Bond Fund | 5.9 | |
| Fidelity Series Investment Grade Securitized Fund | 5.8 | |
| Fidelity Series Blue Chip Growth Fund | 5.6 | |
| Fidelity Series Long-Term Treasury Bond Index Fund | 4.3 | |
| Fidelity Series International Developed Markets Bond Index Fund | 4.0 | |
| 65.0 | ||
| Fidelity, the Fidelity Investments Logo and all other Fidelity trademarks or service marks used herein are trademarks or service marks of FMR LLC. Any third-party marks that are used herein are trademarks or service marks of their respective owners. © 2024 FMR LLC. All rights reserved. | ||
 | For additional information about the Fund; including its prospectus, financial information, holdings and proxy information, scan the QR code or visit fundresearch.fidelity.com/prospectus/sec 1.9913559.100 4501-TSRA-0924 | |
ANNUAL SHAREHOLDER REPORT | AS OF JULY 31, 2024 | ||
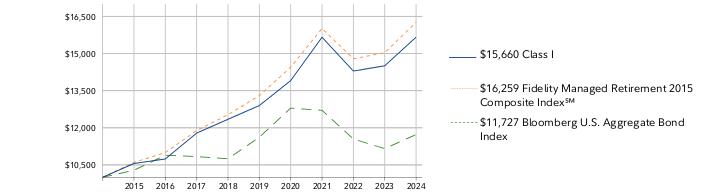
| | Fidelity Managed Retirement 2015 Fund℠ Fidelity Advisor Managed Retirement 2015 Fund℠ Class A : FARSX | |
| Costs of a $10,000 investment | Costs paid as a percentage of a $10,000 investment | ||
| Class A | $ 74 | 0.71% |
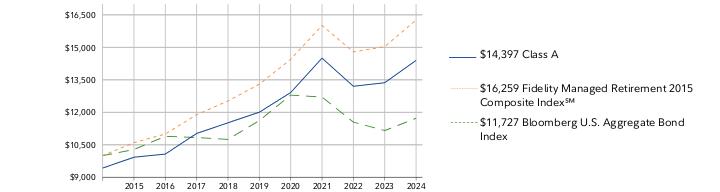
Class A | $9,425 | $9,926 | $10,072 | $11,024 | $11,516 | $12,006 | $12,912 | $14,501 | $13,202 | $13,367 | $14,397 |
Fidelity Managed Retirement 2015 Composite Index℠ | $10,000 | $10,602 | $10,999 | $11,887 | $12,527 | $13,298 | $14,448 | $16,010 | $14,787 | $15,032 | $16,259 |
Bloomberg U.S. Aggregate Bond Index | $10,000 | $10,282 | $10,893 | $10,837 | $10,750 | $11,619 | $12,795 | $12,705 | $11,547 | $11,158 | $11,727 |
| 2014 | 2015 | 2016 | 2017 | 2018 | 2019 | 2020 | 2021 | 2022 | 2023 | 2024 |
 |
| 1 Year | 5 Year | 10 Year | |
| Class A (incl. 5.75% sales charge) | 1.51% | 2.48% | 3.71% |
| Class A (without 5.75% sales charge) | 7.71% | 3.70% | 4.33% |
| Fidelity Managed Retirement 2015 Composite Index℠ | 8.16% | 4.10% | 4.98% |
| Bloomberg U.S. Aggregate Bond Index | 5.10% | 0.19% | 1.61% |
Visit institutional.fidelity.com for more recent performance information. |
The Fund's past performance is not a good predictor of the Fund's future performance. The graph and table do not reflect the deduction of taxes that a shareholder would pay on fund distributions or redemption of fund shares. |
KEY FACTS | ||
| Fund Size | $5,479,558 | |
| Number of Holdings | 33 | |
| Total Advisory Fee | $25,594 | |
| Portfolio Turnover | 34% |
(as of July 31, 2024)
| Bond Funds | 48.3 |
| Inflation-Protected Bond Funds | 18.0 |
| International Equity Funds | 16.7 |
| Domestic Equity Funds | 13.9 |
| Short-Term Funds | 2.5 |
| Short-Term Investments and Net Other Assets (Liabilities) | 0.6 |
ASSET ALLOCATION (% of Fund's net assets) |
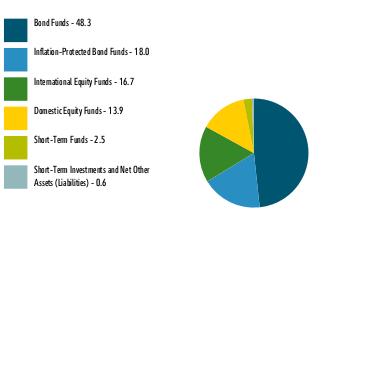 |
TOP HOLDINGS (% of Fund's net assets) | ||
| Fidelity Series 0-5 Year Inflation-Protected Bond Index Fund | 15.1 | |
| Fidelity Series Government Bond Index Fund | 12.3 | |
| Fidelity Series Investment Grade Bond Fund | 12.0 | |
| Fidelity Series Corporate Bond Fund | 7.9 | |
| Fidelity Series Investment Grade Securitized Fund | 7.8 | |
| Fidelity Series Emerging Markets Opportunities Fund | 5.2 | |
| Fidelity Series International Developed Markets Bond Index Fund | 4.0 | |
| Fidelity Series Large Cap Value Index Fund | 3.7 | |
| Fidelity Series Blue Chip Growth Fund | 3.0 | |
| Fidelity Series Long-Term Treasury Bond Index Fund | 2.9 | |
| 73.9 | ||
| Fidelity, the Fidelity Investments Logo and all other Fidelity trademarks or service marks used herein are trademarks or service marks of FMR LLC. Any third-party marks that are used herein are trademarks or service marks of their respective owners. © 2024 FMR LLC. All rights reserved. | ||
 | For additional information about the Fund; including its prospectus, financial information, holdings and proxy information, scan the QR code or visit fundresearch.fidelity.com/prospectus/sec 1.9913494.100 1943-TSRA-0924 | |
ANNUAL SHAREHOLDER REPORT | AS OF JULY 31, 2024 | ||
| | Fidelity Managed Retirement 2020 Fund℠ Fidelity Managed Retirement 2020 Fund℠ Class K : FKRVX | |
| Costs of a $10,000 investment | Costs paid as a percentage of a $10,000 investment | ||
| Class K | $ 39 | 0.37% |
Class K | $10,000 | $10,831 | $12,514 | $11,349 | $11,622 | $12,642 |
Fidelity Managed Retirement 2020 Composite Index℠ | $10,000 | $10,886 | $12,346 | $11,327 | $11,594 | $12,615 |
Bloomberg U.S. Aggregate Bond Index | $10,000 | $10,941 | $10,864 | $9,874 | $9,541 | $10,028 |
| 2019 | 2020 | 2021 | 2022 | 2023 | 2024 |
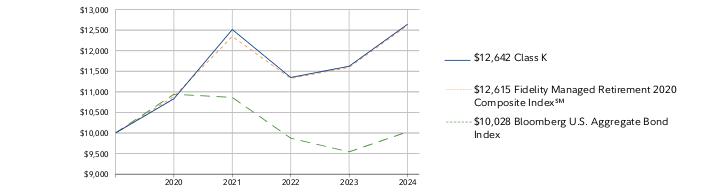 |
| 1 Year | Life of Fund A | |
| Class K | 8.78% | 4.80% |
| Fidelity Managed Retirement 2020 Composite Index℠ | 8.80% | 4.75% |
| Bloomberg U.S. Aggregate Bond Index | 5.10% | 0.06% |
Visit www.401k.com for more recent performance information. |
The Fund's past performance is not a good predictor of the Fund's future performance. The graph and table do not reflect the deduction of taxes that a shareholder would pay on fund distributions or redemption of fund shares. |
KEY FACTS | ||
| Fund Size | $8,371,922 | |
| Number of Holdings | 33 | |
| Total Advisory Fee | $38,515 | |
| Portfolio Turnover | 32% |
(as of July 31, 2024)
| Bond Funds | 45.9 |
| International Equity Funds | 19.3 |
| Domestic Equity Funds | 17.9 |
| Inflation-Protected Bond Funds | 15.8 |
| Short-Term Funds | 0.9 |
| Short-Term Investments and Net Other Assets (Liabilities) | 0.2 |
ASSET ALLOCATION (% of Fund's net assets) |
|
TOP HOLDINGS (% of Fund's net assets) | ||
| Fidelity Series Government Bond Index Fund | 11.5 | |
| Fidelity Series Investment Grade Bond Fund | 11.2 | |
| Fidelity Series 0-5 Year Inflation-Protected Bond Index Fund | 11.1 | |
| Fidelity Series Corporate Bond Fund | 7.5 | |
| Fidelity Series Investment Grade Securitized Fund | 7.3 | |
| Fidelity Series Emerging Markets Opportunities Fund | 5.9 | |
| Fidelity Series Large Cap Value Index Fund | 4.8 | |
| Fidelity Series 5+ Year Inflation-Protected Bond Index Fund | 4.7 | |
| Fidelity Series International Developed Markets Bond Index Fund | 4.0 | |
| Fidelity Series Blue Chip Growth Fund | 3.9 | |
| 71.9 | ||
| Fidelity, the Fidelity Investments Logo and all other Fidelity trademarks or service marks used herein are trademarks or service marks of FMR LLC. Any third-party marks that are used herein are trademarks or service marks of their respective owners. © 2024 FMR LLC. All rights reserved. | ||
 | For additional information about the Fund; including its prospectus, financial information, holdings and proxy information, scan the QR code or visit fundresearch.fidelity.com/prospectus/sec 1.9913503.100 3475-TSRA-0924 | |
ANNUAL SHAREHOLDER REPORT | AS OF JULY 31, 2024 | ||
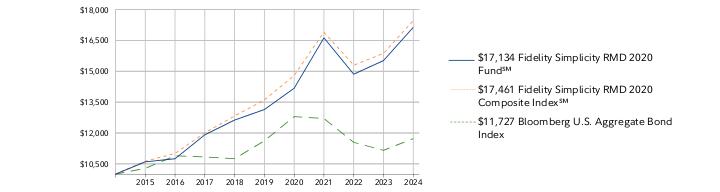
| | Fidelity Simplicity RMD 2020 Fund℠ Fidelity Simplicity RMD 2020 Fund℠ : FIRWX | |
| Costs of a $10,000 investment | Costs paid as a percentage of a $10,000 investment | ||
| Fidelity Simplicity RMD 2020 Fund℠ | $ 59 | 0.56% |
Fidelity Simplicity RMD 2020 Fund℠ | $10,000 | $10,598 | $10,748 | $11,912 | $12,629 | $13,139 | $14,174 | $16,624 | $14,857 | $15,519 | $17,134 |
Fidelity Simplicity RMD 2020 Composite Index℠ | $10,000 | $10,628 | $11,005 | $12,009 | $12,829 | $13,603 | $14,791 | $16,901 | $15,293 | $15,868 | $17,461 |
Bloomberg U.S. Aggregate Bond Index | $10,000 | $10,282 | $10,893 | $10,837 | $10,750 | $11,619 | $12,795 | $12,705 | $11,547 | $11,158 | $11,727 |
| 2014 | 2015 | 2016 | 2017 | 2018 | 2019 | 2020 | 2021 | 2022 | 2023 | 2024 |
 |
| 1 Year | 5 Year | 10 Year | |
| Fidelity Simplicity RMD 2020 Fund℠ | 10.41% | 5.45% | 5.53% |
| Fidelity Simplicity RMD 2020 Composite Index℠ | 10.04% | 5.12% | 5.73% |
| Bloomberg U.S. Aggregate Bond Index | 5.10% | 0.19% | 1.61% |
Visit www.fidelity.com for more recent performance information. |
The Fund's past performance is not a good predictor of the Fund's future performance. The graph and table do not reflect the deduction of taxes that a shareholder would pay on fund distributions or redemption of fund shares. |
KEY FACTS | ||
| Fund Size | $47,578,281 | |
| Number of Holdings | 33 | |
| Total Advisory Fee | $274,828 | |
| Portfolio Turnover | 23% |
(as of July 31, 2024)
| Bond Funds | 38.4 |
| Domestic Equity Funds | 25.5 |
| International Equity Funds | 24.4 |
| Inflation-Protected Bond Funds | 11.7 |
| Short-Term Funds | 0.0 |
| Short-Term Investments and Net Other Assets (Liabilities) | 0.0 |
ASSET ALLOCATION (% of Fund's net assets) |
 |
TOP HOLDINGS (% of Fund's net assets) | ||
| Fidelity Series Investment Grade Bond Fund | 27.9 | |
| Fidelity Series 5+ Year Inflation-Protected Bond Index Fund | 8.4 | |
| Fidelity Series Emerging Markets Opportunities Fund | 7.0 | |
| Fidelity Series Long-Term Treasury Bond Index Fund | 5.1 | |
| Fidelity Series Growth Company Fund | 4.7 | |
| Fidelity Series Large Cap Stock Fund | 4.3 | |
| Fidelity Series International Growth Fund | 4.3 | |
| Fidelity Series International Value Fund | 4.2 | |
| Fidelity Series Overseas Fund | 4.2 | |
| Fidelity Series International Developed Markets Bond Index Fund | 4.0 | |
| 74.1 | ||
| Fidelity, the Fidelity Investments Logo and all other Fidelity trademarks or service marks used herein are trademarks or service marks of FMR LLC. Any third-party marks that are used herein are trademarks or service marks of their respective owners. © 2024 FMR LLC. All rights reserved. | ||
 | For additional information about the Fund; including its prospectus, financial information, holdings and proxy information, scan the QR code or visit fundresearch.fidelity.com/prospectus/sec 1.9913512.100 2009-TSRA-0924 | |
ANNUAL SHAREHOLDER REPORT | AS OF JULY 31, 2024 | ||
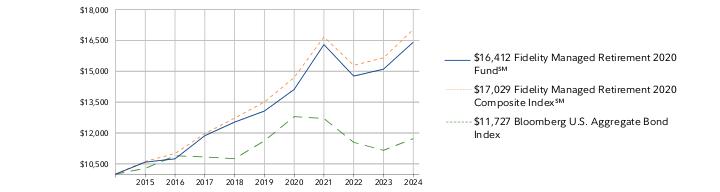
| | Fidelity Managed Retirement 2020 Fund℠ Fidelity Managed Retirement 2020 Fund℠ : FIRVX | |
| Costs of a $10,000 investment | Costs paid as a percentage of a $10,000 investment | ||
| Fidelity Managed Retirement 2020 Fund℠ | $ 49 | 0.47% |
Fidelity Managed Retirement 2020 Fund℠ | $10,000 | $10,584 | $10,745 | $11,870 | $12,529 | $13,065 | $14,116 | $16,296 | $14,764 | $15,102 | $16,412 |
Fidelity Managed Retirement 2020 Composite Index℠ | $10,000 | $10,619 | $11,003 | $11,968 | $12,723 | $13,505 | $14,696 | $16,666 | $15,291 | $15,651 | $17,029 |
Bloomberg U.S. Aggregate Bond Index | $10,000 | $10,282 | $10,893 | $10,837 | $10,750 | $11,619 | $12,795 | $12,705 | $11,547 | $11,158 | $11,727 |
| 2014 | 2015 | 2016 | 2017 | 2018 | 2019 | 2020 | 2021 | 2022 | 2023 | 2024 |
 |
| 1 Year | 5 Year | 10 Year | |
| Fidelity Managed Retirement 2020 Fund℠ | 8.67% | 4.67% | 5.08% |
| Fidelity Managed Retirement 2020 Composite Index℠ | 8.80% | 4.75% | 5.47% |
| Bloomberg U.S. Aggregate Bond Index | 5.10% | 0.19% | 1.61% |
Visit www.fidelity.com for more recent performance information. |
The Fund's past performance is not a good predictor of the Fund's future performance. The graph and table do not reflect the deduction of taxes that a shareholder would pay on fund distributions or redemption of fund shares. |
KEY FACTS | ||
| Fund Size | $8,371,922 | |
| Number of Holdings | 33 | |
| Total Advisory Fee | $38,515 | |
| Portfolio Turnover | 32% |
(as of July 31, 2024)
| Bond Funds | 45.9 |
| International Equity Funds | 19.3 |
| Domestic Equity Funds | 17.9 |
| Inflation-Protected Bond Funds | 15.8 |
| Short-Term Funds | 0.9 |
| Short-Term Investments and Net Other Assets (Liabilities) | 0.2 |
ASSET ALLOCATION (% of Fund's net assets) |
|
TOP HOLDINGS (% of Fund's net assets) | ||
| Fidelity Series Government Bond Index Fund | 11.5 | |
| Fidelity Series Investment Grade Bond Fund | 11.2 | |
| Fidelity Series 0-5 Year Inflation-Protected Bond Index Fund | 11.1 | |
| Fidelity Series Corporate Bond Fund | 7.5 | |
| Fidelity Series Investment Grade Securitized Fund | 7.3 | |
| Fidelity Series Emerging Markets Opportunities Fund | 5.9 | |
| Fidelity Series Large Cap Value Index Fund | 4.8 | |
| Fidelity Series 5+ Year Inflation-Protected Bond Index Fund | 4.7 | |
| Fidelity Series International Developed Markets Bond Index Fund | 4.0 | |
| Fidelity Series Blue Chip Growth Fund | 3.9 | |
| 71.9 | ||
| Fidelity, the Fidelity Investments Logo and all other Fidelity trademarks or service marks used herein are trademarks or service marks of FMR LLC. Any third-party marks that are used herein are trademarks or service marks of their respective owners. © 2024 FMR LLC. All rights reserved. | ||
 | For additional information about the Fund; including its prospectus, financial information, holdings and proxy information, scan the QR code or visit fundresearch.fidelity.com/prospectus/sec 1.9913500.100 1995-TSRA-0924 | |
ANNUAL SHAREHOLDER REPORT | AS OF JULY 31, 2024 | ||
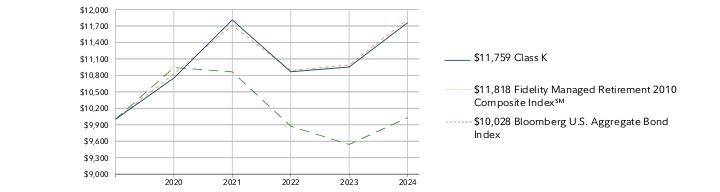
| | Fidelity Managed Retirement 2010 Fund℠ Fidelity Managed Retirement 2010 Fund℠ Class K : FRQKX | |
| Costs of a $10,000 investment | Costs paid as a percentage of a $10,000 investment | ||
| Class K | $ 36 | 0.35% |
Class K | $10,000 | $10,752 | $11,809 | $10,866 | $10,953 | $11,759 |
Fidelity Managed Retirement 2010 Composite Index℠ | $10,000 | $10,829 | $11,713 | $10,888 | $10,991 | $11,818 |
Bloomberg U.S. Aggregate Bond Index | $10,000 | $10,941 | $10,864 | $9,874 | $9,541 | $10,028 |
| 2019 | 2020 | 2021 | 2022 | 2023 | 2024 |
 |
| 1 Year | Life of Fund A | |
| Class K | 7.36% | 3.29% |
| Fidelity Managed Retirement 2010 Composite Index℠ | 7.52% | 3.39% |
| Bloomberg U.S. Aggregate Bond Index | 5.10% | 0.06% |
Visit www.401k.com for more recent performance information. |
The Fund's past performance is not a good predictor of the Fund's future performance. The graph and table do not reflect the deduction of taxes that a shareholder would pay on fund distributions or redemption of fund shares. |
KEY FACTS | ||
| Fund Size | $5,472,463 | |
| Number of Holdings | 33 | |
| Total Advisory Fee | $25,116 | |
| Portfolio Turnover | 25% |
(as of July 31, 2024)
| Bond Funds | 50.8 |
| Inflation-Protected Bond Funds | 20.1 |
| International Equity Funds | 14.1 |
| Domestic Equity Funds | 10.0 |
| Short-Term Funds | 4.0 |
| Short-Term Investments and Net Other Assets (Liabilities) | 1.0 |
ASSET ALLOCATION (% of Fund's net assets) |
 |
TOP HOLDINGS (% of Fund's net assets) | ||
| Fidelity Series 0-5 Year Inflation-Protected Bond Index Fund | 19.2 | |
| Fidelity Series Government Bond Index Fund | 13.1 | |
| Fidelity Series Investment Grade Bond Fund | 12.8 | |
| Fidelity Series Corporate Bond Fund | 8.5 | |
| Fidelity Series Investment Grade Securitized Fund | 8.3 | |
| Fidelity Series Emerging Markets Opportunities Fund | 4.7 | |
| Fidelity Series International Developed Markets Bond Index Fund | 3.9 | |
| Fidelity Series Treasury Bill Index Fund | 3.0 | |
| Fidelity Series Long-Term Treasury Bond Index Fund | 2.7 | |
| Fidelity Series Large Cap Value Index Fund | 2.6 | |
| 78.8 | ||
| Fidelity, the Fidelity Investments Logo and all other Fidelity trademarks or service marks used herein are trademarks or service marks of FMR LLC. Any third-party marks that are used herein are trademarks or service marks of their respective owners. © 2024 FMR LLC. All rights reserved. | ||
 | For additional information about the Fund; including its prospectus, financial information, holdings and proxy information, scan the QR code or visit fundresearch.fidelity.com/prospectus/sec 1.9913489.100 3473-TSRA-0924 | |
ANNUAL SHAREHOLDER REPORT | AS OF JULY 31, 2024 | This report describes changes to the Fund that occurred during the reporting period. | |
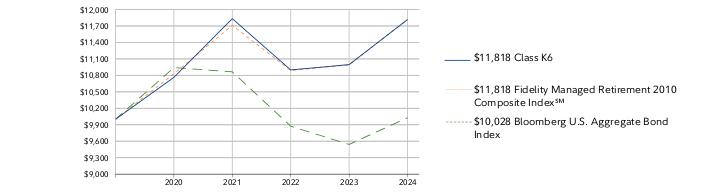
| | Fidelity Managed Retirement 2010 Fund℠ Fidelity Managed Retirement 2010 Fund℠ Class K6 : FRQHX | |
| Costs of a $10,000 investment | Costs paid as a percentage of a $10,000 investment | ||
| Class K6 | $ 26 | 0.25% |
Class K6 | $10,000 | $10,764 | $11,833 | $10,899 | $10,997 | $11,818 |
Fidelity Managed Retirement 2010 Composite Index℠ | $10,000 | $10,829 | $11,713 | $10,888 | $10,991 | $11,818 |
Bloomberg U.S. Aggregate Bond Index | $10,000 | $10,941 | $10,864 | $9,874 | $9,541 | $10,028 |
| 2019 | 2020 | 2021 | 2022 | 2023 | 2024 |
 |
| 1 Year | Life of Fund A | |
| Class K6 | 7.47% | 3.39% |
| Fidelity Managed Retirement 2010 Composite Index℠ | 7.52% | 3.39% |
| Bloomberg U.S. Aggregate Bond Index | 5.10% | 0.06% |
Visit www.401k.com for more recent performance information. |
The Fund's past performance is not a good predictor of the Fund's future performance. The graph and table do not reflect the deduction of taxes that a shareholder would pay on fund distributions or redemption of fund shares. |
KEY FACTS | ||
| Fund Size | $5,472,463 | |
| Number of Holdings | 33 | |
| Total Advisory Fee | $25,116 | |
| Portfolio Turnover | 25% |
(as of July 31, 2024)
| Bond Funds | 50.8 |
| Inflation-Protected Bond Funds | 20.1 |
| International Equity Funds | 14.1 |
| Domestic Equity Funds | 10.0 |
| Short-Term Funds | 4.0 |
| Short-Term Investments and Net Other Assets (Liabilities) | 1.0 |
ASSET ALLOCATION (% of Fund's net assets) |
|
TOP HOLDINGS (% of Fund's net assets) | ||
| Fidelity Series 0-5 Year Inflation-Protected Bond Index Fund | 19.2 | |
| Fidelity Series Government Bond Index Fund | 13.1 | |
| Fidelity Series Investment Grade Bond Fund | 12.8 | |
| Fidelity Series Corporate Bond Fund | 8.5 | |
| Fidelity Series Investment Grade Securitized Fund | 8.3 | |
| Fidelity Series Emerging Markets Opportunities Fund | 4.7 | |
| Fidelity Series International Developed Markets Bond Index Fund | 3.9 | |
| Fidelity Series Treasury Bill Index Fund | 3.0 | |
| Fidelity Series Long-Term Treasury Bond Index Fund | 2.7 | |
| Fidelity Series Large Cap Value Index Fund | 2.6 | |
| 78.8 | ||
Effective May 24, 2024, Class Z6, a class of shares of the fund, was consolidated into Class K6 shares of the fund. |
| Fidelity, the Fidelity Investments Logo and all other Fidelity trademarks or service marks used herein are trademarks or service marks of FMR LLC. Any third-party marks that are used herein are trademarks or service marks of their respective owners. © 2024 FMR LLC. All rights reserved. | ||
 | For additional information about the Fund; including its prospectus, financial information, holdings and proxy information, scan the QR code or visit fundresearch.fidelity.com/prospectus/sec 1.9913490.100 3479-TSRA-0924 | |
ANNUAL SHAREHOLDER REPORT | AS OF JULY 31, 2024 | ||
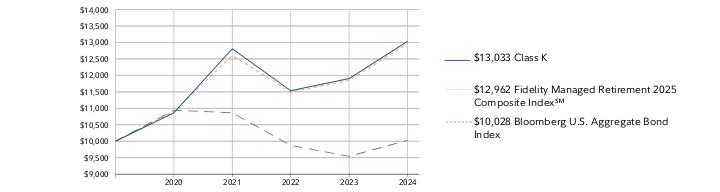
| | Fidelity Managed Retirement 2025 Fund℠ Fidelity Managed Retirement 2025 Fund℠ Class K : FKRFX | |
| Costs of a $10,000 investment | Costs paid as a percentage of a $10,000 investment | ||
| Class K | $ 39 | 0.38% |
Class K | $10,000 | $10,863 | $12,808 | $11,534 | $11,904 | $13,033 |
Fidelity Managed Retirement 2025 Composite Index℠ | $10,000 | $10,908 | $12,605 | $11,491 | $11,844 | $12,962 |
Bloomberg U.S. Aggregate Bond Index | $10,000 | $10,941 | $10,864 | $9,874 | $9,541 | $10,028 |
| 2019 | 2020 | 2021 | 2022 | 2023 | 2024 |
 |
| 1 Year | Life of Fund A | |
| Class K | 9.49% | 5.44% |
| Fidelity Managed Retirement 2025 Composite Index℠ | 9.44% | 5.32% |
| Bloomberg U.S. Aggregate Bond Index | 5.10% | 0.06% |
Visit www.401k.com for more recent performance information. |
The Fund's past performance is not a good predictor of the Fund's future performance. The graph and table do not reflect the deduction of taxes that a shareholder would pay on fund distributions or redemption of fund shares. |
KEY FACTS | ||
| Fund Size | $50,060,844 | |
| Number of Holdings | 33 | |
| Total Advisory Fee | $222,391 | |
| Portfolio Turnover | 36% |
(as of July 31, 2024)
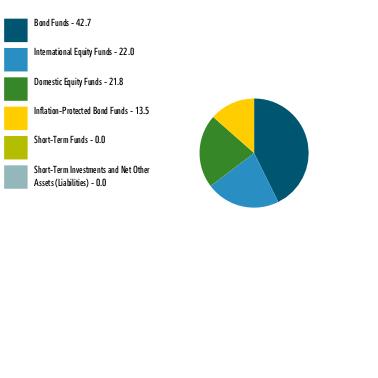
| Bond Funds | 42.7 |
| International Equity Funds | 22.0 |
| Domestic Equity Funds | 21.8 |
| Inflation-Protected Bond Funds | 13.5 |
| Short-Term Funds | 0.0 |
| Short-Term Investments and Net Other Assets (Liabilities) | 0.0 |
ASSET ALLOCATION (% of Fund's net assets) |
 |
TOP HOLDINGS (% of Fund's net assets) | ||
| Fidelity Series Government Bond Index Fund | 10.4 | |
| Fidelity Series Investment Grade Bond Fund | 10.1 | |
| Fidelity Series 0-5 Year Inflation-Protected Bond Index Fund | 7.0 | |
| Fidelity Series Corporate Bond Fund | 6.7 | |
| Fidelity Series 5+ Year Inflation-Protected Bond Index Fund | 6.5 | |
| Fidelity Series Investment Grade Securitized Fund | 6.5 | |
| Fidelity Series Emerging Markets Opportunities Fund | 6.5 | |
| Fidelity Series Large Cap Value Index Fund | 5.9 | |
| Fidelity Series Blue Chip Growth Fund | 4.9 | |
| Fidelity Series International Developed Markets Bond Index Fund | 4.0 | |
| 68.5 | ||
| Fidelity, the Fidelity Investments Logo and all other Fidelity trademarks or service marks used herein are trademarks or service marks of FMR LLC. Any third-party marks that are used herein are trademarks or service marks of their respective owners. © 2024 FMR LLC. All rights reserved. | ||
 | For additional information about the Fund; including its prospectus, financial information, holdings and proxy information, scan the QR code or visit fundresearch.fidelity.com/prospectus/sec 1.9913509.100 3476-TSRA-0924 | |
ANNUAL SHAREHOLDER REPORT | AS OF JULY 31, 2024 | ||
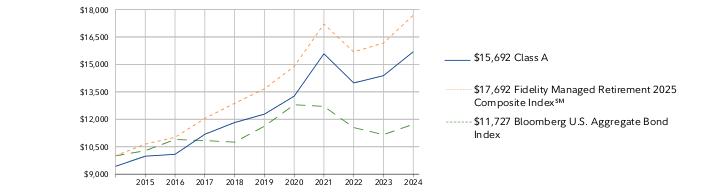
| | Fidelity Managed Retirement 2025 Fund℠ Fidelity Advisor Managed Retirement 2025 Fund℠ Class A : FARFX | |
| Costs of a $10,000 investment | Costs paid as a percentage of a $10,000 investment | ||
| Class A | $ 75 | 0.72% |
Class A | $9,425 | $9,982 | $10,085 | $11,179 | $11,822 | $12,279 | $13,263 | $15,583 | $13,987 | $14,384 | $15,692 |
Fidelity Managed Retirement 2025 Composite Index℠ | $10,000 | $10,641 | $11,013 | $12,048 | $12,871 | $13,663 | $14,888 | $17,204 | $15,685 | $16,166 | $17,692 |
Bloomberg U.S. Aggregate Bond Index | $10,000 | $10,282 | $10,893 | $10,837 | $10,750 | $11,619 | $12,795 | $12,705 | $11,547 | $11,158 | $11,727 |
| 2014 | 2015 | 2016 | 2017 | 2018 | 2019 | 2020 | 2021 | 2022 | 2023 | 2024 |
 |
| 1 Year | 5 Year | 10 Year | |
| Class A (incl. 5.75% sales charge) | 2.82% | 3.79% | 4.61% |
| Class A (without 5.75% sales charge) | 9.09% | 5.03% | 5.23% |
| Fidelity Managed Retirement 2025 Composite Index℠ | 9.44% | 5.31% | 5.87% |
| Bloomberg U.S. Aggregate Bond Index | 5.10% | 0.19% | 1.61% |
Visit institutional.fidelity.com for more recent performance information. |
The Fund's past performance is not a good predictor of the Fund's future performance. The graph and table do not reflect the deduction of taxes that a shareholder would pay on fund distributions or redemption of fund shares. |
KEY FACTS | ||
| Fund Size | $50,060,844 | |
| Number of Holdings | 33 | |
| Total Advisory Fee | $222,391 | |
| Portfolio Turnover | 36% |
(as of July 31, 2024)
| Bond Funds | 42.7 |
| International Equity Funds | 22.0 |
| Domestic Equity Funds | 21.8 |
| Inflation-Protected Bond Funds | 13.5 |
| Short-Term Funds | 0.0 |
| Short-Term Investments and Net Other Assets (Liabilities) | 0.0 |
ASSET ALLOCATION (% of Fund's net assets) |
|
TOP HOLDINGS (% of Fund's net assets) | ||
| Fidelity Series Government Bond Index Fund | 10.4 | |
| Fidelity Series Investment Grade Bond Fund | 10.1 | |
| Fidelity Series 0-5 Year Inflation-Protected Bond Index Fund | 7.0 | |
| Fidelity Series Corporate Bond Fund | 6.7 | |
| Fidelity Series 5+ Year Inflation-Protected Bond Index Fund | 6.5 | |
| Fidelity Series Investment Grade Securitized Fund | 6.5 | |
| Fidelity Series Emerging Markets Opportunities Fund | 6.5 | |
| Fidelity Series Large Cap Value Index Fund | 5.9 | |
| Fidelity Series Blue Chip Growth Fund | 4.9 | |
| Fidelity Series International Developed Markets Bond Index Fund | 4.0 | |
| 68.5 | ||
| Fidelity, the Fidelity Investments Logo and all other Fidelity trademarks or service marks used herein are trademarks or service marks of FMR LLC. Any third-party marks that are used herein are trademarks or service marks of their respective owners. © 2024 FMR LLC. All rights reserved. | ||
 | For additional information about the Fund; including its prospectus, financial information, holdings and proxy information, scan the QR code or visit fundresearch.fidelity.com/prospectus/sec 1.9913507.100 2005-TSRA-0924 | |
ANNUAL SHAREHOLDER REPORT | AS OF JULY 31, 2024 | ||
| | Fidelity Managed Retirement 2030 Fund℠ Fidelity Advisor Managed Retirement 2030 Fund℠ Class I : FMRDX | |
| Costs of a $10,000 investment | Costs paid as a percentage of a $10,000 investment | ||
| Class I | $ 51 | 0.48% |
Class I | $10,000 | $10,967 | $13,119 | $11,746 | $12,181 | $13,386 |
Fidelity Managed Retirement 2030 Composite Index℠ | $10,000 | $11,008 | $12,899 | $11,710 | $12,137 | $13,343 |
Bloomberg U.S. Aggregate Bond Index | $10,000 | $10,766 | $10,690 | $9,716 | $9,389 | $9,868 |
| 2019 | 2020 | 2021 | 2022 | 2023 | 2024 |
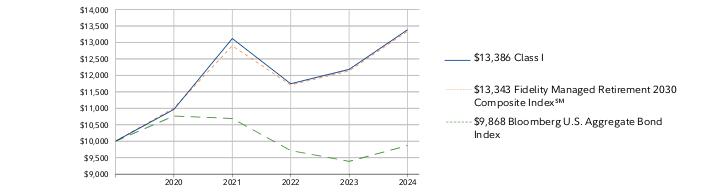 |
| 1 Year | Life of Fund A | |
| Class I | 9.89% | 6.05% |
| Fidelity Managed Retirement 2030 Composite Index℠ | 9.94% | 5.99% |
| Bloomberg U.S. Aggregate Bond Index | 5.10% | -0.27% |
Visit institutional.fidelity.com for more recent performance information. |
The Fund's past performance is not a good predictor of the Fund's future performance. The graph and table do not reflect the deduction of taxes that a shareholder would pay on fund distributions or redemption of fund shares. |
KEY FACTS | ||
| Fund Size | $42,605,634 | |
| Number of Holdings | 33 | |
| Total Advisory Fee | $175,975 | |
| Portfolio Turnover | 40% |
(as of July 31, 2024)
| Bond Funds | 39.6 |
| Domestic Equity Funds | 24.8 |
| International Equity Funds | 24.0 |
| Inflation-Protected Bond Funds | 11.6 |
| Short-Term Funds | 0.0 |
| Short-Term Investments and Net Other Assets (Liabilities) | 0.0 |
ASSET ALLOCATION (% of Fund's net assets) |
|
TOP HOLDINGS (% of Fund's net assets) | ||
| Fidelity Series Government Bond Index Fund | 9.2 | |
| Fidelity Series Investment Grade Bond Fund | 9.0 | |
| Fidelity Series 5+ Year Inflation-Protected Bond Index Fund | 7.7 | |
| Fidelity Series Emerging Markets Opportunities Fund | 6.8 | |
| Fidelity Series Large Cap Value Index Fund | 6.7 | |
| Fidelity Series Corporate Bond Fund | 5.9 | |
| Fidelity Series Investment Grade Securitized Fund | 5.8 | |
| Fidelity Series Blue Chip Growth Fund | 5.6 | |
| Fidelity Series Long-Term Treasury Bond Index Fund | 4.3 | |
| Fidelity Series International Developed Markets Bond Index Fund | 4.0 | |
| 65.0 | ||
| Fidelity, the Fidelity Investments Logo and all other Fidelity trademarks or service marks used herein are trademarks or service marks of FMR LLC. Any third-party marks that are used herein are trademarks or service marks of their respective owners. © 2024 FMR LLC. All rights reserved. | ||
 | For additional information about the Fund; including its prospectus, financial information, holdings and proxy information, scan the QR code or visit fundresearch.fidelity.com/prospectus/sec 1.9913557.100 3500-TSRA-0924 | |
ANNUAL SHAREHOLDER REPORT | AS OF JULY 31, 2024 | ||
| | Fidelity Managed Retirement 2030 Fund℠ Fidelity Advisor Managed Retirement 2030 Fund℠ Class A : FMRBX | |
| Costs of a $10,000 investment | Costs paid as a percentage of a $10,000 investment | ||
| Class A | $ 77 | 0.73% |
Class A | $9,425 | $10,316 | $12,305 | $10,994 | $11,374 | $12,464 |
Fidelity Managed Retirement 2030 Composite Index℠ | $10,000 | $11,008 | $12,899 | $11,710 | $12,137 | $13,343 |
Bloomberg U.S. Aggregate Bond Index | $10,000 | $10,766 | $10,690 | $9,716 | $9,389 | $9,868 |
| 2019 | 2020 | 2021 | 2022 | 2023 | 2024 |
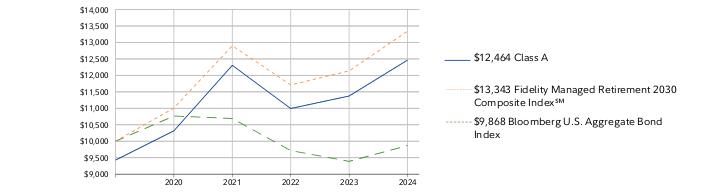 |
| 1 Year | Life of Fund A | |
| Class A (incl. 5.75% sales charge) | 3.29% | 4.54% |
| Class A (without 5.75% sales charge) | 9.59% | 5.80% |
| Fidelity Managed Retirement 2030 Composite Index℠ | 9.94% | 5.99% |
| Bloomberg U.S. Aggregate Bond Index | 5.10% | -0.27% |
Visit institutional.fidelity.com for more recent performance information. |
The Fund's past performance is not a good predictor of the Fund's future performance. The graph and table do not reflect the deduction of taxes that a shareholder would pay on fund distributions or redemption of fund shares. |
KEY FACTS | ||
| Fund Size | $42,605,634 | |
| Number of Holdings | 33 | |
| Total Advisory Fee | $175,975 | |
| Portfolio Turnover | 40% |
(as of July 31, 2024)
| Bond Funds | 39.6 |
| Domestic Equity Funds | 24.8 |
| International Equity Funds | 24.0 |
| Inflation-Protected Bond Funds | 11.6 |
| Short-Term Funds | 0.0 |
| Short-Term Investments and Net Other Assets (Liabilities) | 0.0 |
ASSET ALLOCATION (% of Fund's net assets) |
|
TOP HOLDINGS (% of Fund's net assets) | ||
| Fidelity Series Government Bond Index Fund | 9.2 | |
| Fidelity Series Investment Grade Bond Fund | 9.0 | |
| Fidelity Series 5+ Year Inflation-Protected Bond Index Fund | 7.7 | |
| Fidelity Series Emerging Markets Opportunities Fund | 6.8 | |
| Fidelity Series Large Cap Value Index Fund | 6.7 | |
| Fidelity Series Corporate Bond Fund | 5.9 | |
| Fidelity Series Investment Grade Securitized Fund | 5.8 | |
| Fidelity Series Blue Chip Growth Fund | 5.6 | |
| Fidelity Series Long-Term Treasury Bond Index Fund | 4.3 | |
| Fidelity Series International Developed Markets Bond Index Fund | 4.0 | |
| 65.0 | ||
| Fidelity, the Fidelity Investments Logo and all other Fidelity trademarks or service marks used herein are trademarks or service marks of FMR LLC. Any third-party marks that are used herein are trademarks or service marks of their respective owners. © 2024 FMR LLC. All rights reserved. | ||
 | For additional information about the Fund; including its prospectus, financial information, holdings and proxy information, scan the QR code or visit fundresearch.fidelity.com/prospectus/sec 1.9913556.100 3499-TSRA-0924 | |
ANNUAL SHAREHOLDER REPORT | AS OF JULY 31, 2024 | ||
| | Fidelity Managed Retirement Income Fund℠ Fidelity Advisor Managed Retirement Income Fund℠ Class A : FRAMX | |
| Costs of a $10,000 investment | Costs paid as a percentage of a $10,000 investment | ||
| Class A | $ 73 | 0.70% |
Class A | $9,425 | $9,754 | $9,962 | $10,433 | $10,679 | $11,189 | $11,957 | $12,819 | $11,807 | $11,823 | $12,629 |
Fidelity Managed Retirement Income Composite Index℠ | $10,000 | $10,453 | $10,823 | $11,247 | $11,594 | $12,312 | $13,328 | $14,141 | $13,199 | $13,286 | $14,268 |
Bloomberg U.S. Aggregate Bond Index | $10,000 | $10,282 | $10,893 | $10,837 | $10,750 | $11,619 | $12,795 | $12,705 | $11,547 | $11,158 | $11,727 |
| 2014 | 2015 | 2016 | 2017 | 2018 | 2019 | 2020 | 2021 | 2022 | 2023 | 2024 |
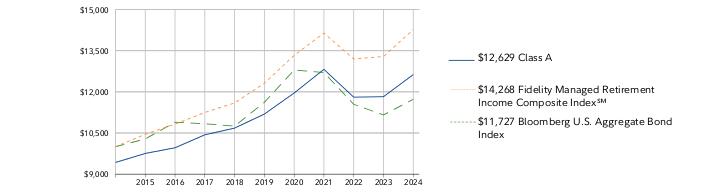 |
| 1 Year | 5 Year | 10 Year | |
| Class A (incl. 5.75% sales charge) | 0.67% | 1.24% | 2.36% |
| Class A (without 5.75% sales charge) | 6.82% | 2.45% | 2.97% |
| Fidelity Managed Retirement Income Composite Index℠ | 7.39% | 2.99% | 3.62% |
| Bloomberg U.S. Aggregate Bond Index | 5.10% | 0.19% | 1.61% |
Visit institutional.fidelity.com for more recent performance information. |
The Fund's past performance is not a good predictor of the Fund's future performance. The graph and table do not reflect the deduction of taxes that a shareholder would pay on fund distributions or redemption of fund shares. |
KEY FACTS | ||
| Fund Size | $14,747,002 | |
| Number of Holdings | 33 | |
| Total Advisory Fee | $64,102 | |
| Portfolio Turnover | 33% |
(as of July 31, 2024)
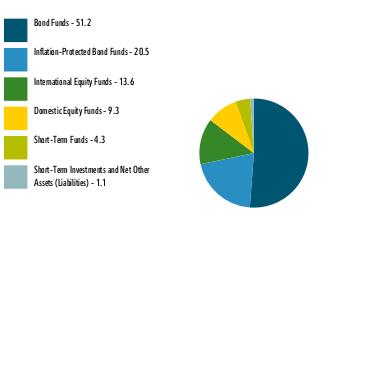
| Bond Funds | 51.2 |
| Inflation-Protected Bond Funds | 20.5 |
| International Equity Funds | 13.6 |
| Domestic Equity Funds | 9.3 |
| Short-Term Funds | 4.3 |
| Short-Term Investments and Net Other Assets (Liabilities) | 1.1 |
ASSET ALLOCATION (% of Fund's net assets) |
 |
TOP HOLDINGS (% of Fund's net assets) | ||
| Fidelity Series 0-5 Year Inflation-Protected Bond Index Fund | 19.9 | |
| Fidelity Series Government Bond Index Fund | 13.3 | |
| Fidelity Series Investment Grade Bond Fund | 12.9 | |
| Fidelity Series Corporate Bond Fund | 8.6 | |
| Fidelity Series Investment Grade Securitized Fund | 8.4 | |
| Fidelity Series Emerging Markets Opportunities Fund | 4.6 | |
| Fidelity Series International Developed Markets Bond Index Fund | 3.9 | |
| Fidelity Series Treasury Bill Index Fund | 3.2 | |
| Fidelity Series Long-Term Treasury Bond Index Fund | 2.6 | |
| Fidelity Series Large Cap Value Index Fund | 2.4 | |
| 79.8 | ||
| Fidelity, the Fidelity Investments Logo and all other Fidelity trademarks or service marks used herein are trademarks or service marks of FMR LLC. Any third-party marks that are used herein are trademarks or service marks of their respective owners. © 2024 FMR LLC. All rights reserved. | ||
 | For additional information about the Fund; including its prospectus, financial information, holdings and proxy information, scan the QR code or visit fundresearch.fidelity.com/prospectus/sec 1.9913480.100 1917-TSRA-0924 | |
ANNUAL SHAREHOLDER REPORT | AS OF JULY 31, 2024 | ||
| | Fidelity Managed Retirement 2015 Fund℠ Fidelity Advisor Managed Retirement 2015 Fund℠ Class I : FRASX | |
| Costs of a $10,000 investment | Costs paid as a percentage of a $10,000 investment | ||
| Class I | $ 48 | 0.46% |
Class I | $10,000 | $10,558 | $10,741 | $11,786 | $12,343 | $12,899 | $13,907 | $15,657 | $14,292 | $14,504 | $15,660 |
Fidelity Managed Retirement 2015 Composite Index℠ | $10,000 | $10,602 | $10,999 | $11,887 | $12,527 | $13,298 | $14,448 | $16,010 | $14,787 | $15,032 | $16,259 |
Bloomberg U.S. Aggregate Bond Index | $10,000 | $10,282 | $10,893 | $10,837 | $10,750 | $11,619 | $12,795 | $12,705 | $11,547 | $11,158 | $11,727 |
| 2014 | 2015 | 2016 | 2017 | 2018 | 2019 | 2020 | 2021 | 2022 | 2023 | 2024 |
 |
| 1 Year | 5 Year | 10 Year | |
| Class I | 7.97% | 3.96% | 4.59% |
| Fidelity Managed Retirement 2015 Composite Index℠ | 8.16% | 4.10% | 4.98% |
| Bloomberg U.S. Aggregate Bond Index | 5.10% | 0.19% | 1.61% |
Visit institutional.fidelity.com for more recent performance information. |
The Fund's past performance is not a good predictor of the Fund's future performance. The graph and table do not reflect the deduction of taxes that a shareholder would pay on fund distributions or redemption of fund shares. |
KEY FACTS | ||
| Fund Size | $5,479,558 | |
| Number of Holdings | 33 | |
| Total Advisory Fee | $25,594 | |
| Portfolio Turnover | 34% |
(as of July 31, 2024)
| Bond Funds | 48.3 |
| Inflation-Protected Bond Funds | 18.0 |
| International Equity Funds | 16.7 |
| Domestic Equity Funds | 13.9 |
| Short-Term Funds | 2.5 |
| Short-Term Investments and Net Other Assets (Liabilities) | 0.6 |
ASSET ALLOCATION (% of Fund's net assets) |
|
TOP HOLDINGS (% of Fund's net assets) | ||
| Fidelity Series 0-5 Year Inflation-Protected Bond Index Fund | 15.1 | |
| Fidelity Series Government Bond Index Fund | 12.3 | |
| Fidelity Series Investment Grade Bond Fund | 12.0 | |
| Fidelity Series Corporate Bond Fund | 7.9 | |
| Fidelity Series Investment Grade Securitized Fund | 7.8 | |
| Fidelity Series Emerging Markets Opportunities Fund | 5.2 | |
| Fidelity Series International Developed Markets Bond Index Fund | 4.0 | |
| Fidelity Series Large Cap Value Index Fund | 3.7 | |
| Fidelity Series Blue Chip Growth Fund | 3.0 | |
| Fidelity Series Long-Term Treasury Bond Index Fund | 2.9 | |
| 73.9 | ||
| Fidelity, the Fidelity Investments Logo and all other Fidelity trademarks or service marks used herein are trademarks or service marks of FMR LLC. Any third-party marks that are used herein are trademarks or service marks of their respective owners. © 2024 FMR LLC. All rights reserved. | ||
 | For additional information about the Fund; including its prospectus, financial information, holdings and proxy information, scan the QR code or visit fundresearch.fidelity.com/prospectus/sec 1.9913495.100 1946-TSRA-0924 | |
ANNUAL SHAREHOLDER REPORT | AS OF JULY 31, 2024 | This report describes changes to the Fund that occurred during the reporting period. | |
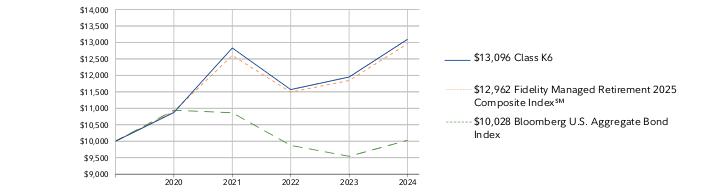
| | Fidelity Managed Retirement 2025 Fund℠ Fidelity Managed Retirement 2025 Fund℠ Class K6 : FHRFX | |
| Costs of a $10,000 investment | Costs paid as a percentage of a $10,000 investment | ||
| Class K6 | $ 28 | 0.27% |
Class K6 | $10,000 | $10,873 | $12,833 | $11,568 | $11,950 | $13,096 |
Fidelity Managed Retirement 2025 Composite Index℠ | $10,000 | $10,908 | $12,605 | $11,491 | $11,844 | $12,962 |
Bloomberg U.S. Aggregate Bond Index | $10,000 | $10,941 | $10,864 | $9,874 | $9,541 | $10,028 |
| 2019 | 2020 | 2021 | 2022 | 2023 | 2024 |
 |
| 1 Year | Life of Fund A | |
| Class K6 | 9.59% | 5.54% |
| Fidelity Managed Retirement 2025 Composite Index℠ | 9.44% | 5.32% |
| Bloomberg U.S. Aggregate Bond Index | 5.10% | 0.06% |
Visit www.401k.com for more recent performance information. |
The Fund's past performance is not a good predictor of the Fund's future performance. The graph and table do not reflect the deduction of taxes that a shareholder would pay on fund distributions or redemption of fund shares. |
KEY FACTS | ||
| Fund Size | $50,060,844 | |
| Number of Holdings | 33 | |
| Total Advisory Fee | $222,391 | |
| Portfolio Turnover | 36% |
(as of July 31, 2024)
| Bond Funds | 42.7 |
| International Equity Funds | 22.0 |
| Domestic Equity Funds | 21.8 |
| Inflation-Protected Bond Funds | 13.5 |
| Short-Term Funds | 0.0 |
| Short-Term Investments and Net Other Assets (Liabilities) | 0.0 |
ASSET ALLOCATION (% of Fund's net assets) |
|
TOP HOLDINGS (% of Fund's net assets) | ||
| Fidelity Series Government Bond Index Fund | 10.4 | |
| Fidelity Series Investment Grade Bond Fund | 10.1 | |
| Fidelity Series 0-5 Year Inflation-Protected Bond Index Fund | 7.0 | |
| Fidelity Series Corporate Bond Fund | 6.7 | |
| Fidelity Series 5+ Year Inflation-Protected Bond Index Fund | 6.5 | |
| Fidelity Series Investment Grade Securitized Fund | 6.5 | |
| Fidelity Series Emerging Markets Opportunities Fund | 6.5 | |
| Fidelity Series Large Cap Value Index Fund | 5.9 | |
| Fidelity Series Blue Chip Growth Fund | 4.9 | |
| Fidelity Series International Developed Markets Bond Index Fund | 4.0 | |
| 68.5 | ||
Effective May 24, 2024, Class Z6, a class of shares of the fund, was consolidated into Class K6 shares of the fund. |
| Fidelity, the Fidelity Investments Logo and all other Fidelity trademarks or service marks used herein are trademarks or service marks of FMR LLC. Any third-party marks that are used herein are trademarks or service marks of their respective owners. © 2024 FMR LLC. All rights reserved. | ||
 | For additional information about the Fund; including its prospectus, financial information, holdings and proxy information, scan the QR code or visit fundresearch.fidelity.com/prospectus/sec 1.9913510.100 3482-TSRA-0924 | |
ANNUAL SHAREHOLDER REPORT | AS OF JULY 31, 2024 | ||
| | Fidelity Managed Retirement 2025 Fund℠ Fidelity Advisor Managed Retirement 2025 Fund℠ Class I : FIRFX | |
| Costs of a $10,000 investment | Costs paid as a percentage of a $10,000 investment | ||
| Class I | $ 49 | 0.47% |
Class I | $10,000 | $10,617 | $10,751 | $11,949 | $12,669 | $13,192 | $14,286 | $16,826 | $15,140 | $15,609 | $17,071 |
Fidelity Managed Retirement 2025 Composite Index℠ | $10,000 | $10,641 | $11,013 | $12,048 | $12,871 | $13,663 | $14,888 | $17,204 | $15,685 | $16,166 | $17,692 |
Bloomberg U.S. Aggregate Bond Index | $10,000 | $10,282 | $10,893 | $10,837 | $10,750 | $11,619 | $12,795 | $12,705 | $11,547 | $11,158 | $11,727 |
| 2014 | 2015 | 2016 | 2017 | 2018 | 2019 | 2020 | 2021 | 2022 | 2023 | 2024 |
 |
| 1 Year | 5 Year | 10 Year | |
| Class I | 9.36% | 5.29% | 5.49% |
| Fidelity Managed Retirement 2025 Composite Index℠ | 9.44% | 5.31% | 5.87% |
| Bloomberg U.S. Aggregate Bond Index | 5.10% | 0.19% | 1.61% |
Visit institutional.fidelity.com for more recent performance information. |
The Fund's past performance is not a good predictor of the Fund's future performance. The graph and table do not reflect the deduction of taxes that a shareholder would pay on fund distributions or redemption of fund shares. |
KEY FACTS | ||
| Fund Size | $50,060,844 | |
| Number of Holdings | 33 | |
| Total Advisory Fee | $222,391 | |
| Portfolio Turnover | 36% |
(as of July 31, 2024)
| Bond Funds | 42.7 |
| International Equity Funds | 22.0 |
| Domestic Equity Funds | 21.8 |
| Inflation-Protected Bond Funds | 13.5 |
| Short-Term Funds | 0.0 |
| Short-Term Investments and Net Other Assets (Liabilities) | 0.0 |
ASSET ALLOCATION (% of Fund's net assets) |
|
TOP HOLDINGS (% of Fund's net assets) | ||
| Fidelity Series Government Bond Index Fund | 10.4 | |
| Fidelity Series Investment Grade Bond Fund | 10.1 | |
| Fidelity Series 0-5 Year Inflation-Protected Bond Index Fund | 7.0 | |
| Fidelity Series Corporate Bond Fund | 6.7 | |
| Fidelity Series 5+ Year Inflation-Protected Bond Index Fund | 6.5 | |
| Fidelity Series Investment Grade Securitized Fund | 6.5 | |
| Fidelity Series Emerging Markets Opportunities Fund | 6.5 | |
| Fidelity Series Large Cap Value Index Fund | 5.9 | |
| Fidelity Series Blue Chip Growth Fund | 4.9 | |
| Fidelity Series International Developed Markets Bond Index Fund | 4.0 | |
| 68.5 | ||
| Fidelity, the Fidelity Investments Logo and all other Fidelity trademarks or service marks used herein are trademarks or service marks of FMR LLC. Any third-party marks that are used herein are trademarks or service marks of their respective owners. © 2024 FMR LLC. All rights reserved. | ||
 | For additional information about the Fund; including its prospectus, financial information, holdings and proxy information, scan the QR code or visit fundresearch.fidelity.com/prospectus/sec 1.9913508.100 2008-TSRA-0924 | |
ANNUAL SHAREHOLDER REPORT | AS OF JULY 31, 2024 | This report describes changes to the Fund that occurred during the reporting period. | |
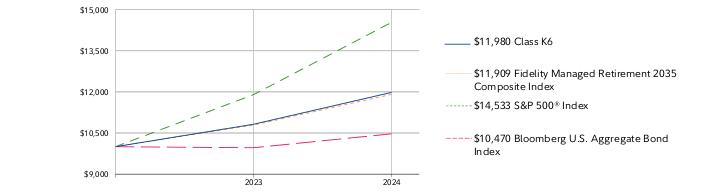
| | Fidelity Managed Retirement 2035 Fund℠ Fidelity Managed Retirement 2035 Fund℠ Class K6 : FMRJX | |
| Costs of a $10,000 investment | Costs paid as a percentage of a $10,000 investment | ||
| Class K6 | $ 30 | 0.28% |
Class K6 | $10,000 | $10,819 | $11,980 |
Fidelity Managed Retirement 2035 Composite Index | $10,000 | $10,787 | $11,909 |
S&P 500® Index | $10,000 | $11,898 | $14,533 |
Bloomberg U.S. Aggregate Bond Index | $10,000 | $9,962 | $10,470 |
| 2022 | 2023 | 2024 |
 |
| 1 Year | Life of Fund A | |
| Class K6 | 10.73% | 11.74% |
| Fidelity Managed Retirement 2035 Composite Index | 10.39% | 11.33% |
| S&P 500® Index | 24.56% | 26.43% |
| Bloomberg U.S. Aggregate Bond Index | 5.10% | 2.86% |
Visit www.401k.com for more recent performance information. |
The Fund's past performance is not a good predictor of the Fund's future performance. The graph and table do not reflect the deduction of taxes that a shareholder would pay on fund distributions or redemption of fund shares. |
KEY FACTS | ||
| Fund Size | $10,439,772 | |
| Number of Holdings | 32 | |
| Total Advisory Fee | $16,710 | |
| Portfolio Turnover | 60% |
(as of July 31, 2024)
| Bond Funds | 36.9 |
| Domestic Equity Funds | 27.5 |
| International Equity Funds | 25.8 |
| Inflation-Protected Bond Funds | 9.8 |
| Short-Term Funds | 0.0 |
| Short-Term Investments and Net Other Assets (Liabilities) | 0.0 |
ASSET ALLOCATION (% of Fund's net assets) |
|
TOP HOLDINGS (% of Fund's net assets) | ||
| Fidelity Series 5+ Year Inflation-Protected Bond Index Fund | 8.4 | |
| Fidelity Series Government Bond Index Fund | 8.2 | |
| Fidelity Series Investment Grade Bond Fund | 8.0 | |
| Fidelity Series Large Cap Value Index Fund | 7.4 | |
| Fidelity Series Emerging Markets Opportunities Fund | 7.3 | |
| Fidelity Series Blue Chip Growth Fund | 6.2 | |
| Fidelity Series Corporate Bond Fund | 5.3 | |
| Fidelity Series Investment Grade Securitized Fund | 5.2 | |
| Fidelity Series Long-Term Treasury Bond Index Fund | 4.8 | |
| Fidelity Series International Growth Fund | 4.1 | |
| 64.9 |
Effective May 24, 2024, Class Z6, a class of shares of the fund, was consolidated into Class K6 shares of the fund. |
| Fidelity, the Fidelity Investments Logo and all other Fidelity trademarks or service marks used herein are trademarks or service marks of FMR LLC. Any third-party marks that are used herein are trademarks or service marks of their respective owners. © 2024 FMR LLC. All rights reserved. | ||
 | For additional information about the Fund; including its prospectus, financial information, holdings and proxy information, scan the QR code or visit fundresearch.fidelity.com/prospectus/sec 1.9913579.100 7308-TSRA-0924 | |
ANNUAL SHAREHOLDER REPORT | AS OF JULY 31, 2024 | ||
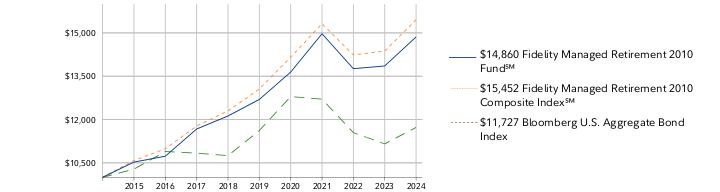
| | Fidelity Managed Retirement 2010 Fund℠ Fidelity Managed Retirement 2010 Fund℠ : FIRQX | |
| Costs of a $10,000 investment | Costs paid as a percentage of a $10,000 investment | ||
| Fidelity Managed Retirement 2010 Fund℠ | $ 47 | 0.45% |
Fidelity Managed Retirement 2010 Fund℠ | $10,000 | $10,527 | $10,730 | $11,671 | $12,123 | $12,696 | $13,643 | $14,970 | $13,761 | $13,856 | $14,860 |
Fidelity Managed Retirement 2010 Composite Index℠ | $10,000 | $10,582 | $10,986 | $11,778 | $12,300 | $13,058 | $14,159 | $15,315 | $14,237 | $14,371 | $15,452 |
Bloomberg U.S. Aggregate Bond Index | $10,000 | $10,282 | $10,893 | $10,837 | $10,750 | $11,619 | $12,795 | $12,705 | $11,547 | $11,158 | $11,727 |
| 2014 | 2015 | 2016 | 2017 | 2018 | 2019 | 2020 | 2021 | 2022 | 2023 | 2024 |
 |
| 1 Year | 5 Year | 10 Year | |
| Fidelity Managed Retirement 2010 Fund℠ | 7.25% | 3.20% | 4.04% |
| Fidelity Managed Retirement 2010 Composite Index℠ | 7.52% | 3.42% | 4.45% |
| Bloomberg U.S. Aggregate Bond Index | 5.10% | 0.19% | 1.61% |
Visit www.fidelity.com for more recent performance information. |
The Fund's past performance is not a good predictor of the Fund's future performance. The graph and table do not reflect the deduction of taxes that a shareholder would pay on fund distributions or redemption of fund shares. |
KEY FACTS | ||
| Fund Size | $5,472,463 | |
| Number of Holdings | 33 | |
| Total Advisory Fee | $25,116 | |
| Portfolio Turnover | 25% |
(as of July 31, 2024)
| Bond Funds | 50.8 |
| Inflation-Protected Bond Funds | 20.1 |
| International Equity Funds | 14.1 |
| Domestic Equity Funds | 10.0 |
| Short-Term Funds | 4.0 |
| Short-Term Investments and Net Other Assets (Liabilities) | 1.0 |
ASSET ALLOCATION (% of Fund's net assets) |
|
TOP HOLDINGS (% of Fund's net assets) | ||
| Fidelity Series 0-5 Year Inflation-Protected Bond Index Fund | 19.2 | |
| Fidelity Series Government Bond Index Fund | 13.1 | |
| Fidelity Series Investment Grade Bond Fund | 12.8 | |
| Fidelity Series Corporate Bond Fund | 8.5 | |
| Fidelity Series Investment Grade Securitized Fund | 8.3 | |
| Fidelity Series Emerging Markets Opportunities Fund | 4.7 | |
| Fidelity Series International Developed Markets Bond Index Fund | 3.9 | |
| Fidelity Series Treasury Bill Index Fund | 3.0 | |
| Fidelity Series Long-Term Treasury Bond Index Fund | 2.7 | |
| Fidelity Series Large Cap Value Index Fund | 2.6 | |
| 78.8 | ||
| Fidelity, the Fidelity Investments Logo and all other Fidelity trademarks or service marks used herein are trademarks or service marks of FMR LLC. Any third-party marks that are used herein are trademarks or service marks of their respective owners. © 2024 FMR LLC. All rights reserved. | ||
 | For additional information about the Fund; including its prospectus, financial information, holdings and proxy information, scan the QR code or visit fundresearch.fidelity.com/prospectus/sec 1.9913486.100 1891-TSRA-0924 | |
ANNUAL SHAREHOLDER REPORT | AS OF JULY 31, 2024 | ||
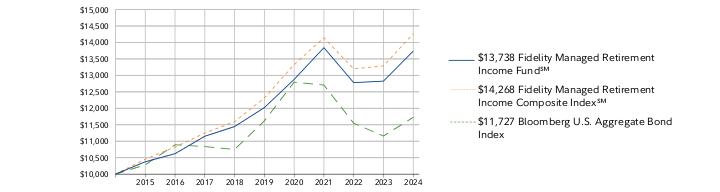
| | Fidelity Managed Retirement Income Fund℠ Fidelity Managed Retirement Income Fund℠ : FIRMX | |
| Costs of a $10,000 investment | Costs paid as a percentage of a $10,000 investment | ||
| Fidelity Managed Retirement Income Fund℠ | $ 47 | 0.45% |
Fidelity Managed Retirement Income Fund℠ | $10,000 | $10,376 | $10,622 | $11,151 | $11,445 | $12,021 | $12,878 | $13,841 | $12,779 | $12,826 | $13,738 |
Fidelity Managed Retirement Income Composite Index℠ | $10,000 | $10,453 | $10,823 | $11,247 | $11,594 | $12,312 | $13,328 | $14,141 | $13,199 | $13,286 | $14,268 |
Bloomberg U.S. Aggregate Bond Index | $10,000 | $10,282 | $10,893 | $10,837 | $10,750 | $11,619 | $12,795 | $12,705 | $11,547 | $11,158 | $11,727 |
| 2014 | 2015 | 2016 | 2017 | 2018 | 2019 | 2020 | 2021 | 2022 | 2023 | 2024 |
 |
| 1 Year | 5 Year | 10 Year | |
| Fidelity Managed Retirement Income Fund℠ | 7.11% | 2.70% | 3.23% |
| Fidelity Managed Retirement Income Composite Index℠ | 7.39% | 2.99% | 3.62% |
| Bloomberg U.S. Aggregate Bond Index | 5.10% | 0.19% | 1.61% |
Visit www.fidelity.com for more recent performance information. |
The Fund's past performance is not a good predictor of the Fund's future performance. The graph and table do not reflect the deduction of taxes that a shareholder would pay on fund distributions or redemption of fund shares. |
KEY FACTS | ||
| Fund Size | $14,747,002 | |
| Number of Holdings | 33 | |
| Total Advisory Fee | $64,102 | |
| Portfolio Turnover | 33% |
(as of July 31, 2024)
| Bond Funds | 51.2 |
| Inflation-Protected Bond Funds | 20.5 |
| International Equity Funds | 13.6 |
| Domestic Equity Funds | 9.3 |
| Short-Term Funds | 4.3 |
| Short-Term Investments and Net Other Assets (Liabilities) | 1.1 |
ASSET ALLOCATION (% of Fund's net assets) |
|
TOP HOLDINGS (% of Fund's net assets) | ||
| Fidelity Series 0-5 Year Inflation-Protected Bond Index Fund | 19.9 | |
| Fidelity Series Government Bond Index Fund | 13.3 | |
| Fidelity Series Investment Grade Bond Fund | 12.9 | |
| Fidelity Series Corporate Bond Fund | 8.6 | |
| Fidelity Series Investment Grade Securitized Fund | 8.4 | |
| Fidelity Series Emerging Markets Opportunities Fund | 4.6 | |
| Fidelity Series International Developed Markets Bond Index Fund | 3.9 | |
| Fidelity Series Treasury Bill Index Fund | 3.2 | |
| Fidelity Series Long-Term Treasury Bond Index Fund | 2.6 | |
| Fidelity Series Large Cap Value Index Fund | 2.4 | |
| 79.8 | ||
| Fidelity, the Fidelity Investments Logo and all other Fidelity trademarks or service marks used herein are trademarks or service marks of FMR LLC. Any third-party marks that are used herein are trademarks or service marks of their respective owners. © 2024 FMR LLC. All rights reserved. | ||
 | For additional information about the Fund; including its prospectus, financial information, holdings and proxy information, scan the QR code or visit fundresearch.fidelity.com/prospectus/sec 1.9913479.100 1887-TSRA-0924 | |
ANNUAL SHAREHOLDER REPORT | AS OF JULY 31, 2024 | ||
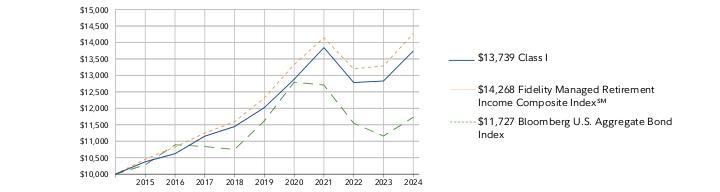
| | Fidelity Managed Retirement Income Fund℠ Fidelity Advisor Managed Retirement Income Fund℠ Class I : FRIMX | |
| Costs of a $10,000 investment | Costs paid as a percentage of a $10,000 investment | ||
| Class I | $ 47 | 0.45% |
Class I | $10,000 | $10,376 | $10,622 | $11,153 | $11,445 | $12,022 | $12,880 | $13,843 | $12,782 | $12,830 | $13,739 |
Fidelity Managed Retirement Income Composite Index℠ | $10,000 | $10,453 | $10,823 | $11,247 | $11,594 | $12,312 | $13,328 | $14,141 | $13,199 | $13,286 | $14,268 |
Bloomberg U.S. Aggregate Bond Index | $10,000 | $10,282 | $10,893 | $10,837 | $10,750 | $11,619 | $12,795 | $12,705 | $11,547 | $11,158 | $11,727 |
| 2014 | 2015 | 2016 | 2017 | 2018 | 2019 | 2020 | 2021 | 2022 | 2023 | 2024 |
 |
| 1 Year | 5 Year | 10 Year | |
| Class I | 7.09% | 2.71% | 3.23% |
| Fidelity Managed Retirement Income Composite Index℠ | 7.39% | 2.99% | 3.62% |
| Bloomberg U.S. Aggregate Bond Index | 5.10% | 0.19% | 1.61% |
Visit institutional.fidelity.com for more recent performance information. |
The Fund's past performance is not a good predictor of the Fund's future performance. The graph and table do not reflect the deduction of taxes that a shareholder would pay on fund distributions or redemption of fund shares. |
KEY FACTS | ||
| Fund Size | $14,747,002 | |
| Number of Holdings | 33 | |
| Total Advisory Fee | $64,102 | |
| Portfolio Turnover | 33% |
(as of July 31, 2024)
| Bond Funds | 51.2 |
| Inflation-Protected Bond Funds | 20.5 |
| International Equity Funds | 13.6 |
| Domestic Equity Funds | 9.3 |
| Short-Term Funds | 4.3 |
| Short-Term Investments and Net Other Assets (Liabilities) | 1.1 |
ASSET ALLOCATION (% of Fund's net assets) |
|
TOP HOLDINGS (% of Fund's net assets) | ||
| Fidelity Series 0-5 Year Inflation-Protected Bond Index Fund | 19.9 | |
| Fidelity Series Government Bond Index Fund | 13.3 | |
| Fidelity Series Investment Grade Bond Fund | 12.9 | |
| Fidelity Series Corporate Bond Fund | 8.6 | |
| Fidelity Series Investment Grade Securitized Fund | 8.4 | |
| Fidelity Series Emerging Markets Opportunities Fund | 4.6 | |
| Fidelity Series International Developed Markets Bond Index Fund | 3.9 | |
| Fidelity Series Treasury Bill Index Fund | 3.2 | |
| Fidelity Series Long-Term Treasury Bond Index Fund | 2.6 | |
| Fidelity Series Large Cap Value Index Fund | 2.4 | |
| 79.8 | ||
| Fidelity, the Fidelity Investments Logo and all other Fidelity trademarks or service marks used herein are trademarks or service marks of FMR LLC. Any third-party marks that are used herein are trademarks or service marks of their respective owners. © 2024 FMR LLC. All rights reserved. | ||
 | For additional information about the Fund; including its prospectus, financial information, holdings and proxy information, scan the QR code or visit fundresearch.fidelity.com/prospectus/sec 1.9913481.100 1920-TSRA-0924 | |
ANNUAL SHAREHOLDER REPORT | AS OF JULY 31, 2024 | ||
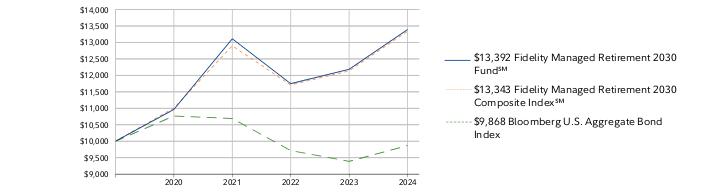
| | Fidelity Managed Retirement 2030 Fund℠ Fidelity Managed Retirement 2030 Fund℠ : FMRAX | |
| Costs of a $10,000 investment | Costs paid as a percentage of a $10,000 investment | ||
| Fidelity Managed Retirement 2030 Fund℠ | $ 50 | 0.48% |
Fidelity Managed Retirement 2030 Fund℠ | $10,000 | $10,966 | $13,111 | $11,749 | $12,185 | $13,392 |
Fidelity Managed Retirement 2030 Composite Index℠ | $10,000 | $11,008 | $12,899 | $11,710 | $12,137 | $13,343 |
Bloomberg U.S. Aggregate Bond Index | $10,000 | $10,766 | $10,690 | $9,716 | $9,389 | $9,868 |
| 2019 | 2020 | 2021 | 2022 | 2023 | 2024 |
 |
| 1 Year | Life of Fund A | |
| Fidelity Managed Retirement 2030 Fund℠ | 9.91% | 6.06% |
| Fidelity Managed Retirement 2030 Composite Index℠ | 9.94% | 5.99% |
| Bloomberg U.S. Aggregate Bond Index | 5.10% | -0.27% |
Visit www.fidelity.com for more recent performance information. |
The Fund's past performance is not a good predictor of the Fund's future performance. The graph and table do not reflect the deduction of taxes that a shareholder would pay on fund distributions or redemption of fund shares. |
KEY FACTS | ||
| Fund Size | $42,605,634 | |
| Number of Holdings | 33 | |
| Total Advisory Fee | $175,975 | |
| Portfolio Turnover | 40% |
(as of July 31, 2024)
| Bond Funds | 39.6 |
| Domestic Equity Funds | 24.8 |
| International Equity Funds | 24.0 |
| Inflation-Protected Bond Funds | 11.6 |
| Short-Term Funds | 0.0 |
| Short-Term Investments and Net Other Assets (Liabilities) | 0.0 |
ASSET ALLOCATION (% of Fund's net assets) |
|
TOP HOLDINGS (% of Fund's net assets) | ||
| Fidelity Series Government Bond Index Fund | 9.2 | |
| Fidelity Series Investment Grade Bond Fund | 9.0 | |
| Fidelity Series 5+ Year Inflation-Protected Bond Index Fund | 7.7 | |
| Fidelity Series Emerging Markets Opportunities Fund | 6.8 | |
| Fidelity Series Large Cap Value Index Fund | 6.7 | |
| Fidelity Series Corporate Bond Fund | 5.9 | |
| Fidelity Series Investment Grade Securitized Fund | 5.8 | |
| Fidelity Series Blue Chip Growth Fund | 5.6 | |
| Fidelity Series Long-Term Treasury Bond Index Fund | 4.3 | |
| Fidelity Series International Developed Markets Bond Index Fund | 4.0 | |
| 65.0 | ||
| Fidelity, the Fidelity Investments Logo and all other Fidelity trademarks or service marks used herein are trademarks or service marks of FMR LLC. Any third-party marks that are used herein are trademarks or service marks of their respective owners. © 2024 FMR LLC. All rights reserved. | ||
 | For additional information about the Fund; including its prospectus, financial information, holdings and proxy information, scan the QR code or visit fundresearch.fidelity.com/prospectus/sec 1.9913558.100 4500-TSRA-0924 | |
ANNUAL SHAREHOLDER REPORT | AS OF JULY 31, 2024 | ||
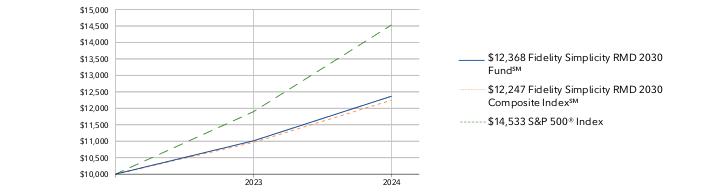
| | Fidelity Simplicity RMD 2030 Fund℠ Fidelity Simplicity RMD 2030 Fund℠ : FSRMX | |
| Costs of a $10,000 investment | Costs paid as a percentage of a $10,000 investment | ||
| Fidelity Simplicity RMD 2030 Fund℠ | $ 69 | 0.65% |
Fidelity Simplicity RMD 2030 Fund℠ | $10,000 | $11,013 | $12,368 |
Fidelity Simplicity RMD 2030 Composite Index℠ | $10,000 | $10,965 | $12,247 |
S&P 500® Index | $10,000 | $11,898 | $14,533 |
| 2022 | 2023 | 2024 |
 |
| 1 Year | Life of Fund A | |
| Fidelity Simplicity RMD 2030 Fund℠ | 12.31% | 13.95% |
| Fidelity Simplicity RMD 2030 Composite Index℠ | 11.69% | 13.26% |
| S&P 500® Index | 22.15% | 25.83% |
Visit www.fidelity.com for more recent performance information. |
The Fund's past performance is not a good predictor of the Fund's future performance. The graph and table do not reflect the deduction of taxes that a shareholder would pay on fund distributions or redemption of fund shares. |
KEY FACTS | ||
| Fund Size | $795,401 | |
| Number of Holdings | 29 | |
| Total Advisory Fee | $4,620 | |
| Portfolio Turnover | 55% |
(as of July 31, 2024)
| Domestic Equity Funds | 34.0 |
| Bond Funds | 30.9 |
| International Equity Funds | 30.1 |
| Inflation-Protected Bond Funds | 5.1 |
ASSET ALLOCATION (% of Fund's net assets) |
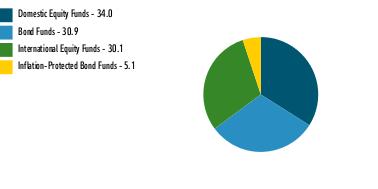 |
| Short-Term Investments and Net Other Assets (Liabilities) - (0.1)% |
TOP HOLDINGS (% of Fund's net assets) | ||
| Fidelity Series Investment Grade Bond Fund | 18.7 | |
| Fidelity Series Emerging Markets Opportunities Fund | 8.3 | |
| Fidelity Series Long-Term Treasury Bond Index Fund | 6.9 | |
| Fidelity Series Growth Company Fund | 6.2 | |
| Fidelity Series Large Cap Stock Fund | 5.8 | |
| Fidelity Series International Growth Fund | 5.5 | |
| Fidelity Series International Value Fund | 5.4 | |
| Fidelity Series Overseas Fund | 5.4 | |
| Fidelity Series 5+ Year Inflation-Protected Bond Index Fund | 5.1 | |
| Fidelity Series Stock Selector Large Cap Value Fund | 4.0 | |
| 71.3 | ||
| Fidelity, the Fidelity Investments Logo and all other Fidelity trademarks or service marks used herein are trademarks or service marks of FMR LLC. Any third-party marks that are used herein are trademarks or service marks of their respective owners. © 2024 FMR LLC. All rights reserved. | ||
 | For additional information about the Fund; including its prospectus, financial information, holdings and proxy information, scan the QR code or visit fundresearch.fidelity.com/prospectus/sec 1.9913573.100 7247-TSRA-0924 | |
ANNUAL SHAREHOLDER REPORT | AS OF JULY 31, 2024 | ||
| | Fidelity Simplicity RMD 2025 Fund℠ Fidelity Simplicity RMD 2025 Fund℠ : FMRHX | |
| Costs of a $10,000 investment | Costs paid as a percentage of a $10,000 investment | ||
| Fidelity Simplicity RMD 2025 Fund℠ | $ 65 | 0.61% |
Fidelity Simplicity RMD 2025 Fund℠ | $10,000 | $10,945 | $13,157 | $11,709 | $12,368 | $13,761 |
Fidelity Simplicity RMD 2025 Composite Index℠ | $10,000 | $10,986 | $12,847 | $11,582 | $12,142 | $13,460 |
S&P 500® Index | $10,000 | $11,533 | $15,736 | $15,006 | $16,959 | $20,715 |
| 2019 | 2020 | 2021 | 2022 | 2023 | 2024 |
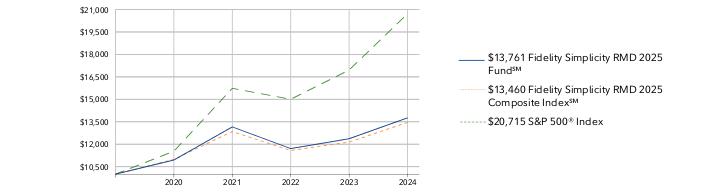 |
| 1 Year | Life of Fund A | |
| Fidelity Simplicity RMD 2025 Fund℠ | 11.26% | 6.65% |
| Fidelity Simplicity RMD 2025 Composite Index℠ | 10.86% | 6.17% |
| S&P 500® Index | 22.15% | 15.81% |
Visit www.fidelity.com for more recent performance information. |
The Fund's past performance is not a good predictor of the Fund's future performance. The graph and table do not reflect the deduction of taxes that a shareholder would pay on fund distributions or redemption of fund shares. |
KEY FACTS | ||
| Fund Size | $11,726,075 | |
| Number of Holdings | 30 | |
| Total Advisory Fee | $68,008 | |
| Portfolio Turnover | 36% |
(as of July 31, 2024)
| Bond Funds | 33.4 |
| Domestic Equity Funds | 30.0 |
| International Equity Funds | 27.4 |
| Inflation-Protected Bond Funds | 9.3 |
ASSET ALLOCATION (% of Fund's net assets) |
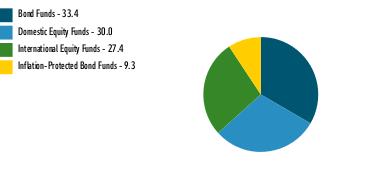 |
| Short-Term Investments and Net Other Assets (Liabilities) - (0.1)% |
TOP HOLDINGS (% of Fund's net assets) | ||
| Fidelity Series Investment Grade Bond Fund | 21.6 | |
| Fidelity Series 5+ Year Inflation-Protected Bond Index Fund | 9.3 | |
| Fidelity Series Emerging Markets Opportunities Fund | 7.6 | |
| Fidelity Series Long-Term Treasury Bond Index Fund | 6.5 | |
| Fidelity Series Growth Company Fund | 5.5 | |
| Fidelity Series Large Cap Stock Fund | 5.2 | |
| Fidelity Series International Growth Fund | 4.9 | |
| Fidelity Series International Value Fund | 4.9 | |
| Fidelity Series Overseas Fund | 4.9 | |
| Fidelity Series International Developed Markets Bond Index Fund | 3.9 | |
| 74.3 | ||
| Fidelity, the Fidelity Investments Logo and all other Fidelity trademarks or service marks used herein are trademarks or service marks of FMR LLC. Any third-party marks that are used herein are trademarks or service marks of their respective owners. © 2024 FMR LLC. All rights reserved. | ||
 | For additional information about the Fund; including its prospectus, financial information, holdings and proxy information, scan the QR code or visit fundresearch.fidelity.com/prospectus/sec 1.9913555.100 3497-TSRA-0924 | |
ANNUAL SHAREHOLDER REPORT | AS OF JULY 31, 2024 | This report describes changes to the Fund that occurred during the reporting period. | |
| | Fidelity Managed Retirement 2020 Fund℠ Fidelity Managed Retirement 2020 Fund℠ Class K6 : FHRVX | |
| Costs of a $10,000 investment | Costs paid as a percentage of a $10,000 investment | ||
| Class K6 | $ 28 | 0.27% |
Class K6 | $10,000 | $10,842 | $12,539 | $11,384 | $11,669 | $12,705 |
Fidelity Managed Retirement 2020 Composite Index℠ | $10,000 | $10,886 | $12,346 | $11,327 | $11,594 | $12,615 |
Bloomberg U.S. Aggregate Bond Index | $10,000 | $10,941 | $10,864 | $9,874 | $9,541 | $10,028 |
| 2019 | 2020 | 2021 | 2022 | 2023 | 2024 |
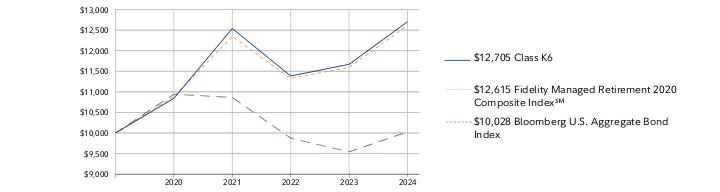 |
| 1 Year | Life of Fund A | |
| Class K6 | 8.88% | 4.90% |
| Fidelity Managed Retirement 2020 Composite Index℠ | 8.80% | 4.75% |
| Bloomberg U.S. Aggregate Bond Index | 5.10% | 0.06% |
Visit www.401k.com for more recent performance information. |
The Fund's past performance is not a good predictor of the Fund's future performance. The graph and table do not reflect the deduction of taxes that a shareholder would pay on fund distributions or redemption of fund shares. |
KEY FACTS | ||
| Fund Size | $8,371,922 | |
| Number of Holdings | 33 | |
| Total Advisory Fee | $38,515 | |
| Portfolio Turnover | 32% |
(as of July 31, 2024)
| Bond Funds | 45.9 |
| International Equity Funds | 19.3 |
| Domestic Equity Funds | 17.9 |
| Inflation-Protected Bond Funds | 15.8 |
| Short-Term Funds | 0.9 |
| Short-Term Investments and Net Other Assets (Liabilities) | 0.2 |
ASSET ALLOCATION (% of Fund's net assets) |
|
TOP HOLDINGS (% of Fund's net assets) | ||
| Fidelity Series Government Bond Index Fund | 11.5 | |
| Fidelity Series Investment Grade Bond Fund | 11.2 | |
| Fidelity Series 0-5 Year Inflation-Protected Bond Index Fund | 11.1 | |
| Fidelity Series Corporate Bond Fund | 7.5 | |
| Fidelity Series Investment Grade Securitized Fund | 7.3 | |
| Fidelity Series Emerging Markets Opportunities Fund | 5.9 | |
| Fidelity Series Large Cap Value Index Fund | 4.8 | |
| Fidelity Series 5+ Year Inflation-Protected Bond Index Fund | 4.7 | |
| Fidelity Series International Developed Markets Bond Index Fund | 4.0 | |
| Fidelity Series Blue Chip Growth Fund | 3.9 | |
| 71.9 | ||
Effective May 24, 2024, Class Z6, a class of shares of the fund, was consolidated into Class K6 shares of the fund. |
| Fidelity, the Fidelity Investments Logo and all other Fidelity trademarks or service marks used herein are trademarks or service marks of FMR LLC. Any third-party marks that are used herein are trademarks or service marks of their respective owners. © 2024 FMR LLC. All rights reserved. | ||
 | For additional information about the Fund; including its prospectus, financial information, holdings and proxy information, scan the QR code or visit fundresearch.fidelity.com/prospectus/sec 1.9913504.100 3481-TSRA-0924 | |
ANNUAL SHAREHOLDER REPORT | AS OF JULY 31, 2024 | ||
| | Fidelity Simplicity RMD 2010 Fund℠ Fidelity Simplicity RMD 2010 Fund℠ : FIRRX | |
| Costs of a $10,000 investment | Costs paid as a percentage of a $10,000 investment | ||
| Fidelity Simplicity RMD 2010 Fund℠ | $ 50 | 0.48% |
Fidelity Simplicity RMD 2010 Fund℠ | $10,000 | $10,548 | $10,740 | $11,728 | $12,194 | $12,763 | $13,712 | $15,178 | $13,847 | $14,147 | $15,330 |
Fidelity Simplicity RMD 2010 Composite Index℠ | $10,000 | $10,594 | $10,995 | $11,829 | $12,369 | $13,129 | $14,234 | $15,417 | $14,209 | $14,465 | $15,658 |
Bloomberg U.S. Aggregate Bond Index | $10,000 | $10,282 | $10,893 | $10,837 | $10,750 | $11,619 | $12,795 | $12,705 | $11,547 | $11,158 | $11,727 |
| 2014 | 2015 | 2016 | 2017 | 2018 | 2019 | 2020 | 2021 | 2022 | 2023 | 2024 |
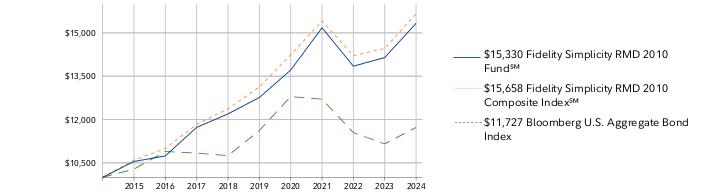 |
| 1 Year | 5 Year | 10 Year | |
| Fidelity Simplicity RMD 2010 Fund℠ | 8.36% | 3.73% | 4.37% |
| Fidelity Simplicity RMD 2010 Composite Index℠ | 8.24% | 3.59% | 4.59% |
| Bloomberg U.S. Aggregate Bond Index | 5.10% | 0.19% | 1.61% |
Visit www.fidelity.com for more recent performance information. |
The Fund's past performance is not a good predictor of the Fund's future performance. The graph and table do not reflect the deduction of taxes that a shareholder would pay on fund distributions or redemption of fund shares. |
KEY FACTS | ||
| Fund Size | $10,112,022 | |
| Number of Holdings | 33 | |
| Total Advisory Fee | $48,350 | |
| Portfolio Turnover | 30% |
(as of July 31, 2024)
| Bond Funds | 48.0 |
| Inflation-Protected Bond Funds | 17.6 |
| International Equity Funds | 17.0 |
| Domestic Equity Funds | 14.4 |
| Short-Term Funds | 0.6 |
| Short-Term Investments and Net Other Assets (Liabilities) | 2.4 |
ASSET ALLOCATION (% of Fund's net assets) |
 |
TOP HOLDINGS (% of Fund's net assets) | ||
| Fidelity Series Investment Grade Bond Fund | 39.7 | |
| Fidelity Series 0-5 Year Inflation-Protected Bond Index Fund | 14.5 | |
| Fidelity Series Emerging Markets Opportunities Fund | 5.2 | |
| Fidelity Series International Developed Markets Bond Index Fund | 4.0 | |
| Fidelity Series 5+ Year Inflation-Protected Bond Index Fund | 3.1 | |
| Fidelity Series Long-Term Treasury Bond Index Fund | 2.9 | |
| Fidelity Series International Growth Fund | 2.7 | |
| Fidelity Series International Value Fund | 2.7 | |
| Fidelity Series Overseas Fund | 2.7 | |
| Fidelity Series Growth Company Fund | 2.5 | |
| 80.0 | ||
| Fidelity, the Fidelity Investments Logo and all other Fidelity trademarks or service marks used herein are trademarks or service marks of FMR LLC. Any third-party marks that are used herein are trademarks or service marks of their respective owners. © 2024 FMR LLC. All rights reserved. | ||
 | For additional information about the Fund; including its prospectus, financial information, holdings and proxy information, scan the QR code or visit fundresearch.fidelity.com/prospectus/sec 1.9913492.100 1892-TSRA-0924 | |
ANNUAL SHAREHOLDER REPORT | AS OF JULY 31, 2024 | ||
| | Fidelity Simplicity RMD 2015 Fund℠ Fidelity Simplicity RMD 2015 Fund℠ : FIRUX | |
| Costs of a $10,000 investment | Costs paid as a percentage of a $10,000 investment | ||
| Fidelity Simplicity RMD 2015 Fund℠ | $ 54 | 0.52% |
Fidelity Simplicity RMD 2015 Fund℠ | $10,000 | $10,570 | $10,741 | $11,823 | $12,414 | $12,955 | $13,953 | $15,895 | $14,354 | $14,831 | $16,227 |
Fidelity Simplicity RMD 2015 Composite Index℠ | $10,000 | $10,610 | $10,999 | $11,923 | $12,601 | $13,370 | $14,520 | $16,153 | $14,753 | $15,163 | $16,550 |
Bloomberg U.S. Aggregate Bond Index | $10,000 | $10,282 | $10,893 | $10,837 | $10,750 | $11,619 | $12,795 | $12,705 | $11,547 | $11,158 | $11,727 |
| 2014 | 2015 | 2016 | 2017 | 2018 | 2019 | 2020 | 2021 | 2022 | 2023 | 2024 |
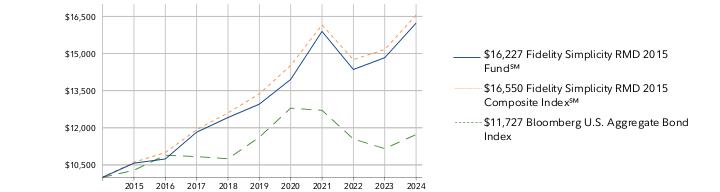 |
| 1 Year | 5 Year | 10 Year | |
| Fidelity Simplicity RMD 2015 Fund℠ | 9.41% | 4.61% | 4.96% |
| Fidelity Simplicity RMD 2015 Composite Index℠ | 9.15% | 4.36% | 5.17% |
| Bloomberg U.S. Aggregate Bond Index | 5.10% | 0.19% | 1.61% |
Visit www.fidelity.com for more recent performance information. |
The Fund's past performance is not a good predictor of the Fund's future performance. The graph and table do not reflect the deduction of taxes that a shareholder would pay on fund distributions or redemption of fund shares. |
KEY FACTS | ||
| Fund Size | $18,974,932 | |
| Number of Holdings | 33 | |
| Total Advisory Fee | $103,222 | |
| Portfolio Turnover | 22% |
(as of July 31, 2024)
| Bond Funds | 44.6 |
| International Equity Funds | 20.7 |
| Domestic Equity Funds | 20.0 |
| Inflation-Protected Bond Funds | 14.6 |
| Short-Term Funds | 0.0 |
| Short-Term Investments and Net Other Assets (Liabilities) | 0.1 |
ASSET ALLOCATION (% of Fund's net assets) |
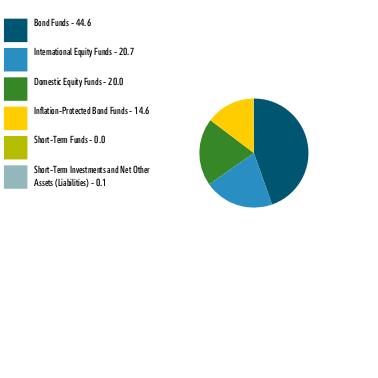 |
TOP HOLDINGS (% of Fund's net assets) | ||
| Fidelity Series Investment Grade Bond Fund | 36.1 | |
| Fidelity Series 0-5 Year Inflation-Protected Bond Index Fund | 8.9 | |
| Fidelity Series Emerging Markets Opportunities Fund | 6.1 | |
| Fidelity Series 5+ Year Inflation-Protected Bond Index Fund | 5.7 | |
| Fidelity Series International Developed Markets Bond Index Fund | 4.0 | |
| Fidelity Series Growth Company Fund | 3.6 | |
| Fidelity Series International Growth Fund | 3.5 | |
| Fidelity Series International Value Fund | 3.5 | |
| Fidelity Series Overseas Fund | 3.4 | |
| Fidelity Series Large Cap Stock Fund | 3.4 | |
| 78.2 | ||
| Fidelity, the Fidelity Investments Logo and all other Fidelity trademarks or service marks used herein are trademarks or service marks of FMR LLC. Any third-party marks that are used herein are trademarks or service marks of their respective owners. © 2024 FMR LLC. All rights reserved. | ||
 | For additional information about the Fund; including its prospectus, financial information, holdings and proxy information, scan the QR code or visit fundresearch.fidelity.com/prospectus/sec 1.9913499.100 1894-TSRA-0924 | |
ANNUAL SHAREHOLDER REPORT | AS OF JULY 31, 2024 | ||
| | Fidelity Managed Retirement 2035 Fund℠ Fidelity Advisor Managed Retirement 2035 Fund℠ Class I : FMRYX | |
| Costs of a $10,000 investment | Costs paid as a percentage of a $10,000 investment | ||
| Class I | $ 51 | 0.48% |
Class I | $10,000 | $10,807 | $11,947 |
Fidelity Managed Retirement 2035 Composite Index | $10,000 | $10,787 | $11,909 |
S&P 500® Index | $10,000 | $11,898 | $14,533 |
Bloomberg U.S. Aggregate Bond Index | $10,000 | $9,962 | $10,470 |
| 2022 | 2023 | 2024 |
 |
| 1 Year | Life of Fund A | |
| Class I | 10.54% | 11.55% |
| Fidelity Managed Retirement 2035 Composite Index | 10.39% | 11.33% |
| S&P 500® Index | 24.56% | 26.43% |
| Bloomberg U.S. Aggregate Bond Index | 5.10% | 2.86% |
Visit institutional.fidelity.com for more recent performance information. |
The Fund's past performance is not a good predictor of the Fund's future performance. The graph and table do not reflect the deduction of taxes that a shareholder would pay on fund distributions or redemption of fund shares. |
KEY FACTS | ||
| Fund Size | $10,439,772 | |
| Number of Holdings | 32 | |
| Total Advisory Fee | $16,710 | |
| Portfolio Turnover | 60% |
(as of July 31, 2024)
| Bond Funds | 36.9 |
| Domestic Equity Funds | 27.5 |
| International Equity Funds | 25.8 |
| Inflation-Protected Bond Funds | 9.8 |
| Short-Term Funds | 0.0 |
| Short-Term Investments and Net Other Assets (Liabilities) | 0.0 |
ASSET ALLOCATION (% of Fund's net assets) |
|
TOP HOLDINGS (% of Fund's net assets) | ||
| Fidelity Series 5+ Year Inflation-Protected Bond Index Fund | 8.4 | |
| Fidelity Series Government Bond Index Fund | 8.2 | |
| Fidelity Series Investment Grade Bond Fund | 8.0 | |
| Fidelity Series Large Cap Value Index Fund | 7.4 | |
| Fidelity Series Emerging Markets Opportunities Fund | 7.3 | |
| Fidelity Series Blue Chip Growth Fund | 6.2 | |
| Fidelity Series Corporate Bond Fund | 5.3 | |
| Fidelity Series Investment Grade Securitized Fund | 5.2 | |
| Fidelity Series Long-Term Treasury Bond Index Fund | 4.8 | |
| Fidelity Series International Growth Fund | 4.1 | |
| 64.9 |
| Fidelity, the Fidelity Investments Logo and all other Fidelity trademarks or service marks used herein are trademarks or service marks of FMR LLC. Any third-party marks that are used herein are trademarks or service marks of their respective owners. © 2024 FMR LLC. All rights reserved. | ||
 | For additional information about the Fund; including its prospectus, financial information, holdings and proxy information, scan the QR code or visit fundresearch.fidelity.com/prospectus/sec 1.9913577.100 7306-TSRA-0924 | |
ANNUAL SHAREHOLDER REPORT | AS OF JULY 31, 2024 | This report describes changes to the Fund that occurred during the reporting period. | |
| | Fidelity Managed Retirement Income Fund℠ Fidelity Managed Retirement Income Fund℠ Class K6 : FRHMX | |
| Costs of a $10,000 investment | Costs paid as a percentage of a $10,000 investment | ||
| Class K6 | $ 26 | 0.25% |
Class K6 | $10,000 | $10,720 | $11,544 | $10,680 | $10,741 | $11,526 |
Fidelity Managed Retirement Income Composite Index℠ | $10,000 | $10,800 | $11,459 | $10,695 | $10,766 | $11,561 |
Bloomberg U.S. Aggregate Bond Index | $10,000 | $10,941 | $10,864 | $9,874 | $9,541 | $10,028 |
| 2019 | 2020 | 2021 | 2022 | 2023 | 2024 |
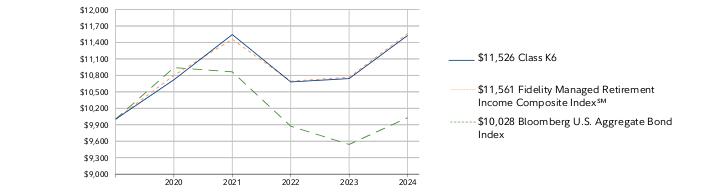 |
| 1 Year | Life of Fund A | |
| Class K6 | 7.31% | 2.88% |
| Fidelity Managed Retirement Income Composite Index℠ | 7.39% | 2.94% |
| Bloomberg U.S. Aggregate Bond Index | 5.10% | 0.06% |
Visit www.401k.com for more recent performance information. |
The Fund's past performance is not a good predictor of the Fund's future performance. The graph and table do not reflect the deduction of taxes that a shareholder would pay on fund distributions or redemption of fund shares. |
KEY FACTS | ||
| Fund Size | $14,747,002 | |
| Number of Holdings | 33 | |
| Total Advisory Fee | $64,102 | |
| Portfolio Turnover | 33% |
(as of July 31, 2024)
| Bond Funds | 51.2 |
| Inflation-Protected Bond Funds | 20.5 |
| International Equity Funds | 13.6 |
| Domestic Equity Funds | 9.3 |
| Short-Term Funds | 4.3 |
| Short-Term Investments and Net Other Assets (Liabilities) | 1.1 |
ASSET ALLOCATION (% of Fund's net assets) |
|
TOP HOLDINGS (% of Fund's net assets) | ||
| Fidelity Series 0-5 Year Inflation-Protected Bond Index Fund | 19.9 | |
| Fidelity Series Government Bond Index Fund | 13.3 | |
| Fidelity Series Investment Grade Bond Fund | 12.9 | |
| Fidelity Series Corporate Bond Fund | 8.6 | |
| Fidelity Series Investment Grade Securitized Fund | 8.4 | |
| Fidelity Series Emerging Markets Opportunities Fund | 4.6 | |
| Fidelity Series International Developed Markets Bond Index Fund | 3.9 | |
| Fidelity Series Treasury Bill Index Fund | 3.2 | |
| Fidelity Series Long-Term Treasury Bond Index Fund | 2.6 | |
| Fidelity Series Large Cap Value Index Fund | 2.4 | |
| 79.8 | ||
Effective May 24, 2024, Class Z6, a class of shares of the fund, was consolidated into Class K6 shares of the fund. |
| Fidelity, the Fidelity Investments Logo and all other Fidelity trademarks or service marks used herein are trademarks or service marks of FMR LLC. Any third-party marks that are used herein are trademarks or service marks of their respective owners. © 2024 FMR LLC. All rights reserved. | ||
 | For additional information about the Fund; including its prospectus, financial information, holdings and proxy information, scan the QR code or visit fundresearch.fidelity.com/prospectus/sec 1.9913483.100 3477-TSRA-0924 | |
ANNUAL SHAREHOLDER REPORT | AS OF JULY 31, 2024 | This report describes changes to the Fund that occurred during the reporting period. | |
| | Fidelity Managed Retirement 2030 Fund℠ Fidelity Managed Retirement 2030 Fund℠ Class K6 : FMRFX | |
| Costs of a $10,000 investment | Costs paid as a percentage of a $10,000 investment | ||
| Class K6 | $ 30 | 0.28% |
Class K6 | $10,000 | $10,995 | $13,165 | $11,820 | $12,284 | $13,518 |
Fidelity Managed Retirement 2030 Composite Index℠ | $10,000 | $11,008 | $12,899 | $11,710 | $12,137 | $13,343 |
Bloomberg U.S. Aggregate Bond Index | $10,000 | $10,766 | $10,690 | $9,716 | $9,389 | $9,868 |
| 2019 | 2020 | 2021 | 2022 | 2023 | 2024 |
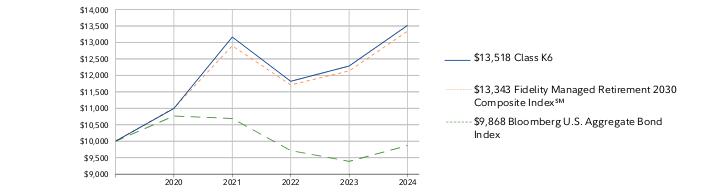 |
| 1 Year | Life of Fund A | |
| Class K6 | 10.04% | 6.26% |
| Fidelity Managed Retirement 2030 Composite Index℠ | 9.94% | 5.99% |
| Bloomberg U.S. Aggregate Bond Index | 5.10% | -0.27% |
Visit www.401k.com for more recent performance information. |
The Fund's past performance is not a good predictor of the Fund's future performance. The graph and table do not reflect the deduction of taxes that a shareholder would pay on fund distributions or redemption of fund shares. |
KEY FACTS | ||
| Fund Size | $42,605,634 | |
| Number of Holdings | 33 | |
| Total Advisory Fee | $175,975 | |
| Portfolio Turnover | 40% |
(as of July 31, 2024)
| Bond Funds | 39.6 |
| Domestic Equity Funds | 24.8 |
| International Equity Funds | 24.0 |
| Inflation-Protected Bond Funds | 11.6 |
| Short-Term Funds | 0.0 |
| Short-Term Investments and Net Other Assets (Liabilities) | 0.0 |
ASSET ALLOCATION (% of Fund's net assets) |
|
TOP HOLDINGS (% of Fund's net assets) | ||
| Fidelity Series Government Bond Index Fund | 9.2 | |
| Fidelity Series Investment Grade Bond Fund | 9.0 | |
| Fidelity Series 5+ Year Inflation-Protected Bond Index Fund | 7.7 | |
| Fidelity Series Emerging Markets Opportunities Fund | 6.8 | |
| Fidelity Series Large Cap Value Index Fund | 6.7 | |
| Fidelity Series Corporate Bond Fund | 5.9 | |
| Fidelity Series Investment Grade Securitized Fund | 5.8 | |
| Fidelity Series Blue Chip Growth Fund | 5.6 | |
| Fidelity Series Long-Term Treasury Bond Index Fund | 4.3 | |
| Fidelity Series International Developed Markets Bond Index Fund | 4.0 | |
| 65.0 | ||
Effective May 24, 2024, Class Z6, a class of shares of the fund, was consolidated into Class K6 shares of the fund. |
| Fidelity, the Fidelity Investments Logo and all other Fidelity trademarks or service marks used herein are trademarks or service marks of FMR LLC. Any third-party marks that are used herein are trademarks or service marks of their respective owners. © 2024 FMR LLC. All rights reserved. | ||
 | For additional information about the Fund; including its prospectus, financial information, holdings and proxy information, scan the QR code or visit fundresearch.fidelity.com/prospectus/sec 1.9913560.100 4502-TSRA-0924 | |
ANNUAL SHAREHOLDER REPORT | AS OF JULY 31, 2024 | ||
| | Fidelity Managed Retirement Income Fund℠ Fidelity Managed Retirement Income Fund℠ Class K : FRKMX | |
| Costs of a $10,000 investment | Costs paid as a percentage of a $10,000 investment | ||
| Class K | $ 36 | 0.35% |
Class K | $10,000 | $10,709 | $11,522 | $10,648 | $10,698 | $11,469 |
Fidelity Managed Retirement Income Composite Index℠ | $10,000 | $10,800 | $11,459 | $10,695 | $10,766 | $11,561 |
Bloomberg U.S. Aggregate Bond Index | $10,000 | $10,941 | $10,864 | $9,874 | $9,541 | $10,028 |
| 2019 | 2020 | 2021 | 2022 | 2023 | 2024 |
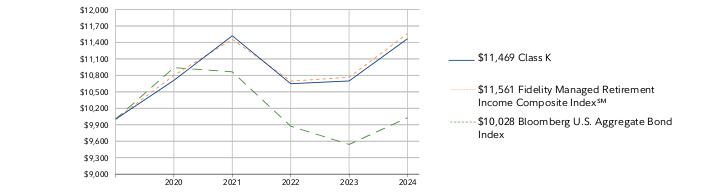 |
| 1 Year | Life of Fund A | |
| Class K | 7.20% | 2.78% |
| Fidelity Managed Retirement Income Composite Index℠ | 7.39% | 2.94% |
| Bloomberg U.S. Aggregate Bond Index | 5.10% | 0.06% |
Visit www.401k.com for more recent performance information. |
The Fund's past performance is not a good predictor of the Fund's future performance. The graph and table do not reflect the deduction of taxes that a shareholder would pay on fund distributions or redemption of fund shares. |
KEY FACTS | ||
| Fund Size | $14,747,002 | |
| Number of Holdings | 33 | |
| Total Advisory Fee | $64,102 | |
| Portfolio Turnover | 33% |
(as of July 31, 2024)
| Bond Funds | 51.2 |
| Inflation-Protected Bond Funds | 20.5 |
| International Equity Funds | 13.6 |
| Domestic Equity Funds | 9.3 |
| Short-Term Funds | 4.3 |
| Short-Term Investments and Net Other Assets (Liabilities) | 1.1 |
ASSET ALLOCATION (% of Fund's net assets) |
|
TOP HOLDINGS (% of Fund's net assets) | ||
| Fidelity Series 0-5 Year Inflation-Protected Bond Index Fund | 19.9 | |
| Fidelity Series Government Bond Index Fund | 13.3 | |
| Fidelity Series Investment Grade Bond Fund | 12.9 | |
| Fidelity Series Corporate Bond Fund | 8.6 | |
| Fidelity Series Investment Grade Securitized Fund | 8.4 | |
| Fidelity Series Emerging Markets Opportunities Fund | 4.6 | |
| Fidelity Series International Developed Markets Bond Index Fund | 3.9 | |
| Fidelity Series Treasury Bill Index Fund | 3.2 | |
| Fidelity Series Long-Term Treasury Bond Index Fund | 2.6 | |
| Fidelity Series Large Cap Value Index Fund | 2.4 | |
| 79.8 | ||
| Fidelity, the Fidelity Investments Logo and all other Fidelity trademarks or service marks used herein are trademarks or service marks of FMR LLC. Any third-party marks that are used herein are trademarks or service marks of their respective owners. © 2024 FMR LLC. All rights reserved. | ||
 | For additional information about the Fund; including its prospectus, financial information, holdings and proxy information, scan the QR code or visit fundresearch.fidelity.com/prospectus/sec 1.9913482.100 3471-TSRA-0924 | |
ANNUAL SHAREHOLDER REPORT | AS OF JULY 31, 2024 | ||
| | Fidelity Managed Retirement 2015 Fund℠ Fidelity Managed Retirement 2015 Fund℠ : FIRSX | |
| Costs of a $10,000 investment | Costs paid as a percentage of a $10,000 investment | ||
| Fidelity Managed Retirement 2015 Fund℠ | $ 48 | 0.46% |
Fidelity Managed Retirement 2015 Fund℠ | $10,000 | $10,560 | $10,743 | $11,786 | $12,343 | $12,899 | $13,908 | $15,661 | $14,292 | $14,505 | $15,664 |
Fidelity Managed Retirement 2015 Composite Index℠ | $10,000 | $10,602 | $10,999 | $11,887 | $12,527 | $13,298 | $14,448 | $16,010 | $14,787 | $15,032 | $16,259 |
Bloomberg U.S. Aggregate Bond Index | $10,000 | $10,282 | $10,893 | $10,837 | $10,750 | $11,619 | $12,795 | $12,705 | $11,547 | $11,158 | $11,727 |
| 2014 | 2015 | 2016 | 2017 | 2018 | 2019 | 2020 | 2021 | 2022 | 2023 | 2024 |
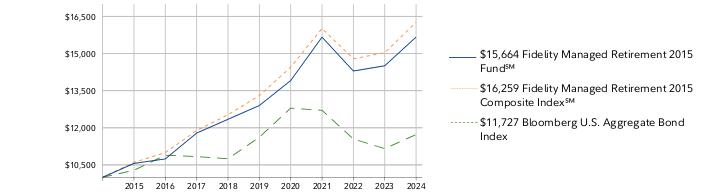 |
| 1 Year | 5 Year | 10 Year | |
| Fidelity Managed Retirement 2015 Fund℠ | 7.99% | 3.96% | 4.59% |
| Fidelity Managed Retirement 2015 Composite Index℠ | 8.16% | 4.10% | 4.98% |
| Bloomberg U.S. Aggregate Bond Index | 5.10% | 0.19% | 1.61% |
Visit www.fidelity.com for more recent performance information. |
The Fund's past performance is not a good predictor of the Fund's future performance. The graph and table do not reflect the deduction of taxes that a shareholder would pay on fund distributions or redemption of fund shares. |
KEY FACTS | ||
| Fund Size | $5,479,558 | |
| Number of Holdings | 33 | |
| Total Advisory Fee | $25,594 | |
| Portfolio Turnover | 34% |
(as of July 31, 2024)
| Bond Funds | 48.3 |
| Inflation-Protected Bond Funds | 18.0 |
| International Equity Funds | 16.7 |
| Domestic Equity Funds | 13.9 |
| Short-Term Funds | 2.5 |
| Short-Term Investments and Net Other Assets (Liabilities) | 0.6 |
ASSET ALLOCATION (% of Fund's net assets) |
|
TOP HOLDINGS (% of Fund's net assets) | ||
| Fidelity Series 0-5 Year Inflation-Protected Bond Index Fund | 15.1 | |
| Fidelity Series Government Bond Index Fund | 12.3 | |
| Fidelity Series Investment Grade Bond Fund | 12.0 | |
| Fidelity Series Corporate Bond Fund | 7.9 | |
| Fidelity Series Investment Grade Securitized Fund | 7.8 | |
| Fidelity Series Emerging Markets Opportunities Fund | 5.2 | |
| Fidelity Series International Developed Markets Bond Index Fund | 4.0 | |
| Fidelity Series Large Cap Value Index Fund | 3.7 | |
| Fidelity Series Blue Chip Growth Fund | 3.0 | |
| Fidelity Series Long-Term Treasury Bond Index Fund | 2.9 | |
| 73.9 | ||
| Fidelity, the Fidelity Investments Logo and all other Fidelity trademarks or service marks used herein are trademarks or service marks of FMR LLC. Any third-party marks that are used herein are trademarks or service marks of their respective owners. © 2024 FMR LLC. All rights reserved. | ||
 | For additional information about the Fund; including its prospectus, financial information, holdings and proxy information, scan the QR code or visit fundresearch.fidelity.com/prospectus/sec 1.9913493.100 1893-TSRA-0924 | |
ANNUAL SHAREHOLDER REPORT | AS OF JULY 31, 2024 | ||
| | Fidelity Managed Retirement 2035 Fund℠ Fidelity Advisor Managed Retirement 2035 Fund℠ Class A : FMRUX | |
| Costs of a $10,000 investment | Costs paid as a percentage of a $10,000 investment | ||
| Class A | $ 77 | 0.73% |
Class A | $9,425 | $10,165 | $11,213 |
Fidelity Managed Retirement 2035 Composite Index | $10,000 | $10,787 | $11,909 |
S&P 500® Index | $10,000 | $11,898 | $14,533 |
Bloomberg U.S. Aggregate Bond Index | $10,000 | $9,962 | $10,470 |
| 2022 | 2023 | 2024 |
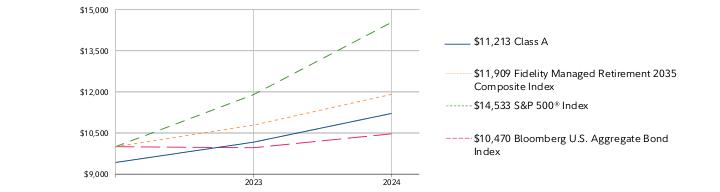 |
| 1 Year | Life of Fund A | |
| Class A (incl. 5.75% sales charge) | 3.97% | 7.29% |
| Class A (without 5.75% sales charge) | 10.31% | 11.27% |
| Fidelity Managed Retirement 2035 Composite Index | 10.39% | 11.33% |
| S&P 500® Index | 24.56% | 26.43% |
| Bloomberg U.S. Aggregate Bond Index | 5.10% | 2.86% |
Visit institutional.fidelity.com for more recent performance information. |
The Fund's past performance is not a good predictor of the Fund's future performance. The graph and table do not reflect the deduction of taxes that a shareholder would pay on fund distributions or redemption of fund shares. |
KEY FACTS | ||
| Fund Size | $10,439,772 | |
| Number of Holdings | 32 | |
| Total Advisory Fee | $16,710 | |
| Portfolio Turnover | 60% |
(as of July 31, 2024)
| Bond Funds | 36.9 |
| Domestic Equity Funds | 27.5 |
| International Equity Funds | 25.8 |
| Inflation-Protected Bond Funds | 9.8 |
| Short-Term Funds | 0.0 |
| Short-Term Investments and Net Other Assets (Liabilities) | 0.0 |
ASSET ALLOCATION (% of Fund's net assets) |
|
TOP HOLDINGS (% of Fund's net assets) | ||
| Fidelity Series 5+ Year Inflation-Protected Bond Index Fund | 8.4 | |
| Fidelity Series Government Bond Index Fund | 8.2 | |
| Fidelity Series Investment Grade Bond Fund | 8.0 | |
| Fidelity Series Large Cap Value Index Fund | 7.4 | |
| Fidelity Series Emerging Markets Opportunities Fund | 7.3 | |
| Fidelity Series Blue Chip Growth Fund | 6.2 | |
| Fidelity Series Corporate Bond Fund | 5.3 | |
| Fidelity Series Investment Grade Securitized Fund | 5.2 | |
| Fidelity Series Long-Term Treasury Bond Index Fund | 4.8 | |
| Fidelity Series International Growth Fund | 4.1 | |
| 64.9 |
| Fidelity, the Fidelity Investments Logo and all other Fidelity trademarks or service marks used herein are trademarks or service marks of FMR LLC. Any third-party marks that are used herein are trademarks or service marks of their respective owners. © 2024 FMR LLC. All rights reserved. | ||
 | For additional information about the Fund; including its prospectus, financial information, holdings and proxy information, scan the QR code or visit fundresearch.fidelity.com/prospectus/sec 1.9913575.100 7304-TSRA-0924 | |
ANNUAL SHAREHOLDER REPORT | AS OF JULY 31, 2024 | ||
| | Fidelity Managed Retirement 2020 Fund℠ Fidelity Advisor Managed Retirement 2020 Fund℠ Class A : FARVX | |
| Costs of a $10,000 investment | Costs paid as a percentage of a $10,000 investment | ||
| Class A | $ 75 | 0.72% |
Class A | $9,425 | $9,951 | $10,077 | $11,104 | $11,692 | $12,162 | $13,106 | $15,092 | $13,640 | $13,918 | $15,085 |
Fidelity Managed Retirement 2020 Composite Index℠ | $10,000 | $10,619 | $11,003 | $11,968 | $12,723 | $13,505 | $14,696 | $16,666 | $15,291 | $15,651 | $17,029 |
Bloomberg U.S. Aggregate Bond Index | $10,000 | $10,282 | $10,893 | $10,837 | $10,750 | $11,619 | $12,795 | $12,705 | $11,547 | $11,158 | $11,727 |
| 2014 | 2015 | 2016 | 2017 | 2018 | 2019 | 2020 | 2021 | 2022 | 2023 | 2024 |
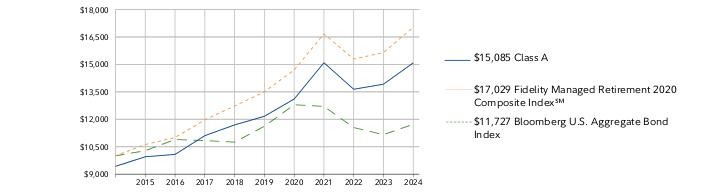 |
| 1 Year | 5 Year | 10 Year | |
| Class A (incl. 5.75% sales charge) | 2.15% | 3.17% | 4.20% |
| Class A (without 5.75% sales charge) | 8.38% | 4.40% | 4.82% |
| Fidelity Managed Retirement 2020 Composite Index℠ | 8.80% | 4.75% | 5.47% |
| Bloomberg U.S. Aggregate Bond Index | 5.10% | 0.19% | 1.61% |
Visit institutional.fidelity.com for more recent performance information. |
The Fund's past performance is not a good predictor of the Fund's future performance. The graph and table do not reflect the deduction of taxes that a shareholder would pay on fund distributions or redemption of fund shares. |
KEY FACTS | ||
| Fund Size | $8,371,922 | |
| Number of Holdings | 33 | |
| Total Advisory Fee | $38,515 | |
| Portfolio Turnover | 32% |
(as of July 31, 2024)
| Bond Funds | 45.9 |
| International Equity Funds | 19.3 |
| Domestic Equity Funds | 17.9 |
| Inflation-Protected Bond Funds | 15.8 |
| Short-Term Funds | 0.9 |
| Short-Term Investments and Net Other Assets (Liabilities) | 0.2 |
ASSET ALLOCATION (% of Fund's net assets) |
|
TOP HOLDINGS (% of Fund's net assets) | ||
| Fidelity Series Government Bond Index Fund | 11.5 | |
| Fidelity Series Investment Grade Bond Fund | 11.2 | |
| Fidelity Series 0-5 Year Inflation-Protected Bond Index Fund | 11.1 | |
| Fidelity Series Corporate Bond Fund | 7.5 | |
| Fidelity Series Investment Grade Securitized Fund | 7.3 | |
| Fidelity Series Emerging Markets Opportunities Fund | 5.9 | |
| Fidelity Series Large Cap Value Index Fund | 4.8 | |
| Fidelity Series 5+ Year Inflation-Protected Bond Index Fund | 4.7 | |
| Fidelity Series International Developed Markets Bond Index Fund | 4.0 | |
| Fidelity Series Blue Chip Growth Fund | 3.9 | |
| 71.9 | ||
| Fidelity, the Fidelity Investments Logo and all other Fidelity trademarks or service marks used herein are trademarks or service marks of FMR LLC. Any third-party marks that are used herein are trademarks or service marks of their respective owners. © 2024 FMR LLC. All rights reserved. | ||
 | For additional information about the Fund; including its prospectus, financial information, holdings and proxy information, scan the QR code or visit fundresearch.fidelity.com/prospectus/sec 1.9913501.100 1997-TSRA-0924 | |
ANNUAL SHAREHOLDER REPORT | AS OF JULY 31, 2024 | This report describes changes to the Fund that occurred during the reporting period. | |
| | Fidelity Managed Retirement 2015 Fund℠ Fidelity Managed Retirement 2015 Fund℠ Class K6 : FJRSX | |
| Costs of a $10,000 investment | Costs paid as a percentage of a $10,000 investment | ||
| Class K6 | $ 27 | 0.26% |
Class K6 | $10,000 | $10,809 | $12,195 | $11,153 | $11,343 | $12,271 |
Fidelity Managed Retirement 2015 Composite Index℠ | $10,000 | $10,859 | $12,034 | $11,114 | $11,298 | $12,221 |
Bloomberg U.S. Aggregate Bond Index | $10,000 | $10,941 | $10,864 | $9,874 | $9,541 | $10,028 |
| 2019 | 2020 | 2021 | 2022 | 2023 | 2024 |
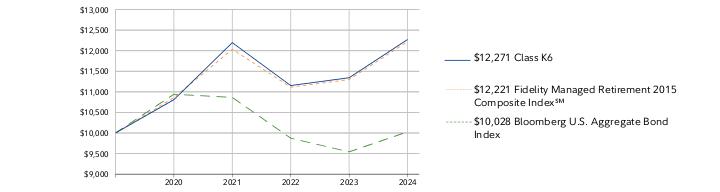 |
| 1 Year | Life of Fund A | |
| Class K6 | 8.18% | 4.18% |
| Fidelity Managed Retirement 2015 Composite Index℠ | 8.16% | 4.09% |
| Bloomberg U.S. Aggregate Bond Index | 5.10% | 0.06% |
Visit www.401k.com for more recent performance information. |
The Fund's past performance is not a good predictor of the Fund's future performance. The graph and table do not reflect the deduction of taxes that a shareholder would pay on fund distributions or redemption of fund shares. |
KEY FACTS | ||
| Fund Size | $5,479,558 | |
| Number of Holdings | 33 | |
| Total Advisory Fee | $25,594 | |
| Portfolio Turnover | 34% |
(as of July 31, 2024)
| Bond Funds | 48.3 |
| Inflation-Protected Bond Funds | 18.0 |
| International Equity Funds | 16.7 |
| Domestic Equity Funds | 13.9 |
| Short-Term Funds | 2.5 |
| Short-Term Investments and Net Other Assets (Liabilities) | 0.6 |
ASSET ALLOCATION (% of Fund's net assets) |
|
TOP HOLDINGS (% of Fund's net assets) | ||
| Fidelity Series 0-5 Year Inflation-Protected Bond Index Fund | 15.1 | |
| Fidelity Series Government Bond Index Fund | 12.3 | |
| Fidelity Series Investment Grade Bond Fund | 12.0 | |
| Fidelity Series Corporate Bond Fund | 7.9 | |
| Fidelity Series Investment Grade Securitized Fund | 7.8 | |
| Fidelity Series Emerging Markets Opportunities Fund | 5.2 | |
| Fidelity Series International Developed Markets Bond Index Fund | 4.0 | |
| Fidelity Series Large Cap Value Index Fund | 3.7 | |
| Fidelity Series Blue Chip Growth Fund | 3.0 | |
| Fidelity Series Long-Term Treasury Bond Index Fund | 2.9 | |
| 73.9 | ||
Effective May 24, 2024, Class Z6, a class of shares of the fund, was consolidated into Class K6 shares of the fund. |
| Fidelity, the Fidelity Investments Logo and all other Fidelity trademarks or service marks used herein are trademarks or service marks of FMR LLC. Any third-party marks that are used herein are trademarks or service marks of their respective owners. © 2024 FMR LLC. All rights reserved. | ||
 | For additional information about the Fund; including its prospectus, financial information, holdings and proxy information, scan the QR code or visit fundresearch.fidelity.com/prospectus/sec 1.9913497.100 3480-TSRA-0924 | |
ANNUAL SHAREHOLDER REPORT | AS OF JULY 31, 2024 | ||
| | Fidelity Managed Retirement 2025 Fund℠ Fidelity Managed Retirement 2025 Fund℠ : FIXRX | |
| Costs of a $10,000 investment | Costs paid as a percentage of a $10,000 investment | ||
| Fidelity Managed Retirement 2025 Fund℠ | $ 49 | 0.47% |
Fidelity Managed Retirement 2025 Fund℠ | $10,000 | $10,617 | $10,753 | $11,950 | $12,668 | $13,190 | $14,284 | $16,826 | $15,138 | $15,606 | $17,070 |
Fidelity Managed Retirement 2025 Composite Index℠ | $10,000 | $10,641 | $11,013 | $12,048 | $12,871 | $13,663 | $14,888 | $17,204 | $15,685 | $16,166 | $17,692 |
Bloomberg U.S. Aggregate Bond Index | $10,000 | $10,282 | $10,893 | $10,837 | $10,750 | $11,619 | $12,795 | $12,705 | $11,547 | $11,158 | $11,727 |
| 2014 | 2015 | 2016 | 2017 | 2018 | 2019 | 2020 | 2021 | 2022 | 2023 | 2024 |
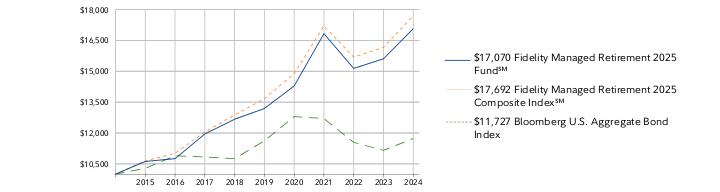 |
| 1 Year | 5 Year | 10 Year | |
| Fidelity Managed Retirement 2025 Fund℠ | 9.38% | 5.29% | 5.49% |
| Fidelity Managed Retirement 2025 Composite Index℠ | 9.44% | 5.31% | 5.87% |
| Bloomberg U.S. Aggregate Bond Index | 5.10% | 0.19% | 1.61% |
Visit www.fidelity.com for more recent performance information. |
The Fund's past performance is not a good predictor of the Fund's future performance. The graph and table do not reflect the deduction of taxes that a shareholder would pay on fund distributions or redemption of fund shares. |
KEY FACTS | ||
| Fund Size | $50,060,844 | |
| Number of Holdings | 33 | |
| Total Advisory Fee | $222,391 | |
| Portfolio Turnover | 36% |
(as of July 31, 2024)
| Bond Funds | 42.7 |
| International Equity Funds | 22.0 |
| Domestic Equity Funds | 21.8 |
| Inflation-Protected Bond Funds | 13.5 |
| Short-Term Funds | 0.0 |
| Short-Term Investments and Net Other Assets (Liabilities) | 0.0 |
ASSET ALLOCATION (% of Fund's net assets) |
|
TOP HOLDINGS (% of Fund's net assets) | ||
| Fidelity Series Government Bond Index Fund | 10.4 | |
| Fidelity Series Investment Grade Bond Fund | 10.1 | |
| Fidelity Series 0-5 Year Inflation-Protected Bond Index Fund | 7.0 | |
| Fidelity Series Corporate Bond Fund | 6.7 | |
| Fidelity Series 5+ Year Inflation-Protected Bond Index Fund | 6.5 | |
| Fidelity Series Investment Grade Securitized Fund | 6.5 | |
| Fidelity Series Emerging Markets Opportunities Fund | 6.5 | |
| Fidelity Series Large Cap Value Index Fund | 5.9 | |
| Fidelity Series Blue Chip Growth Fund | 4.9 | |
| Fidelity Series International Developed Markets Bond Index Fund | 4.0 | |
| 68.5 | ||
| Fidelity, the Fidelity Investments Logo and all other Fidelity trademarks or service marks used herein are trademarks or service marks of FMR LLC. Any third-party marks that are used herein are trademarks or service marks of their respective owners. © 2024 FMR LLC. All rights reserved. | ||
 | For additional information about the Fund; including its prospectus, financial information, holdings and proxy information, scan the QR code or visit fundresearch.fidelity.com/prospectus/sec 1.9913506.100 1996-TSRA-0924 | |
ANNUAL SHAREHOLDER REPORT | AS OF JULY 31, 2024 | ||
| | Fidelity Managed Retirement 2010 Fund℠ Fidelity Advisor Managed Retirement 2010 Fund℠ Class A : FRQAX | |
| Costs of a $10,000 investment | Costs paid as a percentage of a $10,000 investment | ||
| Class A | $ 72 | 0.70% |
Class A | $9,425 | $9,897 | $10,062 | $10,918 | $11,311 | $11,817 | $12,667 | $13,865 | $12,711 | $12,768 | $13,659 |
Fidelity Managed Retirement 2010 Composite Index℠ | $10,000 | $10,582 | $10,986 | $11,778 | $12,300 | $13,058 | $14,159 | $15,315 | $14,237 | $14,371 | $15,452 |
Bloomberg U.S. Aggregate Bond Index | $10,000 | $10,282 | $10,893 | $10,837 | $10,750 | $11,619 | $12,795 | $12,705 | $11,547 | $11,158 | $11,727 |
| 2014 | 2015 | 2016 | 2017 | 2018 | 2019 | 2020 | 2021 | 2022 | 2023 | 2024 |
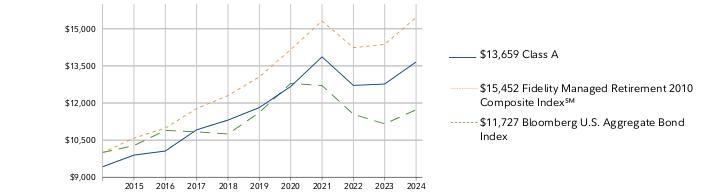 |
| 1 Year | 5 Year | 10 Year | |
| Class A (incl. 5.75% sales charge) | 0.83% | 1.73% | 3.17% |
| Class A (without 5.75% sales charge) | 6.98% | 2.94% | 3.78% |
| Fidelity Managed Retirement 2010 Composite Index℠ | 7.52% | 3.42% | 4.45% |
| Bloomberg U.S. Aggregate Bond Index | 5.10% | 0.19% | 1.61% |
Visit institutional.fidelity.com for more recent performance information. |
The Fund's past performance is not a good predictor of the Fund's future performance. The graph and table do not reflect the deduction of taxes that a shareholder would pay on fund distributions or redemption of fund shares. |
KEY FACTS | ||
| Fund Size | $5,472,463 | |
| Number of Holdings | 33 | |
| Total Advisory Fee | $25,116 | |
| Portfolio Turnover | 25% |
(as of July 31, 2024)
| Bond Funds | 50.8 |
| Inflation-Protected Bond Funds | 20.1 |
| International Equity Funds | 14.1 |
| Domestic Equity Funds | 10.0 |
| Short-Term Funds | 4.0 |
| Short-Term Investments and Net Other Assets (Liabilities) | 1.0 |
ASSET ALLOCATION (% of Fund's net assets) |
|
TOP HOLDINGS (% of Fund's net assets) | ||
| Fidelity Series 0-5 Year Inflation-Protected Bond Index Fund | 19.2 | |
| Fidelity Series Government Bond Index Fund | 13.1 | |
| Fidelity Series Investment Grade Bond Fund | 12.8 | |
| Fidelity Series Corporate Bond Fund | 8.5 | |
| Fidelity Series Investment Grade Securitized Fund | 8.3 | |
| Fidelity Series Emerging Markets Opportunities Fund | 4.7 | |
| Fidelity Series International Developed Markets Bond Index Fund | 3.9 | |
| Fidelity Series Treasury Bill Index Fund | 3.0 | |
| Fidelity Series Long-Term Treasury Bond Index Fund | 2.7 | |
| Fidelity Series Large Cap Value Index Fund | 2.6 | |
| 78.8 | ||
| Fidelity, the Fidelity Investments Logo and all other Fidelity trademarks or service marks used herein are trademarks or service marks of FMR LLC. Any third-party marks that are used herein are trademarks or service marks of their respective owners. © 2024 FMR LLC. All rights reserved. | ||
 | For additional information about the Fund; including its prospectus, financial information, holdings and proxy information, scan the QR code or visit fundresearch.fidelity.com/prospectus/sec 1.9913487.100 1934-TSRA-0924 | |
ANNUAL SHAREHOLDER REPORT | AS OF JULY 31, 2024 | ||
| | Fidelity Managed Retirement 2015 Fund℠ Fidelity Managed Retirement 2015 Fund℠ Class K : FKRSX | |
| Costs of a $10,000 investment | Costs paid as a percentage of a $10,000 investment | ||
| Class K | $ 38 | 0.36% |
Class K | $10,000 | $10,798 | $12,170 | $11,119 | $11,296 | $12,209 |
Fidelity Managed Retirement 2015 Composite Index℠ | $10,000 | $10,859 | $12,034 | $11,114 | $11,298 | $12,221 |
Bloomberg U.S. Aggregate Bond Index | $10,000 | $10,941 | $10,864 | $9,874 | $9,541 | $10,028 |
| 2019 | 2020 | 2021 | 2022 | 2023 | 2024 |
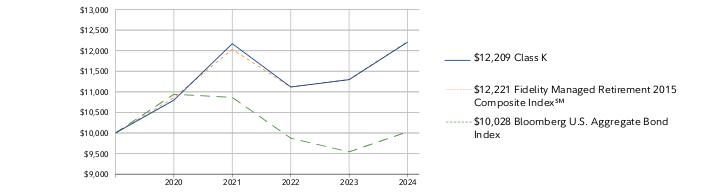 |
| 1 Year | Life of Fund A | |
| Class K | 8.08% | 4.07% |
| Fidelity Managed Retirement 2015 Composite Index℠ | 8.16% | 4.09% |
| Bloomberg U.S. Aggregate Bond Index | 5.10% | 0.06% |
Visit www.401k.com for more recent performance information. |
The Fund's past performance is not a good predictor of the Fund's future performance. The graph and table do not reflect the deduction of taxes that a shareholder would pay on fund distributions or redemption of fund shares. |
KEY FACTS | ||
| Fund Size | $5,479,558 | |
| Number of Holdings | 33 | |
| Total Advisory Fee | $25,594 | |
| Portfolio Turnover | 34% |
(as of July 31, 2024)
| Bond Funds | 48.3 |
| Inflation-Protected Bond Funds | 18.0 |
| International Equity Funds | 16.7 |
| Domestic Equity Funds | 13.9 |
| Short-Term Funds | 2.5 |
| Short-Term Investments and Net Other Assets (Liabilities) | 0.6 |
ASSET ALLOCATION (% of Fund's net assets) |
|
TOP HOLDINGS (% of Fund's net assets) | ||
| Fidelity Series 0-5 Year Inflation-Protected Bond Index Fund | 15.1 | |
| Fidelity Series Government Bond Index Fund | 12.3 | |
| Fidelity Series Investment Grade Bond Fund | 12.0 | |
| Fidelity Series Corporate Bond Fund | 7.9 | |
| Fidelity Series Investment Grade Securitized Fund | 7.8 | |
| Fidelity Series Emerging Markets Opportunities Fund | 5.2 | |
| Fidelity Series International Developed Markets Bond Index Fund | 4.0 | |
| Fidelity Series Large Cap Value Index Fund | 3.7 | |
| Fidelity Series Blue Chip Growth Fund | 3.0 | |
| Fidelity Series Long-Term Treasury Bond Index Fund | 2.9 | |
| 73.9 | ||
| Fidelity, the Fidelity Investments Logo and all other Fidelity trademarks or service marks used herein are trademarks or service marks of FMR LLC. Any third-party marks that are used herein are trademarks or service marks of their respective owners. © 2024 FMR LLC. All rights reserved. | ||
 | For additional information about the Fund; including its prospectus, financial information, holdings and proxy information, scan the QR code or visit fundresearch.fidelity.com/prospectus/sec 1.9913496.100 3474-TSRA-0924 | |
ANNUAL SHAREHOLDER REPORT | AS OF JULY 31, 2024 | ||
| | Fidelity Managed Retirement 2010 Fund℠ Fidelity Advisor Managed Retirement 2010 Fund℠ Class I : FRQIX | |
| Costs of a $10,000 investment | Costs paid as a percentage of a $10,000 investment | ||
| Class I | $ 47 | 0.45% |
Class I | $10,000 | $10,526 | $10,730 | $11,671 | $12,122 | $12,696 | $13,645 | $14,971 | $13,761 | $13,856 | $14,861 |
Fidelity Managed Retirement 2010 Composite Index℠ | $10,000 | $10,582 | $10,986 | $11,778 | $12,300 | $13,058 | $14,159 | $15,315 | $14,237 | $14,371 | $15,452 |
Bloomberg U.S. Aggregate Bond Index | $10,000 | $10,282 | $10,893 | $10,837 | $10,750 | $11,619 | $12,795 | $12,705 | $11,547 | $11,158 | $11,727 |
| 2014 | 2015 | 2016 | 2017 | 2018 | 2019 | 2020 | 2021 | 2022 | 2023 | 2024 |
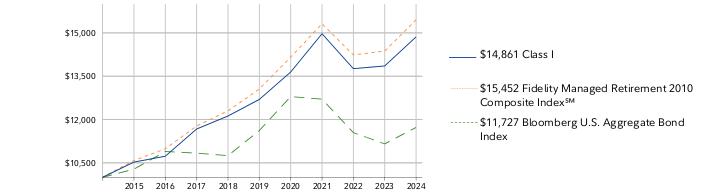 |
| 1 Year | 5 Year | 10 Year | |
| Class I | 7.26% | 3.20% | 4.04% |
| Fidelity Managed Retirement 2010 Composite Index℠ | 7.52% | 3.42% | 4.45% |
| Bloomberg U.S. Aggregate Bond Index | 5.10% | 0.19% | 1.61% |
Visit institutional.fidelity.com for more recent performance information. |
The Fund's past performance is not a good predictor of the Fund's future performance. The graph and table do not reflect the deduction of taxes that a shareholder would pay on fund distributions or redemption of fund shares. |
KEY FACTS | ||
| Fund Size | $5,472,463 | |
| Number of Holdings | 33 | |
| Total Advisory Fee | $25,116 | |
| Portfolio Turnover | 25% |
(as of July 31, 2024)
| Bond Funds | 50.8 |
| Inflation-Protected Bond Funds | 20.1 |
| International Equity Funds | 14.1 |
| Domestic Equity Funds | 10.0 |
| Short-Term Funds | 4.0 |
| Short-Term Investments and Net Other Assets (Liabilities) | 1.0 |
ASSET ALLOCATION (% of Fund's net assets) |
|
TOP HOLDINGS (% of Fund's net assets) | ||
| Fidelity Series 0-5 Year Inflation-Protected Bond Index Fund | 19.2 | |
| Fidelity Series Government Bond Index Fund | 13.1 | |
| Fidelity Series Investment Grade Bond Fund | 12.8 | |
| Fidelity Series Corporate Bond Fund | 8.5 | |
| Fidelity Series Investment Grade Securitized Fund | 8.3 | |
| Fidelity Series Emerging Markets Opportunities Fund | 4.7 | |
| Fidelity Series International Developed Markets Bond Index Fund | 3.9 | |
| Fidelity Series Treasury Bill Index Fund | 3.0 | |
| Fidelity Series Long-Term Treasury Bond Index Fund | 2.7 | |
| Fidelity Series Large Cap Value Index Fund | 2.6 | |
| 78.8 | ||
| Fidelity, the Fidelity Investments Logo and all other Fidelity trademarks or service marks used herein are trademarks or service marks of FMR LLC. Any third-party marks that are used herein are trademarks or service marks of their respective owners. © 2024 FMR LLC. All rights reserved. | ||
 | For additional information about the Fund; including its prospectus, financial information, holdings and proxy information, scan the QR code or visit fundresearch.fidelity.com/prospectus/sec 1.9913488.100 1937-TSRA-0924 | |
ANNUAL SHAREHOLDER REPORT | AS OF JULY 31, 2024 | ||
| | Fidelity Managed Retirement 2035 Fund℠ Fidelity Managed Retirement 2035 Fund℠ : FMRTX | |
| Costs of a $10,000 investment | Costs paid as a percentage of a $10,000 investment | ||
| Fidelity Managed Retirement 2035 Fund℠ | $ 51 | 0.48% |
Fidelity Managed Retirement 2035 Fund℠ | $10,000 | $10,802 | $11,937 |
Fidelity Managed Retirement 2035 Composite Index | $10,000 | $10,787 | $11,909 |
S&P 500® Index | $10,000 | $11,898 | $14,533 |
Bloomberg U.S. Aggregate Bond Index | $10,000 | $9,962 | $10,470 |
| 2022 | 2023 | 2024 |
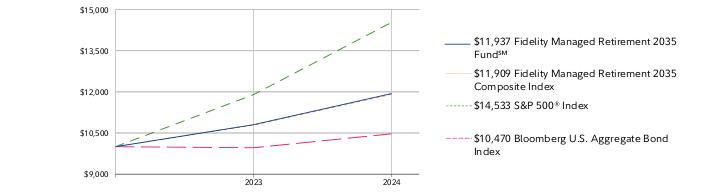 |
| 1 Year | Life of Fund A | |
| Fidelity Managed Retirement 2035 Fund℠ | 10.50% | 11.49% |
| Fidelity Managed Retirement 2035 Composite Index | 10.39% | 11.33% |
| S&P 500® Index | 24.56% | 26.43% |
| Bloomberg U.S. Aggregate Bond Index | 5.10% | 2.86% |
Visit www.fidelity.com for more recent performance information. |
The Fund's past performance is not a good predictor of the Fund's future performance. The graph and table do not reflect the deduction of taxes that a shareholder would pay on fund distributions or redemption of fund shares. |
KEY FACTS | ||
| Fund Size | $10,439,772 | |
| Number of Holdings | 32 | |
| Total Advisory Fee | $16,710 | |
| Portfolio Turnover | 60% |
(as of July 31, 2024)
| Bond Funds | 36.9 |
| Domestic Equity Funds | 27.5 |
| International Equity Funds | 25.8 |
| Inflation-Protected Bond Funds | 9.8 |
| Short-Term Funds | 0.0 |
| Short-Term Investments and Net Other Assets (Liabilities) | 0.0 |
ASSET ALLOCATION (% of Fund's net assets) |
|
TOP HOLDINGS (% of Fund's net assets) | ||
| Fidelity Series 5+ Year Inflation-Protected Bond Index Fund | 8.4 | |
| Fidelity Series Government Bond Index Fund | 8.2 | |
| Fidelity Series Investment Grade Bond Fund | 8.0 | |
| Fidelity Series Large Cap Value Index Fund | 7.4 | |
| Fidelity Series Emerging Markets Opportunities Fund | 7.3 | |
| Fidelity Series Blue Chip Growth Fund | 6.2 | |
| Fidelity Series Corporate Bond Fund | 5.3 | |
| Fidelity Series Investment Grade Securitized Fund | 5.2 | |
| Fidelity Series Long-Term Treasury Bond Index Fund | 4.8 | |
| Fidelity Series International Growth Fund | 4.1 | |
| 64.9 |
| Fidelity, the Fidelity Investments Logo and all other Fidelity trademarks or service marks used herein are trademarks or service marks of FMR LLC. Any third-party marks that are used herein are trademarks or service marks of their respective owners. © 2024 FMR LLC. All rights reserved. | ||
 | For additional information about the Fund; including its prospectus, financial information, holdings and proxy information, scan the QR code or visit fundresearch.fidelity.com/prospectus/sec 1.9913574.100 7303-TSRA-0924 | |
Item 2.
Code of Ethics
As of the end of the period, July 31, 2024, Fidelity Income Fund (the trust) has adopted a code of ethics, as defined in Item 2 of Form N-CSR, that applies to its President and Treasurer and its Chief Financial Officer. A copy of the code of ethics is filed as an exhibit to this Form N-CSR.
Item 3.
Audit Committee Financial Expert
The Board of Trustees of the trust has determined that Elizabeth S. Acton is an audit committee financial expert, as defined in Item 3 of Form N-CSR. Ms. Acton is independent for purposes of Item 3 of Form N-CSR.
Item 4.
Principal Accountant Fees and Services
Fees and Services
The following table presents fees billed by Deloitte & Touche LLP, the member firms of Deloitte Touche Tohmatsu, and their respective affiliates (collectively, “Deloitte Entities”) in each of the last two fiscal years for services rendered to Fidelity Managed Retirement 2010 Fund, Fidelity Managed Retirement 2015 Fund, Fidelity Managed Retirement 2020 Fund, Fidelity Managed Retirement 2025 Fund, Fidelity Managed Retirement 2030 Fund, Fidelity Managed Retirement 2035 Fund, Fidelity Managed Retirement Income Fund, Fidelity Simplicity RMD 2010 Fund, Fidelity Simplicity RMD 2015 Fund, Fidelity Simplicity RMD 2020 Fund, Fidelity Simplicity RMD 2025 Fund, Fidelity Simplicity RMD 2030 Fund, and Fidelity Simplicity RMD Income Fund (the “Funds”):
Services Billed by Deloitte Entities
July 31, 2024 FeesA
Audit Fees | Audit-Related Fees | Tax Fees | All Other Fees | |
Fidelity Managed Retirement 2010 Fund | $21,100 | $- | $7,500 | $600 |
Fidelity Managed Retirement 2015 Fund | $21,100 | $- | $7,500 | $600 |
Fidelity Managed Retirement 2020 Fund | $21,100 | $- | $7,500 | $600 |
Fidelity Managed Retirement 2025 Fund | $21,100 | $- | $7,500 | $600 |
Fidelity Managed Retirement 2030 Fund | $20,400 | $- | $7,500 | $600 |
Fidelity Managed Retirement 2035 Fund | $19,900 | $- | $7,700 | $500 |
Fidelity Managed Retirement Income Fund | $21,100 | $- | $7,500 | $600 |
Fidelity Simplicity RMD 2010 Fund | $14,900 | $- | $7,500 | $500 |
Fidelity Simplicity RMD 2015 Fund | $14,900 | $- | $7,500 | $500 |
Fidelity Simplicity RMD 2020 Fund | $14,900 | $- | $7,500 | $500 |
Fidelity Simplicity RMD 2025 Fund | $17,100 | $- | $7,500 | $500 |
Fidelity Simplicity RMD 2030 Fund | $16,400 | $- | $8,000 | $500 |
Fidelity Simplicity RMD Income Fund | $14,900 | $- | $7,500 | $500 |
July 31, 2023 Fees,A
Audit Fees | Audit-Related Fees | Tax Fees | All Other Fees | |
Fidelity Managed Retirement 2010 Fund | $22,600 | $- | $7,500 | $600 |
Fidelity Managed Retirement 2015 Fund | $22,600 | $- | $7,500 | $600 |
Fidelity Managed Retirement 2020 Fund | $22,600 | $- | $7,500 | $600 |
Fidelity Managed Retirement 2025 Fund | $22,600 | $- | $7,500 | $600 |
Fidelity Managed Retirement 2030 Fund | $21,400 | $- | $8,000 | $600 |
Fidelity Managed Retirement 2035 Fund | $16,900 | $- | $7,500 | $300 |
Fidelity Managed Retirement Income Fund | $22,600 | $- | $7,500 | $600 |
Fidelity Simplicity RMD 2010 Fund | $16,400 | $- | $7,500 | $500 |
Fidelity Simplicity RMD 2015 Fund | $16,400 | $- | $7,500 | $500 |
Fidelity Simplicity RMD 2020 Fund | $16,400 | $- | $7,500 | $500 |
Fidelity Simplicity RMD 2025 Fund | $18,100 | $- | $7,500 | $500 |
Fidelity Simplicity RMD 2030 Fund | $13,800 | $- | $7,800 | $300 |
Fidelity Simplicity RMD Income Fund | $16,400 | $- | $7,500 | $500 |
A Amounts may reflect rounding.
The following table presents fees billed by PricewaterhouseCoopers LLP (“PwC”) in each of the last two fiscal years for services rendered to Fidelity GNMA Fund (the “Fund”):
Services Billed by PwC
July 31, 2024 FeesA
Audit Fees | Audit-Related Fees | Tax Fees | All Other Fees | |
Fidelity GNMA Fund | $96,200 | $8,000 | $14,100 | $3,400 |
July 31, 2023 FeesA
Audit Fees | Audit-Related Fees | Tax Fees | All Other Fees | |
Fidelity GNMA Fund | $96,500 | $8,000 | $14,100 | $3,400 |
A Amounts may reflect rounding.
The following table(s) present(s) fees billed by Deloitte Entities and PwC that were required to be approved by the Audit Committee for services that relate directly to the operations and financial reporting of the Fund(s) and that are rendered on behalf of Fidelity Management & Research Company LLC ("FMR") and entities controlling, controlled by, or under common control with FMR (not including any sub-adviser whose role is primarily portfolio management and is subcontracted with or overseen by another investment adviser) that provide ongoing services to the Fund(s) (“Fund Service Providers”):
Services Billed by Deloitte Entities
July 31, 2024A | July 31, 2023A | |
Audit-Related Fees | $200,000 | $80,000 |
Tax Fees | $- | $- |
All Other Fees | $1,929,500 | $- |
A Amounts may reflect rounding.
Services Billed by PwC
July 31, 2024A | July 31, 2023A | |
Audit-Related Fees | $9,437,800 | $8,699,200 |
Tax Fees | $61,000 | $1,000 |
All Other Fees | $35,000 | $- |
A Amounts may reflect rounding
“Audit-Related Fees” represent fees billed for assurance and related services that are reasonably related to the performance of the fund audit or the review of the fund's financial statements and that are not reported under Audit Fees.
“Tax Fees” represent fees billed for tax compliance, tax advice or tax planning that relate directly to the operations and financial reporting of the fund.
“All Other Fees” represent fees billed for services provided to the fund or Fund Service Provider, a significant portion of which are assurance related, that relate directly to the operations and financial reporting of the fund, excluding those services that are reported under Audit Fees, Audit-Related Fees or Tax Fees.
Assurance services must be performed by an independent public accountant.
* * *
The aggregate non-audit fees billed by Deloitte Entities and PwC for services rendered to the Fund(s), FMR (not including any sub-adviser whose role is primarily portfolio management and is subcontracted with or overseen by another investment adviser), and any Fund Service Provider for each of the last two fiscal years of the Fund(s) are as follows:
Billed By | July 31, 2024A | July 31, 2023A |
Deloitte Entities | $5,053,800 | $3,403,000 |
PwC | $15,033,900 | $14,178,500 |
A Amounts may reflect rounding.
The trust's Audit Committee has considered non-audit services that were not pre-approved that were provided by Deloitte Entities and PwC to Fund Service Providers to be compatible with maintaining the independence of Deloitte Entities and PwC in its(their) audit of the Fund(s), taking into account representations from Deloitte Entities and PwC, in accordance with Public Company Accounting Oversight Board rules, regarding its independence from the Fund(s) and its(their) related entities and FMR’s review of the appropriateness and permissibility under applicable law of such non-audit services prior to their provision to the Fund(s) Service Providers.
Audit Committee Pre-Approval Policies and Procedures
The trust’s Audit Committee must pre-approve all audit and non-audit services provided by a fund’s independent registered public accounting firm relating to the operations or financial reporting of the fund. Prior to the commencement of any audit or non-audit services to a fund, the Audit Committee reviews the services to determine whether they are appropriate and permissible under applicable law.
The Audit Committee has adopted policies and procedures to, among other purposes, provide a framework for the Committee’s consideration of non-audit services by the audit firms that audit the Fidelity funds. The policies and procedures require that any non-audit service provided by a fund audit firm to a Fidelity fund and any non-audit service provided by a fund auditor to a Fund Service Provider that relates directly to the operations and financial reporting of a Fidelity fund (“Covered Service”) are subject to approval by the Audit Committee before such service is provided.
All Covered Services must be approved in advance of provision of the service either: (i) by formal resolution of the Audit Committee, or (ii) by oral or written approval of the service by the Chair of the Audit Committee (or if the Chair is unavailable, such other member of the Audit Committee as may be designated by the Chair to act in the Chair’s absence). The approval contemplated by (ii) above is permitted where the Treasurer determines that action on such an engagement is necessary before the next meeting of the Audit Committee.
Non-audit services provided by a fund audit firm to a Fund Service Provider that do not relate directly to the operations and financial reporting of a Fidelity fund are reported to the Audit Committee periodically.
Non-Audit Services Approved Pursuant to Rule 2-01(c)(7)(i)(C) and (ii) of Regulation S-X (“De Minimis Exception”)
There were no non-audit services approved or required to be approved by the Audit Committee pursuant to the De Minimis Exception during the Fund’s(s’) last two fiscal
years relating to services provided to (i) the Fund(s) or (ii) any Fund Service Provider that relate directly to the operations and financial reporting of the Fund(s).
The Registrant has not retained, for the preparation of the audit report on the financial statements included in the Form N-CSR, a registered public accounting firm that has a branch or office that is located in a foreign jurisdiction and that the Public Company Accounting Oversight Board (the “PCAOB”) has determined that the PCAOB is unable to inspect or investigate completely because of a position taken by an authority in the foreign jurisdiction.
The Registrant is not a “foreign issuer,” as defined in 17 CFR 240.3b-4.
Item 5.
Audit Committee of Listed Registrants
Not applicable.
Item 6.
Investments
(a)
Not applicable.
(b)
Not applicable.
Item 7.
Financial Statements and Financial Highlights for Open-End Management Investment Companies


Contents
| Domestic Equity Funds - 9.3% | |||
| Shares | Value ($) | ||
| Fidelity Series All-Sector Equity Fund (a) | 7,051 | 87,151 | |
| Fidelity Series Blue Chip Growth Fund (a) | 12,873 | 246,258 | |
| Fidelity Series Commodity Strategy Fund (a) | 2,636 | 246,956 | |
| Fidelity Series Growth Company Fund (a) | 19,149 | 462,268 | |
| Fidelity Series Intrinsic Opportunities Fund (a) | 6,961 | 84,989 | |
| Fidelity Series Large Cap Stock Fund (a) | 18,632 | 433,754 | |
| Fidelity Series Large Cap Value Index Fund (a) | 8,087 | 133,193 | |
| Fidelity Series Opportunistic Insights Fund (a) | 11,615 | 272,717 | |
| Fidelity Series Small Cap Core Fund (a) | 1,026 | 12,749 | |
| Fidelity Series Small Cap Discovery Fund (a) | 2,990 | 35,462 | |
| Fidelity Series Small Cap Opportunities Fund (a) | 8,263 | 134,187 | |
| Fidelity Series Stock Selector Large Cap Value Fund (a) | 20,548 | 297,118 | |
| Fidelity Series Value Discovery Fund (a) | 16,476 | 264,927 | |
| TOTAL DOMESTIC EQUITY FUNDS (Cost $2,083,586) | 2,711,729 | ||
| International Equity Funds - 13.6% | |||
| Shares | Value ($) | ||
| Fidelity Series Canada Fund (a) | 12,828 | 202,176 | |
| Fidelity Series Emerging Markets Fund (a) | 35,486 | 324,696 | |
| Fidelity Series Emerging Markets Opportunities Fund (a) | 69,282 | 1,300,419 | |
| Fidelity Series International Growth Fund (a) | 30,793 | 570,904 | |
| Fidelity Series International Small Cap Fund (a) | 24,245 | 439,568 | |
| Fidelity Series International Value Fund (a) | 43,305 | 567,293 | |
| Fidelity Series Overseas Fund (a) | 39,236 | 566,568 | |
| TOTAL INTERNATIONAL EQUITY FUNDS (Cost $3,189,428) | 3,971,624 | ||
| Bond Funds - 71.7% | |||
| Shares | Value ($) | ||
| Fidelity Series 0-5 Year Inflation-Protected Bond Index Fund (a) | 598,183 | 5,796,393 | |
| Fidelity Series 5+ Year Inflation-Protected Bond Index Fund (a) | 23,017 | 178,379 | |
| Fidelity Series Emerging Markets Debt Fund (a) | 19,358 | 153,122 | |
| Fidelity Series Emerging Markets Debt Local Currency Fund (a) | 5,374 | 48,633 | |
| Fidelity Series Floating Rate High Income Fund (a) | 3,250 | 29,186 | |
| Fidelity Series High Income Fund (a) | 18,550 | 158,227 | |
| Fidelity Series International Credit Fund (a) | 2,059 | 16,929 | |
| Fidelity Series International Developed Markets Bond Index Fund (a) | 132,291 | 1,149,606 | |
| Fidelity Series Investment Grade Bond Fund (a) | 1,246,554 | 12,565,269 | |
| Fidelity Series Long-Term Treasury Bond Index Fund (a) | 136,887 | 776,149 | |
| Fidelity Series Real Estate Income Fund (a) | 2,930 | 28,915 | |
| TOTAL BOND FUNDS (Cost $22,678,278) | 20,900,808 | ||
| Short-Term Funds - 5.4% | |||
| Shares | Value ($) | ||
| Fidelity Series Government Money Market Fund 5.42% (a)(b) | 1,246,024 | 1,246,024 | |
| Fidelity Series Short-Term Credit Fund (a) | 32,637 | 325,064 | |
| TOTAL SHORT-TERM FUNDS (Cost $1,568,354) | 1,571,088 | ||
| TOTAL INVESTMENT IN SECURITIES - 100.0% (Cost $29,519,646) | 29,155,249 |
NET OTHER ASSETS (LIABILITIES) - 0.0% | (10,984) |
| NET ASSETS - 100.0% | 29,144,265 |
| (a) | Affiliated Fund |
| (b) | The rate quoted is the annualized seven-day yield of the fund at period end. |
| Affiliate | Value, beginning of period ($) | Purchases ($) | Sales Proceeds ($) | Dividend Income ($) | Realized Gain (loss) ($) | Change in Unrealized appreciation (depreciation) ($) | Value, end of period ($) |
| Fidelity Series 0-5 Year Inflation-Protected Bond Index Fund | 7,018,186 | 810,311 | 2,161,164 | 215,672 | (60,957) | 190,017 | 5,796,393 |
| Fidelity Series 5+ Year Inflation-Protected Bond Index Fund | 214,310 | 23,080 | 54,727 | 8,421 | (3,620) | (664) | 178,379 |
| Fidelity Series All-Sector Equity Fund | 71,283 | 35,318 | 31,088 | 5,234 | 1,164 | 10,474 | 87,151 |
| Fidelity Series Blue Chip Growth Fund | 196,979 | 97,625 | 105,911 | 1,076 | 7,831 | 49,734 | 246,258 |
| Fidelity Series Canada Fund | 236,535 | 42,552 | 88,921 | 7,100 | 13,852 | (1,842) | 202,176 |
| Fidelity Series Commodity Strategy Fund | 264,781 | 91,609 | 84,814 | 10,335 | (5,352) | (19,268) | 246,956 |
| Fidelity Series Emerging Markets Debt Fund | 181,579 | 17,002 | 52,894 | 10,416 | (11,819) | 19,254 | 153,122 |
| Fidelity Series Emerging Markets Debt Local Currency Fund | 61,532 | 7,374 | 16,504 | 3,862 | (1,694) | (2,075) | 48,633 |
| Fidelity Series Emerging Markets Fund | 315,154 | 141,203 | 143,084 | 7,853 | (9,449) | 20,872 | 324,696 |
| Fidelity Series Emerging Markets Opportunities Fund | 1,395,401 | 474,786 | 601,247 | 36,252 | (46,089) | 77,568 | 1,300,419 |
| Fidelity Series Floating Rate High Income Fund | 35,970 | 5,392 | 12,148 | 3,111 | (336) | 308 | 29,186 |
| Fidelity Series Government Money Market Fund 5.42% | 3,101,330 | 471,766 | 2,327,072 | 109,563 | - | - | 1,246,024 |
| Fidelity Series Growth Company Fund | 366,740 | 195,111 | 199,664 | 10,753 | 11,101 | 88,980 | 462,268 |
| Fidelity Series High Income Fund | 190,964 | 14,637 | 52,317 | 11,093 | (6,135) | 11,078 | 158,227 |
| Fidelity Series International Credit Fund | 15,198 | 678 | - | 678 | - | 1,053 | 16,929 |
| Fidelity Series International Developed Markets Bond Index Fund | 1,380,465 | 111,509 | 365,582 | 45,993 | (35,073) | 58,287 | 1,149,606 |
| Fidelity Series International Growth Fund | 672,075 | 130,109 | 287,531 | 7,716 | 4,979 | 51,272 | 570,904 |
| Fidelity Series International Small Cap Fund | 187,392 | 371,164 | 205,432 | 18,146 | 3,746 | 82,698 | 439,568 |
| Fidelity Series International Value Fund | 676,210 | 103,535 | 283,771 | 19,208 | 23,027 | 48,292 | 567,293 |
| Fidelity Series Intrinsic Opportunities Fund | 73,289 | 47,874 | 35,591 | 15,218 | (1,949) | 1,366 | 84,989 |
| Fidelity Series Investment Grade Bond Fund | 14,506,058 | 1,955,336 | 4,082,251 | 565,562 | (365,813) | 551,939 | 12,565,269 |
| Fidelity Series Large Cap Stock Fund | 344,741 | 195,386 | 175,148 | 17,339 | 14,349 | 54,426 | 433,754 |
| Fidelity Series Large Cap Value Index Fund | 107,891 | 65,017 | 53,028 | 4,407 | 3,335 | 9,978 | 133,193 |
| Fidelity Series Long-Term Treasury Bond Index Fund | 1,345,046 | 315,601 | 839,863 | 38,261 | (271,014) | 226,379 | 776,149 |
| Fidelity Series Opportunistic Insights Fund | 218,577 | 103,514 | 115,074 | 2,135 | 8,618 | 57,082 | 272,717 |
| Fidelity Series Overseas Fund | 673,053 | 107,175 | 279,153 | 9,814 | 33,009 | 32,484 | 566,568 |
| Fidelity Series Real Estate Income Fund | 50,182 | 3,304 | 24,609 | 2,368 | (2,167) | 2,205 | 28,915 |
| Fidelity Series Short-Term Credit Fund | 641,551 | 23,506 | 354,879 | 16,189 | (4,314) | 19,200 | 325,064 |
| Fidelity Series Small Cap Core Fund | 658 | 11,122 | 151 | 62 | 19 | 1,101 | 12,749 |
| Fidelity Series Small Cap Discovery Fund | 31,556 | 18,269 | 15,436 | 3,012 | 409 | 664 | 35,462 |
| Fidelity Series Small Cap Opportunities Fund | 105,079 | 47,774 | 41,896 | 1,055 | 1,956 | 21,274 | 134,187 |
| Fidelity Series Stock Selector Large Cap Value Fund | 240,009 | 154,552 | 127,645 | 17,121 | 5,095 | 25,107 | 297,118 |
| Fidelity Series Value Discovery Fund | 215,117 | 138,519 | 103,716 | 11,194 | 1,812 | 13,195 | 264,927 |
| 35,134,891 | 6,331,710 | 13,322,311 | 1,236,219 | (691,479) | 1,702,438 | 29,155,249 |
| Valuation Inputs at Reporting Date: | ||||
| Description | Total ($) | Level 1 ($) | Level 2 ($) | Level 3 ($) |
Investments in Securities: | ||||
| Domestic Equity Funds | 2,711,729 | 2,711,729 | - | - |
| International Equity Funds | 3,971,624 | 3,971,624 | - | - |
| Bond Funds | 20,900,808 | 20,900,808 | - | - |
| Short-Term Funds | 1,571,088 | 1,571,088 | - | - |
| Total Investments in Securities: | 29,155,249 | 29,155,249 | - | - |
| Statement of Assets and Liabilities | ||||
As of July 31, 2024 | ||||
| Assets | ||||
| Investment in securities, at value - See accompanying schedule: | ||||
Affiliated issuers (cost $29,519,646) | $ | 29,155,249 | ||
| Total Investment in Securities (cost $29,519,646) | $ | 29,155,249 | ||
| Cash | 215 | |||
| Receivable for investments sold | 198,521 | |||
Total assets | 29,353,985 | |||
| Liabilities | ||||
| Payable for investments purchased | $ | 101,044 | ||
| Payable for fund shares redeemed | 97,477 | |||
| Accrued management fee | 11,192 | |||
| Other payables and accrued expenses | 7 | |||
| Total liabilities | 209,720 | |||
| Net Assets | $ | 29,144,265 | ||
| Net Assets consist of: | ||||
| Paid in capital | $ | 31,243,429 | ||
| Total accumulated earnings (loss) | (2,099,164) | |||
| Net Assets | $ | 29,144,265 | ||
Net Asset Value, offering price and redemption price per share ($29,144,265 ÷ 516,309 shares) | $ | 56.45 | ||
| Statement of Operations | ||||
| Year ended July 31, 2024 | ||||
| Investment Income | ||||
| Dividends: | ||||
| Affiliated issuers | $ | 1,166,703 | ||
| Expenses | ||||
| Management fee | $ | 143,976 | ||
| Independent trustees' fees and expenses | 96 | |||
| Miscellaneous | 259 | |||
| Total expenses before reductions | 144,331 | |||
| Expense reductions | (8) | |||
| Total expenses after reductions | 144,323 | |||
| Net Investment income (loss) | 1,022,380 | |||
| Realized and Unrealized Gain (Loss) | ||||
| Net realized gain (loss) on: | ||||
| Investment Securities: | ||||
| Affiliated issuers | (691,479) | |||
| Capital gain distributions from underlying funds: | ||||
| Affiliated issuers | 69,516 | |||
| Total net realized gain (loss) | (621,963) | |||
| Change in net unrealized appreciation (depreciation) on: | ||||
| Investment Securities: | ||||
| Affiliated issuers | 1,702,438 | |||
| Total change in net unrealized appreciation (depreciation) | 1,702,438 | |||
| Net gain (loss) | 1,080,475 | |||
| Net increase (decrease) in net assets resulting from operations | $ | 2,102,855 | ||
| Statement of Changes in Net Assets | ||||
Year ended July 31, 2024 | Year ended July 31, 2023 | |||
| Increase (Decrease) in Net Assets | ||||
| Operations | ||||
| Net investment income (loss) | $ | 1,022,380 | $ | 1,469,983 |
| Net realized gain (loss) | (621,963) | (863,475) | ||
| Change in net unrealized appreciation (depreciation) | 1,702,438 | (475,115) | ||
| Net increase (decrease) in net assets resulting from operations | 2,102,855 | 131,393 | ||
| Distributions to shareholders | (986,396) | (2,081,134) | ||
| Share transactions | ||||
| Proceeds from sales of shares | 642,495 | 1,555,588 | ||
| Reinvestment of distributions | 856,507 | 1,826,862 | ||
| Cost of shares redeemed | (8,605,623) | (6,832,236) | ||
Net increase (decrease) in net assets resulting from share transactions | (7,106,621) | (3,449,786) | ||
| Total increase (decrease) in net assets | (5,990,162) | (5,399,527) | ||
| Net Assets | ||||
| Beginning of period | 35,134,427 | 40,533,954 | ||
| End of period | $ | 29,144,265 | $ | 35,134,427 |
| Other Information | ||||
| Shares | ||||
| Sold | 11,898 | 28,765 | ||
| Issued in reinvestment of distributions | 15,756 | 34,369 | ||
| Redeemed | (158,926) | (127,752) | ||
| Net increase (decrease) | (131,272) | (64,618) | ||
Fidelity Simplicity RMD Income Fund℠ |
| Years ended July 31, | 2024 | 2023 | 2022 | 2021 | 2020 | |||||
Selected Per-Share Data | ||||||||||
| Net asset value, beginning of period | $ | 54.25 | $ | 56.91 | $ | 64.40 | $ | 61.11 | $ | 58.52 |
| Income from Investment Operations | ||||||||||
Net investment income (loss) A,B | 1.770 | 2.156 | 1.542 | .572 | .950 | |||||
| Net realized and unrealized gain (loss) | 2.117 | (1.812) | (6.196) | 4.418 | 3.181 | |||||
| Total from investment operations | 3.887 | .344 | (4.654) | 4.990 | 4.131 | |||||
| Distributions from net investment income | (1.682) | (2.108) | (1.516) | (.562) | (1.020) | |||||
| Distributions from net realized gain | (.005) | (.896) | (1.320) | (1.138) | (.521) | |||||
| Total distributions | (1.687) | (3.004) | (2.836) | (1.700) | (1.541) | |||||
| Net asset value, end of period | $ | 56.45 | $ | 54.25 | $ | 56.91 | $ | 64.40 | $ | 61.11 |
Total Return C | 7.32 % | .84% | (7.54)% | 8.26% | 7.19% | |||||
Ratios to Average Net Assets B,D,E | ||||||||||
| Expenses before reductions | .46% | .46% | .46% | .46% | .46% | |||||
| Expenses net of fee waivers, if any | .46 % | .46% | .46% | .46% | .46% | |||||
| Expenses net of all reductions | .46% | .46% | .46% | .46% | .46% | |||||
| Net investment income (loss) | 3.27% | 4.02% | 2.56% | .91% | 1.62% | |||||
| Supplemental Data | ||||||||||
| Net assets, end of period (000 omitted) | $ | 29,144 | $ | 35,134 | $ | 40,534 | $ | 46,223 | $ | 39,908 |
Portfolio turnover rate F | 20 % | 21% | 59% | 37% | 42% G |
| Domestic Equity Funds - 14.4% | |||
| Shares | Value ($) | ||
| Fidelity Series All-Sector Equity Fund (a) | 3,953 | 48,858 | |
| Fidelity Series Blue Chip Growth Fund (a) | 7,133 | 136,452 | |
| Fidelity Series Commodity Strategy Fund (a) | 914 | 85,674 | |
| Fidelity Series Growth Company Fund (a) | 10,638 | 256,798 | |
| Fidelity Series Intrinsic Opportunities Fund (a) | 3,906 | 47,694 | |
| Fidelity Series Large Cap Stock Fund (a) | 10,426 | 242,720 | |
| Fidelity Series Large Cap Value Index Fund (a) | 4,505 | 74,199 | |
| Fidelity Series Opportunistic Insights Fund (a) | 6,439 | 151,189 | |
| Fidelity Series Small Cap Core Fund (a) | 570 | 7,079 | |
| Fidelity Series Small Cap Discovery Fund (a) | 1,666 | 19,754 | |
| Fidelity Series Small Cap Opportunities Fund (a) | 4,636 | 75,287 | |
| Fidelity Series Stock Selector Large Cap Value Fund (a) | 11,446 | 165,515 | |
| Fidelity Series Value Discovery Fund (a) | 9,178 | 147,584 | |
| TOTAL DOMESTIC EQUITY FUNDS (Cost $1,088,878) | 1,458,803 | ||
| International Equity Funds - 17.0% | |||
| Shares | Value ($) | ||
| Fidelity Series Canada Fund (a) | 6,109 | 96,281 | |
| Fidelity Series Emerging Markets Fund (a) | 14,466 | 132,363 | |
| Fidelity Series Emerging Markets Opportunities Fund (a) | 28,243 | 530,119 | |
| Fidelity Series International Growth Fund (a) | 14,665 | 271,881 | |
| Fidelity Series International Small Cap Fund (a) | 8,380 | 151,938 | |
| Fidelity Series International Value Fund (a) | 20,636 | 270,331 | |
| Fidelity Series Overseas Fund (a) | 18,697 | 269,985 | |
| TOTAL INTERNATIONAL EQUITY FUNDS (Cost $1,402,631) | 1,722,898 | ||
| Bond Funds - 65.6% | |||
| Shares | Value ($) | ||
| Fidelity Series 0-5 Year Inflation-Protected Bond Index Fund (a) | 151,150 | 1,464,642 | |
| Fidelity Series 5+ Year Inflation-Protected Bond Index Fund (a) | 40,844 | 316,541 | |
| Fidelity Series Emerging Markets Debt Fund (a) | 6,733 | 53,259 | |
| Fidelity Series Emerging Markets Debt Local Currency Fund (a) | 1,847 | 16,715 | |
| Fidelity Series Floating Rate High Income Fund (a) | 1,127 | 10,116 | |
| Fidelity Series High Income Fund (a) | 6,429 | 54,843 | |
| Fidelity Series International Credit Fund (a) | 446 | 3,663 | |
| Fidelity Series International Developed Markets Bond Index Fund (a) | 46,139 | 400,950 | |
| Fidelity Series Investment Grade Bond Fund (a) | 397,549 | 4,007,294 | |
| Fidelity Series Long-Term Treasury Bond Index Fund (a) | 51,553 | 292,308 | |
| Fidelity Series Real Estate Income Fund (a) | 1,016 | 10,029 | |
| TOTAL BOND FUNDS (Cost $7,168,084) | 6,630,360 | ||
| Short-Term Funds - 3.0% | |||
| Shares | Value ($) | ||
| Fidelity Series Government Money Market Fund 5.42% (a)(b) | 243,899 | 243,899 | |
| Fidelity Series Short-Term Credit Fund (a) | 6,031 | 60,069 | |
| TOTAL SHORT-TERM FUNDS (Cost $303,316) | 303,968 | ||
| TOTAL INVESTMENT IN SECURITIES - 100.0% (Cost $9,962,909) | 10,116,029 |
NET OTHER ASSETS (LIABILITIES) - 0.0% | (4,007) |
| NET ASSETS - 100.0% | 10,112,022 |
| (a) | Affiliated Fund |
| (b) | The rate quoted is the annualized seven-day yield of the fund at period end. |
| Affiliate | Value, beginning of period ($) | Purchases ($) | Sales Proceeds ($) | Dividend Income ($) | Realized Gain (loss) ($) | Change in Unrealized appreciation (depreciation) ($) | Value, end of period ($) |
| Fidelity Series 0-5 Year Inflation-Protected Bond Index Fund | 1,370,749 | 408,010 | 345,459 | 47,722 | (4,014) | 35,356 | 1,464,642 |
| Fidelity Series 5+ Year Inflation-Protected Bond Index Fund | 373,188 | 54,820 | 104,105 | 14,886 | (21,979) | 14,617 | 316,541 |
| Fidelity Series All-Sector Equity Fund | 43,510 | 15,117 | 16,735 | 3,209 | 1,709 | 5,257 | 48,858 |
| Fidelity Series Blue Chip Growth Fund | 120,315 | 38,992 | 57,863 | 670 | 6,220 | 28,788 | 136,452 |
| Fidelity Series Canada Fund | 97,819 | 23,838 | 32,182 | 3,246 | 2,606 | 4,200 | 96,281 |
| Fidelity Series Commodity Strategy Fund | 76,903 | 39,112 | 23,093 | 3,065 | (1,139) | (6,109) | 85,674 |
| Fidelity Series Emerging Markets Debt Fund | 52,727 | 10,651 | 12,721 | 3,340 | (385) | 2,987 | 53,259 |
| Fidelity Series Emerging Markets Debt Local Currency Fund | 17,887 | 3,988 | 4,028 | 1,212 | (345) | (787) | 16,715 |
| Fidelity Series Emerging Markets Fund | 117,156 | 54,990 | 45,691 | 2,999 | (2,950) | 8,858 | 132,363 |
| Fidelity Series Emerging Markets Opportunities Fund | 496,992 | 204,394 | 190,538 | 13,846 | (12,235) | 31,506 | 530,119 |
| Fidelity Series Floating Rate High Income Fund | 10,343 | 2,932 | 3,147 | 994 | (62) | 50 | 10,116 |
| Fidelity Series Government Money Market Fund 5.42% | 662,457 | 189,013 | 607,571 | 23,072 | - | - | 243,899 |
| Fidelity Series Growth Company Fund | 224,043 | 79,052 | 106,488 | 6,716 | 9,604 | 50,587 | 256,798 |
| Fidelity Series High Income Fund | 55,481 | 10,692 | 13,021 | 3,555 | (602) | 2,293 | 54,843 |
| Fidelity Series International Credit Fund | 3,288 | 147 | - | 147 | - | 228 | 3,663 |
| Fidelity Series International Developed Markets Bond Index Fund | 401,763 | 83,620 | 91,556 | 14,999 | (3,621) | 10,744 | 400,950 |
| Fidelity Series International Growth Fund | 277,999 | 69,442 | 105,347 | 3,526 | 2,613 | 27,174 | 271,881 |
| Fidelity Series International Small Cap Fund | 77,606 | 103,991 | 54,530 | 5,604 | 488 | 24,383 | 151,938 |
| Fidelity Series International Value Fund | 279,712 | 61,690 | 107,338 | 8,779 | 7,643 | 28,624 | 270,331 |
| Fidelity Series Intrinsic Opportunities Fund | 44,738 | 21,660 | 18,118 | 9,339 | (1,364) | 778 | 47,694 |
| Fidelity Series Investment Grade Bond Fund | 3,785,894 | 1,038,886 | 880,424 | 165,545 | (23,365) | 86,303 | 4,007,294 |
| Fidelity Series Large Cap Stock Fund | 210,602 | 80,166 | 88,122 | 10,923 | 4,522 | 35,552 | 242,720 |
| Fidelity Series Large Cap Value Index Fund | 65,882 | 26,931 | 26,298 | 2,788 | 1,229 | 6,455 | 74,199 |
| Fidelity Series Long-Term Treasury Bond Index Fund | 417,947 | 134,646 | 247,016 | 13,084 | (70,866) | 57,597 | 292,308 |
| Fidelity Series Opportunistic Insights Fund | 133,510 | 36,905 | 59,422 | 1,358 | 4,384 | 35,812 | 151,189 |
| Fidelity Series Overseas Fund | 278,404 | 60,818 | 103,692 | 4,485 | 5,201 | 29,254 | 269,985 |
| Fidelity Series Real Estate Income Fund | 14,361 | 2,096 | 6,542 | 792 | (649) | 763 | 10,029 |
| Fidelity Series Short-Term Credit Fund | 122,634 | 15,804 | 81,378 | 3,240 | (740) | 3,749 | 60,069 |
| Fidelity Series Small Cap Core Fund | 413 | 6,110 | 90 | 36 | 11 | 635 | 7,079 |
| Fidelity Series Small Cap Discovery Fund | 19,238 | 8,318 | 8,571 | 1,749 | 60 | 709 | 19,754 |
| Fidelity Series Small Cap Opportunities Fund | 64,164 | 19,847 | 22,435 | 659 | 1,066 | 12,645 | 75,287 |
| Fidelity Series Stock Selector Large Cap Value Fund | 146,606 | 65,400 | 63,985 | 10,501 | 1,996 | 15,498 | 165,515 |
| Fidelity Series Value Discovery Fund | 131,397 | 60,610 | 52,812 | 7,021 | 1,398 | 6,991 | 147,584 |
| 10,195,728 | 3,032,688 | 3,580,318 | 393,107 | (93,566) | 561,497 | 10,116,029 |
| Valuation Inputs at Reporting Date: | ||||
| Description | Total ($) | Level 1 ($) | Level 2 ($) | Level 3 ($) |
Investments in Securities: | ||||
| Domestic Equity Funds | 1,458,803 | 1,458,803 | - | - |
| International Equity Funds | 1,722,898 | 1,722,898 | - | - |
| Bond Funds | 6,630,360 | 6,630,360 | - | - |
| Short-Term Funds | 303,968 | 303,968 | - | - |
| Total Investments in Securities: | 10,116,029 | 10,116,029 | - | - |
| Statement of Assets and Liabilities | ||||
As of July 31, 2024 | ||||
| Assets | ||||
| Investment in securities, at value - See accompanying schedule: | ||||
Affiliated issuers (cost $9,962,909) | $ | 10,116,029 | ||
| Total Investment in Securities (cost $9,962,909) | $ | 10,116,029 | ||
| Cash | 32 | |||
| Receivable for investments sold | 62,165 | |||
Total assets | 10,178,226 | |||
| Liabilities | ||||
| Payable for investments purchased | $ | 57,395 | ||
| Payable for fund shares redeemed | 4,770 | |||
| Accrued management fee | 4,039 | |||
| Total liabilities | 66,204 | |||
| Net Assets | $ | 10,112,022 | ||
| Net Assets consist of: | ||||
| Paid in capital | $ | 10,398,061 | ||
| Total accumulated earnings (loss) | (286,039) | |||
| Net Assets | $ | 10,112,022 | ||
Net Asset Value, offering price and redemption price per share ($10,112,022 ÷ 190,583 shares) | $ | 53.06 | ||
| Statement of Operations | ||||
| Year ended July 31, 2024 | ||||
| Investment Income | ||||
| Dividends: | ||||
| Affiliated issuers | $ | 352,464 | ||
| Expenses | ||||
| Management fee | $ | 48,350 | ||
| Independent trustees' fees and expenses | 30 | |||
| Miscellaneous | 60 | |||
| Total expenses before reductions | 48,440 | |||
| Expense reductions | (1) | |||
| Total expenses after reductions | 48,439 | |||
| Net Investment income (loss) | 304,025 | |||
| Realized and Unrealized Gain (Loss) | ||||
| Net realized gain (loss) on: | ||||
| Investment Securities: | ||||
| Affiliated issuers | (93,566) | |||
| Capital gain distributions from underlying funds: | ||||
| Affiliated issuers | 40,643 | |||
| Total net realized gain (loss) | (52,923) | |||
| Change in net unrealized appreciation (depreciation) on: | ||||
| Investment Securities: | ||||
| Affiliated issuers | 561,497 | |||
| Total change in net unrealized appreciation (depreciation) | 561,497 | |||
| Net gain (loss) | 508,574 | |||
| Net increase (decrease) in net assets resulting from operations | $ | 812,599 | ||
| Statement of Changes in Net Assets | ||||
Year ended July 31, 2024 | Year ended July 31, 2023 | |||
| Increase (Decrease) in Net Assets | ||||
| Operations | ||||
| Net investment income (loss) | $ | 304,025 | $ | 385,326 |
| Net realized gain (loss) | (52,923) | (232,060) | ||
| Change in net unrealized appreciation (depreciation) | 561,497 | 33,404 | ||
| Net increase (decrease) in net assets resulting from operations | 812,599 | 186,670 | ||
| Distributions to shareholders | (289,788) | (562,742) | ||
| Share transactions | ||||
| Proceeds from sales of shares | 1,198,169 | 411,764 | ||
| Reinvestment of distributions | 243,266 | 495,959 | ||
| Cost of shares redeemed | (2,047,775) | (1,742,440) | ||
Net increase (decrease) in net assets resulting from share transactions | (606,340) | (834,717) | ||
| Total increase (decrease) in net assets | (83,529) | (1,210,789) | ||
| Net Assets | ||||
| Beginning of period | 10,195,551 | 11,406,340 | ||
| End of period | $ | 10,112,022 | $ | 10,195,551 |
| Other Information | ||||
| Shares | ||||
| Sold | 23,725 | 8,330 | ||
| Issued in reinvestment of distributions | 4,804 | 10,221 | ||
| Redeemed | (40,300) | (35,173) | ||
| Net increase (decrease) | (11,771) | (16,622) | ||
Fidelity Simplicity RMD 2010 Fund℠ |
| Years ended July 31, | 2024 | 2023 | 2022 | 2021 | 2020 | |||||
Selected Per-Share Data | ||||||||||
| Net asset value, beginning of period | $ | 50.38 | $ | 52.09 | $ | 59.88 | $ | 55.75 | $ | 53.53 |
| Income from Investment Operations | ||||||||||
Net investment income (loss) A,B | 1.525 | 1.837 | 1.444 | .508 | .888 | |||||
| Net realized and unrealized gain (loss) | 2.604 | (.873) | (6.454) | 5.365 | 3.009 | |||||
| Total from investment operations | 4.129 | .964 | (5.010) | 5.873 | 3.897 | |||||
| Distributions from net investment income | (1.440) | (1.808) | (1.433) | (.533) | (.908) | |||||
| Distributions from net realized gain | (.009) | (.866) | (1.347) | (1.210) | (.769) | |||||
| Total distributions | (1.449) | (2.674) | (2.780) | (1.743) | (1.677) | |||||
| Net asset value, end of period | $ | 53.06 | $ | 50.38 | $ | 52.09 | $ | 59.88 | $ | 55.75 |
Total Return C | 8.36 % | 2.17% | (8.77)% | 10.69% | 7.44% | |||||
Ratios to Average Net Assets B,D,E | ||||||||||
| Expenses before reductions | .48% | .49% | .49% | .50% | .51% | |||||
| Expenses net of fee waivers, if any | .48 % | .49% | .49% | .50% | .51% | |||||
| Expenses net of all reductions | .48% | .49% | .49% | .50% | .51% | |||||
| Net investment income (loss) | 3.02% | 3.74% | 2.58% | .88% | 1.66% | |||||
| Supplemental Data | ||||||||||
| Net assets, end of period (000 omitted) | $ | 10,112 | $ | 10,196 | $ | 11,406 | $ | 14,826 | $ | 11,105 |
Portfolio turnover rate F | 30 % | 24% | 58% | 32% | 51% |
| Domestic Equity Funds - 20.0% | |||
| Shares | Value ($) | ||
| Fidelity Series All-Sector Equity Fund (a) | 10,405 | 128,609 | |
| Fidelity Series Blue Chip Growth Fund (a) | 18,861 | 360,810 | |
| Fidelity Series Commodity Strategy Fund (a) | 1,715 | 160,735 | |
| Fidelity Series Growth Company Fund (a) | 28,105 | 678,462 | |
| Fidelity Series Intrinsic Opportunities Fund (a) | 10,296 | 125,715 | |
| Fidelity Series Large Cap Stock Fund (a) | 27,490 | 639,959 | |
| Fidelity Series Large Cap Value Index Fund (a) | 11,892 | 195,856 | |
| Fidelity Series Opportunistic Insights Fund (a) | 17,023 | 399,712 | |
| Fidelity Series Small Cap Core Fund (a) | 1,515 | 18,836 | |
| Fidelity Series Small Cap Discovery Fund (a) | 4,396 | 52,139 | |
| Fidelity Series Small Cap Opportunities Fund (a) | 12,225 | 198,537 | |
| Fidelity Series Stock Selector Large Cap Value Fund (a) | 30,215 | 436,905 | |
| Fidelity Series Value Discovery Fund (a) | 24,226 | 389,556 | |
| TOTAL DOMESTIC EQUITY FUNDS (Cost $2,759,021) | 3,785,831 | ||
| International Equity Funds - 20.7% | |||
| Shares | Value ($) | ||
| Fidelity Series Canada Fund (a) | 14,811 | 233,428 | |
| Fidelity Series Emerging Markets Fund (a) | 31,511 | 288,327 | |
| Fidelity Series Emerging Markets Opportunities Fund (a) | 61,519 | 1,154,717 | |
| Fidelity Series International Growth Fund (a) | 35,553 | 659,155 | |
| Fidelity Series International Small Cap Fund (a) | 15,815 | 286,733 | |
| Fidelity Series International Value Fund (a) | 50,019 | 655,254 | |
| Fidelity Series Overseas Fund (a) | 45,324 | 654,475 | |
| TOTAL INTERNATIONAL EQUITY FUNDS (Cost $3,146,318) | 3,932,089 | ||
| Bond Funds - 59.2% | |||
| Shares | Value ($) | ||
| Fidelity Series 0-5 Year Inflation-Protected Bond Index Fund (a) | 174,316 | 1,689,121 | |
| Fidelity Series 5+ Year Inflation-Protected Bond Index Fund (a) | 140,570 | 1,089,420 | |
| Fidelity Series Emerging Markets Debt Fund (a) | 12,664 | 100,176 | |
| Fidelity Series Emerging Markets Debt Local Currency Fund (a) | 3,433 | 31,073 | |
| Fidelity Series Floating Rate High Income Fund (a) | 2,112 | 18,963 | |
| Fidelity Series High Income Fund (a) | 12,054 | 102,819 | |
| Fidelity Series International Credit Fund (a) | 590 | 4,852 | |
| Fidelity Series International Developed Markets Bond Index Fund (a) | 86,603 | 752,581 | |
| Fidelity Series Investment Grade Bond Fund (a) | 678,316 | 6,837,417 | |
| Fidelity Series Long-Term Treasury Bond Index Fund (a) | 104,350 | 591,667 | |
| Fidelity Series Real Estate Income Fund (a) | 1,906 | 18,813 | |
| TOTAL BOND FUNDS (Cost $12,291,441) | 11,236,902 | ||
| Short-Term Funds - 0.1% | |||
| Shares | Value ($) | ||
| Fidelity Series Government Money Market Fund 5.42% (a)(b) | 22,895 | 22,895 | |
| Fidelity Series Short-Term Credit Fund (a) | 541 | 5,389 | |
| TOTAL SHORT-TERM FUNDS (Cost $28,117) | 28,284 | ||
| TOTAL INVESTMENT IN SECURITIES - 100.0% (Cost $18,224,897) | 18,983,106 |
NET OTHER ASSETS (LIABILITIES) - 0.0% | (8,174) |
| NET ASSETS - 100.0% | 18,974,932 |
| (a) | Affiliated Fund |
| (b) | The rate quoted is the annualized seven-day yield of the fund at period end. |
| Affiliate | Value, beginning of period ($) | Purchases ($) | Sales Proceeds ($) | Dividend Income ($) | Realized Gain (loss) ($) | Change in Unrealized appreciation (depreciation) ($) | Value, end of period ($) |
| Fidelity Series 0-5 Year Inflation-Protected Bond Index Fund | 1,754,493 | 438,793 | 540,555 | 55,692 | (11,126) | 47,516 | 1,689,121 |
| Fidelity Series 5+ Year Inflation-Protected Bond Index Fund | 1,403,066 | 133,899 | 417,346 | 51,409 | (90,999) | 60,800 | 1,089,420 |
| Fidelity Series All-Sector Equity Fund | 140,072 | 23,971 | 54,068 | 8,814 | 4,316 | 14,318 | 128,609 |
| Fidelity Series Blue Chip Growth Fund | 387,380 | 56,609 | 177,542 | 2,038 | 23,726 | 70,637 | 360,810 |
| Fidelity Series Canada Fund | 271,760 | 35,117 | 88,701 | 8,147 | 18,546 | (3,294) | 233,428 |
| Fidelity Series Commodity Strategy Fund | 169,211 | 65,388 | 58,785 | 6,370 | (5,152) | (9,927) | 160,735 |
| Fidelity Series Emerging Markets Debt Fund | 115,939 | 13,455 | 33,650 | 6,599 | (6,318) | 10,750 | 100,176 |
| Fidelity Series Emerging Markets Debt Local Currency Fund | 39,471 | 4,646 | 10,661 | 2,359 | (1,146) | (1,237) | 31,073 |
| Fidelity Series Emerging Markets Fund | 294,538 | 105,728 | 121,625 | 6,771 | (11,200) | 20,886 | 288,327 |
| Fidelity Series Emerging Markets Opportunities Fund | 1,282,993 | 357,668 | 514,409 | 31,253 | (38,751) | 67,216 | 1,154,717 |
| Fidelity Series Floating Rate High Income Fund | 22,527 | 4,641 | 8,179 | 1,955 | (18) | (8) | 18,963 |
| Fidelity Series Government Money Market Fund 5.42% | 948,979 | 223,118 | 1,149,202 | 21,832 | - | - | 22,895 |
| Fidelity Series Growth Company Fund | 721,414 | 134,731 | 337,918 | 19,712 | 45,888 | 114,347 | 678,462 |
| Fidelity Series High Income Fund | 121,117 | 15,246 | 36,451 | 6,991 | (3,984) | 6,891 | 102,819 |
| Fidelity Series International Credit Fund | 4,356 | 194 | - | 194 | - | 302 | 4,852 |
| Fidelity Series International Developed Markets Bond Index Fund | 884,599 | 123,115 | 268,946 | 28,821 | (22,285) | 36,098 | 752,581 |
| Fidelity Series International Growth Fund | 772,323 | 103,825 | 287,127 | 8,855 | (1,846) | 71,980 | 659,155 |
| Fidelity Series International Small Cap Fund | 214,488 | 153,871 | 122,952 | 10,762 | 1,691 | 39,635 | 286,733 |
| Fidelity Series International Value Fund | 777,066 | 104,920 | 313,599 | 22,049 | 27,445 | 59,422 | 655,254 |
| Fidelity Series Intrinsic Opportunities Fund | 144,024 | 46,240 | 58,122 | 29,515 | (10,239) | 3,812 | 125,715 |
| Fidelity Series Investment Grade Bond Fund | 7,508,282 | 1,419,167 | 2,178,580 | 295,616 | (165,807) | 254,355 | 6,837,417 |
| Fidelity Series Large Cap Stock Fund | 678,138 | 133,674 | 273,745 | 32,842 | 35,487 | 66,405 | 639,959 |
| Fidelity Series Large Cap Value Index Fund | 212,109 | 46,230 | 81,211 | 7,918 | 7,607 | 11,121 | 195,856 |
| Fidelity Series Long-Term Treasury Bond Index Fund | 971,051 | 185,576 | 529,142 | 27,545 | (189,208) | 153,390 | 591,667 |
| Fidelity Series Opportunistic Insights Fund | 429,898 | 55,886 | 195,571 | 3,878 | 17,578 | 91,921 | 399,712 |
| Fidelity Series Overseas Fund | 773,447 | 93,417 | 293,304 | 11,264 | 32,603 | 48,312 | 654,475 |
| Fidelity Series Real Estate Income Fund | 30,434 | 2,834 | 14,459 | 1,504 | (1,165) | 1,169 | 18,813 |
| Fidelity Series Short-Term Credit Fund | 135,521 | 7,821 | 140,256 | 2,349 | (153) | 2,456 | 5,389 |
| Fidelity Series Small Cap Core Fund | 1,712 | 16,101 | 754 | 103 | 53 | 1,724 | 18,836 |
| Fidelity Series Small Cap Discovery Fund | 61,904 | 16,556 | 27,915 | 4,759 | (47) | 1,641 | 52,139 |
| Fidelity Series Small Cap Opportunities Fund | 206,570 | 35,924 | 78,788 | 1,982 | 687 | 34,144 | 198,537 |
| Fidelity Series Stock Selector Large Cap Value Fund | 472,070 | 124,991 | 204,902 | 28,863 | 4,947 | 39,799 | 436,905 |
| Fidelity Series Value Discovery Fund | 423,083 | 118,583 | 171,679 | 19,762 | 5,887 | 13,682 | 389,556 |
| 22,374,035 | 4,401,935 | 8,790,144 | 768,523 | (332,983) | 1,330,263 | 18,983,106 |
| Valuation Inputs at Reporting Date: | ||||
| Description | Total ($) | Level 1 ($) | Level 2 ($) | Level 3 ($) |
Investments in Securities: | ||||
| Domestic Equity Funds | 3,785,831 | 3,785,831 | - | - |
| International Equity Funds | 3,932,089 | 3,932,089 | - | - |
| Bond Funds | 11,236,902 | 11,236,902 | - | - |
| Short-Term Funds | 28,284 | 28,284 | - | - |
| Total Investments in Securities: | 18,983,106 | 18,983,106 | - | - |
| Statement of Assets and Liabilities | ||||
As of July 31, 2024 | ||||
| Assets | ||||
| Investment in securities, at value - See accompanying schedule: | ||||
Affiliated issuers (cost $18,224,897) | $ | 18,983,106 | ||
| Total Investment in Securities (cost $18,224,897) | $ | 18,983,106 | ||
| Cash | 2 | |||
| Receivable for investments sold | 142,764 | |||
Total assets | 19,125,872 | |||
| Liabilities | ||||
| Payable for investments purchased | $ | 138,704 | ||
| Payable for fund shares redeemed | 4,060 | |||
| Accrued management fee | 8,176 | |||
| Total liabilities | 150,940 | |||
| Net Assets | $ | 18,974,932 | ||
| Net Assets consist of: | ||||
| Paid in capital | $ | 19,688,855 | ||
| Total accumulated earnings (loss) | (713,923) | |||
| Net Assets | $ | 18,974,932 | ||
Net Asset Value, offering price and redemption price per share ($18,974,932 ÷ 312,768 shares) | $ | 60.67 | ||
| Statement of Operations | ||||
| Year ended July 31, 2024 | ||||
| Investment Income | ||||
| Dividends: | ||||
| Affiliated issuers | $ | 652,368 | ||
| Expenses | ||||
| Management fee | $ | 103,222 | ||
| Independent trustees' fees and expenses | 61 | |||
| Miscellaneous | 92 | |||
| Total expenses | 103,375 | |||
| Net Investment income (loss) | 548,993 | |||
| Realized and Unrealized Gain (Loss) | ||||
| Net realized gain (loss) on: | ||||
| Investment Securities: | ||||
| Affiliated issuers | (332,983) | |||
| Capital gain distributions from underlying funds: | ||||
| Affiliated issuers | 116,155 | |||
| Total net realized gain (loss) | (216,828) | |||
| Change in net unrealized appreciation (depreciation) on: | ||||
| Investment Securities: | ||||
| Affiliated issuers | 1,330,263 | |||
| Total change in net unrealized appreciation (depreciation) | 1,330,263 | |||
| Net gain (loss) | 1,113,435 | |||
| Net increase (decrease) in net assets resulting from operations | $ | 1,662,428 | ||
| Statement of Changes in Net Assets | ||||
Year ended July 31, 2024 | Year ended July 31, 2023 | |||
| Increase (Decrease) in Net Assets | ||||
| Operations | ||||
| Net investment income (loss) | $ | 548,993 | $ | 850,935 |
| Net realized gain (loss) | (216,828) | (911,479) | ||
| Change in net unrealized appreciation (depreciation) | 1,330,263 | 681,526 | ||
| Net increase (decrease) in net assets resulting from operations | 1,662,428 | 620,982 | ||
| Distributions to shareholders | (530,828) | (1,400,178) | ||
| Share transactions | ||||
| Proceeds from sales of shares | 771,599 | 1,485,316 | ||
| Reinvestment of distributions | 455,624 | 1,225,964 | ||
| Cost of shares redeemed | (5,757,442) | (6,476,135) | ||
Net increase (decrease) in net assets resulting from share transactions | (4,530,219) | (3,764,855) | ||
| Total increase (decrease) in net assets | (3,398,619) | (4,544,051) | ||
| Net Assets | ||||
| Beginning of period | 22,373,551 | 26,917,602 | ||
| End of period | $ | 18,974,932 | $ | 22,373,551 |
| Other Information | ||||
| Shares | ||||
| Sold | 14,050 | 26,943 | ||
| Issued in reinvestment of distributions | 7,950 | 22,653 | ||
| Redeemed | (102,193) | (117,741) | ||
| Net increase (decrease) | (80,193) | (68,145) | ||
Fidelity Simplicity RMD 2015 Fund℠ |
| Years ended July 31, | 2024 | 2023 | 2022 | 2021 | 2020 | |||||
Selected Per-Share Data | ||||||||||
| Net asset value, beginning of period | $ | 56.94 | $ | 58.38 | $ | 68.21 | $ | 61.80 | $ | 59.41 |
| Income from Investment Operations | ||||||||||
Net investment income (loss) A,B | 1.579 | 1.947 | 1.629 | .565 | .947 | |||||
| Net realized and unrealized gain (loss) | 3.675 | (.246) | (7.886) | 7.894 | 3.526 | |||||
| Total from investment operations | 5.254 | 1.701 | (6.257) | 8.459 | 4.473 | |||||
| Distributions from net investment income | (1.510) | (1.901) | (1.569) | (.598) | (.987) | |||||
| Distributions from net realized gain | (.014) | (1.240) | (2.004) | (1.451) | (1.096) | |||||
| Total distributions | (1.524) | (3.141) | (3.573) | (2.049) | (2.083) | |||||
| Net asset value, end of period | $ | 60.67 | $ | 56.94 | $ | 58.38 | $ | 68.21 | $ | 61.80 |
Total Return C | 9.41 % | 3.32% | (9.69)% | 13.92% | 7.71% | |||||
Ratios to Average Net Assets B,D,E | ||||||||||
| Expenses before reductions | .52% | .53% | .54% | .55% | .55% | |||||
| Expenses net of fee waivers, if any | .52 % | .53% | .54% | .55% | .55% | |||||
| Expenses net of all reductions | .52% | .53% | .54% | .55% | .55% | |||||
| Net investment income (loss) | 2.76% | 3.54% | 2.58% | .86% | 1.60% | |||||
| Supplemental Data | ||||||||||
| Net assets, end of period (000 omitted) | $ | 18,975 | $ | 22,374 | $ | 26,918 | $ | 31,376 | $ | 21,546 |
Portfolio turnover rate F | 22 % | 27% | 58% | 30% | 48% |
| Domestic Equity Funds - 25.4% | |||
| Shares | Value ($) | ||
| Fidelity Series All-Sector Equity Fund (a) | 33,596 | 415,248 | |
| Fidelity Series Blue Chip Growth Fund (a) | 60,962 | 1,166,205 | |
| Fidelity Series Commodity Strategy Fund (a) | 4,300 | 402,905 | |
| Fidelity Series Growth Company Fund (a) | 90,842 | 2,192,919 | |
| Fidelity Series Intrinsic Opportunities Fund (a) | 32,966 | 402,517 | |
| Fidelity Series Large Cap Stock Fund (a) | 88,833 | 2,068,028 | |
| Fidelity Series Large Cap Value Index Fund (a) | 38,436 | 633,044 | |
| Fidelity Series Opportunistic Insights Fund (a) | 55,023 | 1,291,946 | |
| Fidelity Series Small Cap Core Fund (a) | 5,109 | 63,509 | |
| Fidelity Series Small Cap Discovery Fund (a) | 14,209 | 168,523 | |
| Fidelity Series Small Cap Opportunities Fund (a) | 39,508 | 641,603 | |
| Fidelity Series Stock Selector Large Cap Value Fund (a) | 97,660 | 1,412,159 | |
| Fidelity Series Value Discovery Fund (a) | 78,304 | 1,259,129 | |
| TOTAL DOMESTIC EQUITY FUNDS (Cost $9,032,968) | 12,117,735 | ||
| International Equity Funds - 24.4% | |||
| Shares | Value ($) | ||
| Fidelity Series Canada Fund (a) | 45,517 | 717,348 | |
| Fidelity Series Emerging Markets Fund (a) | 90,043 | 823,891 | |
| Fidelity Series Emerging Markets Opportunities Fund (a) | 175,795 | 3,299,666 | |
| Fidelity Series International Growth Fund (a) | 109,260 | 2,025,675 | |
| Fidelity Series International Small Cap Fund (a) | 39,658 | 719,007 | |
| Fidelity Series International Value Fund (a) | 153,629 | 2,012,546 | |
| Fidelity Series Overseas Fund (a) | 139,217 | 2,010,287 | |
| TOTAL INTERNATIONAL EQUITY FUNDS (Cost $9,476,666) | 11,608,420 | ||
| Bond Funds - 50.1% | |||
| Shares | Value ($) | ||
| Fidelity Series 0-5 Year Inflation-Protected Bond Index Fund (a) | 164,033 | 1,589,475 | |
| Fidelity Series 5+ Year Inflation-Protected Bond Index Fund (a) | 511,939 | 3,967,524 | |
| Fidelity Series Emerging Markets Debt Fund (a) | 31,840 | 251,853 | |
| Fidelity Series Emerging Markets Debt Local Currency Fund (a) | 8,534 | 77,233 | |
| Fidelity Series Floating Rate High Income Fund (a) | 5,290 | 47,501 | |
| Fidelity Series High Income Fund (a) | 30,256 | 258,086 | |
| Fidelity Series International Credit Fund (a) | 1,364 | 11,215 | |
| Fidelity Series International Developed Markets Bond Index Fund (a) | 216,931 | 1,885,128 | |
| Fidelity Series Investment Grade Bond Fund (a) | 1,318,475 | 13,290,223 | |
| Fidelity Series Long-Term Treasury Bond Index Fund (a) | 424,387 | 2,406,277 | |
| Fidelity Series Real Estate Income Fund (a) | 4,778 | 47,164 | |
| TOTAL BOND FUNDS (Cost $26,539,044) | 23,831,679 | ||
| Short-Term Funds - 0.1% | |||
| Shares | Value ($) | ||
| Fidelity Series Government Money Market Fund 5.42% (a)(b) | 39,354 | 39,354 | |
| Fidelity Series Short-Term Credit Fund (a) | 311 | 3,101 | |
| TOTAL SHORT-TERM FUNDS (Cost $42,366) | 42,455 | ||
| TOTAL INVESTMENT IN SECURITIES - 100.0% (Cost $45,091,044) | 47,600,289 |
NET OTHER ASSETS (LIABILITIES) - 0.0% | (22,008) |
| NET ASSETS - 100.0% | 47,578,281 |
| (a) | Affiliated Fund |
| (b) | The rate quoted is the annualized seven-day yield of the fund at period end. |
| Affiliate | Value, beginning of period ($) | Purchases ($) | Sales Proceeds ($) | Dividend Income ($) | Realized Gain (loss) ($) | Change in Unrealized appreciation (depreciation) ($) | Value, end of period ($) |
| Fidelity Series 0-5 Year Inflation-Protected Bond Index Fund | 1,165,201 | 721,349 | 327,869 | 46,092 | (143) | 30,937 | 1,589,475 |
| Fidelity Series 5+ Year Inflation-Protected Bond Index Fund | 4,656,207 | 623,769 | 1,217,151 | 184,202 | (153,602) | 58,301 | 3,967,524 |
| Fidelity Series All-Sector Equity Fund | 434,244 | 69,593 | 150,170 | 29,224 | 4,417 | 57,164 | 415,248 |
| Fidelity Series Blue Chip Growth Fund | 1,201,012 | 190,387 | 537,534 | 6,563 | 75,643 | 236,697 | 1,166,205 |
| Fidelity Series Canada Fund | 773,096 | 131,500 | 238,312 | 25,320 | 31,438 | 19,626 | 717,348 |
| Fidelity Series Commodity Strategy Fund | 397,323 | 170,931 | 128,529 | 15,485 | (8,779) | (28,041) | 402,905 |
| Fidelity Series Emerging Markets Debt Fund | 272,798 | 38,970 | 71,441 | 16,297 | (9,100) | 20,626 | 251,853 |
| Fidelity Series Emerging Markets Debt Local Currency Fund | 92,119 | 14,173 | 23,196 | 5,919 | (2,089) | (3,774) | 77,233 |
| Fidelity Series Emerging Markets Fund | 816,164 | 266,614 | 289,572 | 19,599 | (21,635) | 52,320 | 823,891 |
| Fidelity Series Emerging Markets Opportunities Fund | 3,432,574 | 992,210 | 1,226,224 | 90,472 | (106,001) | 207,107 | 3,299,666 |
| Fidelity Series Floating Rate High Income Fund | 52,711 | 12,768 | 17,914 | 4,824 | 195 | (259) | 47,501 |
| Fidelity Series Government Money Market Fund 5.42% | 1,333,176 | 388,664 | 1,682,486 | 26,047 | - | - | 39,354 |
| Fidelity Series Growth Company Fund | 2,236,693 | 448,840 | 1,023,405 | 65,302 | 108,446 | 422,345 | 2,192,919 |
| Fidelity Series High Income Fund | 283,321 | 44,511 | 77,435 | 17,275 | (4,816) | 12,505 | 258,086 |
| Fidelity Series International Credit Fund | 10,068 | 449 | - | 449 | - | 698 | 11,215 |
| Fidelity Series International Developed Markets Bond Index Fund | 2,077,665 | 382,727 | 609,126 | 72,238 | (27,883) | 61,745 | 1,885,128 |
| Fidelity Series International Growth Fund | 2,197,576 | 367,617 | 767,860 | 27,518 | 10,741 | 217,601 | 2,025,675 |
| Fidelity Series International Small Cap Fund | 607,567 | 293,239 | 272,773 | 26,913 | (7,537) | 98,511 | 719,007 |
| Fidelity Series International Value Fund | 2,211,035 | 339,241 | 814,435 | 68,521 | 72,898 | 203,807 | 2,012,546 |
| Fidelity Series Intrinsic Opportunities Fund | 446,486 | 132,367 | 160,073 | 92,972 | (26,547) | 10,284 | 402,517 |
| Fidelity Series Investment Grade Bond Fund | 15,174,171 | 2,523,968 | 4,590,831 | 603,994 | (269,085) | 452,000 | 13,290,223 |
| Fidelity Series Large Cap Stock Fund | 2,102,506 | 364,003 | 736,604 | 106,774 | 101,178 | 236,945 | 2,068,028 |
| Fidelity Series Large Cap Value Index Fund | 657,597 | 135,190 | 222,565 | 26,445 | 18,197 | 44,625 | 633,044 |
| Fidelity Series Long-Term Treasury Bond Index Fund | 2,622,826 | 1,184,367 | 1,318,121 | 88,103 | (343,472) | 260,677 | 2,406,277 |
| Fidelity Series Opportunistic Insights Fund | 1,332,855 | 171,678 | 574,194 | 12,970 | 44,675 | 316,932 | 1,291,946 |
| Fidelity Series Overseas Fund | 2,200,770 | 305,325 | 757,590 | 35,005 | 73,335 | 188,447 | 2,010,287 |
| Fidelity Series Real Estate Income Fund | 73,607 | 7,670 | 34,260 | 3,672 | (3,432) | 3,579 | 47,164 |
| Fidelity Series Short-Term Credit Fund | 66,864 | 8,882 | 73,771 | 1,152 | (167) | 1,293 | 3,101 |
| Fidelity Series Small Cap Core Fund | 4,588 | 54,234 | 1,392 | 340 | 107 | 5,972 | 63,509 |
| Fidelity Series Small Cap Discovery Fund | 191,883 | 47,719 | 77,586 | 15,432 | 3,306 | 3,201 | 168,523 |
| Fidelity Series Small Cap Opportunities Fund | 640,394 | 118,250 | 234,749 | 6,428 | 3,117 | 114,591 | 641,603 |
| Fidelity Series Stock Selector Large Cap Value Fund | 1,463,612 | 365,197 | 564,736 | 95,714 | 27,161 | 120,925 | 1,412,159 |
| Fidelity Series Value Discovery Fund | 1,311,726 | 364,317 | 482,431 | 65,879 | 12,816 | 52,701 | 1,259,129 |
| 52,540,435 | 11,280,719 | 19,304,335 | 1,903,140 | (396,618) | 3,480,088 | 47,600,289 |
| Valuation Inputs at Reporting Date: | ||||
| Description | Total ($) | Level 1 ($) | Level 2 ($) | Level 3 ($) |
Investments in Securities: | ||||
| Domestic Equity Funds | 12,117,735 | 12,117,735 | - | - |
| International Equity Funds | 11,608,420 | 11,608,420 | - | - |
| Bond Funds | 23,831,679 | 23,831,679 | - | - |
| Short-Term Funds | 42,455 | 42,455 | - | - |
| Total Investments in Securities: | 47,600,289 | 47,600,289 | - | - |
| Statement of Assets and Liabilities | ||||
As of July 31, 2024 | ||||
| Assets | ||||
| Investment in securities, at value - See accompanying schedule: | ||||
Affiliated issuers (cost $45,091,044) | $ | 47,600,289 | ||
| Total Investment in Securities (cost $45,091,044) | $ | 47,600,289 | ||
| Cash | 206 | |||
| Receivable for investments sold | 416,381 | |||
| Receivable for fund shares sold | 16 | |||
Total assets | 48,016,892 | |||
| Liabilities | ||||
| Payable for investments purchased | $ | 401,543 | ||
| Payable for fund shares redeemed | 14,854 | |||
| Accrued management fee | 22,214 | |||
| Total liabilities | 438,611 | |||
| Net Assets | $ | 47,578,281 | ||
| Net Assets consist of: | ||||
| Paid in capital | $ | 47,953,477 | ||
| Total accumulated earnings (loss) | (375,196) | |||
| Net Assets | $ | 47,578,281 | ||
Net Asset Value, offering price and redemption price per share ($47,578,281 ÷ 753,294 shares) | $ | 63.16 | ||
| Statement of Operations | ||||
| Year ended July 31, 2024 | ||||
| Investment Income | ||||
| Dividends: | ||||
| Affiliated issuers | $ | 1,527,573 | ||
| Expenses | ||||
| Management fee | $ | 274,828 | ||
| Independent trustees' fees and expenses | 149 | |||
| Miscellaneous | 193 | |||
| Total expenses before reductions | 275,170 | |||
| Expense reductions | (7) | |||
| Total expenses after reductions | 275,163 | |||
| Net Investment income (loss) | 1,252,410 | |||
| Realized and Unrealized Gain (Loss) | ||||
| Net realized gain (loss) on: | ||||
| Investment Securities: | ||||
| Affiliated issuers | (396,618) | |||
| Capital gain distributions from underlying funds: | ||||
| Affiliated issuers | 375,567 | |||
| Total net realized gain (loss) | (21,051) | |||
| Change in net unrealized appreciation (depreciation) on: | ||||
| Investment Securities: | ||||
| Affiliated issuers | 3,480,088 | |||
| Total change in net unrealized appreciation (depreciation) | 3,480,088 | |||
| Net gain (loss) | 3,459,037 | |||
| Net increase (decrease) in net assets resulting from operations | $ | 4,711,447 | ||
| Statement of Changes in Net Assets | ||||
Year ended July 31, 2024 | Year ended July 31, 2023 | |||
| Increase (Decrease) in Net Assets | ||||
| Operations | ||||
| Net investment income (loss) | $ | 1,252,410 | $ | 1,722,629 |
| Net realized gain (loss) | (21,051) | (1,903,256) | ||
| Change in net unrealized appreciation (depreciation) | 3,480,088 | 2,107,511 | ||
| Net increase (decrease) in net assets resulting from operations | 4,711,447 | 1,926,884 | ||
| Distributions to shareholders | (1,214,497) | (3,243,749) | ||
| Share transactions | ||||
| Proceeds from sales of shares | 3,071,647 | 3,392,453 | ||
| Reinvestment of distributions | 1,114,269 | 3,036,491 | ||
| Cost of shares redeemed | (12,643,969) | (11,007,930) | ||
Net increase (decrease) in net assets resulting from share transactions | (8,458,053) | (4,578,986) | ||
| Total increase (decrease) in net assets | (4,961,103) | (5,895,851) | ||
| Net Assets | ||||
| Beginning of period | 52,539,384 | 58,435,235 | ||
| End of period | $ | 47,578,281 | $ | 52,539,384 |
| Other Information | ||||
| Shares | ||||
| Sold | 52,344 | 60,470 | ||
| Issued in reinvestment of distributions | 18,873 | 55,248 | ||
| Redeemed | (214,346) | (198,222) | ||
| Net increase (decrease) | (143,129) | (82,504) | ||
Fidelity Simplicity RMD 2020 Fund℠ |
| Years ended July 31, | 2024 | 2023 | 2022 | 2021 | 2020 | |||||
Selected Per-Share Data | ||||||||||
| Net asset value, beginning of period | $ | 58.61 | $ | 59.69 | $ | 70.79 | $ | 62.18 | $ | 59.88 |
| Income from Investment Operations | ||||||||||
Net investment income (loss) A,B | 1.505 | 1.853 | 1.637 | .586 | .930 | |||||
| Net realized and unrealized gain (loss) | 4.486 | .496 | (8.714) | 9.999 | 3.672 | |||||
| Total from investment operations | 5.991 | 2.349 | (7.077) | 10.585 | 4.602 | |||||
| Distributions from net investment income | (1.422) | (1.819) | (1.614) | (.617) | (.966) | |||||
| Distributions from net realized gain | (.019) | (1.610) | (2.409) | (1.358) | (1.336) | |||||
| Total distributions | (1.441) | (3.429) | (4.023) | (1.975) | (2.302) | |||||
| Net asset value, end of period | $ | 63.16 | $ | 58.61 | $ | 59.69 | $ | 70.79 | $ | 62.18 |
Total Return C | 10.41 % | 4.45% | (10.63)% | 17.29% | 7.88% | |||||
Ratios to Average Net Assets B,D,E | ||||||||||
| Expenses before reductions | .56% | .57% | .58% | .59% | .60% | |||||
| Expenses net of fee waivers, if any | .56 % | .57% | .58% | .59% | .60% | |||||
| Expenses net of all reductions | .56% | .57% | .58% | .59% | .60% | |||||
| Net investment income (loss) | 2.55% | 3.31% | 2.51% | .87% | 1.57% | |||||
| Supplemental Data | ||||||||||
| Net assets, end of period (000 omitted) | $ | 47,578 | $ | 52,539 | $ | 58,435 | $ | 67,611 | $ | 49,365 |
Portfolio turnover rate F | 23 % | 30% | 62% | 34% | 48% |
| Domestic Equity Funds - 30.0% | |||
| Shares | Value ($) | ||
| Fidelity Series All-Sector Equity Fund (a) | 9,818 | 121,356 | |
| Fidelity Series Blue Chip Growth Fund (a) | 17,849 | 341,450 | |
| Fidelity Series Commodity Strategy Fund (a) | 1,061 | 99,397 | |
| Fidelity Series Growth Company Fund (a) | 26,567 | 641,317 | |
| Fidelity Series Intrinsic Opportunities Fund (a) | 9,559 | 116,720 | |
| Fidelity Series Large Cap Stock Fund (a) | 25,950 | 604,118 | |
| Fidelity Series Large Cap Value Index Fund (a) | 11,225 | 184,882 | |
| Fidelity Series Opportunistic Insights Fund (a) | 16,106 | 378,172 | |
| Fidelity Series Small Cap Core Fund (a) | 1,466 | 18,225 | |
| Fidelity Series Small Cap Discovery Fund (a) | 4,150 | 49,218 | |
| Fidelity Series Small Cap Opportunities Fund (a) | 11,441 | 185,804 | |
| Fidelity Series Stock Selector Large Cap Value Fund (a) | 28,522 | 412,423 | |
| Fidelity Series Value Discovery Fund (a) | 22,869 | 367,732 | |
| TOTAL DOMESTIC EQUITY FUNDS (Cost $2,757,877) | 3,520,814 | ||
| International Equity Funds - 27.5% | |||
| Shares | Value ($) | ||
| Fidelity Series Canada Fund (a) | 12,934 | 203,840 | |
| Fidelity Series Emerging Markets Fund (a) | 24,422 | 223,462 | |
| Fidelity Series Emerging Markets Opportunities Fund (a) | 47,680 | 894,946 | |
| Fidelity Series International Growth Fund (a) | 31,047 | 575,616 | |
| Fidelity Series International Small Cap Fund (a) | 9,761 | 176,961 | |
| Fidelity Series International Value Fund (a) | 43,680 | 572,208 | |
| Fidelity Series Overseas Fund (a) | 39,576 | 571,478 | |
| TOTAL INTERNATIONAL EQUITY FUNDS (Cost $2,785,948) | 3,218,511 | ||
| Bond Funds - 42.6% | |||
| Shares | Value ($) | ||
| Fidelity Series 5+ Year Inflation-Protected Bond Index Fund (a) | 140,004 | 1,085,028 | |
| Fidelity Series Emerging Markets Debt Fund (a) | 7,890 | 62,410 | |
| Fidelity Series Emerging Markets Debt Local Currency Fund (a) | 2,067 | 18,711 | |
| Fidelity Series Floating Rate High Income Fund (a) | 1,303 | 11,697 | |
| Fidelity Series High Income Fund (a) | 7,444 | 63,499 | |
| Fidelity Series International Credit Fund (a) | 369 | 3,030 | |
| Fidelity Series International Developed Markets Bond Index Fund (a) | 52,489 | 456,132 | |
| Fidelity Series Investment Grade Bond Fund (a) | 250,154 | 2,521,548 | |
| Fidelity Series Long-Term Treasury Bond Index Fund (a) | 133,855 | 758,956 | |
| Fidelity Series Real Estate Income Fund (a) | 1,178 | 11,632 | |
| TOTAL BOND FUNDS (Cost $5,546,860) | 4,992,643 | ||
| TOTAL INVESTMENT IN SECURITIES - 100.1% (Cost $11,090,685) | 11,731,968 |
NET OTHER ASSETS (LIABILITIES) - (0.1)% | (5,893) |
| NET ASSETS - 100.0% | 11,726,075 |
| (a) | Affiliated Fund |
| Affiliate | Value, beginning of period ($) | Purchases ($) | Sales Proceeds ($) | Dividend Income ($) | Realized Gain (loss) ($) | Change in Unrealized appreciation (depreciation) ($) | Value, end of period ($) |
| Fidelity Series 5+ Year Inflation-Protected Bond Index Fund | 944,353 | 385,804 | 229,357 | 42,757 | (15,238) | (534) | 1,085,028 |
| Fidelity Series All-Sector Equity Fund | 109,440 | 32,058 | 36,745 | 7,729 | (20) | 16,623 | 121,356 |
| Fidelity Series Blue Chip Growth Fund | 302,681 | 91,189 | 136,075 | 1,719 | 9,366 | 74,289 | 341,450 |
| Fidelity Series Canada Fund | 186,008 | 58,964 | 55,118 | 6,343 | 247 | 13,739 | 203,840 |
| Fidelity Series Commodity Strategy Fund | 84,462 | 50,137 | 27,092 | 3,400 | (595) | (7,515) | 99,397 |
| Fidelity Series Emerging Markets Debt Fund | 58,061 | 17,164 | 15,411 | 3,700 | (1,560) | 4,156 | 62,410 |
| Fidelity Series Emerging Markets Debt Local Currency Fund | 19,445 | 5,611 | 5,034 | 1,298 | (297) | (1,014) | 18,711 |
| Fidelity Series Emerging Markets Fund | 188,998 | 125,075 | 98,451 | 4,711 | (6,665) | 14,505 | 223,462 |
| Fidelity Series Emerging Markets Opportunities Fund | 802,391 | 325,657 | 261,826 | 21,747 | (26,367) | 55,091 | 894,946 |
| Fidelity Series Floating Rate High Income Fund | 11,196 | 4,398 | 3,876 | 1,093 | 38 | (59) | 11,697 |
| Fidelity Series Government Money Market Fund 5.42% | 145,790 | 39,653 | 185,443 | 1,510 | - | - | - |
| Fidelity Series Growth Company Fund | 563,700 | 193,460 | 258,744 | 17,323 | 6,711 | 136,190 | 641,317 |
| Fidelity Series High Income Fund | 60,152 | 18,564 | 16,967 | 3,918 | (991) | 2,741 | 63,499 |
| Fidelity Series International Credit Fund | 2,720 | 122 | - | 121 | - | 188 | 3,030 |
| Fidelity Series International Developed Markets Bond Index Fund | 431,880 | 146,523 | 129,253 | 16,276 | (4,562) | 11,544 | 456,132 |
| Fidelity Series International Growth Fund | 528,793 | 170,324 | 181,451 | 6,892 | 1,629 | 56,321 | 575,616 |
| Fidelity Series International Small Cap Fund | 145,466 | 69,287 | 56,309 | 5,841 | (4,162) | 22,679 | 176,961 |
| Fidelity Series International Value Fund | 532,013 | 161,202 | 194,870 | 17,171 | 7,606 | 66,257 | 572,208 |
| Fidelity Series Intrinsic Opportunities Fund | 112,526 | 48,877 | 40,983 | 24,431 | (4,633) | 933 | 116,720 |
| Fidelity Series Investment Grade Bond Fund | 2,828,311 | 804,896 | 1,141,033 | 113,833 | (95,062) | 124,436 | 2,521,548 |
| Fidelity Series Large Cap Stock Fund | 529,879 | 163,165 | 181,969 | 27,376 | 6,287 | 86,756 | 604,118 |
| Fidelity Series Large Cap Value Index Fund | 165,731 | 57,215 | 55,479 | 6,901 | 694 | 16,721 | 184,882 |
| Fidelity Series Long-Term Treasury Bond Index Fund | 609,688 | 477,443 | 310,328 | 23,585 | (57,975) | 40,128 | 758,956 |
| Fidelity Series Opportunistic Insights Fund | 335,916 | 89,370 | 143,843 | 3,377 | 813 | 95,916 | 378,172 |
| Fidelity Series Overseas Fund | 529,558 | 152,756 | 179,310 | 8,768 | 996 | 67,478 | 571,478 |
| Fidelity Series Real Estate Income Fund | 15,623 | 3,672 | 7,710 | 833 | (352) | 399 | 11,632 |
| Fidelity Series Short-Term Credit Fund | 4,034 | 31 | 4,056 | 30 | 42 | (51) | - |
| Fidelity Series Small Cap Core Fund | 1,060 | 15,745 | 385 | 94 | 26 | 1,779 | 18,225 |
| Fidelity Series Small Cap Discovery Fund | 48,357 | 19,241 | 20,056 | 4,253 | (679) | 2,355 | 49,218 |
| Fidelity Series Small Cap Opportunities Fund | 161,389 | 51,161 | 59,295 | 1,682 | (66) | 32,615 | 185,804 |
| Fidelity Series Stock Selector Large Cap Value Fund | 368,872 | 144,679 | 141,728 | 25,329 | (77) | 40,677 | 412,423 |
| Fidelity Series Value Discovery Fund | 330,588 | 138,485 | 119,793 | 17,251 | 193 | 18,259 | 367,732 |
| 11,159,081 | 4,061,928 | 4,297,990 | 421,292 | (184,653) | 993,602 | 11,731,968 |
| Valuation Inputs at Reporting Date: | ||||
| Description | Total ($) | Level 1 ($) | Level 2 ($) | Level 3 ($) |
Investments in Securities: | ||||
| Domestic Equity Funds | 3,520,814 | 3,520,814 | - | - |
| International Equity Funds | 3,218,511 | 3,218,511 | - | - |
| Bond Funds | 4,992,643 | 4,992,643 | - | - |
| Total Investments in Securities: | 11,731,968 | 11,731,968 | - | - |
| Statement of Assets and Liabilities | ||||
As of July 31, 2024 | ||||
| Assets | ||||
| Investment in securities, at value - See accompanying schedule: | ||||
Affiliated issuers (cost $11,090,685) | $ | 11,731,968 | ||
| Total Investment in Securities (cost $11,090,685) | $ | 11,731,968 | ||
| Receivable for investments sold | 109,628 | |||
Total assets | 11,841,596 | |||
| Liabilities | ||||
| Payable for investments purchased | $ | 94,844 | ||
| Payable for fund shares redeemed | 14,783 | |||
| Accrued management fee | 5,894 | |||
| Total liabilities | 115,521 | |||
| Net Assets | $ | 11,726,075 | ||
| Net Assets consist of: | ||||
| Paid in capital | $ | 11,741,554 | ||
| Total accumulated earnings (loss) | (15,479) | |||
| Net Assets | $ | 11,726,075 | ||
Net Asset Value, offering price and redemption price per share ($11,726,075 ÷ 1,025,947 shares) | $ | 11.43 | ||
| Statement of Operations | ||||
| Year ended July 31, 2024 | ||||
| Investment Income | ||||
| Dividends: | ||||
| Affiliated issuers | $ | 322,937 | ||
| Expenses | ||||
| Management fee | $ | 68,008 | ||
| Independent trustees' fees and expenses | 33 | |||
| Miscellaneous | 69 | |||
| Total expenses | 68,110 | |||
| Net Investment income (loss) | 254,827 | |||
| Realized and Unrealized Gain (Loss) | ||||
| Net realized gain (loss) on: | ||||
| Investment Securities: | ||||
| Affiliated issuers | (184,653) | |||
| Capital gain distributions from underlying funds: | ||||
| Affiliated issuers | 98,355 | |||
| Total net realized gain (loss) | (86,298) | |||
| Change in net unrealized appreciation (depreciation) on: | ||||
| Investment Securities: | ||||
| Affiliated issuers | 993,602 | |||
| Total change in net unrealized appreciation (depreciation) | 993,602 | |||
| Net gain (loss) | 907,304 | |||
| Net increase (decrease) in net assets resulting from operations | $ | 1,162,131 | ||
| Statement of Changes in Net Assets | ||||
Year ended July 31, 2024 | Year ended July 31, 2023 | |||
| Increase (Decrease) in Net Assets | ||||
| Operations | ||||
| Net investment income (loss) | $ | 254,827 | $ | 316,447 |
| Net realized gain (loss) | (86,298) | (185,474) | ||
| Change in net unrealized appreciation (depreciation) | 993,602 | 478,610 | ||
| Net increase (decrease) in net assets resulting from operations | 1,162,131 | 609,583 | ||
| Distributions to shareholders | (245,693) | (551,378) | ||
| Share transactions | ||||
| Proceeds from sales of shares | 2,209,638 | 2,145,106 | ||
| Reinvestment of distributions | 237,808 | 530,200 | ||
| Cost of shares redeemed | (2,796,609) | (2,478,871) | ||
Net increase (decrease) in net assets resulting from share transactions | (349,163) | 196,435 | ||
| Total increase (decrease) in net assets | 567,275 | 254,640 | ||
| Net Assets | ||||
| Beginning of period | 11,158,800 | 10,904,160 | ||
| End of period | $ | 11,726,075 | $ | 11,158,800 |
| Other Information | ||||
| Shares | ||||
| Sold | 206,132 | 222,343 | ||
| Issued in reinvestment of distributions | 22,429 | 54,701 | ||
| Redeemed | (265,768) | (252,694) | ||
| Net increase (decrease) | (37,207) | 24,350 | ||
Fidelity Simplicity RMD 2025 Fund℠ |
| Years ended July 31, | 2024 | 2023 | 2022 | 2021 | 2020 A | |||||
Selected Per-Share Data | ||||||||||
| Net asset value, beginning of period | $ | 10.50 | $ | 10.50 | $ | 12.57 | $ | 10.77 | $ | 10.00 |
| Income from Investment Operations | ||||||||||
Net investment income (loss) B,C | .243 | .299 | .269 | .088 | .118 | |||||
| Net realized and unrealized gain (loss) | .920 | .236 | (1.561) | 2.054 | .822 | |||||
| Total from investment operations | 1.163 | .535 | (1.292) | 2.142 | .940 | |||||
| Distributions from net investment income | (.229) | (.301) | (.283) | (.106) | (.134) | |||||
| Distributions from net realized gain | (.004) | (.234) | (.495) | (.236) | (.036) | |||||
| Total distributions | (.233) | (.535) | (.778) | (.342) | (.170) | |||||
| Net asset value, end of period | $ | 11.43 | $ | 10.50 | $ | 10.50 | $ | 12.57 | $ | 10.77 |
Total Return D | 11.26 % | 5.63% | (11.01)% | 20.21% | 9.45% | |||||
Ratios to Average Net Assets C,E,F | ||||||||||
| Expenses before reductions | .61% | .61% | .62% | .63% | .64% G | |||||
| Expenses net of fee waivers, if any | .61 % | .61% | .62% | .63% | .64% G | |||||
| Expenses net of all reductions | .61% | .61% | .62% | .63% | .64% G | |||||
| Net investment income (loss) | 2.29% | 3.01% | 2.35% | .74% | 1.21% G | |||||
| Supplemental Data | ||||||||||
| Net assets, end of period (000 omitted) | $ | 11,726 | $ | 11,159 | $ | 10,904 | $ | 11,399 | $ | 5,676 |
Portfolio turnover rate H | 36 % | 40% | 79% | 66% | 54% G |
| Domestic Equity Funds - 34.0% | |||
| Shares | Value ($) | ||
| Fidelity Series All-Sector Equity Fund (a) | 754 | 9,320 | |
| Fidelity Series Blue Chip Growth Fund (a) | 1,377 | 26,344 | |
| Fidelity Series Commodity Strategy Fund (a) | 72 | 6,732 | |
| Fidelity Series Growth Company Fund (a) | 2,048 | 49,434 | |
| Fidelity Series Intrinsic Opportunities Fund (a) | 734 | 8,960 | |
| Fidelity Series Large Cap Stock Fund (a) | 1,997 | 46,481 | |
| Fidelity Series Large Cap Value Index Fund (a) | 864 | 14,237 | |
| Fidelity Series Opportunistic Insights Fund (a) | 1,242 | 29,172 | |
| Fidelity Series Small Cap Core Fund (a) | 116 | 1,438 | |
| Fidelity Series Small Cap Discovery Fund (a) | 320 | 3,790 | |
| Fidelity Series Small Cap Opportunities Fund (a) | 875 | 14,205 | |
| Fidelity Series Stock Selector Large Cap Value Fund (a) | 2,196 | 31,759 | |
| Fidelity Series Value Discovery Fund (a) | 1,761 | 28,318 | |
| TOTAL DOMESTIC EQUITY FUNDS (Cost $210,293) | 270,190 | ||
| International Equity Funds - 30.1% | |||
| Shares | Value ($) | ||
| Fidelity Series Canada Fund (a) | 977 | 15,401 | |
| Fidelity Series Emerging Markets Fund (a) | 1,787 | 16,352 | |
| Fidelity Series Emerging Markets Opportunities Fund (a) | 3,489 | 65,487 | |
| Fidelity Series International Growth Fund (a) | 2,346 | 43,490 | |
| Fidelity Series International Small Cap Fund (a) | 664 | 12,031 | |
| Fidelity Series International Value Fund (a) | 3,301 | 43,242 | |
| Fidelity Series Overseas Fund (a) | 2,991 | 43,192 | |
| TOTAL INTERNATIONAL EQUITY FUNDS (Cost $205,301) | 239,195 | ||
| Bond Funds - 36.0% | |||
| Shares | Value ($) | ||
| Fidelity Series 5+ Year Inflation-Protected Bond Index Fund (a) | 5,231 | 40,542 | |
| Fidelity Series Emerging Markets Debt Fund (a) | 536 | 4,239 | |
| Fidelity Series Emerging Markets Debt Local Currency Fund (a) | 140 | 1,265 | |
| Fidelity Series Floating Rate High Income Fund (a) | 88 | 793 | |
| Fidelity Series High Income Fund (a) | 506 | 4,316 | |
| Fidelity Series International Developed Markets Bond Index Fund (a) | 3,539 | 30,756 | |
| Fidelity Series Investment Grade Bond Fund (a) | 14,765 | 148,831 | |
| Fidelity Series Long-Term Treasury Bond Index Fund (a) | 9,685 | 54,911 | |
| Fidelity Series Real Estate Income Fund (a) | 80 | 788 | |
| TOTAL BOND FUNDS (Cost $285,042) | 286,441 | ||
| TOTAL INVESTMENT IN SECURITIES - 100.1% (Cost $700,636) | 795,826 |
NET OTHER ASSETS (LIABILITIES) - (0.1)% | (425) |
| NET ASSETS - 100.0% | 795,401 |
| (a) | Affiliated Fund |
| Affiliate | Value, beginning of period ($) | Purchases ($) | Sales Proceeds ($) | Dividend Income ($) | Realized Gain (loss) ($) | Change in Unrealized appreciation (depreciation) ($) | Value, end of period ($) |
| Fidelity Series 5+ Year Inflation-Protected Bond Index Fund | 28,016 | 25,956 | 13,288 | 1,409 | (439) | 297 | 40,542 |
| Fidelity Series All-Sector Equity Fund | 7,332 | 4,654 | 3,956 | 548 | 229 | 1,061 | 9,320 |
| Fidelity Series Blue Chip Growth Fund | 20,277 | 13,015 | 13,260 | 113 | 1,596 | 4,716 | 26,344 |
| Fidelity Series Canada Fund | 12,082 | 8,199 | 6,001 | 421 | 44 | 1,077 | 15,401 |
| Fidelity Series Commodity Strategy Fund | 4,959 | 4,851 | 2,586 | 195 | (225) | (267) | 6,732 |
| Fidelity Series Emerging Markets Debt Fund | 3,380 | 2,270 | 1,589 | 235 | (1) | 179 | 4,239 |
| Fidelity Series Emerging Markets Debt Local Currency Fund | 1,132 | 731 | 523 | 79 | (3) | (72) | 1,265 |
| Fidelity Series Emerging Markets Fund | 12,590 | 9,504 | 6,414 | 303 | (161) | 833 | 16,352 |
| Fidelity Series Emerging Markets Opportunities Fund | 50,240 | 38,842 | 26,151 | 1,399 | (446) | 3,002 | 65,487 |
| Fidelity Series Floating Rate High Income Fund | 655 | 504 | 364 | 69 | - | (2) | 793 |
| Fidelity Series Government Money Market Fund 5.42% | 8,111 | 2,134 | 10,245 | 83 | - | - | - |
| Fidelity Series Growth Company Fund | 37,763 | 25,329 | 24,682 | 1,170 | 2,371 | 8,653 | 49,434 |
| Fidelity Series High Income Fund | 3,519 | 2,402 | 1,727 | 249 | 4 | 118 | 4,316 |
| Fidelity Series International Developed Markets Bond Index Fund | 25,297 | 18,204 | 13,173 | 1,036 | (150) | 578 | 30,756 |
| Fidelity Series International Growth Fund | 34,327 | 22,626 | 17,833 | 457 | 437 | 3,933 | 43,490 |
| Fidelity Series International Small Cap Fund | 9,389 | 6,714 | 5,237 | 346 | 93 | 1,072 | 12,031 |
| Fidelity Series International Value Fund | 34,547 | 23,102 | 20,028 | 1,140 | 405 | 5,216 | 43,242 |
| Fidelity Series Intrinsic Opportunities Fund | 7,538 | 7,159 | 5,725 | 1,567 | (357) | 345 | 8,960 |
| Fidelity Series Investment Grade Bond Fund | 147,280 | 93,007 | 93,664 | 6,373 | (905) | 3,113 | 148,831 |
| Fidelity Series Large Cap Stock Fund | 35,497 | 22,990 | 19,311 | 1,844 | 737 | 6,568 | 46,481 |
| Fidelity Series Large Cap Value Index Fund | 11,103 | 7,743 | 6,031 | 473 | 126 | 1,296 | 14,237 |
| Fidelity Series Long-Term Treasury Bond Index Fund | 38,354 | 44,236 | 26,811 | 1,618 | (1,535) | 667 | 54,911 |
| Fidelity Series Opportunistic Insights Fund | 22,503 | 13,853 | 14,369 | 230 | 1,249 | 5,936 | 29,172 |
| Fidelity Series Overseas Fund | 34,388 | 21,622 | 18,076 | 581 | 405 | 4,853 | 43,192 |
| Fidelity Series Real Estate Income Fund | 897 | 401 | 521 | 52 | (20) | 31 | 788 |
| Fidelity Series Short-Term Credit Fund | 654 | 4 | 657 | 5 | 2 | (3) | - |
| Fidelity Series Small Cap Core Fund | 77 | 1,315 | 97 | 7 | 2 | 141 | 1,438 |
| Fidelity Series Small Cap Discovery Fund | 3,240 | 2,410 | 2,005 | 327 | 30 | 115 | 3,790 |
| Fidelity Series Small Cap Opportunities Fund | 10,812 | 6,929 | 6,112 | 111 | 221 | 2,355 | 14,205 |
| Fidelity Series Stock Selector Large Cap Value Fund | 24,711 | 18,597 | 14,782 | 1,794 | 296 | 2,937 | 31,759 |
| Fidelity Series Value Discovery Fund | 22,146 | 17,655 | 13,085 | 1,193 | 6 | 1,596 | 28,318 |
| 652,816 | 466,958 | 388,303 | 25,427 | 4,011 | 60,344 | 795,826 |
| Valuation Inputs at Reporting Date: | ||||
| Description | Total ($) | Level 1 ($) | Level 2 ($) | Level 3 ($) |
Investments in Securities: | ||||
| Domestic Equity Funds | 270,190 | 270,190 | - | - |
| International Equity Funds | 239,195 | 239,195 | - | - |
| Bond Funds | 286,441 | 286,441 | - | - |
| Total Investments in Securities: | 795,826 | 795,826 | - | - |
| Statement of Assets and Liabilities | ||||
As of July 31, 2024 | ||||
| Assets | ||||
| Investment in securities, at value - See accompanying schedule: | ||||
Affiliated issuers (cost $700,636) | $ | 795,826 | ||
| Total Investment in Securities (cost $700,636) | $ | 795,826 | ||
| Cash | 12 | |||
| Receivable for investments sold | 8,028 | |||
Total assets | 803,866 | |||
| Liabilities | ||||
| Payable for investments purchased | $ | 8,028 | ||
| Accrued management fee | 437 | |||
| Total liabilities | 8,465 | |||
| Net Assets | $ | 795,401 | ||
| Net Assets consist of: | ||||
| Paid in capital | $ | 691,189 | ||
| Total accumulated earnings (loss) | 104,212 | |||
| Net Assets | $ | 795,401 | ||
Net Asset Value, offering price and redemption price per share ($795,401 ÷ 66,144 shares) | $ | 12.03 | ||
| Statement of Operations | ||||
| Year ended July 31, 2024 | ||||
| Investment Income | ||||
| Dividends: | ||||
| Affiliated issuers | $ | 18,723 | ||
| Expenses | ||||
| Management fee | $ | 4,620 | ||
| Independent trustees' fees and expenses | 2 | |||
| Miscellaneous | 7 | |||
| Total expenses | 4,629 | |||
| Net Investment income (loss) | 14,094 | |||
| Realized and Unrealized Gain (Loss) | ||||
| Net realized gain (loss) on: | ||||
| Investment Securities: | ||||
| Affiliated issuers | 4,011 | |||
| Capital gain distributions from underlying funds: | ||||
| Affiliated issuers | 6,704 | |||
| Total net realized gain (loss) | 10,715 | |||
| Change in net unrealized appreciation (depreciation) on: | ||||
| Investment Securities: | ||||
| Affiliated issuers | 60,344 | |||
| Total change in net unrealized appreciation (depreciation) | 60,344 | |||
| Net gain (loss) | 71,059 | |||
| Net increase (decrease) in net assets resulting from operations | $ | 85,153 | ||
| Statement of Changes in Net Assets | ||||
Year ended July 31, 2024 | For the period December 15, 2022 (commencement of operations) through July 31, 2023 | |||
| Increase (Decrease) in Net Assets | ||||
| Operations | ||||
| Net investment income (loss) | $ | 14,094 | $ | 1,985 |
| Net realized gain (loss) | 10,715 | 1,141 | ||
| Change in net unrealized appreciation (depreciation) | 60,344 | 34,846 | ||
| Net increase (decrease) in net assets resulting from operations | 85,153 | 37,972 | ||
| Distributions to shareholders | (17,426) | (1,486) | ||
| Share transactions | ||||
| Proceeds from sales of shares | 345,523 | 636,085 | ||
| Reinvestment of distributions | 16,050 | 1,379 | ||
| Cost of shares redeemed | (286,709) | (21,140) | ||
Net increase (decrease) in net assets resulting from share transactions | 74,864 | 616,324 | ||
| Total increase (decrease) in net assets | 142,591 | 652,810 | ||
| Net Assets | ||||
| Beginning of period | 652,810 | - | ||
| End of period | $ | 795,401 | $ | 652,810 |
| Other Information | ||||
| Shares | ||||
| Sold | 30,889 | 61,367 | ||
| Issued in reinvestment of distributions | 1,454 | 132 | ||
| Redeemed | (25,648) | (2,050) | ||
| Net increase (decrease) | 6,695 | 59,449 | ||
Fidelity Simplicity RMD 2030 Fund℠ |
| Years ended July 31, | 2024 | 2023 A | ||
Selected Per-Share Data | ||||
| Net asset value, beginning of period | $ | 10.98 | $ | 10.00 |
| Income from Investment Operations | ||||
Net investment income (loss) B,C | .221 | .044 | ||
| Net realized and unrealized gain (loss) | 1.103 | .967 | ||
| Total from investment operations | 1.324 | 1.011 | ||
| Distributions from net investment income | (.213) | (.031) | ||
| Distributions from net realized gain | (.061) | - | ||
| Total distributions | (.274) | (.031) | ||
| Net asset value, end of period | $ | 12.03 | $ | 10.98 |
Total Return D | 12.31 % | 10.13% | ||
Ratios to Average Net Assets C,E,F | ||||
| Expenses before reductions | .65% | .66% G | ||
| Expenses net of fee waivers, if any | .65 % | .66% G | ||
| Expenses net of all reductions | .65% | .66% G | ||
| Net investment income (loss) | 1.98% | .67% G | ||
| Supplemental Data | ||||
| Net assets, end of period (000 omitted) | $ | 795 | $ | 653 |
Portfolio turnover rate H | 55 % | 25% G |
| Tax cost ($) | Gross unrealized appreciation ($) | Gross unrealized depreciation ($) | Net unrealized appreciation (depreciation)($) | |
| Fidelity Simplicity RMD Income Fund | 29,709,242 | 1,473,975 | (2,027,968) | (553,993) |
| Fidelity Simplicity RMD 2010 Fund | 10,110,377 | 700,502 | (694,850) | 5,652 |
| Fidelity Simplicity RMD 2015 Fund | 18,457,689 | 1,822,494 | (1,297,077) | 525,417 |
| Fidelity Simplicity RMD 2020 Fund | 45,672,673 | 5,303,538 | (3,375,922) | 1,927,616 |
| Fidelity Simplicity RMD 2025 Fund | 11,239,294 | 1,240,946 | (748,272) | 492,674 |
| Fidelity Simplicity RMD 2030 Fund | 704,440 | 95,117 | (3,731) | 91,386 |
| Undistributed ordinary income ($) | Undistributed long-term capital gain ($) | Capital loss carryforward ($) | Net unrealized appreciation (depreciation) on securities and other investments ($) | |
| Fidelity Simplicity RMD Income Fund | 113,673 | - | (1,658,844) | (553,993) |
| Fidelity Simplicity RMD 2010 Fund | 34,094 | - | (325,785) | 5,652 |
| Fidelity Simplicity RMD 2015 Fund | 55,210 | - | (1,294,549) | 525,417 |
| Fidelity Simplicity RMD 2020 Fund | 113,585 | - | (2,416,397) | 1,927,616 |
| Fidelity Simplicity RMD 2025 Fund | 23,045 | - | (531,197) | 492,674 |
| Fidelity Simplicity RMD 2030 Fund | 6,288 | 6,539 | - | 91,386 |
| Short-term ($) | Long-term ($) | Total capital loss carryforward ($) | |
| Fidelity Simplicity RMD Income Fund | (330,517) | (1,328,327) | (1,658,844) |
| Fidelity Simplicity RMD 2010 Fund | (131,210) | (194,575) | (325,785) |
| Fidelity Simplicity RMD 2015 Fund | (302,329) | (992,220) | (1,294,549) |
| Fidelity Simplicity RMD 2020 Fund | (1,097,028) | (1,319,369) | (2,416,397) |
| Fidelity Simplicity RMD 2025 Fund | (220,962) | (310,235) | (531,197) |
| July 31, 2024 | |||
| Ordinary Income ($) | Long-term Capital Gains ($) | Total ($) | |
| Fidelity Simplicity RMD Income Fund | 986,396 | - | 986,396 |
| Fidelity Simplicity RMD 2010 Fund | 289,788 | - | 289,788 |
| Fidelity Simplicity RMD 2015 Fund | 530,828 | - | 530,828 |
| Fidelity Simplicity RMD 2020 Fund | 1,214,497 | - | 1,214,497 |
| Fidelity Simplicity RMD 2025 Fund | 245,693 | - | 245,693 |
| Fidelity Simplicity RMD 2030 Fund | 15,505 | 1,921 | 17,426 |
| July 31, 2023 | |||
| Ordinary Income ($) | Long-term Capital Gains ($) | Total ($) | |
| Fidelity Simplicity RMD Income Fund | 1,447,229 | 633,905 | 2,081,134 |
| Fidelity Simplicity RMD 2010 Fund | 378,848 | 183,894 | 562,742 |
| Fidelity Simplicity RMD 2015 Fund | 837,648 | 562,530 | 1,400,178 |
| Fidelity Simplicity RMD 2020 Fund | 1,697,467 | 1,546,282 | 3,243,749 |
| Fidelity Simplicity RMD 2025 Fund | 311,135 | 240,243 | 551,378 |
Fidelity Simplicity RMD 2030 Fund A | 1,486 | - | 1,486 |
| Purchases ($) | Sales ($) | |
| Fidelity Simplicity RMD Income Fund | 6,331,710 | 13,322,311 |
| Fidelity Simplicity RMD 2010 Fund | 3,032,688 | 3,580,318 |
| Fidelity Simplicity RMD 2015 Fund | 4,401,935 | 8,790,144 |
| Fidelity Simplicity RMD 2020 Fund | 11,280,719 | 19,304,335 |
| Fidelity Simplicity RMD 2025 Fund | 4,061,928 | 4,297,990 |
| Fidelity Simplicity RMD 2030 Fund | 466,958 | 388,303 |
| Fidelity Simplicity RMD Income Fund | .46% |
| Fidelity Simplicity RMD 2010 Fund | .48% |
| Fidelity Simplicity RMD 2015 Fund | .52% |
| Fidelity Simplicity RMD 2020 Fund | .56% |
| Fidelity Simplicity RMD 2025 Fund | .61% |
| Fidelity Simplicity RMD 2030 Fund | .65% |
| Custodian credits ($) | |
Fidelity Simplicity RMD Income Fund | 8 |
| Fidelity Simplicity RMD 2010 Fund | 1 |
| Fidelity Simplicity RMD 2020 Fund | 7 |
| Fund | Affiliated % |
| Fidelity Simplicity RMD 2030 Fund | 16% |
| Fidelity Simplicity RMD 2030 Fund | $8,320 |
| Fidelity Simplicity RMD Income Fund | 40.44% |
| Fidelity Simplicity RMD 2010 Fund | 35.80% |
| Fidelity Simplicity RMD 2015 Fund | 31.38% |
| Fidelity Simplicity RMD 2020 Fund | 27.72% |
| Fidelity Simplicity RMD 2025 Fund | 24.74% |
| Fidelity Simplicity RMD 2030 Fund | 20.25% |
| Fidelity Simplicity RMD Income Fund | |
September 2023 October 2023 November 2023 December 2023 February 2024 March 2024 April 2024 May 2024 June 2024 July 2024 | 8.98% 14.27% 14.27% 14.27% 0.31% 0.31% 0.31% 0.31% 0.31% 0.31% |
| Fidelity Simplicity RMD 2010 Fund | |
September 2023 October 2023 November 2023 December 2023 February 2024 March 2024 April 2024 May 2024 June 2024 July 2024 | 14.26% 21.36% 21.36% 21.36% 0.60% 0.60% 0.60% 0.60% 0.60% 0.60% |
| Fidelity Simplicity RMD 2015 Fund | |
September 2023 October 2023 November 2023 December 2023 February 2024 March 2024 April 2024 May 2024 June 2024 July 2024 | 19.33% 27.82% 27.82% 27.82% 1.17% 1.17% 1.17% 1.17% 1.17% 1.17% |
| Fidelity Simplicity RMD 2020 Fund | |
September 2023 October 2023 November 2023 December 2023 February 2024 March 2024 April 2024 May 2024 June 2024 July 2024 | 25.92% 35.11% 35.11% 35.11% 2.00% 2.00% 2.00% 2.00% 2.00% 2.00% |
| Fidelity Simplicity RMD 2025 Fund | |
September 2023 October 2023 November 2023 December 2023 February 2024 March 2024 April 2024 May 2024 June 2024 July 2024 | 37.89% 40.71% 40.71% 40.71% 3.07% 3.07% 3.07% 3.07% 3.07% 3.07% |
| Fidelity Simplicity RMD 2030 Fund | |
September 2023 October 2023 November 2023 December 2023 February 2024 March 2024 April 2024 May 2024 June 2024 July 2024 | 11.95% 47.44% 47.44% 47.44% 4.13% 4.13% 4.13% 4.13% 4.13% 4.13% |
| Fidelity Simplicity RMD Income Fund | |
September 2023 October 2023 November 2023 December 2023 February 2024 March 2024 April 2024 May 2024 June 2024 July 2024 | 0.11% 0.16% 0.16% 0.16% 0.02% 0.02% 0.02% 0.02% 0.02% 0.02% |
| Fidelity Simplicity RMD 2010 Fund | |
September 2023 October 2023 November 2023 December 2023 February 2024 March 2024 April 2024 May 2024 June 2024 July 2024 | 0.20% 0.29% 0.29% 0.29% 0.01% 0.01% 0.01% 0.01% 0.01% 0.01% |
| Fidelity Simplicity RMD 2015 Fund | |
September 2023 October 2023 November 2023 December 2023 | 0.28% 0.40% 0.40% 0.40% |
| Fidelity Simplicity RMD 2020 Fund | |
September 2023 October 2023 November 2023 December 2023 | 0.39% 0.52% 0.52% 0.52% |
| Fidelity Simplicity RMD 2025 Fund | |
September 2023 October 2023 November 2023 December 2023 | 0.58% 0.62% 0.62% 0.62% |
| Fidelity Simplicity RMD 2030 Fund | |
September 2023 October 2023 November 2023 December 2023 | 0.19% 0.72% 0.72% 0.72% |
| Pay Date | Income | Taxes | |
| Fidelity Simplicity RMD Income Fund | 12/29/23 | $0.1761 | $0.0187 |
| Fidelity Simplicity RMD 2010 Fund | 12/29/23 | $0.2021 | $0.0216 |
| Fidelity Simplicity RMD 2015 Fund | 12/29/23 | $0.2704 | $0.0288 |
| Fidelity Simplicity RMD 2020 Fund | 12/29/23 | $0.3235 | $0.0343 |
| Fidelity Simplicity RMD 2025 Fund | 12/29/23 | $0.0634 | $0.0066 |
| Fidelity Simplicity RMD 2030 Fund | 12/29/23 | $0.0663 | $0.0070 |
| A special meeting of shareholders was held on October 18, 2023. The results of votes taken among shareholders on the proposal before them are reported below. Each vote reported represents one dollar of net asset value held on the record date for the meeting. | ||
| Proposal 1 | ||
| To elect a Board of Trustees. | ||
# of Votes | % of Votes | |
| Abigail P. Johnson | ||
| Affirmative | 29,408,520,731.18 | 96.84 |
| Withheld | 958,659,352.64 | 3.16 |
| TOTAL | 30,367,180,083.82 | 100.00 |
| Jennifer Toolin McAuliffe | ||
| Affirmative | 29,484,249,185.02 | 97.09 |
| Withheld | 882,930,898.80 | 2.91 |
| TOTAL | 30,367,180,083.82 | 100.00 |
| Christine J. Thompson | ||
| Affirmative | 29,483,889,948.58 | 97.09 |
| Withheld | 883,290,135.24 | 2.91 |
| TOTAL | 30,367,180,083.82 | 100.00 |
| Elizabeth S. Acton | ||
| Affirmative | 29,471,265,000.64 | 97.05 |
| Withheld | 895,915,083.18 | 2.95 |
| TOTAL | 30,367,180,083.82 | 100.00 |
| Laura M. Bishop | ||
| Affirmative | 29,508,015,754.27 | 97.17 |
| Withheld | 859,164,329.55 | 2.83 |
| TOTAL | 30,367,180,083.82 | 100.00 |
| Ann E. Dunwoody | ||
| Affirmative | 29,470,432,034.14 | 97.05 |
| Withheld | 896,748,049.68 | 2.95 |
| TOTAL | 30,367,180,083.82 | 100.00 |
| John Engler | ||
| Affirmative | 29,326,181,411.39 | 96.57 |
| Withheld | 1,040,998,672.43 | 3.43 |
| TOTAL | 30,367,180,083.82 | 100.00 |
| Robert F. Gartland | ||
| Affirmative | 29,422,803,481.93 | 96.89 |
| Withheld | 944,376,601.89 | 3.11 |
| TOTAL | 30,367,180,083.82 | 100.00 |
| Robert W. Helm | ||
| Affirmative | 29,445,540,968.38 | 96.97 |
| Withheld | 921,639,115.44 | 3.03 |
| TOTAL | 30,367,180,083.82 | 100.00 |
| Arthur E. Johnson | ||
| Affirmative | 29,395,582,286.37 | 96.80 |
| Withheld | 971,597,797.45 | 3.20 |
| TOTAL | 30,367,180,083.82 | 100.00 |
| Michael E. Kenneally | ||
| Affirmative | 29,420,582,069.08 | 96.88 |
| Withheld | 946,598,014.74 | 3.12 |
| TOTAL | 30,367,180,083.82 | 100.00 |
| Mark A. Murray | ||
| Affirmative | 29,446,384,581.44 | 96.97 |
| Withheld | 920,795,502.38 | 3.03 |
| TOTAL | 30,367,180,083.82 | 100.00 |
| Carol J. Zierhoffer | ||
| Affirmative | 29,510,392,522.55 | 97.18 |
| Withheld | 856,787,561.27 | 2.82 |
| TOTAL | 30,367,180,083.82 | 100.00 |
| Proposal 1 reflects trust-wide proposal and voting results. | ||
 |


Contents
| Domestic Equity Funds - 9.3% | |||
| Shares | Value ($) | ||
| Fidelity Series Blue Chip Growth Fund (a) | 15,034 | 287,597 | |
| Fidelity Series Commodity Strategy Fund (a) | 1,334 | 124,981 | |
| Fidelity Series Large Cap Growth Index Fund (a) | 8,119 | 184,225 | |
| Fidelity Series Large Cap Stock Fund (a) | 7,236 | 168,454 | |
| Fidelity Series Large Cap Value Index Fund (a) | 21,031 | 346,375 | |
| Fidelity Series Small Cap Core Fund (a) | 6,888 | 85,613 | |
| Fidelity Series Small Cap Opportunities Fund (a) | 3,181 | 51,659 | |
| Fidelity Series Value Discovery Fund (a) | 7,543 | 121,295 | |
| TOTAL DOMESTIC EQUITY FUNDS (Cost $1,068,492) | 1,370,199 | ||
| International Equity Funds - 13.6% | |||
| Shares | Value ($) | ||
| Fidelity Series Canada Fund (a) | 6,491 | 102,304 | |
| Fidelity Series Emerging Markets Fund (a) | 17,956 | 164,298 | |
| Fidelity Series Emerging Markets Opportunities Fund (a) | 35,057 | 658,013 | |
| Fidelity Series International Growth Fund (a) | 13,835 | 256,507 | |
| Fidelity Series International Index Fund (a) | 7,551 | 96,420 | |
| Fidelity Series International Small Cap Fund (a) | 12,285 | 222,729 | |
| Fidelity Series International Value Fund (a) | 19,457 | 254,889 | |
| Fidelity Series Overseas Fund (a) | 17,641 | 254,743 | |
| TOTAL INTERNATIONAL EQUITY FUNDS (Cost $1,625,544) | 2,009,903 | ||
| Bond Funds - 71.7% | |||
| Shares | Value ($) | ||
| Fidelity Series 0-5 Year Inflation-Protected Bond Index Fund (a) | 302,700 | 2,933,164 | |
| Fidelity Series 5+ Year Inflation-Protected Bond Index Fund (a) | 11,642 | 90,227 | |
| Fidelity Series Corporate Bond Fund (a) | 135,188 | 1,262,652 | |
| Fidelity Series Emerging Markets Debt Fund (a) | 9,796 | 77,485 | |
| Fidelity Series Emerging Markets Debt Local Currency Fund (a) | 2,714 | 24,558 | |
| Fidelity Series Floating Rate High Income Fund (a) | 1,645 | 14,768 | |
| Fidelity Series Government Bond Index Fund (a) | 212,328 | 1,955,544 | |
| Fidelity Series High Income Fund (a) | 9,382 | 80,027 | |
| Fidelity Series International Credit Fund (a) | 1,011 | 8,310 | |
| Fidelity Series International Developed Markets Bond Index Fund (a) | 66,944 | 581,744 | |
| Fidelity Series Investment Grade Bond Fund (a) | 189,247 | 1,907,611 | |
| Fidelity Series Investment Grade Securitized Fund (a) | 137,270 | 1,234,053 | |
| Fidelity Series Long-Term Treasury Bond Index Fund (a) | 69,225 | 392,506 | |
| Fidelity Series Real Estate Income Fund (a) | 1,482 | 14,624 | |
| TOTAL BOND FUNDS (Cost $11,469,076) | 10,577,273 | ||
| Short-Term Funds - 5.4% | |||
| Shares | Value ($) | ||
| Fidelity Series Government Money Market Fund 5.42% (a)(b) | 156,176 | 156,176 | |
| Fidelity Series Short-Term Credit Fund (a) | 16,533 | 164,669 | |
| Fidelity Series Treasury Bill Index Fund (a) | 47,694 | 474,076 | |
| TOTAL SHORT-TERM FUNDS (Cost $795,857) | 794,921 | ||
| TOTAL INVESTMENT IN SECURITIES - 100.0% (Cost $14,958,969) | 14,752,296 |
NET OTHER ASSETS (LIABILITIES) - 0.0% | (5,294) |
| NET ASSETS - 100.0% | 14,747,002 |
| (a) | Affiliated Fund |
| (b) | The rate quoted is the annualized seven-day yield of the fund at period end. |
| Affiliate | Value, beginning of period ($) | Purchases ($) | Sales Proceeds ($) | Dividend Income ($) | Realized Gain (loss) ($) | Change in Unrealized appreciation (depreciation) ($) | Value, end of period ($) |
| Fidelity Series 0-5 Year Inflation-Protected Bond Index Fund | 3,270,413 | 760,313 | 1,161,436 | 99,801 | (30,900) | 94,774 | 2,933,164 |
| Fidelity Series 5+ Year Inflation-Protected Bond Index Fund | 99,867 | 22,707 | 30,439 | 3,887 | (1,698) | (210) | 90,227 |
| Fidelity Series Blue Chip Growth Fund | 207,095 | 148,942 | 135,196 | 1,099 | 8,526 | 58,230 | 287,597 |
| Fidelity Series Canada Fund | 110,291 | 31,908 | 45,948 | 3,139 | 3,712 | 2,341 | 102,304 |
| Fidelity Series Commodity Strategy Fund | 123,398 | 54,991 | 42,531 | 4,572 | (1,826) | (9,051) | 124,981 |
| Fidelity Series Corporate Bond Fund | 1,364,912 | 344,809 | 480,445 | 56,221 | (37,449) | 70,825 | 1,262,652 |
| Fidelity Series Emerging Markets Debt Fund | 84,622 | 17,914 | 28,508 | 4,921 | (3,255) | 6,712 | 77,485 |
| Fidelity Series Emerging Markets Debt Local Currency Fund | 28,678 | 6,507 | 8,865 | 1,760 | (746) | (1,016) | 24,558 |
| Fidelity Series Emerging Markets Fund | 159,950 | 70,498 | 71,724 | 3,472 | (3,651) | 9,225 | 164,298 |
| Fidelity Series Emerging Markets Opportunities Fund | 637,224 | 314,086 | 313,326 | 16,028 | (19,279) | 39,308 | 658,013 |
| Fidelity Series Floating Rate High Income Fund | 16,783 | 4,554 | 6,546 | 1,470 | - | (23) | 14,768 |
| Fidelity Series Government Bond Index Fund | 1,984,604 | 564,715 | 609,927 | 59,552 | (23,497) | 39,649 | 1,955,544 |
| Fidelity Series Government Money Market Fund 5.42% | 373,590 | 75,572 | 292,986 | 12,835 | - | - | 156,176 |
| Fidelity Series High Income Fund | 89,000 | 17,245 | 28,524 | 5,242 | (2,529) | 4,835 | 80,027 |
| Fidelity Series International Credit Fund | 7,460 | 333 | - | 333 | - | 517 | 8,310 |
| Fidelity Series International Developed Markets Bond Index Fund | 642,907 | 131,565 | 202,576 | 21,654 | (14,238) | 24,086 | 581,744 |
| Fidelity Series International Growth Fund | 278,109 | 81,402 | 126,788 | 3,029 | (5,527) | 29,311 | 256,507 |
| Fidelity Series International Index Fund | 105,177 | 28,242 | 43,321 | 2,496 | 1,999 | 4,323 | 96,420 |
| Fidelity Series International Small Cap Fund | 87,237 | 191,709 | 96,507 | 8,024 | (460) | 40,750 | 222,729 |
| Fidelity Series International Value Fund | 280,062 | 71,315 | 127,434 | 7,545 | 6,103 | 24,843 | 254,889 |
| Fidelity Series Investment Grade Bond Fund | 2,027,936 | 521,714 | 666,158 | 80,448 | (47,196) | 71,315 | 1,907,611 |
| Fidelity Series Investment Grade Securitized Fund | 1,376,634 | 324,964 | 480,299 | 52,901 | (36,337) | 49,091 | 1,234,053 |
| Fidelity Series Large Cap Growth Index Fund | 130,833 | 97,540 | 80,851 | 1,080 | 7,986 | 28,717 | 184,225 |
| Fidelity Series Large Cap Stock Fund | 145,083 | 98,499 | 105,716 | 7,017 | 8,638 | 21,950 | 168,454 |
| Fidelity Series Large Cap Value Index Fund | 269,527 | 205,879 | 162,839 | 10,093 | 9,754 | 24,054 | 346,375 |
| Fidelity Series Long-Term Treasury Bond Index Fund | 626,786 | 205,154 | 416,588 | 17,997 | (115,076) | 92,230 | 392,506 |
| Fidelity Series Overseas Fund | 278,417 | 71,832 | 123,792 | 3,856 | 898 | 27,388 | 254,743 |
| Fidelity Series Real Estate Income Fund | 23,369 | 3,582 | 12,409 | 1,081 | (624) | 706 | 14,624 |
| Fidelity Series Short-Term Credit Fund | 298,973 | 42,131 | 183,265 | 7,624 | (3,404) | 10,234 | 164,669 |
| Fidelity Series Small Cap Core Fund | 715 | 81,141 | 444 | 35 | 23 | 4,178 | 85,613 |
| Fidelity Series Small Cap Opportunities Fund | 66,365 | 35,302 | 62,587 | 634 | 5,851 | 6,728 | 51,659 |
| Fidelity Series Treasury Bill Index Fund | 1,072,458 | 268,649 | 866,595 | 38,239 | (3,384) | 2,948 | 474,076 |
| Fidelity Series Value Discovery Fund | 99,468 | 77,314 | 62,754 | 4,797 | 2,503 | 4,764 | 121,295 |
| 16,367,943 | 4,973,028 | 7,077,324 | 542,882 | (295,083) | 783,732 | 14,752,296 |
| Valuation Inputs at Reporting Date: | ||||
| Description | Total ($) | Level 1 ($) | Level 2 ($) | Level 3 ($) |
Investments in Securities: | ||||
| Domestic Equity Funds | 1,370,199 | 1,370,199 | - | - |
| International Equity Funds | 2,009,903 | 2,009,903 | - | - |
| Bond Funds | 10,577,273 | 10,577,273 | - | - |
| Short-Term Funds | 794,921 | 794,921 | - | - |
| Total Investments in Securities: | 14,752,296 | 14,752,296 | - | - |
| Statement of Assets and Liabilities | ||||
As of July 31, 2024 | ||||
| Assets | ||||
| Investment in securities, at value - See accompanying schedule: | ||||
Affiliated issuers (cost $14,958,969) | $ | 14,752,296 | ||
| Total Investment in Securities (cost $14,958,969) | $ | 14,752,296 | ||
| Cash | 14 | |||
| Receivable for investments sold | 78,016 | |||
| Receivable for fund shares sold | 42 | |||
Total assets | 14,830,368 | |||
| Liabilities | ||||
| Payable for investments purchased | $ | 75,378 | ||
| Payable for fund shares redeemed | 2,680 | |||
| Accrued management fee | 5,132 | |||
| Distribution and service plan fees payable | 175 | |||
| Other payables and accrued expenses | 1 | |||
| Total liabilities | 83,366 | |||
| Net Assets | $ | 14,747,002 | ||
| Net Assets consist of: | ||||
| Paid in capital | $ | 15,913,919 | ||
| Total accumulated earnings (loss) | (1,166,917) | |||
| Net Assets | $ | 14,747,002 | ||
| Net Asset Value and Maximum Offering Price | ||||
| Class A : | ||||
Net Asset Value and redemption price per share ($846,824 ÷ 15,069.65 shares)(a) | $ | 56.19 | ||
| Maximum offering price per share (100/94.25 of $56.19) | $ | 59.62 | ||
| Fidelity Managed Retirement Income : | ||||
Net Asset Value, offering price and redemption price per share ($11,500,540 ÷ 204,670.01 shares) | $ | 56.19 | ||
| Class K : | ||||
Net Asset Value, offering price and redemption price per share ($114,698 ÷ 2,041.1 shares) | $ | 56.19 | ||
| Class K6 : | ||||
Net Asset Value, offering price and redemption price per share ($2,171,982 ÷ 38,654.09 shares) | $ | 56.19 | ||
| Class I : | ||||
Net Asset Value, offering price and redemption price per share ($112,958 ÷ 2,007.97 shares) | $ | 56.25 | ||
(a)Redemption price per share is equal to net asset value less any applicable contingent deferred sales charge. | ||||
| Statement of Operations | ||||
| Year ended July 31, 2024 | ||||
| Investment Income | ||||
| Dividends: | ||||
| Affiliated issuers | $ | 527,223 | ||
| Expenses | ||||
| Management fee | $ | 64,102 | ||
| Distribution and service plan fees | 2,068 | |||
| Independent trustees' fees and expenses | 45 | |||
| Miscellaneous | 183 | |||
| Total expenses before reductions | 66,398 | |||
| Expense reductions | (1) | |||
| Total expenses after reductions | 66,397 | |||
| Net Investment income (loss) | 460,826 | |||
| Realized and Unrealized Gain (Loss) | ||||
| Net realized gain (loss) on: | ||||
| Investment Securities: | ||||
| Affiliated issuers | (295,083) | |||
| Capital gain distributions from underlying funds: | ||||
| Affiliated issuers | 15,659 | |||
| Total net realized gain (loss) | (279,424) | |||
| Change in net unrealized appreciation (depreciation) on: | ||||
| Investment Securities: | ||||
| Affiliated issuers | 783,732 | |||
| Total change in net unrealized appreciation (depreciation) | 783,732 | |||
| Net gain (loss) | 504,308 | |||
| Net increase (decrease) in net assets resulting from operations | $ | 965,134 | ||
| Statement of Changes in Net Assets | ||||
Year ended July 31, 2024 | Year ended July 31, 2023 | |||
| Increase (Decrease) in Net Assets | ||||
| Operations | ||||
| Net investment income (loss) | $ | 460,826 | $ | 654,735 |
| Net realized gain (loss) | (279,424) | (416,282) | ||
| Change in net unrealized appreciation (depreciation) | 783,732 | (240,100) | ||
| Net increase (decrease) in net assets resulting from operations | 965,134 | (1,647) | ||
| Distributions to shareholders | (440,966) | (850,429) | ||
| Share transactions - net increase (decrease) | (2,144,669) | (828,342) | ||
| Total increase (decrease) in net assets | (1,620,501) | (1,680,418) | ||
| Net Assets | ||||
| Beginning of period | 16,367,503 | 18,047,921 | ||
| End of period | $ | 14,747,002 | $ | 16,367,503 |
Fidelity Advisor Managed Retirement Income Fund℠ Class A |
| Years ended July 31, | 2024 | 2023 | 2022 | 2021 | 2020 | |||||
Selected Per-Share Data | ||||||||||
| Net asset value, beginning of period | $ | 54.06 | $ | 56.57 | $ | 63.52 | $ | 60.44 | $ | 57.74 |
| Income from Investment Operations | ||||||||||
Net investment income (loss) A,B | 1.559 | 1.924 | 1.317 | .309 | .684 | |||||
| Net realized and unrealized gain (loss) | 2.056 | (1.950) | (6.180) | 4.009 | 3.226 | |||||
| Total from investment operations | 3.615 | (.026) | (4.863) | 4.318 | 3.910 | |||||
| Distributions from net investment income | (1.474) | (1.849) | (1.252) | (.329) | (.776) | |||||
| Distributions from net realized gain | (.011) | (.635) | (.835) | (.909) | (.434) | |||||
| Total distributions | (1.485) | (2.484) | (2.087) | (1.238) | (1.210) | |||||
| Net asset value, end of period | $ | 56.19 | $ | 54.06 | $ | 56.57 | $ | 63.52 | $ | 60.44 |
Total Return C,D | 6.82 % | .14% | (7.90)% | 7.21% | 6.86% | |||||
Ratios to Average Net Assets B,E,F | ||||||||||
| Expenses before reductions | .70% | .70% | .70% | .70% | .70% | |||||
| Expenses net of fee waivers, if any | .70 % | .70% | .70% | .70% | .70% | |||||
| Expenses net of all reductions | .70% | .69% | .70% | .70% | .70% | |||||
| Net investment income (loss) | 2.89% | 3.60% | 2.20% | .50% | 1.18% | |||||
| Supplemental Data | ||||||||||
| Net assets, end of period (000 omitted) | $ | 847 | $ | 807 | $ | 717 | $ | 716 | $ | 453 |
Portfolio turnover rate G | 33 % | 25% | 64% | 31% | 62% H |
Fidelity Managed Retirement Income Fund℠ |
| Years ended July 31, | 2024 | 2023 | 2022 | 2021 | 2020 | |||||
Selected Per-Share Data | ||||||||||
| Net asset value, beginning of period | $ | 54.04 | $ | 56.57 | $ | 63.52 | $ | 60.42 | $ | 57.73 |
| Income from Investment Operations | ||||||||||
Net investment income (loss) A,B | 1.694 | 2.055 | 1.473 | .464 | .829 | |||||
| Net realized and unrealized gain (loss) | 2.069 | (1.958) | (6.189) | 4.011 | 3.220 | |||||
| Total from investment operations | 3.763 | .097 | (4.716) | 4.475 | 4.049 | |||||
| Distributions from net investment income | (1.602) | (1.992) | (1.399) | (.466) | (.925) | |||||
| Distributions from net realized gain | (.011) | (.635) | (.835) | (.909) | (.434) | |||||
| Total distributions | (1.613) | (2.627) | (2.234) | (1.375) | (1.359) | |||||
| Net asset value, end of period | $ | 56.19 | $ | 54.04 | $ | 56.57 | $ | 63.52 | $ | 60.42 |
Total Return C | 7.11 % | .37% | (7.68)% | 7.48% | 7.12% | |||||
Ratios to Average Net Assets B,D,E | ||||||||||
| Expenses before reductions | .45% | .45% | .45% | .45% | .45% | |||||
| Expenses net of fee waivers, if any | .45 % | .45% | .45% | .45% | .45% | |||||
| Expenses net of all reductions | .45% | .45% | .45% | .45% | .45% | |||||
| Net investment income (loss) | 3.14% | 3.84% | 2.45% | .75% | 1.43% | |||||
| Supplemental Data | ||||||||||
| Net assets, end of period (000 omitted) | $ | 11,501 | $ | 14,670 | $ | 16,230 | $ | 19,995 | $ | 13,965 |
Portfolio turnover rate F | 33 % | 25% | 64% | 31% | 62% G |
Fidelity Managed Retirement Income Fund℠ Class K |
| Years ended July 31, | 2024 | 2023 | 2022 | 2021 | 2020 A | |||||
Selected Per-Share Data | ||||||||||
| Net asset value, beginning of period | $ | 54.05 | $ | 56.59 | $ | 63.54 | $ | 60.43 | $ | 57.81 |
| Income from Investment Operations | ||||||||||
Net investment income (loss) B,C | 1.747 | 2.105 | 1.529 | .526 | .889 | |||||
| Net realized and unrealized gain (loss) | 2.064 | (1.955) | (6.186) | 4.010 | 3.146 | |||||
| Total from investment operations | 3.811 | .150 | (4.657) | 4.536 | 4.035 | |||||
| Distributions from net investment income | (1.660) | (2.055) | (1.458) | (.517) | (.981) | |||||
| Distributions from net realized gain | (.011) | (.635) | (.835) | (.909) | (.434) | |||||
| Total distributions | (1.671) | (2.690) | (2.293) | (1.426) | (1.415) | |||||
| Net asset value, end of period | $ | 56.19 | $ | 54.05 | $ | 56.59 | $ | 63.54 | $ | 60.43 |
Total Return D,E | 7.20 % | .47% | (7.58)% | 7.59% | 7.09% | |||||
Ratios to Average Net Assets C,F,G | ||||||||||
| Expenses before reductions | .35% | .35% | .35% | .35% | .35% | |||||
| Expenses net of fee waivers, if any | .35 % | .35% | .35% | .35% | .35% | |||||
| Expenses net of all reductions | .35% | .35% | .35% | .35% | .35% | |||||
| Net investment income (loss) | 3.24% | 3.94% | 2.55% | .85% | 1.53% | |||||
| Supplemental Data | ||||||||||
| Net assets, end of period (000 omitted) | $ | 115 | $ | 131 | $ | 106 | $ | 115 | $ | 107 |
Portfolio turnover rate H | 33 % | 25% | 64% | 31% | 62% I |
Fidelity Managed Retirement Income Fund℠ Class K6 |
| Years ended July 31, | 2024 | 2023 | 2022 | 2021 | 2020 A | |||||
Selected Per-Share Data | ||||||||||
| Net asset value, beginning of period | $ | 54.06 | $ | 56.60 | $ | 63.55 | $ | 60.42 | $ | 57.81 |
| Income from Investment Operations | ||||||||||
Net investment income (loss) B,C | 1.592 | 2.164 | 1.583 | .588 | .941 | |||||
| Net realized and unrealized gain (loss) | 2.272 | (1.959) | (6.174) | 4.005 | 3.151 | |||||
| Total from investment operations | 3.864 | .205 | (4.591) | 4.593 | 4.092 | |||||
| Distributions from net investment income | (1.723) | (2.110) | (1.524) | (.554) | (1.048) | |||||
| Distributions from net realized gain | (.011) | (.635) | (.835) | (.909) | (.434) | |||||
| Total distributions | (1.734) | (2.745) | (2.359) | (1.463) | (1.482) | |||||
| Net asset value, end of period | $ | 56.19 | $ | 54.06 | $ | 56.60 | $ | 63.55 | $ | 60.42 |
Total Return D,E | 7.31 % | .57% | (7.48)% | 7.69% | 7.20% | |||||
Ratios to Average Net Assets C,F,G | ||||||||||
| Expenses before reductions | .25% | .25% | .25% | .25% | .25% | |||||
| Expenses net of fee waivers, if any | .25 % | .25% | .25% | .25% | .25% | |||||
| Expenses net of all reductions | .25% | .25% | .25% | .25% | .25% | |||||
| Net investment income (loss) | 2.93% | 4.05% | 2.65% | .95% | 1.62% | |||||
| Supplemental Data | ||||||||||
| Net assets, end of period (000 omitted) | $ | 2,172 | $ | 494 | $ | 711 | $ | 539 | $ | 434 |
Portfolio turnover rate H | 33 % | 25% | 64% | 31% | 62% I |
Fidelity Advisor Managed Retirement Income Fund℠ Class I |
| Years ended July 31, | 2024 | 2023 | 2022 | 2021 | 2020 | |||||
Selected Per-Share Data | ||||||||||
| Net asset value, beginning of period | $ | 54.11 | $ | 56.64 | $ | 63.58 | $ | 60.48 | $ | 57.71 |
| Income from Investment Operations | ||||||||||
Net investment income (loss) A,B | 1.696 | 2.059 | 1.480 | .464 | .828 | |||||
| Net realized and unrealized gain (loss) | 2.059 | (1.961) | (6.193) | 4.011 | 3.233 | |||||
| Total from investment operations | 3.755 | .098 | (4.713) | 4.475 | 4.061 | |||||
| Distributions from net investment income | (1.604) | (1.993) | (1.392) | (.466) | (.857) | |||||
| Distributions from net realized gain | (.011) | (.635) | (.835) | (.909) | (.434) | |||||
| Total distributions | (1.615) | (2.628) | (2.227) | (1.375) | (1.291) | |||||
| Net asset value, end of period | $ | 56.25 | $ | 54.11 | $ | 56.64 | $ | 63.58 | $ | 60.48 |
Total Return C | 7.09 % | .37% | (7.66)% | 7.48% | 7.14% | |||||
Ratios to Average Net Assets B,D,E | ||||||||||
| Expenses before reductions | .45% | .45% | .45% | .45% | .45% | |||||
| Expenses net of fee waivers, if any | .45 % | .45% | .45% | .45% | .45% | |||||
| Expenses net of all reductions | .45% | .45% | .45% | .45% | .45% | |||||
| Net investment income (loss) | 3.14% | 3.85% | 2.45% | .75% | 1.43% | |||||
| Supplemental Data | ||||||||||
| Net assets, end of period (000 omitted) | $ | 113 | $ | 159 | $ | 176 | $ | 270 | $ | 300 |
Portfolio turnover rate F | 33 % | 25% | 64% | 31% | 62% G |
| Domestic Equity Funds - 10.0% | |||
| Shares | Value ($) | ||
| Fidelity Series Blue Chip Growth Fund (a) | 6,070 | 116,119 | |
| Fidelity Series Commodity Strategy Fund (a) | 495 | 46,373 | |
| Fidelity Series Large Cap Growth Index Fund (a) | 3,282 | 74,459 | |
| Fidelity Series Large Cap Stock Fund (a) | 2,915 | 67,864 | |
| Fidelity Series Large Cap Value Index Fund (a) | 8,472 | 139,530 | |
| Fidelity Series Small Cap Core Fund (a) | 2,768 | 34,404 | |
| Fidelity Series Small Cap Opportunities Fund (a) | 1,275 | 20,699 | |
| Fidelity Series Value Discovery Fund (a) | 3,039 | 48,860 | |
| TOTAL DOMESTIC EQUITY FUNDS (Cost $402,250) | 548,308 | ||
| International Equity Funds - 14.1% | |||
| Shares | Value ($) | ||
| Fidelity Series Canada Fund (a) | 2,535 | 39,946 | |
| Fidelity Series Emerging Markets Fund (a) | 6,832 | 62,514 | |
| Fidelity Series Emerging Markets Opportunities Fund (a) | 13,339 | 250,374 | |
| Fidelity Series International Growth Fund (a) | 5,403 | 100,166 | |
| Fidelity Series International Index Fund (a) | 2,954 | 37,720 | |
| Fidelity Series International Small Cap Fund (a) | 4,541 | 82,330 | |
| Fidelity Series International Value Fund (a) | 7,603 | 99,599 | |
| Fidelity Series Overseas Fund (a) | 6,893 | 99,541 | |
| TOTAL INTERNATIONAL EQUITY FUNDS (Cost $614,874) | 772,190 | ||
| Bond Funds - 70.9% | |||
| Shares | Value ($) | ||
| Fidelity Series 0-5 Year Inflation-Protected Bond Index Fund (a) | 108,151 | 1,047,989 | |
| Fidelity Series 5+ Year Inflation-Protected Bond Index Fund (a) | 6,807 | 52,754 | |
| Fidelity Series Corporate Bond Fund (a) | 49,588 | 463,156 | |
| Fidelity Series Emerging Markets Debt Fund (a) | 3,618 | 28,616 | |
| Fidelity Series Emerging Markets Debt Local Currency Fund (a) | 1,022 | 9,247 | |
| Fidelity Series Floating Rate High Income Fund (a) | 610 | 5,479 | |
| Fidelity Series Government Bond Index Fund (a) | 77,902 | 717,475 | |
| Fidelity Series High Income Fund (a) | 3,481 | 29,696 | |
| Fidelity Series International Credit Fund (a) | 696 | 5,720 | |
| Fidelity Series International Developed Markets Bond Index Fund (a) | 24,537 | 213,227 | |
| Fidelity Series Investment Grade Bond Fund (a) | 69,423 | 699,786 | |
| Fidelity Series Investment Grade Securitized Fund (a) | 50,352 | 452,666 | |
| Fidelity Series Long-Term Treasury Bond Index Fund (a) | 25,984 | 147,331 | |
| Fidelity Series Real Estate Income Fund (a) | 550 | 5,427 | |
| TOTAL BOND FUNDS (Cost $4,127,859) | 3,878,569 | ||
| Short-Term Funds - 5.0% | |||
| Shares | Value ($) | ||
| Fidelity Series Government Money Market Fund 5.42% (a)(b) | 55,041 | 55,041 | |
| Fidelity Series Short-Term Credit Fund (a) | 5,535 | 55,133 | |
| Fidelity Series Treasury Bill Index Fund (a) | 16,612 | 165,121 | |
| TOTAL SHORT-TERM FUNDS (Cost $275,147) | 275,295 | ||
| TOTAL INVESTMENT IN SECURITIES - 100.0% (Cost $5,420,130) | 5,474,362 |
NET OTHER ASSETS (LIABILITIES) - 0.0% | (1,899) |
| NET ASSETS - 100.0% | 5,472,463 |
| (a) | Affiliated Fund |
| (b) | The rate quoted is the annualized seven-day yield of the fund at period end. |
| Affiliate | Value, beginning of period ($) | Purchases ($) | Sales Proceeds ($) | Dividend Income ($) | Realized Gain (loss) ($) | Change in Unrealized appreciation (depreciation) ($) | Value, end of period ($) |
| Fidelity Series 0-5 Year Inflation-Protected Bond Index Fund | 1,134,177 | 220,023 | 329,650 | 38,272 | (8,638) | 32,077 | 1,047,989 |
| Fidelity Series 5+ Year Inflation-Protected Bond Index Fund | 82,192 | 6,728 | 34,207 | 3,038 | (6,461) | 4,502 | 52,754 |
| Fidelity Series Blue Chip Growth Fund | 98,750 | 47,996 | 61,899 | 555 | 9,624 | 21,648 | 116,119 |
| Fidelity Series Canada Fund | 45,687 | 8,960 | 17,528 | 1,463 | 2,664 | 163 | 39,946 |
| Fidelity Series Commodity Strategy Fund | 46,405 | 18,213 | 13,955 | 1,861 | (540) | (3,750) | 46,373 |
| Fidelity Series Corporate Bond Fund | 501,092 | 99,513 | 152,862 | 21,924 | (10,500) | 25,913 | 463,156 |
| Fidelity Series Emerging Markets Debt Fund | 31,828 | 4,247 | 9,031 | 1,957 | (2,000) | 3,572 | 28,616 |
| Fidelity Series Emerging Markets Debt Local Currency Fund | 10,782 | 1,834 | 2,692 | 737 | (266) | (411) | 9,247 |
| Fidelity Series Emerging Markets Fund | 57,577 | 28,953 | 26,947 | 1,545 | (1,296) | 4,227 | 62,514 |
| Fidelity Series Emerging Markets Opportunities Fund | 259,375 | 97,224 | 115,012 | 7,131 | (4,842) | 13,629 | 250,374 |
| Fidelity Series Floating Rate High Income Fund | 6,301 | 1,247 | 2,064 | 584 | (73) | 68 | 5,479 |
| Fidelity Series Government Bond Index Fund | 728,582 | 163,852 | 182,871 | 23,193 | (8,743) | 16,655 | 717,475 |
| Fidelity Series Government Money Market Fund 5.42% | 133,727 | 23,493 | 102,179 | 4,806 | - | - | 55,041 |
| Fidelity Series High Income Fund | 33,470 | 4,090 | 8,890 | 2,086 | (1,086) | 2,112 | 29,696 |
| Fidelity Series International Credit Fund | 5,135 | 229 | - | 229 | - | 356 | 5,720 |
| Fidelity Series International Developed Markets Bond Index Fund | 239,506 | 30,366 | 61,092 | 8,750 | (5,493) | 9,940 | 213,227 |
| Fidelity Series International Growth Fund | 115,383 | 23,317 | 50,080 | 1,412 | 3,747 | 7,799 | 100,166 |
| Fidelity Series International Index Fund | 43,565 | 8,382 | 17,239 | 1,163 | 1,956 | 1,056 | 37,720 |
| Fidelity Series International Small Cap Fund | 36,319 | 66,117 | 36,241 | 3,394 | 1,190 | 14,945 | 82,330 |
| Fidelity Series International Value Fund | 116,088 | 21,105 | 51,534 | 3,516 | 6,094 | 7,846 | 99,599 |
| Fidelity Series Investment Grade Bond Fund | 744,500 | 148,506 | 205,246 | 31,366 | (19,469) | 31,495 | 699,786 |
| Fidelity Series Investment Grade Securitized Fund | 505,391 | 91,950 | 151,667 | 20,641 | (16,643) | 23,635 | 452,666 |
| Fidelity Series Large Cap Growth Index Fund | 62,378 | 31,439 | 36,322 | 525 | 4,640 | 12,324 | 74,459 |
| Fidelity Series Large Cap Stock Fund | 69,175 | 33,706 | 48,829 | 3,554 | 6,581 | 7,231 | 67,864 |
| Fidelity Series Large Cap Value Index Fund | 128,523 | 67,658 | 71,728 | 5,187 | 4,544 | 10,533 | 139,530 |
| Fidelity Series Long-Term Treasury Bond Index Fund | 240,090 | 64,397 | 150,139 | 7,288 | (53,510) | 46,493 | 147,331 |
| Fidelity Series Overseas Fund | 115,511 | 20,735 | 49,883 | 1,797 | 8,509 | 4,669 | 99,541 |
| Fidelity Series Real Estate Income Fund | 8,745 | 842 | 4,205 | 438 | (706) | 751 | 5,427 |
| Fidelity Series Short-Term Credit Fund | 98,710 | 8,031 | 54,185 | 2,753 | (976) | 3,553 | 55,133 |
| Fidelity Series Small Cap Core Fund | 352 | 32,613 | 270 | 12 | 11 | 1,698 | 34,404 |
| Fidelity Series Small Cap Opportunities Fund | 31,634 | 10,863 | 27,628 | 321 | 8,033 | (2,203) | 20,699 |
| Fidelity Series Treasury Bill Index Fund | 378,331 | 86,983 | 300,028 | 14,231 | (1,254) | 1,089 | 165,121 |
| Fidelity Series Value Discovery Fund | 47,420 | 23,316 | 24,865 | 2,436 | 1,221 | 1,768 | 48,860 |
| 6,156,701 | 1,496,928 | 2,400,968 | 218,165 | (83,682) | 305,383 | 5,474,362 |
| Valuation Inputs at Reporting Date: | ||||
| Description | Total ($) | Level 1 ($) | Level 2 ($) | Level 3 ($) |
Investments in Securities: | ||||
| Domestic Equity Funds | 548,308 | 548,308 | - | - |
| International Equity Funds | 772,190 | 772,190 | - | - |
| Bond Funds | 3,878,569 | 3,878,569 | - | - |
| Short-Term Funds | 275,295 | 275,295 | - | - |
| Total Investments in Securities: | 5,474,362 | 5,474,362 | - | - |
| Statement of Assets and Liabilities | ||||
As of July 31, 2024 | ||||
| Assets | ||||
| Investment in securities, at value - See accompanying schedule: | ||||
Affiliated issuers (cost $5,420,130) | $ | 5,474,362 | ||
| Total Investment in Securities (cost $5,420,130) | $ | 5,474,362 | ||
| Cash | 58 | |||
| Receivable for investments sold | 48,754 | |||
Total assets | 5,523,174 | |||
| Liabilities | ||||
| Payable for investments purchased | $ | 19,175 | ||
| Payable for fund shares redeemed | 29,579 | |||
| Accrued management fee | 1,905 | |||
| Distribution and service plan fees payable | 34 | |||
| Other payables and accrued expenses | 18 | |||
| Total liabilities | 50,711 | |||
| Net Assets | $ | 5,472,463 | ||
| Net Assets consist of: | ||||
| Paid in capital | $ | 5,614,368 | ||
| Total accumulated earnings (loss) | (141,905) | |||
| Net Assets | $ | 5,472,463 | ||
| Net Asset Value and Maximum Offering Price | ||||
| Class A : | ||||
Net Asset Value and redemption price per share ($164,672 ÷ 3,063.03 shares)(a) | $ | 53.76 | ||
| Maximum offering price per share (100/94.25 of $53.76) | $ | 57.04 | ||
| Fidelity Managed Retirement 2010 : | ||||
Net Asset Value, offering price and redemption price per share ($4,290,928 ÷ 79,783.14 shares) | $ | 53.78 | ||
| Class K : | ||||
Net Asset Value, offering price and redemption price per share ($117,582 ÷ 2,187.34 shares) | $ | 53.76 | ||
| Class K6 : | ||||
Net Asset Value, offering price and redemption price per share ($799,463 ÷ 14,874.88 shares) | $ | 53.75 | ||
| Class I : | ||||
Net Asset Value, offering price and redemption price per share ($99,818 ÷ 1,856.51 shares) | $ | 53.77 | ||
(a)Redemption price per share is equal to net asset value less any applicable contingent deferred sales charge. | ||||
| Statement of Operations | ||||
| Year ended July 31, 2024 | ||||
| Investment Income | ||||
| Dividends: | ||||
| Affiliated issuers | $ | 210,462 | ||
| Expenses | ||||
| Management fee | $ | 25,116 | ||
| Distribution and service plan fees | 438 | |||
| Independent trustees' fees and expenses | 18 | |||
| Miscellaneous | 62 | |||
| Total expenses before reductions | 25,634 | |||
| Expense reductions | (2) | |||
| Total expenses after reductions | 25,632 | |||
| Net Investment income (loss) | 184,830 | |||
| Realized and Unrealized Gain (Loss) | ||||
| Net realized gain (loss) on: | ||||
| Investment Securities: | ||||
| Affiliated issuers | (83,682) | |||
| Capital gain distributions from underlying funds: | ||||
| Affiliated issuers | 7,703 | |||
| Total net realized gain (loss) | (75,979) | |||
| Change in net unrealized appreciation (depreciation) on: | ||||
| Investment Securities: | ||||
| Affiliated issuers | 305,383 | |||
| Total change in net unrealized appreciation (depreciation) | 305,383 | |||
| Net gain (loss) | 229,404 | |||
| Net increase (decrease) in net assets resulting from operations | $ | 414,234 | ||
| Statement of Changes in Net Assets | ||||
Year ended July 31, 2024 | Year ended July 31, 2023 | |||
| Increase (Decrease) in Net Assets | ||||
| Operations | ||||
| Net investment income (loss) | $ | 184,830 | $ | 237,655 |
| Net realized gain (loss) | (75,979) | (83,891) | ||
| Change in net unrealized appreciation (depreciation) | 305,383 | (119,914) | ||
| Net increase (decrease) in net assets resulting from operations | 414,234 | 33,850 | ||
| Distributions to shareholders | (178,041) | (339,967) | ||
| Share transactions - net increase (decrease) | (920,306) | (232,213) | ||
| Total increase (decrease) in net assets | (684,113) | (538,330) | ||
| Net Assets | ||||
| Beginning of period | 6,156,576 | 6,694,906 | ||
| End of period | $ | 5,472,463 | $ | 6,156,576 |
Fidelity Advisor Managed Retirement 2010 Fund℠ Class A |
| Years ended July 31, | 2024 | 2023 | 2022 | 2021 | 2020 | |||||
Selected Per-Share Data | ||||||||||
| Net asset value, beginning of period | $ | 51.60 | $ | 54.07 | $ | 62.41 | $ | 58.79 | $ | 56.34 |
| Income from Investment Operations | ||||||||||
Net investment income (loss) A,B | 1.434 | 1.772 | 1.275 | .342 | .777 | |||||
| Net realized and unrealized gain (loss) | 2.102 | (1.646) | (6.182) | 5.126 | 3.204 | |||||
| Total from investment operations | 3.536 | .126 | (4.907) | 5.468 | 3.981 | |||||
| Distributions from net investment income | (1.363) | (1.726) | (1.207) | (.379) | (.812) | |||||
| Distributions from net realized gain | (.013) | (.870) | (2.226) | (1.469) | (.719) | |||||
| Total distributions | (1.376) | (2.596) | (3.433) | (1.848) | (1.531) | |||||
| Net asset value, end of period | $ | 53.76 | $ | 51.60 | $ | 54.07 | $ | 62.41 | $ | 58.79 |
Total Return C,D | 6.98 % | .45% | (8.32)% | 9.46% | 7.19% | |||||
Ratios to Average Net Assets B,E,F | ||||||||||
| Expenses before reductions | .70% | .71% | .71% | .71% | .71% | |||||
| Expenses net of fee waivers, if any | .70 % | .71% | .71% | .71% | .71% | |||||
| Expenses net of all reductions | .70% | .71% | .71% | .71% | .71% | |||||
| Net investment income (loss) | 2.78% | 3.48% | 2.21% | .56% | 1.37% | |||||
| Supplemental Data | ||||||||||
| Net assets, end of period (000 omitted) | $ | 165 | $ | 241 | $ | 325 | $ | 394 | $ | 188 |
Portfolio turnover rate G | 25 % | 22% | 54% | 41% | 45% |
Fidelity Managed Retirement 2010 Fund℠ |
| Years ended July 31, | 2024 | 2023 | 2022 | 2021 | 2020 | |||||
Selected Per-Share Data | ||||||||||
| Net asset value, beginning of period | $ | 51.64 | $ | 54.12 | $ | 62.47 | $ | 58.82 | $ | 56.37 |
| Income from Investment Operations | ||||||||||
Net investment income (loss) A,B | 1.614 | 1.899 | 1.421 | .493 | .920 | |||||
| Net realized and unrealized gain (loss) | 2.052 | (1.652) | (6.181) | 5.129 | 3.204 | |||||
| Total from investment operations | 3.666 | .247 | (4.760) | 5.622 | 4.124 | |||||
| Distributions from net investment income | (1.513) | (1.857) | (1.364) | (.503) | (.955) | |||||
| Distributions from net realized gain | (.013) | (.870) | (2.226) | (1.469) | (.719) | |||||
| Total distributions | (1.526) | (2.727) | (3.590) | (1.972) | (1.674) | |||||
| Net asset value, end of period | $ | 53.78 | $ | 51.64 | $ | 54.12 | $ | 62.47 | $ | 58.82 |
Total Return C | 7.25 % | .69% | (8.08)% | 9.73% | 7.46% | |||||
Ratios to Average Net Assets B,D,E | ||||||||||
| Expenses before reductions | .45% | .46% | .46% | .46% | .46% | |||||
| Expenses net of fee waivers, if any | .45 % | .46% | .46% | .46% | .46% | |||||
| Expenses net of all reductions | .45% | .46% | .46% | .46% | .46% | |||||
| Net investment income (loss) | 3.13% | 3.73% | 2.46% | .81% | 1.62% | |||||
| Supplemental Data | ||||||||||
| Net assets, end of period (000 omitted) | $ | 4,291 | $ | 5,239 | $ | 5,655 | $ | 6,728 | $ | 7,144 |
Portfolio turnover rate F | 25 % | 22% | 54% | 41% | 45% |
Fidelity Managed Retirement 2010 Fund℠ Class K |
| Years ended July 31, | 2024 | 2023 | 2022 | 2021 | 2020 A | |||||
Selected Per-Share Data | ||||||||||
| Net asset value, beginning of period | $ | 51.62 | $ | 54.10 | $ | 62.45 | $ | 58.81 | $ | 56.39 |
| Income from Investment Operations | ||||||||||
Net investment income (loss) B,C | 1.614 | 1.947 | 1.474 | .554 | .976 | |||||
| Net realized and unrealized gain (loss) | 2.107 | (1.646) | (6.173) | 5.122 | 3.182 | |||||
| Total from investment operations | 3.721 | .301 | (4.699) | 5.676 | 4.158 | |||||
| Distributions from net investment income | (1.568) | (1.911) | (1.425) | (.567) | (1.019) | |||||
| Distributions from net realized gain | (.013) | (.870) | (2.226) | (1.469) | (.719) | |||||
| Total distributions | (1.581) | (2.781) | (3.651) | (2.036) | (1.738) | |||||
| Net asset value, end of period | $ | 53.76 | $ | 51.62 | $ | 54.10 | $ | 62.45 | $ | 58.81 |
Total Return D,E | 7.36 % | .80% | (7.99)% | 9.83% | 7.52% | |||||
Ratios to Average Net Assets C,F,G | ||||||||||
| Expenses before reductions | .35% | .36% | .36% | .36% | .36% | |||||
| Expenses net of fee waivers, if any | .35 % | .36% | .36% | .36% | .36% | |||||
| Expenses net of all reductions | .35% | .36% | .36% | .36% | .36% | |||||
| Net investment income (loss) | 3.13% | 3.83% | 2.56% | .91% | 1.72% | |||||
| Supplemental Data | ||||||||||
| Net assets, end of period (000 omitted) | $ | 118 | $ | 129 | $ | 109 | $ | 118 | $ | 108 |
Portfolio turnover rate H | 25 % | 22% | 54% | 41% | 45% |
Fidelity Managed Retirement 2010 Fund℠ Class K6 |
| Years ended July 31, | 2024 | 2023 | 2022 | 2021 | 2020 A | |||||
Selected Per-Share Data | ||||||||||
| Net asset value, beginning of period | $ | 51.62 | $ | 54.10 | $ | 62.46 | $ | 58.82 | $ | 56.39 |
| Income from Investment Operations | ||||||||||
Net investment income (loss) B,C | 1.720 | 2.000 | 1.503 | .615 | 1.029 | |||||
| Net realized and unrealized gain (loss) | 2.050 | (1.650) | (6.145) | 5.120 | 3.191 | |||||
| Total from investment operations | 3.770 | .350 | (4.642) | 5.735 | 4.220 | |||||
| Distributions from net investment income | (1.627) | (1.960) | (1.492) | (.626) | (1.071) | |||||
| Distributions from net realized gain | (.013) | (.870) | (2.226) | (1.469) | (.719) | |||||
| Total distributions | (1.640) | (2.830) | (3.718) | (2.095) | (1.790) | |||||
| Net asset value, end of period | $ | 53.75 | $ | 51.62 | $ | 54.10 | $ | 62.46 | $ | 58.82 |
Total Return D,E | 7.47 % | .90% | (7.90)% | 9.94% | 7.64% | |||||
Ratios to Average Net Assets B,F,G | ||||||||||
| Expenses before reductions | .25% | .26% | .26% | .26% | .26% | |||||
| Expenses net of fee waivers, if any | .25 % | .26% | .26% | .26% | .26% | |||||
| Expenses net of all reductions | .25% | .26% | .26% | .26% | .26% | |||||
| Net investment income (loss) | 3.33% | 3.93% | 2.65% | 1.01% | 1.82% | |||||
| Supplemental Data | ||||||||||
| Net assets, end of period (000 omitted) | $ | 799 | $ | 290 | $ | 337 | $ | 174 | $ | 160 |
Portfolio turnover rate H | 25 % | 22% | 54% | 41% | 45% |
Fidelity Advisor Managed Retirement 2010 Fund℠ Class I |
| Years ended July 31, | 2024 | 2023 | 2022 | 2021 | 2020 | |||||
Selected Per-Share Data | ||||||||||
| Net asset value, beginning of period | $ | 51.63 | $ | 54.11 | $ | 62.46 | $ | 58.82 | $ | 56.36 |
| Income from Investment Operations | ||||||||||
Net investment income (loss) A,B | 1.563 | 1.898 | 1.417 | .493 | .919 | |||||
| Net realized and unrealized gain (loss) | 2.108 | (1.652) | (6.176) | 5.120 | 3.213 | |||||
| Total from investment operations | 3.671 | .246 | (4.759) | 5.613 | 4.132 | |||||
| Distributions from net investment income | (1.518) | (1.856) | (1.365) | (.504) | (.953) | |||||
| Distributions from net realized gain | (.013) | (.870) | (2.226) | (1.469) | (.719) | |||||
| Total distributions | (1.531) | (2.726) | (3.591) | (1.973) | (1.672) | |||||
| Net asset value, end of period | $ | 53.77 | $ | 51.63 | $ | 54.11 | $ | 62.46 | $ | 58.82 |
Total Return C | 7.26 % | .69% | (8.08)% | 9.72% | 7.47% | |||||
Ratios to Average Net Assets B,D,E | ||||||||||
| Expenses before reductions | .45% | .46% | .46% | .46% | .46% | |||||
| Expenses net of fee waivers, if any | .45 % | .46% | .46% | .46% | .46% | |||||
| Expenses net of all reductions | .45% | .46% | .46% | .46% | .46% | |||||
| Net investment income (loss) | 3.03% | 3.73% | 2.46% | .81% | 1.62% | |||||
| Supplemental Data | ||||||||||
| Net assets, end of period (000 omitted) | $ | 100 | $ | 93 | $ | 103 | $ | 113 | $ | 113 |
Portfolio turnover rate F | 25 % | 22% | 54% | 41% | 45% |
| Domestic Equity Funds - 13.9% | |||
| Shares | Value ($) | ||
| Fidelity Series Blue Chip Growth Fund (a) | 8,624 | 164,978 | |
| Fidelity Series Commodity Strategy Fund (a) | 495 | 46,407 | |
| Fidelity Series Large Cap Growth Index Fund (a) | 4,647 | 105,432 | |
| Fidelity Series Large Cap Stock Fund (a) | 4,168 | 97,026 | |
| Fidelity Series Large Cap Value Index Fund (a) | 12,111 | 199,472 | |
| Fidelity Series Small Cap Core Fund (a) | 3,985 | 49,536 | |
| Fidelity Series Small Cap Opportunities Fund (a) | 1,914 | 31,085 | |
| Fidelity Series Value Discovery Fund (a) | 4,344 | 69,851 | |
| TOTAL DOMESTIC EQUITY FUNDS (Cost $540,140) | 763,787 | ||
| International Equity Funds - 16.7% | |||
| Shares | Value ($) | ||
| Fidelity Series Canada Fund (a) | 3,226 | 50,838 | |
| Fidelity Series Emerging Markets Fund (a) | 7,731 | 70,737 | |
| Fidelity Series Emerging Markets Opportunities Fund (a) | 15,096 | 283,344 | |
| Fidelity Series International Growth Fund (a) | 6,875 | 127,469 | |
| Fidelity Series International Index Fund (a) | 3,758 | 47,992 | |
| Fidelity Series International Small Cap Fund (a) | 4,543 | 82,363 | |
| Fidelity Series International Value Fund (a) | 9,675 | 126,743 | |
| Fidelity Series Overseas Fund (a) | 8,772 | 126,667 | |
| TOTAL INTERNATIONAL EQUITY FUNDS (Cost $721,132) | 916,153 | ||
| Bond Funds - 66.3% | |||
| Shares | Value ($) | ||
| Fidelity Series 0-5 Year Inflation-Protected Bond Index Fund (a) | 85,407 | 827,592 | |
| Fidelity Series 5+ Year Inflation-Protected Bond Index Fund (a) | 20,164 | 156,268 | |
| Fidelity Series Corporate Bond Fund (a) | 46,634 | 435,559 | |
| Fidelity Series Emerging Markets Debt Fund (a) | 3,634 | 28,748 | |
| Fidelity Series Emerging Markets Debt Local Currency Fund (a) | 1,011 | 9,149 | |
| Fidelity Series Floating Rate High Income Fund (a) | 611 | 5,484 | |
| Fidelity Series Government Bond Index Fund (a) | 73,257 | 674,695 | |
| Fidelity Series High Income Fund (a) | 3,483 | 29,711 | |
| Fidelity Series International Credit Fund (a) | 303 | 2,487 | |
| Fidelity Series International Developed Markets Bond Index Fund (a) | 24,931 | 216,649 | |
| Fidelity Series Investment Grade Bond Fund (a) | 65,287 | 658,088 | |
| Fidelity Series Investment Grade Securitized Fund (a) | 47,352 | 425,696 | |
| Fidelity Series Long-Term Treasury Bond Index Fund (a) | 27,627 | 156,643 | |
| Fidelity Series Real Estate Income Fund (a) | 550 | 5,424 | |
| TOTAL BOND FUNDS (Cost $3,930,669) | 3,632,193 | ||
| Short-Term Funds - 3.1% | |||
| Shares | Value ($) | ||
| Fidelity Series Government Money Market Fund 5.42% (a)(b) | 33,785 | 33,785 | |
| Fidelity Series Short-Term Credit Fund (a) | 3,439 | 34,257 | |
| Fidelity Series Treasury Bill Index Fund (a) | 10,224 | 101,631 | |
| TOTAL SHORT-TERM FUNDS (Cost $169,534) | 169,673 | ||
| TOTAL INVESTMENT IN SECURITIES - 100.0% (Cost $5,361,475) | 5,481,806 |
NET OTHER ASSETS (LIABILITIES) - 0.0% | (2,248) |
| NET ASSETS - 100.0% | 5,479,558 |
| (a) | Affiliated Fund |
| (b) | The rate quoted is the annualized seven-day yield of the fund at period end. |
| Affiliate | Value, beginning of period ($) | Purchases ($) | Sales Proceeds ($) | Dividend Income ($) | Realized Gain (loss) ($) | Change in Unrealized appreciation (depreciation) ($) | Value, end of period ($) |
| Fidelity Series 0-5 Year Inflation-Protected Bond Index Fund | 913,699 | 260,207 | 364,366 | 29,189 | (11,011) | 29,063 | 827,592 |
| Fidelity Series 5+ Year Inflation-Protected Bond Index Fund | 205,342 | 32,787 | 77,256 | 7,695 | (16,240) | 11,635 | 156,268 |
| Fidelity Series Blue Chip Growth Fund | 158,062 | 68,496 | 106,163 | 852 | 5,654 | 38,929 | 164,978 |
| Fidelity Series Canada Fund | 58,763 | 15,070 | 26,397 | 1,729 | 4,208 | (806) | 50,838 |
| Fidelity Series Commodity Strategy Fund | 47,955 | 24,354 | 21,750 | 1,821 | (1,564) | (2,588) | 46,407 |
| Fidelity Series Corporate Bond Fund | 483,851 | 131,080 | 191,293 | 20,126 | (16,889) | 28,810 | 435,559 |
| Fidelity Series Emerging Markets Debt Fund | 32,880 | 7,086 | 12,533 | 1,913 | (739) | 2,054 | 28,748 |
| Fidelity Series Emerging Markets Debt Local Currency Fund | 11,156 | 2,335 | 3,663 | 679 | (401) | (278) | 9,149 |
| Fidelity Series Emerging Markets Fund | 70,089 | 36,349 | 38,471 | 1,622 | (1,835) | 4,605 | 70,737 |
| Fidelity Series Emerging Markets Opportunities Fund | 303,349 | 129,236 | 157,544 | 7,489 | (7,281) | 15,584 | 283,344 |
| Fidelity Series Floating Rate High Income Fund | 6,448 | 1,830 | 2,788 | 569 | 16 | (22) | 5,484 |
| Fidelity Series Government Bond Index Fund | 703,521 | 218,159 | 252,752 | 21,317 | (21,506) | 27,273 | 674,695 |
| Fidelity Series Government Money Market Fund 5.42% | 113,784 | 20,809 | 100,808 | 3,516 | - | - | 33,785 |
| Fidelity Series High Income Fund | 34,568 | 6,911 | 12,632 | 2,036 | (1,292) | 2,156 | 29,711 |
| Fidelity Series International Credit Fund | 2,232 | 100 | - | 100 | - | 155 | 2,487 |
| Fidelity Series International Developed Markets Bond Index Fund | 250,310 | 53,944 | 91,202 | 8,417 | (8,534) | 12,131 | 216,649 |
| Fidelity Series International Growth Fund | 148,236 | 39,780 | 73,684 | 1,669 | 2,871 | 10,266 | 127,469 |
| Fidelity Series International Index Fund | 56,036 | 13,799 | 25,423 | 1,375 | 2,105 | 1,475 | 47,992 |
| Fidelity Series International Small Cap Fund | 46,495 | 63,973 | 41,873 | 3,106 | 658 | 13,110 | 82,363 |
| Fidelity Series International Value Fund | 149,252 | 35,288 | 74,998 | 4,155 | 7,144 | 10,057 | 126,743 |
| Fidelity Series Investment Grade Bond Fund | 718,888 | 197,319 | 266,629 | 28,801 | (24,755) | 33,265 | 658,088 |
| Fidelity Series Investment Grade Securitized Fund | 488,006 | 121,803 | 188,476 | 18,935 | (17,715) | 22,078 | 425,696 |
| Fidelity Series Large Cap Growth Index Fund | 99,840 | 45,422 | 64,407 | 778 | 11,175 | 13,402 | 105,432 |
| Fidelity Series Large Cap Stock Fund | 110,718 | 46,260 | 78,654 | 5,399 | 11,404 | 7,298 | 97,026 |
| Fidelity Series Large Cap Value Index Fund | 205,725 | 92,992 | 118,235 | 7,455 | 8,401 | 10,589 | 199,472 |
| Fidelity Series Long-Term Treasury Bond Index Fund | 258,683 | 72,546 | 164,982 | 7,430 | (51,325) | 41,721 | 156,643 |
| Fidelity Series Overseas Fund | 148,400 | 35,233 | 72,506 | 2,124 | 8,345 | 7,195 | 126,667 |
| Fidelity Series Real Estate Income Fund | 8,943 | 1,357 | 4,916 | 455 | (331) | 371 | 5,424 |
| Fidelity Series Short-Term Credit Fund | 76,378 | 6,966 | 50,801 | 1,877 | (793) | 2,507 | 34,257 |
| Fidelity Series Small Cap Core Fund | 555 | 47,992 | 1,767 | 17 | 24 | 2,732 | 49,536 |
| Fidelity Series Small Cap Opportunities Fund | 50,622 | 19,080 | 46,824 | 488 | 7,422 | 785 | 31,085 |
| Fidelity Series Treasury Bill Index Fund | 316,813 | 76,683 | 291,703 | 10,296 | (1,115) | 953 | 101,631 |
| Fidelity Series Value Discovery Fund | 75,895 | 33,590 | 43,280 | 3,472 | 2,334 | 1,312 | 69,851 |
| 6,355,494 | 1,958,836 | 3,068,776 | 206,902 | (111,565) | 347,817 | 5,481,806 |
| Valuation Inputs at Reporting Date: | ||||
| Description | Total ($) | Level 1 ($) | Level 2 ($) | Level 3 ($) |
Investments in Securities: | ||||
| Domestic Equity Funds | 763,787 | 763,787 | - | - |
| International Equity Funds | 916,153 | 916,153 | - | - |
| Bond Funds | 3,632,193 | 3,632,193 | - | - |
| Short-Term Funds | 169,673 | 169,673 | - | - |
| Total Investments in Securities: | 5,481,806 | 5,481,806 | - | - |
| Statement of Assets and Liabilities | ||||
As of July 31, 2024 | ||||
| Assets | ||||
| Investment in securities, at value - See accompanying schedule: | ||||
Affiliated issuers (cost $5,361,475) | $ | 5,481,806 | ||
| Total Investment in Securities (cost $5,361,475) | $ | 5,481,806 | ||
| Cash | 6 | |||
| Receivable for investments sold | 37,493 | |||
Total assets | 5,519,305 | |||
| Liabilities | ||||
| Payable for investments purchased | $ | 37,005 | ||
| Payable for fund shares redeemed | 486 | |||
| Accrued management fee | 2,046 | |||
| Distribution and service plan fees payable | 210 | |||
| Total liabilities | 39,747 | |||
| Net Assets | $ | 5,479,558 | ||
| Net Assets consist of: | ||||
| Paid in capital | $ | 5,633,468 | ||
| Total accumulated earnings (loss) | (153,910) | |||
| Net Assets | $ | 5,479,558 | ||
| Net Asset Value and Maximum Offering Price | ||||
| Class A : | ||||
Net Asset Value and redemption price per share ($1,013,922 ÷ 19,128.36 shares)(a) | $ | 53.01 | ||
| Maximum offering price per share (100/94.25 of $53.01) | $ | 56.24 | ||
| Fidelity Managed Retirement 2015 : | ||||
Net Asset Value, offering price and redemption price per share ($3,704,017 ÷ 69,812.85 shares) | $ | 53.06 | ||
| Class K : | ||||
Net Asset Value, offering price and redemption price per share ($122,092 ÷ 2,301.87 shares) | $ | 53.04 | ||
| Class K6 : | ||||
Net Asset Value, offering price and redemption price per share ($485,700 ÷ 9,155.96 shares) | $ | 53.05 | ||
| Class I : | ||||
Net Asset Value, offering price and redemption price per share ($153,827 ÷ 2,898.37 shares) | $ | 53.07 | ||
(a)Redemption price per share is equal to net asset value less any applicable contingent deferred sales charge. | ||||
| Statement of Operations | ||||
| Year ended July 31, 2024 | ||||
| Investment Income | ||||
| Dividends: | ||||
| Affiliated issuers | $ | 196,389 | ||
| Expenses | ||||
| Management fee | $ | 25,594 | ||
| Distribution and service plan fees | 2,497 | |||
| Independent trustees' fees and expenses | 18 | |||
| Miscellaneous | 55 | |||
| Total expenses | 28,164 | |||
| Net Investment income (loss) | 168,225 | |||
| Realized and Unrealized Gain (Loss) | ||||
| Net realized gain (loss) on: | ||||
| Investment Securities: | ||||
| Affiliated issuers | (111,565) | |||
| Capital gain distributions from underlying funds: | ||||
| Affiliated issuers | 10,513 | |||
| Total net realized gain (loss) | (101,052) | |||
| Change in net unrealized appreciation (depreciation) on: | ||||
| Investment Securities: | ||||
| Affiliated issuers | 347,817 | |||
| Total change in net unrealized appreciation (depreciation) | 347,817 | |||
| Net gain (loss) | 246,765 | |||
| Net increase (decrease) in net assets resulting from operations | $ | 414,990 | ||
| Statement of Changes in Net Assets | ||||
Year ended July 31, 2024 | Year ended July 31, 2023 | |||
| Increase (Decrease) in Net Assets | ||||
| Operations | ||||
| Net investment income (loss) | $ | 168,225 | $ | 236,247 |
| Net realized gain (loss) | (101,052) | (80,553) | ||
| Change in net unrealized appreciation (depreciation) | 347,817 | (81,038) | ||
| Net increase (decrease) in net assets resulting from operations | 414,990 | 74,656 | ||
| Distributions to shareholders | (160,658) | (338,146) | ||
| Share transactions - net increase (decrease) | (1,129,926) | (729,610) | ||
| Total increase (decrease) in net assets | (875,594) | (993,100) | ||
| Net Assets | ||||
| Beginning of period | 6,355,152 | 7,348,252 | ||
| End of period | $ | 5,479,558 | $ | 6,355,152 |
Fidelity Advisor Managed Retirement 2015 Fund℠ Class A |
| Years ended July 31, | 2024 | 2023 | 2022 | 2021 | 2020 | |||||
Selected Per-Share Data | ||||||||||
| Net asset value, beginning of period | $ | 50.49 | $ | 52.42 | $ | 60.51 | $ | 55.51 | $ | 53.13 |
| Income from Investment Operations | ||||||||||
Net investment income (loss) A,B | 1.331 | 1.675 | 1.241 | .335 | .690 | |||||
| Net realized and unrealized gain (loss) | 2.489 | (1.158) | (6.395) | 6.385 | 3.244 | |||||
| Total from investment operations | 3.820 | .517 | (5.154) | 6.720 | 3.934 | |||||
| Distributions from net investment income | (1.281) | (1.647) | (1.207) | (.369) | (.769) | |||||
| Distributions from net realized gain | (.019) | (.800) | (1.729) | (1.351) | (.785) | |||||
| Total distributions | (1.300) | (2.447) | (2.936) | (1.720) | (1.554) | |||||
| Net asset value, end of period | $ | 53.01 | $ | 50.49 | $ | 52.42 | $ | 60.51 | $ | 55.51 |
Total Return C,D | 7.71 % | 1.25% | (8.96)% | 12.31% | 7.54% | |||||
Ratios to Average Net Assets B,E,F | ||||||||||
| Expenses before reductions | .71% | .71% | .71% | .72% | .72% | |||||
| Expenses net of fee waivers, if any | .71 % | .71% | .71% | .72% | .72% | |||||
| Expenses net of all reductions | .71% | .71% | .71% | .72% | .72% | |||||
| Net investment income (loss) | 2.63% | 3.39% | 2.20% | .58% | 1.30% | |||||
| Supplemental Data | ||||||||||
| Net assets, end of period (000 omitted) | $ | 1,014 | $ | 1,043 | $ | 1,242 | $ | 1,461 | $ | 1,024 |
Portfolio turnover rate G | 34 % | 23% | 60% | 32% | 61% |
Fidelity Managed Retirement 2015 Fund℠ |
| Years ended July 31, | 2024 | 2023 | 2022 | 2021 | 2020 | |||||
Selected Per-Share Data | ||||||||||
| Net asset value, beginning of period | $ | 50.53 | $ | 52.47 | $ | 60.56 | $ | 55.53 | $ | 53.11 |
| Income from Investment Operations | ||||||||||
Net investment income (loss) A,B | 1.498 | 1.799 | 1.389 | .481 | .825 | |||||
| Net realized and unrealized gain (loss) | 2.458 | (1.166) | (6.410) | 6.395 | 3.250 | |||||
| Total from investment operations | 3.956 | .633 | (5.021) | 6.876 | 4.075 | |||||
| Distributions from net investment income | (1.407) | (1.773) | (1.340) | (.495) | (.870) | |||||
| Distributions from net realized gain | (.019) | (.800) | (1.729) | (1.351) | (.785) | |||||
| Total distributions | (1.426) | (2.573) | (3.069) | (1.846) | (1.655) | |||||
| Net asset value, end of period | $ | 53.06 | $ | 50.53 | $ | 52.47 | $ | 60.56 | $ | 55.53 |
Total Return C | 7.99 % | 1.49% | (8.74)% | 12.60% | 7.83% | |||||
Ratios to Average Net Assets B,D,E | ||||||||||
| Expenses before reductions | .46% | .46% | .46% | .47% | .47% | |||||
| Expenses net of fee waivers, if any | .46 % | .46% | .46% | .47% | .47% | |||||
| Expenses net of all reductions | .46% | .46% | .46% | .47% | .47% | |||||
| Net investment income (loss) | 2.96% | 3.64% | 2.45% | .83% | 1.55% | |||||
| Supplemental Data | ||||||||||
| Net assets, end of period (000 omitted) | $ | 3,704 | $ | 4,612 | $ | 4,768 | $ | 6,736 | $ | 5,155 |
Portfolio turnover rate F | 34 % | 23% | 60% | 32% | 61% |
Fidelity Managed Retirement 2015 Fund℠ Class K |
| Years ended July 31, | 2024 | 2023 | 2022 | 2021 | 2020 A | |||||
Selected Per-Share Data | ||||||||||
| Net asset value, beginning of period | $ | 50.52 | $ | 52.46 | $ | 60.55 | $ | 55.52 | $ | 53.08 |
| Income from Investment Operations | ||||||||||
Net investment income (loss) B,C | 1.505 | 1.845 | 1.436 | .539 | .879 | |||||
| Net realized and unrealized gain (loss) | 2.492 | (1.158) | (6.395) | 6.392 | 3.270 | |||||
| Total from investment operations | 3.997 | .687 | (4.959) | 6.931 | 4.149 | |||||
| Distributions from net investment income | (1.458) | (1.827) | (1.402) | (.550) | (.924) | |||||
| Distributions from net realized gain | (.019) | (.800) | (1.729) | (1.351) | (.785) | |||||
| Total distributions | (1.477) | (2.627) | (3.131) | (1.901) | (1.709) | |||||
| Net asset value, end of period | $ | 53.04 | $ | 50.52 | $ | 52.46 | $ | 60.55 | $ | 55.52 |
Total Return D | 8.08 % | 1.60% | (8.64)% | 12.71% | 7.98% | |||||
Ratios to Average Net Assets C,E,F | ||||||||||
| Expenses before reductions | .36% | .36% | .36% | .37% | .37% | |||||
| Expenses net of fee waivers, if any | .36 % | .36% | .36% | .37% | .37% | |||||
| Expenses net of all reductions | .36% | .36% | .36% | .37% | .37% | |||||
| Net investment income (loss) | 2.98% | 3.74% | 2.55% | .93% | 1.65% | |||||
| Supplemental Data | ||||||||||
| Net assets, end of period (000 omitted) | $ | 122 | $ | 171 | $ | 111 | $ | 122 | $ | 108 |
Portfolio turnover rate G | 34 % | 23% | 60% | 32% | 61% |
Fidelity Managed Retirement 2015 Fund℠ Class K6 |
| Years ended July 31, | 2024 | 2023 | 2022 | 2021 | 2020 A | |||||
Selected Per-Share Data | ||||||||||
| Net asset value, beginning of period | $ | 50.55 | $ | 52.46 | $ | 60.56 | $ | 55.53 | $ | 53.08 |
| Income from Investment Operations | ||||||||||
Net investment income (loss) B,C | 1.624 | 1.920 | 1.434 | .597 | .932 | |||||
| Net realized and unrealized gain (loss) | 2.423 | (1.181) | (6.334) | 6.391 | 3.274 | |||||
| Total from investment operations | 4.047 | .739 | (4.900) | 6.988 | 4.206 | |||||
| Distributions from net investment income | (1.528) | (1.849) | (1.471) | (.607) | (.971) | |||||
| Distributions from net realized gain | (.019) | (.800) | (1.729) | (1.351) | (.785) | |||||
| Total distributions | (1.547) | (2.649) | (3.200) | (1.958) | (1.756) | |||||
| Net asset value, end of period | $ | 53.05 | $ | 50.55 | $ | 52.46 | $ | 60.56 | $ | 55.53 |
Total Return D,E | 8.18 % | 1.70% | (8.54)% | 12.82% | 8.09% | |||||
Ratios to Average Net Assets C,F,G | ||||||||||
| Expenses before reductions | .26% | .26% | .26% | .27% | .27% | |||||
| Expenses net of fee waivers, if any | .26 % | .26% | .26% | .27% | .27% | |||||
| Expenses net of all reductions | .26% | .25% | .26% | .27% | .27% | |||||
| Net investment income (loss) | 3.20% | 3.85% | 2.65% | 1.03% | 1.75% | |||||
| Supplemental Data | ||||||||||
| Net assets, end of period (000 omitted) | $ | 486 | $ | 162 | $ | 837 | $ | 204 | $ | 112 |
Portfolio turnover rate H | 34 % | 23% | 60% | 32% | 61% |
Fidelity Advisor Managed Retirement 2015 Fund℠ Class I |
| Years ended July 31, | 2024 | 2023 | 2022 | 2021 | 2020 | |||||
Selected Per-Share Data | ||||||||||
| Net asset value, beginning of period | $ | 50.54 | $ | 52.48 | $ | 60.57 | $ | 55.54 | $ | 53.12 |
| Income from Investment Operations | ||||||||||
Net investment income (loss) A,B | 1.458 | 1.799 | 1.376 | .481 | .827 | |||||
| Net realized and unrealized gain (loss) | 2.491 | (1.168) | (6.387) | 6.390 | 3.242 | |||||
| Total from investment operations | 3.949 | .631 | (5.011) | 6.871 | 4.069 | |||||
| Distributions from net investment income | (1.400) | (1.771) | (1.350) | (.490) | (.864) | |||||
| Distributions from net realized gain | (.019) | (.800) | (1.729) | (1.351) | (.785) | |||||
| Total distributions | (1.419) | (2.571) | (3.079) | (1.841) | (1.649) | |||||
| Net asset value, end of period | $ | 53.07 | $ | 50.54 | $ | 52.48 | $ | 60.57 | $ | 55.54 |
Total Return C | 7.97 % | 1.48% | (8.72)% | 12.59% | 7.81% | |||||
Ratios to Average Net Assets B,D,E | ||||||||||
| Expenses before reductions | .46% | .46% | .46% | .47% | .47% | |||||
| Expenses net of fee waivers, if any | .46 % | .46% | .46% | .47% | .47% | |||||
| Expenses net of all reductions | .46% | .46% | .46% | .47% | .47% | |||||
| Net investment income (loss) | 2.88% | 3.64% | 2.45% | .83% | 1.55% | |||||
| Supplemental Data | ||||||||||
| Net assets, end of period (000 omitted) | $ | 154 | $ | 253 | $ | 279 | $ | 278 | $ | 274 |
Portfolio turnover rate F | 34 % | 23% | 60% | 32% | 61% |
| Domestic Equity Funds - 17.8% | |||
| Shares | Value ($) | ||
| Fidelity Series Blue Chip Growth Fund (a) | 17,203 | 329,095 | |
| Fidelity Series Commodity Strategy Fund (a) | 755 | 70,740 | |
| Fidelity Series Large Cap Growth Index Fund (a) | 9,295 | 210,905 | |
| Fidelity Series Large Cap Stock Fund (a) | 8,271 | 192,551 | |
| Fidelity Series Large Cap Value Index Fund (a) | 24,039 | 395,918 | |
| Fidelity Series Small Cap Core Fund (a) | 7,812 | 97,109 | |
| Fidelity Series Small Cap Opportunities Fund (a) | 3,678 | 59,725 | |
| Fidelity Series Value Discovery Fund (a) | 8,622 | 138,644 | |
| TOTAL DOMESTIC EQUITY FUNDS (Cost $1,072,886) | 1,494,687 | ||
| International Equity Funds - 19.3% | |||
| Shares | Value ($) | ||
| Fidelity Series Canada Fund (a) | 5,978 | 94,208 | |
| Fidelity Series Emerging Markets Fund (a) | 13,189 | 120,679 | |
| Fidelity Series Emerging Markets Opportunities Fund (a) | 25,749 | 483,302 | |
| Fidelity Series International Growth Fund (a) | 12,741 | 236,212 | |
| Fidelity Series International Index Fund (a) | 6,963 | 88,913 | |
| Fidelity Series International Small Cap Fund (a) | 6,986 | 126,651 | |
| Fidelity Series International Value Fund (a) | 17,927 | 234,844 | |
| Fidelity Series Overseas Fund (a) | 16,254 | 234,706 | |
| TOTAL INTERNATIONAL EQUITY FUNDS (Cost $1,306,885) | 1,619,515 | ||
| Bond Funds - 61.7% | |||
| Shares | Value ($) | ||
| Fidelity Series 0-5 Year Inflation-Protected Bond Index Fund (a) | 95,562 | 925,994 | |
| Fidelity Series 5+ Year Inflation-Protected Bond Index Fund (a) | 51,169 | 396,560 | |
| Fidelity Series Corporate Bond Fund (a) | 66,610 | 622,136 | |
| Fidelity Series Emerging Markets Debt Fund (a) | 5,575 | 44,097 | |
| Fidelity Series Emerging Markets Debt Local Currency Fund (a) | 1,523 | 13,779 | |
| Fidelity Series Floating Rate High Income Fund (a) | 932 | 8,373 | |
| Fidelity Series Government Bond Index Fund (a) | 104,635 | 963,691 | |
| Fidelity Series High Income Fund (a) | 5,321 | 45,387 | |
| Fidelity Series International Credit Fund (a) | 242 | 1,993 | |
| Fidelity Series International Developed Markets Bond Index Fund (a) | 38,230 | 332,217 | |
| Fidelity Series Investment Grade Bond Fund (a) | 93,252 | 939,979 | |
| Fidelity Series Investment Grade Securitized Fund (a) | 67,636 | 608,044 | |
| Fidelity Series Long-Term Treasury Bond Index Fund (a) | 44,750 | 253,731 | |
| Fidelity Series Real Estate Income Fund (a) | 840 | 8,288 | |
| TOTAL BOND FUNDS (Cost $5,636,512) | 5,164,269 | ||
| Short-Term Funds - 1.2% | |||
| Shares | Value ($) | ||
| Fidelity Series Government Money Market Fund 5.42% (a)(b) | 18,753 | 18,753 | |
| Fidelity Series Short-Term Credit Fund (a) | 2,055 | 20,472 | |
| Fidelity Series Treasury Bill Index Fund (a) | 5,772 | 57,379 | |
| TOTAL SHORT-TERM FUNDS (Cost $96,390) | 96,604 | ||
| TOTAL INVESTMENT IN SECURITIES - 100.0% (Cost $8,112,673) | 8,375,075 |
NET OTHER ASSETS (LIABILITIES) - 0.0% | (3,153) |
| NET ASSETS - 100.0% | 8,371,922 |
| (a) | Affiliated Fund |
| (b) | The rate quoted is the annualized seven-day yield of the fund at period end. |
| Affiliate | Value, beginning of period ($) | Purchases ($) | Sales Proceeds ($) | Dividend Income ($) | Realized Gain (loss) ($) | Change in Unrealized appreciation (depreciation) ($) | Value, end of period ($) |
| Fidelity Series 0-5 Year Inflation-Protected Bond Index Fund | 903,622 | 284,268 | 281,946 | 32,268 | (4,336) | 24,386 | 925,994 |
| Fidelity Series 5+ Year Inflation-Protected Bond Index Fund | 448,419 | 81,518 | 125,983 | 19,008 | (24,849) | 17,455 | 396,560 |
| Fidelity Series Blue Chip Growth Fund | 295,007 | 104,623 | 164,182 | 1,693 | 15,503 | 78,144 | 329,095 |
| Fidelity Series Canada Fund | 96,684 | 25,657 | 35,365 | 3,325 | 3,853 | 3,379 | 94,208 |
| Fidelity Series Commodity Strategy Fund | 66,092 | 33,909 | 22,781 | 2,657 | (1,422) | (5,058) | 70,740 |
| Fidelity Series Corporate Bond Fund | 621,030 | 168,301 | 188,219 | 28,227 | (9,889) | 30,913 | 622,136 |
| Fidelity Series Emerging Markets Debt Fund | 45,311 | 10,312 | 13,864 | 2,878 | (1,138) | 3,476 | 44,097 |
| Fidelity Series Emerging Markets Debt Local Currency Fund | 15,382 | 3,547 | 4,186 | 1,066 | (342) | (622) | 13,779 |
| Fidelity Series Emerging Markets Fund | 116,200 | 48,297 | 49,465 | 2,875 | (624) | 6,271 | 120,679 |
| Fidelity Series Emerging Markets Opportunities Fund | 462,813 | 201,734 | 201,180 | 13,273 | (6,435) | 26,370 | 483,302 |
| Fidelity Series Floating Rate High Income Fund | 8,858 | 2,817 | 3,290 | 855 | 12 | (24) | 8,373 |
| Fidelity Series Government Bond Index Fund | 902,994 | 282,529 | 234,256 | 29,922 | (11,649) | 24,073 | 963,691 |
| Fidelity Series Government Money Market Fund 5.42% | 123,748 | 39,685 | 144,680 | 3,421 | - | - | 18,753 |
| Fidelity Series High Income Fund | 47,504 | 10,679 | 14,323 | 3,056 | (1,067) | 2,594 | 45,387 |
| Fidelity Series International Credit Fund | 1,789 | 80 | - | 80 | - | 124 | 1,993 |
| Fidelity Series International Developed Markets Bond Index Fund | 346,129 | 82,301 | 102,823 | 12,870 | (4,144) | 10,754 | 332,217 |
| Fidelity Series International Growth Fund | 243,958 | 66,400 | 102,583 | 3,209 | 2,767 | 25,670 | 236,212 |
| Fidelity Series International Index Fund | 92,199 | 23,046 | 33,978 | 2,644 | 2,786 | 4,860 | 88,913 |
| Fidelity Series International Small Cap Fund | 76,370 | 84,080 | 54,348 | 4,860 | 1,100 | 19,449 | 126,651 |
| Fidelity Series International Value Fund | 245,605 | 61,263 | 105,348 | 7,991 | 12,226 | 21,098 | 234,844 |
| Fidelity Series Investment Grade Bond Fund | 922,704 | 253,288 | 253,644 | 40,389 | (21,934) | 39,565 | 939,979 |
| Fidelity Series Investment Grade Securitized Fund | 626,368 | 156,935 | 185,786 | 26,565 | (15,047) | 25,574 | 608,044 |
| Fidelity Series Large Cap Growth Index Fund | 186,316 | 68,883 | 95,719 | 1,611 | 19,668 | 31,757 | 210,905 |
| Fidelity Series Large Cap Stock Fund | 206,623 | 70,835 | 124,196 | 10,879 | 21,318 | 17,971 | 192,551 |
| Fidelity Series Large Cap Value Index Fund | 383,990 | 157,909 | 188,094 | 15,905 | 12,107 | 30,006 | 395,918 |
| Fidelity Series Long-Term Treasury Bond Index Fund | 371,293 | 118,045 | 226,101 | 11,673 | (73,235) | 63,729 | 253,731 |
| Fidelity Series Overseas Fund | 244,227 | 59,155 | 101,228 | 4,085 | 11,765 | 20,787 | 234,706 |
| Fidelity Series Real Estate Income Fund | 12,187 | 2,025 | 6,035 | 675 | (309) | 420 | 8,288 |
| Fidelity Series Short-Term Credit Fund | 69,208 | 8,819 | 59,153 | 1,636 | (544) | 2,142 | 20,472 |
| Fidelity Series Small Cap Core Fund | 1,355 | 92,574 | 1,796 | 63 | 49 | 4,927 | 97,109 |
| Fidelity Series Small Cap Opportunities Fund | 94,427 | 23,314 | 75,272 | 984 | 9,614 | 7,642 | 59,725 |
| Fidelity Series Treasury Bill Index Fund | 335,280 | 92,823 | 370,502 | 9,983 | (1,184) | 962 | 57,379 |
| Fidelity Series Value Discovery Fund | 141,611 | 57,202 | 68,458 | 7,340 | 3,817 | 4,472 | 138,644 |
| 8,755,303 | 2,776,853 | 3,638,784 | 307,966 | (61,563) | 543,266 | 8,375,075 |
| Valuation Inputs at Reporting Date: | ||||
| Description | Total ($) | Level 1 ($) | Level 2 ($) | Level 3 ($) |
Investments in Securities: | ||||
| Domestic Equity Funds | 1,494,687 | 1,494,687 | - | - |
| International Equity Funds | 1,619,515 | 1,619,515 | - | - |
| Bond Funds | 5,164,269 | 5,164,269 | - | - |
| Short-Term Funds | 96,604 | 96,604 | - | - |
| Total Investments in Securities: | 8,375,075 | 8,375,075 | - | - |
| Statement of Assets and Liabilities | ||||
As of July 31, 2024 | ||||
| Assets | ||||
| Investment in securities, at value - See accompanying schedule: | ||||
Affiliated issuers (cost $8,112,673) | $ | 8,375,075 | ||
| Total Investment in Securities (cost $8,112,673) | $ | 8,375,075 | ||
| Cash | 41 | |||
| Receivable for investments sold | 65,329 | |||
| Receivable for fund shares sold | 97 | |||
Total assets | 8,440,542 | |||
| Liabilities | ||||
| Payable for investments purchased | $ | 65,192 | ||
| Payable for fund shares redeemed | 234 | |||
| Accrued management fee | 3,140 | |||
| Distribution and service plan fees payable | 43 | |||
| Other payables and accrued expenses | 11 | |||
| Total liabilities | 68,620 | |||
| Net Assets | $ | 8,371,922 | ||
| Net Assets consist of: | ||||
| Paid in capital | $ | 8,551,911 | ||
| Total accumulated earnings (loss) | (179,989) | |||
| Net Assets | $ | 8,371,922 | ||
| Net Asset Value and Maximum Offering Price | ||||
| Class A : | ||||
Net Asset Value and redemption price per share ($205,645 ÷ 3,815.83 shares)(a) | $ | 53.89 | ||
| Maximum offering price per share (100/94.25 of $53.89) | $ | 57.18 | ||
| Fidelity Managed Retirement 2020 : | ||||
Net Asset Value, offering price and redemption price per share ($6,803,039 ÷ 126,106.31 shares) | $ | 53.95 | ||
| Class K : | ||||
Net Asset Value, offering price and redemption price per share ($126,412 ÷ 2,342.89 shares) | $ | 53.96 | ||
| Class K6 : | ||||
Net Asset Value, offering price and redemption price per share ($1,074,318 ÷ 19,914.12 shares) | $ | 53.95 | ||
| Class I : | ||||
Net Asset Value, offering price and redemption price per share ($162,508 ÷ 3,010.56 shares) | $ | 53.98 | ||
(a)Redemption price per share is equal to net asset value less any applicable contingent deferred sales charge. | ||||
| Statement of Operations | ||||
| Year ended July 31, 2024 | ||||
| Investment Income | ||||
| Dividends: | ||||
| Affiliated issuers | $ | 286,665 | ||
| Expenses | ||||
| Management fee | $ | 38,515 | ||
| Distribution and service plan fees | 551 | |||
| Independent trustees' fees and expenses | 26 | |||
| Miscellaneous | 103 | |||
| Total expenses before reductions | 39,195 | |||
| Expense reductions | (2) | |||
| Total expenses after reductions | 39,193 | |||
| Net Investment income (loss) | 247,472 | |||
| Realized and Unrealized Gain (Loss) | ||||
| Net realized gain (loss) on: | ||||
| Investment Securities: | ||||
| Affiliated issuers | (61,563) | |||
| Capital gain distributions from underlying funds: | ||||
| Affiliated issuers | 21,301 | |||
| Total net realized gain (loss) | (40,262) | |||
| Change in net unrealized appreciation (depreciation) on: | ||||
| Investment Securities: | ||||
| Affiliated issuers | 543,266 | |||
| Total change in net unrealized appreciation (depreciation) | 543,266 | |||
| Net gain (loss) | 503,004 | |||
| Net increase (decrease) in net assets resulting from operations | $ | 750,476 | ||
| Statement of Changes in Net Assets | ||||
Year ended July 31, 2024 | Year ended July 31, 2023 | |||
| Increase (Decrease) in Net Assets | ||||
| Operations | ||||
| Net investment income (loss) | $ | 247,472 | $ | 330,675 |
| Net realized gain (loss) | (40,262) | (254,994) | ||
| Change in net unrealized appreciation (depreciation) | 543,266 | 57,861 | ||
| Net increase (decrease) in net assets resulting from operations | 750,476 | 133,542 | ||
| Distributions to shareholders | (239,352) | (360,184) | ||
| Share transactions - net increase (decrease) | (894,312) | (1,284,586) | ||
| Total increase (decrease) in net assets | (383,188) | (1,511,228) | ||
| Net Assets | ||||
| Beginning of period | 8,755,110 | 10,266,338 | ||
| End of period | $ | 8,371,922 | $ | 8,755,110 |
Fidelity Advisor Managed Retirement 2020 Fund℠ Class A |
| Years ended July 31, | 2024 | 2023 | 2022 | 2021 | 2020 | |||||
Selected Per-Share Data | ||||||||||
| Net asset value, beginning of period | $ | 50.93 | $ | 51.75 | $ | 59.83 | $ | 53.77 | $ | 51.34 |
| Income from Investment Operations | ||||||||||
Net investment income (loss) A,B | 1.310 | 1.630 | 1.245 | .327 | .639 | |||||
| Net realized and unrealized gain (loss) | 2.887 | (.705) | (6.741) | 7.664 | 3.282 | |||||
| Total from investment operations | 4.197 | .925 | (5.496) | 7.991 | 3.921 | |||||
| Distributions from net investment income | (1.211) | (1.571) | (1.232) | (.409) | (.754) | |||||
| Distributions from net realized gain | (.026) | (.174) | (1.352) | (1.522) | (.737) | |||||
| Total distributions | (1.237) | (1.745) | (2.584) | (1.931) | (1.491) | |||||
| Net asset value, end of period | $ | 53.89 | $ | 50.93 | $ | 51.75 | $ | 59.83 | $ | 53.77 |
Total Return C,D | 8.38 % | 2.03% | (9.62)% | 15.15% | 7.76% | |||||
Ratios to Average Net Assets B,E,F | ||||||||||
| Expenses before reductions | .72% | .72% | .72% | .72% | .72% | |||||
| Expenses net of fee waivers, if any | .72 % | .72% | .72% | .72% | .72% | |||||
| Expenses net of all reductions | .72% | .72% | .72% | .72% | .72% | |||||
| Net investment income (loss) | 2.57% | 3.30% | 2.22% | .57% | 1.26% | |||||
| Supplemental Data | ||||||||||
| Net assets, end of period (000 omitted) | $ | 206 | $ | 234 | $ | 509 | $ | 678 | $ | 155 |
Portfolio turnover rate G | 32 % | 28% | 67% | 35% | 69% |
Fidelity Managed Retirement 2020 Fund℠ |
| Years ended July 31, | 2024 | 2023 | 2022 | 2021 | 2020 | |||||
Selected Per-Share Data | ||||||||||
| Net asset value, beginning of period | $ | 51.00 | $ | 51.84 | $ | 59.92 | $ | 53.81 | $ | 51.35 |
| Income from Investment Operations | ||||||||||
Net investment income (loss) A,B | 1.462 | 1.755 | 1.389 | .470 | .777 | |||||
| Net realized and unrealized gain (loss) | 2.876 | (.706) | (6.758) | 7.671 | 3.281 | |||||
| Total from investment operations | 4.338 | 1.049 | (5.369) | 8.141 | 4.058 | |||||
| Distributions from net investment income | (1.362) | (1.715) | (1.359) | (.509) | (.861) | |||||
| Distributions from net realized gain | (.026) | (.174) | (1.352) | (1.522) | (.737) | |||||
| Total distributions | (1.388) | (1.889) | (2.711) | (2.031) | (1.598) | |||||
| Net asset value, end of period | $ | 53.95 | $ | 51.00 | $ | 51.84 | $ | 59.92 | $ | 53.81 |
Total Return C | 8.67 % | 2.29% | (9.40)% | 15.44% | 8.04% | |||||
Ratios to Average Net Assets B,D,E | ||||||||||
| Expenses before reductions | .47% | .47% | .47% | .47% | .47% | |||||
| Expenses net of fee waivers, if any | .47 % | .47% | .47% | .47% | .47% | |||||
| Expenses net of all reductions | .47% | .47% | .47% | .47% | .47% | |||||
| Net investment income (loss) | 2.86% | 3.55% | 2.47% | .82% | 1.51% | |||||
| Supplemental Data | ||||||||||
| Net assets, end of period (000 omitted) | $ | 6,803 | $ | 7,305 | $ | 8,171 | $ | 11,460 | $ | 6,193 |
Portfolio turnover rate F | 32 % | 28% | 67% | 35% | 69% |
Fidelity Managed Retirement 2020 Fund℠ Class K |
| Years ended July 31, | 2024 | 2023 | 2022 | 2021 | 2020 A | |||||
Selected Per-Share Data | ||||||||||
| Net asset value, beginning of period | $ | 51.01 | $ | 51.85 | $ | 59.93 | $ | 53.82 | $ | 51.28 |
| Income from Investment Operations | ||||||||||
Net investment income (loss) B,C | 1.486 | 1.804 | 1.439 | .526 | .829 | |||||
| Net realized and unrealized gain (loss) | 2.902 | (.698) | (6.752) | 7.661 | 3.357 | |||||
| Total from investment operations | 4.388 | 1.106 | (5.313) | 8.187 | 4.186 | |||||
| Distributions from net investment income | (1.412) | (1.772) | (1.415) | (.555) | (.909) | |||||
| Distributions from net realized gain | (.026) | (.174) | (1.352) | (1.522) | (.737) | |||||
| Total distributions | (1.438) | (1.946) | (2.767) | (2.077) | (1.646) | |||||
| Net asset value, end of period | $ | 53.96 | $ | 51.01 | $ | 51.85 | $ | 59.93 | $ | 53.82 |
Total Return D,E | 8.78 % | 2.41% | (9.31)% | 15.53% | 8.31% | |||||
Ratios to Average Net Assets C,F,G | ||||||||||
| Expenses before reductions | .37% | .37% | .37% | .37% | .37% | |||||
| Expenses net of fee waivers, if any | .37 % | .37% | .37% | .37% | .37% | |||||
| Expenses net of all reductions | .37% | .37% | .37% | .37% | .37% | |||||
| Net investment income (loss) | 2.92% | 3.65% | 2.57% | .92% | 1.61% | |||||
| Supplemental Data | ||||||||||
| Net assets, end of period (000 omitted) | $ | 126 | $ | 141 | $ | 113 | $ | 125 | $ | 108 |
Portfolio turnover rate H | 32 % | 28% | 67% | 35% | 69% |
Fidelity Managed Retirement 2020 Fund℠ Class K6 |
| Years ended July 31, | 2024 | 2023 | 2022 | 2021 | 2020 A | |||||
Selected Per-Share Data | ||||||||||
| Net asset value, beginning of period | $ | 51.01 | $ | 51.85 | $ | 59.93 | $ | 53.82 | $ | 51.28 |
| Income from Investment Operations | ||||||||||
Net investment income (loss) B,C | 1.498 | 1.856 | 1.458 | .584 | .869 | |||||
| Net realized and unrealized gain (loss) | 2.938 | (.707) | (6.709) | 7.661 | 3.369 | |||||
| Total from investment operations | 4.436 | 1.149 | (5.251) | 8.245 | 4.238 | |||||
| Distributions from net investment income | (1.470) | (1.815) | (1.477) | (.613) | (.961) | |||||
| Distributions from net realized gain | (.026) | (.174) | (1.352) | (1.522) | (.737) | |||||
| Total distributions | (1.496) | (1.989) | (2.829) | (2.135) | (1.698) | |||||
| Net asset value, end of period | $ | 53.95 | $ | 51.01 | $ | 51.85 | $ | 59.93 | $ | 53.82 |
Total Return D,E | 8.88 % | 2.50% | (9.21)% | 15.65% | 8.42% | |||||
Ratios to Average Net Assets C,F,G | ||||||||||
| Expenses before reductions | .27% | .27% | .27% | .27% | .27% | |||||
| Expenses net of fee waivers, if any | .27 % | .27% | .27% | .27% | .27% | |||||
| Expenses net of all reductions | .27% | .27% | .27% | .27% | .27% | |||||
| Net investment income (loss) | 2.92% | 3.75% | 2.67% | 1.02% | 1.71% | |||||
| Supplemental Data | ||||||||||
| Net assets, end of period (000 omitted) | $ | 1,074 | $ | 741 | $ | 1,110 | $ | 628 | $ | 406 |
Portfolio turnover rate H | 32 % | 28% | 67% | 35% | 69% |
Fidelity Advisor Managed Retirement 2020 Fund℠ Class I |
| Years ended July 31, | 2024 | 2023 | 2022 | 2021 | 2020 | |||||
Selected Per-Share Data | ||||||||||
| Net asset value, beginning of period | $ | 51.03 | $ | 51.87 | $ | 59.95 | $ | 53.83 | $ | 51.35 |
| Income from Investment Operations | ||||||||||
Net investment income (loss) A,B | 1.436 | 1.757 | 1.389 | .470 | .779 | |||||
| Net realized and unrealized gain (loss) | 2.895 | (.704) | (6.761) | 7.673 | 3.282 | |||||
| Total from investment operations | 4.331 | 1.053 | (5.372) | 8.143 | 4.061 | |||||
| Distributions from net investment income | (1.355) | (1.719) | (1.356) | (.501) | (.844) | |||||
| Distributions from net realized gain | (.026) | (.174) | (1.352) | (1.522) | (.737) | |||||
| Total distributions | (1.381) | (1.893) | (2.708) | (2.023) | (1.581) | |||||
| Net asset value, end of period | $ | 53.98 | $ | 51.03 | $ | 51.87 | $ | 59.95 | $ | 53.83 |
Total Return C | 8.65 % | 2.30% | (9.40)% | 15.44% | 8.05% | |||||
Ratios to Average Net Assets B,D,E | ||||||||||
| Expenses before reductions | .47% | .47% | .47% | .47% | .47% | |||||
| Expenses net of fee waivers, if any | .47 % | .47% | .47% | .47% | .47% | |||||
| Expenses net of all reductions | .47% | .47% | .47% | .47% | .47% | |||||
| Net investment income (loss) | 2.82% | 3.55% | 2.47% | .82% | 1.51% | |||||
| Supplemental Data | ||||||||||
| Net assets, end of period (000 omitted) | $ | 163 | $ | 218 | $ | 249 | $ | 320 | $ | 212 |
Portfolio turnover rate F | 32 % | 28% | 67% | 35% | 69% |
| Domestic Equity Funds - 21.8% | |||
| Shares | Value ($) | ||
| Fidelity Series Blue Chip Growth Fund (a) | 126,723 | 2,424,215 | |
| Fidelity Series Commodity Strategy Fund (a) | 4,523 | 423,833 | |
| Fidelity Series Large Cap Growth Index Fund (a) | 68,529 | 1,554,928 | |
| Fidelity Series Large Cap Stock Fund (a) | 60,834 | 1,416,219 | |
| Fidelity Series Large Cap Value Index Fund (a) | 176,800 | 2,911,902 | |
| Fidelity Series Small Cap Core Fund (a) | 56,730 | 705,151 | |
| Fidelity Series Small Cap Opportunities Fund (a) | 27,087 | 439,894 | |
| Fidelity Series Value Discovery Fund (a) | 63,414 | 1,019,696 | |
| TOTAL DOMESTIC EQUITY FUNDS (Cost $7,878,649) | 10,895,838 | ||
| International Equity Funds - 21.9% | |||
| Shares | Value ($) | ||
| Fidelity Series Canada Fund (a) | 42,013 | 662,126 | |
| Fidelity Series Emerging Markets Fund (a) | 87,097 | 796,934 | |
| Fidelity Series Emerging Markets Opportunities Fund (a) | 170,028 | 3,191,434 | |
| Fidelity Series International Growth Fund (a) | 89,545 | 1,660,164 | |
| Fidelity Series International Index Fund (a) | 48,913 | 624,615 | |
| Fidelity Series International Small Cap Fund (a) | 41,719 | 756,366 | |
| Fidelity Series International Value Fund (a) | 125,974 | 1,650,261 | |
| Fidelity Series Overseas Fund (a) | 114,217 | 1,649,295 | |
| TOTAL INTERNATIONAL EQUITY FUNDS (Cost $9,109,182) | 10,991,195 | ||
| Bond Funds - 56.2% | |||
| Shares | Value ($) | ||
| Fidelity Series 0-5 Year Inflation-Protected Bond Index Fund (a) | 362,919 | 3,516,684 | |
| Fidelity Series 5+ Year Inflation-Protected Bond Index Fund (a) | 427,509 | 3,313,197 | |
| Fidelity Series Corporate Bond Fund (a) | 356,980 | 3,334,192 | |
| Fidelity Series Emerging Markets Debt Fund (a) | 33,435 | 264,474 | |
| Fidelity Series Emerging Markets Debt Local Currency Fund (a) | 9,005 | 81,492 | |
| Fidelity Series Floating Rate High Income Fund (a) | 5,570 | 50,018 | |
| Fidelity Series Government Bond Index Fund (a) | 560,784 | 5,164,822 | |
| Fidelity Series High Income Fund (a) | 31,794 | 271,205 | |
| Fidelity Series International Credit Fund (a) | 1,617 | 13,290 | |
| Fidelity Series International Developed Markets Bond Index Fund (a) | 228,445 | 1,985,188 | |
| Fidelity Series Investment Grade Bond Fund (a) | 499,764 | 5,037,622 | |
| Fidelity Series Investment Grade Securitized Fund (a) | 362,478 | 3,258,674 | |
| Fidelity Series Long-Term Treasury Bond Index Fund (a) | 321,235 | 1,821,401 | |
| Fidelity Series Real Estate Income Fund (a) | 5,024 | 49,587 | |
| TOTAL BOND FUNDS (Cost $31,346,861) | 28,161,846 | ||
| Short-Term Funds - 0.1% | |||
| Shares | Value ($) | ||
| Fidelity Series Government Money Market Fund 5.42% (a)(b) | 7,641 | 7,641 | |
| Fidelity Series Short-Term Credit Fund (a) | 260 | 2,588 | |
| Fidelity Series Treasury Bill Index Fund (a) | 1,967 | 19,553 | |
| TOTAL SHORT-TERM FUNDS (Cost $29,707) | 29,782 | ||
| TOTAL INVESTMENT IN SECURITIES - 100.0% (Cost $48,364,399) | 50,078,661 |
NET OTHER ASSETS (LIABILITIES) - 0.0% | (17,817) |
| NET ASSETS - 100.0% | 50,060,844 |
| (a) | Affiliated Fund |
| (b) | The rate quoted is the annualized seven-day yield of the fund at period end. |
| Affiliate | Value, beginning of period ($) | Purchases ($) | Sales Proceeds ($) | Dividend Income ($) | Realized Gain (loss) ($) | Change in Unrealized appreciation (depreciation) ($) | Value, end of period ($) |
| Fidelity Series 0-5 Year Inflation-Protected Bond Index Fund | 3,321,853 | 1,294,233 | 1,172,020 | 113,873 | (13,726) | 86,344 | 3,516,684 |
| Fidelity Series 5+ Year Inflation-Protected Bond Index Fund | 3,718,420 | 895,726 | 1,229,815 | 149,607 | (112,673) | 41,539 | 3,313,197 |
| Fidelity Series Blue Chip Growth Fund | 2,254,724 | 840,282 | 1,318,517 | 12,585 | 114,749 | 532,977 | 2,424,215 |
| Fidelity Series Canada Fund | 681,876 | 205,662 | 271,080 | 22,350 | 17,583 | 28,085 | 662,126 |
| Fidelity Series Commodity Strategy Fund | 400,289 | 219,414 | 157,715 | 15,592 | (8,415) | (29,740) | 423,833 |
| Fidelity Series Corporate Bond Fund | 3,484,368 | 982,873 | 1,230,531 | 149,209 | (88,059) | 185,541 | 3,334,192 |
| Fidelity Series Emerging Markets Debt Fund | 274,433 | 73,356 | 95,196 | 16,626 | (12,657) | 24,538 | 264,474 |
| Fidelity Series Emerging Markets Debt Local Currency Fund | 93,155 | 25,010 | 30,858 | 5,956 | (1,820) | (3,995) | 81,492 |
| Fidelity Series Emerging Markets Fund | 780,166 | 335,593 | 346,480 | 18,168 | (26,806) | 54,461 | 796,934 |
| Fidelity Series Emerging Markets Opportunities Fund | 3,112,006 | 1,362,528 | 1,378,379 | 83,863 | (97,175) | 192,454 | 3,191,434 |
| Fidelity Series Floating Rate High Income Fund | 53,328 | 18,919 | 22,154 | 4,925 | 112 | (187) | 50,018 |
| Fidelity Series Government Bond Index Fund | 5,066,451 | 1,623,492 | 1,575,696 | 158,078 | (35,930) | 86,505 | 5,164,822 |
| Fidelity Series Government Money Market Fund 5.42% | 528,417 | 116,233 | 637,009 | 11,127 | - | - | 7,641 |
| Fidelity Series High Income Fund | 286,874 | 78,012 | 101,693 | 17,618 | (5,869) | 13,881 | 271,205 |
| Fidelity Series International Credit Fund | 11,931 | 532 | - | 532 | - | 827 | 13,290 |
| Fidelity Series International Developed Markets Bond Index Fund | 2,095,312 | 560,698 | 704,781 | 73,628 | (26,173) | 60,132 | 1,985,188 |
| Fidelity Series International Growth Fund | 1,721,030 | 527,539 | 767,083 | 21,571 | (1,620) | 180,298 | 1,660,164 |
| Fidelity Series International Index Fund | 650,276 | 179,574 | 253,060 | 17,776 | 8,155 | 39,670 | 624,615 |
| Fidelity Series International Small Cap Fund | 536,459 | 458,082 | 341,898 | 27,531 | (7,851) | 111,574 | 756,366 |
| Fidelity Series International Value Fund | 1,732,458 | 488,942 | 788,800 | 53,738 | 43,836 | 173,825 | 1,650,261 |
| Fidelity Series Investment Grade Bond Fund | 5,176,995 | 1,497,107 | 1,710,546 | 213,546 | (48,963) | 123,029 | 5,037,622 |
| Fidelity Series Investment Grade Securitized Fund | 3,514,342 | 940,956 | 1,237,387 | 140,392 | (57,679) | 98,442 | 3,258,674 |
| Fidelity Series Large Cap Growth Index Fund | 1,424,079 | 554,912 | 780,167 | 11,483 | 140,988 | 215,116 | 1,554,928 |
| Fidelity Series Large Cap Stock Fund | 1,579,262 | 521,831 | 950,577 | 80,511 | 148,389 | 117,314 | 1,416,219 |
| Fidelity Series Large Cap Value Index Fund | 2,935,027 | 1,124,976 | 1,423,473 | 114,519 | 83,069 | 192,303 | 2,911,902 |
| Fidelity Series Long-Term Treasury Bond Index Fund | 2,339,099 | 965,192 | 1,406,761 | 73,682 | (333,032) | 256,903 | 1,821,401 |
| Fidelity Series Overseas Fund | 1,722,930 | 477,592 | 757,916 | 27,459 | 18,820 | 187,869 | 1,649,295 |
| Fidelity Series Real Estate Income Fund | 74,187 | 13,860 | 38,722 | 3,753 | (3,219) | 3,481 | 49,587 |
| Fidelity Series Short-Term Credit Fund | 243,220 | 29,394 | 274,334 | 4,268 | (3,388) | 7,696 | 2,588 |
| Fidelity Series Small Cap Core Fund | 10,664 | 685,377 | 25,796 | 470 | 221 | 34,685 | 705,151 |
| Fidelity Series Small Cap Opportunities Fund | 721,670 | 222,036 | 622,518 | 7,271 | 57,918 | 60,788 | 439,894 |
| Fidelity Series Treasury Bill Index Fund | 1,396,693 | 387,297 | 1,763,499 | 31,338 | (4,067) | 3,129 | 19,553 |
| Fidelity Series Value Discovery Fund | 1,082,346 | 401,189 | 515,388 | 52,772 | 17,831 | 33,718 | 1,019,696 |
| 53,024,340 | 18,108,419 | 23,929,849 | 1,735,817 | (237,451) | 3,113,202 | 50,078,661 |
| Valuation Inputs at Reporting Date: | ||||
| Description | Total ($) | Level 1 ($) | Level 2 ($) | Level 3 ($) |
Investments in Securities: | ||||
| Domestic Equity Funds | 10,895,838 | 10,895,838 | - | - |
| International Equity Funds | 10,991,195 | 10,991,195 | - | - |
| Bond Funds | 28,161,846 | 28,161,846 | - | - |
| Short-Term Funds | 29,782 | 29,782 | - | - |
| Total Investments in Securities: | 50,078,661 | 50,078,661 | - | - |
| Statement of Assets and Liabilities | ||||
As of July 31, 2024 | ||||
| Assets | ||||
| Investment in securities, at value - See accompanying schedule: | ||||
Affiliated issuers (cost $48,364,399) | $ | 50,078,661 | ||
| Total Investment in Securities (cost $48,364,399) | $ | 50,078,661 | ||
| Cash | 448 | |||
| Receivable for investments sold | 498,070 | |||
| Receivable for fund shares sold | 10,424 | |||
Total assets | 50,587,603 | |||
| Liabilities | ||||
| Payable for investments purchased | $ | 420,064 | ||
| Payable for fund shares redeemed | 88,431 | |||
| Accrued management fee | 17,839 | |||
| Distribution and service plan fees payable | 425 | |||
| Total liabilities | 526,759 | |||
| Net Assets | $ | 50,060,844 | ||
| Net Assets consist of: | ||||
| Paid in capital | $ | 50,675,738 | ||
| Total accumulated earnings (loss) | (614,894) | |||
| Net Assets | $ | 50,060,844 | ||
| Net Asset Value and Maximum Offering Price | ||||
| Class A : | ||||
Net Asset Value and redemption price per share ($2,052,779 ÷ 36,663.95 shares)(a) | $ | 55.99 | ||
| Maximum offering price per share (100/94.25 of $55.99) | $ | 59.41 | ||
| Fidelity Managed Retirement 2025 : | ||||
Net Asset Value, offering price and redemption price per share ($37,990,761 ÷ 676,745.84 shares) | $ | 56.14 | ||
| Class K : | ||||
Net Asset Value, offering price and redemption price per share ($130,322 ÷ 2,319.43 shares) | $ | 56.19 | ||
| Class K6 : | ||||
Net Asset Value, offering price and redemption price per share ($9,822,840 ÷ 175,030.23 shares) | $ | 56.12 | ||
| Class I : | ||||
Net Asset Value, offering price and redemption price per share ($64,142 ÷ 1,138.26 shares) | $ | 56.35 | ||
(a)Redemption price per share is equal to net asset value less any applicable contingent deferred sales charge. | ||||
| Statement of Operations | ||||
| Year ended July 31, 2024 | ||||
| Investment Income | ||||
| Dividends: | ||||
| Affiliated issuers | $ | 1,584,197 | ||
| Expenses | ||||
| Management fee | $ | 222,391 | ||
| Distribution and service plan fees | 4,405 | |||
| Independent trustees' fees and expenses | 152 | |||
| Miscellaneous | 322 | |||
| Total expenses before reductions | 227,270 | |||
| Expense reductions | (16) | |||
| Total expenses after reductions | 227,254 | |||
| Net Investment income (loss) | 1,356,943 | |||
| Realized and Unrealized Gain (Loss) | ||||
| Net realized gain (loss) on: | ||||
| Investment Securities: | ||||
| Affiliated issuers | (237,451) | |||
| Capital gain distributions from underlying funds: | ||||
| Affiliated issuers | 151,620 | |||
| Total net realized gain (loss) | (85,831) | |||
| Change in net unrealized appreciation (depreciation) on: | ||||
| Investment Securities: | ||||
| Affiliated issuers | 3,113,202 | |||
| Total change in net unrealized appreciation (depreciation) | 3,113,202 | |||
| Net gain (loss) | 3,027,371 | |||
| Net increase (decrease) in net assets resulting from operations | $ | 4,384,314 | ||
| Statement of Changes in Net Assets | ||||
Year ended July 31, 2024 | Year ended July 31, 2023 | |||
| Increase (Decrease) in Net Assets | ||||
| Operations | ||||
| Net investment income (loss) | $ | 1,356,943 | $ | 1,785,023 |
| Net realized gain (loss) | (85,831) | (1,468,694) | ||
| Change in net unrealized appreciation (depreciation) | 3,113,202 | 1,113,730 | ||
| Net increase (decrease) in net assets resulting from operations | 4,384,314 | 1,430,059 | ||
| Distributions to shareholders | (1,330,242) | (2,607,842) | ||
| Share transactions - net increase (decrease) | (6,016,589) | (2,181,059) | ||
| Total increase (decrease) in net assets | (2,962,517) | (3,358,842) | ||
| Net Assets | ||||
| Beginning of period | 53,023,361 | 56,382,203 | ||
| End of period | $ | 50,060,844 | $ | 53,023,361 |
Fidelity Advisor Managed Retirement 2025 Fund℠ Class A |
| Years ended July 31, | 2024 | 2023 | 2022 | 2021 | 2020 | |||||
Selected Per-Share Data | ||||||||||
| Net asset value, beginning of period | $ | 52.54 | $ | 53.57 | $ | 62.69 | $ | 55.13 | $ | 52.89 |
| Income from Investment Operations | ||||||||||
Net investment income (loss) A,B | 1.332 | 1.586 | 1.274 | .377 | .692 | |||||
| Net realized and unrealized gain (loss) | 3.363 | (.249) | (7.367) | 9.095 | 3.455 | |||||
| Total from investment operations | 4.695 | 1.337 | (6.093) | 9.472 | 4.147 | |||||
| Distributions from net investment income | (1.212) | (1.562) | (1.297) | (.446) | (.756) | |||||
| Distributions from net realized gain | (.033) | (.805) | (1.730) | (1.466) | (1.151) | |||||
| Total distributions | (1.245) | (2.367) | (3.027) | (1.912) | (1.907) | |||||
| Net asset value, end of period | $ | 55.99 | $ | 52.54 | $ | 53.57 | $ | 62.69 | $ | 55.13 |
Total Return C,D | 9.09 % | 2.84% | (10.25)% | 17.50% | 8.01% | |||||
Ratios to Average Net Assets B,E,F | ||||||||||
| Expenses before reductions | .72% | .73% | .73% | .73% | .73% | |||||
| Expenses net of fee waivers, if any | .72 % | .73% | .73% | .73% | .73% | |||||
| Expenses net of all reductions | .72% | .73% | .73% | .73% | .73% | |||||
| Net investment income (loss) | 2.52% | 3.13% | 2.19% | .63% | 1.32% | |||||
| Supplemental Data | ||||||||||
| Net assets, end of period (000 omitted) | $ | 2,053 | $ | 1,583 | $ | 1,689 | $ | 1,867 | $ | 993 |
Portfolio turnover rate G | 36 % | 31% | 53% | 27% | 67% |
Fidelity Managed Retirement 2025 Fund℠ |
| Years ended July 31, | 2024 | 2023 | 2022 | 2021 | 2020 | |||||
Selected Per-Share Data | ||||||||||
| Net asset value, beginning of period | $ | 52.66 | $ | 53.69 | $ | 62.80 | $ | 55.19 | $ | 52.92 |
| Income from Investment Operations | ||||||||||
Net investment income (loss) A,B | 1.467 | 1.716 | 1.421 | .525 | .825 | |||||
| Net realized and unrealized gain (loss) | 3.380 | (.253) | (7.388) | 9.109 | 3.466 | |||||
| Total from investment operations | 4.847 | 1.463 | (5.967) | 9.634 | 4.291 | |||||
| Distributions from net investment income | (1.334) | (1.688) | (1.413) | (.558) | (.870) | |||||
| Distributions from net realized gain | (.033) | (.805) | (1.730) | (1.466) | (1.151) | |||||
| Total distributions | (1.367) | (2.493) | (3.143) | (2.024) | (2.021) | |||||
| Net asset value, end of period | $ | 56.14 | $ | 52.66 | $ | 53.69 | $ | 62.80 | $ | 55.19 |
Total Return C | 9.38 % | 3.09% | (10.03)% | 17.79% | 8.30% | |||||
Ratios to Average Net Assets B,D,E | ||||||||||
| Expenses before reductions | .47% | .48% | .48% | .48% | .48% | |||||
| Expenses net of fee waivers, if any | .47 % | .48% | .48% | .48% | .48% | |||||
| Expenses net of all reductions | .47% | .48% | .48% | .48% | .48% | |||||
| Net investment income (loss) | 2.78% | 3.38% | 2.44% | .88% | 1.57% | |||||
| Supplemental Data | ||||||||||
| Net assets, end of period (000 omitted) | $ | 37,991 | $ | 47,433 | $ | 51,468 | $ | 55,127 | $ | 30,093 |
Portfolio turnover rate F | 36 % | 31% | 53% | 27% | 67% |
Fidelity Managed Retirement 2025 Fund℠ Class K |
| Years ended July 31, | 2024 | 2023 | 2022 | 2021 | 2020 A | |||||
Selected Per-Share Data | ||||||||||
| Net asset value, beginning of period | $ | 52.67 | $ | 53.71 | $ | 62.82 | $ | 55.20 | $ | 52.82 |
| Income from Investment Operations | ||||||||||
Net investment income (loss) B,C | 1.511 | 1.766 | 1.480 | .582 | .879 | |||||
| Net realized and unrealized gain (loss) | 3.389 | (.250) | (7.390) | 9.109 | 3.572 | |||||
| Total from investment operations | 4.900 | 1.516 | (5.910) | 9.691 | 4.451 | |||||
| Distributions from net investment income | (1.347) | (1.751) | (1.470) | (.605) | (.920) | |||||
| Distributions from net realized gain | (.033) | (.805) | (1.730) | (1.466) | (1.151) | |||||
| Total distributions | (1.380) | (2.556) | (3.200) | (2.071) | (2.071) | |||||
| Net asset value, end of period | $ | 56.19 | $ | 52.67 | $ | 53.71 | $ | 62.82 | $ | 55.20 |
Total Return D,E | 9.49 % | 3.20% | (9.94)% | 17.90% | 8.63% | |||||
Ratios to Average Net Assets C,F,G | ||||||||||
| Expenses before reductions | .38% | .38% | .38% | .38% | .38% | |||||
| Expenses net of fee waivers, if any | .38 % | .38% | .38% | .38% | .38% | |||||
| Expenses net of all reductions | .38% | .38% | .38% | .38% | .38% | |||||
| Net investment income (loss) | 2.87% | 3.48% | 2.54% | .98% | 1.67% | |||||
| Supplemental Data | ||||||||||
| Net assets, end of period (000 omitted) | $ | 130 | $ | 364 | $ | 115 | $ | 128 | $ | 109 |
Portfolio turnover rate H | 36 % | 31% | 53% | 27% | 67% |
Fidelity Managed Retirement 2025 Fund℠ Class K6 |
| Years ended July 31, | 2024 | 2023 | 2022 | 2021 | 2020 A | |||||
Selected Per-Share Data | ||||||||||
| Net asset value, beginning of period | $ | 52.66 | $ | 53.70 | $ | 62.81 | $ | 55.20 | $ | 52.82 |
| Income from Investment Operations | ||||||||||
Net investment income (loss) B,C | 1.222 | 1.817 | 1.527 | .648 | .932 | |||||
| Net realized and unrealized gain (loss) | 3.726 | (.254) | (7.379) | 9.105 | 3.567 | |||||
| Total from investment operations | 4.948 | 1.563 | (5.852) | 9.753 | 4.499 | |||||
| Distributions from net investment income | (1.455) | (1.798) | (1.528) | (.677) | (.968) | |||||
| Distributions from net realized gain | (.033) | (.805) | (1.730) | (1.466) | (1.151) | |||||
| Total distributions | (1.488) | (2.603) | (3.258) | (2.143) | (2.119) | |||||
| Net asset value, end of period | $ | 56.12 | $ | 52.66 | $ | 53.70 | $ | 62.81 | $ | 55.20 |
Total Return D,E | 9.59 % | 3.30% | (9.85)% | 18.03% | 8.73% | |||||
Ratios to Average Net Assets C,F,G | ||||||||||
| Expenses before reductions | .27% | .28% | .28% | .28% | .28% | |||||
| Expenses net of fee waivers, if any | .27 % | .28% | .28% | .28% | .28% | |||||
| Expenses net of all reductions | .27% | .28% | .28% | .28% | .28% | |||||
| Net investment income (loss) | 2.29% | 3.58% | 2.64% | 1.08% | 1.77% | |||||
| Supplemental Data | ||||||||||
| Net assets, end of period (000 omitted) | $ | 9,823 | $ | 3,350 | $ | 2,437 | $ | 1,351 | $ | 412 |
Portfolio turnover rate H | 36 % | 31% | 53% | 27% | 67% |
Fidelity Advisor Managed Retirement 2025 Fund℠ Class I |
| Years ended July 31, | 2024 | 2023 | 2022 | 2021 | 2020 | |||||
Selected Per-Share Data | ||||||||||
| Net asset value, beginning of period | $ | 52.85 | $ | 53.82 | $ | 62.93 | $ | 55.30 | $ | 53.00 |
| Income from Investment Operations | ||||||||||
Net investment income (loss) A,B | 1.462 | 1.723 | 1.427 | .525 | .831 | |||||
| Net realized and unrealized gain (loss) | 3.393 | (.249) | (7.400) | 9.122 | 3.463 | |||||
| Total from investment operations | 4.855 | 1.474 | (5.973) | 9.647 | 4.294 | |||||
| Distributions from net investment income | (1.322) | (1.639) | (1.407) | (.551) | (.843) | |||||
| Distributions from net realized gain | (.033) | (.805) | (1.730) | (1.466) | (1.151) | |||||
| Total distributions | (1.355) | (2.444) | (3.137) | (2.017) | (1.994) | |||||
| Net asset value, end of period | $ | 56.35 | $ | 52.85 | $ | 53.82 | $ | 62.93 | $ | 55.30 |
Total Return C | 9.36 % | 3.10% | (10.02)% | 17.78% | 8.29% | |||||
Ratios to Average Net Assets B,D,E | ||||||||||
| Expenses before reductions | .47% | .48% | .48% | .48% | .48% | |||||
| Expenses net of fee waivers, if any | .47 % | .48% | .48% | .48% | .48% | |||||
| Expenses net of all reductions | .47% | .48% | .48% | .48% | .48% | |||||
| Net investment income (loss) | 2.77% | 3.39% | 2.44% | .88% | 1.57% | |||||
| Supplemental Data | ||||||||||
| Net assets, end of period (000 omitted) | $ | 64 | $ | 174 | $ | 556 | $ | 765 | $ | 498 |
Portfolio turnover rate F | 36 % | 31% | 53% | 27% | 67% |
| Domestic Equity Funds - 24.8% | |||
| Shares | Value ($) | ||
| Fidelity Series Blue Chip Growth Fund (a) | 123,527 | 2,363,070 | |
| Fidelity Series Commodity Strategy Fund (a) | 3,848 | 360,562 | |
| Fidelity Series Large Cap Growth Index Fund (a) | 66,854 | 1,516,923 | |
| Fidelity Series Large Cap Stock Fund (a) | 59,216 | 1,378,558 | |
| Fidelity Series Large Cap Value Index Fund (a) | 172,108 | 2,834,611 | |
| Fidelity Series Small Cap Core Fund (a) | 54,970 | 683,280 | |
| Fidelity Series Small Cap Opportunities Fund (a) | 26,240 | 426,138 | |
| Fidelity Series Value Discovery Fund (a) | 61,731 | 992,642 | |
| TOTAL DOMESTIC EQUITY FUNDS (Cost $8,130,852) | 10,555,784 | ||
| International Equity Funds - 23.9% | |||
| Shares | Value ($) | ||
| Fidelity Series Canada Fund (a) | 39,852 | 628,070 | |
| Fidelity Series Emerging Markets Fund (a) | 79,438 | 726,862 | |
| Fidelity Series Emerging Markets Opportunities Fund (a) | 155,086 | 2,910,967 | |
| Fidelity Series International Growth Fund (a) | 84,940 | 1,574,786 | |
| Fidelity Series International Index Fund (a) | 46,355 | 591,948 | |
| Fidelity Series International Small Cap Fund (a) | 35,567 | 644,827 | |
| Fidelity Series International Value Fund (a) | 119,438 | 1,564,631 | |
| Fidelity Series Overseas Fund (a) | 108,305 | 1,563,917 | |
| TOTAL INTERNATIONAL EQUITY FUNDS (Cost $9,285,509) | 10,206,008 | ||
| Bond Funds - 51.3% | |||
| Shares | Value ($) | ||
| Fidelity Series 0-5 Year Inflation-Protected Bond Index Fund (a) | 176,162 | 1,707,009 | |
| Fidelity Series 5+ Year Inflation-Protected Bond Index Fund (a) | 423,046 | 3,278,604 | |
| Fidelity Series Corporate Bond Fund (a) | 270,572 | 2,527,146 | |
| Fidelity Series Emerging Markets Debt Fund (a) | 28,538 | 225,732 | |
| Fidelity Series Emerging Markets Debt Local Currency Fund (a) | 7,589 | 68,684 | |
| Fidelity Series Floating Rate High Income Fund (a) | 4,738 | 42,550 | |
| Fidelity Series Government Bond Index Fund (a) | 424,961 | 3,913,889 | |
| Fidelity Series High Income Fund (a) | 27,068 | 230,893 | |
| Fidelity Series International Credit Fund (a) | 635 | 5,222 | |
| Fidelity Series International Developed Markets Bond Index Fund (a) | 194,329 | 1,688,723 | |
| Fidelity Series Investment Grade Bond Fund (a) | 378,769 | 3,817,987 | |
| Fidelity Series Investment Grade Securitized Fund (a) | 274,739 | 2,469,905 | |
| Fidelity Series Long-Term Treasury Bond Index Fund (a) | 323,139 | 1,832,201 | |
| Fidelity Series Real Estate Income Fund (a) | 4,276 | 42,201 | |
| TOTAL BOND FUNDS (Cost $24,153,461) | 21,850,746 | ||
| Short-Term Funds - 0.0% | |||
| Shares | Value ($) | ||
| Fidelity Series Government Money Market Fund 5.42% (a)(b) | 2,499 | 2,499 | |
| Fidelity Series Short-Term Credit Fund (a) | 6 | 59 | |
| Fidelity Series Treasury Bill Index Fund (a) | 591 | 5,871 | |
| TOTAL SHORT-TERM FUNDS (Cost $8,429) | 8,429 | ||
| TOTAL INVESTMENT IN SECURITIES - 100.0% (Cost $41,578,251) | 42,620,967 |
NET OTHER ASSETS (LIABILITIES) - 0.0% | (15,333) |
| NET ASSETS - 100.0% | 42,605,634 |
| (a) | Affiliated Fund |
| (b) | The rate quoted is the annualized seven-day yield of the fund at period end. |
| Affiliate | Value, beginning of period ($) | Purchases ($) | Sales Proceeds ($) | Dividend Income ($) | Realized Gain (loss) ($) | Change in Unrealized appreciation (depreciation) ($) | Value, end of period ($) |
| Fidelity Series 0-5 Year Inflation-Protected Bond Index Fund | 1,374,036 | 723,306 | 424,241 | 50,587 | (5,345) | 39,253 | 1,707,009 |
| Fidelity Series 5+ Year Inflation-Protected Bond Index Fund | 3,067,951 | 1,064,817 | 811,685 | 133,219 | (33,258) | (9,221) | 3,278,604 |
| Fidelity Series Blue Chip Growth Fund | 1,903,833 | 812,803 | 948,422 | 10,446 | 12,567 | 582,289 | 2,363,070 |
| Fidelity Series Canada Fund | 552,234 | 193,306 | 163,179 | 18,587 | 1,481 | 44,228 | 628,070 |
| Fidelity Series Commodity Strategy Fund | 295,326 | 194,786 | 102,077 | 11,155 | (1,754) | (25,719) | 360,562 |
| Fidelity Series Corporate Bond Fund | 2,375,000 | 868,178 | 791,400 | 106,937 | (40,352) | 115,720 | 2,527,146 |
| Fidelity Series Emerging Markets Debt Fund | 202,617 | 69,580 | 56,696 | 13,038 | (2,777) | 13,008 | 225,732 |
| Fidelity Series Emerging Markets Debt Local Currency Fund | 68,607 | 22,693 | 18,296 | 4,620 | (404) | (3,916) | 68,684 |
| Fidelity Series Emerging Markets Fund | 615,335 | 300,823 | 221,219 | 14,555 | (7,971) | 39,894 | 726,862 |
| Fidelity Series Emerging Markets Opportunities Fund | 2,454,749 | 1,237,947 | 899,556 | 67,194 | (64,016) | 181,843 | 2,910,967 |
| Fidelity Series Floating Rate High Income Fund | 39,199 | 17,299 | 13,864 | 3,860 | 60 | (144) | 42,550 |
| Fidelity Series Government Bond Index Fund | 3,453,454 | 1,379,045 | 962,345 | 113,564 | (46,174) | 89,909 | 3,913,889 |
| Fidelity Series Government Money Market Fund 5.42% | 335,223 | 91,578 | 424,302 | 6,420 | - | - | 2,499 |
| Fidelity Series High Income Fund | 210,936 | 74,543 | 61,370 | 13,835 | (1,277) | 8,061 | 230,893 |
| Fidelity Series International Credit Fund | 4,688 | 209 | - | 209 | - | 325 | 5,222 |
| Fidelity Series International Developed Markets Bond Index Fund | 1,547,881 | 602,611 | 489,168 | 59,014 | (11,853) | 39,252 | 1,688,723 |
| Fidelity Series International Growth Fund | 1,393,727 | 513,458 | 498,016 | 17,937 | (20,538) | 186,155 | 1,574,786 |
| Fidelity Series International Index Fund | 526,663 | 177,520 | 159,719 | 14,782 | (272) | 47,756 | 591,948 |
| Fidelity Series International Small Cap Fund | 433,046 | 341,044 | 209,956 | 20,491 | (19,220) | 99,913 | 644,827 |
| Fidelity Series International Value Fund | 1,403,017 | 493,581 | 536,181 | 44,717 | 16,324 | 187,890 | 1,564,631 |
| Fidelity Series Investment Grade Bond Fund | 3,528,751 | 1,300,614 | 1,073,151 | 153,040 | (66,159) | 127,932 | 3,817,987 |
| Fidelity Series Investment Grade Securitized Fund | 2,395,457 | 823,615 | 785,532 | 100,605 | (48,272) | 84,637 | 2,469,905 |
| Fidelity Series Large Cap Growth Index Fund | 1,202,514 | 542,205 | 553,530 | 10,201 | 47,191 | 278,543 | 1,516,923 |
| Fidelity Series Large Cap Stock Fund | 1,333,523 | 497,496 | 711,200 | 67,519 | 81,419 | 177,320 | 1,378,558 |
| Fidelity Series Large Cap Value Index Fund | 2,478,236 | 1,077,259 | 1,000,906 | 99,107 | 26,163 | 253,859 | 2,834,611 |
| Fidelity Series Long-Term Treasury Bond Index Fund | 1,821,345 | 1,018,255 | 961,706 | 63,621 | (101,659) | 55,966 | 1,832,201 |
| Fidelity Series Overseas Fund | 1,395,261 | 464,693 | 491,013 | 22,835 | 2,115 | 192,861 | 1,563,917 |
| Fidelity Series Real Estate Income Fund | 54,571 | 13,506 | 26,399 | 2,806 | (1,659) | 2,182 | 42,201 |
| Fidelity Series Short-Term Credit Fund | 169,992 | 30,233 | 202,944 | 2,780 | (4,079) | 6,857 | 59 |
| Fidelity Series Small Cap Core Fund | 7,877 | 659,296 | 18,255 | 300 | 145 | 34,217 | 683,280 |
| Fidelity Series Small Cap Opportunities Fund | 609,424 | 196,416 | 495,664 | 6,078 | 10,584 | 105,378 | 426,138 |
| Fidelity Series Treasury Bill Index Fund | 896,539 | 268,648 | 1,158,741 | 18,632 | (2,363) | 1,788 | 5,871 |
| Fidelity Series Value Discovery Fund | 913,972 | 415,411 | 393,074 | 46,039 | 6,627 | 49,706 | 992,642 |
| 39,064,984 | 16,486,774 | 15,663,807 | 1,318,730 | (274,726) | 3,007,742 | 42,620,967 |
| Valuation Inputs at Reporting Date: | ||||
| Description | Total ($) | Level 1 ($) | Level 2 ($) | Level 3 ($) |
Investments in Securities: | ||||
| Domestic Equity Funds | 10,555,784 | 10,555,784 | - | - |
| International Equity Funds | 10,206,008 | 10,206,008 | - | - |
| Bond Funds | 21,850,746 | 21,850,746 | - | - |
| Short-Term Funds | 8,429 | 8,429 | - | - |
| Total Investments in Securities: | 42,620,967 | 42,620,967 | - | - |
| Statement of Assets and Liabilities | ||||
As of July 31, 2024 | ||||
| Assets | ||||
| Investment in securities, at value - See accompanying schedule: | ||||
Affiliated issuers (cost $41,578,251) | $ | 42,620,967 | ||
| Total Investment in Securities (cost $41,578,251) | $ | 42,620,967 | ||
| Cash | 183 | |||
| Receivable for investments sold | 389,384 | |||
| Receivable for fund shares sold | 900 | |||
Total assets | 43,011,434 | |||
| Liabilities | ||||
| Payable for investments purchased | $ | 383,484 | ||
| Payable for fund shares redeemed | 6,800 | |||
| Accrued management fee | 15,314 | |||
| Distribution and service plan fees payable | 202 | |||
| Total liabilities | 405,800 | |||
| Net Assets | $ | 42,605,634 | ||
| Net Assets consist of: | ||||
| Paid in capital | $ | 43,305,344 | ||
| Total accumulated earnings (loss) | (699,710) | |||
| Net Assets | $ | 42,605,634 | ||
| Net Asset Value and Maximum Offering Price | ||||
| Class A : | ||||
Net Asset Value and redemption price per share ($978,904 ÷ 86,105.27 shares)(a) | $ | 11.37 | ||
| Maximum offering price per share (100/94.25 of $11.37) | $ | 12.06 | ||
| Fidelity Managed Retirement 2030 Fund : | ||||
Net Asset Value, offering price and redemption price per share ($31,065,196 ÷ 2,728,068.76 shares) | $ | 11.39 | ||
| Class K : | ||||
Net Asset Value, offering price and redemption price per share ($224,245 ÷ 19,642.6 shares) | $ | 11.42 | ||
| Class K6 : | ||||
Net Asset Value, offering price and redemption price per share ($10,002,273 ÷ 877,198.31 shares) | $ | 11.40 | ||
| Class I : | ||||
Net Asset Value, offering price and redemption price per share ($335,016 ÷ 29,379.18 shares) | $ | 11.40 | ||
(a)Redemption price per share is equal to net asset value less any applicable contingent deferred sales charge. | ||||
| Statement of Operations | ||||
| Year ended July 31, 2024 | ||||
| Investment Income | ||||
| Dividends: | ||||
| Affiliated issuers | $ | 1,189,833 | ||
| Expenses | ||||
| Management fee | $ | 175,975 | ||
| Distribution and service plan fees | 1,622 | |||
| Independent trustees' fees and expenses | 116 | |||
| Miscellaneous | 260 | |||
| Total expenses before reductions | 177,973 | |||
| Expense reductions | (7) | |||
| Total expenses after reductions | 177,966 | |||
| Net Investment income (loss) | 1,011,867 | |||
| Realized and Unrealized Gain (Loss) | ||||
| Net realized gain (loss) on: | ||||
| Investment Securities: | ||||
| Affiliated issuers | (274,726) | |||
| Capital gain distributions from underlying funds: | ||||
| Affiliated issuers | 128,897 | |||
| Total net realized gain (loss) | (145,829) | |||
| Change in net unrealized appreciation (depreciation) on: | ||||
| Investment Securities: | ||||
| Affiliated issuers | 3,007,742 | |||
| Total change in net unrealized appreciation (depreciation) | 3,007,742 | |||
| Net gain (loss) | 2,861,913 | |||
| Net increase (decrease) in net assets resulting from operations | $ | 3,873,780 | ||
| Statement of Changes in Net Assets | ||||
Year ended July 31, 2024 | Year ended July 31, 2023 | |||
| Increase (Decrease) in Net Assets | ||||
| Operations | ||||
| Net investment income (loss) | $ | 1,011,867 | $ | 1,177,350 |
| Net realized gain (loss) | (145,829) | (994,480) | ||
| Change in net unrealized appreciation (depreciation) | 3,007,742 | 1,257,413 | ||
| Net increase (decrease) in net assets resulting from operations | 3,873,780 | 1,440,283 | ||
| Distributions to shareholders | (984,355) | (1,494,111) | ||
| Share transactions - net increase (decrease) | 651,896 | 4,649,194 | ||
| Total increase (decrease) in net assets | 3,541,321 | 4,595,366 | ||
| Net Assets | ||||
| Beginning of period | 39,064,313 | 34,468,947 | ||
| End of period | $ | 42,605,634 | $ | 39,064,313 |
Fidelity Advisor Managed Retirement 2030 Fund℠ Class A |
| Years ended July 31, | 2024 | 2023 | 2022 | 2021 | 2020 A | |||||
Selected Per-Share Data | ||||||||||
| Net asset value, beginning of period | $ | 10.61 | $ | 10.68 | $ | 12.51 | $ | 10.78 | $ | 10.00 |
| Income from Investment Operations | ||||||||||
Net investment income (loss) B,C | .250 | .304 | .248 | .056 | .104 | |||||
| Net realized and unrealized gain (loss) | .750 | .029 | (1.517) | 1.993 | .837 | |||||
| Total from investment operations | 1.000 | .333 | (1.269) | 2.049 | .941 | |||||
| Distributions from net investment income | (.232) | (.303) | (.257) | (.089) | (.121) | |||||
| Distributions from net realized gain | (.008) | (.100) | (.304) | (.230) | (.040) | |||||
| Total distributions | (.240) | (.403) | (.561) | (.319) | (.161) | |||||
| Net asset value, end of period | $ | 11.37 | $ | 10.61 | $ | 10.68 | $ | 12.51 | $ | 10.78 |
Total Return D,E,F | 9.59 % | 3.46% | (10.66)% | 19.28% | 9.46% | |||||
Ratios to Average Net Assets C,G,H | ||||||||||
| Expenses before reductions | .73% | .73% | .73% | .73% | .73% I | |||||
| Expenses net of fee waivers, if any | .73 % | .73% | .73% | .73% | .73% I | |||||
| Expenses net of all reductions | .73% | .73% | .73% | .73% | .73% I | |||||
| Net investment income (loss) | 2.35% | 2.99% | 2.13% | .47% | 1.06% I | |||||
| Supplemental Data | ||||||||||
| Net assets, end of period (000 omitted) | $ | 979 | $ | 546 | $ | 455 | $ | 595 | $ | 300 |
Portfolio turnover rate J | 40 % | 31% | 54% | 46% | 117% I |
Fidelity Managed Retirement 2030 Fund℠ |
| Years ended July 31, | 2024 | 2023 | 2022 | 2021 | 2020 A | |||||
Selected Per-Share Data | ||||||||||
| Net asset value, beginning of period | $ | 10.62 | $ | 10.69 | $ | 12.51 | $ | 10.77 | $ | 10.00 |
| Income from Investment Operations | ||||||||||
Net investment income (loss) B,C | .279 | .330 | .275 | .086 | .127 | |||||
| Net realized and unrealized gain (loss) | .754 | .028 | (1.510) | 1.990 | .832 | |||||
| Total from investment operations | 1.033 | .358 | (1.235) | 2.076 | .959 | |||||
| Distributions from net investment income | (.255) | (.328) | (.281) | (.106) | (.149) | |||||
| Distributions from net realized gain | (.008) | (.100) | (.304) | (.230) | (.040) | |||||
| Total distributions | (.263) | (.428) | (.585) | (.336) | (.189) | |||||
| Net asset value, end of period | $ | 11.39 | $ | 10.62 | $ | 10.69 | $ | 12.51 | $ | 10.77 |
Total Return D,E | 9.91 % | 3.71% | (10.39)% | 19.57% | 9.66% | |||||
Ratios to Average Net Assets C,F,G | ||||||||||
| Expenses before reductions | .48% | .48% | .48% | .48% | .48% H | |||||
| Expenses net of fee waivers, if any | .48 % | .48% | .48% | .48% | .48% H | |||||
| Expenses net of all reductions | .48% | .48% | .48% | .48% | .48% H | |||||
| Net investment income (loss) | 2.61% | 3.24% | 2.38% | .73% | 1.31% H | |||||
| Supplemental Data | ||||||||||
| Net assets, end of period (000 omitted) | $ | 31,065 | $ | 35,369 | $ | 32,369 | $ | 28,958 | $ | 4,986 |
Portfolio turnover rate I | 40 % | 31% | 54% | 46% | 117% H |
Fidelity Managed Retirement 2030 Fund℠ Class K |
| Years ended July 31, | 2024 | 2023 | 2022 | 2021 | 2020 A | |||||
Selected Per-Share Data | ||||||||||
| Net asset value, beginning of period | $ | 10.64 | $ | 10.71 | $ | 12.53 | $ | 10.78 | $ | 10.00 |
| Income from Investment Operations | ||||||||||
Net investment income (loss) B,C | .287 | .341 | .289 | .097 | .138 | |||||
| Net realized and unrealized gain (loss) | .758 | .028 | (1.514) | 1.994 | .832 | |||||
| Total from investment operations | 1.045 | .369 | (1.225) | 2.091 | .970 | |||||
| Distributions from net investment income | (.257) | (.339) | (.291) | (.111) | (.150) | |||||
| Distributions from net realized gain | (.008) | (.100) | (.304) | (.230) | (.040) | |||||
| Total distributions | (.265) | (.439) | (.595) | (.341) | (.190) | |||||
| Net asset value, end of period | $ | 11.42 | $ | 10.64 | $ | 10.71 | $ | 12.53 | $ | 10.78 |
Total Return D,E | 10.01 % | 3.82% | (10.30)% | 19.69% | 9.77% | |||||
Ratios to Average Net Assets C,F,G | ||||||||||
| Expenses before reductions | .39% | .38% | .38% | .38% | .38% H | |||||
| Expenses net of fee waivers, if any | .39 % | .38% | .38% | .38% | .38% H | |||||
| Expenses net of all reductions | .39% | .38% | .38% | .38% | .38% H | |||||
| Net investment income (loss) | 2.69% | 3.34% | 2.48% | .83% | 1.41% H | |||||
| Supplemental Data | ||||||||||
| Net assets, end of period (000 omitted) | $ | 224 | $ | 347 | $ | 196 | $ | 219 | $ | 183 |
Portfolio turnover rate I | 40 % | 31% | 54% | 46% | 117% H |
Fidelity Managed Retirement 2030 Fund℠ Class K6 |
| Years ended July 31, | 2024 | 2023 | 2022 | 2021 | 2020 A | |||||
Selected Per-Share Data | ||||||||||
| Net asset value, beginning of period | $ | 10.64 | $ | 10.71 | $ | 12.53 | $ | 10.79 | $ | 10.00 |
| Income from Investment Operations | ||||||||||
Net investment income (loss) B,C | .257 | .352 | .303 | .111 | .148 | |||||
| Net realized and unrealized gain (loss) | .790 | .028 | (1.517) | 1.985 | .840 | |||||
| Total from investment operations | 1.047 | .380 | (1.214) | 2.096 | .988 | |||||
| Distributions from net investment income | (.279) | (.350) | (.302) | (.126) | (.158) | |||||
| Distributions from net realized gain | (.008) | (.100) | (.304) | (.230) | (.040) | |||||
| Total distributions | (.287) | (.450) | (.606) | (.356) | (.198) | |||||
| Net asset value, end of period | $ | 11.40 | $ | 10.64 | $ | 10.71 | $ | 12.53 | $ | 10.79 |
Total Return D,E | 10.04 % | 3.93% | (10.21)% | 19.73% | 9.95% | |||||
Ratios to Average Net Assets C,F,G | ||||||||||
| Expenses before reductions | .28% | .28% | .28% | .28% | .28% H | |||||
| Expenses net of fee waivers, if any | .28 % | .28% | .28% | .28% | .28% H | |||||
| Expenses net of all reductions | .28% | .28% | .28% | .28% | .28% H | |||||
| Net investment income (loss) | 2.37% | 3.44% | 2.58% | .93% | 1.51% H | |||||
| Supplemental Data | ||||||||||
| Net assets, end of period (000 omitted) | $ | 10,002 | $ | 2,105 | $ | 892 | $ | 1,459 | $ | 183 |
Portfolio turnover rate I | 40 % | 31% | 54% | 46% | 117% H |
Fidelity Advisor Managed Retirement 2030 Fund℠ Class I |
| Years ended July 31, | 2024 | 2023 | 2022 | 2021 | 2020 A | |||||
Selected Per-Share Data | ||||||||||
| Net asset value, beginning of period | $ | 10.63 | $ | 10.70 | $ | 12.53 | $ | 10.78 | $ | 10.00 |
| Income from Investment Operations | ||||||||||
Net investment income (loss) B,C | .277 | .331 | .277 | .086 | .128 | |||||
| Net realized and unrealized gain (loss) | .755 | .027 | (1.523) | 1.998 | .833 | |||||
| Total from investment operations | 1.032 | .358 | (1.246) | 2.084 | .961 | |||||
| Distributions from net investment income | (.254) | (.328) | (.280) | (.104) | (.141) | |||||
| Distributions from net realized gain | (.008) | (.100) | (.304) | (.230) | (.040) | |||||
| Total distributions | (.262) | (.428) | (.584) | (.334) | (.181) | |||||
| Net asset value, end of period | $ | 11.40 | $ | 10.63 | $ | 10.70 | $ | 12.53 | $ | 10.78 |
Total Return D,E | 9.89 % | 3.71% | (10.46)% | 19.62% | 9.67% | |||||
Ratios to Average Net Assets C,F,G | ||||||||||
| Expenses before reductions | .48% | .48% | .48% | .48% | .48% H | |||||
| Expenses net of fee waivers, if any | .48 % | .48% | .48% | .48% | .48% H | |||||
| Expenses net of all reductions | .48% | .48% | .48% | .48% | .48% H | |||||
| Net investment income (loss) | 2.59% | 3.25% | 2.38% | .73% | 1.31% H | |||||
| Supplemental Data | ||||||||||
| Net assets, end of period (000 omitted) | $ | 335 | $ | 351 | $ | 359 | $ | 421 | $ | 254 |
Portfolio turnover rate I | 40 % | 31% | 54% | 46% | 117% H |
| Domestic Equity Funds - 27.5% | |||
| Shares | Value ($) | ||
| Fidelity Series Blue Chip Growth Fund (a) | 33,718 | 645,031 | |
| Fidelity Series Commodity Strategy Fund (a) | 947 | 88,718 | |
| Fidelity Series Large Cap Growth Index Fund (a) | 18,260 | 414,329 | |
| Fidelity Series Large Cap Stock Fund (a) | 16,143 | 375,814 | |
| Fidelity Series Large Cap Value Index Fund (a) | 46,921 | 772,793 | |
| Fidelity Series Small Cap Core Fund (a) | 14,937 | 185,667 | |
| Fidelity Series Small Cap Opportunities Fund (a) | 7,055 | 114,579 | |
| Fidelity Series Value Discovery Fund (a) | 16,830 | 270,625 | |
| TOTAL DOMESTIC EQUITY FUNDS (Cost $2,542,165) | 2,867,556 | ||
| International Equity Funds - 25.8% | |||
| Shares | Value ($) | ||
| Fidelity Series Canada Fund (a) | 10,669 | 168,151 | |
| Fidelity Series Emerging Markets Fund (a) | 20,652 | 188,962 | |
| Fidelity Series Emerging Markets Opportunities Fund (a) | 40,319 | 756,794 | |
| Fidelity Series International Growth Fund (a) | 22,741 | 421,626 | |
| Fidelity Series International Index Fund (a) | 12,429 | 158,723 | |
| Fidelity Series International Small Cap Fund (a) | 8,711 | 157,931 | |
| Fidelity Series International Value Fund (a) | 31,998 | 419,174 | |
| Fidelity Series Overseas Fund (a) | 29,013 | 418,946 | |
| TOTAL INTERNATIONAL EQUITY FUNDS (Cost $2,483,603) | 2,690,307 | ||
| Bond Funds - 46.7% | |||
| Shares | Value ($) | ||
| Fidelity Series 0-5 Year Inflation-Protected Bond Index Fund (a) | 15,591 | 151,078 | |
| Fidelity Series 5+ Year Inflation-Protected Bond Index Fund (a) | 113,011 | 875,831 | |
| Fidelity Series Corporate Bond Fund (a) | 59,125 | 552,224 | |
| Fidelity Series Emerging Markets Debt Fund (a) | 7,285 | 57,627 | |
| Fidelity Series Emerging Markets Debt Local Currency Fund (a) | 1,600 | 14,481 | |
| Fidelity Series Floating Rate High Income Fund (a) | 1,160 | 10,415 | |
| Fidelity Series Government Bond Index Fund (a) | 92,865 | 855,288 | |
| Fidelity Series High Income Fund (a) | 6,629 | 56,549 | |
| Fidelity Series International Developed Markets Bond Index Fund (a) | 47,679 | 414,329 | |
| Fidelity Series Investment Grade Bond Fund (a) | 82,768 | 834,301 | |
| Fidelity Series Investment Grade Securitized Fund (a) | 60,036 | 539,726 | |
| Fidelity Series Long-Term Treasury Bond Index Fund (a) | 89,254 | 506,073 | |
| Fidelity Series Real Estate Income Fund (a) | 1,049 | 10,357 | |
| TOTAL BOND FUNDS (Cost $4,766,086) | 4,878,279 | ||
| Short-Term Funds - 0.0% | |||
| Shares | Value ($) | ||
| Fidelity Series Government Money Market Fund 5.42% (a)(b) | 1,853 | 1,853 | |
| Fidelity Series Short-Term Credit Fund (a) | 1 | 9 | |
| Fidelity Series Treasury Bill Index Fund (a) | 437 | 4,341 | |
| TOTAL SHORT-TERM FUNDS (Cost $6,201) | 6,203 | ||
| TOTAL INVESTMENT IN SECURITIES - 100.0% (Cost $9,798,055) | 10,442,345 |
NET OTHER ASSETS (LIABILITIES) - 0.0% | (2,573) |
| NET ASSETS - 100.0% | 10,439,772 |
| (a) | Affiliated Fund |
| (b) | The rate quoted is the annualized seven-day yield of the fund at period end. |
| Affiliate | Value, beginning of period ($) | Purchases ($) | Sales Proceeds ($) | Dividend Income ($) | Realized Gain (loss) ($) | Change in Unrealized appreciation (depreciation) ($) | Value, end of period ($) |
| Fidelity Series 0-5 Year Inflation-Protected Bond Index Fund | 12,374 | 163,695 | 27,057 | 1,984 | (41) | 2,107 | 151,078 |
| Fidelity Series 5+ Year Inflation-Protected Bond Index Fund | 112,682 | 910,818 | 163,465 | 16,457 | (2,601) | 18,397 | 875,831 |
| Fidelity Series Blue Chip Growth Fund | 72,617 | 676,710 | 183,905 | 733 | (168) | 79,777 | 645,031 |
| Fidelity Series Canada Fund | 20,362 | 172,649 | 34,612 | 1,674 | (413) | 10,165 | 168,151 |
| Fidelity Series Commodity Strategy Fund | 9,966 | 99,013 | 16,929 | 697 | (556) | (2,776) | 88,718 |
| Fidelity Series Corporate Bond Fund | 73,633 | 600,302 | 136,925 | 11,446 | (1,520) | 16,734 | 552,224 |
| Fidelity Series Emerging Markets Debt Fund | 6,842 | 58,752 | 9,769 | 1,581 | (88) | 1,890 | 57,627 |
| Fidelity Series Emerging Markets Debt Local Currency Fund | 2,310 | 16,656 | 4,277 | 402 | (93) | (115) | 14,481 |
| Fidelity Series Emerging Markets Fund | 22,112 | 201,387 | 43,229 | 1,275 | (259) | 8,951 | 188,962 |
| Fidelity Series Emerging Markets Opportunities Fund | 88,198 | 815,399 | 184,445 | 5,886 | (787) | 38,429 | 756,794 |
| Fidelity Series Floating Rate High Income Fund | 1,323 | 11,147 | 2,012 | 455 | (10) | (33) | 10,415 |
| Fidelity Series Government Bond Index Fund | 107,063 | 910,940 | 178,306 | 12,436 | (1,892) | 17,483 | 855,288 |
| Fidelity Series Government Money Market Fund 5.42% | 9,317 | 63,876 | 71,340 | 707 | - | - | 1,853 |
| Fidelity Series High Income Fund | 7,103 | 58,126 | 9,953 | 1,649 | (70) | 1,343 | 56,549 |
| Fidelity Series International Developed Markets Bond Index Fund | 52,338 | 435,873 | 78,897 | 7,108 | (1,364) | 6,379 | 414,329 |
| Fidelity Series International Growth Fund | 51,347 | 435,884 | 88,188 | 1,615 | (1,618) | 24,201 | 421,626 |
| Fidelity Series International Index Fund | 19,408 | 161,515 | 31,504 | 1,331 | (367) | 9,671 | 158,723 |
| Fidelity Series International Small Cap Fund | 15,933 | 165,543 | 35,800 | 1,671 | (359) | 12,614 | 157,931 |
| Fidelity Series International Value Fund | 51,713 | 430,813 | 97,946 | 4,030 | (535) | 35,129 | 419,174 |
| Fidelity Series Investment Grade Bond Fund | 109,414 | 897,783 | 190,990 | 16,378 | (1,862) | 19,956 | 834,301 |
| Fidelity Series Investment Grade Securitized Fund | 74,265 | 585,348 | 132,714 | 10,729 | (1,625) | 14,452 | 539,726 |
| Fidelity Series Large Cap Growth Index Fund | 45,860 | 434,065 | 110,833 | 1,295 | 158 | 45,079 | 414,329 |
| Fidelity Series Large Cap Stock Fund | 50,866 | 431,752 | 153,762 | 4,847 | 631 | 46,327 | 375,814 |
| Fidelity Series Large Cap Value Index Fund | 94,527 | 810,127 | 194,194 | 9,416 | (437) | 62,770 | 772,793 |
| Fidelity Series Long-Term Treasury Bond Index Fund | 65,009 | 577,905 | 148,947 | 7,882 | (6,114) | 18,220 | 506,073 |
| Fidelity Series Overseas Fund | 51,408 | 425,742 | 90,295 | 2,056 | (849) | 32,940 | 418,946 |
| Fidelity Series Real Estate Income Fund | 1,798 | 11,221 | 2,909 | 294 | (28) | 275 | 10,357 |
| Fidelity Series Short-Term Credit Fund | 4,556 | 54,477 | 59,212 | 419 | 228 | (40) | 9 |
| Fidelity Series Small Cap Core Fund | 330 | 194,832 | 19,285 | 135 | (305) | 10,095 | 185,667 |
| Fidelity Series Small Cap Opportunities Fund | 23,253 | 156,327 | 85,681 | 453 | 364 | 20,316 | 114,579 |
| Fidelity Series Treasury Bill Index Fund | 24,817 | 187,511 | 207,958 | 2,090 | (43) | 14 | 4,341 |
| Fidelity Series Value Discovery Fund | 34,860 | 298,968 | 78,820 | 4,544 | 206 | 15,411 | 270,625 |
| 1,317,604 | 11,455,156 | 2,874,159 | 133,675 | (22,417) | 566,161 | 10,442,345 |
| Valuation Inputs at Reporting Date: | ||||
| Description | Total ($) | Level 1 ($) | Level 2 ($) | Level 3 ($) |
Investments in Securities: | ||||
| Domestic Equity Funds | 2,867,556 | 2,867,556 | - | - |
| International Equity Funds | 2,690,307 | 2,690,307 | - | - |
| Bond Funds | 4,878,279 | 4,878,279 | - | - |
| Short-Term Funds | 6,203 | 6,203 | - | - |
| Total Investments in Securities: | 10,442,345 | 10,442,345 | - | - |
| Statement of Assets and Liabilities | ||||
As of July 31, 2024 | ||||
| Assets | ||||
| Investment in securities, at value - See accompanying schedule: | ||||
Affiliated issuers (cost $9,798,055) | $ | 10,442,345 | ||
| Total Investment in Securities (cost $9,798,055) | $ | 10,442,345 | ||
| Cash | 73 | |||
| Receivable for investments sold | 89,449 | |||
| Receivable for fund shares sold | 6,695 | |||
Total assets | 10,538,562 | |||
| Liabilities | ||||
| Payable for investments purchased | $ | 96,101 | ||
| Payable for fund shares redeemed | 43 | |||
| Accrued management fee | 2,609 | |||
| Distribution and service plan fees payable | 29 | |||
| Other payables and accrued expenses | 8 | |||
| Total liabilities | 98,790 | |||
| Net Assets | $ | 10,439,772 | ||
| Net Assets consist of: | ||||
| Paid in capital | $ | 9,791,669 | ||
| Total accumulated earnings (loss) | 648,103 | |||
| Net Assets | $ | 10,439,772 | ||
| Net Asset Value and Maximum Offering Price | ||||
| Class A : | ||||
Net Asset Value and redemption price per share ($154,508 ÷ 13,347.14 shares)(a) | $ | 11.58 | ||
| Maximum offering price per share (100/94.25 of $11.58) | $ | 12.29 | ||
| Fidelity Managed Retirement 2035 Fund : | ||||
Net Asset Value, offering price and redemption price per share ($1,916,060 ÷ 165,534.85 shares) | $ | 11.57 | ||
| Class K : | ||||
Net Asset Value, offering price and redemption price per share ($119,614 ÷ 10,325.02 shares) | $ | 11.58 | ||
| Class K6 : | ||||
Net Asset Value, offering price and redemption price per share ($8,108,609 ÷ 700,194.37 shares) | $ | 11.58 | ||
| Class I : | ||||
Net Asset Value, offering price and redemption price per share ($140,981 ÷ 12,168.79 shares) | $ | 11.59 | ||
(a)Redemption price per share is equal to net asset value less any applicable contingent deferred sales charge. | ||||
| Statement of Operations | ||||
| Year ended July 31, 2024 | ||||
| Investment Income | ||||
| Dividends: | ||||
| Affiliated issuers | $ | 122,313 | ||
| Expenses | ||||
| Management fee | $ | 16,710 | ||
| Distribution and service plan fees | 300 | |||
| Independent trustees' fees and expenses | 11 | |||
| Miscellaneous | 27 | |||
| Total expenses before reductions | 17,048 | |||
| Expense reductions | (3) | |||
| Total expenses after reductions | 17,045 | |||
| Net Investment income (loss) | 105,268 | |||
| Realized and Unrealized Gain (Loss) | ||||
| Net realized gain (loss) on: | ||||
| Investment Securities: | ||||
| Affiliated issuers | (22,417) | |||
| Capital gain distributions from underlying funds: | ||||
| Affiliated issuers | 11,362 | |||
| Total net realized gain (loss) | (11,055) | |||
| Change in net unrealized appreciation (depreciation) on: | ||||
| Investment Securities: | ||||
| Affiliated issuers | 566,161 | |||
| Total change in net unrealized appreciation (depreciation) | 566,161 | |||
| Net gain (loss) | 555,106 | |||
| Net increase (decrease) in net assets resulting from operations | $ | 660,374 | ||
| Statement of Changes in Net Assets | ||||
Year ended July 31, 2024 | For the period December 15, 2022 (commencement of operations) through July 31, 2023 | |||
| Increase (Decrease) in Net Assets | ||||
| Operations | ||||
| Net investment income (loss) | $ | 105,268 | $ | 7,423 |
| Net realized gain (loss) | (11,055) | 3,205 | ||
| Change in net unrealized appreciation (depreciation) | 566,161 | 78,129 | ||
| Net increase (decrease) in net assets resulting from operations | 660,374 | 88,757 | ||
| Distributions to shareholders | (95,345) | (5,680) | ||
| Share transactions - net increase (decrease) | 8,557,117 | 1,234,549 | ||
| Total increase (decrease) in net assets | 9,122,146 | 1,317,626 | ||
| Net Assets | ||||
| Beginning of period | 1,317,626 | - | ||
| End of period | $ | 10,439,772 | $ | 1,317,626 |
Fidelity Advisor Managed Retirement 2035 Fund℠ Class A |
| Years ended July 31, | 2024 | 2023 A | ||
Selected Per-Share Data | ||||
| Net asset value, beginning of period | $ | 10.75 | $ | 10.00 |
| Income from Investment Operations | ||||
Net investment income (loss) B,C | .233 | .048 | ||
| Net realized and unrealized gain (loss) | .853 | .736 | ||
| Total from investment operations | 1.086 | .784 | ||
| Distributions from net investment income | (.202) | (.034) | ||
| Distributions from net realized gain | (.054) | - | ||
| Total distributions | (.256) | (.034) | ||
| Net asset value, end of period | $ | 11.58 | $ | 10.75 |
Total Return D,E,F | 10.31 % | 7.86% | ||
Ratios to Average Net Assets C,G,H | ||||
| Expenses before reductions | .73% | .73% I | ||
| Expenses net of fee waivers, if any | .73 % | .73% I | ||
| Expenses net of all reductions | .73% | .73% I | ||
| Net investment income (loss) | 2.16% | .75% I | ||
| Supplemental Data | ||||
| Net assets, end of period (000 omitted) | $ | 155 | $ | 115 |
Portfolio turnover rate J | 60 % | 59% I |
Fidelity Managed Retirement 2035 Fund℠ |
| Years ended July 31, | 2024 | 2023 A | ||
Selected Per-Share Data | ||||
| Net asset value, beginning of period | $ | 10.75 | $ | 10.00 |
| Income from Investment Operations | ||||
Net investment income (loss) B,C | .261 | .065 | ||
| Net realized and unrealized gain (loss) | .843 | .735 | ||
| Total from investment operations | 1.104 | .800 | ||
| Distributions from net investment income | (.230) | (.050) | ||
| Distributions from net realized gain | (.054) | - | ||
| Total distributions | (.284) | (.050) | ||
| Net asset value, end of period | $ | 11.57 | $ | 10.75 |
Total Return D,E | 10.50 % | 8.02% | ||
Ratios to Average Net Assets C,F,G | ||||
| Expenses before reductions | .48% | .48% H | ||
| Expenses net of fee waivers, if any | .48 % | .48% H | ||
| Expenses net of all reductions | .48% | .48% H | ||
| Net investment income (loss) | 2.41% | 1.00% H | ||
| Supplemental Data | ||||
| Net assets, end of period (000 omitted) | $ | 1,916 | $ | 765 |
Portfolio turnover rate I | 60 % | 59% H |
Fidelity Managed Retirement 2035 Fund℠ Class K |
| Years ended July 31, | 2024 | 2023 A | ||
Selected Per-Share Data | ||||
| Net asset value, beginning of period | $ | 10.76 | $ | 10.00 |
| Income from Investment Operations | ||||
Net investment income (loss) B,C | .271 | .071 | ||
| Net realized and unrealized gain (loss) | .842 | .739 | ||
| Total from investment operations | 1.113 | .810 | ||
| Distributions from net investment income | (.239) | (.050) | ||
| Distributions from net realized gain | (.054) | - | ||
| Total distributions | (.293) | (.050) | ||
| Net asset value, end of period | $ | 11.58 | $ | 10.76 |
Total Return D,E | 10.58 % | 8.12% | ||
Ratios to Average Net Assets C,F,G | ||||
| Expenses before reductions | .38% | .38% H | ||
| Expenses net of fee waivers, if any | .38 % | .38% H | ||
| Expenses net of all reductions | .38% | .38% H | ||
| Net investment income (loss) | 2.51% | 1.10% H | ||
| Supplemental Data | ||||
| Net assets, end of period (000 omitted) | $ | 120 | $ | 108 |
Portfolio turnover rate I | 60 % | 59% H |
Fidelity Managed Retirement 2035 Fund℠ Class K6 |
| Years ended July 31, | 2024 | 2023 A | ||
Selected Per-Share Data | ||||
| Net asset value, beginning of period | $ | 10.76 | $ | 10.00 |
| Income from Investment Operations | ||||
Net investment income (loss) B,C | .232 | .077 | ||
| Net realized and unrealized gain (loss) | .896 | .739 | ||
| Total from investment operations | 1.128 | .816 | ||
| Distributions from net investment income | (.254) | (.056) | ||
| Distributions from net realized gain | (.054) | - | ||
| Total distributions | (.308) | (.056) | ||
| Net asset value, end of period | $ | 11.58 | $ | 10.76 |
Total Return D,E | 10.73 % | 8.19% | ||
Ratios to Average Net Assets C,F,G | ||||
| Expenses before reductions | .28% | .28% H | ||
| Expenses net of fee waivers, if any | .28 % | .28% H | ||
| Expenses net of all reductions | .28% | .28% H | ||
| Net investment income (loss) | 2.11% | 1.20% H | ||
| Supplemental Data | ||||
| Net assets, end of period (000 omitted) | $ | 8,109 | $ | 108 |
Portfolio turnover rate I | 60 % | 59% H |
Fidelity Advisor Managed Retirement 2035 Fund℠ Class I |
| Years ended July 31, | 2024 | 2023 A | ||
Selected Per-Share Data | ||||
| Net asset value, beginning of period | $ | 10.76 | $ | 10.00 |
| Income from Investment Operations | ||||
Net investment income (loss) B,C | .261 | .064 | ||
| Net realized and unrealized gain (loss) | .849 | .741 | ||
| Total from investment operations | 1.110 | .805 | ||
| Distributions from net investment income | (.226) | (.045) | ||
| Distributions from net realized gain | (.054) | - | ||
| Total distributions | (.280) | (.045) | ||
| Net asset value, end of period | $ | 11.59 | $ | 10.76 |
Total Return D,E | 10.54 % | 8.07% | ||
Ratios to Average Net Assets C,F,G | ||||
| Expenses before reductions | .48% | .48% H | ||
| Expenses net of fee waivers, if any | .48 % | .48% H | ||
| Expenses net of all reductions | .48% | .48% H | ||
| Net investment income (loss) | 2.41% | 1.00% H | ||
| Supplemental Data | ||||
| Net assets, end of period (000 omitted) | $ | 141 | $ | 113 |
Portfolio turnover rate I | 60 % | 59% H |
| Tax cost ($) | Gross unrealized appreciation ($) | Gross unrealized depreciation ($) | Net unrealized appreciation (depreciation)($) | |
Fidelity Managed Retirement Income Fund | 15,127,171 | 707,743 | (1,082,618) | (374,875) |
| Fidelity Managed Retirement 2010 Fund. | 5,467,074 | 329,616 | (322,328) | 7,288 |
| Fidelity Managed Retirement 2015 Fund. | 5,440,542 | 417,530 | (376,266) | 41,264 |
| Fidelity Managed Retirement 2020 Fund. | 8,239,262 | 757,357 | (621,544) | 135,813 |
| Fidelity Managed Retirement 2025 Fund. | 49,103,120 | 4,912,497 | (3,936,956) | 975,541 |
| Fidelity Managed Retirement 2030 Fund. | 42,398,601 | 3,624,399 | (3,402,033) | 222,366 |
| Fidelity Managed Retirement 2035 Fund. | 9,828,315 | 642,010 | (27,980) | 614,030 |
| Undistributed ordinary income ($) | Undistributed long-term capital gain ($) | Capital loss carryforward ($) | Net unrealized appreciation (depreciation) on securities and other investments ($) | |
Fidelity Managed Retirement Income Fund | 55,444 | - | (847,486) | (374,875) |
| Fidelity Managed Retirement 2010 Fund. | 20,404 | - | (169,597) | 7,288 |
| Fidelity Managed Retirement 2015 Fund. | 20,858 | - | (216,033) | 41,264 |
| Fidelity Managed Retirement 2020 Fund. | 26,367 | - | (342,169) | 135,813 |
| Fidelity Managed Retirement 2025 Fund. | 132,473 | - | (1,722,909) | 975,541 |
| Fidelity Managed Retirement 2030 Fund. | 105,606 | - | (1,027,680) | 222,366 |
| Fidelity Managed Retirement 2035 Fund. | 25,990 | 8,083 | - | 614,030 |
| Short-term ($) | Long-term ($) | Total capital loss carryforward ($) | |
Fidelity Managed Retirement Income Fund | (147,808) | (699,678) | (847,486) |
| Fidelity Managed Retirement 2010 Fund. | (21,687) | (147,910) | (169,597) |
| Fidelity Managed Retirement 2015 Fund. | (31,655) | (184,378) | (216,033) |
| Fidelity Managed Retirement 2020 Fund. | (71,796) | (270,373) | (342,169) |
| Fidelity Managed Retirement 2025 Fund. | (193,107) | (1,529,802) | (1,722,909) |
| Fidelity Managed Retirement 2030 Fund. | - | (1,027,680) | (1,027,680) |
| July 31, 2024 | |||
| Ordinary Income ($) | Long-term Capital Gains ($) | Total ($) | |
Fidelity Managed Retirement Income Fund | 440,966 | - | 440,966 |
| Fidelity Managed Retirement 2010 Fund. | 178,041 | - | 178,041 |
| Fidelity Managed Retirement 2015 Fund. | 160,658 | - | 160,658 |
| Fidelity Managed Retirement 2020 Fund. | 239,352 | - | 239,352 |
| Fidelity Managed Retirement 2025 Fund. | 1,330,242 | - | 1,330,242 |
| Fidelity Managed Retirement 2030 Fund. | 984,355 | - | 984,355 |
| Fidelity Managed Retirement 2035 Fund. | 94,410 | 935 | 95,345 |
| July 31, 2023 | |||
| Ordinary Income ($) | Long-term Capital Gains ($) | Total ($) | |
Fidelity Managed Retirement Income Fund | 641,673 | 208,756 | 850,429 |
| Fidelity Managed Retirement 2010 Fund. | 232,387 | 107,580 | 339,967 |
| Fidelity Managed Retirement 2015 Fund. | 230,915 | 107,231 | 338,146 |
| Fidelity Managed Retirement 2020 Fund. | 325,626 | 34,558 | 360,184 |
| Fidelity Managed Retirement 2025 Fund. | 1,752,862 | 854,980 | 2,607,842 |
| Fidelity Managed Retirement 2030 Fund. | 1,151,131 | 342,980 | 1,494,111 |
Fidelity Managed Retirement 2035 Fund A | 5,680 | - | 5,680 |
| Purchases ($) | Sales ($) | |
| Fidelity Managed Retirement Income Fund | 4,973,028 | 7,077,324 |
| Fidelity Managed Retirement 2010 Fund | 1,496,928 | 2,400,968 |
| Fidelity Managed Retirement 2015 Fund | 1,958,836 | 3,068,776 |
| Fidelity Managed Retirement 2020 Fund | 2,776,853 | 3,638,784 |
| Fidelity Managed Retirement 2025 Fund | 18,108,419 | 23,929,849 |
| Fidelity Managed Retirement 2030 Fund | 16,486,774 | 15,663,807 |
| Fidelity Managed Retirement 2035 Fund | 11,455,156 | 2,874,159 |
Annual % of Class-Level Average Net Assets (Classes A, Retail and I) | Annual % of Class-Level Average Net Assets (Classes K, K6 and Z6) | |
| Fidelity Managed Retirement Income Fund | .45% | .35% |
| Fidelity Managed Retirement 2010 Fund | .45% | .35% |
| Fidelity Managed Retirement 2015 Fund | .46% | .36% |
| Fidelity Managed Retirement 2020 Fund | .47% | .37% |
| Fidelity Managed Retirement 2025 Fund | .47% | .37% |
| Fidelity Managed Retirement 2030 Fund | .48% | .38% |
| Fidelity Managed Retirement 2035 Fund | .48% | .38% |
Annual % of Class-Level Average Net Assets (Classes K6 and Z6) | |
| Fidelity Managed Retirement Income Fund | .25% |
| Fidelity Managed Retirement 2010 Fund | .25% |
| Fidelity Managed Retirement 2015 Fund | .26% |
| Fidelity Managed Retirement 2020 Fund | .27% |
| Fidelity Managed Retirement 2025 Fund | .27% |
| Fidelity Managed Retirement 2030 Fund | .28% |
| Fidelity Managed Retirement 2035 Fund | .28% |
| Distribution Fee | Service Fee | Total Fees ($) | Retained by FDC ($) | |
| Fidelity Managed Retirement Income Fund | ||||
| Class A | - % | .25% | 2,068 | 1,544 |
| 2,068 | 1,544 | |||
| Fidelity Managed Retirement 2010 Fund | ||||
| Class A | - % | .25% | 438 | 116 |
| 438 | 116 | |||
| Fidelity Managed Retirement 2015 Fund | ||||
| Class A | - % | .25% | 2,497 | - |
| 2,497 | - | |||
| Fidelity Managed Retirement 2020 Fund | ||||
| Class A | - % | .25% | 551 | 233 |
| 551 | 233 | |||
| Fidelity Managed Retirement 2025 Fund | ||||
| Class A | - % | .25% | 4,405 | 971 |
| 4,405 | 971 | |||
| Fidelity Managed Retirement 2030 Fund | ||||
| Class A | - % | .25% | 1,622 | 876 |
| 1,622 | 876 | |||
| Fidelity Managed Retirement 2035 Fund | ||||
| Class A | - % | .25% | 300 | 275 |
| 300 | 275 |
| Retained by FDC ($) | |
| Fidelity Managed Retirement Income Fund | |
| Class A | 5 |
| Fidelity Managed Retirement 2010 Fund | |
| Class A | - |
| Fidelity Managed Retirement 2015 Fund | |
| Class A | 29 |
| Fidelity Managed Retirement 2020 Fund | |
| Class A | 76 |
| Fidelity Managed Retirement 2025 Fund | |
| Class A | - |
| Fidelity Managed Retirement 2030 Fund | |
| Class A | 954 |
| Fidelity Managed Retirement 2035 Fund | |
| Class A | 54 |
| Custodian credits ($) | |
| Fidelity Managed Retirement Income Fund | 1 |
| Fidelity Managed Retirement 2010 Fund | 2 |
| Fidelity Managed Retirement 2020 Fund | 2 |
| Fidelity Managed Retirement 2025 Fund | 16 |
| Fidelity Managed Retirement 2030 Fund | 7 |
| Fidelity Managed Retirement 2035 Fund | 3 |
Year ended July 31, 2024A | Year ended July 31, 2023B | |
| Fidelity Managed Retirement Income Fund | ||
| Distributions to shareholders | ||
| Class A | $22,867 | $30,825 |
| Fidelity Managed Retirement Income | 376,238 | 765,103 |
| Class K | 3,847 | 5,595 |
| Class K6 | 30,378 | 36,074 |
| Class I | 4,412 | 7,544 |
| Class Z6 | 3,224 | 5,288 |
Total | $440,966 | $850,429 |
| Fidelity Managed Retirement 2010 Fund | ||
| Distributions to shareholders | ||
| Class A | $4,523 | $15,168 |
| Fidelity Managed Retirement 2010 | 146,806 | 287,106 |
| Class K | 3,844 | 5,856 |
| Class K6 | 15,376 | 17,663 |
| Class I | 2,791 | 5,302 |
| Class Z6 | 4,701 | 8,872 |
Total | $178,041 | $339,967 |
| Fidelity Managed Retirement 2015 Fund | ||
| Distributions to shareholders | ||
| Class A | $25,686 | $ 57,506 |
| Fidelity Managed Retirement 2015 | 113,440 | 236,084 |
| Class K | 4,646 | 5,945 |
| Class K6 | 7,442 | 19,064 |
| Class I | 6,293 | 13,748 |
| Class Z6 | 3,151 | 5,799 |
Total | $160,658 | $338,146 |
| Fidelity Managed Retirement 2020 Fund | ||
| Distributions to shareholders | ||
| Class A | $5,447 | $19,273 |
| Fidelity Managed Retirement 2020 | 195,822 | 286,009 |
| Class K | 4,489 | 4,448 |
| Class K6 | 25,047 | 37,690 |
| Class I | 5,425 | 8,321 |
| Class Z6 | 3,122 | 4,443 |
Total | $239,352 | $360,184 |
| Fidelity Managed Retirement 2025 Fund | ||
| Distributions to shareholders | ||
| Class A | $41,244 | $75,727 |
| Fidelity Managed Retirement 2025 | 1,115,505 | 2,377,382 |
| Class K | 17,403 | 6,792 |
| Class K6 | 148,355 | 122,627 |
| Class I | 4,204 | 19,622 |
| Class Z6 | 3,531 | 5,692 |
Total | $1,330,242 | $2,607,842 |
| Fidelity Managed Retirement 2030 Fund | ||
| Distributions to shareholders | ||
| Class A | $14,117 | $15,906 |
| Fidelity Managed Retirement 2030 Fund | 787,236 | 1,412,691 |
| Class K | 18,627 | 9,749 |
| Class K6 | 149,642 | 34,156 |
| Class I | 9,055 | 12,934 |
| Class Z6 | 5,678 | 8,675 |
Total | $984,355 | $1,494,111 |
| Fidelity Managed Retirement 2035 Fund | ||
| Distributions to shareholders | ||
| Class A | $2,773 | $340 |
| Fidelity Managed Retirement 2035 Fund | 32,045 | 3,249 |
| Class K | 2,972 | 501 |
| Class K6 | 51,660 | 561 |
| Class I | 3,005 | 468 |
| Class Z6 | 2,890 | 561 |
Total | $95,345 | $5,680 |
| Shares | Shares | Dollars | Dollars | |
Year ended July 31, 2024A | Year ended July 31, 2023B | Year ended July 31, 2024A | Year ended July 31, 2023B | |
| Fidelity Managed Retirement Income Fund | ||||
| Class A | ||||
| Shares sold | 619 | 3,627 | $32,729 | $195,073 |
| Reinvestment of distributions | 410 | 565 | 22,245 | 29,856 |
| Shares redeemed | (890) | (1,940) | (48,349) | (104,167) |
| Net increase (decrease) | 139 | 2,252 | $6,625 | $120,762 |
| Fidelity Managed Retirement Income | ||||
| Shares sold | 9,624 | 27,223 | $524,447 | $1,477,101 |
| Reinvestment of distributions | 5,759 | 12,187 | 311,753 | 644,354 |
| Shares redeemed | (82,150) | (54,848) | (4,426,056) | (2,924,303) |
| Net increase (decrease) | (66,767) | (15,438) | $(3,589,856) | $(802,848) |
| Class K | ||||
| Shares sold | 15 | 727 | $805 | $38,462 |
| Reinvestment of distributions | 71 | 106 | 3,847 | 5,595 |
| Shares redeemed | (463) | (297) | (25,104) | (15,918) |
| Net increase (decrease) | (377) | 536 | $(20,452) | $28,139 |
| Class K6 | ||||
| Shares sold | 45,953 | 3,785 | $2,505,991 | $206,587 |
| Reinvestment of distributions | 557 | 683 | 30,359 | 36,074 |
| Shares redeemed | (16,989) | (7,900) | (916,807) | (413,843) |
| Net increase (decrease) | 29,521 | (3,432) | $1,619,543 | $(171,182) |
| Class I | ||||
| Shares sold | - | 586 | $ - | $31,608 |
| Reinvestment of distributions | 81 | 135 | 4,413 | 7,118 |
| Shares redeemed | (1,012) | (895) | (55,431) | (47,227) |
| Net increase (decrease) | (931) | (174) | $(51,018) | $(8,501) |
| Class Z6 | ||||
| Shares sold | 93 | - | $5,000 | $ - |
| Reinvestment of distributions | 60 | 100 | 3,224 | 5,288 |
| Shares redeemed | (2,141) | - | (117,735) | - |
| Net increase (decrease) | (1,988) | 100 | $(109,511) | $5,288 |
| Fidelity Managed Retirement 2010 Fund | ||||
| Class A | ||||
| Reinvestment of distributions | 87 | 301 | 4,523 | 15,168 |
| Shares redeemed | (1,692) | (1,638) | (83,859) | (83,733) |
| Net increase (decrease) | (1,605) | (1,337) | $(79,336) | $(68,565) |
| Fidelity Managed Retirement 2010 | ||||
| Shares sold | 2,037 | 3,923 | $102,395 | $200,194 |
| Reinvestment of distributions | 2,204 | 4,718 | 114,113 | 238,071 |
| Shares redeemed | (25,909) | (11,670) | (1,346,989) | (596,306) |
| Net increase (decrease) | (21,668) | (3,029) | $(1,130,481) | $(158,041) |
| Class K | ||||
| Shares sold | - | 366 | $ - | $18,719 |
| Reinvestment of distributions | 74 | 116 | 3,844 | 5,856 |
| Shares redeemed | (378) | - | (19,727) | - |
| Net increase (decrease) | (304) | 482 | $(15,883) | $24,575 |
| Class K6 | ||||
| Shares sold | 9,961 | 379 | $506,540 | $19,151 |
| Reinvestment of distributions | 296 | 351 | 15,376 | 17,663 |
| Shares redeemed | (994) | (1,351) | (50,560) | (68,089) |
| Net increase (decrease) | 9,263 | (621) | $471,356 | $(31,275) |
| Class I | ||||
| Reinvestment of distributions | 54 | 105 | 2,791 | 5,302 |
| Shares redeemed | - | (214) | - | (10,928) |
| Net increase (decrease) | 54 | (109) | $2,791 | $(5,626) |
| Class Z6 | ||||
| Reinvestment of distributions | 91 | 176 | 4,701 | 8,872 |
| Shares redeemed | (3,298) | (43) | (173,454) | (2,153) |
| Net increase (decrease) | (3,207) | 133 | $(168,753) | $6,719 |
| Fidelity Managed Retirement 2015 Fund | ||||
| Class A | ||||
| Shares sold | 110 | - | $5,851 | $ - |
| Reinvestment of distributions | 507 | 1,181 | 25,686 | 57,506 |
| Shares redeemed | (2,145) | (4,218) | (108,036) | (210,819) |
| Net increase (decrease) | (1,528) | (3,037) | $(76,499) | $(153,313) |
| Fidelity Managed Retirement 2015 | ||||
| Shares sold | 607 | 6,953 | $30,788 | $340,470 |
| Reinvestment of distributions | 1,930 | 4,392 | 97,752 | 214,460 |
| Shares redeemed | (23,995) | (10,936) | (1,206,486) | (540,007) |
| Net increase (decrease) | (21,458) | 409 | $(1,077,946) | $14,923 |
| Class K | ||||
| Shares sold | 18 | 1,148 | $869 | $57,268 |
| Reinvestment of distributions | 92 | 122 | 4,645 | 5,945 |
| Shares redeemed | (1,198) | - | (61,252) | - |
| Net increase (decrease) | (1,088) | 1,270 | $(55,738) | $63,213 |
| Class K6 | ||||
| Shares sold | 18,928 | 178 | $985,970 | $8,810 |
| Reinvestment of distributions | 146 | 389 | 7,442 | 19,064 |
| Shares redeemed | (13,128) | (13,320) | (689,294) | (673,024) |
| Net increase (decrease) | 5,946 | (12,753) | $304,118 | $(645,150) |
| Class I | ||||
| Shares sold | - | 17 | $ - | $863 |
| Reinvestment of distributions | 124 | 281 | 6,293 | 13,711 |
| Shares redeemed | (2,232) | (601) | (113,699) | (29,656) |
| Net increase (decrease) | (2,108) | (303) | $(107,406) | $(15,082) |
| Class Z6 | ||||
| Reinvestment of distributions | 62 | 119 | 3,151 | 5,799 |
| Shares redeemed | (2,306) | - | (119,606) | - |
| Net increase (decrease) | (2,244) | 119 | $(116,455) | $5,799 |
| Fidelity Managed Retirement 2020 Fund | ||||
| Class A | ||||
| Shares sold | 190 | 2,463 | $9,424 | $121,452 |
| Reinvestment of distributions | 106 | 401 | 5,447 | 19,273 |
| Shares redeemed | (1,080) | (8,092) | (54,996) | (404,954) |
| Net increase (decrease) | (784) | (5,228) | $(40,125) | $(264,229) |
| Fidelity Managed Retirement 2020 | ||||
| Shares sold | 14,347 | 12,552 | $712,439 | $628,868 |
| Reinvestment of distributions | 3,495 | 5,374 | 179,217 | 259,182 |
| Shares redeemed | (34,964) | (32,324) | (1,802,018) | (1,575,144) |
| Net increase (decrease) | (17,122) | (14,398) | $(910,362) | $(687,094) |
| Class K | ||||
| Shares sold | 657 | 475 | $32,465 | $23,783 |
| Reinvestment of distributions | 88 | 92 | 4,489 | 4,448 |
| Shares redeemed | (1,158) | - | (60,061) | - |
| Net increase (decrease) | (413) | 567 | $(23,107) | $28,231 |
| Class K6 | ||||
| Shares sold | 15,378 | 1,248 | $800,434 | $62,179 |
| Reinvestment of distributions | 487 | 781 | 25,047 | 37,690 |
| Shares redeemed | (10,468) | (8,929) | (560,410) | (438,956) |
| Net increase (decrease) | 5,397 | (6,900) | $265,071 | $(339,087) |
| Class I | ||||
| Shares sold | - | 13 | $ - | $618 |
| Reinvestment of distributions | 106 | 172 | 5,424 | 8,288 |
| Shares redeemed | (1,370) | (711) | (70,556) | (35,756) |
| Net increase (decrease) | (1,264) | (526) | $(65,132) | $(26,850) |
| Class Z6 | ||||
| Reinvestment of distributions | 61 | 92 | 3,122 | 4,443 |
| Shares redeemed | (2,348) | - | (123,779) | - |
| Net increase (decrease) | (2,287) | 92 | $(120,657) | $4,443 |
| Fidelity Managed Retirement 2025 Fund | ||||
| Class A | ||||
| Shares sold | 12,594 | 1,080 | $663,332 | $55,268 |
| Reinvestment of distributions | 779 | 1,528 | 41,244 | 75,727 |
| Shares redeemed | (6,848) | (4,001) | (354,892) | (205,772) |
| Net increase (decrease) | 6,525 | (1,393) | $349,684 | $(74,777) |
| Fidelity Managed Retirement 2025 | ||||
| Shares sold | 47,786 | 97,735 | $2,533,499 | $5,028,821 |
| Reinvestment of distributions | 15,439 | 40,549 | 816,958 | 2,018,409 |
| Shares redeemed | (287,184) | (196,184) | (15,162,844) | (9,971,080) |
| Net increase (decrease) | (223,959) | (57,900) | $(11,812,387) | $(2,923,850) |
| Class K | ||||
| Shares sold | 11,870 | 4,979 | $617,200 | $256,058 |
| Reinvestment of distributions | 328 | 129 | 17,402 | 6,433 |
| Shares redeemed | (16,786) | (349) | (899,494) | (17,869) |
| Net increase (decrease) | (4,588) | 4,759 | $(264,892) | $244,622 |
| Class K6 | ||||
| Shares sold | 181,593 | 32,944 | $9,748,530 | $1,672,600 |
| Reinvestment of distributions | 2,783 | 2,463 | 148,354 | 122,627 |
| Shares redeemed | (72,949) | (17,193) | (3,941,193) | (871,481) |
| Net increase (decrease) | 111,427 | 18,214 | $5,955,691 | $923,746 |
| Class I | ||||
| Shares sold | 32 | 1,828 | $1,700 | $92,326 |
| Reinvestment of distributions | 76 | 394 | 4,053 | 19,622 |
| Shares redeemed | (2,258) | (9,270) | (121,932) | (468,440) |
| Net increase (decrease) | (2,150) | (7,048) | $(116,179) | $(356,492) |
| Class Z6 | ||||
| Shares sold | 3,518 | - | $187,582 | $ - |
| Reinvestment of distributions | 58 | 114 | 3,078 | 5,692 |
| Shares redeemed | (5,841) | - | (319,166) | - |
| Net increase (decrease) | (2,265) | 114 | $(128,506) | $5,692 |
| Fidelity Managed Retirement 2030 Fund | ||||
| Class A | ||||
| Shares sold | 35,935 | 18,613 | $392,812 | $194,871 |
| Reinvestment of distributions | 1,320 | 1,611 | 14,117 | 15,906 |
| Shares redeemed | (2,644) | (11,369) | (28,501) | (114,724) |
| Net increase (decrease) | 34,611 | 8,855 | $378,428 | $96,053 |
| Fidelity Managed Retirement 2030 Fund | ||||
| Shares sold | 212,465 | 723,736 | $2,280,791 | $7,415,873 |
| Reinvestment of distributions | 59,647 | 121,301 | 637,307 | 1,200,188 |
| Shares redeemed | (874,931) | (542,920) | (9,338,391) | (5,507,199) |
| Net increase (decrease) | (602,819) | 302,117 | $(6,420,293) | $3,108,862 |
| Class K | ||||
| Shares sold | 117,533 | 13,268 | $1,241,395 | $134,681 |
| Reinvestment of distributions | 1,739 | 981 | 18,627 | 9,749 |
| Shares redeemed | (132,215) | (2) | (1,443,916) | (21) |
| Net increase (decrease) | (12,943) | 14,247 | $(183,894) | $144,409 |
| Class K6 | ||||
| Shares sold | 850,666 | 146,146 | $9,109,088 | $1,498,389 |
| Reinvestment of distributions | 13,850 | 3,423 | 149,642 | 34,156 |
| Shares redeemed | (185,270) | (34,929) | (1,992,400) | (372,535) |
| Net increase (decrease) | 679,246 | 114,640 | $7,266,330 | $1,160,010 |
| Class I | ||||
| Shares sold | 3,334 | 3,910 | $35,240 | $39,746 |
| Reinvestment of distributions | 846 | 1,305 | 9,055 | 12,934 |
| Shares redeemed | (7,774) | (5,815) | (86,559) | (58,499) |
| Net increase (decrease) | (3,594) | (600) | $(42,264) | $(5,819) |
| Class Z6 | ||||
| Shares sold | - | 14,761 | $ - | $152,590 |
| Reinvestment of distributions | 486 | 859 | 5,185 | 8,523 |
| Shares redeemed | (33,062) | (1,499) | (351,596) | (15,434) |
| Net increase (decrease) | (32,576) | 14,121 | $(346,411) | $145,679 |
| Fidelity Managed Retirement 2035 Fund | ||||
| Class A | ||||
| Shares sold | 3,070 | 10,668 | $34,553 | $107,138 |
| Reinvestment of distributions | 258 | 33 | 2,773 | 340 |
| Shares redeemed | (682) | - | (7,482) | - |
| Net increase (decrease) | 2,646 | 10,701 | $29,844 | $107,478 |
| Fidelity Managed Retirement 2035 Fund | ||||
| Shares sold | 125,359 | 103,506 | $1,344,450 | $1,054,826 |
| Reinvestment of distributions | 1,815 | 120 | 19,586 | 1,244 |
| Shares redeemed | (32,725) | (32,540) | (343,063) | (336,222) |
| Net increase (decrease) | 94,449 | 71,086 | $1,020,973 | $719,848 |
| Class K | ||||
| Shares sold | - | 10,000 | $ - | $100,000 |
| Reinvestment of distributions | 276 | 49 | 2,972 | 501 |
| Net increase (decrease) | 276 | 10,049 | $2,972 | $100,501 |
| Class K6 | ||||
| Shares sold | 862,421 | 10,013 | $9,523,331 | $100,135 |
| Reinvestment of distributions | 4,698 | 54 | 51,661 | 561 |
| Shares redeemed | (176,992) | - | (1,975,854) | (3) |
| Net increase (decrease) | 690,127 | 10,067 | $7,599,138 | $100,693 |
| Class I | ||||
| Shares sold | 1,857 | 10,485 | $20,300 | $105,000 |
| Reinvestment of distributions | 279 | 45 | 3,005 | 468 |
| Shares redeemed | (498) | - | (5,365) | - |
| Net increase (decrease) | 1,638 | 10,530 | $17,940 | $105,468 |
| Class Z6 | ||||
| Shares sold | - | 10,000 | $ - | $100,000 |
| Reinvestment of distributions | 270 | 54 | 2,891 | 561 |
| Shares redeemed | (10,324) | - | (116,641) | - |
| Net increase (decrease) | (10,054) | 10,054 | $(113,750) | $100,561 |
| Fidelity Managed Retirement 2035 Fund | $8,841 |
| Fidelity Managed Retirement Income Fund | 47.67% |
| Fidelity Managed Retirement 2010 Fund | 46.42% |
| Fidelity Managed Retirement 2015 Fund | 43.26% |
| Fidelity Managed Retirement 2020 Fund | 39.35% |
| Fidelity Managed Retirement 2025 Fund | 35.76% |
| Fidelity Managed Retirement 2030 Fund | 33.88% |
| Fidelity Managed Retirement 2035 Fund | 35.91% |
| Class A | Retail Class | Class K | Class K6 | Class I | Class Z6 | |
| Fidelity Managed Retirement Income Fund | ||||||
| August 2023 | 0.00% | 0.00% | 0.00% | 0.00% | 0.00% | 0.00% |
| September 2023 | 10.66% | 9.19% | 8.65% | 8.17% | 9.08% | 8.26% |
| October 2023 | 16.37% | 14.75% | 14.00% | 14.24% | 14.62% | 13.42% |
| November 2023 | 16.61% | 14.75% | 14.11% | 13.82% | 14.75% | 13.53% |
| December 2023 | 15.31% | 14.81% | 14.58% | 14.23% | 14.79% | 14.39% |
| February 2024 | 0.65% | 0.56% | 0.54% | 0.50% | 0.56% | 0.51% |
| March 2024 | 0.65% | 0.56% | 0.53% | 0.50% | 0.56% | 0.51% |
| April 2024 | 0.67% | 0.57% | 0.55% | 0.49% | 0.57% | 0.50% |
| May 2024 | 0.62% | 0.56% | 0.54% | 0.53% | 0.56% | 0.53% |
| June 2024 | 0.66% | 0.57% | 0.53% | 0.50% | 0.57% | - |
| July 2024 | 0.65% | 0.57% | 0.53% | 0.50% | 0.58% | - |
| Fidelity Managed Retirement 2010 Fund | ||||||
| August 2023 | 0.00% | 0.00% | 0.00% | 0.00% | 0.00% | 0.00% |
| September 2023 | 12.94% | 11.18% | 10.65% | 10.41% | 11.18% | 10.18% |
| October 2023 | 22.87% | 16.61% | 15.78% | 15.18% | 16.61% | 15.03% |
| November 2023 | 20.84% | 16.78% | 15.96% | 14.52% | 16.78% | 15.21% |
| December 2023 | 17.21% | 16.65% | 16.42% | 16.21% | 16.65% | 16.21% |
| February 2024 | 0.75% | 0.66% | 0.62% | 0.60% | 0.67% | 0.60% |
| March 2024 | 0.76% | 0.66% | 0.63% | 0.58% | 0.66% | 0.59% |
| April 2024 | 0.77% | 0.66% | 0.64% | 0.57% | 0.65% | 0.58% |
| May 2024 | 0.72% | 0.66% | 0.62% | 0.60% | 0.65% | 0.60% |
| June 2024 | 0.77% | 0.66% | 0.62% | 0.57% | 0.65% | - |
| July 2024 | 0.75% | 0.66% | 0.62% | 0.59% | 0.66% | - |
| Fidelity Managed Retirement 2015 Fund | ||||||
| August 2023 | 0.00% | 0.00% | 0.00% | 0.00% | 0.00% | 0.00% |
| September 2023 | 17.98% | 15.28% | 14.33% | 13.68% | 15.28% | 13.68% |
| October 2023 | 23.70% | 20.99% | 19.75% | 18.83% | 20.77% | 18.83% |
| November 2023 | 23.83% | 20.89% | 19.81% | 18.83% | 21.79% | 18.83% |
| December 2023 | 21.86% | 21.16% | 20.85% | 20.61% | 21.13% | 20.61% |
| February 2024 | 1.29% | 1.09% | 1.03% | 0.99% | 1.09% | 0.99% |
| March 2024 | 1.30% | 1.09% | 1.03% | 0.96% | 1.09% | 0.96% |
| April 2024 | 1.35% | 1.10% | 1.13% | 0.88% | 1.10% | 0.95% |
| May 2024 | 1.23% | 1.10% | 1.05% | 1.01% | 1.10% | 1.01% |
| June 2024 | 1.30% | 1.10% | 1.03% | 0.94% | 1.09% | - |
| July 2024 | 1.43% | 1.13% | 1.04% | 0.88% | 1.39% | - |
| Fidelity Managed Retirement 2020 Fund | ||||||
| August 2023 | 0.00% | 0.00% | 0.00% | 0.00% | 0.00% | 0.00% |
| September 2023 | 25.28% | 20.79% | 18.96% | 18.42% | 20.79% | 18.69% |
| October 2023 | 31.47% | 26.29% | 25.03% | 23.60% | 26.29% | 23.60% |
| November 2023 | 31.44% | 26.29% | 25.06% | 23.58% | 26.29% | 23.58% |
| December 2023 | 26.97% | 26.14% | 25.80% | 25.48% | 26.14% | 25.51% |
| February 2024 | 2.07% | 1.57% | 1.46% | 1.37% | 1.57% | 1.37% |
| March 2024 | 1.88% | 1.57% | 1.45% | 1.36% | 1.77% | 1.36% |
| April 2024 | 1.96% | 1.57% | 1.60% | 1.33% | 1.60% | 1.35% |
| May 2024 | 1.83% | 1.56% | 1.49% | 1.43% | 1.56% | 1.43% |
| June 2024 | 2.07% | 1.60% | 1.45% | 1.30% | 1.60% | - |
| July 2024 | 1.89% | 1.58% | 1.46% | 1.38% | 1.56% | - |
| Fidelity Managed Retirement 2025 Fund | ||||||
| August 2023 | 0.00% | 0.00% | 0.00% | 0.00% | 0.00% | 0.00% |
| September 2023 | 25.75% | 21.90% | 20.10% | 19.31% | 21.58% | 19.31% |
| October 2023 | 35.70% | 30.48% | 29.75% | 27.16% | 30.48% | 27.16% |
| November 2023 | 37.02% | 30.61% | 28.43% | 26.10% | 30.61% | 26.98% |
| December 2023 | 31.22% | 30.45% | 29.53% | 29.46% | 30.41% | 29.68% |
| February 2024 | 2.34% | 2.00% | 1.95% | 1.71% | 1.95% | 1.67% |
| March 2024 | 2.51% | 2.00% | 1.89% | 1.69% | 2.04% | 1.53% |
| April 2024 | 2.41% | 2.01% | 0.00% | 1.65% | 2.01% | 1.67% |
| May 2024 | 2.30% | 1.99% | 1.81% | 1.77% | 1.99% | 2.01% |
| June 2024 | 2.50% | 2.00% | 1.85% | 1.72% | 2.67% | - |
| July 2024 | 2.56% | 2.02% | 1.82% | 1.69% | 1.93% | - |
| Fidelity Managed Retirement 2030 Fund | ||||||
| August 2023 | 0.00% | 0.00% | 0.00% | 0.00% | 0.00% | 0.00% |
| September 2023 | 27.87% | 23.23% | 21.44% | 19.91% | 23.23% | 19.91% |
| October 2023 | 39.10% | 33.89% | 29.90% | 29.90% | 33.89% | 29.90% |
| November 2023 | 41.58% | 34.02% | 34.02% | 28.79% | 34.02% | 34.02% |
| December 2023 | 34.80% | 33.74% | 32.93% | 32.74% | 33.74% | 33.13% |
| February 2024 | 4.31% | 2.88% | 2.88% | 2.47% | 2.88% | 2.47% |
| March 2024 | 4.28% | 2.86% | 2.86% | 2.57% | 2.86% | 2.57% |
| April 2024 | 3.87% | 3.01% | 0.00% | 2.26% | 3.01% | 2.46% |
| May 2024 | 3.30% | 2.89% | 2.72% | 2.57% | 2.89% | 2.57% |
| June 2024 | 3.75% | 3.00% | 2.73% | 2.31% | 3.00% | - |
| July 2024 | 3.01% | 3.01% | 2.63% | 2.34% | 3.51% | - |
| Fidelity Managed Retirement 2035 Fund | ||||||
| August 2023 | 0.00% | 0.00% | 0.00% | 0.00% | 0.00% | 0.00% |
| September 2023 | 6.21% | 5.85% | 5.85% | 5.63% | 5.96% | 5.74% |
| October 2023 | 49.73% | 38.26% | 38.26% | 35.52% | 41.44% | 35.52% |
| November 2023 | 60.95% | 43.54% | 38.09% | 30.48% | 43.54% | 33.86% |
| December 2023 | 40.35% | 39.08% | 38.59% | 37.89% | 39.08% | 38.12% |
| February 2024 | 4.63% | 3.71% | 3.09% | 3.09% | 3.71% | 3.09% |
| March 2024 | 6.03% | 3.77% | 3.35% | 3.02% | 4.31% | 3.35% |
| April 2024 | 8.98% | 4.49% | 3.85% | 3.00% | 5.39% | 3.37% |
| May 2024 | 4.13% | 3.50% | 3.50% | 3.25% | 3.50% | 3.25% |
| June 2024 | 7.00% | 4.00% | 3.50% | 3.11% | 4.00% | - |
| July 2024 | 5.63% | 4.02% | 3.52% | 3.13% | 4.02% | - |
| Class A | Retail Class | Class K | Class K6 | Class I | Class Z6 | |
| Fidelity Managed Retirement Income Fund | ||||||
| August 2023 | 0.00% | 0.00% | 0.00% | 0.00% | 0.00% | 0.00% |
| September 2023 | 0.16% | 0.14% | 0.13% | 0.13% | 0.14% | 0.13% |
| October 2023 | 0.25% | 0.22% | 0.21% | 0.22% | 0.22% | 0.20% |
| November 2023 | 0.25% | 0.22% | 0.21% | 0.21% | 0.22% | 0.21% |
| December 2023 | 0.23% | 0.23% | 0.22% | 0.22% | 0.22% | 0.22% |
| February 2024 | 0.04% | 0.04% | 0.03% | 0.03% | 0.04% | 0.03% |
| March 2024 | 0.04% | 0.04% | 0.03% | 0.03% | 0.04% | 0.03% |
| April 2024 | 0.04% | 0.04% | 0.03% | 0.03% | 0.04% | 0.03% |
| May 2024 | 0.04% | 0.04% | 0.03% | 0.03% | 0.04% | 0.03% |
| June 2024 | 0.04% | 0.04% | 0.03% | 0.03% | 0.04% | - |
| July 2024 | 0.04% | 0.04% | 0.03% | 0.03% | 0.04% | - |
| Fidelity Managed Retirement 2010 Fund | ||||||
| August 2023 | 0.00% | 0.00% | 0.00% | 0.00% | 0.00% | 0.00% |
| September 2023 | 0.22% | 0.19% | 0.18% | 0.17% | 0.19% | 0.17% |
| October 2023 | 0.38% | 0.28% | 0.26% | 0.25% | 0.28% | 0.25% |
| November 2023 | 0.34% | 0.28% | 0.26% | 0.24% | 0.28% | 0.25% |
| December 2023 | 0.28% | 0.28% | 0.27% | 0.27% | 0.28% | 0.27% |
| February 2024 | 0.03% | 0.03% | 0.02% | 0.02% | 0.03% | 0.02% |
| March 2024 | 0.03% | 0.03% | 0.02% | 0.02% | 0.03% | 0.02% |
| April 2024 | 0.03% | 0.03% | 0.02% | 0.02% | 0.02% | 0.02% |
| May 2024 | 0.03% | 0.03% | 0.02% | 0.02% | 0.02% | 0.02% |
| June 2024 | 0.03% | 0.03% | 0.02% | 0.02% | 0.02% | - |
| July 2024 | 0.03% | 0.03% | 0.02% | 0.02% | 0.03% | - |
| Fidelity Managed Retirement 2015 Fund | ||||||
| August 2023 | 0.00% | 0.00% | 0.00% | 0.00% | 0.00% | 0.00% |
| September 2023 | 0.34% | 0.29% | 0.27% | 0.26% | 0.29% | 0.26% |
| October 2023 | 0.44% | 0.39% | 0.37% | 0.35% | 0.39% | 0.35% |
| November 2023 | 0.44% | 0.39% | 0.37% | 0.35% | 0.41% | 0.35% |
| December 2023 | 0.41% | 0.39% | 0.39% | 0.38% | 0.39% | 0.38% |
| February 2024 | 0.02% | 0.01% | 0.01% | 0.01% | 0.01% | 0.01% |
| March 2024 | 0.02% | 0.01% | 0.01% | 0.01% | 0.01% | 0.01% |
| April 2024 | 0.02% | 0.01% | 0.02% | 0.01% | 0.01% | 0.01% |
| May 2024 | 0.02% | 0.01% | 0.01% | 0.01% | 0.01% | 0.01% |
| June 2024 | 0.02% | 0.01% | 0.01% | 0.01% | 0.01% | - |
| July 2024 | 0.02% | 0.02% | 0.01% | 0.01% | 0.02% | - |
| Fidelity Managed Retirement 2020 Fund | ||||||
| August 2023 | 0.00% | 0.00% | 0.00% | 0.00% | 0.00% | 0.00% |
| September 2023 | 0.51% | 0.42% | 0.38% | 0.37% | 0.42% | 0.38% |
| October 2023 | 0.63% | 0.53% | 0.50% | 0.48% | 0.53% | 0.48% |
| November 2023 | 0.63% | 0.53% | 0.50% | 0.48% | 0.53% | 0.48% |
| December 2023 | 0.54% | 0.53% | 0.52% | 0.51% | 0.53% | 0.51% |
| February 2024 | 0.00% | 0.00% | 0.00% | 0.00% | 0.00% | 0.00% |
| March 2024 | 0.00% | 0.00% | 0.00% | 0.00% | 0.00% | 0.00% |
| April 2024 | 0.00% | 0.00% | 0.00% | 0.00% | 0.00% | 0.00% |
| May 2024 | 0.00% | 0.00% | 0.00% | 0.00% | 0.00% | 0.00% |
| June 2024 | 0.00% | 0.00% | 0.00% | 0.00% | 0.00% | - |
| July 2024 | 0.00% | 0.00% | 0.00% | 0.00% | 0.00% | - |
| Fidelity Managed Retirement 2025 Fund | ||||||
| August 2023 | 0.00% | 0.00% | 0.00% | 0.00% | 0.00% | 0.00% |
| September 2023 | 0.55% | 0.47% | 0.43% | 0.41% | 0.46% | 0.41% |
| October 2023 | 0.76% | 0.65% | 0.63% | 0.58% | 0.65% | 0.58% |
| November 2023 | 0.79% | 0.65% | 0.60% | 0.56% | 0.65% | 0.57% |
| December 2023 | 0.66% | 0.65% | 0.63% | 0.63% | 0.65% | 0.63% |
| February 2024 | 0.00% | 0.00% | 0.00% | 0.00% | 0.00% | 0.00% |
| March 2024 | 0.00% | 0.00% | 0.00% | 0.00% | 0.00% | 0.00% |
| April 2024 | 0.00% | 0.00% | 0.00% | 0.00% | 0.00% | 0.00% |
| May 2024 | 0.00% | 0.00% | 0.00% | 0.00% | 0.00% | 0.00% |
| June 2024 | 0.00% | 0.00% | 0.00% | 0.00% | 0.00% | - |
| July 2024 | 0.00% | 0.00% | 0.00% | 0.00% | 0.00% | - |
| Fidelity Managed Retirement 2030 Fund | ||||||
| August 2023 | 0.00% | 0.00% | 0.00% | 0.00% | 0.00% | 0.00% |
| September 2023 | 0.60% | 0.50% | 0.46% | 0.43% | 0.50% | 0.43% |
| October 2023 | 0.84% | 0.73% | 0.65% | 0.65% | 0.73% | 0.65% |
| November 2023 | 0.90% | 0.73% | 0.73% | 0.62% | 0.73% | 0.73% |
| December 2023 | 0.75% | 0.73% | 0.71% | 0.71% | 0.73% | 0.72% |
| February 2024 | 0.00% | 0.00% | 0.00% | 0.00% | 0.00% | 0.00% |
| March 2024 | 0.00% | 0.00% | 0.00% | 0.00% | 0.00% | 0.00% |
| April 2024 | 0.00% | 0.00% | 0.00% | 0.00% | 0.00% | 0.00% |
| May 2024 | 0.00% | 0.00% | 0.00% | 0.00% | 0.00% | 0.00% |
| June 2024 | 0.00% | 0.00% | 0.00% | 0.00% | 0.00% | - |
| July 2024 | 0.00% | 0.00% | 0.00% | 0.00% | 0.00% | - |
| Fidelity Managed Retirement 2035 Fund | ||||||
| August 2023 | 0.00% | 0.00% | 0.00% | 0.00% | 0.00% | 0.00% |
| September 2023 | 0.14% | 0.13% | 0.13% | 0.13% | 0.14% | 0.13% |
| October 2023 | 1.10% | 0.85% | 0.85% | 0.79% | 0.92% | 0.79% |
| November 2023 | 1.35% | 0.97% | 0.85% | 0.68% | 0.97% | 0.75% |
| December 2023 | 0.90% | 0.87% | 0.86% | 0.84% | 0.87% | 0.85% |
| February 2024 | 0.05% | 0.04% | 0.03% | 0.03% | 0.04% | 0.03% |
| March 2024 | 0.06% | 0.04% | 0.04% | 0.03% | 0.04% | 0.04% |
| April 2024 | 0.09% | 0.05% | 0.04% | 0.03% | 0.05% | 0.04% |
| May 2024 | 0.04% | 0.04% | 0.04% | 0.03% | 0.04% | 0.03% |
| June 2024 | 0.07% | 0.04% | 0.04% | 0.03% | 0.04% | - |
| July 2024 | 0.06% | 0.04% | 0.04% | 0.03% | 0.04% | - |
| Pay Date | Income | Taxes | |
| Fidelity Managed Retirement Income Fund | |||
| Class A | 12/29/2023 | 0.1729 | 0.0186 |
| Fidelity Managed Retirement Income | 12/29/2023 | 0.1787 | 0.0186 |
| Class K | 12/29/2023 | 0.1815 | 0.0186 |
| Class K6 | 12/29/2023 | 0.1859 | 0.0186 |
| Class I | 12/29/2023 | 0.1789 | 0.0186 |
| Class Z6 | 12/29/2023 | 0.1838 | 0.0186 |
| Fidelity Managed Retirement 2010 Fund | |||
| Class A | 12/29/2023 | 0.1754 | 0.0187 |
| Fidelity Managed Retirement 2010 | 12/29/2023 | 0.1813 | 0.0187 |
| Class K | 12/29/2023 | 0.1837 | 0.0187 |
| Class K6 | 12/29/2023 | 0.1862 | 0.0187 |
| Class I | 12/29/2023 | 0.1813 | 0.0187 |
| Class Z6 | 12/29/2023 | 0.1862 | 0.0187 |
| Fidelity Managed Retirement 2015 Fund | |||
| Class A | 12/29/2023 | 0.1967 | 0.0213 |
| Fidelity Managed Retirement 2015 | 12/29/2023 | 0.2032 | 0.0213 |
| Class K | 12/29/2023 | 0.2062 | 0.0213 |
| Class K6 | 12/29/2023 | 0.2086 | 0.0213 |
| Class I | 12/29/2023 | 0.2035 | 0.0213 |
| Class Z6 | 12/29/2023 | 0.2086 | 0.0213 |
| Fidelity Managed Retirement 2020 Fund | |||
| Class A | 12/29/2023 | 0.2303 | 0.0245 |
| Fidelity Managed Retirement 2020 | 12/29/2023 | 0.2377 | 0.0245 |
| Class K | 12/29/2023 | 0.2408 | 0.0245 |
| Class K6 | 12/29/2023 | 0.2438 | 0.0245 |
| Class I | 12/29/2023 | 0.2377 | 0.0245 |
| Class Z6 | 12/29/2023 | 0.2435 | 0.0245 |
| Fidelity Managed Retirement 2025 Fund | |||
| Class A | 12/29/2023 | 0.2608 | 0.0277 |
| Fidelity Managed Retirement 2025 | 12/29/2023 | 0.2675 | 0.0277 |
| Class K | 12/29/2023 | 0.2757 | 0.0277 |
| Class K6 | 12/29/2023 | 0.2764 | 0.0277 |
| Class I | 12/29/2023 | 0.2678 | 0.0277 |
| Class Z6 | 12/29/2023 | 0.2744 | 0.0277 |
| Fidelity Managed Retirement 2030 Fund | |||
| Class A | 12/29/2023 | 0.0564 | 0.0059 |
| Fidelity Managed Retirement 2030 | 12/29/2023 | 0.0582 | 0.0059 |
| Class K | 12/29/2023 | 0.0596 | 0.0059 |
| Class K6 | 12/29/2023 | 0.0599 | 0.0059 |
| Class I | 12/29/2023 | 0.0582 | 0.0059 |
| Class Z6 | 12/29/2023 | 0.0592 | 0.0059 |
| Fidelity Managed Retirement 2035 Fund | |||
| Class A | 12/29/2023 | 0.0612 | 0.0061 |
| Fidelity Managed Retirement 2035 | 12/29/2023 | 0.0631 | 0.0061 |
| Class K | 12/29/2023 | 0.0639 | 0.0061 |
| Class K6 | 12/29/2023 | 0.0651 | 0.0061 |
| Class I | 12/29/2023 | 0.0631 | 0.0061 |
| Class Z6 | 12/29/2023 | 0.0647 | 0.0061 |
| A special meeting of shareholders was held on October 18, 2023. The results of votes taken among shareholders on the proposal before them are reported below. Each vote reported represents one dollar of net asset value held on the record date for the meeting. | ||
| Proposal 1 | ||
| To elect a Board of Trustees. | ||
# of Votes | % of Votes | |
| Abigail P. Johnson | ||
| Affirmative | 29,408,520,731.18 | 96.84 |
| Withheld | 958,659,352.64 | 3.16 |
| TOTAL | 30,367,180,083.82 | 100.00 |
| Jennifer Toolin McAuliffe | ||
| Affirmative | 29,484,249,185.02 | 97.09 |
| Withheld | 882,930,898.80 | 2.91 |
| TOTAL | 30,367,180,083.82 | 100.00 |
| Christine J. Thompson | ||
| Affirmative | 29,483,889,948.58 | 97.09 |
| Withheld | 883,290,135.24 | 2.91 |
| TOTAL | 30,367,180,083.82 | 100.00 |
| Elizabeth S. Acton | ||
| Affirmative | 29,471,265,000.64 | 97.05 |
| Withheld | 895,915,083.18 | 2.95 |
| TOTAL | 30,367,180,083.82 | 100.00 |
| Laura M. Bishop | ||
| Affirmative | 29,508,015,754.27 | 97.17 |
| Withheld | 859,164,329.55 | 2.83 |
| TOTAL | 30,367,180,083.82 | 100.00 |
| Ann E. Dunwoody | ||
| Affirmative | 29,470,432,034.14 | 97.05 |
| Withheld | 896,748,049.68 | 2.95 |
| TOTAL | 30,367,180,083.82 | 100.00 |
| John Engler | ||
| Affirmative | 29,326,181,411.39 | 96.57 |
| Withheld | 1,040,998,672.43 | 3.43 |
| TOTAL | 30,367,180,083.82 | 100.00 |
| Robert F. Gartland | ||
| Affirmative | 29,422,803,481.93 | 96.89 |
| Withheld | 944,376,601.89 | 3.11 |
| TOTAL | 30,367,180,083.82 | 100.00 |
| Robert W. Helm | ||
| Affirmative | 29,445,540,968.38 | 96.97 |
| Withheld | 921,639,115.44 | 3.03 |
| TOTAL | 30,367,180,083.82 | 100.00 |
| Arthur E. Johnson | ||
| Affirmative | 29,395,582,286.37 | 96.80 |
| Withheld | 971,597,797.45 | 3.20 |
| TOTAL | 30,367,180,083.82 | 100.00 |
| Michael E. Kenneally | ||
| Affirmative | 29,420,582,069.08 | 96.88 |
| Withheld | 946,598,014.74 | 3.12 |
| TOTAL | 30,367,180,083.82 | 100.00 |
| Mark A. Murray | ||
| Affirmative | 29,446,384,581.44 | 96.97 |
| Withheld | 920,795,502.38 | 3.03 |
| TOTAL | 30,367,180,083.82 | 100.00 |
| Carol J. Zierhoffer | ||
| Affirmative | 29,510,392,522.55 | 97.18 |
| Withheld | 856,787,561.27 | 2.82 |
| TOTAL | 30,367,180,083.82 | 100.00 |
| Proposal 1 reflects trust-wide proposal and voting results. | ||
 |


Contents
| U.S. Government and Government Agency Obligations - 8.5% | |||
Principal Amount (a) (000s) | Value ($) (000s) | ||
| U.S. Treasury Obligations - 8.5% | |||
| U.S. Treasury Bonds: | |||
| 4.125% 8/15/53 | 22,440 | 21,581 | |
| 4.25% 2/15/54 | 8,490 | 8,349 | |
| 4.625% 5/15/44 | 310 | 318 | |
| U.S. Treasury Notes: | |||
| 3.625% 5/31/28 | 22,860 | 22,567 | |
| 4% 1/15/27 | 18,090 | 18,020 | |
| 4.125% 2/15/27 | 37,990 | 37,966 | |
| 4.25% 3/15/27 | 8,670 | 8,698 | |
| 4.25% 6/30/29 | 7,340 | 7,441 | |
| 4.25% 6/30/31 | 6,880 | 6,998 | |
| 4.375% 12/15/26 | 39,790 | 39,961 | |
| 4.875% 10/31/30 | 1,400 | 1,470 | |
| TOTAL U.S. GOVERNMENT AND GOVERNMENT AGENCY OBLIGATIONS (Cost $172,197) | 173,369 | ||
| U.S. Government Agency - Mortgage Securities - 123.0% | |||
Principal Amount (a) (000s) | Value ($) (000s) | ||
| Fannie Mae - 4.2% | |||
| Refinitiv USD IBOR Consumer Cash Fallbacks Term 1Y + 1.460% 6.085% 1/1/35 (b)(c) | 9 | 9 | |
| Refinitiv USD IBOR Consumer Cash Fallbacks Term 1Y + 1.480% 7.48% 7/1/34 (b)(c) | 4 | 4 | |
| Refinitiv USD IBOR Consumer Cash Fallbacks Term 1Y + 1.510% 7.26% 2/1/33 (b)(c) | 7 | 7 | |
| Refinitiv USD IBOR Consumer Cash Fallbacks Term 1Y + 1.530% 5.785% 12/1/34 (b)(c) | 8 | 8 | |
| Refinitiv USD IBOR Consumer Cash Fallbacks Term 1Y + 1.530% 5.785% 3/1/35 (b)(c) | 8 | 8 | |
| Refinitiv USD IBOR Consumer Cash Fallbacks Term 1Y + 1.550% 7.125% 9/1/33 (b)(c) | 104 | 105 | |
| Refinitiv USD IBOR Consumer Cash Fallbacks Term 1Y + 1.550% 7.174% 10/1/33 (b)(c) | 4 | 4 | |
| Refinitiv USD IBOR Consumer Cash Fallbacks Term 1Y + 1.560% 7.315% 7/1/35 (b)(c) | 6 | 6 | |
| Refinitiv USD IBOR Consumer Cash Fallbacks Term 1Y + 1.590% 5.971% 3/1/36 (b)(c) | 27 | 28 | |
| Refinitiv USD IBOR Consumer Cash Fallbacks Term 1Y + 1.600% 5.858% 8/1/35 (b)(c) | 77 | 79 | |
| Refinitiv USD IBOR Consumer Cash Fallbacks Term 1Y + 1.640% 5.967% 5/1/35 (b)(c) | 65 | 67 | |
| Refinitiv USD IBOR Consumer Cash Fallbacks Term 1Y + 1.640% 6.33% 3/1/33 (b)(c) | 22 | 22 | |
| Refinitiv USD IBOR Consumer Cash Fallbacks Term 1Y + 1.640% 6.53% 11/1/36 (b)(c) | 32 | 32 | |
| Refinitiv USD IBOR Consumer Cash Fallbacks Term 1Y + 1.890% 6.521% 8/1/35 (b)(c) | 40 | 41 | |
| U.S. TREASURY 1 YEAR INDEX + 2.150% 6.432% 7/1/36 (b)(c) | 28 | 28 | |
| U.S. TREASURY 1 YEAR INDEX + 2.280% 6.402% 10/1/33 (b)(c) | 12 | 12 | |
| U.S. TREASURY 1 YEAR INDEX + 2.460% 6.585% 9/1/34 (b)(c) | 21 | 21 | |
| U.S. TREASURY 1 YEAR INDEX + 2.460% 7.167% 7/1/34 (b)(c) | 96 | 97 | |
| 1.5% 11/1/35 to 1/1/51 | 12,269 | 10,204 | |
| 2% 2/1/28 to 6/1/36 | 14,260 | 12,906 | |
| 2.5% 10/1/31 to 5/1/42 | 10,887 | 9,914 | |
| 3% 11/1/51 to 3/1/52 | 1,557 | 1,369 | |
| 3.5% 10/1/41 to 4/1/52 | 18,124 | 16,589 | |
| 5% 10/1/52 to 12/1/52 (d) | 4,887 | 4,866 | |
| 5.5% 11/1/52 | 8,719 | 8,743 | |
| 6% 11/1/52 to 7/1/54 (d) | 17,051 | 17,472 | |
| 6.5% 3/1/54 to 7/1/54 | 2,579 | 2,658 | |
| 8.5% 12/1/27 | 5 | 5 | |
TOTAL FANNIE MAE | 85,304 | ||
| Freddie Mac - 2.9% | |||
| Refinitiv USD IBOR Consumer Cash Fallbacks Term 1Y + 1.860% 6.11% 8/1/34 (b)(c) | 41 | 42 | |
| Refinitiv USD IBOR Consumer Cash Fallbacks Term 1Y + 1.860% 7.239% 4/1/36 (b)(c) | 47 | 48 | |
| Refinitiv USD IBOR Consumer Cash Fallbacks Term 1Y + 1.950% 6.489% 10/1/36 (b)(c) | 107 | 109 | |
| Refinitiv USD IBOR Consumer Cash Fallbacks Term 1Y + 1.960% 7.711% 6/1/33 (b)(c) | 74 | 76 | |
| Refinitiv USD IBOR Consumer Cash Fallbacks Term 1Y + 1.990% 6.663% 10/1/35 (b)(c) | 58 | 59 | |
| Refinitiv USD IBOR Consumer Cash Fallbacks Term 1Y + 2.030% 6.158% 3/1/33 (b)(c) | 1 | 1 | |
| U.S. TREASURY 1 YEAR INDEX + 2.030% 6.782% 6/1/33 (b)(c) | 79 | 80 | |
| U.S. TREASURY 1 YEAR INDEX + 2.230% 6.341% 12/1/35 (b)(c) | 324 | 328 | |
| U.S. TREASURY 1 YEAR INDEX + 2.260% 7.127% 6/1/33 (b)(c) | 135 | 136 | |
| U.S. TREASURY 1 YEAR INDEX + 2.460% 6.859% 3/1/35 (b)(c) | 248 | 252 | |
| 1.5% 11/1/35 to 2/1/51 | 17,493 | 14,100 | |
| 2% 3/1/36 to 8/1/36 | 4,451 | 4,015 | |
| 2.5% 11/1/31 to 4/1/42 | 17,040 | 15,109 | |
| 3% 4/1/34 to 3/1/52 | 505 | 464 | |
| 3.5% 3/1/42 to 3/1/52 | 11,318 | 10,448 | |
| 5% 11/1/52 | 1,282 | 1,277 | |
| 5.5% 3/1/53 (e) | 2,139 | 2,175 | |
| 6% 9/1/53 | 1,568 | 1,596 | |
| 6.5% 9/1/53 to 10/1/53 | 8,252 | 8,568 | |
TOTAL FREDDIE MAC | 58,883 | ||
| Ginnie Mae - 112.3% | |||
| 3% 5/15/27 to 12/20/50 | 162,617 | 147,593 | |
| 3.5% 9/15/26 to 5/20/50 (f) | 220,701 | 206,829 | |
| 3.7% 10/15/42 | 3,700 | 3,492 | |
| 4% 5/15/44 | 833 | 802 | |
| 4.5% 7/15/33 to 4/20/53 | 89,867 | 88,101 | |
| 4.75% 7/15/40 | 325 | 323 | |
| 4.875% 9/15/39 to 12/15/39 | 2,811 | 2,809 | |
| 5.09% 4/15/36 to 11/15/36 | 2,311 | 2,323 | |
| 5.15% 2/15/36 | 90 | 90 | |
| 5.2% 7/15/36 | 45 | 46 | |
| 5.25% 4/15/36 to 4/15/37 | 149 | 150 | |
| 5.39% 5/15/36 | 42 | 43 | |
| 5.45% 2/15/37 | 389 | 396 | |
| 5.5% 10/15/32 to 2/20/42 | 3,449 | 3,537 | |
| 5.6% 11/15/36 | 127 | 131 | |
| 6.45% 1/15/32 to 8/15/32 | 63 | 65 | |
| 6.5% 10/15/25 to 1/15/39 | 2,293 | 2,390 | |
| 7% to 7% 7/15/25 to 9/20/34 | 4,484 | 4,626 | |
| 7.25% 9/15/27 | 14 | 14 | |
| 7.5% to 7.5% 8/15/25 to 7/20/32 | 1,450 | 1,499 | |
| 8% 8/15/24 to 9/15/31 | 309 | 319 | |
| 8.5% 9/15/30 to 2/15/31 | 91 | 96 | |
| 9% 10/15/24 | 0 | 0 | |
| 2% 9/20/50 to 3/20/52 | 476,820 | 395,683 | |
| 2% 8/1/54 (g) | 9,850 | 8,169 | |
| 2% 8/1/54 (g) | 59,200 | 49,099 | |
| 2.25% 5/20/50 | 1,840 | 1,531 | |
| 2.375% 5/20/50 | 1,327 | 1,115 | |
| 2.5% 3/15/28 to 10/20/52 | 392,372 | 338,737 | |
| 2.625% 5/20/50 | 3,397 | 2,923 | |
| 2.75% 5/20/50 | 1,024 | 889 | |
| 3% 8/1/54 (g) | 139,150 | 124,264 | |
| 3% 8/1/54 (g) | 23,150 | 20,673 | |
| 3% 8/1/54 (g) | 2,800 | 2,500 | |
| 3% 8/1/54 (g) | 1,900 | 1,697 | |
| 3% 8/1/54 (g) | 6,500 | 5,805 | |
| 3% 8/1/54 (g) | 10,000 | 8,930 | |
| 3% 8/1/54 (g) | 40,500 | 36,167 | |
| 3% 9/1/54 (g) | 27,800 | 24,850 | |
| 3% 9/1/54 (g) | 83,450 | 74,594 | |
| 3.25% 2/20/41 to 7/20/46 | 839 | 736 | |
| 3.375% 5/20/50 | 441 | 400 | |
| 3.74% 7/20/42 to 8/20/42 | 310 | 293 | |
| 3.75% 10/20/41 to 7/20/47 | 14,732 | 13,889 | |
| 4% 2/20/33 to 1/20/50 | 125,821 | 121,316 | |
| 4.25% 1/20/46 | 287 | 278 | |
| 4.5% 8/1/54 (g) | 49,700 | 48,133 | |
| 5% 6/20/29 to 5/20/54 | 92,168 | 91,793 | |
| 5% 8/1/54 (g) | 24,950 | 24,668 | |
| 5.35% 4/20/29 to 12/20/30 | 2,730 | 2,739 | |
| 5.5% 8/1/54 (g) | 20,500 | 20,563 | |
| 5.5% 8/1/54 (g) | 5,175 | 5,191 | |
| 5.5% 8/1/54 (g) | 5,325 | 5,341 | |
| 5.5% 8/1/54 (g) | 10,300 | 10,332 | |
| 5.5% 8/1/54 (g) | 5,000 | 5,015 | |
| 5.5% 9/1/54 (g) | 7,750 | 7,773 | |
| 5.5% 9/1/54 (g) | 10,300 | 10,331 | |
| 5.5% 9/1/54 (g) | 5,000 | 5,015 | |
| 5.75% 9/20/39 to 9/20/40 | 5,356 | 5,545 | |
| 6% to 6% 12/20/27 to 3/15/39 | 4,427 | 4,543 | |
| 6% 8/1/54 (g) | 58,600 | 59,307 | |
| 6% 8/1/54 (g) | 43,925 | 44,455 | |
| 6% 8/1/54 (g) | 23,425 | 23,707 | |
| 6% 8/1/54 (g) | 13,150 | 13,309 | |
| 6% 8/1/54 (g) | 43,925 | 44,455 | |
| 6% 8/1/54 (g) | 3,725 | 3,770 | |
| 6% 9/1/54 (g) | 21,175 | 21,420 | |
| 6% 9/1/54 (g) | 37,000 | 37,429 | |
| 6% 9/1/54 (g) | 3,150 | 3,187 | |
| 6% 9/1/54 (g) | 1,600 | 1,619 | |
| 6% 9/1/54 (g) | 47,650 | 48,202 | |
| 6% 9/1/54 (g) | 28,525 | 28,856 | |
| 6.5% 8/1/54 (g) | 17,400 | 17,732 | |
| 6.5% 9/1/54 (g) | 10,650 | 10,846 | |
| 7.395% 7/20/25 to 2/20/27 | 55 | 55 | |
TOTAL GINNIE MAE | 2,305,543 | ||
| Uniform Mortgage Backed Securities - 3.6% | |||
| 2% 8/1/39 (g) | 400 | 359 | |
| 2% 9/1/39 (g) | 300 | 270 | |
| 2% 8/1/54 (g) | 9,000 | 7,243 | |
| 2% 8/1/54 (g) | 9,000 | 7,243 | |
| 2% 8/1/54 (g) | 11,850 | 9,536 | |
| 2% 8/1/54 (g) | 9,750 | 7,846 | |
| 2% 9/1/54 (g) | 2,100 | 1,692 | |
| 2% 10/1/54 (g) | 725 | 585 | |
| 3% 8/1/54 (g) | 4,975 | 4,344 | |
| 6% 8/1/54 (g) | 2,300 | 2,333 | |
| 6% 8/1/54 (g) | 2,350 | 2,384 | |
| 6% 8/1/54 (g) | 5,850 | 5,934 | |
| 6% 8/1/54 (g) | 5,850 | 5,934 | |
| 6% 9/1/54 (g) | 1,150 | 1,167 | |
| 6.5% 8/1/54 (g) | 17,400 | 17,847 | |
TOTAL UNIFORM MORTGAGE BACKED SECURITIES | 74,717 | ||
| TOTAL U.S. GOVERNMENT AGENCY - MORTGAGE SECURITIES (Cost $2,610,650) | 2,524,447 | ||
| Collateralized Mortgage Obligations - 12.3% | |||
Principal Amount (a) (000s) | Value ($) (000s) | ||
| U.S. Government Agency - 12.3% | |||
| Fannie Mae: | |||
| planned amortization class: | |||
Series 2012-93 Class QW, 5% 1/25/42 | 28 | 27 | |
Series 2017-1 Class JP, 3.5% 4/25/45 | 191 | 184 | |
Series 2017-22 Class JN, 4.5% 4/25/46 | 426 | 419 | |
Series 2019-52 Class M, 3.5% 3/25/49 | 63 | 61 | |
Series 2019-64 Class MJ, 4.5% 6/25/49 | 804 | 784 | |
Series 2019-74 Class LB, 3% 10/25/49 | 351 | 317 | |
Series 2021-26 Class HC, 1% 11/25/49 | 3,484 | 2,946 | |
| sequential payer: | |||
Series 2017-89 Class KV, 3.5% 8/25/47 | 894 | 877 | |
Series 2020-49 Class JA, 2% 8/25/44 | 798 | 731 | |
Series 2020-67 Class KZ, 3.25% 9/25/40 | 2,403 | 2,213 | |
Series 2021-68 Class A, 2% 7/25/49 | 1,699 | 1,349 | |
Series 2021-85 Class L, 2.5% 8/25/48 | 926 | 812 | |
Series 2021-96 Class HA, 2.5% 2/25/50 | 1,466 | 1,286 | |
Series 2022-3: | |||
Class G, 2% 11/25/47 | 10,726 | 9,371 | |
Class N, 2% 10/25/47 | 9,979 | 8,729 | |
Series 2022-4 Class B, 2.5% 5/25/49 | 1,075 | 945 | |
| Series 2016-3 Class IP, 4% 2/25/46 (h) | 14,269 | 2,846 | |
| Series 2016-78 Class IO, 3.5% 11/25/46 (h) | 3,829 | 658 | |
| Series 2020-45 Class JL, 3% 7/25/40 | 95 | 86 | |
| Series 2021-59 Class H, 2% 6/25/48 | 955 | 780 | |
| Series 2021-66: | |||
Class DA, 2% 1/25/48 | 1,021 | 838 | |
Class DM, 2% 1/25/48 | 1,085 | 890 | |
| Fannie Mae Stripped Mortgage-Backed Securities: | |||
| Series 331 Class 12, 6.5% 2/25/33 (b)(h) | 71 | 11 | |
| Series 339 Class 5, 5.5% 7/25/33 (h) | 98 | 15 | |
| Series 343 Class 16, 5.5% 5/25/34 (h) | 92 | 14 | |
| Freddie Mac: | |||
| planned amortization class: | |||
Series 2022-5213 Class JM, 3.5% 9/25/51 | 3,956 | 3,772 | |
Series 2022-5224 Class DQ, 3.75% 8/25/44 | 2,239 | 2,138 | |
Series 2220 Class PD, 8% 3/15/30 | 151 | 158 | |
| sequential payer: | |||
Series 2020-5018: | |||
Class LC, 3% 10/25/40 | 641 | 584 | |
Class LT, 3.25% 10/25/40 | 2,481 | 2,304 | |
Class LY, 3% 10/25/40 | 487 | 443 | |
Series 2021-5175 Class CB, 2.5% 4/25/50 | 5,365 | 4,694 | |
Series 2021-5180 Class KA, 2.5% 10/25/47 | 1,060 | 951 | |
Series 2022-5191 Class CA, 2.5% 4/25/50 | 1,244 | 1,082 | |
Series 2022-5198 Class BA, 2.5% 11/25/47 | 3,420 | 3,080 | |
Series 2204 Class N, 7.5% 12/20/29 | 325 | 334 | |
| Series 2020-5041 Class LB, 3% 11/25/40 | 1,092 | 995 | |
| Series 2021-5083 Class VA, 1% 8/15/38 | 3,477 | 3,262 | |
| Series 2021-5176 Class AG, 2% 1/25/47 | 4,013 | 3,482 | |
| Series 2021-5182 Class A, 2.5% 10/25/48 | 6,955 | 6,116 | |
| Freddie Mac Multi-family Structured pass-thru certificates sequential payer Series 2021-5159 Class GC, 2% 11/25/47 | 849 | 745 | |
| Ginnie Mae guaranteed REMIC pass-thru certificates: | |||
| floater: | |||
Series 2007-37 Class TS, 6.570% - CME Term SOFR 1 Month Index 1.2477% 6/16/37 (b)(h)(i) | 515 | 52 | |
Series 2008-51 Class FE, CME Term SOFR 1 Month Index + 0.860% 6.1923% 6/16/38 (b)(c) | 141 | 141 | |
Series 2008-57 Class AF, CME Term SOFR 1 Month Index + 0.690% 6.0396% 7/20/38 (b)(c) | 348 | 347 | |
Series 2010-130 Class KF, CME Term SOFR 1 Month Index + 0.760% 6.0923% 10/16/40 (b)(c) | 651 | 651 | |
Series 2010-H03 Class FA, CME Term SOFR 1 Month Index + 0.660% 6.0104% 3/20/60 (b)(c)(j) | 2,953 | 2,949 | |
Series 2010-H17 Class FA, CME Term SOFR 1 Month Index + 0.440% 5.7904% 7/20/60 (b)(c)(j) | 4,201 | 4,187 | |
Series 2010-H18 Class AF, CME Term SOFR 1 Month Index + 0.410% 5.7443% 9/20/60 (b)(c)(j) | 3,539 | 3,521 | |
Series 2010-H19 Class FG, CME Term SOFR 1 Month Index + 0.410% 5.7443% 8/20/60 (b)(c)(j) | 3,483 | 3,468 | |
Series 2010-H27 Class FA, CME Term SOFR 1 Month Index + 0.380% 5.8243% 12/20/60 (b)(c)(j) | 1,451 | 1,446 | |
Series 2011-H05 Class FA, CME Term SOFR 1 Month Index + 0.610% 5.9443% 12/20/60 (b)(c)(j) | 1,097 | 1,095 | |
Series 2011-H07 Class FA, CME Term SOFR 1 Month Index + 0.610% 5.9443% 2/20/61 (b)(c)(j) | 253 | 252 | |
Series 2011-H12 Class FA, CME Term SOFR 1 Month Index + 0.600% 5.9343% 2/20/61 (b)(c)(j) | 1,255 | 1,252 | |
Series 2011-H13 Class FA, CME Term SOFR 1 Month Index + 0.610% 5.9443% 4/20/61 (b)(c)(j) | 1,198 | 1,196 | |
Series 2011-H14: | |||
Class FB, CME Term SOFR 1 Month Index + 0.610% 5.9443% 5/20/61 (b)(c)(j) | 1,127 | 1,125 | |
Class FC, CME Term SOFR 1 Month Index + 0.610% 5.9443% 5/20/61 (b)(c)(j) | 1,297 | 1,295 | |
Series 2011-H17 Class FA, CME Term SOFR 1 Month Index + 0.640% 5.9743% 6/20/61 (b)(c)(j) | 1,461 | 1,459 | |
Series 2011-H21 Class FA, CME Term SOFR 1 Month Index + 0.710% 6.0443% 10/20/61 (b)(c)(j) | 1,490 | 1,489 | |
Series 2012-48 Class FA, CME Term SOFR 1 Month Index + 0.460% 5.7923% 4/16/42 (b)(c) | 249 | 245 | |
Series 2012-76 Class GF CME Term SOFR 1 Month Index + 0.410% 5.7423% 6/16/42 (b)(c) | 284 | 281 | |
Series 2012-H01 Class FA, CME Term SOFR 1 Month Index + 0.810% 6.1443% 11/20/61 (b)(c)(j) | 1,733 | 1,735 | |
Series 2012-H03 Class FA, CME Term SOFR 1 Month Index + 0.810% 6.1443% 1/20/62 (b)(c)(j) | 864 | 864 | |
Series 2012-H06 Class FA, CME Term SOFR 1 Month Index + 0.740% 6.0743% 1/20/62 (b)(c)(j) | 1,648 | 1,648 | |
Series 2012-H07 Class FA, CME Term SOFR 1 Month Index + 0.740% 6.0743% 3/20/62 (b)(c)(j) | 802 | 801 | |
Series 2012-H21 Class DF, CME Term SOFR 1 Month Index + 0.760% 6.0943% 5/20/61 (b)(c)(j) | 23 | 23 | |
Series 2015-H13 Class FL, CME Term SOFR 1 Month Index + 0.390% 5.7243% 5/20/63 (b)(c)(j) | 25 | 25 | |
Series 2015-H19 Class FA, CME Term SOFR 1 Month Index + 0.310% 5.6443% 4/20/63 (b)(c)(j) | 26 | 25 | |
Series 2016-12 Class FA, CME Term SOFR 1 Month Index + 0.460% 5.8096% 1/20/46 (b)(c) | 693 | 674 | |
Series 2019-42 Class FK, CME Term SOFR 1 Month Index + 0.560% 5.9096% 4/20/49 (b)(c) | 4,863 | 4,748 | |
| planned amortization class: | |||
Series 2003-74 Class PZ, 5.5% 8/20/33 | 2,144 | 2,175 | |
Series 2005-24 Class TC, 5.5% 3/20/35 | 1,518 | 1,537 | |
Series 2005-57 Class PB, 5.5% 7/20/35 | 2,239 | 2,294 | |
Series 2006-50 Class JC, 5% 6/20/36 | 251 | 250 | |
Series 2011-136 Class WI, 4.5% 5/20/40 (h) | 128 | 7 | |
Series 2015-24 Class PI, 3.5% 2/20/45 (h) | 7,663 | 1,164 | |
Series 2016-69 Class WA, 3% 2/20/46 | 914 | 845 | |
Series 2017-134 Class BA, 2.5% 11/20/46 | 387 | 349 | |
Series 2017-139 Class K, 3% 8/20/47 | 12,861 | 11,833 | |
Series 2017-153 Class GA, 3% 9/20/47 | 2,523 | 2,278 | |
Series 2017-182 Class KA, 3% 10/20/47 | 1,998 | 1,818 | |
Series 2018-13 Class Q, 3% 4/20/47 | 2,434 | 2,262 | |
| sequential payer: | |||
Series 2003-75 Class ZA, 5.5% 9/20/33 | 656 | 671 | |
Series 2004-24 Class ZM, 5% 4/20/34 | 1,348 | 1,330 | |
Series 2004-46 Class BZ, 6% 6/20/34 | 842 | 852 | |
Series 2004-86 Class G, 6% 10/20/34 | 6,273 | 6,509 | |
Series 2005-26 Class ZA, 5.5% 1/20/35 | 6,293 | 6,443 | |
Series 2005-47 Class ZY, 6% 6/20/35 | 4,567 | 4,728 | |
Series 2005-6 Class EX, 5.5% 11/20/34 | 1,001 | 1,025 | |
Series 2005-82 Class JV, 5% 6/20/35 | 1,221 | 1,231 | |
Series 2006-2 Class Z, 5.5% 1/20/36 | 2,760 | 2,829 | |
Series 2010-160 Class DY, 4% 12/20/40 | 12,996 | 12,608 | |
Series 2010-168 Class BG, 4% 4/20/40 | 5,199 | 5,048 | |
Series 2010-170 Class B, 4% 12/20/40 | 2,044 | 1,980 | |
Series 2017-139 Class BA, 3% 9/20/47 | 4,322 | 3,892 | |
Series 2018-H12 Class HA, 3.25% 8/20/68 (j) | 9,222 | 8,856 | |
| Series 2004-32: | |||
Class GS, 6.380% - CME Term SOFR 1 Month Index 1.0577% 5/16/34 (b)(h)(i) | 158 | 10 | |
Class SG, 6.380% - CME Term SOFR 1 Month Index 1.0404% 3/20/33 (b)(h)(i) | 1,775 | 83 | |
| Series 2004-59 Class SC, 7.080% - CME Term SOFR 1 Month Index 1.7577% 8/16/34 (b)(h)(i) | 920 | 76 | |
| Series 2004-73 Class AL, 7.080% - CME Term SOFR 1 Month Index 1.7577% 8/17/34 (b)(h)(i) | 272 | 23 | |
| Series 2005-13 Class SA, 6.680% - CME Term SOFR 1 Month Index 1.3404% 2/20/35 (b)(h)(i) | 1,604 | 125 | |
| Series 2005-6 Class EY, 5.5% 11/20/33 | 1,016 | 1,013 | |
| Series 2005-82 Class NS, 6.180% - CME Term SOFR 1 Month Index 0.8404% 7/20/34 (b)(h)(i) | 1,626 | 144 | |
| Series 2006-13 Class DS, 10.920% x CME Term SOFR 1 Month Index 2.9106% 3/20/36 (b)(c)(i) | 1,722 | 1,726 | |
| Series 2007-35 Class SC, 39.510% x CME Term SOFR 1 Month Index 7.5463% 6/16/37 (b)(c)(i) | 303 | 342 | |
| Series 2009-13 Class E, 4.5% 3/16/39 | 1,539 | 1,513 | |
| Series 2009-42 Class AY, 5% 6/16/37 | 980 | 983 | |
| Series 2010-H10 Class FA, CME Term SOFR 1 Month Index + 0.440% 5.7904% 5/20/60 (b)(c)(j) | 2,267 | 2,260 | |
| Series 2011-52 Class HI, 7% 4/16/41 (h) | 199 | 27 | |
| Series 2012-103 Class IL, 3% 8/20/27 (h) | 3,922 | 108 | |
| Series 2013-149 Class MA, 2.5% 5/20/40 | 6,808 | 6,596 | |
| Series 2013-182 Class IQ, 4.5% 12/16/43 (h) | 2,537 | 426 | |
| Series 2014-133 Class IB, 5% 9/20/44 (h) | 2,416 | 464 | |
| Series 2014-146 Class EI, 5% 10/20/44 (h) | 4,632 | 926 | |
| Series 2014-154 Class IO, 5% 10/20/44 (h) | 932 | 203 | |
| Series 2014-158 Class ID, 5% 10/20/44 (h) | 4,045 | 813 | |
| Series 2014-178 Class IO, 5% 11/20/44 (h) | 5,791 | 1,135 | |
| Series 2014-2 Class BA, 3% 1/20/44 | 3,110 | 2,843 | |
| Series 2014-21 Class HA, 3% 2/20/44 | 1,157 | 1,066 | |
| Series 2014-25 Class HC, 3% 2/20/44 | 1,986 | 1,810 | |
| Series 2014-5 Class A, 3% 1/20/44 | 1,601 | 1,463 | |
| Series 2015-117 Class KI, 5% 8/20/45 (h) | 5,522 | 1,062 | |
| Series 2015-14 Class IO, 5% 10/20/44 (h) | 6,290 | 1,215 | |
| Series 2015-79 Class IC, 5% 5/20/45 (h) | 3,006 | 581 | |
| Series 2015-H21: | |||
Class HZ, 4.2622% 6/20/63 (b)(j) | 445 | 437 | |
Class JZ, 4.4982% 6/20/65 (b)(j) | 30 | 30 | |
| Series 2016-146 Class AL, 5.6316% 5/20/40 (b) | 1,850 | 1,868 | |
| Series 2016-17 Class A, 3% 2/16/46 | 12,310 | 11,351 | |
| Series 2016-171 Class BI, 5% 10/20/44 (h) | 5,650 | 1,110 | |
| Series 2017-186 Class HK, 3% 11/16/45 | 5,905 | 5,448 | |
| Series 2017-75 Class PT, 5.7245% 4/20/47 (b) | 6,927 | 6,979 | |
| Series 2017-H06 Class FA, U.S. TREASURY 1 YEAR INDEX + 0.350% 5.55% 8/20/66 (b)(c)(j) | 2,607 | 2,595 | |
| TOTAL COLLATERALIZED MORTGAGE OBLIGATIONS (Cost $265,353) | 251,991 | ||
| Commercial Mortgage Securities - 1.0% | |||
Principal Amount (a) (000s) | Value ($) (000s) | ||
| Freddie Mac: | |||
| floater Series 2024-K523 Class A/S, U.S. 30-Day Avg. Secured Overnight Fin. Rate (SOFR) Index + 0.550% 5.8864% 4/25/29 (b)(c) | 10,600 | 10,600 | |
| sequential payer: | |||
Series 2015-K049 Class A2, 3.01% 7/25/25 | 212 | 208 | |
Series K058 Class A2, 2.653% 8/25/26 | 7,000 | 6,727 | |
| Series K063 Class A2, 3.43% 1/25/27 | 1,300 | 1,264 | |
| Series K090 Class A2, 3.422% 2/25/29 | 2,400 | 2,300 | |
| Ginnie Mae guaranteed Multi-family REMIC pass-thru securities sequential payer Series 2001-58 Class X, 0.4902% 9/16/41 (b)(h) | 221 | 0 | |
| Ginnie Mae guaranteed REMIC pass-thru certificates: | |||
| sequential payer Series 2002-81 Class IO, 0.9493% 9/16/42 (b)(h) | 1,188 | 18 | |
| Series 2002-62 Class IO, 1.1703% 8/16/42 (b)(h) | 547 | 6 | |
| TOTAL COMMERCIAL MORTGAGE SECURITIES (Cost $28,451) | 21,123 | ||
| Money Market Funds - 0.3% | |||
| Shares | Value ($) (000s) | ||
Fidelity Cash Central Fund 5.39% (k) (Cost $6,990) | 6,988,468 | 6,990 | |
| Purchased Swaptions - 0.0% | ||||
Expiration Date | Notional Amount (a) (000s) | Value ($) (000s) | ||
| Put Options - 0.0% | ||||
| Option on an interest rate swap with Goldman Sachs Bank U.S.A. to pay annually a fixed rate of 3.865% and receive annually a floating rate based on the U.S. Secured Overnight Fin. Rate (SOFR) Index, expiring May 2035. | 5/15/25 | 8,200 | 155 | |
| Call Options - 0.0% | ||||
| Option on an interest rate swap with Goldman Sachs Bank U.S.A. to receive annually a fixed rate of 3.865% and pay annually a floating rate based on the U.S. Secured Overnight Fin. Rate (SOFR) Index, expiring May 2035. | 5/15/25 | 8,200 | 383 | |
TOTAL PURCHASED SWAPTIONS (Cost $530) | 538 | |||
| TOTAL INVESTMENT IN SECURITIES - 145.1% (Cost $3,084,171) | 2,978,458 |
NET OTHER ASSETS (LIABILITIES) - (45.1)% | (925,331) |
| NET ASSETS - 100.0% | 2,053,127 |
| TBA Sale Commitments | ||
Principal Amount (a) (000s) | Value ($) (000s) | |
| Ginnie Mae | ||
| 2% 8/1/54 | (9,000) | (7,464) |
| 2% 8/1/54 | (8,100) | (6,718) |
| 3% 8/1/54 | (27,800) | (24,826) |
| 3% 8/1/54 | (83,450) | (74,523) |
| 5.5% 8/1/54 | (10,300) | (10,332) |
| 5.5% 8/1/54 | (5,000) | (5,015) |
| 5.5% 8/1/54 | (10,300) | (10,332) |
| 5.5% 8/1/54 | (5,000) | (5,015) |
| 5.5% 8/1/54 | (7,750) | (7,774) |
| 6% 8/1/54 | (21,175) | (21,430) |
| 6% 8/1/54 | (37,000) | (37,446) |
| 6% 8/1/54 | (3,150) | (3,188) |
| 6% 8/1/54 | (1,600) | (1,619) |
| 6% 8/1/54 | (47,650) | (48,225) |
| 6% 8/1/54 | (28,525) | (28,869) |
| 6% 8/1/54 | (43,925) | (44,455) |
| 6% 8/1/54 | (3,725) | (3,770) |
| 6.5% 8/1/54 | (10,650) | (10,853) |
| TOTAL GINNIE MAE | (351,854) | |
| Uniform Mortgage Backed Securities | ||
| 2% 8/1/39 | (300) | (269) |
| 2% 8/1/54 | (9,000) | (7,243) |
| 2% 8/1/54 | (9,000) | (7,243) |
| 2% 8/1/54 | (8,750) | (7,042) |
| 2% 8/1/54 | (2,100) | (1,690) |
| 2% 8/1/54 | (11,000) | (8,852) |
| 2% 8/1/54 | (3,500) | (2,817) |
| 2% 8/1/54 | (9,750) | (7,846) |
| 2% 9/1/54 | (725) | (584) |
| 3% 8/1/54 | (4,975) | (4,344) |
| 3% 9/1/54 | (4,975) | (4,349) |
| 3.5% 8/1/54 | (3,500) | (3,177) |
| 4% 8/1/54 | (5,000) | (4,685) |
| 6% 8/1/54 | (1,150) | (1,167) |
| 6% 8/1/54 | (150) | (152) |
| 6% 8/1/54 | (7,200) | (7,304) |
| 6% 8/1/54 | (5,850) | (5,934) |
| 6.5% 8/1/54 | (17,400) | (17,847) |
| TOTAL UNIFORM MORTGAGE BACKED SECURITIES | (92,545) | |
TOTAL TBA SALE COMMITMENTS (Proceeds $441,512) | (444,399) | |
| Written Swaptions | ||||
Expiration Date | Notional Amount (a) (000s) | Value ($) (000s) | ||
| Put Swaptions | ||||
| Option on an interest rate swap with JPMorgan Chase Bank N.A. to receive annually a fixed rate of 3.502% and pay annually a floating rate based on the U.S. Secured Overnight Fin. Rate (SOFR) Index, expiring January 2034. | 1/04/29 | 39,000 | (1,551) | |
| Call Swaptions | ||||
| Option on an interest rate swap with JPMorgan Chase Bank N.A. to pay annually a fixed rate of 3.502% and receive annually a floating rate based on the U.S. Secured Overnight Fin. Rate (SOFR) Index, expiring January 2034. | 1/04/29 | 39,000 | (1,451) | |
| TOTAL WRITTEN SWAPTIONS | (3,002) | |||
| Futures Contracts | |||||
Number of contracts | Expiration Date | Notional Amount ($) (000s) | Value ($) (000s) | Unrealized Appreciation/ (Depreciation) ($) (000s) | |
| Purchased | |||||
| Treasury Contracts | |||||
| CBOT 2-Year U.S. Treasury Note Contracts (United States) | 139 | Sep 2024 | 28,546 | 101 | 101 |
| CBOT 5-Year U.S. Treasury Note Contracts (United States) | 10 | Sep 2024 | 1,079 | 6 | 6 |
| TOTAL PURCHASED | 107 | ||||
| Sold | |||||
| Treasury Contracts | |||||
| CBOT 10-Year U.S. Treasury Note Contracts (United States) | 1,515 | Sep 2024 | 169,396 | (2,931) | (2,931) |
| CBOT Long Term U.S. Treasury Bond Contracts (United States) | 197 | Sep 2024 | 23,794 | (414) | (414) |
| TOTAL SOLD | (3,345) | ||||
| TOTAL FUTURES CONTRACTS | (3,238) | ||||
| The notional amount of futures purchased as a percentage of Net Assets is 1.5% | |||||
| The notional amount of futures sold as a percentage of Net Assets is 9.5% | |||||
| Interest Rate Swaps | ||||||||||
| Payment Received | Payment Frequency | Payment Paid | Payment Frequency | Clearinghouse / Counterparty(1) | Maturity Date | Notional Amount (000s)(2) | Value ($) (000s) | Upfront Premium Received/ (Paid) ($) (000s)(3) | Unrealized Appreciation/ (Depreciation) ($) (000s) | |
U.S. Secured Overnight Fin. Rate (SOFR) Index(4) | Annual | 3.75% | Annual | LCH | Sep 2026 | 102,006 | (616) | 0 | (616) | |
U.S. Secured Overnight Fin. Rate (SOFR) Index(4) | Annual | 3.5% | Annual | LCH | Sep 2027 | 29,441 | (301) | 0 | (301) | |
U.S. Secured Overnight Fin. Rate (SOFR) Index(4) | Annual | 3.5% | Annual | LCH | Sep 2031 | 66,158 | (815) | 0 | (815) | |
| 3.75% | Annual | U.S. Secured Overnight Fin. Rate (SOFR) Index(4) | Annual | LCH | Sep 2034 | 5,146 | 67 | 0 | 67 | |
U.S. Secured Overnight Fin. Rate (SOFR) Index(4) | Annual | 3.75% | Annual | LCH | Sep 2044 | 7,035 | (73) | 0 | (73) | |
| TOTAL INTEREST RATE SWAPS | (1,738) | 0 | (1,738) | |||||||
| (a) | Amount is stated in United States dollars unless otherwise noted. |
| (b) | Coupon rates for floating and adjustable rate securities reflect the rates in effect at period end. |
| (c) | Coupon is indexed to a floating interest rate which may be multiplied by a specified factor and/or subject to caps or floors. |
| (d) | Security or a portion of the security was pledged to cover margin requirements for centrally cleared swaps. At period end, the value of securities pledged amounted to $5,317,000. |
| (e) | Security or a portion of the security has been segregated as collateral for mortgage-backed or asset-backed securities purchased on a delayed delivery or when-issued basis. At period end, the value of securities pledged amounted to $1,000. |
| (f) | Security or a portion of the security was pledged to cover margin requirements for futures contracts. At period end, the value of securities pledged amounted to $3,929,000. |
| (g) | Security or a portion of the security purchased on a delayed delivery or when-issued basis. |
| (h) | Interest Only (IO) security represents the right to receive only monthly interest payments on an underlying pool of mortgages or assets. Principal shown is the outstanding par amount of the pool as of the end of the period. |
| (i) | Coupon is inversely indexed to a floating interest rate multiplied by a specified factor. The price may be considerably more volatile than the price of a comparable fixed rate security. |
| (j) | Represents an investment in an underlying pool of reverse mortgages which typically do not require regular principal and interest payments as repayment is deferred until a maturity event. |
| (k) | Affiliated fund that is generally available only to investment companies and other accounts managed by Fidelity Investments. The rate quoted is the annualized seven-day yield of the fund at period end. A complete unaudited listing of the fund's holdings as of its most recent quarter end is available upon request. In addition, each Fidelity Central Fund's financial statements, which are not covered by the Fund's Report of Independent Registered Public Accounting Firm, are available on the SEC's website or upon request. |
| Affiliate (Amounts in thousands) | Value, beginning of period ($) | Purchases ($) | Sales Proceeds ($) | Dividend Income ($) | Realized Gain (loss) ($) | Change in Unrealized appreciation (depreciation) ($) | Value, end of period ($) | % ownership, end of period |
| Fidelity Cash Central Fund 5.39% | 260,948 | 908,667 | 1,162,625 | 5,702 | - | - | 6,990 | 0.0% |
| Fidelity Securities Lending Cash Central Fund 5.39% | - | 195,184 | 195,184 | 6 | - | - | - | 0.0% |
| Total | 260,948 | 1,103,851 | 1,357,809 | 5,708 | - | - | 6,990 | |
| Valuation Inputs at Reporting Date: | ||||
Description (Amounts in thousands) | Total ($) | Level 1 ($) | Level 2 ($) | Level 3 ($) |
Investments in Securities: | ||||
| U.S. Government and Government Agency Obligations | 173,369 | - | 173,369 | - |
| U.S. Government Agency - Mortgage Securities | 2,524,447 | - | 2,524,447 | - |
| Collateralized Mortgage Obligations | 251,991 | - | 251,991 | - |
| Commercial Mortgage Securities | 21,123 | - | 21,123 | - |
| Money Market Funds | 6,990 | 6,990 | - | - |
| Purchased Swaptions | 538 | - | 538 | - |
| Total Investments in Securities: | 2,978,458 | 6,990 | 2,971,468 | - |
Derivative Instruments: Assets | ||||
Futures Contracts | 107 | 107 | - | - |
Swaps | 67 | - | 67 | - |
| Total Assets | 174 | 107 | 67 | - |
| Liabilities | ||||
Futures Contracts | (3,345) | (3,345) | - | - |
Swaps | (1,805) | - | (1,805) | - |
Written Swaptions | (3,002) | - | (3,002) | - |
| Total Liabilities | (8,152) | (3,345) | (4,807) | - |
| Total Derivative Instruments: | (7,978) | (3,238) | (4,740) | - |
Other Financial Instruments: | ||||
TBA Sale Commitments | (444,399) | - | (444,399) | - |
| Total Other Financial Instruments: | (444,399) | - | (444,399) | - |
Primary Risk Exposure / Derivative Type | Value | |
| (Amounts in thousands) | Asset ($) | Liability ($) |
| Interest Rate Risk | ||
Futures Contracts (a) | 107 | (3,345) |
Purchased Swaptions (b) | 538 | 0 |
Swaps (c) | 67 | (1,805) |
Written Swaptions (d) | 0 | (3,002) |
| Total Interest Rate Risk | 712 | (8,152) |
| Total Value of Derivatives | 712 | (8,152) |
| Statement of Assets and Liabilities | ||||
As of July 31, 2024 Amounts in thousands (except per-share amount) | ||||
| Assets | ||||
| Investment in securities, at value - See accompanying schedule: | ||||
Unaffiliated issuers (cost $3,077,181) | $ | 2,971,468 | ||
Fidelity Central Funds (cost $6,990) | 6,990 | |||
| Total Investment in Securities (cost $3,084,171) | $ | 2,978,458 | ||
| Receivable for investments sold | 4,721 | |||
| Receivable for premium on written options | 3,241 | |||
| Receivable for TBA sale commitments | 441,512 | |||
| Receivable for fund shares sold | 57 | |||
| Interest receivable | 7,420 | |||
| Distributions receivable from Fidelity Central Funds | 68 | |||
| Other receivables | 4 | |||
Total assets | 3,435,481 | |||
| Liabilities | ||||
| Payable for investments purchased | ||||
Regular delivery | $ | 7,179 | ||
Delayed delivery | 923,905 | |||
| TBA sale commitments, at value | 444,399 | |||
| Payable for fund shares redeemed | 1,130 | |||
| Distributions payable | 770 | |||
| Accrued management fee | 478 | |||
| Payable for daily variation margin on futures contracts | 439 | |||
| Payable for daily variation margin on centrally cleared swaps | 693 | |||
| Written options, at value (premium receivable $3,241) | 3,002 | |||
| Other affiliated payables | 285 | |||
| Other payables and accrued expenses | 74 | |||
| Total liabilities | 1,382,354 | |||
| Net Assets | $ | 2,053,127 | ||
| Net Assets consist of: | ||||
| Paid in capital | $ | 2,437,912 | ||
| Total accumulated earnings (loss) | (384,785) | |||
| Net Assets | $ | 2,053,127 | ||
Net Asset Value, offering price and redemption price per share ($2,053,127 ÷ 201,123 shares) | $ | 10.21 | ||
| Statement of Operations | ||||
| Year ended July 31, 2024 Amounts in thousands | ||||
| Investment Income | ||||
| Interest | $ | 81,236 | ||
| Income from Fidelity Central Funds (including $6 from security lending) | 5,708 | |||
| Total income | 86,944 | |||
| Expenses | ||||
| Management fee | $ | 6,162 | ||
| Transfer agent fees | 2,125 | |||
| Fund wide operations fee | 1,209 | |||
| Independent trustees' fees and expenses | 65 | |||
| Total expenses before reductions | 9,561 | |||
| Expense reductions | (7) | |||
| Total expenses after reductions | 9,554 | |||
| Net Investment income (loss) | 77,390 | |||
| Realized and Unrealized Gain (Loss) | ||||
| Net realized gain (loss) on: | ||||
| Investment Securities: | ||||
| Unaffiliated issuers | (27,527) | |||
| Futures contracts | 15,075 | |||
| Swaps | (3,892) | |||
| Total net realized gain (loss) | (16,344) | |||
| Change in net unrealized appreciation (depreciation) on: | ||||
| Investment Securities: | ||||
| Unaffiliated issuers | 55,327 | |||
| Futures contracts | (9,583) | |||
| Swaps | (1,561) | |||
| Written options | 239 | |||
| TBA Sale commitments | (3,767) | |||
| Total change in net unrealized appreciation (depreciation) | 40,655 | |||
| Net gain (loss) | 24,311 | |||
| Net increase (decrease) in net assets resulting from operations | $ | 101,701 | ||
| Statement of Changes in Net Assets | ||||
| Amount in thousands | Year ended July 31, 2024 | Year ended July 31, 2023 | ||
| Increase (Decrease) in Net Assets | ||||
| Operations | ||||
| Net investment income (loss) | $ | 77,390 | $ | 80,753 |
| Net realized gain (loss) | (16,344) | (80,806) | ||
| Change in net unrealized appreciation (depreciation) | 40,655 | (130,047) | ||
| Net increase (decrease) in net assets resulting from operations | 101,701 | (130,100) | ||
| Distributions to shareholders | (75,877) | (79,236) | ||
| Share transactions | ||||
| Proceeds from sales of shares | 129,681 | 189,947 | ||
| Reinvestment of distributions | 66,832 | 70,547 | ||
| Cost of shares redeemed | (480,069) | (633,058) | ||
Net increase (decrease) in net assets resulting from share transactions | (283,556) | (372,564) | ||
| Total increase (decrease) in net assets | (257,732) | (581,900) | ||
| Net Assets | ||||
| Beginning of period | 2,310,859 | 2,892,759 | ||
| End of period | $ | 2,053,127 | $ | 2,310,859 |
| Other Information | ||||
| Shares | ||||
| Sold | 13,229 | 18,607 | ||
| Issued in reinvestment of distributions | 6,735 | 6,944 | ||
| Redeemed | (48,519) | (62,311) | ||
| Net increase (decrease) | (28,555) | (36,760) | ||
Fidelity® GNMA Fund |
| Years ended July 31, | 2024 | 2023 | 2022 | 2021 | 2020 | |||||
Selected Per-Share Data | ||||||||||
| Net asset value, beginning of period | $ | 10.06 | $ | 10.86 | $ | 11.73 | $ | 11.80 | $ | 11.51 |
| Income from Investment Operations | ||||||||||
Net investment income (loss) A,B | .361 | .326 | .116 | .097 | .229 | |||||
| Net realized and unrealized gain (loss) | .143 | (.823) | (.838) | (.065) | .307 | |||||
| Total from investment operations | .504 | (.497) | (.722) | .032 | .536 | |||||
| Distributions from net investment income | (.354) | (.303) | (.121) | (.093) C | (.246) | |||||
| Distributions from net realized gain | - | - | (.027) | (.009) C | - | |||||
| Total distributions | (.354) | (.303) | (.148) | (.102) | (.246) | |||||
| Net asset value, end of period | $ | 10.21 | $ | 10.06 | $ | 10.86 | $ | 11.73 | $ | 11.80 |
Total Return D | 5.17 % | (4.39)% | (6.19)% | .27% | 4.71% | |||||
Ratios to Average Net Assets B,E,F | ||||||||||
| Expenses before reductions | .45% | .45% | .45% | .45% | .45% | |||||
| Expenses net of fee waivers, if any | .45 % | .45% | .45% | .45% | .45% | |||||
| Expenses net of all reductions | .45% | .45% | .45% | .45% | .45% | |||||
| Net investment income (loss) | 3.64% | 3.20% | 1.03% | .83% | 1.96% | |||||
| Supplemental Data | ||||||||||
| Net assets, end of period (in millions) | $ | 2,053 | $ | 2,311 | $ | 2,893 | $ | 3,958 | $ | 4,303 |
Portfolio turnover rate G | 781 % | 776% | 863% | 593% | 561% |
| Fidelity Central Fund | Investment Manager | Investment Objective | Investment Practices | Expense RatioA |
| Fidelity Money Market Central Funds | Fidelity Management & Research Company LLC (FMR) | Each fund seeks to obtain a high level of current income consistent with the preservation of capital and liquidity. | Short-term Investments | Less than .005% |
| Fidelity GNMA Fund | $3 |
| Gross unrealized appreciation | $20,616 |
| Gross unrealized depreciation | (137,394) |
| Net unrealized appreciation (depreciation) | $(116,778) |
| Tax Cost | $3,090,420 |
| Undistributed ordinary income | $2,660 |
| Capital loss carryforward | $(270,442) |
| Net unrealized appreciation (depreciation) on securities and other investments | $(117,005) |
Short-term | $(250,763) |
Long-term | (19,679) |
| Total capital loss carryforward | $(270,442) |
| July 31, 2024 | July 31, 2023 | |
| Ordinary Income | $75,877 | $79,236 |
| Interest Rate Risk | Interest rate risk relates to the fluctuations in the value of interest-bearing securities due to changes in the prevailing levels of market interest rates. |
| Primary Risk Exposure / Derivative Type | Net Realized Gain (Loss)($) | Change in Net Unrealized Appreciation (Depreciation)($) |
| Fidelity GNMA Fund | ||
| Interest Rate Risk | ||
| Futures Contracts | 15,075 | (9,583) |
| Purchased Options | 138 | 8 |
| Written Options | - | 239 |
| Swaps | (3,892) | (1,561) |
| Total Interest Rate Risk | 11,321 | (10,897) |
| Totals | 11,321 | (10,897) |
| Purchases ($) | Sales ($) | |
| Fidelity GNMA Fund | 4,002,802 | 4,067,392 |
| Fidelity GNMA Fund | .06% |
| Total Security Lending Fees Paid to NFS ($) | Security Lending Income From Securities Loaned to NFS ($) | Value of Securities Loaned to NFS at Period End ($) | |
| Fidelity GNMA Fund | 1 | - | - |
| A special meeting of shareholders was held on October 18, 2023. The results of votes taken among shareholders on the proposal before them are reported below. Each vote reported represents one dollar of net asset value held on the record date for the meeting. | ||
| Proposal 1 | ||
| To elect a Board of Trustees. | ||
# of Votes | % of Votes | |
| Abigail P. Johnson | ||
| Affirmative | 29,408,520,731.18 | 96.84 |
| Withheld | 958,659,352.64 | 3.16 |
| TOTAL | 30,367,180,083.82 | 100.00 |
| Jennifer Toolin McAuliffe | ||
| Affirmative | 29,484,249,185.02 | 97.09 |
| Withheld | 882,930,898.80 | 2.91 |
| TOTAL | 30,367,180,083.82 | 100.00 |
| Christine J. Thompson | ||
| Affirmative | 29,483,889,948.58 | 97.09 |
| Withheld | 883,290,135.24 | 2.91 |
| TOTAL | 30,367,180,083.82 | 100.00 |
| Elizabeth S. Acton | ||
| Affirmative | 29,471,265,000.64 | 97.05 |
| Withheld | 895,915,083.18 | 2.95 |
| TOTAL | 30,367,180,083.82 | 100.00 |
| Laura M. Bishop | ||
| Affirmative | 29,508,015,754.27 | 97.17 |
| Withheld | 859,164,329.55 | 2.83 |
| TOTAL | 30,367,180,083.82 | 100.00 |
| Ann E. Dunwoody | ||
| Affirmative | 29,470,432,034.14 | 97.05 |
| Withheld | 896,748,049.68 | 2.95 |
| TOTAL | 30,367,180,083.82 | 100.00 |
| John Engler | ||
| Affirmative | 29,326,181,411.39 | 96.57 |
| Withheld | 1,040,998,672.43 | 3.43 |
| TOTAL | 30,367,180,083.82 | 100.00 |
| Robert F. Gartland | ||
| Affirmative | 29,422,803,481.93 | 96.89 |
| Withheld | 944,376,601.89 | 3.11 |
| TOTAL | 30,367,180,083.82 | 100.00 |
| Robert W. Helm | ||
| Affirmative | 29,445,540,968.38 | 96.97 |
| Withheld | 921,639,115.44 | 3.03 |
| TOTAL | 30,367,180,083.82 | 100.00 |
| Arthur E. Johnson | ||
| Affirmative | 29,395,582,286.37 | 96.80 |
| Withheld | 971,597,797.45 | 3.20 |
| TOTAL | 30,367,180,083.82 | 100.00 |
| Michael E. Kenneally | ||
| Affirmative | 29,420,582,069.08 | 96.88 |
| Withheld | 946,598,014.74 | 3.12 |
| TOTAL | 30,367,180,083.82 | 100.00 |
| Mark A. Murray | ||
| Affirmative | 29,446,384,581.44 | 96.97 |
| Withheld | 920,795,502.38 | 3.03 |
| TOTAL | 30,367,180,083.82 | 100.00 |
| Carol J. Zierhoffer | ||
| Affirmative | 29,510,392,522.55 | 97.18 |
| Withheld | 856,787,561.27 | 2.82 |
| TOTAL | 30,367,180,083.82 | 100.00 |
| Proposal 1 reflects trust-wide proposal and voting results. | ||
 |
Item 8.
Changes in and Disagreements with Accountants for Open-End Management Investment Companies
See Item 7.
Item 9.
Proxy Disclosures for Open-End Management Investment Companies
See Item 7.
Item 10.
Remuneration Paid to Directors, Officers, and Others of Open-End Management Investment Companies
See Item 7.
Item 11.
Statement Regarding Basis for Approval of Investment Advisory Contract
See Item 7.
Item 12.
Disclosure of Proxy Voting Policies and Procedures for Closed-End Management Investment Companies
Not applicable.
Item 13.
Portfolio Managers of Closed-End Management Investment Companies
Not applicable.
Item 14.
Purchase of Equity Securities by Closed-End Management Investment Company and Affiliated Purchasers
Not applicable.
Item 15.
Submission of Matters to a Vote of Security Holders
There were no material changes to the procedures by which shareholders may recommend nominees to the trust’s Board of Trustees.
Item 16.
Controls and Procedures
(a)(i) The President and Treasurer and the Chief Financial Officer have concluded that the trust’s disclosure controls and procedures (as defined in Rule 30a-3(c) under the Investment Company Act) provide reasonable assurances that material information relating to the trust is made known to them by the appropriate persons, based on their evaluation of these controls and procedures as of a date within 90 days of the filing date of this report.
(a)(ii) There was no change in the trust’s internal control over financial reporting (as defined in Rule 30a-3(d) under the Investment Company Act) that occurred during the period covered by this report that has materially affected, or is reasonably likely to materially affect, the trust’s internal control over financial reporting.
Item 17.
Disclosure of Securities Lending Activities for Closed-End Management Investment Companies
Not applicable.
Item 18.
Recovery of Erroneously Awarded Compensation
(a)
Not applicable.
(b)
Not applicable.
Item 19.
Exhibits
(a) | (1) | Code of Ethics pursuant to Item 2 of Form N-CSR is filed and attached hereto as EX-99.CODE ETH. |
(a) | (2) | |
(a) | (3) | Not applicable. |
(b) |
SIGNATURES
Pursuant to the requirements of the Securities Exchange Act of 1934 and the Investment Company Act of 1940, the registrant has duly caused this report to be signed on its behalf by the undersigned, thereunto duly authorized.
Fidelity Income Fund
By: | /s/Laura M. Del Prato |
Laura M. Del Prato | |
President and Treasurer (Principal Executive Officer) | |
Date: | September 20, 2024 |
Pursuant to the requirements of the Securities Exchange Act of 1934 and the Investment Company Act of 1940, this report has been signed below by the following persons on behalf of the registrant and in the capacities and on the dates indicated.
By: | /s/Laura M. Del Prato |
Laura M. Del Prato | |
President and Treasurer (Principal Executive Officer) | |
Date: | September 20, 2024 |
By: | /s/John J. Burke III |
John J. Burke III | |
Chief Financial Officer (Principal Financial Officer) | |
Date: | September 20, 2024 |