UNITED STATES
SECURITIES AND EXCHANGE COMMISSION
Washington, D.C. 20549
FORM N-CSR
CERTIFIED SHAREHOLDER REPORT OF REGISTERED
MANAGEMENT INVESTMENT COMPANIES
Investment Company Act file number 811-4085
Fidelity Income Fund
(Exact name of registrant as specified in charter)
82 Devonshire St., Boston, Massachusetts 02109
(Address of principal executive offices) (Zip code)
Scott C. Goebel, Secretary
82 Devonshire St.
Boston, Massachusetts 02109
(Name and address of agent for service)
Registrant's telephone number, including area code: 617-563-7000
Date of fiscal year end: | July 31 |
| |
Date of reporting period: | July 31, 2011 |
Item 1. Reports to Stockholders
Fidelity® GNMA Fund
Annual Report
July 31, 2011
(2_fidelity_logos) (Registered_Trademark)
Contents
Chairman's Message | <Click Here> | The Chairman's message to shareholders. |
Performance | <Click Here> | How the fund has done over time. |
Management's Discussion of Fund Performance | <Click Here> | The Portfolio Manager's review of fund performance and strategy. |
Shareholder Expense Example | <Click Here> | An example of shareholder expenses. |
Investment Changes | <Click Here> | A summary of major shifts in the fund's investments over the past six months. |
Investments | <Click Here> | A complete list of the fund's investments with their market values. |
Financial Statements | <Click Here> | Statements of assets and liabilities, operations, and changes in net assets, as well as financial highlights. |
Notes | <Click Here> | Notes to the financial statements. |
Report of Independent Registered Public Accounting Firm | <Click Here> | |
Trustees and Officers | <Click Here> | |
Distributions | <Click Here> | |
To view a fund's proxy voting guidelines and proxy voting record for the 12-month period ended June 30, visit http://www.fidelity.com/proxyvotingresults or visit the Securities and Exchange Commission's (SEC) web site at http://www.sec.gov. You may also call 1-800-544-8544 to request a free copy of the proxy voting guidelines.
Standard & Poor's, S&P and S&P 500 are registered service marks of The McGraw-Hill Companies, Inc. and have been licensed for use by Fidelity Distributors Corporation.
Other third party marks appearing herein are the property of their respective owners.
All other marks appearing herein are registered or unregistered trademarks or service marks of FMR LLC or an affiliated company.
This report and the financial statements contained herein are submitted for the general information of the shareholders of the fund. This report is not authorized for distribution to prospective investors in the fund unless preceded or accompanied by an effective prospectus.
A fund files its complete schedule of portfolio holdings with the SEC for the first and third quarters of each fiscal year on Form N-Q. Forms N-Q are available on the SEC's web site at http://www.sec.gov. A fund's Forms N-Q may be reviewed and copied at the SEC's Public Reference Room in Washington, DC. Information regarding the operation of the SEC's Public Reference Room may be obtained by calling 1-800-SEC-0330. For a complete list of a fund's portfolio holdings, view the most recent holdings listing, semiannual report, or annual report on Fidelity's web site at http://www.fidelity.com, http://www.advisor.fidelity.com, or http://www.401k.com, as applicable.
NOT FDIC INSURED • MAY LOSE VALUE • NO BANK GUARANTEE
Neither the fund nor Fidelity Distributors Corporation is a bank.
Annual Report
(photo_of_Abigail_P_Johnson)
Dear Shareholder:
The second half of 2011 began with U.S. equities continuing to give back some of the gains achieved earlier in the year. In the days leading up to July 31, markets were shaken by a political stalemate in which Congress struggled to address the debt ceiling issue before an early-August deadline. The resulting uncertainty held back markets in July, the third consecutive monthly decline for equities, effectively reversing the positive momentum seen through the end of April. Financial markets are always unpredictable, of course, but there are several time-tested investment principles that can help put the odds in your favor.
One of the basic tenets is to invest for the long term. Over time, riding out the markets' inevitable ups and downs has proven much more effective than selling into panic or chasing the hottest trend. Even missing only a few of the markets' best days can significantly diminish investor returns. Patience also affords the benefits of compounding - of earning interest on additional income or reinvested dividends and capital gains. There can be tax advantages and cost benefits to consider as well. While staying the course doesn't eliminate risk, it can considerably lessen the effect of short-term declines.
You can further manage your investing risk through diversification. And today, more than ever, geographic diversification should be taken into account. Studies indicate that asset allocation is the single most important determinant of a portfolio's long-term success. The right mix of stocks, bonds and cash - aligned to your particular risk tolerance and investment objective - is very important. Age-appropriate rebalancing is also an essential aspect of asset allocation. For younger investors, an emphasis on equities - which historically have been the best-performing asset class over time - is encouraged. As investors near their specific goal, such as retirement or sending a child to college, consideration may be given to replacing volatile assets (e.g. common stocks) with more-stable fixed investments (bonds or savings plans).
A third principle - investing regularly - can help lower the average cost of your purchases. Investing a certain amount of money each month or quarter helps ensure you won't pay for all your shares at market highs. This strategy - known as dollar cost averaging - also reduces "emotion" from investing, helping shareholders avoid selling weak performers just prior to an upswing, or chasing a hot performer just before a correction.
We invite you to contact us via the Internet, through our Investor Centers or by phone. It is our privilege to provide you the information you need to make the investments that are right for you.
Sincerely,
(The chairman's signature appears here.)
Abigail P. Johnson
Annual Report
Average annual total return reflects the change in the value of an investment, assuming reinvestment of the fund's distributions from dividend income and capital gains (the profits earned upon the sale of securities that have grown in value, if any) and assuming a constant rate of performance each year. The $10,000 table and the fund's returns do not reflect the deduction of taxes that a shareholder would pay on fund distributions or the redemption of fund shares. During periods of reimbursement by Fidelity, a fund's total return will be greater than it would be had the reimbursement not occurred. How a fund did yesterday is no guarantee of how it will do tomorrow.
Average Annual Total Returns
Periods ended July 31, 2011 | Past 1
year | Past 5
years | Past 10
years |
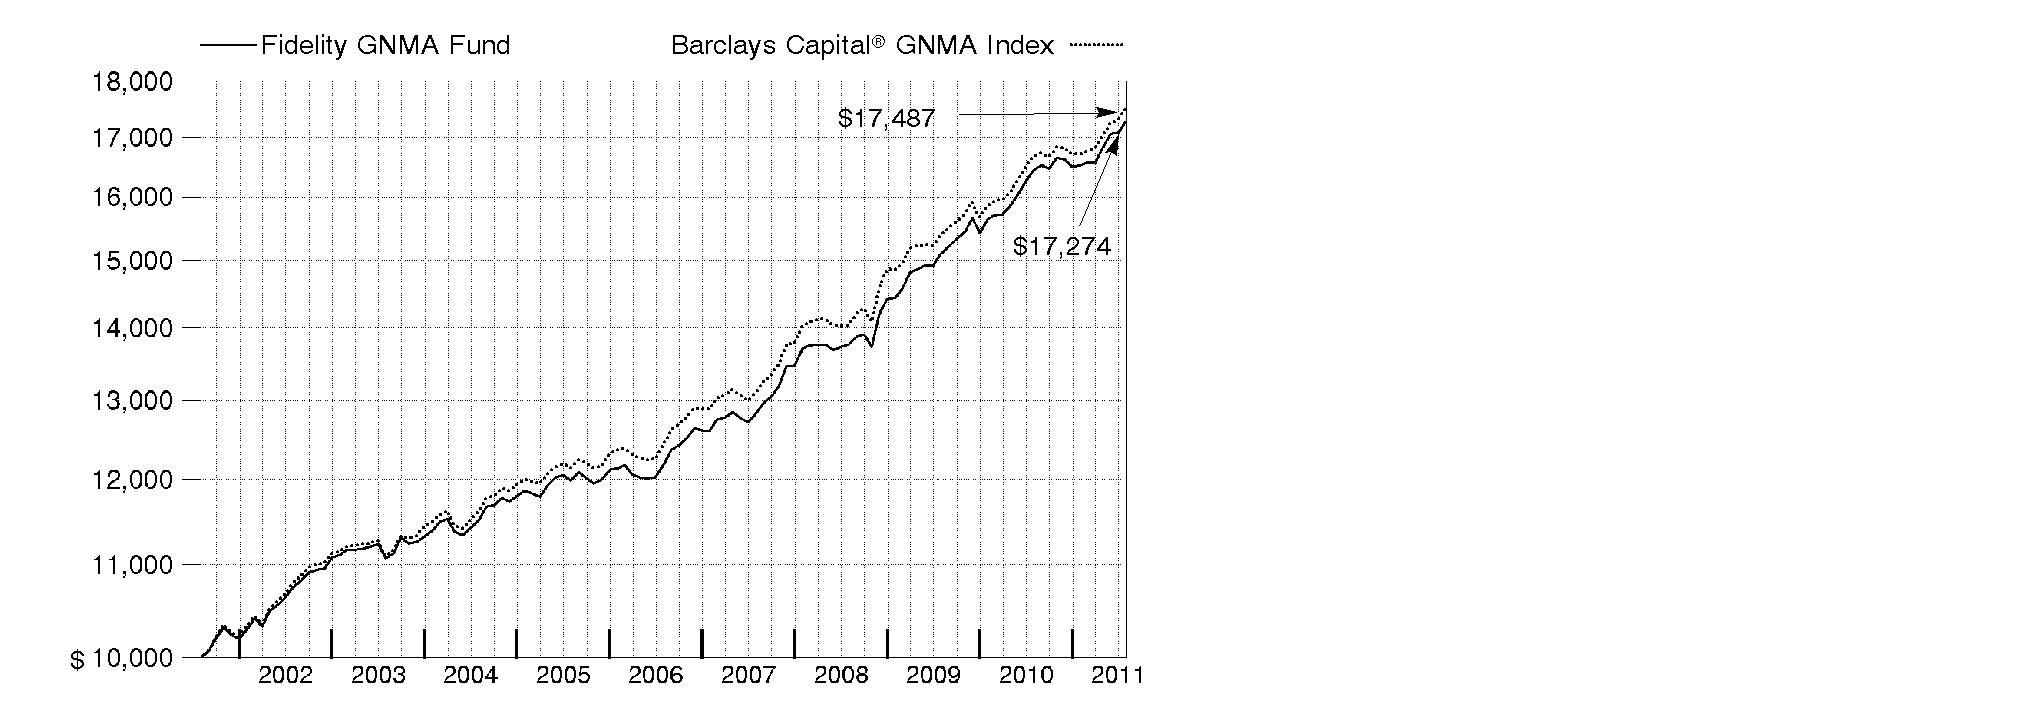
Fidelity® GNMA Fund | 5.04% | 7.24% | 5.62% |
$10,000 Over 10 Years
Let's say hypothetically that $10,000 was invested in Fidelity® GNMA Fund on July 31, 2001. The chart shows how the value of your investment would have changed, and also shows how the Barclays Capital® GNMA Index performed over the same period.
Annual Report
Market Recap: Amid ultra-low interest rates and heightened market volatility, U.S. taxable investment-grade bonds generated solid results for the year ending July 31, 2011, as evidenced by the 4.44% advance of the Barclays Capital® U.S. Aggregate Bond Index. The best-performing categories within the index were those on the riskier end of the spectrum that benefited during intervals when data pointed to an improving economy. Buoyed by a strong first-half showing, commercial mortgage-backed securities (CMBS) fared best, gaining 10.01% amid modest improvement in commercial real estate fundamentals. Corporate bonds rose 6.70%, due in large part to increased corporate profitability, high cash balances, reduced debt levels and improved credit conditions. Residential mortgage-backed securities, supported by a combination of strong demand from yield-hungry investors and slower prepayment rates, rose a solid 3.85%. Meanwhile, U.S. Treasury and agency securities gained 3.39% and 2.53%, respectively. These securities, which lagged in the first half of the period, when economic data was strong and inflation worries were muted, performed comparatively well in the second half amid signs of a weakening economic recovery and heightened concern about the sovereign debt crisis in Europe.
Comments from William Irving, Lead Portfolio Manager of Fidelity® GNMA Fund: For the 12-month period ending July 31, 2011, the fund returned 5.04%, while the Barclays Capital® GNMA Index rose 4.85%. Security selection was the main driver of the fund's outperformance, with our focus on prepayment-resistant securities - namely those backed by loans with low remaining balances and by loans in certain geographic regions where prepayments lagged - working to the fund's advantage. More recently, selling some prepayment-resistant securities and buying more-attractively-priced GNMAs proved advantageous, as these securities rallied nicely amid strong demand. We also benefited from owning collateralized mortgage obligation (CMO) floaters. Additionally, various trading strategies, including the use of dollar rolls, proved beneficial. These transactions allow us to extend the settlement of an existing purchase obligation, freeing up cash in the process to be invested in attractive short-term assets. Detracting from performance was out-of-benchmark exposure to reverse mortgage securities, which lagged due to concern about a potential lack of investor interest in the sector.
The views expressed above reflect those of the portfolio manager(s) only through the end of the period as stated on the cover of this report and do not necessarily represent the views of Fidelity or any other person in the Fidelity organization. Any such views are subject to change at any time based upon market or other conditions and Fidelity disclaims any responsibility to update such views. These views may not be relied on as investment advice and, because investment decisions for a Fidelity fund are based on numerous factors, may not be relied on as an indication of trading intent on behalf of any Fidelity fund.
Annual Report
Shareholder Expense Example
As a shareholder of the Fund, you incur two types of costs: (1) transaction costs, and (2) ongoing costs, including management fees and other Fund expenses. This Example is intended to help you understand your ongoing costs (in dollars) of investing in the Fund and to compare these costs with the ongoing costs of investing in other mutual funds.
The Example is based on an investment of $1,000 invested at the beginning of the period and held for the entire period (February 1, 2011 to July 31, 2011).
Actual Expenses
The first line of the accompanying table provides information about actual account values and actual expenses. You may use the information in this line, together with the amount you invested, to estimate the expenses that you paid over the period. Simply divide your account value by $1,000.00 (for example, an $8,600 account value divided by $1,000.00 = 8.6), then multiply the result by the number in the first line under the heading entitled "Expenses Paid During Period" to estimate the expenses you paid on your account during this period. A small balance maintenance fee of $12.00 that is charged once a year may apply for certain accounts with a value of less than $2,000. This fee is not included in the table below. If it was, the estimate of expenses you paid during the period would be higher, and your ending account value lower, by this amount.
Hypothetical Example for Comparison Purposes
The second line of the accompanying table provides information about hypothetical account values and hypothetical expenses based on the Fund's actual expense ratio and an assumed rate of return of 5% per year before expenses, which is not the Fund's actual return. The hypothetical account values and expenses may not be used to estimate the actual ending account balance or expenses you paid for the period. You may use this information to compare the ongoing costs of investing in the Fund and other funds. To do so, compare this 5% hypothetical example with the 5% hypothetical examples that appear in the shareholder reports of the other funds. A small balance maintenance fee of $12.00 that is charged once a year may apply for certain accounts with a value of less than $2,000. This fee is not included in the table below. If it was, the estimate of expenses you paid during the period would be higher, and your ending account value lower, by this amount.
Please note that the expenses shown in the table are meant to highlight your ongoing costs only and do not reflect any transaction costs. Therefore, the second line of the table is useful in comparing ongoing costs only, and will not help you determine the relative total costs of owning different funds.
| Annualized
Expense Ratio | Beginning
Account Value
February 1, 2011 | Ending
Account Value
July 31, 2011 | Expenses Paid
During Period*
February 1, 2011 to July 31, 2011 |
Actual | .45% | $ 1,000.00 | $ 1,045.40 | $ 2.28 |
Hypothetical (5% return per year before expenses) | | $ 1,000.00 | $ 1,022.56 | $ 2.26 |
* Expenses are equal to the Fund's annualized expense ratio, multiplied by the average account value over the period, multiplied by 181/365 (to reflect the one-half year period).
Annual Report
Investment Changes (Unaudited)
Coupon Distribution as of July 31, 2011 |
| % of fund's investments | % of fund's investments
6 months ago |
Less than 4% | 9.9 | 6.1 |
4 - 4.99% | 38.5 | 31.5 |
5 - 5.99% | 37.5 | 43.8 |
6 - 6.99% | 8.4 | 11.6 |
7% and over | 1.9 | 1.9 |
Coupon distribution shows the range of stated interest rates on the fund's investments, excluding short-term investments. |
Weighted Average Maturity as of July 31, 2011 |
| | 6 months ago |
Years | 5.5 | 4.9 |
This is a weighted average of all the maturities of the securities held in a fund. Weighted Average Maturity (WAM) can be used as a measure of sensitivity to interest rate changes and markets changes. Generally, the longer the maturity, the greater the sensitivity to such changes. WAM is based on the dollar-weighted average length of time until principal payments must be paid. Depending on the types of securities held in a fund, certain maturity shortening devices (e.g., demand features, interest rate resets, and call options) may be taken into account when calculating the WAM. |
Duration as of July 31, 2011 |
| | 6 months ago |
Years | 3.8 | 3.7 |
Duration estimates how much a bond fund's price will change with a change in comparable interest rates. If rates rise 1%, for example, a fund with a 5-year duration is likely to lose about 5% of its value. Other factors also can influence a bond fund's performance and share price. Accordingly, a bond fund's actual performance may differ from this example. Duration takes into account any call or put option embedded in the bonds. |
Asset Allocation (% of fund's net assets) |
As of July 31, 2011*A | As of January 31, 2011**B |
 | Mortgage
Securities 95.6% | | | Mortgage
Securities 104.6% | |
 | CMOs and Other Mortgage Related Securities 11.8% | |  | CMOs and Other Mortgage Related Securities 10.1% | |
 | U.S. Government
Agency
Obligations†† 1.2% | | | U.S. Government
Agency
Obligations†† 1.6% | |
 | Short-Term
Investments and
Net Other Assets† (8.6)% | | | Short-Term
Investments and
Net Other Assets† (16.3)% | |
* GNMA Securities | 104.5% | | ** GNMA Securities | 108.5% | |
A Futures and Swaps | (1.1)% | | B Futures and Swaps | (1.7)% | |
† Short-Term Invstments and Net Other Assets are not included in the pie chart. | |
†† Includes NCUA Guaranteed Notes. | |

Annual Report
Investments July 31, 2011
Showing Percentage of Net Assets
U.S. Government and Government Agency Obligations - 1.2% |
| Principal Amount (000s) | | Value (000s) |
Other Government Related - 1.2% |
National Credit Union Administration Guaranteed Notes: | | | | |
Series 2010-A1 Class A, 0.5351% 12/7/20 (NCUA Guaranteed) (c) | | $ 16,638 | | $ 16,684 |
Series 2010-R2 Class 1A, 0.5598% 11/6/17 (NCUA Guaranteed) (c) | | 34,762 | | 34,800 |
Series 2011-R1 Class 1A, 0.6398% 1/8/20 (NCUA Guaranteed) (c) | | 24,330 | | 24,367 |
Series 2011-R4 Class 1A, 0.5698% 3/6/20 (NCUA Guaranteed) (c) | | 17,065 | | 17,073 |
TOTAL U.S. GOVERNMENT AND GOVERNMENT AGENCY OBLIGATIONS (Cost $92,795) | 92,924 |
U.S. Government Agency - Mortgage Securities - 95.6% |
|
Fannie Mae - 1.6% |
2.01% 2/1/33 (c) | | 160 | | 166 |
2.035% 12/1/34 (c) | | 172 | | 179 |
2.035% 3/1/35 (c) | | 159 | | 165 |
2.05% 9/1/33 (c) | | 1,462 | | 1,516 |
2.054% 10/1/33 (c) | | 79 | | 83 |
2.065% 7/1/35 (c) | | 75 | | 78 |
2.175% 3/1/35 (c) | | 31 | | 32 |
2.451% 7/1/36 (c) | | 418 | | 437 |
2.527% 6/1/47 (c) | | 408 | | 427 |
2.534% 7/1/34 (c) | | 92 | | 95 |
2.534% 1/1/35 (c) | | 753 | | 783 |
2.544% 3/1/33 (c) | | 390 | | 406 |
2.554% 10/1/33 (c) | | 154 | | 163 |
2.584% 11/1/36 (c) | | 765 | | 805 |
2.717% 8/1/35 (c) | | 960 | | 1,006 |
2.743% 7/1/34 (c) | | 1,478 | | 1,566 |
2.838% 5/1/35 (c) | | 1,209 | | 1,268 |
3.051% 8/1/35 (c) | | 1,999 | | 2,123 |
3.376% 9/1/34 (c) | | 920 | | 970 |
3.5% 11/1/25 to 4/1/26 | | 90,952 | | 93,604 |
4% 4/1/24 to 10/1/25 | | 2,772 | | 2,913 |
4.5% 6/1/24 | | 3,219 | | 3,427 |
4.5% 8/1/26 (a) | | 11,000 | | 11,701 |
5.5% 12/1/17 to 3/1/20 | | 2,869 | | 3,112 |
5.746% 3/1/36 (c) | | 1,030 | | 1,094 |
U.S. Government Agency - Mortgage Securities - continued |
| Principal Amount (000s) | | Value (000s) |
Fannie Mae - continued |
6.5% 10/1/17 | | $ 180 | | $ 199 |
7% 11/1/16 to 3/1/17 | | 956 | | 1,051 |
7.5% 9/1/11 to 4/1/17 | | 321 | | 347 |
8.5% 12/1/27 | | 139 | | 161 |
9.5% 9/1/30 | | 15 | | 19 |
10.25% 10/1/18 | | 5 | | 6 |
11.5% 11/1/14 to 7/1/15 | | 7 | | 8 |
12.5% 10/1/15 to 7/1/16 | | 17 | | 19 |
13.25% 9/1/11 | | 0* | | 0* |
| | 129,929 |
Freddie Mac - 0.4% |
2.075% 3/1/37 (c) | | 100 | | 104 |
2.102% 12/1/35 (c) | | 703 | | 731 |
2.286% 6/1/33 (c) | | 911 | | 951 |
2.479% 11/1/35 (c) | | 812 | | 846 |
2.487% 10/1/35 (c) | | 929 | | 970 |
2.5% 5/1/37 (c) | | 218 | | 229 |
2.502% 12/1/35 (c) | | 6,514 | | 6,855 |
2.526% 6/1/33 (c) | | 2,635 | | 2,776 |
2.615% 4/1/36 (c) | | 1,091 | | 1,148 |
2.634% 7/1/35 (c) | | 947 | | 985 |
2.714% 3/1/35 (c) | | 3,746 | | 3,947 |
2.716% 10/1/36 (c) | | 1,093 | | 1,142 |
2.77% 1/1/35 (c) | | 2,457 | | 2,587 |
2.81% 6/1/33 (c) | | 2,342 | | 2,461 |
2.942% 3/1/33 (c) | | 28 | | 30 |
3.086% 8/1/34 (c) | | 368 | | 386 |
5.5% 11/1/17 to 1/1/25 | | 4,965 | | 5,407 |
8.5% 5/1/17 to 6/1/25 | | 29 | | 33 |
9% 7/1/18 to 3/1/20 | | 10 | | 11 |
9.5% 7/1/30 | | 61 | | 74 |
10% 4/1/15 to 7/1/19 | | 87 | | 100 |
10.25% 11/1/16 | | 4 | | 5 |
12% 2/1/13 to 6/1/15 | | 14 | | 16 |
12.5% 1/1/13 to 5/1/15 | | 13 | | 15 |
13% 5/1/14 to 11/1/14 | | 2 | | 3 |
13.5% 9/1/14 | | 1 | | 1 |
| | 31,813 |
Ginnie Mae - 93.6% |
3.5% 3/20/34 to 7/15/41 | | 348,408 | | 346,472 |
4% 1/15/25 to 3/15/40 | | 116,364 | | 122,456 |
U.S. Government Agency - Mortgage Securities - continued |
| Principal Amount (000s) | | Value (000s) |
Ginnie Mae - continued |
4% 8/1/41 (a) | | $ 275,000 | | $ 283,791 |
4% 8/1/41 (a) | | 99,000 | | 102,165 |
4% 8/1/41 (a) | | 115,500 | | 119,445 |
4% 8/1/41 (a)(b) | | 72,500 | | 74,976 |
4.5% 6/20/33 to 7/20/41 (a) | | 2,153,755 | | 2,298,753 |
4.5% 6/1/41 (a) | | 83,000 | | 88,447 |
4.5% 8/1/41 (a) | | 46,000 | | 48,917 |
4.5% 8/1/41 (a) | | 128,500 | | 136,931 |
4.5% 8/1/41 (a) | | 40,000 | | 42,624 |
4.5% 8/1/41 (a)(b) | | 40,000 | | 42,624 |
5% 8/15/18 to 5/15/41 | | 1,560,211 | | 1,707,953 |
5% 8/1/41 (a) | | 5,000 | | 5,461 |
5% 8/1/41 (a) | | 32,000 | | 34,886 |
5% 8/1/41 (a) | | 73,000 | | 79,583 |
5.251% 6/20/60 (g) | | 47,242 | | 52,205 |
5.35% 4/20/29 to 12/20/30 | | 30,301 | | 33,748 |
5.391% 11/20/59 (g) | | 70,681 | | 77,503 |
5.5% 12/20/18 to 7/20/40 | | 939,372 | | 1,043,952 |
5.5% 8/1/41 (a)(b) | | 22,000 | | 24,331 |
6% 8/15/17 to 5/15/39 | | 521,661 | | 584,007 |
6.45% 10/15/31 to 11/15/32 | | 1,214 | | 1,379 |
6.5% 5/20/28 to 1/15/39 | | 50,808 | | 57,218 |
7% 10/20/16 to 9/20/34 | | 56,161 | | 64,713 |
7.25% 9/15/27 | | 114 | | 132 |
7.395% 6/20/25 to 11/20/27 | | 1,204 | | 1,396 |
7.5% 5/15/17 to 9/20/32 | | 22,634 | | 26,100 |
8% 8/15/18 to 7/15/32 | | 6,126 | | 7,071 |
8.5% 5/15/16 to 2/15/31 | | 1,495 | | 1,675 |
9% 5/15/14 to 5/15/30 | | 770 | | 884 |
9.5% 12/20/15 to 4/20/17 | | 236 | | 263 |
10.5% 1/15/14 to 10/15/18 | | 238 | | 270 |
13% 4/15/13 to 1/15/15 | | 26 | | 29 |
13.5% 1/15/15 | | 3 | | 3 |
| | 7,512,363 |
TOTAL U.S. GOVERNMENT AGENCY - MORTGAGE SECURITIES (Cost $7,396,615) | 7,674,105 |
Collateralized Mortgage Obligations - 11.8% |
| Principal Amount (000s) | | Value (000s) |
U.S. Government Agency - 11.8% |
Fannie Mae: | | | | |
sequential payer Series 2010-50 Class FA, 0.5373% 1/25/24 (c) | | $ 5,855 | | $ 5,882 |
Series 2003-39 Class IA, 5.5% 10/25/22 (c)(d) | | 1,198 | | 87 |
target amortization class Series G94-2 Class D, 6.45% 1/25/24 | | 752 | | 769 |
Fannie Mae Stripped Mortgage-Backed Securities: | | | | |
Series 331 Class 12, 6.5% 2/1/33 (d) | | 1,249 | | 275 |
Series 339 Class 5, 5.5% 8/1/33 (d) | | 1,924 | | 369 |
Series 343 Class 16, 5.5% 5/1/34 (d) | | 1,488 | | 298 |
Fannie Mae subordinate REMIC pass-thru certificates floater Series 2008-76 Class EF, 0.6873% 9/25/23 (c) | | 7,288 | | 7,297 |
Freddie Mac Multi-class participation certificates guaranteed: | | | | |
floater Series 2861 Class JF, 0.4865% 4/15/17 (c) | | 110 | | 110 |
planned amortization Series 3792, 0.5865% 11/15/40 (c) | | 45,328 | | 45,561 |
planned amortization class: | | | | |
Series 2220 Class PD, 8% 3/15/30 | | 1,926 | | 2,247 |
Series 40 Class K, 6.5% 8/17/24 | | 845 | | 964 |
sequential payer: | | | | |
Series 2204 Class N, 7.5% 12/20/29 | | 4,004 | | 4,737 |
Series 2601 Class TI, 5.5% 10/15/22 (d) | | 4,446 | | 360 |
Ginnie Mae guaranteed Multi-family REMIC pass-thru securities sequential payer Series 2002-71 Class Z, 5.5% 10/20/32 | | 27,718 | | 30,900 |
Ginnie Mae guaranteed REMIC pass-thru certificates: | | | | |
floater: | | | | |
Series 2001-22 Class FM, 0.5363% 5/20/31 (c) | | 376 | | 377 |
Series 2002-41 Class HF, 0.5865% 6/16/32 (c) | | 422 | | 424 |
Series 2010-H03 Class FA, 0.7363% 3/20/60 (c)(g) | | 23,280 | | 23,198 |
Series 2010-H17 Class FA, 0.5163% 7/20/60 (c)(g) | | 19,128 | | 18,835 |
Series 2010-H18 Class AF, 0.5103% 9/20/60 (c)(g) | | 20,016 | | 19,697 |
Series 2010-H19 Class FG, 0.4863% 8/20/60 (c)(g) | | 25,556 | | 25,132 |
Series 2010-H27 Series FA, 0.5663% 12/20/60 (c)(g) | | 7,377 | | 7,278 |
Series 2011-H05 Class FA, 0.6863% 12/20/60 (c)(g) | | 13,648 | | 13,566 |
Collateralized Mortgage Obligations - continued |
| Principal Amount (000s) | | Value (000s) |
U.S. Government Agency - continued |
Ginnie Mae guaranteed REMIC pass-thru certificates: - continued | | | | |
floater: | | | | |
Series 2011-H07 Class FA, 0.6863% 2/20/61 (c)(g) | | $ 5,594 | | $ 5,573 |
Series 2011-H12 Class FA, 0.6763% 2/20/61 (c)(g) | | 27,815 | | 27,676 |
Series 2011-H13 Class FA, 0.6863% 4/20/61 (c)(g) | | 11,988 | | 11,988 |
Series 2011-H14: | | | | |
Class FB, 0.6863% 5/20/61 (c)(g) | | 13,146 | | 13,072 |
Class FC, 0.6863% 5/20/61 (c)(g) | | 13,787 | | 13,713 |
planned amortization: | | | | |
Series 2010-117 Class E, 3% 10/20/39 | | 10,076 | | 9,120 |
Series 2011-52 Class PA, 4.25% 2/16/41 | | 86,170 | | 93,502 |
Series 2011-79, 6/20/40 (e) | | 28,571 | | 22,716 |
planned amortization class: | | | | |
Series 1993-13 Class PD, 6% 5/20/29 | | 8,733 | | 9,814 |
Series 1994-4 Class KQ, 7.9875% 7/16/24 | | 560 | | 648 |
Series 2000-26 Class PK, 7.5% 9/20/30 | | 1,596 | | 1,893 |
Series 2002-50 Class PE, 6% 7/20/32 | | 10,955 | | 12,310 |
Series 2003-54 Class UE, 5% 6/20/33 | | 31,040 | | 34,144 |
Series 2003-70 Class LE, 5% 7/20/32 | | 44,000 | | 47,245 |
Series 2004-19: | | | | |
Class DJ, 4.5% 3/20/34 | | 339 | | 344 |
Class DP, 5.5% 3/20/34 | | 3,895 | | 4,232 |
Series 2004-64 Class KE, 5.5% 12/20/33 | | 22,013 | | 23,741 |
Series 2005-17 Class IA, 5.5% 8/20/33 (d) | | 1,513 | | 68 |
Series 2005-24 Class TC, 5.5% 3/20/35 | | 5,403 | | 6,030 |
Series 2005-54 Class BM, 5% 7/20/35 | | 9,658 | | 10,429 |
Series 2005-57 Class PB, 5.5% 7/20/35 | | 5,673 | | 6,441 |
Series 2006-50 Class JC, 5% 6/20/36 | | 11,780 | | 13,047 |
Series 2008-28 Class PC, 5.5% 4/20/34 | | 18,652 | | 21,585 |
sequential payer: | | | | |
Series 1995-4 Class CQ, 8% 6/20/25 | | 437 | | 506 |
Series 1998-23 Class ZB, 6.5% 6/20/28 | | 6,415 | | 7,314 |
Series 2001-40 Class Z, 6% 8/20/31 | | 4,084 | | 4,590 |
Series 2001-49 Class Z, 7% 10/16/31 | | 1,837 | | 2,132 |
Series 2002-18 Class ZB, 6% 3/20/32 | | 4,066 | | 4,545 |
Series 2002-29: | | | | |
Class SK, 8.25% 5/20/32 (c)(f) | | 196 | | 220 |
Class Z, 6.5% 5/16/32 | | 5,722 | | 6,548 |
Collateralized Mortgage Obligations - continued |
| Principal Amount (000s) | | Value (000s) |
U.S. Government Agency - continued |
Ginnie Mae guaranteed REMIC pass-thru certificates: - continued | | | | |
sequential payer: | | | | |
Series 2002-33 Class ZJ, 6.5% 5/20/32 | | $ 3,406 | | $ 3,934 |
Series 2002-42 Class ZA, 6% 6/20/32 | | 2,633 | | 2,937 |
Series 2002-43 Class Z, 6.5% 6/20/32 | | 6,330 | | 7,249 |
Series 2002-45 Class Z, 6% 6/20/32 | | 1,499 | | 1,684 |
Series 2002-49 Class ZA, 6.5% 7/20/32 | | 21,882 | | 25,244 |
Series 2003-75 Class ZA, 5.5% 9/20/33 | | 10,308 | | 11,328 |
Series 2004-46 Class BZ, 6% 6/20/34 | | 12,278 | | 13,811 |
Series 2004-65 Class VE, 5.5% 7/20/15 | | 2,581 | | 2,802 |
Series 2004-86 Class G, 6% 10/20/34 | | 6,273 | | 7,193 |
Series 2005-28 Class AJ, 5.5% 4/20/35 | | 24,868 | | 27,883 |
Series 2005-47 Class ZY, 6% 6/20/35 | | 5,757 | | 6,878 |
Series 2005-6 Class EX, 5.5% 11/20/34 | | 1,001 | | 1,192 |
Series 2005-82 Class JV, 5% 6/20/35 | | 3,500 | | 3,810 |
Series 2011-29 Class BV, 5% 5/20/40 | | 10,483 | | 11,499 |
Series 1995-6 Class Z, 7% 9/20/25 | | 1,262 | | 1,475 |
Series 2003-92 Class SN, 6.2435% 10/16/33 (c)(d)(f) | | 14,790 | | 2,157 |
Series 2004-32 Class GS, 6.3135% 5/16/34 (c)(d)(f) | | 1,516 | | 262 |
Series 2004-79 Class FA, 0.4863% 1/20/31 (c) | | 3,016 | | 3,017 |
Series 2005-6 Class EY, 5.5% 11/20/33 | | 1,016 | | 1,193 |
Series 2006-13 Class DS, 10.8206% 3/20/36 (c)(f) | | 26,990 | | 31,542 |
Series 2007-35 Class SC, 39.081% 6/16/37 (c)(f) | | 7,906 | | 14,431 |
Series 2008-88 Class BZ, 5.5% 5/20/33 | | 51,789 | | 58,882 |
Series 2009-13 Class E, 4.5% 3/16/39 | | 18,621 | | 19,871 |
Series 2009-42 Class AY, 5% 6/16/37 | | 12,841 | | 14,037 |
Series 2010-42 Class OP, 4/20/40 (e) | | 37,764 | | 30,684 |
Series 2010-H010 Class FA, 0.5163% 5/20/60 (c)(g) | | 15,597 | | 15,359 |
TOTAL COLLATERALIZED MORTGAGE OBLIGATIONS (Cost $889,611) | 943,903 |
Commercial Mortgage Securities - 0.0% |
|
Fannie Mae subordinate REMIC pass-thru certificates: | | | | |
Series 1998-M3 Class IB, 0.9784% 1/17/38 (c)(d) | | 4,722 | | 80 |
Series 1998-M4 Class N, 1.0407% 2/25/35 (c)(d) | | 19 | | 0* |
Ginnie Mae guaranteed Multi-family REMIC pass-thru securities: | | | | |
sequential payer Series 2001-58 Class X, 0.5694% 9/16/41 (c)(d) | | 38,649 | | 537 |
Commercial Mortgage Securities - continued |
| Principal Amount (000s) | | Value (000s) |
Ginnie Mae guaranteed Multi-family REMIC pass-thru securities: - continued | | | | |
Series 2001-12 Class X, 0.643% 7/16/40 (c)(d) | | $ 15,259 | | $ 237 |
Ginnie Mae guaranteed REMIC pass-thru certificates: | | | | |
sequential payer Series 2002-81 Class IO, 0.9857% 9/16/42 (c)(d) | | 49,586 | | 883 |
Series 2002-62 Class IO, 1.2178% 8/16/42 (c)(d) | | 47,072 | | 1,393 |
Series 2002-85 Class X, 1.4216% 3/16/42 (c)(d) | | 21,903 | | 1,118 |
TOTAL COMMERCIAL MORTGAGE SECURITIES (Cost $17,027) | 4,248 |
Cash Equivalents - 4.4% |
| Maturity Amount (000s) | | |
Investments in repurchase agreements in a joint trading account at 0.17%, dated 7/29/11 due 8/1/11 (Collateralized by U.S. Government Obligations) #
(Cost $354,286) | $ 354,291 | | 354,286 |
TOTAL INVESTMENT PORTFOLIO - 113.0% (Cost $8,750,334) | | 9,069,466 |
NET OTHER ASSETS (LIABILITIES) - (13.0)% | | (1,044,345) |
NET ASSETS - 100% | $ 8,025,121 |
Swap Agreements |
| Expiration Date | | Notional Amount (000s) | | |
Interest Rate Swaps |
Receive quarterly a floating rate based on 3-month LIBOR and pay semi-annually a fixed rate equal to 1.4% with JPMorgan Chase, Inc. | Oct. 2015 | | $ 85,000 | | $ (683) |
Legend |
(a) Security or a portion of the security purchased on a delayed delivery or when-issued basis. |
(b) A portion of the security is subject to a forward commitment to sell. |
(c) Coupon rates for floating and adjustable rate securities reflect the rates in effect at period end. |
(d) Security represents right to receive monthly interest payments on an underlying pool of mortgages or assets. Principal shown is the outstanding par amount of the pool held as of the end of the period. |
(e) Principal Only Strips represent the right to receive the monthly principal payments on an underlying pool of mortgage loans. |
* Amount represents less than $1,000 |
(f) Coupon is inversely indexed to a floating interest rate multiplied by a specified factor. The price may be considerably more volatile than the price of a comparable fixed rate security. |
(g) Represents an investment in an underlying pool of reverse mortgages which typically do not require regular principal and interest payments as repayment is deferred until a maturity event. |
# Additional information on each counterparty to the repurchase agreement is as follows: |
Repurchase Agreement / Counterparty | Value
(Amounts in thousands) |
$354,286,000 due 8/01/11 at 0.17% |
Bank of America NA | $ 256,309 |
J.P. Morgan Securities, Inc. | 9,581 |
Mizuho Securities USA, Inc. | 88,396 |
| $ 354,286 |
Other Information |
The following is a summary of the inputs used, as of July 31, 2011, involving the Fund's assets and liabilities carried at fair value. The inputs or methodology used for valuing securities may not be an indication of the risk associated with investing in those securities. For more information on valuation inputs, and their aggregation into the levels used in the tables below, please refer to the Security Valuation section in the accompanying Notes to Financial Statements. |
Valuation Inputs at Reporting Date: |
Description
(Amounts in thousands) | Total | Level 1 | Level 2 | Level 3 |
Investments in Securities: | | | | |
U.S. Government and Government Agency Obligations | $ 92,924 | $ - | $ 92,924 | $ - |
U.S. Government Agency - Mortgage Securities | 7,674,105 | - | 7,674,105 | - |
Collateralized Mortgage Obligations | 943,903 | - | 931,915 | 11,988 |
Commercial Mortgage Securities | 4,248 | - | 4,248 | - |
Cash Equivalents | 354,286 | - | 354,286 | - |
Total Investments in Securities: | $ 9,069,466 | $ - | $ 9,057,478 | $ 11,988 |
Derivative Instruments: | | | | |
Liabilities | | | | |
Swap Agreements | $ (683) | $ - | $ (683) | $ - |
Other Financial Instruments
Forward Commitments | $ (2,166) | $ - | $ (2,166) | $ - |
The following is a reconciliation of Investments in Securities for which Level 3 inputs were used in determining value: |
(Amounts in thousands) | |
Investments in Securities: | |
Beginning Balance | $ - |
Total Realized Gain (Loss) | - |
Total Unrealized Gain (Loss) | - |
Cost of Purchases | 12,006 |
Proceeds of Sales | (18) |
Amortization/Accretion | - |
Transfers in to Level 3 | - |
Transfers out of Level 3 | - |
Ending Balance | $ 11,988 |
The change in unrealized gain (loss) for the period attributable to Level 3 securities held at July 31, 2011 | $ - |
The information used in the above reconciliation represents fiscal year to date activity for any Investments in Securities identified as using Level 3 inputs at either the beginning or the end of the current fiscal period. Transfers in or out of Level 3 represent the beginning value of any Security or Instrument where a change in the pricing level occurred from the beginning to the end of the period. The cost of purchases and the proceeds of sales may include securities received or delivered through corporate actions or exchanges. Realized and unrealized gains (losses) disclosed in the reconciliation are included in Net Gain (Loss) on the Fund's Statement of Operations. |
Value of Derivative Instruments |
The following table is a summary of the Fund's value of derivative instruments by risk exposure as of July 31, 2011. For additional information on derivative instruments, please refer to the Derivative Instruments section in the accompanying Notes to Financial Statements. |
Risk Exposure /
Derivative Type
(Amounts in thousands) | Value |
| Asset | Liability |
Interest Rate Risk | | |
Swap Agreements (a) | $ - | $ (683) |
Total Value of Derivatives | $ - | $ (683) |
(a) Value is disclosed on the Statement of Assets and Liabilities in the Swap Agreements, at value line-items. |
See accompanying notes which are an integral part of the financial statements.
Annual Report
Statement of Assets and Liabilities
Amounts in thousands (except per-share amount) | July 31, 2011 |
| | |
Assets | | |
Investment in securities, at value (including repurchase agreements of $354,286) - See accompanying schedule: Unaffiliated issuers (cost $8,750,334) | | $ 9,069,466 |
Commitment to sell securities on a delayed delivery basis | $ (250,318) | |
Receivable for securities sold on a delayed delivery basis | 248,152 | (2,166) |
Receivable for investments sold, regular delivery | | 54,750 |
Receivable for fund shares sold | | 6,573 |
Interest receivable | | 30,131 |
Other receivables | | 1,308 |
Total assets | | 9,160,062 |
| | |
Liabilities | | |
Payable to custodian bank | $ 610 | |
Payable for investments purchased
Regular delivery | 4,562 | |
Delayed delivery | 1,105,668 | |
Payable for fund shares redeemed | 16,937 | |
Distributions payable | 2,168 | |
Swap agreements, at value | 683 | |
Accrued management fee | 2,103 | |
Other affiliated payables | 904 | |
Other payables and accrued expenses | 1,306 | |
Total liabilities | | 1,134,941 |
| | |
Net Assets | | $ 8,025,121 |
Net Assets consist of: | | |
Paid in capital | | $ 7,683,416 |
Distributions in excess of net investment income | | (25,504) |
Accumulated undistributed net realized gain (loss) on investments | | 50,926 |
Net unrealized appreciation (depreciation) on investments | | 316,283 |
Net Assets, for 681,346 shares outstanding | | $ 8,025,121 |
Net Asset Value, offering price and redemption price per share ($8,025,121 ÷ 681,346 shares) | | $ 11.78 |
See accompanying notes which are an integral part of the financial statements.
Annual Report
Statement of Operations
Amounts in thousands | Year ended July 31, 2011 |
| | |
Investment Income | | |
Interest | | $ 292,266 |
| | |
Expenses | | |
Management fee | $ 24,981 | |
Transfer agent fees | 7,920 | |
Fund wide operations fee | 2,710 | |
Independent trustees' compensation | 30 | |
Miscellaneous | 27 | |
Total expenses | | 35,668 |
Net investment income (loss) | | 256,598 |
Realized and Unrealized Gain (Loss) Net realized gain (loss) on: | | |
Investment securities: | | |
Unaffiliated issuers | 114,966 | |
Swap agreements | (3,531) | |
Total net realized gain (loss) | | 111,435 |
Change in net unrealized appreciation (depreciation) on: Investment securities | 7,022 | |
Swap agreements | 3,454 | |
Delayed delivery commitments | 1,142 | |
Total change in net unrealized appreciation (depreciation) | | 11,618 |
Net gain (loss) | | 123,053 |
Net increase (decrease) in net assets resulting from operations | | $ 379,651 |
See accompanying notes which are an integral part of the financial statements.
Annual Report
Financial Statements - continued
Statement of Changes in Net Assets
Amounts in thousands | Year ended
July 31,
2011 | Year ended
July 31,
2010 |
Increase (Decrease) in Net Assets | | |
Operations | | |
Net investment income (loss) | $ 256,598 | $ 215,262 |
Net realized gain (loss) | 111,435 | 269,951 |
Change in net unrealized appreciation (depreciation) | 11,618 | 145,830 |
Net increase (decrease) in net assets resulting
from operations | 379,651 | 631,043 |
Distributions to shareholders from net investment income | (257,737) | (217,763) |
Distributions to shareholders from net realized gain | (226,739) | (74,582) |
Total distributions | (484,476) | (292,345) |
Share transactions
Proceeds from sales of shares | 2,671,179 | 3,765,037 |
Reinvestment of distributions | 436,673 | 260,696 |
Cost of shares redeemed | (3,230,097) | (2,693,893) |
Net increase (decrease) in net assets resulting from share transactions | (122,245) | 1,331,840 |
Total increase (decrease) in net assets | (227,070) | 1,670,538 |
| | |
Net Assets | | |
Beginning of period | 8,252,191 | 6,581,653 |
End of period (including distributions in excess of net investment income of $25,504 and distributions in excess of net investment income of $22,383, respectively) | $ 8,025,121 | $ 8,252,191 |
Other Information Shares | | |
Sold | 229,864 | 325,929 |
Issued in reinvestment of distributions | 37,578 | 22,566 |
Redeemed | (279,076) | (234,206) |
Net increase (decrease) | (11,634) | 114,289 |
See accompanying notes which are an integral part of the financial statements.
Annual Report
Financial Highlights
Years ended July 31, | 2011 | 2010 | 2009 | 2008 | 2007 |
Selected Per-Share Data | | | | | |
Net asset value, beginning of period | $ 11.91 | $ 11.37 | $ 10.86 | $ 10.64 | $ 10.62 |
Income from Investment Operations | | | | | |
Net investment income (loss) B | .376 | .337 | .497 | .534 | .537 |
Net realized and unrealized gain (loss) | .196 | .660 | .533 | .230 | .017 |
Total from investment operations | .572 | .997 | 1.030 | .764 | .554 |
Distributions from net investment income | (.378) | (.342) | (.520) | (.544) | (.534) |
Distributions from net realized gain | (.324) | (.115) | - | - | - |
Total distributions | (.702) | (.457) | (.520) | (.544) | (.534) |
Net asset value, end of period | $ 11.78 | $ 11.91 | $ 11.37 | $ 10.86 | $ 10.64 |
Total Return A | 5.04% | 8.97% | 9.69% | 7.27% | 5.29% |
Ratios to Average Net Assets C | | | | | |
Expenses before reductions | .45% | .45% | .45% | .45% | .45% |
Expenses net of fee waivers, if any | .45% | .45% | .45% | .45% | .45% |
Expenses net of all reductions | .45% | .45% | .45% | .45% | .45% |
Net investment income (loss) | 3.24% | 2.92% | 4.47% | 4.90% | 5.01% |
Supplemental Data | | | | | |
Net assets, end of period (in millions) | $ 8,025 | $ 8,252 | $ 6,582 | $ 3,480 | $ 3,172 |
Portfolio turnover rate | 367% | 540% | 464% | 227% | 165% |
A Total returns would have been lower if certain expenses had not been reduced during the applicable periods shown.
B Calculated based on average shares outstanding during the period.
C Expense ratios reflect operating expenses of the Fund. Expenses before reductions do not reflect amounts reimbursed by the investment adviser or reductions from expense offset arrangements and do not represent the amount paid by the Fund during periods when reimbursements or reductions occur. Expenses net of fee waivers reflect expenses after reimbursement by the investment adviser but prior to reductions from expense offset arrangements. Expenses net of all reductions represent the net expenses paid by the Fund.
See accompanying notes which are an integral part of the financial statements.
Annual Report
Notes to Financial Statements
For the period ended July 31, 2011
(Amounts in thousands except ratios)
1. Organization.
Fidelity GNMA Fund (the Fund) is a fund of Fidelity Income Fund (the Trust) and is authorized to issue an unlimited number of shares. The Trust is registered under the Investment Company Act of 1940, as amended (the 1940 Act), as an open-end management investment company organized as a Massachusetts business trust.
2. Significant Accounting Policies.
The financial statements have been prepared in conformity with accounting principles generally accepted in the United States of America (GAAP), which require management to make certain estimates and assumptions at the date of the financial statements. Actual results could differ from those estimates. Subsequent events, if any, through the date that the financial statements were issued have been evaluated in the preparation of the financial statements. The following summarizes the significant accounting policies of the Fund:
Security Valuation. Investments are valued as of 4:00 p.m. Eastern time on the last calendar day of the period. The Fund uses independent pricing services approved by the Board of Trustees to value its investments. When current market prices or quotations are not readily available or reliable, valuations may be determined in good faith in accordance with procedures adopted by the Board of Trustees. Factors used in determining value may include market or security specific events, changes in interest rates and credit quality. The frequency with which these procedures are used cannot be predicted and they may be utilized to a significant extent. The value used for net asset value (NAV) calculation under these procedures may differ from published prices for the same securities.
The Fund categorizes the inputs to valuation techniques used to value its investments into a disclosure hierarchy consisting of three levels as shown below:
Level 1 - quoted prices in active markets for identical investments
Level 2 - other significant observable inputs (including quoted prices for similar investments, interest rates, prepayment speeds, etc.)
Level 3 - unobservable inputs (including the Fund's own assumptions based on the best information available)
Changes in valuation techniques may result in transfers in or out of an assigned level within the disclosure hierarchy. The aggregate value of investments by input level, as of July 31, 2011 for the Fund's investments as well as a roll forward of Level 3 securities, is included at the end of the Fund's Schedule of Investments. Valuation techniques used to value the Fund's investments by major category are as follows:
Annual Report
2. Significant Accounting Policies - continued
Security Valuation - continued
Debt securities, including restricted securities, are valued based on evaluated prices received from independent pricing services or from dealers who make markets in such securities. For U.S. government and government agency obligations, pricing services utilize matrix pricing which considers yield or price of bonds of comparable quality, coupon, maturity and type as well as dealer supplied prices and are generally categorized as Level 2 in the hierarchy. For collateralized mortgage obligations, commercial mortgage securities and U.S. government agency mortgage securities, pricing services utilize matrix pricing which considers prepayment speed assumptions, attributes of the collateral, yield or price of bonds of comparable quality, coupon, maturity and type as well as dealer supplied prices and, accordingly, such securities are generally categorized as Level 2 in the hierarchy. Swaps are marked-to-market daily based on valuations from independent pricing services or dealer-supplied valuations and changes in value are recorded as unrealized appreciation (depreciation). Pricing services utilize matrix pricing which considers comparisons to interest rate curves, credit spread curves, default possibilities and recovery rates and, as a result, swaps are generally categorized as Level 2 in the hierarchy. When independent prices are unavailable or unreliable, debt securities and swaps may be valued utilizing pricing matrices which consider similar factors that would be used by independent pricing services. These are generally categorized as Level 2 in the hierarchy but may be Level 3 depending on the circumstances.
Short-term securities with remaining maturities of sixty days or less may be valued at amortized cost, which approximates fair value, and are categorized as Level 2 in the hierarchy.
Investment Transactions and Income. For financial reporting purposes, the Fund's investment holdings and NAV include trades executed through the end of the last business day of the period. The NAV per share for processing shareholder transactions is calculated as of the close of business of the New York Stock Exchange (NYSE), normally 4:00 p.m. Eastern time and includes trades executed through the end of the prior business day. Gains and losses on securities sold are determined on the basis of identified cost. Interest income is accrued as earned. Interest income includes coupon interest and amortization of premium and accretion of discount on debt securities.
Expenses. Expenses directly attributable to a fund are charged to that fund. Expenses attributable to more than one fund are allocated among the respective funds on the basis of relative net assets or other appropriate methods. Expense estimates are accrued in the period to which they relate and adjustments are made when actual amounts are known.
Deferred Trustee Compensation. Under a Deferred Compensation Plan (the Plan), independent Trustees may elect to defer receipt of a portion of their annual
Annual Report
Notes to Financial Statements - continued
(Amounts in thousands except ratios)
2. Significant Accounting Policies - continued
Deferred Trustee Compensation - continued
compensation. Deferred amounts are invested in a cross-section of Fidelity funds, are marked-to-market and remain in the Fund until distributed in accordance with the Plan. The investment of deferred amounts and the offsetting payable to the Trustees are included in the accompanying Statement of Assets and Liabilities.
Income Tax Information and Distributions to Shareholders. Each year, the Fund intends to qualify as a regulated investment company, including distributing substantially all of its taxable income and realized gains under Subchapter M of the Internal Revenue Code and filing its U.S. federal tax return. As a result, no provision for income taxes is required. As of July 31, 2011, the Fund did not have any unrecognized tax benefits in the financial statements. A fund's federal tax return is subject to examination by the Internal Revenue Service (IRS) for a period of three years.
Dividends are declared and recorded daily and paid monthly from net investment income. Distributions from realized gains, if any, are declared and recorded on the ex-dividend date. Income and capital gain distributions are determined in accordance with income tax regulations, which may differ from GAAP. In addition, the Fund claimed a portion of the payment made to redeeming shareholders as a distribution for income tax purposes.
Capital accounts within the financial statements are adjusted for permanent book-tax differences. These adjustments have no impact on net assets or the results of operations. Temporary book-tax differences will reverse in a subsequent period.
Book-tax differences are primarily due to swap agreements, market discount, deferred trustees compensation, financing transactions, and losses deferred due to wash sales.
The federal tax cost of investment securities and unrealized appreciation (depreciation) as of period end were as follows:
Gross unrealized appreciation | $ 321,150 |
Gross unrealized depreciation | (18,407) |
Net unrealized appreciation (depreciation) on securities and other investments | $ 302,743 |
| |
Tax Cost | $ 8,766,723 |
The tax-based components of distributable earnings as of period end were as follows:
Undistributed ordinary income | $ 182 |
Undistributed long-term capital gain | $ 41,341 |
Net unrealized appreciation (depreciation) | $ 300,236 |
Annual Report
2. Significant Accounting Policies - continued
Income Tax Information and Distributions to Shareholders - continued
Under the recently enacted Regulated Investment Company Modernization Act of 2010 (the Act), the Fund will be permitted to carry forward capital losses incurred in taxable years beginning after December 22, 2010 for an unlimited period. However, any losses incurred during those future taxable years will be required to be utilized prior to any losses incurred in pre-enactment taxable years, which generally expire after eight years from when they are incurred. Additionally, post-enactment capital losses that are carried forward will retain their character as either short-term or long-term capital losses rather than being considered all short-term as under previous law. The Fund's first fiscal year end subject to the Act will be July 31, 2012.
The tax character of distributions paid was as follows:
| July 31, 2011 | July 31, 2010 |
Ordinary Income | $ 464,849 | $ 272,889 |
Long-term Capital Gains | 19,627 | 19,456 |
Total | $ 484,476 | $ 292,345 |
New Accounting Pronouncements. In May 2011, the Financial Accounting Standards Board (FASB) issued an update to Topic 860 - Transfers and Servicing. The update clarifies the assessment of effective control by removing the collateral provision requirement that the seller maintains at all times collateral sufficient to fund substantially all of the cost of purchasing replacement financial assets from others. This may result in a change in accounting treatment from purchases and sales to secured borrowings for certain mortgage dollar roll transactions, and therefore separate accounting of the income and expenses associated with the secured borrowings. This change would have no effect on the net assets or total return of the Fund. The update is effective for transactions entered into on or after December 15, 2011. Management is currently evaluating the potential impact of the update on the accounting for mortgage dollar roll transactions entered into by the Fund. Also in May 2011, the FASB issued Accounting Standard Update No. 2011-04, Fair Value Measurement (Topic 820) - Amendments to Achieve Common Fair Value Measurement and Disclosure Requirements in U.S. GAAP and IFRSs. The update changes the wording used to describe the requirements in GAAP for measuring fair value and for disclosing information about fair value measurements. The update is effective during interim and annual periods beginning after December 15, 2011. Management is currently evaluating the impact of the update's adoption on the Fund's financial statement disclosures.
Annual Report
Notes to Financial Statements - continued
(Amounts in thousands except ratios)
3. Operating Policies.
Repurchase Agreements. Fidelity Management & Research Company (FMR) has received an Exemptive Order from the Securities and Exchange Commission (the SEC) which permits the Fund and other affiliated entities of FMR to transfer uninvested cash balances into joint trading accounts which are then invested in repurchase agreements. The Fund may also invest directly with institutions in repurchase agreements. Repurchase agreements are collateralized by government or non-government securities. Upon settlement date, collateral is held in segregated accounts with custodian banks and may be obtained in the event of a default of the counterparty. The Fund monitors, on a daily basis, the value of the collateral to ensure it is at least equal to the principal amount of the repurchase agreement (including accrued interest). In the event of a default by the counterparty, realization of the collateral proceeds could be delayed, during which time the value of the collateral may decline.
Delayed Delivery Transactions and When-Issued Securities. The Fund may purchase or sell securities on a delayed delivery or when-issued basis. Payment and delivery may take place after the customary settlement period for that security. The price of the underlying securities and the date when the securities will be delivered and paid for are fixed at the time the transaction is negotiated. During the time a delayed delivery sell is outstanding, the contract is marked-to-market daily and equivalent deliverable securities are held for the transaction. The securities purchased on a delayed delivery or when-issued basis are identified as such in the Fund's Schedule of Investments. The Fund may receive compensation for interest forgone in the purchase of a delayed delivery or when-issued security. With respect to purchase commitments, the Fund identifies securities as segregated in its records with a value at least equal to the amount of the commitment. Losses may arise due to changes in the value of the underlying securities or if the counterparty does not perform under the contract's terms, or if the issuer does not issue the securities due to political, economic, or other factors.
4. Derivative Instruments.
Risk Exposures and the Use of Derivative Instruments. The Fund used derivative instruments (derivatives), including swap agreements, in order to meet its investment objectives. The strategy is to use derivatives to increase returns, to gain exposure to certain types of assets and to manage exposure to certain risks as defined below. The success of any strategy involving derivatives depends on analysis of numerous economic factors, and if the strategies for investment do not work as intended, the Fund may not achieve its objectives.
The Fund's use of derivatives increased or decreased its exposure to the following risk:
Interest Rate Risk | Interest rate risk relates to the fluctuations in the value of interest-bearing securities due to changes in the prevailing levels of market interest rates. |
Annual Report
4. Derivative Instruments - continued
Risk Exposures and the Use of Derivative Instruments - continued
The Fund is also exposed to additional risks from investing in derivatives, such as liquidity risk and counterparty credit risk. Liquidity risk is the risk that the Fund will be unable to sell the derivative in the open market in a timely manner. Counterparty credit risk is the risk that the counterparty will not be able to fulfill its obligation to the Fund. Derivative counterparty credit risk is managed through formal evaluation of the creditworthiness of all potential counterparties. On certain over-the-counter derivatives, the Fund attempts to reduce its exposure to counterparty credit risk by entering into an International Swaps and Derivatives Association (ISDA) Master Agreement on a bilateral basis with each of its counterparties. The ISDA Master Agreement gives the Fund the right to terminate all transactions traded under such agreement if there is a certain deterioration in the credit quality of the counterparty. The ISDA Master Agreement gives each party the right, upon an event of default by the other party or a termination of the agreement, to close out all transactions traded under such agreement and to net amounts owed under each transaction to one net payable by one party to the other. Collateral in the form of cash or securities, if required, is held in segregated accounts with the Fund's custodian bank in accordance with the collateral agreements entered into between the Fund, the swap counterparty and the Fund's custodian bank, and is identified in the Schedule of Investments. The Fund could experience delays and costs in gaining access to the collateral even though it is held by the Fund's custodian bank. The Fund's maximum risk of loss from counterparty credit risk is generally the aggregate unrealized appreciation and unpaid counterparty payments in excess of any collateral pledged by the counterparty to the Fund. Derivatives involve, to varying degrees, risk of loss in excess of the amounts recognized in the Statement of Assets and Liabilities.
Net Realized Gain (Loss) and Change in Net Unrealized Appreciation (Depreciation) on Derivatives. The table below, which reflects the impacts of derivatives on the financial performance of the Fund, summarizes the net realized gain (loss) and change in net unrealized appreciation (depreciation) for derivatives during the period.
Risk Exposure / Derivative Type | Net Realized
Gain (Loss) | Change in Net Unrealized Appreciation (Depreciation) |
Interest Rate Risk | | |
Swap Agreements (a) | $ (3,531) | $ 3,454 |
(a) A summary of the value of derivatives by risk exposure as of period end, is included at the end of the Schedule of Investments and is representative of activity for the period.
Swap Agreements. A swap agreement (swap) is a contract between two parties to exchange future cash flows at periodic intervals based on a notional principal amount.
Annual Report
Notes to Financial Statements - continued
(Amounts in thousands except ratios)
4. Derivative Instruments - continued
Swap Agreements - continued
Details of swaps open at period end, are included in the Schedule of Investments under the caption "Swap Agreements." Swaps are marked-to-market daily and changes in value are recorded as unrealized appreciation or (depreciation) and reflected in the Statement of Assets and Liabilities. Any upfront premiums paid or received upon entering a swap to compensate for differences between stated terms of the agreement and prevailing market conditions (e.g. credit spreads, interest rates or other factors) are recorded as realized gain or (loss) ratably over the term of the swap. Payments are exchanged at specified intervals, accrued daily commencing with the effective date of the contract and recorded as realized gain or (loss). Realized gain or (loss) is also recorded in the event of an early termination of a swap. The net realized gain (loss) and change in net unrealized appreciation (depreciation) on swaps during the period is included in the Statement of Operations.
Risks of loss include interest rate risk. In addition, there is the risk of failure by the counterparty to perform under the terms of the agreement and lack of liquidity in the market.
Interest Rate Swaps. Interest rate swaps are agreements between counterparties to exchange cash flows, one based on a fixed rate, and the other on a floating rate. The Fund entered into interest rate swaps to manage its exposure to interest rate changes. Changes in interest rates can have an effect on both the value of bond holdings as well as the amount of interest income earned. In general, the value of bonds can fall when interest rates rise and can rise when interest rates fall.
5. Fees and Other Transactions with Affiliates.
Management Fee. FMR and its affiliates provide the Fund with investment management related services for which the Fund pays a monthly management fee. The management fee is the sum of an individual fund fee rate that is based on an annual rate of .20% of the Fund's average net assets and a group fee rate that averaged .12% during the period. The group fee rate is based upon the average net assets of all the mutual funds advised by FMR. The group fee rate decreases as assets under management increase and increases as assets under management decrease. For the period, the total annual management fee rate was .32% of the Fund's average net assets.
Transfer Agent Fees. Fidelity Investments Institutional Operations Company, Inc. (FIIOC), an affiliate of FMR, is the Fund's transfer, dividend disbursing and shareholder servicing agent. FIIOC receives an asset-based fee of .10% of the Fund's average net assets. FIIOC pays for typesetting, printing and mailing of shareholder reports, except proxy statements.
Annual Report
5. Fees and Other Transactions with Affiliates - continued
Fund Wide Operations Fee. Pursuant to the Fund Wide Operations and Expense Agreement (FWOE), FMR has agreed to provide for fund level expenses (which do not include transfer agent, compensation of the independent Trustees, interest (including commitment fees), taxes or extraordinary expenses, if any) in return for a FWOE fee equal to .35% less the total amount of the management fee. The FWOE paid by the Fund is reduced by an amount equal to the fees and expenses paid to the independent Trustees. For the period, the FWOE fee was equivalent to an annual rate of .03% of average net assets.
6. Committed Line of Credit.
The Fund participates with other funds managed by FMR or an affiliate in a $4.0 billion credit facility (the "line of credit") to be utilized for temporary or emergency purposes to fund shareholder redemptions or for other short-term liquidity purposes. The Fund has agreed to pay commitment fees on its pro-rata portion of the line of credit, which amounted to $27 and is reflected in Miscellaneous expenses on the Statement of Operations. During the period, there were no borrowings on this line of credit.
7. Expense Reductions.
Through arrangements with the Fund's custodian, credits realized as a result of uninvested cash balances were used to reduce the Fund's management fee. During the period, these credits reduced the Fund's management fee by four hundred twenty-eight dollars.
8. Other.
The Fund's organizational documents provide former and current trustees and officers with a limited indemnification against liabilities arising in connection with the performance of their duties to the Fund. In the normal course of business, the Fund may also enter into contracts that provide general indemnifications. The Fund's maximum exposure under these arrangements is unknown as this would be dependent on future claims that may be made against the Fund. The risk of material loss from such claims is considered remote.
Annual Report
To the Trustees of Fidelity Income Fund and the Shareholders of Fidelity GNMA Fund:
In our opinion, the accompanying statement of assets and liabilities, including the schedule of investments, and the related statements of operations and of changes in net assets and the financial highlights present fairly, in all material respects, the financial position of Fidelity GNMA Fund (a fund of Fidelity Income Fund) at July 31, 2011, the results of its operations for the year then ended, the changes in its net assets for each of the two years in the period then ended and the financial highlights for each of the five years in the period then ended, in conformity with accounting principles generally accepted in the United States of America. These financial statements and financial highlights (hereafter referred to as "financial statements") are the responsibility of the Fidelity GNMA Fund's management. Our responsibility is to express an opinion on these financial statements based on our audits. We conducted our audits of these financial statements in accordance with the standards of the Public Company Accounting Oversight Board (United States). Those standards require that we plan and perform the audit to obtain reasonable assurance about whether the financial statements are free of material misstatement. An audit includes examining, on a test basis, evidence supporting the amounts and disclosures in the financial statements, assessing the accounting principles used and significant estimates made by management, and evaluating the overall financial statement presentation. We believe that our audits, which included confirmation of securities at July 31, 2011 by correspondence with the custodian and brokers, provide a reasonable basis for our opinion.
/s/ PricewaterhouseCoopers LLP
PricewaterhouseCoopers LLP
Boston, Massachusetts
September 15, 2011
Annual Report
The Trustees and executive officers of the trust and fund, as applicable, are listed below. The Board of Trustees governs the fund and is responsible for protecting the interests of shareholders. The Trustees are experienced executives who meet periodically throughout the year to oversee the fund's activities, review contractual arrangements with companies that provide services to the fund, oversee management of the risks associated with such activities and contractual arrangements, and review the fund's performance. Except for James C. Curvey, each of the Trustees oversees 198 funds advised by FMR or an affiliate. Mr. Curvey oversees 419 funds advised by FMR or an affiliate.
The Trustees hold office without limit in time except that (a) any Trustee may resign; (b) any Trustee may be removed by written instrument, signed by at least two-thirds of the number of Trustees prior to such removal; (c) any Trustee who requests to be retired or who has become incapacitated by illness or injury may be retired by written instrument signed by a majority of the other Trustees; and (d) any Trustee may be removed at any special meeting of shareholders by a two-thirds vote of the outstanding voting securities of the trust. Each Trustee who is not an interested person (as defined in the 1940 Act) (Independent Trustee), shall retire not later than the last day of the calendar year in which his or her 75th birthday occurs. The Independent Trustees may waive this mandatory retirement age policy with respect to individual Trustees. The executive officers hold office without limit in time, except that any officer may resign or may be removed by a vote of a majority of the Trustees at any regular meeting or any special meeting of the Trustees. Except as indicated, each individual has held the office shown or other offices in the same company for the past five years.
Experience, Skills, Attributes, and Qualifications of the Fund's Trustees. The Governance and Nominating Committee has adopted a statement of policy that describes the experience, qualifications, attributes, and skills that are necessary and desirable for potential Independent Trustee candidates (Statement of Policy). The Board believes that each Trustee satisfied at the time he or she was initially elected or appointed a Trustee, and continues to satisfy, the standards contemplated by the Statement of Policy. The Governance and Nominating Committee also engages professional search firms to help identify potential Independent Trustee candidates who have the experience, qualifications, attributes, and skills consistent with the Statement of Policy. From time to time, additional criteria based on the composition and skills of the current Independent Trustees, as well as experience or skills that may be appropriate in light of future changes to board composition, business conditions, and regulatory or other developments, have also been considered by the professional search firms and the Governance and Nominating Committee. In addition, the Board takes into account the Trustees' commitment and participation in Board and committee meetings, as well as their leadership of standing and ad hoc committees throughout their tenure.
In determining that a particular Trustee was and continues to be qualified to serve as a Trustee, the Board has considered a variety of criteria, none of which, in isolation, was controlling. The Board believes that, collectively, the Trustees have balanced and diverse experience, qualifications, attributes, and skills, which allow the Board to operate effectively in governing the fund and protecting the interests of shareholders. Information about the specific experience, skills, attributes, and qualifications of each Trustee, which in each case led to the Board's conclusion that the Trustee should serve (or continue to serve) as a trustee of the fund, is provided below.
Annual Report
Board Structure and Oversight Function. Abigail P. Johnson is an interested person (as defined in the 1940 Act) and currently serves as Chairman. The Trustees have determined that an interested Chairman is appropriate and benefits shareholders because an interested Chairman has a personal and professional stake in the quality and continuity of services provided to the fund. Independent Trustees exercise their informed business judgment to appoint an individual of their choosing to serve as Chairman, regardless of whether the Trustee happens to be independent or a member of management. The Independent Trustees have determined that they can act independently and effectively without having an Independent Trustee serve as Chairman and that a key structural component for assuring that they are in a position to do so is for the Independent Trustees to constitute a substantial majority for the Board. The Independent Trustees also regularly meet in executive session. Kenneth L. Wolfe serves as Chairman of the Independent Trustees and as such (i) acts as a liaison between the Independent Trustees and management with respect to matters important to the Independent Trustees and (ii) with management prepares agendas for Board meetings.
Fidelity funds are overseen by different Boards of Trustees. The fund's Board oversees Fidelity's investment-grade bond, money market, and asset allocation funds and another Board oversees Fidelity's equity and high income funds. The asset allocation funds may invest in Fidelity funds that are overseen by such other Board. The use of separate Boards, each with its own committee structure, allows the Trustees of each group of Fidelity funds to focus on the unique issues of the funds they oversee, including common research, investment, and operational issues. On occasion, the separate Boards establish joint committees to address issues of overlapping consequences for the Fidelity funds overseen by each Board.
The Trustees operate using a system of committees to facilitate the timely and efficient consideration of all matters of importance to the Trustees, the fund, and fund shareholders and to facilitate compliance with legal and regulatory requirements and oversight of the fund's activities and associated risks. The Board, acting through its committees, has charged FMR and its affiliates with (i) identifying events or circumstances the occurrence of which could have demonstrably adverse effects on the fund's business and/or reputation; (ii) implementing processes and controls to lessen the possibility that such events or circumstances occur or to mitigate the effects of such events or circumstances if they do occur; and (iii) creating and maintaining a system designed to evaluate continuously business and market conditions in order to facilitate the identification and implementation processes described in (i) and (ii) above. Because the day-to-day operations and activities of the fund are carried out by or through FMR, its affiliates and other service providers, the fund's exposure to risks is mitigated but not eliminated by the processes overseen by the Trustees. While each of the Board's committees has responsibility for overseeing different aspects of the fund's activities, oversight is exercised primarily through the Operations and Audit Committees. Appropriate personnel, including but not limited to the fund's Chief Compliance Officer (CCO), FMR's internal auditor, the independent accountants, the fund's Treasurer and portfolio management personnel, make periodic reports to the Board's committees, as appropriate. The responsibilities of each committee, including their oversight responsibilities, are described further under "Standing Committees of the Fund's Trustees."
Annual Report
Trustees and Officers - continued
The fund's Statement of Additional Information (SAI) includes more information about the Trustees. To request a free copy, call Fidelity at 1-800-544-8544.
Interested Trustees*:
Correspondence intended for each Trustee who is an interested person may be sent to Fidelity Investments, 82 Devonshire Street, Boston, Massachusetts 02109.
Name, Age; Principal Occupations and Other Relevant Experience+ |
Abigail P. Johnson (49) |
| Year of Election or Appointment: 2009 Ms. Johnson is Trustee and Chairman of the Board of Trustees of certain Trusts. Ms. Johnson serves as President of Personal, Workplace and Institutional Services (2005-present). Ms. Johnson is Chairman and Director of FMR Co., Inc. (2011-present), Chairman and Director of FMR (2011-present), and the Vice Chairman and Director (2007-present) of FMR LLC. Previously, Ms. Johnson served as President and a Director of FMR (2001-2005), a Trustee of other investment companies advised by FMR, Fidelity Investments Money Management, Inc., and FMR Co., Inc. (2001-2005), Senior Vice President of the Fidelity funds (2001-2005), and managed a number of Fidelity funds. Ms. Abigail P. Johnson and Mr. Arthur E. Johnson are not related. |
James C. Curvey (76) |
| Year of Election or Appointment: 2007 Mr. Curvey also serves as Trustee (2007-present) of other investment companies advised by FMR. Mr. Curvey is a Director of Fidelity Investments Money Management, Inc. (2009-present), Director of Fidelity Research & Analysis Co. (2009-present) and Director of FMR and FMR Co., Inc. (2007-present). Mr. Curvey is also Vice Chairman (2007-present) and Director of FMR LLC. In addition, Mr. Curvey serves as an Overseer for the Boston Symphony Orchestra and a member of the Trustees of Villanova University. Previously, Mr. Curvey was the Vice Chairman (2006-2007) and Director (2000-2007) of FMR Corp. |
* Trustees have been determined to be "Interested Trustees" by virtue of, among other things, their affiliation with the trust or various entities under common control with FMR.
Annual Report
+ The information above includes each Trustee's principal occupation during the last five years and other information relating to the experience, attributes, and skills relevant to each Trustee's qualifications to serve as a Trustee, which led to the conclusion that each Trustee should serve as a Trustee for the fund.
Independent Trustees:
Correspondence intended for each Independent Trustee (that is, the Trustees other than the Interested Trustees) may be sent to Fidelity Investments, P.O. Box 55235, Boston, Massachusetts 02205-5235.
Name, Age; Principal Occupations and Other Relevant Experience+ |
Albert R. Gamper, Jr. (69) |
| Year of Election or Appointment: 2006 Mr. Gamper is Vice Chairman of the Independent Trustees of the Fixed Income and Asset Allocation Funds (2011-present). Prior to his retirement in December 2004, Mr. Gamper served as Chairman of the Board of CIT Group Inc. (commercial finance). During his tenure with CIT Group Inc. Mr. Gamper served in numerous senior management positions, including Chairman (1987-1989; 1999-2001; 2002-2004), Chief Executive Officer (1987-2004), and President (2002-2003). He also served as President and Chief Executive Officer of Tyco Capital Corporation (2001-2002). Mr. Gamper currently serves as a member of the Board of Directors of Public Service Enterprise Group (utilities, 2000-present), a member of the Board of Trustees, Rutgers University (2004-present), and Chairman of the Board of Saint Barnabas Health Care System. Previously, Mr. Gamper served as Chairman of the Board of Governors, Rutgers University (2004-2007). |
Robert F. Gartland (59) |
| Year of Election or Appointment: 2010 Mr. Gartland is a partner and investor of Vietnam Partners LLC (investments and consulting, 2008-present) and is Chairman and an investor in Gartland and Mellina Group Corp. (consulting, 2009-present). Prior to his retirement, Mr. Gartland held a variety of positions at Morgan Stanley (financial services, 1979-2007) including Managing Director (1987-2007). |
Arthur E. Johnson (64) |
| Year of Election or Appointment: 2008 Mr. Johnson serves as a member of the Board of Directors of Eaton Corporation (diversified power management, 2009-present) and AGL Resources, Inc. (holding company). Prior to his retirement, Mr. Johnson served as Senior Vice President of Corporate Strategic Development of Lockheed Martin Corporation (defense contractor, 1999-2009). He previously served on the Board of Directors of IKON Office Solutions, Inc. (1999-2008) and Delta Airlines (2005-2007). Mr. Arthur E. Johnson and Ms. Abigail P. Johnson are not related. |
Michael E. Kenneally (57) |
| Year of Election or Appointment: 2009 Previously, Mr. Kenneally served as a Member of the Advisory Board for certain Fidelity Fixed Income and Asset Allocation Funds (2008-2009). Prior to his retirement, Mr. Kenneally served as Chairman and Global Chief Executive Officer of Credit Suisse Asset Management (2003-2005). Mr. Kenneally was a Director of the Credit Suisse Funds (U.S. mutual funds, 2004-2008) and certain other closed-end funds (2004-2005) and was awarded the Chartered Financial Analyst (CFA) designation in 1991. |
James H. Keyes (70) |
| Year of Election or Appointment: 2007 Mr. Keyes serves as a member of the Boards of Navistar International Corporation (manufacture and sale of trucks, buses, and diesel engines, since 2002) and Pitney Bowes, Inc. (integrated mail, messaging, and document management solutions, since 1998). Prior to his retirement, Mr. Keyes served as Chairman and Chief Executive Officer of Johnson Controls (automotive, building, and energy, 1998-2002) and as a member of the Board of LSI Logic Corporation (semiconductor technologies, 1984-2008). |
Marie L. Knowles (64) |
| Year of Election or Appointment: 2001 Prior to Ms. Knowles' retirement in June 2000, she served as Executive Vice President and Chief Financial Officer of Atlantic Richfield Company (ARCO) (diversified energy, 1996-2000). From 1993 to 1996, she was a Senior Vice President of ARCO and President of ARCO Transportation Company. She served as a Director of ARCO from 1996 to 1998. Ms. Knowles currently serves as a Director and Chairman of the Audit Committee of McKesson Corporation (healthcare service, since 2002). Ms. Knowles is an Honorary Trustee of the Brookings Institution and a member of the Board of the Catalina Island Conservancy and of the Santa Catalina Island Company (2009-present). She also serves as a member of the Advisory Board for the School of Engineering of the University of Southern California and the Foundation Board of the School of Architecture at the University of Virginia (2007-present). Previously, Ms. Knowles served as a Director of Phelps Dodge Corporation (copper mining and manufacturing, 1994-2007). |
Kenneth L. Wolfe (72) |
| Year of Election or Appointment: 2005 Mr. Wolfe is Chairman of the Independent Trustees of the Fixed Income and Asset Allocation Funds (2008-present). Prior to his retirement, Mr. Wolfe served as Chairman and a Director (2007-2009) and Chairman and Chief Executive Officer (1994-2001) of Hershey Foods Corporation. He also served as a member of the Boards of Adelphia Communications Corporation (telecommunications, 2003-2006), Bausch & Lomb, Inc. (medical/pharmaceutical, 1993-2007), and Revlon, Inc. (personal care products, 2004-2009). |
+ The information above includes each Trustee's principal occupation during the last five years and other information relating to the experience, attributes, and skills relevant to each Trustee's qualifications to serve as a Trustee, which led to the conclusion that each Trustee should serve as a Trustee for the fund.
Annual Report
Trustees and Officers - continued
Executive Officers:
Correspondence intended for each executive officer may be sent to Fidelity Investments, 82 Devonshire Street, Boston, Massachusetts 02109.
Name, Age; Principal Occupation |
John R. Hebble (53) |
| Year of Election or Appointment: 2008 President and Treasurer of Fidelity's Fixed Income and Asset Allocation Funds. Mr. Hebble also serves as President (2011-present), Treasurer, and Chief Financial Officer of The North Carolina Capital Management Trust: Cash and Term Portfolios (2008-present), Assistant Treasurer of other Fidelity funds (2009-present) and is an employee of Fidelity Investments. |
Christopher P. Sullivan (57) |
| Year of Election or Appointment: 2009 Vice President of Fidelity's Bond Funds. Mr. Sullivan also serves as President of Fidelity's Bond Division (2009-present). Mr. Sullivan is Executive Vice President of Fidelity Investments Money Management, Inc. (2009-present), and a Director of Fidelity Management & Research (U.K.) Inc. (2010-present). Previously, Mr. Sullivan served as Managing Director, Co-Head of U.S. Fixed Income at Goldman Sachs Asset Management (2001-2009). |
Christine J. Thompson (53) |
| Year of Election or Appointment: 2010 Vice President of Fidelity's Bond Funds. Ms. Thompson also serves as Chief Investment Officer of FMR's Bond Group (2010-present) and is an employee of Fidelity Investments. Previously, Ms. Thompson served as Director of Municipal Bond Portfolio Managers (2002-2010). |
Scott C. Goebel (43) |
| Year of Election or Appointment: 2008 Secretary and Chief Legal Officer (CLO) of the Fidelity funds. Mr. Goebel also serves as Secretary of Fidelity Investments Money Management, Inc. (FIMM) (2010-present) and Fidelity Research and Analysis Company (FRAC) (2010-present); Secretary and CLO of The North Carolina Capital Management Trust: Cash and Term Portfolios (2008-present); General Counsel, Secretary, and Senior Vice President of FMR (2008-present) and FMR Co., Inc. (2008-present); employed by FMR LLC or an affiliate (2001-present); Chief Legal Officer of Fidelity Management & Research (Hong Kong) Limited (2008-present) and Assistant Secretary of Fidelity Management & Research (Japan) Inc. (2008-present), and Fidelity Management & Research (U.K.) Inc. (2008-present). Previously, Mr. Goebel served as Assistant Secretary of FIMM (2008-2010), FRAC (2008-2010), and the Funds (2007-2008) and as Vice President and Secretary of Fidelity Distributors Corporation (FDC) (2005-2007). |
David J. Carter (38) |
| Year of Election or Appointment: 2010 Assistant Secretary of Fidelity's Fixed Income and Asset Allocation Funds. Mr. Carter also serves as Vice President, Associate General Counsel (2010-present) and is an employee of Fidelity Investments (2005-present). |
Holly C. Laurent (57) |
| Year of Election or Appointment: 2008 Anti-Money Laundering (AML) Officer of the Fidelity funds. Ms. Laurent also serves as AML Officer of The North Carolina Capital Management Trust: Cash and Term Portfolios (2008-present) and is an employee of Fidelity Investments. Previously, Ms. Laurent was Senior Vice President and Head of Legal for Fidelity Business Services India Pvt. Ltd. (2006-2008), and Senior Vice President, Deputy General Counsel and Group Head for FMR LLC (2005-2006). |
Christine Reynolds (52) |
| Year of Election or Appointment: 2008 Chief Financial Officer of the Fidelity funds. Ms. Reynolds became President of Fidelity Pricing and Cash Management Services (FPCMS) in August 2008. Ms. Reynolds served as Chief Operating Officer of FPCMS (2007-2008). Previously, Ms. Reynolds served as President, Treasurer, and Anti-Money Laundering officer of the Fidelity funds (2004-2007). |
Michael H. Whitaker (44) |
| Year of Election or Appointment: 2008 Chief Compliance Officer of Fidelity's Fixed Income and Asset Allocation Funds. Mr. Whitaker also serves as Chief Compliance Officer of The North Carolina Capital Management Trust: Cash and Term Portfolios (2008-present). Mr. Whitaker is an employee of Fidelity Investments (2007-present). Prior to joining Fidelity Investments, Mr. Whitaker worked at MFS Investment Management where he served as Senior Vice President and Chief Compliance Officer (2004-2006), and Assistant General Counsel. |
Jeffrey S. Christian (49) |
| Year of Election or Appointment: 2009 Deputy Treasurer of the Fidelity funds. Mr. Christian is an employee of Fidelity Investments. Previously, Mr. Christian served as Chief Financial Officer (2008-2009) of certain Fidelity funds and Senior Vice President of Fidelity Pricing and Cash Management Services (FPCMS) (2004-2009). |
Bryan A. Mehrmann (50) |
| Year of Election or Appointment: 2005 Deputy Treasurer of the Fidelity funds. Mr. Mehrmann is an employee of Fidelity Investments. |
Stephanie J. Dorsey (42) |
| Year of Election or Appointment: 2008 Deputy Treasurer of Fidelity's Fixed Income and Asset Allocation Funds. Ms. Dorsey also serves as Assistant Treasurer of other Fidelity funds (2010-present) and is an employee of Fidelity Investments (2008-present). Previously, Ms. Dorsey served as Treasurer (2004-2008) of the JPMorgan Mutual Funds and Vice President (2004-2008) of JPMorgan Chase Bank. |
Adrien E. Deberghes (43) |
| Year of Election or Appointment: 2010 Assistant Treasurer of Fidelity's Fixed Income and Asset Allocation Funds. Mr. Deberghes also serves as Deputy Treasurer of other Fidelity funds (2008-present) and is an employee of Fidelity Investments (2008-present). Previously, Mr. Deberghes served as Senior Vice President of Mutual Fund Administration at State Street Corporation (2007-2008), Senior Director of Mutual Fund Administration at Investors Bank & Trust (2005-2007), and Director of Finance for Dunkin' Brands (2000-2005). |
Kenneth B. Robins (41) |
| Year of Election or Appointment: 2009 Assistant Treasurer of the Fidelity Fixed Income and Asset Allocation Funds. Mr. Robins also serves as President and Treasurer of other Fidelity funds (2008-present; 2010-present) and is an employee of Fidelity Investments (2004-present). Previously, Mr. Robins served as Deputy Treasurer of the Fidelity funds (2005-2008) and Treasurer and Chief Financial Officer of The North Carolina Capital Management Trust: Cash and Term Portfolios (2006-2008). |
Gary W. Ryan (52) |
| Year of Election or Appointment: 2005 Assistant Treasurer of the Fidelity funds. Mr. Ryan is an employee of Fidelity Investments. Previously, Mr. Ryan served as Vice President of Fund Reporting in Fidelity Pricing and Cash Management Services (FPCMS) (1999-2005). |
Jonathan Davis (43) |
| Year of Election or Appointment: 2010 Assistant Treasurer of the Fidelity funds. Mr. Davis is an employee of Fidelity Investments. Previously, Mr. Davis served as Vice President and Associate General Counsel of FMR LLC (2003-2010). |
Annual Report
The Board of Trustees of Fidelity GNMA Fund voted to pay on September 12, 2011, to shareholders of record at the opening of business on September 9, 2011, a distribution of $0.073 per share derived from capital gains realized from sales of portfolio securities.
The fund hereby designates as a capital gain dividend with respect to the taxable year ended July 31, 2011, $44,365,671, or, if subsequently determined to be different, the net capital gain of such year.
The fund designates $150,953,118 of distributions paid during the period January 1, 2011 to July 31, 2011 as qualifying to be taxed as interest-related dividends for nonresident alien shareholders.
The fund will notify shareholders in January 2012 of amounts for use in preparing 2011 income tax returns.
Annual Report
Managing Your Investments
Fidelity offers several ways to conveniently manage your personal investments via your telephone or PC. You can access your account information, conduct trades and research your investments 24 hours a day.
By Phone
Fidelity Automated Service Telephone provides a single toll-free number to access account balances, positions, quotes and trading. It's easy to navigate the service, and on your first call, the system will help you create a personal identification number (PIN) for security.
(phone_graphic)
Fidelity Automated
Service Telephone (FAST®)
1-800-544-5555
Press
 For mutual fund and brokerage trading.
 For quotes.*
 For account balances and holdings.
 To review orders and mutual
fund activity.
 To change your PIN.

 To speak to a Fidelity representative.
By PC
Fidelity's web site on the Internet provides a wide range of information, including daily financial news, fund performance, interactive planning tools and news about Fidelity products and services.
(computer_graphic)
Fidelity's Web Site
www.fidelity.com
* When you call the quotes line, please remember that a fund's yield and return will vary and, except for money market funds, share price will also vary. This means that you may have a gain or loss when you sell your shares. There is no assurance that money market funds will be able to maintain a stable $1 share price; an investment in a money market fund is not insured or guaranteed by the U.S. government. Total returns are historical and include changes in share price, reinvestment of dividends and capital gains distributions, and the effects of any sales charges.
Annual Report
To Write Fidelity
We'll give your correspondence immediate attention and send you written confirmation upon completion of your request.
(letter_graphic)
Making Changes
To Your Account
(such as changing name, address, bank, etc.)
Fidelity Investments
P.O. Box 770001
Cincinnati, OH 45277-0002
(letter_graphic)
For Non-Retirement
Accounts
Buying shares
Fidelity Investments
P.O. Box 770001
Cincinnati, OH 45277-0003
Overnight Express
Fidelity Investments
Attn: Distribution Services
100 Crosby Parkway - KC1H
Covington, KY 41015
Selling shares
Fidelity Investments
P.O. Box 770001
Cincinnati, OH 45277-0035
Overnight Express
Fidelity Investments
Attn: Distribution Services
100 Crosby Parkway - KC1H
Covington, KY 41015
General Correspondence
Fidelity Investments
P.O. Box 500
Merrimack, NH 03054-0500
(letter_graphic)
For Retirement
Accounts
Buying shares
Fidelity Investments
P.O. Box 770001
Cincinnati, OH 45277-0003
Selling shares
Fidelity Investments
P.O. Box 770001
Cincinnati, OH 45277-0035
Overnight Express
Fidelity Investments
Attn: Distribution Services
100 Crosby Parkway - KC1H
Covington, KY 41015
General Correspondence
Fidelity Investments
P.O. Box 500
Merrimack, NH 03054-0500
Annual Report
To Visit Fidelity
For directions and hours,
please call 1-800-544-9797.
Arizona
7001 West Ray Road
Chandler, AZ
15445 N. Scottsdale Road
Scottsdale, AZ
17550 North 75th Avenue
Glendale, AZ
5330 E. Broadway Blvd
Tucson, AZ
California
815 East Birch Street
Brea, CA
1411 Chapin Avenue
Burlingame, CA
851 East Hamilton Avenue
Campbell, CA
601 Larkspur Landing Circle
Larkspur, CA
2000 Avenue of the Stars
Los Angeles, CA
27101 Puerta Real
Mission Viejo, CA
73575 El Paseo
Palm Desert, CA
251 University Avenue
Palo Alto, CA
123 South Lake Avenue
Pasadena, CA
16656 Bernardo Ctr. Drive
Rancho Bernardo, CA
1220 Roseville Parkway
Roseville, CA
1740 Arden Way
Sacramento, CA
7676 Hazard Center Drive
San Diego, CA
11943 El Camino Real
San Diego, CA
8 Montgomery Street
San Francisco, CA
3793 State Street
Santa Barbara, CA
1200 Wilshire Boulevard
Santa Monica, CA
398 West El Camino Real
Sunnyvale, CA
111 South Westlake Blvd
Thousand Oaks, CA
21701 Hawthorne Boulevard
Torrance, CA
2001 North Main Street
Walnut Creek, CA
6326 Canoga Avenue
Woodland Hills, CA
2211 Michelson Drive
Irvine, CA
Colorado
281 East Flatiron Circle
Broomfield, CO
1625 Broadway
Denver, CO
9185 Westview Road
Lone Tree, CO
Connecticut
48 West Putnam Avenue
Greenwich, CT
265 Church Street
New Haven, CT
300 Atlantic Street
Stamford, CT
29 South Main Street
West Hartford, CT
1261 Post Road
Fairfield, CT
Delaware
400 Delaware Avenue
Wilmington, DE
Florida
175 East Altamonte Drive
Altamonte Springs, FL
1400 Glades Road
Boca Raton, FL
121 Alhambra Plaza
Coral Gables, FL
2948 N. Federal Highway
Ft. Lauderdale, FL
4671 Town Center Parkway
Jacksonville, FL
8880 Tamiami Trail, North
Naples, FL
230 Royal Palm Way
Palm Beach, FL
3501 PGA Boulevard
Palm Beach Gardens, FL
3550 Tamiami Trail, South
Sarasota, FL
1502 N. Westshore Blvd.
Tampa, FL
2465 State Road 7
Wellington, FL
Georgia
3242 Peachtree Road
Atlanta, GA
1000 Abernathy Road
Atlanta, GA
Illinois
One North LaSalle Street
Chicago, IL
401 North Michigan Avenue
Chicago, IL
One Skokie Valley Road
Highland Park, IL
1415 West 22nd Street
Oak Brook, IL
15105 S LaGrange Road
Orland Park, IL
1572 East Golf Road
Schaumburg, IL
1823 Freedom Drive
Naperville, IL
Indiana
8480 Keystone Crossing
Indianapolis, IN
Kansas
5400 College Boulevard
Overland Park, KS
Maine
Three Canal Plaza
Portland, ME
Maryland
7315 Wisconsin Avenue
Bethesda, MD
610 York Road
Towson, MD
Massachusetts
801 Boylston Street
Boston, MA
155 Congress Street
Boston, MA
300 Granite Street
Braintree, MA
44 Mall Road
Burlington, MA
238 Main Street
Cambridge, MA
200 Endicott Street
Danvers, MA
Fidelity Brokerage Services, Inc., 100 Summer St., Boston, MA 02110 Member NYSE/SIPC
Annual Report
405 Cochituate Road
Framingham, MA
551 Boston Turnpike
Shrewsbury, MA
Michigan
500 E. Eisenhower Pkwy.
Ann Arbor, MI
280 N. Old Woodward Ave.
Birmingham, MI
30200 Northwestern Hwy.
Farmington Hills, MI
43420 Grand River Avenue
Novi, MI
3480 28th Street
Grand Rapids, MI
2425 S. Linden Road STE E
Flint, MI
Minnesota
7740 France Avenue South
Edina, MN
8342 3rd Street North
Oakdale, MN
Missouri
1524 South Lindbergh Blvd.
St. Louis, MO
Nevada
2225 Village Walk Drive
Henderson, NV
New Jersey
501 Route 73 South
Marlton, NJ
150 Essex Street
Millburn, NJ
35 Morris Street
Morristown, NJ
396 Route 17, North
Paramus, NJ
3518 Route 1 North
Princeton, NJ
530 Broad Street
Shrewsbury, NJ
New Mexico
2261 Q Street NE
Albuquerque, NM
New York
1130 Franklin Avenue
Garden City, NY
37 West Jericho Turnpike
Huntington Station, NY
1271 Avenue of the Americas
New York, NY
980 Madison Avenue
New York, NY
61 Broadway
New York, NY
350 Park Avenue
New York, NY
200 Fifth Avenue
New York, NY
733 Third Avenue
New York, NY
2070 Broadway
New York, NY
1075 Northern Blvd.
Roslyn, NY
799 Central Park Avenue
Scarsdale, NY
3349 Monroe Avenue
Rochester, NY
North Carolina
4611 Sharon Road
Charlotte, NC
7011 Fayetteville Road
Durham, NC
Ohio
3805 Edwards Road
Cincinnati, OH
1324 Polaris Parkway
Columbus, OH
1800 Crocker Road
Westlake, OH
28699 Chagrin Boulevard
Woodmere Village, OH
Oregon
7493 SW Bridgeport Road
Tigard, OR
Pennsylvania
600 West DeKalb Pike
King of Prussia, PA
1735 Market Street
Philadelphia, PA
12001 Perry Highway
Wexford, PA
Rhode Island
10 Memorial Boulevard
Providence, RI
Tennessee
3018 Peoples Street
Johnson City, TN
7628 West Farmington Blvd.
Germantown, TN
2035 Mallory Lane
Franklin, TN
Texas
10000 Research Boulevard
Austin, TX
4001 Northwest Parkway
Dallas, TX
12532 Memorial Drive
Houston, TX
2701 Drexel Drive
Houston, TX
6560 Fannin Street
Houston, TX
1701 Lake Robbins Drive
The Woodlands, TX
6500 N. MacArthur Blvd.
Irving, TX
6005 West Park Boulevard
Plano, TX
1576 East Southlake Blvd.
Southlake, TX
15600 Southwest Freeway
Sugar Land, TX
139 N. Loop 1604 East
San Antonio, TX
Utah
279 West South Temple
Salt Lake City, UT
Virginia
1861 International Drive
McLean, VA
11957 Democracy Drive
Reston, VA
Washington
10500 NE 8th Street
Bellevue, WA
1518 6th Avenue
Seattle, WA
304 Strander Blvd
Tukwila, WA
Washington, DC
1900 K Street, N.W.
Washington, DC
Wisconsin
16020 West Bluemound Road
Brookfield, WI
Annual Report
Investment Adviser
Fidelity Management & Research Company
Boston, MA
Investment Sub-Advisers
Fidelity Management & Research (U.K.) Inc.
Fidelity Investments
Money Management, Inc.
Fidelity Management & Research
(Hong Kong) Limited
Fidelity Management & Research
(Japan) Inc.
General Distributor
Fidelity Distributors Corporation
Boston, MA
Transfer and Service Agents
Fidelity Investments Institutional
Operations Company, Inc.
Boston, MA
Fidelity Service Company, Inc.
Boston, MA
Custodian
The Bank of New York Mellon
New York, NY
The Fidelity Telephone Connection
Mutual Fund 24-Hour Service
Exchanges/Redemptions
and Account Assistance 1-800-544-6666
Product Information 1-800-544-6666
Retirement Accounts 1-800-544-4774
(8 a.m. - 9 p.m.)
TDD Service 1-800-544-0118
for the deaf and hearing impaired
(9 a.m. - 9 p.m. Eastern time)
Fidelity Automated Service
Telephone (FAST®)
1-800-544-5555
Automated line for quickest service
MOG-UANN-0911
1.930525.100

Fidelity® Intermediate
Government Income Fund
Annual Report
July 31, 2011
(2_fidelity_logos) (Registered_Trademark)
Contents
Chairman's Message | <Click Here> | The Chairman's message to shareholders. |
Performance | <Click Here> | How the fund has done over time. |
Management's Discussion of Fund Performance | <Click Here> | The Portfolio Manager's review of fund performance and strategy. |
Shareholder Expense Example | <Click Here> | An example of shareholder expenses. |
Investment Changes | <Click Here> | A summary of major shifts in the fund's investments over the past six months. |
Investments | <Click Here> | A complete list of the fund's investments with their market values. |
Financial Statements | <Click Here> | Statements of assets and liabilities, operations, and changes in net assets, as well as financial highlights. |
Notes | <Click Here> | Notes to the financial statements. |
Report of Independent Registered Public Accounting Firm | <Click Here> | |
Trustees and Officers | <Click Here> | |
Distributions | <Click Here> | |
To view a fund's proxy voting guidelines and proxy voting record for the 12-month period ended June 30, visit http://www.fidelity.com/proxyvotingresults or visit the Securities and Exchange Commission's (SEC) web site at http://www.sec.gov. You may also call 1-800-544-8544 to request a free copy of the proxy voting guidelines.
Standard & Poor's, S&P and S&P 500 are registered service marks of The McGraw-Hill Companies, Inc. and have been licensed for use by Fidelity Distributors Corporation.
Other third party marks appearing herein are the property of their respective owners.
All other marks appearing herein are registered or unregistered trademarks or service marks of FMR LLC or an affiliated company.
This report and the financial statements contained herein are submitted for the general information of the shareholders of the funds. This report is not authorized for distribution to prospective investors in the funds unless preceded or accompanied by an effective prospectus.
A fund files its complete schedule of portfolio holdings with the SEC for the first and third quarters of each fiscal year on Form N-Q. Forms N-Q are available on the SEC's web site at http://www.sec.gov. A fund's Forms N-Q may be reviewed and copied at the SEC's Public Reference Room in Washington, DC. Information regarding the operation of the SEC's Public Reference Room may be obtained by calling 1-800-SEC-0330. For a complete list of a fund's portfolio holdings, view the most recent holdings listing, semiannual report, or annual report on Fidelity's web site at http://www.fidelity.com, http://www.advisor.fidelity.com, or http://www.401k.com, as applicable.
NOT FDIC INSURED • MAY LOSE VALUE • NO BANK GUARANTEE
Neither the fund nor Fidelity Distributors Corporation is a bank.
Annual Report
(photo_of_Abigail_P_Johnson)
Dear Shareholder:
The second half of 2011 began with U.S. equities continuing to give back some of the gains achieved earlier in the year. In the days leading up to July 31, markets were shaken by a political stalemate in which Congress struggled to address the debt ceiling issue before an early-August deadline. The resulting uncertainty held back markets in July, the third consecutive monthly decline for equities, effectively reversing the positive momentum seen through the end of April. Financial markets are always unpredictable, of course, but there are several time-tested investment principles that can help put the odds in your favor.
One of the basic tenets is to invest for the long term. Over time, riding out the markets' inevitable ups and downs has proven much more effective than selling into panic or chasing the hottest trend. Even missing only a few of the markets' best days can significantly diminish investor returns. Patience also affords the benefits of compounding - of earning interest on additional income or reinvested dividends and capital gains. There can be tax advantages and cost benefits to consider as well. While staying the course doesn't eliminate risk, it can considerably lessen the effect of short-term declines.
You can further manage your investing risk through diversification. And today, more than ever, geographic diversification should be taken into account. Studies indicate that asset allocation is the single most important determinant of a portfolio's long-term success. The right mix of stocks, bonds and cash - aligned to your particular risk tolerance and investment objective - is very important. Age-appropriate rebalancing is also an essential aspect of asset allocation. For younger investors, an emphasis on equities - which historically have been the best-performing asset class over time - is encouraged. As investors near their specific goal, such as retirement or sending a child to college, consideration may be given to replacing volatile assets (e.g. common stocks) with more-stable fixed investments (bonds or savings plans).
A third principle - investing regularly - can help lower the average cost of your purchases. Investing a certain amount of money each month or quarter helps ensure you won't pay for all your shares at market highs. This strategy - known as dollar cost averaging - also reduces "emotion" from investing, helping shareholders avoid selling weak performers just prior to an upswing, or chasing a hot performer just before a correction.
We invite you to contact us via the Internet, through our Investor Centers or by phone. It is our privilege to provide you the information you need to make the investments that are right for you.
Sincerely,
(The chairman's signature appears here.)
Abigail P. Johnson
Annual Report
Average annual total return reflects the change in the value of an investment, assuming reinvestment of the fund's distributions from dividend income and capital gains (the profits earned upon the sale of securities that have grown in value, if any) and assuming a constant rate of performance each year. The $10,000 table and the fund's returns do not reflect the deduction of taxes that a shareholder would pay on fund distributions or the redemption of fund shares. During periods of reimbursement by Fidelity, a fund's total return will be greater than it would be had the reimbursement not occurred. How a fund did yesterday is no guarantee of how it will do tomorrow.
Average Annual Total Returns
Periods ended July 31, 2011 | Past 1
year | Past 5
years | Past 10
years |
Fidelity® Intermediate Government Income Fund | 3.04% | 5.87% | 4.87% |
$10,000 Over 10 Years
Let's say hypothetically that $10,000 was invested in Fidelity® Intermediate Government Income Fund on July 31, 2001. The chart shows how the value of your investment would have changed, and also shows how the Barclays Capital U.S. Intermediate Government Bond Index performed over the same period.
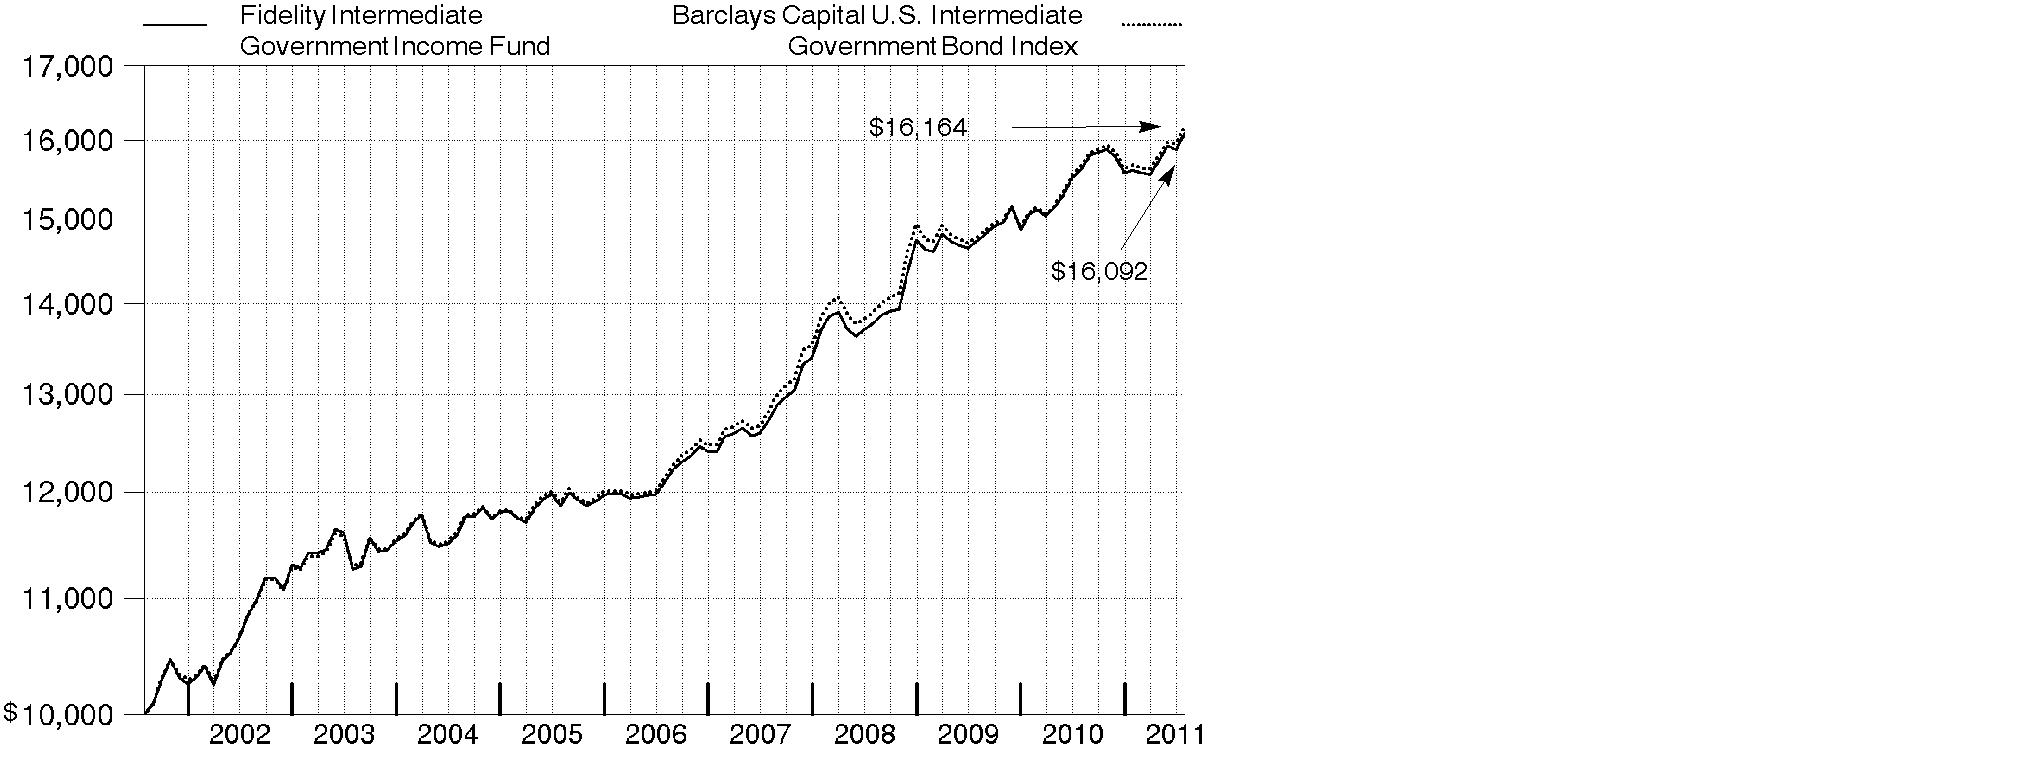
Annual Report
Market Recap: Amid ultra-low interest rates and heightened market volatility, U.S. taxable investment-grade bonds generated solid results for the year ending July 31, 2011, as evidenced by the 4.44% advance of the Barclays Capital® U.S. Aggregate Bond Index. The best-performing categories within the index were those on the riskier end of the spectrum that benefited during intervals when data pointed to an improving economy. Buoyed by a strong first-half showing, commercial mortgage-backed securities (CMBS) fared best, gaining 10.01% amid modest improvement in commercial real estate fundamentals. Corporate bonds rose 6.70%, due in large part to increased corporate profitability, high cash balances, reduced debt levels and improved credit conditions. Residential mortgage-backed securities, supported by a combination of strong demand from yield-hungry investors and slower prepayment rates, rose a solid 3.85%. Meanwhile, U.S. Treasury and agency securities gained 3.39% and 2.53%, respectively. These securities, which lagged in the first half of the period, when economic data was strong and inflation worries were muted, performed comparatively well in the second half amid signs of a weakening economic recovery and heightened concern about the sovereign debt crisis in Europe.
Comments from William Irving, Lead Portfolio Manager of Fidelity® Intermediate Government Income Fund: For the year, the fund returned 3.04%, while the Barclays Capital® U.S. Intermediate Government Bond Index rose 3.21%. Out-of-benchmark exposure to government-backed MBS helped. MBS were aided by both their comparatively high yields and solid price appreciation, and we enjoyed good security selection within the sector. Specifically, emphasizing prepayment-resistant securities worked in our favor during the period's first half. We also modestly benefited from owning collateralized mortgage obligation (CMO) floaters. To help manage the interest rate sensitivity of our CMO holdings, we purchased short-term U.S. Treasury bond futures. Detracting from performance was out-of-index exposure to reverse mortgage securities, which lagged.
Note to shareholders: Effective August 1, 2011, the fund will have the ability to invest in agency MBS indirectly through Fidelity Mortgage Backed Securities Central Fund. In connection with this change, the fund's fiscal year end will shift from July 31 to August 31 to align it with that of the central fund.
The views expressed above reflect those of the portfolio manager(s) only through the end of the period as stated on the cover of this report and do not necessarily represent the views of Fidelity or any other person in the Fidelity organization. Any such views are subject to change at any time based upon market or other conditions and Fidelity disclaims any responsibility to update such views. These views may not be relied on as investment advice and, because investment decisions for a Fidelity fund are based on numerous factors, may not be relied on as an indication of trading intent on behalf of any Fidelity fund.
Annual Report
Shareholder Expense Example
As a shareholder of the Fund, you incur two types of costs: (1) transaction costs, and (2) ongoing costs, including management fees and other Fund expenses. This Example is intended to help you understand your ongoing costs (in dollars) of investing in the Fund and to compare these costs with the ongoing costs of investing in other mutual funds.
The Example is based on an investment of $1,000 invested at the beginning of the period and held for the entire period (February 1, 2011 to July 31, 2011).
Actual Expenses
The first line of the accompanying table provides information about actual account values and actual expenses. You may use the information in this line, together with the amount you invested, to estimate the expenses that you paid over the period. Simply divide your account value by $1,000.00 (for example, an $8,600 account value divided by $1,000.00 = 8.6), then multiply the result by the number in the first line under the heading entitled "Expenses Paid During Period" to estimate the expenses you paid on your account during this period. A small balance maintenance fee of $12.00 that is charged once a year may apply for certain accounts with a value of less than $2,000. This fee is not included in the table below. If it was, the estimate of expenses you paid during the period would be higher, and your ending account value lower, by this amount.
Hypothetical Example for Comparison Purposes
The second line of the accompanying table provides information about hypothetical account values and hypothetical expenses based on the Fund's actual expense ratio and an assumed rate of return of 5% per year before expenses, which is not the Fund's actual return. The hypothetical account values and expenses may not be used to estimate the actual ending account balance or expenses you paid for the period. You may use this information to compare the ongoing costs of investing in the Fund and other funds. To do so, compare this 5% hypothetical example with the 5% hypothetical examples that appear in the shareholder reports of the other funds. A small balance maintenance fee of $12.00 that is charged once a year may apply for certain accounts with a value of less than $2,000. This fee is not included in the table below. If it was, the estimate of expenses you paid during the period would be higher, and your ending account value lower, by this amount.
Please note that the expenses shown in the table are meant to highlight your ongoing costs only and do not reflect any transaction costs. Therefore, the second line of the table is useful in comparing ongoing costs only, and will not help you determine the relative total costs of owning different funds.
| Annualized Expense Ratio | Beginning
Account Value
February 1, 2011 | Ending
Account Value
July 31, 2011 | Expenses Paid
During Period*
February 1, 2011
to July 31, 2011 |
Actual | .45% | $ 1,000.00 | $ 1,031.20 | $ 2.27 |
Hypothetical (5% return per year before expenses) | | $ 1,000.00 | $ 1,022.56 | $ 2.26 |
* Expenses are equal to the Fund's annualized expense ratio, multiplied by the average account value over the period, multiplied by 181/365 (to reflect the one-half year period).
Annual Report
Investment Changes (Unaudited)
Coupon Distribution as of July 31, 2011 |
| % of fund's investments | % of fund's investments
6 months ago |
Zero coupon bonds | 0.6 | 0.0 |
0.01 - 0.99% | 30.0 | 14.5 |
1 - 1.99% | 13.1 | 26.1 |
2 - 2.99% | 13.4 | 19.1 |
3 - 3.99% | 16.7 | 25.4 |
4 - 4.99% | 6.4 | 5.4 |
5 - 5.99% | 5.1 | 5.0 |
6% and over | 2.3 | 2.5 |
Coupon distribution shows the range of stated interest rates on the fund's investments, excluding short-term investments. |
Weighted Average Maturity as of July 31, 2011 |
| | 6 months ago |
Years | 4.5 | 5.1 |
This is a weighted average of all the maturities of the securities held in a fund. Weighted Average Maturity (WAM) can be used as a measure of sensitivity to interest rate changes and markets changes. Generally, the longer the maturity, the greater the sensitivity to such changes. WAM is based on the dollar-weighted average length of time until principal payments must be paid. Depending on the types of securities held in a fund, certain maturity shortening devices (e.g., demand features, interest rate resets, and call options) may be taken into account when calculating the WAM. |
Duration as of July 31, 2011 |
| | 6 months ago |
Years | 3.7 | 3.6 |
Duration estimates how much a bond fund's price will change with a change in comparable interest rates. If rates rise 1%, for example, a fund with a 5-year duration is likely to lose about 5% of its value. Other factors also can influence a bond fund's performance and share price. Accordingly, a bond fund's actual performance may differ from this example. Duration takes into account any call or put option embedded in the bonds. |
Asset Allocation (% of fund's net assets) |
As of July 31, 2011 * | As of January 31, 2011 ** |
 | Mortgage Securities 5.6% | | | Mortgage Securities 15.1% | |
 | CMOs and
Other Mortgage
Related Securities 11.1% | |  | CMOs and
Other Mortgage
Related Securities 8.3% | |
 | U.S. Treasury
Obligations 63.8% | | | U.S. Treasury
Obligations 63.9% | |
 | U.S. Government
Agency Obligations† 17.1% | |  | U.S. Government
Agency Obligations† 18.5% | |
 | Foreign Government
& Government
Agency Obligations 1.4% | |  | Foreign Government
& Government
Agency Obligations 0.2% | |
 | Short-Term
Investments and
Net Other Assets 1.0% | |  | Short-Term
Investments and
Net Other Assets †† (6.0)% | |

* Futures and Swaps | 6.5% | | ** Futures and Swaps | 0.6% | |
† Includes FDIC Guaranteed Corporate Securities and NCUA Guaranteed Notes. |
†† Short-Term Investments and Net Other Assets are not included in the pie chart. |
Annual Report
Investments July 31, 2011
Showing Percentage of Net Assets
U.S. Government and Government Agency Obligations - 80.9% |
| Principal Amount (000s) | | Value (000s) |
U.S. Government Agency Obligations - 5.6% |
Fannie Mae: | | | | |
0.375% 12/28/12 | | $ 8,610 | | $ 8,614 |
0.5% 8/9/13 | | 3,407 | | 3,407 |
1.125% 6/27/14 | | 2,050 | | 2,072 |
Federal Home Loan Bank: | | | | |
0.5% 8/28/13 | | 11,240 | | 11,240 |
0.875% 8/22/12 | | 2,100 | | 2,112 |
0.875% 12/27/13 | | 465 | | 468 |
Freddie Mac: | | | | |
0.375% 11/30/12 | | 2,964 | | 2,964 |
1% 7/30/14 | | 7,241 | | 7,283 |
1% 8/27/14 | | 3,738 | | 3,757 |
Private Export Funding Corp. secured: | | | | |
4.974% 8/15/13 | | 3,435 | | 3,734 |
5.66% 9/15/11 (c) | | 9,000 | | 9,056 |
5.685% 5/15/12 | | 3,915 | | 4,080 |
Small Business Administration guaranteed development participation certificates Series 2004-20H Class 1, 5.17% 8/1/24 | | 472 | | 512 |
Tennessee Valley Authority 3.875% 2/15/21 | | 7,910 | | 8,360 |
TOTAL U.S. GOVERNMENT AGENCY OBLIGATIONS | | 67,659 |
U.S. Treasury Obligations - 63.8% |
U.S. Treasury Bonds 8.75% 5/15/17 | | 14,750 | | 20,595 |
U.S. Treasury Notes: | | | | |
0.375% 6/30/13 (b) | | 110,584 | | 110,627 |
0.5% 5/31/13 | | 19,409 | | 19,463 |
0.625% 7/15/14 (b) | | 135,613 | | 135,953 |
0.75% 6/15/14 | | 36,584 | | 36,824 |
1.25% 8/31/15 | | 1,000 | | 1,012 |
1.375% 2/15/13 | | 5,455 | | 5,543 |
1.5% 7/31/16 | | 52,260 | | 52,623 |
1.75% 7/31/15 | | 2,000 | | 2,065 |
1.875% 6/30/15 | | 35,554 | | 36,915 |
2.125% 5/31/15 | | 1,574 | | 1,650 |
2.25% 7/31/18 | | 65,031 | | 65,666 |
2.375% 8/31/14 | | 9,290 | | 9,797 |
2.375% 9/30/14 | | 4,572 | | 4,823 |
2.375% 10/31/14 | | 16,136 | | 17,035 |
2.375% 7/31/17 | | 12,000 | | 12,443 |
2.5% 3/31/15 | | 7,000 | | 7,438 |
U.S. Government and Government Agency Obligations - continued |
| Principal Amount (000s) | | Value (000s) |
U.S. Treasury Obligations - continued |
U.S. Treasury Notes: - continued | | | | |
2.5% 6/30/17 | | $ 1,800 | | $ 1,881 |
3% 9/30/16 | | 6,641 | | 7,170 |
3% 2/28/17 | | 26,424 | | 28,453 |
3.125% 10/31/16 | | 33,540 | | 36,391 |
3.125% 1/31/17 | | 27,081 | | 29,347 |
3.125% 5/15/19 | | 26,941 | | 28,566 |
3.125% 5/15/21 | | 22,565 | | 23,193 |
3.375% 6/30/13 | | 1,138 | | 1,204 |
3.625% 8/15/19 | | 9,790 | | 10,708 |
3.625% 2/15/20 | | 11,372 | | 12,364 |
4.25% 11/15/17 | | 6,260 | | 7,177 |
4.5% 5/15/17 (e) | | 1,369 | | 1,587 |
4.625% 2/15/17 | | 14,625 | | 17,030 |
4.75% 8/15/17 | | 12,139 | | 14,266 |
TOTAL U.S. TREASURY OBLIGATIONS | | 759,809 |
Other Government Related - 11.5% |
Bank of America Corp.: | | | | |
2.1% 4/30/12 (FDIC Guaranteed) (d) | | 1,493 | | 1,513 |
3.125% 6/15/12 (FDIC Guaranteed) (d) | | 305 | | 312 |
Citibank NA 1.875% 5/7/12 (FDIC Guaranteed) (d) | | 22,000 | | 22,267 |
Citigroup Funding, Inc.: | | | | |
1.875% 10/22/12 (FDIC Guaranteed) (d) | | 20,600 | | 20,987 |
1.875% 11/15/12 (FDIC Guaranteed) (d) | | 3,800 | | 3,872 |
2% 3/30/12 (FDIC Guaranteed) (d) | | 10,000 | | 10,125 |
2.125% 7/12/12 (FDIC Guaranteed) (d) | | 2,384 | | 2,426 |
General Electric Capital Corp.: | | | | |
2% 9/28/12 (FDIC Guaranteed) (d) | | 13,000 | | 13,246 |
2.625% 12/28/12 (FDIC Guaranteed) (d) | | 4,364 | | 4,509 |
3% 12/9/11 (FDIC Guaranteed) (d) | | 1,030 | | 1,040 |
GMAC, Inc. 1.75% 10/30/12 (FDIC Guaranteed) (d) | | 15,000 | | 15,251 |
Goldman Sachs Group, Inc. 3.25% 6/15/12 (FDIC Guaranteed) (d) | | 306 | | 314 |
JPMorgan Chase & Co.: | | | | |
2.2% 6/15/12 (FDIC Guaranteed) (d) | | 2,260 | | 2,298 |
3.125% 12/1/11 (FDIC Guaranteed) (d) | | 170 | | 172 |
National Credit Union Administration Guaranteed Notes: | | | | |
Series 2010-A1 Class A, 0.5351% 12/7/20 (NCUA Guaranteed) (f) | | 2,786 | | 2,793 |
U.S. Government and Government Agency Obligations - continued |
| Principal Amount (000s) | | Value (000s) |
Other Government Related - continued |
National Credit Union Administration Guaranteed Notes: - continued | | | | |
Series 2011-R1 Class 1A, 0.6398% 1/8/20 (NCUA Guaranteed) (f) | | $ 4,133 | | $ 4,140 |
Series 2011-R4 Class 1A, 0.5698% 3/6/20 (NCUA Guaranteed) (f) | | 2,688 | | 2,689 |
National Credit Union Administration Guaranteed Notes Master Trust: | | | | |
1.4% 6/12/15 (NCUA Guaranteed) | | 1,690 | | 1,694 |
2.35% 6/12/17 (NCUA Guaranteed) | | 14,740 | | 14,846 |
3.45% 6/12/21 (NCUA Guaranteed) | | 12,000 | | 12,104 |
TOTAL OTHER GOVERNMENT RELATED | | 136,598 |
TOTAL U.S. GOVERNMENT AND GOVERNMENT AGENCY OBLIGATIONS (Cost $939,834) | 964,066 |
U.S. Government Agency - Mortgage Securities - 5.6% |
|
Fannie Mae - 2.5% |
2.01% 2/1/33 (f) | | 34 | | 35 |
2.035% 12/1/34 (f) | | 34 | | 36 |
2.035% 3/1/35 (f) | | 35 | | 37 |
2.054% 10/1/33 (f) | | 17 | | 18 |
2.065% 7/1/35 (f) | | 16 | | 17 |
2.175% 3/1/35 (f) | | 7 | | 7 |
2.297% 11/1/33 (f) | | 87 | | 90 |
2.451% 7/1/36 (f) | | 148 | | 155 |
2.457% 3/1/35 (f) | | 22 | | 23 |
2.467% 10/1/35 (f) | | 51 | | 53 |
2.509% 2/1/36 (f) | | 66 | | 69 |
2.527% 6/1/47 (f) | | 89 | | 94 |
2.534% 7/1/34 (f) | | 20 | | 21 |
2.534% 1/1/35 (f) | | 171 | | 178 |
2.534% 7/1/35 (f) | | 45 | | 47 |
2.543% 6/1/36 (f) | | 24 | | 25 |
2.544% 3/1/33 (f) | | 89 | | 93 |
2.554% 10/1/33 (f) | | 32 | | 33 |
2.584% 11/1/36 (f) | | 211 | | 222 |
2.592% 2/1/37 (f) | | 364 | | 382 |
2.603% 5/1/36 (f) | | 46 | | 48 |
U.S. Government Agency - Mortgage Securities - continued |
| Principal Amount (000s) | | Value (000s) |
Fannie Mae - continued |
2.637% 4/1/36 (f) | | $ 294 | | $ 309 |
2.837% 9/1/36 (f) | | 75 | | 78 |
3.051% 8/1/35 (f) | | 453 | | 481 |
3.343% 1/1/40 (f) | | 10,357 | | 10,844 |
3.47% 3/1/40 (f) | | 2,605 | | 2,728 |
3.688% 5/1/40 (f) | | 1,434 | | 1,505 |
3.698% 5/1/40 (f) | | 1,699 | | 1,784 |
3.791% 6/1/40 (f) | | 1,471 | | 1,547 |
3.972% 11/1/39 (f) | | 1,291 | | 1,363 |
4% 9/1/13 | | 100 | | 105 |
5% 2/1/16 to 4/1/22 | | 185 | | 199 |
5.5% 10/1/20 to 4/1/21 | | 4,385 | | 4,762 |
5.963% 3/1/37 (f) | | 56 | | 60 |
6% 6/1/16 to 3/1/34 | | 1,610 | | 1,788 |
6.5% 6/1/16 to 5/1/27 | | 827 | | 914 |
7% 3/1/12 to 9/1/14 | | 41 | | 43 |
10.25% 10/1/18 | | 3 | | 3 |
11% 9/1/15 to 1/1/16 | | 10 | | 12 |
11.25% 5/1/14 to 1/1/16 | | 19 | | 21 |
11.5% 1/1/13 to 6/15/19 | | 29 | | 32 |
12.25% 8/1/13 | | 1 | | 1 |
12.5% 1/1/13 to 7/1/16 | | 53 | | 60 |
13% 10/1/14 | | 17 | | 20 |
13.25% 9/1/11 | | 0 * | | 0 * |
13.5% 11/1/14 | | 1 | | 1 |
15% 4/1/12 | | 0 * | | 0 * |
| | 30,343 |
Freddie Mac - 1.8% |
1.945% 3/1/35 (f) | | 104 | | 107 |
2.046% 5/1/37 (f) | | 61 | | 64 |
2.075% 3/1/37 (f) | | 22 | | 23 |
2.165% 7/1/35 (f) | | 842 | | 872 |
2.286% 6/1/33 (f) | | 199 | | 208 |
2.474% 12/1/33 (f) | | 431 | | 453 |
2.479% 11/1/35 (f) | | 177 | | 184 |
2.48% 4/1/34 (f) | | 771 | | 811 |
2.487% 10/1/35 (f) | | 203 | | 212 |
2.5% 5/1/37 (f) | | 48 | | 50 |
2.508% 12/1/36 (f) | | 670 | | 700 |
2.51% 5/1/37 (f) | | 627 | | 660 |
2.51% 5/1/37 (f) | | 354 | | 371 |
U.S. Government Agency - Mortgage Securities - continued |
| Principal Amount (000s) | | Value (000s) |
Freddie Mac - continued |
2.54% 6/1/37 (f) | | $ 186 | | $ 196 |
2.557% 4/1/37 (f) | | 72 | | 76 |
2.634% 7/1/35 (f) | | 209 | | 218 |
2.654% 2/1/36 (f) | | 16 | | 17 |
2.716% 10/1/36 (f) | | 249 | | 260 |
2.77% 1/1/35 (f) | | 535 | | 563 |
2.942% 3/1/33 (f) | | 6 | | 7 |
2.995% 7/1/35 (f) | | 188 | | 201 |
3.282% 10/1/35 (f) | | 33 | | 36 |
3.801% 4/1/40 (f) | | 1,376 | | 1,441 |
5.292% 7/1/36 (f) | | 81 | | 85 |
5.5% 11/1/18 to 11/1/21 | | 11,400 | | 12,360 |
5.847% 6/1/37 (f) | | 23 | | 25 |
6.383% 8/1/37 (f) | | 103 | | 110 |
6.487% 2/1/37 (f) | | 43 | | 44 |
6.5% 12/1/21 | | 345 | | 381 |
7.22% 4/1/37 (f) | | 4 | | 4 |
9% 7/1/16 | | 12 | | 13 |
9.5% 7/1/16 to 8/1/21 | | 116 | | 133 |
10% 4/1/15 to 3/1/21 | | 216 | | 250 |
10.5% 1/1/21 | | 2 | | 2 |
11% 9/1/20 | | 7 | | 9 |
11.25% 6/1/14 | | 25 | | 27 |
11.5% 10/1/15 to 11/1/15 | | 17 | | 19 |
12% 2/1/13 to 11/1/19 | | 12 | | 13 |
12.25% 11/1/13 to 8/1/15 | | 15 | | 17 |
12.5% 10/1/12 to 6/1/19 | | 134 | | 150 |
13% 12/1/13 to 5/1/17 | | 15 | | 17 |
14% 11/1/12 to 4/1/16 | | 2 | | 2 |
| | 21,391 |
Ginnie Mae - 1.3% |
4% 9/15/25 | | 573 | | 609 |
5.5% 2/20/60 (i) | | 12,729 | | 14,002 |
8% 12/15/23 | | 211 | | 242 |
8.5% 6/15/16 to 2/15/17 | | 3 | | 3 |
10.5% 9/15/15 to 10/15/21 | | 322 | | 387 |
11% 5/20/16 to 1/20/21 | | 27 | | 33 |
13% 9/15/13 to 10/15/13 | | 4 | | 4 |
U.S. Government Agency - Mortgage Securities - continued |
| Principal Amount (000s) | | Value (000s) |
Ginnie Mae - continued |
13.25% 8/15/14 | | $ 4 | | $ 5 |
13.5% 12/15/14 | | 1 | | 1 |
| | 15,286 |
TOTAL U.S. GOVERNMENT AGENCY - MORTGAGE SECURITIES (Cost $65,366) | 67,020 |
Collateralized Mortgage Obligations - 11.1% |
|
U.S. Government Agency - 11.1% |
Fannie Mae: | | | | |
floater Series 1994-42 Class FK, 2.46% 4/25/24 (f) | | 1,686 | | 1,739 |
planned amortization class: | | | | |
Series 1988-21 Class G, 9.5% 8/25/18 | | 38 | | 44 |
Series 2003-28 Class KG, 5.5% 4/25/23 | | 725 | | 813 |
sequential payer: | | | | |
Series 2007-113 Class DB, 4.5% 12/25/22 | | 2,930 | | 3,253 |
Series 2009-14 Class EB, 4.5% 3/25/24 | | 1,800 | | 1,981 |
Series 2010-97 Class CX, 4.5% 9/25/25 | | 2,500 | | 2,683 |
Series 2010-109 Class IM, 5.5% 9/25/40 (g) | | 5,095 | | 995 |
Fannie Mae subordinate REMIC pass-thru certificates: | | | | |
floater: | | | | |
Series 2001-38 Class QF, 1.1673% 8/25/31 (f) | | 327 | | 333 |
Series 2002-60 Class FV, 1.1873% 4/25/32 (f) | | 94 | | 96 |
Series 2002-74 Class FV, 0.6373% 11/25/32 (f) | | 2,791 | | 2,804 |
Series 2002-75 Class FA, 1.1873% 11/25/32 (f) | | 193 | | 197 |
Series 2008-76 Class EF, 0.6873% 9/25/23 (f) | | 1,285 | | 1,286 |
planned amortization class: | | | | |
Series 2002-16 Class PG, 6% 4/25/17 | | 487 | | 527 |
Series 2002-9 Class PC, 6% 3/25/17 | | 35 | | 38 |
Series 2004-80 Class LD, 4% 1/25/19 | | 881 | | 918 |
Series 2004-81 Class KD, 4.5% 7/25/18 | | 1,535 | | 1,599 |
Series 2005-52 Class PB, 6.5% 12/25/34 | | 399 | | 428 |
sequential payer: | | | | |
Series 2002-56 Class MC, 5.5% 9/25/17 | | 137 | | 148 |
Series 2002-57 Class BD, 5.5% 9/25/17 | | 123 | | 135 |
Series 2004-72 Class CB, 4% 9/25/19 | | 5,000 | | 5,368 |
Series 2005-47 Class HK, 4.5% 6/25/20 | | 1,790 | | 1,969 |
Series 2008-27 Class KB, 4.5% 4/25/23 | | 1,010 | | 1,119 |
Series 2010-139 Class NI, 4.5% 2/25/40 (g) | | 2,856 | | 536 |
Federal HMLC Multi-class participation certificates guaranteed floater Series 3835, 0.5365% 5/15/38 (f) | | 7,199 | | 7,200 |
Collateralized Mortgage Obligations - continued |
| Principal Amount (000s) | | Value (000s) |
U.S. Government Agency - continued |
FHLMC Multifamily Structured pass-thru Certificates planned amortization class 0.6365% 5/15/41 (f) | | $ 5,111 | | $ 5,110 |
Freddie Mac Multi-class participation certificates guaranteed: | | | | |
floater: | | | | |
Series 2526 Class FC, 0.5865% 11/15/32 (f) | | 407 | | 408 |
Series 2630 Class FL, 0.6865% 6/15/18 (f) | | 47 | | 47 |
Series 3346 Class FA, 0.4165% 2/15/19 (f) | | 6,116 | | 6,125 |
planned amortization class: | | | | |
Series 2356 Class GD, 6% 9/15/16 | | 140 | | 152 |
Series 2376 Class JE, 5.5% 11/15/16 | | 134 | | 144 |
Series 2381 Class OG, 5.5% 11/15/16 | | 89 | | 95 |
Series 2425 Class JH, 6% 3/15/17 | | 168 | | 184 |
Series 2628 Class OE, 4.5% 6/15/18 | | 705 | | 759 |
Series 2640 Class GE, 4.5% 7/15/18 | | 3,690 | | 3,986 |
Series 2672 Class MG, 5% 9/15/23 | | 1,630 | | 1,828 |
Series 2684 Class FP, 0.6865% 1/15/33 (f) | | 4,430 | | 4,466 |
Series 2695 Class DG, 4% 10/15/18 | | 1,635 | | 1,742 |
Series 2802 Class OB, 6% 5/15/34 | | 1,355 | | 1,564 |
Series 2810 Class PD, 6% 6/15/33 | | 735 | | 774 |
Series 2831 Class PB, 5% 7/15/19 | | 1,975 | | 2,158 |
Series 2866 Class XE, 4% 12/15/18 | | 2,647 | | 2,764 |
Series 3147 Class PF, 0.4865% 4/15/36 (f) | | 2,787 | | 2,773 |
Series 3741 Class YU, 3.5% 11/15/22 | | 3,140 | | 3,304 |
sequential payer: | | | | |
Series 1929 Class EZ, 7.5% 2/17/27 | | 1,267 | | 1,422 |
Series 2570 Class CU, 4.5% 7/15/17 | | 33 | | 34 |
Series 2572 Class HK, 4% 2/15/17 | | 15 | | 15 |
Series 2645, Class BY, 4.5% 7/15/18 | | 1,100 | | 1,216 |
Series 2668 Class AZ, 4% 9/15/18 | | 4,949 | | 5,244 |
Series 2729 Class GB, 5% 1/15/19 | | 665 | | 716 |
Series 2860 Class CP, 4% 10/15/17 | | 3 | | 3 |
Series 2930 Class KT, 4.5% 2/15/20 | | 1,540 | | 1,701 |
Series 2998 Class LY, 5.5% 7/15/25 | | 295 | | 337 |
Series 3007 Class EW, 5.5% 7/15/25 | | 1,125 | | 1,288 |
Series 3013 Class VJ, 5% 1/15/14 | | 840 | | 881 |
Series 3277 Class B, 4% 2/15/22 | | 1,200 | | 1,299 |
Series 3578, Class B, 4.5% 9/15/24 | | 1,820 | | 2,002 |
Series 2715 Class NG, 4.5% 12/15/18 | | 890 | | 976 |
Collateralized Mortgage Obligations - continued |
| Principal Amount (000s) | | Value (000s) |
U.S. Government Agency - continued |
Ginnie Mae guaranteed REMIC pass-thru certificates: | | | | |
floater: | | | | |
Series 2010-H17 Class FA, 0.5163% 7/20/60 (f)(i) | | $ 3,339 | | $ 3,288 |
Series 2010-H18 Class AF, 0.5103% 9/20/60 (f)(i) | | 3,408 | | 3,354 |
Series 2010-H19 Class FG, 0.4863% 8/20/60 (f)(i) | | 4,368 | | 4,296 |
Series 2010-H27 Series FA, 0.5663% 12/20/60 (f)(i) | | 1,096 | | 1,081 |
Series 2011-H03 Class FA, 0.6863% 1/20/61 (f)(i) | | 3,521 | | 3,499 |
Series 2011-H05 Class FA, 0.6863% 12/20/60 (f)(i) | | 2,288 | | 2,275 |
Series 2011-H07 Class FA, 0.6863% 2/20/61 (f)(i) | | 4,095 | | 4,080 |
Series 2011-H12 Class FA, 0.6763% 2/20/61 (f)(i) | | 4,310 | | 4,288 |
Series 2011-H13 Class FA, 0.6863% 4/20/61 (f)(i) | | 1,872 | | 1,872 |
Series 2011-H14: | | | | |
Class FB, 0.6863% 5/20/61 (f)(i) | | 2,000 | | 1,989 |
Class FC, 0.6863% 5/20/61 (f)(i) | | 2,102 | | 2,091 |
planned amortization Series 2011-79, 6/20/40 (h) | | 4,344 | | 3,454 |
Series 2004-79 Class FA, 0.4863% 1/20/31 (f) | | 559 | | 559 |
Series 2010-42 Class OP, 4/20/40 (h) | | 5,785 | | 4,700 |
TOTAL COLLATERALIZED MORTGAGE OBLIGATIONS (Cost $129,884) | 132,552 |
Foreign Government and Government Agency Obligations - 1.4% |
|
Israeli State (guaranteed by U.S. Government through Agency for International Development): | | | | |
5.5% 9/18/23 | | 1,064 | | 1,267 |
5.5% 12/4/23 | | 10,700 | | 12,772 |
6.8% 2/15/12 | | 2,067 | | 2,108 |
TOTAL FOREIGN GOVERNMENT AND GOVERNMENT AGENCY OBLIGATIONS (Cost $15,451) | 16,147 |
Cash Equivalents - 13.9% |
| Maturity Amount (000s) | | Value (000s) |
Investments in repurchase agreements in a joint trading account at: | | | |
0.17%, dated 7/29/11 due 8/1/11 (Collateralized by U.S. Government Obligations) # | $ 12,607 | | $ 12,607 |
0.2%, dated 7/29/11 due 8/1/11 (Collateralized by U.S. Government Obligations) # (a) | 152,910 | | 152,907 |
TOTAL CASH EQUIVALENTS (Cost $165,514) | 165,514 |
TOTAL INVESTMENT PORTFOLIO - 112.9% (Cost $1,316,049) | | 1,345,299 |
NET OTHER ASSETS (LIABILITIES) - (12.9)% | | (153,848) |
NET ASSETS - 100% | $ 1,191,451 |
Futures Contracts |
| Expiration Date | | Underlying Face Amount at Value (000s) | | Unrealized Appreciation/
(Depreciation) (000s) |
Purchased |
Treasury Contracts |
349 CBOT 2 Year U.S. Treasury Notes Contracts | Sept. 2011 | | $ 76,753 | | $ 283 |
The face value of futures purchased as a percentage of net assets is 6.5% |
Legend |
(a) Includes investment made with cash collateral received from securities on loan. |
(b) Security or a portion of the security is on loan at period end. |
(c) Security exempt from registration under Rule 144A of the Securities Act of 1933. These securities may be resold in transactions exempt from registration, normally to qualified institutional buyers. At the end of the period, the value of these securities amounted to $9,056,000 or 0.8% of net assets. |
(d) Under the Temporary Liquidity Guarantee Program, the Federal Deposit Insurance Corporation guarantees principal and interest in the event of payment default or bankruptcy until the earlier of maturity date of the debt or until June 30, 2012. At the end of the period these securities amounted to $98,332,000 or 8.3% of net assets. |
(e) Security or a portion of the security was pledged to cover margin requirements for futures contracts. At the period end, the value of securities pledged amounted to $230,000. |
(f) Coupon rates for floating and adjustable rate securities reflect the rates in effect at period end. |
(g) Security represents right to receive monthly interest payments on an underlying pool of mortgages or assets. Principal shown is the outstanding par amount of the pool held as of the end of the period. |
(h) Principal Only Strips represent the right to receive the monthly principal payments on an underlying pool of mortgage loans. |
(i) Represents an investment in an underlying pool of reverse mortgages which typically do not require regular principal and interest payments as repayment is deferred until a maturity event. |
* Amount represents less than $1,000. |
# Additional information on each counterparty to the repurchase agreement is as follows: |
Repurchase Agreement / Counterparty | Value
(Amounts in thousands) |
$12,607,000 due 8/01/11 at 0.17% |
Bank of America NA | $ 9,120 |
J.P. Morgan Securities, Inc. | 341 |
Mizuho Securities USA, Inc. | 3,146 |
| $ 12,607 |
$152,907,000 due 8/01/11 at 0.20% |
J.P. Morgan Securities, Inc. | $ 67,160 |
Merrill Lynch, Pierce, Fenner & Smith, Inc. | 85,747 |
| $ 152,907 |
Other Information |
The following is a summary of the inputs used, as of July 31, 2011, involving the Fund's assets and liabilities carried at fair value. The inputs or methodology used for valuing securities may not be an indication of the risk associated with investing in those securities. For more information on valuation inputs, and their aggregation into the levels used in the tables below, please refer to the Security Valuation section in the accompanying Notes to Financial Statements. |
Valuation Inputs at Reporting Date: |
Description
(Amounts in thousands) | Total | Level 1 | Level 2 | Level 3 |
Investments in Securities: | | | | |
U.S. Government and Government Agency Obligations | $ 964,066 | $ - | $ 964,066 | $ - |
U.S. Government Agency - Mortgage Securities | 67,020 | - | 67,020 | - |
Collateralized Mortgage Obligations | 132,552 | - | 130,680 | 1,872 |
Foreign Government and Government Agency Obligations | 16,147 | - | 16,147 | - |
Cash Equivalents | 165,514 | - | 165,514 | - |
Total Investments in Securities: | $ 1,345,299 | $ - | $ 1,343,427 | $ 1,872 |
Derivative Instruments: | | | | |
Assets | | | | |
Futures Contracts | $ 283 | $ 283 | $ - | $ - |
The following is a reconciliation of Investments in Securities for which Level 3 inputs were used in determining value: |
(Amounts in thousands) | |
Investments in Securities: | |
Beginning Balance | $ - |
Total Realized Gain (Loss) | - |
Total Unrealized Gain (Loss) | - |
Cost of Purchases | 1,875 |
Proceeds of Sales | (3) |
Amortization/Accretion | - |
Transfers in to Level 3 | - |
Transfers out of Level 3 | - |
Ending Balance | $ 1,872 |
The change in unrealized gain (loss) for the period attributable to Level 3 securities held at July 31, 2011 | $ - |
The information used in the above reconciliation represents fiscal year to date activity for any Investments in Securities identified as using Level 3 inputs at either the beginning or the end of the current fiscal period. Transfers in or out of Level 3 represent the beginning value of any Security or Instrument where a change in the pricing level occurred from the beginning to the end of the period. The cost of purchases and the proceeds of sales may include securities received or delivered through corporate actions or exchanges. Realized and unrealized gains (losses) disclosed in the reconciliation are included in Net Gain (Loss) on the Fund's Statement of Operations. |
Value of Derivative Instruments |
The following table is a summary of the Fund's value of derivative instruments by risk exposure as of July 31, 2011. For additional information on derivative instruments, please refer to the Derivative Instruments section in the accompanying Notes to Financial Statements. |
Risk Exposure /
Derivative Type
(Amounts in thousands) | Value |
| Asset | Liability |
Interest Rate Risk | | |
Futures Contracts (a) | $ 283 | $ - |
Total Value of Derivatives | $ 283 | $ - |
(a) Reflects cumulative appreciation/(depreciation) on futures contracts as disclosed on the Schedule of Investments. Only the period end variation margin is separately disclosed on the Statement of Assets and Liabilities. |
See accompanying notes which are an integral part of the financial statements.
Annual Report
Statement of Assets and Liabilities
Amounts in thousands (except per-share amount) | July 31, 2011 |
| | |
Assets | | |
Investment in securities, at value (including securities loaned of $150,185 and repurchase agreements of $165,514) - See accompanying schedule: Unaffiliated issuers (cost $1,316,049) | | $ 1,345,299 |
Cash | | 12 |
Receivable for investments sold | | 118,960 |
Receivable for fund shares sold | | 837 |
Interest receivable | | 5,094 |
Receivable for daily variation margin on futures contracts | | 82 |
Total assets | | 1,470,284 |
| | |
Liabilities | | |
Payable for investments purchased | $ 122,081 | |
Payable for fund shares redeemed | 3,242 | |
Distributions payable | 151 | |
Accrued management fee | 315 | |
Other affiliated payables | 136 | |
Other payables and accrued expenses | 1 | |
Collateral on securities loaned, at value | 152,907 | |
Total liabilities | | 278,833 |
| | |
Net Assets | | $ 1,191,451 |
Net Assets consist of: | | |
Paid in capital | | $ 1,151,276 |
Undistributed net investment income | | 534 |
Accumulated undistributed net realized gain (loss) on investments | | 10,108 |
Net unrealized appreciation (depreciation) on investments | | 29,533 |
Net Assets, for 108,566 shares outstanding | | $ 1,191,451 |
Net Asset Value, offering price and redemption price per share ($1,191,451 ÷ 108,566 shares) | | $ 10.97 |
See accompanying notes which are an integral part of the financial statements.
Annual Report
Statement of Operations
Amounts in thousands | Year ended July 31, 2011 |
| | |
Investment Income | | |
Interest | | $ 26,236 |
| | |
Expenses | | |
Management fee | $ 4,093 | |
Transfer agent fees | 1,297 | |
Fund wide operations fee | 444 | |
Independent trustees' compensation | 5 | |
Miscellaneous | 5 | |
Total expenses | | 5,844 |
Net investment income (loss) | | 20,392 |
Realized and Unrealized Gain (Loss) Net realized gain (loss) on: | | |
Investment securities: | | |
Unaffiliated issuers | 29,180 | |
Futures contracts | 226 | |
Total net realized gain (loss) | | 29,406 |
Change in net unrealized appreciation (depreciation) on: Investment securities | (14,155) | |
Futures contracts | 283 | |
Delayed delivery commitments | (1) | |
Total change in net unrealized appreciation (depreciation) | | (13,873) |
Net gain (loss) | | 15,533 |
Net increase (decrease) in net assets resulting from operations | | $ 35,925 |
See accompanying notes which are an integral part of the financial statements.
Annual Report
Financial Statements - continued
Statement of Changes in Net Assets
Amounts in thousands | Year ended
July 31,
2011 | Year ended
July 31,
2010 |
Increase (Decrease) in Net Assets | | |
Operations | | |
Net investment income (loss) | $ 20,392 | $ 29,126 |
Net realized gain (loss) | 29,406 | 26,348 |
Change in net unrealized appreciation (depreciation) | (13,873) | 29,967 |
Net increase (decrease) in net assets resulting
from operations | 35,925 | 85,441 |
Distributions to shareholders from net investment income | (20,486) | (28,870) |
Distributions to shareholders from net realized gain | (35,778) | (17,774) |
Total distributions | (56,264) | (46,644) |
Share transactions
Proceeds from sales of shares | 190,884 | 356,483 |
Reinvestment of distributions | 51,734 | 43,213 |
Cost of shares redeemed | (448,298) | (583,721) |
Net increase (decrease) in net assets resulting from share transactions | (205,680) | (184,025) |
Total increase (decrease) in net assets | (226,019) | (145,228) |
| | |
Net Assets | | |
Beginning of period | 1,417,470 | 1,562,698 |
End of period (including undistributed net investment income of $534 and undistributed net investment income of $676, respectively) | $ 1,191,451 | $ 1,417,470 |
Other Information Shares | | |
Sold | 17,484 | 32,895 |
Issued in reinvestment of distributions | 4,756 | 3,989 |
Redeemed | (41,337) | (53,973) |
Net increase (decrease) | (19,097) | (17,089) |
See accompanying notes which are an integral part of the financial statements.
Annual Report
Financial Highlights
Years ended July 31, | 2011 | 2010 | 2009 | 2008 | 2007 |
Selected Per-Share Data | | | | | |
Net asset value, beginning of period | $ 11.10 | $ 10.80 | $ 10.36 | $ 9.97 | $ 9.92 |
Income from Investment Operations | | | | | |
Net investment income (loss) B | .171 | .214 | .278 | .398 | .435 |
Net realized and unrealized gain (loss) | .155 | .423 | .439 | .413 | .067 |
Total from investment operations | .326 | .637 | .717 | .811 | .502 |
Distributions from net investment income | (.172) | (.212) | (.277) | (.421) | (.452) |
Distributions from net realized gain | (.284) | (.125) | - | - | - |
Total distributions | (.456) | (.337) | (.277) | (.421) | (.452) |
Net asset value, end of period | $ 10.97 | $ 11.10 | $ 10.80 | $ 10.36 | $ 9.97 |
Total Return A | 3.04% | 6.02% | 6.98% | 8.24% | 5.14% |
Ratios to Average Net Assets C | | | | | |
Expenses before reductions | .45% | .45% | .45% | .45% | .45% |
Expenses net of fee waivers, if any | .45% | .45% | .45% | .45% | .45% |
Expenses net of all reductions | .45% | .45% | .45% | .45% | .45% |
Net investment income (loss) | 1.57% | 1.98% | 2.59% | 3.86% | 4.36% |
Supplemental Data | | | | | |
Net assets, end of period (in millions) | $ 1,191 | $ 1,417 | $ 1,563 | $ 974 | $ 700 |
Portfolio turnover rate | 339% | 227% | 305% | 318% | 121% |
A Total returns would have been lower if certain expenses had not been reduced during the applicable periods shown.
B Calculated based on average shares outstanding during the period.
C Expense ratios reflect operating expenses of the Fund. Expenses before reductions do not reflect amounts reimbursed by the investment adviser or reductions from expense offset arrangements and do not represent the amount paid by the Fund during periods when reimbursements or reductions occur. Expenses net of fee waivers reflect expenses after reimbursement by the investment adviser but prior to reductions from expense offset arrangements. Expenses net of all reductions represent the net expenses paid by the Fund.
See accompanying notes which are an integral part of the financial statements.
Annual Report
Notes to Financial Statements
For the period ended July 31, 2011
(Amounts in thousands except ratios)
1. Organization.
Fidelity Intermediate Government Income Fund (the Fund) is a fund of Fidelity Income Fund (the Trust) and is authorized to issue an unlimited number of shares. The Trust is registered under the Investment Company Act of 1940, as amended (the 1940 Act), as an open-end management investment company organized as a Massachusetts business trust.
In May 2011, the Board of Trustees approved a change in the fiscal year end of the Fund from July 31 to August 31, effective August 31, 2011.
2. Significant Accounting Policies.
The financial statements have been prepared in conformity with accounting principles generally accepted in the United States of America (GAAP), which require management to make certain estimates and assumptions at the date of the financial statements. Actual results could differ from those estimates. Subsequent events, if any, through the date that the financial statements were issued have been evaluated in the preparation of the financial statements. The following summarizes the significant accounting policies of the Fund:
Security Valuation. Investments are valued as of 4:00 p.m. Eastern time on the last calendar day of the period. The Fund uses independent pricing services approved by the Board of Trustees to value its investments. When current market prices or quotations are not readily available or reliable, valuations may be determined in good faith in accordance with procedures adopted by the Board of Trustees. Factors used in determining value may include market or security specific events, changes in interest rates and credit quality. The frequency with which these procedures are used cannot be predicted and they may be utilized to a significant extent. The value used for net asset value (NAV) calculation under these procedures may differ from published prices for the same securities.
The Fund categorizes the inputs to valuation techniques used to value its investments into a disclosure hierarchy consisting of three levels as shown below:
Level 1 - quoted prices in active markets for identical investments
Level 2 - other significant observable inputs (including quoted prices for similar investments, interest rates, prepayment speeds, etc.)
Level 3 - unobservable inputs (including the Fund's own assumptions based on the best information available)
Annual Report
2. Significant Accounting Policies - continued
Security Valuation - continued
Changes in valuation techniques may result in transfers in or out of an assigned level within the disclosure hierarchy. The aggregate value of investments by input level, as of July 31, 2011 for the Fund's investments, as well as a roll forward of Level 3 securities, is included at the end of the Fund's Schedule of Investments. Valuation techniques used to value the Fund's investments by major category are as follows:
Debt securities, including restricted securities, are valued based on evaluated prices received from independent pricing services or from dealers who make markets in such securities. For foreign government and government agency obligations and U.S. government and government agency obligations, pricing services utilize matrix pricing which considers yield or price of bonds of comparable quality, coupon, maturity and type as well as dealer supplied prices and are generally categorized as Level 2 in the hierarchy. For collateralized mortgage obligations and U.S. government agency mortgage securities, pricing services utilize matrix pricing which considers prepayment speed assumptions, attributes of the collateral, yield or price of bonds of comparable quality, coupon, maturity and type as well as dealer supplied prices and, accordingly, such securities are generally categorized as Level 2 in the hierarchy. When independent prices are unavailable or unreliable, debt securities may be valued utilizing pricing matrices which consider similar factors that would be used by independent pricing services. These are generally categorized as Level 2 in the hierarchy but may be Level 3 depending on the circumstances.
Futures contracts are valued at the settlement price established each day by the board of trade or exchange on which they are traded and are categorized as Level 1 in the hierarchy. Short-term securities with remaining maturities of sixty days or less may be valued at amortized cost, which approximates fair value, and are categorized as Level 2 in the hierarchy.
Investment Transactions and Income. For financial reporting purposes, the Fund's investment holdings and NAV include trades executed through the end of the last business day of the period. The NAV per share for processing shareholder transactions is calculated as of the close of business of the New York Stock Exchange (NYSE), normally 4:00 p.m. Eastern time and includes trades executed through the end of the prior business day. Gains and losses on securities sold are determined on the basis of identified cost. Interest income is accrued as earned. Interest income includes coupon interest and amortization of premium and accretion of discount on debt securities. The principal value on inflation-indexed securities is periodically adjusted to the rate of inflation and interest is accrued based on the principal value. The adjustments to principal due to inflation are reflected as increases or decreases to interest income even though principal is not received until maturity.
Annual Report
Notes to Financial Statements - continued
(Amounts in thousands except ratios)
2. Significant Accounting Policies - continued
Expenses. Expenses directly attributable to a fund are charged to that fund. Expenses attributable to more than one fund are allocated among the respective funds on the basis of relative net assets or other appropriate methods. Expense estimates are accrued in the period to which they relate and adjustments are made when actual amounts are known.
Income Tax Information and Distributions to Shareholders. Each year, the Fund intends to qualify as a regulated investment company, including distributing substantially all of its taxable income and realized gains under Subchapter M of the Internal Revenue Code and filing its U.S. federal tax return. As a result, no provision for income taxes is required. As of July 31, 2011, the Fund did not have any unrecognized tax benefits in the financial statements. A fund's federal tax return is subject to examination by the Internal Revenue Service (IRS) for a period of three years.
Dividends are declared and recorded daily and paid monthly from net investment income. Distributions from realized gains, if any, are declared and recorded on the ex-dividend date. Income and capital gain distributions are determined in accordance with income tax regulations, which may differ from GAAP. In addition, the Fund claimed a portion of the payment made to redeeming shareholders as a distribution for income tax purposes.
Capital accounts within the financial statements are adjusted for permanent book-tax differences. These adjustments have no impact on net assets or the results of operations. Temporary book-tax differences will reverse in a subsequent period.
Book-tax differences are primarily due to futures transactions, market discount, deferred trustees compensation, certain losses related to deflation adjustments on U.S. Treasury inflation-indexed securities and losses deferred due to wash sales.
The federal tax cost of investment securities and unrealized appreciation (depreciation) as of period end were as follows:
Gross unrealized appreciation | $ 29,622 |
Gross unrealized depreciation | (292) |
Net unrealized appreciation (depreciation) on securities and other investments | $ 29,330 |
| |
Tax Cost | $ 1,315,969 |
The tax-based components of distributable earnings as of period end were as follows:
Undistributed ordinary income | $ 3,415 |
Undistributed long-term capital gain | $ 7,432 |
Net unrealized appreciation (depreciation) | $ 29,330 |
Annual Report
2. Significant Accounting Policies - continued
Income Tax Information and Distributions to Shareholders - continued
Under the recently enacted Regulated Investment Company Modernization Act of 2010 (the Act), the Fund will be permitted to carry forward capital losses incurred in taxable years beginning after December 22, 2010 for an unlimited period. However, any losses incurred during those future taxable years will be required to be utilized prior to any losses incurred in pre-enactment taxable years, which generally expire after eight years from when they are incurred. Additionally, post-enactment capital losses that are carried forward will retain their character as either short-term or long-term capital losses rather than being considered all short-term as under previous law. The Fund's first fiscal year end subject to the Act will be August 31, 2011.
The tax character of distributions paid was as follows:
| July 31, 2011 | July 31, 2010 |
Ordinary Income | $ 38,134 | $ 32,397 |
Long-term Capital Gains | 18,130 | 14,247 |
Total | $ 56,264 | $ 46,644 |
New Accounting Pronouncement. In May 2011, the Financial Accounting Standards Board (FASB) issued an update to Topic 860 - Transfers and Servicing. The update clarifies the assessment of effective control by removing the collateral provision requirement that the seller maintains at all times collateral sufficient to fund substantially all of the cost of purchasing replacement financial assets from others. This may result in a change in accounting treatment from purchases and sales to secured borrowings for certain mortgage dollar roll transactions, and therefore separate accounting of the income and expenses associated with the secured borrowings. This change would have no effect on the net assets or total return of the Fund. The update is effective for transactions entered into on or after December 15, 2011. Management is currently evaluating the potential impact of the update on the accounting for mortgage dollar roll transactions entered into by the Fund. Also in May 2011, the FASB issued Accounting Standard Update No. 2011-04, Fair Value Measurement (Topic 820) - Amendments to Achieve Common Fair Value Measurement and Disclosure Requirements in U.S. GAAP and IFRSs. The update changes the wording used to describe the requirements in GAAP for measuring fair value and for disclosing information about fair value measurements. The update is effective during interim and annual periods beginning after December 15, 2011. Management is currently evaluating the impact of the update's adoption on the Fund's financial statement disclosures
Annual Report
Notes to Financial Statements - continued
(Amounts in thousands except ratios)
3. Operating Policies.
Repurchase Agreements. Fidelity Management & Research Company (FMR) has received an Exemptive Order from the Securities and Exchange Commission (the SEC) which permits the Fund and other affiliated entities of FMR to transfer uninvested cash balances into joint trading accounts which are then invested in repurchase agreements. The Fund may also invest directly with institutions in repurchase agreements. Repurchase agreements are collateralized by government or non-government securities. Upon settlement date, collateral is held in segregated accounts with custodian banks and may be obtained in the event of a default of the counterparty. The Fund monitors, on a daily basis, the value of the collateral to ensure it is at least equal to the principal amount of the repurchase agreement (including accrued interest). In the event of a default by the counterparty, realization of the collateral proceeds could be delayed, during which time the value of the collateral may decline.
Restricted Securities. The Fund may invest in securities that are subject to legal or contractual restrictions on resale. These securities generally may be resold in transactions exempt from registration or to the public if the securities are registered. Disposal of these securities may involve time-consuming negotiations and expense, and prompt sale at an acceptable price may be difficult. Information regarding restricted securities is included at the end of the Fund's Schedule of Investments.
4. Derivative Instruments.
Risk Exposures and the Use of Derivative Instruments. The Fund used derivative instruments (derivatives), including futures contracts in order to meet its investment objectives. The strategy is to use derivatives to increase returns and to manage exposure to certain risks as defined below. The success of any strategy involving derivatives depends on analysis of numerous economic factors, and if the strategies for investment do not work as intended, the Fund may not achieve its objectives.
The Fund's use of derivatives increased or decreased its exposure to the following risk:
Interest Rate Risk | Interest rate risk relates to the fluctuations in the value of interest-bearing securities due to changes in the prevailing levels of market interest rates. |
The Fund is also exposed to additional risks from investing in derivatives, such as liquidity risk and counterparty credit risk. Liquidity risk is the risk that the Fund will be unable to sell the derivative in the open market in a timely manner. Counterparty credit risk is the risk that the counterparty will not be able to fulfill its obligation to the Fund. The Fund's maximum risk of loss from counterparty credit risk is generally the aggregate
Annual Report
4. Derivative Instruments - continued
Risk Exposures and the Use of Derivative Instruments - continued
unrealized appreciation and unpaid counterparty payments in excess of any collateral pledged by the counterparty to the Fund. Counterparty risk related to exchange-traded futures contracts is minimal because of the protection provided by the exchange on which they trade. Derivatives involve, to varying degrees, risk of loss in excess of the amounts recognized in the Statement of Assets and Liabilities.
Futures Contracts. A futures contract is an agreement between two parties to buy or sell a specified underlying instrument for a fixed price at a specified future date. The Fund used futures contracts to manage its exposure to the bond market and to fluctuations in interest rates.
Upon entering into a futures contract, a fund is required to deposit either cash or securities (initial margin) with a clearing broker in an amount equal to a certain percentage of the face value of the contract. Futures contracts are marked-to-market daily and subsequent payments (variation margin) are made or received by a fund depending on the daily fluctuations in the value of the futures contracts and are recorded as unrealized appreciation or (depreciation). This receivable and/or payable is included in daily variation margin on futures contracts in the Statement of Assets and Liabilities. Realized gain or (loss) is recorded upon the expiration or closing of a futures contract.
The underlying face amount at value of open futures contracts at period end is shown in the Schedule of Investments under the caption "Futures Contracts." This amount reflects each contract's exposure to the underlying instrument at period end and is representative of activity for the period. Securities deposited to meet initial margin requirements are identified in the Schedule of Investments.
Certain risks arise upon entering into futures contracts, including the risk that an illiquid market limits the ability to close out a futures contract prior to settlement date.
During the period the Fund recognized net realized gain (loss) of $226 and a change in net unrealized appreciation (depreciation) of $283 related to its investment in futures contracts. These amounts are included in the Statement of Operations.
5. Purchases and Sales of Investments.
Purchases and sales of securities, other than short-term securities and U.S. government securities, aggregated $13,386 and $1,933, respectively.
Annual Report
Notes to Financial Statements - continued
(Amounts in thousands except ratios)
6. Fees and Other Transactions with Affiliates.
Management Fee. FMR and its affiliates provide the Fund with investment management related services for which the Fund pays a monthly management fee. The management fee is the sum of an individual fund fee rate that is based on an annual rate of .20% of the Fund's average net assets and a group fee rate that averaged .12% during the period. The group fee rate is based upon the average net assets of all the mutual funds advised by FMR. The group fee rate decreases as assets under management increase and increases as assets under management decrease. For the period, the total annual management fee rate was .32% of the Fund's average net assets.
Transfer Agent Fees. Fidelity Investments Institutional Operations Company, Inc. (FIIOC), an affiliate of FMR, is the Fund's transfer, dividend disbursing and shareholder servicing agent. FIIOC receives an asset-based fee of .10% of the Fund's average net assets. FIIOC pays for typesetting, printing and mailing of shareholder reports, except proxy statements.
Fund Wide Operations Fee. Pursuant to the Fund Wide Operations and Expense Agreement (FWOE), FMR has agreed to provide for fund level expenses (which do not include transfer agent, compensation of the independent Trustees, interest (including commitment fees), taxes or extraordinary expenses, if any) in return for a FWOE fee equal to .35% less the total amount of the management fee. The FWOE paid by the Fund is reduced by an amount equal to the fees and expenses paid to the independent Trustees. For the period, the FWOE fee was equivalent to an annual rate of .03% of average net assets.
7. Committed Line of Credit.
The Fund participates with other funds managed by FMR or an affiliate in a $4.0 billion credit facility (the "line of credit") to be utilized for temporary or emergency purposes to fund shareholder redemptions or for other short-term liquidity purposes. The Fund has agreed to pay commitment fees on its pro-rata portion of the line of credit, which amounted to $4 and is reflected in Miscellaneous expenses on the Statement of Operations. During the period, there were no borrowings on this line of credit.
8. Security Lending.
The Fund lends portfolio securities from time to time in order to earn additional income. On the settlement date of the loan, the Fund receives collateral (in the form of U.S. Treasury obligations, letters of credit and/or cash) against the loaned securities and maintains collateral in an amount not less than 100% of the market value of the loaned securities during the period of the loan. The market value of the loaned securities is determined at the close of business of the Fund and any additional required collateral is delivered to the Fund on the next business day. If the borrower defaults on its obligation
Annual Report
8. Security Lending - continued
to return the securities loaned because of insolvency or other reasons, a fund could experience delays and costs in recovering the securities loaned or in gaining access to the collateral. Any cash collateral received is maintained at the Fund's custodian and/or invested in cash equivalents. The value of loaned securities and cash collateral at period end are disclosed on the Fund's Statement of Assets and Liabilities. Security lending income represents the income earned on investing cash collateral, less rebates paid to borrowers, plus any premium payments received for lending certain types of securities. Security lending income is presented in the Statement of Operations as a component of interest income. Total security lending income during the period amounted to $56.
9. Bank Borrowings.
The Fund is permitted to have bank borrowings for temporary or emergency purposes to fund shareholder redemptions or for other short-term liquidity requirements. The Fund has established borrowing arrangements with certain banks. The interest rate on the borrowings is the bank's base rate, as revised from time to time. The average daily loan balance during the period for which loans were outstanding amounted to $8,816. The weighted average interest rate was .68%. The interest expense amounted to three hundred and thirty-three dollars under the bank borrowing program. At period end, there were no bank borrowings outstanding.
10. Other.
The Fund's organizational documents provide former and current trustees and officers with a limited indemnification against liabilities arising in connection with the performance of their duties to the Fund. In the normal course of business, the Fund may also enter into contracts that provide general indemnifications. The Fund's maximum exposure under these arrangements is unknown as this would be dependent on future claims that may be made against the Fund. The risk of material loss from such claims is considered remote.
Annual Report
To the Trustees of Fidelity Income Fund and the Shareholders of Fidelity Intermediate Government Income Fund:
In our opinion, the accompanying statement of assets and liabilities, including the schedule of investments, and the related statements of operations and of changes in net assets and the financial highlights present fairly, in all material respects, the financial position of Fidelity Intermediate Government Income Fund (a fund of Fidelity Income Fund) at July 31, 2011, the results of its operations for the year then ended, the changes in its net assets for each of the two years in the period then ended and the financial highlights for each of the five years in the period then ended, in conformity with accounting principles generally accepted in the United States of America. These financial statements and financial highlights (hereafter referred to as "financial statements") are the responsibility of the Fidelity Intermediate Government Income Fund's management. Our responsibility is to express an opinion on these financial statements based on our audits. We conducted our audits of these financial statements in accordance with the standards of the Public Company Accounting Oversight Board (United States). Those standards require that we plan and perform the audit to obtain reasonable assurance about whether the financial statements are free of material misstatement. An audit includes examining, on a test basis, evidence supporting the amounts and disclosures in the financial statements, assessing the accounting principles used and significant estimates made by management, and evaluating the overall financial statement presentation. We believe that our audits, which included confirmation of securities at July 31, 2011 by correspondence with the custodian and brokers, provide a reasonable basis for our opinion.
/s/ PricewaterhouseCoopers LLP
PricewaterhouseCoopers LLP
Boston, Massachusetts
September 13, 2011
Annual Report
The Trustees and executive officers of the trust and fund, as applicable, are listed below. The Board of Trustees governs the fund and is responsible for protecting the interests of shareholders. The Trustees are experienced executives who meet periodically throughout the year to oversee the fund's activities, review contractual arrangements with companies that provide services to the fund, oversee management of the risks associated with such activities and contractual arrangements, and review the fund's performance. Except for James C. Curvey, each of the Trustees oversees 198 funds advised by FMR or an affiliate. Mr. Curvey oversees 419 funds advised by FMR or an affiliate.
The Trustees hold office without limit in time except that (a) any Trustee may resign; (b) any Trustee may be removed by written instrument, signed by at least two-thirds of the number of Trustees prior to such removal; (c) any Trustee who requests to be retired or who has become incapacitated by illness or injury may be retired by written instrument signed by a majority of the other Trustees; and (d) any Trustee may be removed at any special meeting of shareholders by a two-thirds vote of the outstanding voting securities of the trust. Each Trustee who is not an interested person (as defined in the 1940 Act) (Independent Trustee), shall retire not later than the last day of the calendar year in which his or her 75th birthday occurs. The Independent Trustees may waive this mandatory retirement age policy with respect to individual Trustees. The executive officers hold office without limit in time, except that any officer may resign or may be removed by a vote of a majority of the Trustees at any regular meeting or any special meeting of the Trustees. Except as indicated, each individual has held the office shown or other offices in the same company for the past five years.
Experience, Skills, Attributes, and Qualifications of the Fund's Trustees. The Governance and Nominating Committee has adopted a statement of policy that describes the experience, qualifications, attributes, and skills that are necessary and desirable for potential Independent Trustee candidates (Statement of Policy). The Board believes that each Trustee satisfied at the time he or she was initially elected or appointed a Trustee, and continues to satisfy, the standards contemplated by the Statement of Policy. The Governance and Nominating Committee also engages professional search firms to help identify potential Independent Trustee candidates who have the experience, qualifications, attributes, and skills consistent with the Statement of Policy. From time to time, additional criteria based on the composition and skills of the current Independent Trustees, as well as experience or skills that may be appropriate in light of future changes to board composition, business conditions, and regulatory or other developments, have also been considered by the professional search firms and the Governance and Nominating Committee. In addition, the Board takes into account the Trustees' commitment and participation in Board and committee meetings, as well as their leadership of standing and ad hoc committees throughout their tenure.
In determining that a particular Trustee was and continues to be qualified to serve as a Trustee, the Board has considered a variety of criteria, none of which, in isolation, was controlling. The Board believes that, collectively, the Trustees have balanced and diverse experience, qualifications, attributes, and skills, which allow the Board to operate effectively in governing the fund and protecting the interests of shareholders. Information about the specific experience, skills, attributes, and qualifications of each Trustee, which in each case led to the Board's conclusion that the Trustee should serve (or continue to serve) as a trustee of the fund, is provided below.
Annual Report
Board Structure and Oversight Function. Abigail P. Johnson is an interested person (as defined in the 1940 Act) and currently serves as Chairman. The Trustees have determined that an interested Chairman is appropriate and benefits shareholders because an interested Chairman has a personal and professional stake in the quality and continuity of services provided to the fund. Independent Trustees exercise their informed business judgment to appoint an individual of their choosing to serve as Chairman, regardless of whether the Trustee happens to be independent or a member of management. The Independent Trustees have determined that they can act independently and effectively without having an Independent Trustee serve as Chairman and that a key structural component for assuring that they are in a position to do so is for the Independent Trustees to constitute a substantial majority for the Board. The Independent Trustees also regularly meet in executive session. Kenneth L. Wolfe serves as Chairman of the Independent Trustees and as such (i) acts as a liaison between the Independent Trustees and management with respect to matters important to the Independent Trustees and (ii) with management prepares agendas for Board meetings.
Fidelity funds are overseen by different Boards of Trustees. The fund's Board oversees Fidelity's investment-grade bond, money market, and asset allocation funds and another Board oversees Fidelity's equity and high income funds. The asset allocation funds may invest in Fidelity funds that are overseen by such other Board. The use of separate Boards, each with its own committee structure, allows the Trustees of each group of Fidelity funds to focus on the unique issues of the funds they oversee, including common research, investment, and operational issues. On occasion, the separate Boards establish joint committees to address issues of overlapping consequences for the Fidelity funds overseen by each Board.
The Trustees operate using a system of committees to facilitate the timely and efficient consideration of all matters of importance to the Trustees, the fund, and fund shareholders and to facilitate compliance with legal and regulatory requirements and oversight of the fund's activities and associated risks. The Board, acting through its committees, has charged FMR and its affiliates with (i) identifying events or circumstances the occurrence of which could have demonstrably adverse effects on the fund's business and/or reputation; (ii) implementing processes and controls to lessen the possibility that such events or circumstances occur or to mitigate the effects of such events or circumstances if they do occur; and (iii) creating and maintaining a system designed to evaluate continuously business and market conditions in order to facilitate the identification and implementation processes described in (i) and (ii) above. Because the day-to-day operations and activities of the fund are carried out by or through FMR, its affiliates and other service providers, the fund's exposure to risks is mitigated but not eliminated by the processes overseen by the Trustees. While each of the Board's committees has responsibility for overseeing different aspects of the fund's activities, oversight is exercised primarily through the Operations and Audit Committees. Appropriate personnel, including but not limited to the fund's Chief Compliance Officer (CCO), FMR's internal auditor, the independent accountants, the fund's Treasurer and portfolio management personnel, make periodic reports to the Board's committees, as appropriate. The responsibilities of each committee, including their oversight responsibilities, are described further under "Standing Committees of the Fund's Trustees."
Annual Report
Trustees and Officers - continued
The fund's Statement of Additional Information (SAI) includes more information about the Trustees. To request a free copy, call Fidelity at 1-800-544-8544.
Interested Trustees*:
Correspondence intended for each Trustee who is an interested person may be sent to Fidelity Investments, 82 Devonshire Street, Boston, Massachusetts 02109.
Name, Age; Principal Occupations and Other Relevant Experience+ |
Abigail P. Johnson (49) |
| Year of Election or Appointment: 2009 Ms. Johnson is Trustee and Chairman of the Board of Trustees of certain Trusts. Ms. Johnson serves as President of Personal, Workplace and Institutional Services (2005-present). Ms. Johnson is Chairman and Director of FMR Co., Inc. (2011-present), Chairman and Director of FMR (2011-present), and the Vice Chairman and Director (2007-present) of FMR LLC. Previously, Ms. Johnson served as President and a Director of FMR (2001-2005), a Trustee of other investment companies advised by FMR, Fidelity Investments Money Management, Inc., and FMR Co., Inc. (2001-2005), Senior Vice President of the Fidelity funds (2001-2005), and managed a number of Fidelity funds. Ms. Abigail P. Johnson and Mr. Arthur E. Johnson are not related. |
James C. Curvey (76) |
| Year of Election or Appointment: 2007 Mr. Curvey also serves as Trustee (2007-present) of other investment companies advised by FMR. Mr. Curvey is a Director of Fidelity Investments Money Management, Inc. (2009-present), Director of Fidelity Research & Analysis Co. (2009-present) and Director of FMR and FMR Co., Inc. (2007-present). Mr. Curvey is also Vice Chairman (2007-present) and Director of FMR LLC. In addition, Mr. Curvey serves as an Overseer for the Boston Symphony Orchestra and a member of the Trustees of Villanova University. Previously, Mr. Curvey was the Vice Chairman (2006-2007) and Director (2000-2007) of FMR Corp. |
* Trustees have been determined to be "Interested Trustees" by virtue of, among other things, their affiliation with the trust or various entities under common control with FMR.
+ The information above includes each Trustee's principal occupation during the last five years and other information relating to the experience, attributes, and skills relevant to each Trustee's qualifications to serve as a Trustee, which led to the conclusion that each Trustee should serve as a Trustee for the fund.
Annual Report
Independent Trustees:
Correspondence intended for each Independent Trustee (that is, the Trustees other than the Interested Trustees) may be sent to Fidelity Investments, P.O. Box 55235, Boston, Massachusetts 02205-5235.
Name, Age; Principal Occupations and Other Relevant Experience+ |
Albert R. Gamper, Jr. (69) |
| Year of Election or Appointment: 2006 Mr. Gamper is Vice Chairman of the Independent Trustees of the Fixed Income and Asset Allocation Funds (2011-present). Prior to his retirement in December 2004, Mr. Gamper served as Chairman of the Board of CIT Group Inc. (commercial finance). During his tenure with CIT Group Inc. Mr. Gamper served in numerous senior management positions, including Chairman (1987-1989; 1999-2001; 2002-2004), Chief Executive Officer (1987-2004), and President (2002-2003). He also served as President and Chief Executive Officer of Tyco Capital Corporation (2001-2002). Mr. Gamper currently serves as a member of the Board of Directors of Public Service Enterprise Group (utilities, 2000-present), a member of the Board of Trustees, Rutgers University (2004-present), and Chairman of the Board of Saint Barnabas Health Care System. Previously, Mr. Gamper served as Chairman of the Board of Governors, Rutgers University (2004-2007). |
Robert F. Gartland (59) |
| Year of Election or Appointment: 2010 Mr. Gartland is a partner and investor of Vietnam Partners LLC (investments and consulting, 2008-present) and is Chairman and an investor in Gartland and Mellina Group Corp. (consulting, 2009-present). Prior to his retirement, Mr. Gartland held a variety of positions at Morgan Stanley (financial services, 1979-2007) including Managing Director (1987-2007). |
Arthur E. Johnson (64) |
| Year of Election or Appointment: 2008 Mr. Johnson serves as a member of the Board of Directors of Eaton Corporation (diversified power management, 2009-present) and AGL Resources, Inc. (holding company). Prior to his retirement, Mr. Johnson served as Senior Vice President of Corporate Strategic Development of Lockheed Martin Corporation (defense contractor, 1999-2009). He previously served on the Board of Directors of IKON Office Solutions, Inc. (1999-2008) and Delta Airlines (2005-2007). Mr. Arthur E. Johnson and Ms. Abigail P. Johnson are not related. |
Michael E. Kenneally (57) |
| Year of Election or Appointment: 2009 Previously, Mr. Kenneally served as a Member of the Advisory Board for certain Fidelity Fixed Income and Asset Allocation Funds (2008-2009). Prior to his retirement, Mr. Kenneally served as Chairman and Global Chief Executive Officer of Credit Suisse Asset Management (2003-2005). Mr. Kenneally was a Director of the Credit Suisse Funds (U.S. mutual funds, 2004-2008) and certain other closed-end funds (2004-2005) and was awarded the Chartered Financial Analyst (CFA) designation in 1991. |
James H. Keyes (70) |
| Year of Election or Appointment: 2007 Mr. Keyes serves as a member of the Boards of Navistar International Corporation (manufacture and sale of trucks, buses, and diesel engines, since 2002) and Pitney Bowes, Inc. (integrated mail, messaging, and document management solutions, since 1998). Prior to his retirement, Mr. Keyes served as Chairman and Chief Executive Officer of Johnson Controls (automotive, building, and energy, 1998-2002) and as a member of the Board of LSI Logic Corporation (semiconductor technologies, 1984-2008). |
Marie L. Knowles (64) |
| Year of Election or Appointment: 2001 Prior to Ms. Knowles' retirement in June 2000, she served as Executive Vice President and Chief Financial Officer of Atlantic Richfield Company (ARCO) (diversified energy, 1996-2000). From 1993 to 1996, she was a Senior Vice President of ARCO and President of ARCO Transportation Company. She served as a Director of ARCO from 1996 to 1998. Ms. Knowles currently serves as a Director and Chairman of the Audit Committee of McKesson Corporation (healthcare service, since 2002). Ms. Knowles is an Honorary Trustee of the Brookings Institution and a member of the Board of the Catalina Island Conservancy and of the Santa Catalina Island Company (2009-present). She also serves as a member of the Advisory Board for the School of Engineering of the University of Southern California and the Foundation Board of the School of Architecture at the University of Virginia (2007-present). Previously, Ms. Knowles served as a Director of Phelps Dodge Corporation (copper mining and manufacturing, 1994-2007). |
Kenneth L. Wolfe (72) |
| Year of Election or Appointment: 2005 Mr. Wolfe is Chairman of the Independent Trustees of the Fixed Income and Asset Allocation Funds (2008-present). Prior to his retirement, Mr. Wolfe served as Chairman and a Director (2007-2009) and Chairman and Chief Executive Officer (1994-2001) of Hershey Foods Corporation. He also served as a member of the Boards of Adelphia Communications Corporation (telecommunications, 2003-2006), Bausch & Lomb, Inc. (medical/pharmaceutical, 1993-2007), and Revlon, Inc. (personal care products, 2004-2009). |
+ The information above includes each Trustee's principal occupation during the last five years and other information relating to the experience, attributes, and skills relevant to each Trustee's qualifications to serve as a Trustee, which led to the conclusion that each Trustee should serve as a Trustee for the fund.
Annual Report
Trustees and Officers - continued
Executive Officers:
Correspondence intended for each executive officer may be sent to Fidelity Investments, 82 Devonshire Street, Boston, Massachusetts 02109.
Name, Age; Principal Occupation |
John R. Hebble (53) |
| Year of Election or Appointment: 2008 President and Treasurer of Fidelity's Fixed Income and Asset Allocation Funds. Mr. Hebble also serves as President (2011-present), Treasurer, and Chief Financial Officer of The North Carolina Capital Management Trust: Cash and Term Portfolios (2008-present), Assistant Treasurer of other Fidelity funds (2009-present) and is an employee of Fidelity Investments. |
Christopher P. Sullivan (57) |
| Year of Election or Appointment: 2009 Vice President of Fidelity's Bond Funds. Mr. Sullivan also serves as President of Fidelity's Bond Division (2009-present). Mr. Sullivan is Executive Vice President of Fidelity Investments Money Management, Inc. (2009-present), and a Director of Fidelity Management & Research (U.K.) Inc. (2010-present). Previously, Mr. Sullivan served as Managing Director, Co-Head of U.S. Fixed Income at Goldman Sachs Asset Management (2001-2009). |
Christine J. Thompson (53) |
| Year of Election or Appointment: 2010 Vice President of Fidelity's Bond Funds. Ms. Thompson also serves as Chief Investment Officer of FMR's Bond Group (2010-present) and is an employee of Fidelity Investments. Previously, Ms. Thompson served as Director of Municipal Bond Portfolio Managers (2002-2010). |
Scott C. Goebel (43) |
| Year of Election or Appointment: 2008 Secretary and Chief Legal Officer (CLO) of the Fidelity funds. Mr. Goebel also serves as Secretary of Fidelity Investments Money Management, Inc. (FIMM) (2010-present) and Fidelity Research and Analysis Company (FRAC) (2010-present); Secretary and CLO of The North Carolina Capital Management Trust: Cash and Term Portfolios (2008-present); General Counsel, Secretary, and Senior Vice President of FMR (2008-present) and FMR Co., Inc. (2008-present); employed by FMR LLC or an affiliate (2001-present); Chief Legal Officer of Fidelity Management & Research (Hong Kong) Limited (2008-present) and Assistant Secretary of Fidelity Management & Research (Japan) Inc. (2008-present), and Fidelity Management & Research (U.K.) Inc. (2008-present). Previously, Mr. Goebel served as Assistant Secretary of FIMM (2008-2010), FRAC (2008-2010), and the Funds (2007-2008) and as Vice President and Secretary of Fidelity Distributors Corporation (FDC) (2005-2007). |
David J. Carter (38) |
| Year of Election or Appointment: 2010 Assistant Secretary of Fidelity's Fixed Income and Asset Allocation Funds. Mr. Carter also serves as Vice President, Associate General Counsel (2010-present) and is an employee of Fidelity Investments (2005-present). |
Holly C. Laurent (57) |
| Year of Election or Appointment: 2008 Anti-Money Laundering (AML) Officer of the Fidelity funds. Ms. Laurent also serves as AML Officer of The North Carolina Capital Management Trust: Cash and Term Portfolios (2008-present) and is an employee of Fidelity Investments. Previously, Ms. Laurent was Senior Vice President and Head of Legal for Fidelity Business Services India Pvt. Ltd. (2006-2008), and Senior Vice President, Deputy General Counsel and Group Head for FMR LLC (2005-2006). |
Christine Reynolds (52) |
| Year of Election or Appointment: 2008 Chief Financial Officer of the Fidelity funds. Ms. Reynolds became President of Fidelity Pricing and Cash Management Services (FPCMS) in August 2008. Ms. Reynolds served as Chief Operating Officer of FPCMS (2007-2008). Previously, Ms. Reynolds served as President, Treasurer, and Anti-Money Laundering officer of the Fidelity funds (2004-2007). |
Michael H. Whitaker (44) |
| Year of Election or Appointment: 2008 Chief Compliance Officer of Fidelity's Fixed Income and Asset Allocation Funds. Mr. Whitaker also serves as Chief Compliance Officer of The North Carolina Capital Management Trust: Cash and Term Portfolios (2008-present). Mr. Whitaker is an employee of Fidelity Investments (2007-present). Prior to joining Fidelity Investments, Mr. Whitaker worked at MFS Investment Management where he served as Senior Vice President and Chief Compliance Officer (2004-2006), and Assistant General Counsel. |
Jeffrey S. Christian (49) |
| Year of Election or Appointment: 2009 Deputy Treasurer of the Fidelity funds. Mr. Christian is an employee of Fidelity Investments. Previously, Mr. Christian served as Chief Financial Officer (2008-2009) of certain Fidelity funds and Senior Vice President of Fidelity Pricing and Cash Management Services (FPCMS) (2004-2009). |
Bryan A. Mehrmann (50) |
| Year of Election or Appointment: 2005 Deputy Treasurer of the Fidelity funds. Mr. Mehrmann is an employee of Fidelity Investments. |
Stephanie J. Dorsey (42) |
| Year of Election or Appointment: 2008 Deputy Treasurer of Fidelity's Fixed Income and Asset Allocation Funds. Ms. Dorsey also serves as Assistant Treasurer of other Fidelity funds (2010-present) and is an employee of Fidelity Investments (2008-present). Previously, Ms. Dorsey served as Treasurer (2004-2008) of the JPMorgan Mutual Funds and Vice President (2004-2008) of JPMorgan Chase Bank. |
Adrien E. Deberghes (43) |
| Year of Election or Appointment: 2010 Assistant Treasurer of Fidelity's Fixed Income and Asset Allocation Funds. Mr. Deberghes also serves as Deputy Treasurer of other Fidelity funds (2008-present) and is an employee of Fidelity Investments (2008-present). Previously, Mr. Deberghes served as Senior Vice President of Mutual Fund Administration at State Street Corporation (2007-2008), Senior Director of Mutual Fund Administration at Investors Bank & Trust (2005-2007), and Director of Finance for Dunkin' Brands (2000-2005). |
Kenneth B. Robins (41) |
| Year of Election or Appointment: 2009 Assistant Treasurer of the Fidelity Fixed Income and Asset Allocation Funds. Mr. Robins also serves as President and Treasurer of other Fidelity funds (2008-present; 2010-present) and is an employee of Fidelity Investments (2004-present). Previously, Mr. Robins served as Deputy Treasurer of the Fidelity funds (2005-2008) and Treasurer and Chief Financial Officer of The North Carolina Capital Management Trust: Cash and Term Portfolios (2006-2008). |
Gary W. Ryan (52) |
| Year of Election or Appointment: 2005 Assistant Treasurer of the Fidelity funds. Mr. Ryan is an employee of Fidelity Investments. Previously, Mr. Ryan served as Vice President of Fund Reporting in Fidelity Pricing and Cash Management Services (FPCMS) (1999-2005). |
Jonathan Davis (43) |
| Year of Election or Appointment: 2010 Assistant Treasurer of the Fidelity funds. Mr. Davis is an employee of Fidelity Investments. Previously, Mr. Davis served as Vice President and Associate General Counsel of FMR LLC (2003-2010). |
Annual Report
The fund hereby designates as a capital gain dividend with respect to the taxable year ended July 31, 2011, $16,571,416, or, if subsequently determined to be different, the net capital gain of such year.
A total of 69.63% of the dividends distributed during the fiscal year was derived from interest on U.S. Government securities which is generally exempt from state income tax.
The fund designates $10,958,546 of distributions paid during the period January 1, 2011 to July 31, 2011 as qualifying to be taxed as interest-related dividends for nonresident alien shareholders.
The fund will notify shareholders in January 2012 of amounts for use in preparing 2011 income tax returns.
Annual Report
Managing Your Investments
Fidelity offers several ways to conveniently manage your personal investments via your telephone or PC. You can access your account information, conduct trades and research your investments 24 hours a day.
By Phone
Fidelity Automated Service Telephone provides a single toll-free number to access account balances, positions, quotes and trading. It's easy to navigate the service, and on your first call, the system will help you create a personal identification number (PIN) for security.
(phone_graphic)
Fidelity Automated
Service Telephone (FAST®)
1-800-544-5555
Press
For mutual fund and brokerage trading.
For quotes.*
For account balances and holdings.
To review orders and mutual
fund activity.
To change your PIN.
To speak to a Fidelity representative.
By PC
Fidelity's web site on the Internet provides a wide range of information, including daily financial news, fund performance, interactive planning tools and news about Fidelity products and services.
(computer_graphic)
Fidelity's Web Site
www.fidelity.com
* When you call the quotes line, please remember that a fund's yield and return will vary and, except for money market funds, share price will also vary. This means that you may have a gain or loss when you sell your shares. There is no assurance that money market funds will be able to maintain a stable $1 share price; an investment in a money market fund is not insured or guaranteed by the U.S. government. Total returns are historical and include changes in share price, reinvestment of dividends and capital gains distributions, and the effects of any sales charges.
Annual Report
To Visit Fidelity
For directions and hours,
please call 1-800-544-9797.
Arizona
7001 West Ray Road
Chandler, AZ
15445 N. Scottsdale Road
Scottsdale, AZ
17550 North 75th Avenue
Glendale, AZ
5330 E. Broadway Blvd
Tucson, AZ
California
815 East Birch Street
Brea, CA
1411 Chapin Avenue
Burlingame, CA
851 East Hamilton Avenue
Campbell, CA
601 Larkspur Landing Circle
Larkspur, CA
2000 Avenue of the Stars
Los Angeles, CA
27101 Puerta Real
Mission Viejo, CA
73575 El Paseo
Palm Desert, CA
251 University Avenue
Palo Alto, CA
123 South Lake Avenue
Pasadena, CA
16656 Bernardo Ctr. Drive
Rancho Bernardo, CA
1220 Roseville Parkway
Roseville, CA
1740 Arden Way
Sacramento, CA
7676 Hazard Center Drive
San Diego, CA
11943 El Camino Real
San Diego, CA
8 Montgomery Street
San Francisco, CA
3793 State Street
Santa Barbara, CA
1200 Wilshire Boulevard
Santa Monica, CA
398 West El Camino Real
Sunnyvale, CA
111 South Westlake Blvd
Thousand Oaks, CA
21701 Hawthorne Boulevard
Torrance, CA
2001 North Main Street
Walnut Creek, CA
6326 Canoga Avenue
Woodland Hills, CA
2211 Michelson Drive
Irvine, CA
Colorado
281 East Flatiron Circle
Broomfield, CO
1625 Broadway
Denver, CO
9185 Westview Road
Lone Tree, CO
Connecticut
48 West Putnam Avenue
Greenwich, CT
265 Church Street
New Haven, CT
300 Atlantic Street
Stamford, CT
29 South Main Street
West Hartford, CT
1261 Post Road
Fairfield, CT
Delaware
400 Delaware Avenue
Wilmington, DE
Florida
175 East Altamonte Drive
Altamonte Springs, FL
1400 Glades Road
Boca Raton, FL
121 Alhambra Plaza
Coral Gables, FL
2948 N. Federal Highway
Ft. Lauderdale, FL
4671 Town Center Parkway
Jacksonville, FL
8880 Tamiami Trail, North
Naples, FL
230 Royal Palm Way
Palm Beach, FL
3501 PGA Boulevard
Palm Beach Gardens, FL
3550 Tamiami Trail, South
Sarasota, FL
1502 N. Westshore Blvd.
Tampa, FL
2465 State Road 7
Wellington, FL
Georgia
3242 Peachtree Road
Atlanta, GA
1000 Abernathy Road
Atlanta, GA
Illinois
One North LaSalle Street
Chicago, IL
401 North Michigan Avenue
Chicago, IL
One Skokie Valley Road
Highland Park, IL
1415 West 22nd Street
Oak Brook, IL
15105 S LaGrange Road
Orland Park, IL
1572 East Golf Road
Schaumburg, IL
1823 Freedom Drive
Naperville, IL
Indiana
8480 Keystone Crossing
Indianapolis, IN
Kansas
5400 College Boulevard
Overland Park, KS
Maine
Three Canal Plaza
Portland, ME
Maryland
7315 Wisconsin Avenue
Bethesda, MD
610 York Road
Towson, MD
Massachusetts
801 Boylston Street
Boston, MA
155 Congress Street
Boston, MA
300 Granite Street
Braintree, MA
44 Mall Road
Burlington, MA
238 Main Street
Cambridge, MA
200 Endicott Street
Danvers, MA
Annual Report
405 Cochituate Road
Framingham, MA
551 Boston Turnpike
Shrewsbury, MA
Michigan
500 E. Eisenhower Pkwy.
Ann Arbor, MI
280 N. Old Woodward Ave.
Birmingham, MI
30200 Northwestern Hwy.
Farmington Hills, MI
43420 Grand River Avenue
Novi, MI
3480 28th Street
Grand Rapids, MI
2425 S. Linden Road STE E
Flint, MI
Minnesota
7740 France Avenue South
Edina, MN
8342 3rd Street North
Oakdale, MN
Missouri
1524 South Lindbergh Blvd.
St. Louis, MO
Nevada
2225 Village Walk Drive
Henderson, NV
New Jersey
501 Route 73 South
Marlton, NJ
150 Essex Street
Millburn, NJ
35 Morris Street
Morristown, NJ
396 Route 17, North
Paramus, NJ
3518 Route 1 North
Princeton, NJ
530 Broad Street
Shrewsbury, NJ
New Mexico
2261 Q Street NE
Albuquerque, NM
New York
1130 Franklin Avenue
Garden City, NY
37 West Jericho Turnpike
Huntington Station, NY
1271 Avenue of the Americas
New York, NY
980 Madison Avenue
New York, NY
61 Broadway
New York, NY
350 Park Avenue
New York, NY
200 Fifth Avenue
New York, NY
733 Third Avenue
New York, NY
2070 Broadway
New York, NY
1075 Northern Blvd.
Roslyn, NY
799 Central Park Avenue
Scarsdale, NY
3349 Monroe Avenue
Rochester, NY
North Carolina
4611 Sharon Road
Charlotte, NC
7011 Fayetteville Road
Durham, NC
Ohio
3805 Edwards Road
Cincinnati, OH
1324 Polaris Parkway
Columbus, OH
1800 Crocker Road
Westlake, OH
28699 Chagrin Boulevard
Woodmere Village, OH
Oregon
7493 SW Bridgeport Road
Tigard, OR
Pennsylvania
600 West DeKalb Pike
King of Prussia, PA
1735 Market Street
Philadelphia, PA
12001 Perry Highway
Wexford, PA
Rhode Island
10 Memorial Boulevard
Providence, RI
Tennessee
3018 Peoples Street
Johnson City, TN
7628 West Farmington Blvd.
Germantown, TN
2035 Mallory Lane
Franklin, TN
Texas
10000 Research Boulevard
Austin, TX
4001 Northwest Parkway
Dallas, TX
12532 Memorial Drive
Houston, TX
2701 Drexel Drive
Houston, TX
6560 Fannin Street
Houston, TX
1701 Lake Robbins Drive
The Woodlands, TX
6500 N. MacArthur Blvd.
Irving, TX
6005 West Park Boulevard
Plano, TX
1576 East Southlake Blvd.
Southlake, TX
15600 Southwest Freeway
Sugar Land, TX
139 N. Loop 1604 East
San Antonio, TX
Utah
279 West South Temple
Salt Lake City, UT
Virginia
1861 International Drive
McLean, VA
11957 Democracy Drive
Reston, VA
Washington
10500 NE 8th Street
Bellevue, WA
1518 6th Avenue
Seattle, WA
304 Strander Blvd
Tukwila, WA
Washington, DC
1900 K Street, N.W.
Washington, DC
Wisconsin
16020 West Bluemound Road
Brookfield, WI
Fidelity Brokerage Services, Inc., 100 Summer St., Boston, MA 02110 Member NYSE/SIPC
Annual Report
Investment Adviser
Fidelity Management & Research Company
Boston, MA
Investment Sub-Advisers
Fidelity Management & Research (U.K.) Inc.
Fidelity Investments
Money Management, Inc.
Fidelity Management & Research
(Hong Kong) Limited
Fidelity Management & Research
(Japan) Inc.
General Distributor
Fidelity Distributors Corporation
Boston, MA
Transfer and Service Agents
Fidelity Investments Institutional
Operations Company, Inc.
Boston, MA
Fidelity Service Company, Inc.
Boston, MA
Custodian
The Bank of New York Mellon
New York, NY
The Fidelity Telephone Connection
Mutual Fund 24-Hour Service
Exchanges/Redemptions
and Account Assistance 1-800-544-6666
Product Information 1-800-544-6666
Retirement Accounts 1-800-544-4774
(8 a.m. - 9 p.m.)
TDD Service 1-800-544-0118
for the deaf and hearing impaired
(9 a.m. - 9 p.m. Eastern time)
Fidelity Automated Service
Telephone (FAST®)
1-800-544-5555
Automated line for quickest service
SLM-UANN-0911
1.844592.104
Fidelity®
Government Income
Fund
Annual Report
July 31, 2011
(2_fidelity_logos) (Registered_Trademark)
Contents
Chairman's Message | <Click Here> | The Chairman's message to shareholders. |
Performance | <Click Here> | How the fund has done over time. |
Management's Discussion of Fund Performance | <Click Here> | The Portfolio Manager's review of fund performance and strategy. |
Shareholder Expense Example | <Click Here> | An example of shareholder expenses. |
Investment Changes | <Click Here> | A summary of major shifts in the fund's investments over the past six months. |
Investments | <Click Here> | A complete list of the fund's investments with their market values. |
Financial Statements | <Click Here> | Statements of assets and liabilities, operations, and changes in net assets, as well as financial highlights. |
Notes | <Click Here> | Notes to the financial statements. |
Report of Independent Registered Public Accounting Firm | <Click Here> | |
Trustees and Officers | <Click Here> | |
Distributions | <Click Here> | |
To view a fund's proxy voting guidelines and proxy voting record for the 12-month period ended June 30, visit http://www.fidelity.com/proxyvotingresults or visit the Securities and Exchange Commission's (SEC) web site at http://www.sec.gov. You may also call 1-800-544-8544 to request a free copy of the proxy voting guidelines.
Standard & Poor's, S&P and S&P 500 are registered service marks of The McGraw-Hill Companies, Inc. and have been licensed for use by Fidelity Distributors Corporation.
Other third party marks appearing herein are the property of their respective owners.
All other marks appearing herein are registered or unregistered trademarks or service marks of FMR LLC or an affiliated company.
Annual Report
This report and the financial statements contained herein are submitted for the general information of the shareholders of the fund. This report is not authorized for distribution to prospective investors in the fund unless preceded or accompanied by an effective prospectus.
A fund files its complete schedule of portfolio holdings with the SEC for the first and third quarters of each fiscal year on Form N-Q. Forms N-Q are available on the SEC's web site at http://www.sec.gov. A fund's Forms N-Q may be reviewed and copied at the SEC's Public Reference Room in Washington, DC. Information regarding the operation of the SEC's Public Reference Room may be obtained by calling 1-800-SEC-0330. For a complete list of a fund's portfolio holdings, view the most recent holdings listing, semiannual report, or annual report on Fidelity's web site at http://www.fidelity.com, http://www.advisor.fidelity.com, or http://www.401k.com, as applicable.
NOT FDIC INSURED • MAY LOSE VALUE • NO BANK GUARANTEE
Neither the fund nor Fidelity Distributors Corporation is a bank.
Annual Report
(photo_of_Abigail_P_Johnson)
Dear Shareholder:
The second half of 2011 began with U.S. equities continuing to give back some of the gains achieved earlier in the year. In the days leading up to July 31, markets were shaken by a political stalemate in which Congress struggled to address the debt ceiling issue before an early-August deadline. The resulting uncertainty held back markets in July, the third consecutive monthly decline for equities, effectively reversing the positive momentum seen through the end of April. Financial markets are always unpredictable, of course, but there are several time-tested investment principles that can help put the odds in your favor.
One of the basic tenets is to invest for the long term. Over time, riding out the markets' inevitable ups and downs has proven much more effective than selling into panic or chasing the hottest trend. Even missing only a few of the markets' best days can significantly diminish investor returns. Patience also affords the benefits of compounding - of earning interest on additional income or reinvested dividends and capital gains. There can be tax advantages and cost benefits to consider as well. While staying the course doesn't eliminate risk, it can considerably lessen the effect of short-term declines.
You can further manage your investing risk through diversification. And today, more than ever, geographic diversification should be taken into account. Studies indicate that asset allocation is the single most important determinant of a portfolio's long-term success. The right mix of stocks, bonds and cash - aligned to your particular risk tolerance and investment objective - is very important. Age-appropriate rebalancing is also an essential aspect of asset allocation. For younger investors, an emphasis on equities - which historically have been the best-performing asset class over time - is encouraged. As investors near their specific goal, such as retirement or sending a child to college, consideration may be given to replacing volatile assets (e.g. common stocks) with more-stable fixed investments (bonds or savings plans).
A third principle - investing regularly - can help lower the average cost of your purchases. Investing a certain amount of money each month or quarter helps ensure you won't pay for all your shares at market highs. This strategy - known as dollar cost averaging - also reduces "emotion" from investing, helping shareholders avoid selling weak performers just prior to an upswing, or chasing a hot performer just before a correction.
We invite you to contact us via the Internet, through our Investor Centers or by phone. It is our privilege to provide you the information you need to make the investments that are right for you.
Sincerely,
(The chairman's signature appears here.)
Abigail P. Johnson
Annual Report
Average annual total return reflects the change in the value of an investment, assuming reinvestment of the class' distributions from dividend income and capital gains (the profits earned upon the sale of securities that have grown in value, if any) and assuming a constant rate of performance each year. The $10,000 table and the fund's returns do not reflect the deduction of taxes that a shareholder would pay on fund distributions or the redemption of fund shares. During periods of reimbursement by Fidelity, a fund's total return will be greater than it would be had the reimbursement not occurred. How a fund did yesterday is no guarantee of how it will do tomorrow.
Average Annual Total Returns
Periods ended July 31, 2011 | Past 1
year | Past 5
years | Past 10
years |
Fidelity® Government Income Fund | 3.27% | 6.37% | 5.33% |
$10,000 Over 10 Years
Let's say hypothetically that $10,000 was invested in Fidelity Government Income Fund, a class of the fund, on July 31, 2001. The chart shows how the value of your investment would have changed, and also shows how the Barclays Capital U.S. Government Bond Index performed over the same period.
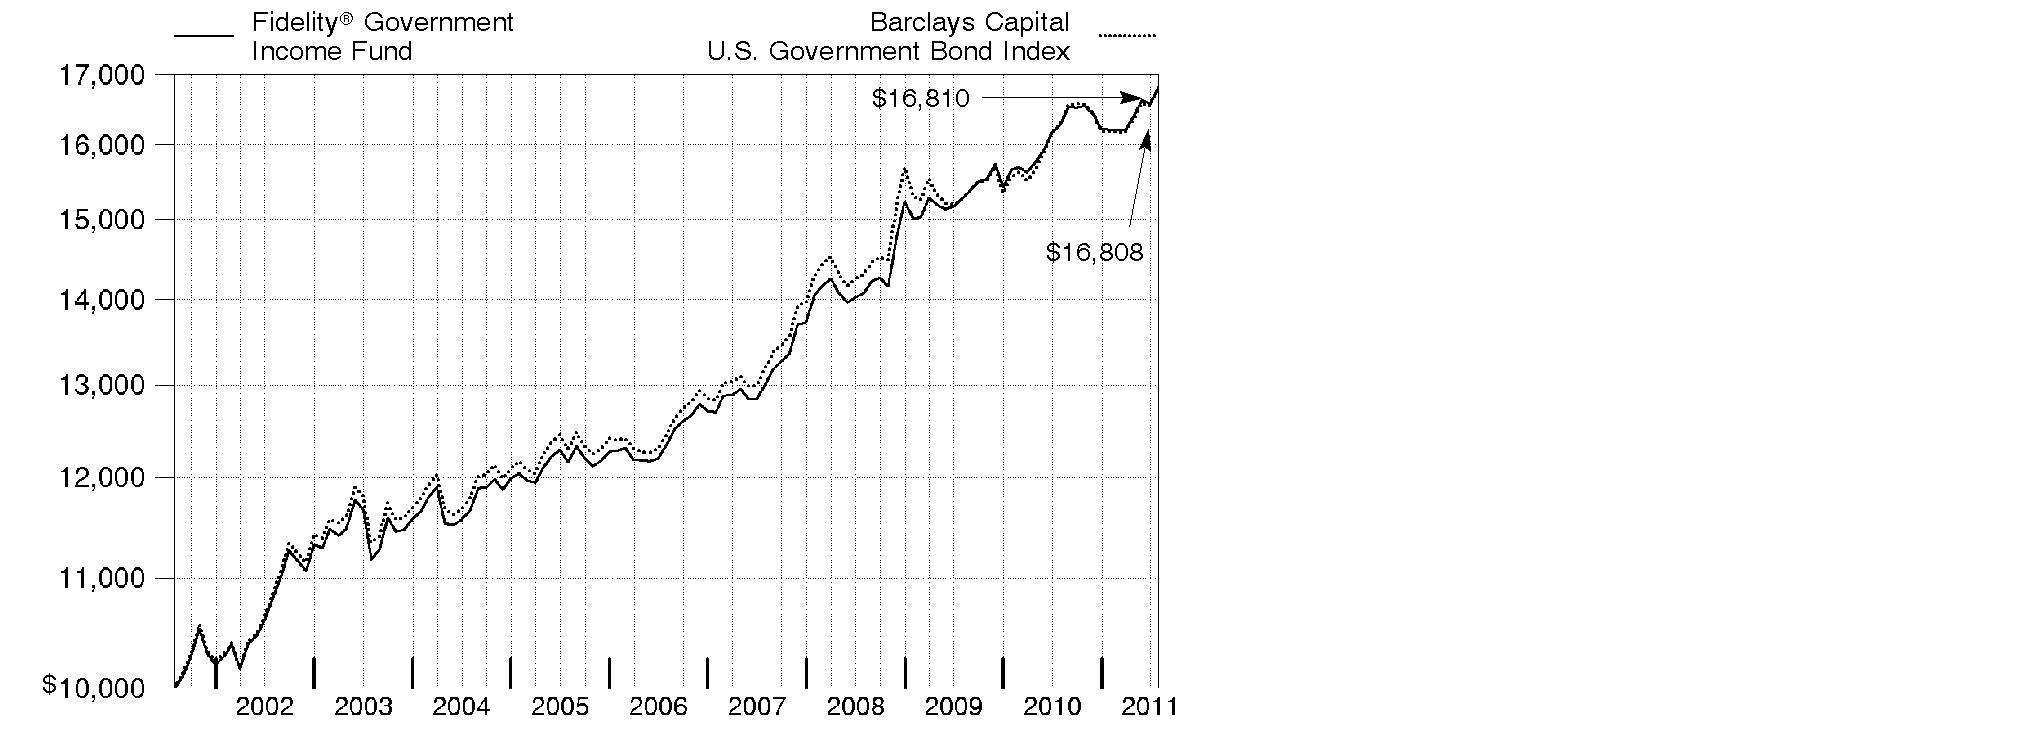
Annual Report
Market Recap: Amid ultra-low interest rates and heightened market volatility, U.S. taxable investment-grade bonds generated solid results for the year ending July 31, 2011, as evidenced by the 4.44% advance of the Barclays Capital® U.S. Aggregate Bond Index. The best-performing categories within the index were those on the riskier end of the spectrum that benefited during intervals when data pointed to an improving economy. Buoyed by a strong first-half showing, commercial mortgage-backed securities (CMBS) fared best, gaining 10.01% amid modest improvement in commercial real estate fundamentals. Corporate bonds rose 6.70%, due in large part to increased corporate profitability, high cash balances, reduced debt levels and improved credit conditions. Residential mortgage-backed securities, supported by a combination of strong demand from yield-hungry investors and slower prepayment rates, rose a solid 3.85%. Meanwhile, U.S. Treasury and agency securities gained 3.39% and 2.53%, respectively. These securities, which lagged in the first half of the period, when economic data was strong and inflation worries were muted, performed comparatively well in the second half amid signs of a weakening economic recovery and heightened concern about the sovereign debt crisis in Europe.
Comments from William Irving, Lead Portfolio Manager of Fidelity® Government Income Fund: For the year, the fund's Retail Class shares returned 3.27%, while the Barclays Capital® 75% U.S. Government/25% U.S. MBS Blended Index rose 3.41%. Emphasizing sectors with a yield advantage over conventional Treasuries helped bolster the fund's performance. Specifically, out-of-benchmark exposure to strong-performing Treasury Inflation-Protected Securities (TIPS), which we ultimately eliminated by the end of the period, and favorable positioning within the mortgage sector aided results. The fund gained from both an overweighting and good security selection within mortgages. Specifically, emphasizing prepayment-resistant securities worked in our favor during the period's first half. We also modestly benefited from owning collateralized mortgage obligation (CMO) floaters. Detracting from performance was out-of-index exposure to reverse mortgage securities, which lagged, and ineffective yield-curve positioning.
Note to shareholders: Effective August 1, 2011, the fund will have the ability to invest in agency MBS indirectly through Fidelity Mortgage Backed Securities Central Fund. In connection with this change, the fund's fiscal year end will shift from July 31 to August 31 to align it with that of the central fund.
The views expressed above reflect those of the portfolio manager(s) only through the end of the period as stated on the cover of this report and do not necessarily represent the views of Fidelity or any other person in the Fidelity organization. Any such views are subject to change at any time based upon market or other conditions and Fidelity disclaims any responsibility to update such views. These views may not be relied on as investment advice and, because investment decisions for a Fidelity fund are based on numerous factors, may not be relied on as an indication of trading intent on behalf of any Fidelity fund.
Annual Report
Shareholder Expense Example
As a shareholder of the Fund, you incur two types of costs: (1) transaction costs, including sales charges (loads) on purchase payments or redemption proceeds, and (2) ongoing costs, including management fees, distribution and/or service (12b-1) fees and other Fund expenses. This Example is intended to help you understand your ongoing costs (in dollars) of investing in the Fund and to compare these costs with the ongoing costs of investing in other mutual funds.
The Example is based on an investment of $1,000 invested at the beginning of the period and held for the entire period (February 1, 2011 to July 31, 2011).
Actual Expenses
The first line of the accompanying table for each class of the Fund provides information about actual account values and actual expenses. You may use the information in this line, together with the amount you invested, to estimate the expenses that you paid over the period. Simply divide your account value by $1,000.00 (for example, an $8,600 account value divided by $1,000.00 = 8.6), then multiply the result by the number in the first line for a class of the Fund under the heading entitled "Expenses Paid During Period" to estimate the expenses you paid on your account during this period. A small balance maintenance fee of $12.00 that is charged once a year may apply for certain accounts with a value of less than $2,000. This fee is not included in the table below. If it was, the estimate of expenses you paid during the period would be higher, and your ending account value lower, by this amount.
Hypothetical Example for Comparison Purposes
The second line of the accompanying table for each class of the Fund provides information about hypothetical account values and hypothetical expenses based on a Class' actual expense ratio and an assumed rate of return of 5% per year before expenses, which is not the Class' actual return. The hypothetical account values and expenses may not be used to estimate the actual ending account balance or expenses you paid for the period. You may use this information to compare the ongoing costs of investing in the Fund and other funds. To do so, compare this 5% hypothetical example with the 5% hypothetical examples that appear in the shareholder reports of the other funds. A small balance maintenance fee of $12.00 that is charged once a year may apply for certain accounts with a value of less than $2,000. This fee is not included in the table below. If it was, the estimate of expenses you paid during the period would be higher, and your ending account value lower, by this amount.
Please note that the expenses shown in the table are meant to highlight your ongoing costs only and do not reflect any transaction costs. Therefore, the second line of the table is useful in comparing ongoing costs only, and will not help you determine the relative total costs of owning different funds. In addition, if these transactional costs were included, your costs would have been higher.
Annual Report
Shareholder Expense Example - continued
| Annualized
Expense Ratio | Beginning
Account Value
February 1, 2011 | Ending
Account Value
July 31, 2011 | Expenses Paid
During Period*
February 1, 2011
to July 31, 2011 |
Class A | .78% | | | |
Actual | | $ 1,000.00 | $ 1,035.30 | $ 3.94 |
Hypothetical A | | $ 1,000.00 | $ 1,020.93 | $ 3.91 |
Class T | .76% | | | |
Actual | | $ 1,000.00 | $ 1,035.40 | $ 3.84 |
HypotheticalA | | $ 1,000.00 | $ 1,021.03 | $ 3.81 |
Class B | 1.51% | | | |
Actual | | $ 1,000.00 | $ 1,031.60 | $ 7.61 |
HypotheticalA | | $ 1,000.00 | $ 1,017.31 | $ 7.55 |
Class C | 1.53% | | | |
Actual | | $ 1,000.00 | $ 1,031.50 | $ 7.71 |
HypotheticalA | | $ 1,000.00 | $ 1,017.21 | $ 7.65 |
Government Income | .45% | | | |
Actual | | $ 1,000.00 | $ 1,037.00 | $ 2.27 |
HypotheticalA | | $ 1,000.00 | $ 1,022.56 | $ 2.26 |
Institutional Class | .52% | | | |
Actual | | $ 1,000.00 | $ 1,036.60 | $ 2.63 |
HypotheticalA | | $ 1,000.00 | $ 1,022.22 | $ 2.61 |
A 5% return per year before expenses
* Expenses are equal to each Class' annualized expense ratio, multiplied by the average account value over the period, multiplied by 181/365 (to reflect the one-half year period).
Annual Report
Investment Changes (Unaudited)
Coupon Distribution as of July 31, 2011 |
| % of fund's investments | % of fund's investments
6 months ago |
Zero coupon bonds | 1.9 | 1.3 |
0.01 - 0.99% | 14.8 | 8.9 |
1 - 1.99% | 14.2 | 15.3 |
2 - 2.99% | 9.8 | 12.7 |
3 - 3.99% | 6.9 | 15.1 |
4 - 4.99% | 19.8 | 14.9 |
5 - 5.99% | 14.8 | 16.2 |
6 - 6.99% | 4.3 | 7.6 |
7% and over | 0.7 | 4.0 |
Coupon distribution shows the range of stated interest rates on the fund's investments, excluding short-term investments. |
Weighted Average Maturity as of July 31, 2011 |
| | 6 months ago |
Years | 5.3 | 6.0 |
This is a weighted average of all the maturities of the securities held in a fund. Weighted Average Maturity (WAM) can be used as a measure of sensitivity to interest rate changes and markets changes. Generally, the longer the maturity, the greater the sensitivity to such changes. WAM is based on the dollar-weighted average length of time until principal payments must be paid. Depending on the types of securities held in a fund, certain maturity shortening devices (e.g., demand features, interest rate resets, and call options) may be taken into account when calculating the WAM. |
Duration as of July 31, 2011 |
| | 6 months ago |
Years | 4.7 | 4.5 |
Duration estimates how much a bond fund's price will change with a change in comparable interest rates. If rates rise 1%, for example, a fund with a 5-year duration is likely to lose about 5% of its value. Other factors also can influence a bond fund's performance and share price. Accordingly, a bond fund's actual performance may differ from this example. Duration takes into account any call or put option embedded in the bonds. |
Asset Allocation (% of fund's net assets) |
As of July 31, 2011 * | As of January 31, 2011 ** |
| Mortgage
Securities 29.6% | | | Mortgage
Securities 39.6% | |
 | CMOs and Other Mortgage Related Securities 10.2% | | | CMOs and Other Mortgage Related Securities 9.3% | |
 | U.S. Treasury
Obligations 47.2% | |  | U.S. Treasury
Obligations 48.6% | |
| U.S. Government
Agency
Obligations† 13.0% | | | U.S. Government
Agency
Obligations† 16.4% | |
 | Foreign Government
& Government
Agency Obligations 1.5% | |  | Foreign Government
& Government
Agency Obligations 1.4% | |
| Short-Term
Investments and
Net Other
Assets*** (1.5)% | |  | Short-Term
Investments and
Net Other
Assets*** (15.3)% | |
* Futures and Swaps | 2.9% | | ** Futures and Swaps | (2.5)% | |
† Includes FDIC Guaranteed Corporate Securities and NCUA Guaranteed Notes. | |
*** Short-Term Investments and Net Other Assets are not included in the pie chart. | |

Annual Report
Investments July 31, 2011
Showing Percentage of Net Assets
U.S. Government and Government Agency Obligations - 60.2% |
| Principal Amount (000s) | | Value (000s) |
U.S. Government Agency Obligations - 6.5% |
Fannie Mae: | | | | |
0.375% 12/28/12 | | $ 50,670 | | $ 50,692 |
0.75% 12/18/13 | | 7,805 | | 7,819 |
1.125% 6/27/14 | | 16,915 | | 17,098 |
4.75% 11/19/12 | | 2,000 | | 2,113 |
Federal Home Loan Bank: | | | | |
0.5% 8/28/13 | | 91,450 | | 91,447 |
0.875% 8/22/12 | | 8,580 | | 8,627 |
Freddie Mac 1% 8/27/14 | | 15,111 | | 15,189 |
Overseas Private Investment Corp. U.S. Government guaranteed participation certificates 6.77% 11/15/13 | | 2,558 | | 2,712 |
Private Export Funding Corp. secured: | | | | |
4.974% 8/15/13 | | 22,940 | | 24,937 |
5.66% 9/15/11 (c) | | 18,000 | | 18,112 |
5.685% 5/15/12 | | 24,035 | | 25,046 |
Small Business Administration guaranteed development participation certificates: | | | | |
Series 2002-20J Class 1, 4.75% 10/1/22 | | 3,859 | | 4,133 |
Series 2002-20K Class 1, 5.08% 11/1/22 | | 8,140 | | 8,791 |
Series 2003-P10B, Class 1 5.136% 8/10/13 | | 2,114 | | 2,235 |
Series 2004-20H Class 1, 5.17% 8/1/24 | | 2,445 | | 2,654 |
Tennessee Valley Authority: | | | | |
3.875% 2/15/21 | | 33,790 | | 35,714 |
5.25% 9/15/39 | | 12,000 | | 13,135 |
5.375% 4/1/56 | | 8,429 | | 9,377 |
TOTAL U.S. GOVERNMENT AGENCY OBLIGATIONS | | 339,831 |
U.S. Treasury Obligations - 47.2% |
U.S. Treasury Bonds: | | | | |
4.375% 2/15/38 | | 14,154 | | 14,809 |
4.375% 5/15/41 | | 176,866 | | 183,803 |
5% 5/15/37 (g) | | 55,700 | | 64,281 |
5.25% 2/15/29 | | 34,950 | | 41,913 |
6.125% 11/15/27 | | 27,365 | | 35,904 |
6.125% 8/15/29 | | 2,877 | | 3,797 |
8% 11/15/21 | | 14,605 | | 21,364 |
9.875% 11/15/15 | | 10,285 | | 14,110 |
U.S. Treasury Notes: | | | | |
0.375% 6/30/13 (b) | | 249,596 | | 249,693 |
0.5% 5/31/13 | | 51,764 | | 51,908 |
0.625% 7/15/14 (b) | | 310,712 | | 311,489 |
U.S. Government and Government Agency Obligations - continued |
| Principal Amount (000s) | | Value (000s) |
U.S. Treasury Obligations - continued |
U.S. Treasury Notes: - continued | | | | |
0.75% 6/15/14 | | $ 91,489 | | $ 92,089 |
1% 4/30/12 | | 602 | | 605 |
1.25% 8/31/15 | | 500 | | 506 |
1.25% 10/31/15 | | 29,580 | | 29,843 |
1.375% 11/15/12 | | 79,743 | | 80,858 |
1.5% 7/31/16 | | 315,993 | | 318,192 |
1.75% 7/31/15 | | 28,800 | | 29,738 |
1.875% 8/31/17 | | 47,000 | | 47,290 |
1.875% 9/30/17 | | 87,400 | | 87,748 |
2.125% 5/31/15 | | 18,669 | | 19,572 |
2.25% 7/31/18 | | 260,091 | | 262,631 |
2.375% 8/31/14 | | 20,000 | | 21,091 |
2.375% 9/30/14 | | 13,017 | | 13,733 |
2.375% 10/31/14 | | 77,497 | | 81,814 |
2.5% 6/30/17 | | 10,000 | | 10,450 |
2.625% 7/31/14 (h) | | 83,808 | | 88,974 |
2.75% 11/30/16 | | 18,530 | | 19,740 |
3.125% 1/31/17 | | 60,773 | | 65,858 |
3.125% 5/15/21 | | 71,904 | | 73,904 |
3.625% 8/15/19 | | 33,225 | | 36,340 |
4% 2/15/15 | | 12,619 | | 14,062 |
4.25% 11/15/17 | | 27,475 | | 31,502 |
4.5% 5/15/17 | | 24,685 | | 28,619 |
4.75% 8/15/17 | | 12,983 | | 15,258 |
TOTAL U.S. TREASURY OBLIGATIONS | | 2,463,488 |
Other Government Related - 6.5% |
Bank of America Corp.: | | | | |
2.1% 4/30/12 (FDIC Guaranteed) (d) | | 6,060 | | 6,143 |
3.125% 6/15/12 (FDIC Guaranteed) (d) | | 3,719 | | 3,810 |
Citibank NA: | | | | |
1.875% 5/7/12 (FDIC Guaranteed) (d) | | 87,150 | | 88,209 |
1.875% 6/4/12 (FDIC Guaranteed) (d) | | 33,000 | | 33,436 |
Citigroup Funding, Inc.: | | | | |
1.875% 10/22/12 (FDIC Guaranteed) (d) | | 40,500 | | 41,262 |
1.875% 11/15/12 (FDIC Guaranteed) (d) | | 18,920 | | 19,278 |
2% 3/30/12 (FDIC Guaranteed) (d) | | 16,000 | | 16,199 |
2.125% 7/12/12 (FDIC Guaranteed) (d) | | 8,784 | | 8,939 |
General Electric Capital Corp.: | | | | |
2% 9/28/12 (FDIC Guaranteed) (d) | | 11,000 | | 11,208 |
U.S. Government and Government Agency Obligations - continued |
| Principal Amount (000s) | | Value (000s) |
Other Government Related - continued |
General Electric Capital Corp.: - continued | | | | |
2.625% 12/28/12 (FDIC Guaranteed) (d) | | $ 16,154 | | $ 16,690 |
3% 12/9/11 (FDIC Guaranteed) (d) | | 4,720 | | 4,767 |
GMAC, Inc. 1.75% 10/30/12 (FDIC Guaranteed) (d) | | 51,106 | | 51,960 |
Goldman Sachs Group, Inc. 3.25% 6/15/12 (FDIC Guaranteed) (d) | | 3,714 | | 3,808 |
JPMorgan Chase & Co.: | | | | |
2.2% 6/15/12 (FDIC Guaranteed) (d) | | 9,200 | | 9,354 |
3.125% 12/1/11 (FDIC Guaranteed) (d) | | 790 | | 798 |
National Credit Union Administration Guaranteed Notes: | | | | |
Series 2010-A1 Class A, 0.5351% 12/7/20 (NCUA Guaranteed) (i) | | 11,813 | | 11,846 |
Series 2011-R4 Class 1A, 0.5698% 3/6/20 (NCUA Guaranteed) (i) | | 12,418 | | 12,424 |
TOTAL OTHER GOVERNMENT RELATED | | 340,131 |
TOTAL U.S. GOVERNMENT AND GOVERNMENT AGENCY OBLIGATIONS (Cost $3,073,941) | 3,143,450 |
U.S. Government Agency - Mortgage Securities - 29.6% |
|
Fannie Mae - 18.5% |
1.975% 10/1/33 (i) | | 300 | | 311 |
2.01% 2/1/33 (i) | | 309 | | 320 |
2.035% 12/1/34 (i) | | 352 | | 364 |
2.035% 3/1/35 (i) | | 283 | | 294 |
2.054% 10/1/33 (i) | | 148 | | 155 |
2.065% 7/1/35 (i) | | 139 | | 145 |
2.175% 3/1/35 (i) | | 58 | | 61 |
2.297% 11/1/33 (i) | | 827 | | 858 |
2.457% 3/1/35 (i) | | 179 | | 189 |
2.509% 2/1/36 (i) | | 696 | | 734 |
2.534% 7/1/34 (i) | | 173 | | 180 |
2.534% 7/1/35 (i) | | 584 | | 613 |
2.543% 6/1/36 (i) | | 249 | | 261 |
2.554% 10/1/33 (i) | | 254 | | 268 |
2.584% 11/1/36 (i) | | 209 | | 220 |
2.603% 5/1/36 (i) | | 465 | | 488 |
3.47% 3/1/40 (i) | | 11,245 | | 11,778 |
U.S. Government Agency - Mortgage Securities - continued |
| Principal Amount (000s) | | Value (000s) |
Fannie Mae - continued |
3.5% 12/1/25 to 2/1/41 | | $ 116,319 | | $ 115,900 |
3.688% 5/1/40 (i) | | 6,190 | | 6,498 |
3.698% 5/1/40 (i) | | 7,335 | | 7,703 |
3.791% 6/1/40 (i) | | 6,350 | | 6,679 |
3.972% 11/1/39 (i) | | 5,571 | | 5,883 |
4% 9/1/13 to 7/1/41 | | 85,281 | | 87,238 |
4.5% 6/1/25 to 7/1/41 | | 150,438 | | 157,250 |
4.5% 8/1/26 (e) | | 1,000 | | 1,063 |
4.5% 8/1/41 (e)(f) | | 40,000 | | 41,746 |
4.5% 8/1/41 (e)(f) | | 16,000 | | 16,698 |
4.5% 8/1/41 (e)(f) | | 60,000 | | 62,618 |
4.5% 9/1/41 (e) | | 84,000 | | 87,399 |
5% 2/1/16 to 9/1/40 | | 110,024 | | 118,062 |
5% 8/1/41 (e)(f) | | 23,000 | | 24,557 |
5% 9/1/41 (e) | | 23,000 | | 24,478 |
5.5% 10/1/20 to 3/1/39 | | 71,278 | | 77,677 |
5.746% 3/1/36 (i) | | 2,209 | | 2,347 |
5.963% 3/1/37 (i) | | 595 | | 645 |
6% 3/1/17 to 9/1/39 | | 33,519 | | 36,658 |
6% 8/1/41 (e)(f) | | 15,000 | | 16,494 |
6% 8/1/41 (e)(f) | | 15,000 | | 16,494 |
6% 8/1/41 (e)(f) | | 9,300 | | 10,227 |
6% 8/1/41 (e)(f) | | 8,000 | | 8,797 |
6% 9/1/41 (e) | | 1,300 | | 1,426 |
6.5% 2/1/12 to 4/1/37 | | 8,432 | | 9,282 |
7% 7/1/13 to 7/1/32 | | 2,629 | | 2,983 |
7.5% 11/1/11 to 4/1/29 | | 16 | | 18 |
8.5% 1/1/15 to 7/1/31 | | 213 | | 235 |
9% 5/1/14 | | 137 | | 142 |
9.5% 4/1/16 to 10/1/20 | | 274 | | 320 |
11.25% 5/1/14 | | 2 | | 2 |
11.5% 6/15/19 to 1/15/21 | | 281 | | 305 |
12.5% 8/1/15 to 3/1/16 | | 1 | | 1 |
| | 965,064 |
Freddie Mac - 4.4% |
1.945% 3/1/35 (i) | | 1,061 | | 1,095 |
2.046% 5/1/37 (i) | | 628 | | 654 |
2.615% 6/1/35 (i) | | 770 | | 814 |
2.654% 2/1/36 (i) | | 122 | | 128 |
2.942% 3/1/33 (i) | | 57 | | 61 |
2.995% 7/1/35 (i) | | 1,865 | | 1,987 |
U.S. Government Agency - Mortgage Securities - continued |
| Principal Amount (000s) | | Value (000s) |
Freddie Mac - continued |
3.282% 10/1/35 (i) | | $ 345 | | $ 368 |
3.801% 4/1/40 (i) | | 5,941 | | 6,221 |
4% 7/1/39 to 1/1/41 | | 8,777 | | 8,938 |
4% 8/1/41 (e) | | 5,000 | | 5,077 |
4.5% 7/1/25 to 4/1/41 | | 38,846 | | 40,609 |
4.5% 8/1/41 (e)(f) | | 6,100 | | 6,359 |
4.5% 9/1/41 (e) | | 2,000 | | 2,078 |
4.5% 9/1/41 (e) | | 4,100 | | 4,259 |
5% 8/1/35 to 4/1/41 | | 24,975 | | 26,745 |
5% 8/1/41 (e) | | 1,000 | | 1,066 |
5.138% 4/1/35 (i) | | 291 | | 310 |
5.292% 7/1/36 (i) | | 827 | | 872 |
5.5% 12/1/27 to 5/1/40 | | 62,560 | | 67,851 |
5.5% 8/1/41 (e)(f) | | 4,700 | | 5,089 |
5.5% 8/1/41 (e)(f) | | 4,800 | | 5,198 |
5.5% 9/1/41 (e) | | 9,500 | | 10,263 |
6% 7/1/16 to 7/1/37 | | 12,128 | | 13,221 |
6.5% 1/1/13 to 3/1/36 | | 19,149 | | 21,124 |
7.5% 9/1/11 to 7/1/16 | | 613 | | 662 |
8.5% 5/1/17 to 9/1/29 | | 118 | | 136 |
9% 9/1/14 to 10/1/20 | | 20 | | 21 |
9.5% 5/1/17 to 8/1/21 | | 119 | | 136 |
9.75% 8/1/14 | | 81 | | 89 |
10% 11/15/18 to 8/1/21 | | 8 | | 9 |
11% 5/1/14 | | 25 | | 27 |
12% 3/1/15 | | 1 | | 1 |
12.5% 2/1/14 to 6/1/19 | | 4 | | 4 |
13% 6/1/14 to 6/1/15 | | 1 | | 2 |
| | 231,474 |
Ginnie Mae - 6.7% |
3.5% 12/15/40 to 2/15/41 | | 19,398 | | 19,290 |
4% 1/15/25 to 10/20/25 | | 32,471 | | 34,454 |
4% 8/1/41 (e) | | 7,900 | | 8,153 |
4.5% 3/15/39 to 7/20/41 | | 87,696 | | 93,627 |
4.5% 8/1/41 (e) | | 1,000 | | 1,063 |
4.5% 8/1/41 (e) | | 10,000 | | 10,656 |
5% 9/20/33 to 12/15/40 | | 61,801 | | 67,779 |
5% 8/1/41 (e) | | 7,000 | | 7,631 |
5% 8/1/41 (e) | | 7,000 | | 7,631 |
5.492% 4/20/60 (l) | | 23,123 | | 25,626 |
5.493% 11/20/59 (l) | | 27,948 | | 30,777 |
U.S. Government Agency - Mortgage Securities - continued |
| Principal Amount (000s) | | Value (000s) |
Ginnie Mae - continued |
5.5% 12/15/38 to 3/15/39 | | $ 522 | | $ 579 |
5.513% 2/20/60 (l) | | 25,090 | | 27,833 |
6% 11/20/31 to 11/20/33 | | 10,075 | | 11,279 |
6.5% 3/20/31 to 10/15/35 | | 1,274 | | 1,439 |
7% 10/15/26 to 8/15/32 | | 72 | | 83 |
7.5% 3/15/28 to 8/15/29 | | 65 | | 75 |
8% 7/15/19 to 12/15/23 | | 733 | | 841 |
8.5% 1/15/25 | | 1 | | 1 |
9.5% 2/15/25 | | 1 | | 1 |
10.5% 4/15/14 to 1/20/18 | | 46 | | 54 |
| | 348,872 |
TOTAL U.S. GOVERNMENT AGENCY - MORTGAGE SECURITIES (Cost $1,510,263) | 1,545,410 |
Collateralized Mortgage Obligations - 10.2% |
|
U.S. Government Agency - 10.2% |
Fannie Mae: | | | | |
planned amortization class: | | | | |
Series 1992-168 Class KB, 7% 10/25/22 | | 673 | | 758 |
Series 1993-207 Class H, 6.5% 11/25/23 | | 10,287 | | 11,714 |
Series 1993-240 Class PD, 6.25% 12/25/13 | | 1,007 | | 1,050 |
Series 1994-23 Class PZ, 6% 2/25/24 | | 12,776 | | 15,204 |
Series 1996-28 Class PK, 6.5% 7/25/25 | | 2,000 | | 2,260 |
Series 2003-28 Class KG, 5.5% 4/25/23 | | 4,940 | | 5,541 |
Series 2006-45 Class OP, 6/25/36 (k) | | 3,768 | | 3,334 |
Series 2006-62 Class KP, 4/25/36 (k) | | 8,461 | | 7,093 |
Series 2010-118 Class PB, 4.5% 10/25/40 | | 7,053 | | 7,376 |
sequential payer: | | | | |
Series 1997-41 Class J, 7.5% 6/18/27 | | 1,482 | | 1,706 |
Series 2007-113 Class DB, 4.5% 12/25/22 | | 12,440 | | 13,810 |
Series 2007-115 Class BE, 4.5% 12/25/22 | | 15,400 | | 17,051 |
Series 2009-14 Class EB, 4.5% 3/25/24 | | 7,840 | | 8,627 |
Series 2010-97 Class CX, 4.5% 9/25/25 | | 10,813 | | 11,606 |
Series 2007-113 Class JD, 4.5% 12/25/22 | | 12,766 | | 14,146 |
Series 2010-109 Class IM, 5.5% 9/25/40 (j) | | 22,193 | | 4,333 |
Series 2010-114 Class CI, 5% 4/25/18 (j) | | 16,764 | | 1,794 |
Series 2010-37 Class GI, 5% 4/25/25 (j) | | 3,153 | | 320 |
Series 2010-97 Class CI, 4.5% 8/25/25 (j) | | 14,172 | | 1,609 |
Fannie Mae Stripped Mortgage-Backed Securities: | | | | |
sequential payer Series 377 Class 1, 10/1/36 (k) | | 10,519 | | 9,095 |
Collateralized Mortgage Obligations - continued |
| Principal Amount (000s) | | Value (000s) |
U.S. Government Agency - continued |
Fannie Mae Stripped Mortgage-Backed Securities: - continued | | | | |
Series 384 Class 6, 5% 7/25/37 (j) | | $ 11,934 | | $ 2,112 |
Fannie Mae subordinate REMIC pass-thru certificates: | | | | |
floater: | | | | |
Series 2001-38 Class QF, 1.1673% 8/25/31 (i) | | 350 | | 356 |
Series 2002-49 Class FB, 0.7865% 11/18/31 (i) | | 449 | | 451 |
Series 2002-60 Class FV, 1.1873% 4/25/32 (i) | | 189 | | 193 |
Series 2002-75 Class FA, 1.1873% 11/25/32 (i) | | 387 | | 395 |
Series 2008-76 Class EF, 0.6873% 9/25/23 (i) | | 5,380 | | 5,386 |
planned amortization class: | | | | |
Series 2003-113 Class PE, 4% 11/25/18 | | 7,545 | | 8,108 |
Series 2004-21 Class QE, 4.5% 11/25/32 | | 1,500 | | 1,634 |
Series 2005-102 Class CO, 11/25/35 (k) | | 3,818 | | 3,466 |
Series 2005-81 Class PC, 5.5% 9/25/35 | | 2,150 | | 2,459 |
Series 2006-12 Class BO, 10/25/35 (k) | | 16,901 | | 15,694 |
Series 2006-37 Class OW, 5/25/36 (k) | | 4,208 | | 3,574 |
sequential payer: | | | | |
Series 1999-25 Class Z, 6% 6/25/29 | | 2,967 | | 3,301 |
Series 2002-79 Class Z, 5.5% 11/25/22 | | 6,885 | | 7,564 |
Series 2005-117, Class JN, 4.5% 1/25/36 | | 645 | | 677 |
Series 2005-47 Class HK, 4.5% 6/25/20 | | 7,798 | | 8,575 |
Series 2006-72 Class CY, 6% 8/25/26 | | 10,215 | | 11,694 |
Series 2008-27 Class KB, 4.5% 4/25/23 | | 4,420 | | 4,898 |
Series 2009-85 Class IB, 4.5% 8/25/24 (j) | | 3,654 | | 404 |
Series 2009-93 Class IC, 4.5% 9/25/24 (j) | | 6,985 | | 744 |
Series 2010-139 Class NI, 4.5% 2/25/40 (j) | | 12,384 | | 2,322 |
Freddie Mac planned amortization class Series 2115 Class PE, 6% 1/15/14 | | 193 | | 201 |
Freddie Mac Manufactured Housing participation certificates guaranteed floater Series 1686 Class FA, 1.0875% 2/15/24 (i) | | 1,017 | | 1,035 |
Freddie Mac Multi-class participation certificates guaranteed: | | | | |
floater: | | | | |
Series 2530 Class FE, 0.7865% 2/15/32 (i) | | 254 | | 256 |
Series 2630 Class FL, 0.6865% 6/15/18 (i) | | 442 | | 446 |
Series 3008 Class SM, 0% 7/15/35 (i) | | 125 | | 121 |
planned amortization class: | | | | |
Series 1141 Class G, 9% 9/15/21 | | 191 | | 219 |
Series 2006-15 Class OP, 3/25/36 (k) | | 5,143 | | 4,316 |
Series 2356 Class GD, 6% 9/15/16 | | 198 | | 214 |
Collateralized Mortgage Obligations - continued |
| Principal Amount (000s) | | Value (000s) |
U.S. Government Agency - continued |
Freddie Mac Multi-class participation certificates guaranteed: - continued | | | | |
planned amortization class: | | | | |
Series 2376 Class JE, 5.5% 11/15/16 | | $ 1,369 | | $ 1,472 |
Series 2381 Class OG, 5.5% 11/15/16 | | 910 | | 975 |
Series 2628 Class OE, 4.5% 6/15/18 | | 6,815 | | 7,335 |
Series 2640 Class GE, 4.5% 7/15/18 | | 7,310 | | 7,897 |
Series 2672 Class MG, 5% 9/15/23 | | 7,120 | | 7,987 |
Series 2682 Class LD, 4.5% 10/15/33 | | 777 | | 820 |
Series 2802 Class OB, 6% 5/15/34 | | 10,455 | | 12,065 |
Series 2810 Class PD, 6% 6/15/33 | | 668 | | 704 |
Series 2937 Class KC, 4.5% 2/15/20 | | 19,686 | | 21,555 |
Series 2962 Class BE, 4.5% 4/15/20 | | 15,015 | | 16,558 |
Series 3110 Class OP, 9/15/35 (k) | | 10,265 | | 8,908 |
Series 3119 Class PO, 2/15/36 (k) | | 12,667 | | 10,757 |
Series 3121 Class KO, 3/15/36 (k) | | 3,705 | | 3,305 |
Series 3123 Class LO, 3/15/36 (k) | | 8,255 | | 6,906 |
Series 3145 Class GO, 4/15/36 (k) | | 7,365 | | 6,244 |
Series 3741 Class YU, 3.5% 11/15/22 | | 13,420 | | 14,122 |
sequential payer: | | | | |
Series 2281 Class ZB, 6% 3/15/30 | | 2,190 | | 2,431 |
Series 2546 Class MJ, 5.5% 3/15/23 | | 2,861 | | 3,232 |
Series 2570 Class CU, 4.5% 7/15/17 | | 313 | | 321 |
Series 2587 Class AD, 4.71% 3/15/33 | | 5,785 | | 6,259 |
Series 2601 Class TB, 5.5% 4/15/23 | | 869 | | 985 |
Series 2645, Class BY, 4.5% 7/15/18 | | 4,800 | | 5,306 |
Series 2729 Class GB, 5% 1/15/19 | | 6,151 | | 6,625 |
Series 2773 Class HC, 4.5% 4/15/19 | | 704 | | 778 |
Series 2860 Class CP, 4% 10/15/17 | | 27 | | 27 |
Series 2930 Class KT, 4.5% 2/15/20 | | 6,728 | | 7,430 |
Series 2987 Class HE, 4.5% 6/15/20 | | 11,260 | | 12,281 |
Series 2998 Class LY, 5.5% 7/15/25 | | 2,011 | | 2,296 |
Series 3007 Class EW, 5.5% 7/15/25 | | 8,875 | | 10,164 |
Series 3013 Class VJ, 5% 1/15/14 | | 901 | | 945 |
Series 3277 Class B, 4% 2/15/22 | | 5,900 | | 6,388 |
Series 3578, Class B, 4.5% 9/15/24 | | 7,927 | | 8,719 |
Series 2863 Class DB, 4% 9/15/14 | | 450 | | 454 |
Series 3772 Class BI, 4.5% 10/15/18 (j) | | 13,479 | | 1,259 |
target amortization class: | | | | |
Series 2156 Class TC, 6.25% 5/15/29 | | 4,822 | | 5,431 |
Series 2877 Class JC, 5% 10/15/34 | | 162 | | 164 |
Collateralized Mortgage Obligations - continued |
| Principal Amount (000s) | | Value (000s) |
U.S. Government Agency - continued |
Ginnie Mae guaranteed REMIC pass-thru certificates: | | | | |
planned amortization Series 2011-61 Class OP, 5/20/40 (k) | | $ 11,127 | | $ 9,266 |
planned amortization class Series 1997-8 Class PE, 7.5% 5/16/27 | | 2,406 | | 2,797 |
sequential payer Series 2011-69 Class GX, 4.5% 5/16/40 | | 10,205 | | 10,693 |
Series 2004-79 Class FA, 0.4863% 1/20/31 (i) | | 2,297 | | 2,298 |
Series 2010-42 Class OP, 4/20/40 (k) | | 25,191 | | 20,468 |
Series 2011-71: | | | | |
Class ZB, 5.5% 8/20/34 | | 20,095 | | 22,393 |
Class ZC, 5.5% 7/16/34 | | 22,910 | | 25,374 |
TOTAL COLLATERALIZED MORTGAGE OBLIGATIONS (Cost $503,097) | 531,636 |
Foreign Government and Government Agency Obligations - 1.5% |
|
Israeli State (guaranteed by U.S. Government through Agency for International Development): | | | | |
5.5% 9/18/23 | | 59,862 | | 71,293 |
6.8% 2/15/12 | | 8,268 | | 8,432 |
TOTAL FOREIGN GOVERNMENT AND GOVERNMENT AGENCY OBLIGATIONS (Cost $69,411) | 79,725 |
Cash Equivalents - 14.7% |
| Maturity Amount (000s) | | Value (000s) |
Investments in repurchase agreements in a joint trading account at: | | | |
0.17%, dated 7/29/11 due 8/1/11 (Collateralized by U.S. Government Obligations) # | $ 424,367 | | $ 424,361 |
0.2%, dated 7/29/11 due 8/1/11 (Collateralized by U.S. Government Obligations) # (a) | 346,586 | | 346,580 |
TOTAL CASH EQUIVALENTS (Cost $770,941) | 770,941 |
TOTAL INVESTMENT PORTFOLIO - 116.2% (Cost $5,927,653) | 6,071,162 |
NET OTHER ASSETS (LIABILITIES) - (16.2)% | (845,808) |
NET ASSETS - 100% | $ 5,225,354 |
Futures Contracts |
| Expiration Date | | Underlying Face Amount at Value
(000s) | | Unrealized Appreciation/
(Depreciation) (000s) |
Purchased |
Treasury Contracts |
897 CBOT 2 Year U.S. Treasury Notes Contracts | Sept. 2011 | | $ 197,270 | | $ 881 |
|
The face value of futures purchased as a percentage of net assets is 3.8% |
Swap Agreements |
| Expiration Date | | Notional Amount (000s) | | Value (000s) |
Interest Rate Swaps |
Receive quarterly a floating rate based on 3-month LIBOR and pay semi-annually a fixed rate equal to 3.23% with Credit Suisse First Boston | May 2020 | | $ 50,000 | | $ (2,363) |
Legend |
(a) Includes investment made with cash collateral received from securities on loan. |
(b) Security or a portion of the security is on loan at period end. |
(c) Security exempt from registration under Rule 144A of the Securities Act of 1933. These securities may be resold in transactions exempt from registration, normally to qualified institutional buyers. At the end of the period, the value of these securities amounted to $18,112,000 or 0.3% of net assets. |
(d) Under the Temporary Liquidity Guarantee Program, the Federal Deposit Insurance Corporation guarantees principal and interest in the event of payment default or bankruptcy until the earlier of maturity date of the debt or until June 30, 2012. At the end of the period these securities amounted to $315,861,000 or 6.0% of net assets. |
(e) Security or a portion of the security purchased on a delayed delivery or when-issued basis. |
(f) A portion of the security is subject to a forward commitment to sell. |
(g) Security or a portion of the security was pledged to cover margin requirements for futures contracts. At the period end, the value of securities pledged amounted to $600,000. |
(h) Security or a portion of the security has been segregated as collateral for open swap agreements. At the period end, the value of securities pledged amounted to $1,067,000. |
(i) Coupon rates for floating and adjustable rate securities reflect the rates in effect at period end. |
(j) Security represents right to receive monthly interest payments on an underlying pool of mortgages or assets. Principal shown is the outstanding par amount of the pool held as of the end of the period. |
(k) Principal Only Strips represent the right to receive the monthly principal payments on an underlying pool of mortgage loans. |
(l) Represents an investment in an underlying pool of reverse mortgages which typically do not require regular principal and interest payments as repayment is deferred until a maturity event. |
# Additional information on each counterparty to the repurchase agreement is as follows: |
Repurchase Agreement / Counterparty | Value
(Amounts in thousands) |
$424,361,000 due 8/01/11 at 0.17% |
Bank of America NA | $ 307,005 |
J.P. Morgan Securities, Inc. | 11,476 |
Mizuho Securities USA, Inc. | 105,880 |
| $ 424,361 |
$346,580,000 due 8/01/11 at 0.20% |
J.P. Morgan Securities, Inc. | $ 152,224 |
Merrill Lynch, Pierce, Fenner & Smith, Inc. | 194,356 |
| $ 346,580 |
Other Information |
The following is a summary of the inputs used, as of July 31, 2011, involving the Fund's assets and liabilities carried at fair value. The inputs or methodology used for valuing securities may not be an indication of the risk associated with investing in those securities. For more information on valuation inputs, and their aggregation into the levels used in the table below, please refer to the Security Valuation section in the accompanying Notes to Financial Statements. |
Valuation Inputs at Reporting Date: |
Description
(Amounts in thousands) | Total | Level 1 | Level 2 | Level 3 |
Investments in Securities: | | | | |
U.S. Government and Government Agency Obligations | $ 3,143,450 | $ - | $ 3,143,450 | $ - |
U.S. Government Agency - Mortgage Securities | 1,545,410 | - | 1,545,410 | - |
Collateralized Mortgage Obligations | 531,636 | - | 531,636 | - |
Foreign Government and Government Agency Obligations | 79,725 | - | 79,725 | - |
Cash Equivalents | 770,941 | - | 770,941 | - |
Total Investments in Securities: | $ 6,071,162 | $ - | $ 6,071,162 | $ - |
Derivative Instruments: | | | | |
Assets | | | | |
Futures Contracts | $ 881 | $ 881 | $ - | $ - |
Liabilities | | | | |
Swap Agreements | $ (2,363) | $ - | $ (2,363) | $ - |
Total Derivative Instruments: | $ (1,482) | $ 881 | $ (2,363) | $ - |
Other Financial Instruments: | | | | |
Forward Commitments | $ (432) | $ - | $ (432) | $ - |
Value of Derivative Instruments |
The following table is a summary of the Fund's value of derivative instruments by risk exposure as of July 31, 2011. For additional information on derivative instruments, please refer to the Derivative Instruments section in the accompanying Notes to Financial Statements. |
Risk Exposure /
Derivative Type | Value |
(Amounts in thousands) | Asset | Liability |
Interest Rate Risk | | |
Futures Contracts (a) | $ 881 | $ - |
Swap Agreements (b) | - | (2,363) |
Total Value of Derivatives | $ 881 | $ (2,363) |
(a) Reflects cumulative appreciation/(depreciation) on futures contracts as disclosed on the Schedule of Investments. Only the period end variation margin is separately disclosed on the Statement of Assets and Liabilities. |
(b) Value is disclosed on the Statement of Assets and Liabilities in the Swap agreements, at value line-items. |
See accompanying notes which are an integral part of the financial statements.
Annual Report
Statement of Assets and Liabilities
Amounts in thousands (except per-share amounts) | July 31, 2011 |
| | |
Assets | | |
Investment in securities, at value (including securities loaned of $340,428 and repurchase agreements of $770,941) - See accompanying schedule: Unaffiliated issuers (cost $5,927,653) | | $ 6,071,162 |
Commitment to sell securities on a delayed delivery basis | $ (214,277) | |
Receivable for securities sold on a delayed delivery basis | 213,845 | (432) |
Receivable for investments sold, regular delivery | | 570,621 |
Cash | | 41 |
Receivable for fund shares sold | | 5,414 |
Interest receivable | | 22,995 |
Receivable for daily variation margin on futures contracts | | 112 |
Other receivables | | 32 |
Total assets | | 6,669,945 |
| | |
Liabilities | | |
Payable for investments purchased
Regular delivery | $ 690,506 | |
Delayed delivery | 385,611 | |
Payable for fund shares redeemed | 16,853 | |
Distributions payable | 396 | |
Swap agreements, at value | 2,363 | |
Accrued management fee | 1,377 | |
Distribution and service plan fees payable | 219 | |
Other affiliated payables | 653 | |
Other payables and accrued expenses | 33 | |
Collateral on securities loaned, at value | 346,580 | |
Total liabilities | | 1,444,591 |
| | |
Net Assets | | $ 5,225,354 |
Net Assets consist of: | | |
Paid in capital | | $ 5,018,538 |
Undistributed net investment income | | 917 |
Accumulated undistributed net realized gain (loss) on investments | | 64,304 |
Net unrealized appreciation (depreciation) on investments | | 141,595 |
Net Assets | | $ 5,225,354 |
See accompanying notes which are an integral part of the financial statements.
Annual Report
Financial Statements - continued
Statement of Assets and Liabilities - continued
Amounts in thousands (except per-share amounts) | July 31, 2011 |
| | |
Calculation of Maximum Offering Price
Class A:
Net Asset Value and redemption price per share ($328,529 ÷ 30,716 shares) | | $ 10.70 |
| | |
Maximum offering price per share (100/96.00 of $10.70) | | $ 11.15 |
Class T:
Net Asset Value and redemption price per share ($271,707 ÷ 25,407 shares) | | $ 10.69 |
| | |
Maximum offering price per share (100/96.00 of $10.69) | | $ 11.14 |
Class B:
Net Asset Value and offering price per share ($24,905 ÷ 2,329 shares)A | | $ 10.69 |
| | |
Class C:
Net Asset Value and offering price per share ($88,590 ÷ 8,284 shares)A | | $ 10.69 |
| | |
Government Income:
Net Asset Value, offering price and redemption price per share ($4,167,179 ÷ 390,178 shares) | | $ 10.68 |
| | |
Institutional Class:
Net Asset Value, offering price and redemption price per share ($344,444 ÷ 32,207 shares) | | $ 10.69 |
A Redemption price per share is equal to net asset value less any applicable contingent deferred sales charge.
See accompanying notes which are an integral part of the financial statements.
Annual Report
Statement of Operations
Amounts in thousands | Year ended July 31, 2011 |
| | |
Investment Income | | |
Interest | | $ 147,814 |
| | |
Expenses | | |
Management fee | $ 17,609 | |
Transfer agent fees | 6,349 | |
Distribution and service plan fees | 3,032 | |
Fund wide operations fee | 1,905 | |
Independent trustees' compensation | 21 | |
Miscellaneous | 19 | |
Total expenses | | 28,935 |
Net investment income (loss) | | 118,879 |
Realized and Unrealized Gain (Loss) Net realized gain (loss) on: | | |
Investment securities: | | |
Unaffiliated issuers | 130,436 | |
Futures contracts | 619 | |
Swap agreements | (6,318) | |
Total net realized gain (loss) | | 124,737 |
Change in net unrealized appreciation (depreciation) on: Investment securities | (89,643) | |
Futures contracts | 881 | |
Swap agreements | 3,215 | |
Delayed delivery commitments | 3,445 | |
Total change in net unrealized appreciation (depreciation) | | (82,102) |
Net gain (loss) | | 42,635 |
Net increase (decrease) in net assets resulting from operations | | $ 161,514 |
See accompanying notes which are an integral part of the financial statements.
Annual Report
Financial Statements - continued
Statement of Changes in Net Assets
Amounts in thousands | Year ended
July 31, 2011 | Year ended
July 31, 2010 |
Increase (Decrease) in Net Assets | | |
Operations | | |
Net investment income (loss) | $ 118,879 | $ 145,918 |
Net realized gain (loss) | 124,737 | 139,116 |
Change in net unrealized appreciation (depreciation) | (82,102) | 85,404 |
Net increase (decrease) in net assets resulting
from operations | 161,514 | 370,438 |
Distributions to shareholders from net investment income | (114,897) | (140,387) |
Distributions to shareholders from net realized gain | (140,821) | (196,760) |
Total distributions | (255,718) | (337,147) |
Share transactions - net increase (decrease) | (695,616) | 203,871 |
Total increase (decrease) in net assets | (789,820) | 237,162 |
| | |
Net Assets | | |
Beginning of period | 6,015,174 | 5,778,012 |
End of period (including undistributed net investment income of $917 and undistributed net investment income of $2,694, respectively) | $ 5,225,354 | $ 6,015,174 |
See accompanying notes which are an integral part of the financial statements.
Annual Report
Financial Highlights - Class A
Years ended July 31, | 2011 | 2010 | 2009 | 2008 | 2007F |
Selected Per-Share Data | | | | | |
Net asset value, beginning of period | $ 10.84 | $ 10.77 | $ 10.40 | $ 10.01 | $ 9.98 |
Income from Investment Operations | | | | | |
Net investment income (loss)E | .199 | .242 | .356 | .402 | .311 |
Net realized and unrealized gain (loss) | .108 | .424 | .466 | .387 | .033 |
Total from investment operations | .307 | .666 | .822 | .789 | .344 |
Distributions from net investment income | (.191) | (.231) | (.352) | (.399) | (.314) |
Distributions from net realized gain | (.256) | (.365) | (.100) | - | - |
Total distributions | (.447) | (.596) | (.452) | (.399) | (.314) |
Net asset value, end of period | $ 10.70 | $ 10.84 | $ 10.77 | $ 10.40 | $ 10.01 |
Total ReturnB,C,D | 2.94% | 6.44% | 8.03% | 7.96% | 3.49% |
Ratios to Average Net AssetsG | | | | | |
Expenses before reductions | .77% | .77% | .77% | .81% | .78%A |
Expenses net of fee waivers, if any | .77% | .77% | .77% | .81% | .78%A |
Expenses net of all reductions | .77% | .77% | .77% | .80% | .77%A |
Net investment income (loss) | 1.88% | 2.28% | 3.33% | 3.88% | 4.08%A |
Supplemental Data | | | | | |
Net assets, end of period (in millions) | $ 329 | $ 431 | $ 437 | $ 232 | $ 145 |
Portfolio turnover rate | 430% | 355% | 380%H | 269% | 164%H |
A Annualized
B Total returns for periods of less than one year are not annualized.
C Total returns would have been lower if certain expenses had not been reduced during the applicable periods shown.
D Total returns do not include the effect of the sales charges.
E Calculated based on average shares outstanding during the period.
F For the period October 24, 2006 (commencement of sale of shares) to July 31, 2007.
G Expense ratios reflect operating expenses of the class. Expenses before reductions do not reflect amounts reimbursed by the investment adviser or reductions from brokerage service arrangements or reductions from other expense offset arrangements and do not represent the amount paid by the class during periods when reimbursements or reductions occur. Expense ratios before reductions for start-up periods may not be representative of longer-term operating periods. Expenses net of fee waivers reflect expenses after reimbursement by the investment adviser but prior to reductions from brokerage service arrangements or other expense offset arrangements. Expenses net of all reductions represent the net expenses paid by the class.
H The portfolio turnover rate does not include the assets acquired in the merger.
See accompanying notes which are an integral part of the financial statements.
Annual Report
Financial Highlights - Class T
Years ended July 31, | 2011 | 2010 | 2009 | 2008 | 2007F |
Selected Per-Share Data | | | | | |
Net asset value, beginning of period | $ 10.84 | $ 10.77 | $ 10.40 | $ 10.01 | $ 9.98 |
Income from Investment Operations | | | | | |
Net investment income (loss)E | .201 | .243 | .357 | .404 | .306 |
Net realized and unrealized gain (loss) | .098 | .425 | .466 | .387 | .036 |
Total from investment operations | .299 | .668 | .823 | .791 | .342 |
Distributions from net investment income | (.193) | (.233) | (.353) | (.401) | (.312) |
Distributions from net realized gain | (.256) | (.365) | (.100) | - | - |
Total distributions | (.449) | (.598) | (.453) | (.401) | (.312) |
Net asset value, end of period | $ 10.69 | $ 10.84 | $ 10.77 | $ 10.40 | $ 10.01 |
Total ReturnB,C,D | 2.86% | 6.45% | 8.04% | 7.98% | 3.46% |
Ratios to Average Net AssetsG | | | | | |
Expenses before reductions | .76% | .76% | .76% | .78% | .79%A |
Expenses net of fee waivers, if any | .76% | .76% | .76% | .78% | .79%A |
Expenses net of all reductions | .76% | .76% | .76% | .78% | .79%A |
Net investment income (loss) | 1.89% | 2.29% | 3.33% | 3.90% | 4.02%A |
Supplemental Data | | | | | |
Net assets, end of period (in millions) | $ 272 | $ 335 | $ 324 | $ 236 | $ 181 |
Portfolio turnover rate | 430% | 355% | 380%H | 269% | 164%H |
A Annualized
B Total returns for periods of less than one year are not annualized.
C Total returns would have been lower if certain expenses had not been reduced during the applicable periods shown.
D Total returns do not include the effect of the sales charges.
E Calculated based on average shares outstanding during the period.
F For the period October 24, 2006 (commencement of sale of shares) to July 31, 2007.
G Expense ratios reflect operating expenses of the class. Expenses before reductions do not reflect amounts reimbursed by the investment adviser or reductions from brokerage service arrangements or reductions from other expense offset arrangements and do not represent the amount paid by the class during periods when reimbursements or reductions occur. Expense ratios before reductions for start-up periods may not be representative of longer-term operating periods. Expenses net of fee waivers reflect expenses after reimbursement by the investment adviser but prior to reductions from brokerage service arrangements or other expense offset arrangements. Expenses net of all reductions represent the net expenses paid by the class.
H The portfolio turnover rate does not include the assets acquired in the merger.
See accompanying notes which are an integral part of the financial statements.
Annual Report
Financial Highlights - Class B
Years ended July 31, | 2011 | 2010 | 2009 | 2008 | 2007F |
Selected Per-Share Data | | | | | |
Net asset value, beginning of period | $ 10.84 | $ 10.77 | $ 10.40 | $ 10.01 | $ 9.98 |
Income from Investment Operations | | | | | |
Net investment income (loss)E | .122 | .164 | .278 | .329 | .251 |
Net realized and unrealized gain (loss) | .098 | .425 | .467 | .387 | .037 |
Total from investment operations | .220 | .589 | .745 | .716 | .288 |
Distributions from net investment income | (.114) | (.154) | (.275) | (.326) | (.258) |
Distributions from net realized gain | (.256) | (.365) | (.100) | - | - |
Total distributions | (.370) | (.519) | (.375) | (.326) | (.258) |
Net asset value, end of period | $ 10.69 | $ 10.84 | $ 10.77 | $ 10.40 | $ 10.01 |
Total ReturnB,C,D | 2.10% | 5.67% | 7.25% | 7.21% | 2.91% |
Ratios to Average Net AssetsG | | | | | |
Expenses before reductions | 1.50% | 1.50% | 1.50% | 1.51% | 1.50%A |
Expenses net of fee waivers, if any | 1.50% | 1.50% | 1.50% | 1.51% | 1.50%A |
Expenses net of all reductions | 1.50% | 1.50% | 1.50% | 1.50% | 1.50%A |
Net investment income (loss) | 1.15% | 1.55% | 2.60% | 3.17% | 3.30%A |
Supplemental Data | | | | | |
Net assets, end of period (in millions) | $ 25 | $ 38 | $ 48 | $ 41 | $ 43 |
Portfolio turnover rate | 430% | 355% | 380%H | 269% | 164%H |
A Annualized
B Total returns for periods of less than one year are not annualized.
C Total returns would have been lower if certain expenses had not been reduced during the applicable periods shown.
D Total returns do not include the effect of the contingent deferred sales charge.
E Calculated based on average shares outstanding during the period.
F For the period October 24, 2006 (commencement of sale of shares) to July 31, 2007.
G Expense ratios reflect operating expenses of the class. Expenses before reductions do not reflect amounts reimbursed by the investment adviser or reductions from brokerage service arrangements or reductions from other expense offset arrangements and do not represent the amount paid by the class during periods when reimbursements or reductions occur. Expense ratios before reductions for start-up periods may not be representative of longer-term operating periods. Expenses net of fee waivers reflect expenses after reimbursement by the investment adviser but prior to reductions from brokerage service arrangements or other expense offset arrangements. Expenses net of all reductions represent the net expenses paid by the class.
H The portfolio turnover rate does not include the assets acquired in the merger.
See accompanying notes which are an integral part of the financial statements.
Annual Report
Financial Highlights - Class C
Years ended July 31, | 2011 | 2010 | 2009 | 2008 | 2007F |
Selected Per-Share Data | | | | | |
Net asset value, beginning of period | $ 10.84 | $ 10.77 | $ 10.40 | $ 10.01 | $ 9.98 |
Income from Investment Operations | | | | | |
Net investment income (loss)E | .121 | .163 | .275 | .326 | .249 |
Net realized and unrealized gain (loss) | .098 | .425 | .468 | .387 | .033 |
Total from investment operations | .219 | .588 | .743 | .713 | .282 |
Distributions from net investment income | (.113) | (.153) | (.273) | (.323) | (.252) |
Distributions from net realized gain | (.256) | (.365) | (.100) | - | - |
Total distributions | (.369) | (.518) | (.373) | (.323) | (.252) |
Net asset value, end of period | $ 10.69 | $ 10.84 | $ 10.77 | $ 10.40 | $ 10.01 |
Total ReturnB,C,D | 2.09% | 5.66% | 7.23% | 7.18% | 2.85% |
Ratios to Average Net AssetsG | | | | | |
Expenses before reductions | 1.51% | 1.51% | 1.52% | 1.53% | 1.55%A |
Expenses net of fee waivers, if any | 1.51% | 1.51% | 1.52% | 1.53% | 1.55%A |
Expenses net of all reductions | 1.51% | 1.51% | 1.51% | 1.53% | 1.55%A |
Net investment income (loss) | 1.14% | 1.54% | 2.58% | 3.15% | 3.26%A |
Supplemental Data | | | | | |
Net assets, end of period (in millions) | $ 89 | $ 118 | $ 131 | $ 71 | $ 39 |
Portfolio turnover rate | 430% | 355% | 380%H | 269% | 164%H |
A Annualized
B Total returns for periods of less than one year are not annualized.
C Total returns would have been lower if certain expenses had not been reduced during the applicable periods shown.
D Total returns do not include the effect of the contingent deferred sales charge.
E Calculated based on average shares outstanding during the period.
F For the period October 24, 2006 (commencement of sale of shares) to July 31, 2007.
G Expense ratios reflect operating expenses of the class. Expenses before reductions do not reflect amounts reimbursed by the investment adviser or reductions from brokerage service arrangements or reductions from other expense offset arrangements and do not represent the amount paid by the class during periods when reimbursements or reductions occur. Expense ratios before reductions for start-up periods may not be representative of longer-term operating periods. Expenses net of fee waivers reflect expenses after reimbursement by the investment adviser but prior to reductions from brokerage service arrangements or other expense offset arrangements. Expenses net of all reductions represent the net expenses paid by the class.
H The portfolio turnover rate does not include the assets acquired in the merger.
See accompanying notes which are an integral part of the financial statements.
Annual Report
Financial Highlights - Government Income
Years ended July 31, | 2011 | 2010 | 2009 | 2008 | 2007 |
Selected Per-Share Data | | | | | |
Net asset value, beginning of period | $ 10.82 | $ 10.76 | $ 10.38 | $ 10.00 | $ 9.95 |
Income from Investment Operations | | | | | |
Net investment income (loss)B | .233 | .275 | .390 | .438 | .443 |
Net realized and unrealized gain (loss) | .108 | .415 | .476 | .378 | .068 |
Total from investment operations | .341 | .690 | .866 | .816 | .511 |
Distributions from net investment income | (.225) | (.265) | (.386) | (.436) | (.456) |
Distributions from net realized gain | (.256) | (.365) | (.100) | - | (.005) |
Total distributions | (.481) | (.630) | (.486) | (.436) | (.461) |
Net asset value, end of period | $ 10.68 | $ 10.82 | $ 10.76 | $ 10.38 | $ 10.00 |
Total ReturnA | 3.27% | 6.69% | 8.49% | 8.25% | 5.22% |
Ratios to Average Net AssetsC | | | | | |
Expenses before reductions | .45% | .45% | .45% | .45% | .45% |
Expenses net of fee waivers, if any | .45% | .45% | .45% | .45% | .45% |
Expenses net of all reductions | .45% | .45% | .45% | .45% | .44% |
Net investment income (loss) | 2.20% | 2.60% | 3.65% | 4.23% | 4.42% |
Supplemental Data | | | | | |
Net assets, end of period (in millions) | $ 4,167 | $ 4,809 | $ 4,638 | $ 8,154 | $ 6,118 |
Portfolio turnover rate | 430% | 355% | 380%D | 269% | 164%D |
A Total returns would have been lower if certain expenses had not been reduced during the applicable periods shown.
B Calculated based on average shares outstanding during the period.
C Expense ratios reflect operating expenses of the class. Expenses before reductions do not reflect amounts reimbursed by the investment adviser or reductions from brokerage service arrangements or reductions from other expense offset arrangements and do not represent the amount paid by the class during periods when reimbursements or reductions occur. Expenses net of fee waivers reflect expenses after reimbursement by the investment adviser but prior to reductions from brokerage service arrangements or other expense offset arrangements. Expenses net of all reductions represent the net expenses paid by the class.
D The portfolio turnover rate does not include the assets acquired in the merger.
See accompanying notes which are an integral part of the financial statements.
Annual Report
Financial Highlights - Institutional Class
Years ended July 31, | 2011 | 2010 | 2009 | 2008 | 2007E |
Selected Per-Share Data | | | | | |
Net asset value, beginning of period | $ 10.84 | $ 10.77 | $ 10.40 | $ 10.01 | $ 9.98 |
Income from Investment Operations | | | | | |
Net investment income (loss)D | .225 | .267 | .385 | .432 | .329 |
Net realized and unrealized gain (loss) | .099 | .425 | .466 | .388 | .034 |
Total from investment operations | .324 | .692 | .851 | .820 | .363 |
Distributions from net investment income | (.218) | (.257) | (.381) | (.430) | (.333) |
Distributions from net realized gain | (.256) | (.365) | (.100) | - | - |
Total distributions | (.474) | (.622) | (.481) | (.430) | (.333) |
Net asset value, end of period | $ 10.69 | $ 10.84 | $ 10.77 | $ 10.40 | $ 10.01 |
Total ReturnB,C | 3.10% | 6.70% | 8.32% | 8.28% | 3.67% |
Ratios to Average Net AssetsF | | | | | |
Expenses before reductions | .52% | .53% | .51% | .51% | .53%A |
Expenses net of fee waivers, if any | .52% | .53% | .51% | .51% | .53%A |
Expenses net of all reductions | .52% | .53% | .51% | .51% | .53%A |
Net investment income (loss) | 2.13% | 2.52% | 3.59% | 4.17% | 4.32%A |
Supplemental Data | | | | | |
Net assets, end of period (in millions) | $ 344 | $ 284 | $ 200 | $ 750 | $ 715 |
Portfolio turnover rate | 430% | 355% | 380%G | 269% | 164%G |
A Annualized
B Total returns for periods of less than one year are not annualized.
C Total returns would have been lower if certain expenses had not been reduced during the applicable periods shown.
D Calculated based on average shares outstanding during the period.
E For the period October 24, 2006 (commencement of sale of shares) to July 31, 2007.
F Expense ratios reflect operating expenses of the class. Expenses before reductions do not reflect amounts reimbursed by the investment adviser or reductions from brokerage service arrangements or reductions from other expense offset arrangements and do not represent the amount paid by the class during periods when reimbursements or reductions occur. Expense ratios before reductions for start-up periods may not be representative of longer-term operating periods. Expenses net of fee waivers reflect expenses after reimbursement by the investment adviser but prior to reductions from brokerage service arrangements or other expense offset arrangements. Expenses net of all reductions represent the net expenses paid by the class.
G The portfolio turnover rate does not include the assets acquired in the merger.
See accompanying notes which are an integral part of the financial statements.
Annual Report
Notes to Financial Statements
For the period ended July 31, 2011
(Amounts in thousands except ratios)
1. Organization.
Fidelity Government Income Fund (the Fund) is a fund of Fidelity Income Fund (the Trust) and is authorized to issue an unlimited number of shares. The Trust is registered under the Investment Company Act of 1940, as amended (the 1940 Act), as an open-end management investment company organized as a Massachusetts business trust. The Fund offers Class A, Class T, Class C, Government Income and Institutional Class shares, each of which, along with Class B shares, has equal rights as to assets and voting privileges. Effective after the close of business on September 1, 2010, Class B shares were closed to new accounts and additional purchases, except for exchanges and reinvestments by existing shareholders. Each class has exclusive voting rights with respect to matters that affect that class. Class B shares will automatically convert to Class A shares after a holding period of seven years from the initial date of purchase. Investment income, realized and unrealized capital gains and losses, the common expenses of the Fund, and certain fund-level expense reductions, if any, are allocated on a pro-rata basis to each class based on the relative net assets of each class to the total net assets of the Fund. Each class differs with respect to transfer agent and distribution and service plan fees incurred. Certain expense reductions may also differ by class.
In May 2011, the Board of Trustees approved a change in the fiscal year end of the Fund from July 31 to August 31, effective August 31, 2011.
2. Significant Accounting Policies.
The financial statements have been prepared in conformity with accounting principles generally accepted in the United States of America (GAAP), which require management to make certain estimates and assumptions at the date of the financial statements. Actual results could differ from those estimates. Subsequent events, if any, through the date that the financial statements were issued have been evaluated in the preparation of the financial statements. The following summarizes the significant accounting policies of the Fund:
Security Valuation. Investments are valued as of 4:00 p.m. Eastern time on the last calendar day of the period. The Fund uses independent pricing services approved by the Board of Trustees to value its investments. When current market prices or quotations are not readily available or reliable, valuations may be determined in good faith in accordance with procedures adopted by the Board of Trustees. Factors used in determining value may include market or security specific events, changes in interest rates and credit quality. The frequency with which these procedures are used cannot be predicted and they may be utilized to a significant extent. The value used for net asset value (NAV) calculation under these procedures may differ from published prices for the same securities.
Annual Report
2. Significant Accounting Policies - continued
Security Valuation - continued
The Fund categorizes the inputs to valuation techniques used to value its investments into a disclosure hierarchy consisting of three levels as shown below:
Level 1 - quoted prices in active markets for identical investments
Level 2 - other significant observable inputs (including quoted prices for similar investments, interest rates, prepayment speeds, etc.)
Level 3 - unobservable inputs (including the Fund's own assumptions based on the best information available)
Changes in valuation techniques may result in transfers in or out of an assigned level within the disclosure hierarchy. The aggregate value of investments by input level, as of July 31, 2011 for the Fund's investments, is included at the end of the Fund's Schedule of Investments. Valuation techniques used to value the Fund's investments by major category are as follows:
Debt securities, including restricted securities, are valued based on evaluated prices received from independent pricing services or from dealers who make markets in such securities. For foreign government and government agency obligations and U.S. government and government agency obligations, pricing services utilize matrix pricing which considers yield or price of bonds of comparable quality, coupon, maturity and type as well as dealer supplied prices and are generally categorized as Level 2 in the hierarchy. For collateralized mortgage obligations and U.S. government agency mortgage securities, pricing services utilize matrix pricing which considers prepayment speed assumptions, attributes of the collateral, yield or price of bonds of comparable quality, coupon, maturity and type as well as dealer supplied prices and, accordingly, such securities are generally categorized as Level 2 in the hierarchy. Swaps are marked-to-market daily based on valuations from independent pricing services or dealer-supplied valuations and changes in value are recorded as unrealized appreciation (depreciation). Pricing services utilize matrix pricing which considers comparisons to interest rate curves, credit spread curves, default possibilities and recovery rates and, as a result, swaps are generally categorized as Level 2 in the hierarchy. When independent prices are unavailable or unreliable, debt securities and swaps may be valued utilizing pricing matrices which consider similar factors that would be used by independent pricing services. These are generally categorized as Level 2 in the hierarchy but may be Level 3 depending on the circumstances.
Futures contracts are valued at the settlement price established each day by the board of trade or exchange on which they are traded and are categorized as Level 1 in the hierarchy. Short-term securities with remaining maturities of sixty days or less may be valued at amortized cost, which approximates fair value, and are categorized as Level 2 in the hierarchy.
Annual Report
Notes to Financial Statements - continued
(Amounts in thousands except ratios)
2. Significant Accounting Policies - continued
Investment Transactions and Income. For financial reporting purposes, the Fund's investment holdings and NAV include trades executed through the end of the last business day of the period. The NAV per share for processing shareholder transactions is calculated as of the close of business of the New York Stock Exchange (NYSE), normally 4:00 p.m. Eastern time and includes trades executed through the end of the prior business day. Gains and losses on securities sold are determined on the basis of identified cost. Interest income is accrued as earned. Interest income includes coupon interest and amortization of premium and accretion of discount on debt securities. The principal value on inflation-indexed securities is periodically adjusted to the rate of inflation and interest is accrued based on the principal value. The adjustments to principal due to inflation are reflected as increases or decreases to interest income even though principal is not received until maturity.
Expenses. Expenses directly attributable to a fund are charged to that fund. Expenses attributable to more than one fund are allocated among the respective funds on the basis of relative net assets or other appropriate methods. Expense estimates are accrued in the period to which they relate and adjustments are made when actual amounts are known.
Deferred Trustee Compensation. Under a Deferred Compensation Plan (the Plan), independent Trustees may elect to defer receipt of a portion of their annual compensation. Deferred amounts are invested in a cross-section of Fidelity funds, are marked-to-market and remain in the Fund until distributed in accordance with the Plan. The investment of deferred amounts and the offsetting payable to the Trustees are included in the accompanying Statement of Assets and Liabilities.
Income Tax Information and Distributions to Shareholders. Each year, the Fund intends to qualify as a regulated investment company, including distributing substantially all of its taxable income and realized gains under Subchapter M of the Internal Revenue Code and filing its U.S. federal tax return. As a result, no provision for income taxes is required. As of July 31, 2011, the Fund did not have any unrecognized tax benefits in the financial statements. A fund's federal tax return is subject to examination by the Internal Revenue Service (IRS) for a period of three years.
Dividends are declared and recorded daily and paid monthly from net investment income. Distributions from realized gains, if any, are declared and recorded on the ex-dividend date. Income dividends and capital gain distributions are declared separately for each class. Income and capital gain distributions are determined in accordance with income tax regulations, which may differ from GAAP. In addition, the Fund claimed a portion of the payment made to redeeming shareholders as a distribution for income tax purposes.
Annual Report
2. Significant Accounting Policies - continued
Income Tax Information and Distributions to Shareholders - continued
Capital accounts within the financial statements are adjusted for permanent book-tax differences. These adjustments have no impact on net assets or the results of operations. Temporary book-tax differences will reverse in a subsequent period.
Book-tax differences are primarily due to futures transactions, swap agreements, market discount, deferred trustees compensation, certain losses related to deflation adjustments on U.S. Treasury inflation-indexed securities and losses deferred due to wash sales.
The federal tax cost of investment securities and unrealized appreciation (depreciation) as of period end were as follows:
Gross unrealized appreciation | $ 150,573 |
Gross unrealized depreciation | (2,894) |
Net unrealized appreciation (depreciation) on securities and other investments | $ 147,679 |
| |
Tax Cost | $ 5,923,483 |
The tax-based components of distributable earnings as of period end were as follows:
Undistributed ordinary income | $ 2,574 |
Undistributed long-term capital gain | $ 58,691 |
Net unrealized appreciation (depreciation) | $ 145,317 |
Under the recently enacted Regulated Investment Company Modernization Act of 2010 (the Act), the Fund will be permitted to carry forward capital losses incurred in taxable years beginning after December 22, 2010 for an unlimited period. However, any losses incurred during those future taxable years will be required to be utilized prior to any losses incurred in pre-enactment taxable years, which generally expire after eight years from when they are incurred. Additionally, post-enactment capital losses that are carried forward will retain their character as either short-term or long-term capital losses rather than being considered all short-term as under previous law. The Fund's first fiscal year end subject to the Act will be August 31, 2011.
The tax character of distributions paid was as follows:
| July 31, 2011 | July 31, 2010 |
Ordinary Income | $ 199,845 | $ 175,643 |
Long-term Capital Gains | 55,873 | 161,504 |
Total | $ 255,718 | $ 337,147 |
Annual Report
Notes to Financial Statements - continued
(Amounts in thousands except ratios)
2. Significant Accounting Policies - continued
New Accounting Pronouncements. In May 2011, the Financial Accounting Standards Board (FASB) issued an update to Topic 860 - Transfers and Servicing. The update clarifies the assessment of effective control by removing the collateral provision requirement that the seller maintains at all times collateral sufficient to fund substantially all of the cost of purchasing replacement financial assets from others. This may result in a change in accounting treatment from purchases and sales to secured borrowings for certain mortgage dollar roll transactions, and therefore separate accounting of the income and expenses associated with the secured borrowings. This change would have no effect on the net assets or total return of the Fund. The update is effective for transactions entered into on or after December 15, 2011. Management is currently evaluating the potential impact of the update on the accounting for mortgage dollar roll transactions entered into by the Fund. Also in May 2011, the FASB issued Accounting Standard Update No. 2011-04, Fair Value Measurement (Topic 820) - Amendments to Achieve Common Fair Value Measurement and Disclosure Requirements in U.S. GAAP and IFRSs. The update changes the wording used to describe the requirements in GAAP for measuring fair value and for disclosing information about fair value measurements. The update is effective during interim and annual periods beginning after December 15, 2011. Management is currently evaluating the impact of the update's adoption on the Fund's financial statement disclosures.
3. Operating Policies.
Repurchase Agreements. Fidelity Management & Research Company (FMR) has received an Exemptive Order from the Securities and Exchange Commission (the SEC) which permits the Fund and other affiliated entities of FMR to transfer uninvested cash balances into joint trading accounts which are then invested in repurchase agreements. The Fund may also invest directly with institutions in repurchase agreements. Repurchase agreements are collateralized by government or non-government securities. Upon settlement date, collateral is held in segregated accounts with custodian banks and may be obtained in the event of a default of the counterparty. The Fund monitors, on a daily basis, the value of the collateral to ensure it is at least equal to the principal amount of the repurchase agreement (including accrued interest). In the event of a default by the counterparty, realization of the collateral proceeds could be delayed, during which time the value of the collateral may decline.
Delayed Delivery Transactions and When-Issued Securities. The Fund may purchase or sell securities on a delayed delivery or when-issued basis. Payment and delivery may take place after the customary settlement period for that security. The price of the underlying securities and the date when the securities will be delivered and paid for are fixed at the time the transaction is negotiated. During the time a delayed delivery sell is outstanding, the contract is marked-to-market daily and equivalent deliverable
Annual Report
3. Operating Policies - continued
Delayed Delivery Transactions and When-Issued Securities - continued
securities are held for the transaction. The securities purchased on a delayed delivery or when-issued basis are identified as such in the Fund's Schedule of Investments. The Fund may receive compensation for interest forgone in the purchase of a delayed delivery or when-issued security. With respect to purchase commitments, the Fund identifies securities as segregated in its records with a value at least equal to the amount of the commitment. Losses may arise due to changes in the value of the underlying securities or if the counterparty does not perform under the contract's terms, or if the issuer does not issue the securities due to political, economic, or other factors.
Restricted Securities. The Fund may invest in securities that are subject to legal or contractual restrictions on resale. These securities generally may be resold in transactions exempt from registration or to the public if the securities are registered. Disposal of these securities may involve time-consuming negotiations and expense, and prompt sale at an acceptable price may be difficult. Information regarding restricted securities is included at the end of the Fund's Schedule of Investments.
4. Derivative Instruments.
Risk Exposures and the Use of Derivative Instruments. The Fund used derivative instruments (derivatives), including futures contracts and swap agreements in order to meet its investment objectives. The strategy is to use derivatives to increase returns, to gain exposure to certain types of assets and to manage exposure to certain risks as defined below. The success of any strategy involving derivatives depends on analysis of numerous economic factors, and if the strategies for investment do not work as intended, the Fund may not achieve its objectives.
The Fund's use of derivatives increased or decreased its exposure to the following risk:
Interest Rate Risk | Interest rate risk relates to the fluctuations in the value of interest-bearing securities due to changes in the prevailing levels of market interest rates. |
The Fund is also exposed to additional risks from investing in derivatives, such as liquidity risk and counterparty credit risk. Liquidity risk is the risk that the Fund will be unable to sell the derivative in the open market in a timely manner. Counterparty credit risk is the risk that the counterparty will not be able to fulfill its obligation to the Fund. Derivative counterparty credit risk is managed through formal evaluation of the creditworthiness of all potential counterparties. On certain over-the-counter derivatives, the Fund attempts to reduce its exposure to counterparty credit risk by entering into an International Swaps and Derivatives Association (ISDA) Master Agreement on a bilateral basis with each of its counterparties. The ISDA Master Agreement gives the Fund the
Annual Report
Notes to Financial Statements - continued
(Amounts in thousands except ratios)
4. Derivative Instruments - continued
Risk Exposures and the Use of Derivative Instruments - continued
right to terminate all transactions traded under such agreement if there is a certain deterioration in the credit quality of the counterparty. The ISDA Master Agreement gives each party the right, upon an event of default by the other party or a termination of the agreement, to close out all transactions traded under such agreement and to net amounts owed under each transaction to one net payable by one party to the other. To mitigate counterparty credit risk, the Fund offsets certain payables and/or receivables with collateral. Collateral in the form of cash or securities, if required, is held in segregated accounts with the Fund's custodian bank in accordance with the collateral agreements entered into between the Fund, the swap counterparty and the Fund's custodian bank, and is identified in the Schedule of Investments. The Fund could experience delays and costs in gaining access to the collateral even though it is held by the Fund's custodian bank. The Fund's maximum risk of loss from counterparty credit risk is generally the aggregate unrealized appreciation and unpaid counterparty payments in excess of any collateral pledged by the counterparty to the Fund. Counterparty risk related to exchange-traded futures contracts is minimal because of the protection provided by the exchange on which they trade. Derivatives involve, to varying degrees, risk of loss in excess of the amounts recognized in the Statement of Assets and Liabilities.
Net Realized Gain (Loss) and Change in Net Unrealized Appreciation (Depreciation) on Derivatives. The table below, which reflects the impacts of derivatives on the financial performance of the Fund, summarizes the net realized gain (loss) and change in net unrealized appreciation (depreciation) for derivatives during the period.
Risk Exposure / Derivative Type | Net Realized Gain (Loss) | Change in Net Unrealized Appreciation (Depreciation) |
Interest Rate Risk | | |
Futures Contracts | $ 619 | $ 881 |
Swap Agreements | (6,318) | 3,215 |
Totals (a)(b)(c) | $ (5,699) | $ 4,096 |
(a) A summary of the value of derivatives by risk exposure as of period end is included at the end of the Schedule of Investments and is representative of activity for the period.
(b) Total derivatives net realized gain (loss) included in the Statement of Operations is comprised of $619 for futures contracts and $(6,318) for swap agreements.
(c) Total derivatives change in net unrealized appreciation (depreciation) included in the Statement of Operations is comprised of $881 for futures contracts and $3,215 for swap agreements.
Futures Contracts. A futures contract is an agreement between two parties to buy or sell a specified underlying instrument for a fixed price at a specified future date. The Fund used futures contracts to manage its exposure to the bond market and to fluctuations in interest rates.
Annual Report
4. Derivative Instruments - continued
Futures Contracts - continued
Upon entering into a futures contract, a fund is required to deposit either cash or securities (initial margin) with a clearing broker in an amount equal to a certain percentage of the face value of the contract. Futures contracts are marked-to-market daily and subsequent payments (variation margin) are made or received by a fund depending on the daily fluctuations in the value of the futures contracts and are recorded as unrealized appreciation or (depreciation). This receivable and/or payable is included in daily variation margin on futures contracts in the Statement of Assets and Liabilities. Realized gain or (loss) is recorded upon the expiration or closing of a futures contract. The net realized gain (loss) and change in net unrealized appreciation (depreciation) on futures contracts during the period is included in the Statement of Operations.
The underlying face amount at value of open futures contracts at period end is shown in the Schedule of Investments under the caption "Futures Contracts." This amount reflects each contract's exposure to the underlying instrument at period end and is representative of activity for the period. Securities deposited to meet initial margin requirements are identified in the Schedule of Investments.
Certain risks arise upon entering into futures contracts, including the risk that an illiquid market limits the ability to close out a futures contract prior to settlement date.
Swap Agreements. A swap agreement (swap) is a contract between two parties to exchange future cash flows at periodic intervals based on a notional principal amount.
Details of swaps open at period end are included in the Schedule of Investments under the caption "Swap Agreements." Swaps are marked-to-market daily and changes in value are recorded as unrealized appreciation or (depreciation) and reflected in the Statement of Assets and Liabilities. Any upfront premiums paid or received upon entering a swap to compensate for differences between stated terms of the agreement and prevailing market conditions (e.g. credit spreads, interest rates or other factors) are recorded as realized gain or (loss) ratably over the term of the swap. Payments are exchanged at specified intervals, accrued daily commencing with the effective date of the contract and recorded as realized gain or (loss). Realized gain or (loss) is also recorded in the event of an early termination of a swap. The net realized gain (loss) and change in net unrealized appreciation (depreciation) on swaps during the period is included in the Statement of Operations.
Risks of loss include interest rate risk. In addition, there is the risk of failure by the counterparty to perform under the terms of the agreement and lack of liquidity in the market.
Annual Report
Notes to Financial Statements - continued
(Amounts in thousands except ratios)
4. Derivative Instruments - continued
Interest Rate Swaps. Interest rate swaps are agreements between counterparties to exchange cash flows, one based on a fixed rate, and the other on a floating rate. The Fund entered into interest rate swaps to manage its exposure to interest rate changes. Changes in interest rates can have an effect on both the value of bond holdings as well as the amount of interest income earned. In general, the value of bonds can fall when interest rates rise and can rise when interest rates fall.
5. Purchases and Sales of Investments.
Purchases and sales of securities, other than short-term securities and U.S. government securities, aggregated $5,151 and $19,358, respectively.
6. Fees and Other Transactions with Affiliates.
Management Fee. FMR and its affiliates provide the Fund with investment management related services for which the Fund pays a monthly management fee. The management fee is the sum of an individual fund fee rate that is based on an annual rate of .20% of the Fund's average net assets and a group fee rate that averaged .12% during the period. The group fee rate is based upon the average net assets of all the mutual funds advised by FMR. The group fee rate decreases as assets under management increase and increases as assets under management decrease. For the period, the total annual management fee rate was .32% of the Fund's average net assets.
Distribution and Service Plan Fees. In accordance with Rule 12b-1 of the 1940 Act, the Fund has adopted separate Distribution and Service Plans for each class of shares. Certain classes pay Fidelity Distributors Corporation (FDC), an affiliate of FMR, separate Distribution and Service Fees, each of which is based on an annual percentage of each class' average net assets. In addition, FDC may pay financial intermediaries for selling shares of the Fund and providing shareholder support services. For the period, the Distribution and Service Fee rates, total fees and amounts retained by FDC were as follows:
| Distribution
Fee | Service
Fee | Total Fees | Retained
by FDC |
Class A | -% | .25% | $ 962 | $ 24 |
Class T | -% | .25% | 758 | 2 |
Class B | .65% | .25% | 278 | 201 |
Class C | .75% | .25% | 1,034 | 184 |
| | | $ 3,032 | $ 411 |
Annual Report
6. Fees and Other Transactions with Affiliates - continued
Sales Load. FDC may receive a front-end sales charge of up to 4.00% for selling Class A shares and Class T shares, some of which is paid to financial intermediaries for selling shares of the Fund. Depending on the holding period, FDC may receive contingent deferred sales charges levied on Class A, Class T, Class B, and Class C redemptions. The deferred sales charges range from 5% to 1% for Class B, 1% for Class C, .75% for certain purchases of Class A shares and .25% for certain purchases of Class T shares.
For the period, sales charge amounts retained by FDC were as follows:
| Retained
by FDC |
Class A | $ 34 |
Class T | 12 |
Class B* | 103 |
Class C* | 25 |
| $ 174 |
* When Class B and Class C shares are initially sold, FDC pays commissions from its own resources to financial intermediaries through which the sales are made.
Transfer Agent Fees. Fidelity Investments Institutional Operations Company, Inc. (FIIOC), an affiliate of FMR, is the transfer, dividend disbursing and shareholder servicing agent for each class of the Fund. FIIOC receives account fees and asset-based fees that vary according to the account size and type of account of the shareholders of the respective classes of the Fund. FIIOC pays for typesetting, printing and mailing of shareholder reports, except proxy statements. For the period, transfer agent fees for each class were as follows:
| Amount | % of
Average
Net Assets |
Class A | $ 662 | .17 |
Class T | 470 | .15 |
Class B | 76 | .25 |
Class C | 165 | .16 |
Government Income | 4,453 | .10 |
Institutional Class | 523 | .17 |
| $ 6,349 | |
Fund Wide Operations Fee. Pursuant to the Fund Wide Operations and Expense Agreement (FWOE), FMR has agreed to provide for fund level expenses (which do not include transfer agent, Rule 12b-1 fees, compensation of the independent Trustees, interest (including commitment fees), taxes or extraordinary expenses, if any) in return for a FWOE fee equal to .35% less the total amount of the management fee. The FWOE
Annual Report
Notes to Financial Statements - continued
(Amounts in thousands except ratios)
6. Fees and Other Transactions with Affiliates - continued
Fund Wide Operations Fee - continued
paid by the Fund is reduced by an amount equal to the fees and expenses paid to the independent Trustees. For the period, the FWOE fee was equivalent to an annual rate of .03% of average net assets.
7. Committed Line of Credit.
The Fund participates with other funds managed by FMR or an affiliate in a $4.0 billion credit facility (the "line of credit") to be utilized for temporary or emergency purposes to fund shareholder redemptions or for other short-term liquidity purposes. The Fund has agreed to pay commitment fees on its pro-rata portion of the line of credit, which amounted to $19 and is reflected in Miscellaneous expenses on the Statement of Operations. During the period, there were no borrowings on this line of credit.
8. Security Lending.
The Fund lends portfolio securities from time to time in order to earn additional income. On the settlement date of the loan, the Fund receives collateral (in the form of U.S. Treasury obligations, letters of credit and/or cash) against the loaned securities and maintains collateral in an amount not less than 100% of the market value of the loaned securities during the period of the loan. The market value of the loaned securities is determined at the close of business of the Fund and any additional required collateral is delivered to the Fund on the next business day. If the borrower defaults on its obligation to return the securities loaned because of insolvency or other reasons, a fund could experience delays and costs in recovering the securities loaned or in gaining access to the collateral. Any cash collateral received is maintained at the Fund's custodian and/or invested in cash equivalents. The value of loaned securities and cash collateral at period end are disclosed on the Fund's Statement of Assets and Liabilities. Security lending income represents the income earned on investing cash collateral, less rebates paid to borrowers, plus any premium payments received for lending certain types of securities. Security lending income is presented in the Statement of Operations as a component of interest income. Total security lending income during the period amounted to $164.
Annual Report
9. Distributions to Shareholders.
Distributions to shareholders of each class were as follows:
Years ended July 31, | 2011 | 2010 |
From net investment income | | |
Class A | $ 6,937 | $ 9,342 |
Class T | 5,513 | 6,865 |
Class B | 332 | 606 |
Class C | 1,100 | 1,669 |
Government Income | 94,692 | 116,185 |
Institutional Class | 6,323 | 5,720 |
Total | $ 114,897 | $ 140,387 |
From net realized gain | | |
Class A | $ 10,104 | $ 14,726 |
Class T | 7,830 | 10,744 |
Class B | 853 | 1,543 |
Class C | 2,724 | 4,162 |
Government Income | 112,442 | 158,363 |
Institutional Class | 6,868 | 7,222 |
Total | $ 140,821 | $ 196,760 |
10. Share Transactions.
Transactions for each class of shares were as follows:
| Shares | Dollars |
Years ended July 31, | 2011 | 2010 | 2011 | 2010 |
Class A | | | | |
Shares sold | 10,505 | 17,922 | $ 111,665 | $ 190,342 |
Reinvestment of distributions | 1,423 | 1,943 | 15,111 | 20,562 |
Shares redeemed | (20,985) | (20,615) | (221,593) | (218,378) |
Net increase (decrease) | (9,057) | (750) | $ (94,817) | $ (7,474) |
Class T | | | | |
Shares sold | 9,053 | 13,716 | $ 96,270 | $ 145,586 |
Reinvestment of distributions | 1,221 | 1,616 | 12,970 | 17,109 |
Shares redeemed | (15,795) | (14,473) | (166,943) | (153,287) |
Net increase (decrease) | (5,521) | 859 | $ (57,703) | $ 9,408 |
Class B | | | | |
Shares sold | 275 | 1,036 | $ 2,957 | $ 11,019 |
Reinvestment of distributions | 93 | 165 | 985 | 1,747 |
Shares redeemed | (1,536) | (2,202) | (16,266) | (23,321) |
Net increase (decrease) | (1,168) | (1,001) | $ (12,324) | $ (10,555) |
Annual Report
Notes to Financial Statements - continued
(Amounts in thousands except ratios)
10. Share Transactions - continued
| Shares | Dollars |
Years ended July 31, | 2011 | 2010 | 2011 | 2010 |
Class C | | | | |
Shares sold | 2,426 | 3,916 | $ 25,890 | $ 41,596 |
Reinvestment of distributions | 261 | 390 | 2,774 | 4,131 |
Shares redeemed | (5,248) | (5,610) | (55,376) | (59,334) |
Net increase (decrease) | (2,561) | (1,304) | $ (26,712) | $ (13,607) |
Government Income | | | | |
Shares sold | 105,621 | 155,285 | $ 1,120,288 | $ 1,646,227 |
Reinvestment of distributions | 18,687 | 24,826 | 198,243 | 262,396 |
Shares redeemed | (178,425) | (166,873) | (1,885,694) | (1,763,484) |
Net increase (decrease) | (54,117) | 13,238 | $ (567,163) | $ 145,139 |
Institutional Class | | | | |
Shares sold | 12,979 | 13,487 | $ 137,402 | $ 143,092 |
Reinvestment of distributions | 1,192 | 1,193 | 12,645 | 12,621 |
Shares redeemed | (8,205) | (7,047) | (86,944) | (74,753) |
Net increase (decrease) | 5,966 | 7,633 | $ 63,103 | $ 80,960 |
11. Other.
The Fund's organizational documents provide former and current trustees and officers with a limited indemnification against liabilities arising in connection with the performance of their duties to the Fund. In the normal course of business, the Fund may also enter into contracts that provide general indemnifications. The Fund's maximum exposure under these arrangements is unknown as this would be dependent on future claims that may be made against the Fund. The risk of material loss from such claims is considered remote.
Effective after the close of business on August 26, 2011, the Fund exchanged securities, including accrued interest, valued at $1,278,207 for shares of Fidelity Mortgage Backed Securities Central Fund, which is an affiliated investment company managed by FMR Co., Inc., an affiliate of FMR. Fidelity Mortgage Backed Securities Central Fund seeks a high level of current income and invests primarily in investment-grade mortgage-related securities issued by the U.S. Government or its instrumentalities and repurchase agreements for those securities. These strategies are consistent with the investment objective of the Fund.
Annual Report
To the Trustees of Fidelity Income Fund and the Shareholders of Fidelity Government Income Fund:
In our opinion, the accompanying statement of assets and liabilities, including the schedule of investments, and the related statements of operations and of changes in net assets and the financial highlights present fairly, in all material respects, the financial position of Fidelity Government Income Fund (a fund of Fidelity Income Fund) at July 31, 2011, the results of its operations for the year then ended, the changes in its net assets for each of the two years in the period then ended and the financial highlights for each of the periods indicated, in conformity with accounting principles generally accepted in the United States of America. These financial statements and financial highlights (hereafter referred to as "financial statements") are the responsibility of the Fidelity Government Income Fund's management. Our responsibility is to express an opinion on these financial statements based on our audits. We conducted our audits of these financial statements in accordance with the standards of the Public Company Accounting Oversight Board (United States). Those standards require that we plan and perform the audit to obtain reasonable assurance about whether the financial statements are free of material misstatement. An audit includes examining, on a test basis, evidence supporting the amounts and disclosures in the financial statements, assessing the accounting principles used and significant estimates made by management, and evaluating the overall financial statement presentation. We believe that our audits, which included confirmation of securities at July 31, 2011 by correspondence with the custodian and brokers, provide a reasonable basis for our opinion.
/s/ PricewaterhouseCoopers LLP
PricewaterhouseCoopers LLP
Boston, Massachusetts
September 13, 2011
Annual Report
The Trustees and executive officers of the trust and fund, as applicable, are listed below. The Board of Trustees governs the fund and is responsible for protecting the interests of shareholders. The Trustees are experienced executives who meet periodically throughout the year to oversee the fund's activities, review contractual arrangements with companies that provide services to the fund, oversee management of the risks associated with such activities and contractual arrangements, and review the fund's performance. Except for James C. Curvey, each of the Trustees oversees 198 funds advised by FMR or an affiliate. Mr. Curvey oversees 419 funds advised by FMR or an affiliate.
The Trustees hold office without limit in time except that (a) any Trustee may resign; (b) any Trustee may be removed by written instrument, signed by at least two-thirds of the number of Trustees prior to such removal; (c) any Trustee who requests to be retired or who has become incapacitated by illness or injury may be retired by written instrument signed by a majority of the other Trustees; and (d) any Trustee may be removed at any special meeting of shareholders by a two-thirds vote of the outstanding voting securities of the trust. Each Trustee who is not an interested person (as defined in the 1940 Act) (Independent Trustee), shall retire not later than the last day of the calendar year in which his or her 75th birthday occurs. The Independent Trustees may waive this mandatory retirement age policy with respect to individual Trustees. The executive officers hold office without limit in time, except that any officer may resign or may be removed by a vote of a majority of the Trustees at any regular meeting or any special meeting of the Trustees. Except as indicated, each individual has held the office shown or other offices in the same company for the past five years.
Experience, Skills, Attributes, and Qualifications of the Fund's Trustees. The Governance and Nominating Committee has adopted a statement of policy that describes the experience, qualifications, attributes, and skills that are necessary and desirable for potential Independent Trustee candidates (Statement of Policy). The Board believes that each Trustee satisfied at the time he or she was initially elected or appointed a Trustee, and continues to satisfy, the standards contemplated by the Statement of Policy. The Governance and Nominating Committee also engages professional search firms to help identify potential Independent Trustee candidates who have the experience, qualifications, attributes, and skills consistent with the Statement of Policy. From time to time, additional criteria based on the composition and skills of the current Independent Trustees, as well as experience or skills that may be appropriate in light of future changes to board composition, business conditions, and regulatory or other developments, have also been considered by the professional search firms and the Governance and Nominating Committee. In addition, the Board takes into account the Trustees' commitment and participation in Board and committee meetings, as well as their leadership of standing and ad hoc committees throughout their tenure.
In determining that a particular Trustee was and continues to be qualified to serve as a Trustee, the Board has considered a variety of criteria, none of which, in isolation, was controlling. The Board believes that, collectively, the Trustees have balanced and diverse experience, qualifications, attributes, and skills, which allow the Board to operate effectively in governing the fund and protecting the interests of shareholders. Information about the specific experience, skills, attributes, and qualifications of each Trustee, which in each case led to the Board's conclusion that the Trustee should serve (or continue to serve) as a trustee of the fund, is provided below.
Annual Report
Trustees and Officers - continued
Board Structure and Oversight Function. Abigail P. Johnson is an interested person (as defined in the 1940 Act) and currently serves as Chairman. The Trustees have determined that an interested Chairman is appropriate and benefits shareholders because an interested Chairman has a personal and professional stake in the quality and continuity of services provided to the fund. Independent Trustees exercise their informed business judgment to appoint an individual of their choosing to serve as Chairman, regardless of whether the Trustee happens to be independent or a member of management. The Independent Trustees have determined that they can act independently and effectively without having an Independent Trustee serve as Chairman and that a key structural component for assuring that they are in a position to do so is for the Independent Trustees to constitute a substantial majority for the Board. The Independent Trustees also regularly meet in executive session. Kenneth L. Wolfe serves as Chairman of the Independent Trustees and as such (i) acts as a liaison between the Independent Trustees and management with respect to matters important to the Independent Trustees and (ii) with management prepares agendas for Board meetings.
Fidelity funds are overseen by different Boards of Trustees. The fund's Board oversees Fidelity's investment-grade bond, money market, and asset allocation funds and another Board oversees Fidelity's equity and high income funds. The asset allocation funds may invest in Fidelity funds that are overseen by such other Board. The use of separate Boards, each with its own committee structure, allows the Trustees of each group of Fidelity funds to focus on the unique issues of the funds they oversee, including common research, investment, and operational issues. On occasion, the separate Boards establish joint committees to address issues of overlapping consequences for the Fidelity funds overseen by each Board.
The Trustees operate using a system of committees to facilitate the timely and efficient consideration of all matters of importance to the Trustees, the fund, and fund shareholders and to facilitate compliance with legal and regulatory requirements and oversight of the fund's activities and associated risks. The Board, acting through its committees, has charged FMR and its affiliates with (i) identifying events or circumstances the occurrence of which could have demonstrably adverse effects on the fund's business and/or reputation; (ii) implementing processes and controls to lessen the possibility that such events or circumstances occur or to mitigate the effects of such events or circumstances if they do occur; and (iii) creating and maintaining a system designed to evaluate continuously business and market conditions in order to facilitate the identification and implementation processes described in (i) and (ii) above. Because the day-to-day operations and activities of the fund are carried out by or through FMR, its affiliates and other service providers, the fund's exposure to risks is mitigated but not eliminated by the processes overseen by the Trustees. While each of the Board's committees has responsibility for overseeing different aspects of the fund's activities, oversight is exercised primarily through the Operations and Audit Committees. Appropriate personnel, including but not limited to the fund's Chief Compliance Officer (CCO), FMR's internal auditor, the independent accountants, the fund's Treasurer and portfolio management personnel, make periodic reports to the Board's committees, as appropriate. The responsibilities of each committee, including their oversight responsibilities, are described further under "Standing Committees of the Fund's Trustees."
Annual Report
The fund's Statement of Additional Information (SAI) includes more information about the Trustees. To request a free copy, call Fidelity at 1-800-544-8544.
Interested Trustees*:
Correspondence intended for each Trustee who is an interested person may be sent to Fidelity Investments, 82 Devonshire Street, Boston, Massachusetts 02109.
Name, Age; Principal Occupations and Other Relevant Experience+ |
Abigail P. Johnson (49) |
| Year of Election or Appointment: 2009 Ms. Johnson is Trustee and Chairman of the Board of Trustees of certain Trusts. Ms. Johnson serves as President of Personal, Workplace and Institutional Services (2005-present). Ms. Johnson is Chairman and Director of FMR Co., Inc. (2011-present), Chairman and Director of FMR (2011-present), and the Vice Chairman and Director (2007-present) of FMR LLC. Previously, Ms. Johnson served as President and a Director of FMR (2001-2005), a Trustee of other investment companies advised by FMR, Fidelity Investments Money Management, Inc., and FMR Co., Inc. (2001-2005), Senior Vice President of the Fidelity funds (2001-2005), and managed a number of Fidelity funds. Ms. Abigail P. Johnson and Mr. Arthur E. Johnson are not related. |
James C. Curvey (76) |
| Year of Election or Appointment: 2007 Mr. Curvey also serves as Trustee (2007-present) of other investment companies advised by FMR. Mr. Curvey is a Director of Fidelity Investments Money Management, Inc. (2009-present), Director of Fidelity Research & Analysis Co. (2009-present) and Director of FMR and FMR Co., Inc. (2007-present). Mr. Curvey is also Vice Chairman (2007-present) and Director of FMR LLC. In addition, Mr. Curvey serves as an Overseer for the Boston Symphony Orchestra and a member of the Trustees of Villanova University. Previously, Mr. Curvey was the Vice Chairman (2006-2007) and Director (2000-2007) of FMR Corp. |
* Trustees have been determined to be "Interested Trustees" by virtue of, among other things, their affiliation with the trust or various entities under common control with FMR.
Annual Report
Trustees and Officers - continued
+ The information above includes each Trustee's principal occupation during the last five years and other information relating to the experience, attributes, and skills relevant to each Trustee's qualifications to serve as a Trustee, which led to the conclusion that each Trustee should serve as a Trustee for the fund.
Independent Trustees:
Correspondence intended for each Independent Trustee (that is, the Trustees other than the Interested Trustees) may be sent to Fidelity Investments, P.O. Box 55235, Boston, Massachusetts 02205-5235.
Name, Age; Principal Occupations and Other Relevant Experience+ |
Albert R. Gamper, Jr. (69) |
| Year of Election or Appointment: 2006 Mr. Gamper is Vice Chairman of the Independent Trustees of the Fixed Income and Asset Allocation Funds (2011-present). Prior to his retirement in December 2004, Mr. Gamper served as Chairman of the Board of CIT Group Inc. (commercial finance). During his tenure with CIT Group Inc. Mr. Gamper served in numerous senior management positions, including Chairman (1987-1989; 1999-2001; 2002-2004), Chief Executive Officer (1987-2004), and President (2002-2003). He also served as President and Chief Executive Officer of Tyco Capital Corporation (2001-2002). Mr. Gamper currently serves as a member of the Board of Directors of Public Service Enterprise Group (utilities, 2000-present), a member of the Board of Trustees, Rutgers University (2004-present), and Chairman of the Board of Saint Barnabas Health Care System. Previously, Mr. Gamper served as Chairman of the Board of Governors, Rutgers University (2004-2007). |
Robert F. Gartland (59) |
| Year of Election or Appointment: 2010 Mr. Gartland is a partner and investor of Vietnam Partners LLC (investments and consulting, 2008-present) and is Chairman and an investor in Gartland and Mellina Group Corp. (consulting, 2009-present). Prior to his retirement, Mr. Gartland held a variety of positions at Morgan Stanley (financial services, 1979-2007) including Managing Director (1987-2007). |
Arthur E. Johnson (64) |
| Year of Election or Appointment: 2008 Mr. Johnson serves as a member of the Board of Directors of Eaton Corporation (diversified power management, 2009-present) and AGL Resources, Inc. (holding company). Prior to his retirement, Mr. Johnson served as Senior Vice President of Corporate Strategic Development of Lockheed Martin Corporation (defense contractor, 1999-2009). He previously served on the Board of Directors of IKON Office Solutions, Inc. (1999-2008) and Delta Airlines (2005-2007). Mr. Arthur E. Johnson and Ms. Abigail P. Johnson are not related. |
Michael E. Kenneally (57) |
| Year of Election or Appointment: 2009 Previously, Mr. Kenneally served as a Member of the Advisory Board for certain Fidelity Fixed Income and Asset Allocation Funds (2008-2009). Prior to his retirement, Mr. Kenneally served as Chairman and Global Chief Executive Officer of Credit Suisse Asset Management (2003-2005). Mr. Kenneally was a Director of the Credit Suisse Funds (U.S. mutual funds, 2004-2008) and certain other closed-end funds (2004-2005) and was awarded the Chartered Financial Analyst (CFA) designation in 1991. |
James H. Keyes (70) |
| Year of Election or Appointment: 2007 Mr. Keyes serves as a member of the Boards of Navistar International Corporation (manufacture and sale of trucks, buses, and diesel engines, since 2002) and Pitney Bowes, Inc. (integrated mail, messaging, and document management solutions, since 1998). Prior to his retirement, Mr. Keyes served as Chairman and Chief Executive Officer of Johnson Controls (automotive, building, and energy, 1998-2002) and as a member of the Board of LSI Logic Corporation (semiconductor technologies, 1984-2008). |
Marie L. Knowles (64) |
| Year of Election or Appointment: 2001 Prior to Ms. Knowles' retirement in June 2000, she served as Executive Vice President and Chief Financial Officer of Atlantic Richfield Company (ARCO) (diversified energy, 1996-2000). From 1993 to 1996, she was a Senior Vice President of ARCO and President of ARCO Transportation Company. She served as a Director of ARCO from 1996 to 1998. Ms. Knowles currently serves as a Director and Chairman of the Audit Committee of McKesson Corporation (healthcare service, since 2002). Ms. Knowles is an Honorary Trustee of the Brookings Institution and a member of the Board of the Catalina Island Conservancy and of the Santa Catalina Island Company (2009-present). She also serves as a member of the Advisory Board for the School of Engineering of the University of Southern California and the Foundation Board of the School of Architecture at the University of Virginia (2007-present). Previously, Ms. Knowles served as a Director of Phelps Dodge Corporation (copper mining and manufacturing, 1994-2007). |
Kenneth L. Wolfe (72) |
| Year of Election or Appointment: 2005 Mr. Wolfe is Chairman of the Independent Trustees of the Fixed Income and Asset Allocation Funds (2008-present). Prior to his retirement, Mr. Wolfe served as Chairman and a Director (2007-2009) and Chairman and Chief Executive Officer (1994-2001) of Hershey Foods Corporation. He also served as a member of the Boards of Adelphia Communications Corporation (telecommunications, 2003-2006), Bausch & Lomb, Inc. (medical/pharmaceutical, 1993-2007), and Revlon, Inc. (personal care products, 2004-2009). |
+ The information above includes each Trustee's principal occupation during the last five years and other information relating to the experience, attributes, and skills relevant to each Trustee's qualifications to serve as a Trustee, which led to the conclusion that each Trustee should serve as a Trustee for the fund.
Annual Report
Executive Officers:
Correspondence intended for each executive officer may be sent to Fidelity Investments, 82 Devonshire Street, Boston, Massachusetts 02109.
Name, Age; Principal Occupation |
John R. Hebble (53) |
| Year of Election or Appointment: 2008 President and Treasurer of Fidelity's Fixed Income and Asset Allocation Funds. Mr. Hebble also serves as President (2011-present), Treasurer, and Chief Financial Officer of The North Carolina Capital Management Trust: Cash and Term Portfolios (2008-present), Assistant Treasurer of other Fidelity funds (2009-present) and is an employee of Fidelity Investments. |
Christopher P. Sullivan (57) |
| Year of Election or Appointment: 2009 Vice President of Fidelity's Bond Funds. Mr. Sullivan also serves as President of Fidelity's Bond Division (2009-present). Mr. Sullivan is Executive Vice President of Fidelity Investments Money Management, Inc. (2009-present), and a Director of Fidelity Management & Research (U.K.) Inc. (2010-present). Previously, Mr. Sullivan served as Managing Director, Co-Head of U.S. Fixed Income at Goldman Sachs Asset Management (2001-2009). |
Christine J. Thompson (53) |
| Year of Election or Appointment: 2010 Vice President of Fidelity's Bond Funds. Ms. Thompson also serves as Chief Investment Officer of FMR's Bond Group (2010-present) and is an employee of Fidelity Investments. Previously, Ms. Thompson served as Director of Municipal Bond Portfolio Managers (2002-2010). |
Scott C. Goebel (43) |
| Year of Election or Appointment: 2008 Secretary and Chief Legal Officer (CLO) of the Fidelity funds. Mr. Goebel also serves as Secretary of Fidelity Investments Money Management, Inc. (FIMM) (2010-present) and Fidelity Research and Analysis Company (FRAC) (2010-present); Secretary and CLO of The North Carolina Capital Management Trust: Cash and Term Portfolios (2008-present); General Counsel, Secretary, and Senior Vice President of FMR (2008-present) and FMR Co., Inc. (2008-present); employed by FMR LLC or an affiliate (2001-present); Chief Legal Officer of Fidelity Management & Research (Hong Kong) Limited (2008-present) and Assistant Secretary of Fidelity Management & Research (Japan) Inc. (2008-present), and Fidelity Management & Research (U.K.) Inc. (2008-present). Previously, Mr. Goebel served as Assistant Secretary of FIMM (2008-2010), FRAC (2008-2010), and the Funds (2007-2008) and as Vice President and Secretary of Fidelity Distributors Corporation (FDC) (2005-2007). |
David J. Carter (38) |
| Year of Election or Appointment: 2010 Assistant Secretary of Fidelity's Fixed Income and Asset Allocation Funds. Mr. Carter also serves as Vice President, Associate General Counsel (2010-present) and is an employee of Fidelity Investments (2005-present). |
Holly C. Laurent (57) |
| Year of Election or Appointment: 2008 Anti-Money Laundering (AML) Officer of the Fidelity funds. Ms. Laurent also serves as AML Officer of The North Carolina Capital Management Trust: Cash and Term Portfolios (2008-present) and is an employee of Fidelity Investments. Previously, Ms. Laurent was Senior Vice President and Head of Legal for Fidelity Business Services India Pvt. Ltd. (2006-2008), and Senior Vice President, Deputy General Counsel and Group Head for FMR LLC (2005-2006). |
Christine Reynolds (52) |
| Year of Election or Appointment: 2008 Chief Financial Officer of the Fidelity funds. Ms. Reynolds became President of Fidelity Pricing and Cash Management Services (FPCMS) in August 2008. Ms. Reynolds served as Chief Operating Officer of FPCMS (2007-2008). Previously, Ms. Reynolds served as President, Treasurer, and Anti-Money Laundering officer of the Fidelity funds (2004-2007). |
Michael H. Whitaker (44) |
| Year of Election or Appointment: 2008 Chief Compliance Officer of Fidelity's Fixed Income and Asset Allocation Funds. Mr. Whitaker also serves as Chief Compliance Officer of The North Carolina Capital Management Trust: Cash and Term Portfolios (2008-present). Mr. Whitaker is an employee of Fidelity Investments (2007-present). Prior to joining Fidelity Investments, Mr. Whitaker worked at MFS Investment Management where he served as Senior Vice President and Chief Compliance Officer (2004-2006), and Assistant General Counsel. |
Jeffrey S. Christian (49) |
| Year of Election or Appointment: 2009 Deputy Treasurer of the Fidelity funds. Mr. Christian is an employee of Fidelity Investments. Previously, Mr. Christian served as Chief Financial Officer (2008-2009) of certain Fidelity funds and Senior Vice President of Fidelity Pricing and Cash Management Services (FPCMS) (2004-2009). |
Bryan A. Mehrmann (50) |
| Year of Election or Appointment: 2005 Deputy Treasurer of the Fidelity funds. Mr. Mehrmann is an employee of Fidelity Investments. |
Stephanie J. Dorsey (42) |
| Year of Election or Appointment: 2008 Deputy Treasurer of Fidelity's Fixed Income and Asset Allocation Funds. Ms. Dorsey also serves as Assistant Treasurer of other Fidelity funds (2010-present) and is an employee of Fidelity Investments (2008-present). Previously, Ms. Dorsey served as Treasurer (2004-2008) of the JPMorgan Mutual Funds and Vice President (2004-2008) of JPMorgan Chase Bank. |
Adrien E. Deberghes (43) |
| Year of Election or Appointment: 2010 Assistant Treasurer of Fidelity's Fixed Income and Asset Allocation Funds. Mr. Deberghes also serves as Deputy Treasurer of other Fidelity funds (2008-present) and is an employee of Fidelity Investments (2008-present). Previously, Mr. Deberghes served as Senior Vice President of Mutual Fund Administration at State Street Corporation (2007-2008), Senior Director of Mutual Fund Administration at Investors Bank & Trust (2005-2007), and Director of Finance for Dunkin' Brands (2000-2005). |
Kenneth B. Robins (41) |
| Year of Election or Appointment: 2009 Assistant Treasurer of the Fidelity Fixed Income and Asset Allocation Funds. Mr. Robins also serves as President and Treasurer of other Fidelity funds (2008-present; 2010-present) and is an employee of Fidelity Investments (2004-present). Previously, Mr. Robins served as Deputy Treasurer of the Fidelity funds (2005-2008) and Treasurer and Chief Financial Officer of The North Carolina Capital Management Trust: Cash and Term Portfolios (2006-2008). |
Gary W. Ryan (52) |
| Year of Election or Appointment: 2005 Assistant Treasurer of the Fidelity funds. Mr. Ryan is an employee of Fidelity Investments. Previously, Mr. Ryan served as Vice President of Fund Reporting in Fidelity Pricing and Cash Management Services (FPCMS) (1999-2005). |
Jonathan Davis (43) |
| Year of Election or Appointment: 2010 Assistant Treasurer of the Fidelity funds. Mr. Davis is an employee of Fidelity Investments. Previously, Mr. Davis served as Vice President and Associate General Counsel of FMR LLC (2003-2010). |
Annual Report
The fund hereby designates as a capital gain dividend with respect to the taxable year ended July 31, 2011, $73,201,895, or, if subsequently determined to be different, the net capital gain of such year.
A total of 45.92% of the dividends distributed during the fiscal year was derived from interest on U.S. Government securities which is generally exempt from state income tax.
The fund designates $64,328,834 of distributions paid during the period January 1, 2011 to July 31, 2011 as qualifying to be taxed as interest-related dividends for nonresident alien shareholders.
The fund will notify shareholders in January 2012 of amounts for use in preparing 2011 income tax returns.
Annual Report
Managing Your Investments
Fidelity offers several ways to conveniently manage your personal investments via your telephone or PC. You can access your account information, conduct trades and research your investments 24 hours a day.
By Phone
Fidelity Automated Service Telephone provides a single toll-free number to access account balances, positions, quotes and trading. It's easy to navigate the service, and on your first call, the system will help you create a personal identification number (PIN) for security.
(phone_graphic)
Fidelity Automated
Service Telephone (FAST®)
1-800-544-5555
Press
For mutual fund and brokerage trading.
For quotes.*
For account balances and holdings.
To review orders and mutual
fund activity.
To change your PIN.
To speak to a Fidelity representative.
By PC
Fidelity's web site on the Internet provides a wide range of information, including daily financial news, fund performance, interactive planning tools and news about Fidelity products and services.
(computer_graphic)
Fidelity's Web Site
www.fidelity.com
* When you call the quotes line, please remember that a fund's yield and return will vary and, except for money market funds, share price will also vary. This means that you may have a gain or loss when you sell your shares. There is no assurance that money market funds will be able to maintain a stable $1 share price; an investment in a money market fund is not insured or guaranteed by the U.S. government. Total returns are historical and include changes in share price, reinvestment of dividends and capital gains distributions, and the effects of any sales charges.
Annual Report
To Write Fidelity
We'll give your correspondence immediate attention and send you written confirmation upon completion of your request.
(letter_graphic)
Making Changes
To Your Account
(such as changing name, address, bank, etc.)
Fidelity Investments
P.O. Box 770001
Cincinnati, OH 45277-0002
(letter_graphic)
For Non-Retirement
Accounts
Buying shares
Fidelity Investments
P.O. Box 770001
Cincinnati, OH 45277-0003
Overnight Express
Fidelity Investments
Attn: Distribution Services
100 Crosby Parkway - KC1H
Covington, KY 41015
Selling shares
Fidelity Investments
P.O. Box 770001
Cincinnati, OH 45277-0035
Overnight Express
Fidelity Investments
Attn: Distribution Services
100 Crosby Parkway - KC1H
Covington, KY 41015
General Correspondence
Fidelity Investments
P.O. Box 500
Merrimack, NH 03054-0500
(letter_graphic)
For Retirement
Accounts
Buying shares
Fidelity Investments
P.O. Box 770001
Cincinnati, OH 45277-0003
Selling shares
Fidelity Investments
P.O. Box 770001
Cincinnati, OH 45277-0035
Overnight Express
Fidelity Investments
Attn: Distribution Services
100 Crosby Parkway - KC1H
Covington, KY 41015
General Correspondence
Fidelity Investments
P.O. Box 500
Merrimack, NH 03054-0500
Annual Report
To Visit Fidelity
For directions and hours,
please call 1-800-544-9797.
Arizona
7001 West Ray Road
Chandler, AZ
15445 N. Scottsdale Road
Scottsdale, AZ
17550 North 75th Avenue
Glendale, AZ
5330 E. Broadway Blvd
Tucson, AZ
California
815 East Birch Street
Brea, CA
1411 Chapin Avenue
Burlingame, CA
851 East Hamilton Avenue
Campbell, CA
601 Larkspur Landing Circle
Larkspur, CA
2000 Avenue of the Stars
Los Angeles, CA
27101 Puerta Real
Mission Viejo, CA
73575 El Paseo
Palm Desert, CA
251 University Avenue
Palo Alto, CA
123 South Lake Avenue
Pasadena, CA
16656 Bernardo Ctr. Drive
Rancho Bernardo, CA
1220 Roseville Parkway
Roseville, CA
1740 Arden Way
Sacramento, CA
7676 Hazard Center Drive
San Diego, CA
11943 El Camino Real
San Diego, CA
8 Montgomery Street
San Francisco, CA
3793 State Street
Santa Barbara, CA
1200 Wilshire Boulevard
Santa Monica, CA
398 West El Camino Real
Sunnyvale, CA
111 South Westlake Blvd
Thousand Oaks, CA
21701 Hawthorne Boulevard
Torrance, CA
2001 North Main Street
Walnut Creek, CA
6326 Canoga Avenue
Woodland Hills, CA
2211 Michelson Drive
Irvine, CA
Colorado
281 East Flatiron Circle
Broomfield, CO
1625 Broadway
Denver, CO
9185 Westview Road
Lone Tree, CO
Connecticut
48 West Putnam Avenue
Greenwich, CT
265 Church Street
New Haven, CT
300 Atlantic Street
Stamford, CT
29 South Main Street
West Hartford, CT
1261 Post Road
Fairfield, CT
Delaware
400 Delaware Avenue
Wilmington, DE
Florida
175 East Altamonte Drive
Altamonte Springs, FL
1400 Glades Road
Boca Raton, FL
121 Alhambra Plaza
Coral Gables, FL
2948 N. Federal Highway
Ft. Lauderdale, FL
4671 Town Center Parkway
Jacksonville, FL
8880 Tamiami Trail, North
Naples, FL
230 Royal Palm Way
Palm Beach, FL
3501 PGA Boulevard
Palm Beach Gardens, FL
3550 Tamiami Trail, South
Sarasota, FL
1502 N. Westshore Blvd.
Tampa, FL
2465 State Road 7
Wellington, FL
Georgia
3242 Peachtree Road
Atlanta, GA
1000 Abernathy Road
Atlanta, GA
Illinois
One North LaSalle Street
Chicago, IL
401 North Michigan Avenue
Chicago, IL
One Skokie Valley Road
Highland Park, IL
1415 West 22nd Street
Oak Brook, IL
15105 S LaGrange Road
Orland Park, IL
1572 East Golf Road
Schaumburg, IL
1823 Freedom Drive
Naperville, IL
Indiana
8480 Keystone Crossing
Indianapolis, IN
Kansas
5400 College Boulevard
Overland Park, KS
Maine
Three Canal Plaza
Portland, ME
Maryland
7315 Wisconsin Avenue
Bethesda, MD
610 York Road
Towson, MD
Massachusetts
801 Boylston Street
Boston, MA
155 Congress Street
Boston, MA
300 Granite Street
Braintree, MA
44 Mall Road
Burlington, MA
238 Main Street
Cambridge, MA
200 Endicott Street
Danvers, MA
Fidelity Brokerage Services, Inc., 100 Summer St., Boston, MA 02110 Member NYSE/SIPC
Annual Report
405 Cochituate Road
Framingham, MA
551 Boston Turnpike
Shrewsbury, MA
Michigan
500 E. Eisenhower Pkwy.
Ann Arbor, MI
280 N. Old Woodward Ave.
Birmingham, MI
30200 Northwestern Hwy.
Farmington Hills, MI
43420 Grand River Avenue
Novi, MI
3480 28th Street
Grand Rapids, MI
2425 S. Linden Road STE E
Flint, MI
Minnesota
7740 France Avenue South
Edina, MN
8342 3rd Street North
Oakdale, MN
Missouri
1524 South Lindbergh Blvd.
St. Louis, MO
Nevada
2225 Village Walk Drive
Henderson, NV
New Jersey
501 Route 73 South
Marlton, NJ
150 Essex Street
Millburn, NJ
35 Morris Street
Morristown, NJ
396 Route 17, North
Paramus, NJ
3518 Route 1 North
Princeton, NJ
530 Broad Street
Shrewsbury, NJ
New Mexico
2261 Q Street NE
Albuquerque, NM
New York
1130 Franklin Avenue
Garden City, NY
37 West Jericho Turnpike
Huntington Station, NY
1271 Avenue of the Americas
New York, NY
980 Madison Avenue
New York, NY
61 Broadway
New York, NY
350 Park Avenue
New York, NY
200 Fifth Avenue
New York, NY
733 Third Avenue
New York, NY
2070 Broadway
New York, NY
1075 Northern Blvd.
Roslyn, NY
799 Central Park Avenue
Scarsdale, NY
3349 Monroe Avenue
Rochester, NY
North Carolina
4611 Sharon Road
Charlotte, NC
7011 Fayetteville Road
Durham, NC
Ohio
3805 Edwards Road
Cincinnati, OH
1324 Polaris Parkway
Columbus, OH
1800 Crocker Road
Westlake, OH
28699 Chagrin Boulevard
Woodmere Village, OH
Oregon
7493 SW Bridgeport Road
Tigard, OR
Pennsylvania
600 West DeKalb Pike
King of Prussia, PA
1735 Market Street
Philadelphia, PA
12001 Perry Highway
Wexford, PA
Rhode Island
10 Memorial Boulevard
Providence, RI
Tennessee
3018 Peoples Street
Johnson City, TN
7628 West Farmington Blvd.
Germantown, TN
2035 Mallory Lane
Franklin, TN
Texas
10000 Research Boulevard
Austin, TX
4001 Northwest Parkway
Dallas, TX
12532 Memorial Drive
Houston, TX
2701 Drexel Drive
Houston, TX
6560 Fannin Street
Houston, TX
1701 Lake Robbins Drive
The Woodlands, TX
6500 N. MacArthur Blvd.
Irving, TX
6005 West Park Boulevard
Plano, TX
1576 East Southlake Blvd.
Southlake, TX
15600 Southwest Freeway
Sugar Land, TX
139 N. Loop 1604 East
San Antonio, TX
Utah
279 West South Temple
Salt Lake City, UT
Virginia
1861 International Drive
McLean, VA
11957 Democracy Drive
Reston, VA
Washington
10500 NE 8th Street
Bellevue, WA
1518 6th Avenue
Seattle, WA
304 Strander Blvd
Tukwila, WA
Washington, DC
1900 K Street, N.W.
Washington, DC
Wisconsin
16020 West Bluemound Road
Brookfield, WI
Annual Report
Investment Adviser
Fidelity Management & Research Company
Boston, MA
Investment Sub-Advisers
Fidelity Management & Research
(U.K.) Inc.
Fidelity Investments
Money Management, Inc.
Fidelity Management & Research
(Hong Kong) Limited
Fidelity Management & Research
(Japan) Inc.
General Distributor
Fidelity Distributors Corporation
Boston, MA
Transfer and Service Agents
Fidelity Investments Institutional
Operations Company, Inc.
Boston, MA
Fidelity Service Company, Inc.
Boston, MA
Custodian
The Bank of New York Mellon
New York, NY
The Fidelity Telephone Connection
Mutual Fund 24-Hour Service
Exchanges/Redemptions
and Account Assistance 1-800-544-6666
Product Information 1-800-544-6666
Retirement Accounts 1-800-544-4774
(8 a.m. - 9 p.m.)
TDD Service 1-800-544-0118
for the deaf and hearing impaired
(9 a.m. - 9 p.m. Eastern time)
Fidelity Automated Service
Telephone (FAST)
1-800-544-5555
Automated line for quickest service
GOV-UANN-0911
1.789246.108

(Fidelity Investment logo)(registered trademark)
Fidelity Advisor®
Government Income
Fund - Class A, Class T, Class B
and Class C
Annual Report
July 31, 2011
Class A, Class T, Class B, and Class C are classes of Fidelity® Government Income Fund
(2_fidelity_logos) (Registered_Trademark)
Contents
Chairman's Message | <Click Here> | The Chairman's message to shareholders. |
Performance | <Click Here> | How the fund has done over time. |
Management's Discussion of Fund Performance | <Click Here> | The Portfolio Manager's review of fund performance and strategy. |
Shareholder Expense Example | <Click Here> | An example of shareholder expenses. |
Investment Changes | <Click Here> | A summary of major shifts in the fund's investments over the past six months. |
Investments | <Click Here> | A complete list of the fund's investments with their market values. |
Financial Statements | <Click Here> | Statements of assets and liabilities, operations, and changes in net assets, as well as financial highlights. |
Notes | <Click Here> | Notes to the financial statements. |
Report of Independent Registered Public Accounting Firm | <Click Here> | |
Trustees and Officers | <Click Here> | |
Distributions | <Click Here> | |
To view a fund's proxy voting guidelines and proxy voting record for the 12-month period ended June 30, visit http://www.fidelity.com/proxyvotingresults or visit the Securities and Exchange Commission's (SEC) web site at http://www.sec.gov. You may also call 1-877-208-0098 to request a free copy of the proxy voting guidelines.
Standard & Poor's, S&P and S&P 500 are registered service marks of The McGraw-Hill Companies, Inc. and have been licensed for use by Fidelity Distributors Corporation.
Other third party marks appearing herein are the property of their respective owners.
All other marks appearing herein are registered or unregistered trademarks or service marks of FMR LLC or an affiliated company.
Annual Report
This report and the financial statements contained herein are submitted for the general information of the shareholders of the fund. This report is not authorized for distribution to prospective investors in the fund unless preceded or accompanied by an effective prospectus.
A fund files its complete schedule of portfolio holdings with the SEC for the first and third quarters of each fiscal year on Form N-Q. Forms N-Q are available on the SEC's web site at http://www.sec.gov. A fund's Forms N-Q may be reviewed and copied at the SEC's Public Reference Room in Washington, DC. Information regarding the operation of the SEC's Public Reference Room may be obtained by calling 1-800-SEC-0330. For a complete list of a fund's portfolio holdings, view the most recent holdings listing, semiannual report, or annual report on Fidelity's web site at http://www.fidelity.com, http://www.advisor.fidelity.com, or http://www.401k.com, as applicable.
NOT FDIC INSURED • MAY LOSE VALUE • NO BANK GUARANTEE
Neither the fund nor Fidelity Distributors Corporation is a bank.
Annual Report
(photo_of_Abigail_P_Johnson)
Dear Shareholder:
The second half of 2011 began with U.S. equities continuing to give back some of the gains achieved earlier in the year. In the days leading up to July 31, markets were shaken by a political stalemate in which Congress struggled to address the debt ceiling issue before an early-August deadline. The resulting uncertainty held back markets in July, the third consecutive monthly decline for equities, effectively reversing the positive momentum seen through the end of April. Financial markets are always unpredictable, of course, but there are several time-tested investment principles that can help put the odds in your favor.
One of the basic tenets is to invest for the long term. Over time, riding out the markets' inevitable ups and downs has proven much more effective than selling into panic or chasing the hottest trend. Even missing only a few of the markets' best days can significantly diminish investor returns. Patience also affords the benefits of compounding - of earning interest on additional income or reinvested dividends and capital gains. There can be tax advantages and cost benefits to consider as well. While staying the course doesn't eliminate risk, it can considerably lessen the effect of short-term declines.
You can further manage your investing risk through diversification. And today, more than ever, geographic diversification should be taken into account. Studies indicate that asset allocation is the single most important determinant of a portfolio's long-term success. The right mix of stocks, bonds and cash - aligned to your particular risk tolerance and investment objective - is very important. Age-appropriate rebalancing is also an essential aspect of asset allocation. For younger investors, an emphasis on equities - which historically have been the best-performing asset class over time - is encouraged. As investors near their specific goal, such as retirement or sending a child to college, consideration may be given to replacing volatile assets (e.g. common stocks) with more-stable fixed investments (bonds or savings plans).
A third principle - investing regularly - can help lower the average cost of your purchases. Investing a certain amount of money each month or quarter helps ensure you won't pay for all your shares at market highs. This strategy - known as dollar cost averaging - also reduces "emotion" from investing, helping shareholders avoid selling weak performers just prior to an upswing, or chasing a hot performer just before a correction.
We invite you to contact us via the Internet, through our Investor Centers or by phone. It is our privilege to provide you the information you need to make the investments that are right for you.
Sincerely,
(The chairman's signature appears here.)
Abigail P. Johnson
Annual Report
Average annual total return reflects the change in the value of an investment, assuming reinvestment of the class' distributions from dividend income and capital gains (the profits earned upon the sale of securities that have grown in value, if any) and assuming a constant rate of performance each year. The $10,000 table and the fund's returns do not reflect the deduction of taxes that a shareholder would pay on fund distributions or the redemption of fund shares. During periods of reimbursement by Fidelity, a fund's total return will be greater than it would be had the reimbursement not occurred. How a fund did yesterday is no guarantee of how it will do tomorrow.
Average Annual Total Returns
Periods ended July 31, 2011 | Past 1
year | Past 5
years | Past 10
years |
Class A (incl. 4.00% sales charge) A | -1.18% | 5.20% | 4.75% |
Class T (incl. 4.00% sales charge) B | -1.25% | 5.19% | 4.75% |
Class B (incl. contingent deferred sales charge) C | -2.83% | 4.99% | 4.81% |
Class C (incl. contingent deferred sales charge) D | 1.10% | 5.30% | 4.80% |
A As of April 1, 2007, Class A shares bear a 0.25% 12b-1 fee. The initial offering of Class A shares took place on October 24, 2006. Returns between October 24, 2006 and March 31, 2007 reflect a 0.15% 12b-1 fee. Returns prior to October 24, 2006 are those of Fidelity Government Income Fund, the original class of the fund, which does not bear a 12b-1 fee. Had Class A shares' current 12b-1 fee been reflected, returns prior to April 1, 2007, would have been lower.
B Class T shares bear a 0.25% 12b-1 fee. The initial offering of Class T shares took place on October 24, 2006. Returns prior to October 24, 2006 are those of Fidelity Government Income Fund, the original class of the fund, which does not bear a 12b-1 fee. Had Class T shares' 12b-1 fee been reflected, returns prior to October 24, 2006, would have been lower.
C Class B shares bear a 0.90% 12b-1 fee. The initial offering of Class B shares took place on October 24, 2006. Returns prior to October 24, 2006 are those of Fidelity Government Income Fund, the original class of the fund, which does not bear a 12b-1 fee. Had Class B shares' 12b-1 fee been reflected, returns prior to October 24, 2006, would have been lower. Class B shares' contingent deferred sales charges included in the past one year, past five years, and past ten years total return figures are 5%, 2%, and 0%, respectively.
D Class C shares bear a 1.00% 12b-1 fee. The initial offering of Class C shares took place on October 24, 2006. Returns prior to October 24, 2006 are those of Fidelity Government Income Fund, the original class of the fund, which does not bear a 12b-1 fee. Had Class C shares' 12b-1 fee been reflected, returns prior to October 24, 2006, would have been lower. Class C shares' contingent deferred sales charges included in the past one year, past five years, and past ten years total return figures are 1%, 0%, and 0%, respectively.
Annual Report
$10,000 Over 10 Years
Let's say hypothetically that $10,000 was invested in Fidelity Advisor® Government Income Fund - Class A on July 31, 2001, and the current 4.00% sales charge was paid. The chart shows how the value of your investment would have changed, and also shows how the Barclays Capital U.S. Government Bond Index performed over the same period. The initial offering of Class A took place on October 24, 2006. See the previous page for additional information regarding the performance of Class A.
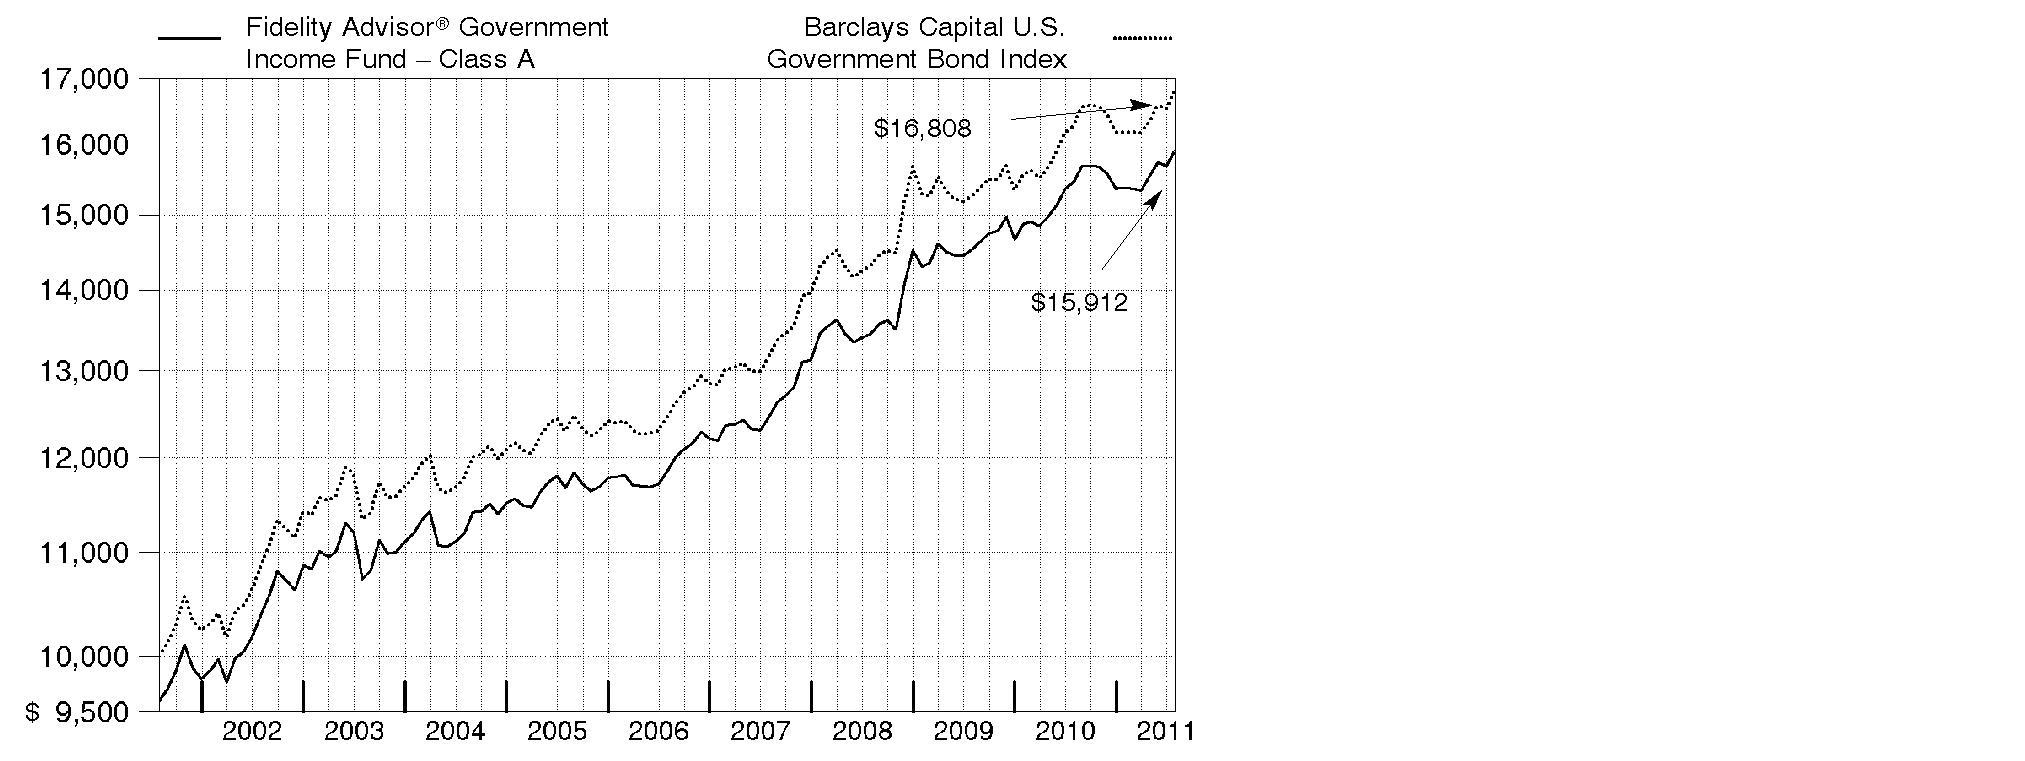
Annual Report
Market Recap: Amid ultra-low interest rates and heightened market volatility, U.S. taxable investment-grade bonds generated solid results for the year ending July 31, 2011, as evidenced by the 4.44% advance of the Barclays Capital® U.S. Aggregate Bond Index. The best-performing categories within the index were those on the riskier end of the spectrum that benefited during intervals when data pointed to an improving economy. Buoyed by a strong first-half showing, commercial mortgage-backed securities (CMBS) fared best, gaining 10.01% amid modest improvement in commercial real estate fundamentals. Corporate bonds rose 6.70%, due in large part to increased corporate profitability, high cash balances, reduced debt levels and improved credit conditions. Residential mortgage-backed securities, supported by a combination of strong demand from yield-hungry investors and slower prepayment rates, rose a solid 3.85%. Meanwhile, U.S. Treasury and agency securities gained 3.39% and 2.53%, respectively. These securities, which lagged in the first half of the period, when economic data was strong and inflation worries were muted, performed comparatively well in the second half amid signs of a weakening economic recovery and heightened concern about the sovereign debt crisis in Europe.
Comments from William Irving, Lead Portfolio Manager of Fidelity Advisor® Government Income Fund: For the year, the fund's Class A, Class T, Class B and Class C shares returned 2.94%, 2.86%, 2.10% and 2.09%, respectively (excluding sales charges), while the Barclays Capital® 75% U.S. Government/25% U.S. MBS Blended Index rose 3.41%. Emphasizing sectors with a yield advantage over conventional Treasuries helped bolster the fund's performance. Specifically, out-of-benchmark exposure to strong-performing Treasury Inflation-Protected Securities (TIPS), which we ultimately eliminated by the end of the period, and favorable positioning within the mortgage sector aided results. The fund gained from both an overweighting and good security selection within mortgages. Specifically, emphasizing prepayment-resistant securities worked in our favor during the period's first half. We also modestly benefited from owning collateralized mortgage obligation (CMO) floaters. Detracting from performance was out-of-index exposure to reverse mortgage securities, which lagged, and ineffective yield-curve positioning.
Note to shareholders: Effective August 1, 2011, the fund will have the ability to invest in agency MBS indirectly through Fidelity Mortgage Backed Securities Central Fund. In connection with this change, the fund's fiscal year end will shift from July 31 to August 31 to align it with that of the central fund.
The views expressed above reflect those of the portfolio manager(s) only through the end of the period as stated on the cover of this report and do not necessarily represent the views of Fidelity or any other person in the Fidelity organization. Any such views are subject to change at any time based upon market or other conditions and Fidelity disclaims any responsibility to update such views. These views may not be relied on as investment advice and, because investment decisions for a Fidelity fund are based on numerous factors, may not be relied on as an indication of trading intent on behalf of any Fidelity fund.
Annual Report
Shareholder Expense Example
As a shareholder of the Fund, you incur two types of costs: (1) transaction costs, including sales charges (loads) on purchase payments or redemption proceeds, and (2) ongoing costs, including management fees, distribution and/or service (12b-1) fees and other Fund expenses. This Example is intended to help you understand your ongoing costs (in dollars) of investing in the Fund and to compare these costs with the ongoing costs of investing in other mutual funds.
The Example is based on an investment of $1,000 invested at the beginning of the period and held for the entire period (February 1, 2011 to July 31, 2011).
Actual Expenses
The first line of the accompanying table for each class of the Fund provides information about actual account values and actual expenses. You may use the information in this line, together with the amount you invested, to estimate the expenses that you paid over the period. Simply divide your account value by $1,000.00 (for example, an $8,600 account value divided by $1,000.00 = 8.6), then multiply the result by the number in the first line for a class of the Fund under the heading entitled "Expenses Paid During Period" to estimate the expenses you paid on your account during this period. A small balance maintenance fee of $12.00 that is charged once a year may apply for certain accounts with a value of less than $2,000. This fee is not included in the table below. If it was, the estimate of expenses you paid during the period would be higher, and your ending account value lower, by this amount.
Hypothetical Example for Comparison Purposes
The second line of the accompanying table for each class of the Fund provides information about hypothetical account values and hypothetical expenses based on a Class' actual expense ratio and an assumed rate of return of 5% per year before expenses, which is not the Class' actual return. The hypothetical account values and expenses may not be used to estimate the actual ending account balance or expenses you paid for the period. You may use this information to compare the ongoing costs of investing in the Fund and other funds. To do so, compare this 5% hypothetical example with the 5% hypothetical examples that appear in the shareholder reports of the other funds. A small balance maintenance fee of $12.00 that is charged once a year may apply for certain accounts with a value of less than $2,000. This fee is not included in the table below. If it was, the estimate of expenses you paid during the period would be higher, and your ending account value lower, by this amount.
Please note that the expenses shown in the table are meant to highlight your ongoing costs only and do not reflect any transaction costs. Therefore, the second line of the table is useful in comparing ongoing costs only, and will not help you determine the relative total costs of owning different funds. In addition, if these transactional costs were included, your costs would have been higher.
Annual Report
| Annualized
Expense Ratio | Beginning
Account Value
February 1, 2011 | Ending
Account Value
July 31, 2011 | Expenses Paid
During Period*
February 1, 2011
to July 31, 2011 |
Class A | .78% | | | |
Actual | | $ 1,000.00 | $ 1,035.30 | $ 3.94 |
Hypothetical A | | $ 1,000.00 | $ 1,020.93 | $ 3.91 |
Class T | .76% | | | |
Actual | | $ 1,000.00 | $ 1,035.40 | $ 3.84 |
HypotheticalA | | $ 1,000.00 | $ 1,021.03 | $ 3.81 |
Class B | 1.51% | | | |
Actual | | $ 1,000.00 | $ 1,031.60 | $ 7.61 |
HypotheticalA | | $ 1,000.00 | $ 1,017.31 | $ 7.55 |
Class C | 1.53% | | | |
Actual | | $ 1,000.00 | $ 1,031.50 | $ 7.71 |
HypotheticalA | | $ 1,000.00 | $ 1,017.21 | $ 7.65 |
Government Income | .45% | | | |
Actual | | $ 1,000.00 | $ 1,037.00 | $ 2.27 |
HypotheticalA | | $ 1,000.00 | $ 1,022.56 | $ 2.26 |
Institutional Class | .52% | | | |
Actual | | $ 1,000.00 | $ 1,036.60 | $ 2.63 |
HypotheticalA | | $ 1,000.00 | $ 1,022.22 | $ 2.61 |
A 5% return per year before expenses
* Expenses are equal to each Class' annualized expense ratio, multiplied by the average account value over the period, multiplied by 181/365 (to reflect the one-half year period).
Annual Report
Investment Changes (Unaudited)
Coupon Distribution as of July 31, 2011 |
| % of fund's investments | % of fund's investments
6 months ago |
Zero coupon bonds | 1.9 | 1.3 |
0.01 - 0.99% | 14.8 | 8.9 |
1 - 1.99% | 14.2 | 15.3 |
2 - 2.99% | 9.8 | 12.7 |
3 - 3.99% | 6.9 | 15.1 |
4 - 4.99% | 19.8 | 14.9 |
5 - 5.99% | 14.8 | 16.2 |
6 - 6.99% | 4.3 | 7.6 |
7% and over | 0.7 | 4.0 |
Coupon distribution shows the range of stated interest rates on the fund's investments, excluding short-term investments. |
Weighted Average Maturity as of July 31, 2011 |
| | 6 months ago |
Years | 5.3 | 6.0 |
This is a weighted average of all the maturities of the securities held in a fund. Weighted Average Maturity (WAM) can be used as a measure of sensitivity to interest rate changes and markets changes. Generally, the longer the maturity, the greater the sensitivity to such changes. WAM is based on the dollar-weighted average length of time until principal payments must be paid. Depending on the types of securities held in a fund, certain maturity shortening devices (e.g., demand features, interest rate resets, and call options) may be taken into account when calculating the WAM. |
Duration as of July 31, 2011 |
| | 6 months ago |
Years | 4.7 | 4.5 |
Duration estimates how much a bond fund's price will change with a change in comparable interest rates. If rates rise 1%, for example, a fund with a 5-year duration is likely to lose about 5% of its value. Other factors also can influence a bond fund's performance and share price. Accordingly, a bond fund's actual performance may differ from this example. Duration takes into account any call or put option embedded in the bonds. |
Asset Allocation (% of fund's net assets) |
As of July 31, 2011 * | As of January 31, 2011 ** |
| Mortgage
Securities 29.6% | | | Mortgage
Securities 39.6% | |
| CMOs and Other Mortgage Related Securities 10.2% | | | CMOs and Other Mortgage Related Securities 9.3% | |
| U.S. Treasury
Obligations 47.2% | | | U.S. Treasury
Obligations 48.6% | |
| U.S. Government
Agency
Obligations† 13.0% | | | U.S. Government
Agency
Obligations† 16.4% | |
| Foreign Government
& Government
Agency Obligations 1.5% | | | Foreign Government
& Government
Agency Obligations 1.4% | |
| Short-Term
Investments and
Net Other
Assets*** (1.5)% | | | Short-Term
Investments and
Net Other
Assets*** (15.3)% | |
* Futures and Swaps | 2.9% | | ** Futures and Swaps | (2.5)% | |
† Includes FDIC Guaranteed Corporate Securities and NCUA Guaranteed Notes. | |
*** Short-Term Investments and Net Other Assets are not included in the pie chart. | |

Annual Report
Investments July 31, 2011
Showing Percentage of Net Assets
U.S. Government and Government Agency Obligations - 60.2% |
| Principal Amount (000s) | | Value (000s) |
U.S. Government Agency Obligations - 6.5% |
Fannie Mae: | | | | |
0.375% 12/28/12 | | $ 50,670 | | $ 50,692 |
0.75% 12/18/13 | | 7,805 | | 7,819 |
1.125% 6/27/14 | | 16,915 | | 17,098 |
4.75% 11/19/12 | | 2,000 | | 2,113 |
Federal Home Loan Bank: | | | | |
0.5% 8/28/13 | | 91,450 | | 91,447 |
0.875% 8/22/12 | | 8,580 | | 8,627 |
Freddie Mac 1% 8/27/14 | | 15,111 | | 15,189 |
Overseas Private Investment Corp. U.S. Government guaranteed participation certificates 6.77% 11/15/13 | | 2,558 | | 2,712 |
Private Export Funding Corp. secured: | | | | |
4.974% 8/15/13 | | 22,940 | | 24,937 |
5.66% 9/15/11 (c) | | 18,000 | | 18,112 |
5.685% 5/15/12 | | 24,035 | | 25,046 |
Small Business Administration guaranteed development participation certificates: | | | | |
Series 2002-20J Class 1, 4.75% 10/1/22 | | 3,859 | | 4,133 |
Series 2002-20K Class 1, 5.08% 11/1/22 | | 8,140 | | 8,791 |
Series 2003-P10B, Class 1 5.136% 8/10/13 | | 2,114 | | 2,235 |
Series 2004-20H Class 1, 5.17% 8/1/24 | | 2,445 | | 2,654 |
Tennessee Valley Authority: | | | | |
3.875% 2/15/21 | | 33,790 | | 35,714 |
5.25% 9/15/39 | | 12,000 | | 13,135 |
5.375% 4/1/56 | | 8,429 | | 9,377 |
TOTAL U.S. GOVERNMENT AGENCY OBLIGATIONS | | 339,831 |
U.S. Treasury Obligations - 47.2% |
U.S. Treasury Bonds: | | | | |
4.375% 2/15/38 | | 14,154 | | 14,809 |
4.375% 5/15/41 | | 176,866 | | 183,803 |
5% 5/15/37 (g) | | 55,700 | | 64,281 |
5.25% 2/15/29 | | 34,950 | | 41,913 |
6.125% 11/15/27 | | 27,365 | | 35,904 |
6.125% 8/15/29 | | 2,877 | | 3,797 |
8% 11/15/21 | | 14,605 | | 21,364 |
9.875% 11/15/15 | | 10,285 | | 14,110 |
U.S. Treasury Notes: | | | | |
0.375% 6/30/13 (b) | | 249,596 | | 249,693 |
0.5% 5/31/13 | | 51,764 | | 51,908 |
0.625% 7/15/14 (b) | | 310,712 | | 311,489 |
U.S. Government and Government Agency Obligations - continued |
| Principal Amount (000s) | | Value (000s) |
U.S. Treasury Obligations - continued |
U.S. Treasury Notes: - continued | | | | |
0.75% 6/15/14 | | $ 91,489 | | $ 92,089 |
1% 4/30/12 | | 602 | | 605 |
1.25% 8/31/15 | | 500 | | 506 |
1.25% 10/31/15 | | 29,580 | | 29,843 |
1.375% 11/15/12 | | 79,743 | | 80,858 |
1.5% 7/31/16 | | 315,993 | | 318,192 |
1.75% 7/31/15 | | 28,800 | | 29,738 |
1.875% 8/31/17 | | 47,000 | | 47,290 |
1.875% 9/30/17 | | 87,400 | | 87,748 |
2.125% 5/31/15 | | 18,669 | | 19,572 |
2.25% 7/31/18 | | 260,091 | | 262,631 |
2.375% 8/31/14 | | 20,000 | | 21,091 |
2.375% 9/30/14 | | 13,017 | | 13,733 |
2.375% 10/31/14 | | 77,497 | | 81,814 |
2.5% 6/30/17 | | 10,000 | | 10,450 |
2.625% 7/31/14 (h) | | 83,808 | | 88,974 |
2.75% 11/30/16 | | 18,530 | | 19,740 |
3.125% 1/31/17 | | 60,773 | | 65,858 |
3.125% 5/15/21 | | 71,904 | | 73,904 |
3.625% 8/15/19 | | 33,225 | | 36,340 |
4% 2/15/15 | | 12,619 | | 14,062 |
4.25% 11/15/17 | | 27,475 | | 31,502 |
4.5% 5/15/17 | | 24,685 | | 28,619 |
4.75% 8/15/17 | | 12,983 | | 15,258 |
TOTAL U.S. TREASURY OBLIGATIONS | | 2,463,488 |
Other Government Related - 6.5% |
Bank of America Corp.: | | | | |
2.1% 4/30/12 (FDIC Guaranteed) (d) | | 6,060 | | 6,143 |
3.125% 6/15/12 (FDIC Guaranteed) (d) | | 3,719 | | 3,810 |
Citibank NA: | | | | |
1.875% 5/7/12 (FDIC Guaranteed) (d) | | 87,150 | | 88,209 |
1.875% 6/4/12 (FDIC Guaranteed) (d) | | 33,000 | | 33,436 |
Citigroup Funding, Inc.: | | | | |
1.875% 10/22/12 (FDIC Guaranteed) (d) | | 40,500 | | 41,262 |
1.875% 11/15/12 (FDIC Guaranteed) (d) | | 18,920 | | 19,278 |
2% 3/30/12 (FDIC Guaranteed) (d) | | 16,000 | | 16,199 |
2.125% 7/12/12 (FDIC Guaranteed) (d) | | 8,784 | | 8,939 |
General Electric Capital Corp.: | | | | |
2% 9/28/12 (FDIC Guaranteed) (d) | | 11,000 | | 11,208 |
U.S. Government and Government Agency Obligations - continued |
| Principal Amount (000s) | | Value (000s) |
Other Government Related - continued |
General Electric Capital Corp.: - continued | | | | |
2.625% 12/28/12 (FDIC Guaranteed) (d) | | $ 16,154 | | $ 16,690 |
3% 12/9/11 (FDIC Guaranteed) (d) | | 4,720 | | 4,767 |
GMAC, Inc. 1.75% 10/30/12 (FDIC Guaranteed) (d) | | 51,106 | | 51,960 |
Goldman Sachs Group, Inc. 3.25% 6/15/12 (FDIC Guaranteed) (d) | | 3,714 | | 3,808 |
JPMorgan Chase & Co.: | | | | |
2.2% 6/15/12 (FDIC Guaranteed) (d) | | 9,200 | | 9,354 |
3.125% 12/1/11 (FDIC Guaranteed) (d) | | 790 | | 798 |
National Credit Union Administration Guaranteed Notes: | | | | |
Series 2010-A1 Class A, 0.5351% 12/7/20 (NCUA Guaranteed) (i) | | 11,813 | | 11,846 |
Series 2011-R4 Class 1A, 0.5698% 3/6/20 (NCUA Guaranteed) (i) | | 12,418 | | 12,424 |
TOTAL OTHER GOVERNMENT RELATED | | 340,131 |
TOTAL U.S. GOVERNMENT AND GOVERNMENT AGENCY OBLIGATIONS (Cost $3,073,941) | 3,143,450 |
U.S. Government Agency - Mortgage Securities - 29.6% |
|
Fannie Mae - 18.5% |
1.975% 10/1/33 (i) | | 300 | | 311 |
2.01% 2/1/33 (i) | | 309 | | 320 |
2.035% 12/1/34 (i) | | 352 | | 364 |
2.035% 3/1/35 (i) | | 283 | | 294 |
2.054% 10/1/33 (i) | | 148 | | 155 |
2.065% 7/1/35 (i) | | 139 | | 145 |
2.175% 3/1/35 (i) | | 58 | | 61 |
2.297% 11/1/33 (i) | | 827 | | 858 |
2.457% 3/1/35 (i) | | 179 | | 189 |
2.509% 2/1/36 (i) | | 696 | | 734 |
2.534% 7/1/34 (i) | | 173 | | 180 |
2.534% 7/1/35 (i) | | 584 | | 613 |
2.543% 6/1/36 (i) | | 249 | | 261 |
2.554% 10/1/33 (i) | | 254 | | 268 |
2.584% 11/1/36 (i) | | 209 | | 220 |
2.603% 5/1/36 (i) | | 465 | | 488 |
3.47% 3/1/40 (i) | | 11,245 | | 11,778 |
U.S. Government Agency - Mortgage Securities - continued |
| Principal Amount (000s) | | Value (000s) |
Fannie Mae - continued |
3.5% 12/1/25 to 2/1/41 | | $ 116,319 | | $ 115,900 |
3.688% 5/1/40 (i) | | 6,190 | | 6,498 |
3.698% 5/1/40 (i) | | 7,335 | | 7,703 |
3.791% 6/1/40 (i) | | 6,350 | | 6,679 |
3.972% 11/1/39 (i) | | 5,571 | | 5,883 |
4% 9/1/13 to 7/1/41 | | 85,281 | | 87,238 |
4.5% 6/1/25 to 7/1/41 | | 150,438 | | 157,250 |
4.5% 8/1/26 (e) | | 1,000 | | 1,063 |
4.5% 8/1/41 (e)(f) | | 40,000 | | 41,746 |
4.5% 8/1/41 (e)(f) | | 16,000 | | 16,698 |
4.5% 8/1/41 (e)(f) | | 60,000 | | 62,618 |
4.5% 9/1/41 (e) | | 84,000 | | 87,399 |
5% 2/1/16 to 9/1/40 | | 110,024 | | 118,062 |
5% 8/1/41 (e)(f) | | 23,000 | | 24,557 |
5% 9/1/41 (e) | | 23,000 | | 24,478 |
5.5% 10/1/20 to 3/1/39 | | 71,278 | | 77,677 |
5.746% 3/1/36 (i) | | 2,209 | | 2,347 |
5.963% 3/1/37 (i) | | 595 | | 645 |
6% 3/1/17 to 9/1/39 | | 33,519 | | 36,658 |
6% 8/1/41 (e)(f) | | 15,000 | | 16,494 |
6% 8/1/41 (e)(f) | | 15,000 | | 16,494 |
6% 8/1/41 (e)(f) | | 9,300 | | 10,227 |
6% 8/1/41 (e)(f) | | 8,000 | | 8,797 |
6% 9/1/41 (e) | | 1,300 | | 1,426 |
6.5% 2/1/12 to 4/1/37 | | 8,432 | | 9,282 |
7% 7/1/13 to 7/1/32 | | 2,629 | | 2,983 |
7.5% 11/1/11 to 4/1/29 | | 16 | | 18 |
8.5% 1/1/15 to 7/1/31 | | 213 | | 235 |
9% 5/1/14 | | 137 | | 142 |
9.5% 4/1/16 to 10/1/20 | | 274 | | 320 |
11.25% 5/1/14 | | 2 | | 2 |
11.5% 6/15/19 to 1/15/21 | | 281 | | 305 |
12.5% 8/1/15 to 3/1/16 | | 1 | | 1 |
| | 965,064 |
Freddie Mac - 4.4% |
1.945% 3/1/35 (i) | | 1,061 | | 1,095 |
2.046% 5/1/37 (i) | | 628 | | 654 |
2.615% 6/1/35 (i) | | 770 | | 814 |
2.654% 2/1/36 (i) | | 122 | | 128 |
2.942% 3/1/33 (i) | | 57 | | 61 |
2.995% 7/1/35 (i) | | 1,865 | | 1,987 |
U.S. Government Agency - Mortgage Securities - continued |
| Principal Amount (000s) | | Value (000s) |
Freddie Mac - continued |
3.282% 10/1/35 (i) | | $ 345 | | $ 368 |
3.801% 4/1/40 (i) | | 5,941 | | 6,221 |
4% 7/1/39 to 1/1/41 | | 8,777 | | 8,938 |
4% 8/1/41 (e) | | 5,000 | | 5,077 |
4.5% 7/1/25 to 4/1/41 | | 38,846 | | 40,609 |
4.5% 8/1/41 (e)(f) | | 6,100 | | 6,359 |
4.5% 9/1/41 (e) | | 2,000 | | 2,078 |
4.5% 9/1/41 (e) | | 4,100 | | 4,259 |
5% 8/1/35 to 4/1/41 | | 24,975 | | 26,745 |
5% 8/1/41 (e) | | 1,000 | | 1,066 |
5.138% 4/1/35 (i) | | 291 | | 310 |
5.292% 7/1/36 (i) | | 827 | | 872 |
5.5% 12/1/27 to 5/1/40 | | 62,560 | | 67,851 |
5.5% 8/1/41 (e)(f) | | 4,700 | | 5,089 |
5.5% 8/1/41 (e)(f) | | 4,800 | | 5,198 |
5.5% 9/1/41 (e) | | 9,500 | | 10,263 |
6% 7/1/16 to 7/1/37 | | 12,128 | | 13,221 |
6.5% 1/1/13 to 3/1/36 | | 19,149 | | 21,124 |
7.5% 9/1/11 to 7/1/16 | | 613 | | 662 |
8.5% 5/1/17 to 9/1/29 | | 118 | | 136 |
9% 9/1/14 to 10/1/20 | | 20 | | 21 |
9.5% 5/1/17 to 8/1/21 | | 119 | | 136 |
9.75% 8/1/14 | | 81 | | 89 |
10% 11/15/18 to 8/1/21 | | 8 | | 9 |
11% 5/1/14 | | 25 | | 27 |
12% 3/1/15 | | 1 | | 1 |
12.5% 2/1/14 to 6/1/19 | | 4 | | 4 |
13% 6/1/14 to 6/1/15 | | 1 | | 2 |
| | 231,474 |
Ginnie Mae - 6.7% |
3.5% 12/15/40 to 2/15/41 | | 19,398 | | 19,290 |
4% 1/15/25 to 10/20/25 | | 32,471 | | 34,454 |
4% 8/1/41 (e) | | 7,900 | | 8,153 |
4.5% 3/15/39 to 7/20/41 | | 87,696 | | 93,627 |
4.5% 8/1/41 (e) | | 1,000 | | 1,063 |
4.5% 8/1/41 (e) | | 10,000 | | 10,656 |
5% 9/20/33 to 12/15/40 | | 61,801 | | 67,779 |
5% 8/1/41 (e) | | 7,000 | | 7,631 |
5% 8/1/41 (e) | | 7,000 | | 7,631 |
5.492% 4/20/60 (l) | | 23,123 | | 25,626 |
5.493% 11/20/59 (l) | | 27,948 | | 30,777 |
U.S. Government Agency - Mortgage Securities - continued |
| Principal Amount (000s) | | Value (000s) |
Ginnie Mae - continued |
5.5% 12/15/38 to 3/15/39 | | $ 522 | | $ 579 |
5.513% 2/20/60 (l) | | 25,090 | | 27,833 |
6% 11/20/31 to 11/20/33 | | 10,075 | | 11,279 |
6.5% 3/20/31 to 10/15/35 | | 1,274 | | 1,439 |
7% 10/15/26 to 8/15/32 | | 72 | | 83 |
7.5% 3/15/28 to 8/15/29 | | 65 | | 75 |
8% 7/15/19 to 12/15/23 | | 733 | | 841 |
8.5% 1/15/25 | | 1 | | 1 |
9.5% 2/15/25 | | 1 | | 1 |
10.5% 4/15/14 to 1/20/18 | | 46 | | 54 |
| | 348,872 |
TOTAL U.S. GOVERNMENT AGENCY - MORTGAGE SECURITIES (Cost $1,510,263) | 1,545,410 |
Collateralized Mortgage Obligations - 10.2% |
|
U.S. Government Agency - 10.2% |
Fannie Mae: | | | | |
planned amortization class: | | | | |
Series 1992-168 Class KB, 7% 10/25/22 | | 673 | | 758 |
Series 1993-207 Class H, 6.5% 11/25/23 | | 10,287 | | 11,714 |
Series 1993-240 Class PD, 6.25% 12/25/13 | | 1,007 | | 1,050 |
Series 1994-23 Class PZ, 6% 2/25/24 | | 12,776 | | 15,204 |
Series 1996-28 Class PK, 6.5% 7/25/25 | | 2,000 | | 2,260 |
Series 2003-28 Class KG, 5.5% 4/25/23 | | 4,940 | | 5,541 |
Series 2006-45 Class OP, 6/25/36 (k) | | 3,768 | | 3,334 |
Series 2006-62 Class KP, 4/25/36 (k) | | 8,461 | | 7,093 |
Series 2010-118 Class PB, 4.5% 10/25/40 | | 7,053 | | 7,376 |
sequential payer: | | | | |
Series 1997-41 Class J, 7.5% 6/18/27 | | 1,482 | | 1,706 |
Series 2007-113 Class DB, 4.5% 12/25/22 | | 12,440 | | 13,810 |
Series 2007-115 Class BE, 4.5% 12/25/22 | | 15,400 | | 17,051 |
Series 2009-14 Class EB, 4.5% 3/25/24 | | 7,840 | | 8,627 |
Series 2010-97 Class CX, 4.5% 9/25/25 | | 10,813 | | 11,606 |
Series 2007-113 Class JD, 4.5% 12/25/22 | | 12,766 | | 14,146 |
Series 2010-109 Class IM, 5.5% 9/25/40 (j) | | 22,193 | | 4,333 |
Series 2010-114 Class CI, 5% 4/25/18 (j) | | 16,764 | | 1,794 |
Series 2010-37 Class GI, 5% 4/25/25 (j) | | 3,153 | | 320 |
Series 2010-97 Class CI, 4.5% 8/25/25 (j) | | 14,172 | | 1,609 |
Fannie Mae Stripped Mortgage-Backed Securities: | | | | |
sequential payer Series 377 Class 1, 10/1/36 (k) | | 10,519 | | 9,095 |
Collateralized Mortgage Obligations - continued |
| Principal Amount (000s) | | Value (000s) |
U.S. Government Agency - continued |
Fannie Mae Stripped Mortgage-Backed Securities: - continued | | | | |
Series 384 Class 6, 5% 7/25/37 (j) | | $ 11,934 | | $ 2,112 |
Fannie Mae subordinate REMIC pass-thru certificates: | | | | |
floater: | | | | |
Series 2001-38 Class QF, 1.1673% 8/25/31 (i) | | 350 | | 356 |
Series 2002-49 Class FB, 0.7865% 11/18/31 (i) | | 449 | | 451 |
Series 2002-60 Class FV, 1.1873% 4/25/32 (i) | | 189 | | 193 |
Series 2002-75 Class FA, 1.1873% 11/25/32 (i) | | 387 | | 395 |
Series 2008-76 Class EF, 0.6873% 9/25/23 (i) | | 5,380 | | 5,386 |
planned amortization class: | | | | |
Series 2003-113 Class PE, 4% 11/25/18 | | 7,545 | | 8,108 |
Series 2004-21 Class QE, 4.5% 11/25/32 | | 1,500 | | 1,634 |
Series 2005-102 Class CO, 11/25/35 (k) | | 3,818 | | 3,466 |
Series 2005-81 Class PC, 5.5% 9/25/35 | | 2,150 | | 2,459 |
Series 2006-12 Class BO, 10/25/35 (k) | | 16,901 | | 15,694 |
Series 2006-37 Class OW, 5/25/36 (k) | | 4,208 | | 3,574 |
sequential payer: | | | | |
Series 1999-25 Class Z, 6% 6/25/29 | | 2,967 | | 3,301 |
Series 2002-79 Class Z, 5.5% 11/25/22 | | 6,885 | | 7,564 |
Series 2005-117, Class JN, 4.5% 1/25/36 | | 645 | | 677 |
Series 2005-47 Class HK, 4.5% 6/25/20 | | 7,798 | | 8,575 |
Series 2006-72 Class CY, 6% 8/25/26 | | 10,215 | | 11,694 |
Series 2008-27 Class KB, 4.5% 4/25/23 | | 4,420 | | 4,898 |
Series 2009-85 Class IB, 4.5% 8/25/24 (j) | | 3,654 | | 404 |
Series 2009-93 Class IC, 4.5% 9/25/24 (j) | | 6,985 | | 744 |
Series 2010-139 Class NI, 4.5% 2/25/40 (j) | | 12,384 | | 2,322 |
Freddie Mac planned amortization class Series 2115 Class PE, 6% 1/15/14 | | 193 | | 201 |
Freddie Mac Manufactured Housing participation certificates guaranteed floater Series 1686 Class FA, 1.0875% 2/15/24 (i) | | 1,017 | | 1,035 |
Freddie Mac Multi-class participation certificates guaranteed: | | | | |
floater: | | | | |
Series 2530 Class FE, 0.7865% 2/15/32 (i) | | 254 | | 256 |
Series 2630 Class FL, 0.6865% 6/15/18 (i) | | 442 | | 446 |
Series 3008 Class SM, 0% 7/15/35 (i) | | 125 | | 121 |
planned amortization class: | | | | |
Series 1141 Class G, 9% 9/15/21 | | 191 | | 219 |
Series 2006-15 Class OP, 3/25/36 (k) | | 5,143 | | 4,316 |
Series 2356 Class GD, 6% 9/15/16 | | 198 | | 214 |
Collateralized Mortgage Obligations - continued |
| Principal Amount (000s) | | Value (000s) |
U.S. Government Agency - continued |
Freddie Mac Multi-class participation certificates guaranteed: - continued | | | | |
planned amortization class: | | | | |
Series 2376 Class JE, 5.5% 11/15/16 | | $ 1,369 | | $ 1,472 |
Series 2381 Class OG, 5.5% 11/15/16 | | 910 | | 975 |
Series 2628 Class OE, 4.5% 6/15/18 | | 6,815 | | 7,335 |
Series 2640 Class GE, 4.5% 7/15/18 | | 7,310 | | 7,897 |
Series 2672 Class MG, 5% 9/15/23 | | 7,120 | | 7,987 |
Series 2682 Class LD, 4.5% 10/15/33 | | 777 | | 820 |
Series 2802 Class OB, 6% 5/15/34 | | 10,455 | | 12,065 |
Series 2810 Class PD, 6% 6/15/33 | | 668 | | 704 |
Series 2937 Class KC, 4.5% 2/15/20 | | 19,686 | | 21,555 |
Series 2962 Class BE, 4.5% 4/15/20 | | 15,015 | | 16,558 |
Series 3110 Class OP, 9/15/35 (k) | | 10,265 | | 8,908 |
Series 3119 Class PO, 2/15/36 (k) | | 12,667 | | 10,757 |
Series 3121 Class KO, 3/15/36 (k) | | 3,705 | | 3,305 |
Series 3123 Class LO, 3/15/36 (k) | | 8,255 | | 6,906 |
Series 3145 Class GO, 4/15/36 (k) | | 7,365 | | 6,244 |
Series 3741 Class YU, 3.5% 11/15/22 | | 13,420 | | 14,122 |
sequential payer: | | | | |
Series 2281 Class ZB, 6% 3/15/30 | | 2,190 | | 2,431 |
Series 2546 Class MJ, 5.5% 3/15/23 | | 2,861 | | 3,232 |
Series 2570 Class CU, 4.5% 7/15/17 | | 313 | | 321 |
Series 2587 Class AD, 4.71% 3/15/33 | | 5,785 | | 6,259 |
Series 2601 Class TB, 5.5% 4/15/23 | | 869 | | 985 |
Series 2645, Class BY, 4.5% 7/15/18 | | 4,800 | | 5,306 |
Series 2729 Class GB, 5% 1/15/19 | | 6,151 | | 6,625 |
Series 2773 Class HC, 4.5% 4/15/19 | | 704 | | 778 |
Series 2860 Class CP, 4% 10/15/17 | | 27 | | 27 |
Series 2930 Class KT, 4.5% 2/15/20 | | 6,728 | | 7,430 |
Series 2987 Class HE, 4.5% 6/15/20 | | 11,260 | | 12,281 |
Series 2998 Class LY, 5.5% 7/15/25 | | 2,011 | | 2,296 |
Series 3007 Class EW, 5.5% 7/15/25 | | 8,875 | | 10,164 |
Series 3013 Class VJ, 5% 1/15/14 | | 901 | | 945 |
Series 3277 Class B, 4% 2/15/22 | | 5,900 | | 6,388 |
Series 3578, Class B, 4.5% 9/15/24 | | 7,927 | | 8,719 |
Series 2863 Class DB, 4% 9/15/14 | | 450 | | 454 |
Series 3772 Class BI, 4.5% 10/15/18 (j) | | 13,479 | | 1,259 |
target amortization class: | | | | |
Series 2156 Class TC, 6.25% 5/15/29 | | 4,822 | | 5,431 |
Series 2877 Class JC, 5% 10/15/34 | | 162 | | 164 |
Collateralized Mortgage Obligations - continued |
| Principal Amount (000s) | | Value (000s) |
U.S. Government Agency - continued |
Ginnie Mae guaranteed REMIC pass-thru certificates: | | | | |
planned amortization Series 2011-61 Class OP, 5/20/40 (k) | | $ 11,127 | | $ 9,266 |
planned amortization class Series 1997-8 Class PE, 7.5% 5/16/27 | | 2,406 | | 2,797 |
sequential payer Series 2011-69 Class GX, 4.5% 5/16/40 | | 10,205 | | 10,693 |
Series 2004-79 Class FA, 0.4863% 1/20/31 (i) | | 2,297 | | 2,298 |
Series 2010-42 Class OP, 4/20/40 (k) | | 25,191 | | 20,468 |
Series 2011-71: | | | | |
Class ZB, 5.5% 8/20/34 | | 20,095 | | 22,393 |
Class ZC, 5.5% 7/16/34 | | 22,910 | | 25,374 |
TOTAL COLLATERALIZED MORTGAGE OBLIGATIONS (Cost $503,097) | 531,636 |
Foreign Government and Government Agency Obligations - 1.5% |
|
Israeli State (guaranteed by U.S. Government through Agency for International Development): | | | | |
5.5% 9/18/23 | | 59,862 | | 71,293 |
6.8% 2/15/12 | | 8,268 | | 8,432 |
TOTAL FOREIGN GOVERNMENT AND GOVERNMENT AGENCY OBLIGATIONS (Cost $69,411) | 79,725 |
Cash Equivalents - 14.7% |
| Maturity Amount (000s) | | Value (000s) |
Investments in repurchase agreements in a joint trading account at: | | | |
0.17%, dated 7/29/11 due 8/1/11 (Collateralized by U.S. Government Obligations) # | $ 424,367 | | $ 424,361 |
0.2%, dated 7/29/11 due 8/1/11 (Collateralized by U.S. Government Obligations) # (a) | 346,586 | | 346,580 |
TOTAL CASH EQUIVALENTS (Cost $770,941) | 770,941 |
TOTAL INVESTMENT PORTFOLIO - 116.2% (Cost $5,927,653) | 6,071,162 |
NET OTHER ASSETS (LIABILITIES) - (16.2)% | (845,808) |
NET ASSETS - 100% | $ 5,225,354 |
Futures Contracts |
| Expiration Date | | Underlying Face Amount at Value
(000s) | | Unrealized Appreciation/
(Depreciation) (000s) |
Purchased |
Treasury Contracts |
897 CBOT 2 Year U.S. Treasury Notes Contracts | Sept. 2011 | | $ 197,270 | | $ 881 |
|
The face value of futures purchased as a percentage of net assets is 3.8% |
Swap Agreements |
| Expiration Date | | Notional Amount (000s) | | Value (000s) |
Interest Rate Swaps |
Receive quarterly a floating rate based on 3-month LIBOR and pay semi-annually a fixed rate equal to 3.23% with Credit Suisse First Boston | May 2020 | | $ 50,000 | | $ (2,363) |
Legend |
(a) Includes investment made with cash collateral received from securities on loan. |
(b) Security or a portion of the security is on loan at period end. |
(c) Security exempt from registration under Rule 144A of the Securities Act of 1933. These securities may be resold in transactions exempt from registration, normally to qualified institutional buyers. At the end of the period, the value of these securities amounted to $18,112,000 or 0.3% of net assets. |
(d) Under the Temporary Liquidity Guarantee Program, the Federal Deposit Insurance Corporation guarantees principal and interest in the event of payment default or bankruptcy until the earlier of maturity date of the debt or until June 30, 2012. At the end of the period these securities amounted to $315,861,000 or 6.0% of net assets. |
(e) Security or a portion of the security purchased on a delayed delivery or when-issued basis. |
(f) A portion of the security is subject to a forward commitment to sell. |
(g) Security or a portion of the security was pledged to cover margin requirements for futures contracts. At the period end, the value of securities pledged amounted to $600,000. |
(h) Security or a portion of the security has been segregated as collateral for open swap agreements. At the period end, the value of securities pledged amounted to $1,067,000. |
(i) Coupon rates for floating and adjustable rate securities reflect the rates in effect at period end. |
(j) Security represents right to receive monthly interest payments on an underlying pool of mortgages or assets. Principal shown is the outstanding par amount of the pool held as of the end of the period. |
(k) Principal Only Strips represent the right to receive the monthly principal payments on an underlying pool of mortgage loans. |
(l) Represents an investment in an underlying pool of reverse mortgages which typically do not require regular principal and interest payments as repayment is deferred until a maturity event. |
# Additional information on each counterparty to the repurchase agreement is as follows: |
Repurchase Agreement / Counterparty | Value
(Amounts in thousands) |
$424,361,000 due 8/01/11 at 0.17% |
Bank of America NA | $ 307,005 |
J.P. Morgan Securities, Inc. | 11,476 |
Mizuho Securities USA, Inc. | 105,880 |
| $ 424,361 |
$346,580,000 due 8/01/11 at 0.20% |
J.P. Morgan Securities, Inc. | $ 152,224 |
Merrill Lynch, Pierce, Fenner & Smith, Inc. | 194,356 |
| $ 346,580 |
Other Information |
The following is a summary of the inputs used, as of July 31, 2011, involving the Fund's assets and liabilities carried at fair value. The inputs or methodology used for valuing securities may not be an indication of the risk associated with investing in those securities. For more information on valuation inputs, and their aggregation into the levels used in the table below, please refer to the Security Valuation section in the accompanying Notes to Financial Statements. |
Valuation Inputs at Reporting Date: |
Description
(Amounts in thousands) | Total | Level 1 | Level 2 | Level 3 |
Investments in Securities: | | | | |
U.S. Government and Government Agency Obligations | $ 3,143,450 | $ - | $ 3,143,450 | $ - |
U.S. Government Agency - Mortgage Securities | 1,545,410 | - | 1,545,410 | - |
Collateralized Mortgage Obligations | 531,636 | - | 531,636 | - |
Foreign Government and Government Agency Obligations | 79,725 | - | 79,725 | - |
Cash Equivalents | 770,941 | - | 770,941 | - |
Total Investments in Securities: | $ 6,071,162 | $ - | $ 6,071,162 | $ - |
Derivative Instruments: | | | | |
Assets | | | | |
Futures Contracts | $ 881 | $ 881 | $ - | $ - |
Liabilities | | | | |
Swap Agreements | $ (2,363) | $ - | $ (2,363) | $ - |
Total Derivative Instruments: | $ (1,482) | $ 881 | $ (2,363) | $ - |
Other Financial Instruments: | | | | |
Forward Commitments | $ (432) | $ - | $ (432) | $ - |
Value of Derivative Instruments |
The following table is a summary of the Fund's value of derivative instruments by risk exposure as of July 31, 2011. For additional information on derivative instruments, please refer to the Derivative Instruments section in the accompanying Notes to Financial Statements. |
Risk Exposure /
Derivative Type | Value |
(Amounts in thousands) | Asset | Liability |
Interest Rate Risk | | |
Futures Contracts (a) | $ 881 | $ - |
Swap Agreements (b) | - | (2,363) |
Total Value of Derivatives | $ 881 | $ (2,363) |
(a) Reflects cumulative appreciation/(depreciation) on futures contracts as disclosed on the Schedule of Investments. Only the period end variation margin is separately disclosed on the Statement of Assets and Liabilities. |
(b) Value is disclosed on the Statement of Assets and Liabilities in the Swap agreements, at value line-items. |
See accompanying notes which are an integral part of the financial statements.
Annual Report
Statement of Assets and Liabilities
Amounts in thousands (except per-share amounts) | July 31, 2011 |
| | |
Assets | | |
Investment in securities, at value (including securities loaned of $340,428 and repurchase agreements of $770,941) - See accompanying schedule: Unaffiliated issuers (cost $5,927,653) | | $ 6,071,162 |
Commitment to sell securities on a delayed delivery basis | $ (214,277) | |
Receivable for securities sold on a delayed delivery basis | 213,845 | (432) |
Receivable for investments sold, regular delivery | | 570,621 |
Cash | | 41 |
Receivable for fund shares sold | | 5,414 |
Interest receivable | | 22,995 |
Receivable for daily variation margin on futures contracts | | 112 |
Other receivables | | 32 |
Total assets | | 6,669,945 |
| | |
Liabilities | | |
Payable for investments purchased
Regular delivery | $ 690,506 | |
Delayed delivery | 385,611 | |
Payable for fund shares redeemed | 16,853 | |
Distributions payable | 396 | |
Swap agreements, at value | 2,363 | |
Accrued management fee | 1,377 | |
Distribution and service plan fees payable | 219 | |
Other affiliated payables | 653 | |
Other payables and accrued expenses | 33 | |
Collateral on securities loaned, at value | 346,580 | |
Total liabilities | | 1,444,591 |
| | |
Net Assets | | $ 5,225,354 |
Net Assets consist of: | | |
Paid in capital | | $ 5,018,538 |
Undistributed net investment income | | 917 |
Accumulated undistributed net realized gain (loss) on investments | | 64,304 |
Net unrealized appreciation (depreciation) on investments | | 141,595 |
Net Assets | | $ 5,225,354 |
See accompanying notes which are an integral part of the financial statements.
Annual Report
Statement of Assets and Liabilities - continued
Amounts in thousands (except per-share amounts) | July 31, 2011 |
| | |
Calculation of Maximum Offering Price
Class A:
Net Asset Value and redemption price per share ($328,529 ÷ 30,716 shares) | | $ 10.70 |
| | |
Maximum offering price per share (100/96.00 of $10.70) | | $ 11.15 |
Class T:
Net Asset Value and redemption price per share ($271,707 ÷ 25,407 shares) | | $ 10.69 |
| | |
Maximum offering price per share (100/96.00 of $10.69) | | $ 11.14 |
Class B:
Net Asset Value and offering price per share ($24,905 ÷ 2,329 shares)A | | $ 10.69 |
| | |
Class C:
Net Asset Value and offering price per share ($88,590 ÷ 8,284 shares)A | | $ 10.69 |
| | |
Government Income:
Net Asset Value, offering price and redemption price per share ($4,167,179 ÷ 390,178 shares) | | $ 10.68 |
| | |
Institutional Class:
Net Asset Value, offering price and redemption price per share ($344,444 ÷ 32,207 shares) | | $ 10.69 |
A Redemption price per share is equal to net asset value less any applicable contingent deferred sales charge.
See accompanying notes which are an integral part of the financial statements.
Annual Report
Financial Statements - continued
Statement of Operations
Amounts in thousands | Year ended July 31, 2011 |
| | |
Investment Income | | |
Interest | | $ 147,814 |
| | |
Expenses | | |
Management fee | $ 17,609 | |
Transfer agent fees | 6,349 | |
Distribution and service plan fees | 3,032 | |
Fund wide operations fee | 1,905 | |
Independent trustees' compensation | 21 | |
Miscellaneous | 19 | |
Total expenses | | 28,935 |
Net investment income (loss) | | 118,879 |
Realized and Unrealized Gain (Loss) Net realized gain (loss) on: | | |
Investment securities: | | |
Unaffiliated issuers | 130,436 | |
Futures contracts | 619 | |
Swap agreements | (6,318) | |
Total net realized gain (loss) | | 124,737 |
Change in net unrealized appreciation (depreciation) on: Investment securities | (89,643) | |
Futures contracts | 881 | |
Swap agreements | 3,215 | |
Delayed delivery commitments | 3,445 | |
Total change in net unrealized appreciation (depreciation) | | (82,102) |
Net gain (loss) | | 42,635 |
Net increase (decrease) in net assets resulting from operations | | $ 161,514 |
See accompanying notes which are an integral part of the financial statements.
Annual Report
Statement of Changes in Net Assets
Amounts in thousands | Year ended
July 31, 2011 | Year ended
July 31, 2010 |
Increase (Decrease) in Net Assets | | |
Operations | | |
Net investment income (loss) | $ 118,879 | $ 145,918 |
Net realized gain (loss) | 124,737 | 139,116 |
Change in net unrealized appreciation (depreciation) | (82,102) | 85,404 |
Net increase (decrease) in net assets resulting
from operations | 161,514 | 370,438 |
Distributions to shareholders from net investment income | (114,897) | (140,387) |
Distributions to shareholders from net realized gain | (140,821) | (196,760) |
Total distributions | (255,718) | (337,147) |
Share transactions - net increase (decrease) | (695,616) | 203,871 |
Total increase (decrease) in net assets | (789,820) | 237,162 |
| | |
Net Assets | | |
Beginning of period | 6,015,174 | 5,778,012 |
End of period (including undistributed net investment income of $917 and undistributed net investment income of $2,694, respectively) | $ 5,225,354 | $ 6,015,174 |
See accompanying notes which are an integral part of the financial statements.
Annual Report
Financial Highlights - Class A
Years ended July 31, | 2011 | 2010 | 2009 | 2008 | 2007F |
Selected Per-Share Data | | | | | |
Net asset value, beginning of period | $ 10.84 | $ 10.77 | $ 10.40 | $ 10.01 | $ 9.98 |
Income from Investment Operations | | | | | |
Net investment income (loss)E | .199 | .242 | .356 | .402 | .311 |
Net realized and unrealized gain (loss) | .108 | .424 | .466 | .387 | .033 |
Total from investment operations | .307 | .666 | .822 | .789 | .344 |
Distributions from net investment income | (.191) | (.231) | (.352) | (.399) | (.314) |
Distributions from net realized gain | (.256) | (.365) | (.100) | - | - |
Total distributions | (.447) | (.596) | (.452) | (.399) | (.314) |
Net asset value, end of period | $ 10.70 | $ 10.84 | $ 10.77 | $ 10.40 | $ 10.01 |
Total ReturnB,C,D | 2.94% | 6.44% | 8.03% | 7.96% | 3.49% |
Ratios to Average Net AssetsG | | | | | |
Expenses before reductions | .77% | .77% | .77% | .81% | .78%A |
Expenses net of fee waivers, if any | .77% | .77% | .77% | .81% | .78%A |
Expenses net of all reductions | .77% | .77% | .77% | .80% | .77%A |
Net investment income (loss) | 1.88% | 2.28% | 3.33% | 3.88% | 4.08%A |
Supplemental Data | | | | | |
Net assets, end of period (in millions) | $ 329 | $ 431 | $ 437 | $ 232 | $ 145 |
Portfolio turnover rate | 430% | 355% | 380%H | 269% | 164%H |
A Annualized
B Total returns for periods of less than one year are not annualized.
C Total returns would have been lower if certain expenses had not been reduced during the applicable periods shown.
D Total returns do not include the effect of the sales charges.
E Calculated based on average shares outstanding during the period.
F For the period October 24, 2006 (commencement of sale of shares) to July 31, 2007.
G Expense ratios reflect operating expenses of the class. Expenses before reductions do not reflect amounts reimbursed by the investment adviser or reductions from brokerage service arrangements or reductions from other expense offset arrangements and do not represent the amount paid by the class during periods when reimbursements or reductions occur. Expense ratios before reductions for start-up periods may not be representative of longer-term operating periods. Expenses net of fee waivers reflect expenses after reimbursement by the investment adviser but prior to reductions from brokerage service arrangements or other expense offset arrangements. Expenses net of all reductions represent the net expenses paid by the class.
H The portfolio turnover rate does not include the assets acquired in the merger.
See accompanying notes which are an integral part of the financial statements.
Annual Report
Financial Highlights - Class T
Years ended July 31, | 2011 | 2010 | 2009 | 2008 | 2007F |
Selected Per-Share Data | | | | | |
Net asset value, beginning of period | $ 10.84 | $ 10.77 | $ 10.40 | $ 10.01 | $ 9.98 |
Income from Investment Operations | | | | | |
Net investment income (loss)E | .201 | .243 | .357 | .404 | .306 |
Net realized and unrealized gain (loss) | .098 | .425 | .466 | .387 | .036 |
Total from investment operations | .299 | .668 | .823 | .791 | .342 |
Distributions from net investment income | (.193) | (.233) | (.353) | (.401) | (.312) |
Distributions from net realized gain | (.256) | (.365) | (.100) | - | - |
Total distributions | (.449) | (.598) | (.453) | (.401) | (.312) |
Net asset value, end of period | $ 10.69 | $ 10.84 | $ 10.77 | $ 10.40 | $ 10.01 |
Total ReturnB,C,D | 2.86% | 6.45% | 8.04% | 7.98% | 3.46% |
Ratios to Average Net AssetsG | | | | | |
Expenses before reductions | .76% | .76% | .76% | .78% | .79%A |
Expenses net of fee waivers, if any | .76% | .76% | .76% | .78% | .79%A |
Expenses net of all reductions | .76% | .76% | .76% | .78% | .79%A |
Net investment income (loss) | 1.89% | 2.29% | 3.33% | 3.90% | 4.02%A |
Supplemental Data | | | | | |
Net assets, end of period (in millions) | $ 272 | $ 335 | $ 324 | $ 236 | $ 181 |
Portfolio turnover rate | 430% | 355% | 380%H | 269% | 164%H |
A Annualized
B Total returns for periods of less than one year are not annualized.
C Total returns would have been lower if certain expenses had not been reduced during the applicable periods shown.
D Total returns do not include the effect of the sales charges.
E Calculated based on average shares outstanding during the period.
F For the period October 24, 2006 (commencement of sale of shares) to July 31, 2007.
G Expense ratios reflect operating expenses of the class. Expenses before reductions do not reflect amounts reimbursed by the investment adviser or reductions from brokerage service arrangements or reductions from other expense offset arrangements and do not represent the amount paid by the class during periods when reimbursements or reductions occur. Expense ratios before reductions for start-up periods may not be representative of longer-term operating periods. Expenses net of fee waivers reflect expenses after reimbursement by the investment adviser but prior to reductions from brokerage service arrangements or other expense offset arrangements. Expenses net of all reductions represent the net expenses paid by the class.
H The portfolio turnover rate does not include the assets acquired in the merger.
See accompanying notes which are an integral part of the financial statements.
Annual Report
Financial Highlights - Class B
Years ended July 31, | 2011 | 2010 | 2009 | 2008 | 2007F |
Selected Per-Share Data | | | | | |
Net asset value, beginning of period | $ 10.84 | $ 10.77 | $ 10.40 | $ 10.01 | $ 9.98 |
Income from Investment Operations | | | | | |
Net investment income (loss)E | .122 | .164 | .278 | .329 | .251 |
Net realized and unrealized gain (loss) | .098 | .425 | .467 | .387 | .037 |
Total from investment operations | .220 | .589 | .745 | .716 | .288 |
Distributions from net investment income | (.114) | (.154) | (.275) | (.326) | (.258) |
Distributions from net realized gain | (.256) | (.365) | (.100) | - | - |
Total distributions | (.370) | (.519) | (.375) | (.326) | (.258) |
Net asset value, end of period | $ 10.69 | $ 10.84 | $ 10.77 | $ 10.40 | $ 10.01 |
Total ReturnB,C,D | 2.10% | 5.67% | 7.25% | 7.21% | 2.91% |
Ratios to Average Net AssetsG | | | | | |
Expenses before reductions | 1.50% | 1.50% | 1.50% | 1.51% | 1.50%A |
Expenses net of fee waivers, if any | 1.50% | 1.50% | 1.50% | 1.51% | 1.50%A |
Expenses net of all reductions | 1.50% | 1.50% | 1.50% | 1.50% | 1.50%A |
Net investment income (loss) | 1.15% | 1.55% | 2.60% | 3.17% | 3.30%A |
Supplemental Data | | | | | |
Net assets, end of period (in millions) | $ 25 | $ 38 | $ 48 | $ 41 | $ 43 |
Portfolio turnover rate | 430% | 355% | 380%H | 269% | 164%H |
A Annualized
B Total returns for periods of less than one year are not annualized.
C Total returns would have been lower if certain expenses had not been reduced during the applicable periods shown.
D Total returns do not include the effect of the contingent deferred sales charge.
E Calculated based on average shares outstanding during the period.
F For the period October 24, 2006 (commencement of sale of shares) to July 31, 2007.
G Expense ratios reflect operating expenses of the class. Expenses before reductions do not reflect amounts reimbursed by the investment adviser or reductions from brokerage service arrangements or reductions from other expense offset arrangements and do not represent the amount paid by the class during periods when reimbursements or reductions occur. Expense ratios before reductions for start-up periods may not be representative of longer-term operating periods. Expenses net of fee waivers reflect expenses after reimbursement by the investment adviser but prior to reductions from brokerage service arrangements or other expense offset arrangements. Expenses net of all reductions represent the net expenses paid by the class.
H The portfolio turnover rate does not include the assets acquired in the merger.
See accompanying notes which are an integral part of the financial statements.
Annual Report
Financial Highlights - Class C
Years ended July 31, | 2011 | 2010 | 2009 | 2008 | 2007F |
Selected Per-Share Data | | | | | |
Net asset value, beginning of period | $ 10.84 | $ 10.77 | $ 10.40 | $ 10.01 | $ 9.98 |
Income from Investment Operations | | | | | |
Net investment income (loss)E | .121 | .163 | .275 | .326 | .249 |
Net realized and unrealized gain (loss) | .098 | .425 | .468 | .387 | .033 |
Total from investment operations | .219 | .588 | .743 | .713 | .282 |
Distributions from net investment income | (.113) | (.153) | (.273) | (.323) | (.252) |
Distributions from net realized gain | (.256) | (.365) | (.100) | - | - |
Total distributions | (.369) | (.518) | (.373) | (.323) | (.252) |
Net asset value, end of period | $ 10.69 | $ 10.84 | $ 10.77 | $ 10.40 | $ 10.01 |
Total ReturnB,C,D | 2.09% | 5.66% | 7.23% | 7.18% | 2.85% |
Ratios to Average Net AssetsG | | | | | |
Expenses before reductions | 1.51% | 1.51% | 1.52% | 1.53% | 1.55%A |
Expenses net of fee waivers, if any | 1.51% | 1.51% | 1.52% | 1.53% | 1.55%A |
Expenses net of all reductions | 1.51% | 1.51% | 1.51% | 1.53% | 1.55%A |
Net investment income (loss) | 1.14% | 1.54% | 2.58% | 3.15% | 3.26%A |
Supplemental Data | | | | | |
Net assets, end of period (in millions) | $ 89 | $ 118 | $ 131 | $ 71 | $ 39 |
Portfolio turnover rate | 430% | 355% | 380%H | 269% | 164%H |
A Annualized
B Total returns for periods of less than one year are not annualized.
C Total returns would have been lower if certain expenses had not been reduced during the applicable periods shown.
D Total returns do not include the effect of the contingent deferred sales charge.
E Calculated based on average shares outstanding during the period.
F For the period October 24, 2006 (commencement of sale of shares) to July 31, 2007.
G Expense ratios reflect operating expenses of the class. Expenses before reductions do not reflect amounts reimbursed by the investment adviser or reductions from brokerage service arrangements or reductions from other expense offset arrangements and do not represent the amount paid by the class during periods when reimbursements or reductions occur. Expense ratios before reductions for start-up periods may not be representative of longer-term operating periods. Expenses net of fee waivers reflect expenses after reimbursement by the investment adviser but prior to reductions from brokerage service arrangements or other expense offset arrangements. Expenses net of all reductions represent the net expenses paid by the class.
H The portfolio turnover rate does not include the assets acquired in the merger.
See accompanying notes which are an integral part of the financial statements.
Annual Report
Financial Highlights - Government Income
Years ended July 31, | 2011 | 2010 | 2009 | 2008 | 2007 |
Selected Per-Share Data | | | | | |
Net asset value, beginning of period | $ 10.82 | $ 10.76 | $ 10.38 | $ 10.00 | $ 9.95 |
Income from Investment Operations | | | | | |
Net investment income (loss)B | .233 | .275 | .390 | .438 | .443 |
Net realized and unrealized gain (loss) | .108 | .415 | .476 | .378 | .068 |
Total from investment operations | .341 | .690 | .866 | .816 | .511 |
Distributions from net investment income | (.225) | (.265) | (.386) | (.436) | (.456) |
Distributions from net realized gain | (.256) | (.365) | (.100) | - | (.005) |
Total distributions | (.481) | (.630) | (.486) | (.436) | (.461) |
Net asset value, end of period | $ 10.68 | $ 10.82 | $ 10.76 | $ 10.38 | $ 10.00 |
Total ReturnA | 3.27% | 6.69% | 8.49% | 8.25% | 5.22% |
Ratios to Average Net AssetsC | | | | | |
Expenses before reductions | .45% | .45% | .45% | .45% | .45% |
Expenses net of fee waivers, if any | .45% | .45% | .45% | .45% | .45% |
Expenses net of all reductions | .45% | .45% | .45% | .45% | .44% |
Net investment income (loss) | 2.20% | 2.60% | 3.65% | 4.23% | 4.42% |
Supplemental Data | | | | | |
Net assets, end of period (in millions) | $ 4,167 | $ 4,809 | $ 4,638 | $ 8,154 | $ 6,118 |
Portfolio turnover rate | 430% | 355% | 380%D | 269% | 164%D |
A Total returns would have been lower if certain expenses had not been reduced during the applicable periods shown.
B Calculated based on average shares outstanding during the period.
C Expense ratios reflect operating expenses of the class. Expenses before reductions do not reflect amounts reimbursed by the investment adviser or reductions from brokerage service arrangements or reductions from other expense offset arrangements and do not represent the amount paid by the class during periods when reimbursements or reductions occur. Expenses net of fee waivers reflect expenses after reimbursement by the investment adviser but prior to reductions from brokerage service arrangements or other expense offset arrangements. Expenses net of all reductions represent the net expenses paid by the class.
D The portfolio turnover rate does not include the assets acquired in the merger.
See accompanying notes which are an integral part of the financial statements.
Annual Report
Financial Highlights - Institutional Class
Years ended July 31, | 2011 | 2010 | 2009 | 2008 | 2007E |
Selected Per-Share Data | | | | | |
Net asset value, beginning of period | $ 10.84 | $ 10.77 | $ 10.40 | $ 10.01 | $ 9.98 |
Income from Investment Operations | | | | | |
Net investment income (loss)D | .225 | .267 | .385 | .432 | .329 |
Net realized and unrealized gain (loss) | .099 | .425 | .466 | .388 | .034 |
Total from investment operations | .324 | .692 | .851 | .820 | .363 |
Distributions from net investment income | (.218) | (.257) | (.381) | (.430) | (.333) |
Distributions from net realized gain | (.256) | (.365) | (.100) | - | - |
Total distributions | (.474) | (.622) | (.481) | (.430) | (.333) |
Net asset value, end of period | $ 10.69 | $ 10.84 | $ 10.77 | $ 10.40 | $ 10.01 |
Total ReturnB,C | 3.10% | 6.70% | 8.32% | 8.28% | 3.67% |
Ratios to Average Net AssetsF | | | | | |
Expenses before reductions | .52% | .53% | .51% | .51% | .53%A |
Expenses net of fee waivers, if any | .52% | .53% | .51% | .51% | .53%A |
Expenses net of all reductions | .52% | .53% | .51% | .51% | .53%A |
Net investment income (loss) | 2.13% | 2.52% | 3.59% | 4.17% | 4.32%A |
Supplemental Data | | | | | |
Net assets, end of period (in millions) | $ 344 | $ 284 | $ 200 | $ 750 | $ 715 |
Portfolio turnover rate | 430% | 355% | 380%G | 269% | 164%G |
A Annualized
B Total returns for periods of less than one year are not annualized.
C Total returns would have been lower if certain expenses had not been reduced during the applicable periods shown.
D Calculated based on average shares outstanding during the period.
E For the period October 24, 2006 (commencement of sale of shares) to July 31, 2007.
F Expense ratios reflect operating expenses of the class. Expenses before reductions do not reflect amounts reimbursed by the investment adviser or reductions from brokerage service arrangements or reductions from other expense offset arrangements and do not represent the amount paid by the class during periods when reimbursements or reductions occur. Expense ratios before reductions for start-up periods may not be representative of longer-term operating periods. Expenses net of fee waivers reflect expenses after reimbursement by the investment adviser but prior to reductions from brokerage service arrangements or other expense offset arrangements. Expenses net of all reductions represent the net expenses paid by the class.
G The portfolio turnover rate does not include the assets acquired in the merger.
See accompanying notes which are an integral part of the financial statements.
Annual Report
Notes to Financial Statements
For the period ended July 31, 2011
(Amounts in thousands except ratios)
1. Organization.
Fidelity Government Income Fund (the Fund) is a fund of Fidelity Income Fund (the Trust) and is authorized to issue an unlimited number of shares. The Trust is registered under the Investment Company Act of 1940, as amended (the 1940 Act), as an open-end management investment company organized as a Massachusetts business trust. The Fund offers Class A, Class T, Class C, Government Income and Institutional Class shares, each of which, along with Class B shares, has equal rights as to assets and voting privileges. Effective after the close of business on September 1, 2010, Class B shares were closed to new accounts and additional purchases, except for exchanges and reinvestments by existing shareholders. Each class has exclusive voting rights with respect to matters that affect that class. Class B shares will automatically convert to Class A shares after a holding period of seven years from the initial date of purchase. Investment income, realized and unrealized capital gains and losses, the common expenses of the Fund, and certain fund-level expense reductions, if any, are allocated on a pro-rata basis to each class based on the relative net assets of each class to the total net assets of the Fund. Each class differs with respect to transfer agent and distribution and service plan fees incurred. Certain expense reductions may also differ by class.
In May 2011, the Board of Trustees approved a change in the fiscal year end of the Fund from July 31 to August 31, effective August 31, 2011.
2. Significant Accounting Policies.
The financial statements have been prepared in conformity with accounting principles generally accepted in the United States of America (GAAP), which require management to make certain estimates and assumptions at the date of the financial statements. Actual results could differ from those estimates. Subsequent events, if any, through the date that the financial statements were issued have been evaluated in the preparation of the financial statements. The following summarizes the significant accounting policies of the Fund:
Security Valuation. Investments are valued as of 4:00 p.m. Eastern time on the last calendar day of the period. The Fund uses independent pricing services approved by the Board of Trustees to value its investments. When current market prices or quotations are not readily available or reliable, valuations may be determined in good faith in accordance with procedures adopted by the Board of Trustees. Factors used in determining value may include market or security specific events, changes in interest rates and credit quality. The frequency with which these procedures are used cannot be predicted and they may be utilized to a significant extent. The value used for net asset value (NAV) calculation under these procedures may differ from published prices for the same securities.
Annual Report
Notes to Financial Statements - continued
(Amounts in thousands except ratios)
2. Significant Accounting Policies - continued
Security Valuation - continued
The Fund categorizes the inputs to valuation techniques used to value its investments into a disclosure hierarchy consisting of three levels as shown below:
Level 1 - quoted prices in active markets for identical investments
Level 2 - other significant observable inputs (including quoted prices for similar investments, interest rates, prepayment speeds, etc.)
Level 3 - unobservable inputs (including the Fund's own assumptions based on the best information available)
Changes in valuation techniques may result in transfers in or out of an assigned level within the disclosure hierarchy. The aggregate value of investments by input level, as of July 31, 2011 for the Fund's investments, is included at the end of the Fund's Schedule of Investments. Valuation techniques used to value the Fund's investments by major category are as follows:
Debt securities, including restricted securities, are valued based on evaluated prices received from independent pricing services or from dealers who make markets in such securities. For foreign government and government agency obligations and U.S. government and government agency obligations, pricing services utilize matrix pricing which considers yield or price of bonds of comparable quality, coupon, maturity and type as well as dealer supplied prices and are generally categorized as Level 2 in the hierarchy. For collateralized mortgage obligations and U.S. government agency mortgage securities, pricing services utilize matrix pricing which considers prepayment speed assumptions, attributes of the collateral, yield or price of bonds of comparable quality, coupon, maturity and type as well as dealer supplied prices and, accordingly, such securities are generally categorized as Level 2 in the hierarchy. Swaps are marked-to-market daily based on valuations from independent pricing services or dealer-supplied valuations and changes in value are recorded as unrealized appreciation (depreciation). Pricing services utilize matrix pricing which considers comparisons to interest rate curves, credit spread curves, default possibilities and recovery rates and, as a result, swaps are generally categorized as Level 2 in the hierarchy. When independent prices are unavailable or unreliable, debt securities and swaps may be valued utilizing pricing matrices which consider similar factors that would be used by independent pricing services. These are generally categorized as Level 2 in the hierarchy but may be Level 3 depending on the circumstances.
Futures contracts are valued at the settlement price established each day by the board of trade or exchange on which they are traded and are categorized as Level 1 in the hierarchy. Short-term securities with remaining maturities of sixty days or less may be valued at amortized cost, which approximates fair value, and are categorized as Level 2 in the hierarchy.
Annual Report
2. Significant Accounting Policies - continued
Investment Transactions and Income. For financial reporting purposes, the Fund's investment holdings and NAV include trades executed through the end of the last business day of the period. The NAV per share for processing shareholder transactions is calculated as of the close of business of the New York Stock Exchange (NYSE), normally 4:00 p.m. Eastern time and includes trades executed through the end of the prior business day. Gains and losses on securities sold are determined on the basis of identified cost. Interest income is accrued as earned. Interest income includes coupon interest and amortization of premium and accretion of discount on debt securities. The principal value on inflation-indexed securities is periodically adjusted to the rate of inflation and interest is accrued based on the principal value. The adjustments to principal due to inflation are reflected as increases or decreases to interest income even though principal is not received until maturity.
Expenses. Expenses directly attributable to a fund are charged to that fund. Expenses attributable to more than one fund are allocated among the respective funds on the basis of relative net assets or other appropriate methods. Expense estimates are accrued in the period to which they relate and adjustments are made when actual amounts are known.
Deferred Trustee Compensation. Under a Deferred Compensation Plan (the Plan), independent Trustees may elect to defer receipt of a portion of their annual compensation. Deferred amounts are invested in a cross-section of Fidelity funds, are marked-to-market and remain in the Fund until distributed in accordance with the Plan. The investment of deferred amounts and the offsetting payable to the Trustees are included in the accompanying Statement of Assets and Liabilities.
Income Tax Information and Distributions to Shareholders. Each year, the Fund intends to qualify as a regulated investment company, including distributing substantially all of its taxable income and realized gains under Subchapter M of the Internal Revenue Code and filing its U.S. federal tax return. As a result, no provision for income taxes is required. As of July 31, 2011, the Fund did not have any unrecognized tax benefits in the financial statements. A fund's federal tax return is subject to examination by the Internal Revenue Service (IRS) for a period of three years.
Dividends are declared and recorded daily and paid monthly from net investment income. Distributions from realized gains, if any, are declared and recorded on the ex-dividend date. Income dividends and capital gain distributions are declared separately for each class. Income and capital gain distributions are determined in accordance with income tax regulations, which may differ from GAAP. In addition, the Fund claimed a portion of the payment made to redeeming shareholders as a distribution for income tax purposes.
Annual Report
Notes to Financial Statements - continued
(Amounts in thousands except ratios)
2. Significant Accounting Policies - continued
Income Tax Information and Distributions to Shareholders - continued
Capital accounts within the financial statements are adjusted for permanent book-tax differences. These adjustments have no impact on net assets or the results of operations. Temporary book-tax differences will reverse in a subsequent period.
Book-tax differences are primarily due to futures transactions, swap agreements, market discount, deferred trustees compensation, certain losses related to deflation adjustments on U.S. Treasury inflation-indexed securities and losses deferred due to wash sales.
The federal tax cost of investment securities and unrealized appreciation (depreciation) as of period end were as follows:
Gross unrealized appreciation | $ 150,573 |
Gross unrealized depreciation | (2,894) |
Net unrealized appreciation (depreciation) on securities and other investments | $ 147,679 |
| |
Tax Cost | $ 5,923,483 |
The tax-based components of distributable earnings as of period end were as follows:
Undistributed ordinary income | $ 2,574 |
Undistributed long-term capital gain | $ 58,691 |
Net unrealized appreciation (depreciation) | $ 145,317 |
Under the recently enacted Regulated Investment Company Modernization Act of 2010 (the Act), the Fund will be permitted to carry forward capital losses incurred in taxable years beginning after December 22, 2010 for an unlimited period. However, any losses incurred during those future taxable years will be required to be utilized prior to any losses incurred in pre-enactment taxable years, which generally expire after eight years from when they are incurred. Additionally, post-enactment capital losses that are carried forward will retain their character as either short-term or long-term capital losses rather than being considered all short-term as under previous law. The Fund's first fiscal year end subject to the Act will be August 31, 2011.
The tax character of distributions paid was as follows:
| July 31, 2011 | July 31, 2010 |
Ordinary Income | $ 199,845 | $ 175,643 |
Long-term Capital Gains | 55,873 | 161,504 |
Total | $ 255,718 | $ 337,147 |
Annual Report
2. Significant Accounting Policies - continued
New Accounting Pronouncements. In May 2011, the Financial Accounting Standards Board (FASB) issued an update to Topic 860 - Transfers and Servicing. The update clarifies the assessment of effective control by removing the collateral provision requirement that the seller maintains at all times collateral sufficient to fund substantially all of the cost of purchasing replacement financial assets from others. This may result in a change in accounting treatment from purchases and sales to secured borrowings for certain mortgage dollar roll transactions, and therefore separate accounting of the income and expenses associated with the secured borrowings. This change would have no effect on the net assets or total return of the Fund. The update is effective for transactions entered into on or after December 15, 2011. Management is currently evaluating the potential impact of the update on the accounting for mortgage dollar roll transactions entered into by the Fund. Also in May 2011, the FASB issued Accounting Standard Update No. 2011-04, Fair Value Measurement (Topic 820) - Amendments to Achieve Common Fair Value Measurement and Disclosure Requirements in U.S. GAAP and IFRSs. The update changes the wording used to describe the requirements in GAAP for measuring fair value and for disclosing information about fair value measurements. The update is effective during interim and annual periods beginning after December 15, 2011. Management is currently evaluating the impact of the update's adoption on the Fund's financial statement disclosures.
3. Operating Policies.
Repurchase Agreements. Fidelity Management & Research Company (FMR) has received an Exemptive Order from the Securities and Exchange Commission (the SEC) which permits the Fund and other affiliated entities of FMR to transfer uninvested cash balances into joint trading accounts which are then invested in repurchase agreements. The Fund may also invest directly with institutions in repurchase agreements. Repurchase agreements are collateralized by government or non-government securities. Upon settlement date, collateral is held in segregated accounts with custodian banks and may be obtained in the event of a default of the counterparty. The Fund monitors, on a daily basis, the value of the collateral to ensure it is at least equal to the principal amount of the repurchase agreement (including accrued interest). In the event of a default by the counterparty, realization of the collateral proceeds could be delayed, during which time the value of the collateral may decline.
Delayed Delivery Transactions and When-Issued Securities. The Fund may purchase or sell securities on a delayed delivery or when-issued basis. Payment and delivery may take place after the customary settlement period for that security. The price of the underlying securities and the date when the securities will be delivered and paid for are fixed at the time the transaction is negotiated. During the time a delayed delivery sell is outstanding, the contract is marked-to-market daily and equivalent deliverable
Annual Report
Notes to Financial Statements - continued
(Amounts in thousands except ratios)
3. Operating Policies - continued
Delayed Delivery Transactions and When-Issued Securities - continued
securities are held for the transaction. The securities purchased on a delayed delivery or when-issued basis are identified as such in the Fund's Schedule of Investments. The Fund may receive compensation for interest forgone in the purchase of a delayed delivery or when-issued security. With respect to purchase commitments, the Fund identifies securities as segregated in its records with a value at least equal to the amount of the commitment. Losses may arise due to changes in the value of the underlying securities or if the counterparty does not perform under the contract's terms, or if the issuer does not issue the securities due to political, economic, or other factors.
Restricted Securities. The Fund may invest in securities that are subject to legal or contractual restrictions on resale. These securities generally may be resold in transactions exempt from registration or to the public if the securities are registered. Disposal of these securities may involve time-consuming negotiations and expense, and prompt sale at an acceptable price may be difficult. Information regarding restricted securities is included at the end of the Fund's Schedule of Investments.
4. Derivative Instruments.
Risk Exposures and the Use of Derivative Instruments. The Fund used derivative instruments (derivatives), including futures contracts and swap agreements in order to meet its investment objectives. The strategy is to use derivatives to increase returns, to gain exposure to certain types of assets and to manage exposure to certain risks as defined below. The success of any strategy involving derivatives depends on analysis of numerous economic factors, and if the strategies for investment do not work as intended, the Fund may not achieve its objectives.
The Fund's use of derivatives increased or decreased its exposure to the following risk:
Interest Rate Risk | Interest rate risk relates to the fluctuations in the value of interest-bearing securities due to changes in the prevailing levels of market interest rates. |
The Fund is also exposed to additional risks from investing in derivatives, such as liquidity risk and counterparty credit risk. Liquidity risk is the risk that the Fund will be unable to sell the derivative in the open market in a timely manner. Counterparty credit risk is the risk that the counterparty will not be able to fulfill its obligation to the Fund. Derivative counterparty credit risk is managed through formal evaluation of the creditworthiness of all potential counterparties. On certain over-the-counter derivatives, the Fund attempts to reduce its exposure to counterparty credit risk by entering into an International Swaps and Derivatives Association (ISDA) Master Agreement on a bilateral basis with each of its counterparties. The ISDA Master Agreement gives the Fund the
Annual Report
4. Derivative Instruments - continued
Risk Exposures and the Use of Derivative Instruments - continued
right to terminate all transactions traded under such agreement if there is a certain deterioration in the credit quality of the counterparty. The ISDA Master Agreement gives each party the right, upon an event of default by the other party or a termination of the agreement, to close out all transactions traded under such agreement and to net amounts owed under each transaction to one net payable by one party to the other. To mitigate counterparty credit risk, the Fund offsets certain payables and/or receivables with collateral. Collateral in the form of cash or securities, if required, is held in segregated accounts with the Fund's custodian bank in accordance with the collateral agreements entered into between the Fund, the swap counterparty and the Fund's custodian bank, and is identified in the Schedule of Investments. The Fund could experience delays and costs in gaining access to the collateral even though it is held by the Fund's custodian bank. The Fund's maximum risk of loss from counterparty credit risk is generally the aggregate unrealized appreciation and unpaid counterparty payments in excess of any collateral pledged by the counterparty to the Fund. Counterparty risk related to exchange-traded futures contracts is minimal because of the protection provided by the exchange on which they trade. Derivatives involve, to varying degrees, risk of loss in excess of the amounts recognized in the Statement of Assets and Liabilities.
Net Realized Gain (Loss) and Change in Net Unrealized Appreciation (Depreciation) on Derivatives. The table below, which reflects the impacts of derivatives on the financial performance of the Fund, summarizes the net realized gain (loss) and change in net unrealized appreciation (depreciation) for derivatives during the period.
Risk Exposure / Derivative Type | Net Realized Gain (Loss) | Change in Net Unrealized Appreciation (Depreciation) |
Interest Rate Risk | | |
Futures Contracts | $ 619 | $ 881 |
Swap Agreements | (6,318) | 3,215 |
Totals (a)(b)(c) | $ (5,699) | $ 4,096 |
(a) A summary of the value of derivatives by risk exposure as of period end is included at the end of the Schedule of Investments and is representative of activity for the period.
(b) Total derivatives net realized gain (loss) included in the Statement of Operations is comprised of $619 for futures contracts and $(6,318) for swap agreements.
(c) Total derivatives change in net unrealized appreciation (depreciation) included in the Statement of Operations is comprised of $881 for futures contracts and $3,215 for swap agreements.
Futures Contracts. A futures contract is an agreement between two parties to buy or sell a specified underlying instrument for a fixed price at a specified future date. The Fund used futures contracts to manage its exposure to the bond market and to fluctuations in interest rates.
Annual Report
Notes to Financial Statements - continued
(Amounts in thousands except ratios)
4. Derivative Instruments - continued
Futures Contracts - continued
Upon entering into a futures contract, a fund is required to deposit either cash or securities (initial margin) with a clearing broker in an amount equal to a certain percentage of the face value of the contract. Futures contracts are marked-to-market daily and subsequent payments (variation margin) are made or received by a fund depending on the daily fluctuations in the value of the futures contracts and are recorded as unrealized appreciation or (depreciation). This receivable and/or payable is included in daily variation margin on futures contracts in the Statement of Assets and Liabilities. Realized gain or (loss) is recorded upon the expiration or closing of a futures contract. The net realized gain (loss) and change in net unrealized appreciation (depreciation) on futures contracts during the period is included in the Statement of Operations.
The underlying face amount at value of open futures contracts at period end is shown in the Schedule of Investments under the caption "Futures Contracts." This amount reflects each contract's exposure to the underlying instrument at period end and is representative of activity for the period. Securities deposited to meet initial margin requirements are identified in the Schedule of Investments.
Certain risks arise upon entering into futures contracts, including the risk that an illiquid market limits the ability to close out a futures contract prior to settlement date.
Swap Agreements. A swap agreement (swap) is a contract between two parties to exchange future cash flows at periodic intervals based on a notional principal amount.
Details of swaps open at period end are included in the Schedule of Investments under the caption "Swap Agreements." Swaps are marked-to-market daily and changes in value are recorded as unrealized appreciation or (depreciation) and reflected in the Statement of Assets and Liabilities. Any upfront premiums paid or received upon entering a swap to compensate for differences between stated terms of the agreement and prevailing market conditions (e.g. credit spreads, interest rates or other factors) are recorded as realized gain or (loss) ratably over the term of the swap. Payments are exchanged at specified intervals, accrued daily commencing with the effective date of the contract and recorded as realized gain or (loss). Realized gain or (loss) is also recorded in the event of an early termination of a swap. The net realized gain (loss) and change in net unrealized appreciation (depreciation) on swaps during the period is included in the Statement of Operations.
Risks of loss include interest rate risk. In addition, there is the risk of failure by the counterparty to perform under the terms of the agreement and lack of liquidity in the market.
Annual Report
4. Derivative Instruments - continued
Interest Rate Swaps. Interest rate swaps are agreements between counterparties to exchange cash flows, one based on a fixed rate, and the other on a floating rate. The Fund entered into interest rate swaps to manage its exposure to interest rate changes. Changes in interest rates can have an effect on both the value of bond holdings as well as the amount of interest income earned. In general, the value of bonds can fall when interest rates rise and can rise when interest rates fall.
5. Purchases and Sales of Investments.
Purchases and sales of securities, other than short-term securities and U.S. government securities, aggregated $5,151 and $19,358, respectively.
6. Fees and Other Transactions with Affiliates.
Management Fee. FMR and its affiliates provide the Fund with investment management related services for which the Fund pays a monthly management fee. The management fee is the sum of an individual fund fee rate that is based on an annual rate of .20% of the Fund's average net assets and a group fee rate that averaged .12% during the period. The group fee rate is based upon the average net assets of all the mutual funds advised by FMR. The group fee rate decreases as assets under management increase and increases as assets under management decrease. For the period, the total annual management fee rate was .32% of the Fund's average net assets.
Distribution and Service Plan Fees. In accordance with Rule 12b-1 of the 1940 Act, the Fund has adopted separate Distribution and Service Plans for each class of shares. Certain classes pay Fidelity Distributors Corporation (FDC), an affiliate of FMR, separate Distribution and Service Fees, each of which is based on an annual percentage of each class' average net assets. In addition, FDC may pay financial intermediaries for selling shares of the Fund and providing shareholder support services. For the period, the Distribution and Service Fee rates, total fees and amounts retained by FDC were as follows:
| Distribution
Fee | Service
Fee | Total Fees | Retained
by FDC |
Class A | -% | .25% | $ 962 | $ 24 |
Class T | -% | .25% | 758 | 2 |
Class B | .65% | .25% | 278 | 201 |
Class C | .75% | .25% | 1,034 | 184 |
| | | $ 3,032 | $ 411 |
Annual Report
Notes to Financial Statements - continued
(Amounts in thousands except ratios)
6. Fees and Other Transactions with Affiliates - continued
Sales Load. FDC may receive a front-end sales charge of up to 4.00% for selling Class A shares and Class T shares, some of which is paid to financial intermediaries for selling shares of the Fund. Depending on the holding period, FDC may receive contingent deferred sales charges levied on Class A, Class T, Class B, and Class C redemptions. The deferred sales charges range from 5% to 1% for Class B, 1% for Class C, .75% for certain purchases of Class A shares and .25% for certain purchases of Class T shares.
For the period, sales charge amounts retained by FDC were as follows:
| Retained
by FDC |
Class A | $ 34 |
Class T | 12 |
Class B* | 103 |
Class C* | 25 |
| $ 174 |
* When Class B and Class C shares are initially sold, FDC pays commissions from its own resources to financial intermediaries through which the sales are made.
Transfer Agent Fees. Fidelity Investments Institutional Operations Company, Inc. (FIIOC), an affiliate of FMR, is the transfer, dividend disbursing and shareholder servicing agent for each class of the Fund. FIIOC receives account fees and asset-based fees that vary according to the account size and type of account of the shareholders of the respective classes of the Fund. FIIOC pays for typesetting, printing and mailing of shareholder reports, except proxy statements. For the period, transfer agent fees for each class were as follows:
| Amount | % of
Average
Net Assets |
Class A | $ 662 | .17 |
Class T | 470 | .15 |
Class B | 76 | .25 |
Class C | 165 | .16 |
Government Income | 4,453 | .10 |
Institutional Class | 523 | .17 |
| $ 6,349 | |
Fund Wide Operations Fee. Pursuant to the Fund Wide Operations and Expense Agreement (FWOE), FMR has agreed to provide for fund level expenses (which do not include transfer agent, Rule 12b-1 fees, compensation of the independent Trustees, interest (including commitment fees), taxes or extraordinary expenses, if any) in return for a FWOE fee equal to .35% less the total amount of the management fee. The FWOE
Annual Report
6. Fees and Other Transactions with Affiliates - continued
Fund Wide Operations Fee - continued
paid by the Fund is reduced by an amount equal to the fees and expenses paid to the independent Trustees. For the period, the FWOE fee was equivalent to an annual rate of .03% of average net assets.
7. Committed Line of Credit.
The Fund participates with other funds managed by FMR or an affiliate in a $4.0 billion credit facility (the "line of credit") to be utilized for temporary or emergency purposes to fund shareholder redemptions or for other short-term liquidity purposes. The Fund has agreed to pay commitment fees on its pro-rata portion of the line of credit, which amounted to $19 and is reflected in Miscellaneous expenses on the Statement of Operations. During the period, there were no borrowings on this line of credit.
8. Security Lending.
The Fund lends portfolio securities from time to time in order to earn additional income. On the settlement date of the loan, the Fund receives collateral (in the form of U.S. Treasury obligations, letters of credit and/or cash) against the loaned securities and maintains collateral in an amount not less than 100% of the market value of the loaned securities during the period of the loan. The market value of the loaned securities is determined at the close of business of the Fund and any additional required collateral is delivered to the Fund on the next business day. If the borrower defaults on its obligation to return the securities loaned because of insolvency or other reasons, a fund could experience delays and costs in recovering the securities loaned or in gaining access to the collateral. Any cash collateral received is maintained at the Fund's custodian and/or invested in cash equivalents. The value of loaned securities and cash collateral at period end are disclosed on the Fund's Statement of Assets and Liabilities. Security lending income represents the income earned on investing cash collateral, less rebates paid to borrowers, plus any premium payments received for lending certain types of securities. Security lending income is presented in the Statement of Operations as a component of interest income. Total security lending income during the period amounted to $164.
Annual Report
Notes to Financial Statements - continued
(Amounts in thousands except ratios)
9. Distributions to Shareholders.
Distributions to shareholders of each class were as follows:
Years ended July 31, | 2011 | 2010 |
From net investment income | | |
Class A | $ 6,937 | $ 9,342 |
Class T | 5,513 | 6,865 |
Class B | 332 | 606 |
Class C | 1,100 | 1,669 |
Government Income | 94,692 | 116,185 |
Institutional Class | 6,323 | 5,720 |
Total | $ 114,897 | $ 140,387 |
From net realized gain | | |
Class A | $ 10,104 | $ 14,726 |
Class T | 7,830 | 10,744 |
Class B | 853 | 1,543 |
Class C | 2,724 | 4,162 |
Government Income | 112,442 | 158,363 |
Institutional Class | 6,868 | 7,222 |
Total | $ 140,821 | $ 196,760 |
10. Share Transactions.
Transactions for each class of shares were as follows:
| Shares | Dollars |
Years ended July 31, | 2011 | 2010 | 2011 | 2010 |
Class A | | | | |
Shares sold | 10,505 | 17,922 | $ 111,665 | $ 190,342 |
Reinvestment of distributions | 1,423 | 1,943 | 15,111 | 20,562 |
Shares redeemed | (20,985) | (20,615) | (221,593) | (218,378) |
Net increase (decrease) | (9,057) | (750) | $ (94,817) | $ (7,474) |
Class T | | | | |
Shares sold | 9,053 | 13,716 | $ 96,270 | $ 145,586 |
Reinvestment of distributions | 1,221 | 1,616 | 12,970 | 17,109 |
Shares redeemed | (15,795) | (14,473) | (166,943) | (153,287) |
Net increase (decrease) | (5,521) | 859 | $ (57,703) | $ 9,408 |
Class B | | | | |
Shares sold | 275 | 1,036 | $ 2,957 | $ 11,019 |
Reinvestment of distributions | 93 | 165 | 985 | 1,747 |
Shares redeemed | (1,536) | (2,202) | (16,266) | (23,321) |
Net increase (decrease) | (1,168) | (1,001) | $ (12,324) | $ (10,555) |
Annual Report
10. Share Transactions - continued
| Shares | Dollars |
Years ended July 31, | 2011 | 2010 | 2011 | 2010 |
Class C | | | | |
Shares sold | 2,426 | 3,916 | $ 25,890 | $ 41,596 |
Reinvestment of distributions | 261 | 390 | 2,774 | 4,131 |
Shares redeemed | (5,248) | (5,610) | (55,376) | (59,334) |
Net increase (decrease) | (2,561) | (1,304) | $ (26,712) | $ (13,607) |
Government Income | | | | |
Shares sold | 105,621 | 155,285 | $ 1,120,288 | $ 1,646,227 |
Reinvestment of distributions | 18,687 | 24,826 | 198,243 | 262,396 |
Shares redeemed | (178,425) | (166,873) | (1,885,694) | (1,763,484) |
Net increase (decrease) | (54,117) | 13,238 | $ (567,163) | $ 145,139 |
Institutional Class | | | | |
Shares sold | 12,979 | 13,487 | $ 137,402 | $ 143,092 |
Reinvestment of distributions | 1,192 | 1,193 | 12,645 | 12,621 |
Shares redeemed | (8,205) | (7,047) | (86,944) | (74,753) |
Net increase (decrease) | 5,966 | 7,633 | $ 63,103 | $ 80,960 |
11. Other.
The Fund's organizational documents provide former and current trustees and officers with a limited indemnification against liabilities arising in connection with the performance of their duties to the Fund. In the normal course of business, the Fund may also enter into contracts that provide general indemnifications. The Fund's maximum exposure under these arrangements is unknown as this would be dependent on future claims that may be made against the Fund. The risk of material loss from such claims is considered remote.
Effective after the close of business on August 26, 2011, the Fund exchanged securities, including accrued interest, valued at $1,278,207 for shares of Fidelity Mortgage Backed Securities Central Fund, which is an affiliated investment company managed by FMR Co., Inc., an affiliate of FMR. Fidelity Mortgage Backed Securities Central Fund seeks a high level of current income and invests primarily in investment-grade mortgage-related securities issued by the U.S. Government or its instrumentalities and repurchase agreements for those securities. These strategies are consistent with the investment objective of the Fund.
Annual Report
To the Trustees of Fidelity Income Fund and the Shareholders of Fidelity Government Income Fund:
In our opinion, the accompanying statement of assets and liabilities, including the schedule of investments, and the related statements of operations and of changes in net assets and the financial highlights present fairly, in all material respects, the financial position of Fidelity Government Income Fund (a fund of Fidelity Income Fund) at July 31, 2011, the results of its operations for the year then ended, the changes in its net assets for each of the two years in the period then ended and the financial highlights for each of the periods indicated, in conformity with accounting principles generally accepted in the United States of America. These financial statements and financial highlights (hereafter referred to as "financial statements") are the responsibility of the Fidelity Government Income Fund's management. Our responsibility is to express an opinion on these financial statements based on our audits. We conducted our audits of these financial statements in accordance with the standards of the Public Company Accounting Oversight Board (United States). Those standards require that we plan and perform the audit to obtain reasonable assurance about whether the financial statements are free of material misstatement. An audit includes examining, on a test basis, evidence supporting the amounts and disclosures in the financial statements, assessing the accounting principles used and significant estimates made by management, and evaluating the overall financial statement presentation. We believe that our audits, which included confirmation of securities at July 31, 2011 by correspondence with the custodian and brokers, provide a reasonable basis for our opinion.
/s/ PricewaterhouseCoopers LLP
PricewaterhouseCoopers LLP
Boston, Massachusetts
September 13, 2011
Annual Report
The Trustees and executive officers of the trust and fund, as applicable, are listed below. The Board of Trustees governs the fund and is responsible for protecting the interests of shareholders. The Trustees are experienced executives who meet periodically throughout the year to oversee the fund's activities, review contractual arrangements with companies that provide services to the fund, oversee management of the risks associated with such activities and contractual arrangements, and review the fund's performance. Except for James C. Curvey, each of the Trustees oversees 198 funds advised by FMR or an affiliate. Mr. Curvey oversees 419 funds advised by FMR or an affiliate.
The Trustees hold office without limit in time except that (a) any Trustee may resign; (b) any Trustee may be removed by written instrument, signed by at least two-thirds of the number of Trustees prior to such removal; (c) any Trustee who requests to be retired or who has become incapacitated by illness or injury may be retired by written instrument signed by a majority of the other Trustees; and (d) any Trustee may be removed at any special meeting of shareholders by a two-thirds vote of the outstanding voting securities of the trust. Each Trustee who is not an interested person (as defined in the 1940 Act) (Independent Trustee), shall retire not later than the last day of the calendar year in which his or her 75th birthday occurs. The Independent Trustees may waive this mandatory retirement age policy with respect to individual Trustees. The executive officers hold office without limit in time, except that any officer may resign or may be removed by a vote of a majority of the Trustees at any regular meeting or any special meeting of the Trustees. Except as indicated, each individual has held the office shown or other offices in the same company for the past five years.
Experience, Skills, Attributes, and Qualifications of the Fund's Trustees. The Governance and Nominating Committee has adopted a statement of policy that describes the experience, qualifications, attributes, and skills that are necessary and desirable for potential Independent Trustee candidates (Statement of Policy). The Board believes that each Trustee satisfied at the time he or she was initially elected or appointed a Trustee, and continues to satisfy, the standards contemplated by the Statement of Policy. The Governance and Nominating Committee also engages professional search firms to help identify potential Independent Trustee candidates who have the experience, qualifications, attributes, and skills consistent with the Statement of Policy. From time to time, additional criteria based on the composition and skills of the current Independent Trustees, as well as experience or skills that may be appropriate in light of future changes to board composition, business conditions, and regulatory or other developments, have also been considered by the professional search firms and the Governance and Nominating Committee. In addition, the Board takes into account the Trustees' commitment and participation in Board and committee meetings, as well as their leadership of standing and ad hoc committees throughout their tenure.
In determining that a particular Trustee was and continues to be qualified to serve as a Trustee, the Board has considered a variety of criteria, none of which, in isolation, was controlling. The Board believes that, collectively, the Trustees have balanced and diverse experience, qualifications, attributes, and skills, which allow the Board to operate effectively in governing the fund and protecting the interests of shareholders. Information about the specific experience, skills, attributes, and qualifications of each Trustee, which in each case led to the Board's conclusion that the Trustee should serve (or continue to serve) as a trustee of the fund, is provided below.
Annual Report
Trustees and Officers - continued
Board Structure and Oversight Function. Abigail P. Johnson is an interested person (as defined in the 1940 Act) and currently serves as Chairman. The Trustees have determined that an interested Chairman is appropriate and benefits shareholders because an interested Chairman has a personal and professional stake in the quality and continuity of services provided to the fund. Independent Trustees exercise their informed business judgment to appoint an individual of their choosing to serve as Chairman, regardless of whether the Trustee happens to be independent or a member of management. The Independent Trustees have determined that they can act independently and effectively without having an Independent Trustee serve as Chairman and that a key structural component for assuring that they are in a position to do so is for the Independent Trustees to constitute a substantial majority for the Board. The Independent Trustees also regularly meet in executive session. Kenneth L. Wolfe serves as Chairman of the Independent Trustees and as such (i) acts as a liaison between the Independent Trustees and management with respect to matters important to the Independent Trustees and (ii) with management prepares agendas for Board meetings.
Fidelity funds are overseen by different Boards of Trustees. The fund's Board oversees Fidelity's investment-grade bond, money market, and asset allocation funds and another Board oversees Fidelity's equity and high income funds. The asset allocation funds may invest in Fidelity funds that are overseen by such other Board. The use of separate Boards, each with its own committee structure, allows the Trustees of each group of Fidelity funds to focus on the unique issues of the funds they oversee, including common research, investment, and operational issues. On occasion, the separate Boards establish joint committees to address issues of overlapping consequences for the Fidelity funds overseen by each Board.
The Trustees operate using a system of committees to facilitate the timely and efficient consideration of all matters of importance to the Trustees, the fund, and fund shareholders and to facilitate compliance with legal and regulatory requirements and oversight of the fund's activities and associated risks. The Board, acting through its committees, has charged FMR and its affiliates with (i) identifying events or circumstances the occurrence of which could have demonstrably adverse effects on the fund's business and/or reputation; (ii) implementing processes and controls to lessen the possibility that such events or circumstances occur or to mitigate the effects of such events or circumstances if they do occur; and (iii) creating and maintaining a system designed to evaluate continuously business and market conditions in order to facilitate the identification and implementation processes described in (i) and (ii) above. Because the day-to-day operations and activities of the fund are carried out by or through FMR, its affiliates and other service providers, the fund's exposure to risks is mitigated but not eliminated by the processes overseen by the Trustees. While each of the Board's committees has responsibility for overseeing different aspects of the fund's activities, oversight is exercised primarily through the Operations and Audit Committees. Appropriate personnel, including but not limited to the fund's Chief Compliance Officer (CCO), FMR's internal auditor, the independent accountants, the fund's Treasurer and portfolio management personnel, make periodic reports to the Board's committees, as appropriate. The responsibilities of each committee, including their oversight responsibilities, are described further under "Standing Committees of the Fund's Trustees."
Annual Report
The fund's Statement of Additional Information (SAI) includes more information about the Trustees. To request a free copy, call Fidelity at 1-877-208-0098.
Interested Trustees*:
Correspondence intended for each Trustee who is an interested person may be sent to Fidelity Investments, 82 Devonshire Street, Boston, Massachusetts 02109.
Name, Age; Principal Occupations and Other Relevant Experience+ |
Abigail P. Johnson (49) |
| Year of Election or Appointment: 2009 Ms. Johnson is Trustee and Chairman of the Board of Trustees of certain Trusts. Ms. Johnson serves as President of Personal, Workplace and Institutional Services (2005-present). Ms. Johnson is Chairman and Director of FMR Co., Inc. (2011-present), Chairman and Director of FMR (2011-present), and the Vice Chairman and Director (2007-present) of FMR LLC. Previously, Ms. Johnson served as President and a Director of FMR (2001-2005), a Trustee of other investment companies advised by FMR, Fidelity Investments Money Management, Inc., and FMR Co., Inc. (2001-2005), Senior Vice President of the Fidelity funds (2001-2005), and managed a number of Fidelity funds. Ms. Abigail P. Johnson and Mr. Arthur E. Johnson are not related. |
James C. Curvey (76) |
| Year of Election or Appointment: 2007 Mr. Curvey also serves as Trustee (2007-present) of other investment companies advised by FMR. Mr. Curvey is a Director of Fidelity Investments Money Management, Inc. (2009-present), Director of Fidelity Research & Analysis Co. (2009-present) and Director of FMR and FMR Co., Inc. (2007-present). Mr. Curvey is also Vice Chairman (2007-present) and Director of FMR LLC. In addition, Mr. Curvey serves as an Overseer for the Boston Symphony Orchestra and a member of the Trustees of Villanova University. Previously, Mr. Curvey was the Vice Chairman (2006-2007) and Director (2000-2007) of FMR Corp. |
* Trustees have been determined to be "Interested Trustees" by virtue of, among other things, their affiliation with the trust or various entities under common control with FMR.
Annual Report
Trustees and Officers - continued
+ The information above includes each Trustee's principal occupation during the last five years and other information relating to the experience, attributes, and skills relevant to each Trustee's qualifications to serve as a Trustee, which led to the conclusion that each Trustee should serve as a Trustee for the fund.
Independent Trustees:
Correspondence intended for each Independent Trustee (that is, the Trustees other than the Interested Trustees) may be sent to Fidelity Investments, P.O. Box 55235, Boston, Massachusetts 02205-5235.
Name, Age; Principal Occupations and Other Relevant Experience+ |
Albert R. Gamper, Jr. (69) |
| Year of Election or Appointment: 2006 Mr. Gamper is Vice Chairman of the Independent Trustees of the Fixed Income and Asset Allocation Funds (2011-present). Prior to his retirement in December 2004, Mr. Gamper served as Chairman of the Board of CIT Group Inc. (commercial finance). During his tenure with CIT Group Inc. Mr. Gamper served in numerous senior management positions, including Chairman (1987-1989; 1999-2001; 2002-2004), Chief Executive Officer (1987-2004), and President (2002-2003). He also served as President and Chief Executive Officer of Tyco Capital Corporation (2001-2002). Mr. Gamper currently serves as a member of the Board of Directors of Public Service Enterprise Group (utilities, 2000-present), a member of the Board of Trustees, Rutgers University (2004-present), and Chairman of the Board of Saint Barnabas Health Care System. Previously, Mr. Gamper served as Chairman of the Board of Governors, Rutgers University (2004-2007). |
Robert F. Gartland (59) |
| Year of Election or Appointment: 2010 Mr. Gartland is a partner and investor of Vietnam Partners LLC (investments and consulting, 2008-present) and is Chairman and an investor in Gartland and Mellina Group Corp. (consulting, 2009-present). Prior to his retirement, Mr. Gartland held a variety of positions at Morgan Stanley (financial services, 1979-2007) including Managing Director (1987-2007). |
Arthur E. Johnson (64) |
| Year of Election or Appointment: 2008 Mr. Johnson serves as a member of the Board of Directors of Eaton Corporation (diversified power management, 2009-present) and AGL Resources, Inc. (holding company). Prior to his retirement, Mr. Johnson served as Senior Vice President of Corporate Strategic Development of Lockheed Martin Corporation (defense contractor, 1999-2009). He previously served on the Board of Directors of IKON Office Solutions, Inc. (1999-2008) and Delta Airlines (2005-2007). Mr. Arthur E. Johnson and Ms. Abigail P. Johnson are not related. |
Michael E. Kenneally (57) |
| Year of Election or Appointment: 2009 Previously, Mr. Kenneally served as a Member of the Advisory Board for certain Fidelity Fixed Income and Asset Allocation Funds (2008-2009). Prior to his retirement, Mr. Kenneally served as Chairman and Global Chief Executive Officer of Credit Suisse Asset Management (2003-2005). Mr. Kenneally was a Director of the Credit Suisse Funds (U.S. mutual funds, 2004-2008) and certain other closed-end funds (2004-2005) and was awarded the Chartered Financial Analyst (CFA) designation in 1991. |
James H. Keyes (70) |
| Year of Election or Appointment: 2007 Mr. Keyes serves as a member of the Boards of Navistar International Corporation (manufacture and sale of trucks, buses, and diesel engines, since 2002) and Pitney Bowes, Inc. (integrated mail, messaging, and document management solutions, since 1998). Prior to his retirement, Mr. Keyes served as Chairman and Chief Executive Officer of Johnson Controls (automotive, building, and energy, 1998-2002) and as a member of the Board of LSI Logic Corporation (semiconductor technologies, 1984-2008). |
Marie L. Knowles (64) |
| Year of Election or Appointment: 2001 Prior to Ms. Knowles' retirement in June 2000, she served as Executive Vice President and Chief Financial Officer of Atlantic Richfield Company (ARCO) (diversified energy, 1996-2000). From 1993 to 1996, she was a Senior Vice President of ARCO and President of ARCO Transportation Company. She served as a Director of ARCO from 1996 to 1998. Ms. Knowles currently serves as a Director and Chairman of the Audit Committee of McKesson Corporation (healthcare service, since 2002). Ms. Knowles is an Honorary Trustee of the Brookings Institution and a member of the Board of the Catalina Island Conservancy and of the Santa Catalina Island Company (2009-present). She also serves as a member of the Advisory Board for the School of Engineering of the University of Southern California and the Foundation Board of the School of Architecture at the University of Virginia (2007-present). Previously, Ms. Knowles served as a Director of Phelps Dodge Corporation (copper mining and manufacturing, 1994-2007). |
Kenneth L. Wolfe (72) |
| Year of Election or Appointment: 2005 Mr. Wolfe is Chairman of the Independent Trustees of the Fixed Income and Asset Allocation Funds (2008-present). Prior to his retirement, Mr. Wolfe served as Chairman and a Director (2007-2009) and Chairman and Chief Executive Officer (1994-2001) of Hershey Foods Corporation. He also served as a member of the Boards of Adelphia Communications Corporation (telecommunications, 2003-2006), Bausch & Lomb, Inc. (medical/pharmaceutical, 1993-2007), and Revlon, Inc. (personal care products, 2004-2009). |
+ The information above includes each Trustee's principal occupation during the last five years and other information relating to the experience, attributes, and skills relevant to each Trustee's qualifications to serve as a Trustee, which led to the conclusion that each Trustee should serve as a Trustee for the fund.
Annual Report
Executive Officers:
Correspondence intended for each executive officer may be sent to Fidelity Investments, 82 Devonshire Street, Boston, Massachusetts 02109.
Name, Age; Principal Occupation |
John R. Hebble (53) |
| Year of Election or Appointment: 2008 President and Treasurer of Fidelity's Fixed Income and Asset Allocation Funds. Mr. Hebble also serves as President (2011-present), Treasurer, and Chief Financial Officer of The North Carolina Capital Management Trust: Cash and Term Portfolios (2008-present), Assistant Treasurer of other Fidelity funds (2009-present) and is an employee of Fidelity Investments. |
Christopher P. Sullivan (57) |
| Year of Election or Appointment: 2009 Vice President of Fidelity's Bond Funds. Mr. Sullivan also serves as President of Fidelity's Bond Division (2009-present). Mr. Sullivan is Executive Vice President of Fidelity Investments Money Management, Inc. (2009-present), and a Director of Fidelity Management & Research (U.K.) Inc. (2010-present). Previously, Mr. Sullivan served as Managing Director, Co-Head of U.S. Fixed Income at Goldman Sachs Asset Management (2001-2009). |
Christine J. Thompson (53) |
| Year of Election or Appointment: 2010 Vice President of Fidelity's Bond Funds. Ms. Thompson also serves as Chief Investment Officer of FMR's Bond Group (2010-present) and is an employee of Fidelity Investments. Previously, Ms. Thompson served as Director of Municipal Bond Portfolio Managers (2002-2010). |
Scott C. Goebel (43) |
| Year of Election or Appointment: 2008 Secretary and Chief Legal Officer (CLO) of the Fidelity funds. Mr. Goebel also serves as Secretary of Fidelity Investments Money Management, Inc. (FIMM) (2010-present) and Fidelity Research and Analysis Company (FRAC) (2010-present); Secretary and CLO of The North Carolina Capital Management Trust: Cash and Term Portfolios (2008-present); General Counsel, Secretary, and Senior Vice President of FMR (2008-present) and FMR Co., Inc. (2008-present); employed by FMR LLC or an affiliate (2001-present); Chief Legal Officer of Fidelity Management & Research (Hong Kong) Limited (2008-present) and Assistant Secretary of Fidelity Management & Research (Japan) Inc. (2008-present), and Fidelity Management & Research (U.K.) Inc. (2008-present). Previously, Mr. Goebel served as Assistant Secretary of FIMM (2008-2010), FRAC (2008-2010), and the Funds (2007-2008) and as Vice President and Secretary of Fidelity Distributors Corporation (FDC) (2005-2007). |
David J. Carter (38) |
| Year of Election or Appointment: 2010 Assistant Secretary of Fidelity's Fixed Income and Asset Allocation Funds. Mr. Carter also serves as Vice President, Associate General Counsel (2010-present) and is an employee of Fidelity Investments (2005-present). |
Holly C. Laurent (57) |
| Year of Election or Appointment: 2008 Anti-Money Laundering (AML) Officer of the Fidelity funds. Ms. Laurent also serves as AML Officer of The North Carolina Capital Management Trust: Cash and Term Portfolios (2008-present) and is an employee of Fidelity Investments. Previously, Ms. Laurent was Senior Vice President and Head of Legal for Fidelity Business Services India Pvt. Ltd. (2006-2008), and Senior Vice President, Deputy General Counsel and Group Head for FMR LLC (2005-2006). |
Christine Reynolds (52) |
| Year of Election or Appointment: 2008 Chief Financial Officer of the Fidelity funds. Ms. Reynolds became President of Fidelity Pricing and Cash Management Services (FPCMS) in August 2008. Ms. Reynolds served as Chief Operating Officer of FPCMS (2007-2008). Previously, Ms. Reynolds served as President, Treasurer, and Anti-Money Laundering officer of the Fidelity funds (2004-2007). |
Michael H. Whitaker (44) |
| Year of Election or Appointment: 2008 Chief Compliance Officer of Fidelity's Fixed Income and Asset Allocation Funds. Mr. Whitaker also serves as Chief Compliance Officer of The North Carolina Capital Management Trust: Cash and Term Portfolios (2008-present). Mr. Whitaker is an employee of Fidelity Investments (2007-present). Prior to joining Fidelity Investments, Mr. Whitaker worked at MFS Investment Management where he served as Senior Vice President and Chief Compliance Officer (2004-2006), and Assistant General Counsel. |
Jeffrey S. Christian (49) |
| Year of Election or Appointment: 2009 Deputy Treasurer of the Fidelity funds. Mr. Christian is an employee of Fidelity Investments. Previously, Mr. Christian served as Chief Financial Officer (2008-2009) of certain Fidelity funds and Senior Vice President of Fidelity Pricing and Cash Management Services (FPCMS) (2004-2009). |
Bryan A. Mehrmann (50) |
| Year of Election or Appointment: 2005 Deputy Treasurer of the Fidelity funds. Mr. Mehrmann is an employee of Fidelity Investments. |
Stephanie J. Dorsey (42) |
| Year of Election or Appointment: 2008 Deputy Treasurer of Fidelity's Fixed Income and Asset Allocation Funds. Ms. Dorsey also serves as Assistant Treasurer of other Fidelity funds (2010-present) and is an employee of Fidelity Investments (2008-present). Previously, Ms. Dorsey served as Treasurer (2004-2008) of the JPMorgan Mutual Funds and Vice President (2004-2008) of JPMorgan Chase Bank. |
Adrien E. Deberghes (43) |
| Year of Election or Appointment: 2010 Assistant Treasurer of Fidelity's Fixed Income and Asset Allocation Funds. Mr. Deberghes also serves as Deputy Treasurer of other Fidelity funds (2008-present) and is an employee of Fidelity Investments (2008-present). Previously, Mr. Deberghes served as Senior Vice President of Mutual Fund Administration at State Street Corporation (2007-2008), Senior Director of Mutual Fund Administration at Investors Bank & Trust (2005-2007), and Director of Finance for Dunkin' Brands (2000-2005). |
Kenneth B. Robins (41) |
| Year of Election or Appointment: 2009 Assistant Treasurer of the Fidelity Fixed Income and Asset Allocation Funds. Mr. Robins also serves as President and Treasurer of other Fidelity funds (2008-present; 2010-present) and is an employee of Fidelity Investments (2004-present). Previously, Mr. Robins served as Deputy Treasurer of the Fidelity funds (2005-2008) and Treasurer and Chief Financial Officer of The North Carolina Capital Management Trust: Cash and Term Portfolios (2006-2008). |
Gary W. Ryan (52) |
| Year of Election or Appointment: 2005 Assistant Treasurer of the Fidelity funds. Mr. Ryan is an employee of Fidelity Investments. Previously, Mr. Ryan served as Vice President of Fund Reporting in Fidelity Pricing and Cash Management Services (FPCMS) (1999-2005). |
Jonathan Davis (43) |
| Year of Election or Appointment: 2010 Assistant Treasurer of the Fidelity funds. Mr. Davis is an employee of Fidelity Investments. Previously, Mr. Davis served as Vice President and Associate General Counsel of FMR LLC (2003-2010). |
Annual Report
The fund hereby designates as a capital gain dividend with respect to the taxable year ended July 31, 2011, $73,201,895, or, if subsequently determined to be different, the net capital gain of such year.
A total of 45.92% of the dividends distributed during the fiscal year was derived from interest on U.S. Government securities which is generally exempt from state income tax.
The fund designates $64,328,834 of distributions paid during the period January 1, 2011 to July 31, 2011 as qualifying to be taxed as interest-related dividends for nonresident alien shareholders.
The fund will notify shareholders in January 2012 of amounts for use in preparing 2011 income tax returns.
Annual Report
Investment Adviser
Fidelity Management & Research Company
Boston, MA
Investment Sub-Advisers
Fidelity Investments Money
Management, Inc.
Fidelity Management & Research
(U.K.) Inc.
Fidelity Management & Research
(Hong Kong) Limited
Fidelity Management & Research
(Japan) Inc.
General Distributor
Fidelity Distributors Corporation
Boston, MA
Transfer and Service Agents
Fidelity Investments Institutional Operations Company, Inc.
Boston, MA
Fidelity Service Company, Inc.
Boston, MA
Custodian
The Bank of New York Mellon
New York, NY
AGVT-UANN-0911
1.834241.104

(Fidelity Investment logo)(registered trademark)
Fidelity Advisor®
Government Income
Fund - Institutional Class
Annual Report
July 31, 2011
Institutional Class is a class of
Fidelity® Government Income Fund
(2_fidelity_logos) (Registered_Trademark)
Contents
Chairman's Message | <Click Here> | The Chairman's message to shareholders. |
Performance | <Click Here> | How the fund has done over time. |
Management's Discussion of Fund Performance | <Click Here> | The Portfolio Manager's review of fund performance and strategy. |
Shareholder Expense Example | <Click Here> | An example of shareholder expenses. |
Investment Changes | <Click Here> | A summary of major shifts in the fund's investments over the past six months. |
Investments | <Click Here> | A complete list of the fund's investments with their market values. |
Financial Statements | <Click Here> | Statements of assets and liabilities, operations, and changes in net assets, as well as financial highlights. |
Notes | <Click Here> | Notes to the financial statements. |
Report of Independent Registered Public Accounting Firm | <Click Here> | |
Trustees and Officers | <Click Here> | |
Distributions | <Click Here> | |
To view a fund's proxy voting guidelines and proxy voting record for the 12-month period ended June 30, visit http://www.fidelity.com/proxyvotingresults or visit the Securities and Exchange Commission's (SEC) web site at http://www.sec.gov. You may also call 1-877-208-0098 to request a free copy of the proxy voting guidelines.
Standard & Poor's, S&P and S&P 500 are registered service marks of The McGraw-Hill Companies, Inc. and have been licensed for use by Fidelity Distributors Corporation.
Other third party marks appearing herein are the property of their respective owners.
All other marks appearing herein are registered or unregistered trademarks or service marks of FMR LLC or an affiliated company.
Annual Report
This report and the financial statements contained herein are submitted for the general information of the shareholders of the fund. This report is not authorized for distribution to prospective investors in the fund unless preceded or accompanied by an effective prospectus.
A fund files its complete schedule of portfolio holdings with the SEC for the first and third quarters of each fiscal year on Form N-Q. Forms N-Q are available on the SEC's web site at http://www.sec.gov. A fund's Forms N-Q may be reviewed and copied at the SEC's Public Reference Room in Washington, DC. Information regarding the operation of the SEC's Public Reference Room may be obtained by calling 1-800-SEC-0330. For a complete list of a fund's portfolio holdings, view the most recent holdings listing, semiannual report, or annual report on Fidelity's web site at http://www.fidelity.com, http://www.advisor.fidelity.com, or http://www.401k.com, as applicable.
NOT FDIC INSURED • MAY LOSE VALUE • NO BANK GUARANTEE
Neither the fund nor Fidelity Distributors Corporation is a bank.
Annual Report
(photo_of_Abigail_P_Johnson)
Dear Shareholder:
The second half of 2011 began with U.S. equities continuing to give back some of the gains achieved earlier in the year. In the days leading up to July 31, markets were shaken by a political stalemate in which Congress struggled to address the debt ceiling issue before an early-August deadline. The resulting uncertainty held back markets in July, the third consecutive monthly decline for equities, effectively reversing the positive momentum seen through the end of April. Financial markets are always unpredictable, of course, but there are several time-tested investment principles that can help put the odds in your favor.
One of the basic tenets is to invest for the long term. Over time, riding out the markets' inevitable ups and downs has proven much more effective than selling into panic or chasing the hottest trend. Even missing only a few of the markets' best days can significantly diminish investor returns. Patience also affords the benefits of compounding - of earning interest on additional income or reinvested dividends and capital gains. There can be tax advantages and cost benefits to consider as well. While staying the course doesn't eliminate risk, it can considerably lessen the effect of short-term declines.
You can further manage your investing risk through diversification. And today, more than ever, geographic diversification should be taken into account. Studies indicate that asset allocation is the single most important determinant of a portfolio's long-term success. The right mix of stocks, bonds and cash - aligned to your particular risk tolerance and investment objective - is very important. Age-appropriate rebalancing is also an essential aspect of asset allocation. For younger investors, an emphasis on equities - which historically have been the best-performing asset class over time - is encouraged. As investors near their specific goal, such as retirement or sending a child to college, consideration may be given to replacing volatile assets (e.g. common stocks) with more-stable fixed investments (bonds or savings plans).
A third principle - investing regularly - can help lower the average cost of your purchases. Investing a certain amount of money each month or quarter helps ensure you won't pay for all your shares at market highs. This strategy - known as dollar cost averaging - also reduces "emotion" from investing, helping shareholders avoid selling weak performers just prior to an upswing, or chasing a hot performer just before a correction.
We invite you to contact us via the Internet, through our Investor Centers or by phone. It is our privilege to provide you the information you need to make the investments that are right for you.
Sincerely,
(The chairman's signature appears here.)
Abigail P. Johnson
Annual Report
Average annual total return reflects the change in the value of an investment, assuming reinvestment of the class' distributions from dividend income and capital gains (the profits earned upon the sale of securities that have grown in value, if any) and assuming a constant rate of performance each year. The $10,000 table and the fund's returns do not reflect the deduction of taxes that a shareholder would pay on fund distributions or the redemption of fund shares. During periods of reimbursement by Fidelity, a fund's total return will be greater than it would be had the reimbursement not occurred. How a fund did yesterday is no guarantee of how it will do tomorrow.
Average Annual Total Returns
Periods ended July 31, 2011 | Past 1
year | Past 5
years | Past 10
years |
Institutional Class A | 3.10% | 6.31% | 5.30% |
A The initial offering of Institutional Class shares took place on October 24, 2006. Returns prior to October 24, 2006 are those of Fidelity Government Income Fund, the original class of the fund.
$10,000 Over 10 Years
Let's say hypothetically that $10,000 was invested in Fidelity Advisor® Government Income Fund - Institutional Class on July 31, 2001. The chart shows how the value of your investment would have changed, and also shows how the Barclays Capital U.S. Government Bond Index performed over the same period. The initial offering of Institutional Class took place on October 24, 2006. See above for additional information regarding the performance of Institutional Class.
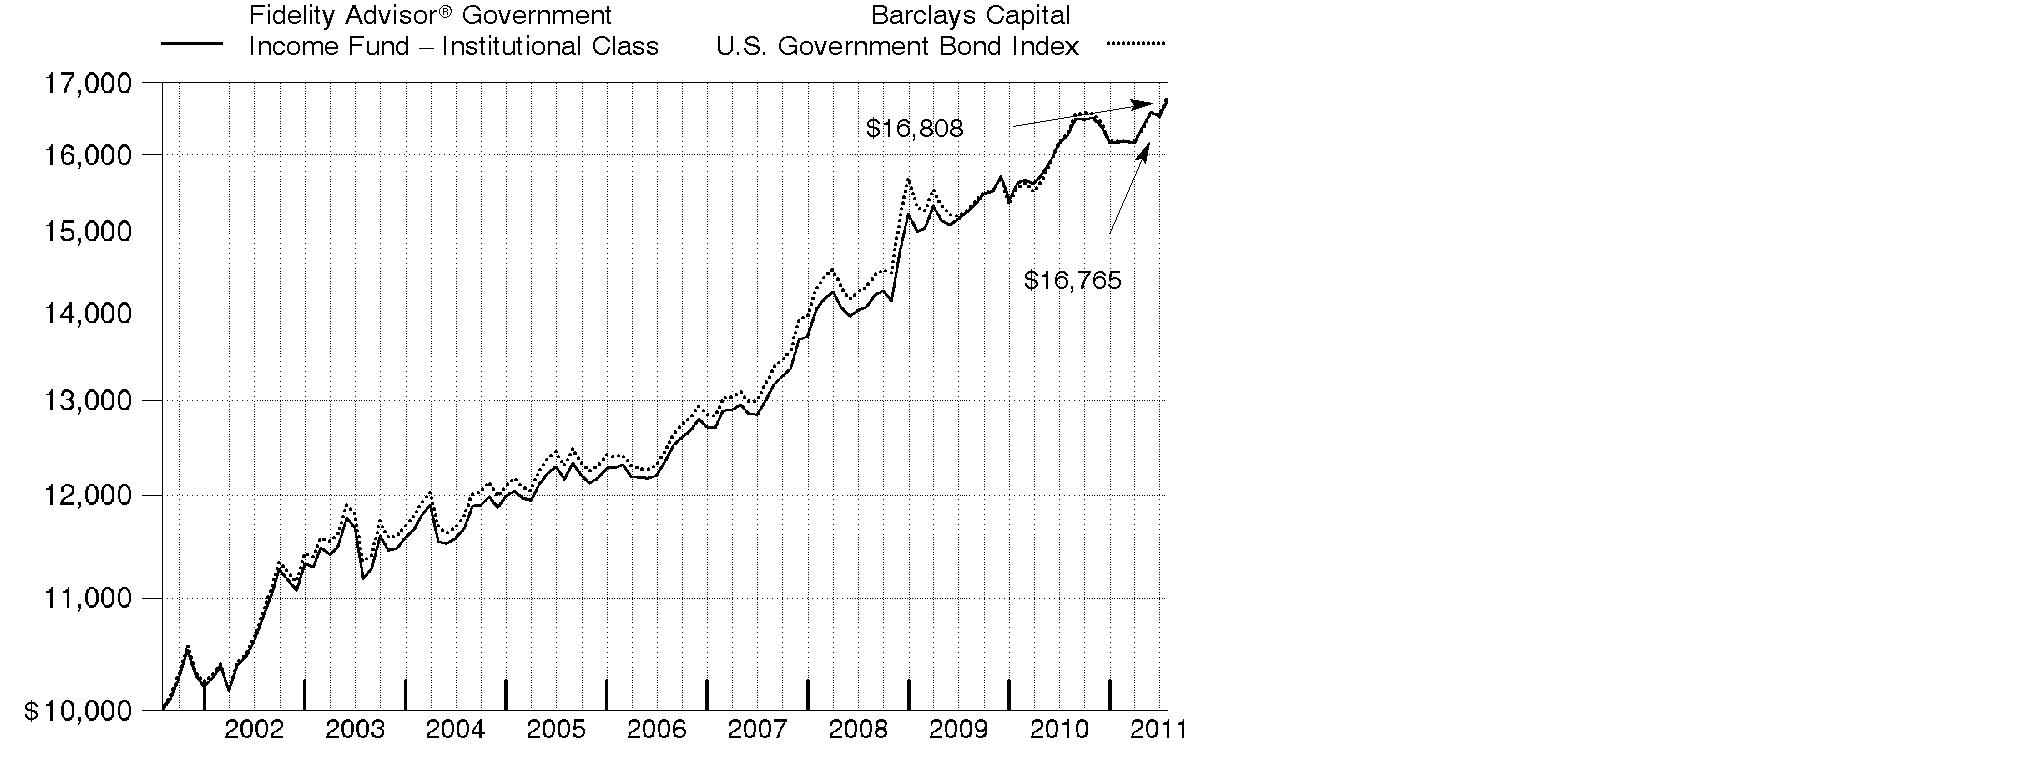
Annual Report
Market Recap: Amid ultra-low interest rates and heightened market volatility, U.S. taxable investment-grade bonds generated solid results for the year ending July 31, 2011, as evidenced by the 4.44% advance of the Barclays Capital® U.S. Aggregate Bond Index. The best-performing categories within the index were those on the riskier end of the spectrum that benefited during intervals when data pointed to an improving economy. Buoyed by a strong first-half showing, commercial mortgage-backed securities (CMBS) fared best, gaining 10.01% amid modest improvement in commercial real estate fundamentals. Corporate bonds rose 6.70%, due in large part to increased corporate profitability, high cash balances, reduced debt levels and improved credit conditions. Residential mortgage-backed securities, supported by a combination of strong demand from yield-hungry investors and slower prepayment rates, rose a solid 3.85%. Meanwhile, U.S. Treasury and agency securities gained 3.39% and 2.53%, respectively. These securities, which lagged in the first half of the period, when economic data was strong and inflation worries were muted, performed comparatively well in the second half amid signs of a weakening economic recovery and heightened concern about the sovereign debt crisis in Europe.
Comments from William Irving, Lead Portfolio Manager of Fidelity Advisor® Government Income Fund: For the year, the fund's Institutional Class shares returned 3.10%, while the Barclays Capital® 75% U.S. Government/25% U.S. MBS Blended Index rose 3.41%. Emphasizing sectors with a yield advantage over conventional Treasuries helped bolster the fund's performance. Specifically, out-of-benchmark exposure to strong-performing Treasury Inflation-Protected Securities (TIPS), which we ultimately eliminated by the end of the period, and favorable positioning within the mortgage sector aided results. The fund gained from both an overweighting and good security selection within mortgages. Specifically, emphasizing prepayment-resistant securities worked in our favor during the period's first half. We also modestly benefited from owning collateralized mortgage obligation (CMO) floaters. Detracting from performance was out-of-index exposure to reverse mortgage securities, which lagged, and ineffective yield-curve positioning.
Note to shareholders: Effective August 1, 2011, the fund will have the ability to invest in agency MBS indirectly through Fidelity Mortgage Backed Securities Central Fund. In connection with this change, the fund's fiscal year end will shift from July 31 to August 31 to align it with that of the central fund.
The views expressed above reflect those of the portfolio manager(s) only through the end of the period as stated on the cover of this report and do not necessarily represent the views of Fidelity or any other person in the Fidelity organization. Any such views are subject to change at any time based upon market or other conditions and Fidelity disclaims any responsibility to update such views. These views may not be relied on as investment advice and, because investment decisions for a Fidelity fund are based on numerous factors, may not be relied on as an indication of trading intent on behalf of any Fidelity fund.
Annual Report
Shareholder Expense Example
As a shareholder of the Fund, you incur two types of costs: (1) transaction costs, including sales charges (loads) on purchase payments or redemption proceeds, and (2) ongoing costs, including management fees, distribution and/or service (12b-1) fees and other Fund expenses. This Example is intended to help you understand your ongoing costs (in dollars) of investing in the Fund and to compare these costs with the ongoing costs of investing in other mutual funds.
The Example is based on an investment of $1,000 invested at the beginning of the period and held for the entire period (February 1, 2011 to July 31, 2011).
Actual Expenses
The first line of the accompanying table for each class of the Fund provides information about actual account values and actual expenses. You may use the information in this line, together with the amount you invested, to estimate the expenses that you paid over the period. Simply divide your account value by $1,000.00 (for example, an $8,600 account value divided by $1,000.00 = 8.6), then multiply the result by the number in the first line for a class of the Fund under the heading entitled "Expenses Paid During Period" to estimate the expenses you paid on your account during this period. A small balance maintenance fee of $12.00 that is charged once a year may apply for certain accounts with a value of less than $2,000. This fee is not included in the table below. If it was, the estimate of expenses you paid during the period would be higher, and your ending account value lower, by this amount.
Hypothetical Example for Comparison Purposes
The second line of the accompanying table for each class of the Fund provides information about hypothetical account values and hypothetical expenses based on a Class' actual expense ratio and an assumed rate of return of 5% per year before expenses, which is not the Class' actual return. The hypothetical account values and expenses may not be used to estimate the actual ending account balance or expenses you paid for the period. You may use this information to compare the ongoing costs of investing in the Fund and other funds. To do so, compare this 5% hypothetical example with the 5% hypothetical examples that appear in the shareholder reports of the other funds. A small balance maintenance fee of $12.00 that is charged once a year may apply for certain accounts with a value of less than $2,000. This fee is not included in the table below. If it was, the estimate of expenses you paid during the period would be higher, and your ending account value lower, by this amount.
Please note that the expenses shown in the table are meant to highlight your ongoing costs only and do not reflect any transaction costs. Therefore, the second line of the table is useful in comparing ongoing costs only, and will not help you determine the relative total costs of owning different funds. In addition, if these transactional costs were included, your costs would have been higher.
Annual Report
| Annualized
Expense Ratio | Beginning
Account Value
February 1, 2011 | Ending
Account Value
July 31, 2011 | Expenses Paid
During Period*
February 1, 2011
to July 31, 2011 |
Class A | .78% | | | |
Actual | | $ 1,000.00 | $ 1,035.30 | $ 3.94 |
Hypothetical A | | $ 1,000.00 | $ 1,020.93 | $ 3.91 |
Class T | .76% | | | |
Actual | | $ 1,000.00 | $ 1,035.40 | $ 3.84 |
HypotheticalA | | $ 1,000.00 | $ 1,021.03 | $ 3.81 |
Class B | 1.51% | | | |
Actual | | $ 1,000.00 | $ 1,031.60 | $ 7.61 |
HypotheticalA | | $ 1,000.00 | $ 1,017.31 | $ 7.55 |
Class C | 1.53% | | | |
Actual | | $ 1,000.00 | $ 1,031.50 | $ 7.71 |
HypotheticalA | | $ 1,000.00 | $ 1,017.21 | $ 7.65 |
Government Income | .45% | | | |
Actual | | $ 1,000.00 | $ 1,037.00 | $ 2.27 |
HypotheticalA | | $ 1,000.00 | $ 1,022.56 | $ 2.26 |
Institutional Class | .52% | | | |
Actual | | $ 1,000.00 | $ 1,036.60 | $ 2.63 |
HypotheticalA | | $ 1,000.00 | $ 1,022.22 | $ 2.61 |
A 5% return per year before expenses
* Expenses are equal to each Class' annualized expense ratio, multiplied by the average account value over the period, multiplied by 181/365 (to reflect the one-half year period).
Annual Report
Investment Changes (Unaudited)
Coupon Distribution as of July 31, 2011 |
| % of fund's investments | % of fund's investments
6 months ago |
Zero coupon bonds | 1.9 | 1.3 |
0.01 - 0.99% | 14.8 | 8.9 |
1 - 1.99% | 14.2 | 15.3 |
2 - 2.99% | 9.8 | 12.7 |
3 - 3.99% | 6.9 | 15.1 |
4 - 4.99% | 19.8 | 14.9 |
5 - 5.99% | 14.8 | 16.2 |
6 - 6.99% | 4.3 | 7.6 |
7% and over | 0.7 | 4.0 |
Coupon distribution shows the range of stated interest rates on the fund's investments, excluding short-term investments. |
Weighted Average Maturity as of July 31, 2011 |
| | 6 months ago |
Years | 5.3 | 6.0 |
This is a weighted average of all the maturities of the securities held in a fund. Weighted Average Maturity (WAM) can be used as a measure of sensitivity to interest rate changes and markets changes. Generally, the longer the maturity, the greater the sensitivity to such changes. WAM is based on the dollar-weighted average length of time until principal payments must be paid. Depending on the types of securities held in a fund, certain maturity shortening devices (e.g., demand features, interest rate resets, and call options) may be taken into account when calculating the WAM. |
Duration as of July 31, 2011 |
| | 6 months ago |
Years | 4.7 | 4.5 |
Duration estimates how much a bond fund's price will change with a change in comparable interest rates. If rates rise 1%, for example, a fund with a 5-year duration is likely to lose about 5% of its value. Other factors also can influence a bond fund's performance and share price. Accordingly, a bond fund's actual performance may differ from this example. Duration takes into account any call or put option embedded in the bonds. |
Asset Allocation (% of fund's net assets) |
As of July 31, 2011 * | As of January 31, 2011 ** |
| Mortgage
Securities 29.6% | | | Mortgage
Securities 39.6% | |
| CMOs and Other Mortgage Related Securities 10.2% | | | CMOs and Other Mortgage Related Securities 9.3% | |
| U.S. Treasury
Obligations 47.2% | | | U.S. Treasury
Obligations 48.6% | |
| U.S. Government
Agency
Obligations† 13.0% | | | U.S. Government
Agency
Obligations† 16.4% | |
| Foreign Government
& Government
Agency Obligations 1.5% | | | Foreign Government
& Government
Agency Obligations 1.4% | |
| Short-Term
Investments and
Net Other
Assets*** (1.5)% | | | Short-Term
Investments and
Net Other
Assets*** (15.3)% | |
* Futures and Swaps | 2.9% | | ** Futures and Swaps | (2.5)% | |
† Includes FDIC Guaranteed Corporate Securities and NCUA Guaranteed Notes. | |
*** Short-Term Investments and Net Other Assets are not included in the pie chart. | |

Annual Report
Investments July 31, 2011
Showing Percentage of Net Assets
U.S. Government and Government Agency Obligations - 60.2% |
| Principal Amount (000s) | | Value (000s) |
U.S. Government Agency Obligations - 6.5% |
Fannie Mae: | | | | |
0.375% 12/28/12 | | $ 50,670 | | $ 50,692 |
0.75% 12/18/13 | | 7,805 | | 7,819 |
1.125% 6/27/14 | | 16,915 | | 17,098 |
4.75% 11/19/12 | | 2,000 | | 2,113 |
Federal Home Loan Bank: | | | | |
0.5% 8/28/13 | | 91,450 | | 91,447 |
0.875% 8/22/12 | | 8,580 | | 8,627 |
Freddie Mac 1% 8/27/14 | | 15,111 | | 15,189 |
Overseas Private Investment Corp. U.S. Government guaranteed participation certificates 6.77% 11/15/13 | | 2,558 | | 2,712 |
Private Export Funding Corp. secured: | | | | |
4.974% 8/15/13 | | 22,940 | | 24,937 |
5.66% 9/15/11 (c) | | 18,000 | | 18,112 |
5.685% 5/15/12 | | 24,035 | | 25,046 |
Small Business Administration guaranteed development participation certificates: | | | | |
Series 2002-20J Class 1, 4.75% 10/1/22 | | 3,859 | | 4,133 |
Series 2002-20K Class 1, 5.08% 11/1/22 | | 8,140 | | 8,791 |
Series 2003-P10B, Class 1 5.136% 8/10/13 | | 2,114 | | 2,235 |
Series 2004-20H Class 1, 5.17% 8/1/24 | | 2,445 | | 2,654 |
Tennessee Valley Authority: | | | | |
3.875% 2/15/21 | | 33,790 | | 35,714 |
5.25% 9/15/39 | | 12,000 | | 13,135 |
5.375% 4/1/56 | | 8,429 | | 9,377 |
TOTAL U.S. GOVERNMENT AGENCY OBLIGATIONS | | 339,831 |
U.S. Treasury Obligations - 47.2% |
U.S. Treasury Bonds: | | | | |
4.375% 2/15/38 | | 14,154 | | 14,809 |
4.375% 5/15/41 | | 176,866 | | 183,803 |
5% 5/15/37 (g) | | 55,700 | | 64,281 |
5.25% 2/15/29 | | 34,950 | | 41,913 |
6.125% 11/15/27 | | 27,365 | | 35,904 |
6.125% 8/15/29 | | 2,877 | | 3,797 |
8% 11/15/21 | | 14,605 | | 21,364 |
9.875% 11/15/15 | | 10,285 | | 14,110 |
U.S. Treasury Notes: | | | | |
0.375% 6/30/13 (b) | | 249,596 | | 249,693 |
0.5% 5/31/13 | | 51,764 | | 51,908 |
0.625% 7/15/14 (b) | | 310,712 | | 311,489 |
U.S. Government and Government Agency Obligations - continued |
| Principal Amount (000s) | | Value (000s) |
U.S. Treasury Obligations - continued |
U.S. Treasury Notes: - continued | | | | |
0.75% 6/15/14 | | $ 91,489 | | $ 92,089 |
1% 4/30/12 | | 602 | | 605 |
1.25% 8/31/15 | | 500 | | 506 |
1.25% 10/31/15 | | 29,580 | | 29,843 |
1.375% 11/15/12 | | 79,743 | | 80,858 |
1.5% 7/31/16 | | 315,993 | | 318,192 |
1.75% 7/31/15 | | 28,800 | | 29,738 |
1.875% 8/31/17 | | 47,000 | | 47,290 |
1.875% 9/30/17 | | 87,400 | | 87,748 |
2.125% 5/31/15 | | 18,669 | | 19,572 |
2.25% 7/31/18 | | 260,091 | | 262,631 |
2.375% 8/31/14 | | 20,000 | | 21,091 |
2.375% 9/30/14 | | 13,017 | | 13,733 |
2.375% 10/31/14 | | 77,497 | | 81,814 |
2.5% 6/30/17 | | 10,000 | | 10,450 |
2.625% 7/31/14 (h) | | 83,808 | | 88,974 |
2.75% 11/30/16 | | 18,530 | | 19,740 |
3.125% 1/31/17 | | 60,773 | | 65,858 |
3.125% 5/15/21 | | 71,904 | | 73,904 |
3.625% 8/15/19 | | 33,225 | | 36,340 |
4% 2/15/15 | | 12,619 | | 14,062 |
4.25% 11/15/17 | | 27,475 | | 31,502 |
4.5% 5/15/17 | | 24,685 | | 28,619 |
4.75% 8/15/17 | | 12,983 | | 15,258 |
TOTAL U.S. TREASURY OBLIGATIONS | | 2,463,488 |
Other Government Related - 6.5% |
Bank of America Corp.: | | | | |
2.1% 4/30/12 (FDIC Guaranteed) (d) | | 6,060 | | 6,143 |
3.125% 6/15/12 (FDIC Guaranteed) (d) | | 3,719 | | 3,810 |
Citibank NA: | | | | |
1.875% 5/7/12 (FDIC Guaranteed) (d) | | 87,150 | | 88,209 |
1.875% 6/4/12 (FDIC Guaranteed) (d) | | 33,000 | | 33,436 |
Citigroup Funding, Inc.: | | | | |
1.875% 10/22/12 (FDIC Guaranteed) (d) | | 40,500 | | 41,262 |
1.875% 11/15/12 (FDIC Guaranteed) (d) | | 18,920 | | 19,278 |
2% 3/30/12 (FDIC Guaranteed) (d) | | 16,000 | | 16,199 |
2.125% 7/12/12 (FDIC Guaranteed) (d) | | 8,784 | | 8,939 |
General Electric Capital Corp.: | | | | |
2% 9/28/12 (FDIC Guaranteed) (d) | | 11,000 | | 11,208 |
U.S. Government and Government Agency Obligations - continued |
| Principal Amount (000s) | | Value (000s) |
Other Government Related - continued |
General Electric Capital Corp.: - continued | | | | |
2.625% 12/28/12 (FDIC Guaranteed) (d) | | $ 16,154 | | $ 16,690 |
3% 12/9/11 (FDIC Guaranteed) (d) | | 4,720 | | 4,767 |
GMAC, Inc. 1.75% 10/30/12 (FDIC Guaranteed) (d) | | 51,106 | | 51,960 |
Goldman Sachs Group, Inc. 3.25% 6/15/12 (FDIC Guaranteed) (d) | | 3,714 | | 3,808 |
JPMorgan Chase & Co.: | | | | |
2.2% 6/15/12 (FDIC Guaranteed) (d) | | 9,200 | | 9,354 |
3.125% 12/1/11 (FDIC Guaranteed) (d) | | 790 | | 798 |
National Credit Union Administration Guaranteed Notes: | | | | |
Series 2010-A1 Class A, 0.5351% 12/7/20 (NCUA Guaranteed) (i) | | 11,813 | | 11,846 |
Series 2011-R4 Class 1A, 0.5698% 3/6/20 (NCUA Guaranteed) (i) | | 12,418 | | 12,424 |
TOTAL OTHER GOVERNMENT RELATED | | 340,131 |
TOTAL U.S. GOVERNMENT AND GOVERNMENT AGENCY OBLIGATIONS (Cost $3,073,941) | 3,143,450 |
U.S. Government Agency - Mortgage Securities - 29.6% |
|
Fannie Mae - 18.5% |
1.975% 10/1/33 (i) | | 300 | | 311 |
2.01% 2/1/33 (i) | | 309 | | 320 |
2.035% 12/1/34 (i) | | 352 | | 364 |
2.035% 3/1/35 (i) | | 283 | | 294 |
2.054% 10/1/33 (i) | | 148 | | 155 |
2.065% 7/1/35 (i) | | 139 | | 145 |
2.175% 3/1/35 (i) | | 58 | | 61 |
2.297% 11/1/33 (i) | | 827 | | 858 |
2.457% 3/1/35 (i) | | 179 | | 189 |
2.509% 2/1/36 (i) | | 696 | | 734 |
2.534% 7/1/34 (i) | | 173 | | 180 |
2.534% 7/1/35 (i) | | 584 | | 613 |
2.543% 6/1/36 (i) | | 249 | | 261 |
2.554% 10/1/33 (i) | | 254 | | 268 |
2.584% 11/1/36 (i) | | 209 | | 220 |
2.603% 5/1/36 (i) | | 465 | | 488 |
3.47% 3/1/40 (i) | | 11,245 | | 11,778 |
U.S. Government Agency - Mortgage Securities - continued |
| Principal Amount (000s) | | Value (000s) |
Fannie Mae - continued |
3.5% 12/1/25 to 2/1/41 | | $ 116,319 | | $ 115,900 |
3.688% 5/1/40 (i) | | 6,190 | | 6,498 |
3.698% 5/1/40 (i) | | 7,335 | | 7,703 |
3.791% 6/1/40 (i) | | 6,350 | | 6,679 |
3.972% 11/1/39 (i) | | 5,571 | | 5,883 |
4% 9/1/13 to 7/1/41 | | 85,281 | | 87,238 |
4.5% 6/1/25 to 7/1/41 | | 150,438 | | 157,250 |
4.5% 8/1/26 (e) | | 1,000 | | 1,063 |
4.5% 8/1/41 (e)(f) | | 40,000 | | 41,746 |
4.5% 8/1/41 (e)(f) | | 16,000 | | 16,698 |
4.5% 8/1/41 (e)(f) | | 60,000 | | 62,618 |
4.5% 9/1/41 (e) | | 84,000 | | 87,399 |
5% 2/1/16 to 9/1/40 | | 110,024 | | 118,062 |
5% 8/1/41 (e)(f) | | 23,000 | | 24,557 |
5% 9/1/41 (e) | | 23,000 | | 24,478 |
5.5% 10/1/20 to 3/1/39 | | 71,278 | | 77,677 |
5.746% 3/1/36 (i) | | 2,209 | | 2,347 |
5.963% 3/1/37 (i) | | 595 | | 645 |
6% 3/1/17 to 9/1/39 | | 33,519 | | 36,658 |
6% 8/1/41 (e)(f) | | 15,000 | | 16,494 |
6% 8/1/41 (e)(f) | | 15,000 | | 16,494 |
6% 8/1/41 (e)(f) | | 9,300 | | 10,227 |
6% 8/1/41 (e)(f) | | 8,000 | | 8,797 |
6% 9/1/41 (e) | | 1,300 | | 1,426 |
6.5% 2/1/12 to 4/1/37 | | 8,432 | | 9,282 |
7% 7/1/13 to 7/1/32 | | 2,629 | | 2,983 |
7.5% 11/1/11 to 4/1/29 | | 16 | | 18 |
8.5% 1/1/15 to 7/1/31 | | 213 | | 235 |
9% 5/1/14 | | 137 | | 142 |
9.5% 4/1/16 to 10/1/20 | | 274 | | 320 |
11.25% 5/1/14 | | 2 | | 2 |
11.5% 6/15/19 to 1/15/21 | | 281 | | 305 |
12.5% 8/1/15 to 3/1/16 | | 1 | | 1 |
| | 965,064 |
Freddie Mac - 4.4% |
1.945% 3/1/35 (i) | | 1,061 | | 1,095 |
2.046% 5/1/37 (i) | | 628 | | 654 |
2.615% 6/1/35 (i) | | 770 | | 814 |
2.654% 2/1/36 (i) | | 122 | | 128 |
2.942% 3/1/33 (i) | | 57 | | 61 |
2.995% 7/1/35 (i) | | 1,865 | | 1,987 |
U.S. Government Agency - Mortgage Securities - continued |
| Principal Amount (000s) | | Value (000s) |
Freddie Mac - continued |
3.282% 10/1/35 (i) | | $ 345 | | $ 368 |
3.801% 4/1/40 (i) | | 5,941 | | 6,221 |
4% 7/1/39 to 1/1/41 | | 8,777 | | 8,938 |
4% 8/1/41 (e) | | 5,000 | | 5,077 |
4.5% 7/1/25 to 4/1/41 | | 38,846 | | 40,609 |
4.5% 8/1/41 (e)(f) | | 6,100 | | 6,359 |
4.5% 9/1/41 (e) | | 2,000 | | 2,078 |
4.5% 9/1/41 (e) | | 4,100 | | 4,259 |
5% 8/1/35 to 4/1/41 | | 24,975 | | 26,745 |
5% 8/1/41 (e) | | 1,000 | | 1,066 |
5.138% 4/1/35 (i) | | 291 | | 310 |
5.292% 7/1/36 (i) | | 827 | | 872 |
5.5% 12/1/27 to 5/1/40 | | 62,560 | | 67,851 |
5.5% 8/1/41 (e)(f) | | 4,700 | | 5,089 |
5.5% 8/1/41 (e)(f) | | 4,800 | | 5,198 |
5.5% 9/1/41 (e) | | 9,500 | | 10,263 |
6% 7/1/16 to 7/1/37 | | 12,128 | | 13,221 |
6.5% 1/1/13 to 3/1/36 | | 19,149 | | 21,124 |
7.5% 9/1/11 to 7/1/16 | | 613 | | 662 |
8.5% 5/1/17 to 9/1/29 | | 118 | | 136 |
9% 9/1/14 to 10/1/20 | | 20 | | 21 |
9.5% 5/1/17 to 8/1/21 | | 119 | | 136 |
9.75% 8/1/14 | | 81 | | 89 |
10% 11/15/18 to 8/1/21 | | 8 | | 9 |
11% 5/1/14 | | 25 | | 27 |
12% 3/1/15 | | 1 | | 1 |
12.5% 2/1/14 to 6/1/19 | | 4 | | 4 |
13% 6/1/14 to 6/1/15 | | 1 | | 2 |
| | 231,474 |
Ginnie Mae - 6.7% |
3.5% 12/15/40 to 2/15/41 | | 19,398 | | 19,290 |
4% 1/15/25 to 10/20/25 | | 32,471 | | 34,454 |
4% 8/1/41 (e) | | 7,900 | | 8,153 |
4.5% 3/15/39 to 7/20/41 | | 87,696 | | 93,627 |
4.5% 8/1/41 (e) | | 1,000 | | 1,063 |
4.5% 8/1/41 (e) | | 10,000 | | 10,656 |
5% 9/20/33 to 12/15/40 | | 61,801 | | 67,779 |
5% 8/1/41 (e) | | 7,000 | | 7,631 |
5% 8/1/41 (e) | | 7,000 | | 7,631 |
5.492% 4/20/60 (l) | | 23,123 | | 25,626 |
5.493% 11/20/59 (l) | | 27,948 | | 30,777 |
U.S. Government Agency - Mortgage Securities - continued |
| Principal Amount (000s) | | Value (000s) |
Ginnie Mae - continued |
5.5% 12/15/38 to 3/15/39 | | $ 522 | | $ 579 |
5.513% 2/20/60 (l) | | 25,090 | | 27,833 |
6% 11/20/31 to 11/20/33 | | 10,075 | | 11,279 |
6.5% 3/20/31 to 10/15/35 | | 1,274 | | 1,439 |
7% 10/15/26 to 8/15/32 | | 72 | | 83 |
7.5% 3/15/28 to 8/15/29 | | 65 | | 75 |
8% 7/15/19 to 12/15/23 | | 733 | | 841 |
8.5% 1/15/25 | | 1 | | 1 |
9.5% 2/15/25 | | 1 | | 1 |
10.5% 4/15/14 to 1/20/18 | | 46 | | 54 |
| | 348,872 |
TOTAL U.S. GOVERNMENT AGENCY - MORTGAGE SECURITIES (Cost $1,510,263) | 1,545,410 |
Collateralized Mortgage Obligations - 10.2% |
|
U.S. Government Agency - 10.2% |
Fannie Mae: | | | | |
planned amortization class: | | | | |
Series 1992-168 Class KB, 7% 10/25/22 | | 673 | | 758 |
Series 1993-207 Class H, 6.5% 11/25/23 | | 10,287 | | 11,714 |
Series 1993-240 Class PD, 6.25% 12/25/13 | | 1,007 | | 1,050 |
Series 1994-23 Class PZ, 6% 2/25/24 | | 12,776 | | 15,204 |
Series 1996-28 Class PK, 6.5% 7/25/25 | | 2,000 | | 2,260 |
Series 2003-28 Class KG, 5.5% 4/25/23 | | 4,940 | | 5,541 |
Series 2006-45 Class OP, 6/25/36 (k) | | 3,768 | | 3,334 |
Series 2006-62 Class KP, 4/25/36 (k) | | 8,461 | | 7,093 |
Series 2010-118 Class PB, 4.5% 10/25/40 | | 7,053 | | 7,376 |
sequential payer: | | | | |
Series 1997-41 Class J, 7.5% 6/18/27 | | 1,482 | | 1,706 |
Series 2007-113 Class DB, 4.5% 12/25/22 | | 12,440 | | 13,810 |
Series 2007-115 Class BE, 4.5% 12/25/22 | | 15,400 | | 17,051 |
Series 2009-14 Class EB, 4.5% 3/25/24 | | 7,840 | | 8,627 |
Series 2010-97 Class CX, 4.5% 9/25/25 | | 10,813 | | 11,606 |
Series 2007-113 Class JD, 4.5% 12/25/22 | | 12,766 | | 14,146 |
Series 2010-109 Class IM, 5.5% 9/25/40 (j) | | 22,193 | | 4,333 |
Series 2010-114 Class CI, 5% 4/25/18 (j) | | 16,764 | | 1,794 |
Series 2010-37 Class GI, 5% 4/25/25 (j) | | 3,153 | | 320 |
Series 2010-97 Class CI, 4.5% 8/25/25 (j) | | 14,172 | | 1,609 |
Fannie Mae Stripped Mortgage-Backed Securities: | | | | |
sequential payer Series 377 Class 1, 10/1/36 (k) | | 10,519 | | 9,095 |
Collateralized Mortgage Obligations - continued |
| Principal Amount (000s) | | Value (000s) |
U.S. Government Agency - continued |
Fannie Mae Stripped Mortgage-Backed Securities: - continued | | | | |
Series 384 Class 6, 5% 7/25/37 (j) | | $ 11,934 | | $ 2,112 |
Fannie Mae subordinate REMIC pass-thru certificates: | | | | |
floater: | | | | |
Series 2001-38 Class QF, 1.1673% 8/25/31 (i) | | 350 | | 356 |
Series 2002-49 Class FB, 0.7865% 11/18/31 (i) | | 449 | | 451 |
Series 2002-60 Class FV, 1.1873% 4/25/32 (i) | | 189 | | 193 |
Series 2002-75 Class FA, 1.1873% 11/25/32 (i) | | 387 | | 395 |
Series 2008-76 Class EF, 0.6873% 9/25/23 (i) | | 5,380 | | 5,386 |
planned amortization class: | | | | |
Series 2003-113 Class PE, 4% 11/25/18 | | 7,545 | | 8,108 |
Series 2004-21 Class QE, 4.5% 11/25/32 | | 1,500 | | 1,634 |
Series 2005-102 Class CO, 11/25/35 (k) | | 3,818 | | 3,466 |
Series 2005-81 Class PC, 5.5% 9/25/35 | | 2,150 | | 2,459 |
Series 2006-12 Class BO, 10/25/35 (k) | | 16,901 | | 15,694 |
Series 2006-37 Class OW, 5/25/36 (k) | | 4,208 | | 3,574 |
sequential payer: | | | | |
Series 1999-25 Class Z, 6% 6/25/29 | | 2,967 | | 3,301 |
Series 2002-79 Class Z, 5.5% 11/25/22 | | 6,885 | | 7,564 |
Series 2005-117, Class JN, 4.5% 1/25/36 | | 645 | | 677 |
Series 2005-47 Class HK, 4.5% 6/25/20 | | 7,798 | | 8,575 |
Series 2006-72 Class CY, 6% 8/25/26 | | 10,215 | | 11,694 |
Series 2008-27 Class KB, 4.5% 4/25/23 | | 4,420 | | 4,898 |
Series 2009-85 Class IB, 4.5% 8/25/24 (j) | | 3,654 | | 404 |
Series 2009-93 Class IC, 4.5% 9/25/24 (j) | | 6,985 | | 744 |
Series 2010-139 Class NI, 4.5% 2/25/40 (j) | | 12,384 | | 2,322 |
Freddie Mac planned amortization class Series 2115 Class PE, 6% 1/15/14 | | 193 | | 201 |
Freddie Mac Manufactured Housing participation certificates guaranteed floater Series 1686 Class FA, 1.0875% 2/15/24 (i) | | 1,017 | | 1,035 |
Freddie Mac Multi-class participation certificates guaranteed: | | | | |
floater: | | | | |
Series 2530 Class FE, 0.7865% 2/15/32 (i) | | 254 | | 256 |
Series 2630 Class FL, 0.6865% 6/15/18 (i) | | 442 | | 446 |
Series 3008 Class SM, 0% 7/15/35 (i) | | 125 | | 121 |
planned amortization class: | | | | |
Series 1141 Class G, 9% 9/15/21 | | 191 | | 219 |
Series 2006-15 Class OP, 3/25/36 (k) | | 5,143 | | 4,316 |
Series 2356 Class GD, 6% 9/15/16 | | 198 | | 214 |
Collateralized Mortgage Obligations - continued |
| Principal Amount (000s) | | Value (000s) |
U.S. Government Agency - continued |
Freddie Mac Multi-class participation certificates guaranteed: - continued | | | | |
planned amortization class: | | | | |
Series 2376 Class JE, 5.5% 11/15/16 | | $ 1,369 | | $ 1,472 |
Series 2381 Class OG, 5.5% 11/15/16 | | 910 | | 975 |
Series 2628 Class OE, 4.5% 6/15/18 | | 6,815 | | 7,335 |
Series 2640 Class GE, 4.5% 7/15/18 | | 7,310 | | 7,897 |
Series 2672 Class MG, 5% 9/15/23 | | 7,120 | | 7,987 |
Series 2682 Class LD, 4.5% 10/15/33 | | 777 | | 820 |
Series 2802 Class OB, 6% 5/15/34 | | 10,455 | | 12,065 |
Series 2810 Class PD, 6% 6/15/33 | | 668 | | 704 |
Series 2937 Class KC, 4.5% 2/15/20 | | 19,686 | | 21,555 |
Series 2962 Class BE, 4.5% 4/15/20 | | 15,015 | | 16,558 |
Series 3110 Class OP, 9/15/35 (k) | | 10,265 | | 8,908 |
Series 3119 Class PO, 2/15/36 (k) | | 12,667 | | 10,757 |
Series 3121 Class KO, 3/15/36 (k) | | 3,705 | | 3,305 |
Series 3123 Class LO, 3/15/36 (k) | | 8,255 | | 6,906 |
Series 3145 Class GO, 4/15/36 (k) | | 7,365 | | 6,244 |
Series 3741 Class YU, 3.5% 11/15/22 | | 13,420 | | 14,122 |
sequential payer: | | | | |
Series 2281 Class ZB, 6% 3/15/30 | | 2,190 | | 2,431 |
Series 2546 Class MJ, 5.5% 3/15/23 | | 2,861 | | 3,232 |
Series 2570 Class CU, 4.5% 7/15/17 | | 313 | | 321 |
Series 2587 Class AD, 4.71% 3/15/33 | | 5,785 | | 6,259 |
Series 2601 Class TB, 5.5% 4/15/23 | | 869 | | 985 |
Series 2645, Class BY, 4.5% 7/15/18 | | 4,800 | | 5,306 |
Series 2729 Class GB, 5% 1/15/19 | | 6,151 | | 6,625 |
Series 2773 Class HC, 4.5% 4/15/19 | | 704 | | 778 |
Series 2860 Class CP, 4% 10/15/17 | | 27 | | 27 |
Series 2930 Class KT, 4.5% 2/15/20 | | 6,728 | | 7,430 |
Series 2987 Class HE, 4.5% 6/15/20 | | 11,260 | | 12,281 |
Series 2998 Class LY, 5.5% 7/15/25 | | 2,011 | | 2,296 |
Series 3007 Class EW, 5.5% 7/15/25 | | 8,875 | | 10,164 |
Series 3013 Class VJ, 5% 1/15/14 | | 901 | | 945 |
Series 3277 Class B, 4% 2/15/22 | | 5,900 | | 6,388 |
Series 3578, Class B, 4.5% 9/15/24 | | 7,927 | | 8,719 |
Series 2863 Class DB, 4% 9/15/14 | | 450 | | 454 |
Series 3772 Class BI, 4.5% 10/15/18 (j) | | 13,479 | | 1,259 |
target amortization class: | | | | |
Series 2156 Class TC, 6.25% 5/15/29 | | 4,822 | | 5,431 |
Series 2877 Class JC, 5% 10/15/34 | | 162 | | 164 |
Collateralized Mortgage Obligations - continued |
| Principal Amount (000s) | | Value (000s) |
U.S. Government Agency - continued |
Ginnie Mae guaranteed REMIC pass-thru certificates: | | | | |
planned amortization Series 2011-61 Class OP, 5/20/40 (k) | | $ 11,127 | | $ 9,266 |
planned amortization class Series 1997-8 Class PE, 7.5% 5/16/27 | | 2,406 | | 2,797 |
sequential payer Series 2011-69 Class GX, 4.5% 5/16/40 | | 10,205 | | 10,693 |
Series 2004-79 Class FA, 0.4863% 1/20/31 (i) | | 2,297 | | 2,298 |
Series 2010-42 Class OP, 4/20/40 (k) | | 25,191 | | 20,468 |
Series 2011-71: | | | | |
Class ZB, 5.5% 8/20/34 | | 20,095 | | 22,393 |
Class ZC, 5.5% 7/16/34 | | 22,910 | | 25,374 |
TOTAL COLLATERALIZED MORTGAGE OBLIGATIONS (Cost $503,097) | 531,636 |
Foreign Government and Government Agency Obligations - 1.5% |
|
Israeli State (guaranteed by U.S. Government through Agency for International Development): | | | | |
5.5% 9/18/23 | | 59,862 | | 71,293 |
6.8% 2/15/12 | | 8,268 | | 8,432 |
TOTAL FOREIGN GOVERNMENT AND GOVERNMENT AGENCY OBLIGATIONS (Cost $69,411) | 79,725 |
Cash Equivalents - 14.7% |
| Maturity Amount (000s) | | Value (000s) |
Investments in repurchase agreements in a joint trading account at: | | | |
0.17%, dated 7/29/11 due 8/1/11 (Collateralized by U.S. Government Obligations) # | $ 424,367 | | $ 424,361 |
0.2%, dated 7/29/11 due 8/1/11 (Collateralized by U.S. Government Obligations) # (a) | 346,586 | | 346,580 |
TOTAL CASH EQUIVALENTS (Cost $770,941) | 770,941 |
TOTAL INVESTMENT PORTFOLIO - 116.2% (Cost $5,927,653) | 6,071,162 |
NET OTHER ASSETS (LIABILITIES) - (16.2)% | (845,808) |
NET ASSETS - 100% | $ 5,225,354 |
Futures Contracts |
| Expiration Date | | Underlying Face Amount at Value
(000s) | | Unrealized Appreciation/
(Depreciation) (000s) |
Purchased |
Treasury Contracts |
897 CBOT 2 Year U.S. Treasury Notes Contracts | Sept. 2011 | | $ 197,270 | | $ 881 |
|
The face value of futures purchased as a percentage of net assets is 3.8% |
Swap Agreements |
| Expiration Date | | Notional Amount (000s) | | Value (000s) |
Interest Rate Swaps |
Receive quarterly a floating rate based on 3-month LIBOR and pay semi-annually a fixed rate equal to 3.23% with Credit Suisse First Boston | May 2020 | | $ 50,000 | | $ (2,363) |
Legend |
(a) Includes investment made with cash collateral received from securities on loan. |
(b) Security or a portion of the security is on loan at period end. |
(c) Security exempt from registration under Rule 144A of the Securities Act of 1933. These securities may be resold in transactions exempt from registration, normally to qualified institutional buyers. At the end of the period, the value of these securities amounted to $18,112,000 or 0.3% of net assets. |
(d) Under the Temporary Liquidity Guarantee Program, the Federal Deposit Insurance Corporation guarantees principal and interest in the event of payment default or bankruptcy until the earlier of maturity date of the debt or until June 30, 2012. At the end of the period these securities amounted to $315,861,000 or 6.0% of net assets. |
(e) Security or a portion of the security purchased on a delayed delivery or when-issued basis. |
(f) A portion of the security is subject to a forward commitment to sell. |
(g) Security or a portion of the security was pledged to cover margin requirements for futures contracts. At the period end, the value of securities pledged amounted to $600,000. |
(h) Security or a portion of the security has been segregated as collateral for open swap agreements. At the period end, the value of securities pledged amounted to $1,067,000. |
(i) Coupon rates for floating and adjustable rate securities reflect the rates in effect at period end. |
(j) Security represents right to receive monthly interest payments on an underlying pool of mortgages or assets. Principal shown is the outstanding par amount of the pool held as of the end of the period. |
(k) Principal Only Strips represent the right to receive the monthly principal payments on an underlying pool of mortgage loans. |
(l) Represents an investment in an underlying pool of reverse mortgages which typically do not require regular principal and interest payments as repayment is deferred until a maturity event. |
# Additional information on each counterparty to the repurchase agreement is as follows: |
Repurchase Agreement / Counterparty | Value
(Amounts in thousands) |
$424,361,000 due 8/01/11 at 0.17% |
Bank of America NA | $ 307,005 |
J.P. Morgan Securities, Inc. | 11,476 |
Mizuho Securities USA, Inc. | 105,880 |
| $ 424,361 |
$346,580,000 due 8/01/11 at 0.20% |
J.P. Morgan Securities, Inc. | $ 152,224 |
Merrill Lynch, Pierce, Fenner & Smith, Inc. | 194,356 |
| $ 346,580 |
Other Information |
The following is a summary of the inputs used, as of July 31, 2011, involving the Fund's assets and liabilities carried at fair value. The inputs or methodology used for valuing securities may not be an indication of the risk associated with investing in those securities. For more information on valuation inputs, and their aggregation into the levels used in the table below, please refer to the Security Valuation section in the accompanying Notes to Financial Statements. |
Valuation Inputs at Reporting Date: |
Description
(Amounts in thousands) | Total | Level 1 | Level 2 | Level 3 |
Investments in Securities: | | | | |
U.S. Government and Government Agency Obligations | $ 3,143,450 | $ - | $ 3,143,450 | $ - |
U.S. Government Agency - Mortgage Securities | 1,545,410 | - | 1,545,410 | - |
Collateralized Mortgage Obligations | 531,636 | - | 531,636 | - |
Foreign Government and Government Agency Obligations | 79,725 | - | 79,725 | - |
Cash Equivalents | 770,941 | - | 770,941 | - |
Total Investments in Securities: | $ 6,071,162 | $ - | $ 6,071,162 | $ - |
Derivative Instruments: | | | | |
Assets | | | | |
Futures Contracts | $ 881 | $ 881 | $ - | $ - |
Liabilities | | | | |
Swap Agreements | $ (2,363) | $ - | $ (2,363) | $ - |
Total Derivative Instruments: | $ (1,482) | $ 881 | $ (2,363) | $ - |
Other Financial Instruments: | | | | |
Forward Commitments | $ (432) | $ - | $ (432) | $ - |
Value of Derivative Instruments |
The following table is a summary of the Fund's value of derivative instruments by risk exposure as of July 31, 2011. For additional information on derivative instruments, please refer to the Derivative Instruments section in the accompanying Notes to Financial Statements. |
Risk Exposure /
Derivative Type | Value |
(Amounts in thousands) | Asset | Liability |
Interest Rate Risk | | |
Futures Contracts (a) | $ 881 | $ - |
Swap Agreements (b) | - | (2,363) |
Total Value of Derivatives | $ 881 | $ (2,363) |
(a) Reflects cumulative appreciation/(depreciation) on futures contracts as disclosed on the Schedule of Investments. Only the period end variation margin is separately disclosed on the Statement of Assets and Liabilities. |
(b) Value is disclosed on the Statement of Assets and Liabilities in the Swap agreements, at value line-items. |
See accompanying notes which are an integral part of the financial statements.
Annual Report
Statement of Assets and Liabilities
Amounts in thousands (except per-share amounts) | July 31, 2011 |
| | |
Assets | | |
Investment in securities, at value (including securities loaned of $340,428 and repurchase agreements of $770,941) - See accompanying schedule: Unaffiliated issuers (cost $5,927,653) | | $ 6,071,162 |
Commitment to sell securities on a delayed delivery basis | $ (214,277) | |
Receivable for securities sold on a delayed delivery basis | 213,845 | (432) |
Receivable for investments sold, regular delivery | | 570,621 |
Cash | | 41 |
Receivable for fund shares sold | | 5,414 |
Interest receivable | | 22,995 |
Receivable for daily variation margin on futures contracts | | 112 |
Other receivables | | 32 |
Total assets | | 6,669,945 |
| | |
Liabilities | | |
Payable for investments purchased
Regular delivery | $ 690,506 | |
Delayed delivery | 385,611 | |
Payable for fund shares redeemed | 16,853 | |
Distributions payable | 396 | |
Swap agreements, at value | 2,363 | |
Accrued management fee | 1,377 | |
Distribution and service plan fees payable | 219 | |
Other affiliated payables | 653 | |
Other payables and accrued expenses | 33 | |
Collateral on securities loaned, at value | 346,580 | |
Total liabilities | | 1,444,591 |
| | |
Net Assets | | $ 5,225,354 |
Net Assets consist of: | | |
Paid in capital | | $ 5,018,538 |
Undistributed net investment income | | 917 |
Accumulated undistributed net realized gain (loss) on investments | | 64,304 |
Net unrealized appreciation (depreciation) on investments | | 141,595 |
Net Assets | | $ 5,225,354 |
See accompanying notes which are an integral part of the financial statements.
Annual Report
Statement of Assets and Liabilities - continued
Amounts in thousands (except per-share amounts) | July 31, 2011 |
| | |
Calculation of Maximum Offering Price
Class A:
Net Asset Value and redemption price per share ($328,529 ÷ 30,716 shares) | | $ 10.70 |
| | |
Maximum offering price per share (100/96.00 of $10.70) | | $ 11.15 |
Class T:
Net Asset Value and redemption price per share ($271,707 ÷ 25,407 shares) | | $ 10.69 |
| | |
Maximum offering price per share (100/96.00 of $10.69) | | $ 11.14 |
Class B:
Net Asset Value and offering price per share ($24,905 ÷ 2,329 shares)A | | $ 10.69 |
| | |
Class C:
Net Asset Value and offering price per share ($88,590 ÷ 8,284 shares)A | | $ 10.69 |
| | |
Government Income:
Net Asset Value, offering price and redemption price per share ($4,167,179 ÷ 390,178 shares) | | $ 10.68 |
| | |
Institutional Class:
Net Asset Value, offering price and redemption price per share ($344,444 ÷ 32,207 shares) | | $ 10.69 |
A Redemption price per share is equal to net asset value less any applicable contingent deferred sales charge.
See accompanying notes which are an integral part of the financial statements.
Annual Report
Financial Statements - continued
Statement of Operations
Amounts in thousands | Year ended July 31, 2011 |
| | |
Investment Income | | |
Interest | | $ 147,814 |
| | |
Expenses | | |
Management fee | $ 17,609 | |
Transfer agent fees | 6,349 | |
Distribution and service plan fees | 3,032 | |
Fund wide operations fee | 1,905 | |
Independent trustees' compensation | 21 | |
Miscellaneous | 19 | |
Total expenses | | 28,935 |
Net investment income (loss) | | 118,879 |
Realized and Unrealized Gain (Loss) Net realized gain (loss) on: | | |
Investment securities: | | |
Unaffiliated issuers | 130,436 | |
Futures contracts | 619 | |
Swap agreements | (6,318) | |
Total net realized gain (loss) | | 124,737 |
Change in net unrealized appreciation (depreciation) on: Investment securities | (89,643) | |
Futures contracts | 881 | |
Swap agreements | 3,215 | |
Delayed delivery commitments | 3,445 | |
Total change in net unrealized appreciation (depreciation) | | (82,102) |
Net gain (loss) | | 42,635 |
Net increase (decrease) in net assets resulting from operations | | $ 161,514 |
See accompanying notes which are an integral part of the financial statements.
Annual Report
Statement of Changes in Net Assets
Amounts in thousands | Year ended
July 31, 2011 | Year ended
July 31, 2010 |
Increase (Decrease) in Net Assets | | |
Operations | | |
Net investment income (loss) | $ 118,879 | $ 145,918 |
Net realized gain (loss) | 124,737 | 139,116 |
Change in net unrealized appreciation (depreciation) | (82,102) | 85,404 |
Net increase (decrease) in net assets resulting
from operations | 161,514 | 370,438 |
Distributions to shareholders from net investment income | (114,897) | (140,387) |
Distributions to shareholders from net realized gain | (140,821) | (196,760) |
Total distributions | (255,718) | (337,147) |
Share transactions - net increase (decrease) | (695,616) | 203,871 |
Total increase (decrease) in net assets | (789,820) | 237,162 |
| | |
Net Assets | | |
Beginning of period | 6,015,174 | 5,778,012 |
End of period (including undistributed net investment income of $917 and undistributed net investment income of $2,694, respectively) | $ 5,225,354 | $ 6,015,174 |
See accompanying notes which are an integral part of the financial statements.
Annual Report
Financial Highlights - Class A
Years ended July 31, | 2011 | 2010 | 2009 | 2008 | 2007F |
Selected Per-Share Data | | | | | |
Net asset value, beginning of period | $ 10.84 | $ 10.77 | $ 10.40 | $ 10.01 | $ 9.98 |
Income from Investment Operations | | | | | |
Net investment income (loss)E | .199 | .242 | .356 | .402 | .311 |
Net realized and unrealized gain (loss) | .108 | .424 | .466 | .387 | .033 |
Total from investment operations | .307 | .666 | .822 | .789 | .344 |
Distributions from net investment income | (.191) | (.231) | (.352) | (.399) | (.314) |
Distributions from net realized gain | (.256) | (.365) | (.100) | - | - |
Total distributions | (.447) | (.596) | (.452) | (.399) | (.314) |
Net asset value, end of period | $ 10.70 | $ 10.84 | $ 10.77 | $ 10.40 | $ 10.01 |
Total ReturnB,C,D | 2.94% | 6.44% | 8.03% | 7.96% | 3.49% |
Ratios to Average Net AssetsG | | | | | |
Expenses before reductions | .77% | .77% | .77% | .81% | .78%A |
Expenses net of fee waivers, if any | .77% | .77% | .77% | .81% | .78%A |
Expenses net of all reductions | .77% | .77% | .77% | .80% | .77%A |
Net investment income (loss) | 1.88% | 2.28% | 3.33% | 3.88% | 4.08%A |
Supplemental Data | | | | | |
Net assets, end of period (in millions) | $ 329 | $ 431 | $ 437 | $ 232 | $ 145 |
Portfolio turnover rate | 430% | 355% | 380%H | 269% | 164%H |
A Annualized
B Total returns for periods of less than one year are not annualized.
C Total returns would have been lower if certain expenses had not been reduced during the applicable periods shown.
D Total returns do not include the effect of the sales charges.
E Calculated based on average shares outstanding during the period.
F For the period October 24, 2006 (commencement of sale of shares) to July 31, 2007.
G Expense ratios reflect operating expenses of the class. Expenses before reductions do not reflect amounts reimbursed by the investment adviser or reductions from brokerage service arrangements or reductions from other expense offset arrangements and do not represent the amount paid by the class during periods when reimbursements or reductions occur. Expense ratios before reductions for start-up periods may not be representative of longer-term operating periods. Expenses net of fee waivers reflect expenses after reimbursement by the investment adviser but prior to reductions from brokerage service arrangements or other expense offset arrangements. Expenses net of all reductions represent the net expenses paid by the class.
H The portfolio turnover rate does not include the assets acquired in the merger.
See accompanying notes which are an integral part of the financial statements.
Annual Report
Financial Highlights - Class T
Years ended July 31, | 2011 | 2010 | 2009 | 2008 | 2007F |
Selected Per-Share Data | | | | | |
Net asset value, beginning of period | $ 10.84 | $ 10.77 | $ 10.40 | $ 10.01 | $ 9.98 |
Income from Investment Operations | | | | | |
Net investment income (loss)E | .201 | .243 | .357 | .404 | .306 |
Net realized and unrealized gain (loss) | .098 | .425 | .466 | .387 | .036 |
Total from investment operations | .299 | .668 | .823 | .791 | .342 |
Distributions from net investment income | (.193) | (.233) | (.353) | (.401) | (.312) |
Distributions from net realized gain | (.256) | (.365) | (.100) | - | - |
Total distributions | (.449) | (.598) | (.453) | (.401) | (.312) |
Net asset value, end of period | $ 10.69 | $ 10.84 | $ 10.77 | $ 10.40 | $ 10.01 |
Total ReturnB,C,D | 2.86% | 6.45% | 8.04% | 7.98% | 3.46% |
Ratios to Average Net AssetsG | | | | | |
Expenses before reductions | .76% | .76% | .76% | .78% | .79%A |
Expenses net of fee waivers, if any | .76% | .76% | .76% | .78% | .79%A |
Expenses net of all reductions | .76% | .76% | .76% | .78% | .79%A |
Net investment income (loss) | 1.89% | 2.29% | 3.33% | 3.90% | 4.02%A |
Supplemental Data | | | | | |
Net assets, end of period (in millions) | $ 272 | $ 335 | $ 324 | $ 236 | $ 181 |
Portfolio turnover rate | 430% | 355% | 380%H | 269% | 164%H |
A Annualized
B Total returns for periods of less than one year are not annualized.
C Total returns would have been lower if certain expenses had not been reduced during the applicable periods shown.
D Total returns do not include the effect of the sales charges.
E Calculated based on average shares outstanding during the period.
F For the period October 24, 2006 (commencement of sale of shares) to July 31, 2007.
G Expense ratios reflect operating expenses of the class. Expenses before reductions do not reflect amounts reimbursed by the investment adviser or reductions from brokerage service arrangements or reductions from other expense offset arrangements and do not represent the amount paid by the class during periods when reimbursements or reductions occur. Expense ratios before reductions for start-up periods may not be representative of longer-term operating periods. Expenses net of fee waivers reflect expenses after reimbursement by the investment adviser but prior to reductions from brokerage service arrangements or other expense offset arrangements. Expenses net of all reductions represent the net expenses paid by the class.
H The portfolio turnover rate does not include the assets acquired in the merger.
See accompanying notes which are an integral part of the financial statements.
Annual Report
Financial Highlights - Class B
Years ended July 31, | 2011 | 2010 | 2009 | 2008 | 2007F |
Selected Per-Share Data | | | | | |
Net asset value, beginning of period | $ 10.84 | $ 10.77 | $ 10.40 | $ 10.01 | $ 9.98 |
Income from Investment Operations | | | | | |
Net investment income (loss)E | .122 | .164 | .278 | .329 | .251 |
Net realized and unrealized gain (loss) | .098 | .425 | .467 | .387 | .037 |
Total from investment operations | .220 | .589 | .745 | .716 | .288 |
Distributions from net investment income | (.114) | (.154) | (.275) | (.326) | (.258) |
Distributions from net realized gain | (.256) | (.365) | (.100) | - | - |
Total distributions | (.370) | (.519) | (.375) | (.326) | (.258) |
Net asset value, end of period | $ 10.69 | $ 10.84 | $ 10.77 | $ 10.40 | $ 10.01 |
Total ReturnB,C,D | 2.10% | 5.67% | 7.25% | 7.21% | 2.91% |
Ratios to Average Net AssetsG | | | | | |
Expenses before reductions | 1.50% | 1.50% | 1.50% | 1.51% | 1.50%A |
Expenses net of fee waivers, if any | 1.50% | 1.50% | 1.50% | 1.51% | 1.50%A |
Expenses net of all reductions | 1.50% | 1.50% | 1.50% | 1.50% | 1.50%A |
Net investment income (loss) | 1.15% | 1.55% | 2.60% | 3.17% | 3.30%A |
Supplemental Data | | | | | |
Net assets, end of period (in millions) | $ 25 | $ 38 | $ 48 | $ 41 | $ 43 |
Portfolio turnover rate | 430% | 355% | 380%H | 269% | 164%H |
A Annualized
B Total returns for periods of less than one year are not annualized.
C Total returns would have been lower if certain expenses had not been reduced during the applicable periods shown.
D Total returns do not include the effect of the contingent deferred sales charge.
E Calculated based on average shares outstanding during the period.
F For the period October 24, 2006 (commencement of sale of shares) to July 31, 2007.
G Expense ratios reflect operating expenses of the class. Expenses before reductions do not reflect amounts reimbursed by the investment adviser or reductions from brokerage service arrangements or reductions from other expense offset arrangements and do not represent the amount paid by the class during periods when reimbursements or reductions occur. Expense ratios before reductions for start-up periods may not be representative of longer-term operating periods. Expenses net of fee waivers reflect expenses after reimbursement by the investment adviser but prior to reductions from brokerage service arrangements or other expense offset arrangements. Expenses net of all reductions represent the net expenses paid by the class.
H The portfolio turnover rate does not include the assets acquired in the merger.
See accompanying notes which are an integral part of the financial statements.
Annual Report
Financial Highlights - Class C
Years ended July 31, | 2011 | 2010 | 2009 | 2008 | 2007F |
Selected Per-Share Data | | | | | |
Net asset value, beginning of period | $ 10.84 | $ 10.77 | $ 10.40 | $ 10.01 | $ 9.98 |
Income from Investment Operations | | | | | |
Net investment income (loss)E | .121 | .163 | .275 | .326 | .249 |
Net realized and unrealized gain (loss) | .098 | .425 | .468 | .387 | .033 |
Total from investment operations | .219 | .588 | .743 | .713 | .282 |
Distributions from net investment income | (.113) | (.153) | (.273) | (.323) | (.252) |
Distributions from net realized gain | (.256) | (.365) | (.100) | - | - |
Total distributions | (.369) | (.518) | (.373) | (.323) | (.252) |
Net asset value, end of period | $ 10.69 | $ 10.84 | $ 10.77 | $ 10.40 | $ 10.01 |
Total ReturnB,C,D | 2.09% | 5.66% | 7.23% | 7.18% | 2.85% |
Ratios to Average Net AssetsG | | | | | |
Expenses before reductions | 1.51% | 1.51% | 1.52% | 1.53% | 1.55%A |
Expenses net of fee waivers, if any | 1.51% | 1.51% | 1.52% | 1.53% | 1.55%A |
Expenses net of all reductions | 1.51% | 1.51% | 1.51% | 1.53% | 1.55%A |
Net investment income (loss) | 1.14% | 1.54% | 2.58% | 3.15% | 3.26%A |
Supplemental Data | | | | | |
Net assets, end of period (in millions) | $ 89 | $ 118 | $ 131 | $ 71 | $ 39 |
Portfolio turnover rate | 430% | 355% | 380%H | 269% | 164%H |
A Annualized
B Total returns for periods of less than one year are not annualized.
C Total returns would have been lower if certain expenses had not been reduced during the applicable periods shown.
D Total returns do not include the effect of the contingent deferred sales charge.
E Calculated based on average shares outstanding during the period.
F For the period October 24, 2006 (commencement of sale of shares) to July 31, 2007.
G Expense ratios reflect operating expenses of the class. Expenses before reductions do not reflect amounts reimbursed by the investment adviser or reductions from brokerage service arrangements or reductions from other expense offset arrangements and do not represent the amount paid by the class during periods when reimbursements or reductions occur. Expense ratios before reductions for start-up periods may not be representative of longer-term operating periods. Expenses net of fee waivers reflect expenses after reimbursement by the investment adviser but prior to reductions from brokerage service arrangements or other expense offset arrangements. Expenses net of all reductions represent the net expenses paid by the class.
H The portfolio turnover rate does not include the assets acquired in the merger.
See accompanying notes which are an integral part of the financial statements.
Annual Report
Financial Highlights - Government Income
Years ended July 31, | 2011 | 2010 | 2009 | 2008 | 2007 |
Selected Per-Share Data | | | | | |
Net asset value, beginning of period | $ 10.82 | $ 10.76 | $ 10.38 | $ 10.00 | $ 9.95 |
Income from Investment Operations | | | | | |
Net investment income (loss)B | .233 | .275 | .390 | .438 | .443 |
Net realized and unrealized gain (loss) | .108 | .415 | .476 | .378 | .068 |
Total from investment operations | .341 | .690 | .866 | .816 | .511 |
Distributions from net investment income | (.225) | (.265) | (.386) | (.436) | (.456) |
Distributions from net realized gain | (.256) | (.365) | (.100) | - | (.005) |
Total distributions | (.481) | (.630) | (.486) | (.436) | (.461) |
Net asset value, end of period | $ 10.68 | $ 10.82 | $ 10.76 | $ 10.38 | $ 10.00 |
Total ReturnA | 3.27% | 6.69% | 8.49% | 8.25% | 5.22% |
Ratios to Average Net AssetsC | | | | | |
Expenses before reductions | .45% | .45% | .45% | .45% | .45% |
Expenses net of fee waivers, if any | .45% | .45% | .45% | .45% | .45% |
Expenses net of all reductions | .45% | .45% | .45% | .45% | .44% |
Net investment income (loss) | 2.20% | 2.60% | 3.65% | 4.23% | 4.42% |
Supplemental Data | | | | | |
Net assets, end of period (in millions) | $ 4,167 | $ 4,809 | $ 4,638 | $ 8,154 | $ 6,118 |
Portfolio turnover rate | 430% | 355% | 380%D | 269% | 164%D |
A Total returns would have been lower if certain expenses had not been reduced during the applicable periods shown.
B Calculated based on average shares outstanding during the period.
C Expense ratios reflect operating expenses of the class. Expenses before reductions do not reflect amounts reimbursed by the investment adviser or reductions from brokerage service arrangements or reductions from other expense offset arrangements and do not represent the amount paid by the class during periods when reimbursements or reductions occur. Expenses net of fee waivers reflect expenses after reimbursement by the investment adviser but prior to reductions from brokerage service arrangements or other expense offset arrangements. Expenses net of all reductions represent the net expenses paid by the class.
D The portfolio turnover rate does not include the assets acquired in the merger.
See accompanying notes which are an integral part of the financial statements.
Annual Report
Financial Highlights - Institutional Class
Years ended July 31, | 2011 | 2010 | 2009 | 2008 | 2007E |
Selected Per-Share Data | | | | | |
Net asset value, beginning of period | $ 10.84 | $ 10.77 | $ 10.40 | $ 10.01 | $ 9.98 |
Income from Investment Operations | | | | | |
Net investment income (loss)D | .225 | .267 | .385 | .432 | .329 |
Net realized and unrealized gain (loss) | .099 | .425 | .466 | .388 | .034 |
Total from investment operations | .324 | .692 | .851 | .820 | .363 |
Distributions from net investment income | (.218) | (.257) | (.381) | (.430) | (.333) |
Distributions from net realized gain | (.256) | (.365) | (.100) | - | - |
Total distributions | (.474) | (.622) | (.481) | (.430) | (.333) |
Net asset value, end of period | $ 10.69 | $ 10.84 | $ 10.77 | $ 10.40 | $ 10.01 |
Total ReturnB,C | 3.10% | 6.70% | 8.32% | 8.28% | 3.67% |
Ratios to Average Net AssetsF | | | | | |
Expenses before reductions | .52% | .53% | .51% | .51% | .53%A |
Expenses net of fee waivers, if any | .52% | .53% | .51% | .51% | .53%A |
Expenses net of all reductions | .52% | .53% | .51% | .51% | .53%A |
Net investment income (loss) | 2.13% | 2.52% | 3.59% | 4.17% | 4.32%A |
Supplemental Data | | | | | |
Net assets, end of period (in millions) | $ 344 | $ 284 | $ 200 | $ 750 | $ 715 |
Portfolio turnover rate | 430% | 355% | 380%G | 269% | 164%G |
A Annualized
B Total returns for periods of less than one year are not annualized.
C Total returns would have been lower if certain expenses had not been reduced during the applicable periods shown.
D Calculated based on average shares outstanding during the period.
E For the period October 24, 2006 (commencement of sale of shares) to July 31, 2007.
F Expense ratios reflect operating expenses of the class. Expenses before reductions do not reflect amounts reimbursed by the investment adviser or reductions from brokerage service arrangements or reductions from other expense offset arrangements and do not represent the amount paid by the class during periods when reimbursements or reductions occur. Expense ratios before reductions for start-up periods may not be representative of longer-term operating periods. Expenses net of fee waivers reflect expenses after reimbursement by the investment adviser but prior to reductions from brokerage service arrangements or other expense offset arrangements. Expenses net of all reductions represent the net expenses paid by the class.
G The portfolio turnover rate does not include the assets acquired in the merger.
See accompanying notes which are an integral part of the financial statements.
Annual Report
Notes to Financial Statements
For the period ended July 31, 2011
(Amounts in thousands except ratios)
1. Organization.
Fidelity Government Income Fund (the Fund) is a fund of Fidelity Income Fund (the Trust) and is authorized to issue an unlimited number of shares. The Trust is registered under the Investment Company Act of 1940, as amended (the 1940 Act), as an open-end management investment company organized as a Massachusetts business trust. The Fund offers Class A, Class T, Class C, Government Income and Institutional Class shares, each of which, along with Class B shares, has equal rights as to assets and voting privileges. Effective after the close of business on September 1, 2010, Class B shares were closed to new accounts and additional purchases, except for exchanges and reinvestments by existing shareholders. Each class has exclusive voting rights with respect to matters that affect that class. Class B shares will automatically convert to Class A shares after a holding period of seven years from the initial date of purchase. Investment income, realized and unrealized capital gains and losses, the common expenses of the Fund, and certain fund-level expense reductions, if any, are allocated on a pro-rata basis to each class based on the relative net assets of each class to the total net assets of the Fund. Each class differs with respect to transfer agent and distribution and service plan fees incurred. Certain expense reductions may also differ by class.
In May 2011, the Board of Trustees approved a change in the fiscal year end of the Fund from July 31 to August 31, effective August 31, 2011.
2. Significant Accounting Policies.
The financial statements have been prepared in conformity with accounting principles generally accepted in the United States of America (GAAP), which require management to make certain estimates and assumptions at the date of the financial statements. Actual results could differ from those estimates. Subsequent events, if any, through the date that the financial statements were issued have been evaluated in the preparation of the financial statements. The following summarizes the significant accounting policies of the Fund:
Security Valuation. Investments are valued as of 4:00 p.m. Eastern time on the last calendar day of the period. The Fund uses independent pricing services approved by the Board of Trustees to value its investments. When current market prices or quotations are not readily available or reliable, valuations may be determined in good faith in accordance with procedures adopted by the Board of Trustees. Factors used in determining value may include market or security specific events, changes in interest rates and credit quality. The frequency with which these procedures are used cannot be predicted and they may be utilized to a significant extent. The value used for net asset value (NAV) calculation under these procedures may differ from published prices for the same securities.
Annual Report
Notes to Financial Statements - continued
(Amounts in thousands except ratios)
2. Significant Accounting Policies - continued
Security Valuation - continued
The Fund categorizes the inputs to valuation techniques used to value its investments into a disclosure hierarchy consisting of three levels as shown below:
Level 1 - quoted prices in active markets for identical investments
Level 2 - other significant observable inputs (including quoted prices for similar investments, interest rates, prepayment speeds, etc.)
Level 3 - unobservable inputs (including the Fund's own assumptions based on the best information available)
Changes in valuation techniques may result in transfers in or out of an assigned level within the disclosure hierarchy. The aggregate value of investments by input level, as of July 31, 2011 for the Fund's investments, is included at the end of the Fund's Schedule of Investments. Valuation techniques used to value the Fund's investments by major category are as follows:
Debt securities, including restricted securities, are valued based on evaluated prices received from independent pricing services or from dealers who make markets in such securities. For foreign government and government agency obligations and U.S. government and government agency obligations, pricing services utilize matrix pricing which considers yield or price of bonds of comparable quality, coupon, maturity and type as well as dealer supplied prices and are generally categorized as Level 2 in the hierarchy. For collateralized mortgage obligations and U.S. government agency mortgage securities, pricing services utilize matrix pricing which considers prepayment speed assumptions, attributes of the collateral, yield or price of bonds of comparable quality, coupon, maturity and type as well as dealer supplied prices and, accordingly, such securities are generally categorized as Level 2 in the hierarchy. Swaps are marked-to-market daily based on valuations from independent pricing services or dealer-supplied valuations and changes in value are recorded as unrealized appreciation (depreciation). Pricing services utilize matrix pricing which considers comparisons to interest rate curves, credit spread curves, default possibilities and recovery rates and, as a result, swaps are generally categorized as Level 2 in the hierarchy. When independent prices are unavailable or unreliable, debt securities and swaps may be valued utilizing pricing matrices which consider similar factors that would be used by independent pricing services. These are generally categorized as Level 2 in the hierarchy but may be Level 3 depending on the circumstances.
Futures contracts are valued at the settlement price established each day by the board of trade or exchange on which they are traded and are categorized as Level 1 in the hierarchy. Short-term securities with remaining maturities of sixty days or less may be valued at amortized cost, which approximates fair value, and are categorized as Level 2 in the hierarchy.
Annual Report
2. Significant Accounting Policies - continued
Investment Transactions and Income. For financial reporting purposes, the Fund's investment holdings and NAV include trades executed through the end of the last business day of the period. The NAV per share for processing shareholder transactions is calculated as of the close of business of the New York Stock Exchange (NYSE), normally 4:00 p.m. Eastern time and includes trades executed through the end of the prior business day. Gains and losses on securities sold are determined on the basis of identified cost. Interest income is accrued as earned. Interest income includes coupon interest and amortization of premium and accretion of discount on debt securities. The principal value on inflation-indexed securities is periodically adjusted to the rate of inflation and interest is accrued based on the principal value. The adjustments to principal due to inflation are reflected as increases or decreases to interest income even though principal is not received until maturity.
Expenses. Expenses directly attributable to a fund are charged to that fund. Expenses attributable to more than one fund are allocated among the respective funds on the basis of relative net assets or other appropriate methods. Expense estimates are accrued in the period to which they relate and adjustments are made when actual amounts are known.
Deferred Trustee Compensation. Under a Deferred Compensation Plan (the Plan), independent Trustees may elect to defer receipt of a portion of their annual compensation. Deferred amounts are invested in a cross-section of Fidelity funds, are marked-to-market and remain in the Fund until distributed in accordance with the Plan. The investment of deferred amounts and the offsetting payable to the Trustees are included in the accompanying Statement of Assets and Liabilities.
Income Tax Information and Distributions to Shareholders. Each year, the Fund intends to qualify as a regulated investment company, including distributing substantially all of its taxable income and realized gains under Subchapter M of the Internal Revenue Code and filing its U.S. federal tax return. As a result, no provision for income taxes is required. As of July 31, 2011, the Fund did not have any unrecognized tax benefits in the financial statements. A fund's federal tax return is subject to examination by the Internal Revenue Service (IRS) for a period of three years.
Dividends are declared and recorded daily and paid monthly from net investment income. Distributions from realized gains, if any, are declared and recorded on the ex-dividend date. Income dividends and capital gain distributions are declared separately for each class. Income and capital gain distributions are determined in accordance with income tax regulations, which may differ from GAAP. In addition, the Fund claimed a portion of the payment made to redeeming shareholders as a distribution for income tax purposes.
Annual Report
Notes to Financial Statements - continued
(Amounts in thousands except ratios)
2. Significant Accounting Policies - continued
Income Tax Information and Distributions to Shareholders - continued
Capital accounts within the financial statements are adjusted for permanent book-tax differences. These adjustments have no impact on net assets or the results of operations. Temporary book-tax differences will reverse in a subsequent period.
Book-tax differences are primarily due to futures transactions, swap agreements, market discount, deferred trustees compensation, certain losses related to deflation adjustments on U.S. Treasury inflation-indexed securities and losses deferred due to wash sales.
The federal tax cost of investment securities and unrealized appreciation (depreciation) as of period end were as follows:
Gross unrealized appreciation | $ 150,573 |
Gross unrealized depreciation | (2,894) |
Net unrealized appreciation (depreciation) on securities and other investments | $ 147,679 |
| |
Tax Cost | $ 5,923,483 |
The tax-based components of distributable earnings as of period end were as follows:
Undistributed ordinary income | $ 2,574 |
Undistributed long-term capital gain | $ 58,691 |
Net unrealized appreciation (depreciation) | $ 145,317 |
Under the recently enacted Regulated Investment Company Modernization Act of 2010 (the Act), the Fund will be permitted to carry forward capital losses incurred in taxable years beginning after December 22, 2010 for an unlimited period. However, any losses incurred during those future taxable years will be required to be utilized prior to any losses incurred in pre-enactment taxable years, which generally expire after eight years from when they are incurred. Additionally, post-enactment capital losses that are carried forward will retain their character as either short-term or long-term capital losses rather than being considered all short-term as under previous law. The Fund's first fiscal year end subject to the Act will be August 31, 2011.
The tax character of distributions paid was as follows:
| July 31, 2011 | July 31, 2010 |
Ordinary Income | $ 199,845 | $ 175,643 |
Long-term Capital Gains | 55,873 | 161,504 |
Total | $ 255,718 | $ 337,147 |
Annual Report
2. Significant Accounting Policies - continued
New Accounting Pronouncements. In May 2011, the Financial Accounting Standards Board (FASB) issued an update to Topic 860 - Transfers and Servicing. The update clarifies the assessment of effective control by removing the collateral provision requirement that the seller maintains at all times collateral sufficient to fund substantially all of the cost of purchasing replacement financial assets from others. This may result in a change in accounting treatment from purchases and sales to secured borrowings for certain mortgage dollar roll transactions, and therefore separate accounting of the income and expenses associated with the secured borrowings. This change would have no effect on the net assets or total return of the Fund. The update is effective for transactions entered into on or after December 15, 2011. Management is currently evaluating the potential impact of the update on the accounting for mortgage dollar roll transactions entered into by the Fund. Also in May 2011, the FASB issued Accounting Standard Update No. 2011-04, Fair Value Measurement (Topic 820) - Amendments to Achieve Common Fair Value Measurement and Disclosure Requirements in U.S. GAAP and IFRSs. The update changes the wording used to describe the requirements in GAAP for measuring fair value and for disclosing information about fair value measurements. The update is effective during interim and annual periods beginning after December 15, 2011. Management is currently evaluating the impact of the update's adoption on the Fund's financial statement disclosures.
3. Operating Policies.
Repurchase Agreements. Fidelity Management & Research Company (FMR) has received an Exemptive Order from the Securities and Exchange Commission (the SEC) which permits the Fund and other affiliated entities of FMR to transfer uninvested cash balances into joint trading accounts which are then invested in repurchase agreements. The Fund may also invest directly with institutions in repurchase agreements. Repurchase agreements are collateralized by government or non-government securities. Upon settlement date, collateral is held in segregated accounts with custodian banks and may be obtained in the event of a default of the counterparty. The Fund monitors, on a daily basis, the value of the collateral to ensure it is at least equal to the principal amount of the repurchase agreement (including accrued interest). In the event of a default by the counterparty, realization of the collateral proceeds could be delayed, during which time the value of the collateral may decline.
Delayed Delivery Transactions and When-Issued Securities. The Fund may purchase or sell securities on a delayed delivery or when-issued basis. Payment and delivery may take place after the customary settlement period for that security. The price of the underlying securities and the date when the securities will be delivered and paid for are fixed at the time the transaction is negotiated. During the time a delayed delivery sell is outstanding, the contract is marked-to-market daily and equivalent deliverable
Annual Report
Notes to Financial Statements - continued
(Amounts in thousands except ratios)
3. Operating Policies - continued
Delayed Delivery Transactions and When-Issued Securities - continued
securities are held for the transaction. The securities purchased on a delayed delivery or when-issued basis are identified as such in the Fund's Schedule of Investments. The Fund may receive compensation for interest forgone in the purchase of a delayed delivery or when-issued security. With respect to purchase commitments, the Fund identifies securities as segregated in its records with a value at least equal to the amount of the commitment. Losses may arise due to changes in the value of the underlying securities or if the counterparty does not perform under the contract's terms, or if the issuer does not issue the securities due to political, economic, or other factors.
Restricted Securities. The Fund may invest in securities that are subject to legal or contractual restrictions on resale. These securities generally may be resold in transactions exempt from registration or to the public if the securities are registered. Disposal of these securities may involve time-consuming negotiations and expense, and prompt sale at an acceptable price may be difficult. Information regarding restricted securities is included at the end of the Fund's Schedule of Investments.
4. Derivative Instruments.
Risk Exposures and the Use of Derivative Instruments. The Fund used derivative instruments (derivatives), including futures contracts and swap agreements in order to meet its investment objectives. The strategy is to use derivatives to increase returns, to gain exposure to certain types of assets and to manage exposure to certain risks as defined below. The success of any strategy involving derivatives depends on analysis of numerous economic factors, and if the strategies for investment do not work as intended, the Fund may not achieve its objectives.
The Fund's use of derivatives increased or decreased its exposure to the following risk:
Interest Rate Risk | Interest rate risk relates to the fluctuations in the value of interest-bearing securities due to changes in the prevailing levels of market interest rates. |
The Fund is also exposed to additional risks from investing in derivatives, such as liquidity risk and counterparty credit risk. Liquidity risk is the risk that the Fund will be unable to sell the derivative in the open market in a timely manner. Counterparty credit risk is the risk that the counterparty will not be able to fulfill its obligation to the Fund. Derivative counterparty credit risk is managed through formal evaluation of the creditworthiness of all potential counterparties. On certain over-the-counter derivatives, the Fund attempts to reduce its exposure to counterparty credit risk by entering into an International Swaps and Derivatives Association (ISDA) Master Agreement on a bilateral basis with each of its counterparties. The ISDA Master Agreement gives the Fund the
Annual Report
4. Derivative Instruments - continued
Risk Exposures and the Use of Derivative Instruments - continued
right to terminate all transactions traded under such agreement if there is a certain deterioration in the credit quality of the counterparty. The ISDA Master Agreement gives each party the right, upon an event of default by the other party or a termination of the agreement, to close out all transactions traded under such agreement and to net amounts owed under each transaction to one net payable by one party to the other. To mitigate counterparty credit risk, the Fund offsets certain payables and/or receivables with collateral. Collateral in the form of cash or securities, if required, is held in segregated accounts with the Fund's custodian bank in accordance with the collateral agreements entered into between the Fund, the swap counterparty and the Fund's custodian bank, and is identified in the Schedule of Investments. The Fund could experience delays and costs in gaining access to the collateral even though it is held by the Fund's custodian bank. The Fund's maximum risk of loss from counterparty credit risk is generally the aggregate unrealized appreciation and unpaid counterparty payments in excess of any collateral pledged by the counterparty to the Fund. Counterparty risk related to exchange-traded futures contracts is minimal because of the protection provided by the exchange on which they trade. Derivatives involve, to varying degrees, risk of loss in excess of the amounts recognized in the Statement of Assets and Liabilities.
Net Realized Gain (Loss) and Change in Net Unrealized Appreciation (Depreciation) on Derivatives. The table below, which reflects the impacts of derivatives on the financial performance of the Fund, summarizes the net realized gain (loss) and change in net unrealized appreciation (depreciation) for derivatives during the period.
Risk Exposure / Derivative Type | Net Realized Gain (Loss) | Change in Net Unrealized Appreciation (Depreciation) |
Interest Rate Risk | | |
Futures Contracts | $ 619 | $ 881 |
Swap Agreements | (6,318) | 3,215 |
Totals (a)(b)(c) | $ (5,699) | $ 4,096 |
(a) A summary of the value of derivatives by risk exposure as of period end is included at the end of the Schedule of Investments and is representative of activity for the period.
(b) Total derivatives net realized gain (loss) included in the Statement of Operations is comprised of $619 for futures contracts and $(6,318) for swap agreements.
(c) Total derivatives change in net unrealized appreciation (depreciation) included in the Statement of Operations is comprised of $881 for futures contracts and $3,215 for swap agreements.
Futures Contracts. A futures contract is an agreement between two parties to buy or sell a specified underlying instrument for a fixed price at a specified future date. The Fund used futures contracts to manage its exposure to the bond market and to fluctuations in interest rates.
Annual Report
Notes to Financial Statements - continued
(Amounts in thousands except ratios)
4. Derivative Instruments - continued
Futures Contracts - continued
Upon entering into a futures contract, a fund is required to deposit either cash or securities (initial margin) with a clearing broker in an amount equal to a certain percentage of the face value of the contract. Futures contracts are marked-to-market daily and subsequent payments (variation margin) are made or received by a fund depending on the daily fluctuations in the value of the futures contracts and are recorded as unrealized appreciation or (depreciation). This receivable and/or payable is included in daily variation margin on futures contracts in the Statement of Assets and Liabilities. Realized gain or (loss) is recorded upon the expiration or closing of a futures contract. The net realized gain (loss) and change in net unrealized appreciation (depreciation) on futures contracts during the period is included in the Statement of Operations.
The underlying face amount at value of open futures contracts at period end is shown in the Schedule of Investments under the caption "Futures Contracts." This amount reflects each contract's exposure to the underlying instrument at period end and is representative of activity for the period. Securities deposited to meet initial margin requirements are identified in the Schedule of Investments.
Certain risks arise upon entering into futures contracts, including the risk that an illiquid market limits the ability to close out a futures contract prior to settlement date.
Swap Agreements. A swap agreement (swap) is a contract between two parties to exchange future cash flows at periodic intervals based on a notional principal amount.
Details of swaps open at period end are included in the Schedule of Investments under the caption "Swap Agreements." Swaps are marked-to-market daily and changes in value are recorded as unrealized appreciation or (depreciation) and reflected in the Statement of Assets and Liabilities. Any upfront premiums paid or received upon entering a swap to compensate for differences between stated terms of the agreement and prevailing market conditions (e.g. credit spreads, interest rates or other factors) are recorded as realized gain or (loss) ratably over the term of the swap. Payments are exchanged at specified intervals, accrued daily commencing with the effective date of the contract and recorded as realized gain or (loss). Realized gain or (loss) is also recorded in the event of an early termination of a swap. The net realized gain (loss) and change in net unrealized appreciation (depreciation) on swaps during the period is included in the Statement of Operations.
Risks of loss include interest rate risk. In addition, there is the risk of failure by the counterparty to perform under the terms of the agreement and lack of liquidity in the market.
Annual Report
4. Derivative Instruments - continued
Interest Rate Swaps. Interest rate swaps are agreements between counterparties to exchange cash flows, one based on a fixed rate, and the other on a floating rate. The Fund entered into interest rate swaps to manage its exposure to interest rate changes. Changes in interest rates can have an effect on both the value of bond holdings as well as the amount of interest income earned. In general, the value of bonds can fall when interest rates rise and can rise when interest rates fall.
5. Purchases and Sales of Investments.
Purchases and sales of securities, other than short-term securities and U.S. government securities, aggregated $5,151 and $19,358, respectively.
6. Fees and Other Transactions with Affiliates.
Management Fee. FMR and its affiliates provide the Fund with investment management related services for which the Fund pays a monthly management fee. The management fee is the sum of an individual fund fee rate that is based on an annual rate of .20% of the Fund's average net assets and a group fee rate that averaged .12% during the period. The group fee rate is based upon the average net assets of all the mutual funds advised by FMR. The group fee rate decreases as assets under management increase and increases as assets under management decrease. For the period, the total annual management fee rate was .32% of the Fund's average net assets.
Distribution and Service Plan Fees. In accordance with Rule 12b-1 of the 1940 Act, the Fund has adopted separate Distribution and Service Plans for each class of shares. Certain classes pay Fidelity Distributors Corporation (FDC), an affiliate of FMR, separate Distribution and Service Fees, each of which is based on an annual percentage of each class' average net assets. In addition, FDC may pay financial intermediaries for selling shares of the Fund and providing shareholder support services. For the period, the Distribution and Service Fee rates, total fees and amounts retained by FDC were as follows:
| Distribution
Fee | Service
Fee | Total Fees | Retained
by FDC |
Class A | -% | .25% | $ 962 | $ 24 |
Class T | -% | .25% | 758 | 2 |
Class B | .65% | .25% | 278 | 201 |
Class C | .75% | .25% | 1,034 | 184 |
| | | $ 3,032 | $ 411 |
Annual Report
Notes to Financial Statements - continued
(Amounts in thousands except ratios)
6. Fees and Other Transactions with Affiliates - continued
Sales Load. FDC may receive a front-end sales charge of up to 4.00% for selling Class A shares and Class T shares, some of which is paid to financial intermediaries for selling shares of the Fund. Depending on the holding period, FDC may receive contingent deferred sales charges levied on Class A, Class T, Class B, and Class C redemptions. The deferred sales charges range from 5% to 1% for Class B, 1% for Class C, .75% for certain purchases of Class A shares and .25% for certain purchases of Class T shares.
For the period, sales charge amounts retained by FDC were as follows:
| Retained
by FDC |
Class A | $ 34 |
Class T | 12 |
Class B* | 103 |
Class C* | 25 |
| $ 174 |
* When Class B and Class C shares are initially sold, FDC pays commissions from its own resources to financial intermediaries through which the sales are made.
Transfer Agent Fees. Fidelity Investments Institutional Operations Company, Inc. (FIIOC), an affiliate of FMR, is the transfer, dividend disbursing and shareholder servicing agent for each class of the Fund. FIIOC receives account fees and asset-based fees that vary according to the account size and type of account of the shareholders of the respective classes of the Fund. FIIOC pays for typesetting, printing and mailing of shareholder reports, except proxy statements. For the period, transfer agent fees for each class were as follows:
| Amount | % of
Average
Net Assets |
Class A | $ 662 | .17 |
Class T | 470 | .15 |
Class B | 76 | .25 |
Class C | 165 | .16 |
Government Income | 4,453 | .10 |
Institutional Class | 523 | .17 |
| $ 6,349 | |
Fund Wide Operations Fee. Pursuant to the Fund Wide Operations and Expense Agreement (FWOE), FMR has agreed to provide for fund level expenses (which do not include transfer agent, Rule 12b-1 fees, compensation of the independent Trustees, interest (including commitment fees), taxes or extraordinary expenses, if any) in return for a FWOE fee equal to .35% less the total amount of the management fee. The FWOE
Annual Report
6. Fees and Other Transactions with Affiliates - continued
Fund Wide Operations Fee - continued
paid by the Fund is reduced by an amount equal to the fees and expenses paid to the independent Trustees. For the period, the FWOE fee was equivalent to an annual rate of .03% of average net assets.
7. Committed Line of Credit.
The Fund participates with other funds managed by FMR or an affiliate in a $4.0 billion credit facility (the "line of credit") to be utilized for temporary or emergency purposes to fund shareholder redemptions or for other short-term liquidity purposes. The Fund has agreed to pay commitment fees on its pro-rata portion of the line of credit, which amounted to $19 and is reflected in Miscellaneous expenses on the Statement of Operations. During the period, there were no borrowings on this line of credit.
8. Security Lending.
The Fund lends portfolio securities from time to time in order to earn additional income. On the settlement date of the loan, the Fund receives collateral (in the form of U.S. Treasury obligations, letters of credit and/or cash) against the loaned securities and maintains collateral in an amount not less than 100% of the market value of the loaned securities during the period of the loan. The market value of the loaned securities is determined at the close of business of the Fund and any additional required collateral is delivered to the Fund on the next business day. If the borrower defaults on its obligation to return the securities loaned because of insolvency or other reasons, a fund could experience delays and costs in recovering the securities loaned or in gaining access to the collateral. Any cash collateral received is maintained at the Fund's custodian and/or invested in cash equivalents. The value of loaned securities and cash collateral at period end are disclosed on the Fund's Statement of Assets and Liabilities. Security lending income represents the income earned on investing cash collateral, less rebates paid to borrowers, plus any premium payments received for lending certain types of securities. Security lending income is presented in the Statement of Operations as a component of interest income. Total security lending income during the period amounted to $164.
Annual Report
Notes to Financial Statements - continued
(Amounts in thousands except ratios)
9. Distributions to Shareholders.
Distributions to shareholders of each class were as follows:
Years ended July 31, | 2011 | 2010 |
From net investment income | | |
Class A | $ 6,937 | $ 9,342 |
Class T | 5,513 | 6,865 |
Class B | 332 | 606 |
Class C | 1,100 | 1,669 |
Government Income | 94,692 | 116,185 |
Institutional Class | 6,323 | 5,720 |
Total | $ 114,897 | $ 140,387 |
From net realized gain | | |
Class A | $ 10,104 | $ 14,726 |
Class T | 7,830 | 10,744 |
Class B | 853 | 1,543 |
Class C | 2,724 | 4,162 |
Government Income | 112,442 | 158,363 |
Institutional Class | 6,868 | 7,222 |
Total | $ 140,821 | $ 196,760 |
10. Share Transactions.
Transactions for each class of shares were as follows:
| Shares | Dollars |
Years ended July 31, | 2011 | 2010 | 2011 | 2010 |
Class A | | | | |
Shares sold | 10,505 | 17,922 | $ 111,665 | $ 190,342 |
Reinvestment of distributions | 1,423 | 1,943 | 15,111 | 20,562 |
Shares redeemed | (20,985) | (20,615) | (221,593) | (218,378) |
Net increase (decrease) | (9,057) | (750) | $ (94,817) | $ (7,474) |
Class T | | | | |
Shares sold | 9,053 | 13,716 | $ 96,270 | $ 145,586 |
Reinvestment of distributions | 1,221 | 1,616 | 12,970 | 17,109 |
Shares redeemed | (15,795) | (14,473) | (166,943) | (153,287) |
Net increase (decrease) | (5,521) | 859 | $ (57,703) | $ 9,408 |
Class B | | | | |
Shares sold | 275 | 1,036 | $ 2,957 | $ 11,019 |
Reinvestment of distributions | 93 | 165 | 985 | 1,747 |
Shares redeemed | (1,536) | (2,202) | (16,266) | (23,321) |
Net increase (decrease) | (1,168) | (1,001) | $ (12,324) | $ (10,555) |
Annual Report
10. Share Transactions - continued
| Shares | Dollars |
Years ended July 31, | 2011 | 2010 | 2011 | 2010 |
Class C | | | | |
Shares sold | 2,426 | 3,916 | $ 25,890 | $ 41,596 |
Reinvestment of distributions | 261 | 390 | 2,774 | 4,131 |
Shares redeemed | (5,248) | (5,610) | (55,376) | (59,334) |
Net increase (decrease) | (2,561) | (1,304) | $ (26,712) | $ (13,607) |
Government Income | | | | |
Shares sold | 105,621 | 155,285 | $ 1,120,288 | $ 1,646,227 |
Reinvestment of distributions | 18,687 | 24,826 | 198,243 | 262,396 |
Shares redeemed | (178,425) | (166,873) | (1,885,694) | (1,763,484) |
Net increase (decrease) | (54,117) | 13,238 | $ (567,163) | $ 145,139 |
Institutional Class | | | | |
Shares sold | 12,979 | 13,487 | $ 137,402 | $ 143,092 |
Reinvestment of distributions | 1,192 | 1,193 | 12,645 | 12,621 |
Shares redeemed | (8,205) | (7,047) | (86,944) | (74,753) |
Net increase (decrease) | 5,966 | 7,633 | $ 63,103 | $ 80,960 |
11. Other.
The Fund's organizational documents provide former and current trustees and officers with a limited indemnification against liabilities arising in connection with the performance of their duties to the Fund. In the normal course of business, the Fund may also enter into contracts that provide general indemnifications. The Fund's maximum exposure under these arrangements is unknown as this would be dependent on future claims that may be made against the Fund. The risk of material loss from such claims is considered remote.
Effective after the close of business on August 26, 2011, the Fund exchanged securities, including accrued interest, valued at $1,278,207 for shares of Fidelity Mortgage Backed Securities Central Fund, which is an affiliated investment company managed by FMR Co., Inc., an affiliate of FMR. Fidelity Mortgage Backed Securities Central Fund seeks a high level of current income and invests primarily in investment-grade mortgage-related securities issued by the U.S. Government or its instrumentalities and repurchase agreements for those securities. These strategies are consistent with the investment objective of the Fund.
Annual Report
To the Trustees of Fidelity Income Fund and the Shareholders of Fidelity Government Income Fund:
In our opinion, the accompanying statement of assets and liabilities, including the schedule of investments, and the related statements of operations and of changes in net assets and the financial highlights present fairly, in all material respects, the financial position of Fidelity Government Income Fund (a fund of Fidelity Income Fund) at July 31, 2011, the results of its operations for the year then ended, the changes in its net assets for each of the two years in the period then ended and the financial highlights for each of the periods indicated, in conformity with accounting principles generally accepted in the United States of America. These financial statements and financial highlights (hereafter referred to as "financial statements") are the responsibility of the Fidelity Government Income Fund's management. Our responsibility is to express an opinion on these financial statements based on our audits. We conducted our audits of these financial statements in accordance with the standards of the Public Company Accounting Oversight Board (United States). Those standards require that we plan and perform the audit to obtain reasonable assurance about whether the financial statements are free of material misstatement. An audit includes examining, on a test basis, evidence supporting the amounts and disclosures in the financial statements, assessing the accounting principles used and significant estimates made by management, and evaluating the overall financial statement presentation. We believe that our audits, which included confirmation of securities at July 31, 2011 by correspondence with the custodian and brokers, provide a reasonable basis for our opinion.
/s/ PricewaterhouseCoopers LLP
PricewaterhouseCoopers LLP
Boston, Massachusetts
September 13, 2011
Annual Report
The Trustees and executive officers of the trust and fund, as applicable, are listed below. The Board of Trustees governs the fund and is responsible for protecting the interests of shareholders. The Trustees are experienced executives who meet periodically throughout the year to oversee the fund's activities, review contractual arrangements with companies that provide services to the fund, oversee management of the risks associated with such activities and contractual arrangements, and review the fund's performance. Except for James C. Curvey, each of the Trustees oversees 198 funds advised by FMR or an affiliate. Mr. Curvey oversees 419 funds advised by FMR or an affiliate.
The Trustees hold office without limit in time except that (a) any Trustee may resign; (b) any Trustee may be removed by written instrument, signed by at least two-thirds of the number of Trustees prior to such removal; (c) any Trustee who requests to be retired or who has become incapacitated by illness or injury may be retired by written instrument signed by a majority of the other Trustees; and (d) any Trustee may be removed at any special meeting of shareholders by a two-thirds vote of the outstanding voting securities of the trust. Each Trustee who is not an interested person (as defined in the 1940 Act) (Independent Trustee), shall retire not later than the last day of the calendar year in which his or her 75th birthday occurs. The Independent Trustees may waive this mandatory retirement age policy with respect to individual Trustees. The executive officers hold office without limit in time, except that any officer may resign or may be removed by a vote of a majority of the Trustees at any regular meeting or any special meeting of the Trustees. Except as indicated, each individual has held the office shown or other offices in the same company for the past five years.
Experience, Skills, Attributes, and Qualifications of the Fund's Trustees. The Governance and Nominating Committee has adopted a statement of policy that describes the experience, qualifications, attributes, and skills that are necessary and desirable for potential Independent Trustee candidates (Statement of Policy). The Board believes that each Trustee satisfied at the time he or she was initially elected or appointed a Trustee, and continues to satisfy, the standards contemplated by the Statement of Policy. The Governance and Nominating Committee also engages professional search firms to help identify potential Independent Trustee candidates who have the experience, qualifications, attributes, and skills consistent with the Statement of Policy. From time to time, additional criteria based on the composition and skills of the current Independent Trustees, as well as experience or skills that may be appropriate in light of future changes to board composition, business conditions, and regulatory or other developments, have also been considered by the professional search firms and the Governance and Nominating Committee. In addition, the Board takes into account the Trustees' commitment and participation in Board and committee meetings, as well as their leadership of standing and ad hoc committees throughout their tenure.
In determining that a particular Trustee was and continues to be qualified to serve as a Trustee, the Board has considered a variety of criteria, none of which, in isolation, was controlling. The Board believes that, collectively, the Trustees have balanced and diverse experience, qualifications, attributes, and skills, which allow the Board to operate effectively in governing the fund and protecting the interests of shareholders. Information about the specific experience, skills, attributes, and qualifications of each Trustee, which in each case led to the Board's conclusion that the Trustee should serve (or continue to serve) as a trustee of the fund, is provided below.
Annual Report
Trustees and Officers - continued
Board Structure and Oversight Function. Abigail P. Johnson is an interested person (as defined in the 1940 Act) and currently serves as Chairman. The Trustees have determined that an interested Chairman is appropriate and benefits shareholders because an interested Chairman has a personal and professional stake in the quality and continuity of services provided to the fund. Independent Trustees exercise their informed business judgment to appoint an individual of their choosing to serve as Chairman, regardless of whether the Trustee happens to be independent or a member of management. The Independent Trustees have determined that they can act independently and effectively without having an Independent Trustee serve as Chairman and that a key structural component for assuring that they are in a position to do so is for the Independent Trustees to constitute a substantial majority for the Board. The Independent Trustees also regularly meet in executive session. Kenneth L. Wolfe serves as Chairman of the Independent Trustees and as such (i) acts as a liaison between the Independent Trustees and management with respect to matters important to the Independent Trustees and (ii) with management prepares agendas for Board meetings.
Fidelity funds are overseen by different Boards of Trustees. The fund's Board oversees Fidelity's investment-grade bond, money market, and asset allocation funds and another Board oversees Fidelity's equity and high income funds. The asset allocation funds may invest in Fidelity funds that are overseen by such other Board. The use of separate Boards, each with its own committee structure, allows the Trustees of each group of Fidelity funds to focus on the unique issues of the funds they oversee, including common research, investment, and operational issues. On occasion, the separate Boards establish joint committees to address issues of overlapping consequences for the Fidelity funds overseen by each Board.
The Trustees operate using a system of committees to facilitate the timely and efficient consideration of all matters of importance to the Trustees, the fund, and fund shareholders and to facilitate compliance with legal and regulatory requirements and oversight of the fund's activities and associated risks. The Board, acting through its committees, has charged FMR and its affiliates with (i) identifying events or circumstances the occurrence of which could have demonstrably adverse effects on the fund's business and/or reputation; (ii) implementing processes and controls to lessen the possibility that such events or circumstances occur or to mitigate the effects of such events or circumstances if they do occur; and (iii) creating and maintaining a system designed to evaluate continuously business and market conditions in order to facilitate the identification and implementation processes described in (i) and (ii) above. Because the day-to-day operations and activities of the fund are carried out by or through FMR, its affiliates and other service providers, the fund's exposure to risks is mitigated but not eliminated by the processes overseen by the Trustees. While each of the Board's committees has responsibility for overseeing different aspects of the fund's activities, oversight is exercised primarily through the Operations and Audit Committees. Appropriate personnel, including but not limited to the fund's Chief Compliance Officer (CCO), FMR's internal auditor, the independent accountants, the fund's Treasurer and portfolio management personnel, make periodic reports to the Board's committees, as appropriate. The responsibilities of each committee, including their oversight responsibilities, are described further under "Standing Committees of the Fund's Trustees."
Annual Report
The fund's Statement of Additional Information (SAI) includes more information about the Trustees. To request a free copy, call Fidelity at 1-877-208-0098.
Interested Trustees*:
Correspondence intended for each Trustee who is an interested person may be sent to Fidelity Investments, 82 Devonshire Street, Boston, Massachusetts 02109.
Name, Age; Principal Occupations and Other Relevant Experience+ |
Abigail P. Johnson (49) |
| Year of Election or Appointment: 2009 Ms. Johnson is Trustee and Chairman of the Board of Trustees of certain Trusts. Ms. Johnson serves as President of Personal, Workplace and Institutional Services (2005-present). Ms. Johnson is Chairman and Director of FMR Co., Inc. (2011-present), Chairman and Director of FMR (2011-present), and the Vice Chairman and Director (2007-present) of FMR LLC. Previously, Ms. Johnson served as President and a Director of FMR (2001-2005), a Trustee of other investment companies advised by FMR, Fidelity Investments Money Management, Inc., and FMR Co., Inc. (2001-2005), Senior Vice President of the Fidelity funds (2001-2005), and managed a number of Fidelity funds. Ms. Abigail P. Johnson and Mr. Arthur E. Johnson are not related. |
James C. Curvey (76) |
| Year of Election or Appointment: 2007 Mr. Curvey also serves as Trustee (2007-present) of other investment companies advised by FMR. Mr. Curvey is a Director of Fidelity Investments Money Management, Inc. (2009-present), Director of Fidelity Research & Analysis Co. (2009-present) and Director of FMR and FMR Co., Inc. (2007-present). Mr. Curvey is also Vice Chairman (2007-present) and Director of FMR LLC. In addition, Mr. Curvey serves as an Overseer for the Boston Symphony Orchestra and a member of the Trustees of Villanova University. Previously, Mr. Curvey was the Vice Chairman (2006-2007) and Director (2000-2007) of FMR Corp. |
* Trustees have been determined to be "Interested Trustees" by virtue of, among other things, their affiliation with the trust or various entities under common control with FMR.
Annual Report
Trustees and Officers - continued
+ The information above includes each Trustee's principal occupation during the last five years and other information relating to the experience, attributes, and skills relevant to each Trustee's qualifications to serve as a Trustee, which led to the conclusion that each Trustee should serve as a Trustee for the fund.
Independent Trustees:
Correspondence intended for each Independent Trustee (that is, the Trustees other than the Interested Trustees) may be sent to Fidelity Investments, P.O. Box 55235, Boston, Massachusetts 02205-5235.
Name, Age; Principal Occupations and Other Relevant Experience+ |
Albert R. Gamper, Jr. (69) |
| Year of Election or Appointment: 2006 Mr. Gamper is Vice Chairman of the Independent Trustees of the Fixed Income and Asset Allocation Funds (2011-present). Prior to his retirement in December 2004, Mr. Gamper served as Chairman of the Board of CIT Group Inc. (commercial finance). During his tenure with CIT Group Inc. Mr. Gamper served in numerous senior management positions, including Chairman (1987-1989; 1999-2001; 2002-2004), Chief Executive Officer (1987-2004), and President (2002-2003). He also served as President and Chief Executive Officer of Tyco Capital Corporation (2001-2002). Mr. Gamper currently serves as a member of the Board of Directors of Public Service Enterprise Group (utilities, 2000-present), a member of the Board of Trustees, Rutgers University (2004-present), and Chairman of the Board of Saint Barnabas Health Care System. Previously, Mr. Gamper served as Chairman of the Board of Governors, Rutgers University (2004-2007). |
Robert F. Gartland (59) |
| Year of Election or Appointment: 2010 Mr. Gartland is a partner and investor of Vietnam Partners LLC (investments and consulting, 2008-present) and is Chairman and an investor in Gartland and Mellina Group Corp. (consulting, 2009-present). Prior to his retirement, Mr. Gartland held a variety of positions at Morgan Stanley (financial services, 1979-2007) including Managing Director (1987-2007). |
Arthur E. Johnson (64) |
| Year of Election or Appointment: 2008 Mr. Johnson serves as a member of the Board of Directors of Eaton Corporation (diversified power management, 2009-present) and AGL Resources, Inc. (holding company). Prior to his retirement, Mr. Johnson served as Senior Vice President of Corporate Strategic Development of Lockheed Martin Corporation (defense contractor, 1999-2009). He previously served on the Board of Directors of IKON Office Solutions, Inc. (1999-2008) and Delta Airlines (2005-2007). Mr. Arthur E. Johnson and Ms. Abigail P. Johnson are not related. |
Michael E. Kenneally (57) |
| Year of Election or Appointment: 2009 Previously, Mr. Kenneally served as a Member of the Advisory Board for certain Fidelity Fixed Income and Asset Allocation Funds (2008-2009). Prior to his retirement, Mr. Kenneally served as Chairman and Global Chief Executive Officer of Credit Suisse Asset Management (2003-2005). Mr. Kenneally was a Director of the Credit Suisse Funds (U.S. mutual funds, 2004-2008) and certain other closed-end funds (2004-2005) and was awarded the Chartered Financial Analyst (CFA) designation in 1991. |
James H. Keyes (70) |
| Year of Election or Appointment: 2007 Mr. Keyes serves as a member of the Boards of Navistar International Corporation (manufacture and sale of trucks, buses, and diesel engines, since 2002) and Pitney Bowes, Inc. (integrated mail, messaging, and document management solutions, since 1998). Prior to his retirement, Mr. Keyes served as Chairman and Chief Executive Officer of Johnson Controls (automotive, building, and energy, 1998-2002) and as a member of the Board of LSI Logic Corporation (semiconductor technologies, 1984-2008). |
Marie L. Knowles (64) |
| Year of Election or Appointment: 2001 Prior to Ms. Knowles' retirement in June 2000, she served as Executive Vice President and Chief Financial Officer of Atlantic Richfield Company (ARCO) (diversified energy, 1996-2000). From 1993 to 1996, she was a Senior Vice President of ARCO and President of ARCO Transportation Company. She served as a Director of ARCO from 1996 to 1998. Ms. Knowles currently serves as a Director and Chairman of the Audit Committee of McKesson Corporation (healthcare service, since 2002). Ms. Knowles is an Honorary Trustee of the Brookings Institution and a member of the Board of the Catalina Island Conservancy and of the Santa Catalina Island Company (2009-present). She also serves as a member of the Advisory Board for the School of Engineering of the University of Southern California and the Foundation Board of the School of Architecture at the University of Virginia (2007-present). Previously, Ms. Knowles served as a Director of Phelps Dodge Corporation (copper mining and manufacturing, 1994-2007). |
Kenneth L. Wolfe (72) |
| Year of Election or Appointment: 2005 Mr. Wolfe is Chairman of the Independent Trustees of the Fixed Income and Asset Allocation Funds (2008-present). Prior to his retirement, Mr. Wolfe served as Chairman and a Director (2007-2009) and Chairman and Chief Executive Officer (1994-2001) of Hershey Foods Corporation. He also served as a member of the Boards of Adelphia Communications Corporation (telecommunications, 2003-2006), Bausch & Lomb, Inc. (medical/pharmaceutical, 1993-2007), and Revlon, Inc. (personal care products, 2004-2009). |
+ The information above includes each Trustee's principal occupation during the last five years and other information relating to the experience, attributes, and skills relevant to each Trustee's qualifications to serve as a Trustee, which led to the conclusion that each Trustee should serve as a Trustee for the fund.
Annual Report
Executive Officers:
Correspondence intended for each executive officer may be sent to Fidelity Investments, 82 Devonshire Street, Boston, Massachusetts 02109.
Name, Age; Principal Occupation |
John R. Hebble (53) |
| Year of Election or Appointment: 2008 President and Treasurer of Fidelity's Fixed Income and Asset Allocation Funds. Mr. Hebble also serves as President (2011-present), Treasurer, and Chief Financial Officer of The North Carolina Capital Management Trust: Cash and Term Portfolios (2008-present), Assistant Treasurer of other Fidelity funds (2009-present) and is an employee of Fidelity Investments. |
Christopher P. Sullivan (57) |
| Year of Election or Appointment: 2009 Vice President of Fidelity's Bond Funds. Mr. Sullivan also serves as President of Fidelity's Bond Division (2009-present). Mr. Sullivan is Executive Vice President of Fidelity Investments Money Management, Inc. (2009-present), and a Director of Fidelity Management & Research (U.K.) Inc. (2010-present). Previously, Mr. Sullivan served as Managing Director, Co-Head of U.S. Fixed Income at Goldman Sachs Asset Management (2001-2009). |
Christine J. Thompson (53) |
| Year of Election or Appointment: 2010 Vice President of Fidelity's Bond Funds. Ms. Thompson also serves as Chief Investment Officer of FMR's Bond Group (2010-present) and is an employee of Fidelity Investments. Previously, Ms. Thompson served as Director of Municipal Bond Portfolio Managers (2002-2010). |
Scott C. Goebel (43) |
| Year of Election or Appointment: 2008 Secretary and Chief Legal Officer (CLO) of the Fidelity funds. Mr. Goebel also serves as Secretary of Fidelity Investments Money Management, Inc. (FIMM) (2010-present) and Fidelity Research and Analysis Company (FRAC) (2010-present); Secretary and CLO of The North Carolina Capital Management Trust: Cash and Term Portfolios (2008-present); General Counsel, Secretary, and Senior Vice President of FMR (2008-present) and FMR Co., Inc. (2008-present); employed by FMR LLC or an affiliate (2001-present); Chief Legal Officer of Fidelity Management & Research (Hong Kong) Limited (2008-present) and Assistant Secretary of Fidelity Management & Research (Japan) Inc. (2008-present), and Fidelity Management & Research (U.K.) Inc. (2008-present). Previously, Mr. Goebel served as Assistant Secretary of FIMM (2008-2010), FRAC (2008-2010), and the Funds (2007-2008) and as Vice President and Secretary of Fidelity Distributors Corporation (FDC) (2005-2007). |
David J. Carter (38) |
| Year of Election or Appointment: 2010 Assistant Secretary of Fidelity's Fixed Income and Asset Allocation Funds. Mr. Carter also serves as Vice President, Associate General Counsel (2010-present) and is an employee of Fidelity Investments (2005-present). |
Holly C. Laurent (57) |
| Year of Election or Appointment: 2008 Anti-Money Laundering (AML) Officer of the Fidelity funds. Ms. Laurent also serves as AML Officer of The North Carolina Capital Management Trust: Cash and Term Portfolios (2008-present) and is an employee of Fidelity Investments. Previously, Ms. Laurent was Senior Vice President and Head of Legal for Fidelity Business Services India Pvt. Ltd. (2006-2008), and Senior Vice President, Deputy General Counsel and Group Head for FMR LLC (2005-2006). |
Christine Reynolds (52) |
| Year of Election or Appointment: 2008 Chief Financial Officer of the Fidelity funds. Ms. Reynolds became President of Fidelity Pricing and Cash Management Services (FPCMS) in August 2008. Ms. Reynolds served as Chief Operating Officer of FPCMS (2007-2008). Previously, Ms. Reynolds served as President, Treasurer, and Anti-Money Laundering officer of the Fidelity funds (2004-2007). |
Michael H. Whitaker (44) |
| Year of Election or Appointment: 2008 Chief Compliance Officer of Fidelity's Fixed Income and Asset Allocation Funds. Mr. Whitaker also serves as Chief Compliance Officer of The North Carolina Capital Management Trust: Cash and Term Portfolios (2008-present). Mr. Whitaker is an employee of Fidelity Investments (2007-present). Prior to joining Fidelity Investments, Mr. Whitaker worked at MFS Investment Management where he served as Senior Vice President and Chief Compliance Officer (2004-2006), and Assistant General Counsel. |
Jeffrey S. Christian (49) |
| Year of Election or Appointment: 2009 Deputy Treasurer of the Fidelity funds. Mr. Christian is an employee of Fidelity Investments. Previously, Mr. Christian served as Chief Financial Officer (2008-2009) of certain Fidelity funds and Senior Vice President of Fidelity Pricing and Cash Management Services (FPCMS) (2004-2009). |
Bryan A. Mehrmann (50) |
| Year of Election or Appointment: 2005 Deputy Treasurer of the Fidelity funds. Mr. Mehrmann is an employee of Fidelity Investments. |
Stephanie J. Dorsey (42) |
| Year of Election or Appointment: 2008 Deputy Treasurer of Fidelity's Fixed Income and Asset Allocation Funds. Ms. Dorsey also serves as Assistant Treasurer of other Fidelity funds (2010-present) and is an employee of Fidelity Investments (2008-present). Previously, Ms. Dorsey served as Treasurer (2004-2008) of the JPMorgan Mutual Funds and Vice President (2004-2008) of JPMorgan Chase Bank. |
Adrien E. Deberghes (43) |
| Year of Election or Appointment: 2010 Assistant Treasurer of Fidelity's Fixed Income and Asset Allocation Funds. Mr. Deberghes also serves as Deputy Treasurer of other Fidelity funds (2008-present) and is an employee of Fidelity Investments (2008-present). Previously, Mr. Deberghes served as Senior Vice President of Mutual Fund Administration at State Street Corporation (2007-2008), Senior Director of Mutual Fund Administration at Investors Bank & Trust (2005-2007), and Director of Finance for Dunkin' Brands (2000-2005). |
Kenneth B. Robins (41) |
| Year of Election or Appointment: 2009 Assistant Treasurer of the Fidelity Fixed Income and Asset Allocation Funds. Mr. Robins also serves as President and Treasurer of other Fidelity funds (2008-present; 2010-present) and is an employee of Fidelity Investments (2004-present). Previously, Mr. Robins served as Deputy Treasurer of the Fidelity funds (2005-2008) and Treasurer and Chief Financial Officer of The North Carolina Capital Management Trust: Cash and Term Portfolios (2006-2008). |
Gary W. Ryan (52) |
| Year of Election or Appointment: 2005 Assistant Treasurer of the Fidelity funds. Mr. Ryan is an employee of Fidelity Investments. Previously, Mr. Ryan served as Vice President of Fund Reporting in Fidelity Pricing and Cash Management Services (FPCMS) (1999-2005). |
Jonathan Davis (43) |
| Year of Election or Appointment: 2010 Assistant Treasurer of the Fidelity funds. Mr. Davis is an employee of Fidelity Investments. Previously, Mr. Davis served as Vice President and Associate General Counsel of FMR LLC (2003-2010). |
Annual Report
The fund hereby designates as a capital gain dividend with respect to the taxable year ended July 31, 2011, $73,201,895, or, if subsequently determined to be different, the net capital gain of such year.
A total of 45.92% of the dividends distributed during the fiscal year was derived from interest on U.S. Government securities which is generally exempt from state income tax.
The fund designates $64,328,834 of distributions paid during the period January 1, 2011 to July 31, 2011 as qualifying to be taxed as interest-related dividends for nonresident alien shareholders.
The fund will notify shareholders in January 2012 of amounts for use in preparing 2011 income tax returns.
Annual Report
Investment Adviser
Fidelity Management & Research Company
Boston, MA
Investment Sub-Advisers
Fidelity Investments Money
Management, Inc.
Fidelity Management & Research
(U.K.) Inc.
Fidelity Management & Research
(Hong Kong) Limited
Fidelity Management & Research
(Japan) Inc.
General Distributor
Fidelity Distributors Corporation
Boston, MA
Transfer and Service Agents
Fidelity Investments Institutional Operations Company, Inc.
Boston, MA
Fidelity Service Company, Inc.
Boston, MA
Custodian
The Bank of New York Mellon
New York, NY
AGVTI-UANN-0911
1.834231.104
Fidelity Income Replacement FundsSM -
2016, 2018, 2020, 2022, 2024, 2026, 2028, 2030, 2032,
2034, 2036, 2038, 2040, 2042
Annual Report
July 31, 2011
(2_fidelity_logos) (Registered_Trademark)
Contents
Annual Report
This report and the financial statements contained herein are submitted for the general information of the shareholders of the funds. This report is not authorized for distribution to prospective investors in the funds unless preceded or accompanied by an effective prospectus.
A fund files its complete schedule of portfolio holdings with the SEC for the first and third quarters of each fiscal year on Form N-Q. Forms N-Q are available on the SEC's web site at http://www.sec.gov. A fund's Forms N-Q may be reviewed and copied at the SEC's Public Reference Room in Washington, DC. Information regarding the operation of the SEC's Public Reference Room may be obtained by calling 1-800-SEC-0330. For a complete list of a fund's portfolio holdings, view the most recent holdings listing, semiannual report, or annual report on Fidelity's web site at http://www.fidelity.com, http://www.advisor.fidelity.com, or http://www.401k.com, as applicable.
NOT FDIC INSURED • MAY LOSE VALUE • NO BANK GUARANTEE
Neither the funds nor Fidelity Distributors Corporation is a bank.
To view a fund's proxy voting guidelines and proxy voting record for the 12-month period ended June 30, visit http://www.fidelity.com/proxyvotingresults or visit the Securities and Exchange Commission's (SEC) web site at http://www.sec.gov. You may also call 1-800-544-8544 to request a free copy of the proxy voting guidelines.
Standard & Poor's, S&P and S&P 500 are registered service marks of The McGraw-Hill Companies, Inc. and have been licensed for use by Fidelity Distributors Corporation.
Other third party marks appearing herein are the property of their respective owners.
All other marks appearing herein are registered or unregistered trademarks or service marks of FMR LLC or an affiliated company.
Annual Report
(photo_of_Abigail_P_Johnson)
Dear Shareholder:
The second half of 2011 began with U.S. equities continuing to give back some of the gains achieved earlier in the year. In the days leading up to July 31, markets were shaken by a political stalemate in which Congress struggled to address the debt ceiling issue before an early-August deadline. The resulting uncertainty held back markets in July, the third consecutive monthly decline for equities, effectively reversing the positive momentum seen through the end of April. Financial markets are always unpredictable, of course, but there are several time-tested investment principles that can help put the odds in your favor.
One of the basic tenets is to invest for the long term. Over time, riding out the markets' inevitable ups and downs has proven much more effective than selling into panic or chasing the hottest trend. Even missing only a few of the markets' best days can significantly diminish investor returns. Patience also affords the benefits of compounding - of earning interest on additional income or reinvested dividends and capital gains. There can be tax advantages and cost benefits to consider as well. While staying the course doesn't eliminate risk, it can considerably lessen the effect of short-term declines.
You can further manage your investing risk through diversification. And today, more than ever, geographic diversification should be taken into account. Studies indicate that asset allocation is the single most important determinant of a portfolio's long-term success. The right mix of stocks, bonds and cash - aligned to your particular risk tolerance and investment objective - is very important. Age-appropriate rebalancing is also an essential aspect of asset allocation. For younger investors, an emphasis on equities - which historically have been the best-performing asset class over time - is encouraged. As investors near their specific goal, such as retirement or sending a child to college, consideration may be given to replacing volatile assets (e.g. common stocks) with more-stable fixed investments (bonds or savings plans).
A third principle - investing regularly - can help lower the average cost of your purchases. Investing a certain amount of money each month or quarter helps ensure you won't pay for all your shares at market highs. This strategy - known as dollar cost averaging - also reduces "emotion" from investing, helping shareholders avoid selling weak performers just prior to an upswing, or chasing a hot performer just before a correction.
We invite you to contact us via the Internet, through our Investor Centers or by phone. It is our privilege to provide you the information you need to make the investments that are right for you.
Sincerely,
(The chairman's signature appears here.)
Abigail P. Johnson
Annual Report
Fidelity Income Replacement 2016 FundSM
Average annual total return reflects the change in the value of an investment, assuming reinvestment of the class' distributions from dividend income and capital gains (the profits earned upon the sale of securities that have grown in value, if any) and assuming a constant rate of performance each year. The $25,000 table and the fund's returns do not reflect the deduction of taxes that a shareholder would pay on fund distributions or the redemption of fund shares. During periods of reimbursement by Fidelity, a fund's total return will be greater than it would be had the reimbursement not occurred. How a fund did yesterday is no guarantee of how it will do tomorrow.
Average Annual Total Returns
Periods ended July 31, 2011 | Past 1
year | Life of
fund A |
Fidelity Income Replacement 2016 Fund | 8.57% | 2.93% |
A From August 30, 2007.
$25,000 Over Life of Fund
Let's say hypothetically that $25,000 was invested in Fidelity Income Replacement 2016 Fund, a class of the fund, on August 30, 2007, when the fund started. The chart shows how the value of your investment would have changed, and also shows how the Barclays Capital® U.S. Aggregate Bond Index performed over the same period.
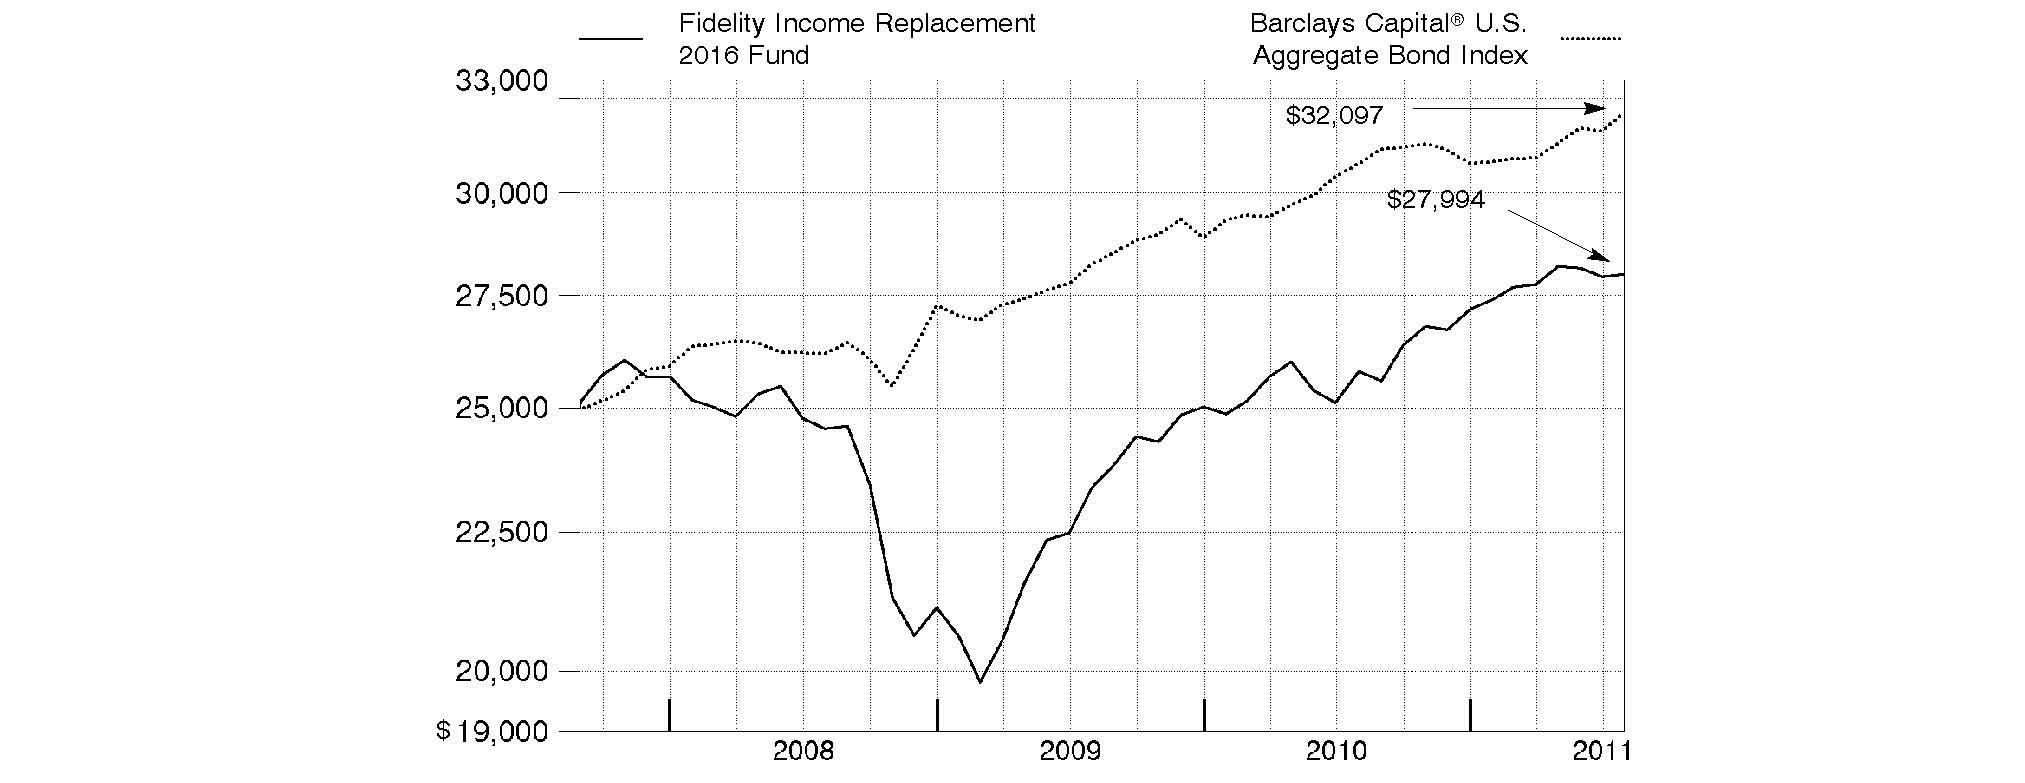
Annual Report
Fidelity Income Replacement 2018 FundSM
Performance: The Bottom Line
Average annual total return reflects the change in the value of an investment, assuming reinvestment of the class' distributions from dividend income and capital gains (the profits earned upon the sale of securities that have grown in value, if any) and assuming a constant rate of performance each year. The $25,000 table and the fund's returns do not reflect the deduction of taxes that a shareholder would pay on fund distributions or the redemption of fund shares. During periods of reimbursement by Fidelity, a fund's total return will be greater than it would be had the reimbursement not occurred. How a fund did yesterday is no guarantee of how it will do tomorrow.
Average Annual Total Returns
Periods ended July 31, 2011 | Past 1
year | Life of
fund A |
Fidelity Income Replacement 2018 Fund | 10.01% | 2.99% |
A From August 30, 2007.
$25,000 Over Life of Fund
Let's say hypothetically that $25,000 was invested in Fidelity Income Replacement 2018 Fund, a class of the fund, on August 30, 2007, when the fund started. The chart shows how the value of your investment would have changed, and also shows how the Barclays Capital U.S. Aggregate Bond Index performed over the same period.
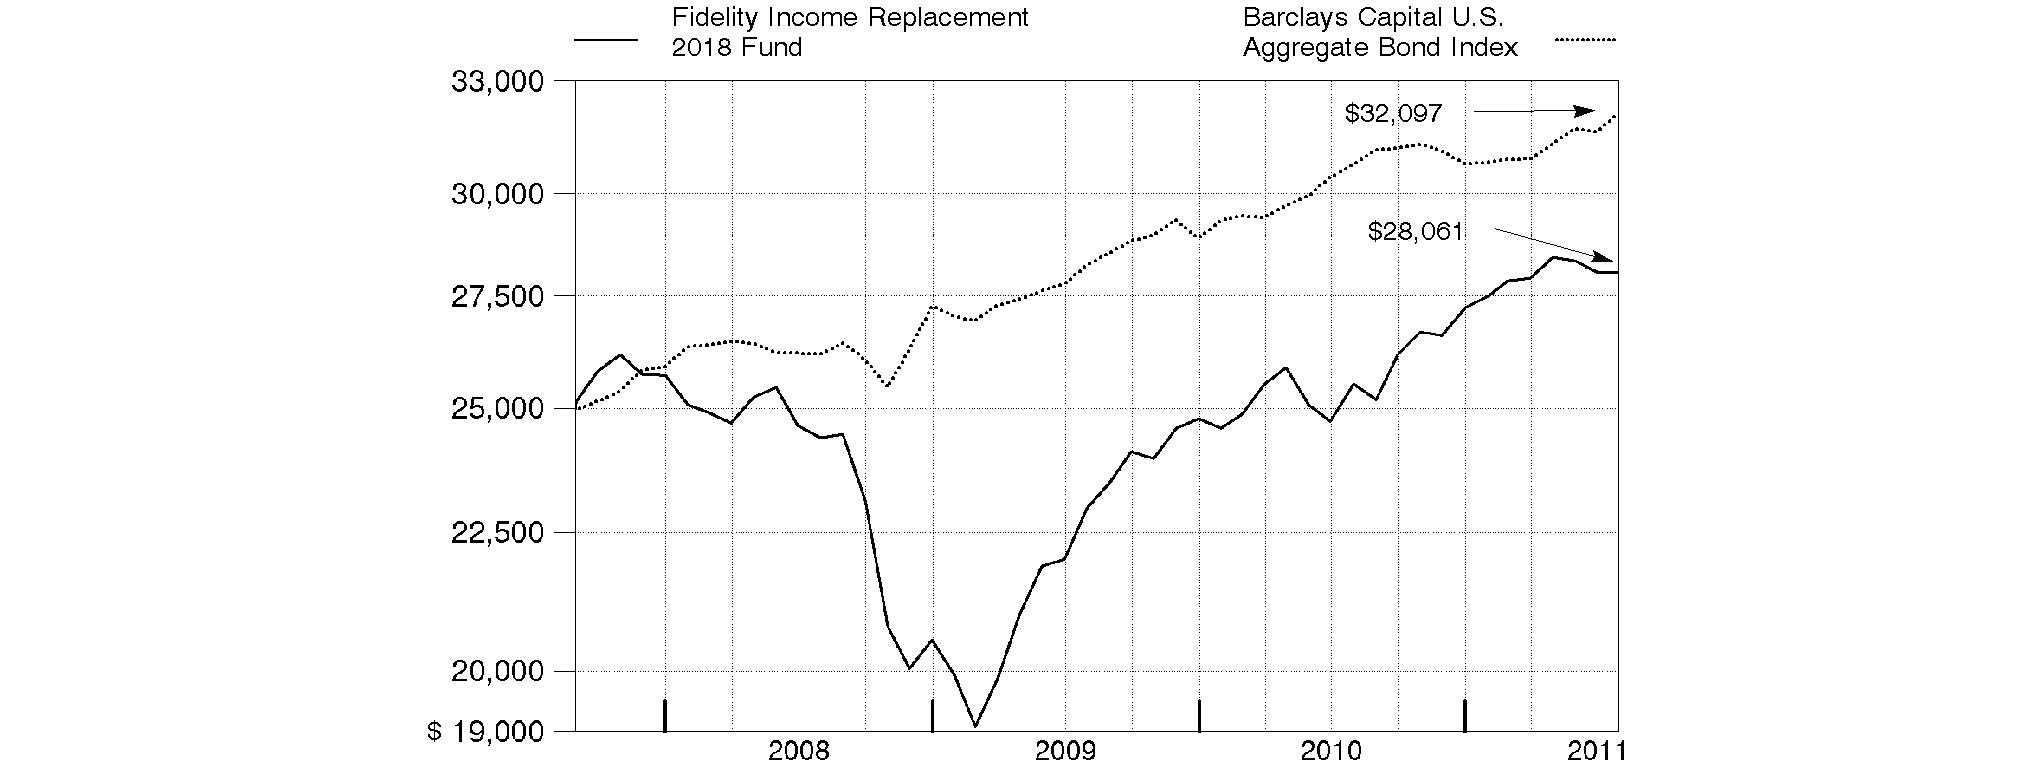
Annual Report
Fidelity Income Replacement 2020 FundSM
Performance: The Bottom Line
Average annual total return reflects the change in the value of an investment, assuming reinvestment of the class' distributions from dividend income and capital gains (the profits earned upon the sale of securities that have grown in value, if any) and assuming a constant rate of performance each year. The $25,000 table and the fund's returns do not reflect the deduction of taxes that a shareholder would pay on fund distributions or the redemption of fund shares. During periods of reimbursement by Fidelity, a fund's total return will be greater than it would be had the reimbursement not occurred. How a fund did yesterday is no guarantee of how it will do tomorrow.
Average Annual Total Returns
Periods ended July 31, 2011 | Past 1
year | Life of
fundA |
Fidelity Income Replacement 2020 Fund | 11.10% | 2.92% |
A From August 30, 2007.
$25,000 Over Life of Fund
Let's say hypothetically that $25,000 was invested in Fidelity Income Replacement 2020 Fund, a class of the fund, on August 30, 2007, when the fund started. The chart shows how the value of your investment would have changed, and also shows how the Barclays Capital U.S. Aggregate Bond Index performed over the same period.
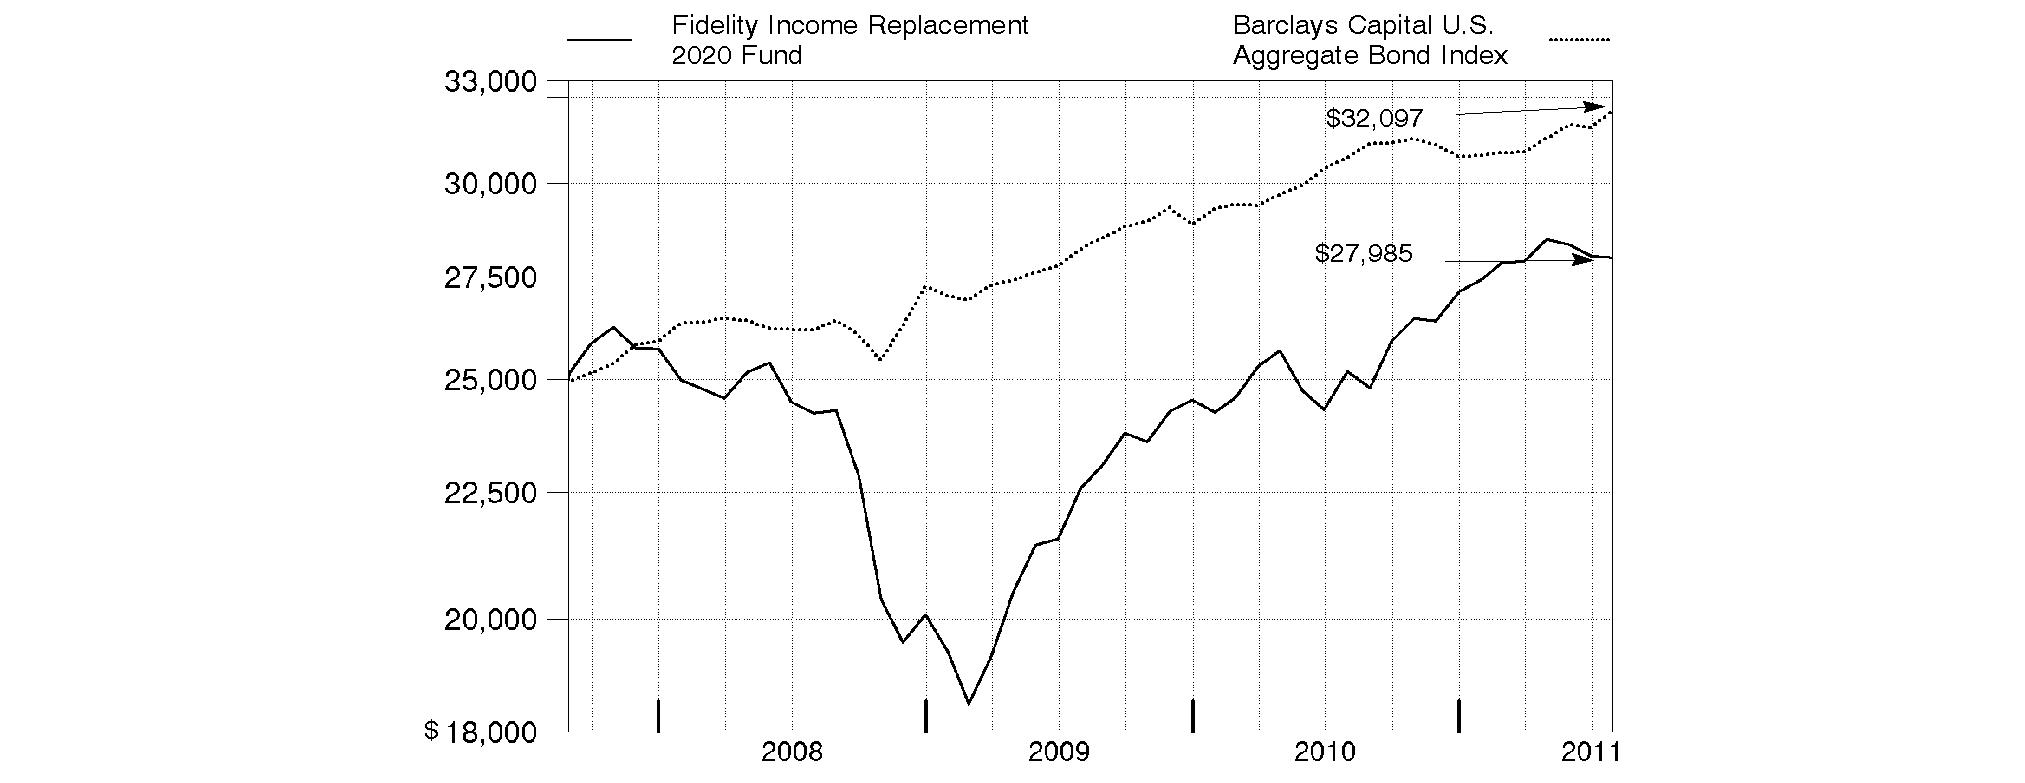
Annual Report
Fidelity Income Replacement 2022 FundSM
Performance: The Bottom Line
Average annual total return reflects the change in the value of an investment, assuming reinvestment of the class' distributions from dividend income and capital gains (the profits earned upon the sale of securities that have grown in value, if any) and assuming a constant rate of performance each year. The $25,000 table and the fund's returns do not reflect the deduction of taxes that a shareholder would pay on fund distributions or the redemption of fund shares. During periods of reimbursement by Fidelity, a fund's total return will be greater than it would be had the reimbursement not occurred. How a fund did yesterday is no guarantee of how it will do tomorrow.
Average Annual Total Returns
Periods ended July 31, 2011 | Past 1
year | Life of
fund A |
Fidelity Income Replacement 2022 Fund | 11.87% | 2.93% |
A From August 30, 2007.
$25,000 Over Life of Fund
Let's say hypothetically that $25,000 was invested in Fidelity Income Replacement 2022 Fund, a class of the fund, on August 30, 2007, when the fund started. The chart shows how the value of your investment would have changed, and also shows how the Barclays Capital U.S. Aggregate Bond Index performed over the same period.
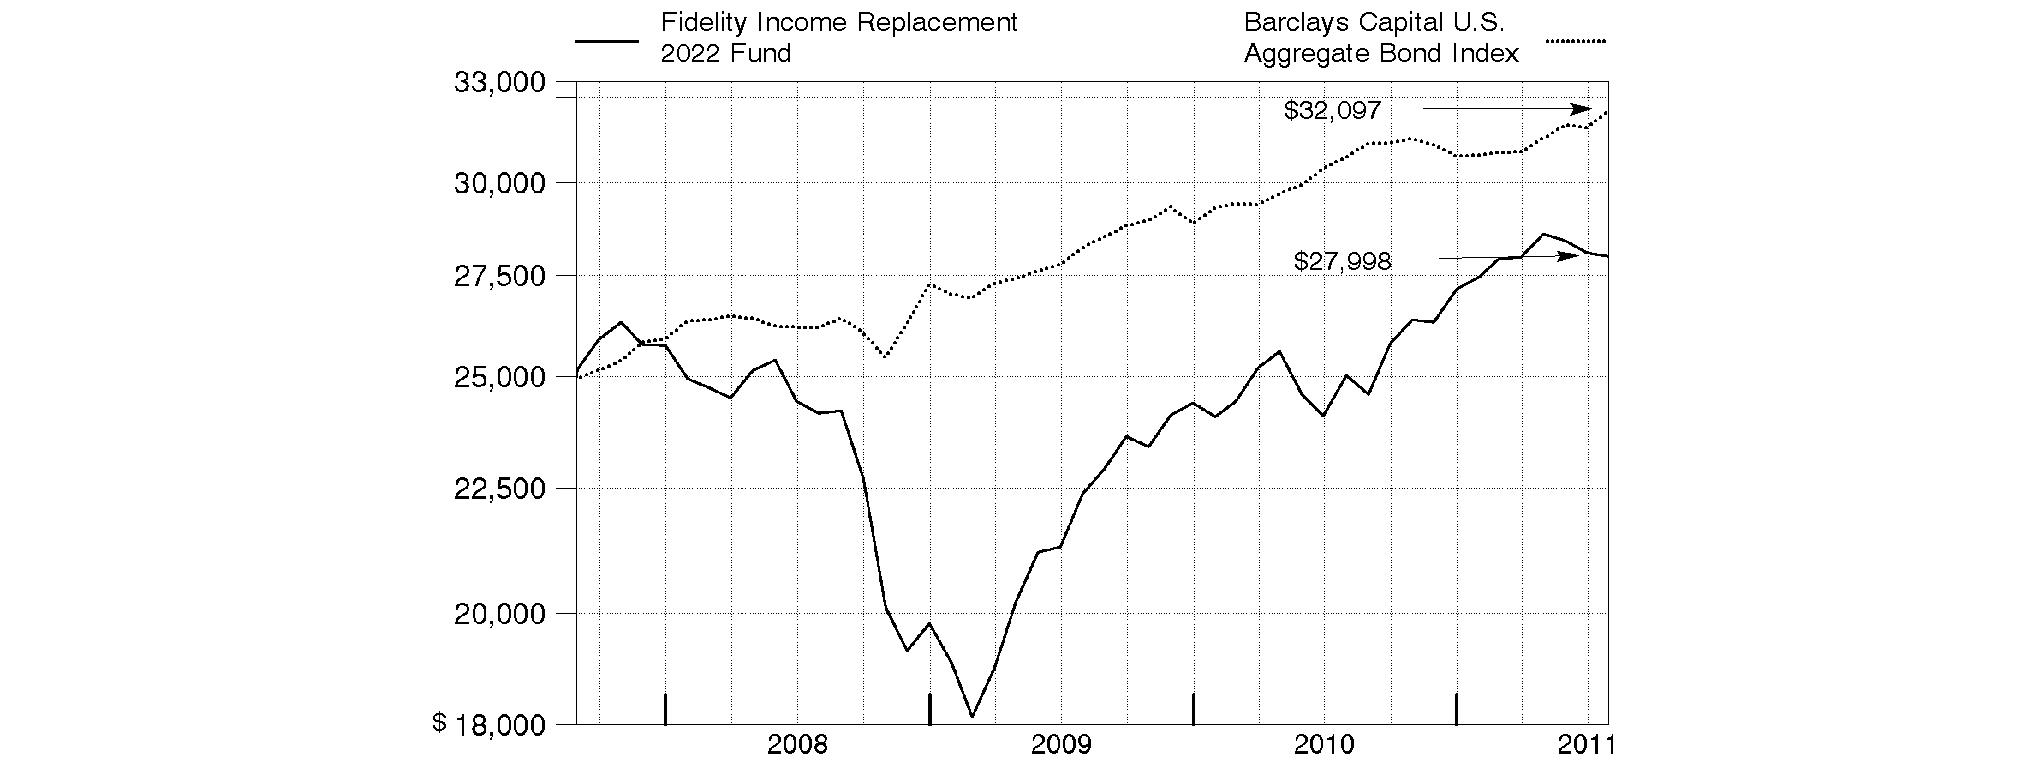
Annual Report
Fidelity Income Replacement 2024 FundSM
Performance: The Bottom Line
Average annual total return reflects the change in the value of an investment, assuming reinvestment of the class' distributions from dividend income and capital gains (the profits earned upon the sale of securities that have grown in value, if any) and assuming a constant rate of performance each year. The $25,000 table and the fund's returns do not reflect the deduction of taxes that a shareholder would pay on fund distributions or the redemption of fund shares. During periods of reimbursement by Fidelity, a fund's total return will be greater than it would be had the reimbursement not occurred. How a fund did yesterday is no guarantee of how it will do tomorrow.
Average Annual Total Returns
Periods ended July 31, 2011 | Past 1
year | Life of
fundA |
Fidelity Income Replacement 2024 Fund | 12.41% | 2.90% |
A From August 30, 2007.
$25,000 Over Life of Fund
Let's say hypothetically that $25,000 was invested in Fidelity Income Replacement 2024 Fund, a class of the fund, on August 30, 2007, when the fund started. The chart shows how the value of your investment would have changed, and also shows how the S&P 500® Index performed over the same period.
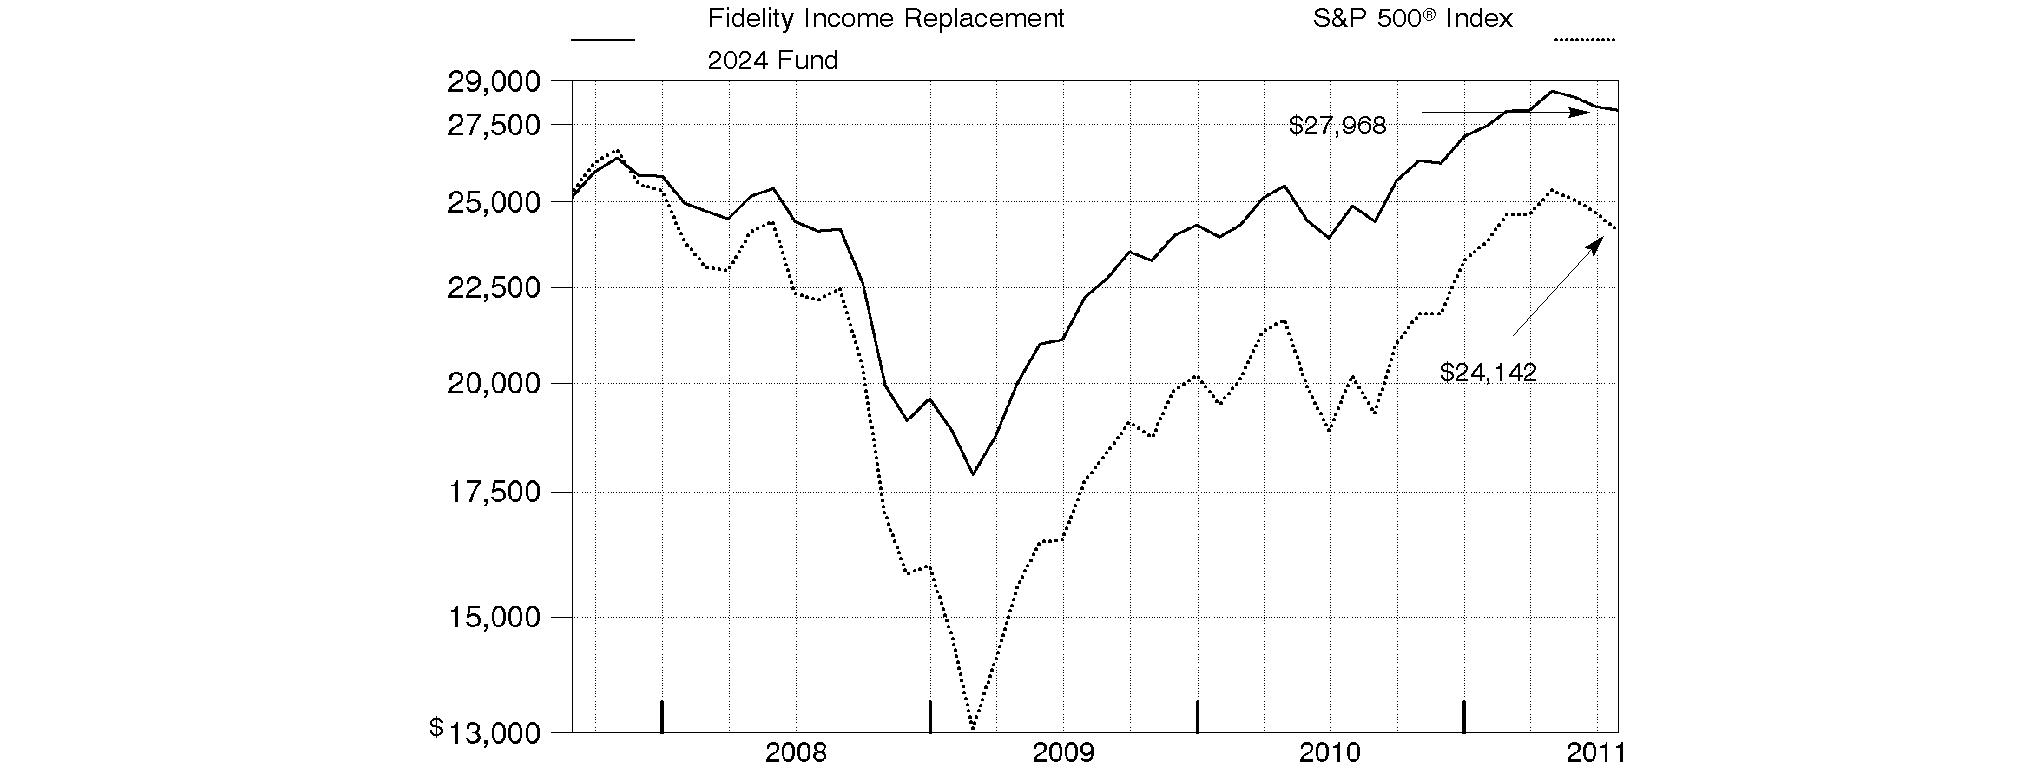
Annual Report
Fidelity Income Replacement 2026 FundSM
Performance: The Bottom Line
Average annual total return reflects the change in the value of an investment, assuming reinvestment of the class' distributions from dividend income and capital gains (the profits earned upon the sale of securities that have grown in value, if any) and assuming a constant rate of performance each year. The $25,000 table and the fund's returns do not reflect the deduction of taxes that a shareholder would pay on fund distributions or the redemption of fund shares. During periods of reimbursement by Fidelity, a fund's total return will be greater than it would be had the reimbursement not occurred. How a fund did yesterday is no guarantee of how it will do tomorrow.
Average Annual Total Returns
Periods ended July 31, 2011 | Past 1
year | Life of
fundA |
Fidelity Income Replacement 2026 Fund | 12.82% | 2.78% |
A From August 30, 2007.
$25,000 Over Life of Fund
Let's say hypothetically that $25,000 was invested in Fidelity Income Replacement 2026 Fund, a class of the fund, on August 30, 2007, when the fund started. The chart shows how the value of your investment would have changed, and also shows how the S&P 500 Index performed over the same period.

Annual Report
Fidelity Income Replacement 2028 FundSM
Performance: The Bottom Line
Average annual total return reflects the change in the value of an investment, assuming reinvestment of the class' distributions from dividend income and capital gains (the profits earned upon the sale of securities that have grown in value, if any) and assuming a constant rate of performance each year. The $25,000 table and the fund's returns do not reflect the deduction of taxes that a shareholder would pay on fund distributions or the redemption of fund shares. During periods of reimbursement by Fidelity, a fund's total return will be greater than it would be had the reimbursement not occurred. How a fund did yesterday is no guarantee of how it will do tomorrow.
Average Annual Total Returns
Periods ended July 31, 2011 | Past 1
year | Life of
fund A |
Fidelity Income Replacement 2028 Fund | 13.12% | 2.73% |
A From August 30, 2007.
$25,000 Over Life of Fund
Let's say hypothetically that $25,000 was invested in Fidelity Income Replacement 2028 Fund, a class of the fund, on August 30, 2007, when the fund started. The chart shows how the value of your investment would have changed, and also shows how the S&P 500 Index performed over the same period.
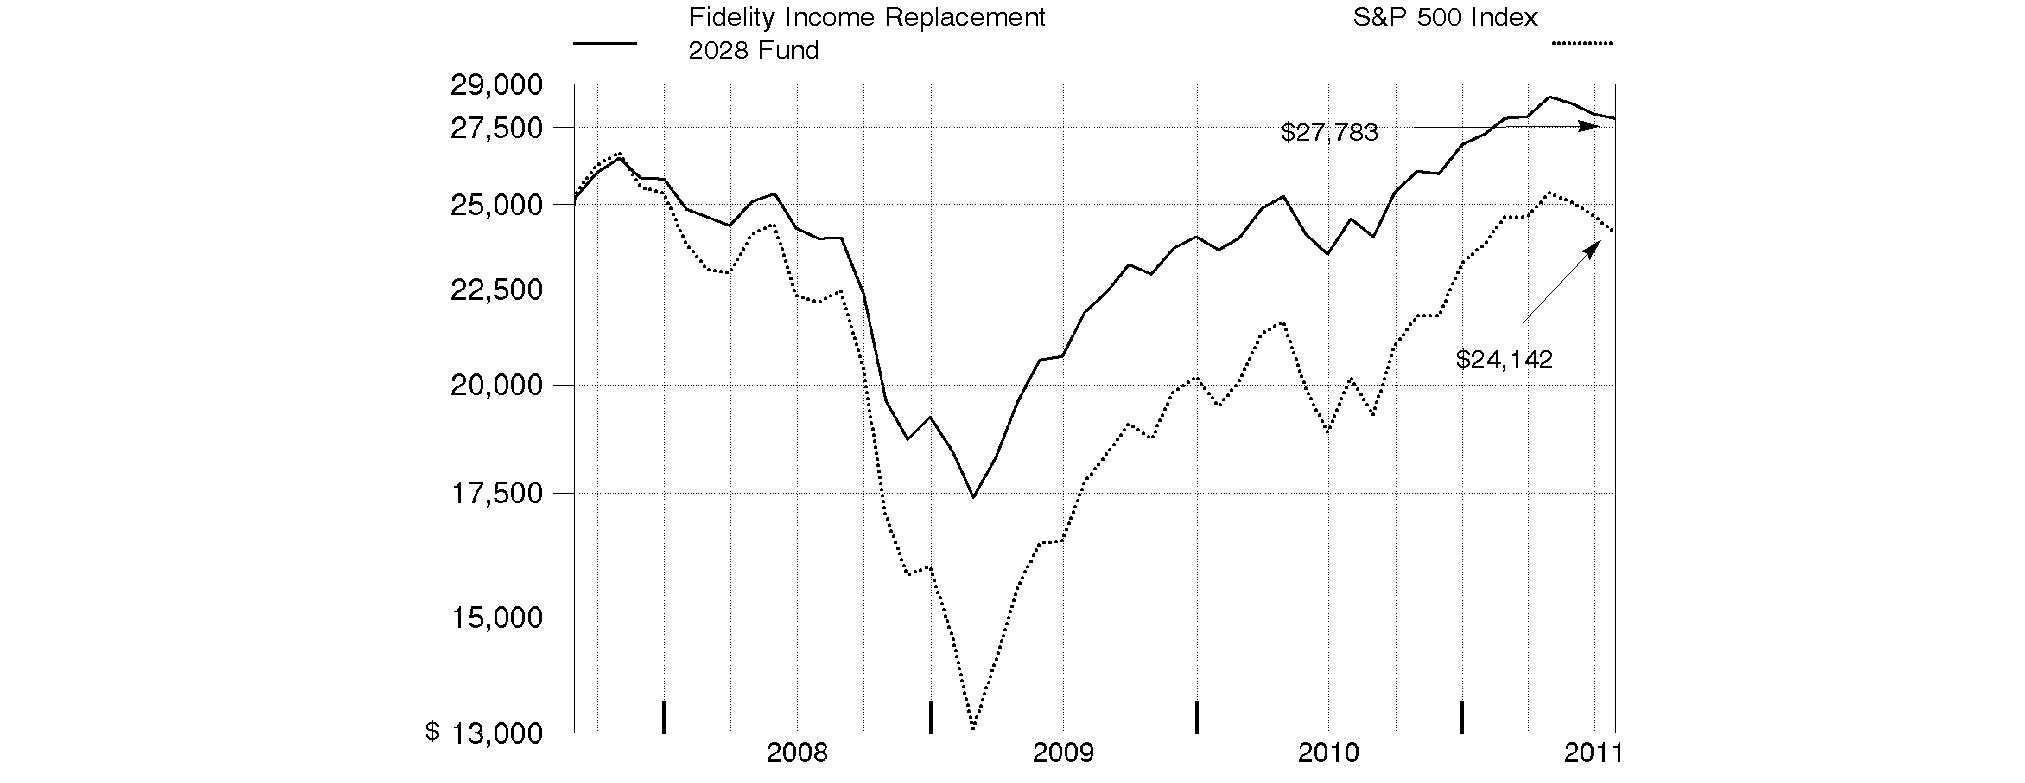
Annual Report
Fidelity Income Replacement 2030 FundSM
Performance: The Bottom Line
Average annual total return reflects the change in the value of an investment, assuming reinvestment of the class' distributions from dividend income and capital gains (the profits earned upon the sale of securities that have grown in value, if any) and assuming a constant rate of performance each year. The $25,000 table and the fund's returns do not reflect the deduction of taxes that a shareholder would pay on fund distributions or the redemption of fund shares. During periods of reimbursement by Fidelity, a fund's total return will be greater than it would be had the reimbursement not occurred. How a fund did yesterday is no guarantee of how it will do tomorrow.
Average Annual Total Returns
Periods ended July 31, 2011 | Past 1
year | Life of
fund A |
Fidelity Income Replacement 2030 Fund | 13.43% | 2.69% |
A From August 30, 2007.
$25,000 Over Life of Fund
Let's say hypothetically that $25,000 was invested in Fidelity Income Replacement 2030 Fund, a class of the fund, on August 30, 2007, when the fund started. The chart shows how the value of your investment would have changed, and also shows how the S&P 500 Index performed over the same period.
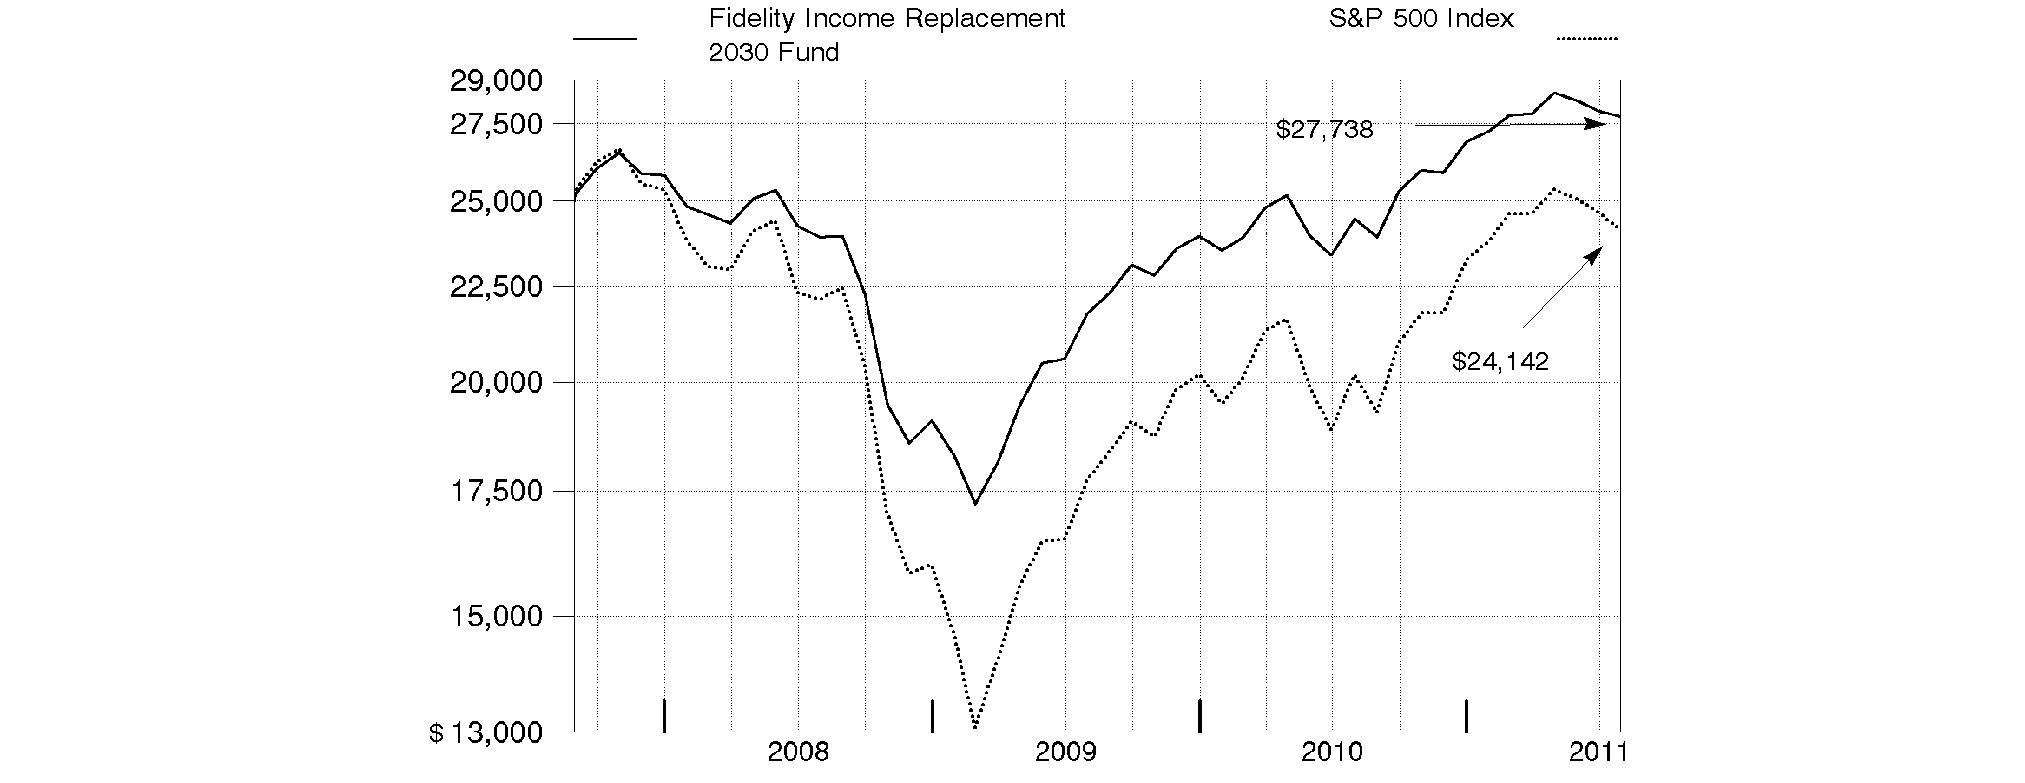
Annual Report
Fidelity Income Replacement 2032 FundSM
Performance: The Bottom Line
Average annual total return reflects the change in the value of an investment, assuming reinvestment of the class' distributions from dividend income and capital gains (the profits earned upon the sale of securities that have grown in value, if any) and assuming a constant rate of performance each year. The $25,000 table and the fund's returns do not reflect the deduction of taxes that a shareholder would pay on fund distributions or the redemption of fund shares. During periods of reimbursement by Fidelity, a fund's total return will be greater than it would be had the reimbursement not occurred. How a fund did yesterday is no guarantee of how it will do tomorrow.
Average Annual Total Returns
Periods ended July 31, 2011 | Past 1
year | Life of
fund A |
Fidelity Income Replacement 2032 Fund | 13.68% | 2.59% |
A From August 30, 2007.
$25,000 Over Life of Fund
Let's say hypothetically that $25,000 was invested in Fidelity Income Replacement 2032 Fund, a class of the fund, on August 30, 2007, when the fund started. The chart shows how the value of your investment would have changed, and also shows how the S&P 500 Index performed over the same period.
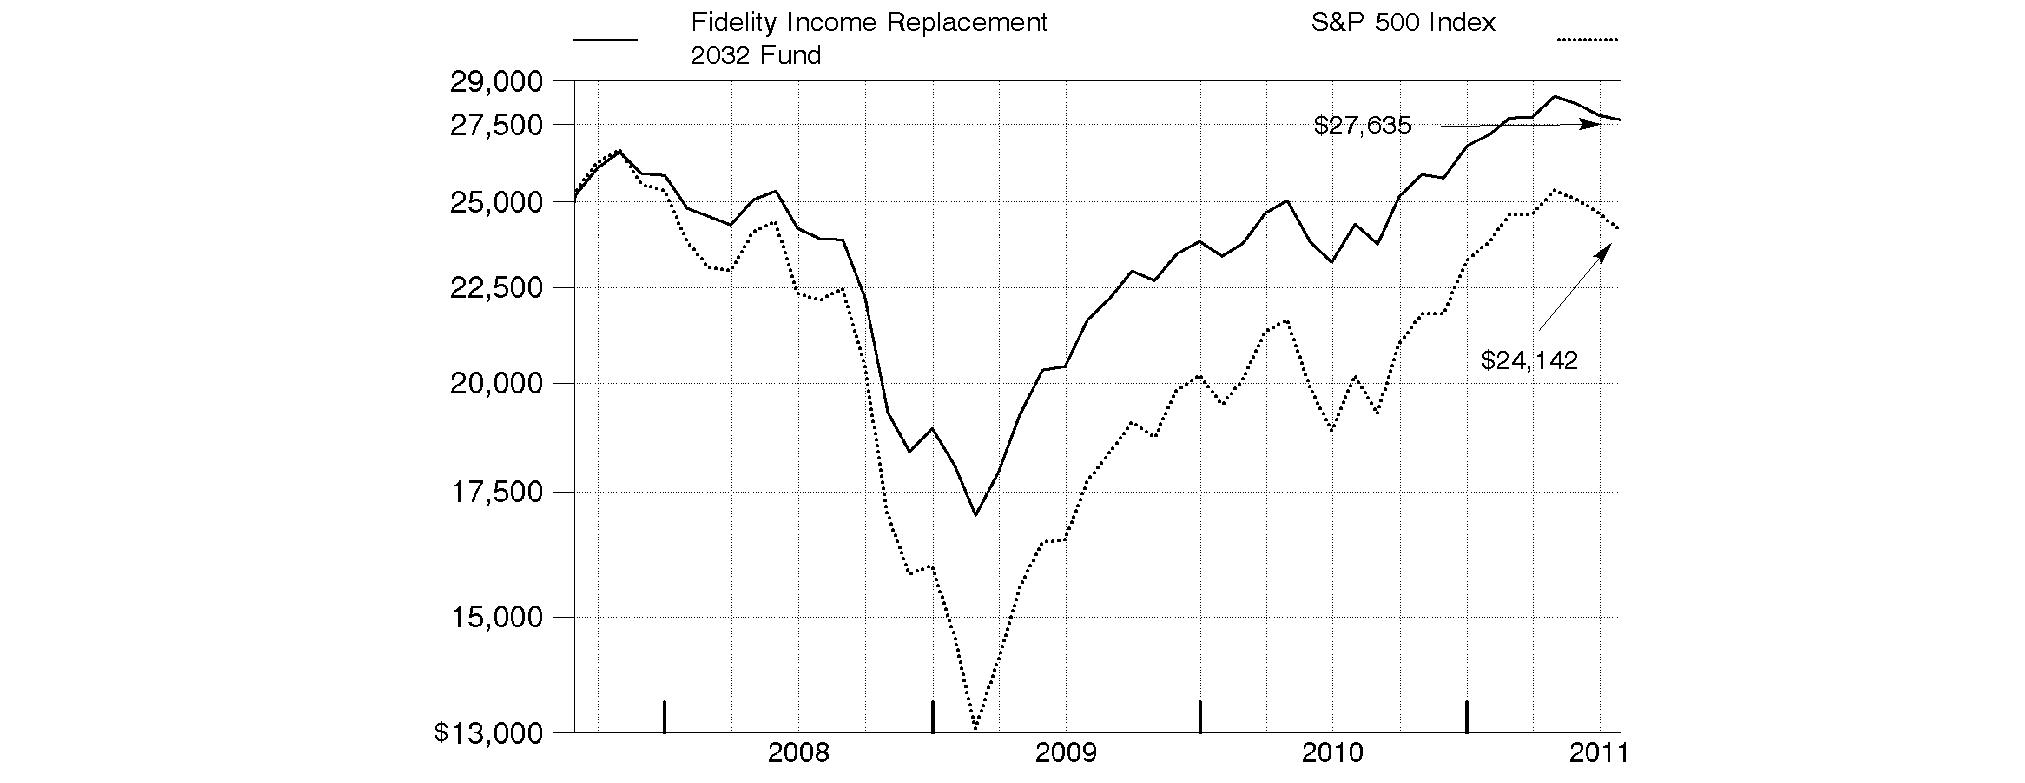
Annual Report
Fidelity Income Replacement 2034 FundSM
Performance: The Bottom Line
Average annual total return reflects the change in the value of an investment, assuming reinvestment of the class' distributions from dividend income and capital gains (the profits earned upon the sale of securities that have grown in value, if any) and assuming a constant rate of performance each year. The $25,000 table and the fund's returns do not reflect the deduction of taxes that a shareholder would pay on fund distributions or the redemption of fund shares. During periods of reimbursement by Fidelity, a fund's total return will be greater than it would be had the reimbursement not occurred. How a fund did yesterday is no guarantee of how it will do tomorrow.
Average Annual Total Returns
Periods ended July 31, 2011 | Past 1
year | Life of
fund A |
Fidelity Income Replacement 2034 Fund | 13.97% | 2.44% |
A From August 30, 2007.
$25,000 Over Life of Fund
Let's say hypothetically that $25,000 was invested in Fidelity Income Replacement 2034 Fund, a class of the fund, on August 30, 2007, when the fund started. The chart shows how the value of your investment would have changed, and also shows how the S&P 500 Index performed over the same period.
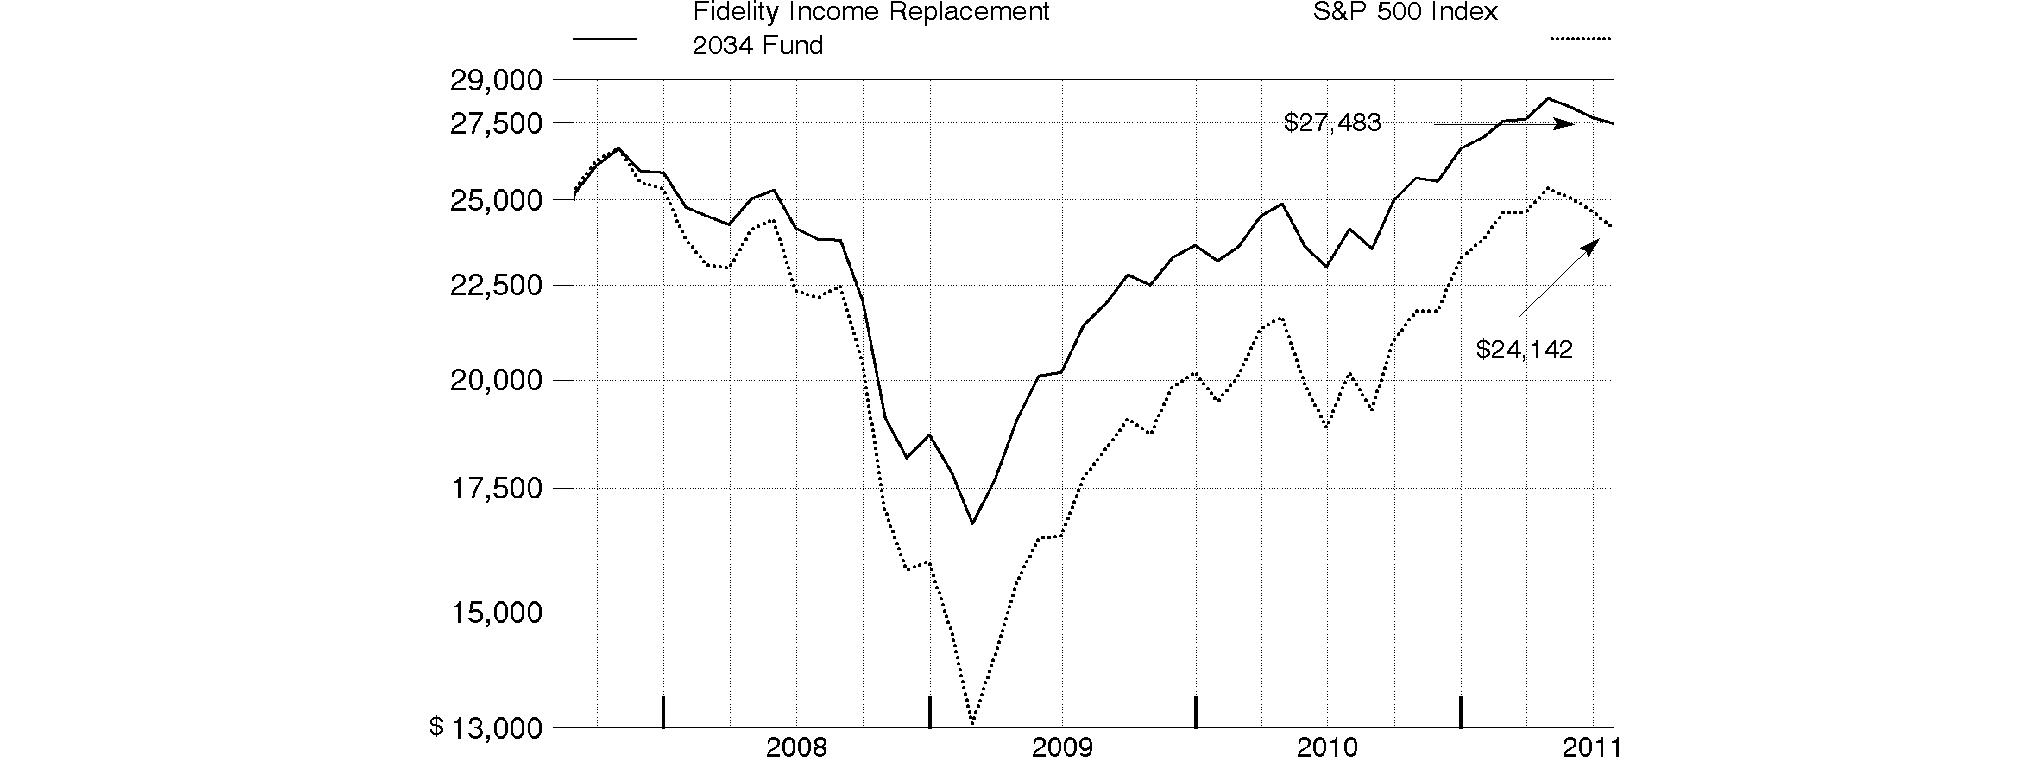
Annual Report
Fidelity Income Replacement 2036 FundSM
Performance: The Bottom Line
Average annual total return reflects the change in the value of an investment, assuming reinvestment of the class' distributions from dividend income and capital gains (the profits earned upon the sale of securities that have grown in value, if any) and assuming a constant rate of performance each year. The $25,000 table and the fund's returns do not reflect the deduction of taxes that a shareholder would pay on fund distributions or the redemption of fund shares. During periods of reimbursement by Fidelity, a fund's total return will be greater than it would be had the reimbursement not occurred. How a fund did yesterday is no guarantee of how it will do tomorrow.
Average Annual Total Returns
Periods ended July 31, 2011 | Past 1
year | Life of
fund A |
Fidelity Income Replacement 2036 Fund | 14.32% | 2.38% |
A From August 30, 2007.
$25,000 Over Life of Fund
Let's say hypothetically that $25,000 was invested in Fidelity Income Replacement 2036 Fund, a class of the fund, on August 30, 2007, when the fund started. The chart shows how the value of your investment would have changed, and also shows how the S&P 500 Index performed over the same period.

Annual Report
Fidelity Income Replacement 2038 FundSM
Performance: The Bottom Line
Average annual total return reflects the change in the value of an investment, assuming reinvestment of the class' distributions from dividend income and capital gains (the profits earned upon the sale of securities that have grown in value, if any) and assuming a constant rate of performance each year. The $25,000 table and the fund's returns do not reflect the deduction of taxes that a shareholder would pay on fund distributions or the redemption of fund shares. During periods of reimbursement by Fidelity, a fund's total return will be greater than it would be had the reimbursement not occurred. How a fund did yesterday is no guarantee of how it will do tomorrow.
Average Annual Total Returns
Periods ended July 31, 2011 | Past 1
year | Life of
fund A |
Fidelity Income Replacement 2038 Fund | 14.74% | 1.48% |
A From December 31, 2007.
$25,000 Over Life of Fund
Let's say hypothetically that $25,000 was invested in Fidelity Income Replacement 2038 Fund, a class of the fund, on December 31, 2007, when the fund started. The chart shows how the value of your investment would have changed, and also shows how the S&P 500 Index performed over the same period.
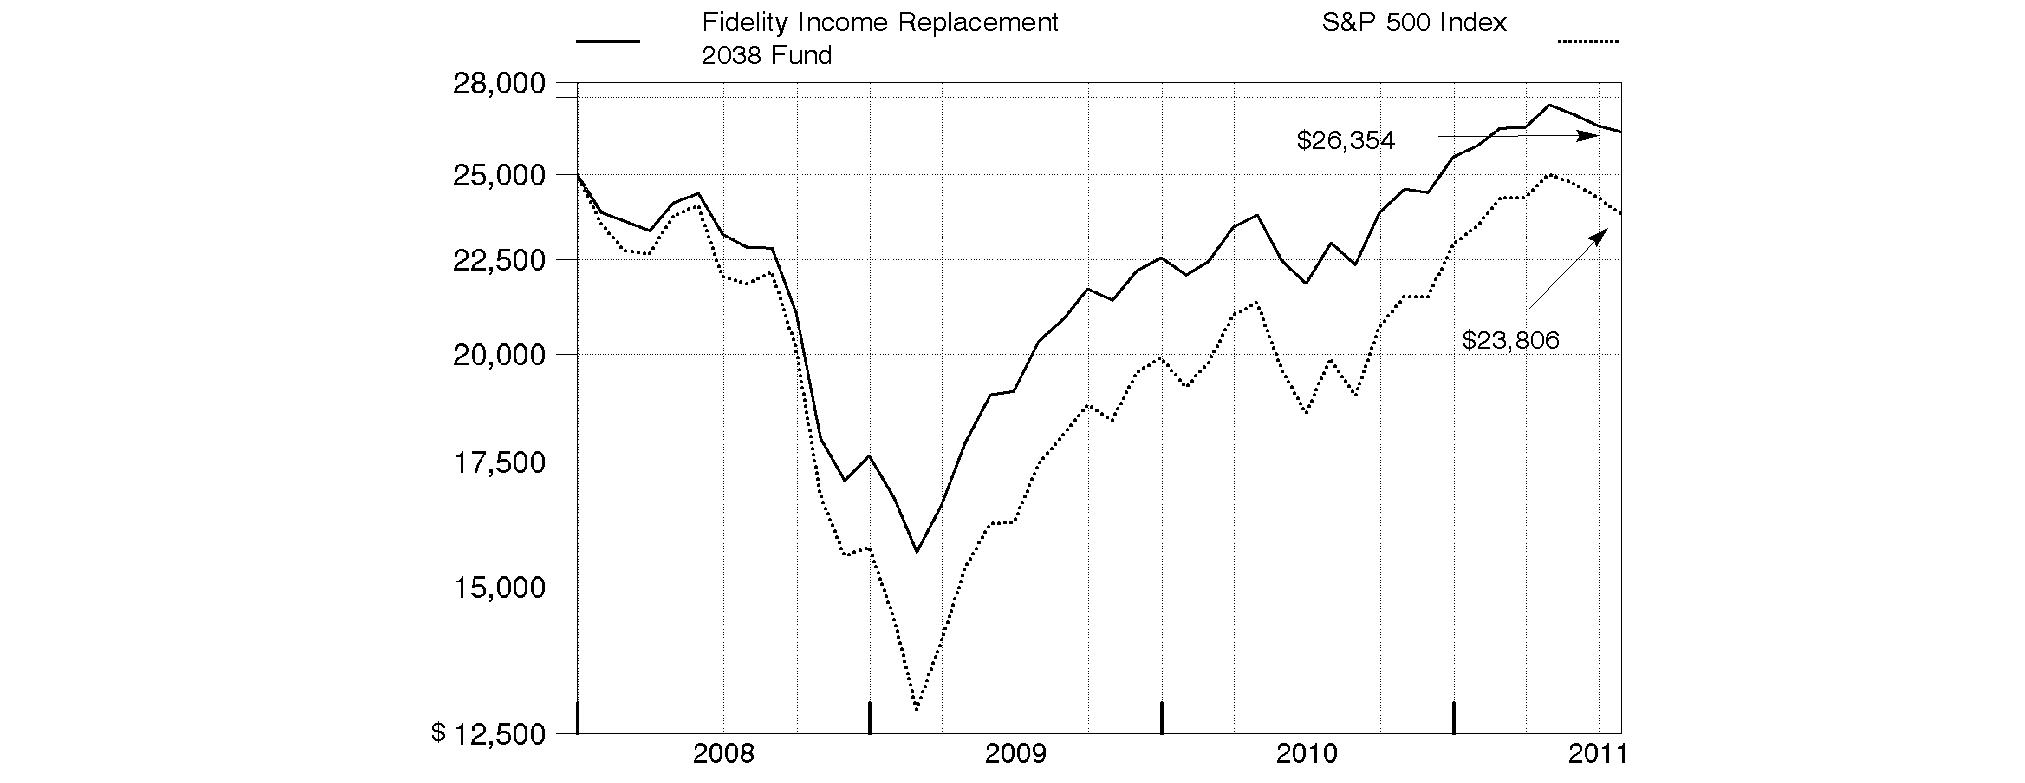
Annual Report
Fidelity Income Replacement 2040 FundSM
Performance: The Bottom Line
Average annual total return reflects the change in the value of an investment, assuming reinvestment of the class' distributions from dividend income and capital gains (the profits earned upon the sale of securities that have grown in value, if any) and assuming a constant rate of performance each year. The $25,000 table and the fund's returns do not reflect the deduction of taxes that a shareholder would pay on fund distributions or the redemption of fund shares. During periods of reimbursement by Fidelity, a fund's total return will be greater than it would be had the reimbursement not occurred. How a fund did yesterday is no guarantee of how it will do tomorrow.
Average Annual Total Returns
Periods ended July 31, 2011 | Past 1
year | Life of
fundA |
Fidelity Income Replacement 2040 Fund | 15.21% | 1.61% |
A From December 31, 2007.
$25,000 Over Life of Fund
Let's say hypothetically that $25,000 was invested in Fidelity Income Replacement 2040 Fund, a class of the fund, on December 31, 2007, when the fund started. The chart shows how the value of your investment would have changed, and also shows how the S&P 500 Index performed over the same period.
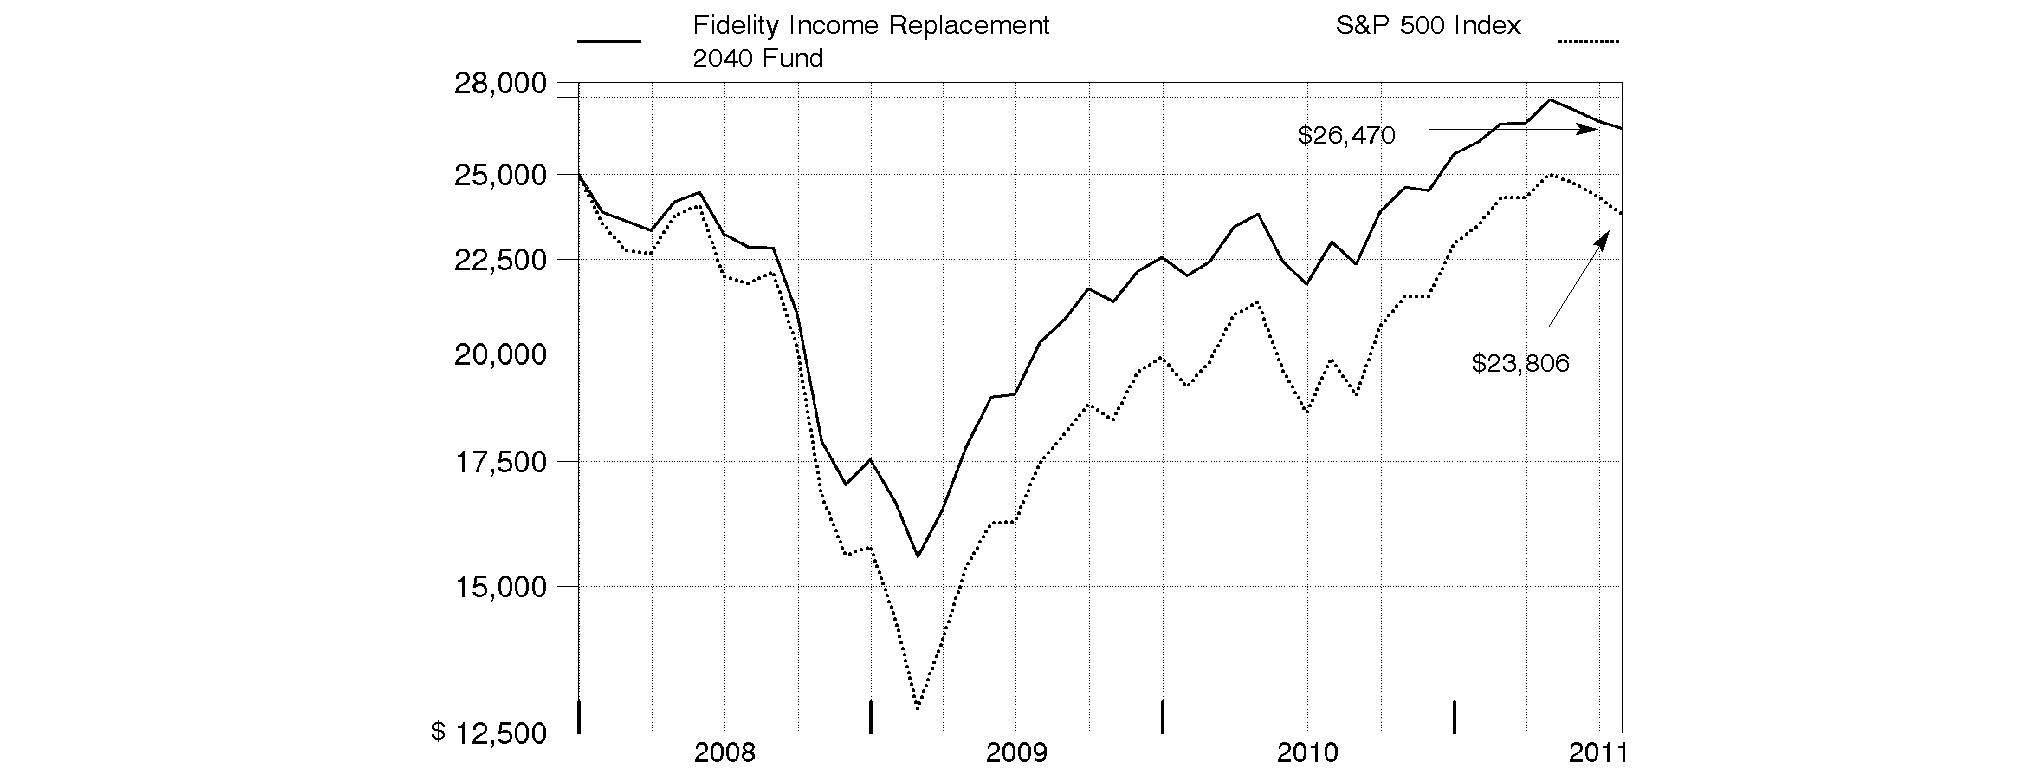
Annual Report
Fidelity Income Replacement 2042 FundSM
Performance: The Bottom Line
Average annual total return reflects the change in the value of an investment, assuming reinvestment of the class' distributions from dividend income and capital gains (the profits earned upon the sale of securities that have grown in value, if any) and assuming a constant rate of performance each year. The $25,000 table and the fund's returns do not reflect the deduction of taxes that a shareholder would pay on fund distributions or the redemption of fund shares. During periods of reimbursement by Fidelity, a fund's total return will be greater than it would be had the reimbursement not occurred. How a fund did yesterday is no guarantee of how it will do tomorrow.
Average Annual Total Returns
Periods ended July 31, 2011 | Past 1
year | Life of
fund A |
Fidelity Income Replacement 2042 Fund | 15.42% | 1.64% |
A From December 31, 2007.
$25,000 Over Life of Fund
Let's say hypothetically that $25,000 was invested in Fidelity Income Replacement 2042 Fund, a class of the fund, on December 31, 2007, when the fund started. The chart shows how the value of your investment would have changed, and also shows how the S&P 500 Index performed over the same period.
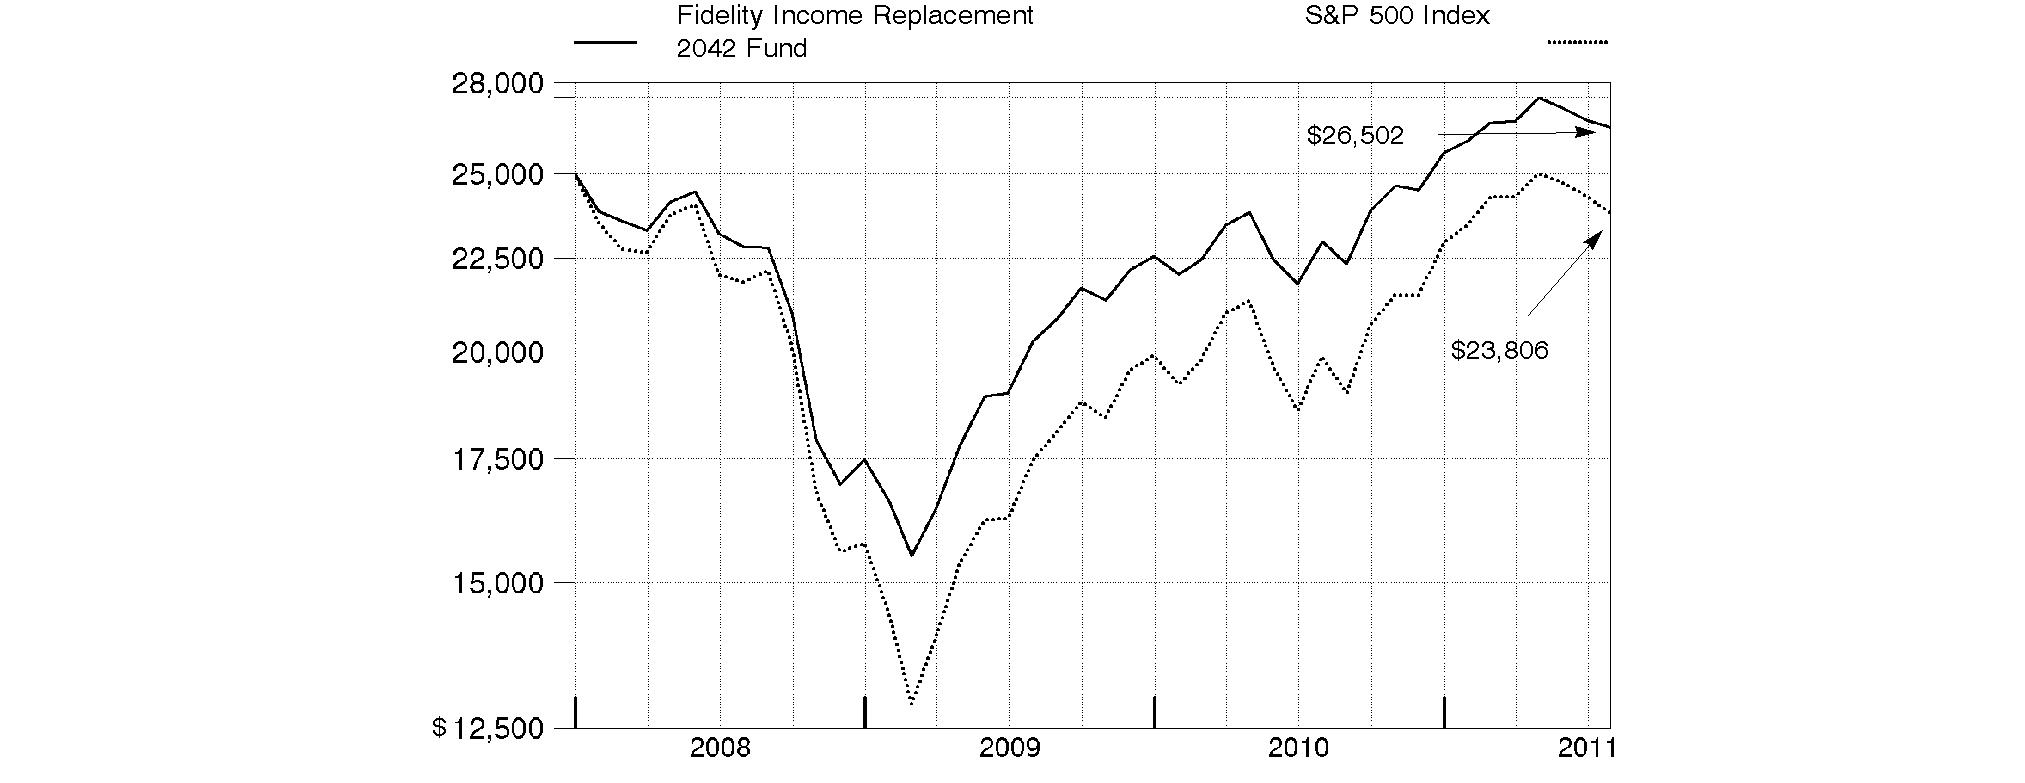
Annual Report
Market Recap: U.S. stocks registered solid double-digit gains for the 12 months ending July 31, 2011, extending a rally that began more than two years earlier. Despite a rough start in August 2010, markets turned positive in September, as increased demand for capital goods and other upbeat indicators trumped investor worry about a U.S. recessionary relapse. The broad market, as measured by the S&P 500® Index, rose 9% that month, its biggest September gain in 71 years. Seven more monthly advances followed, fueled by encouraging corporate earnings and economic activity. However, volatility picked up in the period's latter months, as markets reacted to continued high U.S. unemployment, nagging debt troubles in Europe and looming legislative battles over the federal debt ceiling. May unemployment rose above 9% for the first time in 2011, contributing to a traditional "June swoon" for stocks. Market uncertainty lingered in July, when the S&P 500® posted its second-biggest monthly loss of the period. For the full year, the S&P 500® climbed 19.65%, while the blue-chip-laden Dow Jones Industrial AverageSM rose a comparable 19.09% and the technology-heavy Nasdaq Composite® Index gained 23.40%. On the capitalization spectrum, stocks of mid-cap companies fared best, with the Russell Midcap® Index rising 24.51% and the small-cap Russell 2000® Index adding 23.92%. Strong returns for stocks brought about more-tempered gains for fixed-income markets, however, as investor demand for the perceived safety of bonds fluctuated throughout the year. The Barclays Capital® U.S. Aggregate Bond Index - a broad measure of the investment-grade debt universe - rose 4.44%, lifted by second-half volatility within the equity markets. Higher-risk bond categories fared best, with The BofA Merrill LynchSM US High Yield Constrained Index returning 12.85% for the year. Despite improving in the second half of the period, bonds backed by the U.S. government were still among the weakest performers for the year, with the Barclays Capital® U.S. Treasury Bond Index adding only 3.39%. Faring worse were short-term assets, as gauged by the 0.16% increase in the Barclays Capital U.S. 3 Month Treasury Bellwether Index.
Comments from Andrew Dierdorf, Co-Portfolio Manager of Fidelity Income Replacement FundsSM, and Christopher Sharpe, who became Co-Portfolio Manager on June 21, 2011: For the year, each of the Funds' Retail Class shares posted a positive return, ranging from roughly 9% for the shortest-dated Fund - Fidelity Income Replacement 2016 FundSM - to roughly 15% for Fidelity Income Replacement 2042 FundSM, which has the longest time horizon. For the one-year period, each of the Funds' three asset classes - equities, bonds and short-term instruments - delivered a gain. All of the underlying funds posted positive absolute returns, with equity funds providing the strongest results. On a relative basis, 10 of the 15 underlying funds outperformed their respective asset class benchmarks. In aggregate, the Funds' equity asset class fell just short of the broad U.S. equity market, as measured by the S&P 500® Index, which rose 19.65%. The most notable relative detractors were Fidelity® Disciplined Equity Fund and Fidelity® Equity-Income Fund, which underperformed despite returning roughly 15%. However, outperformance from two of the Funds' largest equity holdings during the period - Fidelity Large Cap Core Enhanced Index Fund and Fidelity Series Broad Market Opportunities Fund - helped buoy results. The Funds' bond asset class - which included a diversified mix of underlying bond funds - handily exceeded its benchmark index, the Barclays Capital® U.S. Aggregate Bond Index, which gained 4.44%. Fidelity Total Bond Fund, which serves as the Funds' largest debt holding, anchored the Funds' performance with a roughly 6% return for the one-year time frame. Meanwhile, Fidelity Capital & Income Fund, which rose 16%, boosted the overall performance of the bond asset class. This fund primarily invested in high-yield securities, which produced solid gains during the first half of the reporting period, and was the best absolute performer in the bond category. Fidelity Strategic Real Return Fund also played an important role in the Funds. This underlying fund invests in real-estate-related securities and other inflation-sensitive asset types, which benefited during the period from investors' concern about an uptick in inflation.
Note to shareholders: On August 8, 2011, there were two changes to the underlying fund lineup. Fidelity Blue Chip Growth Fund was added, and Fidelity Large Cap Core Enhanced Index Fund was removed.
The views expressed above reflect those of the portfolio manager(s) only through the end of the period as stated on the cover of this report and do not necessarily represent the views of Fidelity or any other person in the Fidelity organization. Any such views are subject to change at any time based upon market or other conditions and Fidelity disclaims any responsibility to update such views. These views may not be relied on as investment advice and, because investment decisions for a Fidelity fund are based on numerous factors, may not be relied on as an indication of trading intent on behalf of any Fidelity fund.
Annual Report
As a shareholder of a Fund, you incur two types of costs: (1) transaction costs, including sales charges (loads) on purchase payments or redemption proceeds, and (2) ongoing costs, including distribution and/or service (12b-1) fees and other Fund expenses. This Example is intended to help you understand your ongoing costs (in dollars) of investing in the Funds and to compare these costs with the ongoing costs of investing in other mutual funds.
The Example is based on an investment of $1,000 invested at the beginning of the period and held for the entire period (February 1, 2011 to July 31, 2011).
Actual Expenses
The first line of the accompanying table for each class of each fund provides information about actual account values and actual expenses. You may use the information in this line, together with the amount you invested, to estimate the expenses that you paid over the period. Simply divide your account value by $1,000.00 (for example, an $8,600 account value divided by $1,000.00 = 8.6), then multiply the result by the number in the first line for a class of the fund under the heading entitled "Expenses Paid During Period" to estimate the expenses you paid on your account during this period. In addition, each Fund, as a shareholder in underlying Fidelity Funds, will indirectly bear its pro-rata share of the fees and expenses incurred by the underlying Fidelity Funds. These fees and expenses are not included in each Fund's annualized expense ratio used to calculate the expense estimates in the table below.
Hypothetical Example for Comparison Purposes
The second line of the accompanying table for each class of each fund provides information about hypothetical account values and hypothetical expenses based on a Class' actual expense ratio and an assumed rate of return of 5% per year before expenses, which is not the Class' actual return. The hypothetical account values and expenses may not be used to estimate the actual ending account balance or expenses you paid for the period. You may use this information to compare the ongoing costs of investing in the Fund and other funds. To do so, compare this 5% hypothetical example with the 5% hypothetical examples that appear in the shareholder reports of the other funds. In addition, each Fund, as a shareholder in underlying Fidelity Funds, will indirectly bear its pro-rata share of the fees and expenses incurred by the underlying Fidelity Funds. These fees and expenses are not included in each Fund's annualized expense ratio used to calculate the expense estimates in the table below.
Please note that the expenses shown in the table are meant to highlight your ongoing costs only and do not reflect any transaction costs. Therefore, the second line of the table is useful in comparing ongoing costs only, and will not help you determine the relative total costs of owning different funds. In addition, if these transactional costs were included, your costs would have been higher.
| Annualized
Expense Ratio | Beginning
Account Value
February 1, 2011 | Ending
Account Value
July 31, 2011 | Expenses Paid
During Period*
February 1, 2011
to July 31, 2011 |
Fidelity Income Replacement 2016 Fund | | | | |
Class A | .25% | | | |
Actual | | $ 1,000.00 | $ 1,020.40 | $ 1.25 |
HypotheticalA | | $ 1,000.00 | $ 1,023.55 | $ 1.25 |
Class T | .50% | | | |
Actual | | $ 1,000.00 | $ 1,018.80 | $ 2.50 |
HypotheticalA | | $ 1,000.00 | $ 1,022.32 | $ 2.51 |
Class C | 1.00% | | | |
Actual | | $ 1,000.00 | $ 1,016.50 | $ 5.00 |
HypotheticalA | | $ 1,000.00 | $ 1,019.84 | $ 5.01 |
Income Replacement 2016 | .00% | | | |
Actual | | $ 1,000.00 | $ 1,021.70 | $ .00 |
HypotheticalA | | $ 1,000.00 | $ 1,024.79 | $ .00 |
Institutional Class | .00% | | | |
Actual | | $ 1,000.00 | $ 1,021.70 | $ .00 |
HypotheticalA | | $ 1,000.00 | $ 1,024.79 | $ .00 |
Fidelity Income Replacement 2018 Fund | | | | |
Class A | .25% | | | |
Actual | | $ 1,000.00 | $ 1,019.80 | $ 1.25 |
HypotheticalA | | $ 1,000.00 | $ 1,023.55 | $ 1.25 |
Class T | .50% | | | |
Actual | | $ 1,000.00 | $ 1,018.50 | $ 2.50 |
HypotheticalA | | $ 1,000.00 | $ 1,022.32 | $ 2.51 |
| Annualized
Expense Ratio | Beginning
Account Value
February 1, 2011 | Ending
Account Value
July 31, 2011 | Expenses Paid
During Period*
February 1, 2011
to July 31, 2011 |
Class C | 1.00% | | | |
Actual | | $ 1,000.00 | $ 1,016.00 | $ 5.00 |
HypotheticalA | | $ 1,000.00 | $ 1,019.84 | $ 5.01 |
Income Replacement 2018 | .00% | | | |
Actual | | $ 1,000.00 | $ 1,021.10 | $ .00 |
HypotheticalA | | $ 1,000.00 | $ 1,024.79 | $ .00 |
Institutional Class | .00% | | | |
Actual | | $ 1,000.00 | $ 1,021.10 | $ .00 |
HypotheticalA | | $ 1,000.00 | $ 1,024.79 | $ .00 |
Fidelity Income Replacement 2020 Fund | | | | |
Class A | .25% | | | |
Actual | | $ 1,000.00 | $ 1,018.90 | $ 1.25 |
HypotheticalA | | $ 1,000.00 | $ 1,023.55 | $ 1.25 |
Class T | .50% | | | |
Actual | | $ 1,000.00 | $ 1,017.80 | $ 2.50 |
HypotheticalA | | $ 1,000.00 | $ 1,022.32 | $ 2.51 |
Class C | 1.00% | | | |
Actual | | $ 1,000.00 | $ 1,015.20 | $ 5.00 |
HypotheticalA | | $ 1,000.00 | $ 1,019.84 | $ 5.01 |
Income Replacement 2020 | .00% | | | |
Actual | | $ 1,000.00 | $ 1,020.40 | $ .00 |
HypotheticalA | | $ 1,000.00 | $ 1,024.79 | $ .00 |
Institutional Class | .00% | | | |
Actual | | $ 1,000.00 | $ 1,020.40 | $ .00 |
HypotheticalA | | $ 1,000.00 | $ 1,024.79 | $ .00 |
Fidelity Income Replacement 2022 Fund | | | | |
Class A | .25% | | | |
Actual | | $ 1,000.00 | $ 1,018.40 | $ 1.25 |
HypotheticalA | | $ 1,000.00 | $ 1,023.55 | $ 1.25 |
Class T | .50% | | | |
Actual | | $ 1,000.00 | $ 1,017.20 | $ 2.50 |
HypotheticalA | | $ 1,000.00 | $ 1,022.32 | $ 2.51 |
Class C | 1.00% | | | |
Actual | | $ 1,000.00 | $ 1,014.70 | $ 5.00 |
HypotheticalA | | $ 1,000.00 | $ 1,019.84 | $ 5.01 |
Income Replacement 2022 | .00% | | | |
Actual | | $ 1,000.00 | $ 1,019.70 | $ .00 |
HypotheticalA | | $ 1,000.00 | $ 1,024.79 | $ .00 |
Institutional Class | .00% | | | |
Actual | | $ 1,000.00 | $ 1,019.70 | $ .00 |
HypotheticalA | | $ 1,000.00 | $ 1,024.79 | $ .00 |
Fidelity Income Replacement 2024 Fund | | | | |
Class A | .25% | | | |
Actual | | $ 1,000.00 | $ 1,017.80 | $ 1.25 |
HypotheticalA | | $ 1,000.00 | $ 1,023.55 | $ 1.25 |
Class T | .50% | | | |
Actual | | $ 1,000.00 | $ 1,016.80 | $ 2.50 |
HypotheticalA | | $ 1,000.00 | $ 1,022.32 | $ 2.51 |
| Annualized
Expense Ratio | Beginning
Account Value
February 1, 2011 | Ending
Account Value
July 31, 2011 | Expenses Paid
During Period*
February 1, 2011
to July 31, 2011 |
Class C | 1.00% | | | |
Actual | | $ 1,000.00 | $ 1,014.30 | $ 4.99 |
HypotheticalA | | $ 1,000.00 | $ 1,019.84 | $ 5.01 |
Income Replacement 2024 | .00% | | | |
Actual | | $ 1,000.00 | $ 1,019.40 | $ .00 |
HypotheticalA | | $ 1,000.00 | $ 1,024.79 | $ .00 |
Institutional Class | .00% | | | |
Actual | | $ 1,000.00 | $ 1,019.40 | $ .00 |
HypotheticalA | | $ 1,000.00 | $ 1,024.79 | $ .00 |
Fidelity Income Replacement 2026 Fund | | | | |
Class A | .25% | | | |
Actual | | $ 1,000.00 | $ 1,017.70 | $ 1.25 |
HypotheticalA | | $ 1,000.00 | $ 1,023.55 | $ 1.25 |
Class T | .50% | | | |
Actual | | $ 1,000.00 | $ 1,016.50 | $ 2.50 |
HypotheticalA | | $ 1,000.00 | $ 1,022.32 | $ 2.51 |
Class C | 1.00% | | | |
Actual | | $ 1,000.00 | $ 1,013.90 | $ 4.99 |
HypotheticalA | | $ 1,000.00 | $ 1,019.84 | $ 5.01 |
Income Replacement 2026 | .00% | | | |
Actual | | $ 1,000.00 | $ 1,018.80 | $ .00 |
HypotheticalA | | $ 1,000.00 | $ 1,024.79 | $ .00 |
Institutional Class | .00% | | | |
Actual | | $ 1,000.00 | $ 1,019.00 | $ .00 |
HypotheticalA | | $ 1,000.00 | $ 1,024.79 | $ .00 |
Fidelity Income Replacement 2028 Fund | | | | |
Class A | .25% | | | |
Actual | | $ 1,000.00 | $ 1,017.30 | $ 1.25 |
HypotheticalA | | $ 1,000.00 | $ 1,023.55 | $ 1.25 |
Class T | .50% | | | |
Actual | | $ 1,000.00 | $ 1,015.90 | $ 2.50 |
HypotheticalA | | $ 1,000.00 | $ 1,022.32 | $ 2.51 |
Class C | 1.00% | | | |
Actual | | $ 1,000.00 | $ 1,013.70 | $ 4.99 |
HypotheticalA | | $ 1,000.00 | $ 1,019.84 | $ 5.01 |
Income Replacement 2028 | .00% | | | |
Actual | | $ 1,000.00 | $ 1,018.50 | $ .00 |
HypotheticalA | | $ 1,000.00 | $ 1,024.79 | $ .00 |
Institutional Class | .00% | | | |
Actual | | $ 1,000.00 | $ 1,018.50 | $ .00 |
HypotheticalA | | $ 1,000.00 | $ 1,024.79 | $ .00 |
Fidelity Income Replacement 2030 Fund | | | | |
Class A | .25% | | | |
Actual | | $ 1,000.00 | $ 1,017.10 | $ 1.25 |
HypotheticalA | | $ 1,000.00 | $ 1,023.55 | $ 1.25 |
Class T | .50% | | | |
Actual | | $ 1,000.00 | $ 1,015.80 | $ 2.50 |
HypotheticalA | | $ 1,000.00 | $ 1,022.32 | $ 2.51 |
| Annualized
Expense Ratio | Beginning
Account Value
February 1, 2011 | Ending
Account Value
July 31, 2011 | Expenses Paid
During Period*
February 1, 2011
to July 31, 2011 |
Class C | 1.00% | | | |
Actual | | $ 1,000.00 | $ 1,013.30 | $ 4.99 |
HypotheticalA | | $ 1,000.00 | $ 1,019.84 | $ 5.01 |
Income Replacement 2030 | .00% | | | |
Actual | | $ 1,000.00 | $ 1,018.30 | $ .00 |
HypotheticalA | | $ 1,000.00 | $ 1,024.79 | $ .00 |
Institutional Class | .00% | | | |
Actual | | $ 1,000.00 | $ 1,018.30 | $ .00 |
HypotheticalA | | $ 1,000.00 | $ 1,024.79 | $ .00 |
Fidelity Income Replacement 2032 Fund | | | | |
Class A | .25% | | | |
Actual | | $ 1,000.00 | $ 1,016.80 | $ 1.25 |
HypotheticalA | | $ 1,000.00 | $ 1,023.55 | $ 1.25 |
Class T | .50% | | | |
Actual | | $ 1,000.00 | $ 1,015.80 | $ 2.50 |
HypotheticalA | | $ 1,000.00 | $ 1,022.32 | $ 2.51 |
Class C | 1.00% | | | |
Actual | | $ 1,000.00 | $ 1,013.00 | $ 4.99 |
HypotheticalA | | $ 1,000.00 | $ 1,019.84 | $ 5.01 |
Income Replacement 2032 | .00% | | | |
Actual | | $ 1,000.00 | $ 1,018.10 | $ .00 |
HypotheticalA | | $ 1,000.00 | $ 1,024.79 | $ .00 |
Institutional Class | .00% | | | |
Actual | | $ 1,000.00 | $ 1,018.10 | $ .00 |
HypotheticalA | | $ 1,000.00 | $ 1,024.79 | $ .00 |
Fidelity Income Replacement 2034 Fund | | | | |
Class A | .25% | | | |
Actual | | $ 1,000.00 | $ 1,016.80 | $ 1.25 |
HypotheticalA | | $ 1,000.00 | $ 1,023.55 | $ 1.25 |
Class T | .50% | | | |
Actual | | $ 1,000.00 | $ 1,015.90 | $ 2.50 |
HypotheticalA | | $ 1,000.00 | $ 1,022.32 | $ 2.51 |
Class C | 1.00% | | | |
Actual | | $ 1,000.00 | $ 1,013.10 | $ 4.99 |
HypotheticalA | | $ 1,000.00 | $ 1,019.84 | $ 5.01 |
Income Replacement 2034 | .00% | | | |
Actual | | $ 1,000.00 | $ 1,018.20 | $ .00 |
HypotheticalA | | $ 1,000.00 | $ 1,024.79 | $ .00 |
Institutional Class | .00% | | | |
Actual | | $ 1,000.00 | $ 1,018.00 | $ .00 |
HypotheticalA | | $ 1,000.00 | $ 1,024.79 | $ .00 |
Fidelity Income Replacement 2036 Fund | | | | |
Class A | .25% | | | |
Actual | | $ 1,000.00 | $ 1,017.00 | $ 1.25 |
HypotheticalA | | $ 1,000.00 | $ 1,023.55 | $ 1.25 |
Class T | .50% | | | |
Actual | | $ 1,000.00 | $ 1,015.50 | $ 2.50 |
HypotheticalA | | $ 1,000.00 | $ 1,022.32 | $ 2.51 |
| Annualized
Expense Ratio | Beginning
Account Value
February 1, 2011 | Ending
Account Value
July 31, 2011 | Expenses Paid
During Period*
February 1, 2011
to July 31, 2011 |
Class C | 1.00% | | | |
Actual | | $ 1,000.00 | $ 1,012.90 | $ 4.99 |
HypotheticalA | | $ 1,000.00 | $ 1,019.84 | $ 5.01 |
Income Replacement 2036 | .00% | | | |
Actual | | $ 1,000.00 | $ 1,018.30 | $ .00 |
HypotheticalA | | $ 1,000.00 | $ 1,024.79 | $ .00 |
Institutional Class | .00% | | | |
Actual | | $ 1,000.00 | $ 1,018.10 | $ .00 |
HypotheticalA | | $ 1,000.00 | $ 1,024.79 | $ .00 |
Fidelity Income Replacement 2038 Fund | | | | |
Class A | .25% | | | |
Actual | | $ 1,000.00 | $ 1,016.70 | $ 1.25 |
HypotheticalA | | $ 1,000.00 | $ 1,023.55 | $ 1.25 |
Class T | .50% | | | |
Actual | | $ 1,000.00 | $ 1,015.60 | $ 2.50 |
HypotheticalA | | $ 1,000.00 | $ 1,022.32 | $ 2.51 |
Class C | 1.00% | | | |
Actual | | $ 1,000.00 | $ 1,012.90 | $ 4.99 |
HypotheticalA | | $ 1,000.00 | $ 1,019.84 | $ 5.01 |
Income Replacement 2038 | .00% | | | |
Actual | | $ 1,000.00 | $ 1,017.90 | $ .00 |
HypotheticalA | | $ 1,000.00 | $ 1,024.79 | $ .00 |
Institutional Class | .00% | | | |
Actual | | $ 1,000.00 | $ 1,018.20 | $ .00 |
HypotheticalA | | $ 1,000.00 | $ 1,024.79 | $ .00 |
Fidelity Income Replacement 2040 Fund | | | | |
Class A | .25% | | | |
Actual | | $ 1,000.00 | $ 1,017.00 | $ 1.25 |
HypotheticalA | | $ 1,000.00 | $ 1,023.55 | $ 1.25 |
Class T | .50% | | | |
Actual | | $ 1,000.00 | $ 1,015.80 | $ 2.50 |
HypotheticalA | | $ 1,000.00 | $ 1,022.32 | $ 2.51 |
Class C | 1.00% | | | |
Actual | | $ 1,000.00 | $ 1,013.40 | $ 4.99 |
HypotheticalA | | $ 1,000.00 | $ 1,019.84 | $ 5.01 |
Income Replacement 2040 | .00% | | | |
Actual | | $ 1,000.00 | $ 1,018.10 | $ .00 |
HypotheticalA | | $ 1,000.00 | $ 1,024.79 | $ .00 |
Institutional Class | .00% | | | |
Actual | | $ 1,000.00 | $ 1,018.30 | $ .00 |
HypotheticalA | | $ 1,000.00 | $ 1,024.79 | $ .00 |
Fidelity Income Replacement 2042 Fund | | | | |
Class A | .25% | | | |
Actual | | $ 1,000.00 | $ 1,016.90 | $ 1.25 |
HypotheticalA | | $ 1,000.00 | $ 1,023.55 | $ 1.25 |
Class T | .50% | | | |
Actual | | $ 1,000.00 | $ 1,015.50 | $ 2.50 |
HypotheticalA | | $ 1,000.00 | $ 1,022.32 | $ 2.51 |
| Annualized
Expense Ratio | Beginning
Account Value
February 1, 2011 | Ending
Account Value
July 31, 2011 | Expenses Paid
During Period*
February 1, 2011
to July 31, 2011 |
Class C | 1.00% | | | |
Actual | | $ 1,000.00 | $ 1,013.00 | $ 4.99 |
HypotheticalA | | $ 1,000.00 | $ 1,019.84 | $ 5.01 |
Income Replacement 2042 | .00% | | | |
Actual | | $ 1,000.00 | $ 1,018.20 | $ .00 |
HypotheticalA | | $ 1,000.00 | $ 1,024.79 | $ .00 |
Institutional Class | .00% | | | |
Actual | | $ 1,000.00 | $ 1,018.20 | $ .00 |
HypotheticalA | | $ 1,000.00 | $ 1,024.79 | $ .00 |
A 5% return per year before expenses
* Expenses are equal to each Class' annualized expense ratio, multiplied by the average account value over the period, multiplied by 181/365 (to reflect the one-half year period). The fees and expenses of the underlying Fidelity Funds in which the Fund invests are not included in the Fund's annualized expense ratio.
Annual Report
Fidelity Income Replacement 2016 Fund
Investment Changes (Unaudited)
Fund Holdings as of July 31, 2011 |
| % of fund's
net assets | % of fund's net assets
6 months ago |
Domestic Equity Funds | | |
Fidelity Advisor Mid Cap II Fund Institutional Class | 2.6 | 2.7 |
Fidelity Disciplined Equity Fund | 2.7 | 2.8 |
Fidelity Equity-Income Fund | 2.7 | 2.8 |
Fidelity Large Cap Core Enhanced Index Fund | 4.4 | 4.5 |
Fidelity Series 100 Index Fund | 3.3 | 3.4 |
Fidelity Series Broad Market Opportunities Fund | 4.3 | 4.5 |
Fidelity Series Small Cap Opportunities Fund | 1.7 | 1.8 |
| 21.7 | 22.5 |
International Equity Funds | | |
Fidelity Advisor International Discovery Fund Institutional Class | 1.3 | 1.8 |
Investment Grade Fixed-Income Funds | | |
Fidelity Government Income Fund | 8.4 | 8.5 |
Fidelity Strategic Real Return Fund | 8.3 | 8.5 |
Fidelity Total Bond Fund | 25.1 | 25.4 |
| 41.8 | 42.4 |
Short-Term Funds | | |
Fidelity Institutional Money Market Portfolio Institutional Class | 17.6 | 16.7 |
Fidelity Short-Term Bond Fund | 17.6 | 16.6 |
| 35.2 | 33.3 |
Net Other Assets (Liabilities)* | 0.0 | 0.0 |
| 100.0 | 100.0 |
* Amount represents less than 0.1% |
Asset Allocation (% of fund's net assets) |
Current |
 | Domestic Equity Funds | 21.7% | |
 | International Equity Funds | 1.3% | |
 | Investment Grade Fixed-Income Funds | 41.8% | |
 | Short-Term Funds | 35.2% | |

Six months ago |
| Domestic Equity Funds | 22.5% | |
| International Equity Funds | 1.8% | |
| Investment Grade Fixed-Income Funds | 42.4% | |
| Short-Term Funds | 33.3% | |

Expected |
| Domestic Equity Funds | 19.6% | |
| Investment Grade Fixed-Income Funds | 39.2% | |
| Short-Term Funds | 41.2% | |

The fund invests according to an asset allocation strategy that becomes increasingly conservative over time. The six months ago allocation is based on the fund's holdings as of January 31, 2011. The current allocation is based on the fund's holdings as of July 31, 2011. The expected allocation represents the fund's anticipated allocation at January 31, 2012. |
Annual Report
Fidelity Income Replacement 2016 Fund
Investments July 31, 2011
Showing Percentage of Net Assets
Equity Funds - 23.0% |
| Shares | | Value |
Domestic Equity Funds - 21.7% |
Fidelity Advisor Mid Cap II Fund Institutional Class (a) | 14,293 | | $ 259,125 |
Fidelity Disciplined Equity Fund | 11,630 | | 270,745 |
Fidelity Equity-Income Fund | 6,014 | | 266,787 |
Fidelity Large Cap Core Enhanced Index Fund | 49,020 | | 439,710 |
Fidelity Series 100 Index Fund | 36,581 | | 331,061 |
Fidelity Series Broad Market Opportunities Fund | 42,034 | | 432,954 |
Fidelity Series Small Cap Opportunities Fund | 15,316 | | 171,843 |
TOTAL DOMESTIC EQUITY FUNDS | | 2,172,225 |
International Equity Funds - 1.3% |
Fidelity Advisor International Discovery Fund Institutional Class | 3,909 | | 131,470 |
TOTAL EQUITY FUNDS (Cost $1,993,231) | 2,303,695 |
Fixed-Income Funds - 41.8% |
| | | |
Investment Grade Fixed-Income Funds - 41.8% |
Fidelity Government Income Fund | 78,455 | | 837,896 |
Fidelity Strategic Real Return Fund | 84,075 | | 835,706 |
Fidelity Total Bond Fund | 227,982 | | 2,510,085 |
TOTAL FIXED-INCOME FUNDS (Cost $3,886,859) | 4,183,687 |
Short-Term Funds - 35.2% |
| Shares | | Value |
Fidelity Institutional Money Market Portfolio Institutional Class | 1,755,301 | | $ 1,755,301 |
Fidelity Short-Term Bond Fund | 206,579 | | 1,764,185 |
TOTAL SHORT-TERM FUNDS (Cost $3,481,782) | 3,519,486 |
TOTAL INVESTMENT PORTFOLIO - 100.0% (Cost $9,361,872) | | 10,006,868 |
NET OTHER ASSETS (LIABILITIES) - 0.0% | | (4,805) |
NET ASSETS - 100% | $ 10,002,063 |
Legend |
(a) Non-income producing |
Other Information |
All investments are categorized as Level 1 under the Fair Value Hierarchy. The inputs or methodology used for valuing securities may not be an indication of the risk associated with investing in those securities. For more information on valuation inputs, please refer to the Security Valuation section in the accompanying Notes to Financial Statements. |
Income Tax Information |
At July 31, 2011, the Fund had a capital loss carryforward of approximately $373,492 of which $11,321, $234,074 and $128,097 will expire in fiscal 2017, 2018 and 2019, respectively. Capital loss carryforwards are only available to offset future capital gains of the Fund to the extent provided by regulations and may be limited. |
See accompanying notes which are an integral part of the financial statements.
Annual Report
Fidelity Income Replacement 2016 Fund
Statement of Assets and Liabilities
| July 31, 2011 |
| | |
Assets | | |
Investment in securities, at value (cost $9,361,872) - See accompanying schedule | | $ 10,006,868 |
Cash | | 11 |
Receivable for investments sold | | 14,782 |
Total assets | | 10,021,661 |
| | |
Liabilities | | |
Payable for investments purchased | $ 42 | |
Payable for fund shares redeemed | 18,009 | |
Distribution and service plan fees payable | 1,547 | |
Total liabilities | | 19,598 |
| | |
Net Assets | | $ 10,002,063 |
Net Assets consist of: | | |
Paid in capital | | $ 9,960,023 |
Undistributed net investment income | | 2,169 |
Accumulated undistributed net realized gain (loss) on investments | | (605,125) |
Net unrealized appreciation (depreciation) on investments | | 644,996 |
Net Assets | | $ 10,002,063 |
| | |
Calculation of Maximum Offering Price Class A:
Net Asset Value and redemption price per share ($1,798,102 ÷ 36,094.44 shares) | | $ 49.82 |
| | |
Maximum offering price per share (100/94.25 of $49.82) | | $ 52.86 |
| | |
Class T:
Net Asset Value and redemption price per share ($528,707 ÷ 10,613.41 shares) | | $ 49.81 |
| | |
Maximum offering price per share (100/96.50 of $49.81) | | $ 51.62 |
| | |
Class C:
Net Asset Value and offering price per share ($758,875 ÷ 15,230.25 shares)A | | $ 49.83 |
| | |
Income Replacement 2016:
Net Asset Value, offering price and redemption price per share ($6,872,705 ÷ 137,934.45 shares) | | $ 49.83 |
| | |
Institutional Class:
Net Asset Value, offering price and redemption price per share ($43,674 ÷ 876.50 shares) | | $ 49.83 |
A Redemption price per share is equal to net asset value less any applicable contingent deferred sales charge.
Statement of Operations
| Year ended July 31, 2011 |
| | |
Investment Income | | |
Income distributions from underlying funds | | $ 212,369 |
| | |
Expenses | | |
Distribution and service plan fees | $ 19,517 | |
Independent trustees' compensation | 40 | |
Total expenses before reductions | 19,557 | |
Expense reductions | (40) | 19,517 |
Net investment income (loss) | | 192,852 |
Realized and Unrealized Gain (Loss) Realized gain (loss) on sale of underlying fund shares | (129,144) | |
Capital gain distributions from underlying funds | 78,190 | |
Total net realized gain (loss) | | (50,954) |
Change in net unrealized appreciation (depreciation) on underlying funds | | 761,739 |
Net gain (loss) | | 710,785 |
Net increase (decrease) in net assets resulting from operations | | $ 903,637 |
See accompanying notes which are an integral part of the financial statements.
Annual Report
Statement of Changes in Net Assets
| Year ended
July 31, 2011 | Year ended
July 31, 2010 |
Increase (Decrease) in Net Assets | | |
Operations | | |
Net investment income (loss) | $ 192,852 | $ 190,860 |
Net realized gain (loss) | (50,954) | (128,722) |
Change in net unrealized appreciation (depreciation) | 761,739 | 877,831 |
Net increase (decrease) in net assets resulting from operations | 903,637 | 939,969 |
Distributions to shareholders from net investment income | (194,425) | (190,322) |
Distributions to shareholders from net realized gain | (58,747) | (25,833) |
Total distributions | (253,172) | (216,155) |
Share transactions - net increase (decrease) | (1,722,258) | 1,239,040 |
Total increase (decrease) in net assets | (1,071,793) | 1,962,854 |
| | |
Net Assets | | |
Beginning of period | 11,073,856 | 9,111,002 |
End of period (including undistributed net investment income of $2,169 and undistributed net investment income of $3,810, respectively) | $ 10,002,063 | $ 11,073,856 |
Financial Highlights - Class A
Years ended July 31, | 2011 | 2010 | 2009 | 2008G |
Selected Per-Share Data | | | | |
Net asset value, beginning of period | $ 47.04 | $ 43.62 | $ 47.76 | $ 50.00 |
Income from Investment Operations | | | | |
Net investment income (loss)E | .821 | .831 | 1.118 | 1.233 |
Net realized and unrealized gain (loss) | 3.054 | 3.539 | (3.686) | (2.204) |
Total from investment operations | 3.875 | 4.370 | (2.568) | (.971) |
Distributions from net investment income | (.834) | (.830) | (1.132) | (1.129) |
Distributions from net realized gain | (.261) | (.120) | (.440) | (.140) |
Total distributions | (1.095) | (.950) | (1.572) | (1.269) |
Net asset value, end of period | $ 49.82 | $ 47.04 | $ 43.62 | $ 47.76 |
Total ReturnB,C,D | 8.30% | 10.08% | (5.07)% | (2.02)% |
Ratios to Average Net AssetsF,H | | | | |
Expenses before reductions | .25% | .25% | .25% | .25%A |
Expenses net of fee waivers, if any | .25% | .25% | .25% | .25%A |
Expenses net of all reductions | .25% | .25% | .25% | .25%A |
Net investment income (loss) | 1.68% | 1.80% | 2.72% | 2.76%A |
Supplemental Data | | | | |
Net assets, end of period (000 omitted) | $ 1,798 | $ 2,308 | $ 2,599 | $ 2,214 |
Portfolio turnover rate | 31% | 40% | 54% | 56%A |
A Annualized
B Total returns for periods of less than one year are not annualized.
C Total returns would have been lower if certain expenses had not been reduced during the applicable periods shown.
D Total returns do not include the effect of the sales charges.
E Calculated based on average shares outstanding during the period.
F Amounts do not include the activity of the underlying funds.
G For the period August 30, 2007 (commencement of operations) to July 31, 2008.
H Expense ratios reflect operating expenses of the class. Expenses before reductions do not reflect amounts reimbursed by the investment adviser or reductions from expense offset arrangements and do not represent the amount paid by the class during periods when reimbursements or reductions occur. Expenses net of fee waivers reflect expenses after reimbursement by the investment adviser but prior to reductions from expense offset arrangements. Expenses net of all reductions represent the net expenses paid by the class but do not include expenses of the investment companies in which the Fund invests.
See accompanying notes which are an integral part of the financial statements.
Annual Report
Financial Highlights - Class T
Years ended July 31, | 2011 | 2010 | 2009 | 2008G |
Selected Per-Share Data | | | | |
Net asset value, beginning of period | $ 47.04 | $ 43.62 | $ 47.75 | $ 50.00 |
Income from Investment Operations | | | | |
Net investment income (loss)E | .698 | .716 | 1.025 | 1.128 |
Net realized and unrealized gain (loss) | 3.043 | 3.540 | (3.690) | (2.219) |
Total from investment operations | 3.741 | 4.256 | (2.665) | (1.091) |
Distributions from net investment income | (.710) | (.716) | (1.025) | (1.019) |
Distributions from net realized gain | (.261) | (.120) | (.440) | (.140) |
Total distributions | (.971) | (.836) | (1.465) | (1.159) |
Net asset value, end of period | $ 49.81 | $ 47.04 | $ 43.62 | $ 47.75 |
Total ReturnB,C,D | 8.00% | 9.81% | (5.30)% | (2.26)% |
Ratios to Average Net AssetsF,H | | | | |
Expenses before reductions | .50% | .50% | .50% | .50%A |
Expenses net of fee waivers, if any | .50% | .50% | .50% | .50%A |
Expenses net of all reductions | .50% | .50% | .50% | .50%A |
Net investment income (loss) | 1.42% | 1.55% | 2.47% | 2.51%A |
Supplemental Data | | | | |
Net assets, end of period (000 omitted) | $ 529 | $ 638 | $ 499 | $ 673 |
Portfolio turnover rate | 31% | 40% | 54% | 56%A |
A Annualized
B Total returns for periods of less than one year are not annualized.
C Total returns would have been lower if certain expenses had not been reduced during the applicable periods shown.
D Total returns do not include the effect of the sales charges.
E Calculated based on average shares outstanding during the period.
F Amounts do not include the activity of the underlying funds.
G For the period August 30, 2007 (commencement of operations) to July 31, 2008.
H Expense ratios reflect operating expenses of the class. Expenses before reductions do not reflect amounts reimbursed by the investment adviser or reductions from expense offset arrangements and do not represent the amount paid by the class during periods when reimbursements or reductions occur. Expenses net of fee waivers reflect expenses after reimbursement by the investment adviser but prior to reductions from expense offset arrangements. Expenses net of all reductions represent the net expenses paid by the class but do not include expenses of the investment companies in which the Fund invests.
Financial Highlights - Class C
Years ended July 31, | 2011 | 2010 | 2009 | 2008G |
Selected Per-Share Data | | | | |
Net asset value, beginning of period | $ 47.03 | $ 43.61 | $ 47.73 | $ 50.00 |
Income from Investment Operations | | | | |
Net investment income (loss)E | .453 | .485 | .822 | .904 |
Net realized and unrealized gain (loss) | 3.055 | 3.531 | (3.689) | (2.227) |
Total from investment operations | 3.508 | 4.016 | (2.867) | (1.323) |
Distributions from net investment income | (.447) | (.476) | (.813) | (.807) |
Distributions from net realized gain | (.261) | (.120) | (.440) | (.140) |
Total distributions | (.708) | (.596) | (1.253) | (.947) |
Net asset value, end of period | $ 49.83 | $ 47.03 | $ 43.61 | $ 47.73 |
Total ReturnB,C,D | 7.49% | 9.24% | (5.76)% | (2.71)% |
Ratios to Average Net AssetsF,H | | | | |
Expenses before reductions | 1.00% | 1.00% | 1.00% | 1.00%A |
Expenses net of fee waivers, if any | 1.00% | 1.00% | 1.00% | 1.00%A |
Expenses net of all reductions | 1.00% | 1.00% | 1.00% | 1.00%A |
Net investment income (loss) | .92% | 1.05% | 1.97% | 2.01%A |
Supplemental Data | | | | |
Net assets, end of period (000 omitted) | $ 759 | $ 1,075 | $ 1,171 | $ 1,595 |
Portfolio turnover rate | 31% | 40% | 54% | 56%A |
A Annualized
B Total returns for periods of less than one year are not annualized.
C Total returns would have been lower if certain expenses had not been reduced during the applicable periods shown.
D Total returns do not include the effect of the contingent deferred sales charge.
E Calculated based on average shares outstanding during the period.
F Amounts do not include the activity of the underlying funds.
G For the period August 30, 2007 (commencement of operations) to July 31, 2008.
H Expense ratios reflect operating expenses of the class. Expenses before reductions do not reflect amounts reimbursed by the investment adviser or reductions from expense offset arrangements and do not represent the amount paid by the class during periods when reimbursements or reductions occur. Expenses net of fee waivers reflect expenses after reimbursement by the investment adviser but prior to reductions from expense offset arrangements. Expenses net of all reductions represent the net expenses paid by the class but do not include expenses of the investment companies in which the Fund invests.
See accompanying notes which are an integral part of the financial statements.
Annual Report
Financial Highlights - Income Replacement 2016
Years ended July 31, | 2011 | 2010 | 2009 | 2008G |
Selected Per-Share Data | | | | |
Net asset value, beginning of period | $ 47.05 | $ 43.63 | $ 47.77 | $ 50.00 |
Income from Investment Operations | | | | |
Net investment income (loss)D | .944 | .948 | 1.231 | 1.356 |
Net realized and unrealized gain (loss) | 3.055 | 3.539 | (3.692) | (2.217) |
Total from investment operations | 3.999 | 4.487 | (2.461) | (.861) |
Distributions from net investment income | (.958) | (.947) | (1.239) | (1.229) |
Distributions from net realized gain | (.261) | (.120) | (.440) | (.140) |
Total distributions | (1.219) | (1.067) | (1.679) | (1.369) |
Net asset value, end of period | $ 49.83 | $ 47.05 | $ 43.63 | $ 47.77 |
Total ReturnB,C | 8.57% | 10.36% | (4.82)% | (1.81)% |
Ratios to Average Net AssetsE,H | | | | |
Expenses before reductionsF | .00% | .00% | .00% | .00%A |
Expenses net of fee waivers, if any | .00% | .00% | .00% | .00%A |
Expenses net of all reductions | .00% | .00% | .00% | .00%A |
Net investment income (loss) | 1.93% | 2.05% | 2.97% | 3.00%A |
Supplemental Data | | | | |
Net assets, end of period (000 omitted) | $ 6,873 | $ 6,946 | $ 4,733 | $ 4,880 |
Portfolio turnover rate | 31% | 40% | 54% | 56%A |
A Annualized
B Total returns for periods of less than one year are not annualized.
C Total returns would have been lower if certain expenses had not been reduced during the applicable periods shown.
D Calculated based on average shares outstanding during the period.
E Amounts do not include the activity of the underlying funds.
F Amount represents less than .01%.
G For the period August 30, 2007 (commencement of operations) to July 31, 2008.
H Expense ratios reflect operating expenses of the class. Expenses before reductions do not reflect amounts reimbursed by the investment adviser or reductions from expense offset arrangements and do not represent the amount paid by the class during periods when reimbursements or reductions occur. Expenses net of fee waivers reflect expenses after reimbursement by the investment adviser but prior to reductions from expense offset arrangements. Expenses net of all reductions represent the net expenses paid by the class but do not include expenses of the investment companies in which the Fund invests.
Financial Highlights - Institutional Class
Years ended July 31, | 2011 | 2010 | 2009 | 2008G |
Selected Per-Share Data | | | | |
Net asset value, beginning of period | $ 47.05 | $ 43.64 | $ 47.77 | $ 50.00 |
Income from Investment Operations | | | | |
Net investment income (loss)D | .945 | .947 | 1.235 | 1.370 |
Net realized and unrealized gain (loss) | 3.054 | 3.530 | (3.686) | (2.231) |
Total from investment operations | 3.999 | 4.477 | (2.451) | (.861) |
Distributions from net investment income | (.958) | (.947) | (1.239) | (1.229) |
Distributions from net realized gain | (.261) | (.120) | (.440) | (.140) |
Total distributions | (1.219) | (1.067) | (1.679) | (1.369) |
Net asset value, end of period | $ 49.83 | $ 47.05 | $ 43.64 | $ 47.77 |
Total ReturnB,C | 8.57% | 10.33% | (4.80)% | (1.81)% |
Ratios to Average Net AssetsE,H | | | | |
Expenses before reductionsF | .00% | .00% | .00% | .00%A |
Expenses net of fee waivers, if any | .00% | .00% | .00% | .00%A |
Expenses net of all reductions | .00% | .00% | .00% | .00%A |
Net investment income (loss) | 1.92% | 2.05% | 2.97% | 3.00%A |
Supplemental Data | | | | |
Net assets, end of period (000 omitted) | $ 44 | $ 108 | $ 109 | $ 184 |
Portfolio turnover rate | 31% | 40% | 54% | 56%A |
A Annualized
B Total returns for periods of less than one year are not annualized.
C Total returns would have been lower if certain expenses had not been reduced during the applicable periods shown.
D Calculated based on average shares outstanding during the period.
E Amounts do not include the activity of the underlying funds.
F Amount represents less than .01%.
G For the period August 30, 2007 (commencement of operations) to July 31, 2008.
H Expense ratios reflect operating expenses of the class. Expenses before reductions do not reflect amounts reimbursed by the investment adviser or reductions from expense offset arrangements and do not represent the amount paid by the class during periods when reimbursements or reductions occur. Expenses net of fee waivers reflect expenses after reimbursement by the investment adviser but prior to reductions from expense offset arrangements. Expenses net of all reductions represent the net expenses paid by the class but do not include expenses of the investment companies in which the Fund invests.
See accompanying notes which are an integral part of the financial statements.
Annual Report
Fidelity Income Replacement 2018 Fund
Investment Changes (Unaudited)
Fund Holdings as of July 31, 2011 |
| % of fund's
net assets | % of fund's net assets
6 months ago |
Domestic Equity Funds | | |
Fidelity Advisor Mid Cap II Fund Institutional Class | 3.4 | 3.5 |
Fidelity Disciplined Equity Fund | 3.5 | 3.7 |
Fidelity Equity-Income Fund | 3.5 | 3.7 |
Fidelity Large Cap Core Enhanced Index Fund | 5.7 | 5.9 |
Fidelity Series 100 Index Fund | 4.3 | 4.4 |
Fidelity Series Broad Market Opportunities Fund | 5.7 | 5.9 |
Fidelity Series Small Cap Opportunities Fund | 2.3 | 2.4 |
| 28.4 | 29.5 |
International Equity Funds | | |
Fidelity Advisor International Discovery Fund Institutional Class | 2.7 | 2.9 |
High Yield Fixed-Income Funds | | |
Fidelity Capital & Income Fund | 0.6 | 0.9 |
Fidelity Strategic Income Fund | 0.7 | 0.8 |
| 1.3 | 1.7 |
Investment Grade Fixed-Income Funds | | |
Fidelity Government Income Fund | 7.9 | 7.8 |
Fidelity Strategic Real Return Fund | 7.9 | 7.8 |
Fidelity Total Bond Fund | 23.7 | 23.3 |
| 39.5 | 38.9 |
Short-Term Funds | | |
Fidelity Institutional Money Market Portfolio Institutional Class | 14.0 | 13.5 |
Fidelity Short-Term Bond Fund | 14.1 | 13.5 |
| 28.1 | 27.0 |
Net Other Assets (Liabilities)* | 0.0 | 0.0 |
| 100.0 | 100.0 |
* Amount represents less than 0.1% |
Asset Allocation (% of fund's net assets) |
Current |
| Domestic Equity Funds | 28.4% | |
 | International Equity Funds | 2.7% | |
 | High Yield
Fixed-Income Funds | 1.3% | |
 | Investment Grade Fixed-Income Funds | 39.5% | |
| Short-Term Funds | 28.1% | |

Six months ago |
| Domestic Equity Funds | 29.5% | |
| International Equity Funds | 2.9% | |
| High Yield
Fixed-Income Funds | 1.7% | |
| Investment Grade Fixed-Income Funds | 38.9% | |
| Short-Term Funds | 27.0% | |

Expected |
| Domestic Equity Funds | 26.1% | |
| International Equity Funds | 2.4% | |
| Investment Grade Fixed-Income Funds | 41.0% | |
| Short-Term Funds | 30.5% | |

The fund invests according to an asset allocation strategy that becomes increasingly conservative over time. The six months ago allocation is based on the fund's holdings as of January 31, 2011. The current allocation is based on the fund's holdings as of July 31, 2011. The expected allocation represents the fund's anticipated allocation at January 31, 2012. |
Annual Report
Fidelity Income Replacement 2018 Fund
Investments July 31, 2011
Showing Percentage of Net Assets
Equity Funds - 31.1% |
| Shares | | Value |
Domestic Equity Funds - 28.4% |
Fidelity Advisor Mid Cap II Fund Institutional Class (a) | 9,863 | | $ 178,808 |
Fidelity Disciplined Equity Fund | 8,010 | | 186,461 |
Fidelity Equity-Income Fund | 4,146 | | 183,907 |
Fidelity Large Cap Core Enhanced Index Fund | 33,811 | | 303,289 |
Fidelity Series 100 Index Fund | 25,174 | | 227,828 |
Fidelity Series Broad Market Opportunities Fund | 29,020 | | 298,906 |
Fidelity Series Small Cap Opportunities Fund | 10,586 | | 118,778 |
TOTAL DOMESTIC EQUITY FUNDS | | 1,497,977 |
International Equity Funds - 2.7% |
Fidelity Advisor International Discovery Fund Institutional Class | 4,291 | | 144,302 |
TOTAL EQUITY FUNDS (Cost $1,593,440) | 1,642,279 |
Fixed-Income Funds - 40.8% |
| | | |
High Yield Fixed-Income Funds - 1.3% |
Fidelity Capital & Income Fund | 3,456 | | 33,079 |
Fidelity Strategic Income Fund | 2,994 | | 34,068 |
TOTAL HIGH YIELD FIXED-INCOME FUNDS | | 67,147 |
|
| Shares | | Value |
Investment Grade Fixed-Income Funds - 39.5% |
Fidelity Government Income Fund | 39,200 | | $ 418,660 |
Fidelity Strategic Real Return Fund | 41,988 | | 417,364 |
Fidelity Total Bond Fund | 113,818 | | 1,253,133 |
TOTAL INVESTMENT GRADE FIXED-INCOME FUNDS | | 2,089,157 |
TOTAL FIXED-INCOME FUNDS (Cost $2,030,227) | 2,156,304 |
Short-Term Funds - 28.1% |
| | | |
Fidelity Institutional Money Market Portfolio Institutional Class | 740,895 | | 740,895 |
Fidelity Short-Term Bond Fund | 87,317 | | 745,686 |
TOTAL SHORT-TERM FUNDS (Cost $1,474,109) | 1,486,581 |
TOTAL INVESTMENT PORTFOLIO - 100.0% (Cost $5,097,776) | | 5,285,164 |
NET OTHER ASSETS (LIABILITIES) - 0.0% | | (448) |
NET ASSETS - 100% | $ 5,284,716 |
Legend |
(a) Non-income producing |
Other Information |
All investments are categorized as Level 1 under the Fair Value Hierarchy. The inputs or methodology used for valuing securities may not be an indication of the risk associated with investing in those securities. For more information on valuation inputs, please refer to the Security Valuation section in the accompanying Notes to Financial Statements. |
Income Tax Information |
At July 31, 2011, the Fund had a capital loss carryforward of approximately $571,622 of which $123,548, $410,862 and $37,212 will expire in fiscal 2017, 2018 and 2019, respectively. Capital loss carryforwards are only available to offset future capital gains of the Fund to the extent provided by regulations and may be limited. |
See accompanying notes which are an integral part of the financial statements.
Annual Report
Fidelity Income Replacement 2018 Fund
Statement of Assets and Liabilities
| July 31, 2011 |
| | |
Assets | | |
Investment in securities, at value (cost $5,097,776) - See accompanying schedule | | $ 5,285,164 |
Receivable for investments sold | | 25,688 |
Total assets | | 5,310,852 |
| | |
Liabilities | | |
Payable for investments purchased | $ 25,721 | |
Distribution and service plan fees payable | 415 | |
Total liabilities | | 26,136 |
| | |
Net Assets | | $ 5,284,716 |
Net Assets consist of: | | |
Paid in capital | | $ 5,802,658 |
Undistributed net investment income | | 1,141 |
Accumulated undistributed net realized gain (loss) on investments | | (706,471) |
Net unrealized appreciation (depreciation) on investments | | 187,388 |
Net Assets | | $ 5,284,716 |
| | |
Calculation of Maximum Offering Price Class A:
Net Asset Value and redemption price per share ($783,795 ÷ 15,715.6 shares) | | $ 49.87 |
| | |
Maximum offering price per share (100/94.25 of $49.87) | | $ 52.91 |
| | |
Class T:
Net Asset Value and redemption price per share ($148,019 ÷ 2,966.4 shares) | | $ 49.90 |
| | |
Maximum offering price per share (100/96.50 of $49.90) | | $ 51.71 |
| | |
Class C:
Net Asset Value and offering price per share ($225,996 ÷ 4,533.7 shares)A | | $ 49.85 |
| | |
Income Replacement 2018:
Net Asset Value, offering price and redemption price per share ($3,806,441 ÷ 76,308.6 shares) | | $ 49.88 |
| | |
Institutional Class:
Net Asset Value, offering price and redemption price per share ($320,465 ÷ 6,423.8 shares) | | $ 49.89 |
A Redemption price per share is equal to net asset value less any applicable contingent deferred sales charge.
Statement of Operations
| Year ended July 31, 2011 |
| | |
Investment Income | | |
Income distributions from underlying funds | | $ 111,451 |
| | |
Expenses | | |
Distribution and service plan fees | $ 5,142 | |
Independent trustees' compensation | 21 | |
Total expenses before reductions | 5,163 | |
Expense reductions | (21) | 5,142 |
Net investment income (loss) | | 106,309 |
Realized and Unrealized Gain (Loss) Realized gain (loss) on sale of underlying fund shares | (39,850) | |
Capital gain distributions from underlying funds | 38,940 | |
Total net realized gain (loss) | | (910) |
Change in net unrealized appreciation (depreciation) on underlying funds | | 449,375 |
Net gain (loss) | | 448,465 |
Net increase (decrease) in net assets resulting from operations | | $ 554,774 |
See accompanying notes which are an integral part of the financial statements.
Annual Report
Statement of Changes in Net Assets
| Year ended
July 31, 2011 | Year ended
July 31, 2010 |
Increase (Decrease) in Net Assets | | |
Operations | | |
Net investment income (loss) | $ 106,309 | $ 103,982 |
Net realized gain (loss) | (910) | (68,006) |
Change in net unrealized appreciation (depreciation) | 449,375 | 484,491 |
Net increase (decrease) in net assets resulting from operations | 554,774 | 520,467 |
Distributions to shareholders from net investment income | (106,906) | (103,950) |
Distributions to shareholders from net realized gain | (28,806) | (13,543) |
Total distributions | (135,712) | (117,493) |
Share transactions - net increase (decrease) | (565,574) | 211,898 |
Total increase (decrease) in net assets | (146,512) | 614,872 |
| | |
Net Assets | | |
Beginning of period | 5,431,228 | 4,816,356 |
End of period (including undistributed net investment income of $1,141 and undistributed net investment income of $1,816, respectively) | $ 5,284,716 | $ 5,431,228 |
Financial Highlights - Class A
Years ended July 31, | 2011 | 2010 | 2009 | 2008G |
Selected Per-Share Data | | | | |
Net asset value, beginning of period | $ 46.45 | $ 42.81 | $ 47.46 | $ 50.00 |
Income from Investment Operations | | | | |
Net investment income (loss)E | .836 | .836 | 1.092 | 1.163 |
Net realized and unrealized gain (loss) | 3.655 | 3.763 | (4.138) | (2.454) |
Total from investment operations | 4.491 | 4.599 | (3.046) | (1.291) |
Distributions from net investment income | (.834) | (.839) | (1.124) | (1.119) |
Distributions from net realized gain | (.237) | (.120) | (.480) | (.130) |
Total distributions | (1.071) | (.959) | (1.604) | (1.249) |
Net asset value, end of period | $ 49.87 | $ 46.45 | $ 42.81 | $ 47.46 |
Total ReturnB,C,D | 9.73% | 10.80% | (6.06)% | (2.68)% |
Ratios to Average Net AssetsF,H | | | | |
Expenses before reductions | .25% | .25% | .25% | .25%A |
Expenses net of fee waivers, if any | .25% | .25% | .25% | .25%A |
Expenses net of all reductions | .25% | .25% | .25% | .25%A |
Net investment income (loss) | 1.71% | 1.83% | 2.69% | 2.60%A |
Supplemental Data | | | | |
Net assets, end of period (000 omitted) | $ 784 | $ 1,147 | $ 833 | $ 1,107 |
Portfolio turnover rate | 39% | 24% | 51% | 46%A |
A Annualized
B Total returns for periods of less than one year are not annualized.
C Total returns would have been lower if certain expenses had not been reduced during the applicable periods shown.
D Total returns do not include the effect of the sales charges.
E Calculated based on average shares outstanding during the period.
F Amounts do not include the activity of the underlying funds.
G For the period August 30, 2007 (commencement of operations) to July 31, 2008.
H Expense ratios reflect operating expenses of the class. Expenses before reductions do not reflect amounts reimbursed by the investment adviser or reductions from expense offset arrangements and do not represent the amount paid by the class during periods when reimbursements or reductions occur. Expenses net of fee waivers reflect expenses after reimbursement by the investment adviser but prior to reductions from expense offset arrangements. Expenses net of all reductions represent the net expenses paid by the class but do not include expenses of the investment companies in which the Fund invests.
See accompanying notes which are an integral part of the financial statements.
Annual Report
Financial Highlights - Class T
Years ended July 31, | 2011 | 2010 | 2009 | 2008 G |
Selected Per-Share Data | | | | |
Net asset value, beginning of period | $ 46.48 | $ 42.83 | $ 47.46 | $ 50.00 |
Income from Investment Operations | | | | |
Net investment income (loss)E | .716 | .722 | .989 | 1.075 |
Net realized and unrealized gain (loss) | 3.664 | 3.759 | (4.128) | (2.483) |
Total from investment operations | 4.380 | 4.481 | (3.139) | (1.408) |
Distributions from net investment income | (.723) | (.711) | (1.011) | (1.002) |
Distributions from net realized gain | (.237) | (.120) | (.480) | (.130) |
Total distributions | (.960) | (.831) | (1.491) | (1.132) |
Net asset value, end of period | $ 49.90 | $ 46.48 | $ 42.83 | $ 47.46 |
Total ReturnB,C,D | 9.48% | 10.51% | (6.28)% | (2.91)% |
Ratios to Average Net AssetsF,H | | | | |
Expenses before reductions | .50% | .50% | .50% | .50%A |
Expenses net of fee waivers, if any | .50% | .50% | .50% | .50%A |
Expenses net of all reductions | .50% | .50% | .50% | .50%A |
Net investment income (loss) | 1.46% | 1.58% | 2.44% | 2.35%A |
Supplemental Data | | | | |
Net assets, end of period (000 omitted) | $ 148 | $ 52 | $ 91 | $ 154 |
Portfolio turnover rate | 39% | 24% | 51% | 46%A |
A Annualized
B Total returns for periods of less than one year are not annualized.
C Total returns would have been lower if certain expenses had not been reduced during the applicable periods shown.
D Total returns do not include the effect of the sales charges.
E Calculated based on average shares outstanding during the period.
F Amounts do not include the activity of the underlying funds.
G For the period August 30, 2007 (commencement of operations) to July 31, 2008.
H Expense ratios reflect operating expenses of the class. Expenses before reductions do not reflect amounts reimbursed by the investment adviser or reductions from expense offset arrangements and do not represent the amount paid by the class during periods when reimbursements or reductions occur. Expenses net of fee waivers reflect expenses after reimbursement by the investment adviser but prior to reductions from expense offset arrangements. Expenses net of all reductions represent the net expenses paid by the class but do not include expenses of the investment companies in which the Fund invests.
Financial Highlights - Class C
Years ended July 31, | 2011 | 2010 | 2009 | 2008G |
Selected Per-Share Data | | | | |
Net asset value, beginning of period | $ 46.43 | $ 42.80 | $ 47.41 | $ 50.00 |
Income from Investment Operations | | | | |
Net investment income (loss)E | .469 | .495 | .786 | .836 |
Net realized and unrealized gain (loss) | 3.659 | 3.760 | (4.122) | (2.476) |
Total from investment operations | 4.128 | 4.255 | (3.336) | (1.640) |
Distributions from net investment income | (.471) | (.505) | (.794) | (.820) |
Distributions from net realized gain | (.237) | (.120) | (.480) | (.130) |
Total distributions | (.708) | (.625) | (1.274) | (.950) |
Net asset value, end of period | $ 49.85 | $ 46.43 | $ 42.80 | $ 47.41 |
Total ReturnB,C,D | 8.93% | 9.98% | (6.75)% | (3.36)% |
Ratios to Average Net AssetsF,H | | | | |
Expenses before reductions | 1.00% | 1.00% | 1.00% | 1.00%A |
Expenses net of fee waivers, if any | 1.00% | 1.00% | 1.00% | 1.00%A |
Expenses net of all reductions | 1.00% | 1.00% | 1.00% | 1.00%A |
Net investment income (loss) | .96% | 1.08% | 1.94% | 1.85%A |
Supplemental Data | | | | |
Net assets, end of period (000 omitted) | $ 226 | $ 201 | $ 131 | $ 365 |
Portfolio turnover rate | 39% | 24% | 51% | 46%A |
A Annualized
B Total returns for periods of less than one year are not annualized.
C Total returns would have been lower if certain expenses had not been reduced during the applicable periods shown.
D Total returns do not include the effect of the contingent deferred sales charge.
E Calculated based on average shares outstanding during the period.
F Amounts do not include the activity of the underlying funds.
G For the period August 30, 2007 (commencement of operations) to July 31, 2008.
H Expense ratios reflect operating expenses of the class. Expenses before reductions do not reflect amounts reimbursed by the investment adviser or reductions from expense offset arrangements and do not represent the amount paid by the class during periods when reimbursements or reductions occur. Expenses net of fee waivers reflect expenses after reimbursement by the investment adviser but prior to reductions from expense offset arrangements. Expenses net of all reductions represent the net expenses paid by the class but do not include expenses of the investment companies in which the Fund invests.
See accompanying notes which are an integral part of the financial statements.
Annual Report
Financial Highlights - Income Replacement 2018
Years ended July 31, | 2011 | 2010 | 2009 | 2008G |
Selected Per-Share Data | | | | |
Net asset value, beginning of period | $ 46.46 | $ 42.82 | $ 47.46 | $ 50.00 |
Income from Investment Operations | | | | |
Net investment income (loss)D | .960 | .950 | 1.202 | 1.280 |
Net realized and unrealized gain (loss) | 3.657 | 3.761 | (4.138) | (2.469) |
Total from investment operations | 4.617 | 4.711 | (2.936) | (1.189) |
Distributions from net investment income | (.960) | (.951) | (1.224) | (1.221) |
Distributions from net realized gain | (.237) | (.120) | (.480) | (.130) |
Total distributions | (1.197) | (1.071) | (1.704) | (1.351) |
Net asset value, end of period | $ 49.88 | $ 46.46 | $ 42.82 | $ 47.46 |
Total ReturnB,C | 10.01% | 11.07% | (5.81)% | (2.48)% |
Ratios to Average Net AssetsE,H | | | | |
Expenses before reductionsF | .00% | .00% | .00% | .00%A |
Expenses net of fee waivers, if any | .00% | .00% | .00% | .00%A |
Expenses net of all reductions | .00% | .00% | .00% | .00%A |
Net investment income (loss) | 1.96% | 2.08% | 2.94% | 2.85%A |
Supplemental Data | | | | |
Net assets, end of period (000 omitted) | $ 3,806 | $ 3,681 | $ 3,435 | $ 5,167 |
Portfolio turnover rate | 39% | 24% | 51% | 46%A |
A Annualized
B Total returns for periods of less than one year are not annualized.
C Total returns would have been lower if certain expenses had not been reduced during the applicable periods shown.
D Calculated based on average shares outstanding during the period.
E Amounts do not include the activity of the underlying funds.
F Amount represents less than .01%.
G For the period August 30, 2007 (commencement of operations) to July 31, 2008.
H Expense ratios reflect operating expenses of the class. Expenses before reductions do not reflect amounts reimbursed by the investment adviser or reductions from expense offset arrangements and do not represent the amount paid by the class during periods when reimbursements or reductions occur. Expenses net of fee waivers reflect expenses after reimbursement by the investment adviser but prior to reductions from expense offset arrangements. Expenses net of all reductions represent the net expenses paid by the class but do not include expenses of the investment companies in which the Fund invests.
Financial Highlights - Institutional Class
Years ended July 31, | 2011 | 2010 | 2009 | 2008G |
Selected Per-Share Data | | | | |
Net asset value, beginning of period | $ 46.46 | $ 42.82 | $ 47.47 | $ 50.00 |
Income from Investment Operations | | | | |
Net investment income (loss)D | .959 | .950 | 1.175 | 1.295 |
Net realized and unrealized gain (loss) | 3.668 | 3.761 | (4.121) | (2.474) |
Total from investment operations | 4.627 | 4.711 | (2.946) | (1.179) |
Distributions from net investment income | (.960) | (.951) | (1.224) | (1.221) |
Distributions from net realized gain | (.237) | (.120) | (.480) | (.130) |
Total distributions | (1.197) | (1.071) | (1.704) | (1.351) |
Net asset value, end of period | $ 49.89 | $ 46.46 | $ 42.82 | $ 47.47 |
Total ReturnB,C | 10.03% | 11.07% | (5.83)% | (2.46)% |
Ratios to Average Net AssetsE,H | | | | |
Expenses before reductionsF | .00% | .00% | .00% | .00%A |
Expenses net of fee waivers, if any | .00% | .00% | .00% | .00%A |
Expenses net of all reductions | .00% | .00% | .00% | .00%A |
Net investment income (loss) | 1.96% | 2.08% | 2.94% | 2.85%A |
Supplemental Data | | | | |
Net assets, end of period (000 omitted) | $ 320 | $ 350 | $ 326 | $ 214 |
Portfolio turnover rate | 39% | 24% | 51% | 46%A |
A Annualized
B Total returns for periods of less than one year are not annualized.
C Total returns would have been lower if certain expenses had not been reduced during the applicable periods shown.
D Calculated based on average shares outstanding during the period.
E Amounts do not include the activity of the underlying funds.
F Amount represents less than .01%.
G For the period August 30, 2007 (commencement of operations) to July 31, 2008.
H Expense ratios reflect operating expenses of the class. Expenses before reductions do not reflect amounts reimbursed by the investment adviser or reductions from expense offset arrangements and do not represent the amount paid by the class during periods when reimbursements or reductions occur. Expenses net of fee waivers reflect expenses after reimbursement by the investment adviser but prior to reductions from expense offset arrangements. Expenses net of all reductions represent the net expenses paid by the class but do not include expenses of the investment companies in which the Fund invests.
See accompanying notes which are an integral part of the financial statements.
Annual Report
Fidelity Income Replacement 2020 Fund
Investment Changes (Unaudited)
Fund Holdings as of July 31, 2011 |
| % of fund's
net assets | % of fund's net assets
6 months ago |
Domestic Equity Funds | | |
Fidelity Advisor Mid Cap II Fund Institutional Class | 4.0 | 4.2 |
Fidelity Disciplined Equity Fund | 4.2 | 4.3 |
Fidelity Equity-Income Fund | 4.1 | 4.3 |
Fidelity Large Cap Core Enhanced Index Fund | 6.9 | 7.0 |
Fidelity Series 100 Index Fund | 5.1 | 5.2 |
Fidelity Series Broad Market Opportunities Fund | 6.8 | 7.0 |
Fidelity Series Small Cap Opportunities Fund | 2.7 | 2.8 |
| 33.8 | 34.8 |
International Equity Funds | | |
Fidelity Advisor International Discovery Fund Institutional Class | 3.7 | 3.9 |
High Yield Fixed-Income Funds | | |
Fidelity Capital & Income Fund | 1.3 | 1.4 |
Fidelity Strategic Income Fund | 1.4 | 1.4 |
| 2.7 | 2.8 |
Investment Grade Fixed-Income Funds | | |
Fidelity Government Income Fund | 7.3 | 7.2 |
Fidelity Strategic Real Return Fund | 7.3 | 7.2 |
Fidelity Total Bond Fund | 21.9 | 21.6 |
| 36.5 | 36.0 |
Short-Term Funds | | |
Fidelity Institutional Money Market Portfolio Institutional Class | 11.6 | 11.3 |
Fidelity Short-Term Bond Fund | 11.7 | 11.2 |
| 23.3 | 22.5 |
Net Other Assets (Liabilities)* | 0.0 | 0.0 |
| 100.0 | 100.0 |
* Amount represents less than 0.1% |
Asset Allocation (% of fund's net assets) |
Current |
| Domestic Equity Funds | 33.8% | |
| International Equity Funds | 3.7% | |
| High Yield
Fixed-Income Funds | 2.7% | |
| Investment Grade Fixed-Income Funds | 36.5% | |
| Short-Term Funds | 23.3% | |

Six months ago |
| Domestic Equity Funds | 34.8% | |
| International Equity Funds | 3.9% | |
| High Yield
Fixed-Income Funds | 2.8% | |
| Investment Grade Fixed-Income Funds | 36.0% | |
| Short-Term Funds | 22.5% | |

Expected |
| Domestic Equity Funds | 32.3% | |
| International Equity Funds | 3.4% | |
| High Yield
Fixed-Income Funds | 2.4% | |
| Investment Grade Fixed-Income Funds | 37.3% | |
| Short-Term Funds | 24.6% | |

The fund invests according to an asset allocation strategy that becomes increasingly conservative over time. The six months ago allocation is based on the fund's holdings as of January 31, 2011. The current allocation is based on the fund's holdings as of July 31, 2011. The expected allocation represents the fund's anticipated allocation at January 31, 2012. |
Annual Report
Fidelity Income Replacement 2020 Fund
Investments July 31, 2011
Showing Percentage of Net Assets
Equity Funds - 37.5% |
| Shares | | Value |
Domestic Equity Funds - 33.8% |
Fidelity Advisor Mid Cap II Fund Institutional Class (a) | 8,861 | | $ 160,646 |
Fidelity Disciplined Equity Fund | 7,178 | | 167,105 |
Fidelity Equity-Income Fund | 3,712 | | 164,659 |
Fidelity Large Cap Core Enhanced Index Fund | 30,359 | | 272,320 |
Fidelity Series 100 Index Fund | 22,596 | | 204,492 |
Fidelity Series Broad Market Opportunities Fund | 26,030 | | 268,106 |
Fidelity Series Small Cap Opportunities Fund | 9,469 | | 106,243 |
TOTAL DOMESTIC EQUITY FUNDS | | 1,343,571 |
International Equity Funds - 3.7% |
Fidelity Advisor International Discovery Fund Institutional Class | 4,338 | | 145,871 |
TOTAL EQUITY FUNDS (Cost $1,246,786) | 1,489,442 |
Fixed-Income Funds - 39.2% |
| | | |
High Yield Fixed-Income Funds - 2.7% |
Fidelity Capital & Income Fund | 5,515 | | 52,781 |
Fidelity Strategic Income Fund | 4,785 | | 54,448 |
TOTAL HIGH YIELD FIXED-INCOME FUNDS | | 107,229 |
|
| Shares | | Value |
Investment Grade Fixed-Income Funds - 36.5% |
Fidelity Government Income Fund | 27,198 | | $ 290,477 |
Fidelity Strategic Real Return Fund | 29,143 | | 289,686 |
Fidelity Total Bond Fund | 79,034 | | 870,168 |
TOTAL INVESTMENT GRADE FIXED-INCOME FUNDS | | 1,450,331 |
TOTAL FIXED-INCOME FUNDS (Cost $1,439,557) | 1,557,560 |
Short-Term Funds - 23.3% |
| | | |
Fidelity Institutional Money Market Portfolio Institutional Class | 460,794 | | 460,794 |
Fidelity Short-Term Bond Fund | 54,326 | | 463,942 |
TOTAL SHORT-TERM FUNDS (Cost $913,437) | 924,736 |
TOTAL INVESTMENT PORTFOLIO - 100.0% (Cost $3,599,780) | | 3,971,738 |
NET OTHER ASSETS (LIABILITIES) - 0.0% | | (365) |
NET ASSETS - 100% | $ 3,971,373 |
Legend |
(a) Non-income producing |
Other Information |
All investments are categorized as Level 1 under the Fair Value Hierarchy. The inputs or methodology used for valuing securities may not be an indication of the risk associated with investing in those securities. For more information on valuation inputs, please refer to the Security Valuation section in the accompanying Notes to Financial Statements. |
Income Tax Information |
At July 31, 2011, the Fund had a capital loss carryforward of approximately $144,422 of which $3,778, $118,446 and $22,198 will expire in fiscal 2017, 2018 and 2019, respectively. Capital loss carryforwards are only available to offset future capital gains of the Fund to the extent provided by regulations and may be limited. |
See accompanying notes which are an integral part of the financial statements.
Annual Report
Fidelity Income Replacement 2020 Fund
Statement of Assets and Liabilities
| July 31, 2011 |
| | |
Assets | | |
Investment in securities, at value (cost $3,599,780) - See accompanying schedule | | $ 3,971,738 |
Receivable for investments sold | | 3 |
Total assets | | 3,971,741 |
| | |
Liabilities | | |
Payable for investments purchased | $ 2 | |
Distribution and service plan fees payable | 366 | |
Total liabilities | | 368 |
| | |
Net Assets | | $ 3,971,373 |
Net Assets consist of: | | |
Paid in capital | | $ 3,836,502 |
Undistributed net investment income | | 855 |
Accumulated undistributed net realized gain (loss) on investments | | (237,942) |
Net unrealized appreciation (depreciation) on investments | | 371,958 |
Net Assets | | $ 3,971,373 |
| | |
Calculation of Maximum Offering Price Class A:
Net Asset Value and redemption price per share ($435,873 ÷ 8,718.36 shares) | | $ 49.99 |
| | |
Maximum offering price per share (100/94.25 of $49.99) | | $ 53.04 |
| | |
Class T:
Net Asset Value and redemption price per share ($195,964 ÷ 3,920.19 shares) | | $ 49.99 |
| | |
Maximum offering price per share (100/96.50 of $49.99) | | $ 51.80 |
| | |
Class C:
Net Asset Value and offering price per share ($228,454 ÷ 4,571.93 shares)A | | $ 49.97 |
| | |
Income Replacement 2020:
Net Asset Value, offering price and redemption price per share ($3,078,631 ÷ 61,577.53 shares) | | $ 50.00 |
| | |
Institutional Class:
Net Asset Value, offering price and redemption price per share ($32,451 ÷ 649.06 shares) | | $ 50.00 |
A Redemption price per share is equal to net asset value less any applicable contingent deferred sales charge.
Statement of Operations
| Year ended July 31, 2011 |
| | |
Investment Income | | |
Income distributions from underlying funds | | $ 76,517 |
| | |
Expenses | | |
Distribution and service plan fees | $ 5,120 | |
Independent trustees' compensation | 14 | |
Total expenses before reductions | 5,134 | |
Expense reductions | (14) | 5,120 |
Net investment income (loss) | | 71,397 |
Realized and Unrealized Gain (Loss) Realized gain (loss) on sale of underlying fund shares | (11,978) | |
Capital gain distributions from underlying funds | 23,304 | |
Total net realized gain (loss) | | 11,326 |
Change in net unrealized appreciation (depreciation) on underlying funds | | 303,624 |
Net gain (loss) | | 314,950 |
Net increase (decrease) in net assets resulting from operations | | $ 386,347 |
See accompanying notes which are an integral part of the financial statements.
Annual Report
Statement of Changes in Net Assets
| Year ended
July 31, 2011 | Year ended
July 31, 2010 |
Increase (Decrease) in Net Assets | | |
Operations | | |
Net investment income (loss) | $ 71,397 | $ 58,358 |
Net realized gain (loss) | 11,326 | (17,761) |
Change in net unrealized appreciation (depreciation) | 303,624 | 270,430 |
Net increase (decrease) in net assets resulting from operations | 386,347 | 311,027 |
Distributions to shareholders from net investment income | (71,547) | (58,210) |
Distributions to shareholders from net realized gain | (16,958) | (7,714) |
Total distributions | (88,505) | (65,924) |
Share transactions - net increase (decrease) | 363,777 | 451,360 |
Total increase (decrease) in net assets | 661,619 | 696,463 |
| | |
Net Assets | | |
Beginning of period | 3,309,754 | 2,613,291 |
End of period (including undistributed net investment income of $855 and undistributed net investment income of $1,012, respectively) | $ 3,971,373 | $ 3,309,754 |
Financial Highlights - Class A
Years ended July 31, | 2011 | 2010 | 2009 | 2008G |
Selected Per-Share Data | | | | |
Net asset value, beginning of period | $ 46.09 | $ 42.28 | $ 47.11 | $ 50.00 |
Income from Investment Operations | | | | |
Net investment income (loss)E | .817 | .812 | 1.027 | 1.085 |
Net realized and unrealized gain (loss) | 4.128 | 3.930 | (4.465) | (2.692) |
Total from investment operations | 4.945 | 4.742 | (3.438) | (1.607) |
Distributions from net investment income | (.826) | (.817) | (1.032) | (1.113) |
Distributions from net realized gain | (.219) | (.115) | (.360) | (.170) |
Total distributions | (1.045) | (.932) | (1.392) | (1.283) |
Net asset value, end of period | $ 49.99 | $ 46.09 | $ 42.28 | $ 47.11 |
Total ReturnB,C,D | 10.79% | 11.27% | (7.00)% | (3.33)% |
Ratios to Average Net AssetsF,H | | | | |
Expenses before reductions | .25% | .25% | .25% | .25%A |
Expenses net of fee waivers, if any | .25% | .25% | .25% | .25%A |
Expenses net of all reductions | .25% | .25% | .25% | .25%A |
Net investment income (loss) | 1.67% | 1.79% | 2.60% | 2.42%A |
Supplemental Data | | | | |
Net assets, end of period (000 omitted) | $ 436 | $ 607 | $ 502 | $ 503 |
Portfolio turnover rate | 48% | 38% | 60% | 21%A |
A Annualized
B Total returns for periods of less than one year are not annualized.
C Total returns would have been lower if certain expenses had not been reduced during the applicable periods shown.
D Total returns do not include the effect of the sales charges.
E Calculated based on average shares outstanding during the period.
F Amounts do not include the activity of the underlying funds.
G For the period August 30, 2007 (commencement of operations) to July 31, 2008.
H Expense ratios reflect operating expenses of the class. Expenses before reductions do not reflect amounts reimbursed by the investment adviser or reductions from expense offset arrangements and do not represent the amount paid by the class during periods when reimbursements or reductions occur. Expenses net of fee waivers reflect expenses after reimbursement by the investment adviser but prior to reductions from expense offset arrangements. Expenses net of all reductions represent the net expenses paid by the class but do not include expenses of the investment companies in which the Fund invests.
See accompanying notes which are an integral part of the financial statements.
Annual Report
Financial Highlights - Class T
Years ended July 31, | 2011 | 2010 | 2009 | 2008G |
Selected Per-Share Data | | | | |
Net asset value, beginning of period | $ 46.09 | $ 42.28 | $ 47.10 | $ 50.00 |
Income from Investment Operations | | | | |
Net investment income (loss)E | .696 | .696 | .926 | .985 |
Net realized and unrealized gain (loss) | 4.135 | 3.928 | (4.460) | (2.707) |
Total from investment operations | 4.831 | 4.624 | (3.534) | (1.722) |
Distributions from net investment income | (.712) | (.699) | (.926) | (1.008) |
Distributions from net realized gain | (.219) | (.115) | (.360) | (.170) |
Total distributions | (.931) | (.814) | (1.286) | (1.178) |
Net asset value, end of period | $ 49.99 | $ 46.09 | $ 42.28 | $ 47.10 |
Total ReturnB,C,D | 10.54% | 10.98% | (7.23)% | (3.56)% |
Ratios to Average Net AssetsF,H | | | | |
Expenses before reductions | .50% | .50% | .50% | .50%A |
Expenses net of fee waivers, if any | .50% | .50% | .50% | .50%A |
Expenses net of all reductions | .50% | .50% | .50% | .50%A |
Net investment income (loss) | 1.42% | 1.54% | 2.35% | 2.17%A |
Supplemental Data | | | | |
Net assets, end of period (000 omitted) | $ 196 | $ 134 | $ 171 | $ 187 |
Portfolio turnover rate | 48% | 38% | 60% | 21%A |
A Annualized
B Total returns for periods of less than one year are not annualized.
C Total returns would have been lower if certain expenses had not been reduced during the applicable periods shown.
D Total returns do not include the effect of the sales charges.
E Calculated based on average shares outstanding during the period.
F Amounts do not include the activity of the underlying funds.
G For the period August 30, 2007 (commencement of operations) to July 31, 2008.
H Expense ratios reflect operating expenses of the class. Expenses before reductions do not reflect amounts reimbursed by the investment adviser or reductions from expense offset arrangements and do not represent the amount paid by the class during periods when reimbursements or reductions occur. Expenses net of fee waivers reflect expenses after reimbursement by the investment adviser but prior to reductions from expense offset arrangements. Expenses net of all reductions represent the net expenses paid by the class but do not include expenses of the investment companies in which the Fund invests.
Financial Highlights - Class C
Years ended July 31, | 2011 | 2010 | 2009 | 2008G |
Selected Per-Share Data | | | | |
Net asset value, beginning of period | $ 46.06 | $ 42.26 | $ 47.08 | $ 50.00 |
Income from Investment Operations | | | | |
Net investment income (loss)E | .449 | .473 | .736 | .755 |
Net realized and unrealized gain (loss) | 4.132 | 3.923 | (4.471) | (2.699) |
Total from investment operations | 4.581 | 4.396 | (3.735) | (1.944) |
Distributions from net investment income | (.452) | (.481) | (.725) | (.806) |
Distributions from net realized gain | (.219) | (.115) | (.360) | (.170) |
Total distributions | (.671) | (.596) | (1.085) | (.976) |
Net asset value, end of period | $ 49.97 | $ 46.06 | $ 42.26 | $ 47.08 |
Total ReturnB,C,D | 9.98% | 10.43% | (7.70)% | (3.99)% |
Ratios to Average Net AssetsF,H | | | | |
Expenses before reductions | 1.00% | 1.00% | 1.00% | 1.00%A |
Expenses net of fee waivers, if any | 1.00% | 1.00% | 1.00% | 1.00%A |
Expenses net of all reductions | 1.00% | 1.00% | 1.00% | 1.00%A |
Net investment income (loss) | .92% | 1.05% | 1.85% | 1.67%A |
Supplemental Data | | | | |
Net assets, end of period (000 omitted) | $ 228 | $ 295 | $ 221 | $ 275 |
Portfolio turnover rate | 48% | 38% | 60% | 21%A |
A Annualized
B Total returns for periods of less than one year are not annualized.
C Total returns would have been lower if certain expenses had not been reduced during the applicable periods shown.
D Total returns do not include the effect of the contingent deferred sales charge.
E Calculated based on average shares outstanding during the period.
F Amounts do not include the activity of the underlying funds.
G For the period August 30, 2007 (commencement of operations) to July 31, 2008.
H Expense ratios reflect operating expenses of the class. Expenses before reductions do not reflect amounts reimbursed by the investment adviser or reductions from expense offset arrangements and do not represent the amount paid by the class during periods when reimbursements or reductions occur. Expenses net of fee waivers reflect expenses after reimbursement by the investment adviser but prior to reductions from expense offset arrangements. Expenses net of all reductions represent the net expenses paid by the class but do not include expenses of the investment companies in which the Fund invests.
See accompanying notes which are an integral part of the financial statements.
Annual Report
Financial Highlights - Income Replacement 2020
Years ended July 31, | 2011 | 2010 | 2009 | 2008G |
Selected Per-Share Data | | | | |
Net asset value, beginning of period | $ 46.09 | $ 42.29 | $ 47.12 | $ 50.00 |
Income from Investment Operations | | | | |
Net investment income (loss)D | .942 | .925 | 1.125 | 1.190 |
Net realized and unrealized gain (loss) | 4.138 | 3.919 | (4.464) | (2.677) |
Total from investment operations | 5.080 | 4.844 | (3.339) | (1.487) |
Distributions from net investment income | (.951) | (.929) | (1.131) | (1.223) |
Distributions from net realized gain | (.219) | (.115) | (.360) | (.170) |
Total distributions | (1.170) | (1.044) | (1.491) | (1.393) |
Net asset value, end of period | $ 50.00 | $ 46.09 | $ 42.29 | $ 47.12 |
Total ReturnB,C | 11.10% | 11.52% | (6.76)% | (3.10)% |
Ratios to Average Net AssetsE,H | | | | |
Expenses before reductionsF | .00% | .00% | .00% | .00%A |
Expenses net of fee waivers, if any | .00% | .00% | .00% | .00%A |
Expenses net of all reductions | .00% | .00% | .00% | .00%A |
Net investment income (loss) | 1.92% | 2.04% | 2.86% | 2.67%A |
Supplemental Data | | | | |
Net assets, end of period (000 omitted) | $ 3,079 | $ 2,225 | $ 1,624 | $ 1,233 |
Portfolio turnover rate | 48% | 38% | 60% | 21%A |
A Annualized
B Total returns for periods of less than one year are not annualized.
C Total returns would have been lower if certain expenses had not been reduced during the applicable periods shown.
D Calculated based on average shares outstanding during the period.
E Amounts do not include the activity of the underlying funds.
F Amount represents less than .01%.
G For the period August 30, 2007 (commencement of operations) to July 31, 2008.
H Expense ratios reflect operating expenses of the class. Expenses before reductions do not reflect amounts reimbursed by the investment adviser or reductions from expense offset arrangements and do not represent the amount paid by the class during periods when reimbursements or reductions occur. Expenses net of fee waivers reflect expenses after reimbursement by the investment adviser but prior to reductions from expense offset arrangements. Expenses net of all reductions represent the net expenses paid by the class but do not include expenses of the investment companies in which the Fund invests.
Financial Highlights - Institutional Class
Years ended July 31, | 2011 | 2010 | 2009 | 2008G |
Selected Per-Share Data | | | | |
Net asset value, beginning of period | $ 46.09 | $ 42.29 | $ 47.12 | $ 50.00 |
Income from Investment Operations | | | | |
Net investment income (loss)D | .939 | .928 | 1.138 | 1.215 |
Net realized and unrealized gain (loss) | 4.141 | 3.916 | (4.477) | (2.702) |
Total from investment operations | 5.080 | 4.844 | (3.339) | (1.487) |
Distributions from net investment income | (.951) | (.929) | (1.131) | (1.223) |
Distributions from net realized gain | (.219) | (.115) | (.360) | (.170) |
Total distributions | (1.170) | (1.044) | (1.491) | (1.393) |
Net asset value, end of period | $ 50.00 | $ 46.09 | $ 42.29 | $ 47.12 |
Total ReturnB,C | 11.10% | 11.52% | (6.76)% | (3.10)% |
Ratios to Average Net AssetsE,H | | | | |
Expenses before reductionsF | .00% | .00% | .00% | .00%A |
Expenses net of fee waivers, if any | .00% | .00% | .00% | .00%A |
Expenses net of all reductions | .00% | .00% | .00% | .00%A |
Net investment income (loss) | 1.92% | 2.04% | 2.85% | 2.67%A |
Supplemental Data | | | | |
Net assets, end of period (000 omitted) | $ 32 | $ 49 | $ 95 | $ 163 |
Portfolio turnover rate | 48% | 38% | 60% | 21%A |
A Annualized
B Total returns for periods of less than one year are not annualized.
C Total returns would have been lower if certain expenses had not been reduced during the applicable periods shown.
D Calculated based on average shares outstanding during the period.
E Amounts do not include the activity of the underlying funds.
F Amount represents less than .01%.
G For the period August 30, 2007 (commencement of operations) to July 31, 2008.
H Expense ratios reflect operating expenses of the class. Expenses before reductions do not reflect amounts reimbursed by the investment adviser or reductions from expense offset arrangements and do not represent the amount paid by the class during periods when reimbursements or reductions occur. Expenses net of fee waivers reflect expenses after reimbursement by the investment adviser but prior to reductions from expense offset arrangements. Expenses net of all reductions represent the net expenses paid by the class but do not include expenses of the investment companies in which the Fund invests.
See accompanying notes which are an integral part of the financial statements.
Annual Report
Fidelity Income Replacement 2022 Fund
Investment Changes (Unaudited)
Fund Holdings as of July 31, 2011 |
| % of fund's
net assets | % of fund's net assets
6 months ago |
Domestic Equity Funds | | |
Fidelity Advisor Mid Cap II Fund Institutional Class | 4.5 | 4.6 |
Fidelity Disciplined Equity Fund | 4.7 | 4.8 |
Fidelity Equity-Income Fund | 4.6 | 4.8 |
Fidelity Large Cap Core Enhanced Index Fund | 7.7 | 7.8 |
Fidelity Series 100 Index Fund | 5.8 | 5.8 |
Fidelity Series Broad Market Opportunities Fund | 7.6 | 7.8 |
Fidelity Series Small Cap Opportunities Fund | 3.0 | 3.1 |
| 37.9 | 38.7 |
International Equity Funds | | |
Fidelity Advisor International Discovery Fund Institutional Class | 4.6 | 4.8 |
High Yield Fixed-Income Funds | | |
Fidelity Capital & Income Fund | 1.7 | 1.7 |
Fidelity Strategic Income Fund | 1.8 | 1.8 |
| 3.5 | 3.5 |
Investment Grade Fixed-Income Funds | | |
Fidelity Government Income Fund | 6.9 | 6.7 |
Fidelity Strategic Real Return Fund | 6.8 | 6.8 |
Fidelity Total Bond Fund | 20.5 | 20.3 |
| 34.2 | 33.8 |
Short-Term Funds | | |
Fidelity Institutional Money Market Portfolio Institutional Class | 9.9 | 9.6 |
Fidelity Short-Term Bond Fund | 9.9 | 9.6 |
| 19.8 | 19.2 |
Net Other Assets (Liabilities)* | 0.0 | 0.0 |
| 100.0 | 100.0 |
* Amount represents less than 0.1% |
Asset Allocation (% of fund's net assets) |
Current |
| Domestic Equity Funds | 37.9% | |
| International Equity Funds | 4.6% | |
| High Yield
Fixed-Income Funds | 3.5% | |
| Investment Grade Fixed-Income Funds | 34.2% | |
| Short-Term Funds | 19.8% | |

Six months ago |
| Domestic Equity Funds | 38.7% | |
| International Equity Funds | 4.8% | |
| High Yield
Fixed-Income Funds | 3.5% | |
| Investment Grade Fixed-Income Funds | 33.8% | |
| Short-Term Funds | 19.2% | |

Expected |
| Domestic Equity Funds | 36.9% | |
| International Equity Funds | 4.3% | |
| High Yield
Fixed-Income Funds | 3.2% | |
| Investment Grade Fixed-Income Funds | 34.9% | |
| Short-Term Funds | 20.7% | |

The fund invests according to an asset allocation strategy that becomes increasingly conservative over time. The six months ago allocation is based on the fund's holdings as of January 31, 2011. The current allocation is based on the fund's holdings as of July 31, 2011. The expected allocation represents the fund's anticipated allocation at January 31, 2012. |
Annual Report
Fidelity Income Replacement 2022 Fund
Investments July 31, 2011
Showing Percentage of Net Assets
Equity Funds - 42.5% |
| Shares | | Value |
Domestic Equity Funds - 37.9% |
Fidelity Advisor Mid Cap II Fund Institutional Class (a) | 8,478 | | $ 153,712 |
Fidelity Disciplined Equity Fund | 6,883 | | 160,235 |
Fidelity Equity-Income Fund | 3,560 | | 157,914 |
Fidelity Large Cap Core Enhanced Index Fund | 29,054 | | 260,616 |
Fidelity Series 100 Index Fund | 21,663 | | 196,046 |
Fidelity Series Broad Market Opportunities Fund | 24,921 | | 256,689 |
Fidelity Series Small Cap Opportunities Fund | 9,074 | | 101,805 |
TOTAL DOMESTIC EQUITY FUNDS | | 1,287,017 |
International Equity Funds - 4.6% |
Fidelity Advisor International Discovery Fund Institutional Class | 4,654 | | 156,500 |
TOTAL EQUITY FUNDS (Cost $1,498,678) | 1,443,517 |
Fixed-Income Funds - 37.7% |
| | | |
High Yield Fixed-Income Funds - 3.5% |
Fidelity Capital & Income Fund | 6,066 | | 58,055 |
Fidelity Strategic Income Fund | 5,247 | | 59,707 |
TOTAL HIGH YIELD FIXED-INCOME FUNDS | | 117,762 |
|
| Shares | | Value |
Investment Grade Fixed-Income Funds - 34.2% |
Fidelity Government Income Fund | 21,813 | | $ 232,960 |
Fidelity Strategic Real Return Fund | 23,409 | | 232,688 |
Fidelity Total Bond Fund | 63,382 | | 697,839 |
TOTAL INVESTMENT GRADE FIXED-INCOME FUNDS | | 1,163,487 |
TOTAL FIXED-INCOME FUNDS (Cost $1,236,149) | 1,281,249 |
Short-Term Funds - 19.8% |
| | | |
Fidelity Institutional Money Market Portfolio Institutional Class | 334,581 | | 334,581 |
Fidelity Short-Term Bond Fund | 39,427 | | 336,703 |
TOTAL SHORT-TERM FUNDS (Cost $669,361) | 671,284 |
TOTAL INVESTMENT PORTFOLIO - 100.0% (Cost $3,404,188) | | 3,396,050 |
NET OTHER ASSETS (LIABILITIES) - 0.0% | | (49) |
NET ASSETS - 100% | $ 3,396,001 |
Legend |
(a) Non-income producing |
Other Information |
All investments are categorized as Level 1 under the Fair Value Hierarchy. The inputs or methodology used for valuing securities may not be an indication of the risk associated with investing in those securities. For more information on valuation inputs, please refer to the Security Valuation section in the accompanying Notes to Financial Statements. |
Income Tax Information |
At July 31, 2011, the Fund had a capital loss carryforward of approximately $619,540 of which $64,025, $481,397 and $74,118 will expire in fiscal 2017, 2018 and 2019, respectively. Capital loss carryforwards are only available to offset future capital gains of the Fund to the extent provided by regulations and may be limited. |
See accompanying notes which are an integral part of the financial statements.
Annual Report
Fidelity Income Replacement 2022 Fund
Statement of Assets and Liabilities
| July 31, 2011 |
| | |
Assets | | |
Investment in securities, at value (cost $3,404,188) - See accompanying schedule | | $ 3,396,050 |
Cash | | 1 |
Receivable for investments sold | | 2 |
Total assets | | 3,396,053 |
| | |
Liabilities | | |
Distribution and service plan fees payable | | 52 |
| | |
Net Assets | | $ 3,396,001 |
Net Assets consist of: | | |
Paid in capital | | $ 4,057,410 |
Undistributed net investment income | | 761 |
Accumulated undistributed net realized gain (loss) on investments | | (654,032) |
Net unrealized appreciation (depreciation) on investments | | (8,138) |
Net Assets | | $ 3,396,001 |
| | |
Calculation of Maximum Offering Price Class A:
Net Asset Value and redemption price per share ($71,513 ÷ 1,436.28 shares) | | $ 49.79 |
| | |
Maximum offering price per share (100/94.25 of $49.79) | | $ 52.83 |
| | |
Class T:
Net Asset Value and redemption price per share ($22,848 ÷ 458.60 shares) | | $ 49.82 |
| | |
Maximum offering price per share (100/96.50 of $49.82) | | $ 51.63 |
| | |
Class C:
Net Asset Value and offering price per share ($32,317 ÷ 648.81 shares)A | | $ 49.81 |
| | |
Income Replacement 2022:
Net Asset Value, offering price and redemption price per share ($3,265,504 ÷ 65,598.59 shares) | | $ 49.78 |
| | |
Institutional Class:
Net Asset Value, offering price and redemption price per share ($3,819 ÷ 76.73 shares) | | $ 49.77 |
A Redemption price per share is equal to net asset value less any applicable contingent deferred sales charge.
Statement of Operations
| Year ended July 31, 2011 |
| | |
Investment Income | | |
Income distributions from underlying funds | | $ 58,689 |
| | |
Expenses | | |
Distribution and service plan fees | $ 836 | |
Independent trustees' compensation | 11 | |
Total expenses before reductions | 847 | |
Expense reductions | (11) | 836 |
Net investment income (loss) | | 57,853 |
Realized and Unrealized Gain (Loss) Realized gain (loss) on sale of underlying fund shares | 33,778 | |
Capital gain distributions from underlying funds | 17,436 | |
Total net realized gain (loss) | | 51,214 |
Change in net unrealized appreciation (depreciation) on underlying funds | | 211,768 |
Net gain (loss) | | 262,982 |
Net increase (decrease) in net assets resulting from operations | | $ 320,835 |
See accompanying notes which are an integral part of the financial statements.
Annual Report
Fidelity Income Replacement 2022 Fund
Financial Statements - continued
Statement of Changes in Net Assets
| Year ended
July 31, 2011 | Year ended
July 31, 2010 |
Increase (Decrease) in Net Assets | | |
Operations | | |
Net investment income (loss) | $ 57,853 | $ 57,048 |
Net realized gain (loss) | 51,214 | (60,204) |
Change in net unrealized appreciation (depreciation) | 211,768 | 328,653 |
Net increase (decrease) in net assets resulting from operations | 320,835 | 325,497 |
Distributions to shareholders from net investment income | (57,885) | (57,173) |
Distributions to shareholders from net realized gain | (12,730) | (19,734) |
Total distributions | (70,615) | (76,907) |
Share transactions - net increase (decrease) | 582,659 | (508,119) |
Total increase (decrease) in net assets | 832,879 | (259,529) |
| | |
Net Assets | | |
Beginning of period | 2,563,122 | 2,822,651 |
End of period (including undistributed net investment income of $761 and undistributed net investment income of $816, respectively) | $ 3,396,001 | $ 2,563,122 |
Financial Highlights - Class A
Years ended July 31, | 2011 | 2010 | 2009 | 2008G |
Selected Per-Share Data | | | | |
Net asset value, beginning of period | $ 45.58 | $ 41.87 | $ 47.05 | $ 50.00 |
Income from Investment Operations | | | | |
Net investment income (loss)E | .817 | .815 | 1.035 | 1.087 |
Net realized and unrealized gain (loss) | 4.431 | 3.980 | (4.739) | (2.853) |
Total from investment operations | 5.248 | 4.795 | (3.704) | (1.766) |
Distributions from net investment income | (.824) | (.793) | (1.056) | (1.014) |
Distributions from net realized gain | (.214) | (.292) | (.420) | (.170) |
Total distributions | (1.038) | (1.085) | (1.476) | (1.184) |
Net asset value, end of period | $ 49.79 | $ 45.58 | $ 41.87 | $ 47.05 |
Total ReturnB,C,D | 11.58% | 11.53% | (7.53)% | (3.64)% |
Ratios to Average Net AssetsF,H | | | | |
Expenses before reductions | .25% | .25% | .26% | .25%A |
Expenses net of fee waivers, if any | .25% | .25% | .26% | .25%A |
Expenses net of all reductions | .25% | .25% | .26% | .25%A |
Net investment income (loss) | 1.67% | 1.82% | 2.62% | 2.41%A |
Supplemental Data | | | | |
Net assets, end of period (000 omitted) | $ 72 | $ 42 | $ 122 | $ 289 |
Portfolio turnover rate | 29% | 24% | 22% | 32%A |
A Annualized
B Total returns for periods of less than one year are not annualized.
C Total returns would have been lower if certain expenses had not been reduced during the applicable periods shown.
D Total returns do not include the effect of the sales charges.
E Calculated based on average shares outstanding during the period.
F Amounts do not include the activity of the underlying funds.
G For the period August 30, 2007 (commencement of operations) to July 31, 2008.
H Expense ratios reflect operating expenses of the class. Expenses before reductions do not reflect amounts reimbursed by the investment adviser or reductions from expense offset arrangements and do not represent the amount paid by the class during periods when reimbursements or reductions occur. Expenses net of fee waivers reflect expenses after reimbursement by the investment adviser but prior to reductions from expense offset arrangements. Expenses net of all reductions represent the net expenses paid by the class but do not include expenses of the investment companies in which the Fund invests.
See accompanying notes which are an integral part of the financial statements.
Annual Report
Financial Highlights - Class T
Years ended July 31, | 2011 | 2010 | 2009 | 2008G |
Selected Per-Share Data | | | | |
Net asset value, beginning of period | $ 45.57 | $ 41.86 | $ 47.04 | $ 50.00 |
Income from Investment Operations | | | | |
Net investment income (loss)E | .691 | .702 | .933 | .982 |
Net realized and unrealized gain (loss) | 4.434 | 3.985 | (4.736) | (2.862) |
Total from investment operations | 5.125 | 4.687 | (3.803) | (1.880) |
Distributions from net investment income | (.661) | (.685) | (.957) | (.910) |
Distributions from net realized gain | (.214) | (.292) | (.420) | (.170) |
Total distributions | (.875) | (.977) | (1.377) | (1.080) |
Net asset value, end of period | $ 49.82 | $ 45.57 | $ 41.86 | $ 47.04 |
Total ReturnB,C,D | 11.30% | 11.27% | (7.77)% | (3.87)% |
Ratios to Average Net AssetsF,H | | | | |
Expenses before reductions | .50% | .50% | .51% | .50%A |
Expenses net of fee waivers, if any | .50% | .50% | .51% | .50%A |
Expenses net of all reductions | .50% | .50% | .51% | .50%A |
Net investment income (loss) | 1.43% | 1.57% | 2.37% | 2.16%A |
Supplemental Data | | | | |
Net assets, end of period (000 omitted) | $ 23 | $ 77 | $ 112 | $ 187 |
Portfolio turnover rate | 29% | 24% | 22% | 32%A |
A Annualized
B Total returns for periods of less than one year are not annualized.
C Total returns would have been lower if certain expenses had not been reduced during the applicable periods shown.
D Total returns do not include the effect of the sales charges.
E Calculated based on average shares outstanding during the period.
F Amounts do not include the activity of the underlying funds.
G For the period August 30, 2007 (commencement of operations) to July 31, 2008.
H Expense ratios reflect operating expenses of the class. Expenses before reductions do not reflect amounts reimbursed by the investment adviser or reductions from expense offset arrangements and do not represent the amount paid by the class during periods when reimbursements or reductions occur. Expenses net of fee waivers reflect expenses after reimbursement by the investment adviser but prior to reductions from expense offset arrangements. Expenses net of all reductions represent the net expenses paid by the class but do not include expenses of the investment companies in which the Fund invests.
Financial Highlights - Class C
Years ended July 31, | 2011 | 2010 | 2009 | 2008G |
Selected Per-Share Data | | | | |
Net asset value, beginning of period | $ 45.58 | $ 41.86 | $ 47.04 | $ 50.00 |
Income from Investment Operations | | | | |
Net investment income (loss)E | .447 | .477 | .737 | .760 |
Net realized and unrealized gain (loss) | 4.434 | 3.989 | (4.745) | (2.860) |
Total from investment operations | 4.881 | 4.466 | (4.008) | (2.100) |
Distributions from net investment income | (.437) | (.454) | (.752) | (.690) |
Distributions from net realized gain | (.214) | (.292) | (.420) | (.170) |
Total distributions | (.651) | (.746) | (1.172) | (.860) |
Net asset value, end of period | $ 49.81 | $ 45.58 | $ 41.86 | $ 47.04 |
Total ReturnB,C,D | 10.74% | 10.72% | (8.25)% | (4.29)% |
Ratios to Average Net AssetsF,H | | | | |
Expenses before reductions | 1.00% | 1.00% | 1.01% | 1.00%A |
Expenses net of fee waivers, if any | 1.00% | 1.00% | 1.01% | 1.00%A |
Expenses net of all reductions | 1.00% | 1.00% | 1.01% | 1.00%A |
Net investment income (loss) | .92% | 1.07% | 1.87% | 1.66%A |
Supplemental Data | | | | |
Net assets, end of period (000 omitted) | $ 32 | $ 44 | $ 69 | $ 120 |
Portfolio turnover rate | 29% | 24% | 22% | 32%A |
A Annualized
B Total returns for periods of less than one year are not annualized.
C Total returns would have been lower if certain expenses had not been reduced during the applicable periods shown.
D Total returns do not include the effect of the contingent deferred sales charge.
E Calculated based on average shares outstanding during the period.
F Amounts do not include the activity of the underlying funds.
G For the period August 30, 2007 (commencement of operations) to July 31, 2008.
H Expense ratios reflect operating expenses of the class. Expenses before reductions do not reflect amounts reimbursed by the investment adviser or reductions from expense offset arrangements and do not represent the amount paid by the class during periods when reimbursements or reductions occur. Expenses net of fee waivers reflect expenses after reimbursement by the investment adviser but prior to reductions from expense offset arrangements. Expenses net of all reductions represent the net expenses paid by the class but do not include expenses of the investment companies in which the Fund invests.
See accompanying notes which are an integral part of the financial statements.
Annual Report
Financial Highlights - Income Replacement 2022
Years ended July 31, | 2011 | 2010 | 2009 | 2008G |
Selected Per-Share Data | | | | |
Net asset value, beginning of period | $ 45.56 | $ 41.87 | $ 47.06 | $ 50.00 |
Income from Investment Operations | | | | |
Net investment income (loss)D | .937 | .925 | 1.144 | 1.190 |
Net realized and unrealized gain (loss) | 4.438 | 3.978 | (4.752) | (2.836) |
Total from investment operations | 5.375 | 4.903 | (3.608) | (1.646) |
Distributions from net investment income | (.941) | (.921) | (1.162) | (1.124) |
Distributions from net realized gain | (.214) | (.292) | (.420) | (.170) |
Total distributions | (1.155) | (1.213) | (1.582) | (1.294) |
Net asset value, end of period | $ 49.78 | $ 45.56 | $ 41.87 | $ 47.06 |
Total ReturnB,C | 11.87% | 11.80% | (7.30)% | (3.41)% |
Ratios to Average Net AssetsE,H | | | | |
Expenses before reductions | .00%F | .00%F | .01% | .00%A,F |
Expenses net of fee waivers, if any | .00% | .00% | .01% | .00%A |
Expenses net of all reductions | .00% | .00% | .01% | .00%A |
Net investment income (loss) | 1.92% | 2.07% | 2.87% | 2.66%A |
Supplemental Data | | | | |
Net assets, end of period (000 omitted) | $ 3,266 | $ 2,395 | $ 2,353 | $ 4,666 |
Portfolio turnover rate | 29% | 24% | 22% | 32%A |
A Annualized
B Total returns for periods of less than one year are not annualized.
C Total returns would have been lower if certain expenses had not been reduced during the applicable periods shown.
D Calculated based on average shares outstanding during the period.
E Amounts do not include the activity of the underlying funds.
F Amount represents less than .01%.
G For the period August 30, 2007 (commencement of operations) to July 31, 2008.
H Expense ratios reflect operating expenses of the class. Expenses before reductions do not reflect amounts reimbursed by the investment adviser or reductions from expense offset arrangements and do not represent the amount paid by the class during periods when reimbursements or reductions occur. Expenses net of fee waivers reflect expenses after reimbursement by the investment adviser but prior to reductions from expense offset arrangements. Expenses net of all reductions represent the net expenses paid by the class but do not include expenses of the investment companies in which the Fund invests.
Financial Highlights - Institutional Class
Years ended July 31, | 2011 | 2010 | 2009 | 2008G |
Selected Per-Share Data | | | | |
Net asset value, beginning of period | $ 45.56 | $ 41.86 | $ 47.06 | $ 50.00 |
Income from Investment Operations | | | | |
Net investment income (loss)D | .937 | .918 | 1.131 | 1.208 |
Net realized and unrealized gain (loss) | 4.428 | 3.995 | (4.749) | (2.854) |
Total from investment operations | 5.365 | 4.913 | (3.618) | (1.646) |
Distributions from net investment income | (.941) | (.921) | (1.162) | (1.124) |
Distributions from net realized gain | (.214) | (.292) | (.420) | (.170) |
Total distributions | (1.155) | (1.213) | (1.582) | (1.294) |
Net asset value, end of period | $ 49.77 | $ 45.56 | $ 41.86 | $ 47.06 |
Total ReturnB,C | 11.85% | 11.83% | (7.33)% | (3.41)% |
Ratios to Average Net AssetsE,H | | | | |
Expenses before reductions | .00%F | .00%F | .01% | .00%A,F |
Expenses net of fee waivers, if any | .00% | .00% | .01% | .00%A |
Expenses net of all reductions | .00% | .00% | .01% | .00%A |
Net investment income (loss) | 1.92% | 2.07% | 2.87% | 2.66%A |
Supplemental Data | | | | |
Net assets, end of period (000 omitted) | $ 4 | $ 5 | $ 166 | $ 277 |
Portfolio turnover rate | 29% | 24% | 22% | 32%A |
A Annualized
B Total returns for periods of less than one year are not annualized.
C Total returns would have been lower if certain expenses had not been reduced during the applicable periods shown.
D Calculated based on average shares outstanding during the period.
E Amounts do not include the activity of the underlying funds.
F Amount represents less than .01%.
G For the period August 30, 2007 (commencement of operations) to July 31, 2008.
H Expense ratios reflect operating expenses of the class. Expenses before reductions do not reflect amounts reimbursed by the investment adviser or reductions from expense offset arrangements and do not represent the amount paid by the class during periods when reimbursements or reductions occur. Expenses net of fee waivers reflect expenses after reimbursement by the investment adviser but prior to reductions from expense offset arrangements. Expenses net of all reductions represent the net expenses paid by the class but do not include expenses of the investment companies in which the Fund invests.
See accompanying notes which are an integral part of the financial statements.
Annual Report
Fidelity Income Replacement 2024 Fund
Investment Changes (Unaudited)
Fund Holdings as of July 31, 2011 |
| % of fund's
net assets | % of fund's net assets
6 months ago |
Domestic Equity Funds | | |
Fidelity Advisor Mid Cap II Fund Institutional Class | 4.8 | 4.9 |
Fidelity Disciplined Equity Fund | 5.0 | 5.1 |
Fidelity Equity-Income Fund | 5.0 | 5.1 |
Fidelity Large Cap Core Enhanced Index Fund | 8.2 | 8.3 |
Fidelity Series 100 Index Fund | 6.2 | 6.2 |
Fidelity Series Broad Market Opportunities Fund | 8.1 | 8.3 |
Fidelity Series Small Cap Opportunities Fund | 3.2 | 3.3 |
| 40.5 | 41.2 |
International Equity Funds | | |
Fidelity Advisor International Discovery Fund Institutional Class | 5.5 | 5.6 |
High Yield Fixed-Income Funds | | |
Fidelity Capital & Income Fund | 2.0 | 2.0 |
Fidelity Strategic Income Fund | 2.0 | 2.0 |
| 4.0 | 4.0 |
Investment Grade Fixed-Income Funds | | |
Fidelity Government Income Fund | 6.5 | 6.4 |
Fidelity Strategic Real Return Fund | 6.5 | 6.5 |
Fidelity Total Bond Fund | 19.6 | 19.3 |
| 32.6 | 32.2 |
Short-Term Funds | | |
Fidelity Institutional Money Market Portfolio Institutional Class | 8.7 | 8.5 |
Fidelity Short-Term Bond Fund | 8.7 | 8.5 |
| 17.4 | 17.0 |
Net Other Assets (Liabilities)* | 0.0 | 0.0 |
| 100.0 | 100.0 |
* Amount represents less than 0.1% |
Asset Allocation (% of fund's net assets) |
Current |
| Domestic Equity Funds | 40.5% | |
| International Equity Funds | 5.5% | |
| High Yield
Fixed-Income Funds | 4.0% | |
| Investment Grade Fixed-Income Funds | 32.6% | |
| Short-Term Funds | 17.4% | |

Six months ago |
| Domestic Equity Funds | 41.2% | |
| International Equity Funds | 5.6% | |
| High Yield
Fixed-Income Funds | 4.0% | |
| Investment Grade Fixed-Income Funds | 32.2% | |
| Short-Term Funds | 17.0% | |

Expected |
| Domestic Equity Funds | 40.1% | |
| International Equity Funds | 5.2% | |
| High Yield
Fixed-Income Funds | 3.8% | |
| Investment Grade Fixed-Income Funds | 32.9% | |
| Short-Term Funds | 18.0% | |

The fund invests according to an asset allocation strategy that becomes increasingly conservative over time. The six months ago allocation is based on the fund's holdings as of January 31, 2011. The current allocation is based on the fund's holdings as of July 31, 2011. The expected allocation represents the fund's anticipated allocation at January 31, 2012. |
Annual Report
Fidelity Income Replacement 2024 Fund
Investments July 31, 2011
Showing Percentage of Net Assets
Equity Funds - 46.0% |
| Shares | | Value |
Domestic Equity Funds - 40.5% |
Fidelity Advisor Mid Cap II Fund Institutional Class (a) | 5,049 | | $ 91,546 |
Fidelity Disciplined Equity Fund | 4,095 | | 95,335 |
Fidelity Equity-Income Fund | 2,120 | | 94,043 |
Fidelity Large Cap Core Enhanced Index Fund | 17,276 | | 154,970 |
Fidelity Series 100 Index Fund | 12,883 | | 116,595 |
Fidelity Series Broad Market Opportunities Fund | 14,839 | | 152,838 |
Fidelity Series Small Cap Opportunities Fund | 5,404 | | 60,636 |
TOTAL DOMESTIC EQUITY FUNDS | | 765,963 |
International Equity Funds - 5.5% |
Fidelity Advisor International Discovery Fund Institutional Class | 3,061 | | 102,936 |
TOTAL EQUITY FUNDS (Cost $797,205) | 868,899 |
Fixed-Income Funds - 36.6% |
| | | |
High Yield Fixed-Income Funds - 4.0% |
Fidelity Capital & Income Fund | 3,893 | | 37,255 |
Fidelity Strategic Income Fund | 3,365 | | 38,297 |
TOTAL HIGH YIELD FIXED-INCOME FUNDS | | 75,552 |
|
| Shares | | Value |
Investment Grade Fixed-Income Funds - 32.6% |
Fidelity Government Income Fund | 11,548 | | $ 123,328 |
Fidelity Strategic Real Return Fund | 12,387 | | 123,130 |
Fidelity Total Bond Fund | 33,605 | | 369,993 |
TOTAL INVESTMENT GRADE FIXED-INCOME FUNDS | | 616,451 |
TOTAL FIXED-INCOME FUNDS (Cost $649,880) | 692,003 |
Short-Term Funds - 17.4% |
| | | |
Fidelity Institutional Money Market Portfolio Institutional Class | 164,304 | | 164,304 |
Fidelity Short-Term Bond Fund | 19,359 | | 165,329 |
TOTAL SHORT-TERM FUNDS (Cost $325,980) | 329,633 |
TOTAL INVESTMENT PORTFOLIO - 100.0% (Cost $1,773,065) | | 1,890,535 |
NET OTHER ASSETS (LIABILITIES) - 0.0% | | (136) |
NET ASSETS - 100% | $ 1,890,399 |
Legend |
(a) Non-income producing |
Other Information |
All investments are categorized as Level 1 under the Fair Value Hierarchy. The inputs or methodology used for valuing securities may not be an indication of the risk associated with investing in those securities. For more information on valuation inputs, please refer to the Security Valuation section in the accompanying Notes to Financial Statements. |
Income Tax Information |
At July 31, 2011, the Fund had a capital loss carryforward of approximately $134,792 of which $9,801, $66,647 and $58,344 will expire in fiscal 2017, 2018 and 2019, respectively. Capital loss carryforwards are only available to offset future capital gains of the Fund to the extent provided by regulations and may be limited. |
See accompanying notes which are an integral part of the financial statements.
Annual Report
Fidelity Income Replacement 2024 Fund
Statement of Assets and Liabilities
| July 31, 2011 |
| | |
Assets | | |
Investment in securities, at value (cost $1,773,065) - See accompanying schedule | | $ 1,890,535 |
Cash | | 72 |
Total assets | | 1,890,607 |
| | |
Liabilities | | |
Payable for investments purchased | $ 4 | |
Distribution and service plan fees payable | 204 | |
Total liabilities | | 208 |
| | |
Net Assets | | $ 1,890,399 |
Net Assets consist of: | | |
Paid in capital | | $ 1,937,792 |
Undistributed net investment income | | 362 |
Accumulated undistributed net realized gain (loss) on investments | | (165,225) |
Net unrealized appreciation (depreciation) on investments | | 117,470 |
Net Assets | | $ 1,890,399 |
| | |
Calculation of Maximum Offering Price Class A:
Net Asset Value and redemption price per share ($187,352 ÷ 3,758.0 shares) | | $ 49.85 |
| | |
Maximum offering price per share (100/94.25 of $49.85) | | $ 52.89 |
| | |
Class T:
Net Asset Value and redemption price per share ($40,221 ÷ 806.5 shares) | | $ 49.87 |
| | |
Maximum offering price per share (100/96.50 of $49.87) | | $ 51.68 |
| | |
Class C:
Net Asset Value and offering price per share ($171,805 ÷ 3,448.6 shares)A | | $ 49.82 |
| | |
| | |
Income Replacement 2024:
Net Asset Value, offering price and redemption price per share ($1,463,400 ÷ 29,350.7 shares) | | $ 49.86 |
| | |
Institutional Class:
Net Asset Value, offering price and redemption price per share ($27,621 ÷ 554.0 shares) | | $ 49.86 |
A Redemption price per share is equal to net asset value less any applicable contingent deferred sales charge.
Statement of Operations
| Year ended July 31, 2011 |
| | |
Investment Income | | |
Income distributions from underlying funds | | $ 32,191 |
| | |
Expenses | | |
Distribution and service plan fees | $ 2,557 | |
Independent trustees' compensation | 6 | |
Total expenses before reductions | 2,563 | |
Expense reductions | (6) | 2,557 |
Net investment income (loss) | | 29,634 |
Realized and Unrealized Gain (Loss) Realized gain (loss) on sale of underlying fund shares | (15,024) | |
Capital gain distributions from underlying funds | 9,534 | |
Total net realized gain (loss) | | (5,490) |
Change in net unrealized appreciation (depreciation) on underlying funds | | 160,663 |
Net gain (loss) | | 155,173 |
Net increase (decrease) in net assets resulting from operations | | $ 184,807 |
See accompanying notes which are an integral part of the financial statements.
Annual Report
Statement of Changes in Net Assets
| Year ended
July 31, 2011 | Year ended
July 31, 2010 |
Increase (Decrease) in Net Assets | | |
Operations | | |
Net investment income (loss) | $ 29,634 | $ 30,872 |
Net realized gain (loss) | (5,490) | (37,364) |
Change in net unrealized appreciation (depreciation) | 160,663 | 180,425 |
Net increase (decrease) in net assets resulting from operations | 184,807 | 173,933 |
Distributions to shareholders from net investment income | (29,693) | (30,833) |
Distributions to shareholders from net realized gain | (7,078) | (4,233) |
Total distributions | (36,771) | (35,066) |
Share transactions - net increase (decrease) | 206,846 | 87,922 |
Total increase (decrease) in net assets | 354,882 | 226,789 |
| | |
Net Assets | | |
Beginning of period | 1,535,517 | 1,308,728 |
End of period (including undistributed net investment income of $362 and undistributed net investment income of $438, respectively) | $ 1,890,399 | $ 1,535,517 |
Financial Highlights - Class A
Years ended July 31, | 2011 | 2010 | 2009 | 2008G |
Selected Per-Share Data | | | | |
Net asset value, beginning of period | $ 45.41 | $ 41.48 | $ 46.97 | $ 50.00 |
Income from Investment Operations | | | | |
Net investment income (loss)E | .809 | .811 | 1.014 | 1.063 |
Net realized and unrealized gain (loss) | 4.667 | 4.020 | (5.004) | (2.884) |
Total from investment operations | 5.476 | 4.831 | (3.990) | (1.821) |
Distributions from net investment income | (.819) | (.791) | (1.020) | (1.039) |
Distributions from net realized gain | (.217) | (.110) | (.480) | (.170) |
Total distributions | (1.036) | (.901) | (1.500) | (1.209) |
Net asset value, end of period | $ 49.85 | $ 45.41 | $ 41.48 | $ 46.97 |
Total ReturnB,C,D | 12.13% | 11.70% | (8.10)% | (3.77)% |
Ratios to Average Net AssetsF,H | | | | |
Expenses before reductions | .25% | .25% | .25% | .25%A |
Expenses net of fee waivers, if any | .25% | .25% | .25% | .25%A |
Expenses net of all reductions | .25% | .25% | .25% | .25%A |
Net investment income (loss) | 1.66% | 1.82% | 2.62% | 2.35%A |
Supplemental Data | | | | |
Net assets, end of period (000 omitted) | $ 187 | $ 260 | $ 287 | $ 286 |
Portfolio turnover rate | 26% | 34% | 64% | 41%A |
A Annualized
B Total returns for periods of less than one year are not annualized.
C Total returns would have been lower if certain expenses had not been reduced during the applicable periods shown.
D Total returns do not include the effect of the sales charges.
E Calculated based on average shares outstanding during the period.
F Amounts do not include the activity of the underlying funds.
G For the period August 30, 2007 (commencement of operations) to July 31, 2008.
H Expense ratios reflect operating expenses of the class. Expenses before reductions do not reflect amounts reimbursed by the investment adviser or reductions from expense offset arrangements and do not represent the amount paid by the class during periods when reimbursements or reductions occur. Expenses net of fee waivers reflect expenses after reimbursement by the investment adviser but prior to reductions from expense offset arrangements. Expenses net of all reductions represent the net expenses paid by the class but do not include expenses of the investment companies in which the Fund invests.
See accompanying notes which are an integral part of the financial statements.
Annual Report
Financial Highlights - Class T
Years ended July 31, | 2011 | 2010 | 2009 | 2008G |
Selected Per-Share Data | | | | |
Net asset value, beginning of period | $ 45.42 | $ 41.48 | $ 46.97 | $ 50.00 |
Income from Investment Operations | | | | |
Net investment income (loss)E | .685 | .701 | .919 | .966 |
Net realized and unrealized gain (loss) | 4.672 | 4.025 | (5.010) | (2.903) |
Total from investment operations | 5.357 | 4.726 | (4.091) | (1.937) |
Distributions from net investment income | (.690) | (.676) | (.919) | (.923) |
Distributions from net realized gain | (.217) | (.110) | (.480) | (.170) |
Total distributions | (.907) | (.786) | (1.399) | (1.093) |
Net asset value, end of period | $ 49.87 | $ 45.42 | $ 41.48 | $ 46.97 |
Total ReturnB,C,D | 11.85% | 11.43% | (8.34)% | (3.99)% |
Ratios to Average Net AssetsF,H | | | | |
Expenses before reductions | .50% | .50% | .50% | .50%A |
Expenses net of fee waivers, if any | .50% | .50% | .50% | .50%A |
Expenses net of all reductions | .50% | .50% | .50% | .50%A |
Net investment income (loss) | 1.41% | 1.57% | 2.37% | 2.11%A |
Supplemental Data | | | | |
Net assets, end of period (000 omitted) | $ 40 | $ 54 | $ 69 | $ 96 |
Portfolio turnover rate | 26% | 34% | 64% | 41%A |
A Annualized
B Total returns for periods of less than one year are not annualized.
C Total returns would have been lower if certain expenses had not been reduced during the applicable periods shown.
D Total returns do not include the effect of the sales charges.
E Calculated based on average shares outstanding during the period.
F Amounts do not include the activity of the underlying funds.
G For the period August 30, 2007 (commencement of operations) to July 31, 2008.
H Expense ratios reflect operating expenses of the class. Expenses before reductions do not reflect amounts reimbursed by the investment adviser or reductions from expense offset arrangements and do not represent the amount paid by the class during periods when reimbursements or reductions occur. Expenses net of fee waivers reflect expenses after reimbursement by the investment adviser but prior to reductions from expense offset arrangements. Expenses net of all reductions represent the net expenses paid by the class but do not include expenses of the investment companies in which the Fund invests.
Financial Highlights - Class C
Years ended July 31, | 2011 | 2010 | 2009 | 2008G |
Selected Per-Share Data | | | | |
Net asset value, beginning of period | $ 45.38 | $ 41.45 | $ 46.93 | $ 50.00 |
Income from Investment Operations | | | | |
Net investment income (loss)E | .443 | .476 | .726 | .728 |
Net realized and unrealized gain (loss) | 4.668 | 4.020 | (5.005) | (2.903) |
Total from investment operations | 5.111 | 4.496 | (4.279) | (2.175) |
Distributions from net investment income | (.454) | (.456) | (.721) | (.725) |
Distributions from net realized gain | (.217) | (.110) | (.480) | (.170) |
Total distributions | (.671) | (.566) | (1.201) | (.895) |
Net asset value, end of period | $ 49.82 | $ 45.38 | $ 41.45 | $ 46.93 |
Total ReturnB,C,D | 11.30% | 10.87% | (8.80)% | (4.45)% |
Ratios to Average Net AssetsF,H | | | | |
Expenses before reductions | 1.00% | 1.00% | 1.00% | 1.00%A |
Expenses net of fee waivers, if any | 1.00% | 1.00% | 1.00% | 1.00%A |
Expenses net of all reductions | 1.00% | 1.00% | 1.00% | 1.00%A |
Net investment income (loss) | .91% | 1.07% | 1.87% | 1.61%A |
Supplemental Data | | | | |
Net assets, end of period (000 omitted) | $ 172 | $ 159 | $ 147 | $ 233 |
Portfolio turnover rate | 26% | 34% | 64% | 41%A |
A Annualized
B Total returns for periods of less than one year are not annualized.
C Total returns would have been lower if certain expenses had not been reduced during the applicable periods shown.
D Total returns do not include the effect of the contingent deferred sales charge.
E Calculated based on average shares outstanding during the period.
F Amounts do not include the activity of the underlying funds.
G For the period August 30, 2007 (commencement of operations) to July 31, 2008.
H Expense ratios reflect operating expenses of the class. Expenses before reductions do not reflect amounts reimbursed by the investment adviser or reductions from expense offset arrangements and do not represent the amount paid by the class during periods when reimbursements or reductions occur. Expenses net of fee waivers reflect expenses after reimbursement by the investment adviser but prior to reductions from expense offset arrangements. Expenses net of all reductions represent the net expenses paid by the class but do not include expenses of the investment companies in which the Fund invests.
See accompanying notes which are an integral part of the financial statements.
Annual Report
Financial Highlights - Income Replacement 2024
Years ended July 31, | 2011 | 2010 | 2009 | 2008G |
Selected Per-Share Data | | | | |
Net asset value, beginning of period | $ 45.42 | $ 41.49 | $ 46.98 | $ 50.00 |
Income from Investment Operations | | | | |
Net investment income (loss)D | .933 | .924 | 1.118 | 1.166 |
Net realized and unrealized gain (loss) | 4.668 | 4.020 | (5.011) | (2.868) |
Total from investment operations | 5.601 | 4.944 | (3.893) | (1.702) |
Distributions from net investment income | (.944) | (.904) | (1.117) | (1.148) |
Distributions from net realized gain | (.217) | (.110) | (.480) | (.170) |
Total distributions | (1.161) | (1.014) | (1.597) | (1.318) |
Net asset value, end of period | $ 49.86 | $ 45.42 | $ 41.49 | $ 46.98 |
Total ReturnB,C | 12.41% | 11.98% | (7.87)% | (3.53)% |
Ratios to Average Net AssetsE,H | | | | |
Expenses before reductionsF | .00% | .00% | .00% | .00%A |
Expenses net of fee waivers, if any | .00% | .00% | .00% | .00%A |
Expenses net of all reductions | .00% | .00% | .00% | .00%A |
Net investment income (loss) | 1.91% | 2.07% | 2.87% | 2.60%A |
Supplemental Data | | | | |
Net assets, end of period (000 omitted) | $ 1,463 | $ 1,026 | $ 749 | $ 714 |
Portfolio turnover rate | 26% | 34% | 64% | 41%A |
A Annualized
B Total returns for periods of less than one year are not annualized.
C Total returns would have been lower if certain expenses had not been reduced during the applicable periods shown.
D Calculated based on average shares outstanding during the period.
E Amounts do not include the activity of the underlying funds.
F Amount represents less than .01%.
G For the period August 30, 2007 (commencement of operations) to July 31, 2008.
H Expense ratios reflect operating expenses of the class. Expenses before reductions do not reflect amounts reimbursed by the investment adviser or reductions from expense offset arrangements and do not represent the amount paid by the class during periods when reimbursements or reductions occur. Expenses net of fee waivers reflect expenses after reimbursement by the investment adviser but prior to reductions from expense offset arrangements. Expenses net of all reductions represent the net expenses paid by the class but do not include expenses of the investment companies in which the Fund invests.
Financial Highlights - Institutional Class
Years ended July 31, | 2011 | 2010 | 2009 | 2008G |
Selected Per-Share Data | | | | |
Net asset value, beginning of period | $ 45.42 | $ 41.48 | $ 46.98 | $ 50.00 |
Income from Investment Operations | | | | |
Net investment income (loss)D | .930 | .922 | 1.119 | 1.194 |
Net realized and unrealized gain (loss) | 4.671 | 4.032 | (5.022) | (2.896) |
Total from investment operations | 5.601 | 4.954 | (3.903) | (1.702) |
Distributions from net investment income | (.944) | (.904) | (1.117) | (1.148) |
Distributions from net realized gain | (.217) | (.110) | (.480) | (.170) |
Total distributions | (1.161) | (1.014) | (1.597) | (1.318) |
Net asset value, end of period | $ 49.86 | $ 45.42 | $ 41.48 | $ 46.98 |
Total ReturnB,C | 12.41% | 12.00% | (7.89)% | (3.53)% |
Ratios to Average Net AssetsE,H | | | | |
Expenses before reductionsF | .00% | .00% | .00% | .00%A |
Expenses net of fee waivers, if any | .00% | .00% | .00% | .00%A |
Expenses net of all reductions | .00% | .00% | .00% | .00%A |
Net investment income (loss) | 1.91% | 2.07% | 2.87% | 2.60%A |
Supplemental Data | | | | |
Net assets, end of period (000 omitted) | $ 28 | $ 37 | $ 57 | $ 97 |
Portfolio turnover rate | 26% | 34% | 64% | 41%A |
A Annualized
B Total returns for periods of less than one year are not annualized.
C Total returns would have been lower if certain expenses had not been reduced during the applicable periods shown.
D Calculated based on average shares outstanding during the period.
E Amounts do not include the activity of the underlying funds.
F Amount represents less than .01%.
G For the period August 30, 2007 (commencement of operations) to July 31, 2008.
H Expense ratios reflect operating expenses of the class. Expenses before reductions do not reflect amounts reimbursed by the investment adviser or reductions from expense offset arrangements and do not represent the amount paid by the class during periods when reimbursements or reductions occur. Expenses net of fee waivers reflect expenses after reimbursement by the investment adviser but prior to reductions from expense offset arrangements. Expenses net of all reductions represent the net expenses paid by the class but do not include expenses of the investment companies in which the Fund invests.
See accompanying notes which are an integral part of the financial statements.
Annual Report
Fidelity Income Replacement 2026 Fund
Investment Changes (Unaudited)
Fund Holdings as of July 31, 2011 |
| % of fund's
net assets | % of fund's net assets
6 months ago |
Domestic Equity Funds | | |
Fidelity Advisor Mid Cap II Fund Institutional Class | 5.1 | 5.2 |
Fidelity Disciplined Equity Fund | 5.3 | 5.4 |
Fidelity Equity-Income Fund | 5.2 | 5.4 |
Fidelity Large Cap Core Enhanced Index Fund | 8.5 | 8.6 |
Fidelity Series 100 Index Fund | 6.4 | 6.4 |
Fidelity Series Broad Market Opportunities Fund | 8.4 | 8.6 |
Fidelity Series Small Cap Opportunities Fund | 3.3 | 3.4 |
| 42.2 | 43.0 |
International Equity Funds | | |
Fidelity Advisor International Discovery Fund Institutional Class | 6.3 | 6.4 |
High Yield Fixed-Income Funds | | |
Fidelity Capital & Income Fund | 2.2 | 2.2 |
Fidelity Strategic Income Fund | 2.2 | 2.2 |
| 4.4 | 4.4 |
Investment Grade Fixed-Income Funds | | |
Fidelity Government Income Fund | 6.2 | 6.1 |
Fidelity Strategic Real Return Fund | 6.2 | 6.1 |
Fidelity Total Bond Fund | 18.6 | 18.4 |
| 31.0 | 30.6 |
Short-Term Funds | | |
Fidelity Institutional Money Market Portfolio Institutional Class | 8.0 | 7.8 |
Fidelity Short-Term Bond Fund | 8.1 | 7.8 |
| 16.1 | 15.6 |
Net Other Assets (Liabilities)* | 0.0 | 0.0 |
| 100.0 | 100.0 |
* Amount represents less than 0.1% |
Asset Allocation (% of fund's net assets) |
Current |
| Domestic Equity Funds | 42.2% | |
| International Equity Funds | 6.3% | |
| High Yield
Fixed-Income Funds | 4.4% | |
| Investment Grade Fixed-Income Funds | 31.0% | |
| Short-Term Funds | 16.1% | |

Six months ago |
| Domestic Equity Funds | 43.0% | |
| International Equity Funds | 6.4% | |
| High Yield
Fixed-Income Funds | 4.4% | |
| Investment Grade Fixed-Income Funds | 30.6% | |
| Short-Term Funds | 15.6% | |

Expected |
| Domestic Equity Funds | 42.2% | |
| International Equity Funds | 6.0% | |
| High Yield
Fixed-Income Funds | 4.2% | |
| Investment Grade Fixed-Income Funds | 31.3% | |
| Short-Term Funds | 16.3% | |

The fund invests according to an asset allocation strategy that becomes increasingly conservative over time. The six months ago allocation is based on the fund's holdings as of January 31, 2011. The current allocation is based on the fund's holdings as of July 31, 2011. The expected allocation represents the fund's anticipated allocation at January 31, 2012. |
Annual Report
Fidelity Income Replacement 2026 Fund
Investments July 31, 2011
Showing Percentage of Net Assets
Equity Funds - 48.5% |
| Shares | | Value |
Domestic Equity Funds - 42.2% |
Fidelity Advisor Mid Cap II Fund Institutional Class (a) | 5,898 | | $ 106,934 |
Fidelity Disciplined Equity Fund | 4,781 | | 111,297 |
Fidelity Equity-Income Fund | 2,473 | | 109,722 |
Fidelity Large Cap Core Enhanced Index Fund | 20,161 | | 180,847 |
Fidelity Series 100 Index Fund | 15,033 | | 136,051 |
Fidelity Series Broad Market Opportunities Fund | 17,322 | | 178,417 |
Fidelity Series Small Cap Opportunities Fund | 6,320 | | 70,910 |
TOTAL DOMESTIC EQUITY FUNDS | | 894,178 |
International Equity Funds - 6.3% |
Fidelity Advisor International Discovery Fund Institutional Class | 3,941 | | 132,532 |
TOTAL EQUITY FUNDS (Cost $1,010,950) | 1,026,710 |
Fixed-Income Funds - 35.4% |
| | | |
High Yield Fixed-Income Funds - 4.4% |
Fidelity Capital & Income Fund | 4,801 | | 45,941 |
Fidelity Strategic Income Fund | 4,151 | | 47,240 |
TOTAL HIGH YIELD FIXED-INCOME FUNDS | | 93,181 |
|
| Shares | | Value |
Investment Grade Fixed-Income Funds - 31.0% |
Fidelity Government Income Fund | 12,311 | | $ 131,479 |
Fidelity Strategic Real Return Fund | 13,203 | | 131,240 |
Fidelity Total Bond Fund | 35,788 | | 394,031 |
TOTAL INVESTMENT GRADE FIXED-INCOME FUNDS | | 656,750 |
TOTAL FIXED-INCOME FUNDS (Cost $726,483) | 749,931 |
Short-Term Funds - 16.1% |
| | | |
Fidelity Institutional Money Market Portfolio Institutional Class | 169,363 | | 169,363 |
Fidelity Short-Term Bond Fund | 19,953 | | 170,401 |
TOTAL SHORT-TERM FUNDS (Cost $338,274) | 339,764 |
TOTAL INVESTMENT PORTFOLIO - 100.0% (Cost $2,075,707) | | 2,116,405 |
NET OTHER ASSETS (LIABILITIES) - 0.0% | | (236) |
NET ASSETS - 100% | $ 2,116,169 |
Legend |
(a) Non-income producing |
Other Information |
All investments are categorized as Level 1 under the Fair Value Hierarchy. The inputs or methodology used for valuing securities may not be an indication of the risk associated with investing in those securities. For more information on valuation inputs, please refer to the Security Valuation section in the accompanying Notes to Financial Statements. |
Income Tax Information |
At July 31, 2011, the Fund had a capital loss carryforward of approximately $233,577 all of which will expire in fiscal 2018. Capital loss carryforwards are only available to offset future capital gains of the Fund to the extent provided by regulations and may be limited. |
See accompanying notes which are an integral part of the financial statements.
Annual Report
Fidelity Income Replacement 2026 Fund
Statement of Assets and Liabilities
| July 31, 2011 |
| | |
Assets | | |
Investment in securities, at value (cost $2,075,707) - See accompanying schedule | | $ 2,116,405 |
Receivable for investments sold | | 823 |
Receivable for fund shares sold | | 176 |
Total assets | | 2,117,404 |
| | |
Liabilities | | |
Payable for investments purchased | $ 163 | |
Payable for fund shares redeemed | 838 | |
Distribution and service plan fees payable | 234 | |
Total liabilities | | 1,235 |
| | |
Net Assets | | $ 2,116,169 |
Net Assets consist of: | | |
Paid in capital | | $ 2,329,399 |
Undistributed net investment income | | 405 |
Accumulated undistributed net realized gain (loss) on investments | | (254,333) |
Net unrealized appreciation (depreciation) on investments | | 40,698 |
Net Assets | | $ 2,116,169 |
| | |
Calculation of Maximum Offering Price Class A:
Net Asset Value and redemption price per share ($108,032 ÷ 2,181.2 shares) | | $ 49.53 |
| | |
Maximum offering price per share (100/94.25 of $49.53) | | $ 52.55 |
| | |
Class T:
Net Asset Value and redemption price per share ($130,369 ÷ 2,632.2 shares) | | $ 49.53 |
| | |
Maximum offering price per share (100/96.50 of $49.53) | | $ 51.33 |
| | |
Class C:
Net Asset Value and offering price per share ($184,116 ÷ 3,720.4 shares)A | | $ 49.49 |
| | |
Income Replacement 2026:
Net Asset Value, offering price and redemption price per share ($1,666,155 ÷ 33,638.7 shares) | | $ 49.53 |
| | |
Institutional Class:
Net Asset Value, offering price and redemption price per share ($27,497 ÷ 555.2 shares) | | $ 49.53 |
A Redemption price per share is equal to net asset value less any applicable contingent deferred sales charge.
Statement of Operations
| Year ended July 31, 2011 |
| | |
Investment Income | | |
Income distributions from underlying funds | | $ 26,676 |
| | |
Expenses | | |
Distribution and service plan fees | $ 2,604 | |
Independent trustees' compensation | 5 | |
Total expenses before reductions | 2,609 | |
Expense reductions | (5) | 2,604 |
Net investment income (loss) | | 24,072 |
Realized and Unrealized Gain (Loss) Realized gain (loss) on sale of underlying fund shares | 16,602 | |
Capital gain distributions from underlying funds | 6,465 | |
Total net realized gain (loss) | | 23,067 |
Change in net unrealized appreciation (depreciation) on underlying funds | | 89,707 |
Net gain (loss) | | 112,774 |
Net increase (decrease) in net assets resulting from operations | | $ 136,846 |
See accompanying notes which are an integral part of the financial statements.
Annual Report
Fidelity Income Replacement 2026 Fund
Financial Statements - continued
Statement of Changes in Net Assets
| Year ended
July 31, 2011 | Year ended
July 31, 2010 |
Increase (Decrease) in Net Assets | | |
Operations | | |
Net investment income (loss) | $ 24,072 | $ 13,583 |
Net realized gain (loss) | 23,067 | (46,103) |
Change in net unrealized appreciation (depreciation) | 89,707 | 120,286 |
Net increase (decrease) in net assets resulting from operations | 136,846 | 87,766 |
Distributions to shareholders from net investment income | (23,914) | (13,653) |
Distributions to shareholders from net realized gain | (4,626) | (1,823) |
Total distributions | (28,540) | (15,476) |
Share transactions - net increase (decrease) | 1,015,365 | 199,973 |
Total increase (decrease) in net assets | 1,123,671 | 272,263 |
| | |
Net Assets | | |
Beginning of period | 992,498 | 720,235 |
End of period (including undistributed net investment income of $405 and undistributed net investment income of $259, respectively) | $ 2,116,169 | $ 992,498 |
Financial Highlights - Class A
Years ended July 31, | 2011 | 2010 | 2009 | 2008G |
Selected Per-Share Data | | | | |
Net asset value, beginning of period | $ 44.93 | $ 40.97 | $ 46.76 | $ 50.00 |
Income from Investment Operations | | | | |
Net investment income (loss)E | .750 | .743 | 1.042 | 1.076 |
Net realized and unrealized gain (loss) | 4.846 | 4.098 | (5.184) | (3.105) |
Total from investment operations | 5.596 | 4.841 | (4.142) | (2.029) |
Distributions from net investment income | (.796) | (.771) | (1.028) | (1.031) |
Distributions from net realized gain | (.200) | (.110) | (.620) | (.180) |
Total distributions | (.996) | (.881) | (1.648) | (1.211) |
Net asset value, end of period | $ 49.53 | $ 44.93 | $ 40.97 | $ 46.76 |
Total ReturnB,C,D | 12.52% | 11.87% | (8.56)% | (4.19)% |
Ratios to Average Net AssetsF,H | | | | |
Expenses before reductions | .25% | .25% | .25% | .25%A |
Expenses net of fee waivers, if any | .25% | .25% | .25% | .25%A |
Expenses net of all reductions | .25% | .25% | .25% | .25%A |
Net investment income (loss) | 1.55% | 1.68% | 2.70% | 2.36%A |
Supplemental Data | | | | |
Net assets, end of period (000 omitted) | $ 108 | $ 45 | $ 69 | $ 131 |
Portfolio turnover rate | 25% | 61% | 26% | 21% A |
A Annualized
B Total returns for periods of less than one year are not annualized.
C Total returns would have been lower if certain expenses had not been reduced during the applicable periods shown.
D Total returns do not include the effect of the sales charges.
E Calculated based on average shares outstanding during the period.
F Amounts do not include the activity of the underlying funds.
G For the period August 30, 2007 (commencement of operations) to July 31, 2008.
H Expense ratios reflect operating expenses of the class. Expenses before reductions do not reflect amounts reimbursed by the investment adviser or reductions from expense offset arrangements and do not represent the amount paid by the class during periods when reimbursements or reductions occur. Expenses net of fee waivers reflect expenses after reimbursement by the investment adviser but prior to reductions from expense offset arrangements. Expenses net of all reductions represent the net expenses paid by the class but do not include expenses of the investment companies in which the Fund invests.
See accompanying notes which are an integral part of the financial statements.
Annual Report
Financial Highlights - Class T
Years ended July 31, | 2011 | 2010 | 2009 | 2008G |
Selected Per-Share Data | | | | |
Net asset value, beginning of period | $ 44.92 | $ 40.97 | $ 46.76 | $ 50.00 |
Income from Investment Operations | | | | |
Net investment income (loss)E | .630 | .638 | .944 | .966 |
Net realized and unrealized gain (loss) | 4.851 | 4.092 | (5.184) | (3.110) |
Total from investment operations | 5.481 | 4.730 | (4.240) | (2.144) |
Distributions from net investment income | (.671) | (.670) | (.930) | (.916) |
Distributions from net realized gain | (.200) | (.110) | (.620) | (.180) |
Total distributions | (.871) | (.780) | (1.550) | (1.096) |
Net asset value, end of period | $ 49.53 | $ 44.92 | $ 40.97 | $ 46.76 |
Total ReturnB,C,D | 12.26% | 11.59% | (8.79)% | (4.41)% |
Ratios to Average Net AssetsF,H | | | | |
Expenses before reductions | .50% | .50% | .50% | .50%A |
Expenses net of fee waivers, if any | .50% | .50% | .50% | .50%A |
Expenses net of all reductions | .50% | .50% | .50% | .50%A |
Net investment income (loss) | 1.30% | 1.44% | 2.45% | 2.11%A |
Supplemental Data | | | | |
Net assets, end of period (000 omitted) | $ 130 | $ 116 | $ 55 | $ 96 |
Portfolio turnover rate | 25% | 61% | 26% | 21%A |
A Annualized
B Total returns for periods of less than one year are not annualized.
C Total returns would have been lower if certain expenses had not been reduced during the applicable periods shown.
D Total returns do not include the effect of the sales charges.
E Calculated based on average shares outstanding during the period.
F Amounts do not include the activity of the underlying funds.
G For the period August 30, 2007 (commencement of operations) to July 31, 2008.
H Expense ratios reflect operating expenses of the class. Expenses before reductions do not reflect amounts reimbursed by the investment adviser or reductions from expense offset arrangements and do not represent the amount paid by the class during periods when reimbursements or reductions occur. Expenses net of fee waivers reflect expenses after reimbursement by the investment adviser but prior to reductions from expense offset arrangements. Expenses net of all reductions represent the net expenses paid by the class but do not include expenses of the investment companies in which the Fund invests.
Financial Highlights - Class C
Years ended July 31, | 2011 | 2010 | 2009 | 2008G |
Selected Per-Share Data | | | | |
Net asset value, beginning of period | $ 44.89 | $ 40.95 | $ 46.72 | $ 50.00 |
Income from Investment Operations | | | | |
Net investment income (loss)E | .387 | .412 | .757 | .723 |
Net realized and unrealized gain (loss) | 4.848 | 4.087 | (5.183) | (3.090) |
Total from investment operations | 5.235 | 4.499 | (4.426) | (2.367) |
Distributions from net investment income | (.435) | (.449) | (.724) | (.733) |
Distributions from net realized gain | (.200) | (.110) | (.620) | (.180) |
Total distributions | (.635) | (.559) | (1.344) | (.913) |
Net asset value, end of period | $ 49.49 | $ 44.89 | $ 40.95 | $ 46.72 |
Total ReturnB,C,D | 11.70% | 11.01% | (9.25)% | (4.85)% |
Ratios to Average Net AssetsF,H | | | | |
Expenses before reductions | 1.00% | 1.00% | 1.00% | 1.00%A |
Expenses net of fee waivers, if any | 1.00% | 1.00% | 1.00% | 1.00%A |
Expenses net of all reductions | 1.00% | 1.00% | 1.00% | 1.00%A |
Net investment income (loss) | .80% | .94% | 1.95% | 1.61%A |
Supplemental Data | | | | |
Net assets, end of period (000 omitted) | $ 184 | $ 174 | $ 183 | $ 485 |
Portfolio turnover rate | 25% | 61% | 26% | 21%A |
A Annualized
B Total returns for periods of less than one year are not annualized.
C Total returns would have been lower if certain expenses had not been reduced during the applicable periods shown.
D Total returns do not include the effect of the contingent deferred sales charge.
E Calculated based on average shares outstanding during the period.
F Amounts do not include the activity of the underlying funds.
G For the period August 30, 2007 (commencement of operations) to July 31, 2008.
H Expense ratios reflect operating expenses of the class. Expenses before reductions do not reflect amounts reimbursed by the investment adviser or reductions from expense offset arrangements and do not represent the amount paid by the class during periods when reimbursements or reductions occur. Expenses net of fee waivers reflect expenses after reimbursement by the investment adviser but prior to reductions from expense offset arrangements. Expenses net of all reductions represent the net expenses paid by the class but do not include expenses of the investment companies in which the Fund invests.
See accompanying notes which are an integral part of the financial statements.
Annual Report
Financial Highlights - Income Replacement 2026
Years ended July 31, | 2011 | 2010 | 2009 | 2008G |
Selected Per-Share Data | | | | |
Net asset value, beginning of period | $ 44.92 | $ 40.97 | $ 46.77 | $ 50.00 |
Income from Investment Operations | | | | |
Net investment income (loss)D | .878 | .856 | 1.138 | 1.168 |
Net realized and unrealized gain (loss) | 4.844 | 4.091 | (5.190) | (3.079) |
Total from investment operations | 5.722 | 4.947 | (4.052) | (1.911) |
Distributions from net investment income | (.912) | (.887) | (1.128) | (1.139) |
Distributions from net realized gain | (.200) | (.110) | (.620) | (.180) |
Total distributions | (1.112) | (.997) | (1.748) | (1.319) |
Net asset value, end of period | $ 49.53 | $ 44.92 | $ 40.97 | $ 46.77 |
Total ReturnB,C | 12.82% | 12.14% | (8.34)% | (3.96)% |
Ratios to Average Net AssetsE,H | | | | |
Expenses before reductionsF | .00% | .00% | .00% | .00%A |
Expenses net of fee waivers, if any | .00% | .00% | .00% | .00%A |
Expenses net of all reductions | .00% | .00% | .00% | .00%A |
Net investment income (loss) | 1.80% | 1.94% | 2.95% | 2.61%A |
Supplemental Data | | | | |
Net assets, end of period (000 omitted) | $ 1,666 | $ 622 | $ 357 | $ 783 |
Portfolio turnover rate | 25% | 61% | 26% | 21%A |
A Annualized
B Total returns for periods of less than one year are not annualized.
C Total returns would have been lower if certain expenses had not been reduced during the applicable periods shown.
D Calculated based on average shares outstanding during the period.
E Amounts do not include the activity of the underlying funds.
F Amount represents less than .01%.
G For the period August 30, 2007 (commencement of operations) to July 31, 2008.
H Expense ratios reflect operating expenses of the class. Expenses before reductions do not reflect amounts reimbursed by the investment adviser or reductions from expense offset arrangements and do not represent the amount paid by the class during periods when reimbursements or reductions occur. Expenses net of fee waivers reflect expenses after reimbursement by the investment adviser but prior to reductions from expense offset arrangements. Expenses net of all reductions represent the net expenses paid by the class but do not include expenses of the investment companies in which the Fund invests.
Financial Highlights - Institutional Class
Years ended July 31, | 2011 | 2010 | 2009 | 2008G |
Selected Per-Share Data | | | | |
Net asset value, beginning of period | $ 44.92 | $ 40.97 | $ 46.77 | $ 50.00 |
Income from Investment Operations | | | | |
Net investment income (loss)D | .870 | .855 | 1.136 | 1.196 |
Net realized and unrealized gain (loss) | 4.852 | 4.092 | (5.188) | (3.107) |
Total from investment operations | 5.722 | 4.947 | (4.052) | (1.911) |
Distributions from net investment income | (.912) | (.887) | (1.128) | (1.139) |
Distributions from net realized gain | (.200) | (.110) | (.620) | (.180) |
Total distributions | (1.112) | (.997) | (1.748) | (1.319) |
Net asset value, end of period | $ 49.53 | $ 44.92 | $ 40.97 | $ 46.77 |
Total ReturnB,C | 12.82% | 12.14% | (8.34)% | (3.96)% |
Ratios to Average Net AssetsE,H | | | | |
Expenses before reductionsF | .00% | .00% | .00% | .00%A |
Expenses net of fee waivers, if any | .00% | .00% | .00% | .00%A |
Expenses net of all reductions | .00% | .00% | .00% | .00%A |
Net investment income (loss) | 1.80% | 1.94% | 2.95% | 2.61%A |
Supplemental Data | | | | |
Net assets, end of period (000 omitted) | $ 27 | $ 36 | $ 56 | $ 96 |
Portfolio turnover rate | 25% | 61% | 26% | 21%A |
A Annualized
B Total returns for periods of less than one year are not annualized.
C Total returns would have been lower if certain expenses had not been reduced during the applicable periods shown.
D Calculated based on average shares outstanding during the period.
E Amounts do not include the activity of the underlying funds.
F Amount represents less than .01%.
G For the period August 30, 2007 (commencement of operations) to July 31, 2008.
H Expense ratios reflect operating expenses of the class. Expenses before reductions do not reflect amounts reimbursed by the investment adviser or reductions from expense offset arrangements and do not represent the amount paid by the class during periods when reimbursements or reductions occur. Expenses net of fee waivers reflect expenses after reimbursement by the investment adviser but prior to reductions from expense offset arrangements. Expenses net of all reductions represent the net expenses paid by the class but do not include expenses of the investment companies in which the Fund invests.
See accompanying notes which are an integral part of the financial statements.
Annual Report
Fidelity Income Replacement 2028 Fund
Investment Changes (Unaudited)
Fund Holdings as of July 31, 2011 |
| % of fund's
net assets | % of fund's net assets
6 months ago |
Domestic Equity Funds | | |
Fidelity Advisor Mid Cap II Fund Institutional Class | 5.2 | 5.3 |
Fidelity Disciplined Equity Fund | 5.4 | 5.5 |
Fidelity Equity-Income Fund | 5.4 | 5.5 |
Fidelity Large Cap Core Enhanced Index Fund | 8.8 | 8.9 |
Fidelity Series 100 Index Fund | 6.7 | 6.6 |
Fidelity Series Broad Market Opportunities Fund | 8.7 | 8.9 |
Fidelity Series Small Cap Opportunities Fund | 3.5 | 3.5 |
| 43.7 | 44.2 |
International Equity Funds | | |
Fidelity Advisor International Discovery Fund Institutional Class | 7.0 | 7.2 |
High Yield Fixed-Income Funds | | |
Fidelity Capital & Income Fund | 2.3 | 2.4 |
Fidelity Strategic Income Fund | 2.4 | 2.3 |
| 4.7 | 4.7 |
Investment Grade Fixed-Income Funds | | |
Fidelity Government Income Fund | 6.0 | 5.9 |
Fidelity Strategic Real Return Fund | 6.0 | 6.0 |
Fidelity Total Bond Fund | 18.0 | 17.8 |
| 30.0 | 29.7 |
Short-Term Funds | | |
Fidelity Institutional Money Market Portfolio Institutional Class | 7.3 | 7.1 |
Fidelity Short-Term Bond Fund | 7.3 | 7.1 |
| 14.6 | 14.2 |
Net Other Assets (Liabilities)* | 0.0 | 0.0 |
| 100.0 | 100.0 |
* Amount represents less than 0.1% |
Asset Allocation (% of fund's net assets) |
Current |
| Domestic Equity Funds | 43.7% | |
| International Equity Funds | 7.0% | |
| High Yield
Fixed-Income Funds | 4.7% | |
| Investment Grade Fixed-Income Funds | 30.0% | |
| Short-Term Funds | 14.6% | |

Six months ago |
| Domestic Equity Funds | 44.2% | |
| International Equity Funds | 7.2% | |
| High Yield
Fixed-Income Funds | 4.7% | |
| Investment Grade Fixed-Income Funds | 29.7% | |
| Short-Term Funds | 14.2% | |

Expected |
| Domestic Equity Funds | 43.6% | |
 | International Equity Funds | 6.8% | |
| High Yield
Fixed-Income Funds | 4.6% | |
| Investment Grade Fixed-Income Funds | 30.1% | |
| Short-Term Funds | 14.9% | |

The fund invests according to an asset allocation strategy that becomes increasingly conservative over time. The six months ago allocation is based on the fund's holdings as of January 31, 2011. The current allocation is based on the fund's holdings as of July 31, 2011. The expected allocation represents the fund's anticipated allocation at January 31, 2012. |
Annual Report
Fidelity Income Replacement 2028 Fund
Investments July 31, 2011
Showing Percentage of Net Assets
Equity Funds - 50.7% |
| Shares | | Value |
Domestic Equity Funds - 43.7% |
Fidelity Advisor Mid Cap II Fund Institutional Class (a) | 17,596 | | $ 319,008 |
Fidelity Disciplined Equity Fund | 14,289 | | 332,641 |
Fidelity Equity-Income Fund | 7,396 | | 328,096 |
Fidelity Large Cap Core Enhanced Index Fund | 60,340 | | 541,253 |
Fidelity Series 100 Index Fund | 44,955 | | 406,839 |
Fidelity Series Broad Market Opportunities Fund | 51,796 | | 533,504 |
Fidelity Series Small Cap Opportunities Fund | 18,857 | | 211,575 |
TOTAL DOMESTIC EQUITY FUNDS | | 2,672,916 |
International Equity Funds - 7.0% |
Fidelity Advisor International Discovery Fund Institutional Class | 12,762 | | 429,191 |
TOTAL EQUITY FUNDS (Cost $2,893,214) | 3,102,107 |
Fixed-Income Funds - 34.7% |
| | | |
High Yield Fixed-Income Funds - 4.7% |
Fidelity Capital & Income Fund | 14,925 | | 142,835 |
Fidelity Strategic Income Fund | 12,928 | | 147,120 |
TOTAL HIGH YIELD FIXED-INCOME FUNDS | | 289,955 |
|
| Shares | | Value |
Investment Grade Fixed-Income Funds - 30.0% |
Fidelity Government Income Fund | 34,396 | | $ 367,347 |
Fidelity Strategic Real Return Fund | 36,854 | | 366,332 |
Fidelity Total Bond Fund | 99,916 | | 1,100,075 |
TOTAL INVESTMENT GRADE FIXED-INCOME FUNDS | | 1,833,754 |
TOTAL FIXED-INCOME FUNDS (Cost $1,984,070) | 2,123,709 |
Short-Term Funds - 14.6% |
| | | |
Fidelity Institutional Money Market Portfolio Institutional Class | 447,019 | | 447,019 |
Fidelity Short-Term Bond Fund | 52,693 | | 449,997 |
TOTAL SHORT-TERM FUNDS (Cost $887,417) | 897,016 |
TOTAL INVESTMENT PORTFOLIO - 100.0% (Cost $5,764,701) | | 6,122,832 |
NET OTHER ASSETS (LIABILITIES) - 0.0% | | (121) |
NET ASSETS - 100% | $ 6,122,711 |
Legend |
(a) Non-income producing |
Other Information |
All investments are categorized as Level 1 under the Fair Value Hierarchy. The inputs or methodology used for valuing securities may not be an indication of the risk associated with investing in those securities. For more information on valuation inputs, please refer to the Security Valuation section in the accompanying Notes to Financial Statements. |
Income Tax Information |
At July 31, 2011, the Fund had a capital loss carryforward of approximately $600,001 of which $7,815, $381,761 and $210,425 will expire in fiscal 2017, 2018 and 2019, respectively. Capital loss carryforwards are only available to offset future capital gains of the Fund to the extent provided by regulations and may be limited. |
See accompanying notes which are an integral part of the financial statements.
Annual Report
Fidelity Income Replacement 2028 Fund
Statement of Assets and Liabilities
| July 31, 2011 |
| | |
Assets | | |
Investment in securities, at value (cost $5,764,701) - See accompanying schedule | | $ 6,122,832 |
Cash | | 1 |
Total assets | | 6,122,833 |
| | |
Liabilities | | |
Distribution and service plan fees payable | | 122 |
| | |
Net Assets | | $ 6,122,711 |
Net Assets consist of: | | |
Paid in capital | | $ 6,478,326 |
Undistributed net investment income | | 1,283 |
Accumulated undistributed net realized gain (loss) on investments | | (715,029) |
Net unrealized appreciation (depreciation) on investments | | 358,131 |
Net Assets | | $ 6,122,711 |
| | |
Calculation of Maximum Offering Price Class A:
Net Asset Value and redemption price per share ($133,341 ÷ 2,671.2 shares) | | $ 49.92 |
| | |
Maximum offering price per share (100/94.25 of $49.92) | | $ 52.97 |
| | |
Class T:
Net Asset Value and redemption price per share ($130,222 ÷ 2,607.4 shares) | | $ 49.94 |
| | |
Maximum offering price per share (100/96.50 of $49.94) | | $ 51.75 |
| | |
Class C:
Net Asset Value and offering price per share ($48,899 ÷ 979.2 shares)A | | $ 49.94 |
| | |
Income Replacement 2028:
Net Asset Value, offering price and redemption price per share ($5,782,807 ÷ 115,831.5 shares) | | $ 49.92 |
| | |
Institutional Class:
Net Asset Value, offering price and redemption price per share ($27,442 ÷ 549.7 shares) | | $ 49.92 |
A Redemption price per share is equal to net asset value less any applicable contingent deferred sales charge.
Statement of Operations
| Year ended July 31, 2011 |
| | |
Investment Income | | |
Income distributions from underlying funds | | $ 118,343 |
| | |
Expenses | | |
Distribution and service plan fees | $ 2,069 | |
Independent trustees' compensation | 23 | |
Total expenses before reductions | 2,092 | |
Expense reductions | (23) | 2,069 |
Net investment income (loss) | | 116,274 |
Realized and Unrealized Gain (Loss) Realized gain (loss) on sale of underlying fund shares | (40,097) | |
Capital gain distributions from underlying funds | 35,036 | |
Total net realized gain (loss) | | (5,061) |
Change in net unrealized appreciation (depreciation) on underlying funds | | 647,446 |
Net gain (loss) | | 642,385 |
Net increase (decrease) in net assets resulting from operations | | $ 758,659 |
See accompanying notes which are an integral part of the financial statements.
Annual Report
Statement of Changes in Net Assets
| Year ended
July 31, 2011 | Year ended
July 31, 2010 |
Increase (Decrease) in Net Assets | | |
Operations | | |
Net investment income (loss) | $ 116,274 | $ 130,949 |
Net realized gain (loss) | (5,061) | (193,465) |
Change in net unrealized appreciation (depreciation) | 647,446 | 828,403 |
Net increase (decrease) in net assets resulting from operations | 758,659 | 765,887 |
Distributions to shareholders from net investment income | (116,717) | (131,065) |
Distributions to shareholders from net realized gain | (25,763) | (16,965) |
Total distributions | (142,480) | (148,030) |
Share transactions - net increase (decrease) | (649,489) | (832,893) |
Total increase (decrease) in net assets | (33,310) | (215,036) |
| | |
Net Assets | | |
Beginning of period | 6,156,021 | 6,371,057 |
End of period (including undistributed net investment income of $1,283 and undistributed net investment income of $1,839, respectively) | $ 6,122,711 | $ 6,156,021 |
Financial Highlights - Class A
Years ended July 31, | 2011 | 2010 | 2009 | 2008G |
Selected Per-Share Data | | | | |
Net asset value, beginning of period | $ 45.17 | $ 41.16 | $ 46.81 | $ 50.00 |
Income from Investment Operations | | | | |
Net investment income (loss)E | .802 | .789 | 1.000 | .966 |
Net realized and unrealized gain (loss) | 4.972 | 4.116 | (5.341) | (3.085) |
Total from investment operations | 5.774 | 4.905 | (4.341) | (2.119) |
Distributions from net investment income | (.815) | (.785) | (.979) | (.911) |
Distributions from net realized gain | (.209) | (.110) | (.330) | (.160) |
Total distributions | (1.024) | (.895) | (1.309) | (1.071) |
Net asset value, end of period | $ 49.92 | $ 45.17 | $ 41.16 | $ 46.81 |
Total ReturnB,C,D | 12.85% | 11.96% | (8.93)% | (4.36)% |
Ratios to Average Net AssetsF,H | | | | |
Expenses before reductions | .25% | .25% | .25% | .25%A |
Expenses net of fee waivers, if any | .25% | .25% | .25% | .25%A |
Expenses net of all reductions | .25% | .25% | .25% | .25%A |
Net investment income (loss) | 1.65% | 1.78% | 2.60% | 2.16%A |
Supplemental Data | | | | |
Net assets, end of period (000 omitted) | $ 133 | $ 359 | $ 278 | $ 371 |
Portfolio turnover rate | 17% | 16% | 53% | 33%A |
A Annualized
B Total returns for periods of less than one year are not annualized.
C Total returns would have been lower if certain expenses had not been reduced during the applicable periods shown.
D Total returns do not include the effect of the sales charges.
E Calculated based on average shares outstanding during the period.
F Amounts do not include the activity of the underlying funds.
G For the period August 30, 2007 (commencement of operations) to July 31, 2008.
H Expense ratios reflect operating expenses of the class. Expenses before reductions do not reflect amounts reimbursed by the investment adviser or reductions from expense offset arrangements and do not represent the amount paid by the class during periods when reimbursements or reductions occur. Expenses net of fee waivers reflect expenses after reimbursement by the investment adviser but prior to reductions from expense offset arrangements. Expenses net of all reductions represent the net expenses paid by the class but do not include expenses of the investment companies in which the Fund invests.
See accompanying notes which are an integral part of the financial statements.
Annual Report
Financial Highlights - Class T
Years ended July 31, | 2011 | 2010 | 2009 | 2008G |
Selected Per-Share Data | | | | |
Net asset value, beginning of period | $ 45.16 | $ 41.16 | $ 46.80 | $ 50.00 |
Income from Investment Operations | | | | |
Net investment income (loss)E | .682 | .678 | .905 | .847 |
Net realized and unrealized gain (loss) | 4.975 | 4.107 | (5.340) | (3.079) |
Total from investment operations | 5.657 | 4.785 | (4.435) | (2.232) |
Distributions from net investment income | (.668) | (.675) | (.875) | (.808) |
Distributions from net realized gain | (.209) | (.110) | (.330) | (.160) |
Total distributions | (.877) | (.785) | (1.205) | (.968) |
Net asset value, end of period | $ 49.94 | $ 45.16 | $ 41.16 | $ 46.80 |
Total ReturnB,C,D | 12.57% | 11.66% | (9.15)% | (4.57)% |
Ratios to Average Net AssetsF,H | | | | |
Expenses before reductions | .50% | .50% | .50% | .50%A |
Expenses net of fee waivers, if any | .50% | .50% | .50% | .50%A |
Expenses net of all reductions | .50% | .50% | .50% | .50%A |
Net investment income (loss) | 1.40% | 1.53% | 2.35% | 1.91%A |
Supplemental Data | | | | |
Net assets, end of period (000 omitted) | $ 130 | $ 328 | $ 311 | $ 606 |
Portfolio turnover rate | 17% | 16% | 53% | 33%A |
A Annualized
B Total returns for periods of less than one year are not annualized.
C Total returns would have been lower if certain expenses had not been reduced during the applicable periods shown.
D Total returns do not include the effect of the sales charges.
E Calculated based on average shares outstanding during the period.
F Amounts do not include the activity of the underlying funds.
G For the period August 30, 2007 (commencement of operations) to July 31, 2008.
H Expense ratios reflect operating expenses of the class. Expenses before reductions do not reflect amounts reimbursed by the investment adviser or reductions from expense offset arrangements and do not represent the amount paid by the class during periods when reimbursements or reductions occur. Expenses net of fee waivers reflect expenses after reimbursement by the investment adviser but prior to reductions from expense offset arrangements. Expenses net of all reductions represent the net expenses paid by the class but do not include expenses of the investment companies in which the Fund invests.
Financial Highlights - Class C
Years ended July 31, | 2011 | 2010 | 2009 | 2008G |
Selected Per-Share Data | | | | |
Net asset value, beginning of period | $ 45.19 | $ 41.16 | $ 46.79 | $ 50.00 |
Income from Investment Operations | | | | |
Net investment income (loss)E | .438 | .454 | .711 | .639 |
Net realized and unrealized gain (loss) | 4.974 | 4.117 | (5.333) | (3.104) |
Total from investment operations | 5.412 | 4.571 | (4.622) | (2.465) |
Distributions from net investment income | (.453) | (.431) | (.678) | (.585) |
Distributions from net realized gain | (.209) | (.110) | (.330) | (.160) |
Total distributions | (.662) | (.541) | (1.008) | (.745) |
Net asset value, end of period | $ 49.94 | $ 45.19 | $ 41.16 | $ 46.79 |
Total ReturnB,C,D | 12.01% | 11.13% | (9.60)% | (5.02)% |
Ratios to Average Net AssetsF,H | | | | |
Expenses before reductions | 1.00% | 1.00% | 1.00% | 1.00%A |
Expenses net of fee waivers, if any | 1.00% | 1.00% | 1.00% | 1.00%A |
Expenses net of all reductions | 1.00% | 1.00% | 1.00% | 1.00%A |
Net investment income (loss) | .90% | 1.02% | 1.84% | 1.41%A |
Supplemental Data | | | | |
Net assets, end of period (000 omitted) | $ 49 | $ 51 | $ 86 | $ 150 |
Portfolio turnover rate | 17% | 16% | 53% | 33%A |
A Annualized
B Total returns for periods of less than one year are not annualized.
C Total returns would have been lower if certain expenses had not been reduced during the applicable periods shown.
D Total returns do not include the effect of the contingent deferred sales charge.
E Calculated based on average shares outstanding during the period.
F Amounts do not include the activity of the underlying funds.
G For the period August 30, 2007 (commencement of operations) to July 31, 2008.
H Expense ratios reflect operating expenses of the class. Expenses before reductions do not reflect amounts reimbursed by the investment adviser or reductions from expense offset arrangements and do not represent the amount paid by the class during periods when reimbursements or reductions occur. Expenses net of fee waivers reflect expenses after reimbursement by the investment adviser but prior to reductions from expense offset arrangements. Expenses net of all reductions represent the net expenses paid by the class but do not include expenses of the investment companies in which the Fund invests.
See accompanying notes which are an integral part of the financial statements.
Annual Report
Financial Highlights - Income Replacement 2028
Years ended July 31, | 2011 | 2010 | 2009 | 2008G |
Selected Per-Share Data | | | | |
Net asset value, beginning of period | $ 45.18 | $ 41.17 | $ 46.82 | $ 50.00 |
Income from Investment Operations | | | | |
Net investment income (loss)D | .925 | .900 | 1.087 | 1.067 |
Net realized and unrealized gain (loss) | 4.965 | 4.115 | (5.330) | (3.072) |
Total from investment operations | 5.890 | 5.015 | (4.243) | (2.005) |
Distributions from net investment income | (.941) | (.895) | (1.077) | (1.015) |
Distributions from net realized gain | (.209) | (.110) | (.330) | (.160) |
Total distributions | (1.150) | (1.005) | (1.407) | (1.175) |
Net asset value, end of period | $ 49.92 | $ 45.18 | $ 41.17 | $ 46.82 |
Total ReturnB,C | 13.12% | 12.24% | (8.69)% | (4.14)% |
Ratios to Average Net AssetsE,H | | | | |
Expenses before reductionsF | .00% | .00% | .00% | .00%A |
Expenses net of fee waivers, if any | .00% | .00% | .00% | .00%A |
Expenses net of all reductions | .00% | .00% | .00% | .00%A |
Net investment income (loss) | 1.90% | 2.03% | 2.85% | 2.40%A |
Supplemental Data | | | | |
Net assets, end of period (000 omitted) | $ 5,783 | $ 5,383 | $ 5,641 | $ 6,068 |
Portfolio turnover rate | 17% | 16% | 53% | 33%A |
A Annualized
B Total returns for periods of less than one year are not annualized.
C Total returns would have been lower if certain expenses had not been reduced during the applicable periods shown.
D Calculated based on average shares outstanding during the period.
E Amounts do not include the activity of the underlying funds.
F Amount represents less than .01%.
G For the period August 30, 2007 (commencement of operations) to July 31, 2008.
H Expense ratios reflect operating expenses of the class. Expenses before reductions do not reflect amounts reimbursed by the investment adviser or reductions from expense offset arrangements and do not represent the amount paid by the class during periods when reimbursements or reductions occur. Expenses net of fee waivers reflect expenses after reimbursement by the investment adviser but prior to reductions from expense offset arrangements. Expenses net of all reductions represent the net expenses paid by the class but do not include expenses of the investment companies in which the Fund invests.
Financial Highlights - Institutional Class
Years ended July 31, | 2011 | 2010 | 2009 | 2008G |
Selected Per-Share Data | | | | |
Net asset value, beginning of period | $ 45.18 | $ 41.17 | $ 46.82 | $ 50.00 |
Income from Investment Operations | | | | |
Net investment income (loss)D | .923 | .899 | 1.097 | 1.101 |
Net realized and unrealized gain (loss) | 4.967 | 4.116 | (5.340) | (3.106) |
Total from investment operations | 5.890 | 5.015 | (4.243) | (2.005) |
Distributions from net investment income | (.941) | (.895) | (1.077) | (1.015) |
Distributions from net realized gain | (.209) | (.110) | (.330) | (.160) |
Total distributions | (1.150) | (1.005) | (1.407) | (1.175) |
Net asset value, end of period | $ 49.92 | $ 45.18 | $ 41.17 | $ 46.82 |
Total ReturnB,C | 13.12% | 12.24% | (8.69)% | (4.14)% |
Ratios to Average Net AssetsE,H | | | | |
Expenses before reductions F | .00% | .00% | .00% | .00%A |
Expenses net of fee waivers, if any | .00% | .00% | .00% | .00%A |
Expenses net of all reductions | .00% | .00% | .00% | .00%A |
Net investment income (loss) | 1.90% | 2.03% | 2.85% | 2.40%A |
Supplemental Data | | | | |
Net assets, end of period (000 omitted) | $ 27 | $ 36 | $ 56 | $ 96 |
Portfolio turnover rate | 17% | 16% | 53% | 33%A |
A Annualized
B Total returns for periods of less than one year are not annualized.
C Total returns would have been lower if certain expenses had not been reduced during the applicable periods shown.
D Calculated based on average shares outstanding during the period.
E Amounts do not include the activity of the underlying funds.
F Amount represents less than .01%.
G For the period August 30, 2007 (commencement of operations) to July 31, 2008.
H Expense ratios reflect operating expenses of the class. Expenses before reductions do not reflect amounts reimbursed by the investment adviser or reductions from expense offset arrangements and do not represent the amount paid by the class during periods when reimbursements or reductions occur. Expenses net of fee waivers reflect expenses after reimbursement by the investment adviser but prior to reductions from expense offset arrangements. Expenses net of all reductions represent the net expenses paid by the class but do not include expenses of the investment companies in which the Fund invests.
See accompanying notes which are an integral part of the financial statements.
Annual Report
Fidelity Income Replacement 2030 Fund
Investment Changes (Unaudited)
Fund Holdings as of July 31, 2011 |
| % of fund's
net assets | % of fund's net assets
6 months ago |
Domestic Equity Funds | | |
Fidelity Advisor Mid Cap II Fund Institutional Class | 5.3 | 5.4 |
Fidelity Disciplined Equity Fund | 5.6 | 5.7 |
Fidelity Equity-Income Fund | 5.5 | 5.7 |
Fidelity Large Cap Core Enhanced Index Fund | 9.0 | 9.0 |
Fidelity Series 100 Index Fund | 6.8 | 6.8 |
Fidelity Series Broad Market Opportunities Fund | 8.9 | 9.0 |
Fidelity Series Small Cap Opportunities Fund | 3.5 | 3.6 |
| 44.6 | 45.2 |
International Equity Funds | | |
Fidelity Advisor International Discovery Fund Institutional Class | 7.8 | 8.0 |
High Yield Fixed-Income Funds | | |
Fidelity Capital & Income Fund | 2.5 | 2.5 |
Fidelity Strategic Income Fund | 2.5 | 2.5 |
| 5.0 | 5.0 |
Investment Grade Fixed-Income Funds | | |
Fidelity Government Income Fund | 5.8 | 5.7 |
Fidelity Strategic Real Return Fund | 5.8 | 5.7 |
Fidelity Total Bond Fund | 17.4 | 17.1 |
| 29.0 | 28.5 |
Short-Term Funds | | |
Fidelity Institutional Money Market Portfolio Institutional Class | 6.8 | 6.6 |
Fidelity Short-Term Bond Fund | 6.8 | 6.7 |
| 13.6 | 13.3 |
Net Other Assets (Liabilities)* | 0.0 | 0.0 |
| 100.0 | 100.0 |
* Amount represents less than 0.1% |
Asset Allocation (% of fund's net assets) |
Current |
| Domestic Equity Funds | 44.6% | |
| International Equity Funds | 7.8% | |
| High Yield
Fixed-Income Funds | 5.0% | |
| Investment Grade Fixed-Income Funds | 29.0% | |
| Short-Term Funds | 13.6% | |

Six months ago |
| Domestic Equity Funds | 45.2% | |
| International Equity Funds | 8.0% | |
| High Yield
Fixed-Income Funds | 5.0% | |
| Investment Grade Fixed-Income Funds | 28.5% | |
| Short-Term Funds | 13.3% | |

Expected |
| Domestic Equity Funds | 44.8% | |
| International Equity Funds | 7.6% | |
| High Yield
Fixed-Income Funds | 4.8% | |
| Investment Grade Fixed-Income Funds | 29.3% | |
| Short-Term Funds | 13.5% | |

The fund invests according to an asset allocation strategy that becomes increasingly conservative over time. The six months ago allocation is based on the fund's holdings as of January 31, 2011. The current allocation is based on the fund's holdings as of July 31, 2011. The expected allocation represents the fund's anticipated allocation at January 31, 2012. |
Annual Report
Fidelity Income Replacement 2030 Fund
Investments July 31, 2011
Showing Percentage of Net Assets
Equity Funds - 52.4% |
| Shares | | Value |
Domestic Equity Funds - 44.6% |
Fidelity Advisor Mid Cap II Fund Institutional Class (a) | 12,799 | | $ 232,051 |
Fidelity Disciplined Equity Fund | 10,362 | | 241,225 |
Fidelity Equity-Income Fund | 5,369 | | 238,151 |
Fidelity Large Cap Core Enhanced Index Fund | 43,733 | | 392,287 |
Fidelity Series 100 Index Fund | 32,593 | | 294,970 |
Fidelity Series Broad Market Opportunities Fund | 37,578 | | 387,050 |
Fidelity Series Small Cap Opportunities Fund | 13,677 | | 153,458 |
TOTAL DOMESTIC EQUITY FUNDS | | 1,939,192 |
International Equity Funds - 7.8% |
Fidelity Advisor International Discovery Fund Institutional Class | 10,085 | | 339,163 |
TOTAL EQUITY FUNDS (Cost $2,131,023) | 2,278,355 |
Fixed-Income Funds - 34.0% |
| | | |
High Yield Fixed-Income Funds - 5.0% |
Fidelity Capital & Income Fund | 11,191 | | 107,099 |
Fidelity Strategic Income Fund | 9,671 | | 110,054 |
TOTAL HIGH YIELD FIXED-INCOME FUNDS | | 217,153 |
|
| Shares | | Value |
Investment Grade Fixed-Income Funds - 29.0% |
Fidelity Government Income Fund | 23,635 | | $ 252,421 |
Fidelity Strategic Real Return Fund | 25,326 | | 251,737 |
Fidelity Total Bond Fund | 68,744 | | 756,876 |
TOTAL INVESTMENT GRADE FIXED-INCOME FUNDS | | 1,261,034 |
TOTAL FIXED-INCOME FUNDS (Cost $1,435,010) | 1,478,187 |
Short-Term Funds - 13.6% |
| | | |
Fidelity Institutional Money Market Portfolio Institutional Class | 293,874 | | 293,874 |
Fidelity Short-Term Bond Fund | 34,617 | | 295,628 |
TOTAL SHORT-TERM FUNDS (Cost $586,052) | 589,502 |
TOTAL INVESTMENT PORTFOLIO - 100.0% (Cost $4,152,085) | | 4,346,044 |
NET OTHER ASSETS (LIABILITIES) - 0.0% | | (251) |
NET ASSETS - 100% | $ 4,345,793 |
Legend |
(a) Non-income producing |
Other Information |
All investments are categorized as Level 1 under the Fair Value Hierarchy. The inputs or methodology used for valuing securities may not be an indication of the risk associated with investing in those securities. For more information on valuation inputs, please refer to the Security Valuation section in the accompanying Notes to Financial Statements. |
Income Tax Information |
At July 31, 2011, the Fund had a capital loss carryforward of approximately $119,726 of which $33,830 and $85,896 will expire in fiscal 2017 and 2018, respectively. Capital loss carryforwards are only available to offset future capital gains of the Fund to the extent provided by regulations and may be limited. |
See accompanying notes which are an integral part of the financial statements.
Annual Report
Fidelity Income Replacement 2030 Fund
Statement of Assets and Liabilities
| July 31, 2011 |
| | |
Assets | | |
Investment in securities, at value (cost $4,152,085) - See accompanying schedule | | $ 4,346,044 |
| | |
Liabilities | | |
Distribution and service plan fees payable | | 251 |
| | |
Net Assets | | $ 4,345,793 |
Net Assets consist of: | | |
Paid in capital | | $ 4,322,386 |
Undistributed net investment income | | 793 |
Accumulated undistributed net realized gain (loss) on investments | | (171,345) |
Net unrealized appreciation (depreciation) on investments | | 193,959 |
Net Assets | | $ 4,345,793 |
| | |
Calculation of Maximum Offering Price Class A:
Net Asset Value and redemption price per share ($71,557 ÷ 1,441.26 shares) | | $ 49.65 |
| | |
Maximum offering price per share (100/94.25 of $49.65) | | $ 52.68 |
| | |
Class T:
Net Asset Value and redemption price per share ($14,774 ÷ 297.44 shares) | | $ 49.67 |
| | |
Maximum offering price per share (100/96.50 of $49.67) | | $ 51.47 |
| | |
Class C:
Net Asset Value and offering price per share ($270,005 ÷ 5,442.71 shares)A | | $ 49.61 |
| | |
Income Replacement 2030:
Net Asset Value, offering price and redemption price per share ($3,962,058 ÷ 79,813.06 shares) | | $ 49.64 |
| | |
Institutional Class:
Net Asset Value, offering price and redemption price per share ($27,399 ÷ 551.93 shares) | | $ 49.64 |
A Redemption price per share is equal to net asset value less any applicable contingent deferred sales charge.
Statement of Operations
| Year ended July 31, 2011 |
| | |
Investment Income | | |
Income distributions from underlying funds | | $ 57,450 |
| | |
Expenses | | |
Distribution and service plan fees | $ 2,450 | |
Independent trustees' compensation | 10 | |
Total expenses before reductions | 2,460 | |
Expense reductions | (10) | 2,450 |
Net investment income (loss) | | 55,000 |
Realized and Unrealized Gain (Loss) Realized gain (loss) on sale of underlying fund shares | (23,045) | |
Capital gain distributions from underlying funds | 15,030 | |
Total net realized gain (loss) | | (8,015) |
Change in net unrealized appreciation (depreciation) on underlying funds | | 250,028 |
Net gain (loss) | | 242,013 |
Net increase (decrease) in net assets resulting from operations | | $ 297,013 |
See accompanying notes which are an integral part of the financial statements.
Annual Report
Fidelity Income Replacement 2030 Fund
Financial Statements - continued
Statement of Changes in Net Assets
| Year ended
July 31, 2011 | Year ended
July 31, 2010 |
Increase (Decrease) in Net Assets | | |
Operations | | |
Net investment income (loss) | $ 55,000 | $ 14,472 |
Net realized gain (loss) | (8,015) | 212 |
Change in net unrealized appreciation (depreciation) | 250,028 | 65,683 |
Net increase (decrease) in net assets resulting from operations | 297,013 | 80,367 |
Distributions to shareholders from net investment income | (54,641) | (14,213) |
Distributions to shareholders from net realized gain | (10,723) | (1,857) |
Total distributions | (65,364) | (16,070) |
Share transactions - net increase (decrease) | 2,153,245 | 1,233,775 |
Total increase (decrease) in net assets | 2,384,894 | 1,298,072 |
| | |
Net Assets | | |
Beginning of period | 1,960,899 | 662,827 |
End of period (including undistributed net investment income of $793 and undistributed net investment income of $439, respectively) | $ 4,345,793 | $ 1,960,899 |
Financial Highlights - Class A
Years ended July 31, | 2011 | 2010 | 2009 | 2008G |
Selected Per-Share Data | | | | |
Net asset value, beginning of period | $ 44.77 | $ 40.69 | $ 46.61 | $ 50.00 |
Income from Investment Operations | | | | |
Net investment income (loss)E | .791 | .718 | .978 | 1.034 |
Net realized and unrealized gain (loss) | 5.066 | 4.180 | (5.404) | (3.239) |
Total from investment operations | 5.857 | 4.898 | (4.426) | (2.205) |
Distributions from net investment income | (.801) | (.713) | (1.004) | (.995) |
Distributions from net realized gain | (.176) | (.105) | (.490) | (.190) |
Total distributions | (.977) | (.818) | (1.494) | (1.185) |
Net asset value, end of period | $ 49.65 | $ 44.77 | $ 40.69 | $ 46.61 |
Total ReturnB,C,D | 13.15% | 12.08% | (9.22)% | (4.55)% |
Ratios to Average Net AssetsF,H | | | | |
Expenses before reductions | .25% | .25% | .25% | .25%A |
Expenses net of fee waivers, if any | .25% | .25% | .25% | .25%A |
Expenses net of all reductions | .25% | .25% | .25% | .25%A |
Net investment income (loss) | 1.63% | 1.63% | 2.57% | 2.26%A |
Supplemental Data | | | | |
Net assets, end of period (000 omitted) | $ 72 | $ 66 | $ 55 | $ 95 |
Portfolio turnover rate | 24% | 31% | 53% | 12%A |
A Annualized
B Total returns for periods of less than one year are not annualized.
C Total returns would have been lower if certain expenses had not been reduced during the applicable periods shown.
D Total returns do not include the effect of the sales charges.
E Calculated based on average shares outstanding during the period.
F Amounts do not include the activity of the underlying funds.
G For the period August 30, 2007 (commencement of operations) to July 31, 2008.
H Expense ratios reflect operating expenses of the class. Expenses before reductions do not reflect amounts reimbursed by the investment adviser or reductions from expense offset arrangements and do not represent the amount paid by the class during periods when reimbursements or reductions occur. Expenses net of fee waivers reflect expenses after reimbursement by the investment adviser but prior to reductions from expense offset arrangements. Expenses net of all reductions represent the net expenses paid by the class but do not include expenses of the investment companies in which the Fund invests.
See accompanying notes which are an integral part of the financial statements.
Annual Report
Financial Highlights - Class T
Years ended July 31, | 2011 | 2010 | 2009 | 2008G |
Selected Per-Share Data | | | | |
Net asset value, beginning of period | $ 44.78 | $ 40.69 | $ 46.61 | $ 50.00 |
Income from Investment Operations | | | | |
Net investment income (loss)E | .655 | .603 | .881 | .920 |
Net realized and unrealized gain (loss) | 5.076 | 4.182 | (5.402) | (3.234) |
Total from investment operations | 5.731 | 4.785 | (4.521) | (2.314) |
Distributions from net investment income | (.665) | (.590) | (.909) | (.886) |
Distributions from net realized gain | (.176) | (.105) | (.490) | (.190) |
Total distributions | (.841) | (.695) | (1.399) | (1.076) |
Net asset value, end of period | $ 49.67 | $ 44.78 | $ 40.69 | $ 46.61 |
Total ReturnB,C,D | 12.85% | 11.79% | (9.45)% | (4.76)% |
Ratios to Average Net AssetsF,H | | | | |
Expenses before reductions | .50% | .50% | .50% | .50%A |
Expenses net of fee waivers, if any | .50% | .50% | .50% | .50%A |
Expenses net of all reductions | .50% | .50% | .50% | .50%A |
Net investment income (loss) | 1.38% | 1.37% | 2.32% | 2.01%A |
Supplemental Data | | | | |
Net assets, end of period (000 omitted) | $ 15 | $ 45 | $ 71 | $ 95 |
Portfolio turnover rate | 24% | 31% | 53% | 12%A |
A Annualized
B Total returns for periods of less than one year are not annualized.
C Total returns would have been lower if certain expenses had not been reduced during the applicable periods shown.
D Total returns do not include the effect of the sales charges.
E Calculated based on average shares outstanding during the period.
F Amounts do not include the activity of the underlying funds.
G For the period August 30, 2007 (commencement of operations) to July 31, 2008.
H Expense ratios reflect operating expenses of the class. Expenses before reductions do not reflect amounts reimbursed by the investment adviser or reductions from expense offset arrangements and do not represent the amount paid by the class during periods when reimbursements or reductions occur. Expenses net of fee waivers reflect expenses after reimbursement by the investment adviser but prior to reductions from expense offset arrangements. Expenses net of all reductions represent the net expenses paid by the class but do not include expenses of the investment companies in which the Fund invests.
Financial Highlights - Class C
Years ended July 31, | 2011 | 2010 | 2009 | 2008G |
Selected Per-Share Data | | | | |
Net asset value, beginning of period | $ 44.75 | $ 40.67 | $ 46.58 | $ 50.00 |
Income from Investment Operations | | | | |
Net investment income (loss)E | .428 | .385 | .693 | .682 |
Net realized and unrealized gain (loss) | 5.060 | 4.185 | (5.400) | (3.227) |
Total from investment operations | 5.488 | 4.570 | (4.707) | (2.545) |
Distributions from net investment income | (.452) | (.385) | (.713) | (.685) |
Distributions from net realized gain | (.176) | (.105) | (.490) | (.190) |
Total distributions | (.628) | (.490) | (1.203) | (.875) |
Net asset value, end of period | $ 49.61 | $ 44.75 | $ 40.67 | $ 46.58 |
Total ReturnB,C,D | 12.30% | 11.26% | (9.91)% | (5.21)% |
Ratios to Average Net AssetsF,H | | | | |
Expenses before reductions | 1.00% | 1.00% | 1.00% | 1.00%A |
Expenses net of fee waivers, if any | 1.00% | 1.00% | 1.00% | 1.00%A |
Expenses net of all reductions | 1.00% | 1.00% | 1.00% | 1.00%A |
Net investment income (loss) | .88% | .88% | 1.82% | 1.51%A |
Supplemental Data | | | | |
Net assets, end of period (000 omitted) | $ 270 | $ 186 | $ 178 | $ 297 |
Portfolio turnover rate | 24% | 31% | 53% | 12%A |
A Annualized
B Total returns for periods of less than one year are not annualized.
C Total returns would have been lower if certain expenses had not been reduced during the applicable periods shown.
D Total returns do not include the effect of the contingent deferred sales charge.
E Calculated based on average shares outstanding during the period.
F Amounts do not include the activity of the underlying funds.
G For the period August 30, 2007 (commencement of operations) to July 31, 2008.
H Expense ratios reflect operating expenses of the class. Expenses before reductions do not reflect amounts reimbursed by the investment adviser or reductions from expense offset arrangements and do not represent the amount paid by the class during periods when reimbursements or reductions occur. Expenses net of fee waivers reflect expenses after reimbursement by the investment adviser but prior to reductions from expense offset arrangements. Expenses net of all reductions represent the net expenses paid by the class but do not include expenses of the investment companies in which the Fund invests.
See accompanying notes which are an integral part of the financial statements.
Annual Report
Financial Highlights - Income Replacement 2030
Years ended July 31, | 2011 | 2010 | 2009 | 2008G |
Selected Per-Share Data | | | | |
Net asset value, beginning of period | $ 44.76 | $ 40.69 | $ 46.61 | $ 50.00 |
Income from Investment Operations | | | | |
Net investment income (loss)D | .917 | .821 | 1.101 | 1.117 |
Net realized and unrealized gain (loss) | 5.062 | 4.178 | (5.429) | (3.209) |
Total from investment operations | 5.979 | 4.999 | (4.328) | (2.092) |
Distributions from net investment income | (.923) | (.824) | (1.102) | (1.108) |
Distributions from net realized gain | (.176) | (.105) | (.490) | (.190) |
Total distributions | (1.099) | (.929) | (1.592) | (1.298) |
Net asset value, end of period | $ 49.64 | $ 44.76 | $ 40.69 | $ 46.61 |
Total ReturnB,C | 13.43% | 12.34% | (8.99)% | (4.33)% |
Ratios to Average Net AssetsE,H | | | | |
Expenses before reductionsF | .00% | .00% | .00% | .00%A |
Expenses net of fee waivers, if any | .00% | .00% | .00% | .00%A |
Expenses net of all reductions | .00% | .00% | .00% | .00%A |
Net investment income (loss) | 1.88% | 1.88% | 2.82% | 2.51%A |
Supplemental Data | | | | |
Net assets, end of period (000 omitted) | $ 3,962 | $ 1,628 | $ 303 | $ 653 |
Portfolio turnover rate | 24% | 31% | 53% | 12%A |
A Annualized
B Total returns for periods of less than one year are not annualized.
C Total returns would have been lower if certain expenses had not been reduced during the applicable periods shown.
D Calculated based on average shares outstanding during the period.
E Amounts do not include the activity of the underlying funds.
F Amount represents less than .01%.
G For the period August 30, 2007 (commencement of operations) to July 31, 2008.
H Expense ratios reflect operating expenses of the class. Expenses before reductions do not reflect amounts reimbursed by the investment adviser or reductions from expense offset arrangements and do not represent the amount paid by the class during periods when reimbursements or reductions occur. Expenses net of fee waivers reflect expenses after reimbursement by the investment adviser but prior to reductions from expense offset arrangements. Expenses net of all reductions represent the net expenses paid by the class but do not include expenses of the investment companies in which the Fund invests.
Financial Highlights - Institutional Class
Years ended July 31, | 2011 | 2010 | 2009 | 2008G |
Selected Per-Share Data | | | | |
Net asset value, beginning of period | $ 44.77 | $ 40.69 | $ 46.61 | $ 50.00 |
Income from Investment Operations | | | | |
Net investment income (loss)D | .911 | .825 | 1.074 | 1.149 |
Net realized and unrealized gain (loss) | 5.058 | 4.184 | (5.402) | (3.241) |
Total from investment operations | 5.969 | 5.009 | (4.328) | (2.092) |
Distributions from net investment income | (.923) | (.824) | (1.102) | (1.108) |
Distributions from net realized gain | (.176) | (.105) | (.490) | (.190) |
Total distributions | (1.099) | (.929) | (1.592) | (1.298) |
Net asset value, end of period | $ 49.64 | $ 44.77 | $ 40.69 | $ 46.61 |
Total ReturnB,C | 13.41% | 12.36% | (8.99)% | (4.33)% |
Ratios to Average Net AssetsE,H | | | | |
Expenses before reductionsF | .00% | .00% | .00% | .00%A |
Expenses net of fee waivers, if any | .00% | .00% | .00% | .00%A |
Expenses net of all reductions | .00% | .00% | .00% | .00%A |
Net investment income (loss) | 1.88% | 1.88% | 2.82% | 2.51%A |
Supplemental Data | | | | |
Net assets, end of period (000 omitted) | $ 27 | $ 36 | $ 55 | $ 96 |
Portfolio turnover rate | 24% | 31% | 53% | 12%A |
A Annualized
B Total returns for periods of less than one year are not annualized.
C Total returns would have been lower if certain expenses had not been reduced during the applicable periods shown.
D Calculated based on average shares outstanding during the period.
E Amounts do not include the activity of the underlying funds.
F Amount represents less than .01%.
G For the period August 30, 2007 (commencement of operations) to July 31, 2008.
H Expense ratios reflect operating expenses of the class. Expenses before reductions do not reflect amounts reimbursed by the investment adviser or reductions from expense offset arrangements and do not represent the amount paid by the class during periods when reimbursements or reductions occur. Expenses net of fee waivers reflect expenses after reimbursement by the investment adviser but prior to reductions from expense offset arrangements. Expenses net of all reductions represent the net expenses paid by the class but do not include expenses of the investment companies in which the Fund invests.
See accompanying notes which are an integral part of the financial statements.
Annual Report
Fidelity Income Replacement 2032 Fund
Investment Changes (Unaudited)
Fund Holdings as of July 31, 2011 |
| % of fund's
net assets | % of fund's net assets
6 months ago |
Domestic Equity Funds | | |
Fidelity Advisor Mid Cap II Fund Institutional Class | 5.4 | 5.5 |
Fidelity Disciplined Equity Fund | 5.6 | 5.8 |
Fidelity Equity-Income Fund | 5.6 | 5.7 |
Fidelity Large Cap Core Enhanced Index Fund | 9.2 | 9.2 |
Fidelity Series 100 Index Fund | 6.9 | 6.9 |
Fidelity Series Broad Market Opportunities Fund | 9.0 | 9.2 |
Fidelity Series Small Cap Opportunities Fund | 3.6 | 3.7 |
| 45.3 | 46.0 |
International Equity Funds | | |
Fidelity Advisor International Discovery Fund Institutional Class | 8.4 | 8.8 |
High Yield Fixed-Income Funds | | |
Fidelity Capital & Income Fund | 2.6 | 2.6 |
Fidelity Strategic Income Fund | 2.7 | 2.6 |
| 5.3 | 5.2 |
Investment Grade Fixed-Income Funds | | |
Fidelity Government Income Fund | 5.7 | 5.6 |
Fidelity Strategic Real Return Fund | 5.6 | 5.6 |
Fidelity Total Bond Fund | 17.0 | 16.7 |
| 28.3 | 27.9 |
Short-Term Funds | | |
Fidelity Institutional Money Market Portfolio Institutional Class | 6.3 | 6.1 |
Fidelity Short-Term Bond Fund | 6.4 | 6.0 |
| 12.7 | 12.1 |
Net Other Assets (Liabilities)* | 0.0 | 0.0 |
| 100.0 | 100.0 |
* Amount represents less than 0.1% |
Asset Allocation (% of fund's net assets) |
Current |
| Domestic Equity Funds | 45.3% | |
| International Equity Funds | 8.4% | |
| High Yield
Fixed-Income Funds | 5.3% | |
| Investment Grade Fixed-Income Funds | 28.3% | |
| Short-Term Funds | 12.7% | |

Six months ago |
| Domestic Equity Funds | 46.0% | |
| International Equity Funds | 8.8% | |
| High Yield
Fixed-Income Funds | 5.2% | |
| Investment Grade Fixed-Income Funds | 27.9% | |
| Short-Term Funds | 12.1% | |

Expected |
| Domestic Equity Funds | 45.6% | |
| International Equity Funds | 8.3% | |
| High Yield
Fixed-Income Funds | 5.1% | |
| Investment Grade Fixed-Income Funds | 28.2% | |
| Short-Term Funds | 12.8% | |

The fund invests according to an asset allocation strategy that becomes increasingly conservative over time. The six months ago allocation is based on the fund's holdings as of January 31, 2011. The current allocation is based on the fund's holdings as of July 31, 2011. The expected allocation represents the fund's anticipated allocation at January 31, 2012. |
Annual Report
Fidelity Income Replacement 2032 Fund
Investments July 31, 2011
Showing Percentage of Net Assets
Equity Funds - 53.7% |
| Shares | | Value |
Domestic Equity Funds - 45.3% |
Fidelity Advisor Mid Cap II Fund Institutional Class (a) | 4,677 | | $ 84,790 |
Fidelity Disciplined Equity Fund | 3,823 | | 89,010 |
Fidelity Equity-Income Fund | 1,975 | | 87,630 |
Fidelity Large Cap Core Enhanced Index Fund | 16,216 | | 145,455 |
Fidelity Series 100 Index Fund | 12,043 | | 108,985 |
Fidelity Series Broad Market Opportunities Fund | 13,822 | | 142,370 |
Fidelity Series Small Cap Opportunities Fund | 5,068 | | 56,868 |
TOTAL DOMESTIC EQUITY FUNDS | | 715,108 |
International Equity Funds - 8.4% |
Fidelity Advisor International Discovery Fund Institutional Class | 3,962 | | 133,251 |
TOTAL EQUITY FUNDS (Cost $710,799) | 848,359 |
Fixed-Income Funds - 33.6% |
| | | |
High Yield Fixed-Income Funds - 5.3% |
Fidelity Capital & Income Fund | 4,260 | | 40,772 |
Fidelity Strategic Income Fund | 3,738 | | 42,535 |
TOTAL HIGH YIELD FIXED-INCOME FUNDS | | 83,307 |
|
| Shares | | Value |
Investment Grade Fixed-Income Funds - 28.3% |
Fidelity Government Income Fund | 8,409 | | $ 89,804 |
Fidelity Strategic Real Return Fund | 8,905 | | 88,517 |
Fidelity Total Bond Fund | 24,415 | | 268,810 |
TOTAL INVESTMENT GRADE FIXED-INCOME FUNDS | | 447,131 |
TOTAL FIXED-INCOME FUNDS (Cost $512,270) | 530,438 |
Short-Term Funds - 12.7% |
| | | |
Fidelity Institutional Money Market Portfolio Institutional Class | 99,673 | | 99,673 |
Fidelity Short-Term Bond Fund | 11,771 | | 100,522 |
TOTAL SHORT-TERM FUNDS (Cost $199,272) | 200,195 |
TOTAL INVESTMENT PORTFOLIO - 100.0% (Cost $1,422,341) | | 1,578,992 |
NET OTHER ASSETS (LIABILITIES) - 0.0% | | (76) |
NET ASSETS - 100% | $ 1,578,916 |
Legend |
(a) Non-income producing |
Other Information |
All investments are categorized as Level 1 under the Fair Value Hierarchy. The inputs or methodology used for valuing securities may not be an indication of the risk associated with investing in those securities. For more information on valuation inputs, please refer to the Security Valuation section in the accompanying Notes to Financial Statements. |
Income Tax Information |
At July 31, 2011, the Fund had a capital loss carryforward of approximately $160,350 all of which will expire in fiscal 2018. Capital loss carryforwards are only available to offset future capital gains of the Fund to the extent provided by regulations and may be limited. |
See accompanying notes which are an integral part of the financial statements.
Annual Report
Fidelity Income Replacement 2032 Fund
Statement of Assets and Liabilities
| July 31, 2011 |
| | |
Assets | | |
Investment in securities, at value (cost $1,422,341) - See accompanying schedule | | $ 1,578,992 |
| | |
Liabilities | | |
Distribution and service plan fees payable | | 76 |
| | |
Net Assets | | $ 1,578,916 |
Net Assets consist of: | | |
Paid in capital | | $ 1,583,929 |
Undistributed net investment income | | 290 |
Accumulated undistributed net realized gain (loss) on investments | | (161,954) |
Net unrealized appreciation (depreciation) on investments | | 156,651 |
Net Assets | | $ 1,578,916 |
| | |
Calculation of Maximum Offering Price Class A:
Net Asset Value and redemption price per share ($213,829 ÷ 4,357.23 shares) | | $ 49.07 |
| | |
Maximum offering price per share (100/94.25 of $49.07) | | $ 52.06 |
| | |
Class T:
Net Asset Value and redemption price per share ($26,761 ÷ 545.05 shares) | | $ 49.10 |
| | |
Maximum offering price per share (100/96.50 of $49.10) | | $ 50.88 |
| | |
Class C:
Net Asset Value and offering price per share ($22,168 ÷ 451.28 shares)A | | $ 49.12 |
| | |
Income Replacement 2032:
Net Asset Value, offering price and redemption price per share ($1,297,438 ÷ 26,433.69 shares) | | $ 49.08 |
| | |
Institutional Class:
Net Asset Value, offering price and redemption price per share ($18,720 ÷ 381.40 shares) | | $ 49.08 |
A Redemption price per share is equal to net asset value less any applicable contingent deferred sales charge.
Statement of Operations
| Year ended July 31, 2011 |
| | |
Investment Income | | |
Income distributions from underlying funds | | $ 40,022 |
| | |
Expenses | | |
Distribution and service plan fees | $ 967 | |
Independent trustees' compensation | 7 | |
Total expenses before reductions | 974 | |
Expense reductions | (7) | 967 |
Net investment income (loss) | | 39,055 |
Realized and Unrealized Gain (Loss) Realized gain (loss) on sale of underlying fund shares | 193,243 | |
Capital gain distributions from underlying funds | 11,771 | |
Total net realized gain (loss) | | 205,014 |
Change in net unrealized appreciation (depreciation) on underlying funds | | 10,190 |
Net gain (loss) | | 215,204 |
Net increase (decrease) in net assets resulting from operations | | $ 254,259 |
See accompanying notes which are an integral part of the financial statements.
Annual Report
Fidelity Income Replacement 2032 Fund
Financial Statements - continued
Statement of Changes in Net Assets
| Year ended
July 31, 2011 | Year ended
July 31, 2010 |
Increase (Decrease) in Net Assets | | |
Operations | | |
Net investment income (loss) | $ 39,055 | $ 18,688 |
Net realized gain (loss) | 205,014 | (147,241) |
Change in net unrealized appreciation (depreciation) | 10,190 | 292,353 |
Net increase (decrease) in net assets resulting from operations | 254,259 | 163,800 |
Distributions to shareholders from net investment income | (39,246) | (18,690) |
Distributions to shareholders from net realized gain | (8,488) | (2,138) |
Total distributions | (47,734) | (20,828) |
Share transactions - net increase (decrease) | (344,791) | (49,316) |
Total increase (decrease) in net assets | (138,266) | 93,656 |
| | |
Net Assets | | |
Beginning of period | 1,717,182 | 1,623,526 |
End of period (including undistributed net investment income of $290 and undistributed net investment income of $493, respectively) | $ 1,578,916 | $ 1,717,182 |
Financial Highlights - Class A
Years ended July 31, | 2011 | 2010 | 2009 | 2008G |
Selected Per-Share Data | | | | |
Net asset value, beginning of period | $ 44.19 | $ 40.21 | $ 46.52 | $ 50.00 |
Income from Investment Operations | | | | |
Net investment income (loss)E | .796 | .727 | .930 | 1.019 |
Net realized and unrealized gain (loss) | 5.086 | 4.154 | (5.570) | (3.322) |
Total from investment operations | 5.882 | 4.881 | (4.640) | (2.303) |
Distributions from net investment income | (.812) | (.796) | (.960) | (.987) |
Distributions from net realized gain | (.190) | (.105) | (.710) | (.190) |
Total distributions | (1.002) | (.901) | (1.670) | (1.177) |
Net asset value, end of period | $ 49.07 | $ 44.19 | $ 40.21 | $ 46.52 |
Total ReturnB,C,D | 13.38% | 12.19% | (9.66)% | (4.75)% |
Ratios to Average Net AssetsF,H | | | | |
Expenses before reductions | .25% | .25% | .25% | .25%A |
Expenses net of fee waivers, if any | .25% | .25% | .25% | .25%A |
Expenses net of all reductions | .25% | .25% | .25% | .25%A |
Net investment income (loss) | 1.66% | 1.67% | 2.43% | 2.27%A |
Supplemental Data | | | | |
Net assets, end of period (000 omitted) | $ 214 | $ 200 | $ 183 | $ 402 |
Portfolio turnover rate | 45% | 95% | 82% | 23%A |
A Annualized
B Total returns for periods of less than one year are not annualized.
C Total returns would have been lower if certain expenses had not been reduced during the applicable periods shown.
D Total returns do not include the effect of the sales charges.
E Calculated based on average shares outstanding during the period.
F Amounts do not include the activity of the underlying funds.
G For the period August 30, 2007 (commencement of operations) to July 31, 2008.
H Expense ratios reflect operating expenses of the class. Expenses before reductions do not reflect amounts reimbursed by the investment adviser or reductions from expense offset arrangements and do not represent the amount paid by the class during periods when reimbursements or reductions occur. Expenses net of fee waivers reflect expenses after reimbursement by the investment adviser but prior to reductions from expense offset arrangements. Expenses net of all reductions represent the net expenses paid by the class but do not include expenses of the investment companies in which the Fund invests.
See accompanying notes which are an integral part of the financial statements.
Annual Report
Financial Highlights - Class T
Years ended July 31, | 2011 | 2010 | 2009 | 2008G |
Selected Per-Share Data | | | | |
Net asset value, beginning of period | $ 44.20 | $ 40.22 | $ 46.52 | $ 50.00 |
Income from Investment Operations | | | | |
Net investment income (loss)E | .676 | .620 | .821 | .918 |
Net realized and unrealized gain (loss) | 5.107 | 4.147 | (5.548) | (3.339) |
Total from investment operations | 5.783 | 4.767 | (4.727) | (2.421) |
Distributions from net investment income | (.693) | (.682) | (.863) | (.869) |
Distributions from net realized gain | (.190) | (.105) | (.710) | (.190) |
Total distributions | (.883) | (.787) | (1.573) | (1.059) |
Net asset value, end of period | $ 49.10 | $ 44.20 | $ 40.22 | $ 46.52 |
Total ReturnB,C,D | 13.14% | 11.90% | (9.88)% | (4.98)% |
Ratios to Average Net AssetsF,H | | | | |
Expenses before reductions | .50% | .50% | .50% | .50%A |
Expenses net of fee waivers, if any | .50% | .50% | .50% | .50%A |
Expenses net of all reductions | .50% | .50% | .50% | .50%A |
Net investment income (loss) | 1.41% | 1.43% | 2.18% | 2.02%A |
Supplemental Data | | | | |
Net assets, end of period (000 omitted) | $ 27 | $ 35 | $ 54 | $ 95 |
Portfolio turnover rate | 45% | 95% | 82% | 23%A |
A Annualized
B Total returns for periods of less than one year are not annualized.
C Total returns would have been lower if certain expenses had not been reduced during the applicable periods shown.
D Total returns do not include the effect of the sales charges.
E Calculated based on average shares outstanding during the period.
F Amounts do not include the activity of the underlying funds.
G For the period August 30, 2007 (commencement of operations) to July 31, 2008.
H Expense ratios reflect operating expenses of the class. Expenses before reductions do not reflect amounts reimbursed by the investment adviser or reductions from expense offset arrangements and do not represent the amount paid by the class during periods when reimbursements or reductions occur. Expenses net of fee waivers reflect expenses after reimbursement by the investment adviser but prior to reductions from expense offset arrangements. Expenses net of all reductions represent the net expenses paid by the class but do not include expenses of the investment companies in which the Fund invests.
Financial Highlights - Class C
Years ended July 31, | 2011 | 2010 | 2009 | 2008G |
Selected Per-Share Data | | | | |
Net asset value, beginning of period | $ 44.22 | $ 40.23 | $ 46.51 | $ 50.00 |
Income from Investment Operations | | | | |
Net investment income (loss)E | .434 | .403 | .624 | .690 |
Net realized and unrealized gain (loss) | 5.102 | 4.143 | (5.532) | (3.342) |
Total from investment operations | 5.536 | 4.546 | (4.908) | (2.652) |
Distributions from net investment income | (.446) | (.451) | (.662) | (.648) |
Distributions from net realized gain | (.190) | (.105) | (.710) | (.190) |
Total distributions | (.636) | (.556) | (1.372) | (.838) |
Net asset value, end of period | $ 49.12 | $ 44.22 | $ 40.23 | $ 46.51 |
Total ReturnB,C,D | 12.55% | 11.33% | (10.32)% | (5.42)% |
Ratios to Average Net AssetsF,H | | | | |
Expenses before reductions | 1.00% | 1.00% | 1.00% | 1.00%A |
Expenses net of fee waivers, if any | 1.00% | 1.00% | 1.00% | 1.00%A |
Expenses net of all reductions | 1.00% | 1.00% | 1.00% | 1.00%A |
Net investment income (loss) | .91% | .93% | 1.68% | 1.52%A |
Supplemental Data | | | | |
Net assets, end of period (000 omitted) | $ 22 | $ 29 | $ 46 | $ 95 |
Portfolio turnover rate | 45% | 95% | 82% | 23%A |
A Annualized
B Total returns for periods of less than one year are not annualized.
C Total returns would have been lower if certain expenses had not been reduced during the applicable periods shown.
D Total returns do not include the effect of the contingent deferred sales charge.
E Calculated based on average shares outstanding during the period.
F Amounts do not include the activity of the underlying funds.
G For the period August 30, 2007 (commencement of operations) to July 31, 2008.
H Expense ratios reflect operating expenses of the class. Expenses before reductions do not reflect amounts reimbursed by the investment adviser or reductions from expense offset arrangements and do not represent the amount paid by the class during periods when reimbursements or reductions occur. Expenses net of fee waivers reflect expenses after reimbursement by the investment adviser but prior to reductions from expense offset arrangements. Expenses net of all reductions represent the net expenses paid by the class but do not include expenses of the investment companies in which the Fund invests.
See accompanying notes which are an integral part of the financial statements.
Annual Report
Financial Highlights - Income Replacement 2032
Years ended July 31, | 2011 | 2010 | 2009 | 2008G |
Selected Per-Share Data | | | | |
Net asset value, beginning of period | $ 44.19 | $ 40.22 | $ 46.53 | $ 50.00 |
Income from Investment Operations | | | | |
Net investment income (loss)D | .918 | .832 | 1.014 | 1.122 |
Net realized and unrealized gain (loss) | 5.095 | 4.147 | (5.557) | (3.310) |
Total from investment operations | 6.013 | 4.979 | (4.543) | (2.188) |
Distributions from net investment income | (.933) | (.904) | (1.057) | (1.092) |
Distributions from net realized gain | (.190) | (.105) | (.710) | (.190) |
Total distributions | (1.123) | (1.009) | (1.767) | (1.282) |
Net asset value, end of period | $ 49.08 | $ 44.19 | $ 40.22 | $ 46.53 |
Total ReturnB,C | 13.68% | 12.44% | (9.43)% | (4.53)% |
Ratios to Average Net AssetsE,H | | | | |
Expenses before reductionsF | .00% | .00% | .00% | .00%A |
Expenses net of fee waivers, if any | .00% | .00% | .00% | .00%A |
Expenses net of all reductions | .00% | .00% | .00% | .00%A |
Net investment income (loss) | 1.91% | 1.92% | 2.68% | 2.52%A |
Supplemental Data | | | | |
Net assets, end of period (000 omitted) | $ 1,297 | $ 1,391 | $ 1,285 | $ 731 |
Portfolio turnover rate | 45% | 95% | 82% | 23%A |
A Annualized
B Total returns for periods of less than one year are not annualized.
C Total returns would have been lower if certain expenses had not been reduced during the applicable periods shown.
D Calculated based on average shares outstanding during the period.
E Amounts do not include the activity of the underlying funds.
F Amount represents less than .01%.
G For the period August 30, 2007 (commencement of operations) to July 31, 2008.
H Expense ratios reflect operating expenses of the class. Expenses before reductions do not reflect amounts reimbursed by the investment adviser or reductions from expense offset arrangements and do not represent the amount paid by the class during periods when reimbursements or reductions occur. Expenses net of fee waivers reflect expenses after reimbursement by the investment adviser but prior to reductions from expense offset arrangements. Expenses net of all reductions represent the net expenses paid by the class but do not include expenses of the investment companies in which the Fund invests.
Financial Highlights - Institutional Class
Years ended July 31, | 2011 | 2010 | 2009 | 2008G |
Selected Per-Share Data | | | | |
Net asset value, beginning of period | $ 44.19 | $ 40.22 | $ 46.53 | $ 50.00 |
Income from Investment Operations | | | | |
Net investment income (loss)D | .904 | .834 | 1.009 | 1.147 |
Net realized and unrealized gain (loss) | 5.109 | 4.145 | (5.552) | (3.335) |
Total from investment operations | 6.013 | 4.979 | (4.543) | (2.188) |
Distributions from net investment income | (.933) | (.904) | (1.057) | (1.092) |
Distributions from net realized gain | (.190) | (.105) | (.710) | (.190) |
Total distributions | (1.123) | (1.009) | (1.767) | (1.282) |
Net asset value, end of period | $ 49.08 | $ 44.19 | $ 40.22 | $ 46.53 |
Total ReturnB,C | 13.68% | 12.44% | (9.43)% | (4.53)% |
Ratios to Average Net AssetsE,H | | | | |
Expenses before reductionsF | .00% | .00% | .00% | .00%A |
Expenses net of fee waivers, if any | .00% | .00% | .00% | .00%A |
Expenses net of all reductions | .00% | .00% | .00% | .00%A |
Net investment income (loss) | 1.91% | 1.92% | 2.68% | 2.52%A |
Supplemental Data | | | | |
Net assets, end of period (000 omitted) | $ 19 | $ 61 | $ 55 | $ 96 |
Portfolio turnover rate | 45% | 95% | 82% | 23%A |
A Annualized
B Total returns for periods of less than one year are not annualized.
C Total returns would have been lower if certain expenses had not been reduced during the applicable periods shown.
D Calculated based on average shares outstanding during the period.
E Amounts do not include the activity of the underlying funds.
F Amount represents less than .01%.
G For the period August 30, 2007 (commencement of operations) to July 31, 2008.
H Expense ratios reflect operating expenses of the class. Expenses before reductions do not reflect amounts reimbursed by the investment adviser or reductions from expense offset arrangements and do not represent the amount paid by the class during periods when reimbursements or reductions occur. Expenses net of fee waivers reflect expenses after reimbursement by the investment adviser but prior to reductions from expense offset arrangements. Expenses net of all reductions represent the net expenses paid by the class but do not include expenses of the investment companies in which the Fund invests.
See accompanying notes which are an integral part of the financial statements.
Annual Report
Fidelity Income Replacement 2034 Fund
Investment Changes (Unaudited)
Fund Holdings as of July 31, 2011 |
| % of fund's
net assets | % of fund's net assets
6 months ago |
Domestic Equity Funds | | |
Fidelity Advisor Mid Cap II Fund Institutional Class | 5.5 | 5.6 |
Fidelity Disciplined Equity Fund | 5.8 | 5.8 |
Fidelity Equity-Income Fund | 5.7 | 5.9 |
Fidelity Large Cap Core Enhanced Index Fund | 9.4 | 9.4 |
Fidelity Series 100 Index Fund | 7.0 | 7.0 |
Fidelity Series Broad Market Opportunities Fund | 9.2 | 9.4 |
Fidelity Series Small Cap Opportunities Fund | 3.7 | 3.7 |
| 46.3 | 46.8 |
International Equity Funds | | |
Fidelity Advisor International Discovery Fund Institutional Class | 9.4 | 9.6 |
High Yield Fixed-Income Funds | | |
Fidelity Capital & Income Fund | 2.7 | 2.7 |
Fidelity Strategic Income Fund | 2.8 | 2.7 |
| 5.5 | 5.4 |
Investment Grade Fixed-Income Funds | | |
Fidelity Government Income Fund | 5.6 | 5.5 |
Fidelity Strategic Real Return Fund | 5.5 | 5.5 |
Fidelity Total Bond Fund | 16.7 | 16.6 |
| 27.8 | 27.6 |
Short-Term Funds | | |
Fidelity Institutional Money Market Portfolio Institutional Class | 5.5 | 5.3 |
Fidelity Short-Term Bond Fund | 5.5 | 5.3 |
| 11.0 | 10.6 |
Net Other Assets (Liabilities)* | 0.0 | 0.0 |
| 100.0 | 100.0 |
* Amount represents less than 0.1% |
Asset Allocation (% of fund's net assets) |
Current |
| Domestic Equity Funds | 46.3% | |
| International Equity Funds | 9.4% | |
| High Yield
Fixed-Income Funds | 5.5% | |
| Investment Grade Fixed-Income Funds | 27.8% | |
| Short-Term Funds | 11.0% | |

Six months ago |
| Domestic Equity Funds | 46.8% | |
| International Equity Funds | 9.6% | |
| High Yield
Fixed-Income Funds | 5.4% | |
| Investment Grade Fixed-Income Funds | 27.6% | |
| Short-Term Funds | 10.6% | |

Expected |
| Domestic Equity Funds | 46.4% | |
| International Equity Funds | 9.2% | |
| High Yield
Fixed-Income Funds | 5.3% | |
| Investment Grade Fixed-Income Funds | 27.7% | |
| Short-Term Funds | 11.4% | |

The fund invests according to an asset allocation strategy that becomes increasingly conservative over time. The six months ago allocation is based on the fund's holdings as of January 31, 2011. The current allocation is based on the fund's holdings as of July 31, 2011. The expected allocation represents the fund's anticipated allocation at January 31, 2012. |
Annual Report
Fidelity Income Replacement 2034 Fund
Investments July 31, 2011
Showing Percentage of Net Assets
Equity Funds - 55.7% |
| Shares | | Value |
Domestic Equity Funds - 46.3% |
Fidelity Advisor Mid Cap II Fund Institutional Class (a) | 6,828 | | $ 123,787 |
Fidelity Disciplined Equity Fund | 5,540 | | 128,972 |
Fidelity Equity-Income Fund | 2,870 | | 127,323 |
Fidelity Large Cap Core Enhanced Index Fund | 23,376 | | 209,683 |
Fidelity Series 100 Index Fund | 17,425 | | 157,695 |
Fidelity Series Broad Market Opportunities Fund | 20,065 | | 206,672 |
Fidelity Series Small Cap Opportunities Fund | 7,304 | | 81,955 |
TOTAL DOMESTIC EQUITY FUNDS | | 1,036,087 |
International Equity Funds - 9.4% |
Fidelity Advisor International Discovery Fund Institutional Class | 6,262 | | 210,595 |
TOTAL EQUITY FUNDS (Cost $1,028,008) | 1,246,682 |
Fixed-Income Funds - 33.3% |
| | | |
High Yield Fixed-Income Funds - 5.5% |
Fidelity Capital & Income Fund | 6,338 | | 60,652 |
Fidelity Strategic Income Fund | 5,475 | | 62,309 |
TOTAL HIGH YIELD FIXED-INCOME FUNDS | | 122,961 |
|
| Shares | | Value |
Investment Grade Fixed-Income Funds - 27.8% |
Fidelity Government Income Fund | 11,700 | | $ 124,954 |
Fidelity Strategic Real Return Fund | 12,543 | | 124,674 |
Fidelity Total Bond Fund | 33,979 | | 374,113 |
TOTAL INVESTMENT GRADE FIXED-INCOME FUNDS | | 623,741 |
TOTAL FIXED-INCOME FUNDS (Cost $679,154) | 746,702 |
Short-Term Funds - 11.0% |
| | | |
Fidelity Institutional Money Market Portfolio Institutional Class | 123,107 | | 123,107 |
Fidelity Short-Term Bond Fund | 14,496 | | 123,800 |
TOTAL SHORT-TERM FUNDS (Cost $243,107) | 246,907 |
TOTAL INVESTMENT PORTFOLIO - 100.0% (Cost $1,950,269) | | 2,240,291 |
NET OTHER ASSETS (LIABILITIES) - 0.0% | | (33) |
NET ASSETS - 100% | $ 2,240,258 |
Legend |
(a) Non-income producing |
Other Information |
All investments are categorized as Level 1 under the Fair Value Hierarchy. The inputs or methodology used for valuing securities may not be an indication of the risk associated with investing in those securities. For more information on valuation inputs, please refer to the Security Valuation section in the accompanying Notes to Financial Statements. |
Income Tax Information |
At July 31, 2011, the Fund had a capital loss carryforward of approximately $106,484 of which $62,824 and $43,660 will expire in fiscal 2018 and 2019, respectively. Capital loss carryforwards are only available to offset future capital gains of the Fund to the extent provided by regulations and may be limited. |
See accompanying notes which are an integral part of the financial statements.
Annual Report
Fidelity Income Replacement 2034 Fund
Statement of Assets and Liabilities
| July 31, 2011 |
| | |
Assets | | |
Investment in securities, at value (cost $1,950,269) - See accompanying schedule | | $ 2,240,291 |
| | |
Liabilities | | |
Distribution and service plan fees payable | | 33 |
| | |
Net Assets | | $ 2,240,258 |
Net Assets consist of: | | |
Paid in capital | | $ 2,093,614 |
Undistributed net investment income | | 426 |
Accumulated undistributed net realized gain (loss) on investments | | (143,804) |
Net unrealized appreciation (depreciation) on investments | | 290,022 |
Net Assets | | $ 2,240,258 |
| | |
Calculation of Maximum Offering Price Class A:
Net Asset Value and redemption price per share ($20,223.1 ÷ 409.92 shares) | | $ 49.33 |
| | |
Maximum offering price per share (100/94.25 of $49.33) | | $ 52.34 |
| | |
Class T:
Net Asset Value and redemption price per share ($26,613.4 ÷ 539.42 shares) | | $ 49.34 |
| | |
Maximum offering price per share (100/96.50 of $49.34) | | $ 51.13 |
| | |
Class C:
Net Asset Value and offering price per share ($20,147.3 ÷ 408.12 shares)A | | $ 49.37 |
| | |
Income Replacement 2034:
Net Asset Value, offering price and redemption price per share ($2,066,283.9 ÷ 41,902.71 shares) | | $ 49.31 |
| | |
Institutional Class:
Net Asset Value, offering price and redemption price per share ($106,990.6 ÷ 2,169.54 shares) | | $ 49.31 |
A Redemption price per share is equal to net asset value less any applicable contingent deferred sales charge.
Statement of Operations
| Year ended July 31, 2011 |
| | |
Investment Income | | |
Income distributions from underlying funds | | $ 38,012 |
| | |
Expenses | | |
Distribution and service plan fees | $ 444 | |
Independent trustees' compensation | 7 | |
Total expenses before reductions | 451 | |
Expense reductions | (7) | 444 |
Net investment income (loss) | | 37,568 |
Realized and Unrealized Gain (Loss) Realized gain (loss) on sale of underlying fund shares | (10,325) | |
Capital gain distributions from underlying funds | 10,953 | |
Total net realized gain (loss) | | 628 |
Change in net unrealized appreciation (depreciation) on underlying funds | | 213,839 |
Net gain (loss) | | 214,467 |
Net increase (decrease) in net assets resulting from operations | | $ 252,035 |
See accompanying notes which are an integral part of the financial statements.
Annual Report
Fidelity Income Replacement 2034 Fund
Financial Statements - continued
Statement of Changes in Net Assets
| Year ended
July 31, 2011 | Year ended
July 31, 2010 |
Increase (Decrease) in Net Assets | | |
Operations | | |
Net investment income (loss) | $ 37,568 | $ 38,285 |
Net realized gain (loss) | 628 | (69,132) |
Change in net unrealized appreciation (depreciation) | 213,839 | 253,583 |
Net increase (decrease) in net assets resulting from operations | 252,035 | 222,736 |
Distributions to shareholders from net investment income | (37,649) | (38,318) |
Distributions to shareholders from net realized gain | (8,111) | (8,464) |
Total distributions | (45,760) | (46,782) |
Share transactions - net increase (decrease) | 179,595 | (216,059) |
Total increase (decrease) in net assets | 385,870 | (40,105) |
| | |
Net Assets | | |
Beginning of period | 1,854,388 | 1,894,493 |
End of period (including undistributed net investment income of $426 and undistributed net investment income of $518, respectively) | $ 2,240,258 | $ 1,854,388 |
Financial Highlights - Class A
Years ended July 31, | 2011 | 2010 | 2009 | 2008G |
Selected Per-Share Data | | | | |
Net asset value, beginning of period | $ 44.27 | $ 40.29 | $ 46.40 | $ 50.00 |
Income from Investment Operations | | | | |
Net investment income (loss)E | .799 | .753 | .923 | .994 |
Net realized and unrealized gain (loss) | 5.233 | 4.174 | (5.753) | (3.438) |
Total from investment operations | 6.032 | 4.927 | (4.830) | (2.444) |
Distributions from net investment income | (.772) | (.758) | (.890) | (.956) |
Distributions from net realized gain | (.200) | (.189) | (.390) | (.200) |
Total distributions | (.972) | (.947) | (1.280) | (1.156) |
Net asset value, end of period | $ 49.33 | $ 44.27 | $ 40.29 | $ 46.40 |
Total ReturnB,C,D | 13.69% | 12.29% | (10.20)% | (5.04)% |
Ratios to Average Net AssetsF,H | | | | |
Expenses before reductions | .25% | .25% | .26% | .25%A |
Expenses net of fee waivers, if any | .25% | .25% | .26% | .25%A |
Expenses net of all reductions | .25% | .25% | .26% | .25%A |
Net investment income (loss) | 1.66% | 1.73% | 2.46% | 2.19%A |
Supplemental Data | | | | |
Net assets, end of period (000 omitted) | $ 20 | $ 27 | $ 63 | $ 138 |
Portfolio turnover rate | 39% | 22% | 46% | 12%A |
A Annualized
B Total returns for periods of less than one year are not annualized.
C Total returns would have been lower if certain expenses had not been reduced during the applicable periods shown.
D Total returns do not include the effect of the sales charges.
E Calculated based on average shares outstanding during the period.
F Amounts do not include the activity of the underlying funds.
G For the period August 30, 2007 (commencement of operations) to July 31, 2008.
H Expense ratios reflect operating expenses of the class. Expenses before reductions do not reflect amounts reimbursed by the investment adviser or reductions from expense offset arrangements and do not represent the amount paid by the class during periods when reimbursements or reductions occur. Expenses net of fee waivers reflect expenses after reimbursement by the investment adviser but prior to reductions from expense offset arrangements. Expenses net of all reductions represent the net expenses paid by the class but do not include expenses of the investment companies in which the Fund invests.
See accompanying notes which are an integral part of the financial statements.
Annual Report
Financial Highlights - Class T
Years ended July 31, | 2011 | 2010 | 2009 | 2008G |
Selected Per-Share Data | | | | |
Net asset value, beginning of period | $ 44.27 | $ 40.29 | $ 46.40 | $ 50.00 |
Income from Investment Operations | | | | |
Net investment income (loss)E | .681 | .645 | .828 | .875 |
Net realized and unrealized gain (loss) | 5.247 | 4.175 | (5.757) | (3.431) |
Total from investment operations | 5.928 | 4.820 | (4.929) | (2.556) |
Distributions from net investment income | (.658) | (.651) | (.791) | (.844) |
Distributions from net realized gain | (.200) | (.189) | (.390) | (.200) |
Total distributions | (.858) | (.840) | (1.181) | (1.044) |
Net asset value, end of period | $ 49.34 | $ 44.27 | $ 40.29 | $ 46.40 |
Total ReturnB,C,D | 13.45% | 12.01% | (10.44)% | (5.25)% |
Ratios to Average Net AssetsF,H | | | | |
Expenses before reductions | .50% | .50% | .51% | .50%A |
Expenses net of fee waivers, if any | .50% | .50% | .51% | .50%A |
Expenses net of all reductions | .50% | .50% | .51% | .50%A |
Net investment income (loss) | 1.42% | 1.48% | 2.21% | 1.94%A |
Supplemental Data | | | | |
Net assets, end of period (000 omitted) | $ 27 | $ 35 | $ 54 | $ 95 |
Portfolio turnover rate | 39% | 22% | 46% | 12%A |
A Annualized
B Total returns for periods of less than one year are not annualized.
C Total returns would have been lower if certain expenses had not been reduced during the applicable periods shown.
D Total returns do not include the effect of the sales charges.
E Calculated based on average shares outstanding during the period.
F Amounts do not include the activity of the underlying funds.
G For the period August 30, 2007 (commencement of operations) to July 31, 2008.
H Expense ratios reflect operating expenses of the class. Expenses before reductions do not reflect amounts reimbursed by the investment adviser or reductions from expense offset arrangements and do not represent the amount paid by the class during periods when reimbursements or reductions occur. Expenses net of fee waivers reflect expenses after reimbursement by the investment adviser but prior to reductions from expense offset arrangements. Expenses net of all reductions represent the net expenses paid by the class but do not include expenses of the investment companies in which the Fund invests.
Financial Highlights - Class C
Years ended July 31, | 2011 | 2010 | 2009 | 2008G |
Selected Per-Share Data | | | | |
Net asset value, beginning of period | $ 44.30 | $ 40.30 | $ 46.39 | $ 50.00 |
Income from Investment Operations | | | | |
Net investment income (loss)E | .439 | .426 | .631 | .658 |
Net realized and unrealized gain (loss) | 5.239 | 4.185 | (5.740) | (3.448) |
Total from investment operations | 5.678 | 4.611 | (5.109) | (2.790) |
Distributions from net investment income | (.408) | (.422) | (.591) | (.620) |
Distributions from net realized gain | (.200) | (.189) | (.390) | (.200) |
Total distributions | (.608) | (.611) | (.981) | (.820) |
Net asset value, end of period | $ 49.37 | $ 44.30 | $ 40.30 | $ 46.39 |
Total ReturnB,C,D | 12.85% | 11.47% | (10.88)% | (5.70)% |
Ratios to Average Net AssetsF,H | | | | |
Expenses before reductions | 1.00% | 1.00% | 1.01% | 1.00%A |
Expenses net of fee waivers, if any | 1.00% | 1.00% | 1.01% | 1.00%A |
Expenses net of all reductions | 1.00% | 1.00% | 1.01% | 1.00%A |
Net investment income (loss) | .91% | .98% | 1.71% | 1.44%A |
Supplemental Data | | | | |
Net assets, end of period (000 omitted) | $ 20 | $ 27 | $ 41 | $ 94 |
Portfolio turnover rate | 39% | 22% | 46% | 12%A |
A Annualized
B Total returns for periods of less than one year are not annualized.
C Total returns would have been lower if certain expenses had not been reduced during the applicable periods shown.
D Total returns do not include the effect of the contingent deferred sales charge.
E Calculated based on average shares outstanding during the period.
F Amounts do not include the activity of the underlying funds.
G For the period August 30, 2007 (commencement of operations) to July 31, 2008.
H Expense ratios reflect operating expenses of the class. Expenses before reductions do not reflect amounts reimbursed by the investment adviser or reductions from expense offset arrangements and do not represent the amount paid by the class during periods when reimbursements or reductions occur. Expenses net of fee waivers reflect expenses after reimbursement by the investment adviser but prior to reductions from expense offset arrangements. Expenses net of all reductions represent the net expenses paid by the class but do not include expenses of the investment companies in which the Fund invests.
See accompanying notes which are an integral part of the financial statements.
Annual Report
Financial Highlights - Income Replacement 2034
Years ended July 31, | 2011 | 2010 | 2009 | 2008G |
Selected Per-Share Data | | | | |
Net asset value, beginning of period | $ 44.26 | $ 40.28 | $ 46.40 | $ 50.00 |
Income from Investment Operations | | | | |
Net investment income (loss)D | .921 | .862 | .988 | 1.090 |
Net realized and unrealized gain (loss) | 5.227 | 4.183 | (5.729) | (3.425) |
Total from investment operations | 6.148 | 5.045 | (4.741) | (2.335) |
Distributions from net investment income | (.898) | (.876) | (.989) | (1.065) |
Distributions from net realized gain | (.200) | (.189) | (.390) | (.200) |
Total distributions | (1.098) | (1.065) | (1.379) | (1.265) |
Net asset value, end of period | $ 49.31 | $ 44.26 | $ 40.28 | $ 46.40 |
Total ReturnB,C | 13.97% | 12.59% | (9.98)% | (4.83)% |
Ratios to Average Net AssetsE,H | | | | |
Expenses before reductions | .00%F | .00%F | .01% | .00%A,F |
Expenses net of fee waivers, if any | .00% | .00% | .01% | .00%A |
Expenses net of all reductions | .00% | .00% | .01% | .00%A |
Net investment income (loss) | 1.92% | 1.98% | 2.71% | 2.44%A |
Supplemental Data | | | | |
Net assets, end of period (000 omitted) | $ 2,066 | $ 1,672 | $ 1,628 | $ 552 |
Portfolio turnover rate | 39% | 22% | 46% | 12%A |
A Annualized
B Total returns for periods of less than one year are not annualized.
C Total returns would have been lower if certain expenses had not been reduced during the applicable periods shown.
D Calculated based on average shares outstanding during the period.
E Amounts do not include the activity of the underlying funds.
F Amount represents less than .01%.
G For the period August 30, 2007 (commencement of operations) to July 31, 2008.
H Expense ratios reflect operating expenses of the class. Expenses before reductions do not reflect amounts reimbursed by the investment adviser or reductions from expense offset arrangements and do not represent the amount paid by the class during periods when reimbursements or reductions occur. Expenses net of fee waivers reflect expenses after reimbursement by the investment adviser but prior to reductions from expense offset arrangements. Expenses net of all reductions represent the net expenses paid by the class but do not include expenses of the investment companies in which the Fund invests.
Financial Highlights - Institutional Class
Years ended July 31, | 2011 | 2010 | 2009 | 2008G |
Selected Per-Share Data | | | | |
Net asset value, beginning of period | $ 44.26 | $ 40.28 | $ 46.41 | $ 50.00 |
Income from Investment Operations | | | | |
Net investment income (loss)D | .922 | .860 | 1.002 | 1.114 |
Net realized and unrealized gain (loss) | 5.226 | 4.185 | (5.753) | (3.439) |
Total from investment operations | 6.148 | 5.045 | (4.751) | (2.325) |
Distributions from net investment income | (.898) | (.876) | (.989) | (1.065) |
Distributions from net realized gain | (.200) | (.189) | (.390) | (.200) |
Total distributions | (1.098) | (1.065) | (1.379) | (1.265) |
Net asset value, end of period | $ 49.31 | $ 44.26 | $ 40.28 | $ 46.41 |
Total ReturnB,C | 13.97% | 12.59% | (10.00)% | (4.81)% |
Ratios to Average Net AssetsE,H | | | | |
Expenses before reductions | .00% F | .00% F | .01% | .00%A, F |
Expenses net of fee waivers, if any | .00% | .00% | .01% | .00%A |
Expenses net of all reductions | .00% | .00% | .01% | .00%A |
Net investment income (loss) | 1.92% | 1.98% | 2.71% | 2.44%A |
Supplemental Data | | | | |
Net assets, end of period (000 omitted) | $ 107 | $ 94 | $ 108 | $ 95 |
Portfolio turnover rate | 39% | 22% | 46% | 12%A |
A Annualized
B Total returns for periods of less than one year are not annualized.
C Total returns would have been lower if certain expenses had not been reduced during the applicable periods shown.
D Calculated based on average shares outstanding during the period.
E Amounts do not include the activity of the underlying funds.
F Amount represents less than .01%.
G For the period August 30, 2007 (commencement of operations) to July 31, 2008.
H Expense ratios reflect operating expenses of the class. Expenses before reductions do not reflect amounts reimbursed by the investment adviser or reductions from expense offset arrangements and do not represent the amount paid by the class during periods when reimbursements or reductions occur. Expenses net of fee waivers reflect expenses after reimbursement by the investment adviser but prior to reductions from expense offset arrangements. Expenses net of all reductions represent the net expenses paid by the class but do not include expenses of the investment companies in which the Fund invests.
See accompanying notes which are an integral part of the financial statements.
Annual Report
Fidelity Income Replacement 2036 Fund
Investment Changes (Unaudited)
Fund Holdings as of July 31, 2011 |
| % of fund's
net assets | % of fund's net assets
6 months ago |
Domestic Equity Funds | | |
Fidelity Advisor Mid Cap II Fund Institutional Class | 5.6 | 5.7 |
Fidelity Disciplined Equity Fund | 5.8 | 6.0 |
Fidelity Equity-Income Fund | 5.8 | 6.0 |
Fidelity Large Cap Core Enhanced Index Fund | 9.5 | 9.6 |
Fidelity Series 100 Index Fund | 7.2 | 7.2 |
Fidelity Series Broad Market Opportunities Fund | 9.4 | 9.5 |
Fidelity Series Small Cap Opportunities Fund | 3.7 | 3.8 |
| 47.0 | 47.8 |
International Equity Funds | | |
Fidelity Advisor International Discovery Fund Institutional Class | 10.3 | 10.4 |
High Yield Fixed-Income Funds | | |
Fidelity Capital & Income Fund | 2.9 | 2.9 |
Fidelity Strategic Income Fund | 2.9 | 2.8 |
| 5.8 | 5.7 |
Investment Grade Fixed-Income Funds | | |
Fidelity Government Income Fund | 5.4 | 5.4 |
Fidelity Strategic Real Return Fund | 5.4 | 5.3 |
Fidelity Total Bond Fund | 16.3 | 16.0 |
| 27.1 | 26.7 |
Short-Term Funds | | |
Fidelity Institutional Money Market Portfolio Institutional Class | 4.9 | 4.7 |
Fidelity Short-Term Bond Fund | 4.9 | 4.7 |
| 9.8 | 9.4 |
Net Other Assets (Liabilities)* | 0.0 | 0.0 |
| 100.0 | 100.0 |
* Amount represents less than 0.1% |
Asset Allocation (% of fund's net assets) |
Current |
| Domestic Equity Funds | 47.0% | |
| International Equity Funds | 10.3% | |
| High Yield
Fixed-Income Funds | 5.8% | |
| Investment Grade Fixed-Income Funds | 27.1% | |
| Short-Term Funds | 9.8% | |

Six months ago |
| Domestic Equity Funds | 47.8% | |
| International Equity Funds | 10.4% | |
| High Yield
Fixed-Income Funds | 5.7% | |
| Investment Grade Fixed-Income Funds | 26.7% | |
| Short-Term Funds | 9.4% | |

Expected |
| Domestic Equity Funds | 47.2% | |
| International Equity Funds | 10.0% | |
| High Yield
Fixed-Income Funds | 5.6% | |
| Investment Grade Fixed-Income Funds | 27.0% | |
| Short-Term Funds | 10.2% | |

The fund invests according to an asset allocation strategy that becomes increasingly conservative over time. The six months ago allocation is based on the fund's holdings as of January 31, 2011. The current allocation is based on the fund's holdings as of July 31, 2011. The expected allocation represents the fund's anticipated allocation at January 31, 2012. |
Annual Report
Fidelity Income Replacement 2036 Fund
Investments July 31, 2011
Showing Percentage of Net Assets
Equity Funds - 57.3% |
| Shares | | Value |
Domestic Equity Funds - 47.0% |
Fidelity Advisor Mid Cap II Fund Institutional Class (a) | 9,279 | | $ 168,225 |
Fidelity Disciplined Equity Fund | 7,538 | | 175,492 |
Fidelity Equity-Income Fund | 3,902 | | 173,114 |
Fidelity Large Cap Core Enhanced Index Fund | 31,736 | | 284,669 |
Fidelity Series 100 Index Fund | 23,697 | | 214,461 |
Fidelity Series Broad Market Opportunities Fund | 27,293 | | 281,115 |
Fidelity Series Small Cap Opportunities Fund | 9,947 | | 111,604 |
TOTAL DOMESTIC EQUITY FUNDS | | 1,408,680 |
International Equity Funds - 10.3% |
Fidelity Advisor International Discovery Fund Institutional Class | 9,198 | | 309,320 |
TOTAL EQUITY FUNDS (Cost $1,739,063) | 1,718,000 |
Fixed-Income Funds - 32.9% |
| | | |
High Yield Fixed-Income Funds - 5.8% |
Fidelity Capital & Income Fund | 8,916 | | 85,326 |
Fidelity Strategic Income Fund | 7,702 | | 87,653 |
TOTAL HIGH YIELD FIXED-INCOME FUNDS | | 172,979 |
|
| Shares | | Value |
Investment Grade Fixed-Income Funds - 27.1% |
Fidelity Government Income Fund | 15,232 | | $ 162,680 |
Fidelity Strategic Real Return Fund | 16,331 | | 162,335 |
Fidelity Total Bond Fund | 44,194 | | 486,575 |
TOTAL INVESTMENT GRADE FIXED-INCOME FUNDS | | 811,590 |
TOTAL FIXED-INCOME FUNDS (Cost $961,707) | 984,569 |
Short-Term Funds - 9.8% |
| | | |
Fidelity Institutional Money Market Portfolio Institutional Class | 146,429 | | 146,429 |
Fidelity Short-Term Bond Fund | 17,244 | | 147,265 |
TOTAL SHORT-TERM FUNDS (Cost $293,013) | 293,694 |
TOTAL INVESTMENT PORTFOLIO - 100.0% (Cost $2,993,783) | | 2,996,263 |
NET OTHER ASSETS (LIABILITIES) - 0.0% | | (248) |
NET ASSETS - 100% | $ 2,996,015 |
Legend |
(a) Non-income producing |
Other Information |
All investments are categorized as Level 1 under the Fair Value Hierarchy. The inputs or methodology used for valuing securities may not be an indication of the risk associated with investing in those securities. For more information on valuation inputs, please refer to the Security Valuation section in the accompanying Notes to Financial Statements. |
Income Tax Information |
At July 31, 2011, the Fund had a capital loss carryforward of approximately $206,608 of which $19,968, $183,763 and $2,877 will expire in fiscal 2017, 2018 and 2019, respectively. Capital loss carryforwards are only available to offset future capital gains of the Fund to the extent provided by regulations and may be limited. |
See accompanying notes which are an integral part of the financial statements.
Annual Report
Fidelity Income Replacement 2036 Fund
Statement of Assets and Liabilities
| July 31, 2011 |
| | |
Assets | | |
Investment in securities, at value (cost $2,993,783) - See accompanying schedule | | $ 2,996,263 |
Cash | | 75 |
Total assets | | 2,996,338 |
| | |
Liabilities | | |
Payable for investments purchased | $ 6 | |
Distribution and service plan fees payable | 317 | |
Total liabilities | | 323 |
| | |
Net Assets | | $ 2,996,015 |
Net Assets consist of: | | |
Paid in capital | | $ 3,215,676 |
Undistributed net investment income | | 528 |
Accumulated undistributed net realized gain (loss) on investments | | (222,669) |
Net unrealized appreciation (depreciation) on investments | | 2,480 |
Net Assets | | $ 2,996,015 |
| | |
Calculation of Maximum Offering Price Class A:
Net Asset Value and redemption price per share ($31,272 ÷ 639.31 shares) | | $ 48.92 |
| | |
Maximum offering price per share (100/94.25 of $48.92) | | $ 51.90 |
| | |
Class T:
Net Asset Value and redemption price per share ($287,732 ÷ 5,884.83 shares) | | $ 48.89 |
| | |
Maximum offering price per share (100/96.50 of $48.89) | | $ 50.66 |
| | |
Class C:
Net Asset Value and offering price per share ($215,963 ÷ 4,417.96 shares)A | | $ 48.88 |
| | |
Income Replacement 2036:
Net Asset Value, offering price and redemption price per share ($2,433,382 ÷ 49,755.66 shares) | | $ 48.91 |
| | |
Institutional Class:
Net Asset Value, offering price and redemption price per share ($27,666 ÷ 565.71 shares) | | $ 48.90 |
A Redemption price per share is equal to net asset value less any applicable contingent deferred sales charge.
Statement of Operations
| Year ended July 31, 2011 |
| | |
Investment Income | | |
Income distributions from underlying funds | | $ 37,375 |
| | |
Expenses | | |
Distribution and service plan fees | $ 2,913 | |
Independent trustees' compensation | 6 | |
Total expenses before reductions | 2,919 | |
Expense reductions | (6) | 2,913 |
Net investment income (loss) | | 34,462 |
Realized and Unrealized Gain (Loss) Realized gain (loss) on sale of underlying fund shares | 16,103 | |
Capital gain distributions from underlying funds | 9,107 | |
Total net realized gain (loss) | | 25,210 |
Change in net unrealized appreciation (depreciation) on underlying funds | | 122,897 |
Net gain (loss) | | 148,107 |
Net increase (decrease) in net assets resulting from operations | | $ 182,569 |
See accompanying notes which are an integral part of the financial statements.
Annual Report
Fidelity Income Replacement 2036 Fund
Financial Statements - continued
Statement of Changes in Net Assets
| Year ended
July 31, 2011 | Year ended
July 31, 2010 |
Increase (Decrease) in Net Assets | | |
Operations | | |
Net investment income (loss) | $ 34,462 | $ 19,710 |
Net realized gain (loss) | 25,210 | (40,612) |
Change in net unrealized appreciation (depreciation) | 122,897 | 163,539 |
Net increase (decrease) in net assets resulting from operations | 182,569 | 142,637 |
Distributions to shareholders from net investment income | (34,152) | (19,743) |
Distributions to shareholders from net realized gain | (6,329) | (3,949) |
Total distributions | (40,481) | (23,692) |
Share transactions - net increase (decrease) | 1,729,093 | (128,803) |
Total increase (decrease) in net assets | 1,871,181 | (9,858) |
| | |
Net Assets | | |
Beginning of period | 1,124,834 | 1,134,692 |
End of period (including undistributed net investment income of $528 and undistributed net investment income of $253, respectively) | $ 2,996,015 | $ 1,124,834 |
Financial Highlights - Class A
Years ended July 31, | 2011 | 2010 | 2009 | 2008G |
Selected Per-Share Data | | | | |
Net asset value, beginning of period | $ 43.73 | $ 39.70 | $ 46.40 | $ 50.00 |
Income from Investment Operations | | | | |
Net investment income (loss)E | .811 | .748 | .937 | .951 |
Net realized and unrealized gain (loss) | 5.306 | 4.178 | (6.127) | (3.464) |
Total from investment operations | 6.117 | 4.926 | (5.190) | (2.513) |
Distributions from net investment income | (.771) | (.752) | (.940) | (.897) |
Distributions from net realized gain | (.156) | (.144) | (.570) | (.190) |
Total distributions | (.927) | (.896) | (1.510) | (1.087) |
Net asset value, end of period | $ 48.92 | $ 43.73 | $ 39.70 | $ 46.40 |
Total ReturnB,C,D | 14.05% | 12.46% | (10.72)% | (5.17)% |
Ratios to Average Net AssetsF,H | | | | |
Expenses before reductions | .25% | .25% | .25% | .25%A |
Expenses net of fee waivers, if any | .25% | .25% | .25% | .25%A |
Expenses net of all reductions | .25% | .25% | .25% | .25%A |
Net investment income (loss) | 1.70% | 1.74% | 2.52% | 2.08%A |
Supplemental Data | | | | |
Net assets, end of period (000 omitted) | $ 31 | $ 40 | $ 54 | $ 95 |
Portfolio turnover rate | 19% | 26% | 39% | 44%A |
A Annualized
B Total returns for periods of less than one year are not annualized.
C Total returns would have been lower if certain expenses had not been reduced during the applicable periods shown.
D Total returns do not include the effect of the sales charges.
E Calculated based on average shares outstanding during the period.
F Amounts do not include the activity of the underlying funds.
G For the period August 30, 2007 (commencement of operations) to July 31, 2008.
H Expense ratios reflect operating expenses of the class. Expenses before reductions do not reflect amounts reimbursed by the investment adviser or reductions from expense offset arrangements and do not represent the amount paid by the class during periods when reimbursements or reductions occur. Expenses net of fee waivers reflect expenses after reimbursement by the investment adviser but prior to reductions from expense offset arrangements. Expenses net of all reductions represent the net expenses paid by the class but do not include expenses of the investment companies in which the Fund invests.
See accompanying notes which are an integral part of the financial statements.
Annual Report
Financial Highlights - Class T
Years ended July 31, | 2011 | 2010 | 2009 | 2008G |
Selected Per-Share Data | | | | |
Net asset value, beginning of period | $ 43.72 | $ 39.69 | $ 46.39 | $ 50.00 |
Income from Investment Operations | | | | |
Net investment income (loss)E | .693 | .639 | .844 | .823 |
Net realized and unrealized gain (loss) | 5.287 | 4.183 | (6.122) | (3.449) |
Total from investment operations | 5.980 | 4.822 | (5.278) | (2.626) |
Distributions from net investment income | (.654) | (.648) | (.852) | (.794) |
Distributions from net realized gain | (.156) | (.144) | (.570) | (.190) |
Total distributions | (.810) | (.792) | (1.422) | (.984) |
Net asset value, end of period | $ 48.89 | $ 43.72 | $ 39.69 | $ 46.39 |
Total ReturnB,C,D | 13.73% | 12.19% | (10.93)% | (5.39)% |
Ratios to Average Net AssetsF,H | | | | |
Expenses before reductions | .50% | .50% | .50% | .50%A |
Expenses net of fee waivers, if any | .50% | .50% | .50% | .50%A |
Expenses net of all reductions | .50% | .50% | .50% | .50%A |
Net investment income (loss) | 1.45% | 1.49% | 2.28% | 1.83%A |
Supplemental Data | | | | |
Net assets, end of period (000 omitted) | $ 288 | $ 265 | $ 265 | $ 384 |
Portfolio turnover rate | 19% | 26% | 39% | 44%A |
A Annualized
B Total returns for periods of less than one year are not annualized.
C Total returns would have been lower if certain expenses had not been reduced during the applicable periods shown.
D Total returns do not include the effect of the sales charges.
E Calculated based on average shares outstanding during the period.
F Amounts do not include the activity of the underlying funds.
G For the period August 30, 2007 (commencement of operations) to July 31, 2008.
H Expense ratios reflect operating expenses of the class. Expenses before reductions do not reflect amounts reimbursed by the investment adviser or reductions from expense offset arrangements and do not represent the amount paid by the class during periods when reimbursements or reductions occur. Expenses net of fee waivers reflect expenses after reimbursement by the investment adviser but prior to reductions from expense offset arrangements. Expenses net of all reductions represent the net expenses paid by the class but do not include expenses of the investment companies in which the Fund invests.
Financial Highlights - Class C
Years ended July 31, | 2011 | 2010 | 2009 | 2008G |
Selected Per-Share Data | | | | |
Net asset value, beginning of period | $ 43.74 | $ 39.71 | $ 46.39 | $ 50.00 |
Income from Investment Operations | | | | |
Net investment income (loss)E | .454 | .424 | .655 | .609 |
Net realized and unrealized gain (loss) | 5.293 | 4.179 | (6.114) | (3.465) |
Total from investment operations | 5.747 | 4.603 | (5.459) | (2.856) |
Distributions from net investment income | (.451) | (.429) | (.651) | (.564) |
Distributions from net realized gain | (.156) | (.144) | (.570) | (.190) |
Total distributions | (.607) | (.573) | (1.221) | (.754) |
Net asset value, end of period | $ 48.88 | $ 43.74 | $ 39.71 | $ 46.39 |
Total ReturnB,C,D | 13.17% | 11.61% | (11.38)% | (5.82)% |
Ratios to Average Net AssetsF,H | | | | |
Expenses before reductions | 1.00% | 1.00% | 1.00% | 1.00%A |
Expenses net of fee waivers, if any | 1.00% | 1.00% | 1.00% | 1.00%A |
Expenses net of all reductions | 1.00% | 1.00% | 1.00% | 1.00%A |
Net investment income (loss) | .95% | .99% | 1.77% | 1.33%A |
Supplemental Data | | | | |
Net assets, end of period (000 omitted) | $ 216 | $ 119 | $ 116 | $ 94 |
Portfolio turnover rate | 19% | 26% | 39% | 44%A |
A Annualized
B Total returns for periods of less than one year are not annualized.
C Total returns would have been lower if certain expenses had not been reduced during the applicable periods shown.
D Total returns do not include the effect of the contingent deferred sales charge.
E Calculated based on average shares outstanding during the period.
F Amounts do not include the activity of the underlying funds.
G For the period August 30, 2007 (commencement of operations) to July 31, 2008.
H Expense ratios reflect operating expenses of the class. Expenses before reductions do not reflect amounts reimbursed by the investment adviser or reductions from expense offset arrangements and do not represent the amount paid by the class during periods when reimbursements or reductions occur. Expenses net of fee waivers reflect expenses after reimbursement by the investment adviser but prior to reductions from expense offset arrangements. Expenses net of all reductions represent the net expenses paid by the class but do not include expenses of the investment companies in which the Fund invests.
See accompanying notes which are an integral part of the financial statements.
Annual Report
Financial Highlights - Income Replacement 2036
Years ended July 31, | 2011 | 2010 | 2009 | 2008G |
Selected Per-Share Data | | | | |
Net asset value, beginning of period | $ 43.73 | $ 39.70 | $ 46.40 | $ 50.00 |
Income from Investment Operations | | | | |
Net investment income (loss)D | .939 | .854 | 1.034 | 1.043 |
Net realized and unrealized gain (loss) | 5.291 | 4.183 | (6.126) | (3.445) |
Total from investment operations | 6.230 | 5.037 | (5.092) | (2.402) |
Distributions from net investment income | (.894) | (.863) | (1.038) | (1.008) |
Distributions from net realized gain | (.156) | (.144) | (.570) | (.190) |
Total distributions | (1.050) | (1.007) | (1.608) | (1.198) |
Net asset value, end of period | $ 48.91 | $ 43.73 | $ 39.70 | $ 46.40 |
Total ReturnB,C | 14.32% | 12.75% | (10.48)% | (4.96)% |
Ratios to Average Net AssetsE,H | | | | |
Expenses before reductionsF | .00% | .00% | .00% | .00%A |
Expenses net of fee waivers, if any | .00% | .00% | .00% | .00%A |
Expenses net of all reductions | .00% | .00% | .00% | .00%A |
Net investment income (loss) | 1.95% | 1.99% | 2.78% | 2.33%A |
Supplemental Data | | | | |
Net assets, end of period (000 omitted) | $ 2,433 | $ 598 | $ 632 | $ 986 |
Portfolio turnover rate | 19% | 26% | 39% | 44%A |
A Annualized
B Total returns for periods of less than one year are not annualized.
C Total returns would have been lower if certain expenses had not been reduced during the applicable periods shown.
D Calculated based on average shares outstanding during the period.
E Amounts do not include the activity of the underlying funds.
F Amount represents less than .01%.
G For the period August 30, 2007 (commencement of operations) to July 31, 2008.
H Expense ratios reflect operating expenses of the class. Expenses before reductions do not reflect amounts reimbursed by the investment adviser or reductions from expense offset arrangements and do not represent the amount paid by the class during periods when reimbursements or reductions occur. Expenses net of fee waivers reflect expenses after reimbursement by the investment adviser but prior to reductions from expense offset arrangements. Expenses net of all reductions represent the net expenses paid by the class but do not include expenses of the investment companies in which the Fund invests.
Financial Highlights - Institutional Class
Years ended July 31, | 2011 | 2010 | 2009 | 2008G |
Selected Per-Share Data | | | | |
Net asset value, beginning of period | $ 43.73 | $ 39.70 | $ 46.40 | $ 50.00 |
Income from Investment Operations | | | | |
Net investment income (loss)D | .929 | .851 | 1.031 | 1.064 |
Net realized and unrealized gain (loss) | 5.291 | 4.186 | (6.123) | (3.466) |
Total from investment operations | 6.220 | 5.037 | (5.092) | (2.402) |
Distributions from net investment income | (.894) | (.863) | (1.038) | (1.008) |
Distributions from net realized gain | (.156) | (.144) | (.570) | (.190) |
Total distributions | (1.050) | (1.007) | (1.608) | (1.198) |
Net asset value, end of period | $ 48.90 | $ 43.73 | $ 39.70 | $ 46.40 |
Total ReturnB,C | 14.30% | 12.75% | (10.48)% | (4.96)% |
Ratios to Average Net AssetsE,H | | | | |
Expenses before reductionsF | .00% | .00% | .00% | .00%A |
Expenses net of fee waivers, if any | .00% | .00% | .00% | .00%A |
Expenses net of all reductions | .00% | .00% | .00% | .00%A |
Net investment income (loss) | 1.95% | 1.99% | 2.78% | 2.33%A |
Supplemental Data | | | | |
Net assets, end of period (000 omitted) | $ 28 | $ 103 | $ 67 | $ 119 |
Portfolio turnover rate | 19% | 26% | 39% | 44%A |
A Annualized
B Total returns for periods of less than one year are not annualized.
C Total returns would have been lower if certain expenses had not been reduced during the applicable periods shown.
D Calculated based on average shares outstanding during the period.
E Amounts do not include the activity of the underlying funds.
F Amount represents less than .01%.
G For the period August 30, 2007 (commencement of operations) to July 31, 2008.
H Expense ratios reflect operating expenses of the class. Expenses before reductions do not reflect amounts reimbursed by the investment adviser or reductions from expense offset arrangements and do not represent the amount paid by the class during periods when reimbursements or reductions occur. Expenses net of fee waivers reflect expenses after reimbursement by the investment adviser but prior to reductions from expense offset arrangements. Expenses net of all reductions represent the net expenses paid by the class but do not include expenses of the investment companies in which the Fund invests.
See accompanying notes which are an integral part of the financial statements.
Annual Report
Fidelity Income Replacement 2038 Fund
Investment Changes (Unaudited)
Fund Holdings as of July 31, 2011 |
| % of fund's
net assets | % of fund's net assets
6 months ago |
Domestic Equity Funds | | |
Fidelity Advisor Mid Cap II Fund Institutional Class | 5.8 | 5.9 |
Fidelity Disciplined Equity Fund | 6.0 | 6.1 |
Fidelity Equity-Income Fund | 5.9 | 6.1 |
Fidelity Large Cap Core Enhanced Index Fund | 9.8 | 9.8 |
Fidelity Series 100 Index Fund | 7.4 | 7.3 |
Fidelity Series Broad Market Opportunities Fund | 9.6 | 9.8 |
Fidelity Series Small Cap Opportunities Fund | 3.8 | 3.9 |
| 48.3 | 48.9 |
International Equity Funds | | |
Fidelity Advisor International Discovery Fund Institutional Class | 11.3 | 11.4 |
High Yield Fixed-Income Funds | | |
Fidelity Capital & Income Fund | 3.0 | 3.1 |
Fidelity Strategic Income Fund | 3.1 | 3.0 |
| 6.1 | 6.1 |
Investment Grade Fixed-Income Funds | | |
Fidelity Government Income Fund | 5.3 | 5.2 |
Fidelity Strategic Real Return Fund | 5.3 | 5.3 |
Fidelity Total Bond Fund | 16.0 | 15.8 |
| 26.6 | 26.3 |
Short-Term Funds | | |
Fidelity Institutional Money Market Portfolio Institutional Class | 3.8 | 3.7 |
Fidelity Short-Term Bond Fund | 3.9 | 3.6 |
| 7.7 | 7.3 |
Net Other Assets (Liabilities)* | 0.0 | 0.0 |
| 100.0 | 100.0 |
* Amount represents less than 0.1% |
Asset Allocation (% of fund's net assets) |
Current |
| Domestic Equity Funds | 48.3% | |
| International Equity Funds | 11.3% | |
| High Yield
Fixed-Income Funds | 6.1% | |
| Investment Grade Fixed-Income Funds | 26.6% | |
| Short-Term Funds | 7.7% | |

Six months ago |
| Domestic Equity Funds | 48.9% | |
| International Equity Funds | 11.4% | |
| High Yield
Fixed-Income Funds | 6.1% | |
| Investment Grade Fixed-Income Funds | 26.3% | |
| Short-Term Funds | 7.3% | |

Expected |
| Domestic Equity Funds | 48.3% | |
| International Equity Funds | 10.9% | |
| High Yield
Fixed-Income Funds | 5.9% | |
| Investment Grade Fixed-Income Funds | 26.5% | |
| Short-Term Funds | 8.4% | |

The fund invests according to an asset allocation strategy that becomes increasingly conservative over time. The six months ago allocation is based on the fund's holdings as of January 31, 2011. The current allocation is based on the fund's holdings as of July 31, 2011. The expected allocation represents the fund's anticipated allocation at January 31, 2012. |
Annual Report
Fidelity Income Replacement 2038 Fund
Investments July 31, 2011
Showing Percentage of Net Assets
Equity Funds - 59.6% |
| Shares | | Value |
Domestic Equity Funds - 48.3% |
Fidelity Advisor Mid Cap II Fund Institutional Class (a) | 5,118 | | $ 92,788 |
Fidelity Disciplined Equity Fund | 4,153 | | 96,677 |
Fidelity Equity-Income Fund | 2,150 | | 95,389 |
Fidelity Large Cap Core Enhanced Index Fund | 17,538 | | 157,316 |
Fidelity Series 100 Index Fund | 13,075 | | 118,326 |
Fidelity Series Broad Market Opportunities Fund | 15,054 | | 155,053 |
Fidelity Series Small Cap Opportunities Fund | 5,489 | | 61,591 |
TOTAL DOMESTIC EQUITY FUNDS | | 777,140 |
International Equity Funds - 11.3% |
Fidelity Advisor International Discovery Fund Institutional Class | 5,379 | | 180,901 |
TOTAL EQUITY FUNDS (Cost $762,757) | 958,041 |
Fixed-Income Funds - 32.7% |
| | | |
High Yield Fixed-Income Funds - 6.1% |
Fidelity Capital & Income Fund | 5,041 | | 48,246 |
Fidelity Strategic Income Fund | 4,364 | | 49,666 |
TOTAL HIGH YIELD FIXED-INCOME FUNDS | | 97,912 |
|
| Shares | | Value |
Investment Grade Fixed-Income Funds - 26.6% |
Fidelity Government Income Fund | 8,023 | | $ 85,688 |
Fidelity Strategic Real Return Fund | 8,598 | | 85,464 |
Fidelity Total Bond Fund | 23,309 | | 256,630 |
TOTAL INVESTMENT GRADE FIXED-INCOME FUNDS | | 427,782 |
TOTAL FIXED-INCOME FUNDS (Cost $476,587) | 525,694 |
Short-Term Funds - 7.7% |
| | | |
Fidelity Institutional Money Market Portfolio Institutional Class | 61,645 | | 61,645 |
Fidelity Short-Term Bond Fund | 7,264 | | 62,037 |
TOTAL SHORT-TERM FUNDS (Cost $121,635) | 123,682 |
TOTAL INVESTMENT PORTFOLIO - 100.0% (Cost $1,360,979) | | 1,607,417 |
NET OTHER ASSETS (LIABILITIES) - 0.0% | | (84) |
NET ASSETS - 100% | $ 1,607,333 |
Legend |
(a) Non-income producing |
Other Information |
All investments are categorized as Level 1 under the Fair Value Hierarchy. The inputs or methodology used for valuing securities may not be an indication of the risk associated with investing in those securities. For more information on valuation inputs, please refer to the Security Valuation section in the accompanying Notes to Financial Statements. |
Income Tax Information |
At July 31, 2011, the Fund had a capital loss carryforward of approximately $60,057 of which $11,570 and $48,487 will expire in fiscal 2018 and 2019, respectively. Capital loss carryforwards are only available to offset future capital gains of the Fund to the extent provided by regulations and may be limited. |
The Fund intends to elect to defer to its fiscal year ending July 31, 2012 approximately $18,954 of losses recognized during the period November 1, 2010 to July 31, 2011. |
See accompanying notes which are an integral part of the financial statements.
Annual Report
Fidelity Income Replacement 2038 Fund
Statement of Assets and Liabilities
| July 31, 2011 |
| | |
Assets | | |
Investment in securities, at value (cost $1,360,979) - See accompanying schedule | | $ 1,607,417 |
Cash | | 39 |
Total assets | | 1,607,456 |
| | |
Liabilities | | |
Distribution and service plan fees payable | | 123 |
| | |
Net Assets | | $ 1,607,333 |
Net Assets consist of: | | |
Paid in capital | | $ 1,455,086 |
Undistributed net investment income | | 293 |
Accumulated undistributed net realized gain (loss) on investments | | (94,484) |
Net unrealized appreciation (depreciation) on investments | | 246,438 |
Net Assets | | $ 1,607,333 |
| | |
Calculation of Maximum Offering Price Class A:
Net Asset Value and redemption price per share ($34,321 ÷ 712.14 shares) | | $ 48.19 |
| | |
Maximum offering price per share (100/94.25 of $48.19) | | $ 51.13 |
| | |
Class T:
Net Asset Value and redemption price per share ($126,704 ÷ 2,629.50 shares) | | $ 48.19 |
| | |
Maximum offering price per share (100/96.50 of $48.19) | | $ 49.94 |
| | |
Class C:
Net Asset Value and offering price per share ($72,462 ÷ 1,504.20 shares)A | | $ 48.17 |
| | |
Income Replacement 2038:
Net Asset Value, offering price and redemption price per share ($1,344,885 ÷ 27,907.21 shares) | | $ 48.19 |
| | |
Institutional Class:
Net Asset Value, offering price and redemption price per share ($28,961 ÷ 601.00 shares) | | $ 48.19 |
A Redemption price per share is equal to net asset value less any applicable contingent deferred sales charge.
Statement of Operations
| Year ended July 31, 2011 |
| | |
Investment Income | | |
Income distributions from underlying funds | | $ 40,965 |
| | |
Expenses | | |
Distribution and service plan fees | $ 1,096 | |
Independent trustees' compensation | 7 | |
Total expenses before reductions | 1,103 | |
Expense reductions | (7) | 1,096 |
Net investment income (loss) | | 39,869 |
Realized and Unrealized Gain (Loss) Realized gain (loss) on sale of underlying fund shares | (24,408) | |
Capital gain distributions from underlying funds | 13,137 | |
Total net realized gain (loss) | | (11,271) |
Change in net unrealized appreciation (depreciation) on underlying funds | | 277,762 |
Net gain (loss) | | 266,491 |
Net increase (decrease) in net assets resulting from operations | | $ 306,360 |
See accompanying notes which are an integral part of the financial statements.
Annual Report
Statement of Changes in Net Assets
| Year ended
July 31, 2011 | Year ended
July 31, 2010 |
Increase (Decrease) in Net Assets | | |
Operations | | |
Net investment income (loss) | $ 39,869 | $ 44,672 |
Net realized gain (loss) | (11,271) | (45,293) |
Change in net unrealized appreciation (depreciation) | 277,762 | 254,403 |
Net increase (decrease) in net assets resulting from operations | 306,360 | 253,782 |
Distributions to shareholders from net investment income | (40,181) | (44,437) |
Distributions to shareholders from net realized gain | (9,861) | (9,084) |
Total distributions | (50,042) | (53,521) |
Share transactions - net increase (decrease) | (897,193) | 597,064 |
Total increase (decrease) in net assets | (640,875) | 797,325 |
| | |
Net Assets | | |
Beginning of period | 2,248,208 | 1,450,883 |
End of period (including undistributed net investment income of $293 and undistributed net investment income of $618, respectively) | $ 1,607,333 | $ 2,248,208 |
Financial Highlights - Class A
Years ended July 31, | 2011 | 2010 | 2009 | 2008G |
Selected Per-Share Data | | | | |
Net asset value, beginning of period | $ 43.01 | $ 38.95 | $ 45.26 | $ 50.00 |
Income from Investment Operations | | | | |
Net investment income (loss)E | .858 | .744 | .856 | .442 |
Net realized and unrealized gain (loss) | 5.317 | 4.191 | (6.093) | (4.811) |
Total from investment operations | 6.175 | 4.935 | (5.237) | (4.369) |
Distributions from net investment income | (.802) | (.710) | (.873) | (.371) |
Distributions from net realized gain | (.193) | (.165) | (.200) | - |
Total distributions | (.995) | (.875) | (1.073) | (.371) |
Net asset value, end of period | $ 48.19 | $ 43.01 | $ 38.95 | $ 45.26 |
Total ReturnB,C,D | 14.43% | 12.72% | (11.24)% | (8.76)% |
Ratios to Average Net AssetsF,H | | | | |
Expenses before reductions | .25% | .25% | .25% | .25%A |
Expenses net of fee waivers, if any | .25% | .25% | .25% | .25%A |
Expenses net of all reductions | .25% | .25% | .25% | .25%A |
Net investment income (loss) | 1.82% | 1.76% | 2.44% | 1.59%A |
Supplemental Data | | | | |
Net assets, end of period (000 omitted) | $ 34 | $ 32 | $ 115 | $ 91 |
Portfolio turnover rate | 19% | 23% | 41% | 13%A |
A Annualized
B Total returns for periods of less than one year are not annualized.
C Total returns would have been lower if certain expenses had not been reduced during the applicable periods shown.
D Total returns do not include the effect of the sales charges.
E Calculated based on average shares outstanding during the period.
F Amounts do not include the activity of the underlying funds.
G For the period December 31, 2007 (commencement of operations) to July 31, 2008.
H Expense ratios reflect operating expenses of the class. Expenses before reductions do not reflect amounts reimbursed by the investment adviser or reductions from expense offset arrangements and do not represent the amount paid by the class during periods when reimbursements or reductions occur. Expenses net of fee waivers reflect expenses after reimbursement by the investment adviser but prior to reductions from expense offset arrangements. Expenses net of all reductions represent the net expenses paid by the class but do not include expenses of the investment companies in which the Fund invests.
See accompanying notes which are an integral part of the financial statements.
Annual Report
Financial Highlights - Class T
Years ended July 31, | 2011 | 2010 | 2009 | 2008G |
Selected Per-Share Data | | | | |
Net asset value, beginning of period | $ 43.01 | $ 38.96 | $ 45.26 | $ 50.00 |
Income from Investment Operations | | | | |
Net investment income (loss)E | .736 | .636 | .791 | .373 |
Net realized and unrealized gain (loss) | 5.326 | 4.191 | (6.111) | (4.809) |
Total from investment operations | 6.062 | 4.827 | (5.320) | (4.436) |
Distributions from net investment income | (.689) | (.612) | (.780) | (.304) |
Distributions from net realized gain | (.193) | (.165) | (.200) | - |
Total distributions | (.882) | (.777) | (.980) | (.304) |
Net asset value, end of period | $ 48.19 | $ 43.01 | $ 38.96 | $ 45.26 |
Total ReturnB,C,D | 14.15% | 12.43% | (11.45)% | (8.89)% |
Ratios to Average Net AssetsF,H | | | | |
Expenses before reductions | .50% | .50% | .50% | .50%A |
Expenses net of fee waivers, if any | .50% | .50% | .50% | .50%A |
Expenses net of all reductions | .50% | .50% | .50% | .50%A |
Net investment income (loss) | 1.57% | 1.50% | 2.20% | 1.34%A |
Supplemental Data | | | | |
Net assets, end of period (000 omitted) | $ 127 | $ 37 | $ 57 | $ 91 |
Portfolio turnover rate | 19% | 23% | 41% | 13%A |
A Annualized
B Total returns for periods of less than one year are not annualized.
C Total returns would have been lower if certain expenses had not been reduced during the applicable periods shown.
D Total returns do not include the effect of the sales charges.
E Calculated based on average shares outstanding during the period.
F Amounts do not include the activity of the underlying funds.
G For the period December 31, 2007 (commencement of operations) to July 31, 2008.
H Expense ratios reflect operating expenses of the class. Expenses before reductions do not reflect amounts reimbursed by the investment adviser or reductions from expense offset arrangements and do not represent the amount paid by the class during periods when reimbursements or reductions occur. Expenses net of fee waivers reflect expenses after reimbursement by the investment adviser but prior to reductions from expense offset arrangements. Expenses net of all reductions represent the net expenses paid by the class but do not include expenses of the investment companies in which the Fund invests.
Financial Highlights - Class C
Years ended July 31, | 2011 | 2010 | 2009 | 2008G |
Selected Per-Share Data | | | | |
Net asset value, beginning of period | $ 42.98 | $ 38.95 | $ 45.24 | $ 50.00 |
Income from Investment Operations | | | | |
Net investment income (loss)E | .505 | .424 | .611 | .233 |
Net realized and unrealized gain (loss) | 5.319 | 4.192 | (6.107) | (4.812) |
Total from investment operations | 5.824 | 4.616 | (5.496) | (4.579) |
Distributions from net investment income | (.441) | (.421) | (.594) | (.181) |
Distributions from net realized gain | (.193) | (.165) | (.200) | - |
Total distributions | (.634) | (.586) | (.794) | (.181) |
Net asset value, end of period | $ 48.17 | $ 42.98 | $ 38.95 | $ 45.24 |
Total ReturnB,C,D | 13.59% | 11.87% | (11.89)% | (9.17)% |
Ratios to Average Net AssetsF,H | | | | |
Expenses before reductions | 1.00% | 1.00% | 1.00% | 1.00%A |
Expenses net of fee waivers, if any | 1.00% | 1.00% | 1.00% | 1.00%A |
Expenses net of all reductions | 1.00% | 1.00% | 1.00% | 1.00%A |
Net investment income (loss) | 1.08% | 1.01% | 1.70% | .84%A |
Supplemental Data | | | | |
Net assets, end of period (000 omitted) | $ 72 | $ 91 | $ 57 | $ 91 |
Portfolio turnover rate | 19% | 23% | 41% | 13%A |
A Annualized
B Total returns for periods of less than one year are not annualized.
C Total returns would have been lower if certain expenses had not been reduced during the applicable periods shown.
D Total returns do not include the effect of the contingent deferred sales charge.
E Calculated based on average shares outstanding during the period.
F Amounts do not include the activity of the underlying funds.
G For the period December 31, 2007 (commencement of operations) to July 31, 2008.
H Expense ratios reflect operating expenses of the class. Expenses before reductions do not reflect amounts reimbursed by the investment adviser or reductions from expense offset arrangements and do not represent the amount paid by the class during periods when reimbursements or reductions occur. Expenses net of fee waivers reflect expenses after reimbursement by the investment adviser but prior to reductions from expense offset arrangements. Expenses net of all reductions represent the net expenses paid by the class but do not include expenses of the investment companies in which the Fund invests.
See accompanying notes which are an integral part of the financial statements.
Annual Report
Financial Highlights - Income Replacement 2038
Years ended July 31, | 2011 | 2010 | 2009 | 2008G |
Selected Per-Share Data | | | | |
Net asset value, beginning of period | $ 43.00 | $ 38.96 | $ 45.27 | $ 50.00 |
Income from Investment Operations | | | | |
Net investment income (loss)D | .969 | .849 | .965 | .502 |
Net realized and unrealized gain (loss) | 5.332 | 4.187 | (6.112) | (4.795) |
Total from investment operations | 6.301 | 5.036 | (5.147) | (4.293) |
Distributions from net investment income | (.918) | (.831) | (.963) | (.437) |
Distributions from net realized gain | (.193) | (.165) | (.200) | - |
Total distributions | (1.111) | (.996) | (1.163) | (.437) |
Net asset value, end of period | $ 48.19 | $ 43.00 | $ 38.96 | $ 45.27 |
Total ReturnB,C | 14.74% | 12.99% | (11.02)% | (8.61)% |
Ratios to Average Net AssetsE,H | | | | |
Expenses before reductionsF | .00% | .00% | .00% | .00%A |
Expenses net of fee waivers, if any | .00% | .00% | .00% | .00%A |
Expenses net of all reductions | .00% | .00% | .00% | .00%A |
Net investment income (loss) | 2.07% | 2.01% | 2.69% | 1.84%A |
Supplemental Data | | | | |
Net assets, end of period (000 omitted) | $ 1,345 | $ 2,051 | $ 1,165 | $ 1,122 |
Portfolio turnover rate | 19% | 23% | 41% | 13%A |
A Annualized
B Total returns for periods of less than one year are not annualized.
C Total returns would have been lower if certain expenses had not been reduced during the applicable periods shown.
D Calculated based on average shares outstanding during the period.
E Amounts do not include the activity of the underlying funds.
F Amount represents less than .01%.
G For the period December 31, 2007 (commencement of operations) to July 31, 2008.
H Expense ratios reflect operating expenses of the class. Expenses before reductions do not reflect amounts reimbursed by the investment adviser or reductions from expense offset arrangements and do not represent the amount paid by the class during periods when reimbursements or reductions occur. Expenses net of fee waivers reflect expenses after reimbursement by the investment adviser but prior to reductions from expense offset arrangements. Expenses net of all reductions represent the net expenses paid by the class but do not include expenses of the investment companies in which the Fund invests.
Financial Highlights - Institutional Class
Years ended July 31, | 2011 | 2010 | 2009 | 2008G |
Selected Per-Share Data | | | | |
Net asset value, beginning of period | $ 43.00 | $ 38.96 | $ 45.26 | $ 50.00 |
Income from Investment Operations | | | | |
Net investment income (loss)D | .973 | .848 | .974 | .511 |
Net realized and unrealized gain (loss) | 5.328 | 4.188 | (6.111) | (4.814) |
Total from investment operations | 6.301 | 5.036 | (5.137) | (4.303) |
Distributions from net investment income | (.918) | (.831) | (.963) | (.437) |
Distributions from net realized gain | (.193) | (.165) | (.200) | - |
Total distributions | (1.111) | (.996) | (1.163) | (.437) |
Net asset value, end of period | $ 48.19 | $ 43.00 | $ 38.96 | $ 45.26 |
Total ReturnB,C | 14.74% | 12.99% | (11.00)% | (8.63)% |
Ratios to Average Net AssetsE,H | | | | |
Expenses before reductionsF | .00% | .00% | .00% | .00%A |
Expenses net of fee waivers, if any | .00% | .00% | .00% | .00%A |
Expenses net of all reductions | .00% | .00% | .00% | .00%A |
Net investment income (loss) | 2.07% | 2.01% | 2.69% | 1.84%A |
Supplemental Data | | | | |
Net assets, end of period (000 omitted) | $ 29 | $ 38 | $ 58 | $ 91 |
Portfolio turnover rate | 19% | 23% | 41% | 13%A |
A Annualized
B Total returns for periods of less than one year are not annualized.
C Total returns would have been lower if certain expenses had not been reduced during the applicable periods shown.
D Calculated based on average shares outstanding during the period.
E Amounts do not include the activity of the underlying funds.
F Amount represents less than .01%.
G For the period December 31, 2007 (commencement of operations) to July 31, 2008.
H Expense ratios reflect operating expenses of the class. Expenses before reductions do not reflect amounts reimbursed by the investment adviser or reductions from expense offset arrangements and do not represent the amount paid by the class during periods when reimbursements or reductions occur. Expenses net of fee waivers reflect expenses after reimbursement by the investment adviser but prior to reductions from expense offset arrangements. Expenses net of all reductions represent the net expenses paid by the class but do not include expenses of the investment companies in which the Fund invests.
See accompanying notes which are an integral part of the financial statements.
Annual Report
Fidelity Income Replacement 2040 Fund
Investment Changes (Unaudited)
Fund Holdings as of July 31, 2011 |
| % of fund's
net assets | % of fund's net assets
6 months ago |
Domestic Equity Funds | | |
Fidelity Advisor Mid Cap II Fund Institutional Class | 5.9 | 6.0 |
Fidelity Disciplined Equity Fund | 6.2 | 6.3 |
Fidelity Equity-Income Fund | 6.1 | 6.3 |
Fidelity Large Cap Core Enhanced Index Fund | 10.0 | 10.1 |
Fidelity Series 100 Index Fund | 7.6 | 7.5 |
Fidelity Series Broad Market Opportunities Fund | 9.9 | 10.1 |
Fidelity Series Small Cap Opportunities Fund | 3.9 | 4.0 |
| 49.6 | 50.3 |
International Equity Funds | | |
Fidelity Advisor International Discovery Fund Institutional Class | 12.4 | 12.6 |
High Yield Fixed-Income Funds | | |
Fidelity Capital & Income Fund | 3.2 | 3.2 |
Fidelity Strategic Income Fund | 3.3 | 3.2 |
| 6.5 | 6.4 |
Investment Grade Fixed-Income Funds | | |
Fidelity Government Income Fund | 5.3 | 5.2 |
Fidelity Strategic Real Return Fund | 5.3 | 5.2 |
Fidelity Total Bond Fund | 15.9 | 15.7 |
| 26.5 | 26.1 |
Short-Term Funds | | |
Fidelity Institutional Money Market Portfolio Institutional Class | 2.5 | 2.3 |
Fidelity Short-Term Bond Fund | 2.5 | 2.3 |
| 5.0 | 4.6 |
Net Other Assets (Liabilities)* | 0.0 | 0.0 |
| 100.0 | 100.0 |
* Amount represents less than 0.1% |
Asset Allocation (% of fund's net assets) |
Current |
| Domestic Equity Funds | 49.6% | |
| International Equity Funds | 12.4% | |
| High Yield
Fixed-Income Funds | 6.5% | |
| Investment Grade Fixed-Income Funds | 26.5% | |
| Short-Term Funds | 5.0% | |

Six months ago |
| Domestic Equity Funds | 50.3% | |
| International Equity Funds | 12.6% | |
| High Yield
Fixed-Income Funds | 6.4% | |
| Investment Grade Fixed-Income Funds | 26.1% | |
| Short-Term Funds | 4.6% | |

Expected |
| Domestic Equity Funds | 49.6% | |
| International Equity Funds | 12.0% | |
| High Yield
Fixed-Income Funds | 6.2% | |
| Investment Grade Fixed-Income Funds | 26.3% | |
| Short-Term Funds | 5.9% | |

The fund invests according to an asset allocation strategy that becomes increasingly conservative over time. The six months ago allocation is based on the fund's holdings as of January 31, 2011. The current allocation is based on the fund's holdings as of July 31, 2011. The expected allocation represents the fund's anticipated allocation at January 31, 2012. |
Annual Report
Fidelity Income Replacement 2040 Fund
Investments July 31, 2011
Showing Percentage of Net Assets
Equity Funds - 62.0% |
| Shares | | Value |
Domestic Equity Funds - 49.6% |
Fidelity Advisor Mid Cap II Fund Institutional Class (a) | 7,020 | | $ 127,280 |
Fidelity Disciplined Equity Fund | 5,701 | | 132,715 |
Fidelity Equity-Income Fund | 2,950 | | 130,883 |
Fidelity Large Cap Core Enhanced Index Fund | 24,065 | | 215,864 |
Fidelity Series 100 Index Fund | 17,937 | | 162,333 |
Fidelity Series Broad Market Opportunities Fund | 20,636 | | 212,552 |
Fidelity Series Small Cap Opportunities Fund | 7,523 | | 84,413 |
TOTAL DOMESTIC EQUITY FUNDS | | 1,066,040 |
International Equity Funds - 12.4% |
Fidelity Advisor International Discovery Fund Institutional Class | 7,906 | | 265,877 |
TOTAL EQUITY FUNDS (Cost $1,197,286) | 1,331,917 |
Fixed-Income Funds - 33.0% |
| | | |
High Yield Fixed-Income Funds - 6.5% |
Fidelity Capital & Income Fund | 7,179 | | 68,705 |
Fidelity Strategic Income Fund | 6,211 | | 70,685 |
TOTAL HIGH YIELD FIXED-INCOME FUNDS | | 139,390 |
|
| Shares | | Value |
Investment Grade Fixed-Income Funds - 26.5% |
Fidelity Government Income Fund | 10,696 | | $ 114,230 |
Fidelity Strategic Real Return Fund | 11,457 | | 113,878 |
Fidelity Total Bond Fund | 31,110 | | 342,525 |
TOTAL INVESTMENT GRADE FIXED-INCOME FUNDS | | 570,633 |
TOTAL FIXED-INCOME FUNDS (Cost $678,608) | 710,023 |
Short-Term Funds - 5.0% |
| | | |
Fidelity Institutional Money Market Portfolio Institutional Class | 54,026 | | 54,026 |
Fidelity Short-Term Bond Fund | 6,366 | | 54,367 |
TOTAL SHORT-TERM FUNDS (Cost $107,704) | 108,393 |
TOTAL INVESTMENT PORTFOLIO - 100.0% (Cost $1,983,598) | | 2,150,333 |
NET OTHER ASSETS (LIABILITIES) - 0.0% | | (104) |
NET ASSETS - 100% | $ 2,150,229 |
Legend |
(a) Non-income producing |
Other Information |
All investments are categorized as Level 1 under the Fair Value Hierarchy. The inputs or methodology used for valuing securities may not be an indication of the risk associated with investing in those securities. For more information on valuation inputs, please refer to the Security Valuation section in the accompanying Notes to Financial Statements. |
Income Tax Information |
At July 31, 2011, the Fund had a capital loss carryforward of approximately $169,960 of which $763, $152,507 and $16,690 will expire in fiscal 2017, 2018 and 2019, respectively. Capital loss carryforwards are only available to offset future capital gains of the Fund to the extent provided by regulations and may be limited. |
See accompanying notes which are an integral part of the financial statements.
Annual Report
Fidelity Income Replacement 2040 Fund
Statement of Assets and Liabilities
| July 31, 2011 |
| | |
Assets | | |
Investment in securities, at value (cost $1,983,598) - See accompanying schedule | | $ 2,150,333 |
Cash | | 39 |
Receivable for fund shares sold | | 1,283 |
Total assets | | 2,151,655 |
| | |
Liabilities | | |
Payable for investments purchased | $ 1,284 | |
Distribution and service plan fees payable | 142 | |
Total liabilities | | 1,426 |
| | |
Net Assets | | $ 2,150,229 |
Net Assets consist of: | | |
Paid in capital | | $ 2,178,799 |
Undistributed net investment income | | 368 |
Accumulated undistributed net realized gain (loss) on investments | | (195,673) |
Net unrealized appreciation (depreciation) on investments | | 166,735 |
Net Assets | | $ 2,150,229 |
| | |
Calculation of Maximum Offering Price Class A:
Net Asset Value and redemption price per share ($95,688 ÷ 1,975.33 shares) | | $ 48.44 |
| | |
Maximum offering price per share (100/94.25 of $48.44) | | $ 51.40 |
| | |
Class T:
Net Asset Value and redemption price per share ($130,505 ÷ 2,694.83 shares) | | $ 48.43 |
| | |
Maximum offering price per share (100/96.50 of $48.43) | | $ 50.19 |
| | |
Class C:
Net Asset Value and offering price per share ($79,231 ÷ 1,636.47 shares)A | | $ 48.42 |
| | |
Income Replacement 2040:
Net Asset Value, offering price and redemption price per share ($1,796,972 ÷ 37,110.08 shares) | | $ 48.42 |
| | |
Institutional Class:
Net Asset Value, offering price and redemption price per share ($47,833 ÷ 987.76 shares) | | $ 48.43 |
A Redemption price per share is equal to net asset value less any applicable contingent deferred sales charge.
Statement of Operations
| Year ended July 31, 2011 |
| | |
Investment Income | | |
Income distributions from underlying funds | | $ 36,024 |
| | |
Expenses | | |
Distribution and service plan fees | $ 1,635 | |
Independent trustees' compensation | 7 | |
Total expenses before reductions | 1,642 | |
Expense reductions | (7) | 1,635 |
Net investment income (loss) | | 34,389 |
Realized and Unrealized Gain (Loss) Realized gain (loss) on sale of underlying fund shares | 69,601 | |
Capital gain distributions from underlying funds | 9,917 | |
Total net realized gain (loss) | | 79,518 |
Change in net unrealized appreciation (depreciation) on underlying funds | | 119,745 |
Net gain (loss) | | 199,263 |
Net increase (decrease) in net assets resulting from operations | | $ 233,652 |
See accompanying notes which are an integral part of the financial statements.
Annual Report
Statement of Changes in Net Assets
| Year ended
July 31, 2011 | Year ended
July 31, 2010 |
Increase (Decrease) in Net Assets | | |
Operations | | |
Net investment income (loss) | $ 34,389 | $ 23,376 |
Net realized gain (loss) | 79,518 | (127,348) |
Change in net unrealized appreciation (depreciation) | 119,745 | 184,622 |
Net increase (decrease) in net assets resulting from operations | 233,652 | 80,650 |
Distributions to shareholders from net investment income | (34,374) | (23,219) |
Distributions to shareholders from net realized gain | (7,263) | (2,847) |
Total distributions | (41,637) | (26,066) |
Share transactions - net increase (decrease) | 390,065 | 856,629 |
Total increase (decrease) in net assets | 582,080 | 911,213 |
| | |
Net Assets | | |
Beginning of period | 1,568,149 | 656,936 |
End of period (including undistributed net investment income of $368 and undistributed net investment income of $385, respectively) | $ 2,150,229 | $ 1,568,149 |
Financial Highlights - Class A
Years ended July 31, | 2011 | 2010 | 2009 | 2008G |
Selected Per-Share Data | | | | |
Net asset value, beginning of period | $ 43.04 | $ 38.83 | $ 45.23 | $ 50.00 |
Income from Investment Operations | | | | |
Net investment income (loss)E | .789 | .722 | .933 | .442 |
Net realized and unrealized gain (loss) | 5.608 | 4.298 | (6.238) | (4.814) |
Total from investment operations | 6.397 | 5.020 | (5.305) | (4.372) |
Distributions from net investment income | (.805) | (.710) | (.885) | (.398) |
Distributions from net realized gain | (.192) | (.100) | (.210) | - |
Total distributions | (.997) | (.810) | (1.095) | (.398) |
Net asset value, end of period | $ 48.44 | $ 43.04 | $ 38.83 | $ 45.23 |
Total ReturnB,C,D | 14.94% | 12.97% | (11.41)% | (8.77)% |
Ratios to Average Net AssetsF,H | | | | |
Expenses before reductions | .25% | .25% | .25% | .25%A |
Expenses net of fee waivers, if any | .25% | .25% | .25% | .25%A |
Expenses net of all reductions | .25% | .25% | .25% | .25%A |
Net investment income (loss) | 1.67% | 1.70% | 2.60% | 1.60%A |
Supplemental Data | | | | |
Net assets, end of period (000 omitted) | $ 96 | $ 34 | $ 57 | $ 91 |
Portfolio turnover rate | 75% | 129% | 50% | 4%A |
A Annualized
B Total returns for periods of less than one year are not annualized.
C Total returns would have been lower if certain expenses had not been reduced during the applicable periods shown.
D Total returns do not include the effect of the sales charges.
E Calculated based on average shares outstanding during the period.
F Amounts do not include the activity of the underlying funds.
G For the period December 31, 2007 (commencement of operations) to July 31, 2008.
H Expense ratios reflect operating expenses of the class. Expenses before reductions do not reflect amounts reimbursed by the investment adviser or reductions from expense offset arrangements and do not represent the amount paid by the class during periods when reimbursements or reductions occur. Expenses net of fee waivers reflect expenses after reimbursement by the investment adviser but prior to reductions from expense offset arrangements. Expenses net of all reductions represent the net expenses paid by the class but do not include expenses of the investment companies in which the Fund invests.
See accompanying notes which are an integral part of the financial statements.
Annual Report
Financial Highlights - Class T
Years ended July 31, | 2011 | 2010 | 2009 | 2008G |
Selected Per-Share Data | | | | |
Net asset value, beginning of period | $ 43.05 | $ 38.84 | $ 45.23 | $ 50.00 |
Income from Investment Operations | | | | |
Net investment income (loss)E | .672 | .616 | .836 | .371 |
Net realized and unrealized gain (loss) | 5.604 | 4.301 | (6.227) | (4.809) |
Total from investment operations | 6.276 | 4.917 | (5.391) | (4.438) |
Distributions from net investment income | (.704) | (.607) | (.789) | (.332) |
Distributions from net realized gain | (.192) | (.100) | (.210) | - |
Total distributions | (.896) | (.707) | (.999) | (.332) |
Net asset value, end of period | $ 48.43 | $ 43.05 | $ 38.84 | $ 45.23 |
Total ReturnB,C,D | 14.64% | 12.69% | (11.62)% | (8.90)% |
Ratios to Average Net AssetsF,H | | | | |
Expenses before reductions | .50% | .50% | .50% | .50%A |
Expenses net of fee waivers, if any | .50% | .50% | .50% | .50%A |
Expenses net of all reductions | .50% | .50% | .50% | .50%A |
Net investment income (loss) | 1.42% | 1.45% | 2.35% | 1.35%A |
Supplemental Data | | | | |
Net assets, end of period (000 omitted) | $ 131 | $ 111 | $ 102 | $ 132 |
Portfolio turnover rate | 75% | 129% | 50% | 4%A |
A Annualized
B Total returns for periods of less than one year are not annualized.
C Total returns would have been lower if certain expenses had not been reduced during the applicable periods shown.
D Total returns do not include the effect of the sales charges.
E Calculated based on average shares outstanding during the period.
F Amounts do not include the activity of the underlying funds.
G For the period December 31, 2007 (commencement of operations) to July 31, 2008.
H Expense ratios reflect operating expenses of the class. Expenses before reductions do not reflect amounts reimbursed by the investment adviser or reductions from expense offset arrangements and do not represent the amount paid by the class during periods when reimbursements or reductions occur. Expenses net of fee waivers reflect expenses after reimbursement by the investment adviser but prior to reductions from expense offset arrangements. Expenses net of all reductions represent the net expenses paid by the class but do not include expenses of the investment companies in which the Fund invests.
Financial Highlights - Class C
Years ended July 31, | 2011 | 2010 | 2009 | 2008G |
Selected Per-Share Data | | | | |
Net asset value, beginning of period | $ 43.05 | $ 38.84 | $ 45.22 | $ 50.00 |
Income from Investment Operations | | | | |
Net investment income (loss)E | .435 | .402 | .664 | .234 |
Net realized and unrealized gain (loss) | 5.609 | 4.305 | (6.229) | (4.816) |
Total from investment operations | 6.044 | 4.707 | (5.565) | (4.582) |
Distributions from net investment income | (.482) | (.397) | (.605) | (.198) |
Distributions from net realized gain | (.192) | (.100) | (.210) | - |
Total distributions | (.674) | (.497) | (.815) | (.198) |
Net asset value, end of period | $ 48.42 | $ 43.05 | $ 38.84 | $ 45.22 |
Total ReturnB,C,D | 14.08% | 12.13% | (12.06)% | (9.18)% |
Ratios to Average Net AssetsF,H | | | | |
Expenses before reductions | 1.00% | 1.00% | 1.00% | 1.00%A |
Expenses net of fee waivers, if any | 1.00% | 1.00% | 1.00% | 1.00%A |
Expenses net of all reductions | 1.00% | 1.00% | 1.00% | 1.00%A |
Net investment income (loss) | .93% | .95% | 1.85% | .84%A |
Supplemental Data | | | | |
Net assets, end of period (000 omitted) | $ 79 | $ 99 | $ 57 | $ 91 |
Portfolio turnover rate | 75% | 129% | 50% | 4%A |
A Annualized
B Total returns for periods of less than one year are not annualized.
C Total returns would have been lower if certain expenses had not been reduced during the applicable periods shown.
D Total returns do not include the effect of the contingent deferred sales charge.
E Calculated based on average shares outstanding during the period.
F Amounts do not include the activity of the underlying funds.
G For the period December 31, 2007 (commencement of operations) to July 31, 2008.
H Expense ratios reflect operating expenses of the class. Expenses before reductions do not reflect amounts reimbursed by the investment adviser or reductions from expense offset arrangements and do not represent the amount paid by the class during periods when reimbursements or reductions occur. Expenses net of fee waivers reflect expenses after reimbursement by the investment adviser but prior to reductions from expense offset arrangements. Expenses net of all reductions represent the net expenses paid by the class but do not include expenses of the investment companies in which the Fund invests.
See accompanying notes which are an integral part of the financial statements.
Annual Report
Financial Highlights - Income Replacement 2040
Years ended July 31, | 2011 | 2010 | 2009 | 2008G |
Selected Per-Share Data | | | | |
Net asset value, beginning of period | $ 43.04 | $ 38.83 | $ 45.23 | $ 50.00 |
Income from Investment Operations | | | | |
Net investment income (loss)D | .910 | .833 | 1.015 | .504 |
Net realized and unrealized gain (loss) | 5.602 | 4.297 | (6.231) | (4.810) |
Total from investment operations | 6.512 | 5.130 | (5.216) | (4.306) |
Distributions from net investment income | (.940) | (.820) | (.974) | (.464) |
Distributions from net realized gain | (.192) | (.100) | (.210) | - |
Total distributions | (1.132) | (.920) | (1.184) | (.464) |
Net asset value, end of period | $ 48.42 | $ 43.04 | $ 38.83 | $ 45.23 |
Total ReturnB,C | 15.21% | 13.26% | (11.19)% | (8.64)% |
Ratios to Average Net AssetsE,H | | | | |
Expenses before reductionsF | .00% | .00% | .00% | .00%A |
Expenses net of fee waivers, if any | .00% | .00% | .00% | .00%A |
Expenses net of all reductions | .00% | .00% | .00% | .00%A |
Net investment income (loss) | 1.93% | 1.96% | 2.85% | 1.85%A |
Supplemental Data | | | | |
Net assets, end of period (000 omitted) | $ 1,797 | $ 1,262 | $ 384 | $ 598 |
Portfolio turnover rate | 75% | 129% | 50% | 4%A |
A Annualized
B Total returns for periods of less than one year are not annualized.
C Total returns would have been lower if certain expenses had not been reduced during the applicable periods shown.
D Calculated based on average shares outstanding during the period.
E Amounts do not include the activity of the underlying funds.
F Amount represents less than .01%.
G For the period December 31, 2007 (commencement of operations) to July 31, 2008.
H Expense ratios reflect operating expenses of the class. Expenses before reductions do not reflect amounts reimbursed by the investment adviser or reductions from expense offset arrangements and do not represent the amount paid by the class during periods when reimbursements or reductions occur. Expenses net of fee waivers reflect expenses after reimbursement by the investment adviser but prior to reductions from expense offset arrangements. Expenses net of all reductions represent the net expenses paid by the class but do not include expenses of the investment companies in which the Fund invests.
Financial Highlights - Institutional Class
Years ended July 31, | 2011 | 2010 | 2009 | 2008G |
Selected Per-Share Data | | | | |
Net asset value, beginning of period | $ 43.04 | $ 38.83 | $ 45.23 | $ 50.00 |
Income from Investment Operations | | | | |
Net investment income (loss)D | .906 | .828 | 1.022 | .512 |
Net realized and unrealized gain (loss) | 5.616 | 4.302 | (6.238) | (4.818) |
Total from investment operations | 6.522 | 5.130 | (5.216) | (4.306) |
Distributions from net investment income | (.940) | (.820) | (.974) | (.464) |
Distributions from net realized gain | (.192) | (.100) | (.210) | - |
Total distributions | (1.132) | (.920) | (1.184) | (.464) |
Net asset value, end of period | $ 48.43 | $ 43.04 | $ 38.83 | $ 45.23 |
Total ReturnB,C | 15.24% | 13.26% | (11.19)% | (8.64)% |
Ratios to Average Net AssetsE,H | | | | |
Expenses before reductionsF | .00% | .00% | .00% | .00%A |
Expenses net of fee waivers, if any | .00% | .00% | .00% | .00%A |
Expenses net of all reductions | .00% | .00% | .00% | .00%A |
Net investment income (loss) | 1.93% | 1.96% | 2.85% | 1.85%A |
Supplemental Data | | | | |
Net assets, end of period (000 omitted) | $ 48 | $ 62 | $ 57 | $ 91 |
Portfolio turnover rate | 75% | 129% | 50% | 4%A |
A Annualized
B Total returns for periods of less than one year are not annualized.
C Total returns would have been lower if certain expenses had not been reduced during the applicable periods shown.
D Calculated based on average shares outstanding during the period.
E Amounts do not include the activity of the underlying funds.
F Amount represents less than .01%.
G For the period December 31, 2007 (commencement of operations) to July 31, 2008.
H Expense ratios reflect operating expenses of the class. Expenses before reductions do not reflect amounts reimbursed by the investment adviser or reductions from expense offset arrangements and do not represent the amount paid by the class during periods when reimbursements or reductions occur. Expenses net of fee waivers reflect expenses after reimbursement by the investment adviser but prior to reductions from expense offset arrangements. Expenses net of all reductions represent the net expenses paid by the class but do not include expenses of the investment companies in which the Fund invests.
See accompanying notes which are an integral part of the financial statements.
Annual Report
Fidelity Income Replacement 2042 Fund
Investment Changes (Unaudited)
Fund Holdings as of July 31, 2011 |
| % of fund's
net assets | % of fund's net assets
6 months ago |
Domestic Equity Funds | | |
Fidelity Advisor Mid Cap II Fund Institutional Class | 6.1 | 6.1 |
Fidelity Disciplined Equity Fund | 6.3 | 6.4 |
Fidelity Equity-Income Fund | 6.2 | 6.4 |
Fidelity Large Cap Core Enhanced Index Fund | 10.3 | 10.2 |
Fidelity Series 100 Index Fund | 7.7 | 7.7 |
Fidelity Series Broad Market Opportunities Fund | 10.1 | 10.3 |
Fidelity Series Small Cap Opportunities Fund | 4.0 | 4.1 |
| 50.7 | 51.2 |
International Equity Funds | | |
Fidelity Advisor International Discovery Fund Institutional Class | 12.8 | 12.8 |
High Yield Fixed-Income Funds | | |
Fidelity Capital & Income Fund | 3.3 | 3.3 |
Fidelity Strategic Income Fund | 3.4 | 3.4 |
| 6.7 | 6.7 |
Investment Grade Fixed-Income Funds | | |
Fidelity Government Income Fund | 5.3 | 5.2 |
Fidelity Strategic Real Return Fund | 5.2 | 5.2 |
Fidelity Total Bond Fund | 15.8 | 15.6 |
| 26.3 | 26.0 |
Short-Term Funds | | |
Fidelity Institutional Money Market Portfolio Institutional Class | 1.7 | 1.7 |
Fidelity Short-Term Bond Fund | 1.8 | 1.6 |
| 3.5 | 3.3 |
Net Other Assets (Liabilities)* | 0.0 | 0.0 |
| 100.0 | 100.0 |
* Amount represents less than 0.1% |
Asset Allocation (% of fund's net assets) |
Current |
| Domestic Equity Funds | 50.7% | |
| International Equity Funds | 12.8% | |
| High Yield
Fixed-Income Funds | 6.7% | |
| Investment Grade Fixed-Income Funds | 26.3% | |
| Short-Term Funds | 3.5% | |

Six months ago |
| Domestic Equity Funds | 51.2% | |
| International Equity Funds | 12.8% | |
| High Yield
Fixed-Income Funds | 6.7% | |
| Investment Grade Fixed-Income Funds | 26.0% | |
| Short-Term Funds | 3.3% | |

Expected |
| Domestic Equity Funds | 50.8% | |
| International Equity Funds | 12.7% | |
| High Yield
Fixed-Income Funds | 6.6% | |
| Investment Grade Fixed-Income Funds | 26.0% | |
| Short-Term Funds | 3.9% | |

The fund invests according to an asset allocation strategy that becomes increasingly conservative over time. The six months ago allocation is based on the fund's holdings as of January 31, 2011. The current allocation is based on the fund's holdings as of July 31, 2011. The expected allocation represents the fund's anticipated allocation at January 31, 2012. |
Annual Report
Fidelity Income Replacement 2042 Fund
Investments July 31, 2011
Showing Percentage of Net Assets
Equity Funds - 63.5% |
| Shares | | Value |
Domestic Equity Funds - 50.7% |
Fidelity Advisor Mid Cap II Fund Institutional Class (a) | 18,843 | | $ 341,629 |
Fidelity Disciplined Equity Fund | 15,278 | | 355,681 |
Fidelity Equity-Income Fund | 7,911 | | 350,917 |
Fidelity Large Cap Core Enhanced Index Fund | 64,446 | | 578,082 |
Fidelity Series 100 Index Fund | 48,029 | | 434,666 |
Fidelity Series Broad Market Opportunities Fund | 55,337 | | 569,967 |
Fidelity Series Small Cap Opportunities Fund | 20,139 | | 225,955 |
TOTAL DOMESTIC EQUITY FUNDS | | 2,856,897 |
International Equity Funds - 12.8% |
Fidelity Advisor International Discovery Fund Institutional Class | 21,321 | | 717,015 |
TOTAL EQUITY FUNDS (Cost $3,179,587) | 3,573,912 |
Fixed-Income Funds - 33.0% |
| | | |
High Yield Fixed-Income Funds - 6.7% |
Fidelity Capital & Income Fund | 19,642 | | 187,976 |
Fidelity Strategic Income Fund | 17,004 | | 193,500 |
TOTAL HIGH YIELD FIXED-INCOME FUNDS | | 381,476 |
|
| Shares | | Value |
Investment Grade Fixed-Income Funds - 26.3% |
Fidelity Government Income Fund | 27,780 | | $ 296,692 |
Fidelity Strategic Real Return Fund | 29,764 | | 295,859 |
Fidelity Total Bond Fund | 80,599 | | 887,400 |
TOTAL INVESTMENT GRADE FIXED-INCOME FUNDS | | 1,479,951 |
TOTAL FIXED-INCOME FUNDS (Cost $1,738,420) | 1,861,427 |
Short-Term Funds - 3.5% |
| | | |
Fidelity Institutional Money Market Portfolio Institutional Class | 98,196 | | 98,196 |
Fidelity Short-Term Bond Fund | 11,572 | | 98,828 |
TOTAL SHORT-TERM FUNDS (Cost $195,233) | 197,024 |
TOTAL INVESTMENT PORTFOLIO - 100.0% (Cost $5,113,240) | | 5,632,363 |
NET OTHER ASSETS (LIABILITIES) - 0.0% | | 2 |
NET ASSETS - 100% | $ 5,632,365 |
Legend |
(a) Non-income producing |
Other Information |
All investments are categorized as Level 1 under the Fair Value Hierarchy. The inputs or methodology used for valuing securities may not be an indication of the risk associated with investing in those securities. For more information on valuation inputs, please refer to the Security Valuation section in the accompanying Notes to Financial Statements. |
Income Tax Information |
At July 31, 2011, the Fund had a capital loss carryforward of approximately $51,392 of which $2,106, $15,348 and $33,938 will expire in fiscal 2017, 2018 and 2019, respectively. Capital loss carryforwards are only available to offset future capital gains of the Fund to the extent provided by regulations and may be limited. |
See accompanying notes which are an integral part of the financial statements.
Annual Report
Fidelity Income Replacement 2042 Fund
Statement of Assets and Liabilities
| July 31, 2011 |
| | |
Assets | | |
Investment in securities, at value (cost $5,113,240) - See accompanying schedule | | $ 5,632,363 |
Cash | | 40 |
Receivable for fund shares sold | | 3,001 |
Total assets | | 5,635,404 |
| | |
Liabilities | | |
Payable for investments purchased | $ 2,996 | |
Distribution and service plan fees payable | 43 | |
Total liabilities | | 3,039 |
| | |
Net Assets | | $ 5,632,365 |
Net Assets consist of: | | |
Paid in capital | | $ 5,219,431 |
Undistributed net investment income | | 1,108 |
Accumulated undistributed net realized gain (loss) on investments | | (107,297) |
Net unrealized appreciation (depreciation) on investments | | 519,123 |
Net Assets | | $ 5,632,365 |
| | |
Calculation of Maximum Offering Price Class A:
Net Asset Value and redemption price per share ($22,593 ÷ 465.62 shares) | | $ 48.52 |
| | |
Maximum offering price per share (100/94.25 of $48.52) | | $ 51.48 |
| | |
Class T:
Net Asset Value and redemption price per share ($28,600 ÷ 589.33 shares) | | $ 48.53 |
| | |
Maximum offering price per share (100/96.50 of $48.53) | | $ 50.29 |
| | |
Class C:
Net Asset Value and offering price per share ($28,082 ÷ 578.73 shares)A | | $ 48.52 |
| | |
Income Replacement 2042:
Net Asset Value, offering price and redemption price per share ($5,523,957 ÷ 113,874.34 shares) | | $ 48.51 |
| | |
Institutional Class:
Net Asset Value, offering price and redemption price per share ($29,133 ÷ 600.60 shares) | | $ 48.51 |
A Redemption price per share is equal to net asset value less any applicable contingent deferred sales charge.
Statement of Operations
| Year ended July 31, 2011 |
| | |
Investment Income | | |
Income distributions from underlying funds | | $ 84,817 |
| | |
Expenses | | |
Distribution and service plan fees | $ 560 | |
Independent trustees' compensation | 16 | |
Total expenses before reductions | 576 | |
Expense reductions | (16) | 560 |
Net investment income (loss) | | 84,257 |
Realized and Unrealized Gain (Loss) Realized gain (loss) on sale of underlying fund shares | (38,325) | |
Capital gain distributions from underlying funds | 21,921 | |
Total net realized gain (loss) | | (16,404) |
Change in net unrealized appreciation (depreciation) on underlying funds | | 478,706 |
Net gain (loss) | | 462,302 |
Net increase (decrease) in net assets resulting from operations | | $ 546,559 |
See accompanying notes which are an integral part of the financial statements.
Annual Report
Fidelity Income Replacement 2042 Fund
Financial Statements - continued
Statement of Changes in Net Assets
| Year ended
July 31, 2011 | Year ended
July 31, 2010 |
Increase (Decrease) in Net Assets | | |
Operations | | |
Net investment income (loss) | $ 84,257 | $ 58,360 |
Net realized gain (loss) | (16,404) | (3,503) |
Change in net unrealized appreciation (depreciation) | 478,706 | 231,761 |
Net increase (decrease) in net assets resulting from operations | 546,559 | 286,618 |
Distributions to shareholders from net investment income | (84,042) | (57,943) |
Distributions to shareholders from net realized gain | (15,604) | (7,508) |
Total distributions | (99,646) | (65,451) |
Share transactions - net increase (decrease) | 1,650,368 | 1,660,037 |
Total increase (decrease) in net assets | 2,097,281 | 1,881,204 |
| | |
Net Assets | | |
Beginning of period | 3,535,084 | 1,653,880 |
End of period (including undistributed net investment income of $1,108 and undistributed net investment income of $933, respectively) | $ 5,632,365 | $ 3,535,084 |
Financial Highlights - Class A
Years ended July 31, | 2011 | 2010 | 2009 | 2008G |
Selected Per-Share Data | | | | |
Net asset value, beginning of period | $ 43.04 | $ 38.83 | $ 45.20 | $ 50.00 |
Income from Investment Operations | | | | |
Net investment income (loss)E | .757 | .747 | .819 | .425 |
Net realized and unrealized gain (loss) | 5.719 | 4.285 | (6.123) | (4.836) |
Total from investment operations | 6.476 | 5.032 | (5.304) | (4.411) |
Distributions from net investment income | (.801) | (.717) | (.866) | (.389) |
Distributions from net realized gain | (.195) | (.105) | (.200) | - |
Total distributions | (.996) | (.822) | (1.066) | (.389) |
Net asset value, end of period | $ 48.52 | $ 43.04 | $ 38.83 | $ 45.20 |
Total ReturnB,C,D | 15.12% | 13.00% | (11.40)% | (8.85)% |
Ratios to Average Net AssetsF,H | | | | |
Expenses before reductions | .25% | .25% | .25% | .25%A |
Expenses net of fee waivers, if any | .25% | .25% | .25% | .25%A |
Expenses net of all reductions | .25% | .25% | .25% | .25%A |
Net investment income (loss) | 1.61% | 1.77% | 2.32% | 1.57%A |
Supplemental Data | | | | |
Net assets, end of period (000 omitted) | $ 23 | $ 29 | $ 88 | $ 91 |
Portfolio turnover rate | 15% | 20% | 37% | 8%A |
A Annualized
B Total returns for periods of less than one year are not annualized.
C Total returns would have been lower if certain expenses had not been reduced during the applicable periods shown.
D Total returns do not include the effect of the sales charges.
E Calculated based on average shares outstanding during the period.
F Amounts do not include the activity of the underlying funds.
G For the period December 31, 2007 (commencement of operations) to July 31, 2008.
H Expense ratios reflect operating expenses of the class. Expenses before reductions do not reflect amounts reimbursed by the investment adviser or reductions from expense offset arrangements and do not represent the amount paid by the class during periods when reimbursements or reductions occur. Expenses net of fee waivers reflect expenses after reimbursement by the investment adviser but prior to reductions from expense offset arrangements. Expenses net of all reductions represent the net expenses paid by the class but do not include expenses of the investment companies in which the Fund invests.
See accompanying notes which are an integral part of the financial statements.
Annual Report
Financial Highlights - Class T
Years ended July 31, | 2011 | 2010 | 2009 | 2008G |
Selected Per-Share Data | | | | |
Net asset value, beginning of period | $ 43.04 | $ 38.83 | $ 45.19 | $ 50.00 |
Income from Investment Operations | | | | |
Net investment income (loss)E | .637 | .642 | .739 | .365 |
Net realized and unrealized gain (loss) | 5.727 | 4.281 | (6.128) | (4.852) |
Total from investment operations | 6.364 | 4.923 | (5.389) | (4.487) |
Distributions from net investment income | (.679) | (.608) | (.771) | (.323) |
Distributions from net realized gain | (.195) | (.105) | (.200) | - |
Total distributions | (.874) | (.713) | (.971) | (.323) |
Net asset value, end of period | $ 48.53 | $ 43.04 | $ 38.83 | $ 45.19 |
Total ReturnB,C,D | 14.85% | 12.71% | (11.62)% | (9.00)% |
Ratios to Average Net AssetsF,H | | | | |
Expenses before reductions | .50% | .50% | .50% | .50%A |
Expenses net of fee waivers, if any | .50% | .50% | .50% | .50%A |
Expenses net of all reductions | .50% | .50% | .50% | .50%A |
Net investment income (loss) | 1.35% | 1.52% | 2.07% | 1.32%A |
Supplemental Data | | | | |
Net assets, end of period (000 omitted) | $ 29 | $ 37 | $ 57 | $ 91 |
Portfolio turnover rate | 15% | 20% | 37% | 8%A |
A Annualized
B Total returns for periods of less than one year are not annualized.
C Total returns would have been lower if certain expenses had not been reduced during the applicable periods shown.
D Total returns do not include the effect of the sales charges.
E Calculated based on average shares outstanding during the period.
F Amounts do not include the activity of the underlying funds.
G For the period December 31, 2007 (commencement of operations) to July 31, 2008.
H Expense ratios reflect operating expenses of the class. Expenses before reductions do not reflect amounts reimbursed by the investment adviser or reductions from expense offset arrangements and do not represent the amount paid by the class during periods when reimbursements or reductions occur. Expenses net of fee waivers reflect expenses after reimbursement by the investment adviser but prior to reductions from expense offset arrangements. Expenses net of all reductions represent the net expenses paid by the class but do not include expenses of the investment companies in which the Fund invests.
Financial Highlights - Class C
Years ended July 31, | 2011 | 2010 | 2009 | 2008G |
Selected Per-Share Data | | | | |
Net asset value, beginning of period | $ 43.05 | $ 38.84 | $ 45.19 | $ 50.00 |
Income from Investment Operations | | | | |
Net investment income (loss)E | .402 | .430 | .560 | .226 |
Net realized and unrealized gain (loss) | 5.719 | 4.275 | (6.123) | (4.846) |
Total from investment operations | 6.121 | 4.705 | (5.563) | (4.620) |
Distributions from net investment income | (.456) | (.390) | (.587) | (.190) |
Distributions from net realized gain | (.195) | (.105) | (.200) | - |
Total distributions | (.651) | (.495) | (.787) | (.190) |
Net asset value, end of period | $ 48.52 | $ 43.05 | $ 38.84 | $ 45.19 |
Total ReturnB,C,D | 14.26% | 12.12% | (12.05)% | (9.25)% |
Ratios to Average Net AssetsF,H | | | | |
Expenses before reductions | 1.00% | 1.00% | 1.00% | 1.00%A |
Expenses net of fee waivers, if any | 1.00% | 1.00% | 1.00% | 1.00%A |
Expenses net of all reductions | 1.00% | 1.00% | 1.00% | 1.00%A |
Net investment income (loss) | .85% | 1.02% | 1.57% | .82%A |
Supplemental Data | | | | |
Net assets, end of period (000 omitted) | $ 28 | $ 37 | $ 56 | $ 91 |
Portfolio turnover rate | 15% | 20% | 37% | 8%A |
A Annualized
B Total returns for periods of less than one year are not annualized.
C Total returns would have been lower if certain expenses had not been reduced during the applicable periods shown.
D Total returns do not include the effect of the contingent deferred sales charge.
E Calculated based on average shares outstanding during the period.
F Amounts do not include the activity of the underlying funds.
G For the period December 31, 2007 (commencement of operations) to July 31, 2008.
H Expense ratios reflect operating expenses of the class. Expenses before reductions do not reflect amounts reimbursed by the investment adviser or reductions from expense offset arrangements and do not represent the amount paid by the class during periods when reimbursements or reductions occur. Expenses net of fee waivers reflect expenses after reimbursement by the investment adviser but prior to reductions from expense offset arrangements. Expenses net of all reductions represent the net expenses paid by the class but do not include expenses of the investment companies in which the Fund invests.
See accompanying notes which are an integral part of the financial statements.
Annual Report
Financial Highlights - Income Replacement 2042
Years ended July 31, | 2011 | 2010 | 2009 | 2008G |
Selected Per-Share Data | | | | |
Net asset value, beginning of period | $ 43.03 | $ 38.83 | $ 45.20 | $ 50.00 |
Income from Investment Operations | | | | |
Net investment income (loss)D | .880 | .857 | .900 | .496 |
Net realized and unrealized gain (loss) | 5.719 | 4.279 | (6.114) | (4.840) |
Total from investment operations | 6.599 | 5.136 | (5.214) | (4.344) |
Distributions from net investment income | (.924) | (.831) | (.956) | (.456) |
Distributions from net realized gain | (.195) | (.105) | (.200) | - |
Total distributions | (1.119) | (.936) | (1.156) | (.456) |
Net asset value, end of period | $ 48.51 | $ 43.03 | $ 38.83 | $ 45.20 |
Total ReturnB,C | 15.42% | 13.27% | (11.18)% | (8.72)% |
Ratios to Average Net AssetsE,H | | | | |
Expenses before reductionsF | .00% | .00% | .00% | .00%A |
Expenses net of fee waivers, if any | .00% | .00% | .00% | .00%A |
Expenses net of all reductions | .00% | .00% | .00% | .00%A |
Net investment income (loss) | 1.86% | 2.02% | 2.57% | 1.82%A |
Supplemental Data | | | | |
Net assets, end of period (000 omitted) | $ 5,524 | $ 3,395 | $ 1,395 | $ 969 |
Portfolio turnover rate | 15% | 20% | 37% | 8%A |
A Annualized
B Total returns for periods of less than one year are not annualized.
C Total returns would have been lower if certain expenses had not been reduced during the applicable periods shown.
D Calculated based on average shares outstanding during the period.
E Amounts do not include the activity of the underlying funds.
F Amount represents less than .01%.
G For the period December 31, 2007 (commencement of operations) to July 31, 2008.
H Expense ratios reflect operating expenses of the class. Expenses before reductions do not reflect amounts reimbursed by the investment adviser or reductions from expense offset arrangements and do not represent the amount paid by the class during periods when reimbursements or reductions occur. Expenses net of fee waivers reflect expenses after reimbursement by the investment adviser but prior to reductions from expense offset arrangements. Expenses net of all reductions represent the net expenses paid by the class but do not include expenses of the investment companies in which the Fund invests.
Financial Highlights - Institutional Class
Years ended July 31, | 2011 | 2010 | 2009 | 2008G |
Selected Per-Share Data | | | | |
Net asset value, beginning of period | $ 43.03 | $ 38.83 | $ 45.20 | $ 50.00 |
Income from Investment Operations | | | | |
Net investment income (loss)D | .874 | .855 | .918 | .504 |
Net realized and unrealized gain (loss) | 5.725 | 4.281 | (6.132) | (4.848) |
Total from investment operations | 6.599 | 5.136 | (5.214) | (4.344) |
Distributions from net investment income | (.924) | (.831) | (.956) | (.456) |
Distributions from net realized gain | (.195) | (.105) | (.200) | - |
Total distributions | (1.119) | (.936) | (1.156) | (.456) |
Net asset value, end of period | $ 48.51 | $ 43.03 | $ 38.83 | $ 45.20 |
Total ReturnB,C | 15.42% | 13.27% | (11.18)% | (8.72)% |
Ratios to Average Net AssetsE,H | | | | |
Expenses before reductionsF | .00% | .00% | .00% | .00%A |
Expenses net of fee waivers, if any | .00% | .00% | .00% | .00%A |
Expenses net of all reductions | .00% | .00% | .00% | .00%A |
Net investment income (loss) | 1.86% | 2.02% | 2.57% | 1.82%A |
Supplemental Data | | | | |
Net assets, end of period (000 omitted) | $ 29 | $ 38 | $ 57 | $ 91 |
Portfolio turnover rate | 15% | 20% | 37% | 8%A |
A Annualized
B Total returns for periods of less than one year are not annualized.
C Total returns would have been lower if certain expenses had not been reduced during the applicable periods shown.
D Calculated based on average shares outstanding during the period.
E Amounts do not include the activity of the underlying funds.
F Amount represents less than .01%.
G For the period December 31, 2007 (commencement of operations) to July 31, 2008.
H Expense ratios reflect operating expenses of the class. Expenses before reductions do not reflect amounts reimbursed by the investment adviser or reductions from expense offset arrangements and do not represent the amount paid by the class during periods when reimbursements or reductions occur. Expenses net of fee waivers reflect expenses after reimbursement by the investment adviser but prior to reductions from expense offset arrangements. Expenses net of all reductions represent the net expenses paid by the class but do not include expenses of the investment companies in which the Fund invests.
See accompanying notes which are an integral part of the financial statements.
Annual Report
Notes to Financial Statements
For the period ended July 31, 2011
1. Organization.
Fidelity Income Replacement 2016 Fund, Fidelity Income Replacement 2018 Fund, Fidelity Income Replacement 2020 Fund, Fidelity Income Replacement 2022 Fund, Fidelity Income Replacement 2024 Fund, Fidelity Income Replacement 2026 Fund, Fidelity Income Replacement 2028 Fund, Fidelity Income Replacement 2030 Fund, Fidelity Income Replacement 2032 Fund, Fidelity Income Replacement 2034 Fund, Fidelity Income Replacement 2036 Fund, Fidelity Income Replacement 2038 Fund, Fidelity Income Replacement 2040 Fund and Fidelity Income Replacement 2042 Fund (the Funds) are funds of Fidelity Income Fund (the Trust). The Trust is registered under the Investment Company Act of 1940, as amended (the 1940 Act), as an open-end management investment company organized as a Massachusetts business trust. Each Fund is authorized to issue an unlimited number of shares. The Funds invest primarily in a combination of other Fidelity equity, bond, and short-term funds (the Underlying Funds) managed by Fidelity Management & Research Company (FMR).
The Funds are designed for investors who seek to convert accumulated assets into regular payments over a defined period of time. The payment strategy for each Fund is designed to be implemented through a shareholder's voluntary participation in the Smart Payment Program. Participation in the Smart Payment Program will result in the gradual liquidation of the shareholder's entire investment in the Fund by its horizon date. Each Fund's name refers to the year of its horizon date.
Each Fund offers Class A, Class T, Class C, Income Replacement and Institutional Class shares, each of which has equal rights as to assets and voting privileges. Each class has exclusive voting rights with respect to matters that affect that class. Investment income, realized and unrealized capital gains and losses, the common expenses of the Fund, and certain fund-level expense reductions, if any, are allocated on a pro-rata basis to each class based on the relative net assets of each class to the total net assets of the Fund. Each class differs with respect to distribution and service plan fees incurred. Certain expense reductions may also differ by class.
2. Significant Accounting Policies.
The financial statements have been prepared in conformity with accounting principles generally accepted in the United States of America (GAAP), which require management to make certain estimates and assumptions at the date of the financial statements. Actual results could differ from those estimates. Subsequent events, if any, through the date that the financial statements were issued have been evaluated in the preparation of the financial statements. The following summarizes the significant accounting policies of the Funds:
Security Valuation. Investments are valued as of 4:00 p.m. Eastern time on the last calendar day of the period. Each Fund categorizes the inputs to valuation techniques used to value their investments into a disclosure hierarchy consisting of three levels as shown below:
Level 1 - quoted prices in active markets for identical investments
Level 2 - other significant observable inputs (including quoted prices for similar investments, interest rates, prepayment speeds, etc.)
Level 3 - unobservable inputs (including the Fund's own assumptions based on the best information available)
Valuation techniques used to value each Fund's investments by major category are as follows. Investments in the Underlying Funds are valued at their closing net asset value (NAV) each business day and are categorized as Level 1 in the hierarchy.
Investment Transactions and Income. For financial reporting purposes, the Funds' investment holdings and NAV include trades executed through the end of the last business day of the period. The NAV per share for processing shareholder transactions is calculated as of the close of business of the New York Stock Exchange (NYSE), normally 4:00 p.m. Eastern time and includes trades executed through the end of the prior business day. Gains and losses on securities sold are determined on the basis of identified cost. Income and capital gain distributions from the Underlying Funds, if any, are recorded on the ex-dividend date.
Expenses. Expenses directly attributable to a fund are charged to that fund. Expenses attributable to more than one fund are allocated among the respective funds on the basis of relative net assets or other appropriate methods. Expenses included in the accompanying financial statements reflect the expenses of the Fund and do not include any expenses associated with the Underlying Funds. Expense estimates are accrued in the period to which they relate and adjustments are made when actual amounts are known.
Income Tax Information and Distributions to Shareholders. Each year, each Fund intends to qualify as a regulated investment company, including distributing substantially all of its taxable income and realized gains under Subchapter M of the Internal Revenue Code and filing its U.S. federal tax return. As a result, no provision for income taxes is required. As of July 31, 2011, each Fund did not have any unrecognized tax benefits in the financial statements. A fund's federal tax return is subject to examination by the Internal Revenue Service (IRS) for a period of three years.
Distributions are declared and recorded on the ex-dividend date. Income dividends and capital gain distributions are declared separately for each class. Income and capital gain distributions are determined in accordance with income tax regulations, which may differ from GAAP.
Annual Report
2. Significant Accounting Policies - continued
Income Tax Information and Distributions to Shareholders - continued
Capital accounts within the financial statements are adjusted for permanent book-tax differences. These adjustments have no impact on net assets or the results of operations. Temporary book-tax differences will reverse in a subsequent period.
Book-tax differences are primarily due to the short-term gain distributions from the Underlying Funds, capital loss carryforwards, losses deferred due to wash sales and excise tax regulations.
The federal tax cost of investment securities and unrealized appreciation (depreciation) as of period end were as follows for each Fund:
| Tax cost | Gross unrealized appreciation | Gross unrealized depreciation | Net unrealized appreciation (depreciation) on securities and other investments |
Fidelity Income Replacement 2016 Fund | $ 9,508,174 | $ 578,985 | $ (80,291) | $ 498,694 |
Fidelity Income Replacement 2018 Fund | 5,185,322 | 210,196 | (110,354) | 99,842 |
Fidelity Income Replacement 2020 Fund | 3,682,885 | 320,678 | (31,825) | 288,853 |
Fidelity Income Replacement 2022 Fund | 3,438,681 | 84,225 | (126,856) | (42,631) |
Fidelity Income Replacement 2024 Fund | 1,803,498 | 118,451 | (31,414) | 87,037 |
Fidelity Income Replacement 2026 Fund | 2,096,463 | 64,069 | (44,127) | 19,942 |
Fidelity Income Replacement 2028 Fund | 5,868,593 | 378,957 | (124,718) | 254,239 |
Fidelity Income Replacement 2030 Fund | 4,203,705 | 206,049 | (63,710) | 142,339 |
Fidelity Income Replacement 2032 Fund | 1,423,946 | 160,342 | (5,296) | 155,046 |
Fidelity Income Replacement 2034 Fund | 1,987,588 | 258,796 | (6,093) | 252,703 |
Fidelity Income Replacement 2036 Fund | 3,009,844 | 71,104 | (84,685) | (13,581) |
Fidelity Income Replacement 2038 Fund | 1,376,453 | 234,451 | (3,487) | 230,964 |
Fidelity Income Replacement 2040 Fund | 2,005,007 | 161,128 | (15,802) | 145,326 |
Fidelity Income Replacement 2042 Fund | 5,169,147 | 536,316 | (73,100) | 463,216 |
The tax-based components of distributable earnings as of period end were as follows for each Fund:
| Undistributed ordinary income | Capital loss carryforward | Net unrealized appreciation (depreciation) |
Fidelity Income Replacement 2016 Fund | $ 2,169 | $ (373,492) | $ 498,694 |
Fidelity Income Replacement 2018 Fund | 1,141 | (571,622) | 99,842 |
Fidelity Income Replacement 2020 Fund | 855 | (144,422) | 288,853 |
Fidelity Income Replacement 2022 Fund | 761 | (619,540) | (42,631) |
Fidelity Income Replacement 2024 Fund | 362 | (134,792) | 87,037 |
Fidelity Income Replacement 2026 Fund | 405 | (233,577) | 19,942 |
Fidelity Income Replacement 2028 Fund | 1,283 | (600,001) | 254,239 |
Fidelity Income Replacement 2030 Fund | 793 | (119,726) | 142,339 |
Fidelity Income Replacement 2032 Fund | 290 | (160,350) | 155,046 |
Fidelity Income Replacement 2034 Fund | 426 | (106,484) | 252,703 |
Fidelity Income Replacement 2036 Fund | 528 | (206,608) | (13,581) |
Fidelity Income Replacement 2038 Fund | 293 | (60,057) | 230,964 |
Fidelity Income Replacement 2040 Fund | 368 | (169,960) | 145,326 |
Fidelity Income Replacement 2042 Fund | 1,108 | (51,392) | 463,216 |
Under the recently enacted Regulated Investment Company Modernization Act of 2010 (the Act), the Funds will be permitted to carry forward capital losses incurred in taxable years beginning after December 22, 2010 for an unlimited period. However, any losses incurred during those future taxable years will be required to be utilized prior to any losses incurred in pre-enactment taxable years, which generally expire after eight years from when they are incurred. Additionally, post-enactment capital losses that are carried forward will retain their character as either short-term or long-term capital losses rather than being considered all short-term as under previous law. The Funds' first fiscal year end subject to the Act will be July 31, 2012.
Annual Report
Notes to Financial Statements - continued
2. Significant Accounting Policies - continued
Income Tax Information and Distributions to Shareholders - continued
The tax character of distributions paid was as follows:
July 31, 2011 | Ordinary Income |
Fidelity Income Replacement 2016 Fund | $ 253,172 |
Fidelity Income Replacement 2018 Fund | 135,712 |
Fidelity Income Replacement 2020 Fund | 88,505 |
Fidelity Income Replacement 2022 Fund | 70,615 |
Fidelity Income Replacement 2024 Fund | 36,771 |
Fidelity Income Replacement 2026 Fund | 28,540 |
Fidelity Income Replacement 2028 Fund | 142,480 |
Fidelity Income Replacement 2030 Fund | 65,364 |
Fidelity Income Replacement 2032 Fund | 47,734 |
Fidelity Income Replacement 2034 Fund | 45,760 |
Fidelity Income Replacement 2036 Fund | 40,481 |
Fidelity Income Replacement 2038 Fund | 50,042 |
Fidelity Income Replacement 2040 Fund | 41,637 |
Fidelity Income Replacement 2042 Fund | 99,646 |
July 31, 2010 | |
Fidelity Income Replacement 2016 Fund | 216,155 |
Fidelity Income Replacement 2018 Fund | 117,493 |
Fidelity Income Replacement 2020 Fund | 65,924 |
Fidelity Income Replacement 2022 Fund | 76,907 |
Fidelity Income Replacement 2024 Fund | 35,066 |
Fidelity Income Replacement 2026 Fund | 15,476 |
Fidelity Income Replacement 2028 Fund | 148,030 |
Fidelity Income Replacement 2030 Fund | 16,070 |
Fidelity Income Replacement 2032 Fund | 20,828 |
Fidelity Income Replacement 2034 Fund | 46,782 |
Fidelity Income Replacement 2036 Fund | 23,692 |
Fidelity Income Replacement 2038 Fund | 53,521 |
Fidelity Income Replacement 2040 Fund | 26,066 |
Fidelity Income Replacement 2042 Fund | 65,451 |
3. Purchases and Sales of Investments.
Purchases and redemptions of the Underlying Fund shares are noted in the table below.
| Purchases ($) | Redemptions ($) |
Fidelity Income Replacement 2016 Fund | 3,411,699 | 5,113,582 |
Fidelity Income Replacement 2018 Fund | 2,212,548 | 2,768,533 |
Fidelity Income Replacement 2020 Fund | 2,254,449 | 1,884,536 |
Fidelity Income Replacement 2022 Fund | 1,483,843 | 896,535 |
Fidelity Income Replacement 2024 Fund | 654,679 | 445,200 |
Fidelity Income Replacement 2026 Fund | 1,385,169 | 367,772 |
Fidelity Income Replacement 2028 Fund | 1,086,293 | 1,727,078 |
Fidelity Income Replacement 2030 Fund | 2,895,282 | 737,307 |
Fidelity Income Replacement 2032 Fund | 913,151 | 1,254,850 |
Fidelity Income Replacement 2034 Fund | 950,303 | 767,953 |
Fidelity Income Replacement 2036 Fund | 2,093,941 | 361,646 |
Fidelity Income Replacement 2038 Fund | 365,232 | 1,259,437 |
Fidelity Income Replacement 2040 Fund | 1,775,854 | 1,383,111 |
Fidelity Income Replacement 2042 Fund | 2,357,514 | 700,626 |
Annual Report
4. Fees and Other Transactions with Affiliates.
Management Fee. Strategic Advisers, Inc. (Strategic Advisers), an affiliate of FMR, provides the Funds with investment management related services. The Funds do not pay any fees for these services. Under the management contract, Strategic Advisers pays all other fund-level expenses, except the compensation of the independent Trustees and certain other expenses such as interest expense. The management fee paid by each Fund is reduced by an amount equal to the fees and expenses paid by the Fund to the independent Trustees.
Distribution and Service Plan Fees. In accordance with Rule 12b-1 of the 1940 Act, the Fund has adopted separate Distribution and Service Plans for each class of shares. Certain classes pay Fidelity Distributors Corporation (FDC), an affiliate of FMR, separate Distribution and Service Fees, each of which is based on an annual percentage of each class' average net assets. In addition, FDC may pay financial intermediaries for selling shares of the Fund and providing shareholder support services. For the period, the Distribution and Service Fee rates, total fees and amounts retained by FDC were as follows:
Fidelity Income Replacement 2016 Fund | Distribution
Fee | Service
Fee | Total
Fees | Retained
by FDC |
Class A | -% | .25% | $ 5,200 | $ 7 |
Class T | .25% | .25% | 2,994 | 6 |
Class C | .75% | .25% | 11,323 | 622 |
| | | $ 19,517 | $ 635 |
Fidelity Income Replacement 2018 Fund | | | | |
Class A | -% | .25% | $ 2,705 | $ 30 |
Class T | .25% | .25% | 410 | 8 |
Class C | .75% | .25% | 2,027 | 371 |
| | | $ 5,142 | $ 409 |
Fidelity Income Replacement 2020 Fund | | | | |
Class A | -% | .25% | $ 1,503 | $ 520 |
Class T | .25% | .25% | 802 | 4 |
Class C | .75% | .25% | 2,815 | 136 |
| | | $ 5,120 | $ 660 |
Fidelity Income Replacement 2022 Fund | | | | |
Class A | -% | .25% | $ 158 | $ 4 |
Class T | .25% | .25% | 298 | 12 |
Class C | .75% | .25% | 380 | 139 |
| | | $ 836 | $ 155 |
Fidelity Income Replacement 2024 Fund | | | | |
Class A | -% | .25% | $ 624 | $ 13 |
Class T | .25% | .25% | 235 | 161 |
Class C | .75% | .25% | 1,698 | 42 |
| | | $ 2,557 | $ 216 |
Fidelity Income Replacement 2026 Fund | | | | |
Class A | -% | .25% | $ 135 | $ 28 |
Class T | .25% | .25% | 628 | 28 |
Class C | .75% | .25% | 1,841 | 88 |
| | | $ 2,604 | $ 144 |
Fidelity Income Replacement 2028 Fund | | | | |
Class A | -% | .25% | $ 847 | $ 26 |
Class T | .25% | .25% | 700 | 4 |
Class C | .75% | .25% | 522 | 1 |
| | | $ 2,069 | $ 31 |
Fidelity Income Replacement 2030 Fund | | | | |
Class A | -% | .25% | $ 167 | $ 34 |
Class T | .25% | .25% | 96 | 56 |
Class C | .75% | .25% | 2,187 | 418 |
| | | $ 2,450 | $ 508 |
Fidelity Income Replacement 2032 Fund | | | | |
Class A | -% | .25% | $ 556 | $ 13 |
Class T | .25% | .25% | 152 | 152 |
Class C | .75% | .25% | 259 | 259 |
| | | $ 967 | $ 424 |
Annual Report
Notes to Financial Statements - continued
4. Fees and Other Transactions with Affiliates - continued
Distribution and Service Plan Fees - continued
Fidelity Income Replacement 2034 Fund | Distribution
Fee | Service
Fee | Total
Fees | Retained
by FDC |
Class A | -% | .25% | $ 59 | $ 59 |
Class T | .25% | .25% | 150 | 150 |
Class C | .75% | .25% | 235 | 235 |
| | | $ 444 | $ 444 |
Fidelity Income Replacement 2036 Fund | | | | |
Class A | -% | .25% | $ 89 | $ 72 |
Class T | .25% | .25% | 1,458 | 28 |
Class C | .75% | .25% | 1,366 | 151 |
| | | $ 2,913 | $ 251 |
Fidelity Income Replacement 2038 Fund | | | | |
Class A | -% | .25% | $ 83 | $ 4 |
Class T | .25% | .25% | 214 | 166 |
Class C | .75% | .25% | 799 | 606 |
| | | $ 1,096 | $ 776 |
Fidelity Income Replacement 2040 Fund | | | | |
Class A | -% | .25% | $ 133 | $ 74 |
Class T | .25% | .25% | 626 | 30 |
Class C | .75% | .25% | 876 | 688 |
| | | $ 1,635 | $ 792 |
Fidelity Income Replacement 2042 Fund | | | | |
Class A | -% | .25% | $ 65 | $ 30 |
Class T | .25% | .25% | 167 | 167 |
Class C | .75% | .25% | 328 | 328 |
| | | $ 560 | $ 525 |
Sales Load. FDC may receive a front-end sales charge of up to 5.75% for selling Class A shares, and 3.50% for selling Class T shares, some of which is paid to financial intermediaries for selling shares of the Fund. Depending on the holding period, FDC may receive contingent deferred sales charges levied on Class A, Class T and Class C redemptions. These charges depend on the holding period. The deferred sales charges range from 1% for Class C, 1.00% for certain purchases of Class A shares and .25% for certain purchases of Class T shares.
For the period, sales charge amounts retained by FDC were as follows:
Fidelity Income Replacement 2016 Fund | Retained
by FDC |
Class A | $ 257 |
Class C* | 9 |
| 266 |
Fidelity Income Replacement 2018 Fund | |
Class A | $ 563 |
Fidelity Income Replacement 2020 Fund | |
Class A | $ 2 |
Fidelity Income Replacement 2022 Fund | |
Class A | $ 215 |
Fidelity Income Replacement 2026 Fund | |
Class A | $ 622 |
Class T | 9 |
| $ 631 |
Fidelity Income Replacement 2030 Fund | |
Class A | $ 212 |
Class C* | 3 |
| $ 215 |
Annual Report
4. Fees and Other Transactions with Affiliates - continued
Sales Load - continued
Fidelity Income Replacement 2036 Fund | Retained
by FDC |
Class T | $ 3 |
Class C* | 4 |
| $ 7 |
Fidelity Income Replacement 2040 Fund | |
Class A | $ 441 |
* When Class C shares are initially sold, FDC pays commissions from its own resources to financial intermediaries through which the sales are made.
5. Expense Reductions.
FMR voluntarily agreed to reimburse the Funds to the extent annual operating expenses exceeded distribution and service fees applicable to each class. Some expenses, for example interest expense, are excluded from this reimbursement.
The following Funds were in reimbursement during the period:
| Reimbursement
from adviser* |
Fidelity Income Replacement 2016 Fund | 40 |
Fidelity Income Replacement 2018 Fund | 21 |
Fidelity Income Replacement 2020 Fund | 14 |
Fidelity Income Replacement 2022 Fund | 11 |
Fidelity Income Replacement 2024 Fund | 6 |
Fidelity Income Replacement 2026 Fund | 5 |
Fidelity Income Replacement 2028 Fund | 23 |
Fidelity Income Replacement 2030 Fund | 10 |
Fidelity Income Replacement 2032 Fund | 7 |
Fidelity Income Replacement 2034 Fund | 7 |
Fidelity Income Replacement 2036 Fund | 6 |
Fidelity Income Replacement 2038 Fund | 7 |
Fidelity Income Replacement 2040 Fund | 7 |
Fidelity Income Replacement 2042 Fund | 16 |
* Represents total amount reimbursed to the Fund. Each class has received pro-rata allocation of reimbursement.
6. Distributions to Shareholders.
Distributions to shareholders of each class were as follows:
Years ended July 31, | 2011 | 2010 |
Fidelity Income Replacement 2016 Fund | | |
From net investment income | | |
Class A | $ 34,923 | $ 44,617 |
Class T | 8,720 | 10,060 |
Class C | 10,052 | 12,552 |
Income Replacement 2016 | 138,777 | 120,802 |
Institutional Class | 1,953 | 2,291 |
Total | $ 194,425 | $ 190,322 |
From net realized gain | | |
Class A | $ 11,231 | $ 6,094 |
Class T | 3,381 | 1,771 |
Class C | 6,082 | 3,226 |
Income Replacement 2016 | 37,507 | 14,426 |
Institutional Class | 546 | 316 |
Total | $ 58,747 | $ 25,833 |
Annual Report
Notes to Financial Statements - continued
6. Distributions to Shareholders - continued
Years ended July 31, | 2011 | 2010 |
Fidelity Income Replacement 2018 Fund | | |
From net investment income | | |
Class A | $ 18,636 | $ 17,039 |
Class T | 1,201 | 1,142 |
Class C | 1,971 | 1,710 |
Income Replacement 2018 | 78,313 | 76,857 |
Institutional Class | 6,785 | 7,202 |
Total | $ 106,906 | $ 103,950 |
From net realized gain | | |
Class A | $ 5,977 | $ 2,282 |
Class T | 252 | 200 |
Class C | 980 | 353 |
Income Replacement 2018 | 19,822 | 9,798 |
Institutional Class | 1,775 | 910 |
Total | $ 28,806 | $ 13,543 |
Fidelity Income Replacement 2020 Fund | | |
From net investment income | | |
Class A | $ 10,048 | $ 11,250 |
Class T | 2,330 | 2,566 |
Class C | 2,700 | 2,829 |
Income Replacement 2020 | 55,571 | 39,529 |
Institutional Class | 898 | 2,036 |
Total | $ 71,547 | $ 58,210 |
From net realized gain | | |
Class A | $ 2,797 | $ 1,618 |
Class T | 638 | 468 |
Class C | 1,402 | 667 |
Income Replacement 2020 | 11,887 | 4,645 |
Institutional Class | 234 | 316 |
Total | $ 16,958 | $ 7,714 |
Fidelity Income Replacement 2022 Fund | | |
From net investment income | | |
Class A | $ 1,130 | $ 760 |
Class T | 862 | 1,377 |
Class C | 326 | 583 |
Income Replacement 2022 | 55,484 | 52,195 |
Institutional Class | 83 | 2,258 |
Total | $ 57,885 | $ 57,173 |
From net realized gain | | |
Class A | $ 313 | $ 290 |
Class T | 343 | 657 |
Class C | 169 | 426 |
Income Replacement 2022 | 11,885 | 17,200 |
Institutional Class | 20 | 1,161 |
Total | $ 12,730 | $ 19,734 |
Fidelity Income Replacement 2024 Fund | | |
From net investment income | | |
Class A | $ 4,200 | $ 5,225 |
Class T | 640 | 1,024 |
Class C | 1,582 | 1,614 |
Income Replacement 2024 | 22,670 | 22,024 |
Institutional Class | 601 | 946 |
Total | $ 29,693 | $ 30,833 |
Annual Report
6. Distributions to Shareholders - continued
Years ended July 31, | 2011 | 2010 |
From net realized gain | | |
Class A | $ 1,169 | $ 733 |
Class T | 211 | 173 |
Class C | 755 | 389 |
Income Replacement 2024 | 4,799 | 2,820 |
Institutional Class | 144 | 118 |
Total | $ 7,078 | $ 4,233 |
Fidelity Income Replacement 2026 Fund | | |
From net investment income | | |
Class A | $ 847 | $ 1,002 |
Class T | 1,742 | 1,567 |
Class C | 1,651 | 1,940 |
Income Replacement 2026 | 19,092 | 8,207 |
Institutional Class | 582 | 937 |
Total | $ 23,914 | $ 13,653 |
From net realized gain | | |
Class A | $ 163 | $ 145 |
Class T | 515 | 294 |
Class C | 762 | 484 |
Income Replacement 2026 | 3,053 | 782 |
Institutional Class | 133 | 118 |
Total | $ 4,626 | $ 1,823 |
Fidelity Income Replacement 2028 Fund | | |
From net investment income | | |
Class A | $ 5,819 | $ 6,274 |
Class T | 1,766 | 5,032 |
Class C | 483 | 669 |
Income Replacement 2028 | 108,055 | 118,159 |
Institutional Class | 594 | 931 |
Total | $ 116,717 | $ 131,065 |
From net realized gain | | |
Class A | $ 1,624 | $ 885 |
Class T | 551 | 821 |
Class C | 224 | 172 |
Income Replacement 2028 | 23,226 | 14,970 |
Institutional Class | 138 | 117 |
Total | $ 25,763 | $ 16,965 |
Fidelity Income Replacement 2030 Fund | | |
From net investment income | | |
Class A | $ 1,034 | $ 944 |
Class T | 193 | 802 |
Class C | 2,028 | 1,647 |
Income Replacement 2030 | 50,801 | 9,950 |
Institutional Class | 585 | 870 |
Total | $ 54,641 | $ 14,213 |
From net realized gain | | |
Class A | $ 210 | $ 112 |
Class T | 35 | 143 |
Class C | 777 | 448 |
Income Replacement 2030 | 9,584 | 1,042 |
Institutional Class | 117 | 112 |
Total | $ 10,723 | $ 1,857 |
Annual Report
Notes to Financial Statements - continued
6. Distributions to Shareholders - continued
Years ended July 31, | 2011 | 2010 |
Fidelity Income Replacement 2032 Fund | | |
From net investment income | | |
Class A | $ 3,720 | $ 3,578 |
Class T | 432 | 726 |
Class C | 229 | 409 |
Income Replacement 2032 | 33,843 | 12,987 |
Institutional Class | 1,022 | 990 |
Total | $ 39,246 | $ 18,690 |
From net realized gain | | |
Class A | $ 874 | $ 469 |
Class T | 125 | 112 |
Class C | 104 | 93 |
Income Replacement 2032 | 7,076 | 1,351 |
Institutional Class | 309 | 113 |
Total | $ 8,488 | $ 2,138 |
Fidelity Income Replacement 2034 Fund | | |
From net investment income | | |
Class A | $ 364 | $ 592 |
Class T | 408 | 675 |
Class C | 191 | 337 |
Income Replacement 2034 | 34,754 | 34,804 |
Institutional Class | 1,932 | 1,910 |
Total | $ 37,649 | $ 38,318 |
From net realized gain | | |
Class A | $ 99 | $ 165 |
Class T | 130 | 218 |
Class C | 99 | 166 |
Income Replacement 2034 | 7,355 | 7,479 |
Institutional Class | 428 | 436 |
Total | $ 8,111 | $ 8,464 |
Fidelity Income Replacement 2036 Fund | | |
From net investment income | | |
Class A | $ 555 | $ 811 |
Class T | 3,944 | 4,274 |
Class C | 1,241 | 1,320 |
Income Replacement 2036 | 26,829 | 12,138 |
Institutional Class | 1,583 | 1,200 |
Total | $ 34,152 | $ 19,743 |
From net realized gain | | |
Class A | $ 116 | $ 162 |
Class T | 928 | 958 |
Class C | 398 | 467 |
Income Replacement 2036 | 4,588 | 2,158 |
Institutional Class | 299 | 204 |
Total | $ 6,329 | $ 3,949 |
Fidelity Income Replacement 2038 Fund | | |
From net investment income | | |
Class A | $ 565 | $ 1,542 |
Class T | 664 | 689 |
Class C | 725 | 569 |
Income Replacement 2038 | 37,593 | 40,695 |
Institutional Class | 634 | 942 |
Total | $ 40,181 | $ 44,437 |
Annual Report
6. Distributions to Shareholders - continued
Years ended July 31, | 2011 | 2010 |
From net realized gain | | |
Class A | $ 135 | $ 413 |
Class T | 137 | 207 |
Class C | 333 | 205 |
Income Replacement 2038 | 9,117 | 8,050 |
Institutional Class | 139 | 209 |
Total | $ 9,861 | $ 9,084 |
Fidelity Income Replacement 2040 Fund | | |
From net investment income | | |
Class A | $ 1,176 | $ 1,022 |
Class T | 1,854 | 1,586 |
Class C | 859 | 487 |
Income Replacement 2040 | 29,421 | 18,680 |
Institutional Class | 1,064 | 1,444 |
Total | $ 34,374 | $ 23,219 |
From net realized gain | | |
Class A | $ 360 | $ 174 |
Class T | 502 | 273 |
Class C | 361 | 112 |
Income Replacement 2040 | 5,813 | 2,099 |
Institutional Class | 227 | 189 |
Total | $ 7,263 | $ 2,847 |
Fidelity Income Replacement 2042 Fund | | |
From net investment income | | |
Class A | $ 425 | $1,305 |
Class T | 459 | 687 |
Class C | 302 | 442 |
Income Replacement 2042 | 82,219 | 54,565 |
Institutional Class | 637 | 944 |
Total | $ 84,042 | $ 57,943 |
From net realized gain | | |
Class A | $ 108 | $ 247 |
Class T | 138 | 121 |
Class C | 136 | 120 |
Income Replacement 2042 | 15,082 | 6,898 |
Institutional Class | 140 | 122 |
Total | $ 15,604 | $ 7,508 |
7. Share Transactions.
Transactions for each class of shares were as follows:
| Shares | Dollars |
Years ended July 31, | 2011 | 2010 | 2011 | 2010 |
Fidelity Income Replacement 2016 Fund | | | | |
Class A | | | | |
Shares sold | 1,492 | 10,966 | $ 72,585 | $ 505,595 |
Reinvestment of distributions | 780 | 904 | 38,177 | 41,700 |
Shares redeemed | (15,236) | (22,378) | (747,263) | (1,033,263) |
Net increase (decrease) | (12,964) | (10,508) | $ (636,501) | $ (485,968) |
Class T | | | | |
Shares sold | - | 6,546 | $ - | $ 302,409 |
Reinvestment of distributions | 201 | 199 | 9,845 | 9,206 |
Shares redeemed | (3,144) | (4,625) | (154,952) | (215,246) |
Net increase (decrease) | (2,943) | 2,120 | $ (145,107) | $ 96,369 |
Annual Report
Notes to Financial Statements - continued
7. Share Transactions - continued
| Shares | Dollars |
Years ended July 31, | 2011 | 2010 | 2011 | 2010 |
Class C | | | | |
Shares sold | 2,527 | 3,920 | $ 125,000 | $ 176,110 |
Reinvestment of distributions | 238 | 252 | 11,623 | 11,639 |
Shares redeemed | (10,384) | (8,175) | (518,601) | (376,188) |
Net increase (decrease) | (7,619) | (4,003) | $ (381,978) | $ (188,439) |
Income Replacement 2016 | | | | |
Shares sold | 39,876 | 78,978 | $ 1,956,078 | $ 3,659,239 |
Reinvestment of distributions | 1,346 | 721 | 66,013 | 33,372 |
Shares redeemed | (50,919) | (40,547) | (2,509,419) | (1,866,323) |
Net increase (decrease) | (9,697) | 39,152 | $ (487,328) | $ 1,826,288 |
Institutional Class | | | | |
Shares sold | 841 | 751 | $ 41,400 | $ 34,781 |
Reinvestment of distributions | 8 | 15 | 403 | 690 |
Shares redeemed | (2,264) | (975) | (113,147) | (44,681) |
Net increase (decrease) | (1,415) | (209) | $ (71,344) | $ (9,210) |
Fidelity Income Replacement 2018 Fund | | | | |
Class A | | | | |
Shares sold | 1,564 | 6,590 | $ 72,093 | $ 305,640 |
Reinvestment of distributions | 230 | 248 | 11,233 | 11,354 |
Shares redeemed | (10,781) | (1,601) | (535,725) | (73,103) |
Net increase (decrease) | (8,987) | 5,237 | $ (452,399) | $ 243,891 |
Class T | | | | |
Shares sold | 2,045 | - | $ 102,042 | $ - |
Reinvestment of distributions | 14 | 21 | 665 | 968 |
Shares redeemed | (207) | (1,030) | (10,225) | (46,978) |
Net increase (decrease) | 1,852 | (1,009) | $ 92,482 | $ (46,010) |
Class C | | | | |
Shares sold | 697 | 1,627 | $ 35,000 | $ 75,000 |
Reinvestment of distributions | 46 | 26 | 2,243 | 1,209 |
Shares redeemed | (541) | (373) | (26,508) | (17,000) |
Net increase (decrease) | 202 | 1,280 | $ 10,735 | $ 59,209 |
Income Replacement 2018 | | | | |
Shares sold | 27,556 | 11,957 | $ 1,335,152 | $ 541,219 |
Reinvestment of distributions | 432 | 258 | 21,162 | 11,837 |
Shares redeemed | (30,915) | (13,199) | (1,518,106) | (594,109) |
Net increase (decrease) | (2,927) | (984) | $ (161,792) | $ (41,053) |
Institutional Class | | | | |
Shares sold | - | - | $ - | $ - |
Reinvestment of distributions | 6 | 8 | 294 | 361 |
Shares redeemed | (1,111) | (100) | (54,894) | (4,500) |
Net increase (decrease) | (1,105) | (92) | $ (54,600) | $ (4,139) |
Fidelity Income Replacement 2020 Fund | | | | |
Class A | | | | |
Shares sold | 5 | 4,988 | $ 266 | $ 223,504 |
Reinvestment of distributions | 193 | 166 | 9,448 | 7,568 |
Shares redeemed | (4,655) | (3,855) | (230,357) | (179,660) |
Net increase (decrease) | (4,457) | 1,299 | $ (220,643) | $ 51,412 |
Class T | | | | |
Shares sold | 1,002 | 1,680 | $ 50,063 | $ 80,000 |
Reinvestment of distributions | 56 | 67 | 2,725 | 3,033 |
Shares redeemed | (41) | (2,893) | (2,073) | (131,000) |
Net increase (decrease) | 1,017 | (1,146) | $ 50,715 | $ (47,967) |
Class C | | | | |
Shares sold | - | 1,102 | $ - | $ 49,985 |
Reinvestment of distributions | 59 | 67 | 2,866 | 3,032 |
Shares redeemed | (1,882) | - | (93,646) | - |
Net increase (decrease) | (1,823) | 1,169 | $ (90,780) | $ 53,017 |
Annual Report
7. Share Transactions - continued
| Shares | Dollars |
Years ended July 31, | 2011 | 2010 | 2011 | 2010 |
Income Replacement 2020 | | | | |
Shares sold | 36,410 | 20,661 | $ 1,796,170 | $ 932,116 |
Reinvestment of distributions | 417 | 202 | 20,472 | 9,173 |
Shares redeemed | (23,522) | (10,998) | (1,171,587) | (493,006) |
Net increase (decrease) | 13,305 | 9,865 | $ 645,055 | $ 448,283 |
Institutional Class | | | | |
Shares sold | 397 | 996 | $ 20,000 | $ 45,000 |
Reinvestment of distributions | 23 | 25 | 1,132 | 1,133 |
Shares redeemed | (833) | (2,202) | (41,702) | (99,518) |
Net increase (decrease) | (413) | (1,181) | $ (20,570) | $ (53,385) |
Fidelity Income Replacement 2022 Fund | | | | |
Class A | | | | |
Shares sold | 567 | - | $ 27,240 | $ - |
Reinvestment of distributions | 15 | 8 | 735 | 338 |
Shares redeemed | (67) | (2,006) | (3,203) | (84,777) |
Net increase (decrease) | 515 | (1,998) | $ 24,772 | $ (84,439) |
Class T | | | | |
Shares sold | - | 1,105 | $ - | $ 48,498 |
Reinvestment of distributions | 15 | 31 | 718 | 1,374 |
Shares redeemed | (1,248) | (2,115) | (61,978) | (94,162) |
Net increase (decrease) | (1,233) | (979) | $ (61,260) | $ (44,290) |
Class C | | | | |
Shares sold | - | - | $ - | $ - |
Reinvestment of distributions | 4 | 14 | 172 | 640 |
Shares redeemed | (319) | (699) | (15,279) | (31,230) |
Net increase (decrease) | (315) | (685) | $ (15,107) | $ (30,590) |
Income Replacement 2022 | | | | |
Shares sold | 23,188 | 9,043 | $ 1,142,442 | $ 391,098 |
Reinvestment of distributions | 293 | 462 | 14,318 | 20,398 |
Shares redeemed | (10,448) | (13,142) | (520,826) | (587,330) |
Net increase (decrease) | 13,033 | (3,637) | $ 635,934 | $ (175,834) |
Institutional Class | | | | |
Shares sold | - | - | $ - | $ - |
Reinvestment of distributions | 2 | 4 | 103 | 166 |
Shares redeemed | (37) | (3,867) | (1,783) | (173,132) |
Net increase (decrease) | (35) | (3,863) | $ (1,680) | $ (172,966) |
Fidelity Income Replacement 2024 Fund | | | | |
Class A | | | | |
Shares sold | 117 | - | $ 5,864 | $ - |
Reinvestment of distributions | 86 | 108 | 4,191 | 4,833 |
Shares redeemed | (2,180) | (1,295) | (108,524) | (57,768) |
Net increase (decrease) | (1,977) | (1,187) | $ (98,469) | $ (52,935) |
Class T | | | | |
Shares sold | - | 295 | $ - | $ 13,015 |
Reinvestment of distributions | 17 | 27 | 851 | 1,197 |
Shares redeemed | (392) | (804) | (18,805) | (35,887) |
Net increase (decrease) | (375) | (482) | $ (17,954) | $ (21,675) |
Class C | | | | |
Shares sold | - | - | $ - | $ - |
Reinvestment of distributions | 19 | 19 | 922 | 835 |
Shares redeemed | (74) | (71) | (3,621) | (2,945) |
Net increase (decrease) | (55) | (52) | $ (2,699) | $ (2,110) |
Annual Report
Notes to Financial Statements - continued
7. Share Transactions - continued
| Shares | Dollars |
Years ended July 31, | 2011 | 2010 | 2011 | 2010 |
Income Replacement 2024 | | | | |
Shares sold | 9,431 | 9,741 | $ 469,295 | $ 422,106 |
Reinvestment of distributions | 156 | 143 | 7,661 | 6,430 |
Shares redeemed | (2,819) | (5,344) | (138,862) | (239,126) |
Net increase (decrease) | 6,768 | 4,540 | $ 338,094 | $ 189,410 |
Institutional Class | | | | |
Shares sold | - | - | $ - | $ - |
Reinvestment of distributions | 15 | 24 | 745 | 1,064 |
Shares redeemed | (268) | (580) | (12,871) | (25,832) |
Net increase (decrease) | (253) | (556) | $ (12,126) | $ (24,768) |
Fidelity Income Replacement 2026 Fund | | | | |
Class A | | | | |
Shares sold | 1,608 | - | $ 79,966 | $ - |
Reinvestment of distributions | 16 | 26 | 777 | 1,147 |
Shares redeemed | (434) | (713) | (20,829) | (31,427) |
Net increase (decrease) | 1,190 | (687) | $ 59,914 | $ (30,280) |
Class T | | | | |
Shares sold | 187 | 2,332 | $ 8,556 | $ 103,846 |
Reinvestment of distributions | 38 | 39 | 1,819 | 1,739 |
Shares redeemed | (172) | (1,146) | (7,742) | (50,896) |
Net increase (decrease) | 53 | 1,225 | $ 2,633 | $ 54,689 |
Class C | | | | |
Shares sold | - | - | $ - | $ - |
Reinvestment of distributions | 50 | 55 | 2,413 | 2,424 |
Shares redeemed | (206) | (653) | (9,967) | (29,483) |
Net increase (decrease) | (156) | (598) | $ (7,554) | $ (27,059) |
Income Replacement 2026 | | | | |
Shares sold | 24,011 | 11,631 | $ 1,180,279 | $ 516,873 |
Reinvestment of distributions | 233 | 139 | 11,328 | 6,162 |
Shares redeemed | (4,444) | (6,640) | (219,154) | (295,846) |
Net increase (decrease) | 19,800 | 5,130 | $ 972,453 | $ 227,189 |
Institutional Class | | | | |
Shares sold | - | - | $ - | $ - |
Reinvestment of distributions | 15 | 24 | 715 | 1,055 |
Shares redeemed | (269) | (581) | (12,796) | (25,621) |
Net increase (decrease) | (254) | (557) | $ (12,081) | $ (24,566) |
Fidelity Income Replacement 2028 Fund | | | | |
Class A | | | | |
Shares sold | - | 1,688 | $ - | $ 71,316 |
Reinvestment of distributions | 153 | 161 | 7,443 | 7,159 |
Shares redeemed | (5,420) | (672) | (273,625) | (29,955) |
Net increase (decrease) | (5,267) | 1,177 | $ (266,182) | $ 48,520 |
Class T | | | | |
Shares sold | - | - | $ - | $ - |
Reinvestment of distributions | 24 | 46 | 1,194 | 2,069 |
Shares redeemed | (4,677) | (340) | (209,519) | (15,095) |
Net increase (decrease) | (4,653) | (294) | $ (208,325) | $ (13,026) |
Class C | | | | |
Shares sold | - | - | $ - | $ - |
Reinvestment of distributions | 4 | 8 | 180 | 379 |
Shares redeemed | (148) | (965) | (7,212) | (42,703) |
Net increase (decrease) | (144) | (957) | $ (7,032) | $ (42,324) |
Income Replacement 2028 | | | | |
Shares sold | 9,722 | 7,291 | $ 477,899 | $ 328,341 |
Reinvestment of distributions | 871 | 860 | 42,621 | 38,493 |
Shares redeemed | (13,911) | (26,019) | (676,445) | (1,168,445) |
Net increase (decrease) | (3,318) | (17,868) | $ (155,925) | $ (801,611) |
Annual Report
7. Share Transactions - continued
| Shares | Dollars |
Years ended July 31, | 2011 | 2010 | 2011 | 2010 |
Institutional Class | | | | |
Shares sold | - | - | $ - | $ - |
Reinvestment of distributions | 15 | 24 | 732 | 1,048 |
Shares redeemed | (266) | (575) | (12,757) | (25,500) |
Net increase (decrease) | (251) | (551) | $ (12,025) | $ (24,452) |
Fidelity Income Replacement 2030 Fund | | | | |
Class A | | | | |
Shares sold | 534 | 1,608 | $ 26,388 | $ 70,708 |
Reinvestment of distributions | 10 | 22 | 506 | 972 |
Shares redeemed | (578) | (1,510) | (27,630) | (65,796) |
Net increase (decrease) | (34) | 120 | $ (736) | $ 5,884 |
Class T | | | | |
Shares sold | 130 | - | $ 6,467 | $ - |
Reinvestment of distributions | 4 | 14 | 177 | 632 |
Shares redeemed | (839) | (767) | (39,979) | (33,663) |
Net increase (decrease) | (705) | (753) | $ (33,335) | $ (33,031) |
Class C | | | | |
Shares sold | 2,512 | - | $ 125,006 | $ - |
Reinvestment of distributions | 56 | 47 | 2,702 | 2,094 |
Shares redeemed | (1,287) | (250) | (63,685) | (10,986) |
Net increase (decrease) | 1,281 | (203) | $ 64,023 | $ (8,892) |
Income Replacement 2030 | | | | |
Shares sold | 52,301 | 30,831 | $ 2,568,351 | $ 1,381,260 |
Reinvestment of distributions | 466 | 68 | 22,746 | 3,035 |
Shares redeemed | (9,315) | (1,995) | (455,782) | (90,075) |
Net increase (decrease) | 43,452 | 28,904 | $ 2,135,315 | $ 1,294,220 |
Institutional Class | | | | |
Shares sold | - | - | $ - | $ - |
Reinvestment of distributions | 14 | 22 | 702 | 982 |
Shares redeemed | (267) | (578) | (12,724) | (25,388) |
Net increase (decrease) | (253) | (556) | $ (12,022) | $ (24,406) |
Fidelity Income Replacement 2032 Fund | | | | |
Class A | | | | |
Shares sold | 1,251 | - | $ 61,087 | $ - |
Reinvestment of distributions | 92 | 93 | 4,419 | 4,047 |
Shares redeemed | (1,523) | (107) | (74,213) | (4,502) |
Net increase (decrease) | (180) | (14) | $ (8,707) | $ (455) |
Class T | | | | |
Shares sold | - | - | $ - | $ - |
Reinvestment of distributions | 12 | 19 | 557 | 838 |
Shares redeemed | (266) | (575) | (12,454) | (24,937) |
Net increase (decrease) | (254) | (556) | $ (11,897) | $ (24,099) |
Class C | | | | |
Shares sold | - | - | $ - | $ - |
Reinvestment of distributions | 7 | 12 | 333 | 502 |
Shares redeemed | (221) | (480) | (10,354) | (20,831) |
Net increase (decrease) | (214) | (468) | $ (10,021) | $ (20,329) |
Income Replacement 2032 | | | | |
Shares sold | 13,347 | 20,546 | $ 630,717 | $ 869,619 |
Reinvestment of distributions | 561 | 269 | 27,010 | 11,717 |
Shares redeemed | (18,955) | (21,297) | (922,796) | (886,611) |
Net increase (decrease) | (5,047) | (482) | $ (265,069) | $ (5,275) |
Institutional Class | | | | |
Shares sold | 550 | 565 | $ 25,000 | $ 25,000 |
Reinvestment of distributions | 11 | 25 | 530 | 1,078 |
Shares redeemed | (1,556) | (582) | (74,627) | (25,236) |
Net increase (decrease) | (995) | 8 | $ (49,097) | $ 842 |
Annual Report
Notes to Financial Statements - continued
7. Share Transactions - continued
| Shares | Dollars |
Years ended July 31, | 2011 | 2010 | 2011 | 2010 |
Fidelity Income Replacement 2034 Fund | | | | |
Class A | | | | |
Shares sold | - | - | $ - | $ - |
Reinvestment of distributions | 10 | 17 | 462 | 757 |
Shares redeemed | (199) | (984) | (9,387) | (41,642) |
Net increase (decrease) | (189) | (967) | $ (8,925) | $ (40,885) |
Class T | | | | |
Shares sold | - | - | $ - | $ - |
Reinvestment of distributions | 11 | 20 | 538 | 892 |
Shares redeemed | (263) | (569) | (12,373) | (24,737) |
Net increase (decrease) | (252) | (549) | $ (11,835) | $ (23,845) |
Class C | | | | |
Shares sold | - | - | $ - | $ - |
Reinvestment of distributions | 6 | 12 | 289 | 503 |
Shares redeemed | (199) | (434) | (9,399) | (18,880) |
Net increase (decrease) | (193) | (422) | $ (9,110) | $ (18,377) |
Income Replacement 2034 | | | | |
Shares sold | 15,037 | 5,032 | $ 741,550 | $ 225,749 |
Reinvestment of distributions | 308 | 383 | 14,854 | 16,703 |
Shares redeemed | (11,217) | (8,062) | (548,641) | (352,058) |
Net increase (decrease) | 4,128 | (2,647) | $ 207,763 | $ (109,606) |
Institutional Class | | | | |
Shares sold | - | - | $ - | $ - |
Reinvestment of distributions | 40 | 39 | 1,922 | 1,717 |
Shares redeemed | (4) | (586) | (220) | (25,063) |
Net increase (decrease) | 36 | (547) | $ 1,702 | $ (23,346) |
Fidelity Income Replacement 2036 Fund | | | | |
Class A | | | | |
Shares sold | 22 | 128 | $ 1,088 | $ 5,725 |
Reinvestment of distributions | 14 | 23 | 671 | 973 |
Shares redeemed | (305) | (600) | (14,218) | (25,767) |
Net increase (decrease) | (269) | (449) | $ (12,459) | $ (19,069) |
Class T | | | | |
Shares sold | 592 | 82 | $ 29,293 | $ 3,536 |
Reinvestment of distributions | 41 | 54 | 1,979 | 2,334 |
Shares redeemed | (810) | (756) | (39,495) | (33,710) |
Net increase (decrease) | (177) | (620) | $ (8,223) | $ (27,840) |
Class C | | | | |
Shares sold | 1,929 | 979 | $ 93,800 | $ 39,435 |
Reinvestment of distributions | 34 | 41 | 1,639 | 1,752 |
Shares redeemed | (264) | (1,217) | (12,450) | (52,088) |
Net increase (decrease) | 1,699 | (197) | $ 82,989 | $ (10,901) |
Income Replacement 2036 | | | | |
Shares sold | 36,939 | 2,159 | $ 1,794,635 | $ 86,419 |
Reinvestment of distributions | 302 | 99 | 14,515 | 4,266 |
Shares redeemed | (1,164) | (4,508) | (56,447) | (191,085) |
Net increase (decrease) | 36,077 | (2,250) | $ 1,752,703 | $ (100,400) |
Institutional Class | | | | |
Shares sold | 49 | 1,348 | $ 2,283 | $ 59,043 |
Reinvestment of distributions | 40 | 33 | 1,882 | 1,403 |
Shares redeemed | (1,881) | (723) | (90,082) | (31,039) |
Net increase (decrease) | (1,792) | 658 | $ (85,917) | $ 29,407 |
Annual Report
7. Share Transactions - continued
| Shares | Dollars |
Years ended July 31, | 2011 | 2010 | 2011 | 2010 |
Fidelity Income Replacement 2038 Fund | | | | |
Class A | | | | |
Shares sold | - | 667 | $ - | $ 28,000 |
Reinvestment of distributions | 15 | 24 | 700 | 996 |
Shares redeemed | (37) | (2,898) | (1,526) | (123,534) |
Net increase (decrease) | (22) | (2,207) | $ (826) | $ (94,538) |
Class T | | | | |
Shares sold | 2,160 | - | $ 103,818 | $ - |
Reinvestment of distributions | 13 | 21 | 597 | 896 |
Shares redeemed | (408) | (622) | (19,017) | (26,247) |
Net increase (decrease) | 1,765 | (601) | $ 85,398 | $ (25,351) |
Class C | | | | |
Shares sold | - | 1,458 | $ - | $ 65,000 |
Reinvestment of distributions | 22 | 18 | 1,058 | 774 |
Shares redeemed | (624) | (823) | (28,467) | (34,657) |
Net increase (decrease) | (602) | 653 | $ (27,409) | $ 31,117 |
Income Replacement 2038 | | | | |
Shares sold | 1,521 | 19,983 | $ 73,871 | $ 804,508 |
Reinvestment of distributions | 582 | 594 | 27,411 | 25,218 |
Shares redeemed | (21,894) | (2,784) | (1,042,929) | (118,526) |
Net increase (decrease) | (19,791) | 17,793 | $ (941,647) | $ 711,200 |
Institutional Class | | | | |
Shares sold | - | - | $ - | $ - |
Reinvestment of distributions | 16 | 27 | 773 | 1,151 |
Shares redeemed | (291) | (628) | (13,482) | (26,515) |
Net increase (decrease) | (275) | (601) | $ (12,709) | $ (25,364) |
Fidelity Income Replacement 2040 Fund | | | | |
Class A | | | | |
Shares sold | 2,779 | - | $ 131,112 | $ - |
Reinvestment of distributions | 26 | 21 | 1,246 | 909 |
Shares redeemed | (1,627) | (697) | (77,967) | (29,560) |
Net increase (decrease) | 1,178 | (676) | $ 54,391 | $ (28,651) |
Class T | | | | |
Shares sold | 59 | 766 | $ 2,795 | $ 32,205 |
Reinvestment of distributions | 50 | 44 | 2,356 | 1,859 |
Shares redeemed | (1) | (849) | (45) | (35,678) |
Net increase (decrease) | 108 | (39) | $ 5,106 | $ (1,614) |
Class C | | | | |
Shares sold | - | 1,585 | $ - | $ 67,225 |
Reinvestment of distributions | 26 | 14 | 1,220 | 599 |
Shares redeemed | (679) | (765) | (31,060) | (32,264) |
Net increase (decrease) | (653) | 834 | $ (29,840) | $ 35,560 |
Income Replacement 2040 | | | | |
Shares sold | 31,872 | 51,547 | $ 1,546,264 | $ 2,203,936 |
Reinvestment of distributions | 348 | 391 | 16,441 | 16,805 |
Shares redeemed | (24,432) | (32,503) | (1,181,522) | (1,366,427) |
Net increase (decrease) | 7,788 | 19,435 | $ 381,183 | $ 854,314 |
Institutional Class | | | | |
Shares sold | - | 857 | $ - | $ 35,012 |
Reinvestment of distributions | 27 | 39 | 1,291 | 1,633 |
Shares redeemed | (478) | (935) | (22,066) | (39,625) |
Net increase (decrease) | (451) | (39) | $ (20,775) | $ (2,980) |
Annual Report
Notes to Financial Statements - continued
7. Share Transactions - continued
| Shares | Dollars |
Years ended July 31, | 2011 | 2010 | 2011 | 2010 |
Fidelity Income Replacement 2042 Fund | | | | |
Class A | | | | |
Shares sold | 427 | 1,685 | $ 20,347 | $ 72,288 |
Reinvestment of distributions | 11 | 36 | 533 | 1,552 |
Shares redeemed | (643) | (3,326) | (30,601) | (142,410) |
Net increase (decrease) | (205) | (1,605) | $ (9,721) | $ (68,570) |
Class T | | | | |
Shares sold | - | - | $ - | $ - |
Reinvestment of distributions | 13 | 19 | 597 | 808 |
Shares redeemed | (287) | (621) | (13,228) | (26,230) |
Net increase (decrease) | (274) | (602) | $ (12,631) | $ (25,422) |
Class C | | | | |
Shares sold | - | - | $ - | $ - |
Reinvestment of distributions | 9 | 13 | 438 | 562 |
Shares redeemed | (283) | (615) | (13,030) | (25,273) |
Net increase (decrease) | (274) | (602) | $ (12,592) | $ (24,711) |
Income Replacement 2042 | | | | |
Shares sold | 40,366 | 45,150 | $ 1,950,277 | $ 1,897,966 |
Reinvestment of distributions | 1,123 | 960 | 53,152 | 40,980 |
Shares redeemed | (6,501) | (3,141) | (305,462) | (134,772) |
Net increase (decrease) | 34,988 | 42,969 | $ 1,697,967 | $ 1,804,174 |
Institutional Class | | | | |
Shares sold | - | - | $ - | $ - |
Reinvestment of distributions | 16 | 25 | 777 | 1,066 |
Shares redeemed | (291) | (627) | (13,432) | (26,500) |
Net increase (decrease) | (275) | (602) | $ (12,655) | $ (25,434) |
8. Other.
The Funds' organizational documents provide former and current trustees and officers with a limited indemnification against liabilities arising in connection with the performance of their duties to the Funds. In the normal course of business, the Funds may also enter into contracts that provide general indemnifications. The Funds' maximum exposure under these arrangements is unknown as this would be dependent on future claims that may be made against the Funds. The risk of material loss from such claims is considered remote.
The Funds do not invest in the Underlying Funds for the purpose of exercising management or control; however, investments by the Fund within their principle investment strategies may represent a significant portion of the Underlying Fund's net assets. At the end of the period, the following Funds were the owners of record of 10% or more of the total outstanding shares of the Underlying Funds.
Fund | Fidelity
Income
Replacement 2016 Fund | Fidelity
Income
Replacement 2028 Fund | Fidelity
Income
Replacement 2042 Fund |
Fidelity Series Broad Market Opportunities Fund | 11% | 13% | 14% |
The Funds, in aggregate, were the owners of record of more than 20% of the total outstanding shares of the following Underlying Funds.
Fund | % of shares held |
Fidelity Series Broad Market Opportunities Fund | 100% |
Annual Report
Report of Independent Registered Public Accounting Firm
To the Trustees of Fidelity Income Fund and the Shareholders of Fidelity Income Replacement 2016 Fund, Fidelity Income Replacement 2018 Fund, Fidelity Income Replacement 2020 Fund, Fidelity Income Replacement 2022 Fund, Fidelity Income Replacement 2024 Fund, Fidelity Income Replacement 2026 Fund, Fidelity Income Replacement 2028 Fund, Fidelity Income Replacement 2030 Fund, Fidelity Income Replacement 2032 Fund, Fidelity Income Replacement 2034 Fund, Fidelity Income Replacement 2036 Fund, Fidelity Income Replacement 2038 Fund, Fidelity Income Replacement 2040 Fund and Fidelity Income Replacement 2042 Fund:
We have audited the accompanying statements of assets and liabilities of Fidelity Income Replacement 2016 Fund, Fidelity Income Replacement 2018 Fund, Fidelity Income Replacement 2020 Fund, Fidelity Income Replacement 2022 Fund, Fidelity Income Replacement 2024 Fund, Fidelity Income Replacement 2026 Fund, Fidelity Income Replacement 2028 Fund, Fidelity Income Replacement 2030 Fund, Fidelity Income Replacement 2032 Fund, Fidelity Income Replacement 2034 Fund, Fidelity Income Replacement 2036 Fund, Fidelity Income Replacement 2038 Fund, Fidelity Income Replacement 2040 Fund and Fidelity Income Replacement 2042 Fund (the Funds) are funds of Fidelity Income Fund (the trust), including the schedules of investments, as of July 31, 2011, and the related statements of operations for the year then ended, the statements of changes in net assets for each of the two years in the period then ended, and the financial highlights for each of the periods presented. These financial statements and financial highlights are the responsibility of the Funds' management. Our responsibility is to express an opinion on these financial statements and financial highlights based on our audits.
We conducted our audits in accordance with the standards of the Public Company Accounting Oversight Board (United States). Those standards require that we plan and perform the audit to obtain reasonable assurance about whether the financial statements and financial highlights are free of material misstatement. The Funds are not required to have, nor were we engaged to perform, an audit of its internal control over financial reporting. Our audits included consideration of internal control over financial reporting as a basis for designing audit procedures that are appropriate in the circumstances, but not for the purpose of expressing an opinion on the effectiveness of the Fund's internal control over financial reporting. Accordingly, we express no such opinion. An audit also includes examining, on a test basis, evidence supporting the amounts and disclosures in the financial statements, assessing the accounting principles used and significant estimates made by management, as well as evaluating the overall financial statement presentation. Our procedures included confirmation of securities owned as of July 31, 2011, by correspondence with the custodians and brokers; where replies were not received from brokers, we performed other auditing procedures. We believe that our audits provide a reasonable basis for our opinion.
In our opinion, the financial statements and financial highlights referred to above present fairly, in all material respects, the financial position of Fidelity Income Replacement 2016 Fund, Fidelity Income Replacement 2018 Fund, Fidelity Income Replacement 2020 Fund, Fidelity Income Replacement 2022 Fund, Fidelity Income Replacement 2024 Fund, Fidelity Income Replacement 2026 Fund, Fidelity Income Replacement 2028 Fund, Fidelity Income Replacement 2030 Fund, Fidelity Income Replacement 2032 Fund, Fidelity Income Replacement 2034 Fund, Fidelity Income Replacement 2036 Fund, Fidelity Income Replacement 2038 Fund, Fidelity Income Replacement 2040 Fund and Fidelity Income Replacement 2042 Fund as of July 31, 2011, the results of their operations for the year then ended, the changes in their net assets for each of the two years in the period then ended, and their financial highlights for each of the periods presented, in conformity with accounting principles generally accepted in the United States of America.
/s/ Deloitte & Touche LLP
DELOITTE & TOUCHE LLP
Boston, Massachusetts
September 21, 2011
Annual Report
The Trustees and executive officers of the trust and funds, as applicable, are listed below. The Board of Trustees governs each Fidelity Income Replacement Fund and is responsible for protecting the interests of shareholders. The Trustees are experienced executives who meet periodically throughout the year to oversee each Fidelity Income Replacement Fund's activities, review contractual arrangements with companies that provide services to each Fidelity Income Replacement Fund, oversee management of the risks associated with such activities and contractual arrangements, and review each Fidelity Income Replacement Fund's performance. If the interests of a Fidelity Income Replacement Fund and an underlying Fidelity fund were to diverge, a conflict of interest could arise and affect how the Trustees fulfill their fiduciary duties to the affected funds. Strategic Advisers has structured the Fidelity Income Replacement Funds to avoid these potential conflicts, although there may be situations where a conflict of interest is unavoidable. In such instances, Strategic Advisers and the Trustees would take reasonable steps to minimize and, if possible, eliminate the conflict. Except for James C. Curvey, each of the Trustees oversees 198 funds advised by FMR or an affiliate. Mr. Curvey oversees 419 funds advised by FMR or an affiliate.
The Trustees hold office without limit in time except that (a) any Trustee may resign; (b) any Trustee may be removed by written instrument, signed by at least two-thirds of the number of Trustees prior to such removal; (c) any Trustee who requests to be retired or who has become incapacitated by illness or injury may be retired by written instrument signed by a majority of the other Trustees; and (d) any Trustee may be removed at any special meeting of shareholders by a two-thirds vote of the outstanding voting securities of the trust. Each Trustee who is not an interested person (as defined in the 1940 Act) (Independent Trustee), shall retire not later than the last day of the calendar year in which his or her 75th birthday occurs. The Independent Trustees may waive this mandatory retirement age policy with respect to individual Trustees. The executive officers hold office without limit in time, except that any officer may resign or may be removed by a vote of a majority of the Trustees at any regular meeting or any special meeting of the Trustees. Except as indicated, each individual has held the office shown or other offices in the same company for the past five years.
Experience, Skills, Attributes, and Qualifications of the Funds' Trustees. The Governance and Nominating Committee has adopted a statement of policy that describes the experience, qualifications, attributes, and skills that are necessary and desirable for potential Independent Trustee candidates (Statement of Policy). The Board believes that each Trustee satisfied at the time he or she was initially elected or appointed a Trustee, and continues to satisfy, the standards contemplated by the Statement of Policy. The Governance and Nominating Committee also engages professional search firms to help identify potential Independent Trustee candidates who have the experience, qualifications, attributes, and skills consistent with the Statement of Policy. From time to time, additional criteria based on the composition and skills of the current Independent Trustees, as well as experience or skills that may be appropriate in light of future changes to board composition, business conditions, and regulatory or other developments, have also been considered by the professional search firms and the Governance and Nominating Committee. In addition, the Board takes into account the Trustees' commitment and participation in Board and committee meetings, as well as their leadership of standing and ad hoc committees throughout their tenure.
In determining that a particular Trustee was and continues to be qualified to serve as a Trustee, the Board has considered a variety of criteria, none of which, in isolation, was controlling. The Board believes that, collectively, the Trustees have balanced and diverse experience, qualifications, attributes, and skills, which allow the Board to operate effectively in governing each fund and protecting the interests of shareholders. Information about the specific experience, skills, attributes, and qualifications of each Trustee, which in each case led to the Board's conclusion that the Trustee should serve (or continue to serve) as a trustee of the funds, is provided below.
Board Structure and Oversight Function. Abigail P. Johnson is an interested person (as defined in the 1940 Act) and currently serves as Chairman. The Trustees have determined that an interested Chairman is appropriate and benefits shareholders because an interested Chairman has a personal and professional stake in the quality and continuity of services provided to the funds. Independent Trustees exercise their informed business judgment to appoint an individual of their choosing to serve as Chairman, regardless of whether the Trustee happens to be independent or a member of management. The Independent Trustees have determined that they can act independently and effectively without having an Independent Trustee serve as Chairman and that a key structural component for assuring that they are in a position to do so is for the Independent Trustees to constitute a substantial majority for the Board. The Independent Trustees also regularly meet in executive session. Kenneth L. Wolfe serves as Chairman of the Independent Trustees and as such (i) acts as a liaison between the Independent Trustees and management with respect to matters important to the Independent Trustees and (ii) with management prepares agendas for Board meetings.
Fidelity funds are overseen by different Boards of Trustees. The funds' Board oversees Fidelity's investment-grade bond, money market, and asset allocation funds and another Board oversees Fidelity's equity and high income funds. The asset allocation funds may invest in Fidelity funds that are overseen by such other Board. The use of separate Boards, each with its own committee structure, allows the Trustees of each group of Fidelity funds to focus on the unique issues of the funds they oversee, including common research, investment, and operational issues. On occasion, the separate Boards establish joint committees to address issues of overlapping consequences for the Fidelity funds overseen by each Board.
The Trustees operate using a system of committees to facilitate the timely and efficient consideration of all matters of importance to the Trustees, each fund, and fund shareholders and to facilitate compliance with legal and regulatory requirements and oversight of the funds' activities and associated risks. The Board, acting through its committees, has charged FMR and its affiliates with (i) identifying events or circumstances the occurrence of which could have demonstrably adverse effects on the funds' business and/or reputation; (ii) implementing processes and controls to lessen the possibility that such events or circumstances occur or to mitigate the effects of such events or circumstances if they do occur; and (iii) creating and maintaining a system designed to evaluate continuously business and market conditions in order to facilitate the identification and implementation processes described in (i) and (ii) above. Because the day-to-day operations and activities of the funds are carried out by or through FMR, its affiliates and other service providers, the funds' exposure to risks is mitigated but not eliminated by the processes overseen by the Trustees. While each of the Board's committees has responsibility for overseeing different aspects of the funds' activities, oversight is exercised primarily through the Operations and Audit Committees. Appropriate personnel, including but not limited to the funds' Chief Compliance Officer (CCO), FMR's internal auditor, the independent accountants, the funds' Treasurer and portfolio management personnel, make periodic reports to the Board's committees, as appropriate. The responsibilities of each committee, including their oversight responsibilities, are described further under "Standing Committees of the Funds' Trustees."
Annual Report
Trustees and Officers - continued
The funds' Statement of Additional Information (SAI) includes more information about the Trustees. To request a free copy, call Fidelity at 1-800-544-8544.
Interested Trustees*:
Correspondence intended for each Trustee who is an interested person may be sent to Fidelity Investments, 82 Devonshire Street, Boston, Massachusetts 02109.
Name, Age; Principal Occupations and Other Relevant Experience+ |
Abigail P. Johnson (49) |
| Year of Election or Appointment: 2009 Ms. Johnson is Trustee and Chairman of the Board of Trustees of certain Trusts. Ms. Johnson serves as President of Personal, Workplace and Institutional Services (2005-present). Ms. Johnson is Chairman and Director of FMR Co., Inc. (2011-present), Chairman and Director of FMR (2011-present), and the Vice Chairman and Director (2007-present) of FMR LLC. Previously, Ms. Johnson served as President and a Director of FMR (2001-2005), a Trustee of other investment companies advised by FMR, Fidelity Investments Money Management, Inc., and FMR Co., Inc. (2001-2005), Senior Vice President of the Fidelity funds (2001-2005), and managed a number of Fidelity funds. Ms. Abigail P. Johnson and Mr. Arthur E. Johnson are not related. |
James C. Curvey (76) |
| Year of Election or Appointment: 2007 Mr. Curvey also serves as Trustee (2007-present) of other investment companies advised by FMR. Mr. Curvey is a Director of Fidelity Investments Money Management, Inc. (2009-present), Director of Fidelity Research & Analysis Co. (2009-present) and Director of FMR and FMR Co., Inc. (2007-present). Mr. Curvey is also Vice Chairman (2007-present) and Director of FMR LLC. In addition, Mr. Curvey serves as an Overseer for the Boston Symphony Orchestra and a member of the Trustees of Villanova University. Previously, Mr. Curvey was the Vice Chairman (2006-2007) and Director (2000-2007) of FMR Corp. |
* Trustees have been determined to be "Interested Trustees" by virtue of, among other things, their affiliation with the trust or various entities under common control with FMR.
+ The information above includes each Trustee's principal occupation during the last five years and other information relating to the experience, attributes, and skills relevant to each Trustee's qualifications to serve as a Trustee, which led to the conclusion that each Trustee should serve as a Trustee for each fund.
Independent Trustees:
Correspondence intended for each Independent Trustee (that is, the Trustees other than the Interested Trustees) may be sent to Fidelity Investments, P.O. Box 55235, Boston, Massachusetts 02205-5235.
Name, Age; Principal Occupations and Other Relevant Experience+ |
Albert R. Gamper, Jr. (69) |
| Year of Election or Appointment: 2006 Mr. Gamper is Vice Chairman of the Independent Trustees of the Fixed Income and Asset Allocation Funds (2011-present). Prior to his retirement in December 2004, Mr. Gamper served as Chairman of the Board of CIT Group Inc. (commercial finance). During his tenure with CIT Group Inc. Mr. Gamper served in numerous senior management positions, including Chairman (1987-1989; 1999-2001; 2002-2004), Chief Executive Officer (1987-2004), and President (2002-2003). He also served as President and Chief Executive Officer of Tyco Capital Corporation (2001-2002). Mr. Gamper currently serves as a member of the Board of Directors of Public Service Enterprise Group (utilities, 2000-present), a member of the Board of Trustees, Rutgers University (2004-present), and Chairman of the Board of Saint Barnabas Health Care System. Previously, Mr. Gamper served as Chairman of the Board of Governors, Rutgers University (2004-2007). |
Robert F. Gartland (59) |
| Year of Election or Appointment: 2010 Mr. Gartland is a partner and investor of Vietnam Partners LLC (investments and consulting, 2008-present) and is Chairman and an investor in Gartland and Mellina Group Corp. (consulting, 2009-present). Prior to his retirement, Mr. Gartland held a variety of positions at Morgan Stanley (financial services, 1979-2007) including Managing Director (1987-2007). |
Arthur E. Johnson (64) |
| Year of Election or Appointment: 2008 Mr. Johnson serves as a member of the Board of Directors of Eaton Corporation (diversified power management, 2009-present) and AGL Resources, Inc. (holding company). Prior to his retirement, Mr. Johnson served as Senior Vice President of Corporate Strategic Development of Lockheed Martin Corporation (defense contractor, 1999-2009). He previously served on the Board of Directors of IKON Office Solutions, Inc. (1999-2008) and Delta Airlines (2005-2007). Mr. Arthur E. Johnson and Ms. Abigail P. Johnson are not related. |
Michael E. Kenneally (57) |
| Year of Election or Appointment: 2009 Previously, Mr. Kenneally served as a Member of the Advisory Board for certain Fidelity Fixed Income and Asset Allocation Funds (2008-2009). Prior to his retirement, Mr. Kenneally served as Chairman and Global Chief Executive Officer of Credit Suisse Asset Management (2003-2005). Mr. Kenneally was a Director of the Credit Suisse Funds (U.S. mutual funds, 2004-2008) and certain other closed-end funds (2004-2005) and was awarded the Chartered Financial Analyst (CFA) designation in 1991. |
James H. Keyes (70) |
| Year of Election or Appointment: 2007 Mr. Keyes serves as a member of the Boards of Navistar International Corporation (manufacture and sale of trucks, buses, and diesel engines, since 2002) and Pitney Bowes, Inc. (integrated mail, messaging, and document management solutions, since 1998). Prior to his retirement, Mr. Keyes served as Chairman and Chief Executive Officer of Johnson Controls (automotive, building, and energy, 1998-2002) and as a member of the Board of LSI Logic Corporation (semiconductor technologies, 1984-2008). |
Marie L. Knowles (64) |
| Year of Election or Appointment: 2001 Prior to Ms. Knowles' retirement in June 2000, she served as Executive Vice President and Chief Financial Officer of Atlantic Richfield Company (ARCO) (diversified energy, 1996-2000). From 1993 to 1996, she was a Senior Vice President of ARCO and President of ARCO Transportation Company. She served as a Director of ARCO from 1996 to 1998. Ms. Knowles currently serves as a Director and Chairman of the Audit Committee of McKesson Corporation (healthcare service, since 2002). Ms. Knowles is an Honorary Trustee of the Brookings Institution and a member of the Board of the Catalina Island Conservancy and of the Santa Catalina Island Company (2009-present). She also serves as a member of the Advisory Board for the School of Engineering of the University of Southern California and the Foundation Board of the School of Architecture at the University of Virginia (2007-present). Previously, Ms. Knowles served as a Director of Phelps Dodge Corporation (copper mining and manufacturing, 1994-2007). |
Kenneth L. Wolfe (72) |
| Year of Election or Appointment: 2005 Mr. Wolfe is Chairman of the Independent Trustees of the Fixed Income and Asset Allocation Funds (2008-present). Prior to his retirement, Mr. Wolfe served as Chairman and a Director (2007-2009) and Chairman and Chief Executive Officer (1994-2001) of Hershey Foods Corporation. He also served as a member of the Boards of Adelphia Communications Corporation (telecommunications, 2003-2006), Bausch & Lomb, Inc. (medical/pharmaceutical, 1993-2007), and Revlon, Inc. (personal care products, 2004-2009). |
+ The information above includes each Trustee's principal occupation during the last five years and other information relating to the experience, attributes, and skills relevant to each Trustee's qualifications to serve as a Trustee, which led to the conclusion that each Trustee should serve as a Trustee for each fund.
Executive Officers:
Correspondence intended for each executive officer may be sent to Fidelity Investments, 82 Devonshire Street, Boston, Massachusetts 02109.
Name, Age; Principal Occupation |
John R. Hebble (53) |
| Year of Election or Appointment: 2008 President and Treasurer of Fidelity's Fixed Income and Asset Allocation Funds. Mr. Hebble also serves as President (2011-present), Treasurer, and Chief Financial Officer of The North Carolina Capital Management Trust: Cash and Term Portfolios (2008-present), Assistant Treasurer of other Fidelity funds (2009-present) and is an employee of Fidelity Investments. |
Derek L. Young (46) |
| Year of Election or Appointment: 2009 Vice President of Fidelity's Asset Allocation Funds. Mr. Young also serves as Chief Investment Officer of the Global Asset Allocation Group (2009-present). Previously, Mr. Young served as a portfolio manager. |
Scott C. Goebel (43) |
| Year of Election or Appointment: 2008 Secretary and Chief Legal Officer (CLO) of the Fidelity funds. Mr. Goebel also serves as Secretary of Fidelity Investments Money Management, Inc. (FIMM) (2010-present) and Fidelity Research and Analysis Company (FRAC) (2010-present); Secretary and CLO of The North Carolina Capital Management Trust: Cash and Term Portfolios (2008-present); General Counsel, Secretary, and Senior Vice President of FMR (2008-present) and FMR Co., Inc. (2008-present); employed by FMR LLC or an affiliate (2001-present); Chief Legal Officer of Fidelity Management & Research (Hong Kong) Limited (2008-present) and Assistant Secretary of Fidelity Management & Research (Japan) Inc. (2008-present), and Fidelity Management & Research (U.K.) Inc. (2008-present). Previously, Mr. Goebel served as Assistant Secretary of FIMM (2008-2010), FRAC (2008-2010), and the Funds (2007-2008) and as Vice President and Secretary of Fidelity Distributors Corporation (FDC) (2005-2007). |
David J. Carter (38) |
| Year of Election or Appointment: 2010 Assistant Secretary of Fidelity's Fixed Income and Asset Allocation Funds. Mr. Carter also serves as Vice President, Associate General Counsel (2010-present) and is an employee of Fidelity Investments (2005-present). |
Holly C. Laurent (57) |
| Year of Election or Appointment: 2008 Anti-Money Laundering (AML) Officer of the Fidelity funds. Ms. Laurent also serves as AML Officer of The North Carolina Capital Management Trust: Cash and Term Portfolios (2008-present) and is an employee of Fidelity Investments. Previously, Ms. Laurent was Senior Vice President and Head of Legal for Fidelity Business Services India Pvt. Ltd. (2006-2008), and Senior Vice President, Deputy General Counsel and Group Head for FMR LLC (2005-2006). |
Christine Reynolds (52) |
| Year of Election or Appointment: 2008 Chief Financial Officer of the Fidelity funds. Ms. Reynolds became President of Fidelity Pricing and Cash Management Services (FPCMS) in August 2008. Ms. Reynolds served as Chief Operating Officer of FPCMS (2007-2008). Previously, Ms. Reynolds served as President, Treasurer, and Anti-Money Laundering officer of the Fidelity funds (2004-2007). |
Michael H. Whitaker (44) |
| Year of Election or Appointment: 2008 Chief Compliance Officer of Fidelity's Fixed Income and Asset Allocation Funds. Mr. Whitaker also serves as Chief Compliance Officer of The North Carolina Capital Management Trust: Cash and Term Portfolios (2008-present). Mr. Whitaker is an employee of Fidelity Investments (2007-present). Prior to joining Fidelity Investments, Mr. Whitaker worked at MFS Investment Management where he served as Senior Vice President and Chief Compliance Officer (2004-2006), and Assistant General Counsel. |
Jeffrey S. Christian (49) |
| Year of Election or Appointment: 2009 Deputy Treasurer of the Fidelity funds. Mr. Christian is an employee of Fidelity Investments. Previously, Mr. Christian served as Chief Financial Officer (2008-2009) of certain Fidelity funds and Senior Vice President of Fidelity Pricing and Cash Management Services (FPCMS) (2004-2009). |
Bryan A. Mehrmann (50) |
| Year of Election or Appointment: 2005 Deputy Treasurer of the Fidelity funds. Mr. Mehrmann is an employee of Fidelity Investments. |
Stephanie J. Dorsey (42) |
| Year of Election or Appointment: 2008 Deputy Treasurer of Fidelity's Fixed Income and Asset Allocation Funds. Ms. Dorsey also serves as Assistant Treasurer of other Fidelity funds (2010-present) and is an employee of Fidelity Investments (2008-present). Previously, Ms. Dorsey served as Treasurer (2004-2008) of the JPMorgan Mutual Funds and Vice President (2004-2008) of JPMorgan Chase Bank. |
Adrien E. Deberghes (43) |
| Year of Election or Appointment: 2010 Assistant Treasurer of Fidelity's Fixed Income and Asset Allocation Funds. Mr. Deberghes also serves as Deputy Treasurer of other Fidelity funds (2008-present) and is an employee of Fidelity Investments (2008-present). Previously, Mr. Deberghes served as Senior Vice President of Mutual Fund Administration at State Street Corporation (2007-2008), Senior Director of Mutual Fund Administration at Investors Bank & Trust (2005-2007), and Director of Finance for Dunkin' Brands (2000-2005). |
Kenneth B. Robins (41) |
| Year of Election or Appointment: 2009 Assistant Treasurer of the Fidelity Fixed Income and Asset Allocation Funds. Mr. Robins also serves as President and Treasurer of other Fidelity funds (2008-present; 2010-present) and is an employee of Fidelity Investments (2004-present). Previously, Mr. Robins served as Deputy Treasurer of the Fidelity funds (2005-2008) and Treasurer and Chief Financial Officer of The North Carolina Capital Management Trust: Cash and Term Portfolios (2006-2008). |
Gary W. Ryan (52) |
| Year of Election or Appointment: 2005 Assistant Treasurer of the Fidelity funds. Mr. Ryan is an employee of Fidelity Investments. Previously, Mr. Ryan served as Vice President of Fund Reporting in Fidelity Pricing and Cash Management Services (FPCMS) (1999-2005). |
Jonathan Davis (43) |
| Year of Election or Appointment: 2010 Assistant Treasurer of the Fidelity funds. Mr. Davis is an employee of Fidelity Investments. Previously, Mr. Davis served as Vice President and Associate General Counsel of FMR LLC (2003-2010). |
Annual Report
A percentage of the dividends distributed during the fiscal year for the following funds were derived from interest on U.S. Government securities which is generally exempt from state income tax:
Fund |
|
Income Replacement 2016 | 10.66% |
Income Replacement 2018 | 9.57% |
Income Replacement 2020 | 9.16% |
Income Replacement 2022 | 8.70% |
Income Replacement 2024 | 8.26% |
Income Replacement 2026 | 8.55% |
Income Replacement 2028 | 7.60% |
Income Replacement 2030 | 7.54% |
Income Replacement 2032 | 6.99% |
Income Replacement 2034 | 6.96% |
Income Replacement 2036 | 6.72% |
Income Replacement 2038 | 5.96% |
Income Replacement 2040 | 6.33% |
Income Replacement 2042 | 6.54% |
A percentage of the dividends distributed during the fiscal year for the following funds may be taken into account as a dividend for purposes of the maximum rate under section 1(h)(11) of the Internal Revenue Code.
| Retail Class |
Income Replacement 2016 | |
August 2010 | 11% |
September 2010 | 17% |
October 2010 | 17% |
November 2010 | 16% |
December 2010 (Ex-Date 12/22/10) | 19% |
December 2010 (Ex-Date 12/30/10) | 18% |
January 2011 | 4% |
February 2011 | 4% |
March 2011 | 4% |
April 2011 | 4% |
May 2011 | 4% |
June 2011 | 4% |
July 2011 | 5% |
| Retail Class |
Income Replacement 2018 | |
August 2010 | 14% |
September 2010 | 22% |
October 2010 | 23% |
November 2010 | 22% |
December 2010 (Ex-Date 12/22/10) | 24% |
December 2010 (Ex-Date 12/30/10) | 23% |
January 2011 | 6% |
February 2011 | 5% |
March 2011 | 6% |
April 2011 | 6% |
May 2011 | 6% |
June 2011 | 6% |
July 2011 | 6% |
| Retail Class |
Income Replacement 2020 | |
August 2010 | 15% |
September 2010 | 26% |
October 2010 | 27% |
November 2010 | 26% |
December 2010 (Ex-Date 12/22/10) | 29% |
December 2010 (Ex-Date 12/30/10) | 28% |
January 2011 | 7% |
February 2011 | 7% |
March 2011 | 7% |
April 2011 | 7% |
May 2011 | 7% |
June 2011 | 7% |
July 2011 | 7% |
| Retail Class |
Income Replacement 2022 | |
August 2010 | 18% |
September 2010 | 31% |
October 2010 | 31% |
November 2010 | 31% |
December 2010 (Ex-Date 12/22/10) | 32% |
December 2010 (Ex-Date 12/30/10) | 32% |
January 2011 | 8% |
February 2011 | 8% |
March 2011 | 8% |
April 2011 | 8% |
May 2011 | 8% |
June 2011 | 8% |
July 2011 | 8% |
| Retail Class |
Income Replacement 2024 | |
August 2010 | 15% |
September 2010 | 31% |
October 2010 | 32% |
November 2010 | 32% |
December 2010 (Ex-Date 12/22/10) | 35% |
December 2010 (Ex-Date 12/30/10) | 34% |
January 2011 | 9% |
February 2011 | 9% |
March 2011 | 9% |
April 2011 | 9% |
May 2011 | 9% |
June 2011 | 9% |
July 2011 | 9% |
| Retail Class |
Income Replacement 2026 | |
August 2010 | 15% |
September 2010 | 33% |
October 2010 | 33% |
November 2010 | 34% |
December 2010 (Ex-Date 12/22/10) | 38% |
December 2010 (Ex-Date 12/30/10) | 36% |
January 2011 | 10% |
February 2011 | 10% |
March 2011 | 10% |
April 2011 | 10% |
May 2011 | 11% |
June 2011 | 10% |
July 2011 | 10% |
| Retail Class |
Income Replacement 2028 | |
August 2010 | 20% |
September 2010 | 36% |
October 2010 | 36% |
November 2010 | 36% |
December 2010 (Ex-Date 12/22/10) | 37% |
December 2010 (Ex-Date 12/30/10) | 37% |
January 2011 | 10% |
February 2011 | 10% |
March 2011 | 10% |
April 2011 | 10% |
May 2011 | 10% |
June 2011 | 10% |
July 2011 | 10% |
| Retail Class |
Income Replacement 2030 | |
August 2010 | 20% |
September 2010 | 40% |
October 2010 | 40% |
November 2010 | 41% |
December 2010 (Ex-Date 12/22/10) | 42% |
December 2010 (Ex-Date 12/30/10) | 41% |
January 2011 | 11% |
February 2011 | 11% |
March 2011 | 10% |
April 2011 | 11% |
May 2011 | 10% |
June 2011 | 11% |
July 2011 | 11% |
| Retail Class |
Income Replacement 2032 | |
August 2010 | 23% |
September 2010 | 39% |
October 2010 | 40% |
November 2010 | 40% |
December 2010 (Ex-Date 12/22/10) | 41% |
December 2010 (Ex-Date 12/30/10) | 41% |
January 2011 | 9% |
February 2011 | 9% |
March 2011 | 9% |
April 2011 | 9% |
May 2011 | 9% |
June 2011 | 9% |
July 2011 | 9% |
| Retail Class |
Income Replacement 2034 | |
August 2010 | 19% |
September 2010 | 41% |
October 2010 | 41% |
November 2010 | 41% |
December 2010 (Ex-Date 12/22/10) | 41% |
December 2010 (Ex-Date 12/30/10) | 41% |
January 2011 | 10% |
February 2011 | 10% |
March 2011 | 10% |
April 2011 | 10% |
May 2011 | 10% |
June 2011 | 11% |
July 2011 | 11% |
| Retail Class |
Income Replacement 2036 | |
August 2010 | 17% |
September 2010 | 42% |
October 2010 | 43% |
November 2010 | 46% |
December 2010 (Ex-Date 12/22/10) | 49% |
December 2010 (Ex-Date 12/30/10) | 48% |
January 2011 | 12% |
February 2011 | 12% |
March 2011 | 11% |
April 2011 | 12% |
May 2011 | 12% |
June 2011 | 11% |
July 2011 | 12% |
| Retail Class |
Income Replacement 2038 | |
August 2010 | 20% |
September 2010 | 43% |
October 2010 | 43% |
November 2010 | 43% |
December 2010 (Ex-Date 12/22/10) | 44% |
December 2010 (Ex-Date 12/30/10) | 44% |
January 2011 | 11% |
February 2011 | 11% |
March 2011 | 11% |
April 2011 | 11% |
May 2011 | 11% |
June 2011 | 11% |
July 2011 | 11% |
| Retail Class |
Income Replacement 2040 | |
August 2010 | 17% |
September 2010 | 44% |
October 2010 | 43% |
November 2010 | 44% |
December 2010 (Ex-Date 12/22/10) | 46% |
December 2010 (Ex-Date 12/30/10) | 45% |
January 2011 | 11% |
February 2011 | 11% |
March 2011 | 11% |
April 2011 | 11% |
May 2011 | 11% |
June 2011 | 11% |
July 2011 | 11% |
| Retail Class |
Income Replacement 2042 | |
August 2010 | 25% |
September 2010 | 45% |
October 2010 | 45% |
November 2010 | 45% |
December 2010 (Ex-Date 12/22/10) | 45% |
December 2010 (Ex-Date 12/30/10) | 45% |
January 2011 | 13% |
February 2011 | 13% |
March 2011 | 13% |
April 2011 | 13% |
May 2011 | 13% |
June 2011 | 13% |
July 2011 | 13% |
The fund will notify shareholders in January 2012 of amounts for use in preparing 2011 income tax returns.
Annual Report
Managing Your Investments
Fidelity offers several ways to conveniently manage your personal investments via your telephone or PC. You can access your account information, conduct trades and research your investments 24 hours a day.
By Phone
Fidelity Automated Service Telephone provides a single toll-free number to access account balances, positions, quotes and trading. It's easy to navigate the service, and on your first call, the system will help you create a personal identification number (PIN) for security.
(phone_graphic)
Fidelity Automated Service Telephone (FAST®)
1-800-544-5555
Press
For mutual fund and brokerage trading.
For quotes.*
For account balances and holdings.
To review orders and mutual fund activity.
To change your PIN.
To speak to a Fidelity representative.
By PC
Fidelity's web site on the Internet provides a wide range of information, including daily financial news, fund performance, interactive planning tools and news about Fidelity products and services.
(computer_graphic)
Fidelity's Web Site
www.fidelity.com
* When you call the quotes line, please remember that a fund's yield and return will vary and, except for money market funds, share price will also vary. This means that you may have a gain or loss when you sell your shares. There is no assurance that money market funds will be able to maintain a stable $1 share price; an investment in a money market fund is not insured or guaranteed by the U.S. government. Total returns are historical and include changes in share price, reinvestment of dividends and capital gains distributions, and the effects of any sales charges.
Annual Report
To Write Fidelity
We'll give your correspondence immediate attention and send you written confirmation upon completion of your request.
(letter_graphic)
Making Changes
To Your Account
(such as changing name, address, bank, etc.)
Fidelity Investments
P.O. Box 770001
Cincinnati, OH 45277-0002
(letter_graphic)
For Non-Retirement
Accounts
Buying shares
Fidelity Investments
P.O. Box 770001
Cincinnati, OH 45277-0003
Overnight Express
Fidelity Investments
Attn: Distribution Services
100 Crosby Parkway - KC1H
Covington, KY 41015
Selling shares
Fidelity Investments
P.O. Box 770001
Cincinnati, OH 45277-0035
Overnight Express
Fidelity Investments
Attn: Distribution Services
100 Crosby Parkway - KC1H
Covington, KY 41015
General Correspondence
Fidelity Investments
P.O. Box 500
Merrimack, NH 03054-0500
(letter_graphic)
For Retirement
Accounts
Buying shares
Fidelity Investments
P.O. Box 770001
Cincinnati, OH 45277-0003
Selling shares
Fidelity Investments
P.O. Box 770001
Cincinnati, OH 45277-0035
Overnight Express
Fidelity Investments
Attn: Distribution Services
100 Crosby Parkway - KC1H
Covington, KY 41015
General Correspondence
Fidelity Investments
P.O. Box 500
Merrimack, NH 03054-0500
Annual Report
Investment Adviser
Strategic Advisers, Inc.
Boston, MA
General Distributor
Fidelity Distributors Corporation
Boston, MA
Transfer and Service Agents
Fidelity Investments Institutional Operations Company, Inc.
Boston, MA
Fidelity Service Company, Inc.
Boston, MA
Custodian
The Bank of New York Mellon
New York, NY
The Fidelity Telephone Connection
Mutual Fund 24-Hour Service
Exchanges/Redemptions
and Account Assistance 1-800-544-6666
Product Information 1-800-544-6666
Retirement Accounts 1-800-544-4774
(8 a.m. - 9 p.m.)
TDD Service 1-800-544-0118
for the deaf and hearing impaired
(9 a.m. - 9 p.m. Eastern time)
Fidelity Automated Service
Telephone (FAST®)
1-800-544-5555
Automated line for quickest service
RW-UANN-0911
1.848174.103
Fidelity Advisor Income Replacement FundsSM -
2016, 2018, 2020, 2022, 2024, 2026, 2028, 2030, 2032,
2034, 2036, 2038, 2040, 2042 -
Class A, Class T, and Class C
Annual Report
July 31, 2011
Each Class A, Class T, and Class C are
classes of Fidelity Income Replacement FundsSM
(2_fidelity_logos) (Registered_Trademark)
Contents
This report and the financial statements contained herein are submitted for the general information of the shareholders of the funds. This report is not authorized for distribution to prospective investors in the funds unless preceded or accompanied by an effective prospectus.
A fund files its complete schedule of portfolio holdings with the SEC for the first and third quarters of each fiscal year on Form N-Q. Forms N-Q are available on the SEC's web site at http://www.sec.gov. A fund's Forms N-Q may be reviewed and copied at the SEC's Public Reference Room in Washington, DC. Information regarding the operation of the SEC's Public Reference Room may be obtained by calling 1-800-SEC-0330. For a complete list of a fund's portfolio holdings, view the most recent quarterly holdings listing, semiannual report, or annual report on Fidelity's web site at http://www.fidelity.com, http://www.advisor.fidelity.com, or http://www.401k.com, as applicable.
NOT FDIC INSURED • MAY LOSE VALUE • NO BANK GUARANTEE
Neither the funds nor Fidelity Distributors Corporation is a bank.
To view a fund's proxy voting guidelines and proxy voting record for the 12-month period ended June 30, visit http://www.fidelity.com/proxyvotingresults or visit the Securities and Exchange Commission's (SEC) web site at http://www.sec.gov. You may also call 1-877-208-0098 to request a free copy of the proxy voting guidelines.
Standard & Poor's, S&P and S&P 500 are registered service marks of The McGraw-Hill Companies, Inc. and have been licensed for use by Fidelity Distributors Corporation.
Other third party marks appearing herein are the property of their respective owners.
All other marks appearing herein are registered or unregistered trademarks or service marks of FMR LLC or an affiliated company.
Annual Report
(photo_of_Abigail_P_Johnson)
Dear Shareholder:
The second half of 2011 began with U.S. equities continuing to give back some of the gains achieved earlier in the year. In the days leading up to July 31, markets were shaken by a political stalemate in which Congress struggled to address the debt ceiling issue before an early-August deadline. The resulting uncertainty held back markets in July, the third consecutive monthly decline for equities, effectively reversing the positive momentum seen through the end of April. Financial markets are always unpredictable, of course, but there are several time-tested investment principles that can help put the odds in your favor.
One of the basic tenets is to invest for the long term. Over time, riding out the markets' inevitable ups and downs has proven much more effective than selling into panic or chasing the hottest trend. Even missing only a few of the markets' best days can significantly diminish investor returns. Patience also affords the benefits of compounding - of earning interest on additional income or reinvested dividends and capital gains. There can be tax advantages and cost benefits to consider as well. While staying the course doesn't eliminate risk, it can considerably lessen the effect of short-term declines.
You can further manage your investing risk through diversification. And today, more than ever, geographic diversification should be taken into account. Studies indicate that asset allocation is the single most important determinant of a portfolio's long-term success. The right mix of stocks, bonds and cash - aligned to your particular risk tolerance and investment objective - is very important. Age-appropriate rebalancing is also an essential aspect of asset allocation. For younger investors, an emphasis on equities - which historically have been the best-performing asset class over time - is encouraged. As investors near their specific goal, such as retirement or sending a child to college, consideration may be given to replacing volatile assets (e.g. common stocks) with more-stable fixed investments (bonds or savings plans).
A third principle - investing regularly - can help lower the average cost of your purchases. Investing a certain amount of money each month or quarter helps ensure you won't pay for all your shares at market highs. This strategy - known as dollar cost averaging - also reduces "emotion" from investing, helping shareholders avoid selling weak performers just prior to an upswing, or chasing a hot performer just before a correction.
We invite you to contact us via the Internet, through our Investor Centers or by phone. It is our privilege to provide you the information you need to make the investments that are right for you.
Sincerely,
(The chairman's signature appears here.)
Abigail P. Johnson
Annual Report
Fidelity Advisor Income Replacement 2016 FundSM - Class A, T, and C
Average annual total return reflects the change in the value of an investment, assuming reinvestment of each class' distributions from dividend income and capital gains (the profits earned upon the sale of securities that have grown in value, if any) and assuming a constant rate of performance each year. The $25,000 table and the fund's returns do not reflect the deduction of taxes that a shareholder would pay on fund distributions or the redemption of fund shares. During periods of reimbursement by Fidelity, a fund's total return will be greater than it would be had the reimbursement not occurred. How a fund did yesterday is no guarantee of how it will do tomorrow.
Average Annual Total Returns
Periods ended July 31, 2011 | Past 1
year | Life of
fund A |
Class A (incl. 5.75% sales charge) | 2.07% | 1.13% |
Class T (incl. 3.50% sales charge) | 4.22% | 1.48% |
Class C (incl. contingent deferred sales charge)B | 6.49% | 1.90% |
A From August 30, 2007.
B Class C shares' contingent deferred sales charges included in the past one year and life of fund total return figures are 1% and 0%, respectively.
$25,000 Over Life of Fund
Let's say hypothetically that $25,000 was invested in Fidelity Advisor Income Replacement 2016 Fund - Class A on August 30, 2007, when the fund started, and the current 5.75% sales charge was paid. The chart shows how the value of your investment would have changed, and also shows how the Barclays Capital® U.S. Aggregate Bond Index performed over the same period.
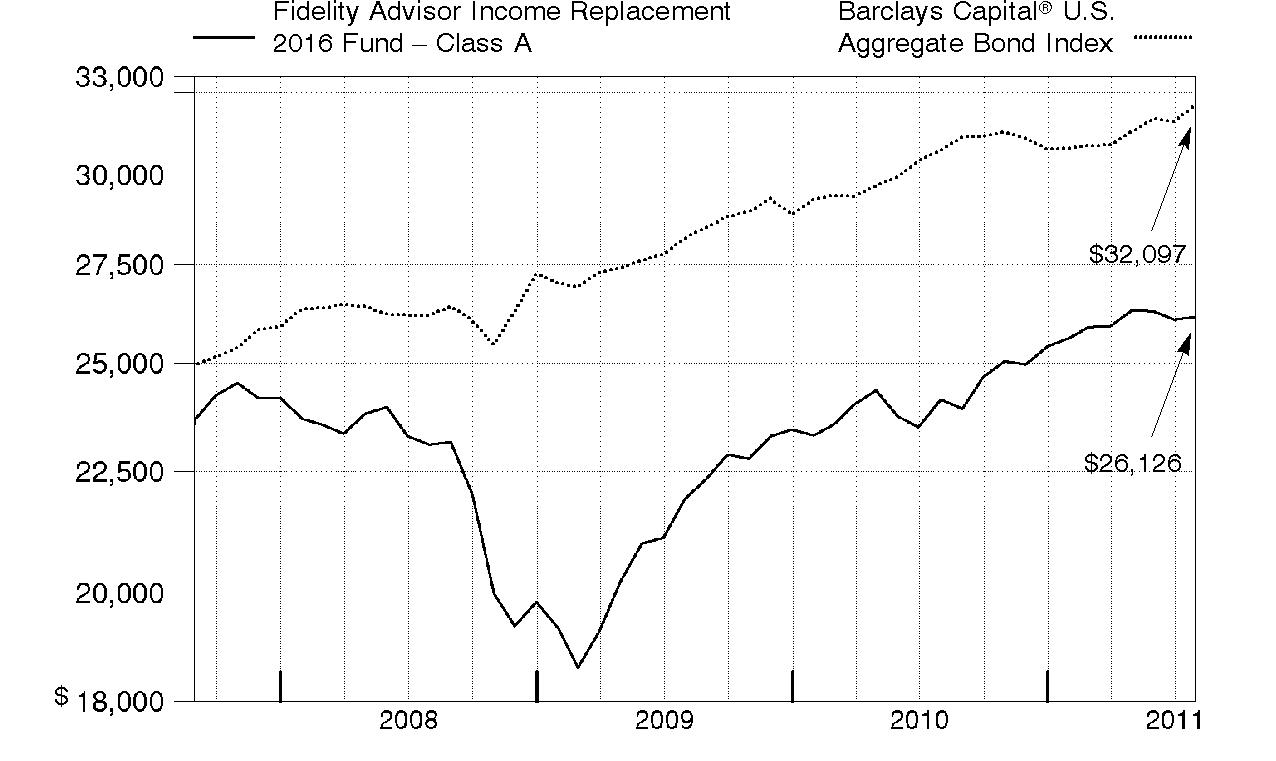
Annual Report
Fidelity Advisor Income Replacement 2018 FundSM - Class A, T, and C
Performance: The Bottom Line
Average annual total return reflects the change in the value of an investment, assuming reinvestment of each class' distributions from dividend income and capital gains (the profits earned upon the sale of securities that have grown in value, if any) and assuming a constant rate of performance each year. The $25,000 table and the fund's returns do not reflect the deduction of taxes that a shareholder would pay on fund distributions or the redemption of fund shares. During periods of reimbursement by Fidelity, a fund's total return will be greater than it would be had the reimbursement not occurred. How a fund did yesterday is no guarantee of how it will do tomorrow.
Average Annual Total Returns
Periods ended July 31, 2011 | Past 1
year | Life of
fund A |
Class A (incl. 5.75% sales charge) | 3.42% | 1.19% |
Class T (incl. 3.50% sales charge) | 5.65% | 1.55% |
Class C (incl. contingent deferred sales charge)B | 7.93% | 1.97% |
A From August 30, 2007.
B Class C shares' contingent deferred sales charges included in the past one year and life of fund total return figures are 1% and 0%, respectively.
$25,000 Over Life of Fund
Let's say hypothetically that $25,000 was invested in Fidelity Advisor Income Replacement 2018 Fund - Class A on August 30, 2007, when the fund started, and the current 5.75% sales charge was paid. The chart shows how the value of your investment would have changed, and also shows how the Barclays Capital U.S. Aggregate Bond Index performed over the same period.
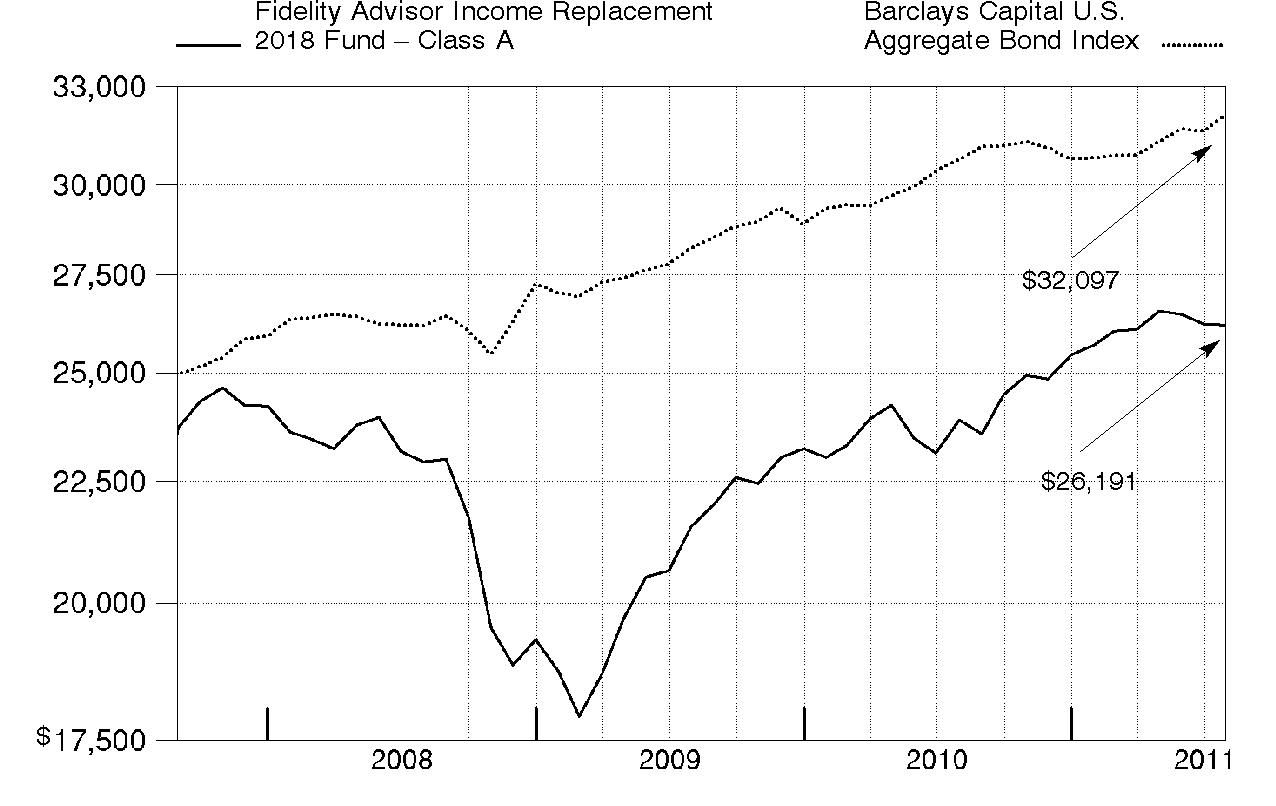
Annual Report
Fidelity Advisor Income Replacement 2020 FundSM - Class A, T, and C
Performance: The Bottom Line
Average annual total return reflects the change in the value of an investment, assuming reinvestment of each class' distributions from dividend income and capital gains (the profits earned upon the sale of securities that have grown in value, if any) and assuming a constant rate of performance each year. The $25,000 table and the fund's returns do not reflect the deduction of taxes that a shareholder would pay on fund distributions or the redemption of fund shares. During periods of reimbursement by Fidelity, a fund's total return will be greater than it would be had the reimbursement not occurred. How a fund did yesterday is no guarantee of how it will do tomorrow.
Average Annual Total Returns
Periods ended July 31, 2011 | Past 1
year | Life of
fund A |
Class A (incl. 5.75% sales charge) | 4.42% | 1.12% |
Class T (incl. 3.50% sales charge) | 6.67% | 1.48% |
Class C (incl. contingent deferred sales charge)B | 8.98% | 1.89% |
A From August 30, 2007.
B Class C shares' contingent deferred sales charges included in the past one year and life of fund total return figures are 1% and 0%, respectively.
$25,000 Over Life of Fund
Let's say hypothetically that $25,000 was invested in Fidelity Advisor Income Replacement 2020 Fund - Class A on August 30, 2007, when the fund started, and the current 5.75% sales charge was paid. The chart shows how the value of your investment would have changed, and also shows how the Barclays Capital U.S. Aggregate Bond Index performed over the same period.

Annual Report
Fidelity Advisor Income Replacement 2022 FundSM - Class A, T, and C
Performance: The Bottom Line
Average annual total return reflects the change in the value of an investment, assuming reinvestment of each class' distributions from dividend income and capital gains (the profits earned upon the sale of securities that have grown in value, if any) and assuming a constant rate of performance each year. The $25,000 table and the fund's returns do not reflect the deduction of taxes that a shareholder would pay on fund distributions or the redemption of fund shares. During periods of reimbursement by Fidelity, a fund's total return will be greater than it would be had the reimbursement not occurred. How a fund did yesterday is no guarantee of how it will do tomorrow.
Average Annual Total Returns
Periods ended July 31, 2011 | Past 1
year | Life of
fund A |
Class A (incl. 5.75% sales charge) | 5.16% | 1.13% |
Class T (incl. 3.50% sales charge) | 7.41% | 1.49% |
Class C (incl. contingent deferred sales charge)B | 9.74% | 1.90% |
A From August 30, 2007.
B Class C shares' contingent deferred sales charges included in the past one year and life of fund total return figures are 1% and 0%, respectively.
$25,000 Over Life of Fund
Let's say hypothetically that $25,000 was invested in Fidelity Advisor Income Replacement 2022 Fund - Class A on August 30, 2007, when the fund started, and the current 5.75% sales charge was paid. The chart shows how the value of your investment would have changed, and also shows how the Barclays Capital U.S. Aggregate Bond Index performed over the same period.
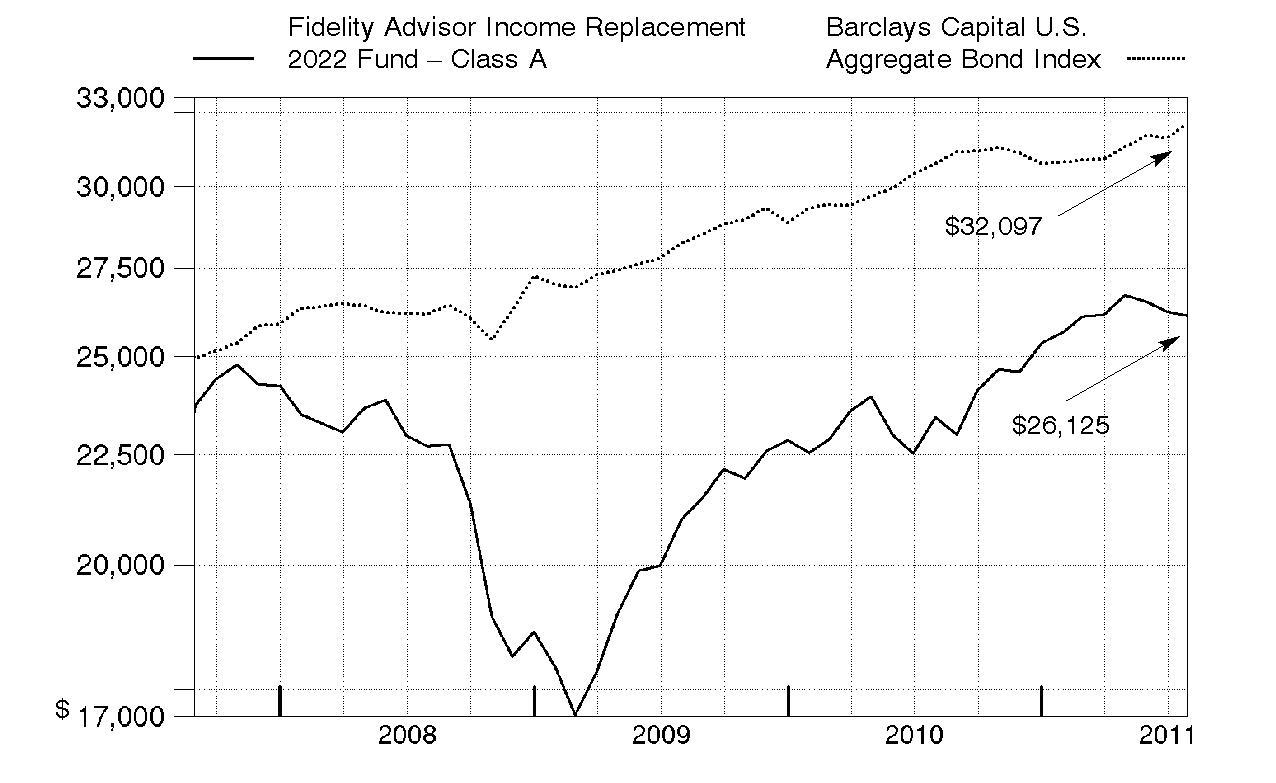
Annual Report
Fidelity Advisor Income Replacement 2024 FundSM - Class A, T, and C
Performance: The Bottom Line
Average annual total return reflects the change in the value of an investment, assuming reinvestment of each class' distributions from dividend income and capital gains (the profits earned upon the sale of securities that have grown in value, if any) and assuming a constant rate of performance each year. The $25,000 table and the fund's returns do not reflect the deduction of taxes that a shareholder would pay on fund distributions or the redemption of fund shares. During periods of reimbursement by Fidelity, a fund's total return will be greater than it would be had the reimbursement not occurred. How a fund did yesterday is no guarantee of how it will do tomorrow.
Average Annual Total Returns
Periods ended July 31, 2011 | Past 1
year | Life of
fund A |
Class A (incl. 5.75% sales charge) | 5.68% | 1.10% |
Class T (incl. 3.50% sales charge) | 7.94% | 1.46% |
Class C (incl. contingent deferred sales charge)B | 10.30% | 1.87% |
A From August 30, 2007.
B Class C shares' contingent deferred sales charges included in the past one year and life of fund total return figures are 1% and 0%, respectively.
$25,000 Over Life of Fund
Let's say hypothetically that $25,000 was invested in Fidelity Advisor Income Replacement 2024 Fund - Class A on August 30, 2007, when the fund started, and the current 5.75% sales charge was paid. The chart shows how the value of your investment would have changed, and also shows how the S&P 500® Index performed over the same period.
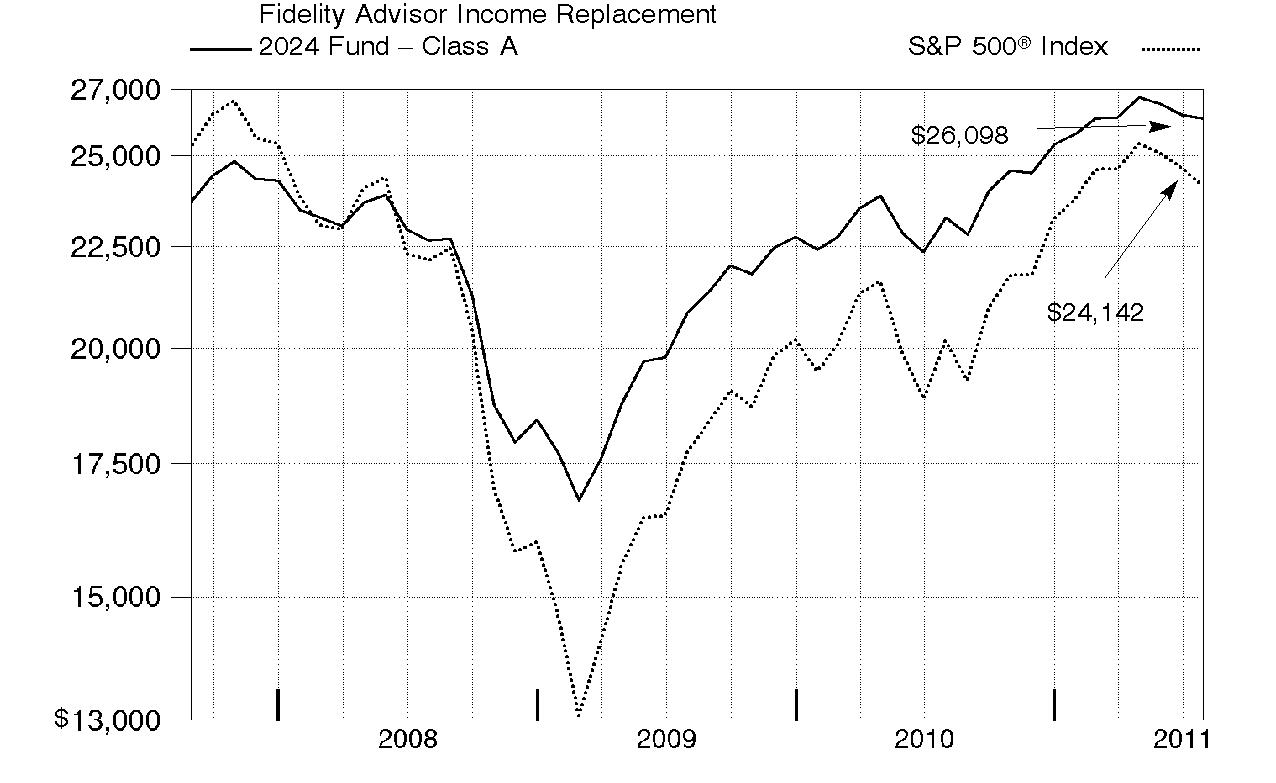
Annual Report
Fidelity Advisor Income Replacement 2026 FundSM - Class A, T, and C
Performance: The Bottom Line
Average annual total return reflects the change in the value of an investment, assuming reinvestment of each class' distributions from dividend income and capital gains (the profits earned upon the sale of securities that have grown in value, if any) and assuming a constant rate of performance each year. The $25,000 table and the fund's returns do not reflect the deduction of taxes that a shareholder would pay on fund distributions or the redemption of fund shares. During periods of reimbursement by Fidelity, a fund's total return will be greater than it would be had the reimbursement not occurred. How a fund did yesterday is no guarantee of how it will do tomorrow.
Average Annual Total Returns
Periods ended July 31, 2011 | Past 1
year | Life of
fund A |
Class A (incl. 5.75% sales charge) | 6.05% | 0.99% |
Class T (incl. 3.50% sales charge) | 8.33% | 1.35% |
Class C (incl. contingent deferred sales charge)B | 10.70% | 1.76% |
A From August 30, 2007.
B Class C shares' contingent deferred sales charges included in the past one year and life of fund total return figures are 1% and 0%, respectively.
$25,000 Over Life of Fund
Let's say hypothetically that $25,000 was invested in Fidelity Advisor Income Replacement 2026 Fund - Class A on August 30, 2007, when the fund started, and the current 5.75% sales charge was paid. The chart shows how the value of your investment would have changed, and also shows how the S&P 500 Index performed over the same period.
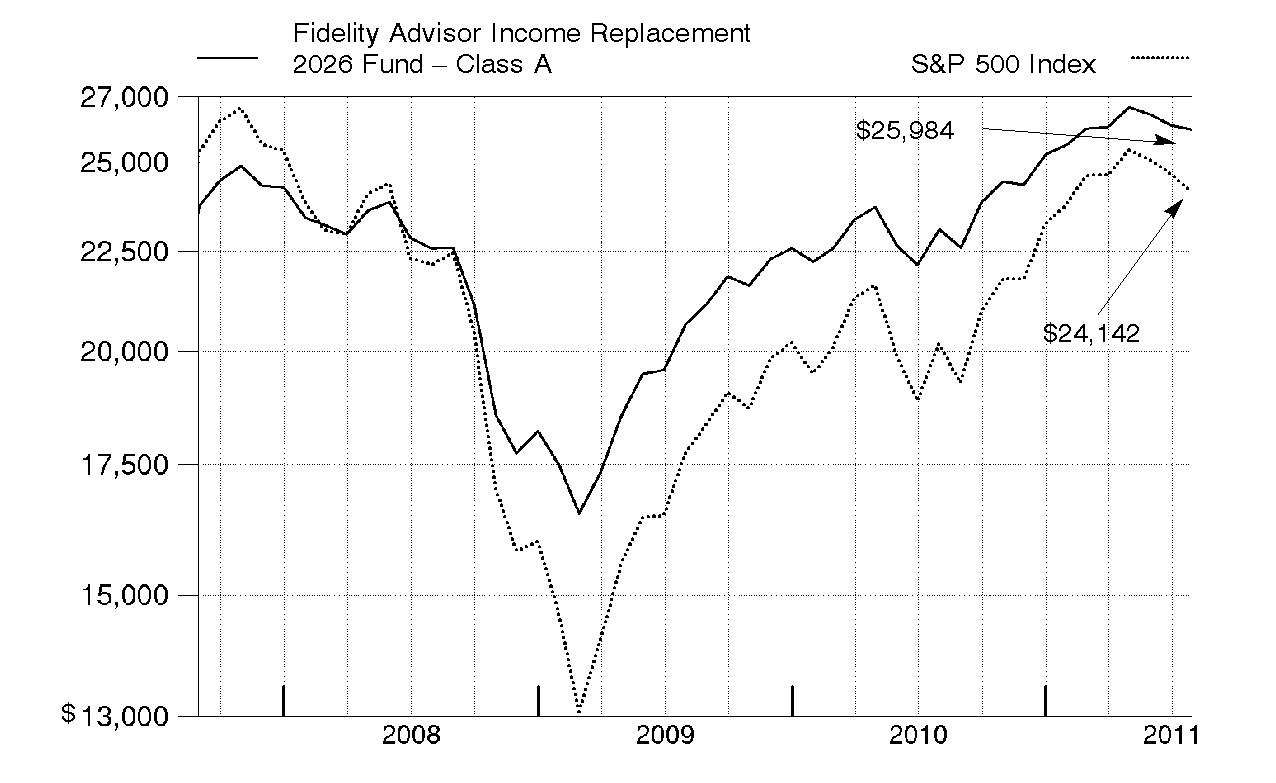
Annual Report
Fidelity Advisor Income Replacement 2028 FundSM - Class A, T, and C
Performance: The Bottom Line
Average annual total return reflects the change in the value of an investment, assuming reinvestment of each class' distributions from dividend income and capital gains (the profits earned upon the sale of securities that have grown in value, if any) and assuming a constant rate of performance each year. The $25,000 table and the fund's returns do not reflect the deduction of taxes that a shareholder would pay on fund distributions or the redemption of fund shares. During periods of reimbursement by Fidelity, a fund's total return will be greater than it would be had the reimbursement not occurred. How a fund did yesterday is no guarantee of how it will do tomorrow.
Average Annual Total Returns
Periods ended July 31, 2011 | Past 1
year | Life of
fund A |
Class A (incl. 5.75% sales charge) | 6.36% | 0.94% |
Class T (incl. 3.50% sales charge) | 8.63% | 1.29% |
Class C (incl. contingent deferred sales charge)B | 11.01% | 1.71% |
A From August 30, 2007.
B Class C shares' contingent deferred sales charges included in the past one year and life of fund total return figures are 1% and 0%, respectively.
$25,000 Over Life of Fund
Let's say hypothetically that $25,000 was invested in Fidelity Advisor Income Replacement 2028 Fund - Class A on August 30, 2007, when the fund started, and the current 5.75% sales charge was paid. The chart shows how the value of your investment would have changed, and also shows how the S&P 500 Index performed over the same period.
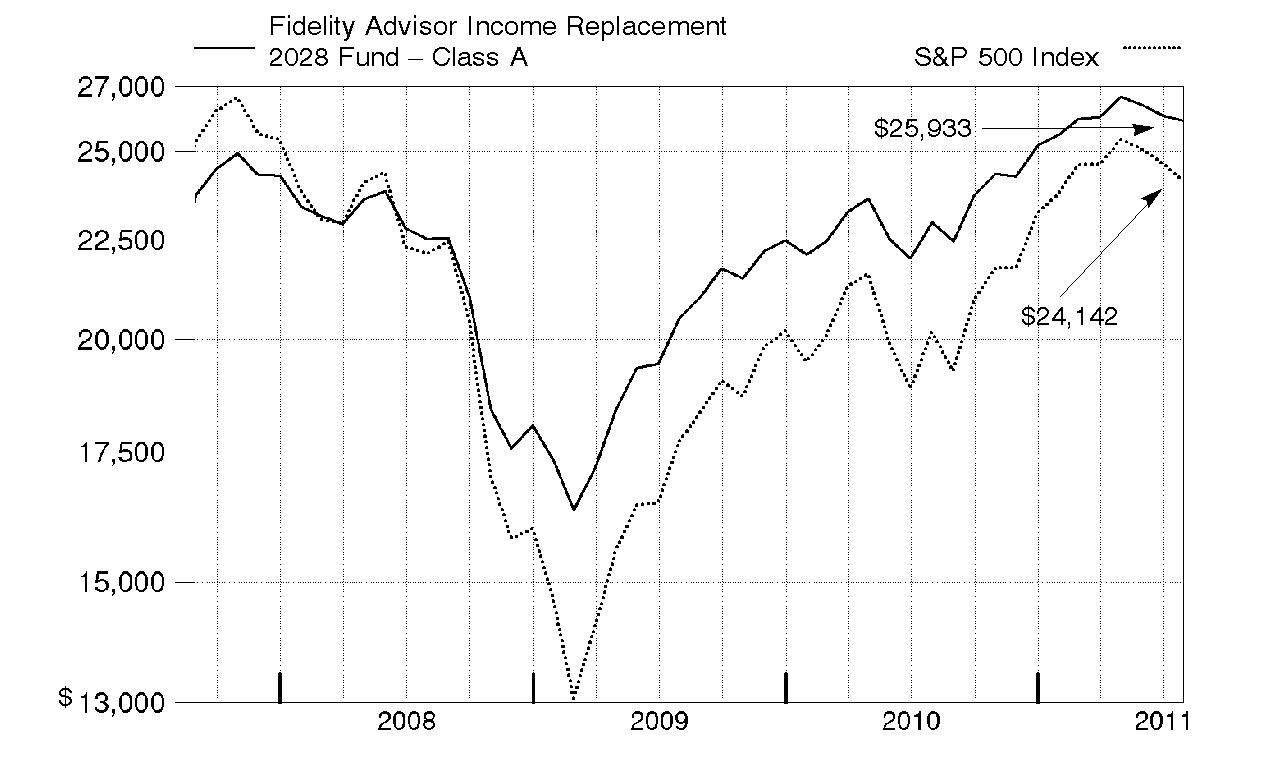
Annual Report
Fidelity Advisor Income Replacement 2030 FundSM - Class A, T, and C
Performance: The Bottom Line
Average annual total return reflects the change in the value of an investment, assuming reinvestment of each class' distributions from dividend income and capital gains (the profits earned upon the sale of securities that have grown in value, if any) and assuming a constant rate of performance each year. The $25,000 table and the fund's returns do not reflect the deduction of taxes that a shareholder would pay on fund distributions or the redemption of fund shares. During periods of reimbursement by Fidelity, a fund's total return will be greater than it would be had the reimbursement not occurred. How a fund did yesterday is no guarantee of how it will do tomorrow.
Average Annual Total Returns
Periods ended July 31, 2011 | Past 1
year | Life of
fund A |
Class A (incl. 5.75% sales charge) | 6.64% | 0.90% |
Class T (incl. 3.50% sales charge) | 8.90% | 1.25% |
Class C (incl. contingent deferred sales charge)B | 11.30% | 1.67% |
A From August 30, 2007.
B Class C shares' contingent deferred sales charges included in the past one year and life of fund total return figures are 1% and 0%, respectively.
$25,000 Over Life of Fund
Let's say hypothetically that $25,000 was invested in Fidelity Advisor Income Replacement 2030 Fund - Class A on August 30, 2007, when the fund started, and the current 5.75% sales charge was paid. The chart shows how the value of your investment would have changed, and also shows how the S&P 500 Index performed over the same period.
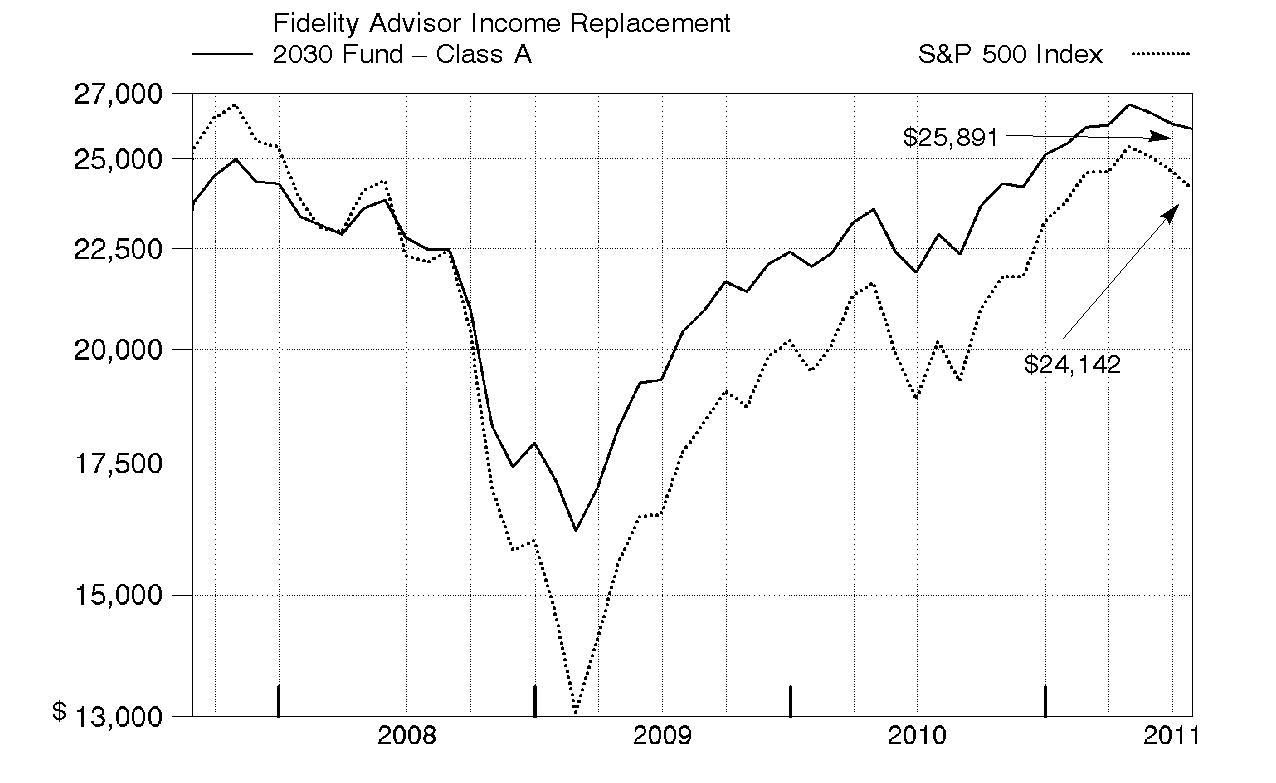
Annual Report
Fidelity Advisor Income Replacement 2032 FundSM - Class A, T, and C
Performance: The Bottom Line
Average annual total return reflects the change in the value of an investment, assuming reinvestment of each class' distributions from dividend income and capital gains (the profits earned upon the sale of securities that have grown in value, if any) and assuming a constant rate of performance each year. The $25,000 table and the fund's returns do not reflect the deduction of taxes that a shareholder would pay on fund distributions or the redemption of fund shares. During periods of reimbursement by Fidelity, a fund's total return will be greater than it would be had the reimbursement not occurred. How a fund did yesterday is no guarantee of how it will do tomorrow.
Average Annual Total Returns
Periods ended July 31, 2011 | Past 1
year | Life of
fund A |
Class A (incl. 5.75% sales charge) | 6.86% | 0.80% |
Class T (incl. 3.50% sales charge) | 9.18% | 1.16% |
Class C (incl. contingent deferred sales charge)B | 11.55% | 1.56% |
A From August 30, 2007.
B Class C shares' contingent deferred sales charges included in the past one year and life of fund total return figures are 1% and 0%, respectively.
$25,000 Over Life of Fund
Let's say hypothetically that $25,000 was invested in Fidelity Advisor Income Replacement 2032 Fund - Class A on August 30, 2007, when the fund started, and the current 5.75% sales charge was paid. The chart shows how the value of your investment would have changed, and also shows how the S&P 500 Index performed over the same period.
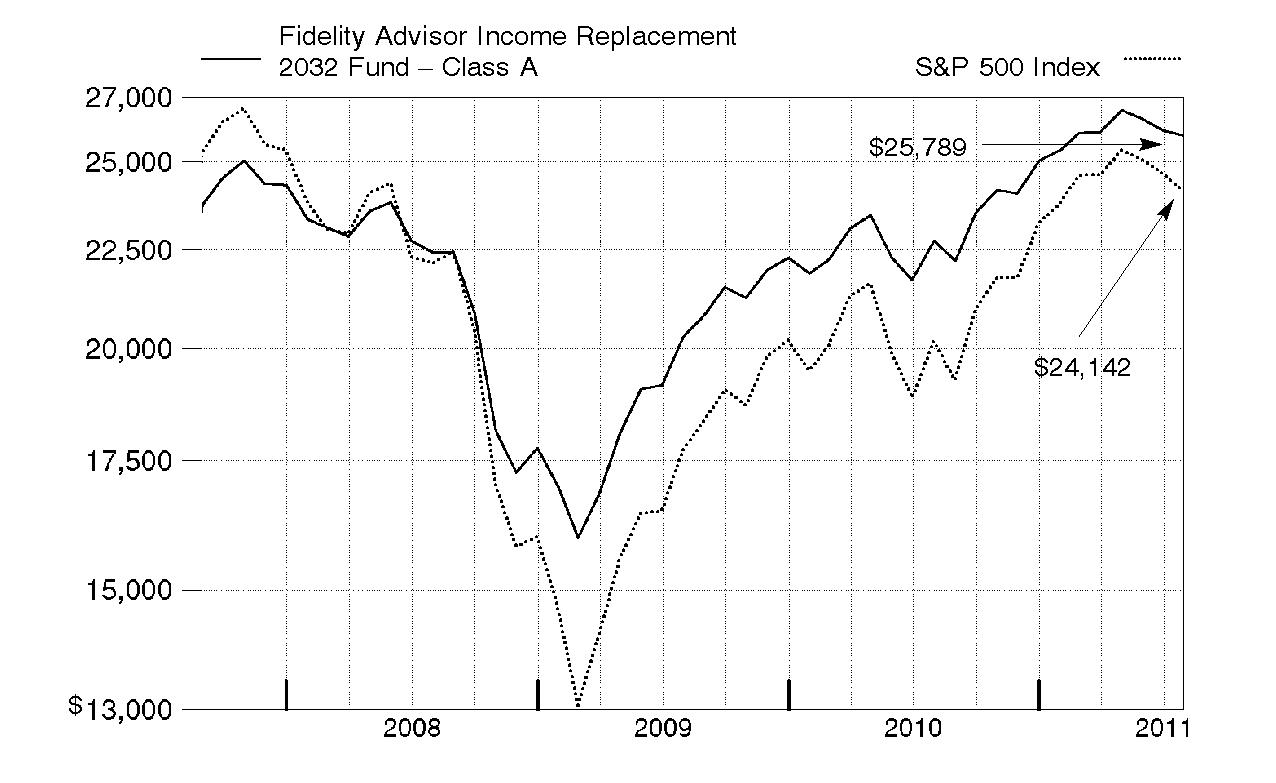
Annual Report
Fidelity Advisor Income Replacement 2034 FundSM - Class A, T, and C
Performance: The Bottom Line
Average annual total return reflects the change in the value of an investment, assuming reinvestment of each class' distributions from dividend income and capital gains (the profits earned upon the sale of securities that have grown in value, if any) and assuming a constant rate of performance each year. The $25,000 table and the fund's returns do not reflect the deduction of taxes that a shareholder would pay on fund distributions or the redemption of fund shares. During periods of reimbursement by Fidelity, a fund's total return will be greater than it would be had the reimbursement not occurred. How a fund did yesterday is no guarantee of how it will do tomorrow.
Average Annual Total Returns
Periods ended July 31, 2011 | Past 1
year | Life of
fund A |
Class A (incl. 5.75% sales charge) | 7.15% | 0.66% |
Class T (incl. 3.50% sales charge) | 9.47% | 1.02% |
Class C (incl. contingent deferred sales charge)B | 11.85% | 1.43% |
A From August 30, 2007.
B Class C shares' contingent deferred sales charges included in the past one year and life of fund total return figures are 1% and 0%, respectively.
$25,000 Over Life of Fund
Let's say hypothetically that $25,000 was invested in Fidelity Advisor Income Replacement 2034 Fund - Class A on August 30, 2007, when the fund started, and the current 5.75% sales charge was paid. The chart shows how the value of your investment would have changed, and also shows how the S&P 500 Index performed over the same period.
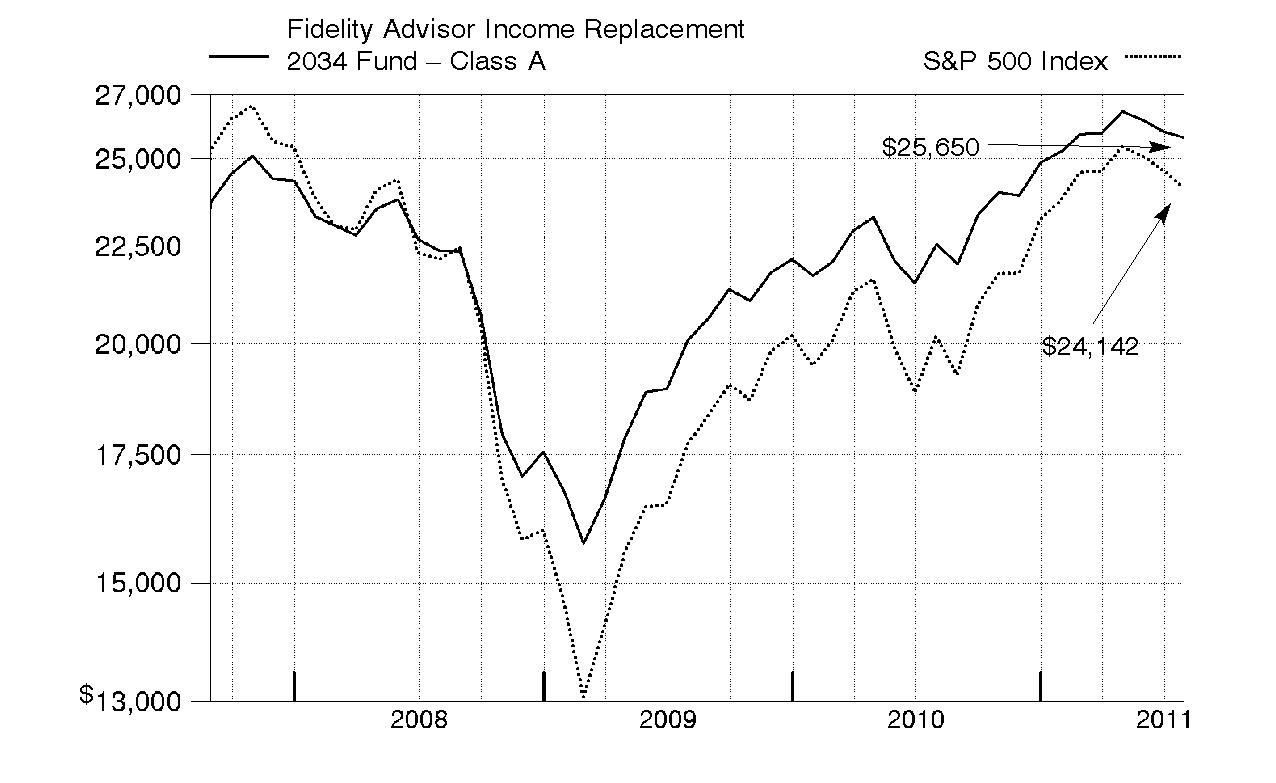
Annual Report
Fidelity Advisor Income Replacement 2036 FundSM - Class A, T, and C
Performance: The Bottom Line
Average annual total return reflects the change in the value of an investment, assuming reinvestment of each class' distributions from dividend income and capital gains (the profits earned upon the sale of securities that have grown in value, if any) and assuming a constant rate of performance each year. The $25,000 table and the fund's returns do not reflect the deduction of taxes that a shareholder would pay on fund distributions or the redemption of fund shares. During periods of reimbursement by Fidelity, a fund's total return will be greater than it would be had the reimbursement not occurred. How a fund did yesterday is no guarantee of how it will do tomorrow.
Average Annual Total Returns
Periods ended July 31, 2011 | Past 1
year | Life of
fund A |
Class A (incl. 5.75% sales charge) | 7.49% | 0.59% |
Class T (incl. 3.50% sales charge) | 9.75% | 0.95% |
Class C (incl. contingent deferred sales charge)B | 12.17% | 1.36% |
A From August 30, 2007.
B Class C shares' contingent deferred sales charges included in the past one year and life of fund total return figures are 1% and 0%, respectively.
$25,000 Over Life of Fund
Let's say hypothetically that $25,000 was invested in Fidelity Advisor Income Replacement 2036 Fund - Class A on August 30, 2007, when the fund started, and the current 5.75% sales charge was paid. The chart shows how the value of your investment would have changed, and also shows how the S&P 500 Index performed over the same period.
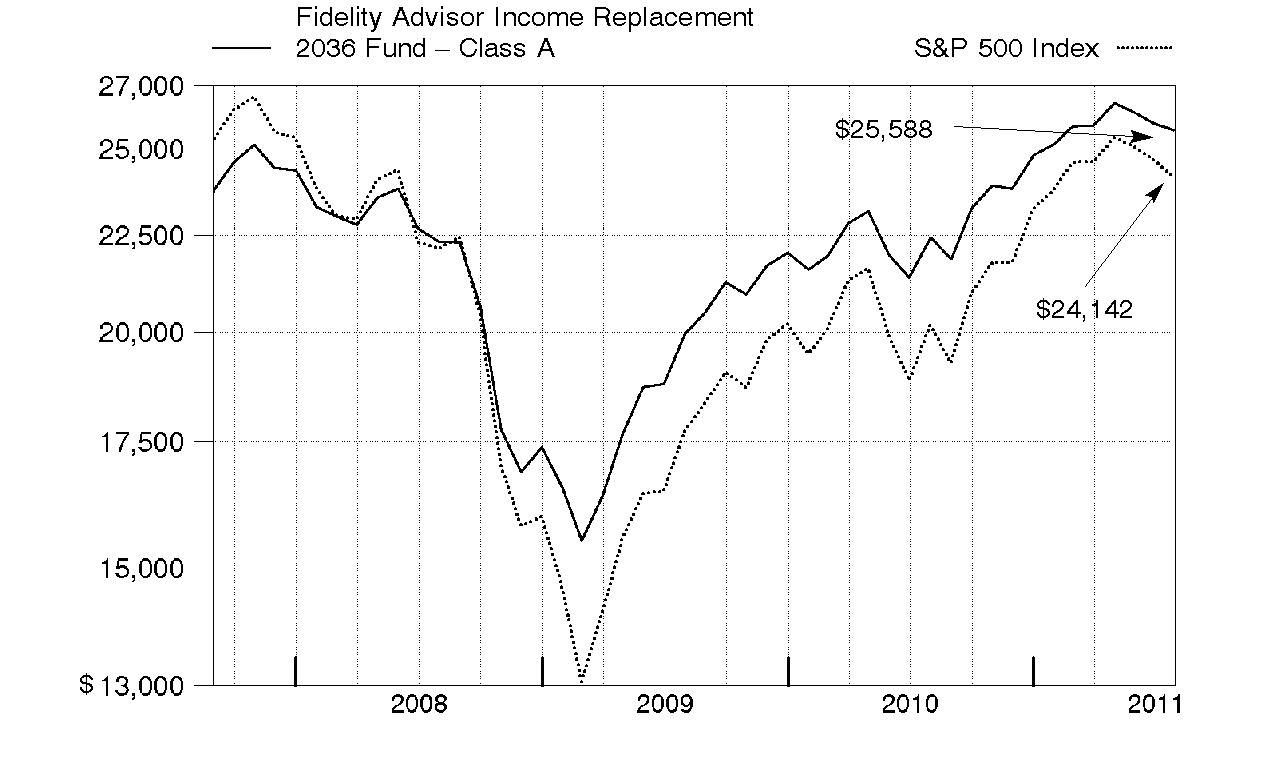
Annual Report
Fidelity Advisor Income Replacement 2038 FundSM - Class A, T, and C
Performance: The Bottom Line
Average annual total return reflects the change in the value of an investment, assuming reinvestment of each class' distributions from dividend income and capital gains (the profits earned upon the sale of securities that have grown in value, if any) and assuming a constant rate of performance each year. The $25,000 table and the fund's returns do not reflect the deduction of taxes that a shareholder would pay on fund distributions or the redemption of fund shares. During periods of reimbursement by Fidelity, a fund's total return will be greater than it would be had the reimbursement not occurred. How a fund did yesterday is no guarantee of how it will do tomorrow.
Average Annual Total Returns
Periods ended July 31, 2011 | Past 1
year | Life of
fund A |
Class A (incl. 5.75% sales charge) | 7.85% | -0.44% |
Class T (incl. 3.50% sales charge) | 10.16% | -0.02% |
Class C (incl. contingent deferred sales charge)B | 12.59% | 0.47% |
A From December 31, 2007.
B Class C shares' contingent deferred sales charges included in the past one year and life of fund total return figures are 1% and 0%, respectively.
$25,000 Over Life of Fund
Let's say hypothetically that $25,000 was invested in Fidelity Advisor Income Replacement 2038 Fund - Class A on December 31, 2007, when the fund started, and the current 5.75% sales charge was paid. The chart shows how the value of your investment would have changed, and also shows how the S&P 500 Index performed over the same period.
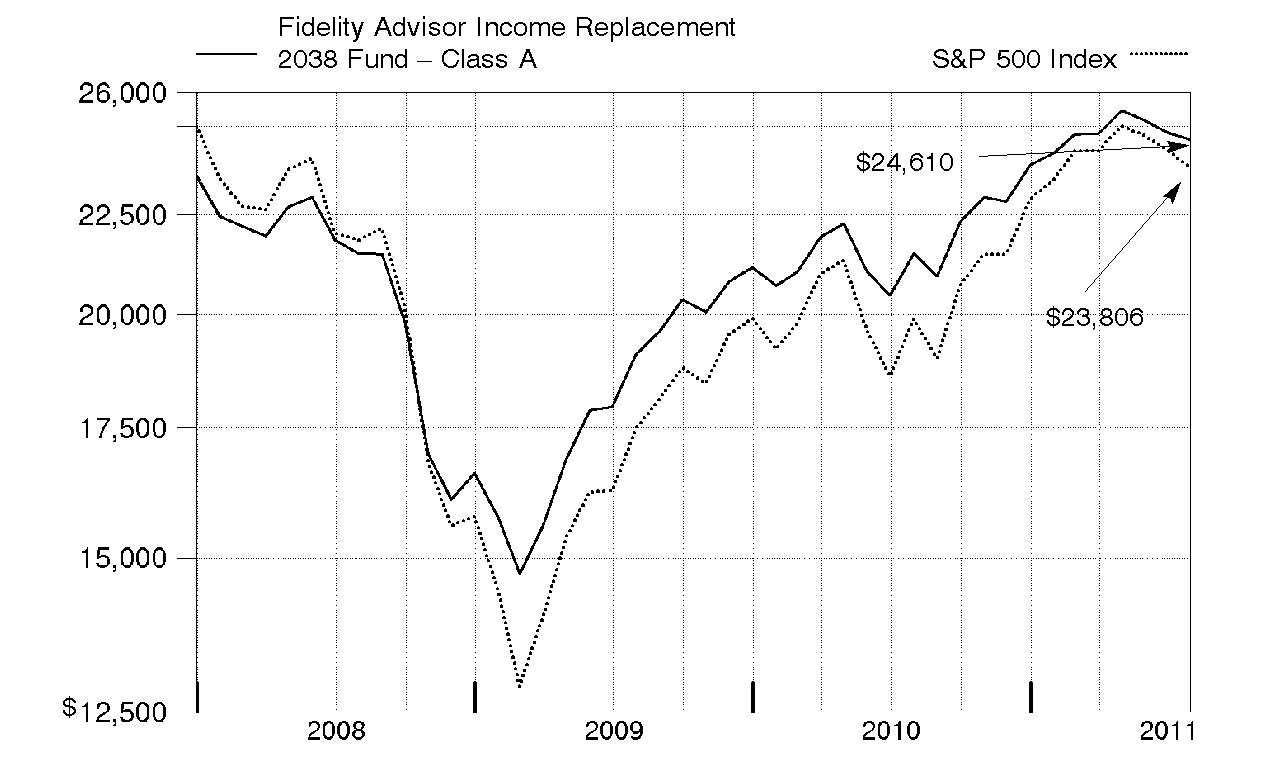
Annual Report
Fidelity Advisor Income Replacement 2040 FundSM - Class A, T, and C
Performance: The Bottom Line
Average annual total return reflects the change in the value of an investment, assuming reinvestment of each class' distributions from dividend income and capital gains (the profits earned upon the sale of securities that have grown in value, if any) and assuming a constant rate of performance each year. The $25,000 table and the fund's returns do not reflect the deduction of taxes that a shareholder would pay on fund distributions or the redemption of fund shares. During periods of reimbursement by Fidelity, a fund's total return will be greater than it would be had the reimbursement not occurred. How a fund did yesterday is no guarantee of how it will do tomorrow.
Average Annual Total Returns
Periods ended July 31, 2011 | Past 1
year | Life of
fund A |
Class A (incl. 5.75% sales charge) | 8.33% | -0.31% |
Class T (incl. 3.50% sales charge) | 10.63% | 0.10% |
Class C (incl. contingent deferred sales charge)B | 13.08% | 0.60% |
A From December 31, 2007.
B Class C shares' contingent deferred sales charges included in the past one year and life of fund total return figures are 1% and 0%, respectively.
$25,000 Over Life of Fund
Let's say hypothetically that $25,000 was invested in Fidelity Advisor Income Replacement 2040 Fund - Class A on December 31, 2007, when the fund started, and the current 5.75% sales charge was paid. The chart shows how the value of your investment would have changed, and also shows how the S&P 500 Index performed over the same period.
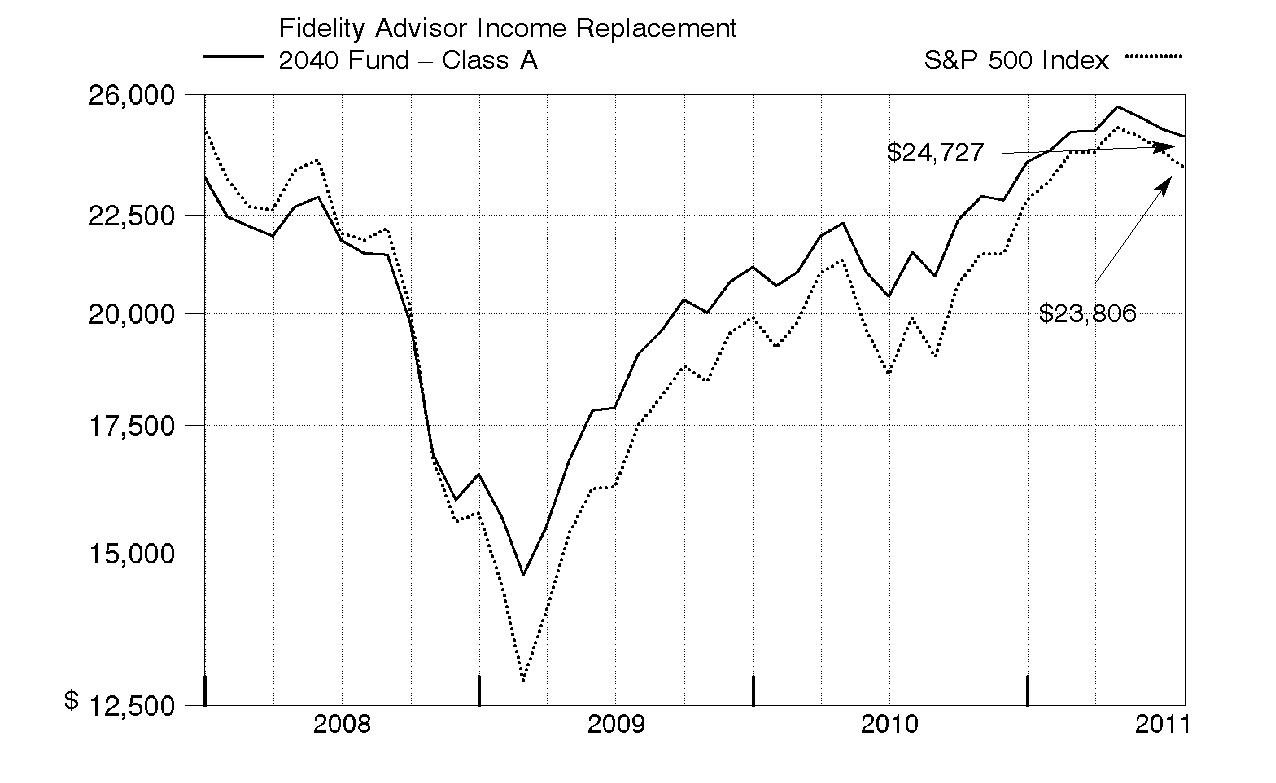
Annual Report
Fidelity Advisor Income Replacement 2042 FundSM - Class A, T, and C
Performance: The Bottom Line
Average annual total return reflects the change in the value of an investment, assuming reinvestment of each class' distributions from dividend income and capital gains (the profits earned upon the sale of securities that have grown in value, if any) and assuming a constant rate of performance each year. The $25,000 table and the fund's returns do not reflect the deduction of taxes that a shareholder would pay on fund distributions or the redemption of fund shares. During periods of reimbursement by Fidelity, a fund's total return will be greater than it would be had the reimbursement not occurred. How a fund did yesterday is no guarantee of how it will do tomorrow.
Average Annual Total Returns
Periods ended July 31, 2011 | Past 1
year | Life of
fund A |
Class A (incl. 5.75% sales charge) | 8.50% | -0.28% |
Class T (incl. 3.50% sales charge) | 10.83% | 0.13% |
Class C (incl. contingent deferred sales charge)B | 13.26% | 0.62% |
A From December 31, 2007.
B Class C shares' contingent deferred sales charges included in the past one year and life of fund total return figures are 1% and 0%, respectively.
$25,000 Over Life of Fund
Let's say hypothetically that $25,000 was invested in Fidelity Advisor Income Replacement 2042 Fund - Class A on December 31, 2007, when the fund started, and the current 5.75% sales charge was paid. The chart shows how the value of your investment would have changed, and also shows how the S&P 500 Index performed over the same period.
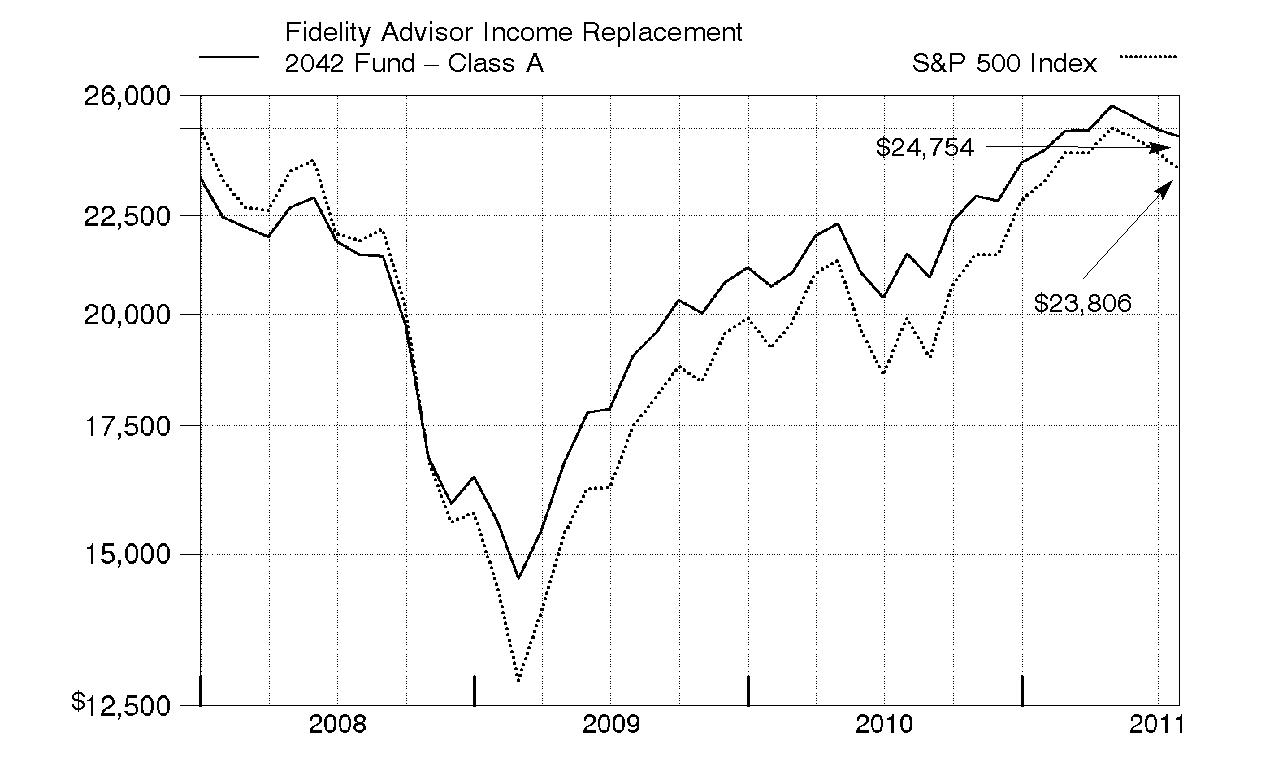
Annual Report
Market Recap: U.S. stocks registered solid double-digit gains for the 12 months ending July 31, 2011, extending a rally that began more than two years earlier. Despite a rough start in August 2010, markets turned positive in September, as increased demand for capital goods and other upbeat indicators trumped investor worry about a U.S. recessionary relapse. The broad market, as measured by the S&P 500® Index, rose 9% that month, its biggest September gain in 71 years. Seven more monthly advances followed, fueled by encouraging corporate earnings and economic activity. However, volatility picked up in the period's latter months, as markets reacted to continued high U.S. unemployment, nagging debt troubles in Europe and looming legislative battles over the federal debt ceiling. May unemployment rose above 9% for the first time in 2011, contributing to a traditional "June swoon" for stocks. Market uncertainty lingered in July, when the S&P 500® posted its second-biggest monthly loss of the period. For the full year, the S&P 500® climbed 19.65%, while the blue-chip-laden Dow Jones Industrial AverageSM rose a comparable 19.09% and the technology-heavy Nasdaq Composite® Index gained 23.40%. On the capitalization spectrum, stocks of mid-cap companies fared best, with the Russell Midcap® Index rising 24.51% and the small-cap Russell 2000® Index adding 23.92%. Strong returns for stocks brought about more-tempered gains for fixed-income markets, however, as investor demand for the perceived safety of bonds fluctuated throughout the year. The Barclays Capital® U.S. Aggregate Bond Index - a broad measure of the investment-grade debt universe - rose 4.44%, lifted by second-half volatility within the equity markets. Higher-risk bond categories fared best, with The BofA Merrill LynchSM US High Yield Constrained Index returning 12.85% for the year. Despite improving in the second half of the period, bonds backed by the U.S. government were still among the weakest performers for the year, with the Barclays Capital® U.S. Treasury Bond Index adding only 3.39%. Faring worse were short-term assets, as gauged by the 0.16% increase in the Barclays Capital U.S. 3 Month Treasury Bellwether Index.
Comments from Andrew Dierdorf, Co-Portfolio Manager of Fidelity Advisor Income Replacement FundsSM, and Christopher Sharpe, who became Co-Portfolio Manager on June 21, 2011: For the year, each of the Funds' Class A, Class T and Class C shares (excluding sales charges) posted a positive return, ranging from roughly 7% for the shortest-dated Fund - Fidelity Advisor Income Replacement 2016 FundSM - to roughly 15% for Fidelity Advisor Income Replacement 2042 FundSM, which has the longest time horizon. For the one-year period, each of the Funds' three asset classes - equities, bonds and short-term instruments - delivered a gain. All of the underlying funds posted positive absolute returns, with equity funds providing the strongest results. On a relative basis, 10 of the 15 underlying funds outperformed their respective benchmarks. In aggregate, the Funds' equity asset class fell just short of the broad U.S. equity market, as measured by the S&P 500® Index, which rose 19.65%. The most notable relative detractors were Fidelity® Disciplined Equity Fund and Fidelity® Equity-Income Fund, which underperformed despite returning roughly 15%. However, outperformance from two of the Funds' largest equity holdings during the period - Fidelity Large Cap Core Enhanced Index Fund and Fidelity Series Broad Market Opportunities Fund - helped buoy results. The Funds' bond asset class - which included a diversified mix of underlying bond funds - handily exceeded its benchmark index, the Barclays Capital® U.S. Aggregate Bond Index, which gained 4.44%. Fidelity Total Bond Fund, which serves as the Funds' largest debt holding, anchored the Funds' performance with a roughly 6% return for the one-year time frame. Meanwhile, Fidelity Capital & Income Fund, which rose 16%, boosted the overall performance of the bond asset class. This fund primarily invested in high-yield securities, which produced solid gains during the first half of the reporting period, and was the best absolute performer in the bond category. Fidelity Strategic Real Return Fund also played an important role in the Funds. This underlying fund invests in real-estate-related securities and other inflation-sensitive asset types, which benefited during the period from investors' concern about an uptick in inflation.
Note to shareholders: On August 8, 2011, there were two changes to the underlying fund lineup. Fidelity Blue Chip Growth Index Fund was added, and Fidelity Large Cap Core Enhanced Index Fund was removed.
The views expressed above reflect those of the portfolio manager(s) only through the end of the period as stated on the cover of this report and do not necessarily represent the views of Fidelity or any other person in the Fidelity organization. Any such views are subject to change at any time based upon market or other conditions and Fidelity disclaims any responsibility to update such views. These views may not be relied on as investment advice and, because investment decisions for a Fidelity fund are based on numerous factors, may not be relied on as an indication of trading intent on behalf of any Fidelity fund.
Annual Report
As a shareholder of a Fund, you incur two types of costs: (1) transaction costs, including sales charges (loads) on purchase payments or redemption proceeds, and (2) ongoing costs, including distribution and/or service (12b-1) fees and other Fund expenses. This Example is intended to help you understand your ongoing costs (in dollars) of investing in the Funds and to compare these costs with the ongoing costs of investing in other mutual funds.
The Example is based on an investment of $1,000 invested at the beginning of the period and held for the entire period (February 1, 2011 to July 31, 2011).
Actual Expenses
The first line of the accompanying table for each class of each fund provides information about actual account values and actual expenses. You may use the information in this line, together with the amount you invested, to estimate the expenses that you paid over the period. Simply divide your account value by $1,000.00 (for example, an $8,600 account value divided by $1,000.00 = 8.6), then multiply the result by the number in the first line for a class of the fund under the heading entitled "Expenses Paid During Period" to estimate the expenses you paid on your account during this period. In addition, each Fund, as a shareholder in underlying Fidelity Funds, will indirectly bear its pro-rata share of the fees and expenses incurred by the underlying Fidelity Funds. These fees and expenses are not included in each Fund's annualized expense ratio used to calculate the expense estimates in the table below.
Hypothetical Example for Comparison Purposes
The second line of the accompanying table for each class of each fund provides information about hypothetical account values and hypothetical expenses based on a Class' actual expense ratio and an assumed rate of return of 5% per year before expenses, which is not the Class' actual return. The hypothetical account values and expenses may not be used to estimate the actual ending account balance or expenses you paid for the period. You may use this information to compare the ongoing costs of investing in the Fund and other funds. To do so, compare this 5% hypothetical example with the 5% hypothetical examples that appear in the shareholder reports of the other funds. In addition, each Fund, as a shareholder in underlying Fidelity Funds, will indirectly bear its pro-rata share of the fees and expenses incurred by the underlying Fidelity Funds. These fees and expenses are not included in each Fund's annualized expense ratio used to calculate the expense estimates in the table below.
Please note that the expenses shown in the table are meant to highlight your ongoing costs only and do not reflect any transaction costs. Therefore, the second line of the table is useful in comparing ongoing costs only, and will not help you determine the relative total costs of owning different funds. In addition, if these transactional costs were included, your costs would have been higher.
| Annualized
Expense Ratio | Beginning
Account Value
February 1, 2011 | Ending
Account Value
July 31, 2011 | Expenses Paid
During Period*
February 1, 2011
to July 31, 2011 |
Fidelity Income Replacement 2016 Fund | | | | |
Class A | .25% | | | |
Actual | | $ 1,000.00 | $ 1,020.40 | $ 1.25 |
HypotheticalA | | $ 1,000.00 | $ 1,023.55 | $ 1.25 |
Class T | .50% | | | |
Actual | | $ 1,000.00 | $ 1,018.80 | $ 2.50 |
HypotheticalA | | $ 1,000.00 | $ 1,022.32 | $ 2.51 |
Class C | 1.00% | | | |
Actual | | $ 1,000.00 | $ 1,016.50 | $ 5.00 |
HypotheticalA | | $ 1,000.00 | $ 1,019.84 | $ 5.01 |
Income Replacement 2016 | .00% | | | |
Actual | | $ 1,000.00 | $ 1,021.70 | $ .00 |
HypotheticalA | | $ 1,000.00 | $ 1,024.79 | $ .00 |
Institutional Class | .00% | | | |
Actual | | $ 1,000.00 | $ 1,021.70 | $ .00 |
HypotheticalA | | $ 1,000.00 | $ 1,024.79 | $ .00 |
Fidelity Income Replacement 2018 Fund | | | | |
Class A | .25% | | | |
Actual | | $ 1,000.00 | $ 1,019.80 | $ 1.25 |
HypotheticalA | | $ 1,000.00 | $ 1,023.55 | $ 1.25 |
Class T | .50% | | | |
Actual | | $ 1,000.00 | $ 1,018.50 | $ 2.50 |
HypotheticalA | | $ 1,000.00 | $ 1,022.32 | $ 2.51 |
| Annualized
Expense Ratio | Beginning
Account Value
February 1, 2011 | Ending
Account Value
July 31, 2011 | Expenses Paid
During Period*
February 1, 2011
to July 31, 2011 |
Class C | 1.00% | | | |
Actual | | $ 1,000.00 | $ 1,016.00 | $ 5.00 |
HypotheticalA | | $ 1,000.00 | $ 1,019.84 | $ 5.01 |
Income Replacement 2018 | .00% | | | |
Actual | | $ 1,000.00 | $ 1,021.10 | $ .00 |
HypotheticalA | | $ 1,000.00 | $ 1,024.79 | $ .00 |
Institutional Class | .00% | | | |
Actual | | $ 1,000.00 | $ 1,021.10 | $ .00 |
HypotheticalA | | $ 1,000.00 | $ 1,024.79 | $ .00 |
Fidelity Income Replacement 2020 Fund | | | | |
Class A | .25% | | | |
Actual | | $ 1,000.00 | $ 1,018.90 | $ 1.25 |
HypotheticalA | | $ 1,000.00 | $ 1,023.55 | $ 1.25 |
Class T | .50% | | | |
Actual | | $ 1,000.00 | $ 1,017.80 | $ 2.50 |
HypotheticalA | | $ 1,000.00 | $ 1,022.32 | $ 2.51 |
Class C | 1.00% | | | |
Actual | | $ 1,000.00 | $ 1,015.20 | $ 5.00 |
HypotheticalA | | $ 1,000.00 | $ 1,019.84 | $ 5.01 |
Income Replacement 2020 | .00% | | | |
Actual | | $ 1,000.00 | $ 1,020.40 | $ .00 |
HypotheticalA | | $ 1,000.00 | $ 1,024.79 | $ .00 |
Institutional Class | .00% | | | |
Actual | | $ 1,000.00 | $ 1,020.40 | $ .00 |
HypotheticalA | | $ 1,000.00 | $ 1,024.79 | $ .00 |
Fidelity Income Replacement 2022 Fund | | | | |
Class A | .25% | | | |
Actual | | $ 1,000.00 | $ 1,018.40 | $ 1.25 |
HypotheticalA | | $ 1,000.00 | $ 1,023.55 | $ 1.25 |
Class T | .50% | | | |
Actual | | $ 1,000.00 | $ 1,017.20 | $ 2.50 |
HypotheticalA | | $ 1,000.00 | $ 1,022.32 | $ 2.51 |
Class C | 1.00% | | | |
Actual | | $ 1,000.00 | $ 1,014.70 | $ 5.00 |
HypotheticalA | | $ 1,000.00 | $ 1,019.84 | $ 5.01 |
Income Replacement 2022 | .00% | | | |
Actual | | $ 1,000.00 | $ 1,019.70 | $ .00 |
HypotheticalA | | $ 1,000.00 | $ 1,024.79 | $ .00 |
Institutional Class | .00% | | | |
Actual | | $ 1,000.00 | $ 1,019.70 | $ .00 |
HypotheticalA | | $ 1,000.00 | $ 1,024.79 | $ .00 |
Fidelity Income Replacement 2024 Fund | | | | |
Class A | .25% | | | |
Actual | | $ 1,000.00 | $ 1,017.80 | $ 1.25 |
HypotheticalA | | $ 1,000.00 | $ 1,023.55 | $ 1.25 |
Class T | .50% | | | |
Actual | | $ 1,000.00 | $ 1,016.80 | $ 2.50 |
HypotheticalA | | $ 1,000.00 | $ 1,022.32 | $ 2.51 |
| Annualized
Expense Ratio | Beginning
Account Value
February 1, 2011 | Ending
Account Value
July 31, 2011 | Expenses Paid
During Period*
February 1, 2011
to July 31, 2011 |
Class C | 1.00% | | | |
Actual | | $ 1,000.00 | $ 1,014.30 | $ 4.99 |
HypotheticalA | | $ 1,000.00 | $ 1,019.84 | $ 5.01 |
Income Replacement 2024 | .00% | | | |
Actual | | $ 1,000.00 | $ 1,019.40 | $ .00 |
HypotheticalA | | $ 1,000.00 | $ 1,024.79 | $ .00 |
Institutional Class | .00% | | | |
Actual | | $ 1,000.00 | $ 1,019.40 | $ .00 |
HypotheticalA | | $ 1,000.00 | $ 1,024.79 | $ .00 |
Fidelity Income Replacement 2026 Fund | | | | |
Class A | .25% | | | |
Actual | | $ 1,000.00 | $ 1,017.70 | $ 1.25 |
HypotheticalA | | $ 1,000.00 | $ 1,023.55 | $ 1.25 |
Class T | .50% | | | |
Actual | | $ 1,000.00 | $ 1,016.50 | $ 2.50 |
HypotheticalA | | $ 1,000.00 | $ 1,022.32 | $ 2.51 |
Class C | 1.00% | | | |
Actual | | $ 1,000.00 | $ 1,013.90 | $ 4.99 |
HypotheticalA | | $ 1,000.00 | $ 1,019.84 | $ 5.01 |
Income Replacement 2026 | .00% | | | |
Actual | | $ 1,000.00 | $ 1,018.80 | $ .00 |
HypotheticalA | | $ 1,000.00 | $ 1,024.79 | $ .00 |
Institutional Class | .00% | | | |
Actual | | $ 1,000.00 | $ 1,019.00 | $ .00 |
HypotheticalA | | $ 1,000.00 | $ 1,024.79 | $ .00 |
Fidelity Income Replacement 2028 Fund | | | | |
Class A | .25% | | | |
Actual | | $ 1,000.00 | $ 1,017.30 | $ 1.25 |
HypotheticalA | | $ 1,000.00 | $ 1,023.55 | $ 1.25 |
Class T | .50% | | | |
Actual | | $ 1,000.00 | $ 1,015.90 | $ 2.50 |
HypotheticalA | | $ 1,000.00 | $ 1,022.32 | $ 2.51 |
Class C | 1.00% | | | |
Actual | | $ 1,000.00 | $ 1,013.70 | $ 4.99 |
HypotheticalA | | $ 1,000.00 | $ 1,019.84 | $ 5.01 |
Income Replacement 2028 | .00% | | | |
Actual | | $ 1,000.00 | $ 1,018.50 | $ .00 |
HypotheticalA | | $ 1,000.00 | $ 1,024.79 | $ .00 |
Institutional Class | .00% | | | |
Actual | | $ 1,000.00 | $ 1,018.50 | $ .00 |
HypotheticalA | | $ 1,000.00 | $ 1,024.79 | $ .00 |
Fidelity Income Replacement 2030 Fund | | | | |
Class A | .25% | | | |
Actual | | $ 1,000.00 | $ 1,017.10 | $ 1.25 |
HypotheticalA | | $ 1,000.00 | $ 1,023.55 | $ 1.25 |
Class T | .50% | | | |
Actual | | $ 1,000.00 | $ 1,015.80 | $ 2.50 |
HypotheticalA | | $ 1,000.00 | $ 1,022.32 | $ 2.51 |
| Annualized
Expense Ratio | Beginning
Account Value
February 1, 2011 | Ending
Account Value
July 31, 2011 | Expenses Paid
During Period*
February 1, 2011
to July 31, 2011 |
Class C | 1.00% | | | |
Actual | | $ 1,000.00 | $ 1,013.30 | $ 4.99 |
HypotheticalA | | $ 1,000.00 | $ 1,019.84 | $ 5.01 |
Income Replacement 2030 | .00% | | | |
Actual | | $ 1,000.00 | $ 1,018.30 | $ .00 |
HypotheticalA | | $ 1,000.00 | $ 1,024.79 | $ .00 |
Institutional Class | .00% | | | |
Actual | | $ 1,000.00 | $ 1,018.30 | $ .00 |
HypotheticalA | | $ 1,000.00 | $ 1,024.79 | $ .00 |
Fidelity Income Replacement 2032 Fund | | | | |
Class A | .25% | | | |
Actual | | $ 1,000.00 | $ 1,016.80 | $ 1.25 |
HypotheticalA | | $ 1,000.00 | $ 1,023.55 | $ 1.25 |
Class T | .50% | | | |
Actual | | $ 1,000.00 | $ 1,015.80 | $ 2.50 |
HypotheticalA | | $ 1,000.00 | $ 1,022.32 | $ 2.51 |
Class C | 1.00% | | | |
Actual | | $ 1,000.00 | $ 1,013.00 | $ 4.99 |
HypotheticalA | | $ 1,000.00 | $ 1,019.84 | $ 5.01 |
Income Replacement 2032 | .00% | | | |
Actual | | $ 1,000.00 | $ 1,018.10 | $ .00 |
HypotheticalA | | $ 1,000.00 | $ 1,024.79 | $ .00 |
Institutional Class | .00% | | | |
Actual | | $ 1,000.00 | $ 1,018.10 | $ .00 |
HypotheticalA | | $ 1,000.00 | $ 1,024.79 | $ .00 |
Fidelity Income Replacement 2034 Fund | | | | |
Class A | .25% | | | |
Actual | | $ 1,000.00 | $ 1,016.80 | $ 1.25 |
HypotheticalA | | $ 1,000.00 | $ 1,023.55 | $ 1.25 |
Class T | .50% | | | |
Actual | | $ 1,000.00 | $ 1,015.90 | $ 2.50 |
HypotheticalA | | $ 1,000.00 | $ 1,022.32 | $ 2.51 |
Class C | 1.00% | | | |
Actual | | $ 1,000.00 | $ 1,013.10 | $ 4.99 |
HypotheticalA | | $ 1,000.00 | $ 1,019.84 | $ 5.01 |
Income Replacement 2034 | .00% | | | |
Actual | | $ 1,000.00 | $ 1,018.20 | $ .00 |
HypotheticalA | | $ 1,000.00 | $ 1,024.79 | $ .00 |
Institutional Class | .00% | | | |
Actual | | $ 1,000.00 | $ 1,018.00 | $ .00 |
HypotheticalA | | $ 1,000.00 | $ 1,024.79 | $ .00 |
Fidelity Income Replacement 2036 Fund | | | | |
Class A | .25% | | | |
Actual | | $ 1,000.00 | $ 1,017.00 | $ 1.25 |
HypotheticalA | | $ 1,000.00 | $ 1,023.55 | $ 1.25 |
Class T | .50% | | | |
Actual | | $ 1,000.00 | $ 1,015.50 | $ 2.50 |
HypotheticalA | | $ 1,000.00 | $ 1,022.32 | $ 2.51 |
| Annualized
Expense Ratio | Beginning
Account Value
February 1, 2011 | Ending
Account Value
July 31, 2011 | Expenses Paid
During Period*
February 1, 2011
to July 31, 2011 |
Class C | 1.00% | | | |
Actual | | $ 1,000.00 | $ 1,012.90 | $ 4.99 |
HypotheticalA | | $ 1,000.00 | $ 1,019.84 | $ 5.01 |
Income Replacement 2036 | .00% | | | |
Actual | | $ 1,000.00 | $ 1,018.30 | $ .00 |
HypotheticalA | | $ 1,000.00 | $ 1,024.79 | $ .00 |
Institutional Class | .00% | | | |
Actual | | $ 1,000.00 | $ 1,018.10 | $ .00 |
HypotheticalA | | $ 1,000.00 | $ 1,024.79 | $ .00 |
Fidelity Income Replacement 2038 Fund | | | | |
Class A | .25% | | | |
Actual | | $ 1,000.00 | $ 1,016.70 | $ 1.25 |
HypotheticalA | | $ 1,000.00 | $ 1,023.55 | $ 1.25 |
Class T | .50% | | | |
Actual | | $ 1,000.00 | $ 1,015.60 | $ 2.50 |
HypotheticalA | | $ 1,000.00 | $ 1,022.32 | $ 2.51 |
Class C | 1.00% | | | |
Actual | | $ 1,000.00 | $ 1,012.90 | $ 4.99 |
HypotheticalA | | $ 1,000.00 | $ 1,019.84 | $ 5.01 |
Income Replacement 2038 | .00% | | | |
Actual | | $ 1,000.00 | $ 1,017.90 | $ .00 |
HypotheticalA | | $ 1,000.00 | $ 1,024.79 | $ .00 |
Institutional Class | .00% | | | |
Actual | | $ 1,000.00 | $ 1,018.20 | $ .00 |
HypotheticalA | | $ 1,000.00 | $ 1,024.79 | $ .00 |
Fidelity Income Replacement 2040 Fund | | | | |
Class A | .25% | | | |
Actual | | $ 1,000.00 | $ 1,017.00 | $ 1.25 |
HypotheticalA | | $ 1,000.00 | $ 1,023.55 | $ 1.25 |
Class T | .50% | | | |
Actual | | $ 1,000.00 | $ 1,015.80 | $ 2.50 |
HypotheticalA | | $ 1,000.00 | $ 1,022.32 | $ 2.51 |
Class C | 1.00% | | | |
Actual | | $ 1,000.00 | $ 1,013.40 | $ 4.99 |
HypotheticalA | | $ 1,000.00 | $ 1,019.84 | $ 5.01 |
Income Replacement 2040 | .00% | | | |
Actual | | $ 1,000.00 | $ 1,018.10 | $ .00 |
HypotheticalA | | $ 1,000.00 | $ 1,024.79 | $ .00 |
Institutional Class | .00% | | | |
Actual | | $ 1,000.00 | $ 1,018.30 | $ .00 |
HypotheticalA | | $ 1,000.00 | $ 1,024.79 | $ .00 |
Fidelity Income Replacement 2042 Fund | | | | |
Class A | .25% | | | |
Actual | | $ 1,000.00 | $ 1,016.90 | $ 1.25 |
HypotheticalA | | $ 1,000.00 | $ 1,023.55 | $ 1.25 |
Class T | .50% | | | |
Actual | | $ 1,000.00 | $ 1,015.50 | $ 2.50 |
HypotheticalA | | $ 1,000.00 | $ 1,022.32 | $ 2.51 |
| Annualized
Expense Ratio | Beginning
Account Value
February 1, 2011 | Ending
Account Value
July 31, 2011 | Expenses Paid
During Period*
February 1, 2011
to July 31, 2011 |
Class C | 1.00% | | | |
Actual | | $ 1,000.00 | $ 1,013.00 | $ 4.99 |
HypotheticalA | | $ 1,000.00 | $ 1,019.84 | $ 5.01 |
Income Replacement 2042 | .00% | | | |
Actual | | $ 1,000.00 | $ 1,018.20 | $ .00 |
HypotheticalA | | $ 1,000.00 | $ 1,024.79 | $ .00 |
Institutional Class | .00% | | | |
Actual | | $ 1,000.00 | $ 1,018.20 | $ .00 |
HypotheticalA | | $ 1,000.00 | $ 1,024.79 | $ .00 |
A 5% return per year before expenses
* Expenses are equal to each Class' annualized expense ratio, multiplied by the average account value over the period, multiplied by 181/365 (to reflect the one-half year period). The fees and expenses of the underlying Fidelity Funds in which the Fund invests are not included in the Fund's annualized expense ratio.
Annual Report
Fidelity Income Replacement 2016 Fund
Investment Changes (Unaudited)
Fund Holdings as of July 31, 2011 |
| % of fund's
net assets | % of fund's net assets
6 months ago |
Domestic Equity Funds | | |
Fidelity Advisor Mid Cap II Fund Institutional Class | 2.6 | 2.7 |
Fidelity Disciplined Equity Fund | 2.7 | 2.8 |
Fidelity Equity-Income Fund | 2.7 | 2.8 |
Fidelity Large Cap Core Enhanced Index Fund | 4.4 | 4.5 |
Fidelity Series 100 Index Fund | 3.3 | 3.4 |
Fidelity Series Broad Market Opportunities Fund | 4.3 | 4.5 |
Fidelity Series Small Cap Opportunities Fund | 1.7 | 1.8 |
| 21.7 | 22.5 |
International Equity Funds | | |
Fidelity Advisor International Discovery Fund Institutional Class | 1.3 | 1.8 |
Investment Grade Fixed-Income Funds | | |
Fidelity Government Income Fund | 8.4 | 8.5 |
Fidelity Strategic Real Return Fund | 8.3 | 8.5 |
Fidelity Total Bond Fund | 25.1 | 25.4 |
| 41.8 | 42.4 |
Short-Term Funds | | |
Fidelity Institutional Money Market Portfolio Institutional Class | 17.6 | 16.7 |
Fidelity Short-Term Bond Fund | 17.6 | 16.6 |
| 35.2 | 33.3 |
Net Other Assets (Liabilities)* | 0.0 | 0.0 |
| 100.0 | 100.0 |
* Amount represents less than 0.1% |
Asset Allocation (% of fund's net assets) |
Current |
| Domestic Equity Funds | 21.7% | |
| International Equity Funds | 1.3% | |
| Investment Grade Fixed-Income Funds | 41.8% | |
| Short-Term Funds | 35.2% | |

Six months ago |
| Domestic Equity Funds | 22.5% | |
| International Equity Funds | 1.8% | |
| Investment Grade Fixed-Income Funds | 42.4% | |
| Short-Term Funds | 33.3% | |

Expected |
| Domestic Equity Funds | 19.6% | |
| Investment Grade Fixed-Income Funds | 39.2% | |
| Short-Term Funds | 41.2% | |

The fund invests according to an asset allocation strategy that becomes increasingly conservative over time. The six months ago allocation is based on the fund's holdings as of January 31, 2011. The current allocation is based on the fund's holdings as of July 31, 2011. The expected allocation represents the fund's anticipated allocation at January 31, 2012. |
Annual Report
Fidelity Income Replacement 2016 Fund
Investments July 31, 2011
Showing Percentage of Net Assets
Equity Funds - 23.0% |
| Shares | | Value |
Domestic Equity Funds - 21.7% |
Fidelity Advisor Mid Cap II Fund Institutional Class (a) | 14,293 | | $ 259,125 |
Fidelity Disciplined Equity Fund | 11,630 | | 270,745 |
Fidelity Equity-Income Fund | 6,014 | | 266,787 |
Fidelity Large Cap Core Enhanced Index Fund | 49,020 | | 439,710 |
Fidelity Series 100 Index Fund | 36,581 | | 331,061 |
Fidelity Series Broad Market Opportunities Fund | 42,034 | | 432,954 |
Fidelity Series Small Cap Opportunities Fund | 15,316 | | 171,843 |
TOTAL DOMESTIC EQUITY FUNDS | | 2,172,225 |
International Equity Funds - 1.3% |
Fidelity Advisor International Discovery Fund Institutional Class | 3,909 | | 131,470 |
TOTAL EQUITY FUNDS (Cost $1,993,231) | 2,303,695 |
Fixed-Income Funds - 41.8% |
| | | |
Investment Grade Fixed-Income Funds - 41.8% |
Fidelity Government Income Fund | 78,455 | | 837,896 |
Fidelity Strategic Real Return Fund | 84,075 | | 835,706 |
Fidelity Total Bond Fund | 227,982 | | 2,510,085 |
TOTAL FIXED-INCOME FUNDS (Cost $3,886,859) | 4,183,687 |
Short-Term Funds - 35.2% |
| Shares | | Value |
Fidelity Institutional Money Market Portfolio Institutional Class | 1,755,301 | | $ 1,755,301 |
Fidelity Short-Term Bond Fund | 206,579 | | 1,764,185 |
TOTAL SHORT-TERM FUNDS (Cost $3,481,782) | 3,519,486 |
TOTAL INVESTMENT PORTFOLIO - 100.0% (Cost $9,361,872) | | 10,006,868 |
NET OTHER ASSETS (LIABILITIES) - 0.0% | | (4,805) |
NET ASSETS - 100% | $ 10,002,063 |
Legend |
(a) Non-income producing |
Other Information |
All investments are categorized as Level 1 under the Fair Value Hierarchy. The inputs or methodology used for valuing securities may not be an indication of the risk associated with investing in those securities. For more information on valuation inputs, please refer to the Security Valuation section in the accompanying Notes to Financial Statements. |
Income Tax Information |
At July 31, 2011, the Fund had a capital loss carryforward of approximately $373,492 of which $11,321, $234,074 and $128,097 will expire in fiscal 2017, 2018 and 2019, respectively. Capital loss carryforwards are only available to offset future capital gains of the Fund to the extent provided by regulations and may be limited. |
See accompanying notes which are an integral part of the financial statements.
Annual Report
Fidelity Income Replacement 2016 Fund
Statement of Assets and Liabilities
| July 31, 2011 |
| | |
Assets | | |
Investment in securities, at value (cost $9,361,872) - See accompanying schedule | | $ 10,006,868 |
Cash | | 11 |
Receivable for investments sold | | 14,782 |
Total assets | | 10,021,661 |
| | |
Liabilities | | |
Payable for investments purchased | $ 42 | |
Payable for fund shares redeemed | 18,009 | |
Distribution and service plan fees payable | 1,547 | |
Total liabilities | | 19,598 |
| | |
Net Assets | | $ 10,002,063 |
Net Assets consist of: | | |
Paid in capital | | $ 9,960,023 |
Undistributed net investment income | | 2,169 |
Accumulated undistributed net realized gain (loss) on investments | | (605,125) |
Net unrealized appreciation (depreciation) on investments | | 644,996 |
Net Assets | | $ 10,002,063 |
| | |
Calculation of Maximum Offering Price Class A:
Net Asset Value and redemption price per share ($1,798,102 ÷ 36,094.44 shares) | | $ 49.82 |
| | |
Maximum offering price per share (100/94.25 of $49.82) | | $ 52.86 |
| | |
Class T:
Net Asset Value and redemption price per share ($528,707 ÷ 10,613.41 shares) | | $ 49.81 |
| | |
Maximum offering price per share (100/96.50 of $49.81) | | $ 51.62 |
| | |
Class C:
Net Asset Value and offering price per share ($758,875 ÷ 15,230.25 shares)A | | $ 49.83 |
| | |
Income Replacement 2016:
Net Asset Value, offering price and redemption price per share ($6,872,705 ÷ 137,934.45 shares) | | $ 49.83 |
| | |
Institutional Class:
Net Asset Value, offering price and redemption price per share ($43,674 ÷ 876.50 shares) | | $ 49.83 |
A Redemption price per share is equal to net asset value less any applicable contingent deferred sales charge.
Statement of Operations
| Year ended July 31, 2011 |
| | |
Investment Income | | |
Income distributions from underlying funds | | $ 212,369 |
| | |
Expenses | | |
Distribution and service plan fees | $ 19,517 | |
Independent trustees' compensation | 40 | |
Total expenses before reductions | 19,557 | |
Expense reductions | (40) | 19,517 |
Net investment income (loss) | | 192,852 |
Realized and Unrealized Gain (Loss) Realized gain (loss) on sale of underlying fund shares | (129,144) | |
Capital gain distributions from underlying funds | 78,190 | |
Total net realized gain (loss) | | (50,954) |
Change in net unrealized appreciation (depreciation) on underlying funds | | 761,739 |
Net gain (loss) | | 710,785 |
Net increase (decrease) in net assets resulting from operations | | $ 903,637 |
See accompanying notes which are an integral part of the financial statements.
Annual Report
Statement of Changes in Net Assets
| Year ended
July 31, 2011 | Year ended
July 31, 2010 |
Increase (Decrease) in Net Assets | | |
Operations | | |
Net investment income (loss) | $ 192,852 | $ 190,860 |
Net realized gain (loss) | (50,954) | (128,722) |
Change in net unrealized appreciation (depreciation) | 761,739 | 877,831 |
Net increase (decrease) in net assets resulting from operations | 903,637 | 939,969 |
Distributions to shareholders from net investment income | (194,425) | (190,322) |
Distributions to shareholders from net realized gain | (58,747) | (25,833) |
Total distributions | (253,172) | (216,155) |
Share transactions - net increase (decrease) | (1,722,258) | 1,239,040 |
Total increase (decrease) in net assets | (1,071,793) | 1,962,854 |
| | |
Net Assets | | |
Beginning of period | 11,073,856 | 9,111,002 |
End of period (including undistributed net investment income of $2,169 and undistributed net investment income of $3,810, respectively) | $ 10,002,063 | $ 11,073,856 |
Financial Highlights - Class A
Years ended July 31, | 2011 | 2010 | 2009 | 2008G |
Selected Per-Share Data | | | | |
Net asset value, beginning of period | $ 47.04 | $ 43.62 | $ 47.76 | $ 50.00 |
Income from Investment Operations | | | | |
Net investment income (loss)E | .821 | .831 | 1.118 | 1.233 |
Net realized and unrealized gain (loss) | 3.054 | 3.539 | (3.686) | (2.204) |
Total from investment operations | 3.875 | 4.370 | (2.568) | (.971) |
Distributions from net investment income | (.834) | (.830) | (1.132) | (1.129) |
Distributions from net realized gain | (.261) | (.120) | (.440) | (.140) |
Total distributions | (1.095) | (.950) | (1.572) | (1.269) |
Net asset value, end of period | $ 49.82 | $ 47.04 | $ 43.62 | $ 47.76 |
Total ReturnB,C,D | 8.30% | 10.08% | (5.07)% | (2.02)% |
Ratios to Average Net AssetsF,H | | | | |
Expenses before reductions | .25% | .25% | .25% | .25%A |
Expenses net of fee waivers, if any | .25% | .25% | .25% | .25%A |
Expenses net of all reductions | .25% | .25% | .25% | .25%A |
Net investment income (loss) | 1.68% | 1.80% | 2.72% | 2.76%A |
Supplemental Data | | | | |
Net assets, end of period (000 omitted) | $ 1,798 | $ 2,308 | $ 2,599 | $ 2,214 |
Portfolio turnover rate | 31% | 40% | 54% | 56%A |
A Annualized
B Total returns for periods of less than one year are not annualized.
C Total returns would have been lower if certain expenses had not been reduced during the applicable periods shown.
D Total returns do not include the effect of the sales charges.
E Calculated based on average shares outstanding during the period.
F Amounts do not include the activity of the underlying funds.
G For the period August 30, 2007 (commencement of operations) to July 31, 2008.
H Expense ratios reflect operating expenses of the class. Expenses before reductions do not reflect amounts reimbursed by the investment adviser or reductions from expense offset arrangements and do not represent the amount paid by the class during periods when reimbursements or reductions occur. Expenses net of fee waivers reflect expenses after reimbursement by the investment adviser but prior to reductions from expense offset arrangements. Expenses net of all reductions represent the net expenses paid by the class but do not include expenses of the investment companies in which the Fund invests.
See accompanying notes which are an integral part of the financial statements.
Annual Report
Financial Highlights - Class T
Years ended July 31, | 2011 | 2010 | 2009 | 2008G |
Selected Per-Share Data | | | | |
Net asset value, beginning of period | $ 47.04 | $ 43.62 | $ 47.75 | $ 50.00 |
Income from Investment Operations | | | | |
Net investment income (loss)E | .698 | .716 | 1.025 | 1.128 |
Net realized and unrealized gain (loss) | 3.043 | 3.540 | (3.690) | (2.219) |
Total from investment operations | 3.741 | 4.256 | (2.665) | (1.091) |
Distributions from net investment income | (.710) | (.716) | (1.025) | (1.019) |
Distributions from net realized gain | (.261) | (.120) | (.440) | (.140) |
Total distributions | (.971) | (.836) | (1.465) | (1.159) |
Net asset value, end of period | $ 49.81 | $ 47.04 | $ 43.62 | $ 47.75 |
Total ReturnB,C,D | 8.00% | 9.81% | (5.30)% | (2.26)% |
Ratios to Average Net AssetsF,H | | | | |
Expenses before reductions | .50% | .50% | .50% | .50%A |
Expenses net of fee waivers, if any | .50% | .50% | .50% | .50%A |
Expenses net of all reductions | .50% | .50% | .50% | .50%A |
Net investment income (loss) | 1.42% | 1.55% | 2.47% | 2.51%A |
Supplemental Data | | | | |
Net assets, end of period (000 omitted) | $ 529 | $ 638 | $ 499 | $ 673 |
Portfolio turnover rate | 31% | 40% | 54% | 56%A |
A Annualized
B Total returns for periods of less than one year are not annualized.
C Total returns would have been lower if certain expenses had not been reduced during the applicable periods shown.
D Total returns do not include the effect of the sales charges.
E Calculated based on average shares outstanding during the period.
F Amounts do not include the activity of the underlying funds.
G For the period August 30, 2007 (commencement of operations) to July 31, 2008.
H Expense ratios reflect operating expenses of the class. Expenses before reductions do not reflect amounts reimbursed by the investment adviser or reductions from expense offset arrangements and do not represent the amount paid by the class during periods when reimbursements or reductions occur. Expenses net of fee waivers reflect expenses after reimbursement by the investment adviser but prior to reductions from expense offset arrangements. Expenses net of all reductions represent the net expenses paid by the class but do not include expenses of the investment companies in which the Fund invests.
Financial Highlights - Class C
Years ended July 31, | 2011 | 2010 | 2009 | 2008G |
Selected Per-Share Data | | | | |
Net asset value, beginning of period | $ 47.03 | $ 43.61 | $ 47.73 | $ 50.00 |
Income from Investment Operations | | | | |
Net investment income (loss)E | .453 | .485 | .822 | .904 |
Net realized and unrealized gain (loss) | 3.055 | 3.531 | (3.689) | (2.227) |
Total from investment operations | 3.508 | 4.016 | (2.867) | (1.323) |
Distributions from net investment income | (.447) | (.476) | (.813) | (.807) |
Distributions from net realized gain | (.261) | (.120) | (.440) | (.140) |
Total distributions | (.708) | (.596) | (1.253) | (.947) |
Net asset value, end of period | $ 49.83 | $ 47.03 | $ 43.61 | $ 47.73 |
Total ReturnB,C,D | 7.49% | 9.24% | (5.76)% | (2.71)% |
Ratios to Average Net AssetsF,H | | | | |
Expenses before reductions | 1.00% | 1.00% | 1.00% | 1.00%A |
Expenses net of fee waivers, if any | 1.00% | 1.00% | 1.00% | 1.00%A |
Expenses net of all reductions | 1.00% | 1.00% | 1.00% | 1.00%A |
Net investment income (loss) | .92% | 1.05% | 1.97% | 2.01%A |
Supplemental Data | | | | |
Net assets, end of period (000 omitted) | $ 759 | $ 1,075 | $ 1,171 | $ 1,595 |
Portfolio turnover rate | 31% | 40% | 54% | 56%A |
A Annualized
B Total returns for periods of less than one year are not annualized.
C Total returns would have been lower if certain expenses had not been reduced during the applicable periods shown.
D Total returns do not include the effect of the contingent deferred sales charge.
E Calculated based on average shares outstanding during the period.
F Amounts do not include the activity of the underlying funds.
G For the period August 30, 2007 (commencement of operations) to July 31, 2008.
H Expense ratios reflect operating expenses of the class. Expenses before reductions do not reflect amounts reimbursed by the investment adviser or reductions from expense offset arrangements and do not represent the amount paid by the class during periods when reimbursements or reductions occur. Expenses net of fee waivers reflect expenses after reimbursement by the investment adviser but prior to reductions from expense offset arrangements. Expenses net of all reductions represent the net expenses paid by the class but do not include expenses of the investment companies in which the Fund invests.
See accompanying notes which are an integral part of the financial statements.
Annual Report
Financial Highlights - Income Replacement 2016
Years ended July 31, | 2011 | 2010 | 2009 | 2008G |
Selected Per-Share Data | | | | |
Net asset value, beginning of period | $ 47.05 | $ 43.63 | $ 47.77 | $ 50.00 |
Income from Investment Operations | | | | |
Net investment income (loss)D | .944 | .948 | 1.231 | 1.356 |
Net realized and unrealized gain (loss) | 3.055 | 3.539 | (3.692) | (2.217) |
Total from investment operations | 3.999 | 4.487 | (2.461) | (.861) |
Distributions from net investment income | (.958) | (.947) | (1.239) | (1.229) |
Distributions from net realized gain | (.261) | (.120) | (.440) | (.140) |
Total distributions | (1.219) | (1.067) | (1.679) | (1.369) |
Net asset value, end of period | $ 49.83 | $ 47.05 | $ 43.63 | $ 47.77 |
Total ReturnB,C | 8.57% | 10.36% | (4.82)% | (1.81)% |
Ratios to Average Net AssetsE,H | | | | |
Expenses before reductionsF | .00% | .00% | .00% | .00%A |
Expenses net of fee waivers, if any | .00% | .00% | .00% | .00%A |
Expenses net of all reductions | .00% | .00% | .00% | .00%A |
Net investment income (loss) | 1.93% | 2.05% | 2.97% | 3.00%A |
Supplemental Data | | | | |
Net assets, end of period (000 omitted) | $ 6,873 | $ 6,946 | $ 4,733 | $ 4,880 |
Portfolio turnover rate | 31% | 40% | 54% | 56%A |
A Annualized
B Total returns for periods of less than one year are not annualized.
C Total returns would have been lower if certain expenses had not been reduced during the applicable periods shown.
D Calculated based on average shares outstanding during the period.
E Amounts do not include the activity of the underlying funds.
F Amount represents less than .01%.
G For the period August 30, 2007 (commencement of operations) to July 31, 2008.
H Expense ratios reflect operating expenses of the class. Expenses before reductions do not reflect amounts reimbursed by the investment adviser or reductions from expense offset arrangements and do not represent the amount paid by the class during periods when reimbursements or reductions occur. Expenses net of fee waivers reflect expenses after reimbursement by the investment adviser but prior to reductions from expense offset arrangements. Expenses net of all reductions represent the net expenses paid by the class but do not include expenses of the investment companies in which the Fund invests.
Financial Highlights - Institutional Class
Years ended July 31, | 2011 | 2010 | 2009 | 2008G |
Selected Per-Share Data | | | | |
Net asset value, beginning of period | $ 47.05 | $ 43.64 | $ 47.77 | $ 50.00 |
Income from Investment Operations | | | | |
Net investment income (loss)D | .945 | .947 | 1.235 | 1.370 |
Net realized and unrealized gain (loss) | 3.054 | 3.530 | (3.686) | (2.231) |
Total from investment operations | 3.999 | 4.477 | (2.451) | (.861) |
Distributions from net investment income | (.958) | (.947) | (1.239) | (1.229) |
Distributions from net realized gain | (.261) | (.120) | (.440) | (.140) |
Total distributions | (1.219) | (1.067) | (1.679) | (1.369) |
Net asset value, end of period | $ 49.83 | $ 47.05 | $ 43.64 | $ 47.77 |
Total ReturnB,C | 8.57% | 10.33% | (4.80)% | (1.81)% |
Ratios to Average Net AssetsE,H | | | | |
Expenses before reductionsF | .00% | .00% | .00% | .00%A |
Expenses net of fee waivers, if any | .00% | .00% | .00% | .00%A |
Expenses net of all reductions | .00% | .00% | .00% | .00%A |
Net investment income (loss) | 1.92% | 2.05% | 2.97% | 3.00%A |
Supplemental Data | | | | |
Net assets, end of period (000 omitted) | $ 44 | $ 108 | $ 109 | $ 184 |
Portfolio turnover rate | 31% | 40% | 54% | 56%A |
A Annualized
B Total returns for periods of less than one year are not annualized.
C Total returns would have been lower if certain expenses had not been reduced during the applicable periods shown.
D Calculated based on average shares outstanding during the period.
E Amounts do not include the activity of the underlying funds.
F Amount represents less than .01%.
G For the period August 30, 2007 (commencement of operations) to July 31, 2008.
H Expense ratios reflect operating expenses of the class. Expenses before reductions do not reflect amounts reimbursed by the investment adviser or reductions from expense offset arrangements and do not represent the amount paid by the class during periods when reimbursements or reductions occur. Expenses net of fee waivers reflect expenses after reimbursement by the investment adviser but prior to reductions from expense offset arrangements. Expenses net of all reductions represent the net expenses paid by the class but do not include expenses of the investment companies in which the Fund invests.
See accompanying notes which are an integral part of the financial statements.
Annual Report
Fidelity Income Replacement 2018 Fund
Investment Changes (Unaudited)
Fund Holdings as of July 31, 2011 |
| % of fund's
net assets | % of fund's net assets
6 months ago |
Domestic Equity Funds | | |
Fidelity Advisor Mid Cap II Fund Institutional Class | 3.4 | 3.5 |
Fidelity Disciplined Equity Fund | 3.5 | 3.7 |
Fidelity Equity-Income Fund | 3.5 | 3.7 |
Fidelity Large Cap Core Enhanced Index Fund | 5.7 | 5.9 |
Fidelity Series 100 Index Fund | 4.3 | 4.4 |
Fidelity Series Broad Market Opportunities Fund | 5.7 | 5.9 |
Fidelity Series Small Cap Opportunities Fund | 2.3 | 2.4 |
| 28.4 | 29.5 |
International Equity Funds | | |
Fidelity Advisor International Discovery Fund Institutional Class | 2.7 | 2.9 |
High Yield Fixed-Income Funds | | |
Fidelity Capital & Income Fund | 0.6 | 0.9 |
Fidelity Strategic Income Fund | 0.7 | 0.8 |
| 1.3 | 1.7 |
Investment Grade Fixed-Income Funds | | |
Fidelity Government Income Fund | 7.9 | 7.8 |
Fidelity Strategic Real Return Fund | 7.9 | 7.8 |
Fidelity Total Bond Fund | 23.7 | 23.3 |
| 39.5 | 38.9 |
Short-Term Funds | | |
Fidelity Institutional Money Market Portfolio Institutional Class | 14.0 | 13.5 |
Fidelity Short-Term Bond Fund | 14.1 | 13.5 |
| 28.1 | 27.0 |
Net Other Assets (Liabilities)* | 0.0 | 0.0 |
| 100.0 | 100.0 |
* Amount represents less than 0.1% |
Asset Allocation (% of fund's net assets) |
Current |
| Domestic Equity Funds | 28.4% | |
| International Equity Funds | 2.7% | |
| High Yield
Fixed-Income Funds | 1.3% | |
| Investment Grade Fixed-Income Funds | 39.5% | |
 | Short-Term Funds | 28.1% | |

Six months ago |
| Domestic Equity Funds | 29.5% | |
| International Equity Funds | 2.9% | |
| High Yield
Fixed-Income Funds | 1.7% | |
| Investment Grade Fixed-Income Funds | 38.9% | |
| Short-Term Funds | 27.0% | |

Expected |
| Domestic Equity Funds | 26.1% | |
| International Equity Funds | 2.4% | |
| Investment Grade Fixed-Income Funds | 41.0% | |
| Short-Term Funds | 30.5% | |

The fund invests according to an asset allocation strategy that becomes increasingly conservative over time. The six months ago allocation is based on the fund's holdings as of January 31, 2011. The current allocation is based on the fund's holdings as of July 31, 2011. The expected allocation represents the fund's anticipated allocation at January 31, 2012. |
Annual Report
Fidelity Income Replacement 2018 Fund
Investments July 31, 2011
Showing Percentage of Net Assets
Equity Funds - 31.1% |
| Shares | | Value |
Domestic Equity Funds - 28.4% |
Fidelity Advisor Mid Cap II Fund Institutional Class (a) | 9,863 | | $ 178,808 |
Fidelity Disciplined Equity Fund | 8,010 | | 186,461 |
Fidelity Equity-Income Fund | 4,146 | | 183,907 |
Fidelity Large Cap Core Enhanced Index Fund | 33,811 | | 303,289 |
Fidelity Series 100 Index Fund | 25,174 | | 227,828 |
Fidelity Series Broad Market Opportunities Fund | 29,020 | | 298,906 |
Fidelity Series Small Cap Opportunities Fund | 10,586 | | 118,778 |
TOTAL DOMESTIC EQUITY FUNDS | | 1,497,977 |
International Equity Funds - 2.7% |
Fidelity Advisor International Discovery Fund Institutional Class | 4,291 | | 144,302 |
TOTAL EQUITY FUNDS (Cost $1,593,440) | 1,642,279 |
Fixed-Income Funds - 40.8% |
| | | |
High Yield Fixed-Income Funds - 1.3% |
Fidelity Capital & Income Fund | 3,456 | | 33,079 |
Fidelity Strategic Income Fund | 2,994 | | 34,068 |
TOTAL HIGH YIELD FIXED-INCOME FUNDS | | 67,147 |
|
| Shares | | Value |
Investment Grade Fixed-Income Funds - 39.5% |
Fidelity Government Income Fund | 39,200 | | $ 418,660 |
Fidelity Strategic Real Return Fund | 41,988 | | 417,364 |
Fidelity Total Bond Fund | 113,818 | | 1,253,133 |
TOTAL INVESTMENT GRADE FIXED-INCOME FUNDS | | 2,089,157 |
TOTAL FIXED-INCOME FUNDS (Cost $2,030,227) | 2,156,304 |
Short-Term Funds - 28.1% |
| | | |
Fidelity Institutional Money Market Portfolio Institutional Class | 740,895 | | 740,895 |
Fidelity Short-Term Bond Fund | 87,317 | | 745,686 |
TOTAL SHORT-TERM FUNDS (Cost $1,474,109) | 1,486,581 |
TOTAL INVESTMENT PORTFOLIO - 100.0% (Cost $5,097,776) | | 5,285,164 |
NET OTHER ASSETS (LIABILITIES) - 0.0% | | (448) |
NET ASSETS - 100% | $ 5,284,716 |
Legend |
(a) Non-income producing |
Other Information |
All investments are categorized as Level 1 under the Fair Value Hierarchy. The inputs or methodology used for valuing securities may not be an indication of the risk associated with investing in those securities. For more information on valuation inputs, please refer to the Security Valuation section in the accompanying Notes to Financial Statements. |
Income Tax Information |
At July 31, 2011, the Fund had a capital loss carryforward of approximately $571,622 of which $123,548, $410,862 and $37,212 will expire in fiscal 2017, 2018 and 2019, respectively. Capital loss carryforwards are only available to offset future capital gains of the Fund to the extent provided by regulations and may be limited. |
See accompanying notes which are an integral part of the financial statements.
Annual Report
Fidelity Income Replacement 2018 Fund
Statement of Assets and Liabilities
| July 31, 2011 |
| | |
Assets | | |
Investment in securities, at value (cost $5,097,776) - See accompanying schedule | | $ 5,285,164 |
Receivable for investments sold | | 25,688 |
Total assets | | 5,310,852 |
| | |
Liabilities | | |
Payable for investments purchased | $ 25,721 | |
Distribution and service plan fees payable | 415 | |
Total liabilities | | 26,136 |
| | |
Net Assets | | $ 5,284,716 |
Net Assets consist of: | | |
Paid in capital | | $ 5,802,658 |
Undistributed net investment income | | 1,141 |
Accumulated undistributed net realized gain (loss) on investments | | (706,471) |
Net unrealized appreciation (depreciation) on investments | | 187,388 |
Net Assets | | $ 5,284,716 |
| | |
Calculation of Maximum Offering Price Class A:
Net Asset Value and redemption price per share ($783,795 ÷ 15,715.6 shares) | | $ 49.87 |
| | |
Maximum offering price per share (100/94.25 of $49.87) | | $ 52.91 |
| | |
Class T:
Net Asset Value and redemption price per share ($148,019 ÷ 2,966.4 shares) | | $ 49.90 |
| | |
Maximum offering price per share (100/96.50 of $49.90) | | $ 51.71 |
| | |
Class C:
Net Asset Value and offering price per share ($225,996 ÷ 4,533.7 shares)A | | $ 49.85 |
| | |
Income Replacement 2018:
Net Asset Value, offering price and redemption price per share ($3,806,441 ÷ 76,308.6 shares) | | $ 49.88 |
| | |
Institutional Class:
Net Asset Value, offering price and redemption price per share ($320,465 ÷ 6,423.8 shares) | | $ 49.89 |
A Redemption price per share is equal to net asset value less any applicable contingent deferred sales charge.
Statement of Operations
| Year ended July 31, 2011 |
| | |
Investment Income | | |
Income distributions from underlying funds | | $ 111,451 |
| | |
Expenses | | |
Distribution and service plan fees | $ 5,142 | |
Independent trustees' compensation | 21 | |
Total expenses before reductions | 5,163 | |
Expense reductions | (21) | 5,142 |
Net investment income (loss) | | 106,309 |
Realized and Unrealized Gain (Loss) Realized gain (loss) on sale of underlying fund shares | (39,850) | |
Capital gain distributions from underlying funds | 38,940 | |
Total net realized gain (loss) | | (910) |
Change in net unrealized appreciation (depreciation) on underlying funds | | 449,375 |
Net gain (loss) | | 448,465 |
Net increase (decrease) in net assets resulting from operations | | $ 554,774 |
See accompanying notes which are an integral part of the financial statements.
Annual Report
Statement of Changes in Net Assets
| Year ended
July 31, 2011 | Year ended
July 31, 2010 |
Increase (Decrease) in Net Assets | | |
Operations | | |
Net investment income (loss) | $ 106,309 | $ 103,982 |
Net realized gain (loss) | (910) | (68,006) |
Change in net unrealized appreciation (depreciation) | 449,375 | 484,491 |
Net increase (decrease) in net assets resulting from operations | 554,774 | 520,467 |
Distributions to shareholders from net investment income | (106,906) | (103,950) |
Distributions to shareholders from net realized gain | (28,806) | (13,543) |
Total distributions | (135,712) | (117,493) |
Share transactions - net increase (decrease) | (565,574) | 211,898 |
Total increase (decrease) in net assets | (146,512) | 614,872 |
| | |
Net Assets | | |
Beginning of period | 5,431,228 | 4,816,356 |
End of period (including undistributed net investment income of $1,141 and undistributed net investment income of $1,816, respectively) | $ 5,284,716 | $ 5,431,228 |
Financial Highlights - Class A
Years ended July 31, | 2011 | 2010 | 2009 | 2008G |
Selected Per-Share Data | | | | |
Net asset value, beginning of period | $ 46.45 | $ 42.81 | $ 47.46 | $ 50.00 |
Income from Investment Operations | | | | |
Net investment income (loss)E | .836 | .836 | 1.092 | 1.163 |
Net realized and unrealized gain (loss) | 3.655 | 3.763 | (4.138) | (2.454) |
Total from investment operations | 4.491 | 4.599 | (3.046) | (1.291) |
Distributions from net investment income | (.834) | (.839) | (1.124) | (1.119) |
Distributions from net realized gain | (.237) | (.120) | (.480) | (.130) |
Total distributions | (1.071) | (.959) | (1.604) | (1.249) |
Net asset value, end of period | $ 49.87 | $ 46.45 | $ 42.81 | $ 47.46 |
Total ReturnB,C,D | 9.73% | 10.80% | (6.06)% | (2.68)% |
Ratios to Average Net AssetsF,H | | | | |
Expenses before reductions | .25% | .25% | .25% | .25%A |
Expenses net of fee waivers, if any | .25% | .25% | .25% | .25%A |
Expenses net of all reductions | .25% | .25% | .25% | .25%A |
Net investment income (loss) | 1.71% | 1.83% | 2.69% | 2.60%A |
Supplemental Data | | | | |
Net assets, end of period (000 omitted) | $ 784 | $ 1,147 | $ 833 | $ 1,107 |
Portfolio turnover rate | 39% | 24% | 51% | 46%A |
A Annualized
B Total returns for periods of less than one year are not annualized.
C Total returns would have been lower if certain expenses had not been reduced during the applicable periods shown.
D Total returns do not include the effect of the sales charges.
E Calculated based on average shares outstanding during the period.
F Amounts do not include the activity of the underlying funds.
G For the period August 30, 2007 (commencement of operations) to July 31, 2008.
H Expense ratios reflect operating expenses of the class. Expenses before reductions do not reflect amounts reimbursed by the investment adviser or reductions from expense offset arrangements and do not represent the amount paid by the class during periods when reimbursements or reductions occur. Expenses net of fee waivers reflect expenses after reimbursement by the investment adviser but prior to reductions from expense offset arrangements. Expenses net of all reductions represent the net expenses paid by the class but do not include expenses of the investment companies in which the Fund invests.
See accompanying notes which are an integral part of the financial statements.
Annual Report
Financial Highlights - Class T
Years ended July 31, | 2011 | 2010 | 2009 | 2008 G |
Selected Per-Share Data | | | | |
Net asset value, beginning of period | $ 46.48 | $ 42.83 | $ 47.46 | $ 50.00 |
Income from Investment Operations | | | | |
Net investment income (loss)E | .716 | .722 | .989 | 1.075 |
Net realized and unrealized gain (loss) | 3.664 | 3.759 | (4.128) | (2.483) |
Total from investment operations | 4.380 | 4.481 | (3.139) | (1.408) |
Distributions from net investment income | (.723) | (.711) | (1.011) | (1.002) |
Distributions from net realized gain | (.237) | (.120) | (.480) | (.130) |
Total distributions | (.960) | (.831) | (1.491) | (1.132) |
Net asset value, end of period | $ 49.90 | $ 46.48 | $ 42.83 | $ 47.46 |
Total ReturnB,C,D | 9.48% | 10.51% | (6.28)% | (2.91)% |
Ratios to Average Net AssetsF,H | | | | |
Expenses before reductions | .50% | .50% | .50% | .50%A |
Expenses net of fee waivers, if any | .50% | .50% | .50% | .50%A |
Expenses net of all reductions | .50% | .50% | .50% | .50%A |
Net investment income (loss) | 1.46% | 1.58% | 2.44% | 2.35%A |
Supplemental Data | | | | |
Net assets, end of period (000 omitted) | $ 148 | $ 52 | $ 91 | $ 154 |
Portfolio turnover rate | 39% | 24% | 51% | 46%A |
A Annualized
B Total returns for periods of less than one year are not annualized.
C Total returns would have been lower if certain expenses had not been reduced during the applicable periods shown.
D Total returns do not include the effect of the sales charges.
E Calculated based on average shares outstanding during the period.
F Amounts do not include the activity of the underlying funds.
G For the period August 30, 2007 (commencement of operations) to July 31, 2008.
H Expense ratios reflect operating expenses of the class. Expenses before reductions do not reflect amounts reimbursed by the investment adviser or reductions from expense offset arrangements and do not represent the amount paid by the class during periods when reimbursements or reductions occur. Expenses net of fee waivers reflect expenses after reimbursement by the investment adviser but prior to reductions from expense offset arrangements. Expenses net of all reductions represent the net expenses paid by the class but do not include expenses of the investment companies in which the Fund invests.
Financial Highlights - Class C
Years ended July 31, | 2011 | 2010 | 2009 | 2008G |
Selected Per-Share Data | | | | |
Net asset value, beginning of period | $ 46.43 | $ 42.80 | $ 47.41 | $ 50.00 |
Income from Investment Operations | | | | |
Net investment income (loss)E | .469 | .495 | .786 | .836 |
Net realized and unrealized gain (loss) | 3.659 | 3.760 | (4.122) | (2.476) |
Total from investment operations | 4.128 | 4.255 | (3.336) | (1.640) |
Distributions from net investment income | (.471) | (.505) | (.794) | (.820) |
Distributions from net realized gain | (.237) | (.120) | (.480) | (.130) |
Total distributions | (.708) | (.625) | (1.274) | (.950) |
Net asset value, end of period | $ 49.85 | $ 46.43 | $ 42.80 | $ 47.41 |
Total ReturnB,C,D | 8.93% | 9.98% | (6.75)% | (3.36)% |
Ratios to Average Net AssetsF,H | | | | |
Expenses before reductions | 1.00% | 1.00% | 1.00% | 1.00%A |
Expenses net of fee waivers, if any | 1.00% | 1.00% | 1.00% | 1.00%A |
Expenses net of all reductions | 1.00% | 1.00% | 1.00% | 1.00%A |
Net investment income (loss) | .96% | 1.08% | 1.94% | 1.85%A |
Supplemental Data | | | | |
Net assets, end of period (000 omitted) | $ 226 | $ 201 | $ 131 | $ 365 |
Portfolio turnover rate | 39% | 24% | 51% | 46%A |
A Annualized
B Total returns for periods of less than one year are not annualized.
C Total returns would have been lower if certain expenses had not been reduced during the applicable periods shown.
D Total returns do not include the effect of the contingent deferred sales charge.
E Calculated based on average shares outstanding during the period.
F Amounts do not include the activity of the underlying funds.
G For the period August 30, 2007 (commencement of operations) to July 31, 2008.
H Expense ratios reflect operating expenses of the class. Expenses before reductions do not reflect amounts reimbursed by the investment adviser or reductions from expense offset arrangements and do not represent the amount paid by the class during periods when reimbursements or reductions occur. Expenses net of fee waivers reflect expenses after reimbursement by the investment adviser but prior to reductions from expense offset arrangements. Expenses net of all reductions represent the net expenses paid by the class but do not include expenses of the investment companies in which the Fund invests.
See accompanying notes which are an integral part of the financial statements.
Annual Report
Financial Highlights - Income Replacement 2018
Years ended July 31, | 2011 | 2010 | 2009 | 2008G |
Selected Per-Share Data | | | | |
Net asset value, beginning of period | $ 46.46 | $ 42.82 | $ 47.46 | $ 50.00 |
Income from Investment Operations | | | | |
Net investment income (loss)D | .960 | .950 | 1.202 | 1.280 |
Net realized and unrealized gain (loss) | 3.657 | 3.761 | (4.138) | (2.469) |
Total from investment operations | 4.617 | 4.711 | (2.936) | (1.189) |
Distributions from net investment income | (.960) | (.951) | (1.224) | (1.221) |
Distributions from net realized gain | (.237) | (.120) | (.480) | (.130) |
Total distributions | (1.197) | (1.071) | (1.704) | (1.351) |
Net asset value, end of period | $ 49.88 | $ 46.46 | $ 42.82 | $ 47.46 |
Total ReturnB,C | 10.01% | 11.07% | (5.81)% | (2.48)% |
Ratios to Average Net AssetsE,H | | | | |
Expenses before reductionsF | .00% | .00% | .00% | .00%A |
Expenses net of fee waivers, if any | .00% | .00% | .00% | .00%A |
Expenses net of all reductions | .00% | .00% | .00% | .00%A |
Net investment income (loss) | 1.96% | 2.08% | 2.94% | 2.85%A |
Supplemental Data | | | | |
Net assets, end of period (000 omitted) | $ 3,806 | $ 3,681 | $ 3,435 | $ 5,167 |
Portfolio turnover rate | 39% | 24% | 51% | 46%A |
A Annualized
B Total returns for periods of less than one year are not annualized.
C Total returns would have been lower if certain expenses had not been reduced during the applicable periods shown.
D Calculated based on average shares outstanding during the period.
E Amounts do not include the activity of the underlying funds.
F Amount represents less than .01%.
G For the period August 30, 2007 (commencement of operations) to July 31, 2008.
H Expense ratios reflect operating expenses of the class. Expenses before reductions do not reflect amounts reimbursed by the investment adviser or reductions from expense offset arrangements and do not represent the amount paid by the class during periods when reimbursements or reductions occur. Expenses net of fee waivers reflect expenses after reimbursement by the investment adviser but prior to reductions from expense offset arrangements. Expenses net of all reductions represent the net expenses paid by the class but do not include expenses of the investment companies in which the Fund invests.
Financial Highlights - Institutional Class
Years ended July 31, | 2011 | 2010 | 2009 | 2008G |
Selected Per-Share Data | | | | |
Net asset value, beginning of period | $ 46.46 | $ 42.82 | $ 47.47 | $ 50.00 |
Income from Investment Operations | | | | |
Net investment income (loss)D | .959 | .950 | 1.175 | 1.295 |
Net realized and unrealized gain (loss) | 3.668 | 3.761 | (4.121) | (2.474) |
Total from investment operations | 4.627 | 4.711 | (2.946) | (1.179) |
Distributions from net investment income | (.960) | (.951) | (1.224) | (1.221) |
Distributions from net realized gain | (.237) | (.120) | (.480) | (.130) |
Total distributions | (1.197) | (1.071) | (1.704) | (1.351) |
Net asset value, end of period | $ 49.89 | $ 46.46 | $ 42.82 | $ 47.47 |
Total ReturnB,C | 10.03% | 11.07% | (5.83)% | (2.46)% |
Ratios to Average Net AssetsE,H | | | | |
Expenses before reductionsF | .00% | .00% | .00% | .00%A |
Expenses net of fee waivers, if any | .00% | .00% | .00% | .00%A |
Expenses net of all reductions | .00% | .00% | .00% | .00%A |
Net investment income (loss) | 1.96% | 2.08% | 2.94% | 2.85%A |
Supplemental Data | | | | |
Net assets, end of period (000 omitted) | $ 320 | $ 350 | $ 326 | $ 214 |
Portfolio turnover rate | 39% | 24% | 51% | 46%A |
A Annualized
B Total returns for periods of less than one year are not annualized.
C Total returns would have been lower if certain expenses had not been reduced during the applicable periods shown.
D Calculated based on average shares outstanding during the period.
E Amounts do not include the activity of the underlying funds.
F Amount represents less than .01%.
G For the period August 30, 2007 (commencement of operations) to July 31, 2008.
H Expense ratios reflect operating expenses of the class. Expenses before reductions do not reflect amounts reimbursed by the investment adviser or reductions from expense offset arrangements and do not represent the amount paid by the class during periods when reimbursements or reductions occur. Expenses net of fee waivers reflect expenses after reimbursement by the investment adviser but prior to reductions from expense offset arrangements. Expenses net of all reductions represent the net expenses paid by the class but do not include expenses of the investment companies in which the Fund invests.
See accompanying notes which are an integral part of the financial statements.
Annual Report
Fidelity Income Replacement 2020 Fund
Investment Changes (Unaudited)
Fund Holdings as of July 31, 2011 |
| % of fund's
net assets | % of fund's net assets
6 months ago |
Domestic Equity Funds | | |
Fidelity Advisor Mid Cap II Fund Institutional Class | 4.0 | 4.2 |
Fidelity Disciplined Equity Fund | 4.2 | 4.3 |
Fidelity Equity-Income Fund | 4.1 | 4.3 |
Fidelity Large Cap Core Enhanced Index Fund | 6.9 | 7.0 |
Fidelity Series 100 Index Fund | 5.1 | 5.2 |
Fidelity Series Broad Market Opportunities Fund | 6.8 | 7.0 |
Fidelity Series Small Cap Opportunities Fund | 2.7 | 2.8 |
| 33.8 | 34.8 |
International Equity Funds | | |
Fidelity Advisor International Discovery Fund Institutional Class | 3.7 | 3.9 |
High Yield Fixed-Income Funds | | |
Fidelity Capital & Income Fund | 1.3 | 1.4 |
Fidelity Strategic Income Fund | 1.4 | 1.4 |
| 2.7 | 2.8 |
Investment Grade Fixed-Income Funds | | |
Fidelity Government Income Fund | 7.3 | 7.2 |
Fidelity Strategic Real Return Fund | 7.3 | 7.2 |
Fidelity Total Bond Fund | 21.9 | 21.6 |
| 36.5 | 36.0 |
Short-Term Funds | | |
Fidelity Institutional Money Market Portfolio Institutional Class | 11.6 | 11.3 |
Fidelity Short-Term Bond Fund | 11.7 | 11.2 |
| 23.3 | 22.5 |
Net Other Assets (Liabilities)* | 0.0 | 0.0 |
| 100.0 | 100.0 |
* Amount represents less than 0.1% |
Asset Allocation (% of fund's net assets) |
Current |
| Domestic Equity Funds | 33.8% | |
| International Equity Funds | 3.7% | |
| High Yield
Fixed-Income Funds | 2.7% | |
| Investment Grade Fixed-Income Funds | 36.5% | |
| Short-Term Funds | 23.3% | |

Six months ago |
| Domestic Equity Funds | 34.8% | |
| International Equity Funds | 3.9% | |
| High Yield
Fixed-Income Funds | 2.8% | |
| Investment Grade Fixed-Income Funds | 36.0% | |
| Short-Term Funds | 22.5% | |

Expected |
| Domestic Equity Funds | 32.3% | |
| International Equity Funds | 3.4% | |
| High Yield
Fixed-Income Funds | 2.4% | |
| Investment Grade Fixed-Income Funds | 37.3% | |
| Short-Term Funds | 24.6% | |

The fund invests according to an asset allocation strategy that becomes increasingly conservative over time. The six months ago allocation is based on the fund's holdings as of January 31, 2011. The current allocation is based on the fund's holdings as of July 31, 2011. The expected allocation represents the fund's anticipated allocation at January 31, 2012. |
Annual Report
Fidelity Income Replacement 2020 Fund
Investments July 31, 2011
Showing Percentage of Net Assets
Equity Funds - 37.5% |
| Shares | | Value |
Domestic Equity Funds - 33.8% |
Fidelity Advisor Mid Cap II Fund Institutional Class (a) | 8,861 | | $ 160,646 |
Fidelity Disciplined Equity Fund | 7,178 | | 167,105 |
Fidelity Equity-Income Fund | 3,712 | | 164,659 |
Fidelity Large Cap Core Enhanced Index Fund | 30,359 | | 272,320 |
Fidelity Series 100 Index Fund | 22,596 | | 204,492 |
Fidelity Series Broad Market Opportunities Fund | 26,030 | | 268,106 |
Fidelity Series Small Cap Opportunities Fund | 9,469 | | 106,243 |
TOTAL DOMESTIC EQUITY FUNDS | | 1,343,571 |
International Equity Funds - 3.7% |
Fidelity Advisor International Discovery Fund Institutional Class | 4,338 | | 145,871 |
TOTAL EQUITY FUNDS (Cost $1,246,786) | 1,489,442 |
Fixed-Income Funds - 39.2% |
| | | |
High Yield Fixed-Income Funds - 2.7% |
Fidelity Capital & Income Fund | 5,515 | | 52,781 |
Fidelity Strategic Income Fund | 4,785 | | 54,448 |
TOTAL HIGH YIELD FIXED-INCOME FUNDS | | 107,229 |
|
| Shares | | Value |
Investment Grade Fixed-Income Funds - 36.5% |
Fidelity Government Income Fund | 27,198 | | $ 290,477 |
Fidelity Strategic Real Return Fund | 29,143 | | 289,686 |
Fidelity Total Bond Fund | 79,034 | | 870,168 |
TOTAL INVESTMENT GRADE FIXED-INCOME FUNDS | | 1,450,331 |
TOTAL FIXED-INCOME FUNDS (Cost $1,439,557) | 1,557,560 |
Short-Term Funds - 23.3% |
| | | |
Fidelity Institutional Money Market Portfolio Institutional Class | 460,794 | | 460,794 |
Fidelity Short-Term Bond Fund | 54,326 | | 463,942 |
TOTAL SHORT-TERM FUNDS (Cost $913,437) | 924,736 |
TOTAL INVESTMENT PORTFOLIO - 100.0% (Cost $3,599,780) | | 3,971,738 |
NET OTHER ASSETS (LIABILITIES) - 0.0% | | (365) |
NET ASSETS - 100% | $ 3,971,373 |
Legend |
(a) Non-income producing |
Other Information |
All investments are categorized as Level 1 under the Fair Value Hierarchy. The inputs or methodology used for valuing securities may not be an indication of the risk associated with investing in those securities. For more information on valuation inputs, please refer to the Security Valuation section in the accompanying Notes to Financial Statements. |
Income Tax Information |
At July 31, 2011, the Fund had a capital loss carryforward of approximately $144,422 of which $3,778, $118,446 and $22,198 will expire in fiscal 2017, 2018 and 2019, respectively. Capital loss carryforwards are only available to offset future capital gains of the Fund to the extent provided by regulations and may be limited. |
See accompanying notes which are an integral part of the financial statements.
Annual Report
Fidelity Income Replacement 2020 Fund
Statement of Assets and Liabilities
| July 31, 2011 |
| | |
Assets | | |
Investment in securities, at value (cost $3,599,780) - See accompanying schedule | | $ 3,971,738 |
Receivable for investments sold | | 3 |
Total assets | | 3,971,741 |
| | |
Liabilities | | |
Payable for investments purchased | $ 2 | |
Distribution and service plan fees payable | 366 | |
Total liabilities | | 368 |
| | |
Net Assets | | $ 3,971,373 |
Net Assets consist of: | | |
Paid in capital | | $ 3,836,502 |
Undistributed net investment income | | 855 |
Accumulated undistributed net realized gain (loss) on investments | | (237,942) |
Net unrealized appreciation (depreciation) on investments | | 371,958 |
Net Assets | | $ 3,971,373 |
| | |
Calculation of Maximum Offering Price Class A:
Net Asset Value and redemption price per share ($435,873 ÷ 8,718.36 shares) | | $ 49.99 |
| | |
Maximum offering price per share (100/94.25 of $49.99) | | $ 53.04 |
| | |
Class T:
Net Asset Value and redemption price per share ($195,964 ÷ 3,920.19 shares) | | $ 49.99 |
| | |
Maximum offering price per share (100/96.50 of $49.99) | | $ 51.80 |
| | |
Class C:
Net Asset Value and offering price per share ($228,454 ÷ 4,571.93 shares)A | | $ 49.97 |
| | |
Income Replacement 2020:
Net Asset Value, offering price and redemption price per share ($3,078,631 ÷ 61,577.53 shares) | | $ 50.00 |
| | |
Institutional Class:
Net Asset Value, offering price and redemption price per share ($32,451 ÷ 649.06 shares) | | $ 50.00 |
A Redemption price per share is equal to net asset value less any applicable contingent deferred sales charge.
Statement of Operations
| Year ended July 31, 2011 |
| | |
Investment Income | | |
Income distributions from underlying funds | | $ 76,517 |
| | |
Expenses | | |
Distribution and service plan fees | $ 5,120 | |
Independent trustees' compensation | 14 | |
Total expenses before reductions | 5,134 | |
Expense reductions | (14) | 5,120 |
Net investment income (loss) | | 71,397 |
Realized and Unrealized Gain (Loss) Realized gain (loss) on sale of underlying fund shares | (11,978) | |
Capital gain distributions from underlying funds | 23,304 | |
Total net realized gain (loss) | | 11,326 |
Change in net unrealized appreciation (depreciation) on underlying funds | | 303,624 |
Net gain (loss) | | 314,950 |
Net increase (decrease) in net assets resulting from operations | | $ 386,347 |
See accompanying notes which are an integral part of the financial statements.
Annual Report
Fidelity Income Replacement 2020 Fund
Financial Statements - continued
Statement of Changes in Net Assets
| Year ended
July 31, 2011 | Year ended
July 31, 2010 |
Increase (Decrease) in Net Assets | | |
Operations | | |
Net investment income (loss) | $ 71,397 | $ 58,358 |
Net realized gain (loss) | 11,326 | (17,761) |
Change in net unrealized appreciation (depreciation) | 303,624 | 270,430 |
Net increase (decrease) in net assets resulting from operations | 386,347 | 311,027 |
Distributions to shareholders from net investment income | (71,547) | (58,210) |
Distributions to shareholders from net realized gain | (16,958) | (7,714) |
Total distributions | (88,505) | (65,924) |
Share transactions - net increase (decrease) | 363,777 | 451,360 |
Total increase (decrease) in net assets | 661,619 | 696,463 |
| | |
Net Assets | | |
Beginning of period | 3,309,754 | 2,613,291 |
End of period (including undistributed net investment income of $855 and undistributed net investment income of $1,012, respectively) | $ 3,971,373 | $ 3,309,754 |
Financial Highlights - Class A
Years ended July 31, | 2011 | 2010 | 2009 | 2008G |
Selected Per-Share Data | | | | |
Net asset value, beginning of period | $ 46.09 | $ 42.28 | $ 47.11 | $ 50.00 |
Income from Investment Operations | | | | |
Net investment income (loss)E | .817 | .812 | 1.027 | 1.085 |
Net realized and unrealized gain (loss) | 4.128 | 3.930 | (4.465) | (2.692) |
Total from investment operations | 4.945 | 4.742 | (3.438) | (1.607) |
Distributions from net investment income | (.826) | (.817) | (1.032) | (1.113) |
Distributions from net realized gain | (.219) | (.115) | (.360) | (.170) |
Total distributions | (1.045) | (.932) | (1.392) | (1.283) |
Net asset value, end of period | $ 49.99 | $ 46.09 | $ 42.28 | $ 47.11 |
Total ReturnB,C,D | 10.79% | 11.27% | (7.00)% | (3.33)% |
Ratios to Average Net AssetsF,H | | | | |
Expenses before reductions | .25% | .25% | .25% | .25%A |
Expenses net of fee waivers, if any | .25% | .25% | .25% | .25%A |
Expenses net of all reductions | .25% | .25% | .25% | .25%A |
Net investment income (loss) | 1.67% | 1.79% | 2.60% | 2.42%A |
Supplemental Data | | | | |
Net assets, end of period (000 omitted) | $ 436 | $ 607 | $ 502 | $ 503 |
Portfolio turnover rate | 48% | 38% | 60% | 21%A |
A Annualized
B Total returns for periods of less than one year are not annualized.
C Total returns would have been lower if certain expenses had not been reduced during the applicable periods shown.
D Total returns do not include the effect of the sales charges.
E Calculated based on average shares outstanding during the period.
F Amounts do not include the activity of the underlying funds.
G For the period August 30, 2007 (commencement of operations) to July 31, 2008.
H Expense ratios reflect operating expenses of the class. Expenses before reductions do not reflect amounts reimbursed by the investment adviser or reductions from expense offset arrangements and do not represent the amount paid by the class during periods when reimbursements or reductions occur. Expenses net of fee waivers reflect expenses after reimbursement by the investment adviser but prior to reductions from expense offset arrangements. Expenses net of all reductions represent the net expenses paid by the class but do not include expenses of the investment companies in which the Fund invests.
See accompanying notes which are an integral part of the financial statements.
Annual Report
Financial Highlights - Class T
Years ended July 31, | 2011 | 2010 | 2009 | 2008G |
Selected Per-Share Data | | | | |
Net asset value, beginning of period | $ 46.09 | $ 42.28 | $ 47.10 | $ 50.00 |
Income from Investment Operations | | | | |
Net investment income (loss)E | .696 | .696 | .926 | .985 |
Net realized and unrealized gain (loss) | 4.135 | 3.928 | (4.460) | (2.707) |
Total from investment operations | 4.831 | 4.624 | (3.534) | (1.722) |
Distributions from net investment income | (.712) | (.699) | (.926) | (1.008) |
Distributions from net realized gain | (.219) | (.115) | (.360) | (.170) |
Total distributions | (.931) | (.814) | (1.286) | (1.178) |
Net asset value, end of period | $ 49.99 | $ 46.09 | $ 42.28 | $ 47.10 |
Total ReturnB,C,D | 10.54% | 10.98% | (7.23)% | (3.56)% |
Ratios to Average Net AssetsF,H | | | | |
Expenses before reductions | .50% | .50% | .50% | .50%A |
Expenses net of fee waivers, if any | .50% | .50% | .50% | .50%A |
Expenses net of all reductions | .50% | .50% | .50% | .50%A |
Net investment income (loss) | 1.42% | 1.54% | 2.35% | 2.17%A |
Supplemental Data | | | | |
Net assets, end of period (000 omitted) | $ 196 | $ 134 | $ 171 | $ 187 |
Portfolio turnover rate | 48% | 38% | 60% | 21%A |
A Annualized
B Total returns for periods of less than one year are not annualized.
C Total returns would have been lower if certain expenses had not been reduced during the applicable periods shown.
D Total returns do not include the effect of the sales charges.
E Calculated based on average shares outstanding during the period.
F Amounts do not include the activity of the underlying funds.
G For the period August 30, 2007 (commencement of operations) to July 31, 2008.
H Expense ratios reflect operating expenses of the class. Expenses before reductions do not reflect amounts reimbursed by the investment adviser or reductions from expense offset arrangements and do not represent the amount paid by the class during periods when reimbursements or reductions occur. Expenses net of fee waivers reflect expenses after reimbursement by the investment adviser but prior to reductions from expense offset arrangements. Expenses net of all reductions represent the net expenses paid by the class but do not include expenses of the investment companies in which the Fund invests.
Financial Highlights - Class C
Years ended July 31, | 2011 | 2010 | 2009 | 2008G |
Selected Per-Share Data | | | | |
Net asset value, beginning of period | $ 46.06 | $ 42.26 | $ 47.08 | $ 50.00 |
Income from Investment Operations | | | | |
Net investment income (loss)E | .449 | .473 | .736 | .755 |
Net realized and unrealized gain (loss) | 4.132 | 3.923 | (4.471) | (2.699) |
Total from investment operations | 4.581 | 4.396 | (3.735) | (1.944) |
Distributions from net investment income | (.452) | (.481) | (.725) | (.806) |
Distributions from net realized gain | (.219) | (.115) | (.360) | (.170) |
Total distributions | (.671) | (.596) | (1.085) | (.976) |
Net asset value, end of period | $ 49.97 | $ 46.06 | $ 42.26 | $ 47.08 |
Total ReturnB,C,D | 9.98% | 10.43% | (7.70)% | (3.99)% |
Ratios to Average Net AssetsF,H | | | | |
Expenses before reductions | 1.00% | 1.00% | 1.00% | 1.00%A |
Expenses net of fee waivers, if any | 1.00% | 1.00% | 1.00% | 1.00%A |
Expenses net of all reductions | 1.00% | 1.00% | 1.00% | 1.00%A |
Net investment income (loss) | .92% | 1.05% | 1.85% | 1.67%A |
Supplemental Data | | | | |
Net assets, end of period (000 omitted) | $ 228 | $ 295 | $ 221 | $ 275 |
Portfolio turnover rate | 48% | 38% | 60% | 21%A |
A Annualized
B Total returns for periods of less than one year are not annualized.
C Total returns would have been lower if certain expenses had not been reduced during the applicable periods shown.
D Total returns do not include the effect of the contingent deferred sales charge.
E Calculated based on average shares outstanding during the period.
F Amounts do not include the activity of the underlying funds.
G For the period August 30, 2007 (commencement of operations) to July 31, 2008.
H Expense ratios reflect operating expenses of the class. Expenses before reductions do not reflect amounts reimbursed by the investment adviser or reductions from expense offset arrangements and do not represent the amount paid by the class during periods when reimbursements or reductions occur. Expenses net of fee waivers reflect expenses after reimbursement by the investment adviser but prior to reductions from expense offset arrangements. Expenses net of all reductions represent the net expenses paid by the class but do not include expenses of the investment companies in which the Fund invests.
See accompanying notes which are an integral part of the financial statements.
Annual Report
Financial Highlights - Income Replacement 2020
Years ended July 31, | 2011 | 2010 | 2009 | 2008G |
Selected Per-Share Data | | | | |
Net asset value, beginning of period | $ 46.09 | $ 42.29 | $ 47.12 | $ 50.00 |
Income from Investment Operations | | | | |
Net investment income (loss)D | .942 | .925 | 1.125 | 1.190 |
Net realized and unrealized gain (loss) | 4.138 | 3.919 | (4.464) | (2.677) |
Total from investment operations | 5.080 | 4.844 | (3.339) | (1.487) |
Distributions from net investment income | (.951) | (.929) | (1.131) | (1.223) |
Distributions from net realized gain | (.219) | (.115) | (.360) | (.170) |
Total distributions | (1.170) | (1.044) | (1.491) | (1.393) |
Net asset value, end of period | $ 50.00 | $ 46.09 | $ 42.29 | $ 47.12 |
Total ReturnB,C | 11.10% | 11.52% | (6.76)% | (3.10)% |
Ratios to Average Net AssetsE,H | | | | |
Expenses before reductionsF | .00% | .00% | .00% | .00%A |
Expenses net of fee waivers, if any | .00% | .00% | .00% | .00%A |
Expenses net of all reductions | .00% | .00% | .00% | .00%A |
Net investment income (loss) | 1.92% | 2.04% | 2.86% | 2.67%A |
Supplemental Data | | | | |
Net assets, end of period (000 omitted) | $ 3,079 | $ 2,225 | $ 1,624 | $ 1,233 |
Portfolio turnover rate | 48% | 38% | 60% | 21%A |
A Annualized
B Total returns for periods of less than one year are not annualized.
C Total returns would have been lower if certain expenses had not been reduced during the applicable periods shown.
D Calculated based on average shares outstanding during the period.
E Amounts do not include the activity of the underlying funds.
F Amount represents less than .01%.
G For the period August 30, 2007 (commencement of operations) to July 31, 2008.
H Expense ratios reflect operating expenses of the class. Expenses before reductions do not reflect amounts reimbursed by the investment adviser or reductions from expense offset arrangements and do not represent the amount paid by the class during periods when reimbursements or reductions occur. Expenses net of fee waivers reflect expenses after reimbursement by the investment adviser but prior to reductions from expense offset arrangements. Expenses net of all reductions represent the net expenses paid by the class but do not include expenses of the investment companies in which the Fund invests.
Financial Highlights - Institutional Class
Years ended July 31, | 2011 | 2010 | 2009 | 2008G |
Selected Per-Share Data | | | | |
Net asset value, beginning of period | $ 46.09 | $ 42.29 | $ 47.12 | $ 50.00 |
Income from Investment Operations | | | | |
Net investment income (loss)D | .939 | .928 | 1.138 | 1.215 |
Net realized and unrealized gain (loss) | 4.141 | 3.916 | (4.477) | (2.702) |
Total from investment operations | 5.080 | 4.844 | (3.339) | (1.487) |
Distributions from net investment income | (.951) | (.929) | (1.131) | (1.223) |
Distributions from net realized gain | (.219) | (.115) | (.360) | (.170) |
Total distributions | (1.170) | (1.044) | (1.491) | (1.393) |
Net asset value, end of period | $ 50.00 | $ 46.09 | $ 42.29 | $ 47.12 |
Total ReturnB,C | 11.10% | 11.52% | (6.76)% | (3.10)% |
Ratios to Average Net AssetsE,H | | | | |
Expenses before reductionsF | .00% | .00% | .00% | .00%A |
Expenses net of fee waivers, if any | .00% | .00% | .00% | .00%A |
Expenses net of all reductions | .00% | .00% | .00% | .00%A |
Net investment income (loss) | 1.92% | 2.04% | 2.85% | 2.67%A |
Supplemental Data | | | | |
Net assets, end of period (000 omitted) | $ 32 | $ 49 | $ 95 | $ 163 |
Portfolio turnover rate | 48% | 38% | 60% | 21%A |
A Annualized
B Total returns for periods of less than one year are not annualized.
C Total returns would have been lower if certain expenses had not been reduced during the applicable periods shown.
D Calculated based on average shares outstanding during the period.
E Amounts do not include the activity of the underlying funds.
F Amount represents less than .01%.
G For the period August 30, 2007 (commencement of operations) to July 31, 2008.
H Expense ratios reflect operating expenses of the class. Expenses before reductions do not reflect amounts reimbursed by the investment adviser or reductions from expense offset arrangements and do not represent the amount paid by the class during periods when reimbursements or reductions occur. Expenses net of fee waivers reflect expenses after reimbursement by the investment adviser but prior to reductions from expense offset arrangements. Expenses net of all reductions represent the net expenses paid by the class but do not include expenses of the investment companies in which the Fund invests.
See accompanying notes which are an integral part of the financial statements.
Annual Report
Fidelity Income Replacement 2022 Fund
Investment Changes (Unaudited)
Fund Holdings as of July 31, 2011 |
| % of fund's
net assets | % of fund's net assets
6 months ago |
Domestic Equity Funds | | |
Fidelity Advisor Mid Cap II Fund Institutional Class | 4.5 | 4.6 |
Fidelity Disciplined Equity Fund | 4.7 | 4.8 |
Fidelity Equity-Income Fund | 4.6 | 4.8 |
Fidelity Large Cap Core Enhanced Index Fund | 7.7 | 7.8 |
Fidelity Series 100 Index Fund | 5.8 | 5.8 |
Fidelity Series Broad Market Opportunities Fund | 7.6 | 7.8 |
Fidelity Series Small Cap Opportunities Fund | 3.0 | 3.1 |
| 37.9 | 38.7 |
International Equity Funds | | |
Fidelity Advisor International Discovery Fund Institutional Class | 4.6 | 4.8 |
High Yield Fixed-Income Funds | | |
Fidelity Capital & Income Fund | 1.7 | 1.7 |
Fidelity Strategic Income Fund | 1.8 | 1.8 |
| 3.5 | 3.5 |
Investment Grade Fixed-Income Funds | | |
Fidelity Government Income Fund | 6.9 | 6.7 |
Fidelity Strategic Real Return Fund | 6.8 | 6.8 |
Fidelity Total Bond Fund | 20.5 | 20.3 |
| 34.2 | 33.8 |
Short-Term Funds | | |
Fidelity Institutional Money Market Portfolio Institutional Class | 9.9 | 9.6 |
Fidelity Short-Term Bond Fund | 9.9 | 9.6 |
| 19.8 | 19.2 |
Net Other Assets (Liabilities)* | 0.0 | 0.0 |
| 100.0 | 100.0 |
* Amount represents less than 0.1% |
Asset Allocation (% of fund's net assets) |
Current |
| Domestic Equity Funds | 37.9% | |
| International Equity Funds | 4.6% | |
| High Yield
Fixed-Income Funds | 3.5% | |
| Investment Grade Fixed-Income Funds | 34.2% | |
| Short-Term Funds | 19.8% | |

Six months ago |
| Domestic Equity Funds | 38.7% | |
| International Equity Funds | 4.8% | |
| High Yield
Fixed-Income Funds | 3.5% | |
| Investment Grade Fixed-Income Funds | 33.8% | |
| Short-Term Funds | 19.2% | |

Expected |
| Domestic Equity Funds | 36.9% | |
| International Equity Funds | 4.3% | |
| High Yield
Fixed-Income Funds | 3.2% | |
| Investment Grade Fixed-Income Funds | 34.9% | |
| Short-Term Funds | 20.7% | |

The fund invests according to an asset allocation strategy that becomes increasingly conservative over time. The six months ago allocation is based on the fund's holdings as of January 31, 2011. The current allocation is based on the fund's holdings as of July 31, 2011. The expected allocation represents the fund's anticipated allocation at January 31, 2012. |
Annual Report
Fidelity Income Replacement 2022 Fund
Investments July 31, 2011
Showing Percentage of Net Assets
Equity Funds - 42.5% |
| Shares | | Value |
Domestic Equity Funds - 37.9% |
Fidelity Advisor Mid Cap II Fund Institutional Class (a) | 8,478 | | $ 153,712 |
Fidelity Disciplined Equity Fund | 6,883 | | 160,235 |
Fidelity Equity-Income Fund | 3,560 | | 157,914 |
Fidelity Large Cap Core Enhanced Index Fund | 29,054 | | 260,616 |
Fidelity Series 100 Index Fund | 21,663 | | 196,046 |
Fidelity Series Broad Market Opportunities Fund | 24,921 | | 256,689 |
Fidelity Series Small Cap Opportunities Fund | 9,074 | | 101,805 |
TOTAL DOMESTIC EQUITY FUNDS | | 1,287,017 |
International Equity Funds - 4.6% |
Fidelity Advisor International Discovery Fund Institutional Class | 4,654 | | 156,500 |
TOTAL EQUITY FUNDS (Cost $1,498,678) | 1,443,517 |
Fixed-Income Funds - 37.7% |
| | | |
High Yield Fixed-Income Funds - 3.5% |
Fidelity Capital & Income Fund | 6,066 | | 58,055 |
Fidelity Strategic Income Fund | 5,247 | | 59,707 |
TOTAL HIGH YIELD FIXED-INCOME FUNDS | | 117,762 |
|
| Shares | | Value |
Investment Grade Fixed-Income Funds - 34.2% |
Fidelity Government Income Fund | 21,813 | | $ 232,960 |
Fidelity Strategic Real Return Fund | 23,409 | | 232,688 |
Fidelity Total Bond Fund | 63,382 | | 697,839 |
TOTAL INVESTMENT GRADE FIXED-INCOME FUNDS | | 1,163,487 |
TOTAL FIXED-INCOME FUNDS (Cost $1,236,149) | 1,281,249 |
Short-Term Funds - 19.8% |
| | | |
Fidelity Institutional Money Market Portfolio Institutional Class | 334,581 | | 334,581 |
Fidelity Short-Term Bond Fund | 39,427 | | 336,703 |
TOTAL SHORT-TERM FUNDS (Cost $669,361) | 671,284 |
TOTAL INVESTMENT PORTFOLIO - 100.0% (Cost $3,404,188) | | 3,396,050 |
NET OTHER ASSETS (LIABILITIES) - 0.0% | | (49) |
NET ASSETS - 100% | $ 3,396,001 |
Legend |
(a) Non-income producing |
Other Information |
All investments are categorized as Level 1 under the Fair Value Hierarchy. The inputs or methodology used for valuing securities may not be an indication of the risk associated with investing in those securities. For more information on valuation inputs, please refer to the Security Valuation section in the accompanying Notes to Financial Statements. |
Income Tax Information |
At July 31, 2011, the Fund had a capital loss carryforward of approximately $619,540 of which $64,025, $481,397 and $74,118 will expire in fiscal 2017, 2018 and 2019, respectively. Capital loss carryforwards are only available to offset future capital gains of the Fund to the extent provided by regulations and may be limited. |
See accompanying notes which are an integral part of the financial statements.
Annual Report
Fidelity Income Replacement 2022 Fund
Statement of Assets and Liabilities
| July 31, 2011 |
| | |
Assets | | |
Investment in securities, at value (cost $3,404,188) - See accompanying schedule | | $ 3,396,050 |
Cash | | 1 |
Receivable for investments sold | | 2 |
Total assets | | 3,396,053 |
| | |
Liabilities | | |
Distribution and service plan fees payable | | 52 |
| | |
Net Assets | | $ 3,396,001 |
Net Assets consist of: | | |
Paid in capital | | $ 4,057,410 |
Undistributed net investment income | | 761 |
Accumulated undistributed net realized gain (loss) on investments | | (654,032) |
Net unrealized appreciation (depreciation) on investments | | (8,138) |
Net Assets | | $ 3,396,001 |
| | |
Calculation of Maximum Offering Price Class A:
Net Asset Value and redemption price per share ($71,513 ÷ 1,436.28 shares) | | $ 49.79 |
| | |
Maximum offering price per share (100/94.25 of $49.79) | | $ 52.83 |
| | |
Class T:
Net Asset Value and redemption price per share ($22,848 ÷ 458.60 shares) | | $ 49.82 |
| | |
Maximum offering price per share (100/96.50 of $49.82) | | $ 51.63 |
| | |
Class C:
Net Asset Value and offering price per share ($32,317 ÷ 648.81 shares)A | | $ 49.81 |
| | |
Income Replacement 2022:
Net Asset Value, offering price and redemption price per share ($3,265,504 ÷ 65,598.59 shares) | | $ 49.78 |
| | |
Institutional Class:
Net Asset Value, offering price and redemption price per share ($3,819 ÷ 76.73 shares) | | $ 49.77 |
A Redemption price per share is equal to net asset value less any applicable contingent deferred sales charge.
Statement of Operations
| Year ended July 31, 2011 |
| | |
Investment Income | | |
Income distributions from underlying funds | | $ 58,689 |
| | |
Expenses | | |
Distribution and service plan fees | $ 836 | |
Independent trustees' compensation | 11 | |
Total expenses before reductions | 847 | |
Expense reductions | (11) | 836 |
Net investment income (loss) | | 57,853 |
Realized and Unrealized Gain (Loss) Realized gain (loss) on sale of underlying fund shares | 33,778 | |
Capital gain distributions from underlying funds | 17,436 | |
Total net realized gain (loss) | | 51,214 |
Change in net unrealized appreciation (depreciation) on underlying funds | | 211,768 |
Net gain (loss) | | 262,982 |
Net increase (decrease) in net assets resulting from operations | | $ 320,835 |
See accompanying notes which are an integral part of the financial statements.
Annual Report
Statement of Changes in Net Assets
| Year ended
July 31, 2011 | Year ended
July 31, 2010 |
Increase (Decrease) in Net Assets | | |
Operations | | |
Net investment income (loss) | $ 57,853 | $ 57,048 |
Net realized gain (loss) | 51,214 | (60,204) |
Change in net unrealized appreciation (depreciation) | 211,768 | 328,653 |
Net increase (decrease) in net assets resulting from operations | 320,835 | 325,497 |
Distributions to shareholders from net investment income | (57,885) | (57,173) |
Distributions to shareholders from net realized gain | (12,730) | (19,734) |
Total distributions | (70,615) | (76,907) |
Share transactions - net increase (decrease) | 582,659 | (508,119) |
Total increase (decrease) in net assets | 832,879 | (259,529) |
| | |
Net Assets | | |
Beginning of period | 2,563,122 | 2,822,651 |
End of period (including undistributed net investment income of $761 and undistributed net investment income of $816, respectively) | $ 3,396,001 | $ 2,563,122 |
Financial Highlights - Class A
Years ended July 31, | 2011 | 2010 | 2009 | 2008G |
Selected Per-Share Data | | | | |
Net asset value, beginning of period | $ 45.58 | $ 41.87 | $ 47.05 | $ 50.00 |
Income from Investment Operations | | | | |
Net investment income (loss)E | .817 | .815 | 1.035 | 1.087 |
Net realized and unrealized gain (loss) | 4.431 | 3.980 | (4.739) | (2.853) |
Total from investment operations | 5.248 | 4.795 | (3.704) | (1.766) |
Distributions from net investment income | (.824) | (.793) | (1.056) | (1.014) |
Distributions from net realized gain | (.214) | (.292) | (.420) | (.170) |
Total distributions | (1.038) | (1.085) | (1.476) | (1.184) |
Net asset value, end of period | $ 49.79 | $ 45.58 | $ 41.87 | $ 47.05 |
Total ReturnB,C,D | 11.58% | 11.53% | (7.53)% | (3.64)% |
Ratios to Average Net AssetsF,H | | | | |
Expenses before reductions | .25% | .25% | .26% | .25%A |
Expenses net of fee waivers, if any | .25% | .25% | .26% | .25%A |
Expenses net of all reductions | .25% | .25% | .26% | .25%A |
Net investment income (loss) | 1.67% | 1.82% | 2.62% | 2.41%A |
Supplemental Data | | | | |
Net assets, end of period (000 omitted) | $ 72 | $ 42 | $ 122 | $ 289 |
Portfolio turnover rate | 29% | 24% | 22% | 32%A |
A Annualized
B Total returns for periods of less than one year are not annualized.
C Total returns would have been lower if certain expenses had not been reduced during the applicable periods shown.
D Total returns do not include the effect of the sales charges.
E Calculated based on average shares outstanding during the period.
F Amounts do not include the activity of the underlying funds.
G For the period August 30, 2007 (commencement of operations) to July 31, 2008.
H Expense ratios reflect operating expenses of the class. Expenses before reductions do not reflect amounts reimbursed by the investment adviser or reductions from expense offset arrangements and do not represent the amount paid by the class during periods when reimbursements or reductions occur. Expenses net of fee waivers reflect expenses after reimbursement by the investment adviser but prior to reductions from expense offset arrangements. Expenses net of all reductions represent the net expenses paid by the class but do not include expenses of the investment companies in which the Fund invests.
See accompanying notes which are an integral part of the financial statements.
Annual Report
Financial Highlights - Class T
Years ended July 31, | 2011 | 2010 | 2009 | 2008G |
Selected Per-Share Data | | | | |
Net asset value, beginning of period | $ 45.57 | $ 41.86 | $ 47.04 | $ 50.00 |
Income from Investment Operations | | | | |
Net investment income (loss)E | .691 | .702 | .933 | .982 |
Net realized and unrealized gain (loss) | 4.434 | 3.985 | (4.736) | (2.862) |
Total from investment operations | 5.125 | 4.687 | (3.803) | (1.880) |
Distributions from net investment income | (.661) | (.685) | (.957) | (.910) |
Distributions from net realized gain | (.214) | (.292) | (.420) | (.170) |
Total distributions | (.875) | (.977) | (1.377) | (1.080) |
Net asset value, end of period | $ 49.82 | $ 45.57 | $ 41.86 | $ 47.04 |
Total ReturnB,C,D | 11.30% | 11.27% | (7.77)% | (3.87)% |
Ratios to Average Net AssetsF,H | | | | |
Expenses before reductions | .50% | .50% | .51% | .50%A |
Expenses net of fee waivers, if any | .50% | .50% | .51% | .50%A |
Expenses net of all reductions | .50% | .50% | .51% | .50%A |
Net investment income (loss) | 1.43% | 1.57% | 2.37% | 2.16%A |
Supplemental Data | | | | |
Net assets, end of period (000 omitted) | $ 23 | $ 77 | $ 112 | $ 187 |
Portfolio turnover rate | 29% | 24% | 22% | 32%A |
A Annualized
B Total returns for periods of less than one year are not annualized.
C Total returns would have been lower if certain expenses had not been reduced during the applicable periods shown.
D Total returns do not include the effect of the sales charges.
E Calculated based on average shares outstanding during the period.
F Amounts do not include the activity of the underlying funds.
G For the period August 30, 2007 (commencement of operations) to July 31, 2008.
H Expense ratios reflect operating expenses of the class. Expenses before reductions do not reflect amounts reimbursed by the investment adviser or reductions from expense offset arrangements and do not represent the amount paid by the class during periods when reimbursements or reductions occur. Expenses net of fee waivers reflect expenses after reimbursement by the investment adviser but prior to reductions from expense offset arrangements. Expenses net of all reductions represent the net expenses paid by the class but do not include expenses of the investment companies in which the Fund invests.
Financial Highlights - Class C
Years ended July 31, | 2011 | 2010 | 2009 | 2008G |
Selected Per-Share Data | | | | |
Net asset value, beginning of period | $ 45.58 | $ 41.86 | $ 47.04 | $ 50.00 |
Income from Investment Operations | | | | |
Net investment income (loss)E | .447 | .477 | .737 | .760 |
Net realized and unrealized gain (loss) | 4.434 | 3.989 | (4.745) | (2.860) |
Total from investment operations | 4.881 | 4.466 | (4.008) | (2.100) |
Distributions from net investment income | (.437) | (.454) | (.752) | (.690) |
Distributions from net realized gain | (.214) | (.292) | (.420) | (.170) |
Total distributions | (.651) | (.746) | (1.172) | (.860) |
Net asset value, end of period | $ 49.81 | $ 45.58 | $ 41.86 | $ 47.04 |
Total ReturnB,C,D | 10.74% | 10.72% | (8.25)% | (4.29)% |
Ratios to Average Net AssetsF,H | | | | |
Expenses before reductions | 1.00% | 1.00% | 1.01% | 1.00%A |
Expenses net of fee waivers, if any | 1.00% | 1.00% | 1.01% | 1.00%A |
Expenses net of all reductions | 1.00% | 1.00% | 1.01% | 1.00%A |
Net investment income (loss) | .92% | 1.07% | 1.87% | 1.66%A |
Supplemental Data | | | | |
Net assets, end of period (000 omitted) | $ 32 | $ 44 | $ 69 | $ 120 |
Portfolio turnover rate | 29% | 24% | 22% | 32%A |
A Annualized
B Total returns for periods of less than one year are not annualized.
C Total returns would have been lower if certain expenses had not been reduced during the applicable periods shown.
D Total returns do not include the effect of the contingent deferred sales charge.
E Calculated based on average shares outstanding during the period.
F Amounts do not include the activity of the underlying funds.
G For the period August 30, 2007 (commencement of operations) to July 31, 2008.
H Expense ratios reflect operating expenses of the class. Expenses before reductions do not reflect amounts reimbursed by the investment adviser or reductions from expense offset arrangements and do not represent the amount paid by the class during periods when reimbursements or reductions occur. Expenses net of fee waivers reflect expenses after reimbursement by the investment adviser but prior to reductions from expense offset arrangements. Expenses net of all reductions represent the net expenses paid by the class but do not include expenses of the investment companies in which the Fund invests.
See accompanying notes which are an integral part of the financial statements.
Annual Report
Financial Highlights - Income Replacement 2022
Years ended July 31, | 2011 | 2010 | 2009 | 2008G |
Selected Per-Share Data | | | | |
Net asset value, beginning of period | $ 45.56 | $ 41.87 | $ 47.06 | $ 50.00 |
Income from Investment Operations | | | | |
Net investment income (loss)D | .937 | .925 | 1.144 | 1.190 |
Net realized and unrealized gain (loss) | 4.438 | 3.978 | (4.752) | (2.836) |
Total from investment operations | 5.375 | 4.903 | (3.608) | (1.646) |
Distributions from net investment income | (.941) | (.921) | (1.162) | (1.124) |
Distributions from net realized gain | (.214) | (.292) | (.420) | (.170) |
Total distributions | (1.155) | (1.213) | (1.582) | (1.294) |
Net asset value, end of period | $ 49.78 | $ 45.56 | $ 41.87 | $ 47.06 |
Total ReturnB,C | 11.87% | 11.80% | (7.30)% | (3.41)% |
Ratios to Average Net AssetsE,H | | | | |
Expenses before reductions | .00%F | .00%F | .01% | .00%A,F |
Expenses net of fee waivers, if any | .00% | .00% | .01% | .00%A |
Expenses net of all reductions | .00% | .00% | .01% | .00%A |
Net investment income (loss) | 1.92% | 2.07% | 2.87% | 2.66%A |
Supplemental Data | | | | |
Net assets, end of period (000 omitted) | $ 3,266 | $ 2,395 | $ 2,353 | $ 4,666 |
Portfolio turnover rate | 29% | 24% | 22% | 32%A |
A Annualized
B Total returns for periods of less than one year are not annualized.
C Total returns would have been lower if certain expenses had not been reduced during the applicable periods shown.
D Calculated based on average shares outstanding during the period.
E Amounts do not include the activity of the underlying funds.
F Amount represents less than .01%.
G For the period August 30, 2007 (commencement of operations) to July 31, 2008.
H Expense ratios reflect operating expenses of the class. Expenses before reductions do not reflect amounts reimbursed by the investment adviser or reductions from expense offset arrangements and do not represent the amount paid by the class during periods when reimbursements or reductions occur. Expenses net of fee waivers reflect expenses after reimbursement by the investment adviser but prior to reductions from expense offset arrangements. Expenses net of all reductions represent the net expenses paid by the class but do not include expenses of the investment companies in which the Fund invests.
Financial Highlights - Institutional Class
Years ended July 31, | 2011 | 2010 | 2009 | 2008G |
Selected Per-Share Data | | | | |
Net asset value, beginning of period | $ 45.56 | $ 41.86 | $ 47.06 | $ 50.00 |
Income from Investment Operations | | | | |
Net investment income (loss)D | .937 | .918 | 1.131 | 1.208 |
Net realized and unrealized gain (loss) | 4.428 | 3.995 | (4.749) | (2.854) |
Total from investment operations | 5.365 | 4.913 | (3.618) | (1.646) |
Distributions from net investment income | (.941) | (.921) | (1.162) | (1.124) |
Distributions from net realized gain | (.214) | (.292) | (.420) | (.170) |
Total distributions | (1.155) | (1.213) | (1.582) | (1.294) |
Net asset value, end of period | $ 49.77 | $ 45.56 | $ 41.86 | $ 47.06 |
Total ReturnB,C | 11.85% | 11.83% | (7.33)% | (3.41)% |
Ratios to Average Net AssetsE,H | | | | |
Expenses before reductions | .00%F | .00%F | .01% | .00%A,F |
Expenses net of fee waivers, if any | .00% | .00% | .01% | .00%A |
Expenses net of all reductions | .00% | .00% | .01% | .00%A |
Net investment income (loss) | 1.92% | 2.07% | 2.87% | 2.66%A |
Supplemental Data | | | | |
Net assets, end of period (000 omitted) | $ 4 | $ 5 | $ 166 | $ 277 |
Portfolio turnover rate | 29% | 24% | 22% | 32%A |
A Annualized
B Total returns for periods of less than one year are not annualized.
C Total returns would have been lower if certain expenses had not been reduced during the applicable periods shown.
D Calculated based on average shares outstanding during the period.
E Amounts do not include the activity of the underlying funds.
F Amount represents less than .01%.
G For the period August 30, 2007 (commencement of operations) to July 31, 2008.
H Expense ratios reflect operating expenses of the class. Expenses before reductions do not reflect amounts reimbursed by the investment adviser or reductions from expense offset arrangements and do not represent the amount paid by the class during periods when reimbursements or reductions occur. Expenses net of fee waivers reflect expenses after reimbursement by the investment adviser but prior to reductions from expense offset arrangements. Expenses net of all reductions represent the net expenses paid by the class but do not include expenses of the investment companies in which the Fund invests.
See accompanying notes which are an integral part of the financial statements.
Annual Report
Fidelity Income Replacement 2024 Fund
Investment Changes (Unaudited)
Fund Holdings as of July 31, 2011 |
| % of fund's
net assets | % of fund's net assets
6 months ago |
Domestic Equity Funds | | |
Fidelity Advisor Mid Cap II Fund Institutional Class | 4.8 | 4.9 |
Fidelity Disciplined Equity Fund | 5.0 | 5.1 |
Fidelity Equity-Income Fund | 5.0 | 5.1 |
Fidelity Large Cap Core Enhanced Index Fund | 8.2 | 8.3 |
Fidelity Series 100 Index Fund | 6.2 | 6.2 |
Fidelity Series Broad Market Opportunities Fund | 8.1 | 8.3 |
Fidelity Series Small Cap Opportunities Fund | 3.2 | 3.3 |
| 40.5 | 41.2 |
International Equity Funds | | |
Fidelity Advisor International Discovery Fund Institutional Class | 5.5 | 5.6 |
High Yield Fixed-Income Funds | | |
Fidelity Capital & Income Fund | 2.0 | 2.0 |
Fidelity Strategic Income Fund | 2.0 | 2.0 |
| 4.0 | 4.0 |
Investment Grade Fixed-Income Funds | | |
Fidelity Government Income Fund | 6.5 | 6.4 |
Fidelity Strategic Real Return Fund | 6.5 | 6.5 |
Fidelity Total Bond Fund | 19.6 | 19.3 |
| 32.6 | 32.2 |
Short-Term Funds | | |
Fidelity Institutional Money Market Portfolio Institutional Class | 8.7 | 8.5 |
Fidelity Short-Term Bond Fund | 8.7 | 8.5 |
| 17.4 | 17.0 |
Net Other Assets (Liabilities)* | 0.0 | 0.0 |
| 100.0 | 100.0 |
* Amount represents less than 0.1% |
Asset Allocation (% of fund's net assets) |
Current |
| Domestic Equity Funds | 40.5% | |
| International Equity Funds | 5.5% | |
| High Yield
Fixed-Income Funds | 4.0% | |
| Investment Grade Fixed-Income Funds | 32.6% | |
| Short-Term Funds | 17.4% | |

Six months ago |
| Domestic Equity Funds | 41.2% | |
| International Equity Funds | 5.6% | |
| High Yield
Fixed-Income Funds | 4.0% | |
| Investment Grade Fixed-Income Funds | 32.2% | |
 | Short-Term Funds | 17.0% | |

Expected |
| Domestic Equity Funds | 40.1% | |
| International Equity Funds | 5.2% | |
| High Yield
Fixed-Income Funds | 3.8% | |
| Investment Grade Fixed-Income Funds | 32.9% | |
| Short-Term Funds | 18.0% | |

The fund invests according to an asset allocation strategy that becomes increasingly conservative over time. The six months ago allocation is based on the fund's holdings as of January 31, 2011. The current allocation is based on the fund's holdings as of July 31, 2011. The expected allocation represents the fund's anticipated allocation at January 31, 2012. |
Annual Report
Fidelity Income Replacement 2024 Fund
Investments July 31, 2011
Showing Percentage of Net Assets
Equity Funds - 46.0% |
| Shares | | Value |
Domestic Equity Funds - 40.5% |
Fidelity Advisor Mid Cap II Fund Institutional Class (a) | 5,049 | | $ 91,546 |
Fidelity Disciplined Equity Fund | 4,095 | | 95,335 |
Fidelity Equity-Income Fund | 2,120 | | 94,043 |
Fidelity Large Cap Core Enhanced Index Fund | 17,276 | | 154,970 |
Fidelity Series 100 Index Fund | 12,883 | | 116,595 |
Fidelity Series Broad Market Opportunities Fund | 14,839 | | 152,838 |
Fidelity Series Small Cap Opportunities Fund | 5,404 | | 60,636 |
TOTAL DOMESTIC EQUITY FUNDS | | 765,963 |
International Equity Funds - 5.5% |
Fidelity Advisor International Discovery Fund Institutional Class | 3,061 | | 102,936 |
TOTAL EQUITY FUNDS (Cost $797,205) | 868,899 |
Fixed-Income Funds - 36.6% |
| | | |
High Yield Fixed-Income Funds - 4.0% |
Fidelity Capital & Income Fund | 3,893 | | 37,255 |
Fidelity Strategic Income Fund | 3,365 | | 38,297 |
TOTAL HIGH YIELD FIXED-INCOME FUNDS | | 75,552 |
|
| Shares | | Value |
Investment Grade Fixed-Income Funds - 32.6% |
Fidelity Government Income Fund | 11,548 | | $ 123,328 |
Fidelity Strategic Real Return Fund | 12,387 | | 123,130 |
Fidelity Total Bond Fund | 33,605 | | 369,993 |
TOTAL INVESTMENT GRADE FIXED-INCOME FUNDS | | 616,451 |
TOTAL FIXED-INCOME FUNDS (Cost $649,880) | 692,003 |
Short-Term Funds - 17.4% |
| | | |
Fidelity Institutional Money Market Portfolio Institutional Class | 164,304 | | 164,304 |
Fidelity Short-Term Bond Fund | 19,359 | | 165,329 |
TOTAL SHORT-TERM FUNDS (Cost $325,980) | 329,633 |
TOTAL INVESTMENT PORTFOLIO - 100.0% (Cost $1,773,065) | | 1,890,535 |
NET OTHER ASSETS (LIABILITIES) - 0.0% | | (136) |
NET ASSETS - 100% | $ 1,890,399 |
Legend |
(a) Non-income producing |
Other Information |
All investments are categorized as Level 1 under the Fair Value Hierarchy. The inputs or methodology used for valuing securities may not be an indication of the risk associated with investing in those securities. For more information on valuation inputs, please refer to the Security Valuation section in the accompanying Notes to Financial Statements. |
Income Tax Information |
At July 31, 2011, the Fund had a capital loss carryforward of approximately $134,792 of which $9,801, $66,647 and $58,344 will expire in fiscal 2017, 2018 and 2019, respectively. Capital loss carryforwards are only available to offset future capital gains of the Fund to the extent provided by regulations and may be limited. |
See accompanying notes which are an integral part of the financial statements.
Annual Report
Fidelity Income Replacement 2024 Fund
Statement of Assets and Liabilities
| July 31, 2011 |
| | |
Assets | | |
Investment in securities, at value (cost $1,773,065) - See accompanying schedule | | $ 1,890,535 |
Cash | | 72 |
Total assets | | 1,890,607 |
| | |
Liabilities | | |
Payable for investments purchased | $ 4 | |
Distribution and service plan fees payable | 204 | |
Total liabilities | | 208 |
| | |
Net Assets | | $ 1,890,399 |
Net Assets consist of: | | |
Paid in capital | | $ 1,937,792 |
Undistributed net investment income | | 362 |
Accumulated undistributed net realized gain (loss) on investments | | (165,225) |
Net unrealized appreciation (depreciation) on investments | | 117,470 |
Net Assets | | $ 1,890,399 |
| | |
Calculation of Maximum Offering Price Class A:
Net Asset Value and redemption price per share ($187,352 ÷ 3,758.0 shares) | | $ 49.85 |
| | |
Maximum offering price per share (100/94.25 of $49.85) | | $ 52.89 |
| | |
Class T:
Net Asset Value and redemption price per share ($40,221 ÷ 806.5 shares) | | $ 49.87 |
| | |
Maximum offering price per share (100/96.50 of $49.87) | | $ 51.68 |
| | |
Class C:
Net Asset Value and offering price per share ($171,805 ÷ 3,448.6 shares)A | | $ 49.82 |
| | |
| | |
Income Replacement 2024:
Net Asset Value, offering price and redemption price per share ($1,463,400 ÷ 29,350.7 shares) | | $ 49.86 |
| | |
Institutional Class:
Net Asset Value, offering price and redemption price per share ($27,621 ÷ 554.0 shares) | | $ 49.86 |
A Redemption price per share is equal to net asset value less any applicable contingent deferred sales charge.
Statement of Operations
| Year ended July 31, 2011 |
| | |
Investment Income | | |
Income distributions from underlying funds | | $ 32,191 |
| | |
Expenses | | |
Distribution and service plan fees | $ 2,557 | |
Independent trustees' compensation | 6 | |
Total expenses before reductions | 2,563 | |
Expense reductions | (6) | 2,557 |
Net investment income (loss) | | 29,634 |
Realized and Unrealized Gain (Loss) Realized gain (loss) on sale of underlying fund shares | (15,024) | |
Capital gain distributions from underlying funds | 9,534 | |
Total net realized gain (loss) | | (5,490) |
Change in net unrealized appreciation (depreciation) on underlying funds | | 160,663 |
Net gain (loss) | | 155,173 |
Net increase (decrease) in net assets resulting from operations | | $ 184,807 |
See accompanying notes which are an integral part of the financial statements.
Annual Report
Fidelity Income Replacement 2024 Fund
Financial Statements - continued
Statement of Changes in Net Assets
| Year ended
July 31, 2011 | Year ended
July 31, 2010 |
Increase (Decrease) in Net Assets | | |
Operations | | |
Net investment income (loss) | $ 29,634 | $ 30,872 |
Net realized gain (loss) | (5,490) | (37,364) |
Change in net unrealized appreciation (depreciation) | 160,663 | 180,425 |
Net increase (decrease) in net assets resulting from operations | 184,807 | 173,933 |
Distributions to shareholders from net investment income | (29,693) | (30,833) |
Distributions to shareholders from net realized gain | (7,078) | (4,233) |
Total distributions | (36,771) | (35,066) |
Share transactions - net increase (decrease) | 206,846 | 87,922 |
Total increase (decrease) in net assets | 354,882 | 226,789 |
| | |
Net Assets | | |
Beginning of period | 1,535,517 | 1,308,728 |
End of period (including undistributed net investment income of $362 and undistributed net investment income of $438, respectively) | $ 1,890,399 | $ 1,535,517 |
Financial Highlights - Class A
Years ended July 31, | 2011 | 2010 | 2009 | 2008G |
Selected Per-Share Data | | | | |
Net asset value, beginning of period | $ 45.41 | $ 41.48 | $ 46.97 | $ 50.00 |
Income from Investment Operations | | | | |
Net investment income (loss)E | .809 | .811 | 1.014 | 1.063 |
Net realized and unrealized gain (loss) | 4.667 | 4.020 | (5.004) | (2.884) |
Total from investment operations | 5.476 | 4.831 | (3.990) | (1.821) |
Distributions from net investment income | (.819) | (.791) | (1.020) | (1.039) |
Distributions from net realized gain | (.217) | (.110) | (.480) | (.170) |
Total distributions | (1.036) | (.901) | (1.500) | (1.209) |
Net asset value, end of period | $ 49.85 | $ 45.41 | $ 41.48 | $ 46.97 |
Total ReturnB,C,D | 12.13% | 11.70% | (8.10)% | (3.77)% |
Ratios to Average Net AssetsF,H | | | | |
Expenses before reductions | .25% | .25% | .25% | .25%A |
Expenses net of fee waivers, if any | .25% | .25% | .25% | .25%A |
Expenses net of all reductions | .25% | .25% | .25% | .25%A |
Net investment income (loss) | 1.66% | 1.82% | 2.62% | 2.35%A |
Supplemental Data | | | | |
Net assets, end of period (000 omitted) | $ 187 | $ 260 | $ 287 | $ 286 |
Portfolio turnover rate | 26% | 34% | 64% | 41%A |
A Annualized
B Total returns for periods of less than one year are not annualized.
C Total returns would have been lower if certain expenses had not been reduced during the applicable periods shown.
D Total returns do not include the effect of the sales charges.
E Calculated based on average shares outstanding during the period.
F Amounts do not include the activity of the underlying funds.
G For the period August 30, 2007 (commencement of operations) to July 31, 2008.
H Expense ratios reflect operating expenses of the class. Expenses before reductions do not reflect amounts reimbursed by the investment adviser or reductions from expense offset arrangements and do not represent the amount paid by the class during periods when reimbursements or reductions occur. Expenses net of fee waivers reflect expenses after reimbursement by the investment adviser but prior to reductions from expense offset arrangements. Expenses net of all reductions represent the net expenses paid by the class but do not include expenses of the investment companies in which the Fund invests.
See accompanying notes which are an integral part of the financial statements.
Annual Report
Financial Highlights - Class T
Years ended July 31, | 2011 | 2010 | 2009 | 2008G |
Selected Per-Share Data | | | | |
Net asset value, beginning of period | $ 45.42 | $ 41.48 | $ 46.97 | $ 50.00 |
Income from Investment Operations | | | | |
Net investment income (loss)E | .685 | .701 | .919 | .966 |
Net realized and unrealized gain (loss) | 4.672 | 4.025 | (5.010) | (2.903) |
Total from investment operations | 5.357 | 4.726 | (4.091) | (1.937) |
Distributions from net investment income | (.690) | (.676) | (.919) | (.923) |
Distributions from net realized gain | (.217) | (.110) | (.480) | (.170) |
Total distributions | (.907) | (.786) | (1.399) | (1.093) |
Net asset value, end of period | $ 49.87 | $ 45.42 | $ 41.48 | $ 46.97 |
Total ReturnB,C,D | 11.85% | 11.43% | (8.34)% | (3.99)% |
Ratios to Average Net AssetsF,H | | | | |
Expenses before reductions | .50% | .50% | .50% | .50%A |
Expenses net of fee waivers, if any | .50% | .50% | .50% | .50%A |
Expenses net of all reductions | .50% | .50% | .50% | .50%A |
Net investment income (loss) | 1.41% | 1.57% | 2.37% | 2.11%A |
Supplemental Data | | | | |
Net assets, end of period (000 omitted) | $ 40 | $ 54 | $ 69 | $ 96 |
Portfolio turnover rate | 26% | 34% | 64% | 41%A |
A Annualized
B Total returns for periods of less than one year are not annualized.
C Total returns would have been lower if certain expenses had not been reduced during the applicable periods shown.
D Total returns do not include the effect of the sales charges.
E Calculated based on average shares outstanding during the period.
F Amounts do not include the activity of the underlying funds.
G For the period August 30, 2007 (commencement of operations) to July 31, 2008.
H Expense ratios reflect operating expenses of the class. Expenses before reductions do not reflect amounts reimbursed by the investment adviser or reductions from expense offset arrangements and do not represent the amount paid by the class during periods when reimbursements or reductions occur. Expenses net of fee waivers reflect expenses after reimbursement by the investment adviser but prior to reductions from expense offset arrangements. Expenses net of all reductions represent the net expenses paid by the class but do not include expenses of the investment companies in which the Fund invests.
Financial Highlights - Class C
Years ended July 31, | 2011 | 2010 | 2009 | 2008G |
Selected Per-Share Data | | | | |
Net asset value, beginning of period | $ 45.38 | $ 41.45 | $ 46.93 | $ 50.00 |
Income from Investment Operations | | | | |
Net investment income (loss)E | .443 | .476 | .726 | .728 |
Net realized and unrealized gain (loss) | 4.668 | 4.020 | (5.005) | (2.903) |
Total from investment operations | 5.111 | 4.496 | (4.279) | (2.175) |
Distributions from net investment income | (.454) | (.456) | (.721) | (.725) |
Distributions from net realized gain | (.217) | (.110) | (.480) | (.170) |
Total distributions | (.671) | (.566) | (1.201) | (.895) |
Net asset value, end of period | $ 49.82 | $ 45.38 | $ 41.45 | $ 46.93 |
Total ReturnB,C,D | 11.30% | 10.87% | (8.80)% | (4.45)% |
Ratios to Average Net AssetsF,H | | | | |
Expenses before reductions | 1.00% | 1.00% | 1.00% | 1.00%A |
Expenses net of fee waivers, if any | 1.00% | 1.00% | 1.00% | 1.00%A |
Expenses net of all reductions | 1.00% | 1.00% | 1.00% | 1.00%A |
Net investment income (loss) | .91% | 1.07% | 1.87% | 1.61%A |
Supplemental Data | | | | |
Net assets, end of period (000 omitted) | $ 172 | $ 159 | $ 147 | $ 233 |
Portfolio turnover rate | 26% | 34% | 64% | 41%A |
A Annualized
B Total returns for periods of less than one year are not annualized.
C Total returns would have been lower if certain expenses had not been reduced during the applicable periods shown.
D Total returns do not include the effect of the contingent deferred sales charge.
E Calculated based on average shares outstanding during the period.
F Amounts do not include the activity of the underlying funds.
G For the period August 30, 2007 (commencement of operations) to July 31, 2008.
H Expense ratios reflect operating expenses of the class. Expenses before reductions do not reflect amounts reimbursed by the investment adviser or reductions from expense offset arrangements and do not represent the amount paid by the class during periods when reimbursements or reductions occur. Expenses net of fee waivers reflect expenses after reimbursement by the investment adviser but prior to reductions from expense offset arrangements. Expenses net of all reductions represent the net expenses paid by the class but do not include expenses of the investment companies in which the Fund invests.
See accompanying notes which are an integral part of the financial statements.
Annual Report
Financial Highlights - Income Replacement 2024
Years ended July 31, | 2011 | 2010 | 2009 | 2008G |
Selected Per-Share Data | | | | |
Net asset value, beginning of period | $ 45.42 | $ 41.49 | $ 46.98 | $ 50.00 |
Income from Investment Operations | | | | |
Net investment income (loss)D | .933 | .924 | 1.118 | 1.166 |
Net realized and unrealized gain (loss) | 4.668 | 4.020 | (5.011) | (2.868) |
Total from investment operations | 5.601 | 4.944 | (3.893) | (1.702) |
Distributions from net investment income | (.944) | (.904) | (1.117) | (1.148) |
Distributions from net realized gain | (.217) | (.110) | (.480) | (.170) |
Total distributions | (1.161) | (1.014) | (1.597) | (1.318) |
Net asset value, end of period | $ 49.86 | $ 45.42 | $ 41.49 | $ 46.98 |
Total ReturnB,C | 12.41% | 11.98% | (7.87)% | (3.53)% |
Ratios to Average Net AssetsE,H | | | | |
Expenses before reductionsF | .00% | .00% | .00% | .00%A |
Expenses net of fee waivers, if any | .00% | .00% | .00% | .00%A |
Expenses net of all reductions | .00% | .00% | .00% | .00%A |
Net investment income (loss) | 1.91% | 2.07% | 2.87% | 2.60%A |
Supplemental Data | | | | |
Net assets, end of period (000 omitted) | $ 1,463 | $ 1,026 | $ 749 | $ 714 |
Portfolio turnover rate | 26% | 34% | 64% | 41%A |
A Annualized
B Total returns for periods of less than one year are not annualized.
C Total returns would have been lower if certain expenses had not been reduced during the applicable periods shown.
D Calculated based on average shares outstanding during the period.
E Amounts do not include the activity of the underlying funds.
F Amount represents less than .01%.
G For the period August 30, 2007 (commencement of operations) to July 31, 2008.
H Expense ratios reflect operating expenses of the class. Expenses before reductions do not reflect amounts reimbursed by the investment adviser or reductions from expense offset arrangements and do not represent the amount paid by the class during periods when reimbursements or reductions occur. Expenses net of fee waivers reflect expenses after reimbursement by the investment adviser but prior to reductions from expense offset arrangements. Expenses net of all reductions represent the net expenses paid by the class but do not include expenses of the investment companies in which the Fund invests.
Financial Highlights - Institutional Class
Years ended July 31, | 2011 | 2010 | 2009 | 2008G |
Selected Per-Share Data | | | | |
Net asset value, beginning of period | $ 45.42 | $ 41.48 | $ 46.98 | $ 50.00 |
Income from Investment Operations | | | | |
Net investment income (loss)D | .930 | .922 | 1.119 | 1.194 |
Net realized and unrealized gain (loss) | 4.671 | 4.032 | (5.022) | (2.896) |
Total from investment operations | 5.601 | 4.954 | (3.903) | (1.702) |
Distributions from net investment income | (.944) | (.904) | (1.117) | (1.148) |
Distributions from net realized gain | (.217) | (.110) | (.480) | (.170) |
Total distributions | (1.161) | (1.014) | (1.597) | (1.318) |
Net asset value, end of period | $ 49.86 | $ 45.42 | $ 41.48 | $ 46.98 |
Total ReturnB,C | 12.41% | 12.00% | (7.89)% | (3.53)% |
Ratios to Average Net AssetsE,H | | | | |
Expenses before reductionsF | .00% | .00% | .00% | .00%A |
Expenses net of fee waivers, if any | .00% | .00% | .00% | .00%A |
Expenses net of all reductions | .00% | .00% | .00% | .00%A |
Net investment income (loss) | 1.91% | 2.07% | 2.87% | 2.60%A |
Supplemental Data | | | | |
Net assets, end of period (000 omitted) | $ 28 | $ 37 | $ 57 | $ 97 |
Portfolio turnover rate | 26% | 34% | 64% | 41%A |
A Annualized
B Total returns for periods of less than one year are not annualized.
C Total returns would have been lower if certain expenses had not been reduced during the applicable periods shown.
D Calculated based on average shares outstanding during the period.
E Amounts do not include the activity of the underlying funds.
F Amount represents less than .01%.
G For the period August 30, 2007 (commencement of operations) to July 31, 2008.
H Expense ratios reflect operating expenses of the class. Expenses before reductions do not reflect amounts reimbursed by the investment adviser or reductions from expense offset arrangements and do not represent the amount paid by the class during periods when reimbursements or reductions occur. Expenses net of fee waivers reflect expenses after reimbursement by the investment adviser but prior to reductions from expense offset arrangements. Expenses net of all reductions represent the net expenses paid by the class but do not include expenses of the investment companies in which the Fund invests.
See accompanying notes which are an integral part of the financial statements.
Annual Report
Fidelity Income Replacement 2026 Fund
Investment Changes (Unaudited)
Fund Holdings as of July 31, 2011 |
| % of fund's
net assets | % of fund's net assets
6 months ago |
Domestic Equity Funds | | |
Fidelity Advisor Mid Cap II Fund Institutional Class | 5.1 | 5.2 |
Fidelity Disciplined Equity Fund | 5.3 | 5.4 |
Fidelity Equity-Income Fund | 5.2 | 5.4 |
Fidelity Large Cap Core Enhanced Index Fund | 8.5 | 8.6 |
Fidelity Series 100 Index Fund | 6.4 | 6.4 |
Fidelity Series Broad Market Opportunities Fund | 8.4 | 8.6 |
Fidelity Series Small Cap Opportunities Fund | 3.3 | 3.4 |
| 42.2 | 43.0 |
International Equity Funds | | |
Fidelity Advisor International Discovery Fund Institutional Class | 6.3 | 6.4 |
High Yield Fixed-Income Funds | | |
Fidelity Capital & Income Fund | 2.2 | 2.2 |
Fidelity Strategic Income Fund | 2.2 | 2.2 |
| 4.4 | 4.4 |
Investment Grade Fixed-Income Funds | | |
Fidelity Government Income Fund | 6.2 | 6.1 |
Fidelity Strategic Real Return Fund | 6.2 | 6.1 |
Fidelity Total Bond Fund | 18.6 | 18.4 |
| 31.0 | 30.6 |
Short-Term Funds | | |
Fidelity Institutional Money Market Portfolio Institutional Class | 8.0 | 7.8 |
Fidelity Short-Term Bond Fund | 8.1 | 7.8 |
| 16.1 | 15.6 |
Net Other Assets (Liabilities)* | 0.0 | 0.0 |
| 100.0 | 100.0 |
* Amount represents less than 0.1% |
Asset Allocation (% of fund's net assets) |
Current |
| Domestic Equity Funds | 42.2% | |
| International Equity Funds | 6.3% | |
| High Yield
Fixed-Income Funds | 4.4% | |
| Investment Grade Fixed-Income Funds | 31.0% | |
| Short-Term Funds | 16.1% | |

Six months ago |
| Domestic Equity Funds | 43.0% | |
| International Equity Funds | 6.4% | |
| High Yield
Fixed-Income Funds | 4.4% | |
| Investment Grade Fixed-Income Funds | 30.6% | |
| Short-Term Funds | 15.6% | |

Expected |
| Domestic Equity Funds | 42.2% | |
| International Equity Funds | 6.0% | |
| High Yield
Fixed-Income Funds | 4.2% | |
| Investment Grade Fixed-Income Funds | 31.3% | |
| Short-Term Funds | 16.3% | |

The fund invests according to an asset allocation strategy that becomes increasingly conservative over time. The six months ago allocation is based on the fund's holdings as of January 31, 2011. The current allocation is based on the fund's holdings as of July 31, 2011. The expected allocation represents the fund's anticipated allocation at January 31, 2012. |
Annual Report
Fidelity Income Replacement 2026 Fund
Investments July 31, 2011
Showing Percentage of Net Assets
Equity Funds - 48.5% |
| Shares | | Value |
Domestic Equity Funds - 42.2% |
Fidelity Advisor Mid Cap II Fund Institutional Class (a) | 5,898 | | $ 106,934 |
Fidelity Disciplined Equity Fund | 4,781 | | 111,297 |
Fidelity Equity-Income Fund | 2,473 | | 109,722 |
Fidelity Large Cap Core Enhanced Index Fund | 20,161 | | 180,847 |
Fidelity Series 100 Index Fund | 15,033 | | 136,051 |
Fidelity Series Broad Market Opportunities Fund | 17,322 | | 178,417 |
Fidelity Series Small Cap Opportunities Fund | 6,320 | | 70,910 |
TOTAL DOMESTIC EQUITY FUNDS | | 894,178 |
International Equity Funds - 6.3% |
Fidelity Advisor International Discovery Fund Institutional Class | 3,941 | | 132,532 |
TOTAL EQUITY FUNDS (Cost $1,010,950) | 1,026,710 |
Fixed-Income Funds - 35.4% |
| | | |
High Yield Fixed-Income Funds - 4.4% |
Fidelity Capital & Income Fund | 4,801 | | 45,941 |
Fidelity Strategic Income Fund | 4,151 | | 47,240 |
TOTAL HIGH YIELD FIXED-INCOME FUNDS | | 93,181 |
|
| Shares | | Value |
Investment Grade Fixed-Income Funds - 31.0% |
Fidelity Government Income Fund | 12,311 | | $ 131,479 |
Fidelity Strategic Real Return Fund | 13,203 | | 131,240 |
Fidelity Total Bond Fund | 35,788 | | 394,031 |
TOTAL INVESTMENT GRADE FIXED-INCOME FUNDS | | 656,750 |
TOTAL FIXED-INCOME FUNDS (Cost $726,483) | 749,931 |
Short-Term Funds - 16.1% |
| | | |
Fidelity Institutional Money Market Portfolio Institutional Class | 169,363 | | 169,363 |
Fidelity Short-Term Bond Fund | 19,953 | | 170,401 |
TOTAL SHORT-TERM FUNDS (Cost $338,274) | 339,764 |
TOTAL INVESTMENT PORTFOLIO - 100.0% (Cost $2,075,707) | | 2,116,405 |
NET OTHER ASSETS (LIABILITIES) - 0.0% | | (236) |
NET ASSETS - 100% | $ 2,116,169 |
Legend |
(a) Non-income producing |
Other Information |
All investments are categorized as Level 1 under the Fair Value Hierarchy. The inputs or methodology used for valuing securities may not be an indication of the risk associated with investing in those securities. For more information on valuation inputs, please refer to the Security Valuation section in the accompanying Notes to Financial Statements. |
Income Tax Information |
At July 31, 2011, the Fund had a capital loss carryforward of approximately $233,577 all of which will expire in fiscal 2018. Capital loss carryforwards are only available to offset future capital gains of the Fund to the extent provided by regulations and may be limited. |
See accompanying notes which are an integral part of the financial statements.
Annual Report
Fidelity Income Replacement 2026 Fund
Statement of Assets and Liabilities
| July 31, 2011 |
| | |
Assets | | |
Investment in securities, at value (cost $2,075,707) - See accompanying schedule | | $ 2,116,405 |
Receivable for investments sold | | 823 |
Receivable for fund shares sold | | 176 |
Total assets | | 2,117,404 |
| | |
Liabilities | | |
Payable for investments purchased | $ 163 | |
Payable for fund shares redeemed | 838 | |
Distribution and service plan fees payable | 234 | |
Total liabilities | | 1,235 |
| | |
Net Assets | | $ 2,116,169 |
Net Assets consist of: | | |
Paid in capital | | $ 2,329,399 |
Undistributed net investment income | | 405 |
Accumulated undistributed net realized gain (loss) on investments | | (254,333) |
Net unrealized appreciation (depreciation) on investments | | 40,698 |
Net Assets | | $ 2,116,169 |
| | |
Calculation of Maximum Offering Price Class A:
Net Asset Value and redemption price per share ($108,032 ÷ 2,181.2 shares) | | $ 49.53 |
| | |
Maximum offering price per share (100/94.25 of $49.53) | | $ 52.55 |
| | |
Class T:
Net Asset Value and redemption price per share ($130,369 ÷ 2,632.2 shares) | | $ 49.53 |
| | |
Maximum offering price per share (100/96.50 of $49.53) | | $ 51.33 |
| | |
Class C:
Net Asset Value and offering price per share ($184,116 ÷ 3,720.4 shares)A | | $ 49.49 |
| | |
Income Replacement 2026:
Net Asset Value, offering price and redemption price per share ($1,666,155 ÷ 33,638.7 shares) | | $ 49.53 |
| | |
Institutional Class:
Net Asset Value, offering price and redemption price per share ($27,497 ÷ 555.2 shares) | | $ 49.53 |
A Redemption price per share is equal to net asset value less any applicable contingent deferred sales charge.
Statement of Operations
| Year ended July 31, 2011 |
| | |
Investment Income | | |
Income distributions from underlying funds | | $ 26,676 |
| | |
Expenses | | |
Distribution and service plan fees | $ 2,604 | |
Independent trustees' compensation | 5 | |
Total expenses before reductions | 2,609 | |
Expense reductions | (5) | 2,604 |
Net investment income (loss) | | 24,072 |
Realized and Unrealized Gain (Loss) Realized gain (loss) on sale of underlying fund shares | 16,602 | |
Capital gain distributions from underlying funds | 6,465 | |
Total net realized gain (loss) | | 23,067 |
Change in net unrealized appreciation (depreciation) on underlying funds | | 89,707 |
Net gain (loss) | | 112,774 |
Net increase (decrease) in net assets resulting from operations | | $ 136,846 |
See accompanying notes which are an integral part of the financial statements.
Annual Report
Statement of Changes in Net Assets
| Year ended
July 31, 2011 | Year ended
July 31, 2010 |
Increase (Decrease) in Net Assets | | |
Operations | | |
Net investment income (loss) | $ 24,072 | $ 13,583 |
Net realized gain (loss) | 23,067 | (46,103) |
Change in net unrealized appreciation (depreciation) | 89,707 | 120,286 |
Net increase (decrease) in net assets resulting from operations | 136,846 | 87,766 |
Distributions to shareholders from net investment income | (23,914) | (13,653) |
Distributions to shareholders from net realized gain | (4,626) | (1,823) |
Total distributions | (28,540) | (15,476) |
Share transactions - net increase (decrease) | 1,015,365 | 199,973 |
Total increase (decrease) in net assets | 1,123,671 | 272,263 |
| | |
Net Assets | | |
Beginning of period | 992,498 | 720,235 |
End of period (including undistributed net investment income of $405 and undistributed net investment income of $259, respectively) | $ 2,116,169 | $ 992,498 |
Financial Highlights - Class A
Years ended July 31, | 2011 | 2010 | 2009 | 2008G |
Selected Per-Share Data | | | | |
Net asset value, beginning of period | $ 44.93 | $ 40.97 | $ 46.76 | $ 50.00 |
Income from Investment Operations | | | | |
Net investment income (loss)E | .750 | .743 | 1.042 | 1.076 |
Net realized and unrealized gain (loss) | 4.846 | 4.098 | (5.184) | (3.105) |
Total from investment operations | 5.596 | 4.841 | (4.142) | (2.029) |
Distributions from net investment income | (.796) | (.771) | (1.028) | (1.031) |
Distributions from net realized gain | (.200) | (.110) | (.620) | (.180) |
Total distributions | (.996) | (.881) | (1.648) | (1.211) |
Net asset value, end of period | $ 49.53 | $ 44.93 | $ 40.97 | $ 46.76 |
Total ReturnB,C,D | 12.52% | 11.87% | (8.56)% | (4.19)% |
Ratios to Average Net AssetsF,H | | | | |
Expenses before reductions | .25% | .25% | .25% | .25%A |
Expenses net of fee waivers, if any | .25% | .25% | .25% | .25%A |
Expenses net of all reductions | .25% | .25% | .25% | .25%A |
Net investment income (loss) | 1.55% | 1.68% | 2.70% | 2.36%A |
Supplemental Data | | | | |
Net assets, end of period (000 omitted) | $ 108 | $ 45 | $ 69 | $ 131 |
Portfolio turnover rate | 25% | 61% | 26% | 21% A |
A Annualized
B Total returns for periods of less than one year are not annualized.
C Total returns would have been lower if certain expenses had not been reduced during the applicable periods shown.
D Total returns do not include the effect of the sales charges.
E Calculated based on average shares outstanding during the period.
F Amounts do not include the activity of the underlying funds.
G For the period August 30, 2007 (commencement of operations) to July 31, 2008.
H Expense ratios reflect operating expenses of the class. Expenses before reductions do not reflect amounts reimbursed by the investment adviser or reductions from expense offset arrangements and do not represent the amount paid by the class during periods when reimbursements or reductions occur. Expenses net of fee waivers reflect expenses after reimbursement by the investment adviser but prior to reductions from expense offset arrangements. Expenses net of all reductions represent the net expenses paid by the class but do not include expenses of the investment companies in which the Fund invests.
See accompanying notes which are an integral part of the financial statements.
Annual Report
Financial Highlights - Class T
Years ended July 31, | 2011 | 2010 | 2009 | 2008G |
Selected Per-Share Data | | | | |
Net asset value, beginning of period | $ 44.92 | $ 40.97 | $ 46.76 | $ 50.00 |
Income from Investment Operations | | | | |
Net investment income (loss)E | .630 | .638 | .944 | .966 |
Net realized and unrealized gain (loss) | 4.851 | 4.092 | (5.184) | (3.110) |
Total from investment operations | 5.481 | 4.730 | (4.240) | (2.144) |
Distributions from net investment income | (.671) | (.670) | (.930) | (.916) |
Distributions from net realized gain | (.200) | (.110) | (.620) | (.180) |
Total distributions | (.871) | (.780) | (1.550) | (1.096) |
Net asset value, end of period | $ 49.53 | $ 44.92 | $ 40.97 | $ 46.76 |
Total ReturnB,C,D | 12.26% | 11.59% | (8.79)% | (4.41)% |
Ratios to Average Net AssetsF,H | | | | |
Expenses before reductions | .50% | .50% | .50% | .50%A |
Expenses net of fee waivers, if any | .50% | .50% | .50% | .50%A |
Expenses net of all reductions | .50% | .50% | .50% | .50%A |
Net investment income (loss) | 1.30% | 1.44% | 2.45% | 2.11%A |
Supplemental Data | | | | |
Net assets, end of period (000 omitted) | $ 130 | $ 116 | $ 55 | $ 96 |
Portfolio turnover rate | 25% | 61% | 26% | 21%A |
A Annualized
B Total returns for periods of less than one year are not annualized.
C Total returns would have been lower if certain expenses had not been reduced during the applicable periods shown.
D Total returns do not include the effect of the sales charges.
E Calculated based on average shares outstanding during the period.
F Amounts do not include the activity of the underlying funds.
G For the period August 30, 2007 (commencement of operations) to July 31, 2008.
H Expense ratios reflect operating expenses of the class. Expenses before reductions do not reflect amounts reimbursed by the investment adviser or reductions from expense offset arrangements and do not represent the amount paid by the class during periods when reimbursements or reductions occur. Expenses net of fee waivers reflect expenses after reimbursement by the investment adviser but prior to reductions from expense offset arrangements. Expenses net of all reductions represent the net expenses paid by the class but do not include expenses of the investment companies in which the Fund invests.
Financial Highlights - Class C
Years ended July 31, | 2011 | 2010 | 2009 | 2008G |
Selected Per-Share Data | | | | |
Net asset value, beginning of period | $ 44.89 | $ 40.95 | $ 46.72 | $ 50.00 |
Income from Investment Operations | | | | |
Net investment income (loss)E | .387 | .412 | .757 | .723 |
Net realized and unrealized gain (loss) | 4.848 | 4.087 | (5.183) | (3.090) |
Total from investment operations | 5.235 | 4.499 | (4.426) | (2.367) |
Distributions from net investment income | (.435) | (.449) | (.724) | (.733) |
Distributions from net realized gain | (.200) | (.110) | (.620) | (.180) |
Total distributions | (.635) | (.559) | (1.344) | (.913) |
Net asset value, end of period | $ 49.49 | $ 44.89 | $ 40.95 | $ 46.72 |
Total ReturnB,C,D | 11.70% | 11.01% | (9.25)% | (4.85)% |
Ratios to Average Net AssetsF,H | | | | |
Expenses before reductions | 1.00% | 1.00% | 1.00% | 1.00%A |
Expenses net of fee waivers, if any | 1.00% | 1.00% | 1.00% | 1.00%A |
Expenses net of all reductions | 1.00% | 1.00% | 1.00% | 1.00%A |
Net investment income (loss) | .80% | .94% | 1.95% | 1.61%A |
Supplemental Data | | | | |
Net assets, end of period (000 omitted) | $ 184 | $ 174 | $ 183 | $ 485 |
Portfolio turnover rate | 25% | 61% | 26% | 21%A |
A Annualized
B Total returns for periods of less than one year are not annualized.
C Total returns would have been lower if certain expenses had not been reduced during the applicable periods shown.
D Total returns do not include the effect of the contingent deferred sales charge.
E Calculated based on average shares outstanding during the period.
F Amounts do not include the activity of the underlying funds.
G For the period August 30, 2007 (commencement of operations) to July 31, 2008.
H Expense ratios reflect operating expenses of the class. Expenses before reductions do not reflect amounts reimbursed by the investment adviser or reductions from expense offset arrangements and do not represent the amount paid by the class during periods when reimbursements or reductions occur. Expenses net of fee waivers reflect expenses after reimbursement by the investment adviser but prior to reductions from expense offset arrangements. Expenses net of all reductions represent the net expenses paid by the class but do not include expenses of the investment companies in which the Fund invests.
See accompanying notes which are an integral part of the financial statements.
Annual Report
Financial Highlights - Income Replacement 2026
Years ended July 31, | 2011 | 2010 | 2009 | 2008G |
Selected Per-Share Data | | | | |
Net asset value, beginning of period | $ 44.92 | $ 40.97 | $ 46.77 | $ 50.00 |
Income from Investment Operations | | | | |
Net investment income (loss)D | .878 | .856 | 1.138 | 1.168 |
Net realized and unrealized gain (loss) | 4.844 | 4.091 | (5.190) | (3.079) |
Total from investment operations | 5.722 | 4.947 | (4.052) | (1.911) |
Distributions from net investment income | (.912) | (.887) | (1.128) | (1.139) |
Distributions from net realized gain | (.200) | (.110) | (.620) | (.180) |
Total distributions | (1.112) | (.997) | (1.748) | (1.319) |
Net asset value, end of period | $ 49.53 | $ 44.92 | $ 40.97 | $ 46.77 |
Total ReturnB,C | 12.82% | 12.14% | (8.34)% | (3.96)% |
Ratios to Average Net AssetsE,H | | | | |
Expenses before reductionsF | .00% | .00% | .00% | .00%A |
Expenses net of fee waivers, if any | .00% | .00% | .00% | .00%A |
Expenses net of all reductions | .00% | .00% | .00% | .00%A |
Net investment income (loss) | 1.80% | 1.94% | 2.95% | 2.61%A |
Supplemental Data | | | | |
Net assets, end of period (000 omitted) | $ 1,666 | $ 622 | $ 357 | $ 783 |
Portfolio turnover rate | 25% | 61% | 26% | 21%A |
A Annualized
B Total returns for periods of less than one year are not annualized.
C Total returns would have been lower if certain expenses had not been reduced during the applicable periods shown.
D Calculated based on average shares outstanding during the period.
E Amounts do not include the activity of the underlying funds.
F Amount represents less than .01%.
G For the period August 30, 2007 (commencement of operations) to July 31, 2008.
H Expense ratios reflect operating expenses of the class. Expenses before reductions do not reflect amounts reimbursed by the investment adviser or reductions from expense offset arrangements and do not represent the amount paid by the class during periods when reimbursements or reductions occur. Expenses net of fee waivers reflect expenses after reimbursement by the investment adviser but prior to reductions from expense offset arrangements. Expenses net of all reductions represent the net expenses paid by the class but do not include expenses of the investment companies in which the Fund invests.
Financial Highlights - Institutional Class
Years ended July 31, | 2011 | 2010 | 2009 | 2008G |
Selected Per-Share Data | | | | |
Net asset value, beginning of period | $ 44.92 | $ 40.97 | $ 46.77 | $ 50.00 |
Income from Investment Operations | | | | |
Net investment income (loss)D | .870 | .855 | 1.136 | 1.196 |
Net realized and unrealized gain (loss) | 4.852 | 4.092 | (5.188) | (3.107) |
Total from investment operations | 5.722 | 4.947 | (4.052) | (1.911) |
Distributions from net investment income | (.912) | (.887) | (1.128) | (1.139) |
Distributions from net realized gain | (.200) | (.110) | (.620) | (.180) |
Total distributions | (1.112) | (.997) | (1.748) | (1.319) |
Net asset value, end of period | $ 49.53 | $ 44.92 | $ 40.97 | $ 46.77 |
Total ReturnB,C | 12.82% | 12.14% | (8.34)% | (3.96)% |
Ratios to Average Net AssetsE,H | | | | |
Expenses before reductionsF | .00% | .00% | .00% | .00%A |
Expenses net of fee waivers, if any | .00% | .00% | .00% | .00%A |
Expenses net of all reductions | .00% | .00% | .00% | .00%A |
Net investment income (loss) | 1.80% | 1.94% | 2.95% | 2.61%A |
Supplemental Data | | | | |
Net assets, end of period (000 omitted) | $ 27 | $ 36 | $ 56 | $ 96 |
Portfolio turnover rate | 25% | 61% | 26% | 21%A |
A Annualized
B Total returns for periods of less than one year are not annualized.
C Total returns would have been lower if certain expenses had not been reduced during the applicable periods shown.
D Calculated based on average shares outstanding during the period.
E Amounts do not include the activity of the underlying funds.
F Amount represents less than .01%.
G For the period August 30, 2007 (commencement of operations) to July 31, 2008.
H Expense ratios reflect operating expenses of the class. Expenses before reductions do not reflect amounts reimbursed by the investment adviser or reductions from expense offset arrangements and do not represent the amount paid by the class during periods when reimbursements or reductions occur. Expenses net of fee waivers reflect expenses after reimbursement by the investment adviser but prior to reductions from expense offset arrangements. Expenses net of all reductions represent the net expenses paid by the class but do not include expenses of the investment companies in which the Fund invests.
See accompanying notes which are an integral part of the financial statements.
Annual Report
Fidelity Income Replacement 2028 Fund
Investment Changes (Unaudited)
Fund Holdings as of July 31, 2011 |
| % of fund's
net assets | % of fund's net assets
6 months ago |
Domestic Equity Funds | | |
Fidelity Advisor Mid Cap II Fund Institutional Class | 5.2 | 5.3 |
Fidelity Disciplined Equity Fund | 5.4 | 5.5 |
Fidelity Equity-Income Fund | 5.4 | 5.5 |
Fidelity Large Cap Core Enhanced Index Fund | 8.8 | 8.9 |
Fidelity Series 100 Index Fund | 6.7 | 6.6 |
Fidelity Series Broad Market Opportunities Fund | 8.7 | 8.9 |
Fidelity Series Small Cap Opportunities Fund | 3.5 | 3.5 |
| 43.7 | 44.2 |
International Equity Funds | | |
Fidelity Advisor International Discovery Fund Institutional Class | 7.0 | 7.2 |
High Yield Fixed-Income Funds | | |
Fidelity Capital & Income Fund | 2.3 | 2.4 |
Fidelity Strategic Income Fund | 2.4 | 2.3 |
| 4.7 | 4.7 |
Investment Grade Fixed-Income Funds | | |
Fidelity Government Income Fund | 6.0 | 5.9 |
Fidelity Strategic Real Return Fund | 6.0 | 6.0 |
Fidelity Total Bond Fund | 18.0 | 17.8 |
| 30.0 | 29.7 |
Short-Term Funds | | |
Fidelity Institutional Money Market Portfolio Institutional Class | 7.3 | 7.1 |
Fidelity Short-Term Bond Fund | 7.3 | 7.1 |
| 14.6 | 14.2 |
Net Other Assets (Liabilities)* | 0.0 | 0.0 |
| 100.0 | 100.0 |
* Amount represents less than 0.1% |
Asset Allocation (% of fund's net assets) |
Current |
| Domestic Equity Funds | 43.7% | |
| International Equity Funds | 7.0% | |
| High Yield
Fixed-Income Funds | 4.7% | |
| Investment Grade Fixed-Income Funds | 30.0% | |
| Short-Term Funds | 14.6% | |

Six months ago |
| Domestic Equity Funds | 44.2% | |
| International Equity Funds | 7.2% | |
| High Yield
Fixed-Income Funds | 4.7% | |
| Investment Grade Fixed-Income Funds | 29.7% | |
| Short-Term Funds | 14.2% | |

Expected |
| Domestic Equity Funds | 43.6% | |
| International Equity Funds | 6.8% | |
| High Yield
Fixed-Income Funds | 4.6% | |
| Investment Grade Fixed-Income Funds | 30.1% | |
| Short-Term Funds | 14.9% | |

The fund invests according to an asset allocation strategy that becomes increasingly conservative over time. The six months ago allocation is based on the fund's holdings as of January 31, 2011. The current allocation is based on the fund's holdings as of July 31, 2011. The expected allocation represents the fund's anticipated allocation at January 31, 2012. |
Annual Report
Fidelity Income Replacement 2028 Fund
Investments July 31, 2011
Showing Percentage of Net Assets
Equity Funds - 50.7% |
| Shares | | Value |
Domestic Equity Funds - 43.7% |
Fidelity Advisor Mid Cap II Fund Institutional Class (a) | 17,596 | | $ 319,008 |
Fidelity Disciplined Equity Fund | 14,289 | | 332,641 |
Fidelity Equity-Income Fund | 7,396 | | 328,096 |
Fidelity Large Cap Core Enhanced Index Fund | 60,340 | | 541,253 |
Fidelity Series 100 Index Fund | 44,955 | | 406,839 |
Fidelity Series Broad Market Opportunities Fund | 51,796 | | 533,504 |
Fidelity Series Small Cap Opportunities Fund | 18,857 | | 211,575 |
TOTAL DOMESTIC EQUITY FUNDS | | 2,672,916 |
International Equity Funds - 7.0% |
Fidelity Advisor International Discovery Fund Institutional Class | 12,762 | | 429,191 |
TOTAL EQUITY FUNDS (Cost $2,893,214) | 3,102,107 |
Fixed-Income Funds - 34.7% |
| | | |
High Yield Fixed-Income Funds - 4.7% |
Fidelity Capital & Income Fund | 14,925 | | 142,835 |
Fidelity Strategic Income Fund | 12,928 | | 147,120 |
TOTAL HIGH YIELD FIXED-INCOME FUNDS | | 289,955 |
|
| Shares | | Value |
Investment Grade Fixed-Income Funds - 30.0% |
Fidelity Government Income Fund | 34,396 | | $ 367,347 |
Fidelity Strategic Real Return Fund | 36,854 | | 366,332 |
Fidelity Total Bond Fund | 99,916 | | 1,100,075 |
TOTAL INVESTMENT GRADE FIXED-INCOME FUNDS | | 1,833,754 |
TOTAL FIXED-INCOME FUNDS (Cost $1,984,070) | 2,123,709 |
Short-Term Funds - 14.6% |
| | | |
Fidelity Institutional Money Market Portfolio Institutional Class | 447,019 | | 447,019 |
Fidelity Short-Term Bond Fund | 52,693 | | 449,997 |
TOTAL SHORT-TERM FUNDS (Cost $887,417) | 897,016 |
TOTAL INVESTMENT PORTFOLIO - 100.0% (Cost $5,764,701) | | 6,122,832 |
NET OTHER ASSETS (LIABILITIES) - 0.0% | | (121) |
NET ASSETS - 100% | $ 6,122,711 |
Legend |
(a) Non-income producing |
Other Information |
All investments are categorized as Level 1 under the Fair Value Hierarchy. The inputs or methodology used for valuing securities may not be an indication of the risk associated with investing in those securities. For more information on valuation inputs, please refer to the Security Valuation section in the accompanying Notes to Financial Statements. |
Income Tax Information |
At July 31, 2011, the Fund had a capital loss carryforward of approximately $600,001 of which $7,815, $381,761 and $210,425 will expire in fiscal 2017, 2018 and 2019, respectively. Capital loss carryforwards are only available to offset future capital gains of the Fund to the extent provided by regulations and may be limited. |
See accompanying notes which are an integral part of the financial statements.
Annual Report
Fidelity Income Replacement 2028 Fund
Statement of Assets and Liabilities
| July 31, 2011 |
| | |
Assets | | |
Investment in securities, at value (cost $5,764,701) - See accompanying schedule | | $ 6,122,832 |
Cash | | 1 |
Total assets | | 6,122,833 |
| | |
Liabilities | | |
Distribution and service plan fees payable | | 122 |
| | |
Net Assets | | $ 6,122,711 |
Net Assets consist of: | | |
Paid in capital | | $ 6,478,326 |
Undistributed net investment income | | 1,283 |
Accumulated undistributed net realized gain (loss) on investments | | (715,029) |
Net unrealized appreciation (depreciation) on investments | | 358,131 |
Net Assets | | $ 6,122,711 |
| | |
Calculation of Maximum Offering Price Class A:
Net Asset Value and redemption price per share ($133,341 ÷ 2,671.2 shares) | | $ 49.92 |
| | |
Maximum offering price per share (100/94.25 of $49.92) | | $ 52.97 |
| | |
Class T:
Net Asset Value and redemption price per share ($130,222 ÷ 2,607.4 shares) | | $ 49.94 |
| | |
Maximum offering price per share (100/96.50 of $49.94) | | $ 51.75 |
| | |
Class C:
Net Asset Value and offering price per share ($48,899 ÷ 979.2 shares)A | | $ 49.94 |
| | |
Income Replacement 2028:
Net Asset Value, offering price and redemption price per share ($5,782,807 ÷ 115,831.5 shares) | | $ 49.92 |
| | |
Institutional Class:
Net Asset Value, offering price and redemption price per share ($27,442 ÷ 549.7 shares) | | $ 49.92 |
A Redemption price per share is equal to net asset value less any applicable contingent deferred sales charge.
Statement of Operations
| Year ended July 31, 2011 |
| | |
Investment Income | | |
Income distributions from underlying funds | | $ 118,343 |
| | |
Expenses | | |
Distribution and service plan fees | $ 2,069 | |
Independent trustees' compensation | 23 | |
Total expenses before reductions | 2,092 | |
Expense reductions | (23) | 2,069 |
Net investment income (loss) | | 116,274 |
Realized and Unrealized Gain (Loss) Realized gain (loss) on sale of underlying fund shares | (40,097) | |
Capital gain distributions from underlying funds | 35,036 | |
Total net realized gain (loss) | | (5,061) |
Change in net unrealized appreciation (depreciation) on underlying funds | | 647,446 |
Net gain (loss) | | 642,385 |
Net increase (decrease) in net assets resulting from operations | | $ 758,659 |
See accompanying notes which are an integral part of the financial statements.
Annual Report
Fidelity Income Replacement 2028 Fund
Financial Statements - continued
Statement of Changes in Net Assets
| Year ended
July 31, 2011 | Year ended
July 31, 2010 |
Increase (Decrease) in Net Assets | | |
Operations | | |
Net investment income (loss) | $ 116,274 | $ 130,949 |
Net realized gain (loss) | (5,061) | (193,465) |
Change in net unrealized appreciation (depreciation) | 647,446 | 828,403 |
Net increase (decrease) in net assets resulting from operations | 758,659 | 765,887 |
Distributions to shareholders from net investment income | (116,717) | (131,065) |
Distributions to shareholders from net realized gain | (25,763) | (16,965) |
Total distributions | (142,480) | (148,030) |
Share transactions - net increase (decrease) | (649,489) | (832,893) |
Total increase (decrease) in net assets | (33,310) | (215,036) |
| | |
Net Assets | | |
Beginning of period | 6,156,021 | 6,371,057 |
End of period (including undistributed net investment income of $1,283 and undistributed net investment income of $1,839, respectively) | $ 6,122,711 | $ 6,156,021 |
Financial Highlights - Class A
Years ended July 31, | 2011 | 2010 | 2009 | 2008G |
Selected Per-Share Data | | | | |
Net asset value, beginning of period | $ 45.17 | $ 41.16 | $ 46.81 | $ 50.00 |
Income from Investment Operations | | | | |
Net investment income (loss)E | .802 | .789 | 1.000 | .966 |
Net realized and unrealized gain (loss) | 4.972 | 4.116 | (5.341) | (3.085) |
Total from investment operations | 5.774 | 4.905 | (4.341) | (2.119) |
Distributions from net investment income | (.815) | (.785) | (.979) | (.911) |
Distributions from net realized gain | (.209) | (.110) | (.330) | (.160) |
Total distributions | (1.024) | (.895) | (1.309) | (1.071) |
Net asset value, end of period | $ 49.92 | $ 45.17 | $ 41.16 | $ 46.81 |
Total ReturnB,C,D | 12.85% | 11.96% | (8.93)% | (4.36)% |
Ratios to Average Net AssetsF,H | | | | |
Expenses before reductions | .25% | .25% | .25% | .25%A |
Expenses net of fee waivers, if any | .25% | .25% | .25% | .25%A |
Expenses net of all reductions | .25% | .25% | .25% | .25%A |
Net investment income (loss) | 1.65% | 1.78% | 2.60% | 2.16%A |
Supplemental Data | | | | |
Net assets, end of period (000 omitted) | $ 133 | $ 359 | $ 278 | $ 371 |
Portfolio turnover rate | 17% | 16% | 53% | 33%A |
A Annualized
B Total returns for periods of less than one year are not annualized.
C Total returns would have been lower if certain expenses had not been reduced during the applicable periods shown.
D Total returns do not include the effect of the sales charges.
E Calculated based on average shares outstanding during the period.
F Amounts do not include the activity of the underlying funds.
G For the period August 30, 2007 (commencement of operations) to July 31, 2008.
H Expense ratios reflect operating expenses of the class. Expenses before reductions do not reflect amounts reimbursed by the investment adviser or reductions from expense offset arrangements and do not represent the amount paid by the class during periods when reimbursements or reductions occur. Expenses net of fee waivers reflect expenses after reimbursement by the investment adviser but prior to reductions from expense offset arrangements. Expenses net of all reductions represent the net expenses paid by the class but do not include expenses of the investment companies in which the Fund invests.
See accompanying notes which are an integral part of the financial statements.
Annual Report
Financial Highlights - Class T
Years ended July 31, | 2011 | 2010 | 2009 | 2008G |
Selected Per-Share Data | | | | |
Net asset value, beginning of period | $ 45.16 | $ 41.16 | $ 46.80 | $ 50.00 |
Income from Investment Operations | | | | |
Net investment income (loss)E | .682 | .678 | .905 | .847 |
Net realized and unrealized gain (loss) | 4.975 | 4.107 | (5.340) | (3.079) |
Total from investment operations | 5.657 | 4.785 | (4.435) | (2.232) |
Distributions from net investment income | (.668) | (.675) | (.875) | (.808) |
Distributions from net realized gain | (.209) | (.110) | (.330) | (.160) |
Total distributions | (.877) | (.785) | (1.205) | (.968) |
Net asset value, end of period | $ 49.94 | $ 45.16 | $ 41.16 | $ 46.80 |
Total ReturnB,C,D | 12.57% | 11.66% | (9.15)% | (4.57)% |
Ratios to Average Net AssetsF,H | | | | |
Expenses before reductions | .50% | .50% | .50% | .50%A |
Expenses net of fee waivers, if any | .50% | .50% | .50% | .50%A |
Expenses net of all reductions | .50% | .50% | .50% | .50%A |
Net investment income (loss) | 1.40% | 1.53% | 2.35% | 1.91%A |
Supplemental Data | | | | |
Net assets, end of period (000 omitted) | $ 130 | $ 328 | $ 311 | $ 606 |
Portfolio turnover rate | 17% | 16% | 53% | 33%A |
A Annualized
B Total returns for periods of less than one year are not annualized.
C Total returns would have been lower if certain expenses had not been reduced during the applicable periods shown.
D Total returns do not include the effect of the sales charges.
E Calculated based on average shares outstanding during the period.
F Amounts do not include the activity of the underlying funds.
G For the period August 30, 2007 (commencement of operations) to July 31, 2008.
H Expense ratios reflect operating expenses of the class. Expenses before reductions do not reflect amounts reimbursed by the investment adviser or reductions from expense offset arrangements and do not represent the amount paid by the class during periods when reimbursements or reductions occur. Expenses net of fee waivers reflect expenses after reimbursement by the investment adviser but prior to reductions from expense offset arrangements. Expenses net of all reductions represent the net expenses paid by the class but do not include expenses of the investment companies in which the Fund invests.
Financial Highlights - Class C
Years ended July 31, | 2011 | 2010 | 2009 | 2008G |
Selected Per-Share Data | | | | |
Net asset value, beginning of period | $ 45.19 | $ 41.16 | $ 46.79 | $ 50.00 |
Income from Investment Operations | | | | |
Net investment income (loss)E | .438 | .454 | .711 | .639 |
Net realized and unrealized gain (loss) | 4.974 | 4.117 | (5.333) | (3.104) |
Total from investment operations | 5.412 | 4.571 | (4.622) | (2.465) |
Distributions from net investment income | (.453) | (.431) | (.678) | (.585) |
Distributions from net realized gain | (.209) | (.110) | (.330) | (.160) |
Total distributions | (.662) | (.541) | (1.008) | (.745) |
Net asset value, end of period | $ 49.94 | $ 45.19 | $ 41.16 | $ 46.79 |
Total ReturnB,C,D | 12.01% | 11.13% | (9.60)% | (5.02)% |
Ratios to Average Net AssetsF,H | | | | |
Expenses before reductions | 1.00% | 1.00% | 1.00% | 1.00%A |
Expenses net of fee waivers, if any | 1.00% | 1.00% | 1.00% | 1.00%A |
Expenses net of all reductions | 1.00% | 1.00% | 1.00% | 1.00%A |
Net investment income (loss) | .90% | 1.02% | 1.84% | 1.41%A |
Supplemental Data | | | | |
Net assets, end of period (000 omitted) | $ 49 | $ 51 | $ 86 | $ 150 |
Portfolio turnover rate | 17% | 16% | 53% | 33%A |
A Annualized
B Total returns for periods of less than one year are not annualized.
C Total returns would have been lower if certain expenses had not been reduced during the applicable periods shown.
D Total returns do not include the effect of the contingent deferred sales charge.
E Calculated based on average shares outstanding during the period.
F Amounts do not include the activity of the underlying funds.
G For the period August 30, 2007 (commencement of operations) to July 31, 2008.
H Expense ratios reflect operating expenses of the class. Expenses before reductions do not reflect amounts reimbursed by the investment adviser or reductions from expense offset arrangements and do not represent the amount paid by the class during periods when reimbursements or reductions occur. Expenses net of fee waivers reflect expenses after reimbursement by the investment adviser but prior to reductions from expense offset arrangements. Expenses net of all reductions represent the net expenses paid by the class but do not include expenses of the investment companies in which the Fund invests.
See accompanying notes which are an integral part of the financial statements.
Annual Report
Financial Highlights - Income Replacement 2028
Years ended July 31, | 2011 | 2010 | 2009 | 2008G |
Selected Per-Share Data | | | | |
Net asset value, beginning of period | $ 45.18 | $ 41.17 | $ 46.82 | $ 50.00 |
Income from Investment Operations | | | | |
Net investment income (loss)D | .925 | .900 | 1.087 | 1.067 |
Net realized and unrealized gain (loss) | 4.965 | 4.115 | (5.330) | (3.072) |
Total from investment operations | 5.890 | 5.015 | (4.243) | (2.005) |
Distributions from net investment income | (.941) | (.895) | (1.077) | (1.015) |
Distributions from net realized gain | (.209) | (.110) | (.330) | (.160) |
Total distributions | (1.150) | (1.005) | (1.407) | (1.175) |
Net asset value, end of period | $ 49.92 | $ 45.18 | $ 41.17 | $ 46.82 |
Total ReturnB,C | 13.12% | 12.24% | (8.69)% | (4.14)% |
Ratios to Average Net AssetsE,H | | | | |
Expenses before reductionsF | .00% | .00% | .00% | .00%A |
Expenses net of fee waivers, if any | .00% | .00% | .00% | .00%A |
Expenses net of all reductions | .00% | .00% | .00% | .00%A |
Net investment income (loss) | 1.90% | 2.03% | 2.85% | 2.40%A |
Supplemental Data | | | | |
Net assets, end of period (000 omitted) | $ 5,783 | $ 5,383 | $ 5,641 | $ 6,068 |
Portfolio turnover rate | 17% | 16% | 53% | 33%A |
A Annualized
B Total returns for periods of less than one year are not annualized.
C Total returns would have been lower if certain expenses had not been reduced during the applicable periods shown.
D Calculated based on average shares outstanding during the period.
E Amounts do not include the activity of the underlying funds.
F Amount represents less than .01%.
G For the period August 30, 2007 (commencement of operations) to July 31, 2008.
H Expense ratios reflect operating expenses of the class. Expenses before reductions do not reflect amounts reimbursed by the investment adviser or reductions from expense offset arrangements and do not represent the amount paid by the class during periods when reimbursements or reductions occur. Expenses net of fee waivers reflect expenses after reimbursement by the investment adviser but prior to reductions from expense offset arrangements. Expenses net of all reductions represent the net expenses paid by the class but do not include expenses of the investment companies in which the Fund invests.
Financial Highlights - Institutional Class
Years ended July 31, | 2011 | 2010 | 2009 | 2008G |
Selected Per-Share Data | | | | |
Net asset value, beginning of period | $ 45.18 | $ 41.17 | $ 46.82 | $ 50.00 |
Income from Investment Operations | | | | |
Net investment income (loss)D | .923 | .899 | 1.097 | 1.101 |
Net realized and unrealized gain (loss) | 4.967 | 4.116 | (5.340) | (3.106) |
Total from investment operations | 5.890 | 5.015 | (4.243) | (2.005) |
Distributions from net investment income | (.941) | (.895) | (1.077) | (1.015) |
Distributions from net realized gain | (.209) | (.110) | (.330) | (.160) |
Total distributions | (1.150) | (1.005) | (1.407) | (1.175) |
Net asset value, end of period | $ 49.92 | $ 45.18 | $ 41.17 | $ 46.82 |
Total ReturnB,C | 13.12% | 12.24% | (8.69)% | (4.14)% |
Ratios to Average Net AssetsE,H | | | | |
Expenses before reductions F | .00% | .00% | .00% | .00%A |
Expenses net of fee waivers, if any | .00% | .00% | .00% | .00%A |
Expenses net of all reductions | .00% | .00% | .00% | .00%A |
Net investment income (loss) | 1.90% | 2.03% | 2.85% | 2.40%A |
Supplemental Data | | | | |
Net assets, end of period (000 omitted) | $ 27 | $ 36 | $ 56 | $ 96 |
Portfolio turnover rate | 17% | 16% | 53% | 33%A |
A Annualized
B Total returns for periods of less than one year are not annualized.
C Total returns would have been lower if certain expenses had not been reduced during the applicable periods shown.
D Calculated based on average shares outstanding during the period.
E Amounts do not include the activity of the underlying funds.
F Amount represents less than .01%.
G For the period August 30, 2007 (commencement of operations) to July 31, 2008.
H Expense ratios reflect operating expenses of the class. Expenses before reductions do not reflect amounts reimbursed by the investment adviser or reductions from expense offset arrangements and do not represent the amount paid by the class during periods when reimbursements or reductions occur. Expenses net of fee waivers reflect expenses after reimbursement by the investment adviser but prior to reductions from expense offset arrangements. Expenses net of all reductions represent the net expenses paid by the class but do not include expenses of the investment companies in which the Fund invests.
See accompanying notes which are an integral part of the financial statements.
Annual Report
Fidelity Income Replacement 2030 Fund
Investment Changes (Unaudited)
Fund Holdings as of July 31, 2011 |
| % of fund's
net assets | % of fund's net assets
6 months ago |
Domestic Equity Funds | | |
Fidelity Advisor Mid Cap II Fund Institutional Class | 5.3 | 5.4 |
Fidelity Disciplined Equity Fund | 5.6 | 5.7 |
Fidelity Equity-Income Fund | 5.5 | 5.7 |
Fidelity Large Cap Core Enhanced Index Fund | 9.0 | 9.0 |
Fidelity Series 100 Index Fund | 6.8 | 6.8 |
Fidelity Series Broad Market Opportunities Fund | 8.9 | 9.0 |
Fidelity Series Small Cap Opportunities Fund | 3.5 | 3.6 |
| 44.6 | 45.2 |
International Equity Funds | | |
Fidelity Advisor International Discovery Fund Institutional Class | 7.8 | 8.0 |
High Yield Fixed-Income Funds | | |
Fidelity Capital & Income Fund | 2.5 | 2.5 |
Fidelity Strategic Income Fund | 2.5 | 2.5 |
| 5.0 | 5.0 |
Investment Grade Fixed-Income Funds | | |
Fidelity Government Income Fund | 5.8 | 5.7 |
Fidelity Strategic Real Return Fund | 5.8 | 5.7 |
Fidelity Total Bond Fund | 17.4 | 17.1 |
| 29.0 | 28.5 |
Short-Term Funds | | |
Fidelity Institutional Money Market Portfolio Institutional Class | 6.8 | 6.6 |
Fidelity Short-Term Bond Fund | 6.8 | 6.7 |
| 13.6 | 13.3 |
Net Other Assets (Liabilities)* | 0.0 | 0.0 |
| 100.0 | 100.0 |
* Amount represents less than 0.1% |
Asset Allocation (% of fund's net assets) |
Current |
| Domestic Equity Funds | 44.6% | |
| International Equity Funds | 7.8% | |
| High Yield
Fixed-Income Funds | 5.0% | |
| Investment Grade Fixed-Income Funds | 29.0% | |
| Short-Term Funds | 13.6% | |

Six months ago |
| Domestic Equity Funds | 45.2% | |
| International Equity Funds | 8.0% | |
| High Yield
Fixed-Income Funds | 5.0% | |
| Investment Grade Fixed-Income Funds | 28.5% | |
| Short-Term Funds | 13.3% | |

Expected |
| Domestic Equity Funds | 44.8% | |
| International Equity Funds | 7.6% | |
| High Yield
Fixed-Income Funds | 4.8% | |
| Investment Grade Fixed-Income Funds | 29.3% | |
| Short-Term Funds | 13.5% | |

The fund invests according to an asset allocation strategy that becomes increasingly conservative over time. The six months ago allocation is based on the fund's holdings as of January 31, 2011. The current allocation is based on the fund's holdings as of July 31, 2011. The expected allocation represents the fund's anticipated allocation at January 31, 2012. |
Annual Report
Fidelity Income Replacement 2030 Fund
Investments July 31, 2011
Showing Percentage of Net Assets
Equity Funds - 52.4% |
| Shares | | Value |
Domestic Equity Funds - 44.6% |
Fidelity Advisor Mid Cap II Fund Institutional Class (a) | 12,799 | | $ 232,051 |
Fidelity Disciplined Equity Fund | 10,362 | | 241,225 |
Fidelity Equity-Income Fund | 5,369 | | 238,151 |
Fidelity Large Cap Core Enhanced Index Fund | 43,733 | | 392,287 |
Fidelity Series 100 Index Fund | 32,593 | | 294,970 |
Fidelity Series Broad Market Opportunities Fund | 37,578 | | 387,050 |
Fidelity Series Small Cap Opportunities Fund | 13,677 | | 153,458 |
TOTAL DOMESTIC EQUITY FUNDS | | 1,939,192 |
International Equity Funds - 7.8% |
Fidelity Advisor International Discovery Fund Institutional Class | 10,085 | | 339,163 |
TOTAL EQUITY FUNDS (Cost $2,131,023) | 2,278,355 |
Fixed-Income Funds - 34.0% |
| | | |
High Yield Fixed-Income Funds - 5.0% |
Fidelity Capital & Income Fund | 11,191 | | 107,099 |
Fidelity Strategic Income Fund | 9,671 | | 110,054 |
TOTAL HIGH YIELD FIXED-INCOME FUNDS | | 217,153 |
|
| Shares | | Value |
Investment Grade Fixed-Income Funds - 29.0% |
Fidelity Government Income Fund | 23,635 | | $ 252,421 |
Fidelity Strategic Real Return Fund | 25,326 | | 251,737 |
Fidelity Total Bond Fund | 68,744 | | 756,876 |
TOTAL INVESTMENT GRADE FIXED-INCOME FUNDS | | 1,261,034 |
TOTAL FIXED-INCOME FUNDS (Cost $1,435,010) | 1,478,187 |
Short-Term Funds - 13.6% |
| | | |
Fidelity Institutional Money Market Portfolio Institutional Class | 293,874 | | 293,874 |
Fidelity Short-Term Bond Fund | 34,617 | | 295,628 |
TOTAL SHORT-TERM FUNDS (Cost $586,052) | 589,502 |
TOTAL INVESTMENT PORTFOLIO - 100.0% (Cost $4,152,085) | | 4,346,044 |
NET OTHER ASSETS (LIABILITIES) - 0.0% | | (251) |
NET ASSETS - 100% | $ 4,345,793 |
Legend |
(a) Non-income producing |
Other Information |
All investments are categorized as Level 1 under the Fair Value Hierarchy. The inputs or methodology used for valuing securities may not be an indication of the risk associated with investing in those securities. For more information on valuation inputs, please refer to the Security Valuation section in the accompanying Notes to Financial Statements. |
Income Tax Information |
At July 31, 2011, the Fund had a capital loss carryforward of approximately $119,726 of which $33,830 and $85,896 will expire in fiscal 2017 and 2018, respectively. Capital loss carryforwards are only available to offset future capital gains of the Fund to the extent provided by regulations and may be limited. |
See accompanying notes which are an integral part of the financial statements.
Annual Report
Fidelity Income Replacement 2030 Fund
Statement of Assets and Liabilities
| July 31, 2011 |
| | |
Assets | | |
Investment in securities, at value (cost $4,152,085) - See accompanying schedule | | $ 4,346,044 |
| | |
Liabilities | | |
Distribution and service plan fees payable | | 251 |
| | |
Net Assets | | $ 4,345,793 |
Net Assets consist of: | | |
Paid in capital | | $ 4,322,386 |
Undistributed net investment income | | 793 |
Accumulated undistributed net realized gain (loss) on investments | | (171,345) |
Net unrealized appreciation (depreciation) on investments | | 193,959 |
Net Assets | | $ 4,345,793 |
| | |
Calculation of Maximum Offering Price Class A:
Net Asset Value and redemption price per share ($71,557 ÷ 1,441.26 shares) | | $ 49.65 |
| | |
Maximum offering price per share (100/94.25 of $49.65) | | $ 52.68 |
| | |
Class T:
Net Asset Value and redemption price per share ($14,774 ÷ 297.44 shares) | | $ 49.67 |
| | |
Maximum offering price per share (100/96.50 of $49.67) | | $ 51.47 |
| | |
Class C:
Net Asset Value and offering price per share ($270,005 ÷ 5,442.71 shares)A | | $ 49.61 |
| | |
Income Replacement 2030:
Net Asset Value, offering price and redemption price per share ($3,962,058 ÷ 79,813.06 shares) | | $ 49.64 |
| | |
Institutional Class:
Net Asset Value, offering price and redemption price per share ($27,399 ÷ 551.93 shares) | | $ 49.64 |
A Redemption price per share is equal to net asset value less any applicable contingent deferred sales charge.
Statement of Operations
| Year ended July 31, 2011 |
| | |
Investment Income | | |
Income distributions from underlying funds | | $ 57,450 |
| | |
Expenses | | |
Distribution and service plan fees | $ 2,450 | |
Independent trustees' compensation | 10 | |
Total expenses before reductions | 2,460 | |
Expense reductions | (10) | 2,450 |
Net investment income (loss) | | 55,000 |
Realized and Unrealized Gain (Loss) Realized gain (loss) on sale of underlying fund shares | (23,045) | |
Capital gain distributions from underlying funds | 15,030 | |
Total net realized gain (loss) | | (8,015) |
Change in net unrealized appreciation (depreciation) on underlying funds | | 250,028 |
Net gain (loss) | | 242,013 |
Net increase (decrease) in net assets resulting from operations | | $ 297,013 |
See accompanying notes which are an integral part of the financial statements.
Annual Report
Statement of Changes in Net Assets
| Year ended
July 31, 2011 | Year ended
July 31, 2010 |
Increase (Decrease) in Net Assets | | |
Operations | | |
Net investment income (loss) | $ 55,000 | $ 14,472 |
Net realized gain (loss) | (8,015) | 212 |
Change in net unrealized appreciation (depreciation) | 250,028 | 65,683 |
Net increase (decrease) in net assets resulting from operations | 297,013 | 80,367 |
Distributions to shareholders from net investment income | (54,641) | (14,213) |
Distributions to shareholders from net realized gain | (10,723) | (1,857) |
Total distributions | (65,364) | (16,070) |
Share transactions - net increase (decrease) | 2,153,245 | 1,233,775 |
Total increase (decrease) in net assets | 2,384,894 | 1,298,072 |
| | |
Net Assets | | |
Beginning of period | 1,960,899 | 662,827 |
End of period (including undistributed net investment income of $793 and undistributed net investment income of $439, respectively) | $ 4,345,793 | $ 1,960,899 |
Financial Highlights - Class A
Years ended July 31, | 2011 | 2010 | 2009 | 2008G |
Selected Per-Share Data | | | | |
Net asset value, beginning of period | $ 44.77 | $ 40.69 | $ 46.61 | $ 50.00 |
Income from Investment Operations | | | | |
Net investment income (loss)E | .791 | .718 | .978 | 1.034 |
Net realized and unrealized gain (loss) | 5.066 | 4.180 | (5.404) | (3.239) |
Total from investment operations | 5.857 | 4.898 | (4.426) | (2.205) |
Distributions from net investment income | (.801) | (.713) | (1.004) | (.995) |
Distributions from net realized gain | (.176) | (.105) | (.490) | (.190) |
Total distributions | (.977) | (.818) | (1.494) | (1.185) |
Net asset value, end of period | $ 49.65 | $ 44.77 | $ 40.69 | $ 46.61 |
Total ReturnB,C,D | 13.15% | 12.08% | (9.22)% | (4.55)% |
Ratios to Average Net AssetsF,H | | | | |
Expenses before reductions | .25% | .25% | .25% | .25%A |
Expenses net of fee waivers, if any | .25% | .25% | .25% | .25%A |
Expenses net of all reductions | .25% | .25% | .25% | .25%A |
Net investment income (loss) | 1.63% | 1.63% | 2.57% | 2.26%A |
Supplemental Data | | | | |
Net assets, end of period (000 omitted) | $ 72 | $ 66 | $ 55 | $ 95 |
Portfolio turnover rate | 24% | 31% | 53% | 12%A |
A Annualized
B Total returns for periods of less than one year are not annualized.
C Total returns would have been lower if certain expenses had not been reduced during the applicable periods shown.
D Total returns do not include the effect of the sales charges.
E Calculated based on average shares outstanding during the period.
F Amounts do not include the activity of the underlying funds.
G For the period August 30, 2007 (commencement of operations) to July 31, 2008.
H Expense ratios reflect operating expenses of the class. Expenses before reductions do not reflect amounts reimbursed by the investment adviser or reductions from expense offset arrangements and do not represent the amount paid by the class during periods when reimbursements or reductions occur. Expenses net of fee waivers reflect expenses after reimbursement by the investment adviser but prior to reductions from expense offset arrangements. Expenses net of all reductions represent the net expenses paid by the class but do not include expenses of the investment companies in which the Fund invests.
See accompanying notes which are an integral part of the financial statements.
Annual Report
Financial Highlights - Class T
Years ended July 31, | 2011 | 2010 | 2009 | 2008G |
Selected Per-Share Data | | | | |
Net asset value, beginning of period | $ 44.78 | $ 40.69 | $ 46.61 | $ 50.00 |
Income from Investment Operations | | | | |
Net investment income (loss)E | .655 | .603 | .881 | .920 |
Net realized and unrealized gain (loss) | 5.076 | 4.182 | (5.402) | (3.234) |
Total from investment operations | 5.731 | 4.785 | (4.521) | (2.314) |
Distributions from net investment income | (.665) | (.590) | (.909) | (.886) |
Distributions from net realized gain | (.176) | (.105) | (.490) | (.190) |
Total distributions | (.841) | (.695) | (1.399) | (1.076) |
Net asset value, end of period | $ 49.67 | $ 44.78 | $ 40.69 | $ 46.61 |
Total ReturnB,C,D | 12.85% | 11.79% | (9.45)% | (4.76)% |
Ratios to Average Net AssetsF,H | | | | |
Expenses before reductions | .50% | .50% | .50% | .50%A |
Expenses net of fee waivers, if any | .50% | .50% | .50% | .50%A |
Expenses net of all reductions | .50% | .50% | .50% | .50%A |
Net investment income (loss) | 1.38% | 1.37% | 2.32% | 2.01%A |
Supplemental Data | | | | |
Net assets, end of period (000 omitted) | $ 15 | $ 45 | $ 71 | $ 95 |
Portfolio turnover rate | 24% | 31% | 53% | 12%A |
A Annualized
B Total returns for periods of less than one year are not annualized.
C Total returns would have been lower if certain expenses had not been reduced during the applicable periods shown.
D Total returns do not include the effect of the sales charges.
E Calculated based on average shares outstanding during the period.
F Amounts do not include the activity of the underlying funds.
G For the period August 30, 2007 (commencement of operations) to July 31, 2008.
H Expense ratios reflect operating expenses of the class. Expenses before reductions do not reflect amounts reimbursed by the investment adviser or reductions from expense offset arrangements and do not represent the amount paid by the class during periods when reimbursements or reductions occur. Expenses net of fee waivers reflect expenses after reimbursement by the investment adviser but prior to reductions from expense offset arrangements. Expenses net of all reductions represent the net expenses paid by the class but do not include expenses of the investment companies in which the Fund invests.
Financial Highlights - Class C
Years ended July 31, | 2011 | 2010 | 2009 | 2008G |
Selected Per-Share Data | | | | |
Net asset value, beginning of period | $ 44.75 | $ 40.67 | $ 46.58 | $ 50.00 |
Income from Investment Operations | | | | |
Net investment income (loss)E | .428 | .385 | .693 | .682 |
Net realized and unrealized gain (loss) | 5.060 | 4.185 | (5.400) | (3.227) |
Total from investment operations | 5.488 | 4.570 | (4.707) | (2.545) |
Distributions from net investment income | (.452) | (.385) | (.713) | (.685) |
Distributions from net realized gain | (.176) | (.105) | (.490) | (.190) |
Total distributions | (.628) | (.490) | (1.203) | (.875) |
Net asset value, end of period | $ 49.61 | $ 44.75 | $ 40.67 | $ 46.58 |
Total ReturnB,C,D | 12.30% | 11.26% | (9.91)% | (5.21)% |
Ratios to Average Net AssetsF,H | | | | |
Expenses before reductions | 1.00% | 1.00% | 1.00% | 1.00%A |
Expenses net of fee waivers, if any | 1.00% | 1.00% | 1.00% | 1.00%A |
Expenses net of all reductions | 1.00% | 1.00% | 1.00% | 1.00%A |
Net investment income (loss) | .88% | .88% | 1.82% | 1.51%A |
Supplemental Data | | | | |
Net assets, end of period (000 omitted) | $ 270 | $ 186 | $ 178 | $ 297 |
Portfolio turnover rate | 24% | 31% | 53% | 12%A |
A Annualized
B Total returns for periods of less than one year are not annualized.
C Total returns would have been lower if certain expenses had not been reduced during the applicable periods shown.
D Total returns do not include the effect of the contingent deferred sales charge.
E Calculated based on average shares outstanding during the period.
F Amounts do not include the activity of the underlying funds.
G For the period August 30, 2007 (commencement of operations) to July 31, 2008.
H Expense ratios reflect operating expenses of the class. Expenses before reductions do not reflect amounts reimbursed by the investment adviser or reductions from expense offset arrangements and do not represent the amount paid by the class during periods when reimbursements or reductions occur. Expenses net of fee waivers reflect expenses after reimbursement by the investment adviser but prior to reductions from expense offset arrangements. Expenses net of all reductions represent the net expenses paid by the class but do not include expenses of the investment companies in which the Fund invests.
See accompanying notes which are an integral part of the financial statements.
Annual Report
Financial Highlights - Income Replacement 2030
Years ended July 31, | 2011 | 2010 | 2009 | 2008G |
Selected Per-Share Data | | | | |
Net asset value, beginning of period | $ 44.76 | $ 40.69 | $ 46.61 | $ 50.00 |
Income from Investment Operations | | | | |
Net investment income (loss)D | .917 | .821 | 1.101 | 1.117 |
Net realized and unrealized gain (loss) | 5.062 | 4.178 | (5.429) | (3.209) |
Total from investment operations | 5.979 | 4.999 | (4.328) | (2.092) |
Distributions from net investment income | (.923) | (.824) | (1.102) | (1.108) |
Distributions from net realized gain | (.176) | (.105) | (.490) | (.190) |
Total distributions | (1.099) | (.929) | (1.592) | (1.298) |
Net asset value, end of period | $ 49.64 | $ 44.76 | $ 40.69 | $ 46.61 |
Total ReturnB,C | 13.43% | 12.34% | (8.99)% | (4.33)% |
Ratios to Average Net AssetsE,H | | | | |
Expenses before reductionsF | .00% | .00% | .00% | .00%A |
Expenses net of fee waivers, if any | .00% | .00% | .00% | .00%A |
Expenses net of all reductions | .00% | .00% | .00% | .00%A |
Net investment income (loss) | 1.88% | 1.88% | 2.82% | 2.51%A |
Supplemental Data | | | | |
Net assets, end of period (000 omitted) | $ 3,962 | $ 1,628 | $ 303 | $ 653 |
Portfolio turnover rate | 24% | 31% | 53% | 12%A |
A Annualized
B Total returns for periods of less than one year are not annualized.
C Total returns would have been lower if certain expenses had not been reduced during the applicable periods shown.
D Calculated based on average shares outstanding during the period.
E Amounts do not include the activity of the underlying funds.
F Amount represents less than .01%.
G For the period August 30, 2007 (commencement of operations) to July 31, 2008.
H Expense ratios reflect operating expenses of the class. Expenses before reductions do not reflect amounts reimbursed by the investment adviser or reductions from expense offset arrangements and do not represent the amount paid by the class during periods when reimbursements or reductions occur. Expenses net of fee waivers reflect expenses after reimbursement by the investment adviser but prior to reductions from expense offset arrangements. Expenses net of all reductions represent the net expenses paid by the class but do not include expenses of the investment companies in which the Fund invests.
Financial Highlights - Institutional Class
Years ended July 31, | 2011 | 2010 | 2009 | 2008G |
Selected Per-Share Data | | | | |
Net asset value, beginning of period | $ 44.77 | $ 40.69 | $ 46.61 | $ 50.00 |
Income from Investment Operations | | | | |
Net investment income (loss)D | .911 | .825 | 1.074 | 1.149 |
Net realized and unrealized gain (loss) | 5.058 | 4.184 | (5.402) | (3.241) |
Total from investment operations | 5.969 | 5.009 | (4.328) | (2.092) |
Distributions from net investment income | (.923) | (.824) | (1.102) | (1.108) |
Distributions from net realized gain | (.176) | (.105) | (.490) | (.190) |
Total distributions | (1.099) | (.929) | (1.592) | (1.298) |
Net asset value, end of period | $ 49.64 | $ 44.77 | $ 40.69 | $ 46.61 |
Total ReturnB,C | 13.41% | 12.36% | (8.99)% | (4.33)% |
Ratios to Average Net AssetsE,H | | | | |
Expenses before reductionsF | .00% | .00% | .00% | .00%A |
Expenses net of fee waivers, if any | .00% | .00% | .00% | .00%A |
Expenses net of all reductions | .00% | .00% | .00% | .00%A |
Net investment income (loss) | 1.88% | 1.88% | 2.82% | 2.51%A |
Supplemental Data | | | | |
Net assets, end of period (000 omitted) | $ 27 | $ 36 | $ 55 | $ 96 |
Portfolio turnover rate | 24% | 31% | 53% | 12%A |
A Annualized
B Total returns for periods of less than one year are not annualized.
C Total returns would have been lower if certain expenses had not been reduced during the applicable periods shown.
D Calculated based on average shares outstanding during the period.
E Amounts do not include the activity of the underlying funds.
F Amount represents less than .01%.
G For the period August 30, 2007 (commencement of operations) to July 31, 2008.
H Expense ratios reflect operating expenses of the class. Expenses before reductions do not reflect amounts reimbursed by the investment adviser or reductions from expense offset arrangements and do not represent the amount paid by the class during periods when reimbursements or reductions occur. Expenses net of fee waivers reflect expenses after reimbursement by the investment adviser but prior to reductions from expense offset arrangements. Expenses net of all reductions represent the net expenses paid by the class but do not include expenses of the investment companies in which the Fund invests.
See accompanying notes which are an integral part of the financial statements.
Annual Report
Fidelity Income Replacement 2032 Fund
Investment Changes (Unaudited)
Fund Holdings as of July 31, 2011 |
| % of fund's
net assets | % of fund's net assets
6 months ago |
Domestic Equity Funds | | |
Fidelity Advisor Mid Cap II Fund Institutional Class | 5.4 | 5.5 |
Fidelity Disciplined Equity Fund | 5.6 | 5.8 |
Fidelity Equity-Income Fund | 5.6 | 5.7 |
Fidelity Large Cap Core Enhanced Index Fund | 9.2 | 9.2 |
Fidelity Series 100 Index Fund | 6.9 | 6.9 |
Fidelity Series Broad Market Opportunities Fund | 9.0 | 9.2 |
Fidelity Series Small Cap Opportunities Fund | 3.6 | 3.7 |
| 45.3 | 46.0 |
International Equity Funds | | |
Fidelity Advisor International Discovery Fund Institutional Class | 8.4 | 8.8 |
High Yield Fixed-Income Funds | | |
Fidelity Capital & Income Fund | 2.6 | 2.6 |
Fidelity Strategic Income Fund | 2.7 | 2.6 |
| 5.3 | 5.2 |
Investment Grade Fixed-Income Funds | | |
Fidelity Government Income Fund | 5.7 | 5.6 |
Fidelity Strategic Real Return Fund | 5.6 | 5.6 |
Fidelity Total Bond Fund | 17.0 | 16.7 |
| 28.3 | 27.9 |
Short-Term Funds | | |
Fidelity Institutional Money Market Portfolio Institutional Class | 6.3 | 6.1 |
Fidelity Short-Term Bond Fund | 6.4 | 6.0 |
| 12.7 | 12.1 |
Net Other Assets (Liabilities)* | 0.0 | 0.0 |
| 100.0 | 100.0 |
* Amount represents less than 0.1% |
Asset Allocation (% of fund's net assets) |
Current |
| Domestic Equity Funds | 45.3% | |
| International Equity Funds | 8.4% | |
| High Yield
Fixed-Income Funds | 5.3% | |
| Investment Grade Fixed-Income Funds | 28.3% | |
| Short-Term Funds | 12.7% | |

Six months ago |
| Domestic Equity Funds | 46.0% | |
| International Equity Funds | 8.8% | |
| High Yield
Fixed-Income Funds | 5.2% | |
| Investment Grade Fixed-Income Funds | 27.9% | |
| Short-Term Funds | 12.1% | |

Expected |
| Domestic Equity Funds | 45.6% | |
| International Equity Funds | 8.3% | |
| High Yield
Fixed-Income Funds | 5.1% | |
| Investment Grade Fixed-Income Funds | 28.2% | |
| Short-Term Funds | 12.8% | |

The fund invests according to an asset allocation strategy that becomes increasingly conservative over time. The six months ago allocation is based on the fund's holdings as of January 31, 2011. The current allocation is based on the fund's holdings as of July 31, 2011. The expected allocation represents the fund's anticipated allocation at January 31, 2012. |
Annual Report
Fidelity Income Replacement 2032 Fund
Investments July 31, 2011
Showing Percentage of Net Assets
Equity Funds - 53.7% |
| Shares | | Value |
Domestic Equity Funds - 45.3% |
Fidelity Advisor Mid Cap II Fund Institutional Class (a) | 4,677 | | $ 84,790 |
Fidelity Disciplined Equity Fund | 3,823 | | 89,010 |
Fidelity Equity-Income Fund | 1,975 | | 87,630 |
Fidelity Large Cap Core Enhanced Index Fund | 16,216 | | 145,455 |
Fidelity Series 100 Index Fund | 12,043 | | 108,985 |
Fidelity Series Broad Market Opportunities Fund | 13,822 | | 142,370 |
Fidelity Series Small Cap Opportunities Fund | 5,068 | | 56,868 |
TOTAL DOMESTIC EQUITY FUNDS | | 715,108 |
International Equity Funds - 8.4% |
Fidelity Advisor International Discovery Fund Institutional Class | 3,962 | | 133,251 |
TOTAL EQUITY FUNDS (Cost $710,799) | 848,359 |
Fixed-Income Funds - 33.6% |
| | | |
High Yield Fixed-Income Funds - 5.3% |
Fidelity Capital & Income Fund | 4,260 | | 40,772 |
Fidelity Strategic Income Fund | 3,738 | | 42,535 |
TOTAL HIGH YIELD FIXED-INCOME FUNDS | | 83,307 |
|
| Shares | | Value |
Investment Grade Fixed-Income Funds - 28.3% |
Fidelity Government Income Fund | 8,409 | | $ 89,804 |
Fidelity Strategic Real Return Fund | 8,905 | | 88,517 |
Fidelity Total Bond Fund | 24,415 | | 268,810 |
TOTAL INVESTMENT GRADE FIXED-INCOME FUNDS | | 447,131 |
TOTAL FIXED-INCOME FUNDS (Cost $512,270) | 530,438 |
Short-Term Funds - 12.7% |
| | | |
Fidelity Institutional Money Market Portfolio Institutional Class | 99,673 | | 99,673 |
Fidelity Short-Term Bond Fund | 11,771 | | 100,522 |
TOTAL SHORT-TERM FUNDS (Cost $199,272) | 200,195 |
TOTAL INVESTMENT PORTFOLIO - 100.0% (Cost $1,422,341) | | 1,578,992 |
NET OTHER ASSETS (LIABILITIES) - 0.0% | | (76) |
NET ASSETS - 100% | $ 1,578,916 |
Legend |
(a) Non-income producing |
Other Information |
All investments are categorized as Level 1 under the Fair Value Hierarchy. The inputs or methodology used for valuing securities may not be an indication of the risk associated with investing in those securities. For more information on valuation inputs, please refer to the Security Valuation section in the accompanying Notes to Financial Statements. |
Income Tax Information |
At July 31, 2011, the Fund had a capital loss carryforward of approximately $160,350 all of which will expire in fiscal 2018. Capital loss carryforwards are only available to offset future capital gains of the Fund to the extent provided by regulations and may be limited. |
See accompanying notes which are an integral part of the financial statements.
Annual Report
Fidelity Income Replacement 2032 Fund
Statement of Assets and Liabilities
| July 31, 2011 |
| | |
Assets | | |
Investment in securities, at value (cost $1,422,341) - See accompanying schedule | | $ 1,578,992 |
| | |
Liabilities | | |
Distribution and service plan fees payable | | 76 |
| | |
Net Assets | | $ 1,578,916 |
Net Assets consist of: | | |
Paid in capital | | $ 1,583,929 |
Undistributed net investment income | | 290 |
Accumulated undistributed net realized gain (loss) on investments | | (161,954) |
Net unrealized appreciation (depreciation) on investments | | 156,651 |
Net Assets | | $ 1,578,916 |
| | |
Calculation of Maximum Offering Price Class A:
Net Asset Value and redemption price per share ($213,829 ÷ 4,357.23 shares) | | $ 49.07 |
| | |
Maximum offering price per share (100/94.25 of $49.07) | | $ 52.06 |
| | |
Class T:
Net Asset Value and redemption price per share ($26,761 ÷ 545.05 shares) | | $ 49.10 |
| | |
Maximum offering price per share (100/96.50 of $49.10) | | $ 50.88 |
| | |
Class C:
Net Asset Value and offering price per share ($22,168 ÷ 451.28 shares)A | | $ 49.12 |
| | |
Income Replacement 2032:
Net Asset Value, offering price and redemption price per share ($1,297,438 ÷ 26,433.69 shares) | | $ 49.08 |
| | |
Institutional Class:
Net Asset Value, offering price and redemption price per share ($18,720 ÷ 381.40 shares) | | $ 49.08 |
A Redemption price per share is equal to net asset value less any applicable contingent deferred sales charge.
Statement of Operations
| Year ended July 31, 2011 |
| | |
Investment Income | | |
Income distributions from underlying funds | | $ 40,022 |
| | |
Expenses | | |
Distribution and service plan fees | $ 967 | |
Independent trustees' compensation | 7 | |
Total expenses before reductions | 974 | |
Expense reductions | (7) | 967 |
Net investment income (loss) | | 39,055 |
Realized and Unrealized Gain (Loss) Realized gain (loss) on sale of underlying fund shares | 193,243 | |
Capital gain distributions from underlying funds | 11,771 | |
Total net realized gain (loss) | | 205,014 |
Change in net unrealized appreciation (depreciation) on underlying funds | | 10,190 |
Net gain (loss) | | 215,204 |
Net increase (decrease) in net assets resulting from operations | | $ 254,259 |
See accompanying notes which are an integral part of the financial statements.
Annual Report
Statement of Changes in Net Assets
| Year ended
July 31, 2011 | Year ended
July 31, 2010 |
Increase (Decrease) in Net Assets | | |
Operations | | |
Net investment income (loss) | $ 39,055 | $ 18,688 |
Net realized gain (loss) | 205,014 | (147,241) |
Change in net unrealized appreciation (depreciation) | 10,190 | 292,353 |
Net increase (decrease) in net assets resulting from operations | 254,259 | 163,800 |
Distributions to shareholders from net investment income | (39,246) | (18,690) |
Distributions to shareholders from net realized gain | (8,488) | (2,138) |
Total distributions | (47,734) | (20,828) |
Share transactions - net increase (decrease) | (344,791) | (49,316) |
Total increase (decrease) in net assets | (138,266) | 93,656 |
| | |
Net Assets | | |
Beginning of period | 1,717,182 | 1,623,526 |
End of period (including undistributed net investment income of $290 and undistributed net investment income of $493, respectively) | $ 1,578,916 | $ 1,717,182 |
Financial Highlights - Class A
Years ended July 31, | 2011 | 2010 | 2009 | 2008G |
Selected Per-Share Data | | | | |
Net asset value, beginning of period | $ 44.19 | $ 40.21 | $ 46.52 | $ 50.00 |
Income from Investment Operations | | | | |
Net investment income (loss)E | .796 | .727 | .930 | 1.019 |
Net realized and unrealized gain (loss) | 5.086 | 4.154 | (5.570) | (3.322) |
Total from investment operations | 5.882 | 4.881 | (4.640) | (2.303) |
Distributions from net investment income | (.812) | (.796) | (.960) | (.987) |
Distributions from net realized gain | (.190) | (.105) | (.710) | (.190) |
Total distributions | (1.002) | (.901) | (1.670) | (1.177) |
Net asset value, end of period | $ 49.07 | $ 44.19 | $ 40.21 | $ 46.52 |
Total ReturnB,C,D | 13.38% | 12.19% | (9.66)% | (4.75)% |
Ratios to Average Net AssetsF,H | | | | |
Expenses before reductions | .25% | .25% | .25% | .25%A |
Expenses net of fee waivers, if any | .25% | .25% | .25% | .25%A |
Expenses net of all reductions | .25% | .25% | .25% | .25%A |
Net investment income (loss) | 1.66% | 1.67% | 2.43% | 2.27%A |
Supplemental Data | | | | |
Net assets, end of period (000 omitted) | $ 214 | $ 200 | $ 183 | $ 402 |
Portfolio turnover rate | 45% | 95% | 82% | 23%A |
A Annualized
B Total returns for periods of less than one year are not annualized.
C Total returns would have been lower if certain expenses had not been reduced during the applicable periods shown.
D Total returns do not include the effect of the sales charges.
E Calculated based on average shares outstanding during the period.
F Amounts do not include the activity of the underlying funds.
G For the period August 30, 2007 (commencement of operations) to July 31, 2008.
H Expense ratios reflect operating expenses of the class. Expenses before reductions do not reflect amounts reimbursed by the investment adviser or reductions from expense offset arrangements and do not represent the amount paid by the class during periods when reimbursements or reductions occur. Expenses net of fee waivers reflect expenses after reimbursement by the investment adviser but prior to reductions from expense offset arrangements. Expenses net of all reductions represent the net expenses paid by the class but do not include expenses of the investment companies in which the Fund invests.
See accompanying notes which are an integral part of the financial statements.
Annual Report
Financial Highlights - Class T
Years ended July 31, | 2011 | 2010 | 2009 | 2008G |
Selected Per-Share Data | | | | |
Net asset value, beginning of period | $ 44.20 | $ 40.22 | $ 46.52 | $ 50.00 |
Income from Investment Operations | | | | |
Net investment income (loss)E | .676 | .620 | .821 | .918 |
Net realized and unrealized gain (loss) | 5.107 | 4.147 | (5.548) | (3.339) |
Total from investment operations | 5.783 | 4.767 | (4.727) | (2.421) |
Distributions from net investment income | (.693) | (.682) | (.863) | (.869) |
Distributions from net realized gain | (.190) | (.105) | (.710) | (.190) |
Total distributions | (.883) | (.787) | (1.573) | (1.059) |
Net asset value, end of period | $ 49.10 | $ 44.20 | $ 40.22 | $ 46.52 |
Total ReturnB,C,D | 13.14% | 11.90% | (9.88)% | (4.98)% |
Ratios to Average Net AssetsF,H | | | | |
Expenses before reductions | .50% | .50% | .50% | .50%A |
Expenses net of fee waivers, if any | .50% | .50% | .50% | .50%A |
Expenses net of all reductions | .50% | .50% | .50% | .50%A |
Net investment income (loss) | 1.41% | 1.43% | 2.18% | 2.02%A |
Supplemental Data | | | | |
Net assets, end of period (000 omitted) | $ 27 | $ 35 | $ 54 | $ 95 |
Portfolio turnover rate | 45% | 95% | 82% | 23%A |
A Annualized
B Total returns for periods of less than one year are not annualized.
C Total returns would have been lower if certain expenses had not been reduced during the applicable periods shown.
D Total returns do not include the effect of the sales charges.
E Calculated based on average shares outstanding during the period.
F Amounts do not include the activity of the underlying funds.
G For the period August 30, 2007 (commencement of operations) to July 31, 2008.
H Expense ratios reflect operating expenses of the class. Expenses before reductions do not reflect amounts reimbursed by the investment adviser or reductions from expense offset arrangements and do not represent the amount paid by the class during periods when reimbursements or reductions occur. Expenses net of fee waivers reflect expenses after reimbursement by the investment adviser but prior to reductions from expense offset arrangements. Expenses net of all reductions represent the net expenses paid by the class but do not include expenses of the investment companies in which the Fund invests.
Financial Highlights - Class C
Years ended July 31, | 2011 | 2010 | 2009 | 2008G |
Selected Per-Share Data | | | | |
Net asset value, beginning of period | $ 44.22 | $ 40.23 | $ 46.51 | $ 50.00 |
Income from Investment Operations | | | | |
Net investment income (loss)E | .434 | .403 | .624 | .690 |
Net realized and unrealized gain (loss) | 5.102 | 4.143 | (5.532) | (3.342) |
Total from investment operations | 5.536 | 4.546 | (4.908) | (2.652) |
Distributions from net investment income | (.446) | (.451) | (.662) | (.648) |
Distributions from net realized gain | (.190) | (.105) | (.710) | (.190) |
Total distributions | (.636) | (.556) | (1.372) | (.838) |
Net asset value, end of period | $ 49.12 | $ 44.22 | $ 40.23 | $ 46.51 |
Total ReturnB,C,D | 12.55% | 11.33% | (10.32)% | (5.42)% |
Ratios to Average Net AssetsF,H | | | | |
Expenses before reductions | 1.00% | 1.00% | 1.00% | 1.00%A |
Expenses net of fee waivers, if any | 1.00% | 1.00% | 1.00% | 1.00%A |
Expenses net of all reductions | 1.00% | 1.00% | 1.00% | 1.00%A |
Net investment income (loss) | .91% | .93% | 1.68% | 1.52%A |
Supplemental Data | | | | |
Net assets, end of period (000 omitted) | $ 22 | $ 29 | $ 46 | $ 95 |
Portfolio turnover rate | 45% | 95% | 82% | 23%A |
A Annualized
B Total returns for periods of less than one year are not annualized.
C Total returns would have been lower if certain expenses had not been reduced during the applicable periods shown.
D Total returns do not include the effect of the contingent deferred sales charge.
E Calculated based on average shares outstanding during the period.
F Amounts do not include the activity of the underlying funds.
G For the period August 30, 2007 (commencement of operations) to July 31, 2008.
H Expense ratios reflect operating expenses of the class. Expenses before reductions do not reflect amounts reimbursed by the investment adviser or reductions from expense offset arrangements and do not represent the amount paid by the class during periods when reimbursements or reductions occur. Expenses net of fee waivers reflect expenses after reimbursement by the investment adviser but prior to reductions from expense offset arrangements. Expenses net of all reductions represent the net expenses paid by the class but do not include expenses of the investment companies in which the Fund invests.
See accompanying notes which are an integral part of the financial statements.
Annual Report
Financial Highlights - Income Replacement 2032
Years ended July 31, | 2011 | 2010 | 2009 | 2008G |
Selected Per-Share Data | | | | |
Net asset value, beginning of period | $ 44.19 | $ 40.22 | $ 46.53 | $ 50.00 |
Income from Investment Operations | | | | |
Net investment income (loss)D | .918 | .832 | 1.014 | 1.122 |
Net realized and unrealized gain (loss) | 5.095 | 4.147 | (5.557) | (3.310) |
Total from investment operations | 6.013 | 4.979 | (4.543) | (2.188) |
Distributions from net investment income | (.933) | (.904) | (1.057) | (1.092) |
Distributions from net realized gain | (.190) | (.105) | (.710) | (.190) |
Total distributions | (1.123) | (1.009) | (1.767) | (1.282) |
Net asset value, end of period | $ 49.08 | $ 44.19 | $ 40.22 | $ 46.53 |
Total ReturnB,C | 13.68% | 12.44% | (9.43)% | (4.53)% |
Ratios to Average Net AssetsE,H | | | | |
Expenses before reductionsF | .00% | .00% | .00% | .00%A |
Expenses net of fee waivers, if any | .00% | .00% | .00% | .00%A |
Expenses net of all reductions | .00% | .00% | .00% | .00%A |
Net investment income (loss) | 1.91% | 1.92% | 2.68% | 2.52%A |
Supplemental Data | | | | |
Net assets, end of period (000 omitted) | $ 1,297 | $ 1,391 | $ 1,285 | $ 731 |
Portfolio turnover rate | 45% | 95% | 82% | 23%A |
A Annualized
B Total returns for periods of less than one year are not annualized.
C Total returns would have been lower if certain expenses had not been reduced during the applicable periods shown.
D Calculated based on average shares outstanding during the period.
E Amounts do not include the activity of the underlying funds.
F Amount represents less than .01%.
G For the period August 30, 2007 (commencement of operations) to July 31, 2008.
H Expense ratios reflect operating expenses of the class. Expenses before reductions do not reflect amounts reimbursed by the investment adviser or reductions from expense offset arrangements and do not represent the amount paid by the class during periods when reimbursements or reductions occur. Expenses net of fee waivers reflect expenses after reimbursement by the investment adviser but prior to reductions from expense offset arrangements. Expenses net of all reductions represent the net expenses paid by the class but do not include expenses of the investment companies in which the Fund invests.
Financial Highlights - Institutional Class
Years ended July 31, | 2011 | 2010 | 2009 | 2008G |
Selected Per-Share Data | | | | |
Net asset value, beginning of period | $ 44.19 | $ 40.22 | $ 46.53 | $ 50.00 |
Income from Investment Operations | | | | |
Net investment income (loss)D | .904 | .834 | 1.009 | 1.147 |
Net realized and unrealized gain (loss) | 5.109 | 4.145 | (5.552) | (3.335) |
Total from investment operations | 6.013 | 4.979 | (4.543) | (2.188) |
Distributions from net investment income | (.933) | (.904) | (1.057) | (1.092) |
Distributions from net realized gain | (.190) | (.105) | (.710) | (.190) |
Total distributions | (1.123) | (1.009) | (1.767) | (1.282) |
Net asset value, end of period | $ 49.08 | $ 44.19 | $ 40.22 | $ 46.53 |
Total ReturnB,C | 13.68% | 12.44% | (9.43)% | (4.53)% |
Ratios to Average Net AssetsE,H | | | | |
Expenses before reductionsF | .00% | .00% | .00% | .00%A |
Expenses net of fee waivers, if any | .00% | .00% | .00% | .00%A |
Expenses net of all reductions | .00% | .00% | .00% | .00%A |
Net investment income (loss) | 1.91% | 1.92% | 2.68% | 2.52%A |
Supplemental Data | | | | |
Net assets, end of period (000 omitted) | $ 19 | $ 61 | $ 55 | $ 96 |
Portfolio turnover rate | 45% | 95% | 82% | 23%A |
A Annualized
B Total returns for periods of less than one year are not annualized.
C Total returns would have been lower if certain expenses had not been reduced during the applicable periods shown.
D Calculated based on average shares outstanding during the period.
E Amounts do not include the activity of the underlying funds.
F Amount represents less than .01%.
G For the period August 30, 2007 (commencement of operations) to July 31, 2008.
H Expense ratios reflect operating expenses of the class. Expenses before reductions do not reflect amounts reimbursed by the investment adviser or reductions from expense offset arrangements and do not represent the amount paid by the class during periods when reimbursements or reductions occur. Expenses net of fee waivers reflect expenses after reimbursement by the investment adviser but prior to reductions from expense offset arrangements. Expenses net of all reductions represent the net expenses paid by the class but do not include expenses of the investment companies in which the Fund invests.
See accompanying notes which are an integral part of the financial statements.
Annual Report
Fidelity Income Replacement 2034 Fund
Investment Changes (Unaudited)
Fund Holdings as of July 31, 2011 |
| % of fund's
net assets | % of fund's net assets
6 months ago |
Domestic Equity Funds | | |
Fidelity Advisor Mid Cap II Fund Institutional Class | 5.5 | 5.6 |
Fidelity Disciplined Equity Fund | 5.8 | 5.8 |
Fidelity Equity-Income Fund | 5.7 | 5.9 |
Fidelity Large Cap Core Enhanced Index Fund | 9.4 | 9.4 |
Fidelity Series 100 Index Fund | 7.0 | 7.0 |
Fidelity Series Broad Market Opportunities Fund | 9.2 | 9.4 |
Fidelity Series Small Cap Opportunities Fund | 3.7 | 3.7 |
| 46.3 | 46.8 |
International Equity Funds | | |
Fidelity Advisor International Discovery Fund Institutional Class | 9.4 | 9.6 |
High Yield Fixed-Income Funds | | |
Fidelity Capital & Income Fund | 2.7 | 2.7 |
Fidelity Strategic Income Fund | 2.8 | 2.7 |
| 5.5 | 5.4 |
Investment Grade Fixed-Income Funds | | |
Fidelity Government Income Fund | 5.6 | 5.5 |
Fidelity Strategic Real Return Fund | 5.5 | 5.5 |
Fidelity Total Bond Fund | 16.7 | 16.6 |
| 27.8 | 27.6 |
Short-Term Funds | | |
Fidelity Institutional Money Market Portfolio Institutional Class | 5.5 | 5.3 |
Fidelity Short-Term Bond Fund | 5.5 | 5.3 |
| 11.0 | 10.6 |
Net Other Assets (Liabilities)* | 0.0 | 0.0 |
| 100.0 | 100.0 |
* Amount represents less than 0.1% |
Asset Allocation (% of fund's net assets) |
Current |
| Domestic Equity Funds | 46.3% | |
| International Equity Funds | 9.4% | |
| High Yield
Fixed-Income Funds | 5.5% | |
| Investment Grade Fixed-Income Funds | 27.8% | |
| Short-Term Funds | 11.0% | |

Six months ago |
| Domestic Equity Funds | 46.8% | |
| International Equity Funds | 9.6% | |
| High Yield
Fixed-Income Funds | 5.4% | |
| Investment Grade Fixed-Income Funds | 27.6% | |
| Short-Term Funds | 10.6% | |

Expected |
| Domestic Equity Funds | 46.4% | |
| International Equity Funds | 9.2% | |
| High Yield
Fixed-Income Funds | 5.3% | |
| Investment Grade Fixed-Income Funds | 27.7% | |
| Short-Term Funds | 11.4% | |

The fund invests according to an asset allocation strategy that becomes increasingly conservative over time. The six months ago allocation is based on the fund's holdings as of January 31, 2011. The current allocation is based on the fund's holdings as of July 31, 2011. The expected allocation represents the fund's anticipated allocation at January 31, 2012. |
Annual Report
Fidelity Income Replacement 2034 Fund
Investments July 31, 2011
Showing Percentage of Net Assets
Equity Funds - 55.7% |
| Shares | | Value |
Domestic Equity Funds - 46.3% |
Fidelity Advisor Mid Cap II Fund Institutional Class (a) | 6,828 | | $ 123,787 |
Fidelity Disciplined Equity Fund | 5,540 | | 128,972 |
Fidelity Equity-Income Fund | 2,870 | | 127,323 |
Fidelity Large Cap Core Enhanced Index Fund | 23,376 | | 209,683 |
Fidelity Series 100 Index Fund | 17,425 | | 157,695 |
Fidelity Series Broad Market Opportunities Fund | 20,065 | | 206,672 |
Fidelity Series Small Cap Opportunities Fund | 7,304 | | 81,955 |
TOTAL DOMESTIC EQUITY FUNDS | | 1,036,087 |
International Equity Funds - 9.4% |
Fidelity Advisor International Discovery Fund Institutional Class | 6,262 | | 210,595 |
TOTAL EQUITY FUNDS (Cost $1,028,008) | 1,246,682 |
Fixed-Income Funds - 33.3% |
| | | |
High Yield Fixed-Income Funds - 5.5% |
Fidelity Capital & Income Fund | 6,338 | | 60,652 |
Fidelity Strategic Income Fund | 5,475 | | 62,309 |
TOTAL HIGH YIELD FIXED-INCOME FUNDS | | 122,961 |
|
| Shares | | Value |
Investment Grade Fixed-Income Funds - 27.8% |
Fidelity Government Income Fund | 11,700 | | $ 124,954 |
Fidelity Strategic Real Return Fund | 12,543 | | 124,674 |
Fidelity Total Bond Fund | 33,979 | | 374,113 |
TOTAL INVESTMENT GRADE FIXED-INCOME FUNDS | | 623,741 |
TOTAL FIXED-INCOME FUNDS (Cost $679,154) | 746,702 |
Short-Term Funds - 11.0% |
| | | |
Fidelity Institutional Money Market Portfolio Institutional Class | 123,107 | | 123,107 |
Fidelity Short-Term Bond Fund | 14,496 | | 123,800 |
TOTAL SHORT-TERM FUNDS (Cost $243,107) | 246,907 |
TOTAL INVESTMENT PORTFOLIO - 100.0% (Cost $1,950,269) | | 2,240,291 |
NET OTHER ASSETS (LIABILITIES) - 0.0% | | (33) |
NET ASSETS - 100% | $ 2,240,258 |
Legend |
(a) Non-income producing |
Other Information |
All investments are categorized as Level 1 under the Fair Value Hierarchy. The inputs or methodology used for valuing securities may not be an indication of the risk associated with investing in those securities. For more information on valuation inputs, please refer to the Security Valuation section in the accompanying Notes to Financial Statements. |
Income Tax Information |
At July 31, 2011, the Fund had a capital loss carryforward of approximately $106,484 of which $62,824 and $43,660 will expire in fiscal 2018 and 2019, respectively. Capital loss carryforwards are only available to offset future capital gains of the Fund to the extent provided by regulations and may be limited. |
See accompanying notes which are an integral part of the financial statements.
Annual Report
Fidelity Income Replacement 2034 Fund
Statement of Assets and Liabilities
| July 31, 2011 |
| | |
Assets | | |
Investment in securities, at value (cost $1,950,269) - See accompanying schedule | | $ 2,240,291 |
| | |
Liabilities | | |
Distribution and service plan fees payable | | 33 |
| | |
Net Assets | | $ 2,240,258 |
Net Assets consist of: | | |
Paid in capital | | $ 2,093,614 |
Undistributed net investment income | | 426 |
Accumulated undistributed net realized gain (loss) on investments | | (143,804) |
Net unrealized appreciation (depreciation) on investments | | 290,022 |
Net Assets | | $ 2,240,258 |
| | |
Calculation of Maximum Offering Price Class A:
Net Asset Value and redemption price per share ($20,223.1 ÷ 409.92 shares) | | $ 49.33 |
| | |
Maximum offering price per share (100/94.25 of $49.33) | | $ 52.34 |
| | |
Class T:
Net Asset Value and redemption price per share ($26,613.4 ÷ 539.42 shares) | | $ 49.34 |
| | |
Maximum offering price per share (100/96.50 of $49.34) | | $ 51.13 |
| | |
Class C:
Net Asset Value and offering price per share ($20,147.3 ÷ 408.12 shares)A | | $ 49.37 |
| | |
Income Replacement 2034:
Net Asset Value, offering price and redemption price per share ($2,066,283.9 ÷ 41,902.71 shares) | | $ 49.31 |
| | |
Institutional Class:
Net Asset Value, offering price and redemption price per share ($106,990.6 ÷ 2,169.54 shares) | | $ 49.31 |
A Redemption price per share is equal to net asset value less any applicable contingent deferred sales charge.
Statement of Operations
| Year ended July 31, 2011 |
| | |
Investment Income | | |
Income distributions from underlying funds | | $ 38,012 |
| | |
Expenses | | |
Distribution and service plan fees | $ 444 | |
Independent trustees' compensation | 7 | |
Total expenses before reductions | 451 | |
Expense reductions | (7) | 444 |
Net investment income (loss) | | 37,568 |
Realized and Unrealized Gain (Loss) Realized gain (loss) on sale of underlying fund shares | (10,325) | |
Capital gain distributions from underlying funds | 10,953 | |
Total net realized gain (loss) | | 628 |
Change in net unrealized appreciation (depreciation) on underlying funds | | 213,839 |
Net gain (loss) | | 214,467 |
Net increase (decrease) in net assets resulting from operations | | $ 252,035 |
See accompanying notes which are an integral part of the financial statements.
Annual Report
Statement of Changes in Net Assets
| Year ended
July 31, 2011 | Year ended
July 31, 2010 |
Increase (Decrease) in Net Assets | | |
Operations | | |
Net investment income (loss) | $ 37,568 | $ 38,285 |
Net realized gain (loss) | 628 | (69,132) |
Change in net unrealized appreciation (depreciation) | 213,839 | 253,583 |
Net increase (decrease) in net assets resulting from operations | 252,035 | 222,736 |
Distributions to shareholders from net investment income | (37,649) | (38,318) |
Distributions to shareholders from net realized gain | (8,111) | (8,464) |
Total distributions | (45,760) | (46,782) |
Share transactions - net increase (decrease) | 179,595 | (216,059) |
Total increase (decrease) in net assets | 385,870 | (40,105) |
| | |
Net Assets | | |
Beginning of period | 1,854,388 | 1,894,493 |
End of period (including undistributed net investment income of $426 and undistributed net investment income of $518, respectively) | $ 2,240,258 | $ 1,854,388 |
Financial Highlights - Class A
Years ended July 31, | 2011 | 2010 | 2009 | 2008G |
Selected Per-Share Data | | | | |
Net asset value, beginning of period | $ 44.27 | $ 40.29 | $ 46.40 | $ 50.00 |
Income from Investment Operations | | | | |
Net investment income (loss)E | .799 | .753 | .923 | .994 |
Net realized and unrealized gain (loss) | 5.233 | 4.174 | (5.753) | (3.438) |
Total from investment operations | 6.032 | 4.927 | (4.830) | (2.444) |
Distributions from net investment income | (.772) | (.758) | (.890) | (.956) |
Distributions from net realized gain | (.200) | (.189) | (.390) | (.200) |
Total distributions | (.972) | (.947) | (1.280) | (1.156) |
Net asset value, end of period | $ 49.33 | $ 44.27 | $ 40.29 | $ 46.40 |
Total ReturnB,C,D | 13.69% | 12.29% | (10.20)% | (5.04)% |
Ratios to Average Net AssetsF,H | | | | |
Expenses before reductions | .25% | .25% | .26% | .25%A |
Expenses net of fee waivers, if any | .25% | .25% | .26% | .25%A |
Expenses net of all reductions | .25% | .25% | .26% | .25%A |
Net investment income (loss) | 1.66% | 1.73% | 2.46% | 2.19%A |
Supplemental Data | | | | |
Net assets, end of period (000 omitted) | $ 20 | $ 27 | $ 63 | $ 138 |
Portfolio turnover rate | 39% | 22% | 46% | 12%A |
A Annualized
B Total returns for periods of less than one year are not annualized.
C Total returns would have been lower if certain expenses had not been reduced during the applicable periods shown.
D Total returns do not include the effect of the sales charges.
E Calculated based on average shares outstanding during the period.
F Amounts do not include the activity of the underlying funds.
G For the period August 30, 2007 (commencement of operations) to July 31, 2008.
H Expense ratios reflect operating expenses of the class. Expenses before reductions do not reflect amounts reimbursed by the investment adviser or reductions from expense offset arrangements and do not represent the amount paid by the class during periods when reimbursements or reductions occur. Expenses net of fee waivers reflect expenses after reimbursement by the investment adviser but prior to reductions from expense offset arrangements. Expenses net of all reductions represent the net expenses paid by the class but do not include expenses of the investment companies in which the Fund invests.
See accompanying notes which are an integral part of the financial statements.
Annual Report
Financial Highlights - Class T
Years ended July 31, | 2011 | 2010 | 2009 | 2008G |
Selected Per-Share Data | | | | |
Net asset value, beginning of period | $ 44.27 | $ 40.29 | $ 46.40 | $ 50.00 |
Income from Investment Operations | | | | |
Net investment income (loss)E | .681 | .645 | .828 | .875 |
Net realized and unrealized gain (loss) | 5.247 | 4.175 | (5.757) | (3.431) |
Total from investment operations | 5.928 | 4.820 | (4.929) | (2.556) |
Distributions from net investment income | (.658) | (.651) | (.791) | (.844) |
Distributions from net realized gain | (.200) | (.189) | (.390) | (.200) |
Total distributions | (.858) | (.840) | (1.181) | (1.044) |
Net asset value, end of period | $ 49.34 | $ 44.27 | $ 40.29 | $ 46.40 |
Total ReturnB,C,D | 13.45% | 12.01% | (10.44)% | (5.25)% |
Ratios to Average Net AssetsF,H | | | | |
Expenses before reductions | .50% | .50% | .51% | .50%A |
Expenses net of fee waivers, if any | .50% | .50% | .51% | .50%A |
Expenses net of all reductions | .50% | .50% | .51% | .50%A |
Net investment income (loss) | 1.42% | 1.48% | 2.21% | 1.94%A |
Supplemental Data | | | | |
Net assets, end of period (000 omitted) | $ 27 | $ 35 | $ 54 | $ 95 |
Portfolio turnover rate | 39% | 22% | 46% | 12%A |
A Annualized
B Total returns for periods of less than one year are not annualized.
C Total returns would have been lower if certain expenses had not been reduced during the applicable periods shown.
D Total returns do not include the effect of the sales charges.
E Calculated based on average shares outstanding during the period.
F Amounts do not include the activity of the underlying funds.
G For the period August 30, 2007 (commencement of operations) to July 31, 2008.
H Expense ratios reflect operating expenses of the class. Expenses before reductions do not reflect amounts reimbursed by the investment adviser or reductions from expense offset arrangements and do not represent the amount paid by the class during periods when reimbursements or reductions occur. Expenses net of fee waivers reflect expenses after reimbursement by the investment adviser but prior to reductions from expense offset arrangements. Expenses net of all reductions represent the net expenses paid by the class but do not include expenses of the investment companies in which the Fund invests.
Financial Highlights - Class C
Years ended July 31, | 2011 | 2010 | 2009 | 2008G |
Selected Per-Share Data | | | | |
Net asset value, beginning of period | $ 44.30 | $ 40.30 | $ 46.39 | $ 50.00 |
Income from Investment Operations | | | | |
Net investment income (loss)E | .439 | .426 | .631 | .658 |
Net realized and unrealized gain (loss) | 5.239 | 4.185 | (5.740) | (3.448) |
Total from investment operations | 5.678 | 4.611 | (5.109) | (2.790) |
Distributions from net investment income | (.408) | (.422) | (.591) | (.620) |
Distributions from net realized gain | (.200) | (.189) | (.390) | (.200) |
Total distributions | (.608) | (.611) | (.981) | (.820) |
Net asset value, end of period | $ 49.37 | $ 44.30 | $ 40.30 | $ 46.39 |
Total ReturnB,C,D | 12.85% | 11.47% | (10.88)% | (5.70)% |
Ratios to Average Net AssetsF,H | | | | |
Expenses before reductions | 1.00% | 1.00% | 1.01% | 1.00%A |
Expenses net of fee waivers, if any | 1.00% | 1.00% | 1.01% | 1.00%A |
Expenses net of all reductions | 1.00% | 1.00% | 1.01% | 1.00%A |
Net investment income (loss) | .91% | .98% | 1.71% | 1.44%A |
Supplemental Data | | | | |
Net assets, end of period (000 omitted) | $ 20 | $ 27 | $ 41 | $ 94 |
Portfolio turnover rate | 39% | 22% | 46% | 12%A |
A Annualized
B Total returns for periods of less than one year are not annualized.
C Total returns would have been lower if certain expenses had not been reduced during the applicable periods shown.
D Total returns do not include the effect of the contingent deferred sales charge.
E Calculated based on average shares outstanding during the period.
F Amounts do not include the activity of the underlying funds.
G For the period August 30, 2007 (commencement of operations) to July 31, 2008.
H Expense ratios reflect operating expenses of the class. Expenses before reductions do not reflect amounts reimbursed by the investment adviser or reductions from expense offset arrangements and do not represent the amount paid by the class during periods when reimbursements or reductions occur. Expenses net of fee waivers reflect expenses after reimbursement by the investment adviser but prior to reductions from expense offset arrangements. Expenses net of all reductions represent the net expenses paid by the class but do not include expenses of the investment companies in which the Fund invests.
See accompanying notes which are an integral part of the financial statements.
Annual Report
Financial Highlights - Income Replacement 2034
Years ended July 31, | 2011 | 2010 | 2009 | 2008G |
Selected Per-Share Data | | | | |
Net asset value, beginning of period | $ 44.26 | $ 40.28 | $ 46.40 | $ 50.00 |
Income from Investment Operations | | | | |
Net investment income (loss)D | .921 | .862 | .988 | 1.090 |
Net realized and unrealized gain (loss) | 5.227 | 4.183 | (5.729) | (3.425) |
Total from investment operations | 6.148 | 5.045 | (4.741) | (2.335) |
Distributions from net investment income | (.898) | (.876) | (.989) | (1.065) |
Distributions from net realized gain | (.200) | (.189) | (.390) | (.200) |
Total distributions | (1.098) | (1.065) | (1.379) | (1.265) |
Net asset value, end of period | $ 49.31 | $ 44.26 | $ 40.28 | $ 46.40 |
Total ReturnB,C | 13.97% | 12.59% | (9.98)% | (4.83)% |
Ratios to Average Net AssetsE,H | | | | |
Expenses before reductions | .00%F | .00%F | .01% | .00%A,F |
Expenses net of fee waivers, if any | .00% | .00% | .01% | .00%A |
Expenses net of all reductions | .00% | .00% | .01% | .00%A |
Net investment income (loss) | 1.92% | 1.98% | 2.71% | 2.44%A |
Supplemental Data | | | | |
Net assets, end of period (000 omitted) | $ 2,066 | $ 1,672 | $ 1,628 | $ 552 |
Portfolio turnover rate | 39% | 22% | 46% | 12%A |
A Annualized
B Total returns for periods of less than one year are not annualized.
C Total returns would have been lower if certain expenses had not been reduced during the applicable periods shown.
D Calculated based on average shares outstanding during the period.
E Amounts do not include the activity of the underlying funds.
F Amount represents less than .01%.
G For the period August 30, 2007 (commencement of operations) to July 31, 2008.
H Expense ratios reflect operating expenses of the class. Expenses before reductions do not reflect amounts reimbursed by the investment adviser or reductions from expense offset arrangements and do not represent the amount paid by the class during periods when reimbursements or reductions occur. Expenses net of fee waivers reflect expenses after reimbursement by the investment adviser but prior to reductions from expense offset arrangements. Expenses net of all reductions represent the net expenses paid by the class but do not include expenses of the investment companies in which the Fund invests.
Financial Highlights - Institutional Class
Years ended July 31, | 2011 | 2010 | 2009 | 2008G |
Selected Per-Share Data | | | | |
Net asset value, beginning of period | $ 44.26 | $ 40.28 | $ 46.41 | $ 50.00 |
Income from Investment Operations | | | | |
Net investment income (loss)D | .922 | .860 | 1.002 | 1.114 |
Net realized and unrealized gain (loss) | 5.226 | 4.185 | (5.753) | (3.439) |
Total from investment operations | 6.148 | 5.045 | (4.751) | (2.325) |
Distributions from net investment income | (.898) | (.876) | (.989) | (1.065) |
Distributions from net realized gain | (.200) | (.189) | (.390) | (.200) |
Total distributions | (1.098) | (1.065) | (1.379) | (1.265) |
Net asset value, end of period | $ 49.31 | $ 44.26 | $ 40.28 | $ 46.41 |
Total ReturnB,C | 13.97% | 12.59% | (10.00)% | (4.81)% |
Ratios to Average Net AssetsE,H | | | | |
Expenses before reductions | .00% F | .00% F | .01% | .00%A, F |
Expenses net of fee waivers, if any | .00% | .00% | .01% | .00%A |
Expenses net of all reductions | .00% | .00% | .01% | .00%A |
Net investment income (loss) | 1.92% | 1.98% | 2.71% | 2.44%A |
Supplemental Data | | | | |
Net assets, end of period (000 omitted) | $ 107 | $ 94 | $ 108 | $ 95 |
Portfolio turnover rate | 39% | 22% | 46% | 12%A |
A Annualized
B Total returns for periods of less than one year are not annualized.
C Total returns would have been lower if certain expenses had not been reduced during the applicable periods shown.
D Calculated based on average shares outstanding during the period.
E Amounts do not include the activity of the underlying funds.
F Amount represents less than .01%.
G For the period August 30, 2007 (commencement of operations) to July 31, 2008.
H Expense ratios reflect operating expenses of the class. Expenses before reductions do not reflect amounts reimbursed by the investment adviser or reductions from expense offset arrangements and do not represent the amount paid by the class during periods when reimbursements or reductions occur. Expenses net of fee waivers reflect expenses after reimbursement by the investment adviser but prior to reductions from expense offset arrangements. Expenses net of all reductions represent the net expenses paid by the class but do not include expenses of the investment companies in which the Fund invests.
See accompanying notes which are an integral part of the financial statements.
Annual Report
Fidelity Income Replacement 2036 Fund
Investment Changes (Unaudited)
Fund Holdings as of July 31, 2011 |
| % of fund's
net assets | % of fund's net assets
6 months ago |
Domestic Equity Funds | | |
Fidelity Advisor Mid Cap II Fund Institutional Class | 5.6 | 5.7 |
Fidelity Disciplined Equity Fund | 5.8 | 6.0 |
Fidelity Equity-Income Fund | 5.8 | 6.0 |
Fidelity Large Cap Core Enhanced Index Fund | 9.5 | 9.6 |
Fidelity Series 100 Index Fund | 7.2 | 7.2 |
Fidelity Series Broad Market Opportunities Fund | 9.4 | 9.5 |
Fidelity Series Small Cap Opportunities Fund | 3.7 | 3.8 |
| 47.0 | 47.8 |
International Equity Funds | | |
Fidelity Advisor International Discovery Fund Institutional Class | 10.3 | 10.4 |
High Yield Fixed-Income Funds | | |
Fidelity Capital & Income Fund | 2.9 | 2.9 |
Fidelity Strategic Income Fund | 2.9 | 2.8 |
| 5.8 | 5.7 |
Investment Grade Fixed-Income Funds | | |
Fidelity Government Income Fund | 5.4 | 5.4 |
Fidelity Strategic Real Return Fund | 5.4 | 5.3 |
Fidelity Total Bond Fund | 16.3 | 16.0 |
| 27.1 | 26.7 |
Short-Term Funds | | |
Fidelity Institutional Money Market Portfolio Institutional Class | 4.9 | 4.7 |
Fidelity Short-Term Bond Fund | 4.9 | 4.7 |
| 9.8 | 9.4 |
Net Other Assets (Liabilities)* | 0.0 | 0.0 |
| 100.0 | 100.0 |
* Amount represents less than 0.1% |
Asset Allocation (% of fund's net assets) |
Current |
| Domestic Equity Funds | 47.0% | |
| International Equity Funds | 10.3% | |
| High Yield
Fixed-Income Funds | 5.8% | |
| Investment Grade Fixed-Income Funds | 27.1% | |
| Short-Term Funds | 9.8% | |

Six months ago |
| Domestic Equity Funds | 47.8% | |
| International Equity Funds | 10.4% | |
| High Yield
Fixed-Income Funds | 5.7% | |
| Investment Grade Fixed-Income Funds | 26.7% | |
| Short-Term Funds | 9.4% | |

Expected |
| Domestic Equity Funds | 47.2% | |
| International Equity Funds | 10.0% | |
| High Yield
Fixed-Income Funds | 5.6% | |
| Investment Grade Fixed-Income Funds | 27.0% | |
| Short-Term Funds | 10.2% | |

The fund invests according to an asset allocation strategy that becomes increasingly conservative over time. The six months ago allocation is based on the fund's holdings as of January 31, 2011. The current allocation is based on the fund's holdings as of July 31, 2011. The expected allocation represents the fund's anticipated allocation at January 31, 2012. |
Annual Report
Fidelity Income Replacement 2036 Fund
Investments July 31, 2011
Showing Percentage of Net Assets
Equity Funds - 57.3% |
| Shares | | Value |
Domestic Equity Funds - 47.0% |
Fidelity Advisor Mid Cap II Fund Institutional Class (a) | 9,279 | | $ 168,225 |
Fidelity Disciplined Equity Fund | 7,538 | | 175,492 |
Fidelity Equity-Income Fund | 3,902 | | 173,114 |
Fidelity Large Cap Core Enhanced Index Fund | 31,736 | | 284,669 |
Fidelity Series 100 Index Fund | 23,697 | | 214,461 |
Fidelity Series Broad Market Opportunities Fund | 27,293 | | 281,115 |
Fidelity Series Small Cap Opportunities Fund | 9,947 | | 111,604 |
TOTAL DOMESTIC EQUITY FUNDS | | 1,408,680 |
International Equity Funds - 10.3% |
Fidelity Advisor International Discovery Fund Institutional Class | 9,198 | | 309,320 |
TOTAL EQUITY FUNDS (Cost $1,739,063) | 1,718,000 |
Fixed-Income Funds - 32.9% |
| | | |
High Yield Fixed-Income Funds - 5.8% |
Fidelity Capital & Income Fund | 8,916 | | 85,326 |
Fidelity Strategic Income Fund | 7,702 | | 87,653 |
TOTAL HIGH YIELD FIXED-INCOME FUNDS | | 172,979 |
|
| Shares | | Value |
Investment Grade Fixed-Income Funds - 27.1% |
Fidelity Government Income Fund | 15,232 | | $ 162,680 |
Fidelity Strategic Real Return Fund | 16,331 | | 162,335 |
Fidelity Total Bond Fund | 44,194 | | 486,575 |
TOTAL INVESTMENT GRADE FIXED-INCOME FUNDS | | 811,590 |
TOTAL FIXED-INCOME FUNDS (Cost $961,707) | 984,569 |
Short-Term Funds - 9.8% |
| | | |
Fidelity Institutional Money Market Portfolio Institutional Class | 146,429 | | 146,429 |
Fidelity Short-Term Bond Fund | 17,244 | | 147,265 |
TOTAL SHORT-TERM FUNDS (Cost $293,013) | 293,694 |
TOTAL INVESTMENT PORTFOLIO - 100.0% (Cost $2,993,783) | | 2,996,263 |
NET OTHER ASSETS (LIABILITIES) - 0.0% | | (248) |
NET ASSETS - 100% | $ 2,996,015 |
Legend |
(a) Non-income producing |
Other Information |
All investments are categorized as Level 1 under the Fair Value Hierarchy. The inputs or methodology used for valuing securities may not be an indication of the risk associated with investing in those securities. For more information on valuation inputs, please refer to the Security Valuation section in the accompanying Notes to Financial Statements. |
Income Tax Information |
At July 31, 2011, the Fund had a capital loss carryforward of approximately $206,608 of which $19,968, $183,763 and $2,877 will expire in fiscal 2017, 2018 and 2019, respectively. Capital loss carryforwards are only available to offset future capital gains of the Fund to the extent provided by regulations and may be limited. |
See accompanying notes which are an integral part of the financial statements.
Annual Report
Fidelity Income Replacement 2036 Fund
Statement of Assets and Liabilities
| July 31, 2011 |
| | |
Assets | | |
Investment in securities, at value (cost $2,993,783) - See accompanying schedule | | $ 2,996,263 |
Cash | | 75 |
Total assets | | 2,996,338 |
| | |
Liabilities | | |
Payable for investments purchased | $ 6 | |
Distribution and service plan fees payable | 317 | |
Total liabilities | | 323 |
| | |
Net Assets | | $ 2,996,015 |
Net Assets consist of: | | |
Paid in capital | | $ 3,215,676 |
Undistributed net investment income | | 528 |
Accumulated undistributed net realized gain (loss) on investments | | (222,669) |
Net unrealized appreciation (depreciation) on investments | | 2,480 |
Net Assets | | $ 2,996,015 |
| | |
Calculation of Maximum Offering Price Class A:
Net Asset Value and redemption price per share ($31,272 ÷ 639.31 shares) | | $ 48.92 |
| | |
Maximum offering price per share (100/94.25 of $48.92) | | $ 51.90 |
| | |
Class T:
Net Asset Value and redemption price per share ($287,732 ÷ 5,884.83 shares) | | $ 48.89 |
| | |
Maximum offering price per share (100/96.50 of $48.89) | | $ 50.66 |
| | |
Class C:
Net Asset Value and offering price per share ($215,963 ÷ 4,417.96 shares)A | | $ 48.88 |
| | |
Income Replacement 2036:
Net Asset Value, offering price and redemption price per share ($2,433,382 ÷ 49,755.66 shares) | | $ 48.91 |
| | |
Institutional Class:
Net Asset Value, offering price and redemption price per share ($27,666 ÷ 565.71 shares) | | $ 48.90 |
A Redemption price per share is equal to net asset value less any applicable contingent deferred sales charge.
Statement of Operations
| Year ended July 31, 2011 |
| | |
Investment Income | | |
Income distributions from underlying funds | | $ 37,375 |
| | |
Expenses | | |
Distribution and service plan fees | $ 2,913 | |
Independent trustees' compensation | 6 | |
Total expenses before reductions | 2,919 | |
Expense reductions | (6) | 2,913 |
Net investment income (loss) | | 34,462 |
Realized and Unrealized Gain (Loss) Realized gain (loss) on sale of underlying fund shares | 16,103 | |
Capital gain distributions from underlying funds | 9,107 | |
Total net realized gain (loss) | | 25,210 |
Change in net unrealized appreciation (depreciation) on underlying funds | | 122,897 |
Net gain (loss) | | 148,107 |
Net increase (decrease) in net assets resulting from operations | | $ 182,569 |
See accompanying notes which are an integral part of the financial statements.
Annual Report
Statement of Changes in Net Assets
| Year ended
July 31, 2011 | Year ended
July 31, 2010 |
Increase (Decrease) in Net Assets | | |
Operations | | |
Net investment income (loss) | $ 34,462 | $ 19,710 |
Net realized gain (loss) | 25,210 | (40,612) |
Change in net unrealized appreciation (depreciation) | 122,897 | 163,539 |
Net increase (decrease) in net assets resulting from operations | 182,569 | 142,637 |
Distributions to shareholders from net investment income | (34,152) | (19,743) |
Distributions to shareholders from net realized gain | (6,329) | (3,949) |
Total distributions | (40,481) | (23,692) |
Share transactions - net increase (decrease) | 1,729,093 | (128,803) |
Total increase (decrease) in net assets | 1,871,181 | (9,858) |
| | |
Net Assets | | |
Beginning of period | 1,124,834 | 1,134,692 |
End of period (including undistributed net investment income of $528 and undistributed net investment income of $253, respectively) | $ 2,996,015 | $ 1,124,834 |
Financial Highlights - Class A
Years ended July 31, | 2011 | 2010 | 2009 | 2008G |
Selected Per-Share Data | | | | |
Net asset value, beginning of period | $ 43.73 | $ 39.70 | $ 46.40 | $ 50.00 |
Income from Investment Operations | | | | |
Net investment income (loss)E | .811 | .748 | .937 | .951 |
Net realized and unrealized gain (loss) | 5.306 | 4.178 | (6.127) | (3.464) |
Total from investment operations | 6.117 | 4.926 | (5.190) | (2.513) |
Distributions from net investment income | (.771) | (.752) | (.940) | (.897) |
Distributions from net realized gain | (.156) | (.144) | (.570) | (.190) |
Total distributions | (.927) | (.896) | (1.510) | (1.087) |
Net asset value, end of period | $ 48.92 | $ 43.73 | $ 39.70 | $ 46.40 |
Total ReturnB,C,D | 14.05% | 12.46% | (10.72)% | (5.17)% |
Ratios to Average Net AssetsF,H | | | | |
Expenses before reductions | .25% | .25% | .25% | .25%A |
Expenses net of fee waivers, if any | .25% | .25% | .25% | .25%A |
Expenses net of all reductions | .25% | .25% | .25% | .25%A |
Net investment income (loss) | 1.70% | 1.74% | 2.52% | 2.08%A |
Supplemental Data | | | | |
Net assets, end of period (000 omitted) | $ 31 | $ 40 | $ 54 | $ 95 |
Portfolio turnover rate | 19% | 26% | 39% | 44%A |
A Annualized
B Total returns for periods of less than one year are not annualized.
C Total returns would have been lower if certain expenses had not been reduced during the applicable periods shown.
D Total returns do not include the effect of the sales charges.
E Calculated based on average shares outstanding during the period.
F Amounts do not include the activity of the underlying funds.
G For the period August 30, 2007 (commencement of operations) to July 31, 2008.
H Expense ratios reflect operating expenses of the class. Expenses before reductions do not reflect amounts reimbursed by the investment adviser or reductions from expense offset arrangements and do not represent the amount paid by the class during periods when reimbursements or reductions occur. Expenses net of fee waivers reflect expenses after reimbursement by the investment adviser but prior to reductions from expense offset arrangements. Expenses net of all reductions represent the net expenses paid by the class but do not include expenses of the investment companies in which the Fund invests.
See accompanying notes which are an integral part of the financial statements.
Annual Report
Financial Highlights - Class T
Years ended July 31, | 2011 | 2010 | 2009 | 2008G |
Selected Per-Share Data | | | | |
Net asset value, beginning of period | $ 43.72 | $ 39.69 | $ 46.39 | $ 50.00 |
Income from Investment Operations | | | | |
Net investment income (loss)E | .693 | .639 | .844 | .823 |
Net realized and unrealized gain (loss) | 5.287 | 4.183 | (6.122) | (3.449) |
Total from investment operations | 5.980 | 4.822 | (5.278) | (2.626) |
Distributions from net investment income | (.654) | (.648) | (.852) | (.794) |
Distributions from net realized gain | (.156) | (.144) | (.570) | (.190) |
Total distributions | (.810) | (.792) | (1.422) | (.984) |
Net asset value, end of period | $ 48.89 | $ 43.72 | $ 39.69 | $ 46.39 |
Total ReturnB,C,D | 13.73% | 12.19% | (10.93)% | (5.39)% |
Ratios to Average Net AssetsF,H | | | | |
Expenses before reductions | .50% | .50% | .50% | .50%A |
Expenses net of fee waivers, if any | .50% | .50% | .50% | .50%A |
Expenses net of all reductions | .50% | .50% | .50% | .50%A |
Net investment income (loss) | 1.45% | 1.49% | 2.28% | 1.83%A |
Supplemental Data | | | | |
Net assets, end of period (000 omitted) | $ 288 | $ 265 | $ 265 | $ 384 |
Portfolio turnover rate | 19% | 26% | 39% | 44%A |
A Annualized
B Total returns for periods of less than one year are not annualized.
C Total returns would have been lower if certain expenses had not been reduced during the applicable periods shown.
D Total returns do not include the effect of the sales charges.
E Calculated based on average shares outstanding during the period.
F Amounts do not include the activity of the underlying funds.
G For the period August 30, 2007 (commencement of operations) to July 31, 2008.
H Expense ratios reflect operating expenses of the class. Expenses before reductions do not reflect amounts reimbursed by the investment adviser or reductions from expense offset arrangements and do not represent the amount paid by the class during periods when reimbursements or reductions occur. Expenses net of fee waivers reflect expenses after reimbursement by the investment adviser but prior to reductions from expense offset arrangements. Expenses net of all reductions represent the net expenses paid by the class but do not include expenses of the investment companies in which the Fund invests.
Financial Highlights - Class C
Years ended July 31, | 2011 | 2010 | 2009 | 2008G |
Selected Per-Share Data | | | | |
Net asset value, beginning of period | $ 43.74 | $ 39.71 | $ 46.39 | $ 50.00 |
Income from Investment Operations | | | | |
Net investment income (loss)E | .454 | .424 | .655 | .609 |
Net realized and unrealized gain (loss) | 5.293 | 4.179 | (6.114) | (3.465) |
Total from investment operations | 5.747 | 4.603 | (5.459) | (2.856) |
Distributions from net investment income | (.451) | (.429) | (.651) | (.564) |
Distributions from net realized gain | (.156) | (.144) | (.570) | (.190) |
Total distributions | (.607) | (.573) | (1.221) | (.754) |
Net asset value, end of period | $ 48.88 | $ 43.74 | $ 39.71 | $ 46.39 |
Total ReturnB,C,D | 13.17% | 11.61% | (11.38)% | (5.82)% |
Ratios to Average Net AssetsF,H | | | | |
Expenses before reductions | 1.00% | 1.00% | 1.00% | 1.00%A |
Expenses net of fee waivers, if any | 1.00% | 1.00% | 1.00% | 1.00%A |
Expenses net of all reductions | 1.00% | 1.00% | 1.00% | 1.00%A |
Net investment income (loss) | .95% | .99% | 1.77% | 1.33%A |
Supplemental Data | | | | |
Net assets, end of period (000 omitted) | $ 216 | $ 119 | $ 116 | $ 94 |
Portfolio turnover rate | 19% | 26% | 39% | 44%A |
A Annualized
B Total returns for periods of less than one year are not annualized.
C Total returns would have been lower if certain expenses had not been reduced during the applicable periods shown.
D Total returns do not include the effect of the contingent deferred sales charge.
E Calculated based on average shares outstanding during the period.
F Amounts do not include the activity of the underlying funds.
G For the period August 30, 2007 (commencement of operations) to July 31, 2008.
H Expense ratios reflect operating expenses of the class. Expenses before reductions do not reflect amounts reimbursed by the investment adviser or reductions from expense offset arrangements and do not represent the amount paid by the class during periods when reimbursements or reductions occur. Expenses net of fee waivers reflect expenses after reimbursement by the investment adviser but prior to reductions from expense offset arrangements. Expenses net of all reductions represent the net expenses paid by the class but do not include expenses of the investment companies in which the Fund invests.
See accompanying notes which are an integral part of the financial statements.
Annual Report
Financial Highlights - Income Replacement 2036
Years ended July 31, | 2011 | 2010 | 2009 | 2008G |
Selected Per-Share Data | | | | |
Net asset value, beginning of period | $ 43.73 | $ 39.70 | $ 46.40 | $ 50.00 |
Income from Investment Operations | | | | |
Net investment income (loss)D | .939 | .854 | 1.034 | 1.043 |
Net realized and unrealized gain (loss) | 5.291 | 4.183 | (6.126) | (3.445) |
Total from investment operations | 6.230 | 5.037 | (5.092) | (2.402) |
Distributions from net investment income | (.894) | (.863) | (1.038) | (1.008) |
Distributions from net realized gain | (.156) | (.144) | (.570) | (.190) |
Total distributions | (1.050) | (1.007) | (1.608) | (1.198) |
Net asset value, end of period | $ 48.91 | $ 43.73 | $ 39.70 | $ 46.40 |
Total ReturnB,C | 14.32% | 12.75% | (10.48)% | (4.96)% |
Ratios to Average Net AssetsE,H | | | | |
Expenses before reductionsF | .00% | .00% | .00% | .00%A |
Expenses net of fee waivers, if any | .00% | .00% | .00% | .00%A |
Expenses net of all reductions | .00% | .00% | .00% | .00%A |
Net investment income (loss) | 1.95% | 1.99% | 2.78% | 2.33%A |
Supplemental Data | | | | |
Net assets, end of period (000 omitted) | $ 2,433 | $ 598 | $ 632 | $ 986 |
Portfolio turnover rate | 19% | 26% | 39% | 44%A |
A Annualized
B Total returns for periods of less than one year are not annualized.
C Total returns would have been lower if certain expenses had not been reduced during the applicable periods shown.
D Calculated based on average shares outstanding during the period.
E Amounts do not include the activity of the underlying funds.
F Amount represents less than .01%.
G For the period August 30, 2007 (commencement of operations) to July 31, 2008.
H Expense ratios reflect operating expenses of the class. Expenses before reductions do not reflect amounts reimbursed by the investment adviser or reductions from expense offset arrangements and do not represent the amount paid by the class during periods when reimbursements or reductions occur. Expenses net of fee waivers reflect expenses after reimbursement by the investment adviser but prior to reductions from expense offset arrangements. Expenses net of all reductions represent the net expenses paid by the class but do not include expenses of the investment companies in which the Fund invests.
Financial Highlights - Institutional Class
Years ended July 31, | 2011 | 2010 | 2009 | 2008G |
Selected Per-Share Data | | | | |
Net asset value, beginning of period | $ 43.73 | $ 39.70 | $ 46.40 | $ 50.00 |
Income from Investment Operations | | | | |
Net investment income (loss)D | .929 | .851 | 1.031 | 1.064 |
Net realized and unrealized gain (loss) | 5.291 | 4.186 | (6.123) | (3.466) |
Total from investment operations | 6.220 | 5.037 | (5.092) | (2.402) |
Distributions from net investment income | (.894) | (.863) | (1.038) | (1.008) |
Distributions from net realized gain | (.156) | (.144) | (.570) | (.190) |
Total distributions | (1.050) | (1.007) | (1.608) | (1.198) |
Net asset value, end of period | $ 48.90 | $ 43.73 | $ 39.70 | $ 46.40 |
Total ReturnB,C | 14.30% | 12.75% | (10.48)% | (4.96)% |
Ratios to Average Net AssetsE,H | | | | |
Expenses before reductionsF | .00% | .00% | .00% | .00%A |
Expenses net of fee waivers, if any | .00% | .00% | .00% | .00%A |
Expenses net of all reductions | .00% | .00% | .00% | .00%A |
Net investment income (loss) | 1.95% | 1.99% | 2.78% | 2.33%A |
Supplemental Data | | | | |
Net assets, end of period (000 omitted) | $ 28 | $ 103 | $ 67 | $ 119 |
Portfolio turnover rate | 19% | 26% | 39% | 44%A |
A Annualized
B Total returns for periods of less than one year are not annualized.
C Total returns would have been lower if certain expenses had not been reduced during the applicable periods shown.
D Calculated based on average shares outstanding during the period.
E Amounts do not include the activity of the underlying funds.
F Amount represents less than .01%.
G For the period August 30, 2007 (commencement of operations) to July 31, 2008.
H Expense ratios reflect operating expenses of the class. Expenses before reductions do not reflect amounts reimbursed by the investment adviser or reductions from expense offset arrangements and do not represent the amount paid by the class during periods when reimbursements or reductions occur. Expenses net of fee waivers reflect expenses after reimbursement by the investment adviser but prior to reductions from expense offset arrangements. Expenses net of all reductions represent the net expenses paid by the class but do not include expenses of the investment companies in which the Fund invests.
See accompanying notes which are an integral part of the financial statements.
Annual Report
Fidelity Income Replacement 2038 Fund
Investment Changes (Unaudited)
Fund Holdings as of July 31, 2011 |
| % of fund's
net assets | % of fund's net assets
6 months ago |
Domestic Equity Funds | | |
Fidelity Advisor Mid Cap II Fund Institutional Class | 5.8 | 5.9 |
Fidelity Disciplined Equity Fund | 6.0 | 6.1 |
Fidelity Equity-Income Fund | 5.9 | 6.1 |
Fidelity Large Cap Core Enhanced Index Fund | 9.8 | 9.8 |
Fidelity Series 100 Index Fund | 7.4 | 7.3 |
Fidelity Series Broad Market Opportunities Fund | 9.6 | 9.8 |
Fidelity Series Small Cap Opportunities Fund | 3.8 | 3.9 |
| 48.3 | 48.9 |
International Equity Funds | | |
Fidelity Advisor International Discovery Fund Institutional Class | 11.3 | 11.4 |
High Yield Fixed-Income Funds | | |
Fidelity Capital & Income Fund | 3.0 | 3.1 |
Fidelity Strategic Income Fund | 3.1 | 3.0 |
| 6.1 | 6.1 |
Investment Grade Fixed-Income Funds | | |
Fidelity Government Income Fund | 5.3 | 5.2 |
Fidelity Strategic Real Return Fund | 5.3 | 5.3 |
Fidelity Total Bond Fund | 16.0 | 15.8 |
| 26.6 | 26.3 |
Short-Term Funds | | |
Fidelity Institutional Money Market Portfolio Institutional Class | 3.8 | 3.7 |
Fidelity Short-Term Bond Fund | 3.9 | 3.6 |
| 7.7 | 7.3 |
Net Other Assets (Liabilities)* | 0.0 | 0.0 |
| 100.0 | 100.0 |
* Amount represents less than 0.1% |
Asset Allocation (% of fund's net assets) |
Current |
| Domestic Equity Funds | 48.3% | |
| International Equity Funds | 11.3% | |
| High Yield
Fixed-Income Funds | 6.1% | |
| Investment Grade Fixed-Income Funds | 26.6% | |
| Short-Term Funds | 7.7% | |

Six months ago |
| Domestic Equity Funds | 48.9% | |
| International Equity Funds | 11.4% | |
| High Yield
Fixed-Income Funds | 6.1% | |
| Investment Grade Fixed-Income Funds | 26.3% | |
| Short-Term Funds | 7.3% | |

Expected |
| Domestic Equity Funds | 48.3% | |
| International Equity Funds | 10.9% | |
| High Yield
Fixed-Income Funds | 5.9% | |
| Investment Grade Fixed-Income Funds | 26.5% | |
| Short-Term Funds | 8.4% | |

The fund invests according to an asset allocation strategy that becomes increasingly conservative over time. The six months ago allocation is based on the fund's holdings as of January 31, 2011. The current allocation is based on the fund's holdings as of July 31, 2011. The expected allocation represents the fund's anticipated allocation at January 31, 2012. |
Annual Report
Fidelity Income Replacement 2038 Fund
Investments July 31, 2011
Showing Percentage of Net Assets
Equity Funds - 59.6% |
| Shares | | Value |
Domestic Equity Funds - 48.3% |
Fidelity Advisor Mid Cap II Fund Institutional Class (a) | 5,118 | | $ 92,788 |
Fidelity Disciplined Equity Fund | 4,153 | | 96,677 |
Fidelity Equity-Income Fund | 2,150 | | 95,389 |
Fidelity Large Cap Core Enhanced Index Fund | 17,538 | | 157,316 |
Fidelity Series 100 Index Fund | 13,075 | | 118,326 |
Fidelity Series Broad Market Opportunities Fund | 15,054 | | 155,053 |
Fidelity Series Small Cap Opportunities Fund | 5,489 | | 61,591 |
TOTAL DOMESTIC EQUITY FUNDS | | 777,140 |
International Equity Funds - 11.3% |
Fidelity Advisor International Discovery Fund Institutional Class | 5,379 | | 180,901 |
TOTAL EQUITY FUNDS (Cost $762,757) | 958,041 |
Fixed-Income Funds - 32.7% |
| | | |
High Yield Fixed-Income Funds - 6.1% |
Fidelity Capital & Income Fund | 5,041 | | 48,246 |
Fidelity Strategic Income Fund | 4,364 | | 49,666 |
TOTAL HIGH YIELD FIXED-INCOME FUNDS | | 97,912 |
|
| Shares | | Value |
Investment Grade Fixed-Income Funds - 26.6% |
Fidelity Government Income Fund | 8,023 | | $ 85,688 |
Fidelity Strategic Real Return Fund | 8,598 | | 85,464 |
Fidelity Total Bond Fund | 23,309 | | 256,630 |
TOTAL INVESTMENT GRADE FIXED-INCOME FUNDS | | 427,782 |
TOTAL FIXED-INCOME FUNDS (Cost $476,587) | 525,694 |
Short-Term Funds - 7.7% |
| | | |
Fidelity Institutional Money Market Portfolio Institutional Class | 61,645 | | 61,645 |
Fidelity Short-Term Bond Fund | 7,264 | | 62,037 |
TOTAL SHORT-TERM FUNDS (Cost $121,635) | 123,682 |
TOTAL INVESTMENT PORTFOLIO - 100.0% (Cost $1,360,979) | | 1,607,417 |
NET OTHER ASSETS (LIABILITIES) - 0.0% | | (84) |
NET ASSETS - 100% | $ 1,607,333 |
Legend |
(a) Non-income producing |
Other Information |
All investments are categorized as Level 1 under the Fair Value Hierarchy. The inputs or methodology used for valuing securities may not be an indication of the risk associated with investing in those securities. For more information on valuation inputs, please refer to the Security Valuation section in the accompanying Notes to Financial Statements. |
Income Tax Information |
At July 31, 2011, the Fund had a capital loss carryforward of approximately $60,057 of which $11,570 and $48,487 will expire in fiscal 2018 and 2019, respectively. Capital loss carryforwards are only available to offset future capital gains of the Fund to the extent provided by regulations and may be limited. |
The Fund intends to elect to defer to its fiscal year ending July 31, 2012 approximately $18,954 of losses recognized during the period November 1, 2010 to July 31, 2011. |
See accompanying notes which are an integral part of the financial statements.
Annual Report
Fidelity Income Replacement 2038 Fund
Statement of Assets and Liabilities
| July 31, 2011 |
| | |
Assets | | |
Investment in securities, at value (cost $1,360,979) - See accompanying schedule | | $ 1,607,417 |
Cash | | 39 |
Total assets | | 1,607,456 |
| | |
Liabilities | | |
Distribution and service plan fees payable | | 123 |
| | |
Net Assets | | $ 1,607,333 |
Net Assets consist of: | | |
Paid in capital | | $ 1,455,086 |
Undistributed net investment income | | 293 |
Accumulated undistributed net realized gain (loss) on investments | | (94,484) |
Net unrealized appreciation (depreciation) on investments | | 246,438 |
Net Assets | | $ 1,607,333 |
| | |
Calculation of Maximum Offering Price Class A:
Net Asset Value and redemption price per share ($34,321 ÷ 712.14 shares) | | $ 48.19 |
| | |
Maximum offering price per share (100/94.25 of $48.19) | | $ 51.13 |
| | |
Class T:
Net Asset Value and redemption price per share ($126,704 ÷ 2,629.50 shares) | | $ 48.19 |
| | |
Maximum offering price per share (100/96.50 of $48.19) | | $ 49.94 |
| | |
Class C:
Net Asset Value and offering price per share ($72,462 ÷ 1,504.20 shares)A | | $ 48.17 |
| | |
Income Replacement 2038:
Net Asset Value, offering price and redemption price per share ($1,344,885 ÷ 27,907.21 shares) | | $ 48.19 |
| | |
Institutional Class:
Net Asset Value, offering price and redemption price per share ($28,961 ÷ 601.00 shares) | | $ 48.19 |
A Redemption price per share is equal to net asset value less any applicable contingent deferred sales charge.
Statement of Operations
| Year ended July 31, 2011 |
| | |
Investment Income | | |
Income distributions from underlying funds | | $ 40,965 |
| | |
Expenses | | |
Distribution and service plan fees | $ 1,096 | |
Independent trustees' compensation | 7 | |
Total expenses before reductions | 1,103 | |
Expense reductions | (7) | 1,096 |
Net investment income (loss) | | 39,869 |
Realized and Unrealized Gain (Loss) Realized gain (loss) on sale of underlying fund shares | (24,408) | |
Capital gain distributions from underlying funds | 13,137 | |
Total net realized gain (loss) | | (11,271) |
Change in net unrealized appreciation (depreciation) on underlying funds | | 277,762 |
Net gain (loss) | | 266,491 |
Net increase (decrease) in net assets resulting from operations | | $ 306,360 |
See accompanying notes which are an integral part of the financial statements.
Annual Report
Fidelity Income Replacement 2038 Fund
Financial Statements - continued
Statement of Changes in Net Assets
| Year ended
July 31, 2011 | Year ended
July 31, 2010 |
Increase (Decrease) in Net Assets | | |
Operations | | |
Net investment income (loss) | $ 39,869 | $ 44,672 |
Net realized gain (loss) | (11,271) | (45,293) |
Change in net unrealized appreciation (depreciation) | 277,762 | 254,403 |
Net increase (decrease) in net assets resulting from operations | 306,360 | 253,782 |
Distributions to shareholders from net investment income | (40,181) | (44,437) |
Distributions to shareholders from net realized gain | (9,861) | (9,084) |
Total distributions | (50,042) | (53,521) |
Share transactions - net increase (decrease) | (897,193) | 597,064 |
Total increase (decrease) in net assets | (640,875) | 797,325 |
| | |
Net Assets | | |
Beginning of period | 2,248,208 | 1,450,883 |
End of period (including undistributed net investment income of $293 and undistributed net investment income of $618, respectively) | $ 1,607,333 | $ 2,248,208 |
Financial Highlights - Class A
Years ended July 31, | 2011 | 2010 | 2009 | 2008G |
Selected Per-Share Data | | | | |
Net asset value, beginning of period | $ 43.01 | $ 38.95 | $ 45.26 | $ 50.00 |
Income from Investment Operations | | | | |
Net investment income (loss)E | .858 | .744 | .856 | .442 |
Net realized and unrealized gain (loss) | 5.317 | 4.191 | (6.093) | (4.811) |
Total from investment operations | 6.175 | 4.935 | (5.237) | (4.369) |
Distributions from net investment income | (.802) | (.710) | (.873) | (.371) |
Distributions from net realized gain | (.193) | (.165) | (.200) | - |
Total distributions | (.995) | (.875) | (1.073) | (.371) |
Net asset value, end of period | $ 48.19 | $ 43.01 | $ 38.95 | $ 45.26 |
Total ReturnB,C,D | 14.43% | 12.72% | (11.24)% | (8.76)% |
Ratios to Average Net AssetsF,H | | | | |
Expenses before reductions | .25% | .25% | .25% | .25%A |
Expenses net of fee waivers, if any | .25% | .25% | .25% | .25%A |
Expenses net of all reductions | .25% | .25% | .25% | .25%A |
Net investment income (loss) | 1.82% | 1.76% | 2.44% | 1.59%A |
Supplemental Data | | | | |
Net assets, end of period (000 omitted) | $ 34 | $ 32 | $ 115 | $ 91 |
Portfolio turnover rate | 19% | 23% | 41% | 13%A |
A Annualized
B Total returns for periods of less than one year are not annualized.
C Total returns would have been lower if certain expenses had not been reduced during the applicable periods shown.
D Total returns do not include the effect of the sales charges.
E Calculated based on average shares outstanding during the period.
F Amounts do not include the activity of the underlying funds.
G For the period December 31, 2007 (commencement of operations) to July 31, 2008.
H Expense ratios reflect operating expenses of the class. Expenses before reductions do not reflect amounts reimbursed by the investment adviser or reductions from expense offset arrangements and do not represent the amount paid by the class during periods when reimbursements or reductions occur. Expenses net of fee waivers reflect expenses after reimbursement by the investment adviser but prior to reductions from expense offset arrangements. Expenses net of all reductions represent the net expenses paid by the class but do not include expenses of the investment companies in which the Fund invests.
See accompanying notes which are an integral part of the financial statements.
Annual Report
Financial Highlights - Class T
Years ended July 31, | 2011 | 2010 | 2009 | 2008G |
Selected Per-Share Data | | | | |
Net asset value, beginning of period | $ 43.01 | $ 38.96 | $ 45.26 | $ 50.00 |
Income from Investment Operations | | | | |
Net investment income (loss)E | .736 | .636 | .791 | .373 |
Net realized and unrealized gain (loss) | 5.326 | 4.191 | (6.111) | (4.809) |
Total from investment operations | 6.062 | 4.827 | (5.320) | (4.436) |
Distributions from net investment income | (.689) | (.612) | (.780) | (.304) |
Distributions from net realized gain | (.193) | (.165) | (.200) | - |
Total distributions | (.882) | (.777) | (.980) | (.304) |
Net asset value, end of period | $ 48.19 | $ 43.01 | $ 38.96 | $ 45.26 |
Total ReturnB,C,D | 14.15% | 12.43% | (11.45)% | (8.89)% |
Ratios to Average Net AssetsF,H | | | | |
Expenses before reductions | .50% | .50% | .50% | .50%A |
Expenses net of fee waivers, if any | .50% | .50% | .50% | .50%A |
Expenses net of all reductions | .50% | .50% | .50% | .50%A |
Net investment income (loss) | 1.57% | 1.50% | 2.20% | 1.34%A |
Supplemental Data | | | | |
Net assets, end of period (000 omitted) | $ 127 | $ 37 | $ 57 | $ 91 |
Portfolio turnover rate | 19% | 23% | 41% | 13%A |
A Annualized
B Total returns for periods of less than one year are not annualized.
C Total returns would have been lower if certain expenses had not been reduced during the applicable periods shown.
D Total returns do not include the effect of the sales charges.
E Calculated based on average shares outstanding during the period.
F Amounts do not include the activity of the underlying funds.
G For the period December 31, 2007 (commencement of operations) to July 31, 2008.
H Expense ratios reflect operating expenses of the class. Expenses before reductions do not reflect amounts reimbursed by the investment adviser or reductions from expense offset arrangements and do not represent the amount paid by the class during periods when reimbursements or reductions occur. Expenses net of fee waivers reflect expenses after reimbursement by the investment adviser but prior to reductions from expense offset arrangements. Expenses net of all reductions represent the net expenses paid by the class but do not include expenses of the investment companies in which the Fund invests.
Financial Highlights - Class C
Years ended July 31, | 2011 | 2010 | 2009 | 2008G |
Selected Per-Share Data | | | | |
Net asset value, beginning of period | $ 42.98 | $ 38.95 | $ 45.24 | $ 50.00 |
Income from Investment Operations | | | | |
Net investment income (loss)E | .505 | .424 | .611 | .233 |
Net realized and unrealized gain (loss) | 5.319 | 4.192 | (6.107) | (4.812) |
Total from investment operations | 5.824 | 4.616 | (5.496) | (4.579) |
Distributions from net investment income | (.441) | (.421) | (.594) | (.181) |
Distributions from net realized gain | (.193) | (.165) | (.200) | - |
Total distributions | (.634) | (.586) | (.794) | (.181) |
Net asset value, end of period | $ 48.17 | $ 42.98 | $ 38.95 | $ 45.24 |
Total ReturnB,C,D | 13.59% | 11.87% | (11.89)% | (9.17)% |
Ratios to Average Net AssetsF,H | | | | |
Expenses before reductions | 1.00% | 1.00% | 1.00% | 1.00%A |
Expenses net of fee waivers, if any | 1.00% | 1.00% | 1.00% | 1.00%A |
Expenses net of all reductions | 1.00% | 1.00% | 1.00% | 1.00%A |
Net investment income (loss) | 1.08% | 1.01% | 1.70% | .84%A |
Supplemental Data | | | | |
Net assets, end of period (000 omitted) | $ 72 | $ 91 | $ 57 | $ 91 |
Portfolio turnover rate | 19% | 23% | 41% | 13%A |
A Annualized
B Total returns for periods of less than one year are not annualized.
C Total returns would have been lower if certain expenses had not been reduced during the applicable periods shown.
D Total returns do not include the effect of the contingent deferred sales charge.
E Calculated based on average shares outstanding during the period.
F Amounts do not include the activity of the underlying funds.
G For the period December 31, 2007 (commencement of operations) to July 31, 2008.
H Expense ratios reflect operating expenses of the class. Expenses before reductions do not reflect amounts reimbursed by the investment adviser or reductions from expense offset arrangements and do not represent the amount paid by the class during periods when reimbursements or reductions occur. Expenses net of fee waivers reflect expenses after reimbursement by the investment adviser but prior to reductions from expense offset arrangements. Expenses net of all reductions represent the net expenses paid by the class but do not include expenses of the investment companies in which the Fund invests.
See accompanying notes which are an integral part of the financial statements.
Annual Report
Financial Highlights - Income Replacement 2038
Years ended July 31, | 2011 | 2010 | 2009 | 2008G |
Selected Per-Share Data | | | | |
Net asset value, beginning of period | $ 43.00 | $ 38.96 | $ 45.27 | $ 50.00 |
Income from Investment Operations | | | | |
Net investment income (loss)D | .969 | .849 | .965 | .502 |
Net realized and unrealized gain (loss) | 5.332 | 4.187 | (6.112) | (4.795) |
Total from investment operations | 6.301 | 5.036 | (5.147) | (4.293) |
Distributions from net investment income | (.918) | (.831) | (.963) | (.437) |
Distributions from net realized gain | (.193) | (.165) | (.200) | - |
Total distributions | (1.111) | (.996) | (1.163) | (.437) |
Net asset value, end of period | $ 48.19 | $ 43.00 | $ 38.96 | $ 45.27 |
Total ReturnB,C | 14.74% | 12.99% | (11.02)% | (8.61)% |
Ratios to Average Net AssetsE,H | | | | |
Expenses before reductionsF | .00% | .00% | .00% | .00%A |
Expenses net of fee waivers, if any | .00% | .00% | .00% | .00%A |
Expenses net of all reductions | .00% | .00% | .00% | .00%A |
Net investment income (loss) | 2.07% | 2.01% | 2.69% | 1.84%A |
Supplemental Data | | | | |
Net assets, end of period (000 omitted) | $ 1,345 | $ 2,051 | $ 1,165 | $ 1,122 |
Portfolio turnover rate | 19% | 23% | 41% | 13%A |
A Annualized
B Total returns for periods of less than one year are not annualized.
C Total returns would have been lower if certain expenses had not been reduced during the applicable periods shown.
D Calculated based on average shares outstanding during the period.
E Amounts do not include the activity of the underlying funds.
F Amount represents less than .01%.
G For the period December 31, 2007 (commencement of operations) to July 31, 2008.
H Expense ratios reflect operating expenses of the class. Expenses before reductions do not reflect amounts reimbursed by the investment adviser or reductions from expense offset arrangements and do not represent the amount paid by the class during periods when reimbursements or reductions occur. Expenses net of fee waivers reflect expenses after reimbursement by the investment adviser but prior to reductions from expense offset arrangements. Expenses net of all reductions represent the net expenses paid by the class but do not include expenses of the investment companies in which the Fund invests.
Financial Highlights - Institutional Class
Years ended July 31, | 2011 | 2010 | 2009 | 2008G |
Selected Per-Share Data | | | | |
Net asset value, beginning of period | $ 43.00 | $ 38.96 | $ 45.26 | $ 50.00 |
Income from Investment Operations | | | | |
Net investment income (loss)D | .973 | .848 | .974 | .511 |
Net realized and unrealized gain (loss) | 5.328 | 4.188 | (6.111) | (4.814) |
Total from investment operations | 6.301 | 5.036 | (5.137) | (4.303) |
Distributions from net investment income | (.918) | (.831) | (.963) | (.437) |
Distributions from net realized gain | (.193) | (.165) | (.200) | - |
Total distributions | (1.111) | (.996) | (1.163) | (.437) |
Net asset value, end of period | $ 48.19 | $ 43.00 | $ 38.96 | $ 45.26 |
Total ReturnB,C | 14.74% | 12.99% | (11.00)% | (8.63)% |
Ratios to Average Net AssetsE,H | | | | |
Expenses before reductionsF | .00% | .00% | .00% | .00%A |
Expenses net of fee waivers, if any | .00% | .00% | .00% | .00%A |
Expenses net of all reductions | .00% | .00% | .00% | .00%A |
Net investment income (loss) | 2.07% | 2.01% | 2.69% | 1.84%A |
Supplemental Data | | | | |
Net assets, end of period (000 omitted) | $ 29 | $ 38 | $ 58 | $ 91 |
Portfolio turnover rate | 19% | 23% | 41% | 13%A |
A Annualized
B Total returns for periods of less than one year are not annualized.
C Total returns would have been lower if certain expenses had not been reduced during the applicable periods shown.
D Calculated based on average shares outstanding during the period.
E Amounts do not include the activity of the underlying funds.
F Amount represents less than .01%.
G For the period December 31, 2007 (commencement of operations) to July 31, 2008.
H Expense ratios reflect operating expenses of the class. Expenses before reductions do not reflect amounts reimbursed by the investment adviser or reductions from expense offset arrangements and do not represent the amount paid by the class during periods when reimbursements or reductions occur. Expenses net of fee waivers reflect expenses after reimbursement by the investment adviser but prior to reductions from expense offset arrangements. Expenses net of all reductions represent the net expenses paid by the class but do not include expenses of the investment companies in which the Fund invests.
See accompanying notes which are an integral part of the financial statements.
Annual Report
Fidelity Income Replacement 2040 Fund
Investment Changes (Unaudited)
Fund Holdings as of July 31, 2011 |
| % of fund's
net assets | % of fund's net assets
6 months ago |
Domestic Equity Funds | | |
Fidelity Advisor Mid Cap II Fund Institutional Class | 5.9 | 6.0 |
Fidelity Disciplined Equity Fund | 6.2 | 6.3 |
Fidelity Equity-Income Fund | 6.1 | 6.3 |
Fidelity Large Cap Core Enhanced Index Fund | 10.0 | 10.1 |
Fidelity Series 100 Index Fund | 7.6 | 7.5 |
Fidelity Series Broad Market Opportunities Fund | 9.9 | 10.1 |
Fidelity Series Small Cap Opportunities Fund | 3.9 | 4.0 |
| 49.6 | 50.3 |
International Equity Funds | | |
Fidelity Advisor International Discovery Fund Institutional Class | 12.4 | 12.6 |
High Yield Fixed-Income Funds | | |
Fidelity Capital & Income Fund | 3.2 | 3.2 |
Fidelity Strategic Income Fund | 3.3 | 3.2 |
| 6.5 | 6.4 |
Investment Grade Fixed-Income Funds | | |
Fidelity Government Income Fund | 5.3 | 5.2 |
Fidelity Strategic Real Return Fund | 5.3 | 5.2 |
Fidelity Total Bond Fund | 15.9 | 15.7 |
| 26.5 | 26.1 |
Short-Term Funds | | |
Fidelity Institutional Money Market Portfolio Institutional Class | 2.5 | 2.3 |
Fidelity Short-Term Bond Fund | 2.5 | 2.3 |
| 5.0 | 4.6 |
Net Other Assets (Liabilities)* | 0.0 | 0.0 |
| 100.0 | 100.0 |
* Amount represents less than 0.1% |
Asset Allocation (% of fund's net assets) |
Current |
| Domestic Equity Funds | 49.6% | |
| International Equity Funds | 12.4% | |
| High Yield
Fixed-Income Funds | 6.5% | |
| Investment Grade Fixed-Income Funds | 26.5% | |
| Short-Term Funds | 5.0% | |

Six months ago |
| Domestic Equity Funds | 50.3% | |
| International Equity Funds | 12.6% | |
| High Yield
Fixed-Income Funds | 6.4% | |
| Investment Grade Fixed-Income Funds | 26.1% | |
| Short-Term Funds | 4.6% | |

Expected |
| Domestic Equity Funds | 49.6% | |
| International Equity Funds | 12.0% | |
| High Yield
Fixed-Income Funds | 6.2% | |
| Investment Grade Fixed-Income Funds | 26.3% | |
| Short-Term Funds | 5.9% | |

The fund invests according to an asset allocation strategy that becomes increasingly conservative over time. The six months ago allocation is based on the fund's holdings as of January 31, 2011. The current allocation is based on the fund's holdings as of July 31, 2011. The expected allocation represents the fund's anticipated allocation at January 31, 2012. |
Annual Report
Fidelity Income Replacement 2040 Fund
Investments July 31, 2011
Showing Percentage of Net Assets
Equity Funds - 62.0% |
| Shares | | Value |
Domestic Equity Funds - 49.6% |
Fidelity Advisor Mid Cap II Fund Institutional Class (a) | 7,020 | | $ 127,280 |
Fidelity Disciplined Equity Fund | 5,701 | | 132,715 |
Fidelity Equity-Income Fund | 2,950 | | 130,883 |
Fidelity Large Cap Core Enhanced Index Fund | 24,065 | | 215,864 |
Fidelity Series 100 Index Fund | 17,937 | | 162,333 |
Fidelity Series Broad Market Opportunities Fund | 20,636 | | 212,552 |
Fidelity Series Small Cap Opportunities Fund | 7,523 | | 84,413 |
TOTAL DOMESTIC EQUITY FUNDS | | 1,066,040 |
International Equity Funds - 12.4% |
Fidelity Advisor International Discovery Fund Institutional Class | 7,906 | | 265,877 |
TOTAL EQUITY FUNDS (Cost $1,197,286) | 1,331,917 |
Fixed-Income Funds - 33.0% |
| | | |
High Yield Fixed-Income Funds - 6.5% |
Fidelity Capital & Income Fund | 7,179 | | 68,705 |
Fidelity Strategic Income Fund | 6,211 | | 70,685 |
TOTAL HIGH YIELD FIXED-INCOME FUNDS | | 139,390 |
|
| Shares | | Value |
Investment Grade Fixed-Income Funds - 26.5% |
Fidelity Government Income Fund | 10,696 | | $ 114,230 |
Fidelity Strategic Real Return Fund | 11,457 | | 113,878 |
Fidelity Total Bond Fund | 31,110 | | 342,525 |
TOTAL INVESTMENT GRADE FIXED-INCOME FUNDS | | 570,633 |
TOTAL FIXED-INCOME FUNDS (Cost $678,608) | 710,023 |
Short-Term Funds - 5.0% |
| | | |
Fidelity Institutional Money Market Portfolio Institutional Class | 54,026 | | 54,026 |
Fidelity Short-Term Bond Fund | 6,366 | | 54,367 |
TOTAL SHORT-TERM FUNDS (Cost $107,704) | 108,393 |
TOTAL INVESTMENT PORTFOLIO - 100.0% (Cost $1,983,598) | | 2,150,333 |
NET OTHER ASSETS (LIABILITIES) - 0.0% | | (104) |
NET ASSETS - 100% | $ 2,150,229 |
Legend |
(a) Non-income producing |
Other Information |
All investments are categorized as Level 1 under the Fair Value Hierarchy. The inputs or methodology used for valuing securities may not be an indication of the risk associated with investing in those securities. For more information on valuation inputs, please refer to the Security Valuation section in the accompanying Notes to Financial Statements. |
Income Tax Information |
At July 31, 2011, the Fund had a capital loss carryforward of approximately $169,960 of which $763, $152,507 and $16,690 will expire in fiscal 2017, 2018 and 2019, respectively. Capital loss carryforwards are only available to offset future capital gains of the Fund to the extent provided by regulations and may be limited. |
See accompanying notes which are an integral part of the financial statements.
Annual Report
Fidelity Income Replacement 2040 Fund
Statement of Assets and Liabilities
| July 31, 2011 |
| | |
Assets | | |
Investment in securities, at value (cost $1,983,598) - See accompanying schedule | | $ 2,150,333 |
Cash | | 39 |
Receivable for fund shares sold | | 1,283 |
Total assets | | 2,151,655 |
| | |
Liabilities | | |
Payable for investments purchased | $ 1,284 | |
Distribution and service plan fees payable | 142 | |
Total liabilities | | 1,426 |
| | |
Net Assets | | $ 2,150,229 |
Net Assets consist of: | | |
Paid in capital | | $ 2,178,799 |
Undistributed net investment income | | 368 |
Accumulated undistributed net realized gain (loss) on investments | | (195,673) |
Net unrealized appreciation (depreciation) on investments | | 166,735 |
Net Assets | | $ 2,150,229 |
| | |
Calculation of Maximum Offering Price Class A:
Net Asset Value and redemption price per share ($95,688 ÷ 1,975.33 shares) | | $ 48.44 |
| | |
Maximum offering price per share (100/94.25 of $48.44) | | $ 51.40 |
| | |
Class T:
Net Asset Value and redemption price per share ($130,505 ÷ 2,694.83 shares) | | $ 48.43 |
| | |
Maximum offering price per share (100/96.50 of $48.43) | | $ 50.19 |
| | |
Class C:
Net Asset Value and offering price per share ($79,231 ÷ 1,636.47 shares)A | | $ 48.42 |
| | |
Income Replacement 2040:
Net Asset Value, offering price and redemption price per share ($1,796,972 ÷ 37,110.08 shares) | | $ 48.42 |
| | |
Institutional Class:
Net Asset Value, offering price and redemption price per share ($47,833 ÷ 987.76 shares) | | $ 48.43 |
A Redemption price per share is equal to net asset value less any applicable contingent deferred sales charge.
Statement of Operations
| Year ended July 31, 2011 |
| | |
Investment Income | | |
Income distributions from underlying funds | | $ 36,024 |
| | |
Expenses | | |
Distribution and service plan fees | $ 1,635 | |
Independent trustees' compensation | 7 | |
Total expenses before reductions | 1,642 | |
Expense reductions | (7) | 1,635 |
Net investment income (loss) | | 34,389 |
Realized and Unrealized Gain (Loss) Realized gain (loss) on sale of underlying fund shares | 69,601 | |
Capital gain distributions from underlying funds | 9,917 | |
Total net realized gain (loss) | | 79,518 |
Change in net unrealized appreciation (depreciation) on underlying funds | | 119,745 |
Net gain (loss) | | 199,263 |
Net increase (decrease) in net assets resulting from operations | | $ 233,652 |
See accompanying notes which are an integral part of the financial statements.
Annual Report
Statement of Changes in Net Assets
| Year ended
July 31, 2011 | Year ended
July 31, 2010 |
Increase (Decrease) in Net Assets | | |
Operations | | |
Net investment income (loss) | $ 34,389 | $ 23,376 |
Net realized gain (loss) | 79,518 | (127,348) |
Change in net unrealized appreciation (depreciation) | 119,745 | 184,622 |
Net increase (decrease) in net assets resulting from operations | 233,652 | 80,650 |
Distributions to shareholders from net investment income | (34,374) | (23,219) |
Distributions to shareholders from net realized gain | (7,263) | (2,847) |
Total distributions | (41,637) | (26,066) |
Share transactions - net increase (decrease) | 390,065 | 856,629 |
Total increase (decrease) in net assets | 582,080 | 911,213 |
| | |
Net Assets | | |
Beginning of period | 1,568,149 | 656,936 |
End of period (including undistributed net investment income of $368 and undistributed net investment income of $385, respectively) | $ 2,150,229 | $ 1,568,149 |
Financial Highlights - Class A
Years ended July 31, | 2011 | 2010 | 2009 | 2008G |
Selected Per-Share Data | | | | |
Net asset value, beginning of period | $ 43.04 | $ 38.83 | $ 45.23 | $ 50.00 |
Income from Investment Operations | | | | |
Net investment income (loss)E | .789 | .722 | .933 | .442 |
Net realized and unrealized gain (loss) | 5.608 | 4.298 | (6.238) | (4.814) |
Total from investment operations | 6.397 | 5.020 | (5.305) | (4.372) |
Distributions from net investment income | (.805) | (.710) | (.885) | (.398) |
Distributions from net realized gain | (.192) | (.100) | (.210) | - |
Total distributions | (.997) | (.810) | (1.095) | (.398) |
Net asset value, end of period | $ 48.44 | $ 43.04 | $ 38.83 | $ 45.23 |
Total ReturnB,C,D | 14.94% | 12.97% | (11.41)% | (8.77)% |
Ratios to Average Net AssetsF,H | | | | |
Expenses before reductions | .25% | .25% | .25% | .25%A |
Expenses net of fee waivers, if any | .25% | .25% | .25% | .25%A |
Expenses net of all reductions | .25% | .25% | .25% | .25%A |
Net investment income (loss) | 1.67% | 1.70% | 2.60% | 1.60%A |
Supplemental Data | | | | |
Net assets, end of period (000 omitted) | $ 96 | $ 34 | $ 57 | $ 91 |
Portfolio turnover rate | 75% | 129% | 50% | 4%A |
A Annualized
B Total returns for periods of less than one year are not annualized.
C Total returns would have been lower if certain expenses had not been reduced during the applicable periods shown.
D Total returns do not include the effect of the sales charges.
E Calculated based on average shares outstanding during the period.
F Amounts do not include the activity of the underlying funds.
G For the period December 31, 2007 (commencement of operations) to July 31, 2008.
H Expense ratios reflect operating expenses of the class. Expenses before reductions do not reflect amounts reimbursed by the investment adviser or reductions from expense offset arrangements and do not represent the amount paid by the class during periods when reimbursements or reductions occur. Expenses net of fee waivers reflect expenses after reimbursement by the investment adviser but prior to reductions from expense offset arrangements. Expenses net of all reductions represent the net expenses paid by the class but do not include expenses of the investment companies in which the Fund invests.
See accompanying notes which are an integral part of the financial statements.
Annual Report
Financial Highlights - Class T
Years ended July 31, | 2011 | 2010 | 2009 | 2008G |
Selected Per-Share Data | | | | |
Net asset value, beginning of period | $ 43.05 | $ 38.84 | $ 45.23 | $ 50.00 |
Income from Investment Operations | | | | |
Net investment income (loss)E | .672 | .616 | .836 | .371 |
Net realized and unrealized gain (loss) | 5.604 | 4.301 | (6.227) | (4.809) |
Total from investment operations | 6.276 | 4.917 | (5.391) | (4.438) |
Distributions from net investment income | (.704) | (.607) | (.789) | (.332) |
Distributions from net realized gain | (.192) | (.100) | (.210) | - |
Total distributions | (.896) | (.707) | (.999) | (.332) |
Net asset value, end of period | $ 48.43 | $ 43.05 | $ 38.84 | $ 45.23 |
Total ReturnB,C,D | 14.64% | 12.69% | (11.62)% | (8.90)% |
Ratios to Average Net AssetsF,H | | | | |
Expenses before reductions | .50% | .50% | .50% | .50%A |
Expenses net of fee waivers, if any | .50% | .50% | .50% | .50%A |
Expenses net of all reductions | .50% | .50% | .50% | .50%A |
Net investment income (loss) | 1.42% | 1.45% | 2.35% | 1.35%A |
Supplemental Data | | | | |
Net assets, end of period (000 omitted) | $ 131 | $ 111 | $ 102 | $ 132 |
Portfolio turnover rate | 75% | 129% | 50% | 4%A |
A Annualized
B Total returns for periods of less than one year are not annualized.
C Total returns would have been lower if certain expenses had not been reduced during the applicable periods shown.
D Total returns do not include the effect of the sales charges.
E Calculated based on average shares outstanding during the period.
F Amounts do not include the activity of the underlying funds.
G For the period December 31, 2007 (commencement of operations) to July 31, 2008.
H Expense ratios reflect operating expenses of the class. Expenses before reductions do not reflect amounts reimbursed by the investment adviser or reductions from expense offset arrangements and do not represent the amount paid by the class during periods when reimbursements or reductions occur. Expenses net of fee waivers reflect expenses after reimbursement by the investment adviser but prior to reductions from expense offset arrangements. Expenses net of all reductions represent the net expenses paid by the class but do not include expenses of the investment companies in which the Fund invests.
Financial Highlights - Class C
Years ended July 31, | 2011 | 2010 | 2009 | 2008G |
Selected Per-Share Data | | | | |
Net asset value, beginning of period | $ 43.05 | $ 38.84 | $ 45.22 | $ 50.00 |
Income from Investment Operations | | | | |
Net investment income (loss)E | .435 | .402 | .664 | .234 |
Net realized and unrealized gain (loss) | 5.609 | 4.305 | (6.229) | (4.816) |
Total from investment operations | 6.044 | 4.707 | (5.565) | (4.582) |
Distributions from net investment income | (.482) | (.397) | (.605) | (.198) |
Distributions from net realized gain | (.192) | (.100) | (.210) | - |
Total distributions | (.674) | (.497) | (.815) | (.198) |
Net asset value, end of period | $ 48.42 | $ 43.05 | $ 38.84 | $ 45.22 |
Total ReturnB,C,D | 14.08% | 12.13% | (12.06)% | (9.18)% |
Ratios to Average Net AssetsF,H | | | | |
Expenses before reductions | 1.00% | 1.00% | 1.00% | 1.00%A |
Expenses net of fee waivers, if any | 1.00% | 1.00% | 1.00% | 1.00%A |
Expenses net of all reductions | 1.00% | 1.00% | 1.00% | 1.00%A |
Net investment income (loss) | .93% | .95% | 1.85% | .84%A |
Supplemental Data | | | | |
Net assets, end of period (000 omitted) | $ 79 | $ 99 | $ 57 | $ 91 |
Portfolio turnover rate | 75% | 129% | 50% | 4%A |
A Annualized
B Total returns for periods of less than one year are not annualized.
C Total returns would have been lower if certain expenses had not been reduced during the applicable periods shown.
D Total returns do not include the effect of the contingent deferred sales charge.
E Calculated based on average shares outstanding during the period.
F Amounts do not include the activity of the underlying funds.
G For the period December 31, 2007 (commencement of operations) to July 31, 2008.
H Expense ratios reflect operating expenses of the class. Expenses before reductions do not reflect amounts reimbursed by the investment adviser or reductions from expense offset arrangements and do not represent the amount paid by the class during periods when reimbursements or reductions occur. Expenses net of fee waivers reflect expenses after reimbursement by the investment adviser but prior to reductions from expense offset arrangements. Expenses net of all reductions represent the net expenses paid by the class but do not include expenses of the investment companies in which the Fund invests.
See accompanying notes which are an integral part of the financial statements.
Annual Report
Financial Highlights - Income Replacement 2040
Years ended July 31, | 2011 | 2010 | 2009 | 2008G |
Selected Per-Share Data | | | | |
Net asset value, beginning of period | $ 43.04 | $ 38.83 | $ 45.23 | $ 50.00 |
Income from Investment Operations | | | | |
Net investment income (loss)D | .910 | .833 | 1.015 | .504 |
Net realized and unrealized gain (loss) | 5.602 | 4.297 | (6.231) | (4.810) |
Total from investment operations | 6.512 | 5.130 | (5.216) | (4.306) |
Distributions from net investment income | (.940) | (.820) | (.974) | (.464) |
Distributions from net realized gain | (.192) | (.100) | (.210) | - |
Total distributions | (1.132) | (.920) | (1.184) | (.464) |
Net asset value, end of period | $ 48.42 | $ 43.04 | $ 38.83 | $ 45.23 |
Total ReturnB,C | 15.21% | 13.26% | (11.19)% | (8.64)% |
Ratios to Average Net AssetsE,H | | | | |
Expenses before reductionsF | .00% | .00% | .00% | .00%A |
Expenses net of fee waivers, if any | .00% | .00% | .00% | .00%A |
Expenses net of all reductions | .00% | .00% | .00% | .00%A |
Net investment income (loss) | 1.93% | 1.96% | 2.85% | 1.85%A |
Supplemental Data | | | | |
Net assets, end of period (000 omitted) | $ 1,797 | $ 1,262 | $ 384 | $ 598 |
Portfolio turnover rate | 75% | 129% | 50% | 4%A |
A Annualized
B Total returns for periods of less than one year are not annualized.
C Total returns would have been lower if certain expenses had not been reduced during the applicable periods shown.
D Calculated based on average shares outstanding during the period.
E Amounts do not include the activity of the underlying funds.
F Amount represents less than .01%.
G For the period December 31, 2007 (commencement of operations) to July 31, 2008.
H Expense ratios reflect operating expenses of the class. Expenses before reductions do not reflect amounts reimbursed by the investment adviser or reductions from expense offset arrangements and do not represent the amount paid by the class during periods when reimbursements or reductions occur. Expenses net of fee waivers reflect expenses after reimbursement by the investment adviser but prior to reductions from expense offset arrangements. Expenses net of all reductions represent the net expenses paid by the class but do not include expenses of the investment companies in which the Fund invests.
Financial Highlights - Institutional Class
Years ended July 31, | 2011 | 2010 | 2009 | 2008G |
Selected Per-Share Data | | | | |
Net asset value, beginning of period | $ 43.04 | $ 38.83 | $ 45.23 | $ 50.00 |
Income from Investment Operations | | | | |
Net investment income (loss)D | .906 | .828 | 1.022 | .512 |
Net realized and unrealized gain (loss) | 5.616 | 4.302 | (6.238) | (4.818) |
Total from investment operations | 6.522 | 5.130 | (5.216) | (4.306) |
Distributions from net investment income | (.940) | (.820) | (.974) | (.464) |
Distributions from net realized gain | (.192) | (.100) | (.210) | - |
Total distributions | (1.132) | (.920) | (1.184) | (.464) |
Net asset value, end of period | $ 48.43 | $ 43.04 | $ 38.83 | $ 45.23 |
Total ReturnB,C | 15.24% | 13.26% | (11.19)% | (8.64)% |
Ratios to Average Net AssetsE,H | | | | |
Expenses before reductionsF | .00% | .00% | .00% | .00%A |
Expenses net of fee waivers, if any | .00% | .00% | .00% | .00%A |
Expenses net of all reductions | .00% | .00% | .00% | .00%A |
Net investment income (loss) | 1.93% | 1.96% | 2.85% | 1.85%A |
Supplemental Data | | | | |
Net assets, end of period (000 omitted) | $ 48 | $ 62 | $ 57 | $ 91 |
Portfolio turnover rate | 75% | 129% | 50% | 4%A |
A Annualized
B Total returns for periods of less than one year are not annualized.
C Total returns would have been lower if certain expenses had not been reduced during the applicable periods shown.
D Calculated based on average shares outstanding during the period.
E Amounts do not include the activity of the underlying funds.
F Amount represents less than .01%.
G For the period December 31, 2007 (commencement of operations) to July 31, 2008.
H Expense ratios reflect operating expenses of the class. Expenses before reductions do not reflect amounts reimbursed by the investment adviser or reductions from expense offset arrangements and do not represent the amount paid by the class during periods when reimbursements or reductions occur. Expenses net of fee waivers reflect expenses after reimbursement by the investment adviser but prior to reductions from expense offset arrangements. Expenses net of all reductions represent the net expenses paid by the class but do not include expenses of the investment companies in which the Fund invests.
See accompanying notes which are an integral part of the financial statements.
Annual Report
Fidelity Income Replacement 2042 Fund
Investment Changes (Unaudited)
Fund Holdings as of July 31, 2011 |
| % of fund's
net assets | % of fund's net assets
6 months ago |
Domestic Equity Funds | | |
Fidelity Advisor Mid Cap II Fund Institutional Class | 6.1 | 6.1 |
Fidelity Disciplined Equity Fund | 6.3 | 6.4 |
Fidelity Equity-Income Fund | 6.2 | 6.4 |
Fidelity Large Cap Core Enhanced Index Fund | 10.3 | 10.2 |
Fidelity Series 100 Index Fund | 7.7 | 7.7 |
Fidelity Series Broad Market Opportunities Fund | 10.1 | 10.3 |
Fidelity Series Small Cap Opportunities Fund | 4.0 | 4.1 |
| 50.7 | 51.2 |
International Equity Funds | | |
Fidelity Advisor International Discovery Fund Institutional Class | 12.8 | 12.8 |
High Yield Fixed-Income Funds | | |
Fidelity Capital & Income Fund | 3.3 | 3.3 |
Fidelity Strategic Income Fund | 3.4 | 3.4 |
| 6.7 | 6.7 |
Investment Grade Fixed-Income Funds | | |
Fidelity Government Income Fund | 5.3 | 5.2 |
Fidelity Strategic Real Return Fund | 5.2 | 5.2 |
Fidelity Total Bond Fund | 15.8 | 15.6 |
| 26.3 | 26.0 |
Short-Term Funds | | |
Fidelity Institutional Money Market Portfolio Institutional Class | 1.7 | 1.7 |
Fidelity Short-Term Bond Fund | 1.8 | 1.6 |
| 3.5 | 3.3 |
Net Other Assets (Liabilities)* | 0.0 | 0.0 |
| 100.0 | 100.0 |
* Amount represents less than 0.1% |
Asset Allocation (% of fund's net assets) |
Current |
| Domestic Equity Funds | 50.7% | |
| International Equity Funds | 12.8% | |
| High Yield
Fixed-Income Funds | 6.7% | |
| Investment Grade Fixed-Income Funds | 26.3% | |
| Short-Term Funds | 3.5% | |

Six months ago |
| Domestic Equity Funds | 51.2% | |
| International Equity Funds | 12.8% | |
| High Yield
Fixed-Income Funds | 6.7% | |
| Investment Grade Fixed-Income Funds | 26.0% | |
| Short-Term Funds | 3.3% | |

Expected |
| Domestic Equity Funds | 50.8% | |
| International Equity Funds | 12.7% | |
| High Yield
Fixed-Income Funds | 6.6% | |
| Investment Grade Fixed-Income Funds | 26.0% | |
| Short-Term Funds | 3.9% | |

The fund invests according to an asset allocation strategy that becomes increasingly conservative over time. The six months ago allocation is based on the fund's holdings as of January 31, 2011. The current allocation is based on the fund's holdings as of July 31, 2011. The expected allocation represents the fund's anticipated allocation at January 31, 2012. |
Annual Report
Fidelity Income Replacement 2042 Fund
Investments July 31, 2011
Showing Percentage of Net Assets
Equity Funds - 63.5% |
| Shares | | Value |
Domestic Equity Funds - 50.7% |
Fidelity Advisor Mid Cap II Fund Institutional Class (a) | 18,843 | | $ 341,629 |
Fidelity Disciplined Equity Fund | 15,278 | | 355,681 |
Fidelity Equity-Income Fund | 7,911 | | 350,917 |
Fidelity Large Cap Core Enhanced Index Fund | 64,446 | | 578,082 |
Fidelity Series 100 Index Fund | 48,029 | | 434,666 |
Fidelity Series Broad Market Opportunities Fund | 55,337 | | 569,967 |
Fidelity Series Small Cap Opportunities Fund | 20,139 | | 225,955 |
TOTAL DOMESTIC EQUITY FUNDS | | 2,856,897 |
International Equity Funds - 12.8% |
Fidelity Advisor International Discovery Fund Institutional Class | 21,321 | | 717,015 |
TOTAL EQUITY FUNDS (Cost $3,179,587) | 3,573,912 |
Fixed-Income Funds - 33.0% |
| | | |
High Yield Fixed-Income Funds - 6.7% |
Fidelity Capital & Income Fund | 19,642 | | 187,976 |
Fidelity Strategic Income Fund | 17,004 | | 193,500 |
TOTAL HIGH YIELD FIXED-INCOME FUNDS | | 381,476 |
|
| Shares | | Value |
Investment Grade Fixed-Income Funds - 26.3% |
Fidelity Government Income Fund | 27,780 | | $ 296,692 |
Fidelity Strategic Real Return Fund | 29,764 | | 295,859 |
Fidelity Total Bond Fund | 80,599 | | 887,400 |
TOTAL INVESTMENT GRADE FIXED-INCOME FUNDS | | 1,479,951 |
TOTAL FIXED-INCOME FUNDS (Cost $1,738,420) | 1,861,427 |
Short-Term Funds - 3.5% |
| | | |
Fidelity Institutional Money Market Portfolio Institutional Class | 98,196 | | 98,196 |
Fidelity Short-Term Bond Fund | 11,572 | | 98,828 |
TOTAL SHORT-TERM FUNDS (Cost $195,233) | 197,024 |
TOTAL INVESTMENT PORTFOLIO - 100.0% (Cost $5,113,240) | | 5,632,363 |
NET OTHER ASSETS (LIABILITIES) - 0.0% | | 2 |
NET ASSETS - 100% | $ 5,632,365 |
Legend |
(a) Non-income producing |
Other Information |
All investments are categorized as Level 1 under the Fair Value Hierarchy. The inputs or methodology used for valuing securities may not be an indication of the risk associated with investing in those securities. For more information on valuation inputs, please refer to the Security Valuation section in the accompanying Notes to Financial Statements. |
Income Tax Information |
At July 31, 2011, the Fund had a capital loss carryforward of approximately $51,392 of which $2,106, $15,348 and $33,938 will expire in fiscal 2017, 2018 and 2019, respectively. Capital loss carryforwards are only available to offset future capital gains of the Fund to the extent provided by regulations and may be limited. |
See accompanying notes which are an integral part of the financial statements.
Annual Report
Fidelity Income Replacement 2042 Fund
Statement of Assets and Liabilities
| July 31, 2011 |
| | |
Assets | | |
Investment in securities, at value (cost $5,113,240) - See accompanying schedule | | $ 5,632,363 |
Cash | | 40 |
Receivable for fund shares sold | | 3,001 |
Total assets | | 5,635,404 |
| | |
Liabilities | | |
Payable for investments purchased | $ 2,996 | |
Distribution and service plan fees payable | 43 | |
Total liabilities | | 3,039 |
| | |
Net Assets | | $ 5,632,365 |
Net Assets consist of: | | |
Paid in capital | | $ 5,219,431 |
Undistributed net investment income | | 1,108 |
Accumulated undistributed net realized gain (loss) on investments | | (107,297) |
Net unrealized appreciation (depreciation) on investments | | 519,123 |
Net Assets | | $ 5,632,365 |
| | |
Calculation of Maximum Offering Price Class A:
Net Asset Value and redemption price per share ($22,593 ÷ 465.62 shares) | | $ 48.52 |
| | |
Maximum offering price per share (100/94.25 of $48.52) | | $ 51.48 |
| | |
Class T:
Net Asset Value and redemption price per share ($28,600 ÷ 589.33 shares) | | $ 48.53 |
| | |
Maximum offering price per share (100/96.50 of $48.53) | | $ 50.29 |
| | |
Class C:
Net Asset Value and offering price per share ($28,082 ÷ 578.73 shares)A | | $ 48.52 |
| | |
Income Replacement 2042:
Net Asset Value, offering price and redemption price per share ($5,523,957 ÷ 113,874.34 shares) | | $ 48.51 |
| | |
Institutional Class:
Net Asset Value, offering price and redemption price per share ($29,133 ÷ 600.60 shares) | | $ 48.51 |
A Redemption price per share is equal to net asset value less any applicable contingent deferred sales charge.
Statement of Operations
| Year ended July 31, 2011 |
| | |
Investment Income | | |
Income distributions from underlying funds | | $ 84,817 |
| | |
Expenses | | |
Distribution and service plan fees | $ 560 | |
Independent trustees' compensation | 16 | |
Total expenses before reductions | 576 | |
Expense reductions | (16) | 560 |
Net investment income (loss) | | 84,257 |
Realized and Unrealized Gain (Loss) Realized gain (loss) on sale of underlying fund shares | (38,325) | |
Capital gain distributions from underlying funds | 21,921 | |
Total net realized gain (loss) | | (16,404) |
Change in net unrealized appreciation (depreciation) on underlying funds | | 478,706 |
Net gain (loss) | | 462,302 |
Net increase (decrease) in net assets resulting from operations | | $ 546,559 |
See accompanying notes which are an integral part of the financial statements.
Annual Report
Fidelity Income Replacement 2042 Fund
Financial Statements - continued
Statement of Changes in Net Assets
| Year ended
July 31, 2011 | Year ended
July 31, 2010 |
Increase (Decrease) in Net Assets | | |
Operations | | |
Net investment income (loss) | $ 84,257 | $ 58,360 |
Net realized gain (loss) | (16,404) | (3,503) |
Change in net unrealized appreciation (depreciation) | 478,706 | 231,761 |
Net increase (decrease) in net assets resulting from operations | 546,559 | 286,618 |
Distributions to shareholders from net investment income | (84,042) | (57,943) |
Distributions to shareholders from net realized gain | (15,604) | (7,508) |
Total distributions | (99,646) | (65,451) |
Share transactions - net increase (decrease) | 1,650,368 | 1,660,037 |
Total increase (decrease) in net assets | 2,097,281 | 1,881,204 |
| | |
Net Assets | | |
Beginning of period | 3,535,084 | 1,653,880 |
End of period (including undistributed net investment income of $1,108 and undistributed net investment income of $933, respectively) | $ 5,632,365 | $ 3,535,084 |
Financial Highlights - Class A
Years ended July 31, | 2011 | 2010 | 2009 | 2008G |
Selected Per-Share Data | | | | |
Net asset value, beginning of period | $ 43.04 | $ 38.83 | $ 45.20 | $ 50.00 |
Income from Investment Operations | | | | |
Net investment income (loss)E | .757 | .747 | .819 | .425 |
Net realized and unrealized gain (loss) | 5.719 | 4.285 | (6.123) | (4.836) |
Total from investment operations | 6.476 | 5.032 | (5.304) | (4.411) |
Distributions from net investment income | (.801) | (.717) | (.866) | (.389) |
Distributions from net realized gain | (.195) | (.105) | (.200) | - |
Total distributions | (.996) | (.822) | (1.066) | (.389) |
Net asset value, end of period | $ 48.52 | $ 43.04 | $ 38.83 | $ 45.20 |
Total ReturnB,C,D | 15.12% | 13.00% | (11.40)% | (8.85)% |
Ratios to Average Net AssetsF,H | | | | |
Expenses before reductions | .25% | .25% | .25% | .25%A |
Expenses net of fee waivers, if any | .25% | .25% | .25% | .25%A |
Expenses net of all reductions | .25% | .25% | .25% | .25%A |
Net investment income (loss) | 1.61% | 1.77% | 2.32% | 1.57%A |
Supplemental Data | | | | |
Net assets, end of period (000 omitted) | $ 23 | $ 29 | $ 88 | $ 91 |
Portfolio turnover rate | 15% | 20% | 37% | 8%A |
A Annualized
B Total returns for periods of less than one year are not annualized.
C Total returns would have been lower if certain expenses had not been reduced during the applicable periods shown.
D Total returns do not include the effect of the sales charges.
E Calculated based on average shares outstanding during the period.
F Amounts do not include the activity of the underlying funds.
G For the period December 31, 2007 (commencement of operations) to July 31, 2008.
H Expense ratios reflect operating expenses of the class. Expenses before reductions do not reflect amounts reimbursed by the investment adviser or reductions from expense offset arrangements and do not represent the amount paid by the class during periods when reimbursements or reductions occur. Expenses net of fee waivers reflect expenses after reimbursement by the investment adviser but prior to reductions from expense offset arrangements. Expenses net of all reductions represent the net expenses paid by the class but do not include expenses of the investment companies in which the Fund invests.
See accompanying notes which are an integral part of the financial statements.
Annual Report
Financial Highlights - Class T
Years ended July 31, | 2011 | 2010 | 2009 | 2008G |
Selected Per-Share Data | | | | |
Net asset value, beginning of period | $ 43.04 | $ 38.83 | $ 45.19 | $ 50.00 |
Income from Investment Operations | | | | |
Net investment income (loss)E | .637 | .642 | .739 | .365 |
Net realized and unrealized gain (loss) | 5.727 | 4.281 | (6.128) | (4.852) |
Total from investment operations | 6.364 | 4.923 | (5.389) | (4.487) |
Distributions from net investment income | (.679) | (.608) | (.771) | (.323) |
Distributions from net realized gain | (.195) | (.105) | (.200) | - |
Total distributions | (.874) | (.713) | (.971) | (.323) |
Net asset value, end of period | $ 48.53 | $ 43.04 | $ 38.83 | $ 45.19 |
Total ReturnB,C,D | 14.85% | 12.71% | (11.62)% | (9.00)% |
Ratios to Average Net AssetsF,H | | | | |
Expenses before reductions | .50% | .50% | .50% | .50%A |
Expenses net of fee waivers, if any | .50% | .50% | .50% | .50%A |
Expenses net of all reductions | .50% | .50% | .50% | .50%A |
Net investment income (loss) | 1.35% | 1.52% | 2.07% | 1.32%A |
Supplemental Data | | | | |
Net assets, end of period (000 omitted) | $ 29 | $ 37 | $ 57 | $ 91 |
Portfolio turnover rate | 15% | 20% | 37% | 8%A |
A Annualized
B Total returns for periods of less than one year are not annualized.
C Total returns would have been lower if certain expenses had not been reduced during the applicable periods shown.
D Total returns do not include the effect of the sales charges.
E Calculated based on average shares outstanding during the period.
F Amounts do not include the activity of the underlying funds.
G For the period December 31, 2007 (commencement of operations) to July 31, 2008.
H Expense ratios reflect operating expenses of the class. Expenses before reductions do not reflect amounts reimbursed by the investment adviser or reductions from expense offset arrangements and do not represent the amount paid by the class during periods when reimbursements or reductions occur. Expenses net of fee waivers reflect expenses after reimbursement by the investment adviser but prior to reductions from expense offset arrangements. Expenses net of all reductions represent the net expenses paid by the class but do not include expenses of the investment companies in which the Fund invests.
Financial Highlights - Class C
Years ended July 31, | 2011 | 2010 | 2009 | 2008G |
Selected Per-Share Data | | | | |
Net asset value, beginning of period | $ 43.05 | $ 38.84 | $ 45.19 | $ 50.00 |
Income from Investment Operations | | | | |
Net investment income (loss)E | .402 | .430 | .560 | .226 |
Net realized and unrealized gain (loss) | 5.719 | 4.275 | (6.123) | (4.846) |
Total from investment operations | 6.121 | 4.705 | (5.563) | (4.620) |
Distributions from net investment income | (.456) | (.390) | (.587) | (.190) |
Distributions from net realized gain | (.195) | (.105) | (.200) | - |
Total distributions | (.651) | (.495) | (.787) | (.190) |
Net asset value, end of period | $ 48.52 | $ 43.05 | $ 38.84 | $ 45.19 |
Total ReturnB,C,D | 14.26% | 12.12% | (12.05)% | (9.25)% |
Ratios to Average Net AssetsF,H | | | | |
Expenses before reductions | 1.00% | 1.00% | 1.00% | 1.00%A |
Expenses net of fee waivers, if any | 1.00% | 1.00% | 1.00% | 1.00%A |
Expenses net of all reductions | 1.00% | 1.00% | 1.00% | 1.00%A |
Net investment income (loss) | .85% | 1.02% | 1.57% | .82%A |
Supplemental Data | | | | |
Net assets, end of period (000 omitted) | $ 28 | $ 37 | $ 56 | $ 91 |
Portfolio turnover rate | 15% | 20% | 37% | 8%A |
A Annualized
B Total returns for periods of less than one year are not annualized.
C Total returns would have been lower if certain expenses had not been reduced during the applicable periods shown.
D Total returns do not include the effect of the contingent deferred sales charge.
E Calculated based on average shares outstanding during the period.
F Amounts do not include the activity of the underlying funds.
G For the period December 31, 2007 (commencement of operations) to July 31, 2008.
H Expense ratios reflect operating expenses of the class. Expenses before reductions do not reflect amounts reimbursed by the investment adviser or reductions from expense offset arrangements and do not represent the amount paid by the class during periods when reimbursements or reductions occur. Expenses net of fee waivers reflect expenses after reimbursement by the investment adviser but prior to reductions from expense offset arrangements. Expenses net of all reductions represent the net expenses paid by the class but do not include expenses of the investment companies in which the Fund invests.
See accompanying notes which are an integral part of the financial statements.
Annual Report
Financial Highlights - Income Replacement 2042
Years ended July 31, | 2011 | 2010 | 2009 | 2008G |
Selected Per-Share Data | | | | |
Net asset value, beginning of period | $ 43.03 | $ 38.83 | $ 45.20 | $ 50.00 |
Income from Investment Operations | | | | |
Net investment income (loss)D | .880 | .857 | .900 | .496 |
Net realized and unrealized gain (loss) | 5.719 | 4.279 | (6.114) | (4.840) |
Total from investment operations | 6.599 | 5.136 | (5.214) | (4.344) |
Distributions from net investment income | (.924) | (.831) | (.956) | (.456) |
Distributions from net realized gain | (.195) | (.105) | (.200) | - |
Total distributions | (1.119) | (.936) | (1.156) | (.456) |
Net asset value, end of period | $ 48.51 | $ 43.03 | $ 38.83 | $ 45.20 |
Total ReturnB,C | 15.42% | 13.27% | (11.18)% | (8.72)% |
Ratios to Average Net AssetsE,H | | | | |
Expenses before reductionsF | .00% | .00% | .00% | .00%A |
Expenses net of fee waivers, if any | .00% | .00% | .00% | .00%A |
Expenses net of all reductions | .00% | .00% | .00% | .00%A |
Net investment income (loss) | 1.86% | 2.02% | 2.57% | 1.82%A |
Supplemental Data | | | | |
Net assets, end of period (000 omitted) | $ 5,524 | $ 3,395 | $ 1,395 | $ 969 |
Portfolio turnover rate | 15% | 20% | 37% | 8%A |
A Annualized
B Total returns for periods of less than one year are not annualized.
C Total returns would have been lower if certain expenses had not been reduced during the applicable periods shown.
D Calculated based on average shares outstanding during the period.
E Amounts do not include the activity of the underlying funds.
F Amount represents less than .01%.
G For the period December 31, 2007 (commencement of operations) to July 31, 2008.
H Expense ratios reflect operating expenses of the class. Expenses before reductions do not reflect amounts reimbursed by the investment adviser or reductions from expense offset arrangements and do not represent the amount paid by the class during periods when reimbursements or reductions occur. Expenses net of fee waivers reflect expenses after reimbursement by the investment adviser but prior to reductions from expense offset arrangements. Expenses net of all reductions represent the net expenses paid by the class but do not include expenses of the investment companies in which the Fund invests.
Financial Highlights - Institutional Class
Years ended July 31, | 2011 | 2010 | 2009 | 2008G |
Selected Per-Share Data | | | | |
Net asset value, beginning of period | $ 43.03 | $ 38.83 | $ 45.20 | $ 50.00 |
Income from Investment Operations | | | | |
Net investment income (loss)D | .874 | .855 | .918 | .504 |
Net realized and unrealized gain (loss) | 5.725 | 4.281 | (6.132) | (4.848) |
Total from investment operations | 6.599 | 5.136 | (5.214) | (4.344) |
Distributions from net investment income | (.924) | (.831) | (.956) | (.456) |
Distributions from net realized gain | (.195) | (.105) | (.200) | - |
Total distributions | (1.119) | (.936) | (1.156) | (.456) |
Net asset value, end of period | $ 48.51 | $ 43.03 | $ 38.83 | $ 45.20 |
Total ReturnB,C | 15.42% | 13.27% | (11.18)% | (8.72)% |
Ratios to Average Net AssetsE,H | | | | |
Expenses before reductionsF | .00% | .00% | .00% | .00%A |
Expenses net of fee waivers, if any | .00% | .00% | .00% | .00%A |
Expenses net of all reductions | .00% | .00% | .00% | .00%A |
Net investment income (loss) | 1.86% | 2.02% | 2.57% | 1.82%A |
Supplemental Data | | | | |
Net assets, end of period (000 omitted) | $ 29 | $ 38 | $ 57 | $ 91 |
Portfolio turnover rate | 15% | 20% | 37% | 8%A |
A Annualized
B Total returns for periods of less than one year are not annualized.
C Total returns would have been lower if certain expenses had not been reduced during the applicable periods shown.
D Calculated based on average shares outstanding during the period.
E Amounts do not include the activity of the underlying funds.
F Amount represents less than .01%.
G For the period December 31, 2007 (commencement of operations) to July 31, 2008.
H Expense ratios reflect operating expenses of the class. Expenses before reductions do not reflect amounts reimbursed by the investment adviser or reductions from expense offset arrangements and do not represent the amount paid by the class during periods when reimbursements or reductions occur. Expenses net of fee waivers reflect expenses after reimbursement by the investment adviser but prior to reductions from expense offset arrangements. Expenses net of all reductions represent the net expenses paid by the class but do not include expenses of the investment companies in which the Fund invests.
See accompanying notes which are an integral part of the financial statements.
Annual Report
Notes to Financial Statements
For the period ended July 31, 2011
1. Organization.
Fidelity Income Replacement 2016 Fund, Fidelity Income Replacement 2018 Fund, Fidelity Income Replacement 2020 Fund, Fidelity Income Replacement 2022 Fund, Fidelity Income Replacement 2024 Fund, Fidelity Income Replacement 2026 Fund, Fidelity Income Replacement 2028 Fund, Fidelity Income Replacement 2030 Fund, Fidelity Income Replacement 2032 Fund, Fidelity Income Replacement 2034 Fund, Fidelity Income Replacement 2036 Fund, Fidelity Income Replacement 2038 Fund, Fidelity Income Replacement 2040 Fund and Fidelity Income Replacement 2042 Fund (the Funds) are funds of Fidelity Income Fund (the Trust). The Trust is registered under the Investment Company Act of 1940, as amended (the 1940 Act), as an open-end management investment company organized as a Massachusetts business trust. Each Fund is authorized to issue an unlimited number of shares. The Funds invest primarily in a combination of other Fidelity equity, bond, and short-term funds (the Underlying Funds) managed by Fidelity Management & Research Company (FMR).
The Funds are designed for investors who seek to convert accumulated assets into regular payments over a defined period of time. The payment strategy for each Fund is designed to be implemented through a shareholder's voluntary participation in the Smart Payment Program. Participation in the Smart Payment Program will result in the gradual liquidation of the shareholder's entire investment in the Fund by its horizon date. Each Fund's name refers to the year of its horizon date.
Each Fund offers Class A, Class T, Class C, Income Replacement and Institutional Class shares, each of which has equal rights as to assets and voting privileges. Each class has exclusive voting rights with respect to matters that affect that class. Investment income, realized and unrealized capital gains and losses, the common expenses of the Fund, and certain fund-level expense reductions, if any, are allocated on a pro-rata basis to each class based on the relative net assets of each class to the total net assets of the Fund. Each class differs with respect to distribution and service plan fees incurred. Certain expense reductions may also differ by class.
2. Significant Accounting Policies.
The financial statements have been prepared in conformity with accounting principles generally accepted in the United States of America (GAAP), which require management to make certain estimates and assumptions at the date of the financial statements. Actual results could differ from those estimates. Subsequent events, if any, through the date that the financial statements were issued have been evaluated in the preparation of the financial statements. The following summarizes the significant accounting policies of the Funds:
Security Valuation. Investments are valued as of 4:00 p.m. Eastern time on the last calendar day of the period. Each Fund categorizes the inputs to valuation techniques used to value their investments into a disclosure hierarchy consisting of three levels as shown below:
Level 1 - quoted prices in active markets for identical investments
Level 2 - other significant observable inputs (including quoted prices for similar investments, interest rates, prepayment speeds, etc.)
Level 3 - unobservable inputs (including the Fund's own assumptions based on the best information available)
Valuation techniques used to value each Fund's investments by major category are as follows. Investments in the Underlying Funds are valued at their closing net asset value (NAV) each business day and are categorized as Level 1 in the hierarchy.
Investment Transactions and Income. For financial reporting purposes, the Funds' investment holdings and NAV include trades executed through the end of the last business day of the period. The NAV per share for processing shareholder transactions is calculated as of the close of business of the New York Stock Exchange (NYSE), normally 4:00 p.m. Eastern time and includes trades executed through the end of the prior business day. Gains and losses on securities sold are determined on the basis of identified cost. Income and capital gain distributions from the Underlying Funds, if any, are recorded on the ex-dividend date.
Expenses. Expenses directly attributable to a fund are charged to that fund. Expenses attributable to more than one fund are allocated among the respective funds on the basis of relative net assets or other appropriate methods. Expenses included in the accompanying financial statements reflect the expenses of the Fund and do not include any expenses associated with the Underlying Funds. Expense estimates are accrued in the period to which they relate and adjustments are made when actual amounts are known.
Income Tax Information and Distributions to Shareholders. Each year, each Fund intends to qualify as a regulated investment company, including distributing substantially all of its taxable income and realized gains under Subchapter M of the Internal Revenue Code and filing its U.S. federal tax return. As a result, no provision for income taxes is required. As of July 31, 2011, each Fund did not have any unrecognized tax benefits in the financial statements. A fund's federal tax return is subject to examination by the Internal Revenue Service (IRS) for a period of three years.
Distributions are declared and recorded on the ex-dividend date. Income dividends and capital gain distributions are declared separately for each class. Income and capital gain distributions are determined in accordance with income tax regulations, which may differ from GAAP.
Annual Report
2. Significant Accounting Policies - continued
Income Tax Information and Distributions to Shareholders - continued
Capital accounts within the financial statements are adjusted for permanent book-tax differences. These adjustments have no impact on net assets or the results of operations. Temporary book-tax differences will reverse in a subsequent period.
Book-tax differences are primarily due to the short-term gain distributions from the Underlying Funds, capital loss carryforwards, losses deferred due to wash sales and excise tax regulations.
The federal tax cost of investment securities and unrealized appreciation (depreciation) as of period end were as follows for each Fund:
| Tax cost | Gross unrealized appreciation | Gross unrealized depreciation | Net unrealized appreciation (depreciation) on securities and other investments |
Fidelity Income Replacement 2016 Fund | $ 9,508,174 | $ 578,985 | $ (80,291) | $ 498,694 |
Fidelity Income Replacement 2018 Fund | 5,185,322 | 210,196 | (110,354) | 99,842 |
Fidelity Income Replacement 2020 Fund | 3,682,885 | 320,678 | (31,825) | 288,853 |
Fidelity Income Replacement 2022 Fund | 3,438,681 | 84,225 | (126,856) | (42,631) |
Fidelity Income Replacement 2024 Fund | 1,803,498 | 118,451 | (31,414) | 87,037 |
Fidelity Income Replacement 2026 Fund | 2,096,463 | 64,069 | (44,127) | 19,942 |
Fidelity Income Replacement 2028 Fund | 5,868,593 | 378,957 | (124,718) | 254,239 |
Fidelity Income Replacement 2030 Fund | 4,203,705 | 206,049 | (63,710) | 142,339 |
Fidelity Income Replacement 2032 Fund | 1,423,946 | 160,342 | (5,296) | 155,046 |
Fidelity Income Replacement 2034 Fund | 1,987,588 | 258,796 | (6,093) | 252,703 |
Fidelity Income Replacement 2036 Fund | 3,009,844 | 71,104 | (84,685) | (13,581) |
Fidelity Income Replacement 2038 Fund | 1,376,453 | 234,451 | (3,487) | 230,964 |
Fidelity Income Replacement 2040 Fund | 2,005,007 | 161,128 | (15,802) | 145,326 |
Fidelity Income Replacement 2042 Fund | 5,169,147 | 536,316 | (73,100) | 463,216 |
The tax-based components of distributable earnings as of period end were as follows for each Fund:
| Undistributed ordinary income | Capital loss carryforward | Net unrealized appreciation (depreciation) |
Fidelity Income Replacement 2016 Fund | $ 2,169 | $ (373,492) | $ 498,694 |
Fidelity Income Replacement 2018 Fund | 1,141 | (571,622) | 99,842 |
Fidelity Income Replacement 2020 Fund | 855 | (144,422) | 288,853 |
Fidelity Income Replacement 2022 Fund | 761 | (619,540) | (42,631) |
Fidelity Income Replacement 2024 Fund | 362 | (134,792) | 87,037 |
Fidelity Income Replacement 2026 Fund | 405 | (233,577) | 19,942 |
Fidelity Income Replacement 2028 Fund | 1,283 | (600,001) | 254,239 |
Fidelity Income Replacement 2030 Fund | 793 | (119,726) | 142,339 |
Fidelity Income Replacement 2032 Fund | 290 | (160,350) | 155,046 |
Fidelity Income Replacement 2034 Fund | 426 | (106,484) | 252,703 |
Fidelity Income Replacement 2036 Fund | 528 | (206,608) | (13,581) |
Fidelity Income Replacement 2038 Fund | 293 | (60,057) | 230,964 |
Fidelity Income Replacement 2040 Fund | 368 | (169,960) | 145,326 |
Fidelity Income Replacement 2042 Fund | 1,108 | (51,392) | 463,216 |
Under the recently enacted Regulated Investment Company Modernization Act of 2010 (the Act), the Funds will be permitted to carry forward capital losses incurred in taxable years beginning after December 22, 2010 for an unlimited period. However, any losses incurred during those future taxable years will be required to be utilized prior to any losses incurred in pre-enactment taxable years, which generally expire after eight years from when they are incurred. Additionally, post-enactment capital losses that are carried forward will retain their character as either short-term or long-term capital losses rather than being considered all short-term as under previous law. The Funds' first fiscal year end subject to the Act will be July 31, 2012.
Annual Report
Notes to Financial Statements - continued
2. Significant Accounting Policies - continued
Income Tax Information and Distributions to Shareholders - continued
The tax character of distributions paid was as follows:
July 31, 2011 | Ordinary Income |
Fidelity Income Replacement 2016 Fund | $ 253,172 |
Fidelity Income Replacement 2018 Fund | 135,712 |
Fidelity Income Replacement 2020 Fund | 88,505 |
Fidelity Income Replacement 2022 Fund | 70,615 |
Fidelity Income Replacement 2024 Fund | 36,771 |
Fidelity Income Replacement 2026 Fund | 28,540 |
Fidelity Income Replacement 2028 Fund | 142,480 |
Fidelity Income Replacement 2030 Fund | 65,364 |
Fidelity Income Replacement 2032 Fund | 47,734 |
Fidelity Income Replacement 2034 Fund | 45,760 |
Fidelity Income Replacement 2036 Fund | 40,481 |
Fidelity Income Replacement 2038 Fund | 50,042 |
Fidelity Income Replacement 2040 Fund | 41,637 |
Fidelity Income Replacement 2042 Fund | 99,646 |
July 31, 2010 | |
Fidelity Income Replacement 2016 Fund | 216,155 |
Fidelity Income Replacement 2018 Fund | 117,493 |
Fidelity Income Replacement 2020 Fund | 65,924 |
Fidelity Income Replacement 2022 Fund | 76,907 |
Fidelity Income Replacement 2024 Fund | 35,066 |
Fidelity Income Replacement 2026 Fund | 15,476 |
Fidelity Income Replacement 2028 Fund | 148,030 |
Fidelity Income Replacement 2030 Fund | 16,070 |
Fidelity Income Replacement 2032 Fund | 20,828 |
Fidelity Income Replacement 2034 Fund | 46,782 |
Fidelity Income Replacement 2036 Fund | 23,692 |
Fidelity Income Replacement 2038 Fund | 53,521 |
Fidelity Income Replacement 2040 Fund | 26,066 |
Fidelity Income Replacement 2042 Fund | 65,451 |
3. Purchases and Sales of Investments.
Purchases and redemptions of the Underlying Fund shares are noted in the table below.
| Purchases ($) | Redemptions ($) |
Fidelity Income Replacement 2016 Fund | 3,411,699 | 5,113,582 |
Fidelity Income Replacement 2018 Fund | 2,212,548 | 2,768,533 |
Fidelity Income Replacement 2020 Fund | 2,254,449 | 1,884,536 |
Fidelity Income Replacement 2022 Fund | 1,483,843 | 896,535 |
Fidelity Income Replacement 2024 Fund | 654,679 | 445,200 |
Fidelity Income Replacement 2026 Fund | 1,385,169 | 367,772 |
Fidelity Income Replacement 2028 Fund | 1,086,293 | 1,727,078 |
Fidelity Income Replacement 2030 Fund | 2,895,282 | 737,307 |
Fidelity Income Replacement 2032 Fund | 913,151 | 1,254,850 |
Fidelity Income Replacement 2034 Fund | 950,303 | 767,953 |
Fidelity Income Replacement 2036 Fund | 2,093,941 | 361,646 |
Fidelity Income Replacement 2038 Fund | 365,232 | 1,259,437 |
Fidelity Income Replacement 2040 Fund | 1,775,854 | 1,383,111 |
Fidelity Income Replacement 2042 Fund | 2,357,514 | 700,626 |
Annual Report
4. Fees and Other Transactions with Affiliates.
Management Fee. Strategic Advisers, Inc. (Strategic Advisers), an affiliate of FMR, provides the Funds with investment management related services. The Funds do not pay any fees for these services. Under the management contract, Strategic Advisers pays all other fund-level expenses, except the compensation of the independent Trustees and certain other expenses such as interest expense. The management fee paid by each Fund is reduced by an amount equal to the fees and expenses paid by the Fund to the independent Trustees.
Distribution and Service Plan Fees. In accordance with Rule 12b-1 of the 1940 Act, the Fund has adopted separate Distribution and Service Plans for each class of shares. Certain classes pay Fidelity Distributors Corporation (FDC), an affiliate of FMR, separate Distribution and Service Fees, each of which is based on an annual percentage of each class' average net assets. In addition, FDC may pay financial intermediaries for selling shares of the Fund and providing shareholder support services. For the period, the Distribution and Service Fee rates, total fees and amounts retained by FDC were as follows:
Fidelity Income Replacement 2016 Fund | Distribution
Fee | Service
Fee | Total
Fees | Retained
by FDC |
Class A | -% | .25% | $ 5,200 | $ 7 |
Class T | .25% | .25% | 2,994 | 6 |
Class C | .75% | .25% | 11,323 | 622 |
| | | $ 19,517 | $ 635 |
Fidelity Income Replacement 2018 Fund | | | | |
Class A | -% | .25% | $ 2,705 | $ 30 |
Class T | .25% | .25% | 410 | 8 |
Class C | .75% | .25% | 2,027 | 371 |
| | | $ 5,142 | $ 409 |
Fidelity Income Replacement 2020 Fund | | | | |
Class A | -% | .25% | $ 1,503 | $ 520 |
Class T | .25% | .25% | 802 | 4 |
Class C | .75% | .25% | 2,815 | 136 |
| | | $ 5,120 | $ 660 |
Fidelity Income Replacement 2022 Fund | | | | |
Class A | -% | .25% | $ 158 | $ 4 |
Class T | .25% | .25% | 298 | 12 |
Class C | .75% | .25% | 380 | 139 |
| | | $ 836 | $ 155 |
Fidelity Income Replacement 2024 Fund | | | | |
Class A | -% | .25% | $ 624 | $ 13 |
Class T | .25% | .25% | 235 | 161 |
Class C | .75% | .25% | 1,698 | 42 |
| | | $ 2,557 | $ 216 |
Fidelity Income Replacement 2026 Fund | | | | |
Class A | -% | .25% | $ 135 | $ 28 |
Class T | .25% | .25% | 628 | 28 |
Class C | .75% | .25% | 1,841 | 88 |
| | | $ 2,604 | $ 144 |
Fidelity Income Replacement 2028 Fund | | | | |
Class A | -% | .25% | $ 847 | $ 26 |
Class T | .25% | .25% | 700 | 4 |
Class C | .75% | .25% | 522 | 1 |
| | | $ 2,069 | $ 31 |
Fidelity Income Replacement 2030 Fund | | | | |
Class A | -% | .25% | $ 167 | $ 34 |
Class T | .25% | .25% | 96 | 56 |
Class C | .75% | .25% | 2,187 | 418 |
| | | $ 2,450 | $ 508 |
Fidelity Income Replacement 2032 Fund | | | | |
Class A | -% | .25% | $ 556 | $ 13 |
Class T | .25% | .25% | 152 | 152 |
Class C | .75% | .25% | 259 | 259 |
| | | $ 967 | $ 424 |
Annual Report
Notes to Financial Statements - continued
4. Fees and Other Transactions with Affiliates - continued
Distribution and Service Plan Fees - continued
Fidelity Income Replacement 2034 Fund | Distribution
Fee | Service
Fee | Total
Fees | Retained
by FDC |
Class A | -% | .25% | $ 59 | $ 59 |
Class T | .25% | .25% | 150 | 150 |
Class C | .75% | .25% | 235 | 235 |
| | | $ 444 | $ 444 |
Fidelity Income Replacement 2036 Fund | | | | |
Class A | -% | .25% | $ 89 | $ 72 |
Class T | .25% | .25% | 1,458 | 28 |
Class C | .75% | .25% | 1,366 | 151 |
| | | $ 2,913 | $ 251 |
Fidelity Income Replacement 2038 Fund | | | | |
Class A | -% | .25% | $ 83 | $ 4 |
Class T | .25% | .25% | 214 | 166 |
Class C | .75% | .25% | 799 | 606 |
| | | $ 1,096 | $ 776 |
Fidelity Income Replacement 2040 Fund | | | | |
Class A | -% | .25% | $ 133 | $ 74 |
Class T | .25% | .25% | 626 | 30 |
Class C | .75% | .25% | 876 | 688 |
| | | $ 1,635 | $ 792 |
Fidelity Income Replacement 2042 Fund | | | | |
Class A | -% | .25% | $ 65 | $ 30 |
Class T | .25% | .25% | 167 | 167 |
Class C | .75% | .25% | 328 | 328 |
| | | $ 560 | $ 525 |
Sales Load. FDC may receive a front-end sales charge of up to 5.75% for selling Class A shares, and 3.50% for selling Class T shares, some of which is paid to financial intermediaries for selling shares of the Fund. Depending on the holding period, FDC may receive contingent deferred sales charges levied on Class A, Class T and Class C redemptions. These charges depend on the holding period. The deferred sales charges range from 1% for Class C, 1.00% for certain purchases of Class A shares and .25% for certain purchases of Class T shares.
For the period, sales charge amounts retained by FDC were as follows:
Fidelity Income Replacement 2016 Fund | Retained
by FDC |
Class A | $ 257 |
Class C* | 9 |
| 266 |
Fidelity Income Replacement 2018 Fund | |
Class A | $ 563 |
Fidelity Income Replacement 2020 Fund | |
Class A | $ 2 |
Fidelity Income Replacement 2022 Fund | |
Class A | $ 215 |
Fidelity Income Replacement 2026 Fund | |
Class A | $ 622 |
Class T | 9 |
| $ 631 |
Fidelity Income Replacement 2030 Fund | |
Class A | $ 212 |
Class C* | 3 |
| $ 215 |
Annual Report
4. Fees and Other Transactions with Affiliates - continued
Sales Load - continued
Fidelity Income Replacement 2036 Fund | Retained
by FDC |
Class T | $ 3 |
Class C* | 4 |
| $ 7 |
Fidelity Income Replacement 2040 Fund | |
Class A | $ 441 |
* When Class C shares are initially sold, FDC pays commissions from its own resources to financial intermediaries through which the sales are made.
5. Expense Reductions.
FMR voluntarily agreed to reimburse the Funds to the extent annual operating expenses exceeded distribution and service fees applicable to each class. Some expenses, for example interest expense, are excluded from this reimbursement.
The following Funds were in reimbursement during the period:
| Reimbursement
from adviser* |
Fidelity Income Replacement 2016 Fund | 40 |
Fidelity Income Replacement 2018 Fund | 21 |
Fidelity Income Replacement 2020 Fund | 14 |
Fidelity Income Replacement 2022 Fund | 11 |
Fidelity Income Replacement 2024 Fund | 6 |
Fidelity Income Replacement 2026 Fund | 5 |
Fidelity Income Replacement 2028 Fund | 23 |
Fidelity Income Replacement 2030 Fund | 10 |
Fidelity Income Replacement 2032 Fund | 7 |
Fidelity Income Replacement 2034 Fund | 7 |
Fidelity Income Replacement 2036 Fund | 6 |
Fidelity Income Replacement 2038 Fund | 7 |
Fidelity Income Replacement 2040 Fund | 7 |
Fidelity Income Replacement 2042 Fund | 16 |
* Represents total amount reimbursed to the Fund. Each class has received pro-rata allocation of reimbursement.
6. Distributions to Shareholders.
Distributions to shareholders of each class were as follows:
Years ended July 31, | 2011 | 2010 |
Fidelity Income Replacement 2016 Fund | | |
From net investment income | | |
Class A | $ 34,923 | $ 44,617 |
Class T | 8,720 | 10,060 |
Class C | 10,052 | 12,552 |
Income Replacement 2016 | 138,777 | 120,802 |
Institutional Class | 1,953 | 2,291 |
Total | $ 194,425 | $ 190,322 |
From net realized gain | | |
Class A | $ 11,231 | $ 6,094 |
Class T | 3,381 | 1,771 |
Class C | 6,082 | 3,226 |
Income Replacement 2016 | 37,507 | 14,426 |
Institutional Class | 546 | 316 |
Total | $ 58,747 | $ 25,833 |
Annual Report
Notes to Financial Statements - continued
6. Distributions to Shareholders - continued
Years ended July 31, | 2011 | 2010 |
Fidelity Income Replacement 2018 Fund | | |
From net investment income | | |
Class A | $ 18,636 | $ 17,039 |
Class T | 1,201 | 1,142 |
Class C | 1,971 | 1,710 |
Income Replacement 2018 | 78,313 | 76,857 |
Institutional Class | 6,785 | 7,202 |
Total | $ 106,906 | $ 103,950 |
From net realized gain | | |
Class A | $ 5,977 | $ 2,282 |
Class T | 252 | 200 |
Class C | 980 | 353 |
Income Replacement 2018 | 19,822 | 9,798 |
Institutional Class | 1,775 | 910 |
Total | $ 28,806 | $ 13,543 |
Fidelity Income Replacement 2020 Fund | | |
From net investment income | | |
Class A | $ 10,048 | $ 11,250 |
Class T | 2,330 | 2,566 |
Class C | 2,700 | 2,829 |
Income Replacement 2020 | 55,571 | 39,529 |
Institutional Class | 898 | 2,036 |
Total | $ 71,547 | $ 58,210 |
From net realized gain | | |
Class A | $ 2,797 | $ 1,618 |
Class T | 638 | 468 |
Class C | 1,402 | 667 |
Income Replacement 2020 | 11,887 | 4,645 |
Institutional Class | 234 | 316 |
Total | $ 16,958 | $ 7,714 |
Fidelity Income Replacement 2022 Fund | | |
From net investment income | | |
Class A | $ 1,130 | $ 760 |
Class T | 862 | 1,377 |
Class C | 326 | 583 |
Income Replacement 2022 | 55,484 | 52,195 |
Institutional Class | 83 | 2,258 |
Total | $ 57,885 | $ 57,173 |
From net realized gain | | |
Class A | $ 313 | $ 290 |
Class T | 343 | 657 |
Class C | 169 | 426 |
Income Replacement 2022 | 11,885 | 17,200 |
Institutional Class | 20 | 1,161 |
Total | $ 12,730 | $ 19,734 |
Fidelity Income Replacement 2024 Fund | | |
From net investment income | | |
Class A | $ 4,200 | $ 5,225 |
Class T | 640 | 1,024 |
Class C | 1,582 | 1,614 |
Income Replacement 2024 | 22,670 | 22,024 |
Institutional Class | 601 | 946 |
Total | $ 29,693 | $ 30,833 |
Annual Report
6. Distributions to Shareholders - continued
Years ended July 31, | 2011 | 2010 |
From net realized gain | | |
Class A | $ 1,169 | $ 733 |
Class T | 211 | 173 |
Class C | 755 | 389 |
Income Replacement 2024 | 4,799 | 2,820 |
Institutional Class | 144 | 118 |
Total | $ 7,078 | $ 4,233 |
Fidelity Income Replacement 2026 Fund | | |
From net investment income | | |
Class A | $ 847 | $ 1,002 |
Class T | 1,742 | 1,567 |
Class C | 1,651 | 1,940 |
Income Replacement 2026 | 19,092 | 8,207 |
Institutional Class | 582 | 937 |
Total | $ 23,914 | $ 13,653 |
From net realized gain | | |
Class A | $ 163 | $ 145 |
Class T | 515 | 294 |
Class C | 762 | 484 |
Income Replacement 2026 | 3,053 | 782 |
Institutional Class | 133 | 118 |
Total | $ 4,626 | $ 1,823 |
Fidelity Income Replacement 2028 Fund | | |
From net investment income | | |
Class A | $ 5,819 | $ 6,274 |
Class T | 1,766 | 5,032 |
Class C | 483 | 669 |
Income Replacement 2028 | 108,055 | 118,159 |
Institutional Class | 594 | 931 |
Total | $ 116,717 | $ 131,065 |
From net realized gain | | |
Class A | $ 1,624 | $ 885 |
Class T | 551 | 821 |
Class C | 224 | 172 |
Income Replacement 2028 | 23,226 | 14,970 |
Institutional Class | 138 | 117 |
Total | $ 25,763 | $ 16,965 |
Fidelity Income Replacement 2030 Fund | | |
From net investment income | | |
Class A | $ 1,034 | $ 944 |
Class T | 193 | 802 |
Class C | 2,028 | 1,647 |
Income Replacement 2030 | 50,801 | 9,950 |
Institutional Class | 585 | 870 |
Total | $ 54,641 | $ 14,213 |
From net realized gain | | |
Class A | $ 210 | $ 112 |
Class T | 35 | 143 |
Class C | 777 | 448 |
Income Replacement 2030 | 9,584 | 1,042 |
Institutional Class | 117 | 112 |
Total | $ 10,723 | $ 1,857 |
Annual Report
Notes to Financial Statements - continued
6. Distributions to Shareholders - continued
Years ended July 31, | 2011 | 2010 |
Fidelity Income Replacement 2032 Fund | | |
From net investment income | | |
Class A | $ 3,720 | $ 3,578 |
Class T | 432 | 726 |
Class C | 229 | 409 |
Income Replacement 2032 | 33,843 | 12,987 |
Institutional Class | 1,022 | 990 |
Total | $ 39,246 | $ 18,690 |
From net realized gain | | |
Class A | $ 874 | $ 469 |
Class T | 125 | 112 |
Class C | 104 | 93 |
Income Replacement 2032 | 7,076 | 1,351 |
Institutional Class | 309 | 113 |
Total | $ 8,488 | $ 2,138 |
Fidelity Income Replacement 2034 Fund | | |
From net investment income | | |
Class A | $ 364 | $ 592 |
Class T | 408 | 675 |
Class C | 191 | 337 |
Income Replacement 2034 | 34,754 | 34,804 |
Institutional Class | 1,932 | 1,910 |
Total | $ 37,649 | $ 38,318 |
From net realized gain | | |
Class A | $ 99 | $ 165 |
Class T | 130 | 218 |
Class C | 99 | 166 |
Income Replacement 2034 | 7,355 | 7,479 |
Institutional Class | 428 | 436 |
Total | $ 8,111 | $ 8,464 |
Fidelity Income Replacement 2036 Fund | | |
From net investment income | | |
Class A | $ 555 | $ 811 |
Class T | 3,944 | 4,274 |
Class C | 1,241 | 1,320 |
Income Replacement 2036 | 26,829 | 12,138 |
Institutional Class | 1,583 | 1,200 |
Total | $ 34,152 | $ 19,743 |
From net realized gain | | |
Class A | $ 116 | $ 162 |
Class T | 928 | 958 |
Class C | 398 | 467 |
Income Replacement 2036 | 4,588 | 2,158 |
Institutional Class | 299 | 204 |
Total | $ 6,329 | $ 3,949 |
Fidelity Income Replacement 2038 Fund | | |
From net investment income | | |
Class A | $ 565 | $ 1,542 |
Class T | 664 | 689 |
Class C | 725 | 569 |
Income Replacement 2038 | 37,593 | 40,695 |
Institutional Class | 634 | 942 |
Total | $ 40,181 | $ 44,437 |
Annual Report
6. Distributions to Shareholders - continued
Years ended July 31, | 2011 | 2010 |
From net realized gain | | |
Class A | $ 135 | $ 413 |
Class T | 137 | 207 |
Class C | 333 | 205 |
Income Replacement 2038 | 9,117 | 8,050 |
Institutional Class | 139 | 209 |
Total | $ 9,861 | $ 9,084 |
Fidelity Income Replacement 2040 Fund | | |
From net investment income | | |
Class A | $ 1,176 | $ 1,022 |
Class T | 1,854 | 1,586 |
Class C | 859 | 487 |
Income Replacement 2040 | 29,421 | 18,680 |
Institutional Class | 1,064 | 1,444 |
Total | $ 34,374 | $ 23,219 |
From net realized gain | | |
Class A | $ 360 | $ 174 |
Class T | 502 | 273 |
Class C | 361 | 112 |
Income Replacement 2040 | 5,813 | 2,099 |
Institutional Class | 227 | 189 |
Total | $ 7,263 | $ 2,847 |
Fidelity Income Replacement 2042 Fund | | |
From net investment income | | |
Class A | $ 425 | $1,305 |
Class T | 459 | 687 |
Class C | 302 | 442 |
Income Replacement 2042 | 82,219 | 54,565 |
Institutional Class | 637 | 944 |
Total | $ 84,042 | $ 57,943 |
From net realized gain | | |
Class A | $ 108 | $ 247 |
Class T | 138 | 121 |
Class C | 136 | 120 |
Income Replacement 2042 | 15,082 | 6,898 |
Institutional Class | 140 | 122 |
Total | $ 15,604 | $ 7,508 |
7. Share Transactions.
Transactions for each class of shares were as follows:
| Shares | Dollars |
Years ended July 31, | 2011 | 2010 | 2011 | 2010 |
Fidelity Income Replacement 2016 Fund | | | | |
Class A | | | | |
Shares sold | 1,492 | 10,966 | $ 72,585 | $ 505,595 |
Reinvestment of distributions | 780 | 904 | 38,177 | 41,700 |
Shares redeemed | (15,236) | (22,378) | (747,263) | (1,033,263) |
Net increase (decrease) | (12,964) | (10,508) | $ (636,501) | $ (485,968) |
Class T | | | | |
Shares sold | - | 6,546 | $ - | $ 302,409 |
Reinvestment of distributions | 201 | 199 | 9,845 | 9,206 |
Shares redeemed | (3,144) | (4,625) | (154,952) | (215,246) |
Net increase (decrease) | (2,943) | 2,120 | $ (145,107) | $ 96,369 |
Annual Report
Notes to Financial Statements - continued
7. Share Transactions - continued
| Shares | Dollars |
Years ended July 31, | 2011 | 2010 | 2011 | 2010 |
Class C | | | | |
Shares sold | 2,527 | 3,920 | $ 125,000 | $ 176,110 |
Reinvestment of distributions | 238 | 252 | 11,623 | 11,639 |
Shares redeemed | (10,384) | (8,175) | (518,601) | (376,188) |
Net increase (decrease) | (7,619) | (4,003) | $ (381,978) | $ (188,439) |
Income Replacement 2016 | | | | |
Shares sold | 39,876 | 78,978 | $ 1,956,078 | $ 3,659,239 |
Reinvestment of distributions | 1,346 | 721 | 66,013 | 33,372 |
Shares redeemed | (50,919) | (40,547) | (2,509,419) | (1,866,323) |
Net increase (decrease) | (9,697) | 39,152 | $ (487,328) | $ 1,826,288 |
Institutional Class | | | | |
Shares sold | 841 | 751 | $ 41,400 | $ 34,781 |
Reinvestment of distributions | 8 | 15 | 403 | 690 |
Shares redeemed | (2,264) | (975) | (113,147) | (44,681) |
Net increase (decrease) | (1,415) | (209) | $ (71,344) | $ (9,210) |
Fidelity Income Replacement 2018 Fund | | | | |
Class A | | | | |
Shares sold | 1,564 | 6,590 | $ 72,093 | $ 305,640 |
Reinvestment of distributions | 230 | 248 | 11,233 | 11,354 |
Shares redeemed | (10,781) | (1,601) | (535,725) | (73,103) |
Net increase (decrease) | (8,987) | 5,237 | $ (452,399) | $ 243,891 |
Class T | | | | |
Shares sold | 2,045 | - | $ 102,042 | $ - |
Reinvestment of distributions | 14 | 21 | 665 | 968 |
Shares redeemed | (207) | (1,030) | (10,225) | (46,978) |
Net increase (decrease) | 1,852 | (1,009) | $ 92,482 | $ (46,010) |
Class C | | | | |
Shares sold | 697 | 1,627 | $ 35,000 | $ 75,000 |
Reinvestment of distributions | 46 | 26 | 2,243 | 1,209 |
Shares redeemed | (541) | (373) | (26,508) | (17,000) |
Net increase (decrease) | 202 | 1,280 | $ 10,735 | $ 59,209 |
Income Replacement 2018 | | | | |
Shares sold | 27,556 | 11,957 | $ 1,335,152 | $ 541,219 |
Reinvestment of distributions | 432 | 258 | 21,162 | 11,837 |
Shares redeemed | (30,915) | (13,199) | (1,518,106) | (594,109) |
Net increase (decrease) | (2,927) | (984) | $ (161,792) | $ (41,053) |
Institutional Class | | | | |
Shares sold | - | - | $ - | $ - |
Reinvestment of distributions | 6 | 8 | 294 | 361 |
Shares redeemed | (1,111) | (100) | (54,894) | (4,500) |
Net increase (decrease) | (1,105) | (92) | $ (54,600) | $ (4,139) |
Fidelity Income Replacement 2020 Fund | | | | |
Class A | | | | |
Shares sold | 5 | 4,988 | $ 266 | $ 223,504 |
Reinvestment of distributions | 193 | 166 | 9,448 | 7,568 |
Shares redeemed | (4,655) | (3,855) | (230,357) | (179,660) |
Net increase (decrease) | (4,457) | 1,299 | $ (220,643) | $ 51,412 |
Class T | | | | |
Shares sold | 1,002 | 1,680 | $ 50,063 | $ 80,000 |
Reinvestment of distributions | 56 | 67 | 2,725 | 3,033 |
Shares redeemed | (41) | (2,893) | (2,073) | (131,000) |
Net increase (decrease) | 1,017 | (1,146) | $ 50,715 | $ (47,967) |
Class C | | | | |
Shares sold | - | 1,102 | $ - | $ 49,985 |
Reinvestment of distributions | 59 | 67 | 2,866 | 3,032 |
Shares redeemed | (1,882) | - | (93,646) | - |
Net increase (decrease) | (1,823) | 1,169 | $ (90,780) | $ 53,017 |
Annual Report
7. Share Transactions - continued
| Shares | Dollars |
Years ended July 31, | 2011 | 2010 | 2011 | 2010 |
Income Replacement 2020 | | | | |
Shares sold | 36,410 | 20,661 | $ 1,796,170 | $ 932,116 |
Reinvestment of distributions | 417 | 202 | 20,472 | 9,173 |
Shares redeemed | (23,522) | (10,998) | (1,171,587) | (493,006) |
Net increase (decrease) | 13,305 | 9,865 | $ 645,055 | $ 448,283 |
Institutional Class | | | | |
Shares sold | 397 | 996 | $ 20,000 | $ 45,000 |
Reinvestment of distributions | 23 | 25 | 1,132 | 1,133 |
Shares redeemed | (833) | (2,202) | (41,702) | (99,518) |
Net increase (decrease) | (413) | (1,181) | $ (20,570) | $ (53,385) |
Fidelity Income Replacement 2022 Fund | | | | |
Class A | | | | |
Shares sold | 567 | - | $ 27,240 | $ - |
Reinvestment of distributions | 15 | 8 | 735 | 338 |
Shares redeemed | (67) | (2,006) | (3,203) | (84,777) |
Net increase (decrease) | 515 | (1,998) | $ 24,772 | $ (84,439) |
Class T | | | | |
Shares sold | - | 1,105 | $ - | $ 48,498 |
Reinvestment of distributions | 15 | 31 | 718 | 1,374 |
Shares redeemed | (1,248) | (2,115) | (61,978) | (94,162) |
Net increase (decrease) | (1,233) | (979) | $ (61,260) | $ (44,290) |
Class C | | | | |
Shares sold | - | - | $ - | $ - |
Reinvestment of distributions | 4 | 14 | 172 | 640 |
Shares redeemed | (319) | (699) | (15,279) | (31,230) |
Net increase (decrease) | (315) | (685) | $ (15,107) | $ (30,590) |
Income Replacement 2022 | | | | |
Shares sold | 23,188 | 9,043 | $ 1,142,442 | $ 391,098 |
Reinvestment of distributions | 293 | 462 | 14,318 | 20,398 |
Shares redeemed | (10,448) | (13,142) | (520,826) | (587,330) |
Net increase (decrease) | 13,033 | (3,637) | $ 635,934 | $ (175,834) |
Institutional Class | | | | |
Shares sold | - | - | $ - | $ - |
Reinvestment of distributions | 2 | 4 | 103 | 166 |
Shares redeemed | (37) | (3,867) | (1,783) | (173,132) |
Net increase (decrease) | (35) | (3,863) | $ (1,680) | $ (172,966) |
Fidelity Income Replacement 2024 Fund | | | | |
Class A | | | | |
Shares sold | 117 | - | $ 5,864 | $ - |
Reinvestment of distributions | 86 | 108 | 4,191 | 4,833 |
Shares redeemed | (2,180) | (1,295) | (108,524) | (57,768) |
Net increase (decrease) | (1,977) | (1,187) | $ (98,469) | $ (52,935) |
Class T | | | | |
Shares sold | - | 295 | $ - | $ 13,015 |
Reinvestment of distributions | 17 | 27 | 851 | 1,197 |
Shares redeemed | (392) | (804) | (18,805) | (35,887) |
Net increase (decrease) | (375) | (482) | $ (17,954) | $ (21,675) |
Class C | | | | |
Shares sold | - | - | $ - | $ - |
Reinvestment of distributions | 19 | 19 | 922 | 835 |
Shares redeemed | (74) | (71) | (3,621) | (2,945) |
Net increase (decrease) | (55) | (52) | $ (2,699) | $ (2,110) |
Annual Report
Notes to Financial Statements - continued
7. Share Transactions - continued
| Shares | Dollars |
Years ended July 31, | 2011 | 2010 | 2011 | 2010 |
Income Replacement 2024 | | | | |
Shares sold | 9,431 | 9,741 | $ 469,295 | $ 422,106 |
Reinvestment of distributions | 156 | 143 | 7,661 | 6,430 |
Shares redeemed | (2,819) | (5,344) | (138,862) | (239,126) |
Net increase (decrease) | 6,768 | 4,540 | $ 338,094 | $ 189,410 |
Institutional Class | | | | |
Shares sold | - | - | $ - | $ - |
Reinvestment of distributions | 15 | 24 | 745 | 1,064 |
Shares redeemed | (268) | (580) | (12,871) | (25,832) |
Net increase (decrease) | (253) | (556) | $ (12,126) | $ (24,768) |
Fidelity Income Replacement 2026 Fund | | | | |
Class A | | | | |
Shares sold | 1,608 | - | $ 79,966 | $ - |
Reinvestment of distributions | 16 | 26 | 777 | 1,147 |
Shares redeemed | (434) | (713) | (20,829) | (31,427) |
Net increase (decrease) | 1,190 | (687) | $ 59,914 | $ (30,280) |
Class T | | | | |
Shares sold | 187 | 2,332 | $ 8,556 | $ 103,846 |
Reinvestment of distributions | 38 | 39 | 1,819 | 1,739 |
Shares redeemed | (172) | (1,146) | (7,742) | (50,896) |
Net increase (decrease) | 53 | 1,225 | $ 2,633 | $ 54,689 |
Class C | | | | |
Shares sold | - | - | $ - | $ - |
Reinvestment of distributions | 50 | 55 | 2,413 | 2,424 |
Shares redeemed | (206) | (653) | (9,967) | (29,483) |
Net increase (decrease) | (156) | (598) | $ (7,554) | $ (27,059) |
Income Replacement 2026 | | | | |
Shares sold | 24,011 | 11,631 | $ 1,180,279 | $ 516,873 |
Reinvestment of distributions | 233 | 139 | 11,328 | 6,162 |
Shares redeemed | (4,444) | (6,640) | (219,154) | (295,846) |
Net increase (decrease) | 19,800 | 5,130 | $ 972,453 | $ 227,189 |
Institutional Class | | | | |
Shares sold | - | - | $ - | $ - |
Reinvestment of distributions | 15 | 24 | 715 | 1,055 |
Shares redeemed | (269) | (581) | (12,796) | (25,621) |
Net increase (decrease) | (254) | (557) | $ (12,081) | $ (24,566) |
Fidelity Income Replacement 2028 Fund | | | | |
Class A | | | | |
Shares sold | - | 1,688 | $ - | $ 71,316 |
Reinvestment of distributions | 153 | 161 | 7,443 | 7,159 |
Shares redeemed | (5,420) | (672) | (273,625) | (29,955) |
Net increase (decrease) | (5,267) | 1,177 | $ (266,182) | $ 48,520 |
Class T | | | | |
Shares sold | - | - | $ - | $ - |
Reinvestment of distributions | 24 | 46 | 1,194 | 2,069 |
Shares redeemed | (4,677) | (340) | (209,519) | (15,095) |
Net increase (decrease) | (4,653) | (294) | $ (208,325) | $ (13,026) |
Class C | | | | |
Shares sold | - | - | $ - | $ - |
Reinvestment of distributions | 4 | 8 | 180 | 379 |
Shares redeemed | (148) | (965) | (7,212) | (42,703) |
Net increase (decrease) | (144) | (957) | $ (7,032) | $ (42,324) |
Income Replacement 2028 | | | | |
Shares sold | 9,722 | 7,291 | $ 477,899 | $ 328,341 |
Reinvestment of distributions | 871 | 860 | 42,621 | 38,493 |
Shares redeemed | (13,911) | (26,019) | (676,445) | (1,168,445) |
Net increase (decrease) | (3,318) | (17,868) | $ (155,925) | $ (801,611) |
Annual Report
7. Share Transactions - continued
| Shares | Dollars |
Years ended July 31, | 2011 | 2010 | 2011 | 2010 |
Institutional Class | | | | |
Shares sold | - | - | $ - | $ - |
Reinvestment of distributions | 15 | 24 | 732 | 1,048 |
Shares redeemed | (266) | (575) | (12,757) | (25,500) |
Net increase (decrease) | (251) | (551) | $ (12,025) | $ (24,452) |
Fidelity Income Replacement 2030 Fund | | | | |
Class A | | | | |
Shares sold | 534 | 1,608 | $ 26,388 | $ 70,708 |
Reinvestment of distributions | 10 | 22 | 506 | 972 |
Shares redeemed | (578) | (1,510) | (27,630) | (65,796) |
Net increase (decrease) | (34) | 120 | $ (736) | $ 5,884 |
Class T | | | | |
Shares sold | 130 | - | $ 6,467 | $ - |
Reinvestment of distributions | 4 | 14 | 177 | 632 |
Shares redeemed | (839) | (767) | (39,979) | (33,663) |
Net increase (decrease) | (705) | (753) | $ (33,335) | $ (33,031) |
Class C | | | | |
Shares sold | 2,512 | - | $ 125,006 | $ - |
Reinvestment of distributions | 56 | 47 | 2,702 | 2,094 |
Shares redeemed | (1,287) | (250) | (63,685) | (10,986) |
Net increase (decrease) | 1,281 | (203) | $ 64,023 | $ (8,892) |
Income Replacement 2030 | | | | |
Shares sold | 52,301 | 30,831 | $ 2,568,351 | $ 1,381,260 |
Reinvestment of distributions | 466 | 68 | 22,746 | 3,035 |
Shares redeemed | (9,315) | (1,995) | (455,782) | (90,075) |
Net increase (decrease) | 43,452 | 28,904 | $ 2,135,315 | $ 1,294,220 |
Institutional Class | | | | |
Shares sold | - | - | $ - | $ - |
Reinvestment of distributions | 14 | 22 | 702 | 982 |
Shares redeemed | (267) | (578) | (12,724) | (25,388) |
Net increase (decrease) | (253) | (556) | $ (12,022) | $ (24,406) |
Fidelity Income Replacement 2032 Fund | | | | |
Class A | | | | |
Shares sold | 1,251 | - | $ 61,087 | $ - |
Reinvestment of distributions | 92 | 93 | 4,419 | 4,047 |
Shares redeemed | (1,523) | (107) | (74,213) | (4,502) |
Net increase (decrease) | (180) | (14) | $ (8,707) | $ (455) |
Class T | | | | |
Shares sold | - | - | $ - | $ - |
Reinvestment of distributions | 12 | 19 | 557 | 838 |
Shares redeemed | (266) | (575) | (12,454) | (24,937) |
Net increase (decrease) | (254) | (556) | $ (11,897) | $ (24,099) |
Class C | | | | |
Shares sold | - | - | $ - | $ - |
Reinvestment of distributions | 7 | 12 | 333 | 502 |
Shares redeemed | (221) | (480) | (10,354) | (20,831) |
Net increase (decrease) | (214) | (468) | $ (10,021) | $ (20,329) |
Income Replacement 2032 | | | | |
Shares sold | 13,347 | 20,546 | $ 630,717 | $ 869,619 |
Reinvestment of distributions | 561 | 269 | 27,010 | 11,717 |
Shares redeemed | (18,955) | (21,297) | (922,796) | (886,611) |
Net increase (decrease) | (5,047) | (482) | $ (265,069) | $ (5,275) |
Institutional Class | | | | |
Shares sold | 550 | 565 | $ 25,000 | $ 25,000 |
Reinvestment of distributions | 11 | 25 | 530 | 1,078 |
Shares redeemed | (1,556) | (582) | (74,627) | (25,236) |
Net increase (decrease) | (995) | 8 | $ (49,097) | $ 842 |
Annual Report
Notes to Financial Statements - continued
7. Share Transactions - continued
| Shares | Dollars |
Years ended July 31, | 2011 | 2010 | 2011 | 2010 |
Fidelity Income Replacement 2034 Fund | | | | |
Class A | | | | |
Shares sold | - | - | $ - | $ - |
Reinvestment of distributions | 10 | 17 | 462 | 757 |
Shares redeemed | (199) | (984) | (9,387) | (41,642) |
Net increase (decrease) | (189) | (967) | $ (8,925) | $ (40,885) |
Class T | | | | |
Shares sold | - | - | $ - | $ - |
Reinvestment of distributions | 11 | 20 | 538 | 892 |
Shares redeemed | (263) | (569) | (12,373) | (24,737) |
Net increase (decrease) | (252) | (549) | $ (11,835) | $ (23,845) |
Class C | | | | |
Shares sold | - | - | $ - | $ - |
Reinvestment of distributions | 6 | 12 | 289 | 503 |
Shares redeemed | (199) | (434) | (9,399) | (18,880) |
Net increase (decrease) | (193) | (422) | $ (9,110) | $ (18,377) |
Income Replacement 2034 | | | | |
Shares sold | 15,037 | 5,032 | $ 741,550 | $ 225,749 |
Reinvestment of distributions | 308 | 383 | 14,854 | 16,703 |
Shares redeemed | (11,217) | (8,062) | (548,641) | (352,058) |
Net increase (decrease) | 4,128 | (2,647) | $ 207,763 | $ (109,606) |
Institutional Class | | | | |
Shares sold | - | - | $ - | $ - |
Reinvestment of distributions | 40 | 39 | 1,922 | 1,717 |
Shares redeemed | (4) | (586) | (220) | (25,063) |
Net increase (decrease) | 36 | (547) | $ 1,702 | $ (23,346) |
Fidelity Income Replacement 2036 Fund | | | | |
Class A | | | | |
Shares sold | 22 | 128 | $ 1,088 | $ 5,725 |
Reinvestment of distributions | 14 | 23 | 671 | 973 |
Shares redeemed | (305) | (600) | (14,218) | (25,767) |
Net increase (decrease) | (269) | (449) | $ (12,459) | $ (19,069) |
Class T | | | | |
Shares sold | 592 | 82 | $ 29,293 | $ 3,536 |
Reinvestment of distributions | 41 | 54 | 1,979 | 2,334 |
Shares redeemed | (810) | (756) | (39,495) | (33,710) |
Net increase (decrease) | (177) | (620) | $ (8,223) | $ (27,840) |
Class C | | | | |
Shares sold | 1,929 | 979 | $ 93,800 | $ 39,435 |
Reinvestment of distributions | 34 | 41 | 1,639 | 1,752 |
Shares redeemed | (264) | (1,217) | (12,450) | (52,088) |
Net increase (decrease) | 1,699 | (197) | $ 82,989 | $ (10,901) |
Income Replacement 2036 | | | | |
Shares sold | 36,939 | 2,159 | $ 1,794,635 | $ 86,419 |
Reinvestment of distributions | 302 | 99 | 14,515 | 4,266 |
Shares redeemed | (1,164) | (4,508) | (56,447) | (191,085) |
Net increase (decrease) | 36,077 | (2,250) | $ 1,752,703 | $ (100,400) |
Institutional Class | | | | |
Shares sold | 49 | 1,348 | $ 2,283 | $ 59,043 |
Reinvestment of distributions | 40 | 33 | 1,882 | 1,403 |
Shares redeemed | (1,881) | (723) | (90,082) | (31,039) |
Net increase (decrease) | (1,792) | 658 | $ (85,917) | $ 29,407 |
Annual Report
7. Share Transactions - continued
| Shares | Dollars |
Years ended July 31, | 2011 | 2010 | 2011 | 2010 |
Fidelity Income Replacement 2038 Fund | | | | |
Class A | | | | |
Shares sold | - | 667 | $ - | $ 28,000 |
Reinvestment of distributions | 15 | 24 | 700 | 996 |
Shares redeemed | (37) | (2,898) | (1,526) | (123,534) |
Net increase (decrease) | (22) | (2,207) | $ (826) | $ (94,538) |
Class T | | | | |
Shares sold | 2,160 | - | $ 103,818 | $ - |
Reinvestment of distributions | 13 | 21 | 597 | 896 |
Shares redeemed | (408) | (622) | (19,017) | (26,247) |
Net increase (decrease) | 1,765 | (601) | $ 85,398 | $ (25,351) |
Class C | | | | |
Shares sold | - | 1,458 | $ - | $ 65,000 |
Reinvestment of distributions | 22 | 18 | 1,058 | 774 |
Shares redeemed | (624) | (823) | (28,467) | (34,657) |
Net increase (decrease) | (602) | 653 | $ (27,409) | $ 31,117 |
Income Replacement 2038 | | | | |
Shares sold | 1,521 | 19,983 | $ 73,871 | $ 804,508 |
Reinvestment of distributions | 582 | 594 | 27,411 | 25,218 |
Shares redeemed | (21,894) | (2,784) | (1,042,929) | (118,526) |
Net increase (decrease) | (19,791) | 17,793 | $ (941,647) | $ 711,200 |
Institutional Class | | | | |
Shares sold | - | - | $ - | $ - |
Reinvestment of distributions | 16 | 27 | 773 | 1,151 |
Shares redeemed | (291) | (628) | (13,482) | (26,515) |
Net increase (decrease) | (275) | (601) | $ (12,709) | $ (25,364) |
Fidelity Income Replacement 2040 Fund | | | | |
Class A | | | | |
Shares sold | 2,779 | - | $ 131,112 | $ - |
Reinvestment of distributions | 26 | 21 | 1,246 | 909 |
Shares redeemed | (1,627) | (697) | (77,967) | (29,560) |
Net increase (decrease) | 1,178 | (676) | $ 54,391 | $ (28,651) |
Class T | | | | |
Shares sold | 59 | 766 | $ 2,795 | $ 32,205 |
Reinvestment of distributions | 50 | 44 | 2,356 | 1,859 |
Shares redeemed | (1) | (849) | (45) | (35,678) |
Net increase (decrease) | 108 | (39) | $ 5,106 | $ (1,614) |
Class C | | | | |
Shares sold | - | 1,585 | $ - | $ 67,225 |
Reinvestment of distributions | 26 | 14 | 1,220 | 599 |
Shares redeemed | (679) | (765) | (31,060) | (32,264) |
Net increase (decrease) | (653) | 834 | $ (29,840) | $ 35,560 |
Income Replacement 2040 | | | | |
Shares sold | 31,872 | 51,547 | $ 1,546,264 | $ 2,203,936 |
Reinvestment of distributions | 348 | 391 | 16,441 | 16,805 |
Shares redeemed | (24,432) | (32,503) | (1,181,522) | (1,366,427) |
Net increase (decrease) | 7,788 | 19,435 | $ 381,183 | $ 854,314 |
Institutional Class | | | | |
Shares sold | - | 857 | $ - | $ 35,012 |
Reinvestment of distributions | 27 | 39 | 1,291 | 1,633 |
Shares redeemed | (478) | (935) | (22,066) | (39,625) |
Net increase (decrease) | (451) | (39) | $ (20,775) | $ (2,980) |
Annual Report
Notes to Financial Statements - continued
7. Share Transactions - continued
| Shares | Dollars |
Years ended July 31, | 2011 | 2010 | 2011 | 2010 |
Fidelity Income Replacement 2042 Fund | | | | |
Class A | | | | |
Shares sold | 427 | 1,685 | $ 20,347 | $ 72,288 |
Reinvestment of distributions | 11 | 36 | 533 | 1,552 |
Shares redeemed | (643) | (3,326) | (30,601) | (142,410) |
Net increase (decrease) | (205) | (1,605) | $ (9,721) | $ (68,570) |
Class T | | | | |
Shares sold | - | - | $ - | $ - |
Reinvestment of distributions | 13 | 19 | 597 | 808 |
Shares redeemed | (287) | (621) | (13,228) | (26,230) |
Net increase (decrease) | (274) | (602) | $ (12,631) | $ (25,422) |
Class C | | | | |
Shares sold | - | - | $ - | $ - |
Reinvestment of distributions | 9 | 13 | 438 | 562 |
Shares redeemed | (283) | (615) | (13,030) | (25,273) |
Net increase (decrease) | (274) | (602) | $ (12,592) | $ (24,711) |
Income Replacement 2042 | | | | |
Shares sold | 40,366 | 45,150 | $ 1,950,277 | $ 1,897,966 |
Reinvestment of distributions | 1,123 | 960 | 53,152 | 40,980 |
Shares redeemed | (6,501) | (3,141) | (305,462) | (134,772) |
Net increase (decrease) | 34,988 | 42,969 | $ 1,697,967 | $ 1,804,174 |
Institutional Class | | | | |
Shares sold | - | - | $ - | $ - |
Reinvestment of distributions | 16 | 25 | 777 | 1,066 |
Shares redeemed | (291) | (627) | (13,432) | (26,500) |
Net increase (decrease) | (275) | (602) | $ (12,655) | $ (25,434) |
8. Other.
The Funds' organizational documents provide former and current trustees and officers with a limited indemnification against liabilities arising in connection with the performance of their duties to the Funds. In the normal course of business, the Funds may also enter into contracts that provide general indemnifications. The Funds' maximum exposure under these arrangements is unknown as this would be dependent on future claims that may be made against the Funds. The risk of material loss from such claims is considered remote.
The Funds do not invest in the Underlying Funds for the purpose of exercising management or control; however, investments by the Fund within their principle investment strategies may represent a significant portion of the Underlying Fund's net assets. At the end of the period, the following Funds were the owners of record of 10% or more of the total outstanding shares of the Underlying Funds.
Fund | Fidelity
Income
Replacement 2016 Fund | Fidelity
Income
Replacement 2028 Fund | Fidelity
Income
Replacement 2042 Fund |
Fidelity Series Broad Market Opportunities Fund | 11% | 13% | 14% |
The Funds, in aggregate, were the owners of record of more than 20% of the total outstanding shares of the following Underlying Funds.
Fund | % of shares held |
Fidelity Series Broad Market Opportunities Fund | 100% |
Annual Report
Report of Independent Registered Public Accounting Firm
To the Trustees of Fidelity Income Fund and the Shareholders of Fidelity Income Replacement 2016 Fund, Fidelity Income Replacement 2018 Fund, Fidelity Income Replacement 2020 Fund, Fidelity Income Replacement 2022 Fund, Fidelity Income Replacement 2024 Fund, Fidelity Income Replacement 2026 Fund, Fidelity Income Replacement 2028 Fund, Fidelity Income Replacement 2030 Fund, Fidelity Income Replacement 2032 Fund, Fidelity Income Replacement 2034 Fund, Fidelity Income Replacement 2036 Fund, Fidelity Income Replacement 2038 Fund, Fidelity Income Replacement 2040 Fund and Fidelity Income Replacement 2042 Fund:
We have audited the accompanying statements of assets and liabilities of Fidelity Income Replacement 2016 Fund, Fidelity Income Replacement 2018 Fund, Fidelity Income Replacement 2020 Fund, Fidelity Income Replacement 2022 Fund, Fidelity Income Replacement 2024 Fund, Fidelity Income Replacement 2026 Fund, Fidelity Income Replacement 2028 Fund, Fidelity Income Replacement 2030 Fund, Fidelity Income Replacement 2032 Fund, Fidelity Income Replacement 2034 Fund, Fidelity Income Replacement 2036 Fund, Fidelity Income Replacement 2038 Fund, Fidelity Income Replacement 2040 Fund and Fidelity Income Replacement 2042 Fund (the Funds) are funds of Fidelity Income Fund (the trust), including the schedules of investments, as of July 31, 2011, and the related statements of operations for the year then ended, the statements of changes in net assets for each of the two years in the period then ended, and the financial highlights for each of the periods presented. These financial statements and financial highlights are the responsibility of the Funds' management. Our responsibility is to express an opinion on these financial statements and financial highlights based on our audits.
We conducted our audits in accordance with the standards of the Public Company Accounting Oversight Board (United States). Those standards require that we plan and perform the audit to obtain reasonable assurance about whether the financial statements and financial highlights are free of material misstatement. The Funds are not required to have, nor were we engaged to perform, an audit of its internal control over financial reporting. Our audits included consideration of internal control over financial reporting as a basis for designing audit procedures that are appropriate in the circumstances, but not for the purpose of expressing an opinion on the effectiveness of the Fund's internal control over financial reporting. Accordingly, we express no such opinion. An audit also includes examining, on a test basis, evidence supporting the amounts and disclosures in the financial statements, assessing the accounting principles used and significant estimates made by management, as well as evaluating the overall financial statement presentation. Our procedures included confirmation of securities owned as of July 31, 2011, by correspondence with the custodians and brokers; where replies were not received from brokers, we performed other auditing procedures. We believe that our audits provide a reasonable basis for our opinion.
In our opinion, the financial statements and financial highlights referred to above present fairly, in all material respects, the financial position of Fidelity Income Replacement 2016 Fund, Fidelity Income Replacement 2018 Fund, Fidelity Income Replacement 2020 Fund, Fidelity Income Replacement 2022 Fund, Fidelity Income Replacement 2024 Fund, Fidelity Income Replacement 2026 Fund, Fidelity Income Replacement 2028 Fund, Fidelity Income Replacement 2030 Fund, Fidelity Income Replacement 2032 Fund, Fidelity Income Replacement 2034 Fund, Fidelity Income Replacement 2036 Fund, Fidelity Income Replacement 2038 Fund, Fidelity Income Replacement 2040 Fund and Fidelity Income Replacement 2042 Fund as of July 31, 2011, the results of their operations for the year then ended, the changes in their net assets for each of the two years in the period then ended, and their financial highlights for each of the periods presented, in conformity with accounting principles generally accepted in the United States of America.
/s/ Deloitte & Touche LLP
DELOITTE & TOUCHE LLP
Boston, Massachusetts
September 21, 2011
Annual Report
The Trustees and executive officers of the trust and funds, as applicable, are listed below. The Board of Trustees governs each Fidelity Income Replacement Fund and is responsible for protecting the interests of shareholders. The Trustees are experienced executives who meet periodically throughout the year to oversee each Fidelity Income Replacement Fund's activities, review contractual arrangements with companies that provide services to each Fidelity Income Replacement Fund, oversee management of the risks associated with such activities and contractual arrangements, and review each Fidelity Income Replacement Fund's performance. If the interests of a Fidelity Income Replacement Fund and an underlying Fidelity fund were to diverge, a conflict of interest could arise and affect how the Trustees fulfill their fiduciary duties to the affected funds. Strategic Advisers has structured the Fidelity Income Replacement Funds to avoid these potential conflicts, although there may be situations where a conflict of interest is unavoidable. In such instances, Strategic Advisers and the Trustees would take reasonable steps to minimize and, if possible, eliminate the conflict. Except for James C. Curvey, each of the Trustees oversees 198 funds advised by FMR or an affiliate. Mr. Curvey oversees 419 funds advised by FMR or an affiliate.
The Trustees hold office without limit in time except that (a) any Trustee may resign; (b) any Trustee may be removed by written instrument, signed by at least two-thirds of the number of Trustees prior to such removal; (c) any Trustee who requests to be retired or who has become incapacitated by illness or injury may be retired by written instrument signed by a majority of the other Trustees; and (d) any Trustee may be removed at any special meeting of shareholders by a two-thirds vote of the outstanding voting securities of the trust. Each Trustee who is not an interested person (as defined in the 1940 Act) (Independent Trustee), shall retire not later than the last day of the calendar year in which his or her 75th birthday occurs. The Independent Trustees may waive this mandatory retirement age policy with respect to individual Trustees. The executive officers hold office without limit in time, except that any officer may resign or may be removed by a vote of a majority of the Trustees at any regular meeting or any special meeting of the Trustees. Except as indicated, each individual has held the office shown or other offices in the same company for the past five years.
Experience, Skills, Attributes, and Qualifications of the Funds' Trustees. The Governance and Nominating Committee has adopted a statement of policy that describes the experience, qualifications, attributes, and skills that are necessary and desirable for potential Independent Trustee candidates (Statement of Policy). The Board believes that each Trustee satisfied at the time he or she was initially elected or appointed a Trustee, and continues to satisfy, the standards contemplated by the Statement of Policy. The Governance and Nominating Committee also engages professional search firms to help identify potential Independent Trustee candidates who have the experience, qualifications, attributes, and skills consistent with the Statement of Policy. From time to time, additional criteria based on the composition and skills of the current Independent Trustees, as well as experience or skills that may be appropriate in light of future changes to board composition, business conditions, and regulatory or other developments, have also been considered by the professional search firms and the Governance and Nominating Committee. In addition, the Board takes into account the Trustees' commitment and participation in Board and committee meetings, as well as their leadership of standing and ad hoc committees throughout their tenure.
In determining that a particular Trustee was and continues to be qualified to serve as a Trustee, the Board has considered a variety of criteria, none of which, in isolation, was controlling. The Board believes that, collectively, the Trustees have balanced and diverse experience, qualifications, attributes, and skills, which allow the Board to operate effectively in governing each fund and protecting the interests of shareholders. Information about the specific experience, skills, attributes, and qualifications of each Trustee, which in each case led to the Board's conclusion that the Trustee should serve (or continue to serve) as a trustee of the funds, is provided below.
Board Structure and Oversight Function. Abigail P. Johnson is an interested person (as defined in the 1940 Act) and currently serves as Chairman. The Trustees have determined that an interested Chairman is appropriate and benefits shareholders because an interested Chairman has a personal and professional stake in the quality and continuity of services provided to the funds. Independent Trustees exercise their informed business judgment to appoint an individual of their choosing to serve as Chairman, regardless of whether the Trustee happens to be independent or a member of management. The Independent Trustees have determined that they can act independently and effectively without having an Independent Trustee serve as Chairman and that a key structural component for assuring that they are in a position to do so is for the Independent Trustees to constitute a substantial majority for the Board. The Independent Trustees also regularly meet in executive session. Kenneth L. Wolfe serves as Chairman of the Independent Trustees and as such (i) acts as a liaison between the Independent Trustees and management with respect to matters important to the Independent Trustees and (ii) with management prepares agendas for Board meetings.
Fidelity funds are overseen by different Boards of Trustees. The funds' Board oversees Fidelity's investment-grade bond, money market, and asset allocation funds and another Board oversees Fidelity's equity and high income funds. The asset allocation funds may invest in Fidelity funds that are overseen by such other Board. The use of separate Boards, each with its own committee structure, allows the Trustees of each group of Fidelity funds to focus on the unique issues of the funds they oversee, including common research, investment, and operational issues. On occasion, the separate Boards establish joint committees to address issues of overlapping consequences for the Fidelity funds overseen by each Board.
The Trustees operate using a system of committees to facilitate the timely and efficient consideration of all matters of importance to the Trustees, each fund, and fund shareholders and to facilitate compliance with legal and regulatory requirements and oversight of the funds' activities and associated risks. The Board, acting through its committees, has charged FMR and its affiliates with (i) identifying events or circumstances the occurrence of which could have demonstrably adverse effects on the funds' business and/or reputation; (ii) implementing processes and controls to lessen the possibility that such events or circumstances occur or to mitigate the effects of such events or circumstances if they do occur; and (iii) creating and maintaining a system designed to evaluate continuously business and market conditions in order to facilitate the identification and implementation processes described in (i) and (ii) above. Because the day-to-day operations and activities of the funds are carried out by or through FMR, its affiliates and other service providers, the funds' exposure to risks is mitigated but not eliminated by the processes overseen by the Trustees. While each of the Board's committees has responsibility for overseeing different aspects of the funds' activities, oversight is exercised primarily through the Operations and Audit Committees. Appropriate personnel, including but not limited to the funds' Chief Compliance Officer (CCO), FMR's internal auditor, the independent accountants, the funds' Treasurer and portfolio management personnel, make periodic reports to the Board's committees, as appropriate. The responsibilities of each committee, including their oversight responsibilities, are described further under "Standing Committees of the Funds' Trustees."
Annual Report
Trustees and Officers - continued
The funds' Statement of Additional Information (SAI) includes more information about the Trustees. To request a free copy, call Fidelity at 1-877-208-0098.
Interested Trustees*:
Correspondence intended for each Trustee who is an interested person may be sent to Fidelity Investments, 82 Devonshire Street, Boston, Massachusetts 02109.
Name, Age; Principal Occupations and Other Relevant Experience+ |
Abigail P. Johnson (49) |
| Year of Election or Appointment: 2009 Ms. Johnson is Trustee and Chairman of the Board of Trustees of certain Trusts. Ms. Johnson serves as President of Personal, Workplace and Institutional Services (2005-present). Ms. Johnson is Chairman and Director of FMR Co., Inc. (2011-present), Chairman and Director of FMR (2011-present), and the Vice Chairman and Director (2007-present) of FMR LLC. Previously, Ms. Johnson served as President and a Director of FMR (2001-2005), a Trustee of other investment companies advised by FMR, Fidelity Investments Money Management, Inc., and FMR Co., Inc. (2001-2005), Senior Vice President of the Fidelity funds (2001-2005), and managed a number of Fidelity funds. Ms. Abigail P. Johnson and Mr. Arthur E. Johnson are not related. |
James C. Curvey (76) |
| Year of Election or Appointment: 2007 Mr. Curvey also serves as Trustee (2007-present) of other investment companies advised by FMR. Mr. Curvey is a Director of Fidelity Investments Money Management, Inc. (2009-present), Director of Fidelity Research & Analysis Co. (2009-present) and Director of FMR and FMR Co., Inc. (2007-present). Mr. Curvey is also Vice Chairman (2007-present) and Director of FMR LLC. In addition, Mr. Curvey serves as an Overseer for the Boston Symphony Orchestra and a member of the Trustees of Villanova University. Previously, Mr. Curvey was the Vice Chairman (2006-2007) and Director (2000-2007) of FMR Corp. |
* Trustees have been determined to be "Interested Trustees" by virtue of, among other things, their affiliation with the trust or various entities under common control with FMR.
+ The information above includes each Trustee's principal occupation during the last five years and other information relating to the experience, attributes, and skills relevant to each Trustee's qualifications to serve as a Trustee, which led to the conclusion that each Trustee should serve as a Trustee for each fund.
Independent Trustees:
Correspondence intended for each Independent Trustee (that is, the Trustees other than the Interested Trustees) may be sent to Fidelity Investments, P.O. Box 55235, Boston, Massachusetts 02205-5235.
Name, Age; Principal Occupations and Other Relevant Experience+ |
Albert R. Gamper, Jr. (69) |
| Year of Election or Appointment: 2006 Mr. Gamper is Vice Chairman of the Independent Trustees of the Fixed Income and Asset Allocation Funds (2011-present). Prior to his retirement in December 2004, Mr. Gamper served as Chairman of the Board of CIT Group Inc. (commercial finance). During his tenure with CIT Group Inc. Mr. Gamper served in numerous senior management positions, including Chairman (1987-1989; 1999-2001; 2002-2004), Chief Executive Officer (1987-2004), and President (2002-2003). He also served as President and Chief Executive Officer of Tyco Capital Corporation (2001-2002). Mr. Gamper currently serves as a member of the Board of Directors of Public Service Enterprise Group (utilities, 2000-present), a member of the Board of Trustees, Rutgers University (2004-present), and Chairman of the Board of Saint Barnabas Health Care System. Previously, Mr. Gamper served as Chairman of the Board of Governors, Rutgers University (2004-2007). |
Robert F. Gartland (59) |
| Year of Election or Appointment: 2010 Mr. Gartland is a partner and investor of Vietnam Partners LLC (investments and consulting, 2008-present) and is Chairman and an investor in Gartland and Mellina Group Corp. (consulting, 2009-present). Prior to his retirement, Mr. Gartland held a variety of positions at Morgan Stanley (financial services, 1979-2007) including Managing Director (1987-2007). |
Arthur E. Johnson (64) |
| Year of Election or Appointment: 2008 Mr. Johnson serves as a member of the Board of Directors of Eaton Corporation (diversified power management, 2009-present) and AGL Resources, Inc. (holding company). Prior to his retirement, Mr. Johnson served as Senior Vice President of Corporate Strategic Development of Lockheed Martin Corporation (defense contractor, 1999-2009). He previously served on the Board of Directors of IKON Office Solutions, Inc. (1999-2008) and Delta Airlines (2005-2007). Mr. Arthur E. Johnson and Ms. Abigail P. Johnson are not related. |
Michael E. Kenneally (57) |
| Year of Election or Appointment: 2009 Previously, Mr. Kenneally served as a Member of the Advisory Board for certain Fidelity Fixed Income and Asset Allocation Funds (2008-2009). Prior to his retirement, Mr. Kenneally served as Chairman and Global Chief Executive Officer of Credit Suisse Asset Management (2003-2005). Mr. Kenneally was a Director of the Credit Suisse Funds (U.S. mutual funds, 2004-2008) and certain other closed-end funds (2004-2005) and was awarded the Chartered Financial Analyst (CFA) designation in 1991. |
James H. Keyes (70) |
| Year of Election or Appointment: 2007 Mr. Keyes serves as a member of the Boards of Navistar International Corporation (manufacture and sale of trucks, buses, and diesel engines, since 2002) and Pitney Bowes, Inc. (integrated mail, messaging, and document management solutions, since 1998). Prior to his retirement, Mr. Keyes served as Chairman and Chief Executive Officer of Johnson Controls (automotive, building, and energy, 1998-2002) and as a member of the Board of LSI Logic Corporation (semiconductor technologies, 1984-2008). |
Marie L. Knowles (64) |
| Year of Election or Appointment: 2001 Prior to Ms. Knowles' retirement in June 2000, she served as Executive Vice President and Chief Financial Officer of Atlantic Richfield Company (ARCO) (diversified energy, 1996-2000). From 1993 to 1996, she was a Senior Vice President of ARCO and President of ARCO Transportation Company. She served as a Director of ARCO from 1996 to 1998. Ms. Knowles currently serves as a Director and Chairman of the Audit Committee of McKesson Corporation (healthcare service, since 2002). Ms. Knowles is an Honorary Trustee of the Brookings Institution and a member of the Board of the Catalina Island Conservancy and of the Santa Catalina Island Company (2009-present). She also serves as a member of the Advisory Board for the School of Engineering of the University of Southern California and the Foundation Board of the School of Architecture at the University of Virginia (2007-present). Previously, Ms. Knowles served as a Director of Phelps Dodge Corporation (copper mining and manufacturing, 1994-2007). |
Kenneth L. Wolfe (72) |
| Year of Election or Appointment: 2005 Mr. Wolfe is Chairman of the Independent Trustees of the Fixed Income and Asset Allocation Funds (2008-present). Prior to his retirement, Mr. Wolfe served as Chairman and a Director (2007-2009) and Chairman and Chief Executive Officer (1994-2001) of Hershey Foods Corporation. He also served as a member of the Boards of Adelphia Communications Corporation (telecommunications, 2003-2006), Bausch & Lomb, Inc. (medical/pharmaceutical, 1993-2007), and Revlon, Inc. (personal care products, 2004-2009). |
+ The information above includes each Trustee's principal occupation during the last five years and other information relating to the experience, attributes, and skills relevant to each Trustee's qualifications to serve as a Trustee, which led to the conclusion that each Trustee should serve as a Trustee for each fund.
Executive Officers:
Correspondence intended for each executive officer may be sent to Fidelity Investments, 82 Devonshire Street, Boston, Massachusetts 02109.
Name, Age; Principal Occupation |
John R. Hebble (53) |
| Year of Election or Appointment: 2008 President and Treasurer of Fidelity's Fixed Income and Asset Allocation Funds. Mr. Hebble also serves as President (2011-present), Treasurer, and Chief Financial Officer of The North Carolina Capital Management Trust: Cash and Term Portfolios (2008-present), Assistant Treasurer of other Fidelity funds (2009-present) and is an employee of Fidelity Investments. |
Derek L. Young (46) |
| Year of Election or Appointment: 2009 Vice President of Fidelity's Asset Allocation Funds. Mr. Young also serves as Chief Investment Officer of the Global Asset Allocation Group (2009-present). Previously, Mr. Young served as a portfolio manager. |
Scott C. Goebel (43) |
| Year of Election or Appointment: 2008 Secretary and Chief Legal Officer (CLO) of the Fidelity funds. Mr. Goebel also serves as Secretary of Fidelity Investments Money Management, Inc. (FIMM) (2010-present) and Fidelity Research and Analysis Company (FRAC) (2010-present); Secretary and CLO of The North Carolina Capital Management Trust: Cash and Term Portfolios (2008-present); General Counsel, Secretary, and Senior Vice President of FMR (2008-present) and FMR Co., Inc. (2008-present); employed by FMR LLC or an affiliate (2001-present); Chief Legal Officer of Fidelity Management & Research (Hong Kong) Limited (2008-present) and Assistant Secretary of Fidelity Management & Research (Japan) Inc. (2008-present), and Fidelity Management & Research (U.K.) Inc. (2008-present). Previously, Mr. Goebel served as Assistant Secretary of FIMM (2008-2010), FRAC (2008-2010), and the Funds (2007-2008) and as Vice President and Secretary of Fidelity Distributors Corporation (FDC) (2005-2007). |
David J. Carter (38) |
| Year of Election or Appointment: 2010 Assistant Secretary of Fidelity's Fixed Income and Asset Allocation Funds. Mr. Carter also serves as Vice President, Associate General Counsel (2010-present) and is an employee of Fidelity Investments (2005-present). |
Holly C. Laurent (57) |
| Year of Election or Appointment: 2008 Anti-Money Laundering (AML) Officer of the Fidelity funds. Ms. Laurent also serves as AML Officer of The North Carolina Capital Management Trust: Cash and Term Portfolios (2008-present) and is an employee of Fidelity Investments. Previously, Ms. Laurent was Senior Vice President and Head of Legal for Fidelity Business Services India Pvt. Ltd. (2006-2008), and Senior Vice President, Deputy General Counsel and Group Head for FMR LLC (2005-2006). |
Christine Reynolds (52) |
| Year of Election or Appointment: 2008 Chief Financial Officer of the Fidelity funds. Ms. Reynolds became President of Fidelity Pricing and Cash Management Services (FPCMS) in August 2008. Ms. Reynolds served as Chief Operating Officer of FPCMS (2007-2008). Previously, Ms. Reynolds served as President, Treasurer, and Anti-Money Laundering officer of the Fidelity funds (2004-2007). |
Michael H. Whitaker (44) |
| Year of Election or Appointment: 2008 Chief Compliance Officer of Fidelity's Fixed Income and Asset Allocation Funds. Mr. Whitaker also serves as Chief Compliance Officer of The North Carolina Capital Management Trust: Cash and Term Portfolios (2008-present). Mr. Whitaker is an employee of Fidelity Investments (2007-present). Prior to joining Fidelity Investments, Mr. Whitaker worked at MFS Investment Management where he served as Senior Vice President and Chief Compliance Officer (2004-2006), and Assistant General Counsel. |
Jeffrey S. Christian (49) |
| Year of Election or Appointment: 2009 Deputy Treasurer of the Fidelity funds. Mr. Christian is an employee of Fidelity Investments. Previously, Mr. Christian served as Chief Financial Officer (2008-2009) of certain Fidelity funds and Senior Vice President of Fidelity Pricing and Cash Management Services (FPCMS) (2004-2009). |
Bryan A. Mehrmann (50) |
| Year of Election or Appointment: 2005 Deputy Treasurer of the Fidelity funds. Mr. Mehrmann is an employee of Fidelity Investments. |
Stephanie J. Dorsey (42) |
| Year of Election or Appointment: 2008 Deputy Treasurer of Fidelity's Fixed Income and Asset Allocation Funds. Ms. Dorsey also serves as Assistant Treasurer of other Fidelity funds (2010-present) and is an employee of Fidelity Investments (2008-present). Previously, Ms. Dorsey served as Treasurer (2004-2008) of the JPMorgan Mutual Funds and Vice President (2004-2008) of JPMorgan Chase Bank. |
Adrien E. Deberghes (43) |
| Year of Election or Appointment: 2010 Assistant Treasurer of Fidelity's Fixed Income and Asset Allocation Funds. Mr. Deberghes also serves as Deputy Treasurer of other Fidelity funds (2008-present) and is an employee of Fidelity Investments (2008-present). Previously, Mr. Deberghes served as Senior Vice President of Mutual Fund Administration at State Street Corporation (2007-2008), Senior Director of Mutual Fund Administration at Investors Bank & Trust (2005-2007), and Director of Finance for Dunkin' Brands (2000-2005). |
Kenneth B. Robins (41) |
| Year of Election or Appointment: 2009 Assistant Treasurer of the Fidelity Fixed Income and Asset Allocation Funds. Mr. Robins also serves as President and Treasurer of other Fidelity funds (2008-present; 2010-present) and is an employee of Fidelity Investments (2004-present). Previously, Mr. Robins served as Deputy Treasurer of the Fidelity funds (2005-2008) and Treasurer and Chief Financial Officer of The North Carolina Capital Management Trust: Cash and Term Portfolios (2006-2008). |
Gary W. Ryan (52) |
| Year of Election or Appointment: 2005 Assistant Treasurer of the Fidelity funds. Mr. Ryan is an employee of Fidelity Investments. Previously, Mr. Ryan served as Vice President of Fund Reporting in Fidelity Pricing and Cash Management Services (FPCMS) (1999-2005). |
Jonathan Davis (43) |
| Year of Election or Appointment: 2010 Assistant Treasurer of the Fidelity funds. Mr. Davis is an employee of Fidelity Investments. Previously, Mr. Davis served as Vice President and Associate General Counsel of FMR LLC (2003-2010). |
Annual Report
A percentage of the dividends distributed during the fiscal year for the following funds were derived from interest on U.S. Government securities which is generally exempt from state income tax:
Income Replacement 2016 | |
Class A | 10.66% |
Class T | 10.66% |
Class C | 10.66% |
Income Replacement 2018 | |
Class A | 9.57% |
Class T | 9.57% |
Class C | 9.57% |
Income Replacement 2020 | |
Class A | 9.16% |
Class T | 9.16% |
Class C | 9.16% |
Income Replacement 2022 | |
Class A | 8.70% |
Class T | 8.70% |
Class C | 8.70% |
Income Replacement 2024 | |
Class A | 8.26% |
Class T | 8.26% |
Class C | 8.26% |
Income Replacement 2026 | |
Class A | 8.55% |
Class T | 8.55% |
Class C | 8.55% |
Income Replacement 2028 | |
Class A | 7.60% |
Class T | 7.60% |
Class C | 7.60% |
Income Replacement 2030 | |
Class A | 7.54% |
Class T | 7.54% |
Class C | 7.54% |
Income Replacement 2032 | |
Class A | 6.99% |
Class T | 6.99% |
Class C | 6.99% |
Income Replacement 2034 | |
Class A | 6.96% |
Class T | 6.96% |
Class C | 6.96% |
Income Replacement 2036 | |
Class A | 6.72% |
Class T | 6.72% |
Class C | 6.72% |
Income Replacement 2038 | |
Class A | 5.96% |
Class T | 5.96% |
Class C | 5.96% |
Income Replacement 2040 | |
Class A | 6.33% |
Class T | 6.33% |
Class C | 6.33% |
Income Replacement 2042 | |
Class A | 6.54% |
Class T | 6.54% |
Class C | 6.54% |
A percentage of the dividends distributed during the fiscal year for the following funds may be taken into account as a dividend for purposes of the maximum rate under section 1(h)(11) of the Internal Revenue Code.
| Class A | Class T | Class C |
Income Replacement 2016 | | | |
August 2010 | 13% | 16% | 32% |
September 2010 | 20% | 25% | 50% |
October 2010 | 20% | 23% | 34% |
November 2010 | 20% | 25% | 50% |
December 2010 (Ex-Date 12/22/10) | 19% | 19% | 19% |
December 2010 (Ex-Date 12/30/10) | 19% | 20% | 22% |
January 2011 | 5% | 6% | 15% |
February 2011 | 5% | 7% | 29% |
March 2011 | 5% | 6% | 12% |
April 2011 | 5% | 6% | 8% |
May 2011 | 5% | 7% | 15% |
June 2011 | 5% | 7% | 16% |
July 2011 | 5% | 6% | 11% |
| Class A | Class T | Class C |
Income Replacement 2018 | | | |
August 2010 | 17% | 21% | 48% |
September 2010 | 27% | 36% | 78% |
October 2010 | 26% | 30% | 46% |
November 2010 | 27% | 35% | 89% |
December 2010 (Ex-Date 12/22/10) | 24% | 24% | 24% |
December 2010 (Ex-Date 12/30/10) | 25% | 26% | 28% |
January 2011 | 7% | 9% | 25% |
February 2011 | 7% | 10% | 46% |
March 2011 | 7% | 8% | 18% |
April 2011 | 7% | 6% | 10% |
May 2011 | 7% | 9% | 32% |
June 2011 | 7% | 9% | 23% |
July 2011 | 6% | 7% | 9% |
| Class A | Class T | Class C |
Income Replacement 2020 | | | |
August 2010 | 19% | 25% | 60% |
September 2010 | 31% | 41% | 100% |
October 2010 | 31% | 37% | 62% |
November 2010 | 32% | 43% | 100% |
December 2010 (Ex-Date 12/22/10) | 29% | 29% | 29% |
December 2010 (Ex-Date 12/30/10) | 30% | 31% | 34% |
January 2011 | 8% | 11% | 100% |
February 201 | 9% | 13% | 100% |
March 2011 | 8% | 9% | 31% |
April 2011 | 8% | 9% | 14% |
May 2011 | 9% | 12% | 41% |
June 2011 | 9% | 11% | 43% |
July 2011 | 8% | 9% | 12% |
| Class A | Class T | Class C |
Income Replacement 2022 | | | |
August 2010 | 23% | 30% | 98% |
September 2010 | 38% | 51% | 100% |
October 2010 | 36% | 43% | 81% |
November 2010 | 35% | 54% | 100% |
December 2010 (Ex-Date 12/22/10) | 32% | 32% | 32% |
December 2010 (Ex-Date 12/30/10) | 33% | 34% | 37% |
January 2011 | 10% | 13% | 86% |
February 2011 | 11% | 15% | 0% |
March 2011 | 10% | 0% | 67% |
April 2011 | 9% | 12% | 16% |
May 2011 | 10% | 16% | 100% |
June 2011 | 10% | 14% | 58% |
July 2011 | 9% | 10% | 14% |
| Class A | Class T | Class C |
Income Replacement 2024 | | | |
August 2010 | 18% | 24% | 69% |
September 2010 | 40% | 54% | 100% |
October 2010 | 37% | 47% | 73% |
November 2010 | 40% | 59% | 100% |
December 2010 (Ex-Date 12/22/10) | 35% | 35% | 35% |
December 2010 (Ex-Date 12/30/10) | 35% | 37% | 40% |
January 2011 | 11% | 16% | 100% |
February 2011 | 12% | 18% | 100% |
March 2011 | 11% | 15% | 44% |
April 2011 | 10% | 12% | 19% |
May 2011 | 11% | 16% | 100% |
June 2011 | 12% | 17% | 100% |
July 2011 | 11% | 12% | 16% |
| Class A | Class T | Class C |
Income Replacement 2026 | | | |
August 2010 | 19% | 26% | 85% |
September 2010 | 42% | 57% | 100% |
October 2010 | 38% | 45% | 77% |
November 2010 | 44% | 60% | 100% |
December 2010 (Ex-Date 12/22/10) | 38% | 38% | 38% |
December 2010 (Ex-Date 12/30/10) | 38% | 39% | 43% |
January 2011 | 14% | 20% | 0% |
February 2011 | 15% | 25% | 0% |
March 2011 | 12% | 17% | 76% |
April 2011 | 12% | 14% | 21% |
May 2011 | 11% | 22% | 0% |
June 2011 | 13% | 17% | 100% |
July 2011 | 12% | 13% | 19% |
| Class A | Class T | Class C |
Income Replacement 2028 | | | |
August 2010 | 25% | 0% | 100% |
September 2010 | 46% | 62% | 100% |
October 2010 | 43% | 51% | 88% |
November 2010 | 46% | 63% | 100% |
December 2010 (Ex-Date 12/22/10) | 37% | 37% | 37% |
December 2010 (Ex-Date 12/30/10) | 38% | 39% | 43% |
January 2011 | 13% | 18% | 0% |
February 2011 | 13% | 21% | 0% |
March 2011 | 12% | 17% | 52% |
April 2011 | 11% | 13% | 20% |
May 2011 | 13% | 19% | 100% |
June 2011 | 13% | 18% | 100% |
July 2011 | 11% | 13% | 19% |
| Class A | Class T | Class C |
Income Replacement 2030 | | | |
August 2010 | 25% | 36% | 100% |
September 2010 | 52% | 75% | 100% |
October 2010 | 47% | 61% | 100% |
November 2010 | 55% | 0% | 100% |
December 2010 (Ex-Date 12/22/10) | 42% | 42% | 42% |
December 2010 (Ex-Date 12/30/10) | 43% | 44% | 48% |
January 2011 | 14% | 17% | 0% |
February 2011 | 15% | 25% | 0% |
March 2011 | 12% | 19% | 96% |
April 2011 | 12% | 15% | 23% |
May 2011 | 14% | 22% | 59% |
June 2011 | 14% | 23% | 100% |
July 2011 | 12% | 13% | 20% |
| Class A | Class T | Class C |
Income Replacement 2032 | | | |
August 2010 | 30% | 38% | 100% |
September 2010 | 52% | 80% | 0% |
October 2010 | 47% | 59% | 100% |
November 2010 | 50% | 79% | 100% |
December 2010 (Ex-Date 12/22/10) | 41% | 41% | 41% |
December 2010 (Ex-Date 12/30/10) | 42% | 43% | 47% |
January 2011 | 12% | 18% | 71% |
February 2011 | 13% | 19% | 0% |
March 2011 | 12% | 16% | 87% |
April 2011 | 11% | 13% | 21% |
May 2011 | 13% | 21% | 0% |
June 2011 | 11% | 13% | 24% |
July 2011 | 11% | 13% | 19% |
| Class A | Class T | Class C |
Income Replacement 2034 | | | |
August 2010 | 25% | 34% | 100% |
September 2010 | 52% | 72% | 100% |
October 2010 | 48% | 60% | 100% |
November 2010 | 55% | 81% | 0% |
December 2010 (Ex-Date 12/22/10) | 41% | 41% | 41% |
December 2010 (Ex-Date 12/30/10) | 42% | 44% | 48% |
January 2011 | 13% | 15% | 87% |
February 2011 | 14% | 20% | 0% |
March 2011 | 13% | 20% | 100% |
April 2011 | 12% | 14% | 21% |
May 2011 | 15% | 21% | 0% |
June 2011 | 15% | 19% | 0% |
July 2011 | 12% | 14% | 21% |
| Class A | Class T | Class C |
Income Replacement 2036 | | | |
August 2010 | 22% | 31% | 100% |
September 2010 | 56% | 80% | 100% |
October 2010 | 51% | 61% | 100% |
November 2010 | 68% | 100% | 0% |
December 2010 (Ex-Date 12/22/10) | 49% | 49% | 49% |
December 2010 (Ex-Date 12/30/10) | 50% | 51% | 55% |
January 2011 | 15% | 22% | 100% |
February 2011 | 16% | 28% | 0% |
March 2011 | 15% | 20% | 100% |
April 2011 | 14% | 16% | 27% |
May 2011 | 20% | 41% | 0% |
June 2011 | 15% | 22% | 50% |
July 2011 | 14% | 17% | 24% |
| Class A | Class T | Class C |
Income Replacement 2038 | | | |
August 2010 | 26% | 38% | 100% |
September 2010 | 55% | 89% | 100% |
October 2010 | 50% | 63% | 100% |
November 2010 | 60% | 82% | 0% |
December 2010 (Ex-Date 12/22/10) | 44% | 44% | 44% |
December 2010 (Ex-Date 12/30/10) | 45% | 47% | 50% |
January 2011 | 15% | 19% | 100% |
February 2011 | 14% | 22% | 100% |
March 2011 | 14% | 20% | 100% |
April 2011 | 12% | 15% | 24% |
May 2011 | 14% | 29% | 0% |
June 2011 | 15% | 13% | 0% |
July 2011 | 12% | 14% | 21% |
| Class A | Class T | Class C |
Income Replacement 2040 | | | |
August 2010 | 22% | 31% | 100% |
September 2010 | 57% | 79% | 100% |
October 2010 | 51% | 63% | 100% |
November 2010 | 49% | 92% | 0% |
December 2010 (Ex-Date 12/22/10) | 46% | 46% | 46% |
December 2010 (Ex-Date 12/30/10) | 47% | 48% | 51% |
January 2011 | 15% | 28% | 0% |
February 2011 | 100% | 26% | 0% |
March 2011 | 15% | 17% | 44% |
April 2011 | 13% | 15% | 22% |
May 2011 | 18% | 30% | 0% |
June 2011 | 13% | 24% | 0% |
July 2011 | 13% | 15% | 21% |
| Class A | Class T | Class C |
Income Replacement 2042 | | | |
August 2010 | 33% | 50% | 0% |
September 2010 | 57% | 100% | 0% |
October 2010 | 55% | 65% | 100% |
November 2010 | 60% | 87% | 0% |
December 2010 (Ex-Date 12/22/10) | 45% | 45% | 45% |
December 2010 (Ex-Date 12/30/10) | 47% | 48% | 51% |
January 2011 | 17% | 24% | 100% |
February 2011 | 18% | 37% | 0% |
March 2011 | 17% | 30% | 0% |
April 2011 | 15% | 17% | 28% |
May 2011 | 17% | 30% | 0% |
June 2011 | 17% | 25% | 100% |
July 2011 | 14% | 17% | 26% |
The fund will notify shareholders in January 2012 of amounts for use in preparing 2011 income tax returns.
Annual Report
Investment Adviser
Strategic Advisers, Inc.
Boston, MA
General Distributor
Fidelity Distributors Corporation
Boston, MA
Transfer and Service Agents
Fidelity Investments Institutional Operations Company, Inc.
Boston, MA
Fidelity Service Company, Inc.
Boston, MA
Custodian
The Bank of New York Mellon
New York, NY
ARW-UANN-0911
1.848191.103
Fidelity Advisor Income Replacement FundsSM -
2016, 2018, 2020, 2022, 2024, 2026, 2028, 2030, 2032,
2034, 2036, 2038, 2040, 2042 -
Institutional Class
Annual Report
July 31, 2011
Each Institutional Class is a class of
Fidelity Income Replacement FundsSM
(2_fidelity_logos) (Registered_Trademark)
Contents
Annual Report
This report and the financial statements contained herein are submitted for the general information of the shareholders of the funds. This report is not authorized for distribution to prospective investors in the funds unless preceded or accompanied by an effective prospectus.
A fund files its complete schedule of portfolio holdings with the SEC for the first and third quarters of each fiscal year on Form N-Q. Forms N-Q are available on the SEC's web site at http://www.sec.gov. A fund's Forms N-Q may be reviewed and copied at the SEC's Public Reference Room in Washington, DC. Information regarding the operation of the SEC's Public Reference Room may be obtained by calling 1-800-SEC-0330. For a complete list of a fund's portfolio holdings, view the most recent holdings listing, semiannual report, or annual report on Fidelity's web site at http://www.fidelity.com, http://www.advisor.fidelity.com, or http://www.401k.com, as applicable.
NOT FDIC INSURED • MAY LOSE VALUE • NO BANK GUARANTEE
Neither the funds nor Fidelity Distributors Corporation is a bank.
To view a fund's proxy voting guidelines and proxy voting record for the 12-month period ended June 30, visit http://www.fidelity.com/proxyvotingresults or visit the Securities and Exchange Commission's (SEC) web site at http://www.sec.gov. You may also call 1-877-208-0098 to request a free copy of the proxy voting guidelines.
Standard & Poor's, S&P and S&P 500 are registered service marks of The McGraw-Hill Companies, Inc. and have been licensed for use by Fidelity Distributors Corporation.
Other third party marks appearing herein are the property of their respective owners.
All other marks appearing herein are registered or unregistered trademarks or service marks of FMR LLC or an affiliated company.
Annual Report
(photo_of_Abigail_P_Johnson)
Dear Shareholder:
The second half of 2011 began with U.S. equities continuing to give back some of the gains achieved earlier in the year. In the days leading up to July 31, markets were shaken by a political stalemate in which Congress struggled to address the debt ceiling issue before an early-August deadline. The resulting uncertainty held back markets in July, the third consecutive monthly decline for equities, effectively reversing the positive momentum seen through the end of April. Financial markets are always unpredictable, of course, but there are several time-tested investment principles that can help put the odds in your favor.
One of the basic tenets is to invest for the long term. Over time, riding out the markets' inevitable ups and downs has proven much more effective than selling into panic or chasing the hottest trend. Even missing only a few of the markets' best days can significantly diminish investor returns. Patience also affords the benefits of compounding - of earning interest on additional income or reinvested dividends and capital gains. There can be tax advantages and cost benefits to consider as well. While staying the course doesn't eliminate risk, it can considerably lessen the effect of short-term declines.
You can further manage your investing risk through diversification. And today, more than ever, geographic diversification should be taken into account. Studies indicate that asset allocation is the single most important determinant of a portfolio's long-term success. The right mix of stocks, bonds and cash - aligned to your particular risk tolerance and investment objective - is very important. Age-appropriate rebalancing is also an essential aspect of asset allocation. For younger investors, an emphasis on equities - which historically have been the best-performing asset class over time - is encouraged. As investors near their specific goal, such as retirement or sending a child to college, consideration may be given to replacing volatile assets (e.g. common stocks) with more-stable fixed investments (bonds or savings plans).
A third principle - investing regularly - can help lower the average cost of your purchases. Investing a certain amount of money each month or quarter helps ensure you won't pay for all your shares at market highs. This strategy - known as dollar cost averaging - also reduces "emotion" from investing, helping shareholders avoid selling weak performers just prior to an upswing, or chasing a hot performer just before a correction.
We invite you to contact us via the Internet, through our Investor Centers or by phone. It is our privilege to provide you the information you need to make the investments that are right for you.
Sincerely,
(The chairman's signature appears here.)
Abigail P. Johnson
Annual Report
Fidelity Advisor Income Replacement 2016 FundSM - Institutional Class
Average annual total return reflects the change in the value of an investment, assuming reinvestment of the class' distributions from dividend income and capital gains (the profits earned upon the sale of securities that have grown in value, if any) and assuming a constant rate of performance each year. The $25,000 table and the fund's returns do not reflect the deduction of taxes that a shareholder would pay on fund distributions or the redemption of fund shares. During periods of reimbursement by Fidelity, a fund's total return will be greater than it would be had the reimbursement not occurred. How a fund did yesterday is no guarantee of how it will do tomorrow.
Average Annual Total Returns
Periods ended July 31, 2011 | | Past 1
year | Life of
fundA |
Institutional Class | | 8.57% | 2.93% |
A From August 30, 2007.
$25,000 Over Life of Fund
Let's say hypothetically that $25,000 was invested in Fidelity Advisor Income Replacement 2016 Fund - Institutional Class on August 30, 2007, when the fund started. The chart shows how the value of your investment would have changed, and also shows how the Barclays Capital® U.S. Aggregate Bond Index performed over the same period.
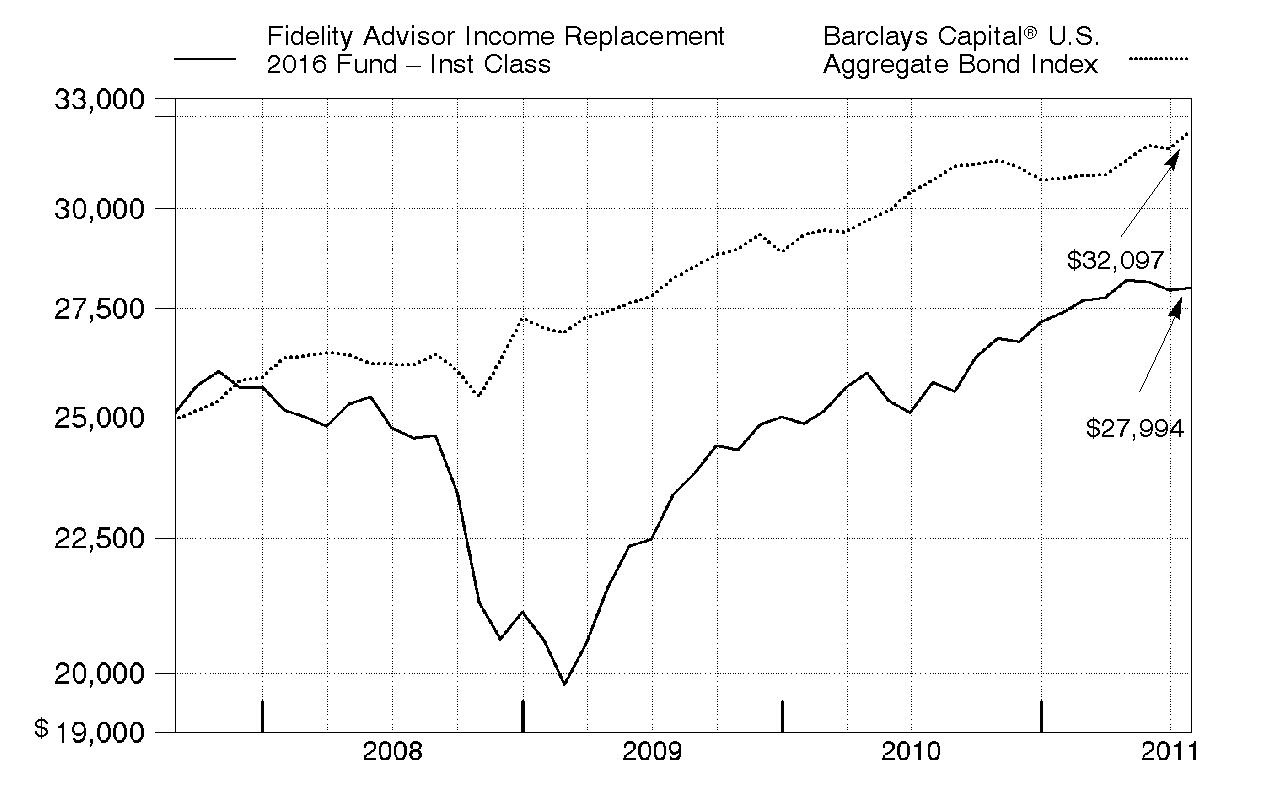
Annual Report
Fidelity Advisor Income Replacement 2018 FundSM - Institutional Class
Performance: The Bottom Line
Average annual total return reflects the change in the value of an investment, assuming reinvestment of the class' distributions from dividend income and capital gains (the profits earned upon the sale of securities that have grown in value, if any) and assuming a constant rate of performance each year. The $25,000 table and the fund's returns do not reflect the deduction of taxes that a shareholder would pay on fund distributions or the redemption of fund shares. During periods of reimbursement by Fidelity, a fund's total return will be greater than it would be had the reimbursement not occurred. How a fund did yesterday is no guarantee of how it will do tomorrow.
Average Annual Total Returns
Periods ended July 31, 2011 | Past 1
year | Life of
fund A |
Institutional Class | 10.03% | 2.99% |
A From August 30, 2007.
$25,000 Over Life of Fund
Let's say hypothetically that $25,000 was invested in Fidelity Advisor Income Replacement 2018 Fund - Institutional Class on August 30, 2007, when the fund started. The chart shows how the value of your investment would have changed, and also shows how the Barclays Capital U.S. Aggregate Bond Index performed over the same period.
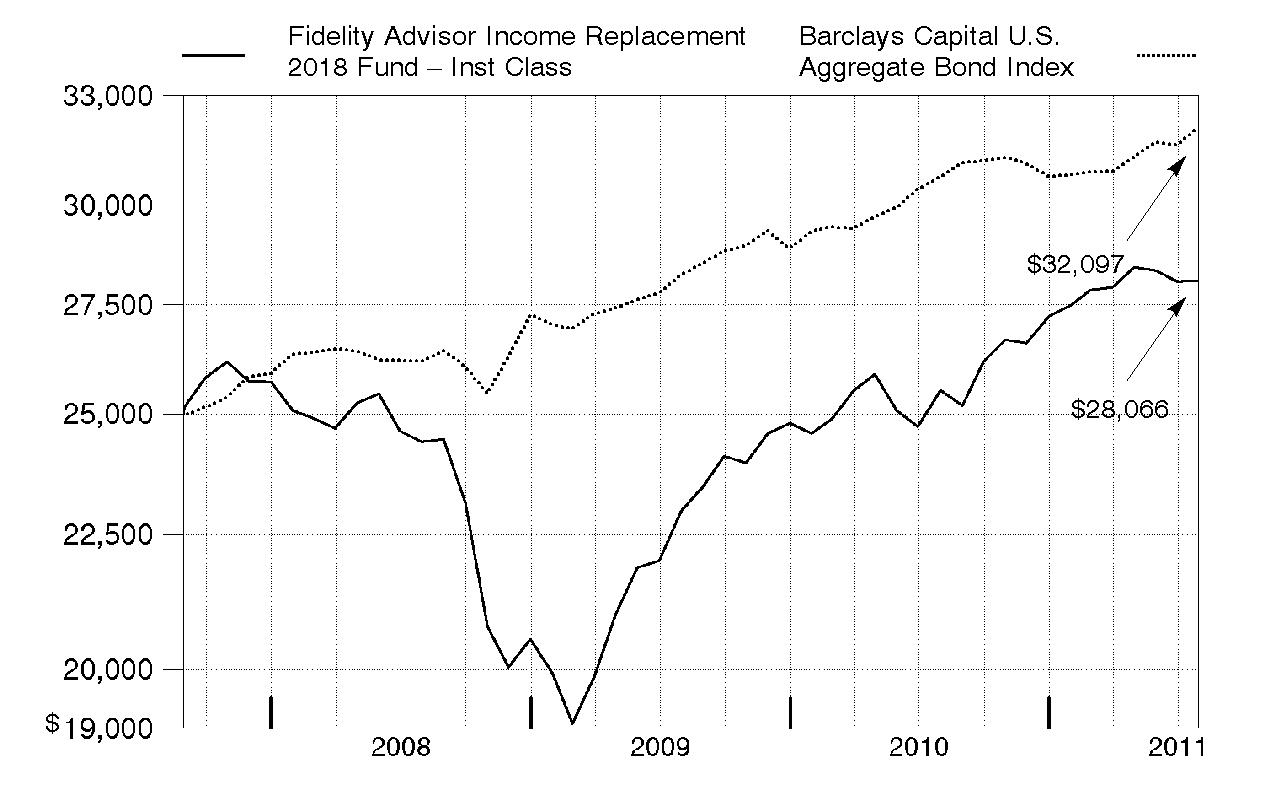
Annual Report
Fidelity Advisor Income Replacement 2020 FundSM - Institutional Class
Performance: The Bottom Line
Average annual total return reflects the change in the value of an investment, assuming reinvestment of the class' distributions from dividend income and capital gains (the profits earned upon the sale of securities that have grown in value, if any) and assuming a constant rate of performance each year. The $25,000 table and the fund's returns do not reflect the deduction of taxes that a shareholder would pay on fund distributions or the redemption of fund shares. During periods of reimbursement by Fidelity, a fund's total return will be greater than it would be had the reimbursement not occurred. How a fund did yesterday is no guarantee of how it will do tomorrow.
Average Annual Total Returns
Periods ended July 31, 2011 | | Past 1
year | Life of
fund A |
Institutional Class | | 11.10% | 2.92% |
A From August 30, 2007.
$25,000 Over Life of Fund
Let's say hypothetically that $25,000 was invested in Fidelity Advisor Income Replacement 2020 Fund - Institutional Class on August 30, 2007, when the fund started. The chart shows how the value of your investment would have changed, and also shows how the Barclays Capital U.S. Aggregate Bond Index performed over the same period.
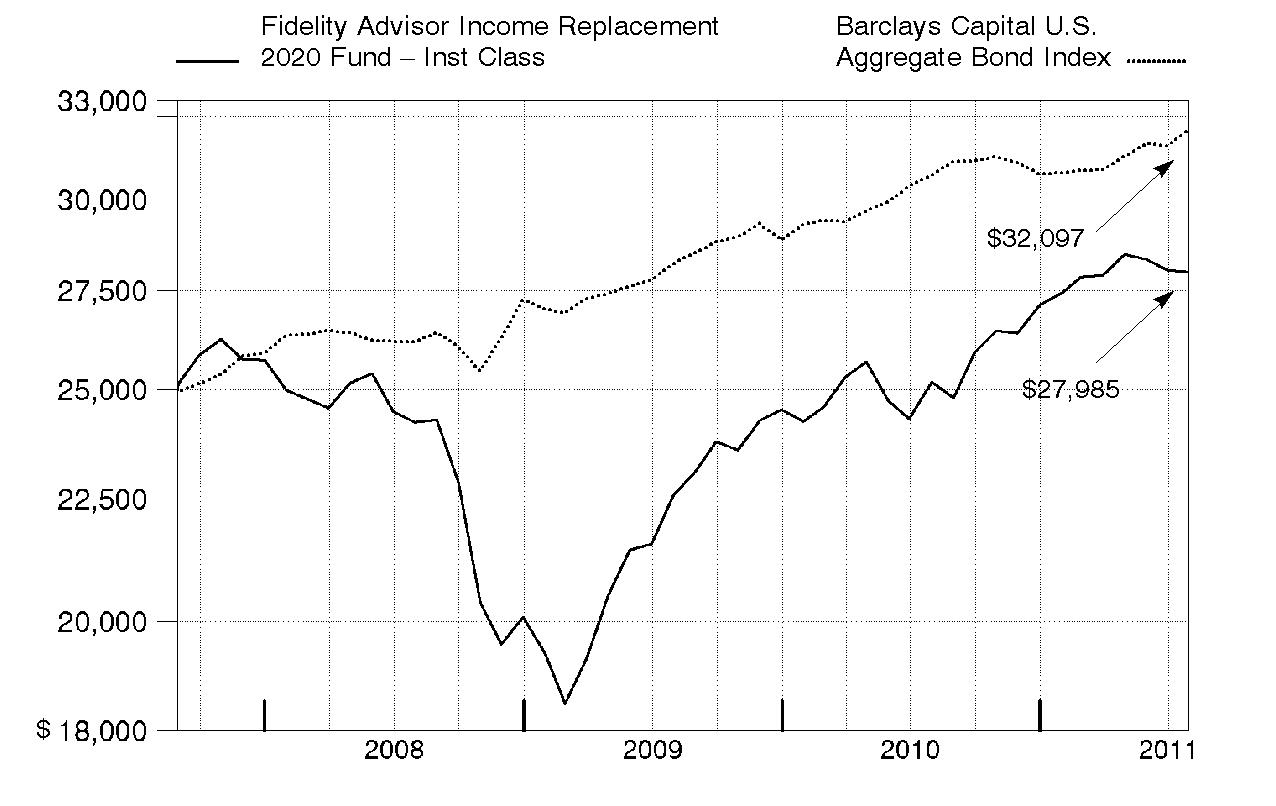
Annual Report
Fidelity Advisor Income Replacement 2022 FundSM - Institutional Class
Performance: The Bottom Line
Average annual total return reflects the change in the value of an investment, assuming reinvestment of the class' distributions from dividend income and capital gains (the profits earned upon the sale of securities that have grown in value, if any) and assuming a constant rate of performance each year. The $25,000 table and the fund's returns do not reflect the deduction of taxes that a shareholder would pay on fund distributions or the redemption of fund shares. During periods of reimbursement by Fidelity, a fund's total return will be greater than it would be had the reimbursement not occurred. How a fund did yesterday is no guarantee of how it will do tomorrow.
Average Annual Total Returns
Periods ended July 31, 2011 | | Past 1
year | Life of
fund A |
Institutional Class | | 11.85% | 2.93% |
A From August 30, 2007.
$25,000 Over Life of Fund
Let's say hypothetically that $25,000 was invested in Fidelity Advisor Income Replacement 2022 Fund - Institutional Class on August 30, 2007, when the fund started. The chart shows how the value of your investment would have changed, and also shows how the Barclays Capital U.S. Aggregate Bond Index performed over the same period.
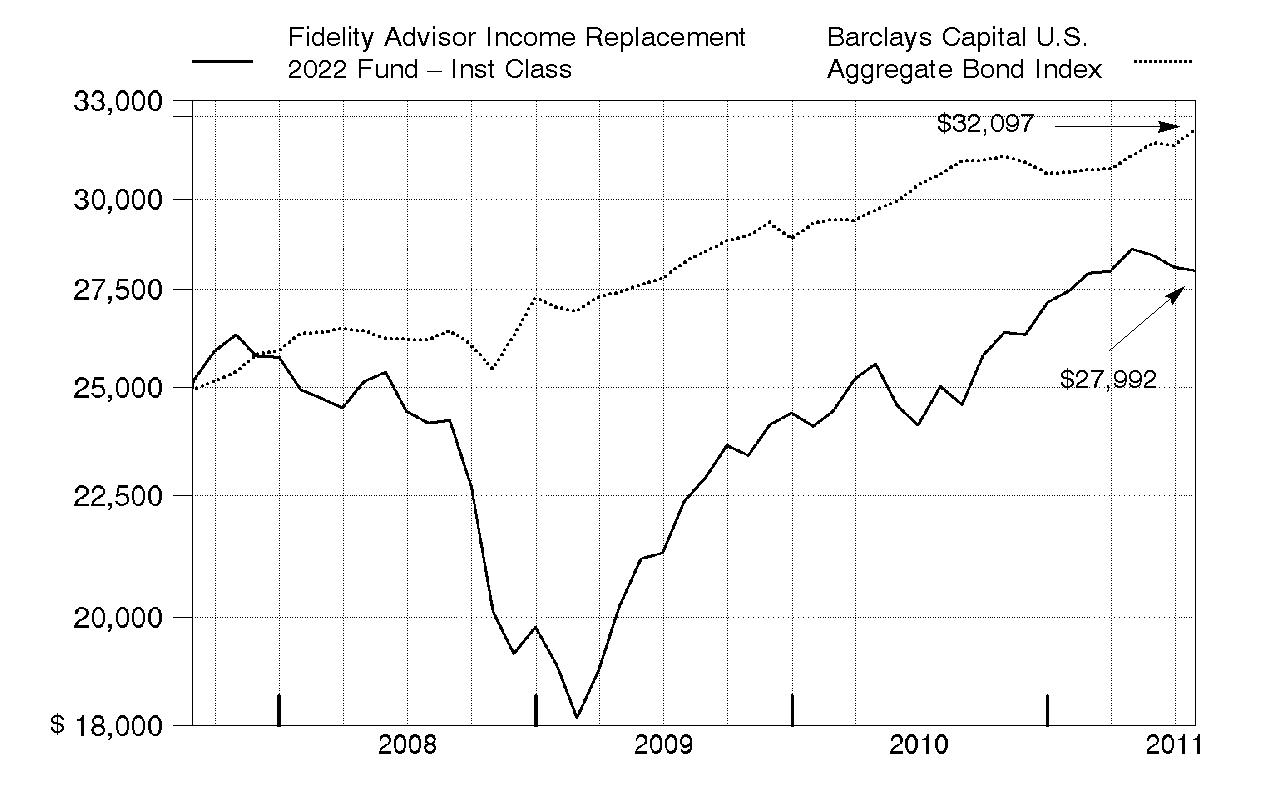
Annual Report
Fidelity Advisor Income Replacement 2024 FundSM - Institutional Class
Performance: The Bottom Line
Average annual total return reflects the change in the value of an investment, assuming reinvestment of the class' distributions from dividend income and capital gains (the profits earned upon the sale of securities that have grown in value, if any) and assuming a constant rate of performance each year. The $25,000 table and the fund's returns do not reflect the deduction of taxes that a shareholder would pay on fund distributions or the redemption of fund shares. During periods of reimbursement by Fidelity, a fund's total return will be greater than it would be had the reimbursement not occurred. How a fund did yesterday is no guarantee of how it will do tomorrow.
Average Annual Total Returns
Periods ended July 31, 2011 | | Past 1
year | Life of
fund A |
Institutional Class | | 12.41% | 2.90% |
A From August 30, 2007.
$25,000 Over Life of Fund
Let's say hypothetically that $25,000 was invested in Fidelity Advisor Income Replacement 2024 Fund - Institutional Class on August 30, 2007, when the fund started. The chart shows how the value of your investment would have changed, and also shows how the S&P 500® Index performed over the same period.
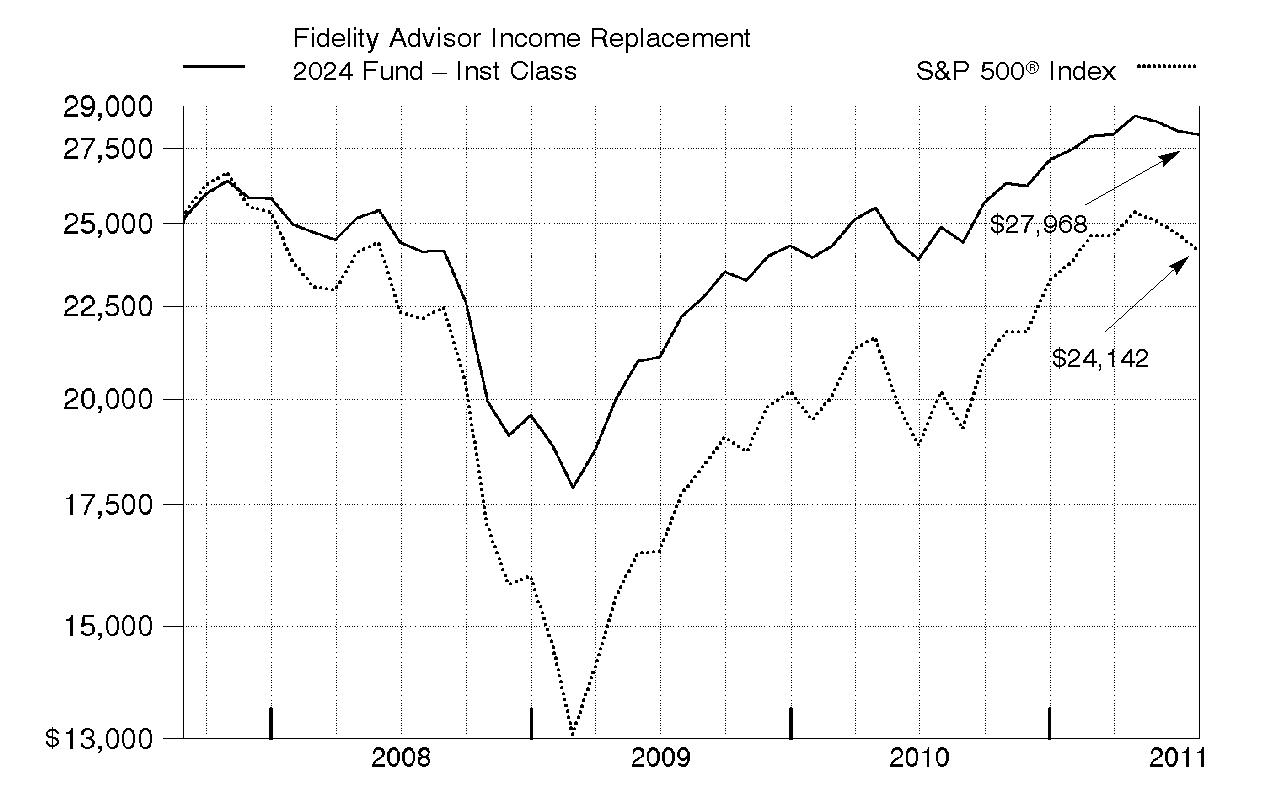
Annual Report
Fidelity Advisor Income Replacement 2026 FundSM - Institutional Class
Performance: The Bottom Line
Average annual total return reflects the change in the value of an investment, assuming reinvestment of the class' distributions from dividend income and capital gains (the profits earned upon the sale of securities that have grown in value, if any) and assuming a constant rate of performance each year. The $25,000 table and the fund's returns do not reflect the deduction of taxes that a shareholder would pay on fund distributions or the redemption of fund shares. During periods of reimbursement by Fidelity, a fund's total return will be greater than it would be had the reimbursement not occurred. How a fund did yesterday is no guarantee of how it will do tomorrow.
Average Annual Total Returns
Periods ended July 31, 2011 | | Past 1
year | Life of
fundA |
Institutional Class | | 12.82% | 2.78% |
A From August 30, 2007.
$25,000 Over Life of Fund
Let's say hypothetically that $25,000 was invested in Fidelity Advisor Income Replacement 2026 Fund - Institutional Class on August 30, 2007, when the fund started. The chart shows how the value of your investment would have changed, and also shows how the S&P 500 Index performed over the same period.
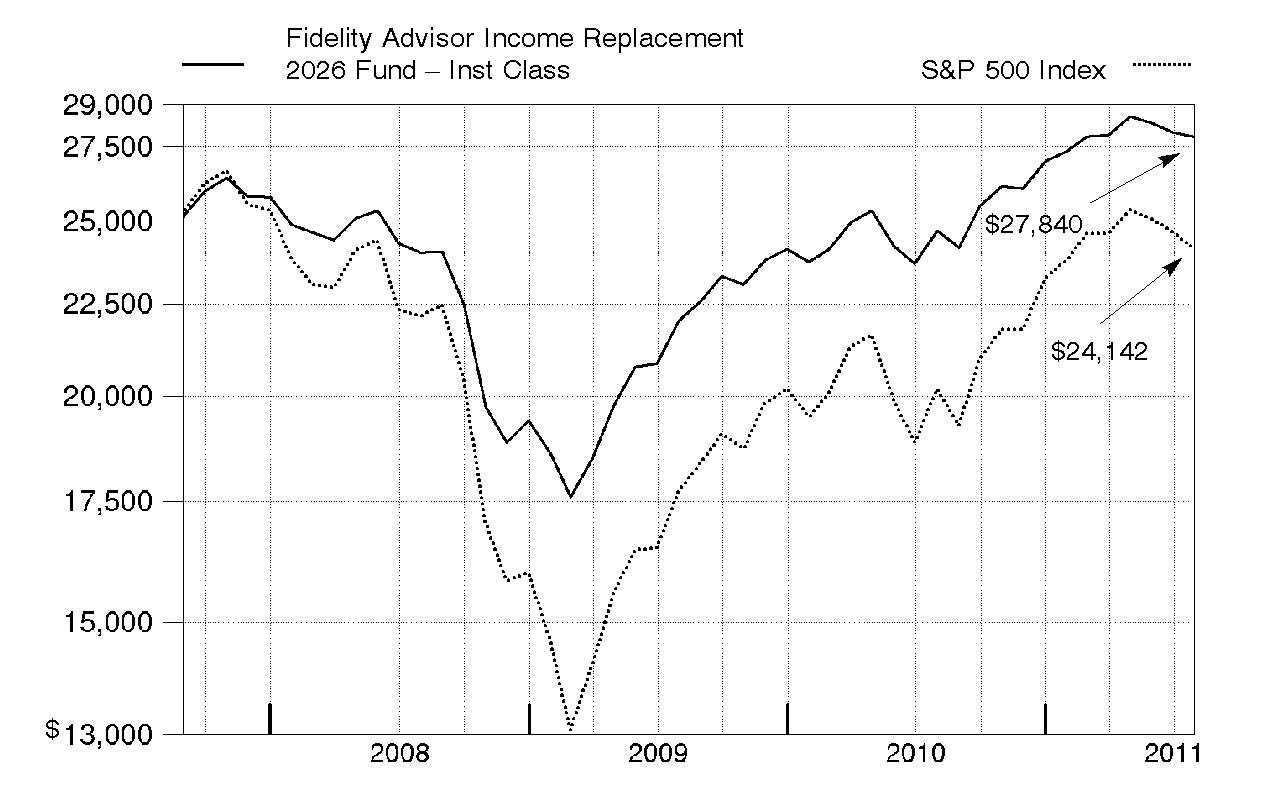
Annual Report
Fidelity Advisor Income Replacement 2028 FundSM - Institutional Class
Performance: The Bottom Line
Average annual total return reflects the change in the value of an investment, assuming reinvestment of the class' distributions from dividend income and capital gains (the profits earned upon the sale of securities that have grown in value, if any) and assuming a constant rate of performance each year. The $25,000 table and the fund's returns do not reflect the deduction of taxes that a shareholder would pay on fund distributions or the redemption of fund shares. During periods of reimbursement by Fidelity, a fund's total return will be greater than it would be had the reimbursement not occurred. How a fund did yesterday is no guarantee of how it will do tomorrow.
Average Annual Total Returns
Periods ended July 31, 2011 | | Past 1
year | Life of
fund A |
Institutional Class | | 13.12% | 2.73% |
A From August 30, 2007.
$25,000 Over Life of Fund
Let's say hypothetically that $25,000 was invested in Fidelity Advisor Income Replacement 2028 Fund - Institutional Class on August 30, 2007, when the fund started. The chart shows how the value of your investment would have changed, and also shows how the S&P 500 Index performed over the same period.
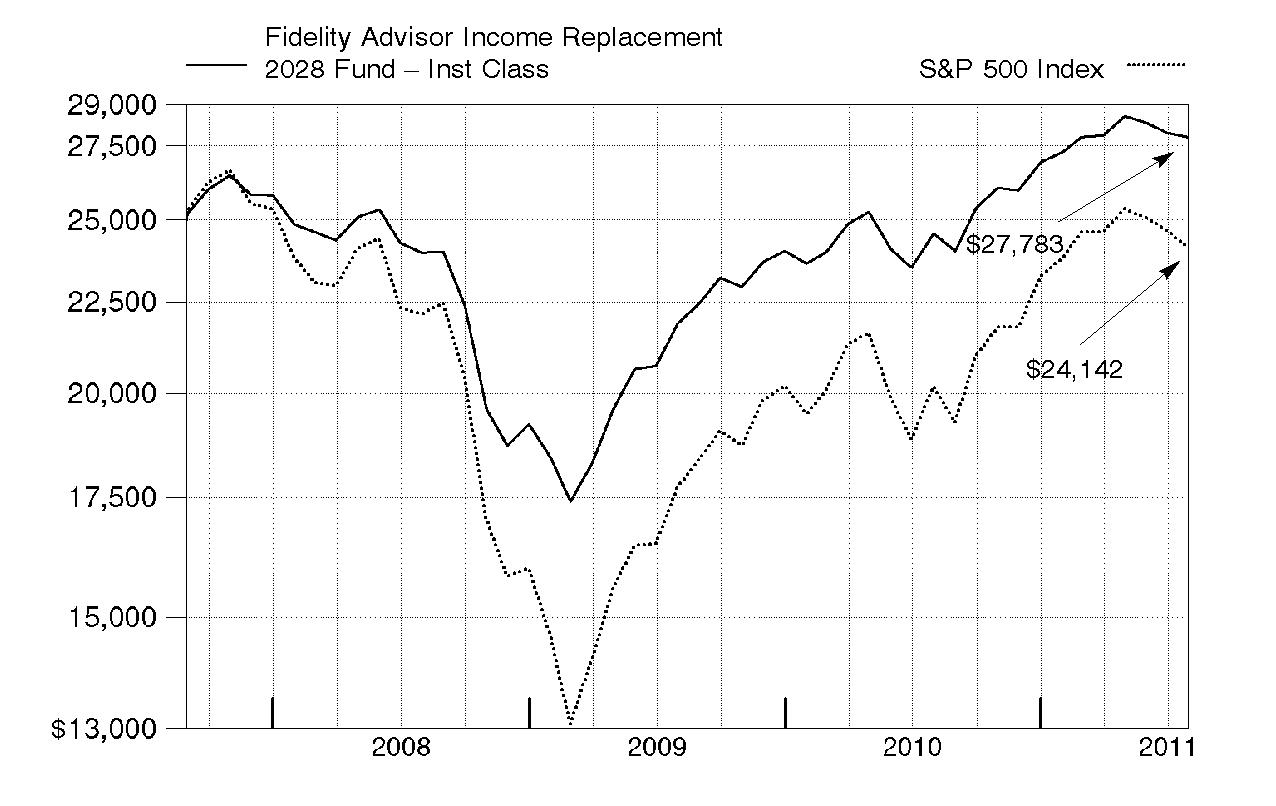
Annual Report
Fidelity Advisor Income Replacement 2030 FundSM - Institutional Class
Performance: The Bottom Line
Average annual total return reflects the change in the value of an investment, assuming reinvestment of the class' distributions from dividend income and capital gains (the profits earned upon the sale of securities that have grown in value, if any) and assuming a constant rate of performance each year. The $25,000 table and the fund's returns do not reflect the deduction of taxes that a shareholder would pay on fund distributions or the redemption of fund shares. During periods of reimbursement by Fidelity, a fund's total return will be greater than it would be had the reimbursement not occurred. How a fund did yesterday is no guarantee of how it will do tomorrow.
Average Annual Total Returns
Periods ended July 31, 2011 | | Past 1
year | Life of
fund A |
Institutional Class | | 13.41% | 2.69% |
A From August 30, 2007.
$25,000 Over Life of Fund
Let's say hypothetically that $25,000 was invested in Fidelity Advisor Income Replacement 2030 Fund - Institutional Class on August 30, 2007, when the fund started. The chart shows how the value of your investment would have changed, and also shows how the S&P 500 Index performed over the same period.
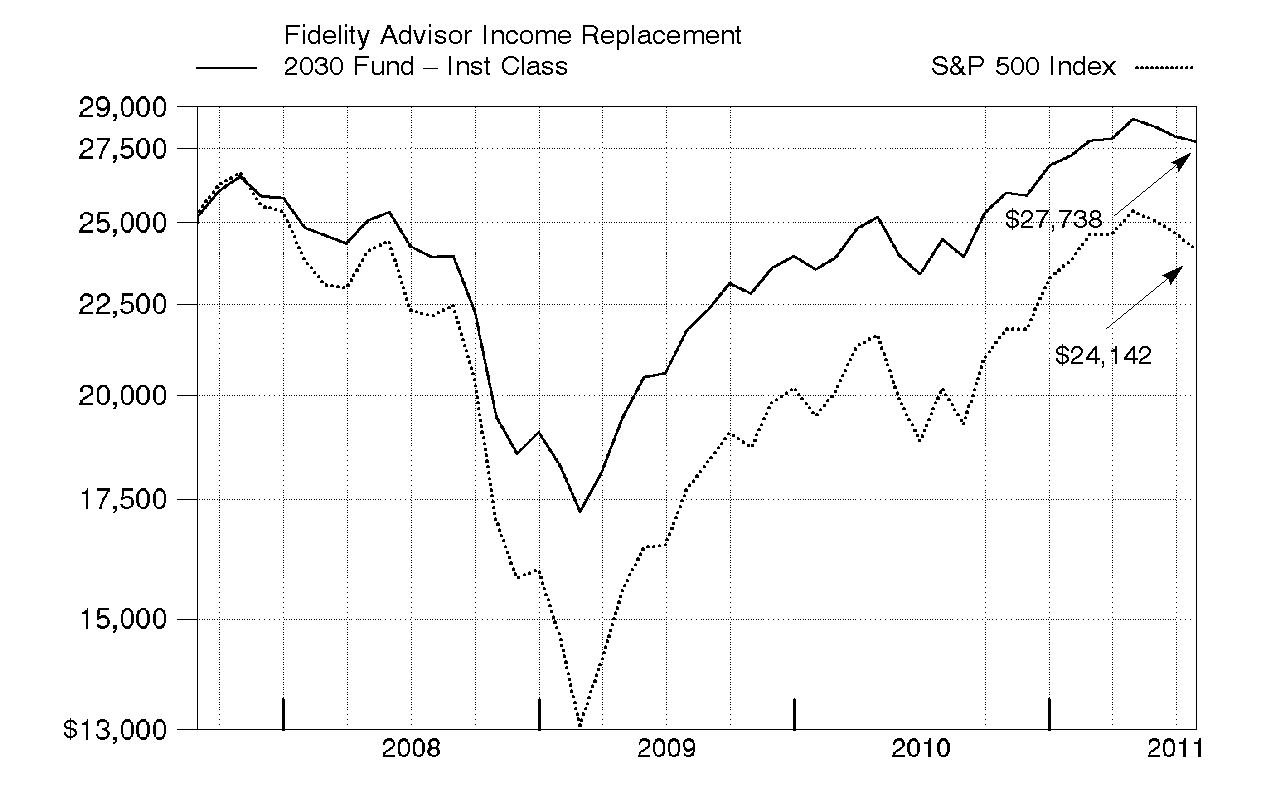
Annual Report
Fidelity Advisor Income Replacement 2032 FundSM - Institutional Class
Performance: The Bottom Line
Average annual total return reflects the change in the value of an investment, assuming reinvestment of the class' distributions from dividend income and capital gains (the profits earned upon the sale of securities that have grown in value, if any) and assuming a constant rate of performance each year. The $25,000 table and the fund's returns do not reflect the deduction of taxes that a shareholder would pay on fund distributions or the redemption of fund shares. During periods of reimbursement by Fidelity, a fund's total return will be greater than it would be had the reimbursement not occurred. How a fund did yesterday is no guarantee of how it will do tomorrow.
Average Annual Total Returns
Periods ended July 31, 2011 | | Past 1
year | Life of
fund A |
Institutional Class | | 13.68% | 2.59% |
A From August 30, 2007.
$25,000 Over Life of Fund
Let's say hypothetically that $25,000 was invested in Fidelity Advisor Income Replacement 2032 Fund - Institutional Class on August 30, 2007, when the fund started. The chart shows how the value of your investment would have changed, and also shows how the S&P 500 Index performed over the same period.
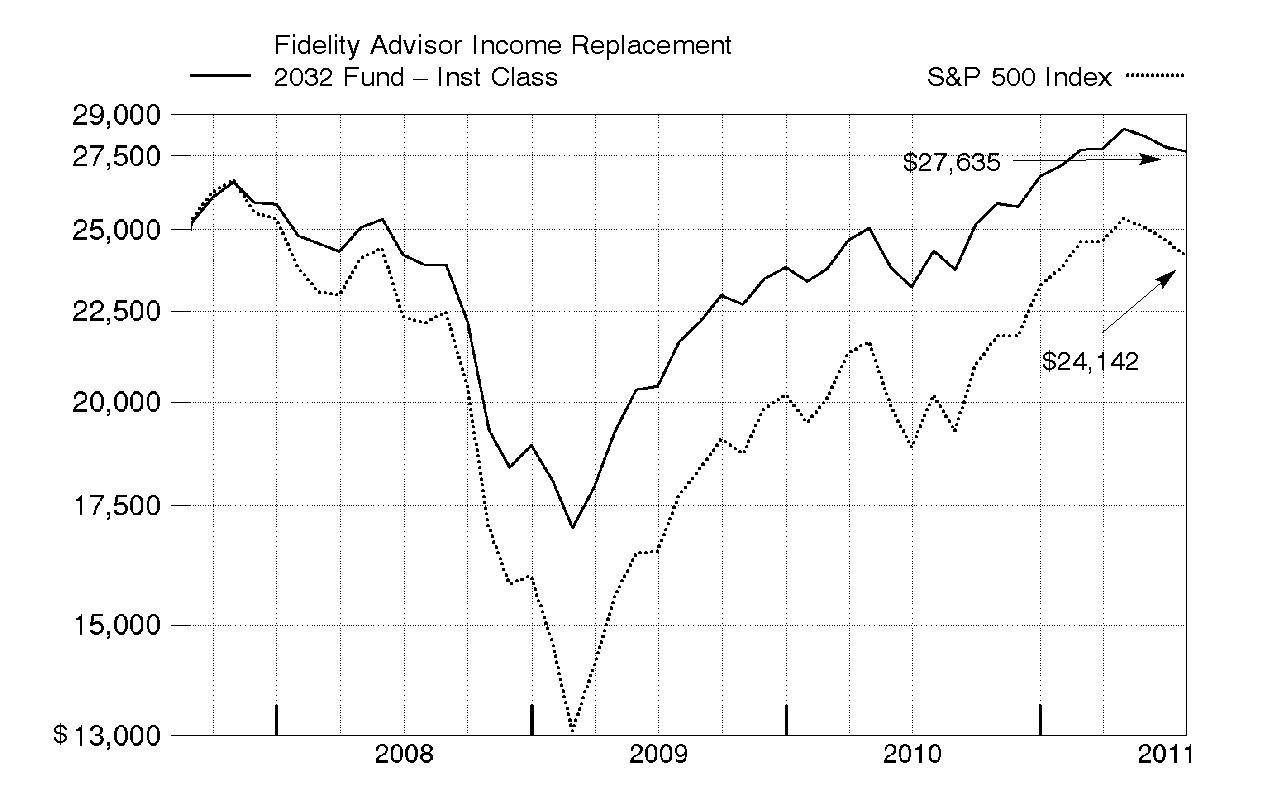
Annual Report
Fidelity Advisor Income Replacement 2034 FundSM - Institutional Class
Performance: The Bottom Line
Average annual total return reflects the change in the value of an investment, assuming reinvestment of the class' distributions from dividend income and capital gains (the profits earned upon the sale of securities that have grown in value, if any) and assuming a constant rate of performance each year. The $25,000 table and the fund's returns do not reflect the deduction of taxes that a shareholder would pay on fund distributions or the redemption of fund shares. During periods of reimbursement by Fidelity, a fund's total return will be greater than it would be had the reimbursement not occurred. How a fund did yesterday is no guarantee of how it will do tomorrow.
Average Annual Total Returns
Periods ended July 31, 2011 | | Past 1
year | Life of
fund A |
Institutional Class | | 13.97% | 2.44% |
A From August 30, 2007.
$25,000 Over Life of Fund
Let's say hypothetically that $25,000 was invested in Fidelity Advisor Income Replacement 2034 Fund - Institutional Class on August 30, 2007, when the fund started. The chart shows how the value of your investment would have changed, and also shows how the S&P 500 Index performed over the same period.
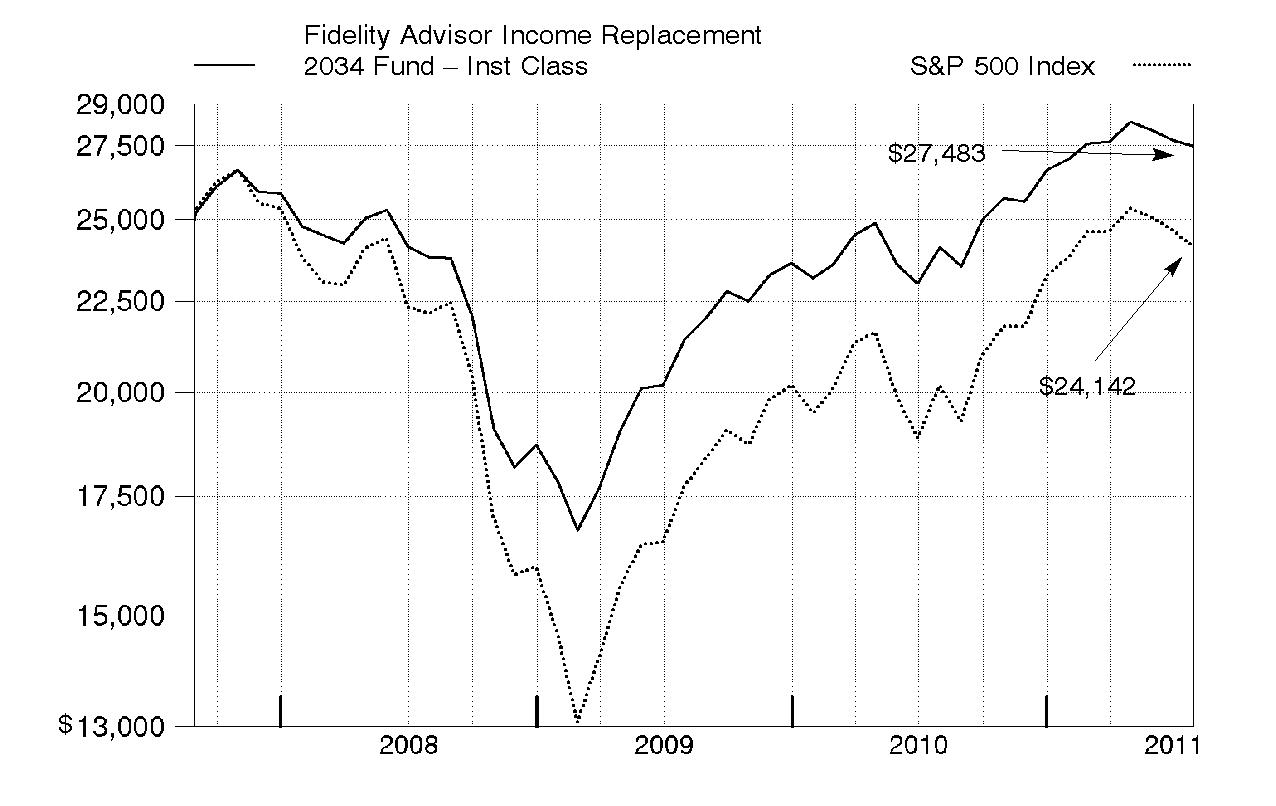
Annual Report
Fidelity Advisor Income Replacement 2036 FundSM - Institutional Class
Performance: The Bottom Line
Average annual total return reflects the change in the value of an investment, assuming reinvestment of the class' distributions from dividend income and capital gains (the profits earned upon the sale of securities that have grown in value, if any) and assuming a constant rate of performance each year. The $25,000 table and the fund's returns do not reflect the deduction of taxes that a shareholder would pay on fund distributions or the redemption of fund shares. During periods of reimbursement by Fidelity, a fund's total return will be greater than it would be had the reimbursement not occurred. How a fund did yesterday is no guarantee of how it will do tomorrow.
Average Annual Total Returns
Periods ended July 31, 2011 | Past 1
year | Life of
fund A |
Institutional Class | 14.30% | 2.38% |
A From August 30, 2007.
$25,000 Over Life of Fund
Let's say hypothetically that $25,000 was invested in Fidelity Advisor Income Replacement 2036 Fund - Institutional Class on August 30, 2007, when the fund started. The chart shows how the value of your investment would have changed, and also shows how the S&P 500 Index performed over the same period.

Annual Report
Fidelity Advisor Income Replacement 2038 FundSM - Institutional Class
Performance: The Bottom Line
Average annual total return reflects the change in the value of an investment, assuming reinvestment of the class' distributions from dividend income and capital gains (the profits earned upon the sale of securities that have grown in value, if any) and assuming a constant rate of performance each year. The $25,000 table and the fund's returns do not reflect the deduction of taxes that a shareholder would pay on fund distributions or the redemption of fund shares. During periods of reimbursement by Fidelity, a fund's total return will be greater than it would be had the reimbursement not occurred. How a fund did yesterday is no guarantee of how it will do tomorrow.
Average Annual Total Returns
Periods ended July 31, 2011 | | Past 1
year | Life of
fund A |
Institutional Class | | 14.74% | 1.48% |
A From December 31, 2007.
$25,000 Over Life of Fund
Let's say hypothetically that $25,000 was invested in Fidelity Advisor Income Replacement 2038 Fund - Institutional Class on December 31, 2007, when the fund started. The chart shows how the value of your investment would have changed, and also shows how the S&P 500 Index performed over the same period.
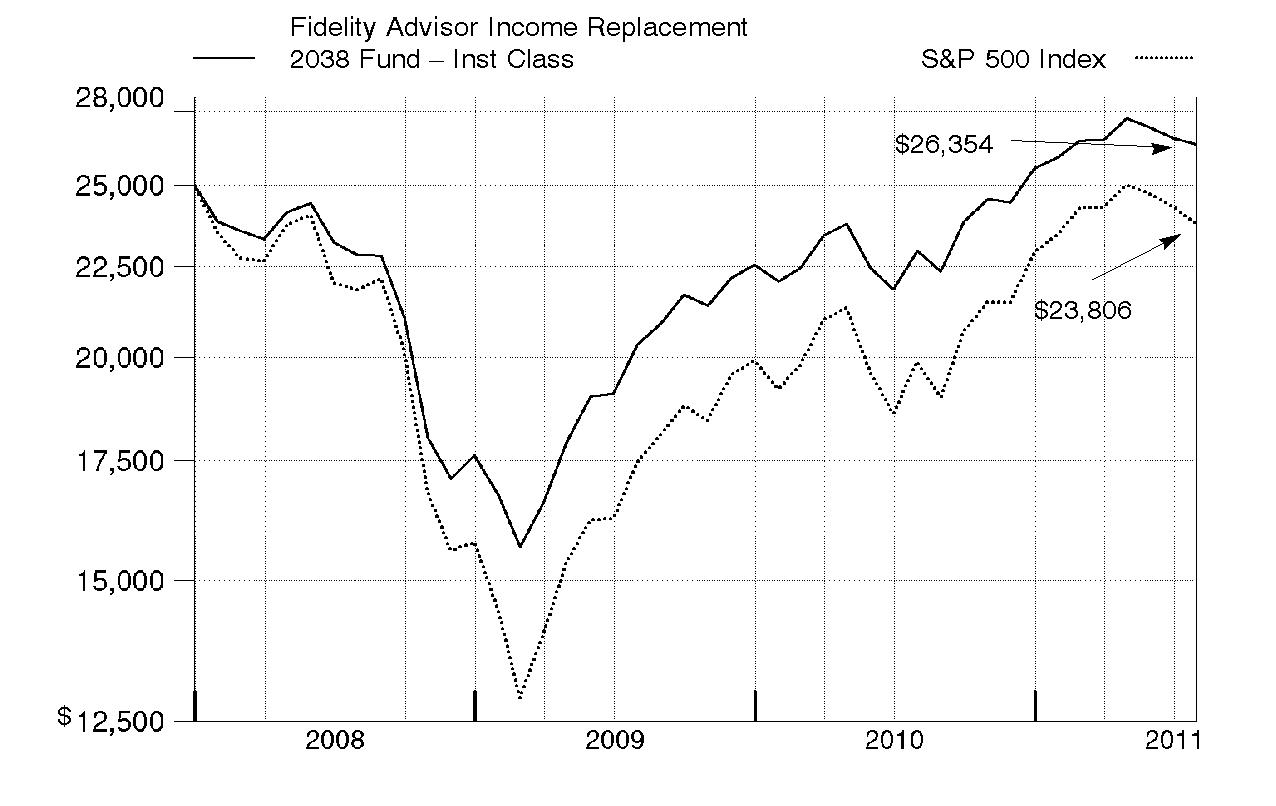
Annual Report
Fidelity Advisor Income Replacement 2040 FundSM - Institutional Class
Performance: The Bottom Line
Average annual total return reflects the change in the value of an investment, assuming reinvestment of the class' distributions from dividend income and capital gains (the profits earned upon the sale of securities that have grown in value, if any) and assuming a constant rate of performance each year. The $25,000 table and the fund's returns do not reflect the deduction of taxes that a shareholder would pay on fund distributions or the redemption of fund shares. During periods of reimbursement by Fidelity, a fund's total return will be greater than it would be had the reimbursement not occurred. How a fund did yesterday is no guarantee of how it will do tomorrow.
Average Annual Total Returns
Periods ended July 31, 2011 | | Past 1
year | Life of
fund A |
Institutional Class | | 15.24% | 1.61% |
A From December 31, 2007.
$25,000 Over Life of Fund
Let's say hypothetically that $25,000 was invested in Fidelity Advisor Income Replacement 2040 Fund - Institutional Class on December 31, 2007, when the fund started. The chart shows how the value of your investment would have changed, and also shows how the S&P 500 Index performed over the same period.
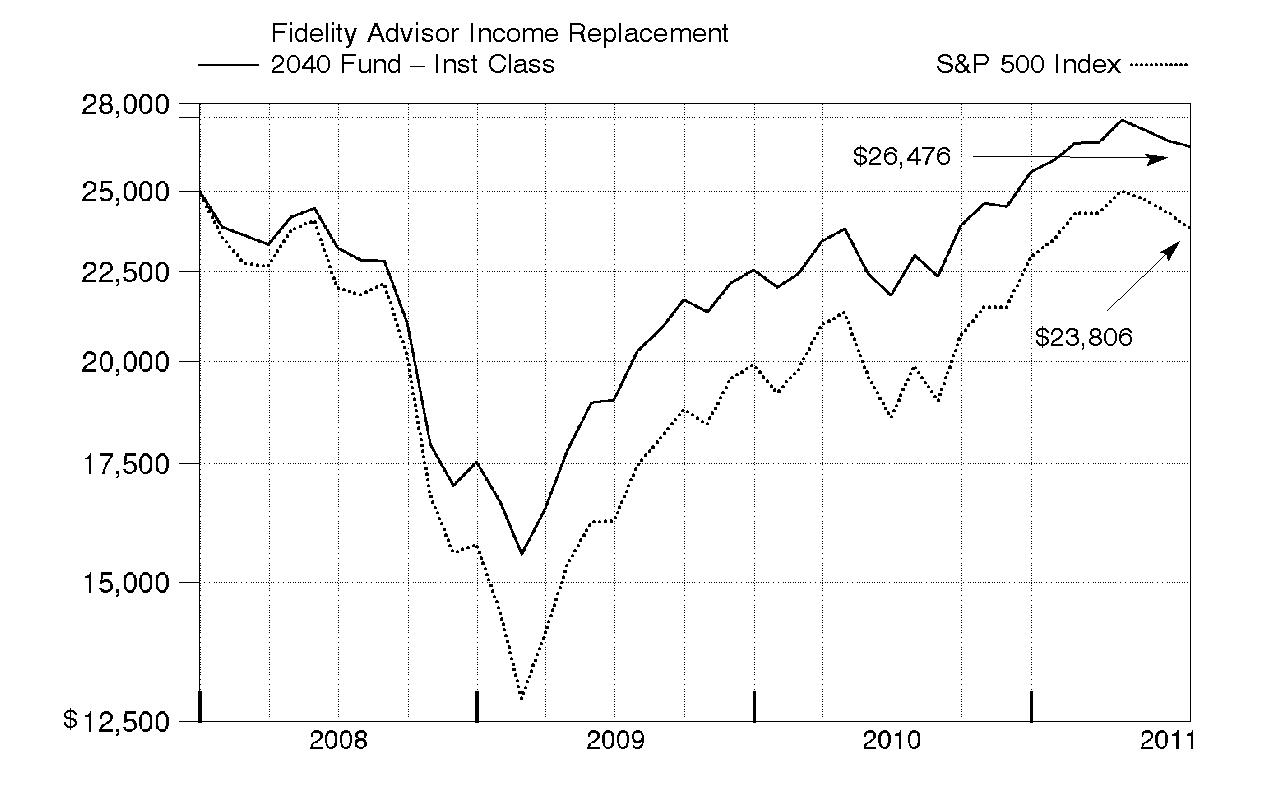
Annual Report
Fidelity Advisor Income Replacement 2042 FundSM - Institutional Class
Performance: The Bottom Line
Average annual total return reflects the change in the value of an investment, assuming reinvestment of the class' distributions from dividend income and capital gains (the profits earned upon the sale of securities that have grown in value, if any) and assuming a constant rate of performance each year. The $25,000 table and the fund's returns do not reflect the deduction of taxes that a shareholder would pay on fund distributions or the redemption of fund shares. During periods of reimbursement by Fidelity, a fund's total return will be greater than it would be had the reimbursement not occurred. How a fund did yesterday is no guarantee of how it will do tomorrow.
Average Annual Total Returns
Periods ended July 31, 2011 | | Past 1
year | Life of
fund A |
Institutional Class | | 15.42% | 1.64% |
A From December 31, 2007.
$25,000 Over Life of Fund
Let's say hypothetically that $25,000 was invested in Fidelity Advisor Income Replacement 2042 Fund - Institutional Class on December 31, 2007, when the fund started. The chart shows how the value of your investment would have changed, and also shows how the S&P 500 Index performed over the same period.
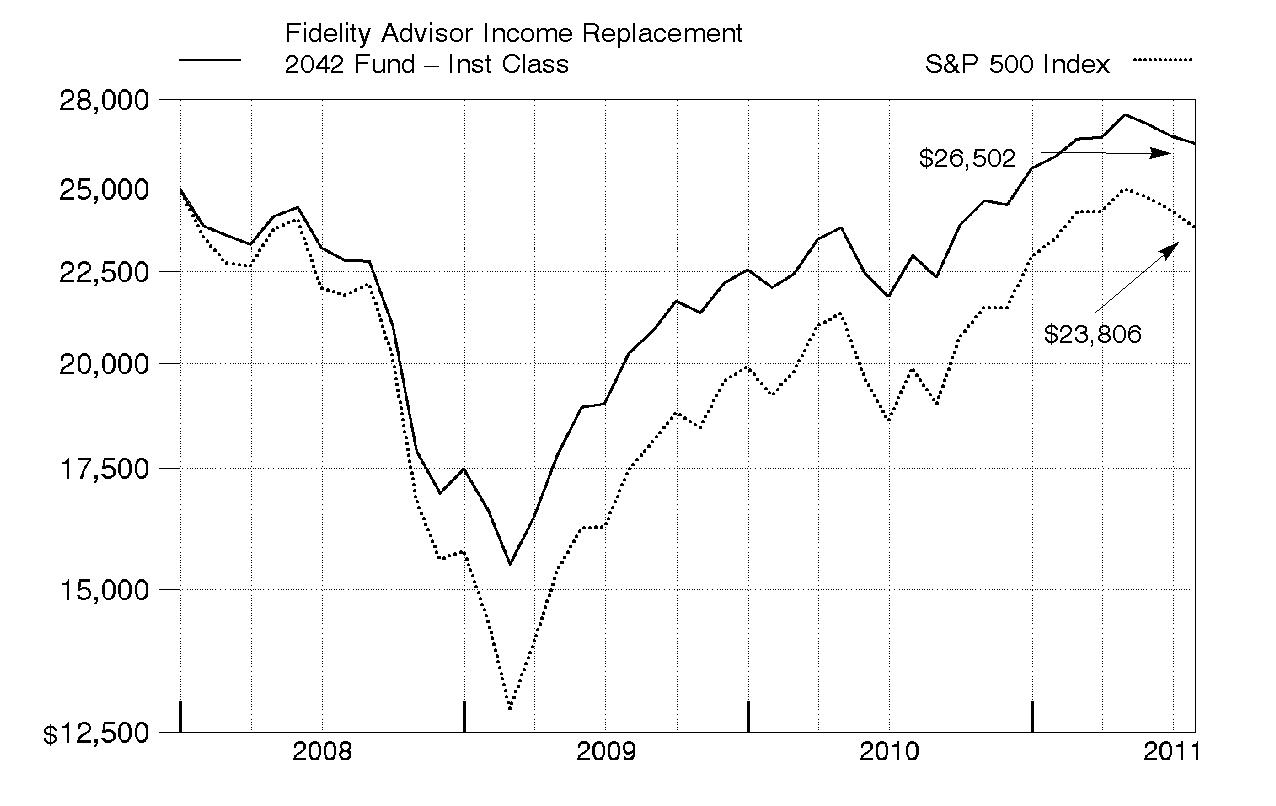
Annual Report
Market Recap: U.S. stocks registered solid double-digit gains for the 12 months ending July 31, 2011, extending a rally that began more than two years earlier. Despite a rough start in August 2010, markets turned positive in September, as increased demand for capital goods and other upbeat indicators trumped investor worry about a U.S. recessionary relapse. The broad market, as measured by the S&P 500® Index, rose 9% that month, its biggest September gain in 71 years. Seven more monthly advances followed, fueled by encouraging corporate earnings and economic activity. However, volatility picked up in the period's latter months, as markets reacted to continued high U.S. unemployment, nagging debt troubles in Europe and looming legislative battles over the federal debt ceiling. May unemployment rose above 9% for the first time in 2011, contributing to a traditional "June swoon" for stocks. Market uncertainty lingered in July, when the S&P 500® posted its second-biggest monthly loss of the period. For the full year, the S&P 500® climbed 19.65%, while the blue-chip-laden Dow Jones Industrial AverageSM rose a comparable 19.09% and the technology-heavy Nasdaq Composite® Index gained 23.40%. On the capitalization spectrum, stocks of mid-cap companies fared best, with the Russell Midcap® Index rising 24.51% and the small-cap Russell 2000® Index adding 23.92%. Strong returns for stocks brought about more-tempered gains for fixed-income markets, however, as investor demand for the perceived safety of bonds fluctuated throughout the year. The Barclays Capital® U.S. Aggregate Bond Index - a broad measure of the investment-grade debt universe - rose 4.44%, lifted by second-half volatility within the equity markets. Higher-risk bond categories fared best, with The BofA Merrill LynchSM US High Yield Constrained Index returning 12.85% for the year. Despite improving in the second half of the period, bonds backed by the U.S. government were still among the weakest performers for the year, with the Barclays Capital® U.S. Treasury Bond Index adding only 3.39%. Faring worse were short-term assets, as gauged by the 0.16% increase in the Barclays Capital U.S. 3 Month Treasury Bellwether Index.
Comments from Andrew Dierdorf, Co-Portfolio Manager of Fidelity Advisor Income Replacement FundsSM, and Christopher Sharpe, who became Co-Portfolio Manager on June 21, 2011: For the year, each of the Funds' Institutional Class shares posted a positive return, ranging from roughly 9% for the shortest-dated Fund - Fidelity Advisor Income Replacement 2016 FundSM - to roughly 15% for Fidelity Advisor Income Replacement 2042 FundSM, which has the longest time horizon. For the one-year period, each of the Funds' three asset classes - equities, bonds and short-term instruments - delivered a gain. All of the underlying funds posted positive absolute returns, with equity funds providing the strongest results. On a relative basis, 10 of the 15 underlying funds outperformed their respective benchmarks. In aggregate, the Funds' equity asset class fell just short of the broad U.S. equity market, as measured by the S&P 500® Index, which rose 19.65%. The most notable relative detractors were Fidelity® Disciplined Equity Fund and Fidelity® Equity-Income Fund, which underperformed despite returning roughly 15%. However, outperformance from two of the Funds' largest equity holdings during the period - Fidelity Large Cap Core Enhanced Index Fund and Fidelity Series Broad Market Opportunities Fund - helped buoy results. The Funds' bond asset class - which included a diversified mix of underlying bond funds - handily exceeded its benchmark index, the Barclays Capital® U.S. Aggregate Bond Index, which gained 4.44%. Fidelity Total Bond Fund, which serves as the Funds' largest debt holding, anchored the Funds' performance with a roughly 6% return for the one-year time frame. Meanwhile, Fidelity Capital & Income Fund, which rose 16%, boosted the overall performance of the bond asset class. This fund primarily invested in high-yield securities, which produced solid gains during the first half of the reporting period, and was the best absolute performer in the bond category. Strategic Real Return Fund also played an important role in the Funds. This underlying fund invests in real-estate-related securities and other inflation-sensitive asset types, which benefited during the period from investors' concern about an uptick in inflation.
Note to shareholders: On August 8, 2011, there were two changes to the underlying fund lineup. Fidelity Blue Chip Growth Index Fund was added, and Fidelity Large Cap Core Enhanced Index Fund was removed.
The views expressed above reflect those of the portfolio manager(s) only through the end of the period as stated on the cover of this report and do not necessarily represent the views of Fidelity or any other person in the Fidelity organization. Any such views are subject to change at any time based upon market or other conditions and Fidelity disclaims any responsibility to update such views. These views may not be relied on as investment advice and, because investment decisions for a Fidelity fund are based on numerous factors, may not be relied on as an indication of trading intent on behalf of any Fidelity fund.
Annual Report
As a shareholder of a Fund, you incur two types of costs: (1) transaction costs, including sales charges (loads) on purchase payments or redemption proceeds, and (2) ongoing costs, including distribution and/or service (12b-1) fees and other Fund expenses. This Example is intended to help you understand your ongoing costs (in dollars) of investing in the Funds and to compare these costs with the ongoing costs of investing in other mutual funds.
The Example is based on an investment of $1,000 invested at the beginning of the period and held for the entire period (February 1, 2011 to July 31, 2011).
Actual Expenses
The first line of the accompanying table for each class of each fund provides information about actual account values and actual expenses. You may use the information in this line, together with the amount you invested, to estimate the expenses that you paid over the period. Simply divide your account value by $1,000.00 (for example, an $8,600 account value divided by $1,000.00 = 8.6), then multiply the result by the number in the first line for a class of the fund under the heading entitled "Expenses Paid During Period" to estimate the expenses you paid on your account during this period. In addition, each Fund, as a shareholder in underlying Fidelity Funds, will indirectly bear its pro-rata share of the fees and expenses incurred by the underlying Fidelity Funds. These fees and expenses are not included in each Fund's annualized expense ratio used to calculate the expense estimates in the table below.
Hypothetical Example for Comparison Purposes
The second line of the accompanying table for each class of each fund provides information about hypothetical account values and hypothetical expenses based on a Class' actual expense ratio and an assumed rate of return of 5% per year before expenses, which is not the Class' actual return. The hypothetical account values and expenses may not be used to estimate the actual ending account balance or expenses you paid for the period. You may use this information to compare the ongoing costs of investing in the Fund and other funds. To do so, compare this 5% hypothetical example with the 5% hypothetical examples that appear in the shareholder reports of the other funds. In addition, each Fund, as a shareholder in underlying Fidelity Funds, will indirectly bear its pro-rata share of the fees and expenses incurred by the underlying Fidelity Funds. These fees and expenses are not included in each Fund's annualized expense ratio used to calculate the expense estimates in the table below.
Please note that the expenses shown in the table are meant to highlight your ongoing costs only and do not reflect any transaction costs. Therefore, the second line of the table is useful in comparing ongoing costs only, and will not help you determine the relative total costs of owning different funds. In addition, if these transactional costs were included, your costs would have been higher.
| Annualized
Expense Ratio | Beginning
Account Value
February 1, 2011 | Ending
Account Value
July 31, 2011 | Expenses Paid
During Period*
February 1, 2011
to July 31, 2011 |
Fidelity Income Replacement 2016 Fund | | | | |
Class A | .25% | | | |
Actual | | $ 1,000.00 | $ 1,020.40 | $ 1.25 |
HypotheticalA | | $ 1,000.00 | $ 1,023.55 | $ 1.25 |
Class T | .50% | | | |
Actual | | $ 1,000.00 | $ 1,018.80 | $ 2.50 |
HypotheticalA | | $ 1,000.00 | $ 1,022.32 | $ 2.51 |
Class C | 1.00% | | | |
Actual | | $ 1,000.00 | $ 1,016.50 | $ 5.00 |
HypotheticalA | | $ 1,000.00 | $ 1,019.84 | $ 5.01 |
Income Replacement 2016 | .00% | | | |
Actual | | $ 1,000.00 | $ 1,021.70 | $ .00 |
HypotheticalA | | $ 1,000.00 | $ 1,024.79 | $ .00 |
Institutional Class | .00% | | | |
Actual | | $ 1,000.00 | $ 1,021.70 | $ .00 |
HypotheticalA | | $ 1,000.00 | $ 1,024.79 | $ .00 |
Fidelity Income Replacement 2018 Fund | | | | |
Class A | .25% | | | |
Actual | | $ 1,000.00 | $ 1,019.80 | $ 1.25 |
HypotheticalA | | $ 1,000.00 | $ 1,023.55 | $ 1.25 |
Class T | .50% | | | |
Actual | | $ 1,000.00 | $ 1,018.50 | $ 2.50 |
HypotheticalA | | $ 1,000.00 | $ 1,022.32 | $ 2.51 |
| Annualized
Expense Ratio | Beginning
Account Value
February 1, 2011 | Ending
Account Value
July 31, 2011 | Expenses Paid
During Period*
February 1, 2011
to July 31, 2011 |
Class C | 1.00% | | | |
Actual | | $ 1,000.00 | $ 1,016.00 | $ 5.00 |
HypotheticalA | | $ 1,000.00 | $ 1,019.84 | $ 5.01 |
Income Replacement 2018 | .00% | | | |
Actual | | $ 1,000.00 | $ 1,021.10 | $ .00 |
HypotheticalA | | $ 1,000.00 | $ 1,024.79 | $ .00 |
Institutional Class | .00% | | | |
Actual | | $ 1,000.00 | $ 1,021.10 | $ .00 |
HypotheticalA | | $ 1,000.00 | $ 1,024.79 | $ .00 |
Fidelity Income Replacement 2020 Fund | | | | |
Class A | .25% | | | |
Actual | | $ 1,000.00 | $ 1,018.90 | $ 1.25 |
HypotheticalA | | $ 1,000.00 | $ 1,023.55 | $ 1.25 |
Class T | .50% | | | |
Actual | | $ 1,000.00 | $ 1,017.80 | $ 2.50 |
HypotheticalA | | $ 1,000.00 | $ 1,022.32 | $ 2.51 |
Class C | 1.00% | | | |
Actual | | $ 1,000.00 | $ 1,015.20 | $ 5.00 |
HypotheticalA | | $ 1,000.00 | $ 1,019.84 | $ 5.01 |
Income Replacement 2020 | .00% | | | |
Actual | | $ 1,000.00 | $ 1,020.40 | $ .00 |
HypotheticalA | | $ 1,000.00 | $ 1,024.79 | $ .00 |
Institutional Class | .00% | | | |
Actual | | $ 1,000.00 | $ 1,020.40 | $ .00 |
HypotheticalA | | $ 1,000.00 | $ 1,024.79 | $ .00 |
Fidelity Income Replacement 2022 Fund | | | | |
Class A | .25% | | | |
Actual | | $ 1,000.00 | $ 1,018.40 | $ 1.25 |
HypotheticalA | | $ 1,000.00 | $ 1,023.55 | $ 1.25 |
Class T | .50% | | | |
Actual | | $ 1,000.00 | $ 1,017.20 | $ 2.50 |
HypotheticalA | | $ 1,000.00 | $ 1,022.32 | $ 2.51 |
Class C | 1.00% | | | |
Actual | | $ 1,000.00 | $ 1,014.70 | $ 5.00 |
HypotheticalA | | $ 1,000.00 | $ 1,019.84 | $ 5.01 |
Income Replacement 2022 | .00% | | | |
Actual | | $ 1,000.00 | $ 1,019.70 | $ .00 |
HypotheticalA | | $ 1,000.00 | $ 1,024.79 | $ .00 |
Institutional Class | .00% | | | |
Actual | | $ 1,000.00 | $ 1,019.70 | $ .00 |
HypotheticalA | | $ 1,000.00 | $ 1,024.79 | $ .00 |
Fidelity Income Replacement 2024 Fund | | | | |
Class A | .25% | | | |
Actual | | $ 1,000.00 | $ 1,017.80 | $ 1.25 |
HypotheticalA | | $ 1,000.00 | $ 1,023.55 | $ 1.25 |
Class T | .50% | | | |
Actual | | $ 1,000.00 | $ 1,016.80 | $ 2.50 |
HypotheticalA | | $ 1,000.00 | $ 1,022.32 | $ 2.51 |
| Annualized
Expense Ratio | Beginning
Account Value
February 1, 2011 | Ending
Account Value
July 31, 2011 | Expenses Paid
During Period*
February 1, 2011
to July 31, 2011 |
Class C | 1.00% | | | |
Actual | | $ 1,000.00 | $ 1,014.30 | $ 4.99 |
HypotheticalA | | $ 1,000.00 | $ 1,019.84 | $ 5.01 |
Income Replacement 2024 | .00% | | | |
Actual | | $ 1,000.00 | $ 1,019.40 | $ .00 |
HypotheticalA | | $ 1,000.00 | $ 1,024.79 | $ .00 |
Institutional Class | .00% | | | |
Actual | | $ 1,000.00 | $ 1,019.40 | $ .00 |
HypotheticalA | | $ 1,000.00 | $ 1,024.79 | $ .00 |
Fidelity Income Replacement 2026 Fund | | | | |
Class A | .25% | | | |
Actual | | $ 1,000.00 | $ 1,017.70 | $ 1.25 |
HypotheticalA | | $ 1,000.00 | $ 1,023.55 | $ 1.25 |
Class T | .50% | | | |
Actual | | $ 1,000.00 | $ 1,016.50 | $ 2.50 |
HypotheticalA | | $ 1,000.00 | $ 1,022.32 | $ 2.51 |
Class C | 1.00% | | | |
Actual | | $ 1,000.00 | $ 1,013.90 | $ 4.99 |
HypotheticalA | | $ 1,000.00 | $ 1,019.84 | $ 5.01 |
Income Replacement 2026 | .00% | | | |
Actual | | $ 1,000.00 | $ 1,018.80 | $ .00 |
HypotheticalA | | $ 1,000.00 | $ 1,024.79 | $ .00 |
Institutional Class | .00% | | | |
Actual | | $ 1,000.00 | $ 1,019.00 | $ .00 |
HypotheticalA | | $ 1,000.00 | $ 1,024.79 | $ .00 |
Fidelity Income Replacement 2028 Fund | | | | |
Class A | .25% | | | |
Actual | | $ 1,000.00 | $ 1,017.30 | $ 1.25 |
HypotheticalA | | $ 1,000.00 | $ 1,023.55 | $ 1.25 |
Class T | .50% | | | |
Actual | | $ 1,000.00 | $ 1,015.90 | $ 2.50 |
HypotheticalA | | $ 1,000.00 | $ 1,022.32 | $ 2.51 |
Class C | 1.00% | | | |
Actual | | $ 1,000.00 | $ 1,013.70 | $ 4.99 |
HypotheticalA | | $ 1,000.00 | $ 1,019.84 | $ 5.01 |
Income Replacement 2028 | .00% | | | |
Actual | | $ 1,000.00 | $ 1,018.50 | $ .00 |
HypotheticalA | | $ 1,000.00 | $ 1,024.79 | $ .00 |
Institutional Class | .00% | | | |
Actual | | $ 1,000.00 | $ 1,018.50 | $ .00 |
HypotheticalA | | $ 1,000.00 | $ 1,024.79 | $ .00 |
Fidelity Income Replacement 2030 Fund | | | | |
Class A | .25% | | | |
Actual | | $ 1,000.00 | $ 1,017.10 | $ 1.25 |
HypotheticalA | | $ 1,000.00 | $ 1,023.55 | $ 1.25 |
Class T | .50% | | | |
Actual | | $ 1,000.00 | $ 1,015.80 | $ 2.50 |
HypotheticalA | | $ 1,000.00 | $ 1,022.32 | $ 2.51 |
| Annualized
Expense Ratio | Beginning
Account Value
February 1, 2011 | Ending
Account Value
July 31, 2011 | Expenses Paid
During Period*
February 1, 2011
to July 31, 2011 |
Class C | 1.00% | | | |
Actual | | $ 1,000.00 | $ 1,013.30 | $ 4.99 |
HypotheticalA | | $ 1,000.00 | $ 1,019.84 | $ 5.01 |
Income Replacement 2030 | .00% | | | |
Actual | | $ 1,000.00 | $ 1,018.30 | $ .00 |
HypotheticalA | | $ 1,000.00 | $ 1,024.79 | $ .00 |
Institutional Class | .00% | | | |
Actual | | $ 1,000.00 | $ 1,018.30 | $ .00 |
HypotheticalA | | $ 1,000.00 | $ 1,024.79 | $ .00 |
Fidelity Income Replacement 2032 Fund | | | | |
Class A | .25% | | | |
Actual | | $ 1,000.00 | $ 1,016.80 | $ 1.25 |
HypotheticalA | | $ 1,000.00 | $ 1,023.55 | $ 1.25 |
Class T | .50% | | | |
Actual | | $ 1,000.00 | $ 1,015.80 | $ 2.50 |
HypotheticalA | | $ 1,000.00 | $ 1,022.32 | $ 2.51 |
Class C | 1.00% | | | |
Actual | | $ 1,000.00 | $ 1,013.00 | $ 4.99 |
HypotheticalA | | $ 1,000.00 | $ 1,019.84 | $ 5.01 |
Income Replacement 2032 | .00% | | | |
Actual | | $ 1,000.00 | $ 1,018.10 | $ .00 |
HypotheticalA | | $ 1,000.00 | $ 1,024.79 | $ .00 |
Institutional Class | .00% | | | |
Actual | | $ 1,000.00 | $ 1,018.10 | $ .00 |
HypotheticalA | | $ 1,000.00 | $ 1,024.79 | $ .00 |
Fidelity Income Replacement 2034 Fund | | | | |
Class A | .25% | | | |
Actual | | $ 1,000.00 | $ 1,016.80 | $ 1.25 |
HypotheticalA | | $ 1,000.00 | $ 1,023.55 | $ 1.25 |
Class T | .50% | | | |
Actual | | $ 1,000.00 | $ 1,015.90 | $ 2.50 |
HypotheticalA | | $ 1,000.00 | $ 1,022.32 | $ 2.51 |
Class C | 1.00% | | | |
Actual | | $ 1,000.00 | $ 1,013.10 | $ 4.99 |
HypotheticalA | | $ 1,000.00 | $ 1,019.84 | $ 5.01 |
Income Replacement 2034 | .00% | | | |
Actual | | $ 1,000.00 | $ 1,018.20 | $ .00 |
HypotheticalA | | $ 1,000.00 | $ 1,024.79 | $ .00 |
Institutional Class | .00% | | | |
Actual | | $ 1,000.00 | $ 1,018.00 | $ .00 |
HypotheticalA | | $ 1,000.00 | $ 1,024.79 | $ .00 |
Fidelity Income Replacement 2036 Fund | | | | |
Class A | .25% | | | |
Actual | | $ 1,000.00 | $ 1,017.00 | $ 1.25 |
HypotheticalA | | $ 1,000.00 | $ 1,023.55 | $ 1.25 |
Class T | .50% | | | |
Actual | | $ 1,000.00 | $ 1,015.50 | $ 2.50 |
HypotheticalA | | $ 1,000.00 | $ 1,022.32 | $ 2.51 |
| Annualized
Expense Ratio | Beginning
Account Value
February 1, 2011 | Ending
Account Value
July 31, 2011 | Expenses Paid
During Period*
February 1, 2011
to July 31, 2011 |
Class C | 1.00% | | | |
Actual | | $ 1,000.00 | $ 1,012.90 | $ 4.99 |
HypotheticalA | | $ 1,000.00 | $ 1,019.84 | $ 5.01 |
Income Replacement 2036 | .00% | | | |
Actual | | $ 1,000.00 | $ 1,018.30 | $ .00 |
HypotheticalA | | $ 1,000.00 | $ 1,024.79 | $ .00 |
Institutional Class | .00% | | | |
Actual | | $ 1,000.00 | $ 1,018.10 | $ .00 |
HypotheticalA | | $ 1,000.00 | $ 1,024.79 | $ .00 |
Fidelity Income Replacement 2038 Fund | | | | |
Class A | .25% | | | |
Actual | | $ 1,000.00 | $ 1,016.70 | $ 1.25 |
HypotheticalA | | $ 1,000.00 | $ 1,023.55 | $ 1.25 |
Class T | .50% | | | |
Actual | | $ 1,000.00 | $ 1,015.60 | $ 2.50 |
HypotheticalA | | $ 1,000.00 | $ 1,022.32 | $ 2.51 |
Class C | 1.00% | | | |
Actual | | $ 1,000.00 | $ 1,012.90 | $ 4.99 |
HypotheticalA | | $ 1,000.00 | $ 1,019.84 | $ 5.01 |
Income Replacement 2038 | .00% | | | |
Actual | | $ 1,000.00 | $ 1,017.90 | $ .00 |
HypotheticalA | | $ 1,000.00 | $ 1,024.79 | $ .00 |
Institutional Class | .00% | | | |
Actual | | $ 1,000.00 | $ 1,018.20 | $ .00 |
HypotheticalA | | $ 1,000.00 | $ 1,024.79 | $ .00 |
Fidelity Income Replacement 2040 Fund | | | | |
Class A | .25% | | | |
Actual | | $ 1,000.00 | $ 1,017.00 | $ 1.25 |
HypotheticalA | | $ 1,000.00 | $ 1,023.55 | $ 1.25 |
Class T | .50% | | | |
Actual | | $ 1,000.00 | $ 1,015.80 | $ 2.50 |
HypotheticalA | | $ 1,000.00 | $ 1,022.32 | $ 2.51 |
Class C | 1.00% | | | |
Actual | | $ 1,000.00 | $ 1,013.40 | $ 4.99 |
HypotheticalA | | $ 1,000.00 | $ 1,019.84 | $ 5.01 |
Income Replacement 2040 | .00% | | | |
Actual | | $ 1,000.00 | $ 1,018.10 | $ .00 |
HypotheticalA | | $ 1,000.00 | $ 1,024.79 | $ .00 |
Institutional Class | .00% | | | |
Actual | | $ 1,000.00 | $ 1,018.30 | $ .00 |
HypotheticalA | | $ 1,000.00 | $ 1,024.79 | $ .00 |
Fidelity Income Replacement 2042 Fund | | | | |
Class A | .25% | | | |
Actual | | $ 1,000.00 | $ 1,016.90 | $ 1.25 |
HypotheticalA | | $ 1,000.00 | $ 1,023.55 | $ 1.25 |
Class T | .50% | | | |
Actual | | $ 1,000.00 | $ 1,015.50 | $ 2.50 |
HypotheticalA | | $ 1,000.00 | $ 1,022.32 | $ 2.51 |
| Annualized
Expense Ratio | Beginning
Account Value
February 1, 2011 | Ending
Account Value
July 31, 2011 | Expenses Paid
During Period*
February 1, 2011
to July 31, 2011 |
Class C | 1.00% | | | |
Actual | | $ 1,000.00 | $ 1,013.00 | $ 4.99 |
HypotheticalA | | $ 1,000.00 | $ 1,019.84 | $ 5.01 |
Income Replacement 2042 | .00% | | | |
Actual | | $ 1,000.00 | $ 1,018.20 | $ .00 |
HypotheticalA | | $ 1,000.00 | $ 1,024.79 | $ .00 |
Institutional Class | .00% | | | |
Actual | | $ 1,000.00 | $ 1,018.20 | $ .00 |
HypotheticalA | | $ 1,000.00 | $ 1,024.79 | $ .00 |
A 5% return per year before expenses
* Expenses are equal to each Class' annualized expense ratio, multiplied by the average account value over the period, multiplied by 181/365 (to reflect the one-half year period). The fees and expenses of the underlying Fidelity Funds in which the Fund invests are not included in the Fund's annualized expense ratio.
Annual Report
Fidelity Income Replacement 2016 Fund
Investment Changes (Unaudited)
Fund Holdings as of July 31, 2011 |
| % of fund's
net assets | % of fund's net assets
6 months ago |
Domestic Equity Funds | | |
Fidelity Advisor Mid Cap II Fund Institutional Class | 2.6 | 2.7 |
Fidelity Disciplined Equity Fund | 2.7 | 2.8 |
Fidelity Equity-Income Fund | 2.7 | 2.8 |
Fidelity Large Cap Core Enhanced Index Fund | 4.4 | 4.5 |
Fidelity Series 100 Index Fund | 3.3 | 3.4 |
Fidelity Series Broad Market Opportunities Fund | 4.3 | 4.5 |
Fidelity Series Small Cap Opportunities Fund | 1.7 | 1.8 |
| 21.7 | 22.5 |
International Equity Funds | | |
Fidelity Advisor International Discovery Fund Institutional Class | 1.3 | 1.8 |
Investment Grade Fixed-Income Funds | | |
Fidelity Government Income Fund | 8.4 | 8.5 |
Fidelity Strategic Real Return Fund | 8.3 | 8.5 |
Fidelity Total Bond Fund | 25.1 | 25.4 |
| 41.8 | 42.4 |
Short-Term Funds | | |
Fidelity Institutional Money Market Portfolio Institutional Class | 17.6 | 16.7 |
Fidelity Short-Term Bond Fund | 17.6 | 16.6 |
| 35.2 | 33.3 |
Net Other Assets (Liabilities)* | 0.0 | 0.0 |
| 100.0 | 100.0 |
* Amount represents less than 0.1% |
Asset Allocation (% of fund's net assets) |
Current |
| Domestic Equity Funds | 21.7% | |
| International Equity Funds | 1.3% | |
| Investment Grade Fixed-Income Funds | 41.8% | |
| Short-Term Funds | 35.2% | |

Six months ago |
| Domestic Equity Funds | 22.5% | |
| International Equity Funds | 1.8% | |
| Investment Grade Fixed-Income Funds | 42.4% | |
| Short-Term Funds | 33.3% | |

Expected |
| Domestic Equity Funds | 19.6% | |
| Investment Grade Fixed-Income Funds | 39.2% | |
| Short-Term Funds | 41.2% | |

The fund invests according to an asset allocation strategy that becomes increasingly conservative over time. The six months ago allocation is based on the fund's holdings as of January 31, 2011. The current allocation is based on the fund's holdings as of July 31, 2011. The expected allocation represents the fund's anticipated allocation at January 31, 2012. |
Annual Report
Fidelity Income Replacement 2016 Fund
Investments July 31, 2011
Showing Percentage of Net Assets
Equity Funds - 23.0% |
| Shares | | Value |
Domestic Equity Funds - 21.7% |
Fidelity Advisor Mid Cap II Fund Institutional Class (a) | 14,293 | | $ 259,125 |
Fidelity Disciplined Equity Fund | 11,630 | | 270,745 |
Fidelity Equity-Income Fund | 6,014 | | 266,787 |
Fidelity Large Cap Core Enhanced Index Fund | 49,020 | | 439,710 |
Fidelity Series 100 Index Fund | 36,581 | | 331,061 |
Fidelity Series Broad Market Opportunities Fund | 42,034 | | 432,954 |
Fidelity Series Small Cap Opportunities Fund | 15,316 | | 171,843 |
TOTAL DOMESTIC EQUITY FUNDS | | 2,172,225 |
International Equity Funds - 1.3% |
Fidelity Advisor International Discovery Fund Institutional Class | 3,909 | | 131,470 |
TOTAL EQUITY FUNDS (Cost $1,993,231) | 2,303,695 |
Fixed-Income Funds - 41.8% |
| | | |
Investment Grade Fixed-Income Funds - 41.8% |
Fidelity Government Income Fund | 78,455 | | 837,896 |
Fidelity Strategic Real Return Fund | 84,075 | | 835,706 |
Fidelity Total Bond Fund | 227,982 | | 2,510,085 |
TOTAL FIXED-INCOME FUNDS (Cost $3,886,859) | 4,183,687 |
Short-Term Funds - 35.2% |
| Shares | | Value |
Fidelity Institutional Money Market Portfolio Institutional Class | 1,755,301 | | $ 1,755,301 |
Fidelity Short-Term Bond Fund | 206,579 | | 1,764,185 |
TOTAL SHORT-TERM FUNDS (Cost $3,481,782) | 3,519,486 |
TOTAL INVESTMENT PORTFOLIO - 100.0% (Cost $9,361,872) | | 10,006,868 |
NET OTHER ASSETS (LIABILITIES) - 0.0% | | (4,805) |
NET ASSETS - 100% | $ 10,002,063 |
Legend |
(a) Non-income producing |
Other Information |
All investments are categorized as Level 1 under the Fair Value Hierarchy. The inputs or methodology used for valuing securities may not be an indication of the risk associated with investing in those securities. For more information on valuation inputs, please refer to the Security Valuation section in the accompanying Notes to Financial Statements. |
Income Tax Information |
At July 31, 2011, the Fund had a capital loss carryforward of approximately $373,492 of which $11,321, $234,074 and $128,097 will expire in fiscal 2017, 2018 and 2019, respectively. Capital loss carryforwards are only available to offset future capital gains of the Fund to the extent provided by regulations and may be limited. |
See accompanying notes which are an integral part of the financial statements.
Annual Report
Fidelity Income Replacement 2016 Fund
Statement of Assets and Liabilities
| July 31, 2011 |
| | |
Assets | | |
Investment in securities, at value (cost $9,361,872) - See accompanying schedule | | $ 10,006,868 |
Cash | | 11 |
Receivable for investments sold | | 14,782 |
Total assets | | 10,021,661 |
| | |
Liabilities | | |
Payable for investments purchased | $ 42 | |
Payable for fund shares redeemed | 18,009 | |
Distribution and service plan fees payable | 1,547 | |
Total liabilities | | 19,598 |
| | |
Net Assets | | $ 10,002,063 |
Net Assets consist of: | | |
Paid in capital | | $ 9,960,023 |
Undistributed net investment income | | 2,169 |
Accumulated undistributed net realized gain (loss) on investments | | (605,125) |
Net unrealized appreciation (depreciation) on investments | | 644,996 |
Net Assets | | $ 10,002,063 |
| | |
Calculation of Maximum Offering Price Class A:
Net Asset Value and redemption price per share ($1,798,102 ÷ 36,094.44 shares) | | $ 49.82 |
| | |
Maximum offering price per share (100/94.25 of $49.82) | | $ 52.86 |
| | |
Class T:
Net Asset Value and redemption price per share ($528,707 ÷ 10,613.41 shares) | | $ 49.81 |
| | |
Maximum offering price per share (100/96.50 of $49.81) | | $ 51.62 |
| | |
Class C:
Net Asset Value and offering price per share ($758,875 ÷ 15,230.25 shares)A | | $ 49.83 |
| | |
Income Replacement 2016:
Net Asset Value, offering price and redemption price per share ($6,872,705 ÷ 137,934.45 shares) | | $ 49.83 |
| | |
Institutional Class:
Net Asset Value, offering price and redemption price per share ($43,674 ÷ 876.50 shares) | | $ 49.83 |
A Redemption price per share is equal to net asset value less any applicable contingent deferred sales charge.
Statement of Operations
| Year ended July 31, 2011 |
| | |
Investment Income | | |
Income distributions from underlying funds | | $ 212,369 |
| | |
Expenses | | |
Distribution and service plan fees | $ 19,517 | |
Independent trustees' compensation | 40 | |
Total expenses before reductions | 19,557 | |
Expense reductions | (40) | 19,517 |
Net investment income (loss) | | 192,852 |
Realized and Unrealized Gain (Loss) Realized gain (loss) on sale of underlying fund shares | (129,144) | |
Capital gain distributions from underlying funds | 78,190 | |
Total net realized gain (loss) | | (50,954) |
Change in net unrealized appreciation (depreciation) on underlying funds | | 761,739 |
Net gain (loss) | | 710,785 |
Net increase (decrease) in net assets resulting from operations | | $ 903,637 |
See accompanying notes which are an integral part of the financial statements.
Annual Report
Statement of Changes in Net Assets
| Year ended
July 31, 2011 | Year ended
July 31, 2010 |
Increase (Decrease) in Net Assets | | |
Operations | | |
Net investment income (loss) | $ 192,852 | $ 190,860 |
Net realized gain (loss) | (50,954) | (128,722) |
Change in net unrealized appreciation (depreciation) | 761,739 | 877,831 |
Net increase (decrease) in net assets resulting from operations | 903,637 | 939,969 |
Distributions to shareholders from net investment income | (194,425) | (190,322) |
Distributions to shareholders from net realized gain | (58,747) | (25,833) |
Total distributions | (253,172) | (216,155) |
Share transactions - net increase (decrease) | (1,722,258) | 1,239,040 |
Total increase (decrease) in net assets | (1,071,793) | 1,962,854 |
| | |
Net Assets | | |
Beginning of period | 11,073,856 | 9,111,002 |
End of period (including undistributed net investment income of $2,169 and undistributed net investment income of $3,810, respectively) | $ 10,002,063 | $ 11,073,856 |
Financial Highlights - Class A
Years ended July 31, | 2011 | 2010 | 2009 | 2008G |
Selected Per-Share Data | | | | |
Net asset value, beginning of period | $ 47.04 | $ 43.62 | $ 47.76 | $ 50.00 |
Income from Investment Operations | | | | |
Net investment income (loss)E | .821 | .831 | 1.118 | 1.233 |
Net realized and unrealized gain (loss) | 3.054 | 3.539 | (3.686) | (2.204) |
Total from investment operations | 3.875 | 4.370 | (2.568) | (.971) |
Distributions from net investment income | (.834) | (.830) | (1.132) | (1.129) |
Distributions from net realized gain | (.261) | (.120) | (.440) | (.140) |
Total distributions | (1.095) | (.950) | (1.572) | (1.269) |
Net asset value, end of period | $ 49.82 | $ 47.04 | $ 43.62 | $ 47.76 |
Total ReturnB,C,D | 8.30% | 10.08% | (5.07)% | (2.02)% |
Ratios to Average Net AssetsF,H | | | | |
Expenses before reductions | .25% | .25% | .25% | .25%A |
Expenses net of fee waivers, if any | .25% | .25% | .25% | .25%A |
Expenses net of all reductions | .25% | .25% | .25% | .25%A |
Net investment income (loss) | 1.68% | 1.80% | 2.72% | 2.76%A |
Supplemental Data | | | | |
Net assets, end of period (000 omitted) | $ 1,798 | $ 2,308 | $ 2,599 | $ 2,214 |
Portfolio turnover rate | 31% | 40% | 54% | 56%A |
A Annualized
B Total returns for periods of less than one year are not annualized.
C Total returns would have been lower if certain expenses had not been reduced during the applicable periods shown.
D Total returns do not include the effect of the sales charges.
E Calculated based on average shares outstanding during the period.
F Amounts do not include the activity of the underlying funds.
G For the period August 30, 2007 (commencement of operations) to July 31, 2008.
H Expense ratios reflect operating expenses of the class. Expenses before reductions do not reflect amounts reimbursed by the investment adviser or reductions from expense offset arrangements and do not represent the amount paid by the class during periods when reimbursements or reductions occur. Expenses net of fee waivers reflect expenses after reimbursement by the investment adviser but prior to reductions from expense offset arrangements. Expenses net of all reductions represent the net expenses paid by the class but do not include expenses of the investment companies in which the Fund invests.
See accompanying notes which are an integral part of the financial statements.
Annual Report
Financial Highlights - Class T
Years ended July 31, | 2011 | 2010 | 2009 | 2008G |
Selected Per-Share Data | | | | |
Net asset value, beginning of period | $ 47.04 | $ 43.62 | $ 47.75 | $ 50.00 |
Income from Investment Operations | | | | |
Net investment income (loss)E | .698 | .716 | 1.025 | 1.128 |
Net realized and unrealized gain (loss) | 3.043 | 3.540 | (3.690) | (2.219) |
Total from investment operations | 3.741 | 4.256 | (2.665) | (1.091) |
Distributions from net investment income | (.710) | (.716) | (1.025) | (1.019) |
Distributions from net realized gain | (.261) | (.120) | (.440) | (.140) |
Total distributions | (.971) | (.836) | (1.465) | (1.159) |
Net asset value, end of period | $ 49.81 | $ 47.04 | $ 43.62 | $ 47.75 |
Total ReturnB,C,D | 8.00% | 9.81% | (5.30)% | (2.26)% |
Ratios to Average Net AssetsF,H | | | | |
Expenses before reductions | .50% | .50% | .50% | .50%A |
Expenses net of fee waivers, if any | .50% | .50% | .50% | .50%A |
Expenses net of all reductions | .50% | .50% | .50% | .50%A |
Net investment income (loss) | 1.42% | 1.55% | 2.47% | 2.51%A |
Supplemental Data | | | | |
Net assets, end of period (000 omitted) | $ 529 | $ 638 | $ 499 | $ 673 |
Portfolio turnover rate | 31% | 40% | 54% | 56%A |
A Annualized
B Total returns for periods of less than one year are not annualized.
C Total returns would have been lower if certain expenses had not been reduced during the applicable periods shown.
D Total returns do not include the effect of the sales charges.
E Calculated based on average shares outstanding during the period.
F Amounts do not include the activity of the underlying funds.
G For the period August 30, 2007 (commencement of operations) to July 31, 2008.
H Expense ratios reflect operating expenses of the class. Expenses before reductions do not reflect amounts reimbursed by the investment adviser or reductions from expense offset arrangements and do not represent the amount paid by the class during periods when reimbursements or reductions occur. Expenses net of fee waivers reflect expenses after reimbursement by the investment adviser but prior to reductions from expense offset arrangements. Expenses net of all reductions represent the net expenses paid by the class but do not include expenses of the investment companies in which the Fund invests.
Financial Highlights - Class C
Years ended July 31, | 2011 | 2010 | 2009 | 2008G |
Selected Per-Share Data | | | | |
Net asset value, beginning of period | $ 47.03 | $ 43.61 | $ 47.73 | $ 50.00 |
Income from Investment Operations | | | | |
Net investment income (loss)E | .453 | .485 | .822 | .904 |
Net realized and unrealized gain (loss) | 3.055 | 3.531 | (3.689) | (2.227) |
Total from investment operations | 3.508 | 4.016 | (2.867) | (1.323) |
Distributions from net investment income | (.447) | (.476) | (.813) | (.807) |
Distributions from net realized gain | (.261) | (.120) | (.440) | (.140) |
Total distributions | (.708) | (.596) | (1.253) | (.947) |
Net asset value, end of period | $ 49.83 | $ 47.03 | $ 43.61 | $ 47.73 |
Total ReturnB,C,D | 7.49% | 9.24% | (5.76)% | (2.71)% |
Ratios to Average Net AssetsF,H | | | | |
Expenses before reductions | 1.00% | 1.00% | 1.00% | 1.00%A |
Expenses net of fee waivers, if any | 1.00% | 1.00% | 1.00% | 1.00%A |
Expenses net of all reductions | 1.00% | 1.00% | 1.00% | 1.00%A |
Net investment income (loss) | .92% | 1.05% | 1.97% | 2.01%A |
Supplemental Data | | | | |
Net assets, end of period (000 omitted) | $ 759 | $ 1,075 | $ 1,171 | $ 1,595 |
Portfolio turnover rate | 31% | 40% | 54% | 56%A |
A Annualized
B Total returns for periods of less than one year are not annualized.
C Total returns would have been lower if certain expenses had not been reduced during the applicable periods shown.
D Total returns do not include the effect of the contingent deferred sales charge.
E Calculated based on average shares outstanding during the period.
F Amounts do not include the activity of the underlying funds.
G For the period August 30, 2007 (commencement of operations) to July 31, 2008.
H Expense ratios reflect operating expenses of the class. Expenses before reductions do not reflect amounts reimbursed by the investment adviser or reductions from expense offset arrangements and do not represent the amount paid by the class during periods when reimbursements or reductions occur. Expenses net of fee waivers reflect expenses after reimbursement by the investment adviser but prior to reductions from expense offset arrangements. Expenses net of all reductions represent the net expenses paid by the class but do not include expenses of the investment companies in which the Fund invests.
See accompanying notes which are an integral part of the financial statements.
Annual Report
Financial Highlights - Income Replacement 2016
Years ended July 31, | 2011 | 2010 | 2009 | 2008G |
Selected Per-Share Data | | | | |
Net asset value, beginning of period | $ 47.05 | $ 43.63 | $ 47.77 | $ 50.00 |
Income from Investment Operations | | | | |
Net investment income (loss)D | .944 | .948 | 1.231 | 1.356 |
Net realized and unrealized gain (loss) | 3.055 | 3.539 | (3.692) | (2.217) |
Total from investment operations | 3.999 | 4.487 | (2.461) | (.861) |
Distributions from net investment income | (.958) | (.947) | (1.239) | (1.229) |
Distributions from net realized gain | (.261) | (.120) | (.440) | (.140) |
Total distributions | (1.219) | (1.067) | (1.679) | (1.369) |
Net asset value, end of period | $ 49.83 | $ 47.05 | $ 43.63 | $ 47.77 |
Total ReturnB,C | 8.57% | 10.36% | (4.82)% | (1.81)% |
Ratios to Average Net AssetsE,H | | | | |
Expenses before reductionsF | .00% | .00% | .00% | .00%A |
Expenses net of fee waivers, if any | .00% | .00% | .00% | .00%A |
Expenses net of all reductions | .00% | .00% | .00% | .00%A |
Net investment income (loss) | 1.93% | 2.05% | 2.97% | 3.00%A |
Supplemental Data | | | | |
Net assets, end of period (000 omitted) | $ 6,873 | $ 6,946 | $ 4,733 | $ 4,880 |
Portfolio turnover rate | 31% | 40% | 54% | 56%A |
A Annualized
B Total returns for periods of less than one year are not annualized.
C Total returns would have been lower if certain expenses had not been reduced during the applicable periods shown.
D Calculated based on average shares outstanding during the period.
E Amounts do not include the activity of the underlying funds.
F Amount represents less than .01%.
G For the period August 30, 2007 (commencement of operations) to July 31, 2008.
H Expense ratios reflect operating expenses of the class. Expenses before reductions do not reflect amounts reimbursed by the investment adviser or reductions from expense offset arrangements and do not represent the amount paid by the class during periods when reimbursements or reductions occur. Expenses net of fee waivers reflect expenses after reimbursement by the investment adviser but prior to reductions from expense offset arrangements. Expenses net of all reductions represent the net expenses paid by the class but do not include expenses of the investment companies in which the Fund invests.
Financial Highlights - Institutional Class
Years ended July 31, | 2011 | 2010 | 2009 | 2008G |
Selected Per-Share Data | | | | |
Net asset value, beginning of period | $ 47.05 | $ 43.64 | $ 47.77 | $ 50.00 |
Income from Investment Operations | | | | |
Net investment income (loss)D | .945 | .947 | 1.235 | 1.370 |
Net realized and unrealized gain (loss) | 3.054 | 3.530 | (3.686) | (2.231) |
Total from investment operations | 3.999 | 4.477 | (2.451) | (.861) |
Distributions from net investment income | (.958) | (.947) | (1.239) | (1.229) |
Distributions from net realized gain | (.261) | (.120) | (.440) | (.140) |
Total distributions | (1.219) | (1.067) | (1.679) | (1.369) |
Net asset value, end of period | $ 49.83 | $ 47.05 | $ 43.64 | $ 47.77 |
Total ReturnB,C | 8.57% | 10.33% | (4.80)% | (1.81)% |
Ratios to Average Net AssetsE,H | | | | |
Expenses before reductionsF | .00% | .00% | .00% | .00%A |
Expenses net of fee waivers, if any | .00% | .00% | .00% | .00%A |
Expenses net of all reductions | .00% | .00% | .00% | .00%A |
Net investment income (loss) | 1.92% | 2.05% | 2.97% | 3.00%A |
Supplemental Data | | | | |
Net assets, end of period (000 omitted) | $ 44 | $ 108 | $ 109 | $ 184 |
Portfolio turnover rate | 31% | 40% | 54% | 56%A |
A Annualized
B Total returns for periods of less than one year are not annualized.
C Total returns would have been lower if certain expenses had not been reduced during the applicable periods shown.
D Calculated based on average shares outstanding during the period.
E Amounts do not include the activity of the underlying funds.
F Amount represents less than .01%.
G For the period August 30, 2007 (commencement of operations) to July 31, 2008.
H Expense ratios reflect operating expenses of the class. Expenses before reductions do not reflect amounts reimbursed by the investment adviser or reductions from expense offset arrangements and do not represent the amount paid by the class during periods when reimbursements or reductions occur. Expenses net of fee waivers reflect expenses after reimbursement by the investment adviser but prior to reductions from expense offset arrangements. Expenses net of all reductions represent the net expenses paid by the class but do not include expenses of the investment companies in which the Fund invests.
See accompanying notes which are an integral part of the financial statements.
Annual Report
Fidelity Income Replacement 2018 Fund
Investment Changes (Unaudited)
Fund Holdings as of July 31, 2011 |
| % of fund's
net assets | % of fund's net assets
6 months ago |
Domestic Equity Funds | | |
Fidelity Advisor Mid Cap II Fund Institutional Class | 3.4 | 3.5 |
Fidelity Disciplined Equity Fund | 3.5 | 3.7 |
Fidelity Equity-Income Fund | 3.5 | 3.7 |
Fidelity Large Cap Core Enhanced Index Fund | 5.7 | 5.9 |
Fidelity Series 100 Index Fund | 4.3 | 4.4 |
Fidelity Series Broad Market Opportunities Fund | 5.7 | 5.9 |
Fidelity Series Small Cap Opportunities Fund | 2.3 | 2.4 |
| 28.4 | 29.5 |
International Equity Funds | | |
Fidelity Advisor International Discovery Fund Institutional Class | 2.7 | 2.9 |
High Yield Fixed-Income Funds | | |
Fidelity Capital & Income Fund | 0.6 | 0.9 |
Fidelity Strategic Income Fund | 0.7 | 0.8 |
| 1.3 | 1.7 |
Investment Grade Fixed-Income Funds | | |
Fidelity Government Income Fund | 7.9 | 7.8 |
Fidelity Strategic Real Return Fund | 7.9 | 7.8 |
Fidelity Total Bond Fund | 23.7 | 23.3 |
| 39.5 | 38.9 |
Short-Term Funds | | |
Fidelity Institutional Money Market Portfolio Institutional Class | 14.0 | 13.5 |
Fidelity Short-Term Bond Fund | 14.1 | 13.5 |
| 28.1 | 27.0 |
Net Other Assets (Liabilities)* | 0.0 | 0.0 |
| 100.0 | 100.0 |
* Amount represents less than 0.1% |
Asset Allocation (% of fund's net assets) |
Current |
| Domestic Equity Funds | 28.4% | |
| International Equity Funds | 2.7% | |
| High Yield
Fixed-Income Funds | 1.3% | |
| Investment Grade Fixed-Income Funds | 39.5% | |
| Short-Term Funds | 28.1% | |

Six months ago |
| Domestic Equity Funds | 29.5% | |
| International Equity Funds | 2.9% | |
| High Yield
Fixed-Income Funds | 1.7% | |
| Investment Grade Fixed-Income Funds | 38.9% | |
| Short-Term Funds | 27.0% | |

Expected |
| Domestic Equity Funds | 26.1% | |
| International Equity Funds | 2.4% | |
| Investment Grade Fixed-Income Funds | 41.0% | |
| Short-Term Funds | 30.5% | |

The fund invests according to an asset allocation strategy that becomes increasingly conservative over time. The six months ago allocation is based on the fund's holdings as of January 31, 2011. The current allocation is based on the fund's holdings as of July 31, 2011. The expected allocation represents the fund's anticipated allocation at January 31, 2012. |
Annual Report
Fidelity Income Replacement 2018 Fund
Investments July 31, 2011
Showing Percentage of Net Assets
Equity Funds - 31.1% |
| Shares | | Value |
Domestic Equity Funds - 28.4% |
Fidelity Advisor Mid Cap II Fund Institutional Class (a) | 9,863 | | $ 178,808 |
Fidelity Disciplined Equity Fund | 8,010 | | 186,461 |
Fidelity Equity-Income Fund | 4,146 | | 183,907 |
Fidelity Large Cap Core Enhanced Index Fund | 33,811 | | 303,289 |
Fidelity Series 100 Index Fund | 25,174 | | 227,828 |
Fidelity Series Broad Market Opportunities Fund | 29,020 | | 298,906 |
Fidelity Series Small Cap Opportunities Fund | 10,586 | | 118,778 |
TOTAL DOMESTIC EQUITY FUNDS | | 1,497,977 |
International Equity Funds - 2.7% |
Fidelity Advisor International Discovery Fund Institutional Class | 4,291 | | 144,302 |
TOTAL EQUITY FUNDS (Cost $1,593,440) | 1,642,279 |
Fixed-Income Funds - 40.8% |
| | | |
High Yield Fixed-Income Funds - 1.3% |
Fidelity Capital & Income Fund | 3,456 | | 33,079 |
Fidelity Strategic Income Fund | 2,994 | | 34,068 |
TOTAL HIGH YIELD FIXED-INCOME FUNDS | | 67,147 |
|
| Shares | | Value |
Investment Grade Fixed-Income Funds - 39.5% |
Fidelity Government Income Fund | 39,200 | | $ 418,660 |
Fidelity Strategic Real Return Fund | 41,988 | | 417,364 |
Fidelity Total Bond Fund | 113,818 | | 1,253,133 |
TOTAL INVESTMENT GRADE FIXED-INCOME FUNDS | | 2,089,157 |
TOTAL FIXED-INCOME FUNDS (Cost $2,030,227) | 2,156,304 |
Short-Term Funds - 28.1% |
| | | |
Fidelity Institutional Money Market Portfolio Institutional Class | 740,895 | | 740,895 |
Fidelity Short-Term Bond Fund | 87,317 | | 745,686 |
TOTAL SHORT-TERM FUNDS (Cost $1,474,109) | 1,486,581 |
TOTAL INVESTMENT PORTFOLIO - 100.0% (Cost $5,097,776) | | 5,285,164 |
NET OTHER ASSETS (LIABILITIES) - 0.0% | | (448) |
NET ASSETS - 100% | $ 5,284,716 |
Legend |
(a) Non-income producing |
Other Information |
All investments are categorized as Level 1 under the Fair Value Hierarchy. The inputs or methodology used for valuing securities may not be an indication of the risk associated with investing in those securities. For more information on valuation inputs, please refer to the Security Valuation section in the accompanying Notes to Financial Statements. |
Income Tax Information |
At July 31, 2011, the Fund had a capital loss carryforward of approximately $571,622 of which $123,548, $410,862 and $37,212 will expire in fiscal 2017, 2018 and 2019, respectively. Capital loss carryforwards are only available to offset future capital gains of the Fund to the extent provided by regulations and may be limited. |
See accompanying notes which are an integral part of the financial statements.
Annual Report
Fidelity Income Replacement 2018 Fund
Statement of Assets and Liabilities
| July 31, 2011 |
| | |
Assets | | |
Investment in securities, at value (cost $5,097,776) - See accompanying schedule | | $ 5,285,164 |
Receivable for investments sold | | 25,688 |
Total assets | | 5,310,852 |
| | |
Liabilities | | |
Payable for investments purchased | $ 25,721 | |
Distribution and service plan fees payable | 415 | |
Total liabilities | | 26,136 |
| | |
Net Assets | | $ 5,284,716 |
Net Assets consist of: | | |
Paid in capital | | $ 5,802,658 |
Undistributed net investment income | | 1,141 |
Accumulated undistributed net realized gain (loss) on investments | | (706,471) |
Net unrealized appreciation (depreciation) on investments | | 187,388 |
Net Assets | | $ 5,284,716 |
| | |
Calculation of Maximum Offering Price Class A:
Net Asset Value and redemption price per share ($783,795 ÷ 15,715.6 shares) | | $ 49.87 |
| | |
Maximum offering price per share (100/94.25 of $49.87) | | $ 52.91 |
| | |
Class T:
Net Asset Value and redemption price per share ($148,019 ÷ 2,966.4 shares) | | $ 49.90 |
| | |
Maximum offering price per share (100/96.50 of $49.90) | | $ 51.71 |
| | |
Class C:
Net Asset Value and offering price per share ($225,996 ÷ 4,533.7 shares)A | | $ 49.85 |
| | |
Income Replacement 2018:
Net Asset Value, offering price and redemption price per share ($3,806,441 ÷ 76,308.6 shares) | | $ 49.88 |
| | |
Institutional Class:
Net Asset Value, offering price and redemption price per share ($320,465 ÷ 6,423.8 shares) | | $ 49.89 |
A Redemption price per share is equal to net asset value less any applicable contingent deferred sales charge.
Statement of Operations
| Year ended July 31, 2011 |
| | |
Investment Income | | |
Income distributions from underlying funds | | $ 111,451 |
| | |
Expenses | | |
Distribution and service plan fees | $ 5,142 | |
Independent trustees' compensation | 21 | |
Total expenses before reductions | 5,163 | |
Expense reductions | (21) | 5,142 |
Net investment income (loss) | | 106,309 |
Realized and Unrealized Gain (Loss) Realized gain (loss) on sale of underlying fund shares | (39,850) | |
Capital gain distributions from underlying funds | 38,940 | |
Total net realized gain (loss) | | (910) |
Change in net unrealized appreciation (depreciation) on underlying funds | | 449,375 |
Net gain (loss) | | 448,465 |
Net increase (decrease) in net assets resulting from operations | | $ 554,774 |
See accompanying notes which are an integral part of the financial statements.
Annual Report
Statement of Changes in Net Assets
| Year ended
July 31, 2011 | Year ended
July 31, 2010 |
Increase (Decrease) in Net Assets | | |
Operations | | |
Net investment income (loss) | $ 106,309 | $ 103,982 |
Net realized gain (loss) | (910) | (68,006) |
Change in net unrealized appreciation (depreciation) | 449,375 | 484,491 |
Net increase (decrease) in net assets resulting from operations | 554,774 | 520,467 |
Distributions to shareholders from net investment income | (106,906) | (103,950) |
Distributions to shareholders from net realized gain | (28,806) | (13,543) |
Total distributions | (135,712) | (117,493) |
Share transactions - net increase (decrease) | (565,574) | 211,898 |
Total increase (decrease) in net assets | (146,512) | 614,872 |
| | |
Net Assets | | |
Beginning of period | 5,431,228 | 4,816,356 |
End of period (including undistributed net investment income of $1,141 and undistributed net investment income of $1,816, respectively) | $ 5,284,716 | $ 5,431,228 |
Financial Highlights - Class A
Years ended July 31, | 2011 | 2010 | 2009 | 2008G |
Selected Per-Share Data | | | | |
Net asset value, beginning of period | $ 46.45 | $ 42.81 | $ 47.46 | $ 50.00 |
Income from Investment Operations | | | | |
Net investment income (loss)E | .836 | .836 | 1.092 | 1.163 |
Net realized and unrealized gain (loss) | 3.655 | 3.763 | (4.138) | (2.454) |
Total from investment operations | 4.491 | 4.599 | (3.046) | (1.291) |
Distributions from net investment income | (.834) | (.839) | (1.124) | (1.119) |
Distributions from net realized gain | (.237) | (.120) | (.480) | (.130) |
Total distributions | (1.071) | (.959) | (1.604) | (1.249) |
Net asset value, end of period | $ 49.87 | $ 46.45 | $ 42.81 | $ 47.46 |
Total ReturnB,C,D | 9.73% | 10.80% | (6.06)% | (2.68)% |
Ratios to Average Net AssetsF,H | | | | |
Expenses before reductions | .25% | .25% | .25% | .25%A |
Expenses net of fee waivers, if any | .25% | .25% | .25% | .25%A |
Expenses net of all reductions | .25% | .25% | .25% | .25%A |
Net investment income (loss) | 1.71% | 1.83% | 2.69% | 2.60%A |
Supplemental Data | | | | |
Net assets, end of period (000 omitted) | $ 784 | $ 1,147 | $ 833 | $ 1,107 |
Portfolio turnover rate | 39% | 24% | 51% | 46%A |
A Annualized
B Total returns for periods of less than one year are not annualized.
C Total returns would have been lower if certain expenses had not been reduced during the applicable periods shown.
D Total returns do not include the effect of the sales charges.
E Calculated based on average shares outstanding during the period.
F Amounts do not include the activity of the underlying funds.
G For the period August 30, 2007 (commencement of operations) to July 31, 2008.
H Expense ratios reflect operating expenses of the class. Expenses before reductions do not reflect amounts reimbursed by the investment adviser or reductions from expense offset arrangements and do not represent the amount paid by the class during periods when reimbursements or reductions occur. Expenses net of fee waivers reflect expenses after reimbursement by the investment adviser but prior to reductions from expense offset arrangements. Expenses net of all reductions represent the net expenses paid by the class but do not include expenses of the investment companies in which the Fund invests.
See accompanying notes which are an integral part of the financial statements.
Annual Report
Financial Highlights - Class T
Years ended July 31, | 2011 | 2010 | 2009 | 2008 G |
Selected Per-Share Data | | | | |
Net asset value, beginning of period | $ 46.48 | $ 42.83 | $ 47.46 | $ 50.00 |
Income from Investment Operations | | | | |
Net investment income (loss)E | .716 | .722 | .989 | 1.075 |
Net realized and unrealized gain (loss) | 3.664 | 3.759 | (4.128) | (2.483) |
Total from investment operations | 4.380 | 4.481 | (3.139) | (1.408) |
Distributions from net investment income | (.723) | (.711) | (1.011) | (1.002) |
Distributions from net realized gain | (.237) | (.120) | (.480) | (.130) |
Total distributions | (.960) | (.831) | (1.491) | (1.132) |
Net asset value, end of period | $ 49.90 | $ 46.48 | $ 42.83 | $ 47.46 |
Total ReturnB,C,D | 9.48% | 10.51% | (6.28)% | (2.91)% |
Ratios to Average Net AssetsF,H | | | | |
Expenses before reductions | .50% | .50% | .50% | .50%A |
Expenses net of fee waivers, if any | .50% | .50% | .50% | .50%A |
Expenses net of all reductions | .50% | .50% | .50% | .50%A |
Net investment income (loss) | 1.46% | 1.58% | 2.44% | 2.35%A |
Supplemental Data | | | | |
Net assets, end of period (000 omitted) | $ 148 | $ 52 | $ 91 | $ 154 |
Portfolio turnover rate | 39% | 24% | 51% | 46%A |
A Annualized
B Total returns for periods of less than one year are not annualized.
C Total returns would have been lower if certain expenses had not been reduced during the applicable periods shown.
D Total returns do not include the effect of the sales charges.
E Calculated based on average shares outstanding during the period.
F Amounts do not include the activity of the underlying funds.
G For the period August 30, 2007 (commencement of operations) to July 31, 2008.
H Expense ratios reflect operating expenses of the class. Expenses before reductions do not reflect amounts reimbursed by the investment adviser or reductions from expense offset arrangements and do not represent the amount paid by the class during periods when reimbursements or reductions occur. Expenses net of fee waivers reflect expenses after reimbursement by the investment adviser but prior to reductions from expense offset arrangements. Expenses net of all reductions represent the net expenses paid by the class but do not include expenses of the investment companies in which the Fund invests.
Financial Highlights - Class C
Years ended July 31, | 2011 | 2010 | 2009 | 2008G |
Selected Per-Share Data | | | | |
Net asset value, beginning of period | $ 46.43 | $ 42.80 | $ 47.41 | $ 50.00 |
Income from Investment Operations | | | | |
Net investment income (loss)E | .469 | .495 | .786 | .836 |
Net realized and unrealized gain (loss) | 3.659 | 3.760 | (4.122) | (2.476) |
Total from investment operations | 4.128 | 4.255 | (3.336) | (1.640) |
Distributions from net investment income | (.471) | (.505) | (.794) | (.820) |
Distributions from net realized gain | (.237) | (.120) | (.480) | (.130) |
Total distributions | (.708) | (.625) | (1.274) | (.950) |
Net asset value, end of period | $ 49.85 | $ 46.43 | $ 42.80 | $ 47.41 |
Total ReturnB,C,D | 8.93% | 9.98% | (6.75)% | (3.36)% |
Ratios to Average Net AssetsF,H | | | | |
Expenses before reductions | 1.00% | 1.00% | 1.00% | 1.00%A |
Expenses net of fee waivers, if any | 1.00% | 1.00% | 1.00% | 1.00%A |
Expenses net of all reductions | 1.00% | 1.00% | 1.00% | 1.00%A |
Net investment income (loss) | .96% | 1.08% | 1.94% | 1.85%A |
Supplemental Data | | | | |
Net assets, end of period (000 omitted) | $ 226 | $ 201 | $ 131 | $ 365 |
Portfolio turnover rate | 39% | 24% | 51% | 46%A |
A Annualized
B Total returns for periods of less than one year are not annualized.
C Total returns would have been lower if certain expenses had not been reduced during the applicable periods shown.
D Total returns do not include the effect of the contingent deferred sales charge.
E Calculated based on average shares outstanding during the period.
F Amounts do not include the activity of the underlying funds.
G For the period August 30, 2007 (commencement of operations) to July 31, 2008.
H Expense ratios reflect operating expenses of the class. Expenses before reductions do not reflect amounts reimbursed by the investment adviser or reductions from expense offset arrangements and do not represent the amount paid by the class during periods when reimbursements or reductions occur. Expenses net of fee waivers reflect expenses after reimbursement by the investment adviser but prior to reductions from expense offset arrangements. Expenses net of all reductions represent the net expenses paid by the class but do not include expenses of the investment companies in which the Fund invests.
See accompanying notes which are an integral part of the financial statements.
Annual Report
Financial Highlights - Income Replacement 2018
Years ended July 31, | 2011 | 2010 | 2009 | 2008G |
Selected Per-Share Data | | | | |
Net asset value, beginning of period | $ 46.46 | $ 42.82 | $ 47.46 | $ 50.00 |
Income from Investment Operations | | | | |
Net investment income (loss)D | .960 | .950 | 1.202 | 1.280 |
Net realized and unrealized gain (loss) | 3.657 | 3.761 | (4.138) | (2.469) |
Total from investment operations | 4.617 | 4.711 | (2.936) | (1.189) |
Distributions from net investment income | (.960) | (.951) | (1.224) | (1.221) |
Distributions from net realized gain | (.237) | (.120) | (.480) | (.130) |
Total distributions | (1.197) | (1.071) | (1.704) | (1.351) |
Net asset value, end of period | $ 49.88 | $ 46.46 | $ 42.82 | $ 47.46 |
Total ReturnB,C | 10.01% | 11.07% | (5.81)% | (2.48)% |
Ratios to Average Net AssetsE,H | | | | |
Expenses before reductionsF | .00% | .00% | .00% | .00%A |
Expenses net of fee waivers, if any | .00% | .00% | .00% | .00%A |
Expenses net of all reductions | .00% | .00% | .00% | .00%A |
Net investment income (loss) | 1.96% | 2.08% | 2.94% | 2.85%A |
Supplemental Data | | | | |
Net assets, end of period (000 omitted) | $ 3,806 | $ 3,681 | $ 3,435 | $ 5,167 |
Portfolio turnover rate | 39% | 24% | 51% | 46%A |
A Annualized
B Total returns for periods of less than one year are not annualized.
C Total returns would have been lower if certain expenses had not been reduced during the applicable periods shown.
D Calculated based on average shares outstanding during the period.
E Amounts do not include the activity of the underlying funds.
F Amount represents less than .01%.
G For the period August 30, 2007 (commencement of operations) to July 31, 2008.
H Expense ratios reflect operating expenses of the class. Expenses before reductions do not reflect amounts reimbursed by the investment adviser or reductions from expense offset arrangements and do not represent the amount paid by the class during periods when reimbursements or reductions occur. Expenses net of fee waivers reflect expenses after reimbursement by the investment adviser but prior to reductions from expense offset arrangements. Expenses net of all reductions represent the net expenses paid by the class but do not include expenses of the investment companies in which the Fund invests.
Financial Highlights - Institutional Class
Years ended July 31, | 2011 | 2010 | 2009 | 2008G |
Selected Per-Share Data | | | | |
Net asset value, beginning of period | $ 46.46 | $ 42.82 | $ 47.47 | $ 50.00 |
Income from Investment Operations | | | | |
Net investment income (loss)D | .959 | .950 | 1.175 | 1.295 |
Net realized and unrealized gain (loss) | 3.668 | 3.761 | (4.121) | (2.474) |
Total from investment operations | 4.627 | 4.711 | (2.946) | (1.179) |
Distributions from net investment income | (.960) | (.951) | (1.224) | (1.221) |
Distributions from net realized gain | (.237) | (.120) | (.480) | (.130) |
Total distributions | (1.197) | (1.071) | (1.704) | (1.351) |
Net asset value, end of period | $ 49.89 | $ 46.46 | $ 42.82 | $ 47.47 |
Total ReturnB,C | 10.03% | 11.07% | (5.83)% | (2.46)% |
Ratios to Average Net AssetsE,H | | | | |
Expenses before reductionsF | .00% | .00% | .00% | .00%A |
Expenses net of fee waivers, if any | .00% | .00% | .00% | .00%A |
Expenses net of all reductions | .00% | .00% | .00% | .00%A |
Net investment income (loss) | 1.96% | 2.08% | 2.94% | 2.85%A |
Supplemental Data | | | | |
Net assets, end of period (000 omitted) | $ 320 | $ 350 | $ 326 | $ 214 |
Portfolio turnover rate | 39% | 24% | 51% | 46%A |
A Annualized
B Total returns for periods of less than one year are not annualized.
C Total returns would have been lower if certain expenses had not been reduced during the applicable periods shown.
D Calculated based on average shares outstanding during the period.
E Amounts do not include the activity of the underlying funds.
F Amount represents less than .01%.
G For the period August 30, 2007 (commencement of operations) to July 31, 2008.
H Expense ratios reflect operating expenses of the class. Expenses before reductions do not reflect amounts reimbursed by the investment adviser or reductions from expense offset arrangements and do not represent the amount paid by the class during periods when reimbursements or reductions occur. Expenses net of fee waivers reflect expenses after reimbursement by the investment adviser but prior to reductions from expense offset arrangements. Expenses net of all reductions represent the net expenses paid by the class but do not include expenses of the investment companies in which the Fund invests.
See accompanying notes which are an integral part of the financial statements.
Annual Report
Fidelity Income Replacement 2020 Fund
Investment Changes (Unaudited)
Fund Holdings as of July 31, 2011 |
| % of fund's
net assets | % of fund's net assets
6 months ago |
Domestic Equity Funds | | |
Fidelity Advisor Mid Cap II Fund Institutional Class | 4.0 | 4.2 |
Fidelity Disciplined Equity Fund | 4.2 | 4.3 |
Fidelity Equity-Income Fund | 4.1 | 4.3 |
Fidelity Large Cap Core Enhanced Index Fund | 6.9 | 7.0 |
Fidelity Series 100 Index Fund | 5.1 | 5.2 |
Fidelity Series Broad Market Opportunities Fund | 6.8 | 7.0 |
Fidelity Series Small Cap Opportunities Fund | 2.7 | 2.8 |
| 33.8 | 34.8 |
International Equity Funds | | |
Fidelity Advisor International Discovery Fund Institutional Class | 3.7 | 3.9 |
High Yield Fixed-Income Funds | | |
Fidelity Capital & Income Fund | 1.3 | 1.4 |
Fidelity Strategic Income Fund | 1.4 | 1.4 |
| 2.7 | 2.8 |
Investment Grade Fixed-Income Funds | | |
Fidelity Government Income Fund | 7.3 | 7.2 |
Fidelity Strategic Real Return Fund | 7.3 | 7.2 |
Fidelity Total Bond Fund | 21.9 | 21.6 |
| 36.5 | 36.0 |
Short-Term Funds | | |
Fidelity Institutional Money Market Portfolio Institutional Class | 11.6 | 11.3 |
Fidelity Short-Term Bond Fund | 11.7 | 11.2 |
| 23.3 | 22.5 |
Net Other Assets (Liabilities)* | 0.0 | 0.0 |
| 100.0 | 100.0 |
* Amount represents less than 0.1% |
Asset Allocation (% of fund's net assets) |
Current |
| Domestic Equity Funds | 33.8% | |
| International Equity Funds | 3.7% | |
| High Yield
Fixed-Income Funds | 2.7% | |
| Investment Grade Fixed-Income Funds | 36.5% | |
| Short-Term Funds | 23.3% | |

Six months ago |
| Domestic Equity Funds | 34.8% | |
| International Equity Funds | 3.9% | |
| High Yield
Fixed-Income Funds | 2.8% | |
| Investment Grade Fixed-Income Funds | 36.0% | |
| Short-Term Funds | 22.5% | |

Expected |
| Domestic Equity Funds | 32.3% | |
| International Equity Funds | 3.4% | |
| High Yield
Fixed-Income Funds | 2.4% | |
| Investment Grade Fixed-Income Funds | 37.3% | |
| Short-Term Funds | 24.6% | |

The fund invests according to an asset allocation strategy that becomes increasingly conservative over time. The six months ago allocation is based on the fund's holdings as of January 31, 2011. The current allocation is based on the fund's holdings as of July 31, 2011. The expected allocation represents the fund's anticipated allocation at January 31, 2012. |
Annual Report
Fidelity Income Replacement 2020 Fund
Investments July 31, 2011
Showing Percentage of Net Assets
Equity Funds - 37.5% |
| Shares | | Value |
Domestic Equity Funds - 33.8% |
Fidelity Advisor Mid Cap II Fund Institutional Class (a) | 8,861 | | $ 160,646 |
Fidelity Disciplined Equity Fund | 7,178 | | 167,105 |
Fidelity Equity-Income Fund | 3,712 | | 164,659 |
Fidelity Large Cap Core Enhanced Index Fund | 30,359 | | 272,320 |
Fidelity Series 100 Index Fund | 22,596 | | 204,492 |
Fidelity Series Broad Market Opportunities Fund | 26,030 | | 268,106 |
Fidelity Series Small Cap Opportunities Fund | 9,469 | | 106,243 |
TOTAL DOMESTIC EQUITY FUNDS | | 1,343,571 |
International Equity Funds - 3.7% |
Fidelity Advisor International Discovery Fund Institutional Class | 4,338 | | 145,871 |
TOTAL EQUITY FUNDS (Cost $1,246,786) | 1,489,442 |
Fixed-Income Funds - 39.2% |
| | | |
High Yield Fixed-Income Funds - 2.7% |
Fidelity Capital & Income Fund | 5,515 | | 52,781 |
Fidelity Strategic Income Fund | 4,785 | | 54,448 |
TOTAL HIGH YIELD FIXED-INCOME FUNDS | | 107,229 |
|
| Shares | | Value |
Investment Grade Fixed-Income Funds - 36.5% |
Fidelity Government Income Fund | 27,198 | | $ 290,477 |
Fidelity Strategic Real Return Fund | 29,143 | | 289,686 |
Fidelity Total Bond Fund | 79,034 | | 870,168 |
TOTAL INVESTMENT GRADE FIXED-INCOME FUNDS | | 1,450,331 |
TOTAL FIXED-INCOME FUNDS (Cost $1,439,557) | 1,557,560 |
Short-Term Funds - 23.3% |
| | | |
Fidelity Institutional Money Market Portfolio Institutional Class | 460,794 | | 460,794 |
Fidelity Short-Term Bond Fund | 54,326 | | 463,942 |
TOTAL SHORT-TERM FUNDS (Cost $913,437) | 924,736 |
TOTAL INVESTMENT PORTFOLIO - 100.0% (Cost $3,599,780) | | 3,971,738 |
NET OTHER ASSETS (LIABILITIES) - 0.0% | | (365) |
NET ASSETS - 100% | $ 3,971,373 |
Legend |
(a) Non-income producing |
Other Information |
All investments are categorized as Level 1 under the Fair Value Hierarchy. The inputs or methodology used for valuing securities may not be an indication of the risk associated with investing in those securities. For more information on valuation inputs, please refer to the Security Valuation section in the accompanying Notes to Financial Statements. |
Income Tax Information |
At July 31, 2011, the Fund had a capital loss carryforward of approximately $144,422 of which $3,778, $118,446 and $22,198 will expire in fiscal 2017, 2018 and 2019, respectively. Capital loss carryforwards are only available to offset future capital gains of the Fund to the extent provided by regulations and may be limited. |
See accompanying notes which are an integral part of the financial statements.
Annual Report
Fidelity Income Replacement 2020 Fund
Statement of Assets and Liabilities
| July 31, 2011 |
| | |
Assets | | |
Investment in securities, at value (cost $3,599,780) - See accompanying schedule | | $ 3,971,738 |
Receivable for investments sold | | 3 |
Total assets | | 3,971,741 |
| | |
Liabilities | | |
Payable for investments purchased | $ 2 | |
Distribution and service plan fees payable | 366 | |
Total liabilities | | 368 |
| | |
Net Assets | | $ 3,971,373 |
Net Assets consist of: | | |
Paid in capital | | $ 3,836,502 |
Undistributed net investment income | | 855 |
Accumulated undistributed net realized gain (loss) on investments | | (237,942) |
Net unrealized appreciation (depreciation) on investments | | 371,958 |
Net Assets | | $ 3,971,373 |
| | |
Calculation of Maximum Offering Price Class A:
Net Asset Value and redemption price per share ($435,873 ÷ 8,718.36 shares) | | $ 49.99 |
| | |
Maximum offering price per share (100/94.25 of $49.99) | | $ 53.04 |
| | |
Class T:
Net Asset Value and redemption price per share ($195,964 ÷ 3,920.19 shares) | | $ 49.99 |
| | |
Maximum offering price per share (100/96.50 of $49.99) | | $ 51.80 |
| | |
Class C:
Net Asset Value and offering price per share ($228,454 ÷ 4,571.93 shares)A | | $ 49.97 |
| | |
Income Replacement 2020:
Net Asset Value, offering price and redemption price per share ($3,078,631 ÷ 61,577.53 shares) | | $ 50.00 |
| | |
Institutional Class:
Net Asset Value, offering price and redemption price per share ($32,451 ÷ 649.06 shares) | | $ 50.00 |
A Redemption price per share is equal to net asset value less any applicable contingent deferred sales charge.
Statement of Operations
| Year ended July 31, 2011 |
| | |
Investment Income | | |
Income distributions from underlying funds | | $ 76,517 |
| | |
Expenses | | |
Distribution and service plan fees | $ 5,120 | |
Independent trustees' compensation | 14 | |
Total expenses before reductions | 5,134 | |
Expense reductions | (14) | 5,120 |
Net investment income (loss) | | 71,397 |
Realized and Unrealized Gain (Loss) Realized gain (loss) on sale of underlying fund shares | (11,978) | |
Capital gain distributions from underlying funds | 23,304 | |
Total net realized gain (loss) | | 11,326 |
Change in net unrealized appreciation (depreciation) on underlying funds | | 303,624 |
Net gain (loss) | | 314,950 |
Net increase (decrease) in net assets resulting from operations | | $ 386,347 |
See accompanying notes which are an integral part of the financial statements.
Annual Report
Fidelity Income Replacement 2020 Fund
Financial Statements - continued
Statement of Changes in Net Assets
| Year ended
July 31, 2011 | Year ended
July 31, 2010 |
Increase (Decrease) in Net Assets | | |
Operations | | |
Net investment income (loss) | $ 71,397 | $ 58,358 |
Net realized gain (loss) | 11,326 | (17,761) |
Change in net unrealized appreciation (depreciation) | 303,624 | 270,430 |
Net increase (decrease) in net assets resulting from operations | 386,347 | 311,027 |
Distributions to shareholders from net investment income | (71,547) | (58,210) |
Distributions to shareholders from net realized gain | (16,958) | (7,714) |
Total distributions | (88,505) | (65,924) |
Share transactions - net increase (decrease) | 363,777 | 451,360 |
Total increase (decrease) in net assets | 661,619 | 696,463 |
| | |
Net Assets | | |
Beginning of period | 3,309,754 | 2,613,291 |
End of period (including undistributed net investment income of $855 and undistributed net investment income of $1,012, respectively) | $ 3,971,373 | $ 3,309,754 |
Financial Highlights - Class A
Years ended July 31, | 2011 | 2010 | 2009 | 2008G |
Selected Per-Share Data | | | | |
Net asset value, beginning of period | $ 46.09 | $ 42.28 | $ 47.11 | $ 50.00 |
Income from Investment Operations | | | | |
Net investment income (loss)E | .817 | .812 | 1.027 | 1.085 |
Net realized and unrealized gain (loss) | 4.128 | 3.930 | (4.465) | (2.692) |
Total from investment operations | 4.945 | 4.742 | (3.438) | (1.607) |
Distributions from net investment income | (.826) | (.817) | (1.032) | (1.113) |
Distributions from net realized gain | (.219) | (.115) | (.360) | (.170) |
Total distributions | (1.045) | (.932) | (1.392) | (1.283) |
Net asset value, end of period | $ 49.99 | $ 46.09 | $ 42.28 | $ 47.11 |
Total ReturnB,C,D | 10.79% | 11.27% | (7.00)% | (3.33)% |
Ratios to Average Net AssetsF,H | | | | |
Expenses before reductions | .25% | .25% | .25% | .25%A |
Expenses net of fee waivers, if any | .25% | .25% | .25% | .25%A |
Expenses net of all reductions | .25% | .25% | .25% | .25%A |
Net investment income (loss) | 1.67% | 1.79% | 2.60% | 2.42%A |
Supplemental Data | | | | |
Net assets, end of period (000 omitted) | $ 436 | $ 607 | $ 502 | $ 503 |
Portfolio turnover rate | 48% | 38% | 60% | 21%A |
A Annualized
B Total returns for periods of less than one year are not annualized.
C Total returns would have been lower if certain expenses had not been reduced during the applicable periods shown.
D Total returns do not include the effect of the sales charges.
E Calculated based on average shares outstanding during the period.
F Amounts do not include the activity of the underlying funds.
G For the period August 30, 2007 (commencement of operations) to July 31, 2008.
H Expense ratios reflect operating expenses of the class. Expenses before reductions do not reflect amounts reimbursed by the investment adviser or reductions from expense offset arrangements and do not represent the amount paid by the class during periods when reimbursements or reductions occur. Expenses net of fee waivers reflect expenses after reimbursement by the investment adviser but prior to reductions from expense offset arrangements. Expenses net of all reductions represent the net expenses paid by the class but do not include expenses of the investment companies in which the Fund invests.
See accompanying notes which are an integral part of the financial statements.
Annual Report
Financial Highlights - Class T
Years ended July 31, | 2011 | 2010 | 2009 | 2008G |
Selected Per-Share Data | | | | |
Net asset value, beginning of period | $ 46.09 | $ 42.28 | $ 47.10 | $ 50.00 |
Income from Investment Operations | | | | |
Net investment income (loss)E | .696 | .696 | .926 | .985 |
Net realized and unrealized gain (loss) | 4.135 | 3.928 | (4.460) | (2.707) |
Total from investment operations | 4.831 | 4.624 | (3.534) | (1.722) |
Distributions from net investment income | (.712) | (.699) | (.926) | (1.008) |
Distributions from net realized gain | (.219) | (.115) | (.360) | (.170) |
Total distributions | (.931) | (.814) | (1.286) | (1.178) |
Net asset value, end of period | $ 49.99 | $ 46.09 | $ 42.28 | $ 47.10 |
Total ReturnB,C,D | 10.54% | 10.98% | (7.23)% | (3.56)% |
Ratios to Average Net AssetsF,H | | | | |
Expenses before reductions | .50% | .50% | .50% | .50%A |
Expenses net of fee waivers, if any | .50% | .50% | .50% | .50%A |
Expenses net of all reductions | .50% | .50% | .50% | .50%A |
Net investment income (loss) | 1.42% | 1.54% | 2.35% | 2.17%A |
Supplemental Data | | | | |
Net assets, end of period (000 omitted) | $ 196 | $ 134 | $ 171 | $ 187 |
Portfolio turnover rate | 48% | 38% | 60% | 21%A |
A Annualized
B Total returns for periods of less than one year are not annualized.
C Total returns would have been lower if certain expenses had not been reduced during the applicable periods shown.
D Total returns do not include the effect of the sales charges.
E Calculated based on average shares outstanding during the period.
F Amounts do not include the activity of the underlying funds.
G For the period August 30, 2007 (commencement of operations) to July 31, 2008.
H Expense ratios reflect operating expenses of the class. Expenses before reductions do not reflect amounts reimbursed by the investment adviser or reductions from expense offset arrangements and do not represent the amount paid by the class during periods when reimbursements or reductions occur. Expenses net of fee waivers reflect expenses after reimbursement by the investment adviser but prior to reductions from expense offset arrangements. Expenses net of all reductions represent the net expenses paid by the class but do not include expenses of the investment companies in which the Fund invests.
Financial Highlights - Class C
Years ended July 31, | 2011 | 2010 | 2009 | 2008G |
Selected Per-Share Data | | | | |
Net asset value, beginning of period | $ 46.06 | $ 42.26 | $ 47.08 | $ 50.00 |
Income from Investment Operations | | | | |
Net investment income (loss)E | .449 | .473 | .736 | .755 |
Net realized and unrealized gain (loss) | 4.132 | 3.923 | (4.471) | (2.699) |
Total from investment operations | 4.581 | 4.396 | (3.735) | (1.944) |
Distributions from net investment income | (.452) | (.481) | (.725) | (.806) |
Distributions from net realized gain | (.219) | (.115) | (.360) | (.170) |
Total distributions | (.671) | (.596) | (1.085) | (.976) |
Net asset value, end of period | $ 49.97 | $ 46.06 | $ 42.26 | $ 47.08 |
Total ReturnB,C,D | 9.98% | 10.43% | (7.70)% | (3.99)% |
Ratios to Average Net AssetsF,H | | | | |
Expenses before reductions | 1.00% | 1.00% | 1.00% | 1.00%A |
Expenses net of fee waivers, if any | 1.00% | 1.00% | 1.00% | 1.00%A |
Expenses net of all reductions | 1.00% | 1.00% | 1.00% | 1.00%A |
Net investment income (loss) | .92% | 1.05% | 1.85% | 1.67%A |
Supplemental Data | | | | |
Net assets, end of period (000 omitted) | $ 228 | $ 295 | $ 221 | $ 275 |
Portfolio turnover rate | 48% | 38% | 60% | 21%A |
A Annualized
B Total returns for periods of less than one year are not annualized.
C Total returns would have been lower if certain expenses had not been reduced during the applicable periods shown.
D Total returns do not include the effect of the contingent deferred sales charge.
E Calculated based on average shares outstanding during the period.
F Amounts do not include the activity of the underlying funds.
G For the period August 30, 2007 (commencement of operations) to July 31, 2008.
H Expense ratios reflect operating expenses of the class. Expenses before reductions do not reflect amounts reimbursed by the investment adviser or reductions from expense offset arrangements and do not represent the amount paid by the class during periods when reimbursements or reductions occur. Expenses net of fee waivers reflect expenses after reimbursement by the investment adviser but prior to reductions from expense offset arrangements. Expenses net of all reductions represent the net expenses paid by the class but do not include expenses of the investment companies in which the Fund invests.
See accompanying notes which are an integral part of the financial statements.
Annual Report
Financial Highlights - Income Replacement 2020
Years ended July 31, | 2011 | 2010 | 2009 | 2008G |
Selected Per-Share Data | | | | |
Net asset value, beginning of period | $ 46.09 | $ 42.29 | $ 47.12 | $ 50.00 |
Income from Investment Operations | | | | |
Net investment income (loss)D | .942 | .925 | 1.125 | 1.190 |
Net realized and unrealized gain (loss) | 4.138 | 3.919 | (4.464) | (2.677) |
Total from investment operations | 5.080 | 4.844 | (3.339) | (1.487) |
Distributions from net investment income | (.951) | (.929) | (1.131) | (1.223) |
Distributions from net realized gain | (.219) | (.115) | (.360) | (.170) |
Total distributions | (1.170) | (1.044) | (1.491) | (1.393) |
Net asset value, end of period | $ 50.00 | $ 46.09 | $ 42.29 | $ 47.12 |
Total ReturnB,C | 11.10% | 11.52% | (6.76)% | (3.10)% |
Ratios to Average Net AssetsE,H | | | | |
Expenses before reductionsF | .00% | .00% | .00% | .00%A |
Expenses net of fee waivers, if any | .00% | .00% | .00% | .00%A |
Expenses net of all reductions | .00% | .00% | .00% | .00%A |
Net investment income (loss) | 1.92% | 2.04% | 2.86% | 2.67%A |
Supplemental Data | | | | |
Net assets, end of period (000 omitted) | $ 3,079 | $ 2,225 | $ 1,624 | $ 1,233 |
Portfolio turnover rate | 48% | 38% | 60% | 21%A |
A Annualized
B Total returns for periods of less than one year are not annualized.
C Total returns would have been lower if certain expenses had not been reduced during the applicable periods shown.
D Calculated based on average shares outstanding during the period.
E Amounts do not include the activity of the underlying funds.
F Amount represents less than .01%.
G For the period August 30, 2007 (commencement of operations) to July 31, 2008.
H Expense ratios reflect operating expenses of the class. Expenses before reductions do not reflect amounts reimbursed by the investment adviser or reductions from expense offset arrangements and do not represent the amount paid by the class during periods when reimbursements or reductions occur. Expenses net of fee waivers reflect expenses after reimbursement by the investment adviser but prior to reductions from expense offset arrangements. Expenses net of all reductions represent the net expenses paid by the class but do not include expenses of the investment companies in which the Fund invests.
Financial Highlights - Institutional Class
Years ended July 31, | 2011 | 2010 | 2009 | 2008G |
Selected Per-Share Data | | | | |
Net asset value, beginning of period | $ 46.09 | $ 42.29 | $ 47.12 | $ 50.00 |
Income from Investment Operations | | | | |
Net investment income (loss)D | .939 | .928 | 1.138 | 1.215 |
Net realized and unrealized gain (loss) | 4.141 | 3.916 | (4.477) | (2.702) |
Total from investment operations | 5.080 | 4.844 | (3.339) | (1.487) |
Distributions from net investment income | (.951) | (.929) | (1.131) | (1.223) |
Distributions from net realized gain | (.219) | (.115) | (.360) | (.170) |
Total distributions | (1.170) | (1.044) | (1.491) | (1.393) |
Net asset value, end of period | $ 50.00 | $ 46.09 | $ 42.29 | $ 47.12 |
Total ReturnB,C | 11.10% | 11.52% | (6.76)% | (3.10)% |
Ratios to Average Net AssetsE,H | | | | |
Expenses before reductionsF | .00% | .00% | .00% | .00%A |
Expenses net of fee waivers, if any | .00% | .00% | .00% | .00%A |
Expenses net of all reductions | .00% | .00% | .00% | .00%A |
Net investment income (loss) | 1.92% | 2.04% | 2.85% | 2.67%A |
Supplemental Data | | | | |
Net assets, end of period (000 omitted) | $ 32 | $ 49 | $ 95 | $ 163 |
Portfolio turnover rate | 48% | 38% | 60% | 21%A |
A Annualized
B Total returns for periods of less than one year are not annualized.
C Total returns would have been lower if certain expenses had not been reduced during the applicable periods shown.
D Calculated based on average shares outstanding during the period.
E Amounts do not include the activity of the underlying funds.
F Amount represents less than .01%.
G For the period August 30, 2007 (commencement of operations) to July 31, 2008.
H Expense ratios reflect operating expenses of the class. Expenses before reductions do not reflect amounts reimbursed by the investment adviser or reductions from expense offset arrangements and do not represent the amount paid by the class during periods when reimbursements or reductions occur. Expenses net of fee waivers reflect expenses after reimbursement by the investment adviser but prior to reductions from expense offset arrangements. Expenses net of all reductions represent the net expenses paid by the class but do not include expenses of the investment companies in which the Fund invests.
See accompanying notes which are an integral part of the financial statements.
Annual Report
Fidelity Income Replacement 2022 Fund
Investment Changes (Unaudited)
Fund Holdings as of July 31, 2011 |
| % of fund's
net assets | % of fund's net assets
6 months ago |
Domestic Equity Funds | | |
Fidelity Advisor Mid Cap II Fund Institutional Class | 4.5 | 4.6 |
Fidelity Disciplined Equity Fund | 4.7 | 4.8 |
Fidelity Equity-Income Fund | 4.6 | 4.8 |
Fidelity Large Cap Core Enhanced Index Fund | 7.7 | 7.8 |
Fidelity Series 100 Index Fund | 5.8 | 5.8 |
Fidelity Series Broad Market Opportunities Fund | 7.6 | 7.8 |
Fidelity Series Small Cap Opportunities Fund | 3.0 | 3.1 |
| 37.9 | 38.7 |
International Equity Funds | | |
Fidelity Advisor International Discovery Fund Institutional Class | 4.6 | 4.8 |
High Yield Fixed-Income Funds | | |
Fidelity Capital & Income Fund | 1.7 | 1.7 |
Fidelity Strategic Income Fund | 1.8 | 1.8 |
| 3.5 | 3.5 |
Investment Grade Fixed-Income Funds | | |
Fidelity Government Income Fund | 6.9 | 6.7 |
Fidelity Strategic Real Return Fund | 6.8 | 6.8 |
Fidelity Total Bond Fund | 20.5 | 20.3 |
| 34.2 | 33.8 |
Short-Term Funds | | |
Fidelity Institutional Money Market Portfolio Institutional Class | 9.9 | 9.6 |
Fidelity Short-Term Bond Fund | 9.9 | 9.6 |
| 19.8 | 19.2 |
Net Other Assets (Liabilities)* | 0.0 | 0.0 |
| 100.0 | 100.0 |
* Amount represents less than 0.1% |
Asset Allocation (% of fund's net assets) |
Current |
| Domestic Equity Funds | 37.9% | |
| International Equity Funds | 4.6% | |
| High Yield
Fixed-Income Funds | 3.5% | |
| Investment Grade Fixed-Income Funds | 34.2% | |
| Short-Term Funds | 19.8% | |

Six months ago |
| Domestic Equity Funds | 38.7% | |
| International Equity Funds | 4.8% | |
| High Yield
Fixed-Income Funds | 3.5% | |
| Investment Grade Fixed-Income Funds | 33.8% | |
| Short-Term Funds | 19.2% | |

Expected |
| Domestic Equity Funds | 36.9% | |
| International Equity Funds | 4.3% | |
| High Yield
Fixed-Income Funds | 3.2% | |
| Investment Grade Fixed-Income Funds | 34.9% | |
| Short-Term Funds | 20.7% | |

The fund invests according to an asset allocation strategy that becomes increasingly conservative over time. The six months ago allocation is based on the fund's holdings as of January 31, 2011. The current allocation is based on the fund's holdings as of July 31, 2011. The expected allocation represents the fund's anticipated allocation at January 31, 2012. |
Annual Report
Fidelity Income Replacement 2022 Fund
Investments July 31, 2011
Showing Percentage of Net Assets
Equity Funds - 42.5% |
| Shares | | Value |
Domestic Equity Funds - 37.9% |
Fidelity Advisor Mid Cap II Fund Institutional Class (a) | 8,478 | | $ 153,712 |
Fidelity Disciplined Equity Fund | 6,883 | | 160,235 |
Fidelity Equity-Income Fund | 3,560 | | 157,914 |
Fidelity Large Cap Core Enhanced Index Fund | 29,054 | | 260,616 |
Fidelity Series 100 Index Fund | 21,663 | | 196,046 |
Fidelity Series Broad Market Opportunities Fund | 24,921 | | 256,689 |
Fidelity Series Small Cap Opportunities Fund | 9,074 | | 101,805 |
TOTAL DOMESTIC EQUITY FUNDS | | 1,287,017 |
International Equity Funds - 4.6% |
Fidelity Advisor International Discovery Fund Institutional Class | 4,654 | | 156,500 |
TOTAL EQUITY FUNDS (Cost $1,498,678) | 1,443,517 |
Fixed-Income Funds - 37.7% |
| | | |
High Yield Fixed-Income Funds - 3.5% |
Fidelity Capital & Income Fund | 6,066 | | 58,055 |
Fidelity Strategic Income Fund | 5,247 | | 59,707 |
TOTAL HIGH YIELD FIXED-INCOME FUNDS | | 117,762 |
|
| Shares | | Value |
Investment Grade Fixed-Income Funds - 34.2% |
Fidelity Government Income Fund | 21,813 | | $ 232,960 |
Fidelity Strategic Real Return Fund | 23,409 | | 232,688 |
Fidelity Total Bond Fund | 63,382 | | 697,839 |
TOTAL INVESTMENT GRADE FIXED-INCOME FUNDS | | 1,163,487 |
TOTAL FIXED-INCOME FUNDS (Cost $1,236,149) | 1,281,249 |
Short-Term Funds - 19.8% |
| | | |
Fidelity Institutional Money Market Portfolio Institutional Class | 334,581 | | 334,581 |
Fidelity Short-Term Bond Fund | 39,427 | | 336,703 |
TOTAL SHORT-TERM FUNDS (Cost $669,361) | 671,284 |
TOTAL INVESTMENT PORTFOLIO - 100.0% (Cost $3,404,188) | | 3,396,050 |
NET OTHER ASSETS (LIABILITIES) - 0.0% | | (49) |
NET ASSETS - 100% | $ 3,396,001 |
Legend |
(a) Non-income producing |
Other Information |
All investments are categorized as Level 1 under the Fair Value Hierarchy. The inputs or methodology used for valuing securities may not be an indication of the risk associated with investing in those securities. For more information on valuation inputs, please refer to the Security Valuation section in the accompanying Notes to Financial Statements. |
Income Tax Information |
At July 31, 2011, the Fund had a capital loss carryforward of approximately $619,540 of which $64,025, $481,397 and $74,118 will expire in fiscal 2017, 2018 and 2019, respectively. Capital loss carryforwards are only available to offset future capital gains of the Fund to the extent provided by regulations and may be limited. |
See accompanying notes which are an integral part of the financial statements.
Annual Report
Fidelity Income Replacement 2022 Fund
Statement of Assets and Liabilities
| July 31, 2011 |
| | |
Assets | | |
Investment in securities, at value (cost $3,404,188) - See accompanying schedule | | $ 3,396,050 |
Cash | | 1 |
Receivable for investments sold | | 2 |
Total assets | | 3,396,053 |
| | |
Liabilities | | |
Distribution and service plan fees payable | | 52 |
| | |
Net Assets | | $ 3,396,001 |
Net Assets consist of: | | |
Paid in capital | | $ 4,057,410 |
Undistributed net investment income | | 761 |
Accumulated undistributed net realized gain (loss) on investments | | (654,032) |
Net unrealized appreciation (depreciation) on investments | | (8,138) |
Net Assets | | $ 3,396,001 |
| | |
Calculation of Maximum Offering Price Class A:
Net Asset Value and redemption price per share ($71,513 ÷ 1,436.28 shares) | | $ 49.79 |
| | |
Maximum offering price per share (100/94.25 of $49.79) | | $ 52.83 |
| | |
Class T:
Net Asset Value and redemption price per share ($22,848 ÷ 458.60 shares) | | $ 49.82 |
| | |
Maximum offering price per share (100/96.50 of $49.82) | | $ 51.63 |
| | |
Class C:
Net Asset Value and offering price per share ($32,317 ÷ 648.81 shares)A | | $ 49.81 |
| | |
Income Replacement 2022:
Net Asset Value, offering price and redemption price per share ($3,265,504 ÷ 65,598.59 shares) | | $ 49.78 |
| | |
Institutional Class:
Net Asset Value, offering price and redemption price per share ($3,819 ÷ 76.73 shares) | | $ 49.77 |
A Redemption price per share is equal to net asset value less any applicable contingent deferred sales charge.
Statement of Operations
| Year ended July 31, 2011 |
| | |
Investment Income | | |
Income distributions from underlying funds | | $ 58,689 |
| | |
Expenses | | |
Distribution and service plan fees | $ 836 | |
Independent trustees' compensation | 11 | |
Total expenses before reductions | 847 | |
Expense reductions | (11) | 836 |
Net investment income (loss) | | 57,853 |
Realized and Unrealized Gain (Loss) Realized gain (loss) on sale of underlying fund shares | 33,778 | |
Capital gain distributions from underlying funds | 17,436 | |
Total net realized gain (loss) | | 51,214 |
Change in net unrealized appreciation (depreciation) on underlying funds | | 211,768 |
Net gain (loss) | | 262,982 |
Net increase (decrease) in net assets resulting from operations | | $ 320,835 |
See accompanying notes which are an integral part of the financial statements.
Annual Report
Statement of Changes in Net Assets
| Year ended
July 31, 2011 | Year ended
July 31, 2010 |
Increase (Decrease) in Net Assets | | |
Operations | | |
Net investment income (loss) | $ 57,853 | $ 57,048 |
Net realized gain (loss) | 51,214 | (60,204) |
Change in net unrealized appreciation (depreciation) | 211,768 | 328,653 |
Net increase (decrease) in net assets resulting from operations | 320,835 | 325,497 |
Distributions to shareholders from net investment income | (57,885) | (57,173) |
Distributions to shareholders from net realized gain | (12,730) | (19,734) |
Total distributions | (70,615) | (76,907) |
Share transactions - net increase (decrease) | 582,659 | (508,119) |
Total increase (decrease) in net assets | 832,879 | (259,529) |
| | |
Net Assets | | |
Beginning of period | 2,563,122 | 2,822,651 |
End of period (including undistributed net investment income of $761 and undistributed net investment income of $816, respectively) | $ 3,396,001 | $ 2,563,122 |
Financial Highlights - Class A
Years ended July 31, | 2011 | 2010 | 2009 | 2008G |
Selected Per-Share Data | | | | |
Net asset value, beginning of period | $ 45.58 | $ 41.87 | $ 47.05 | $ 50.00 |
Income from Investment Operations | | | | |
Net investment income (loss)E | .817 | .815 | 1.035 | 1.087 |
Net realized and unrealized gain (loss) | 4.431 | 3.980 | (4.739) | (2.853) |
Total from investment operations | 5.248 | 4.795 | (3.704) | (1.766) |
Distributions from net investment income | (.824) | (.793) | (1.056) | (1.014) |
Distributions from net realized gain | (.214) | (.292) | (.420) | (.170) |
Total distributions | (1.038) | (1.085) | (1.476) | (1.184) |
Net asset value, end of period | $ 49.79 | $ 45.58 | $ 41.87 | $ 47.05 |
Total ReturnB,C,D | 11.58% | 11.53% | (7.53)% | (3.64)% |
Ratios to Average Net AssetsF,H | | | | |
Expenses before reductions | .25% | .25% | .26% | .25%A |
Expenses net of fee waivers, if any | .25% | .25% | .26% | .25%A |
Expenses net of all reductions | .25% | .25% | .26% | .25%A |
Net investment income (loss) | 1.67% | 1.82% | 2.62% | 2.41%A |
Supplemental Data | | | | |
Net assets, end of period (000 omitted) | $ 72 | $ 42 | $ 122 | $ 289 |
Portfolio turnover rate | 29% | 24% | 22% | 32%A |
A Annualized
B Total returns for periods of less than one year are not annualized.
C Total returns would have been lower if certain expenses had not been reduced during the applicable periods shown.
D Total returns do not include the effect of the sales charges.
E Calculated based on average shares outstanding during the period.
F Amounts do not include the activity of the underlying funds.
G For the period August 30, 2007 (commencement of operations) to July 31, 2008.
H Expense ratios reflect operating expenses of the class. Expenses before reductions do not reflect amounts reimbursed by the investment adviser or reductions from expense offset arrangements and do not represent the amount paid by the class during periods when reimbursements or reductions occur. Expenses net of fee waivers reflect expenses after reimbursement by the investment adviser but prior to reductions from expense offset arrangements. Expenses net of all reductions represent the net expenses paid by the class but do not include expenses of the investment companies in which the Fund invests.
See accompanying notes which are an integral part of the financial statements.
Annual Report
Financial Highlights - Class T
Years ended July 31, | 2011 | 2010 | 2009 | 2008G |
Selected Per-Share Data | | | | |
Net asset value, beginning of period | $ 45.57 | $ 41.86 | $ 47.04 | $ 50.00 |
Income from Investment Operations | | | | |
Net investment income (loss)E | .691 | .702 | .933 | .982 |
Net realized and unrealized gain (loss) | 4.434 | 3.985 | (4.736) | (2.862) |
Total from investment operations | 5.125 | 4.687 | (3.803) | (1.880) |
Distributions from net investment income | (.661) | (.685) | (.957) | (.910) |
Distributions from net realized gain | (.214) | (.292) | (.420) | (.170) |
Total distributions | (.875) | (.977) | (1.377) | (1.080) |
Net asset value, end of period | $ 49.82 | $ 45.57 | $ 41.86 | $ 47.04 |
Total ReturnB,C,D | 11.30% | 11.27% | (7.77)% | (3.87)% |
Ratios to Average Net AssetsF,H | | | | |
Expenses before reductions | .50% | .50% | .51% | .50%A |
Expenses net of fee waivers, if any | .50% | .50% | .51% | .50%A |
Expenses net of all reductions | .50% | .50% | .51% | .50%A |
Net investment income (loss) | 1.43% | 1.57% | 2.37% | 2.16%A |
Supplemental Data | | | | |
Net assets, end of period (000 omitted) | $ 23 | $ 77 | $ 112 | $ 187 |
Portfolio turnover rate | 29% | 24% | 22% | 32%A |
A Annualized
B Total returns for periods of less than one year are not annualized.
C Total returns would have been lower if certain expenses had not been reduced during the applicable periods shown.
D Total returns do not include the effect of the sales charges.
E Calculated based on average shares outstanding during the period.
F Amounts do not include the activity of the underlying funds.
G For the period August 30, 2007 (commencement of operations) to July 31, 2008.
H Expense ratios reflect operating expenses of the class. Expenses before reductions do not reflect amounts reimbursed by the investment adviser or reductions from expense offset arrangements and do not represent the amount paid by the class during periods when reimbursements or reductions occur. Expenses net of fee waivers reflect expenses after reimbursement by the investment adviser but prior to reductions from expense offset arrangements. Expenses net of all reductions represent the net expenses paid by the class but do not include expenses of the investment companies in which the Fund invests.
Financial Highlights - Class C
Years ended July 31, | 2011 | 2010 | 2009 | 2008G |
Selected Per-Share Data | | | | |
Net asset value, beginning of period | $ 45.58 | $ 41.86 | $ 47.04 | $ 50.00 |
Income from Investment Operations | | | | |
Net investment income (loss)E | .447 | .477 | .737 | .760 |
Net realized and unrealized gain (loss) | 4.434 | 3.989 | (4.745) | (2.860) |
Total from investment operations | 4.881 | 4.466 | (4.008) | (2.100) |
Distributions from net investment income | (.437) | (.454) | (.752) | (.690) |
Distributions from net realized gain | (.214) | (.292) | (.420) | (.170) |
Total distributions | (.651) | (.746) | (1.172) | (.860) |
Net asset value, end of period | $ 49.81 | $ 45.58 | $ 41.86 | $ 47.04 |
Total ReturnB,C,D | 10.74% | 10.72% | (8.25)% | (4.29)% |
Ratios to Average Net AssetsF,H | | | | |
Expenses before reductions | 1.00% | 1.00% | 1.01% | 1.00%A |
Expenses net of fee waivers, if any | 1.00% | 1.00% | 1.01% | 1.00%A |
Expenses net of all reductions | 1.00% | 1.00% | 1.01% | 1.00%A |
Net investment income (loss) | .92% | 1.07% | 1.87% | 1.66%A |
Supplemental Data | | | | |
Net assets, end of period (000 omitted) | $ 32 | $ 44 | $ 69 | $ 120 |
Portfolio turnover rate | 29% | 24% | 22% | 32%A |
A Annualized
B Total returns for periods of less than one year are not annualized.
C Total returns would have been lower if certain expenses had not been reduced during the applicable periods shown.
D Total returns do not include the effect of the contingent deferred sales charge.
E Calculated based on average shares outstanding during the period.
F Amounts do not include the activity of the underlying funds.
G For the period August 30, 2007 (commencement of operations) to July 31, 2008.
H Expense ratios reflect operating expenses of the class. Expenses before reductions do not reflect amounts reimbursed by the investment adviser or reductions from expense offset arrangements and do not represent the amount paid by the class during periods when reimbursements or reductions occur. Expenses net of fee waivers reflect expenses after reimbursement by the investment adviser but prior to reductions from expense offset arrangements. Expenses net of all reductions represent the net expenses paid by the class but do not include expenses of the investment companies in which the Fund invests.
See accompanying notes which are an integral part of the financial statements.
Annual Report
Financial Highlights - Income Replacement 2022
Years ended July 31, | 2011 | 2010 | 2009 | 2008G |
Selected Per-Share Data | | | | |
Net asset value, beginning of period | $ 45.56 | $ 41.87 | $ 47.06 | $ 50.00 |
Income from Investment Operations | | | | |
Net investment income (loss)D | .937 | .925 | 1.144 | 1.190 |
Net realized and unrealized gain (loss) | 4.438 | 3.978 | (4.752) | (2.836) |
Total from investment operations | 5.375 | 4.903 | (3.608) | (1.646) |
Distributions from net investment income | (.941) | (.921) | (1.162) | (1.124) |
Distributions from net realized gain | (.214) | (.292) | (.420) | (.170) |
Total distributions | (1.155) | (1.213) | (1.582) | (1.294) |
Net asset value, end of period | $ 49.78 | $ 45.56 | $ 41.87 | $ 47.06 |
Total ReturnB,C | 11.87% | 11.80% | (7.30)% | (3.41)% |
Ratios to Average Net AssetsE,H | | | | |
Expenses before reductions | .00%F | .00%F | .01% | .00%A,F |
Expenses net of fee waivers, if any | .00% | .00% | .01% | .00%A |
Expenses net of all reductions | .00% | .00% | .01% | .00%A |
Net investment income (loss) | 1.92% | 2.07% | 2.87% | 2.66%A |
Supplemental Data | | | | |
Net assets, end of period (000 omitted) | $ 3,266 | $ 2,395 | $ 2,353 | $ 4,666 |
Portfolio turnover rate | 29% | 24% | 22% | 32%A |
A Annualized
B Total returns for periods of less than one year are not annualized.
C Total returns would have been lower if certain expenses had not been reduced during the applicable periods shown.
D Calculated based on average shares outstanding during the period.
E Amounts do not include the activity of the underlying funds.
F Amount represents less than .01%.
G For the period August 30, 2007 (commencement of operations) to July 31, 2008.
H Expense ratios reflect operating expenses of the class. Expenses before reductions do not reflect amounts reimbursed by the investment adviser or reductions from expense offset arrangements and do not represent the amount paid by the class during periods when reimbursements or reductions occur. Expenses net of fee waivers reflect expenses after reimbursement by the investment adviser but prior to reductions from expense offset arrangements. Expenses net of all reductions represent the net expenses paid by the class but do not include expenses of the investment companies in which the Fund invests.
Financial Highlights - Institutional Class
Years ended July 31, | 2011 | 2010 | 2009 | 2008G |
Selected Per-Share Data | | | | |
Net asset value, beginning of period | $ 45.56 | $ 41.86 | $ 47.06 | $ 50.00 |
Income from Investment Operations | | | | |
Net investment income (loss)D | .937 | .918 | 1.131 | 1.208 |
Net realized and unrealized gain (loss) | 4.428 | 3.995 | (4.749) | (2.854) |
Total from investment operations | 5.365 | 4.913 | (3.618) | (1.646) |
Distributions from net investment income | (.941) | (.921) | (1.162) | (1.124) |
Distributions from net realized gain | (.214) | (.292) | (.420) | (.170) |
Total distributions | (1.155) | (1.213) | (1.582) | (1.294) |
Net asset value, end of period | $ 49.77 | $ 45.56 | $ 41.86 | $ 47.06 |
Total ReturnB,C | 11.85% | 11.83% | (7.33)% | (3.41)% |
Ratios to Average Net AssetsE,H | | | | |
Expenses before reductions | .00%F | .00%F | .01% | .00%A,F |
Expenses net of fee waivers, if any | .00% | .00% | .01% | .00%A |
Expenses net of all reductions | .00% | .00% | .01% | .00%A |
Net investment income (loss) | 1.92% | 2.07% | 2.87% | 2.66%A |
Supplemental Data | | | | |
Net assets, end of period (000 omitted) | $ 4 | $ 5 | $ 166 | $ 277 |
Portfolio turnover rate | 29% | 24% | 22% | 32%A |
A Annualized
B Total returns for periods of less than one year are not annualized.
C Total returns would have been lower if certain expenses had not been reduced during the applicable periods shown.
D Calculated based on average shares outstanding during the period.
E Amounts do not include the activity of the underlying funds.
F Amount represents less than .01%.
G For the period August 30, 2007 (commencement of operations) to July 31, 2008.
H Expense ratios reflect operating expenses of the class. Expenses before reductions do not reflect amounts reimbursed by the investment adviser or reductions from expense offset arrangements and do not represent the amount paid by the class during periods when reimbursements or reductions occur. Expenses net of fee waivers reflect expenses after reimbursement by the investment adviser but prior to reductions from expense offset arrangements. Expenses net of all reductions represent the net expenses paid by the class but do not include expenses of the investment companies in which the Fund invests.
See accompanying notes which are an integral part of the financial statements.
Annual Report
Fidelity Income Replacement 2024 Fund
Investment Changes (Unaudited)
Fund Holdings as of July 31, 2011 |
| % of fund's
net assets | % of fund's net assets
6 months ago |
Domestic Equity Funds | | |
Fidelity Advisor Mid Cap II Fund Institutional Class | 4.8 | 4.9 |
Fidelity Disciplined Equity Fund | 5.0 | 5.1 |
Fidelity Equity-Income Fund | 5.0 | 5.1 |
Fidelity Large Cap Core Enhanced Index Fund | 8.2 | 8.3 |
Fidelity Series 100 Index Fund | 6.2 | 6.2 |
Fidelity Series Broad Market Opportunities Fund | 8.1 | 8.3 |
Fidelity Series Small Cap Opportunities Fund | 3.2 | 3.3 |
| 40.5 | 41.2 |
International Equity Funds | | |
Fidelity Advisor International Discovery Fund Institutional Class | 5.5 | 5.6 |
High Yield Fixed-Income Funds | | |
Fidelity Capital & Income Fund | 2.0 | 2.0 |
Fidelity Strategic Income Fund | 2.0 | 2.0 |
| 4.0 | 4.0 |
Investment Grade Fixed-Income Funds | | |
Fidelity Government Income Fund | 6.5 | 6.4 |
Fidelity Strategic Real Return Fund | 6.5 | 6.5 |
Fidelity Total Bond Fund | 19.6 | 19.3 |
| 32.6 | 32.2 |
Short-Term Funds | | |
Fidelity Institutional Money Market Portfolio Institutional Class | 8.7 | 8.5 |
Fidelity Short-Term Bond Fund | 8.7 | 8.5 |
| 17.4 | 17.0 |
Net Other Assets (Liabilities)* | 0.0 | 0.0 |
| 100.0 | 100.0 |
* Amount represents less than 0.1% |
Asset Allocation (% of fund's net assets) |
Current |
| Domestic Equity Funds | 40.5% | |
| International Equity Funds | 5.5% | |
| High Yield
Fixed-Income Funds | 4.0% | |
| Investment Grade Fixed-Income Funds | 32.6% | |
| Short-Term Funds | 17.4% | |

Six months ago |
| Domestic Equity Funds | 41.2% | |
| International Equity Funds | 5.6% | |
| High Yield
Fixed-Income Funds | 4.0% | |
| Investment Grade Fixed-Income Funds | 32.2% | |
| Short-Term Funds | 17.0% | |

Expected |
| Domestic Equity Funds | 40.1% | |
| International Equity Funds | 5.2% | |
| High Yield
Fixed-Income Funds | 3.8% | |
| Investment Grade Fixed-Income Funds | 32.9% | |
| Short-Term Funds | 18.0% | |

The fund invests according to an asset allocation strategy that becomes increasingly conservative over time. The six months ago allocation is based on the fund's holdings as of January 31, 2011. The current allocation is based on the fund's holdings as of July 31, 2011. The expected allocation represents the fund's anticipated allocation at January 31, 2012. |
Annual Report
Fidelity Income Replacement 2024 Fund
Investments July 31, 2011
Showing Percentage of Net Assets
Equity Funds - 46.0% |
| Shares | | Value |
Domestic Equity Funds - 40.5% |
Fidelity Advisor Mid Cap II Fund Institutional Class (a) | 5,049 | | $ 91,546 |
Fidelity Disciplined Equity Fund | 4,095 | | 95,335 |
Fidelity Equity-Income Fund | 2,120 | | 94,043 |
Fidelity Large Cap Core Enhanced Index Fund | 17,276 | | 154,970 |
Fidelity Series 100 Index Fund | 12,883 | | 116,595 |
Fidelity Series Broad Market Opportunities Fund | 14,839 | | 152,838 |
Fidelity Series Small Cap Opportunities Fund | 5,404 | | 60,636 |
TOTAL DOMESTIC EQUITY FUNDS | | 765,963 |
International Equity Funds - 5.5% |
Fidelity Advisor International Discovery Fund Institutional Class | 3,061 | | 102,936 |
TOTAL EQUITY FUNDS (Cost $797,205) | 868,899 |
Fixed-Income Funds - 36.6% |
| | | |
High Yield Fixed-Income Funds - 4.0% |
Fidelity Capital & Income Fund | 3,893 | | 37,255 |
Fidelity Strategic Income Fund | 3,365 | | 38,297 |
TOTAL HIGH YIELD FIXED-INCOME FUNDS | | 75,552 |
|
| Shares | | Value |
Investment Grade Fixed-Income Funds - 32.6% |
Fidelity Government Income Fund | 11,548 | | $ 123,328 |
Fidelity Strategic Real Return Fund | 12,387 | | 123,130 |
Fidelity Total Bond Fund | 33,605 | | 369,993 |
TOTAL INVESTMENT GRADE FIXED-INCOME FUNDS | | 616,451 |
TOTAL FIXED-INCOME FUNDS (Cost $649,880) | 692,003 |
Short-Term Funds - 17.4% |
| | | |
Fidelity Institutional Money Market Portfolio Institutional Class | 164,304 | | 164,304 |
Fidelity Short-Term Bond Fund | 19,359 | | 165,329 |
TOTAL SHORT-TERM FUNDS (Cost $325,980) | 329,633 |
TOTAL INVESTMENT PORTFOLIO - 100.0% (Cost $1,773,065) | | 1,890,535 |
NET OTHER ASSETS (LIABILITIES) - 0.0% | | (136) |
NET ASSETS - 100% | $ 1,890,399 |
Legend |
(a) Non-income producing |
Other Information |
All investments are categorized as Level 1 under the Fair Value Hierarchy. The inputs or methodology used for valuing securities may not be an indication of the risk associated with investing in those securities. For more information on valuation inputs, please refer to the Security Valuation section in the accompanying Notes to Financial Statements. |
Income Tax Information |
At July 31, 2011, the Fund had a capital loss carryforward of approximately $134,792 of which $9,801, $66,647 and $58,344 will expire in fiscal 2017, 2018 and 2019, respectively. Capital loss carryforwards are only available to offset future capital gains of the Fund to the extent provided by regulations and may be limited. |
See accompanying notes which are an integral part of the financial statements.
Annual Report
Fidelity Income Replacement 2024 Fund
Statement of Assets and Liabilities
| July 31, 2011 |
| | |
Assets | | |
Investment in securities, at value (cost $1,773,065) - See accompanying schedule | | $ 1,890,535 |
Cash | | 72 |
Total assets | | 1,890,607 |
| | |
Liabilities | | |
Payable for investments purchased | $ 4 | |
Distribution and service plan fees payable | 204 | |
Total liabilities | | 208 |
| | |
Net Assets | | $ 1,890,399 |
Net Assets consist of: | | |
Paid in capital | | $ 1,937,792 |
Undistributed net investment income | | 362 |
Accumulated undistributed net realized gain (loss) on investments | | (165,225) |
Net unrealized appreciation (depreciation) on investments | | 117,470 |
Net Assets | | $ 1,890,399 |
| | |
Calculation of Maximum Offering Price Class A:
Net Asset Value and redemption price per share ($187,352 ÷ 3,758.0 shares) | | $ 49.85 |
| | |
Maximum offering price per share (100/94.25 of $49.85) | | $ 52.89 |
| | |
Class T:
Net Asset Value and redemption price per share ($40,221 ÷ 806.5 shares) | | $ 49.87 |
| | |
Maximum offering price per share (100/96.50 of $49.87) | | $ 51.68 |
| | |
Class C:
Net Asset Value and offering price per share ($171,805 ÷ 3,448.6 shares)A | | $ 49.82 |
| | |
| | |
Income Replacement 2024:
Net Asset Value, offering price and redemption price per share ($1,463,400 ÷ 29,350.7 shares) | | $ 49.86 |
| | |
Institutional Class:
Net Asset Value, offering price and redemption price per share ($27,621 ÷ 554.0 shares) | | $ 49.86 |
A Redemption price per share is equal to net asset value less any applicable contingent deferred sales charge.
Statement of Operations
| Year ended July 31, 2011 |
| | |
Investment Income | | |
Income distributions from underlying funds | | $ 32,191 |
| | |
Expenses | | |
Distribution and service plan fees | $ 2,557 | |
Independent trustees' compensation | 6 | |
Total expenses before reductions | 2,563 | |
Expense reductions | (6) | 2,557 |
Net investment income (loss) | | 29,634 |
Realized and Unrealized Gain (Loss) Realized gain (loss) on sale of underlying fund shares | (15,024) | |
Capital gain distributions from underlying funds | 9,534 | |
Total net realized gain (loss) | | (5,490) |
Change in net unrealized appreciation (depreciation) on underlying funds | | 160,663 |
Net gain (loss) | | 155,173 |
Net increase (decrease) in net assets resulting from operations | | $ 184,807 |
See accompanying notes which are an integral part of the financial statements.
Annual Report
Fidelity Income Replacement 2024 Fund
Financial Statements - continued
Statement of Changes in Net Assets
| Year ended
July 31, 2011 | Year ended
July 31, 2010 |
Increase (Decrease) in Net Assets | | |
Operations | | |
Net investment income (loss) | $ 29,634 | $ 30,872 |
Net realized gain (loss) | (5,490) | (37,364) |
Change in net unrealized appreciation (depreciation) | 160,663 | 180,425 |
Net increase (decrease) in net assets resulting from operations | 184,807 | 173,933 |
Distributions to shareholders from net investment income | (29,693) | (30,833) |
Distributions to shareholders from net realized gain | (7,078) | (4,233) |
Total distributions | (36,771) | (35,066) |
Share transactions - net increase (decrease) | 206,846 | 87,922 |
Total increase (decrease) in net assets | 354,882 | 226,789 |
| | |
Net Assets | | |
Beginning of period | 1,535,517 | 1,308,728 |
End of period (including undistributed net investment income of $362 and undistributed net investment income of $438, respectively) | $ 1,890,399 | $ 1,535,517 |
Financial Highlights - Class A
Years ended July 31, | 2011 | 2010 | 2009 | 2008G |
Selected Per-Share Data | | | | |
Net asset value, beginning of period | $ 45.41 | $ 41.48 | $ 46.97 | $ 50.00 |
Income from Investment Operations | | | | |
Net investment income (loss)E | .809 | .811 | 1.014 | 1.063 |
Net realized and unrealized gain (loss) | 4.667 | 4.020 | (5.004) | (2.884) |
Total from investment operations | 5.476 | 4.831 | (3.990) | (1.821) |
Distributions from net investment income | (.819) | (.791) | (1.020) | (1.039) |
Distributions from net realized gain | (.217) | (.110) | (.480) | (.170) |
Total distributions | (1.036) | (.901) | (1.500) | (1.209) |
Net asset value, end of period | $ 49.85 | $ 45.41 | $ 41.48 | $ 46.97 |
Total ReturnB,C,D | 12.13% | 11.70% | (8.10)% | (3.77)% |
Ratios to Average Net AssetsF,H | | | | |
Expenses before reductions | .25% | .25% | .25% | .25%A |
Expenses net of fee waivers, if any | .25% | .25% | .25% | .25%A |
Expenses net of all reductions | .25% | .25% | .25% | .25%A |
Net investment income (loss) | 1.66% | 1.82% | 2.62% | 2.35%A |
Supplemental Data | | | | |
Net assets, end of period (000 omitted) | $ 187 | $ 260 | $ 287 | $ 286 |
Portfolio turnover rate | 26% | 34% | 64% | 41%A |
A Annualized
B Total returns for periods of less than one year are not annualized.
C Total returns would have been lower if certain expenses had not been reduced during the applicable periods shown.
D Total returns do not include the effect of the sales charges.
E Calculated based on average shares outstanding during the period.
F Amounts do not include the activity of the underlying funds.
G For the period August 30, 2007 (commencement of operations) to July 31, 2008.
H Expense ratios reflect operating expenses of the class. Expenses before reductions do not reflect amounts reimbursed by the investment adviser or reductions from expense offset arrangements and do not represent the amount paid by the class during periods when reimbursements or reductions occur. Expenses net of fee waivers reflect expenses after reimbursement by the investment adviser but prior to reductions from expense offset arrangements. Expenses net of all reductions represent the net expenses paid by the class but do not include expenses of the investment companies in which the Fund invests.
See accompanying notes which are an integral part of the financial statements.
Annual Report
Financial Highlights - Class T
Years ended July 31, | 2011 | 2010 | 2009 | 2008G |
Selected Per-Share Data | | | | |
Net asset value, beginning of period | $ 45.42 | $ 41.48 | $ 46.97 | $ 50.00 |
Income from Investment Operations | | | | |
Net investment income (loss)E | .685 | .701 | .919 | .966 |
Net realized and unrealized gain (loss) | 4.672 | 4.025 | (5.010) | (2.903) |
Total from investment operations | 5.357 | 4.726 | (4.091) | (1.937) |
Distributions from net investment income | (.690) | (.676) | (.919) | (.923) |
Distributions from net realized gain | (.217) | (.110) | (.480) | (.170) |
Total distributions | (.907) | (.786) | (1.399) | (1.093) |
Net asset value, end of period | $ 49.87 | $ 45.42 | $ 41.48 | $ 46.97 |
Total ReturnB,C,D | 11.85% | 11.43% | (8.34)% | (3.99)% |
Ratios to Average Net AssetsF,H | | | | |
Expenses before reductions | .50% | .50% | .50% | .50%A |
Expenses net of fee waivers, if any | .50% | .50% | .50% | .50%A |
Expenses net of all reductions | .50% | .50% | .50% | .50%A |
Net investment income (loss) | 1.41% | 1.57% | 2.37% | 2.11%A |
Supplemental Data | | | | |
Net assets, end of period (000 omitted) | $ 40 | $ 54 | $ 69 | $ 96 |
Portfolio turnover rate | 26% | 34% | 64% | 41%A |
A Annualized
B Total returns for periods of less than one year are not annualized.
C Total returns would have been lower if certain expenses had not been reduced during the applicable periods shown.
D Total returns do not include the effect of the sales charges.
E Calculated based on average shares outstanding during the period.
F Amounts do not include the activity of the underlying funds.
G For the period August 30, 2007 (commencement of operations) to July 31, 2008.
H Expense ratios reflect operating expenses of the class. Expenses before reductions do not reflect amounts reimbursed by the investment adviser or reductions from expense offset arrangements and do not represent the amount paid by the class during periods when reimbursements or reductions occur. Expenses net of fee waivers reflect expenses after reimbursement by the investment adviser but prior to reductions from expense offset arrangements. Expenses net of all reductions represent the net expenses paid by the class but do not include expenses of the investment companies in which the Fund invests.
Financial Highlights - Class C
Years ended July 31, | 2011 | 2010 | 2009 | 2008G |
Selected Per-Share Data | | | | |
Net asset value, beginning of period | $ 45.38 | $ 41.45 | $ 46.93 | $ 50.00 |
Income from Investment Operations | | | | |
Net investment income (loss)E | .443 | .476 | .726 | .728 |
Net realized and unrealized gain (loss) | 4.668 | 4.020 | (5.005) | (2.903) |
Total from investment operations | 5.111 | 4.496 | (4.279) | (2.175) |
Distributions from net investment income | (.454) | (.456) | (.721) | (.725) |
Distributions from net realized gain | (.217) | (.110) | (.480) | (.170) |
Total distributions | (.671) | (.566) | (1.201) | (.895) |
Net asset value, end of period | $ 49.82 | $ 45.38 | $ 41.45 | $ 46.93 |
Total ReturnB,C,D | 11.30% | 10.87% | (8.80)% | (4.45)% |
Ratios to Average Net AssetsF,H | | | | |
Expenses before reductions | 1.00% | 1.00% | 1.00% | 1.00%A |
Expenses net of fee waivers, if any | 1.00% | 1.00% | 1.00% | 1.00%A |
Expenses net of all reductions | 1.00% | 1.00% | 1.00% | 1.00%A |
Net investment income (loss) | .91% | 1.07% | 1.87% | 1.61%A |
Supplemental Data | | | | |
Net assets, end of period (000 omitted) | $ 172 | $ 159 | $ 147 | $ 233 |
Portfolio turnover rate | 26% | 34% | 64% | 41%A |
A Annualized
B Total returns for periods of less than one year are not annualized.
C Total returns would have been lower if certain expenses had not been reduced during the applicable periods shown.
D Total returns do not include the effect of the contingent deferred sales charge.
E Calculated based on average shares outstanding during the period.
F Amounts do not include the activity of the underlying funds.
G For the period August 30, 2007 (commencement of operations) to July 31, 2008.
H Expense ratios reflect operating expenses of the class. Expenses before reductions do not reflect amounts reimbursed by the investment adviser or reductions from expense offset arrangements and do not represent the amount paid by the class during periods when reimbursements or reductions occur. Expenses net of fee waivers reflect expenses after reimbursement by the investment adviser but prior to reductions from expense offset arrangements. Expenses net of all reductions represent the net expenses paid by the class but do not include expenses of the investment companies in which the Fund invests.
See accompanying notes which are an integral part of the financial statements.
Annual Report
Financial Highlights - Income Replacement 2024
Years ended July 31, | 2011 | 2010 | 2009 | 2008G |
Selected Per-Share Data | | | | |
Net asset value, beginning of period | $ 45.42 | $ 41.49 | $ 46.98 | $ 50.00 |
Income from Investment Operations | | | | |
Net investment income (loss)D | .933 | .924 | 1.118 | 1.166 |
Net realized and unrealized gain (loss) | 4.668 | 4.020 | (5.011) | (2.868) |
Total from investment operations | 5.601 | 4.944 | (3.893) | (1.702) |
Distributions from net investment income | (.944) | (.904) | (1.117) | (1.148) |
Distributions from net realized gain | (.217) | (.110) | (.480) | (.170) |
Total distributions | (1.161) | (1.014) | (1.597) | (1.318) |
Net asset value, end of period | $ 49.86 | $ 45.42 | $ 41.49 | $ 46.98 |
Total ReturnB,C | 12.41% | 11.98% | (7.87)% | (3.53)% |
Ratios to Average Net AssetsE,H | | | | |
Expenses before reductionsF | .00% | .00% | .00% | .00%A |
Expenses net of fee waivers, if any | .00% | .00% | .00% | .00%A |
Expenses net of all reductions | .00% | .00% | .00% | .00%A |
Net investment income (loss) | 1.91% | 2.07% | 2.87% | 2.60%A |
Supplemental Data | | | | |
Net assets, end of period (000 omitted) | $ 1,463 | $ 1,026 | $ 749 | $ 714 |
Portfolio turnover rate | 26% | 34% | 64% | 41%A |
A Annualized
B Total returns for periods of less than one year are not annualized.
C Total returns would have been lower if certain expenses had not been reduced during the applicable periods shown.
D Calculated based on average shares outstanding during the period.
E Amounts do not include the activity of the underlying funds.
F Amount represents less than .01%.
G For the period August 30, 2007 (commencement of operations) to July 31, 2008.
H Expense ratios reflect operating expenses of the class. Expenses before reductions do not reflect amounts reimbursed by the investment adviser or reductions from expense offset arrangements and do not represent the amount paid by the class during periods when reimbursements or reductions occur. Expenses net of fee waivers reflect expenses after reimbursement by the investment adviser but prior to reductions from expense offset arrangements. Expenses net of all reductions represent the net expenses paid by the class but do not include expenses of the investment companies in which the Fund invests.
Financial Highlights - Institutional Class
Years ended July 31, | 2011 | 2010 | 2009 | 2008G |
Selected Per-Share Data | | | | |
Net asset value, beginning of period | $ 45.42 | $ 41.48 | $ 46.98 | $ 50.00 |
Income from Investment Operations | | | | |
Net investment income (loss)D | .930 | .922 | 1.119 | 1.194 |
Net realized and unrealized gain (loss) | 4.671 | 4.032 | (5.022) | (2.896) |
Total from investment operations | 5.601 | 4.954 | (3.903) | (1.702) |
Distributions from net investment income | (.944) | (.904) | (1.117) | (1.148) |
Distributions from net realized gain | (.217) | (.110) | (.480) | (.170) |
Total distributions | (1.161) | (1.014) | (1.597) | (1.318) |
Net asset value, end of period | $ 49.86 | $ 45.42 | $ 41.48 | $ 46.98 |
Total ReturnB,C | 12.41% | 12.00% | (7.89)% | (3.53)% |
Ratios to Average Net AssetsE,H | | | | |
Expenses before reductionsF | .00% | .00% | .00% | .00%A |
Expenses net of fee waivers, if any | .00% | .00% | .00% | .00%A |
Expenses net of all reductions | .00% | .00% | .00% | .00%A |
Net investment income (loss) | 1.91% | 2.07% | 2.87% | 2.60%A |
Supplemental Data | | | | |
Net assets, end of period (000 omitted) | $ 28 | $ 37 | $ 57 | $ 97 |
Portfolio turnover rate | 26% | 34% | 64% | 41%A |
A Annualized
B Total returns for periods of less than one year are not annualized.
C Total returns would have been lower if certain expenses had not been reduced during the applicable periods shown.
D Calculated based on average shares outstanding during the period.
E Amounts do not include the activity of the underlying funds.
F Amount represents less than .01%.
G For the period August 30, 2007 (commencement of operations) to July 31, 2008.
H Expense ratios reflect operating expenses of the class. Expenses before reductions do not reflect amounts reimbursed by the investment adviser or reductions from expense offset arrangements and do not represent the amount paid by the class during periods when reimbursements or reductions occur. Expenses net of fee waivers reflect expenses after reimbursement by the investment adviser but prior to reductions from expense offset arrangements. Expenses net of all reductions represent the net expenses paid by the class but do not include expenses of the investment companies in which the Fund invests.
See accompanying notes which are an integral part of the financial statements.
Annual Report
Fidelity Income Replacement 2026 Fund
Investment Changes (Unaudited)
Fund Holdings as of July 31, 2011 |
| % of fund's
net assets | % of fund's net assets
6 months ago |
Domestic Equity Funds | | |
Fidelity Advisor Mid Cap II Fund Institutional Class | 5.1 | 5.2 |
Fidelity Disciplined Equity Fund | 5.3 | 5.4 |
Fidelity Equity-Income Fund | 5.2 | 5.4 |
Fidelity Large Cap Core Enhanced Index Fund | 8.5 | 8.6 |
Fidelity Series 100 Index Fund | 6.4 | 6.4 |
Fidelity Series Broad Market Opportunities Fund | 8.4 | 8.6 |
Fidelity Series Small Cap Opportunities Fund | 3.3 | 3.4 |
| 42.2 | 43.0 |
International Equity Funds | | |
Fidelity Advisor International Discovery Fund Institutional Class | 6.3 | 6.4 |
High Yield Fixed-Income Funds | | |
Fidelity Capital & Income Fund | 2.2 | 2.2 |
Fidelity Strategic Income Fund | 2.2 | 2.2 |
| 4.4 | 4.4 |
Investment Grade Fixed-Income Funds | | |
Fidelity Government Income Fund | 6.2 | 6.1 |
Fidelity Strategic Real Return Fund | 6.2 | 6.1 |
Fidelity Total Bond Fund | 18.6 | 18.4 |
| 31.0 | 30.6 |
Short-Term Funds | | |
Fidelity Institutional Money Market Portfolio Institutional Class | 8.0 | 7.8 |
Fidelity Short-Term Bond Fund | 8.1 | 7.8 |
| 16.1 | 15.6 |
Net Other Assets (Liabilities)* | 0.0 | 0.0 |
| 100.0 | 100.0 |
* Amount represents less than 0.1% |
Asset Allocation (% of fund's net assets) |
Current |
| Domestic Equity Funds | 42.2% | |
| International Equity Funds | 6.3% | |
| High Yield
Fixed-Income Funds | 4.4% | |
| Investment Grade Fixed-Income Funds | 31.0% | |
| Short-Term Funds | 16.1% | |

Six months ago |
| Domestic Equity Funds | 43.0% | |
| International Equity Funds | 6.4% | |
| High Yield
Fixed-Income Funds | 4.4% | |
| Investment Grade Fixed-Income Funds | 30.6% | |
| Short-Term Funds | 15.6% | |

Expected |
| Domestic Equity Funds | 42.2% | |
| International Equity Funds | 6.0% | |
| High Yield
Fixed-Income Funds | 4.2% | |
 | Investment Grade Fixed-Income Funds | 31.3% | |
| Short-Term Funds | 16.3% | |

The fund invests according to an asset allocation strategy that becomes increasingly conservative over time. The six months ago allocation is based on the fund's holdings as of January 31, 2011. The current allocation is based on the fund's holdings as of July 31, 2011. The expected allocation represents the fund's anticipated allocation at January 31, 2012. |
Annual Report
Fidelity Income Replacement 2026 Fund
Investments July 31, 2011
Showing Percentage of Net Assets
Equity Funds - 48.5% |
| Shares | | Value |
Domestic Equity Funds - 42.2% |
Fidelity Advisor Mid Cap II Fund Institutional Class (a) | 5,898 | | $ 106,934 |
Fidelity Disciplined Equity Fund | 4,781 | | 111,297 |
Fidelity Equity-Income Fund | 2,473 | | 109,722 |
Fidelity Large Cap Core Enhanced Index Fund | 20,161 | | 180,847 |
Fidelity Series 100 Index Fund | 15,033 | | 136,051 |
Fidelity Series Broad Market Opportunities Fund | 17,322 | | 178,417 |
Fidelity Series Small Cap Opportunities Fund | 6,320 | | 70,910 |
TOTAL DOMESTIC EQUITY FUNDS | | 894,178 |
International Equity Funds - 6.3% |
Fidelity Advisor International Discovery Fund Institutional Class | 3,941 | | 132,532 |
TOTAL EQUITY FUNDS (Cost $1,010,950) | 1,026,710 |
Fixed-Income Funds - 35.4% |
| | | |
High Yield Fixed-Income Funds - 4.4% |
Fidelity Capital & Income Fund | 4,801 | | 45,941 |
Fidelity Strategic Income Fund | 4,151 | | 47,240 |
TOTAL HIGH YIELD FIXED-INCOME FUNDS | | 93,181 |
|
| Shares | | Value |
Investment Grade Fixed-Income Funds - 31.0% |
Fidelity Government Income Fund | 12,311 | | $ 131,479 |
Fidelity Strategic Real Return Fund | 13,203 | | 131,240 |
Fidelity Total Bond Fund | 35,788 | | 394,031 |
TOTAL INVESTMENT GRADE FIXED-INCOME FUNDS | | 656,750 |
TOTAL FIXED-INCOME FUNDS (Cost $726,483) | 749,931 |
Short-Term Funds - 16.1% |
| | | |
Fidelity Institutional Money Market Portfolio Institutional Class | 169,363 | | 169,363 |
Fidelity Short-Term Bond Fund | 19,953 | | 170,401 |
TOTAL SHORT-TERM FUNDS (Cost $338,274) | 339,764 |
TOTAL INVESTMENT PORTFOLIO - 100.0% (Cost $2,075,707) | | 2,116,405 |
NET OTHER ASSETS (LIABILITIES) - 0.0% | | (236) |
NET ASSETS - 100% | $ 2,116,169 |
Legend |
(a) Non-income producing |
Other Information |
All investments are categorized as Level 1 under the Fair Value Hierarchy. The inputs or methodology used for valuing securities may not be an indication of the risk associated with investing in those securities. For more information on valuation inputs, please refer to the Security Valuation section in the accompanying Notes to Financial Statements. |
Income Tax Information |
At July 31, 2011, the Fund had a capital loss carryforward of approximately $233,577 all of which will expire in fiscal 2018. Capital loss carryforwards are only available to offset future capital gains of the Fund to the extent provided by regulations and may be limited. |
See accompanying notes which are an integral part of the financial statements.
Annual Report
Fidelity Income Replacement 2026 Fund
Statement of Assets and Liabilities
| July 31, 2011 |
| | |
Assets | | |
Investment in securities, at value (cost $2,075,707) - See accompanying schedule | | $ 2,116,405 |
Receivable for investments sold | | 823 |
Receivable for fund shares sold | | 176 |
Total assets | | 2,117,404 |
| | |
Liabilities | | |
Payable for investments purchased | $ 163 | |
Payable for fund shares redeemed | 838 | |
Distribution and service plan fees payable | 234 | |
Total liabilities | | 1,235 |
| | |
Net Assets | | $ 2,116,169 |
Net Assets consist of: | | |
Paid in capital | | $ 2,329,399 |
Undistributed net investment income | | 405 |
Accumulated undistributed net realized gain (loss) on investments | | (254,333) |
Net unrealized appreciation (depreciation) on investments | | 40,698 |
Net Assets | | $ 2,116,169 |
| | |
Calculation of Maximum Offering Price Class A:
Net Asset Value and redemption price per share ($108,032 ÷ 2,181.2 shares) | | $ 49.53 |
| | |
Maximum offering price per share (100/94.25 of $49.53) | | $ 52.55 |
| | |
Class T:
Net Asset Value and redemption price per share ($130,369 ÷ 2,632.2 shares) | | $ 49.53 |
| | |
Maximum offering price per share (100/96.50 of $49.53) | | $ 51.33 |
| | |
Class C:
Net Asset Value and offering price per share ($184,116 ÷ 3,720.4 shares)A | | $ 49.49 |
| | |
Income Replacement 2026:
Net Asset Value, offering price and redemption price per share ($1,666,155 ÷ 33,638.7 shares) | | $ 49.53 |
| | |
Institutional Class:
Net Asset Value, offering price and redemption price per share ($27,497 ÷ 555.2 shares) | | $ 49.53 |
A Redemption price per share is equal to net asset value less any applicable contingent deferred sales charge.
Statement of Operations
| Year ended July 31, 2011 |
| | |
Investment Income | | |
Income distributions from underlying funds | | $ 26,676 |
| | |
Expenses | | |
Distribution and service plan fees | $ 2,604 | |
Independent trustees' compensation | 5 | |
Total expenses before reductions | 2,609 | |
Expense reductions | (5) | 2,604 |
Net investment income (loss) | | 24,072 |
Realized and Unrealized Gain (Loss) Realized gain (loss) on sale of underlying fund shares | 16,602 | |
Capital gain distributions from underlying funds | 6,465 | |
Total net realized gain (loss) | | 23,067 |
Change in net unrealized appreciation (depreciation) on underlying funds | | 89,707 |
Net gain (loss) | | 112,774 |
Net increase (decrease) in net assets resulting from operations | | $ 136,846 |
See accompanying notes which are an integral part of the financial statements.
Annual Report
Statement of Changes in Net Assets
| Year ended
July 31, 2011 | Year ended
July 31, 2010 |
Increase (Decrease) in Net Assets | | |
Operations | | |
Net investment income (loss) | $ 24,072 | $ 13,583 |
Net realized gain (loss) | 23,067 | (46,103) |
Change in net unrealized appreciation (depreciation) | 89,707 | 120,286 |
Net increase (decrease) in net assets resulting from operations | 136,846 | 87,766 |
Distributions to shareholders from net investment income | (23,914) | (13,653) |
Distributions to shareholders from net realized gain | (4,626) | (1,823) |
Total distributions | (28,540) | (15,476) |
Share transactions - net increase (decrease) | 1,015,365 | 199,973 |
Total increase (decrease) in net assets | 1,123,671 | 272,263 |
| | |
Net Assets | | |
Beginning of period | 992,498 | 720,235 |
End of period (including undistributed net investment income of $405 and undistributed net investment income of $259, respectively) | $ 2,116,169 | $ 992,498 |
Financial Highlights - Class A
Years ended July 31, | 2011 | 2010 | 2009 | 2008G |
Selected Per-Share Data | | | | |
Net asset value, beginning of period | $ 44.93 | $ 40.97 | $ 46.76 | $ 50.00 |
Income from Investment Operations | | | | |
Net investment income (loss)E | .750 | .743 | 1.042 | 1.076 |
Net realized and unrealized gain (loss) | 4.846 | 4.098 | (5.184) | (3.105) |
Total from investment operations | 5.596 | 4.841 | (4.142) | (2.029) |
Distributions from net investment income | (.796) | (.771) | (1.028) | (1.031) |
Distributions from net realized gain | (.200) | (.110) | (.620) | (.180) |
Total distributions | (.996) | (.881) | (1.648) | (1.211) |
Net asset value, end of period | $ 49.53 | $ 44.93 | $ 40.97 | $ 46.76 |
Total ReturnB,C,D | 12.52% | 11.87% | (8.56)% | (4.19)% |
Ratios to Average Net AssetsF,H | | | | |
Expenses before reductions | .25% | .25% | .25% | .25%A |
Expenses net of fee waivers, if any | .25% | .25% | .25% | .25%A |
Expenses net of all reductions | .25% | .25% | .25% | .25%A |
Net investment income (loss) | 1.55% | 1.68% | 2.70% | 2.36%A |
Supplemental Data | | | | |
Net assets, end of period (000 omitted) | $ 108 | $ 45 | $ 69 | $ 131 |
Portfolio turnover rate | 25% | 61% | 26% | 21% A |
A Annualized
B Total returns for periods of less than one year are not annualized.
C Total returns would have been lower if certain expenses had not been reduced during the applicable periods shown.
D Total returns do not include the effect of the sales charges.
E Calculated based on average shares outstanding during the period.
F Amounts do not include the activity of the underlying funds.
G For the period August 30, 2007 (commencement of operations) to July 31, 2008.
H Expense ratios reflect operating expenses of the class. Expenses before reductions do not reflect amounts reimbursed by the investment adviser or reductions from expense offset arrangements and do not represent the amount paid by the class during periods when reimbursements or reductions occur. Expenses net of fee waivers reflect expenses after reimbursement by the investment adviser but prior to reductions from expense offset arrangements. Expenses net of all reductions represent the net expenses paid by the class but do not include expenses of the investment companies in which the Fund invests.
See accompanying notes which are an integral part of the financial statements.
Annual Report
Financial Highlights - Class T
Years ended July 31, | 2011 | 2010 | 2009 | 2008G |
Selected Per-Share Data | | | | |
Net asset value, beginning of period | $ 44.92 | $ 40.97 | $ 46.76 | $ 50.00 |
Income from Investment Operations | | | | |
Net investment income (loss)E | .630 | .638 | .944 | .966 |
Net realized and unrealized gain (loss) | 4.851 | 4.092 | (5.184) | (3.110) |
Total from investment operations | 5.481 | 4.730 | (4.240) | (2.144) |
Distributions from net investment income | (.671) | (.670) | (.930) | (.916) |
Distributions from net realized gain | (.200) | (.110) | (.620) | (.180) |
Total distributions | (.871) | (.780) | (1.550) | (1.096) |
Net asset value, end of period | $ 49.53 | $ 44.92 | $ 40.97 | $ 46.76 |
Total ReturnB,C,D | 12.26% | 11.59% | (8.79)% | (4.41)% |
Ratios to Average Net AssetsF,H | | | | |
Expenses before reductions | .50% | .50% | .50% | .50%A |
Expenses net of fee waivers, if any | .50% | .50% | .50% | .50%A |
Expenses net of all reductions | .50% | .50% | .50% | .50%A |
Net investment income (loss) | 1.30% | 1.44% | 2.45% | 2.11%A |
Supplemental Data | | | | |
Net assets, end of period (000 omitted) | $ 130 | $ 116 | $ 55 | $ 96 |
Portfolio turnover rate | 25% | 61% | 26% | 21%A |
A Annualized
B Total returns for periods of less than one year are not annualized.
C Total returns would have been lower if certain expenses had not been reduced during the applicable periods shown.
D Total returns do not include the effect of the sales charges.
E Calculated based on average shares outstanding during the period.
F Amounts do not include the activity of the underlying funds.
G For the period August 30, 2007 (commencement of operations) to July 31, 2008.
H Expense ratios reflect operating expenses of the class. Expenses before reductions do not reflect amounts reimbursed by the investment adviser or reductions from expense offset arrangements and do not represent the amount paid by the class during periods when reimbursements or reductions occur. Expenses net of fee waivers reflect expenses after reimbursement by the investment adviser but prior to reductions from expense offset arrangements. Expenses net of all reductions represent the net expenses paid by the class but do not include expenses of the investment companies in which the Fund invests.
Financial Highlights - Class C
Years ended July 31, | 2011 | 2010 | 2009 | 2008G |
Selected Per-Share Data | | | | |
Net asset value, beginning of period | $ 44.89 | $ 40.95 | $ 46.72 | $ 50.00 |
Income from Investment Operations | | | | |
Net investment income (loss)E | .387 | .412 | .757 | .723 |
Net realized and unrealized gain (loss) | 4.848 | 4.087 | (5.183) | (3.090) |
Total from investment operations | 5.235 | 4.499 | (4.426) | (2.367) |
Distributions from net investment income | (.435) | (.449) | (.724) | (.733) |
Distributions from net realized gain | (.200) | (.110) | (.620) | (.180) |
Total distributions | (.635) | (.559) | (1.344) | (.913) |
Net asset value, end of period | $ 49.49 | $ 44.89 | $ 40.95 | $ 46.72 |
Total ReturnB,C,D | 11.70% | 11.01% | (9.25)% | (4.85)% |
Ratios to Average Net AssetsF,H | | | | |
Expenses before reductions | 1.00% | 1.00% | 1.00% | 1.00%A |
Expenses net of fee waivers, if any | 1.00% | 1.00% | 1.00% | 1.00%A |
Expenses net of all reductions | 1.00% | 1.00% | 1.00% | 1.00%A |
Net investment income (loss) | .80% | .94% | 1.95% | 1.61%A |
Supplemental Data | | | | |
Net assets, end of period (000 omitted) | $ 184 | $ 174 | $ 183 | $ 485 |
Portfolio turnover rate | 25% | 61% | 26% | 21%A |
A Annualized
B Total returns for periods of less than one year are not annualized.
C Total returns would have been lower if certain expenses had not been reduced during the applicable periods shown.
D Total returns do not include the effect of the contingent deferred sales charge.
E Calculated based on average shares outstanding during the period.
F Amounts do not include the activity of the underlying funds.
G For the period August 30, 2007 (commencement of operations) to July 31, 2008.
H Expense ratios reflect operating expenses of the class. Expenses before reductions do not reflect amounts reimbursed by the investment adviser or reductions from expense offset arrangements and do not represent the amount paid by the class during periods when reimbursements or reductions occur. Expenses net of fee waivers reflect expenses after reimbursement by the investment adviser but prior to reductions from expense offset arrangements. Expenses net of all reductions represent the net expenses paid by the class but do not include expenses of the investment companies in which the Fund invests.
See accompanying notes which are an integral part of the financial statements.
Annual Report
Financial Highlights - Income Replacement 2026
Years ended July 31, | 2011 | 2010 | 2009 | 2008G |
Selected Per-Share Data | | | | |
Net asset value, beginning of period | $ 44.92 | $ 40.97 | $ 46.77 | $ 50.00 |
Income from Investment Operations | | | | |
Net investment income (loss)D | .878 | .856 | 1.138 | 1.168 |
Net realized and unrealized gain (loss) | 4.844 | 4.091 | (5.190) | (3.079) |
Total from investment operations | 5.722 | 4.947 | (4.052) | (1.911) |
Distributions from net investment income | (.912) | (.887) | (1.128) | (1.139) |
Distributions from net realized gain | (.200) | (.110) | (.620) | (.180) |
Total distributions | (1.112) | (.997) | (1.748) | (1.319) |
Net asset value, end of period | $ 49.53 | $ 44.92 | $ 40.97 | $ 46.77 |
Total ReturnB,C | 12.82% | 12.14% | (8.34)% | (3.96)% |
Ratios to Average Net AssetsE,H | | | | |
Expenses before reductionsF | .00% | .00% | .00% | .00%A |
Expenses net of fee waivers, if any | .00% | .00% | .00% | .00%A |
Expenses net of all reductions | .00% | .00% | .00% | .00%A |
Net investment income (loss) | 1.80% | 1.94% | 2.95% | 2.61%A |
Supplemental Data | | | | |
Net assets, end of period (000 omitted) | $ 1,666 | $ 622 | $ 357 | $ 783 |
Portfolio turnover rate | 25% | 61% | 26% | 21%A |
A Annualized
B Total returns for periods of less than one year are not annualized.
C Total returns would have been lower if certain expenses had not been reduced during the applicable periods shown.
D Calculated based on average shares outstanding during the period.
E Amounts do not include the activity of the underlying funds.
F Amount represents less than .01%.
G For the period August 30, 2007 (commencement of operations) to July 31, 2008.
H Expense ratios reflect operating expenses of the class. Expenses before reductions do not reflect amounts reimbursed by the investment adviser or reductions from expense offset arrangements and do not represent the amount paid by the class during periods when reimbursements or reductions occur. Expenses net of fee waivers reflect expenses after reimbursement by the investment adviser but prior to reductions from expense offset arrangements. Expenses net of all reductions represent the net expenses paid by the class but do not include expenses of the investment companies in which the Fund invests.
Financial Highlights - Institutional Class
Years ended July 31, | 2011 | 2010 | 2009 | 2008G |
Selected Per-Share Data | | | | |
Net asset value, beginning of period | $ 44.92 | $ 40.97 | $ 46.77 | $ 50.00 |
Income from Investment Operations | | | | |
Net investment income (loss)D | .870 | .855 | 1.136 | 1.196 |
Net realized and unrealized gain (loss) | 4.852 | 4.092 | (5.188) | (3.107) |
Total from investment operations | 5.722 | 4.947 | (4.052) | (1.911) |
Distributions from net investment income | (.912) | (.887) | (1.128) | (1.139) |
Distributions from net realized gain | (.200) | (.110) | (.620) | (.180) |
Total distributions | (1.112) | (.997) | (1.748) | (1.319) |
Net asset value, end of period | $ 49.53 | $ 44.92 | $ 40.97 | $ 46.77 |
Total ReturnB,C | 12.82% | 12.14% | (8.34)% | (3.96)% |
Ratios to Average Net AssetsE,H | | | | |
Expenses before reductionsF | .00% | .00% | .00% | .00%A |
Expenses net of fee waivers, if any | .00% | .00% | .00% | .00%A |
Expenses net of all reductions | .00% | .00% | .00% | .00%A |
Net investment income (loss) | 1.80% | 1.94% | 2.95% | 2.61%A |
Supplemental Data | | | | |
Net assets, end of period (000 omitted) | $ 27 | $ 36 | $ 56 | $ 96 |
Portfolio turnover rate | 25% | 61% | 26% | 21%A |
A Annualized
B Total returns for periods of less than one year are not annualized.
C Total returns would have been lower if certain expenses had not been reduced during the applicable periods shown.
D Calculated based on average shares outstanding during the period.
E Amounts do not include the activity of the underlying funds.
F Amount represents less than .01%.
G For the period August 30, 2007 (commencement of operations) to July 31, 2008.
H Expense ratios reflect operating expenses of the class. Expenses before reductions do not reflect amounts reimbursed by the investment adviser or reductions from expense offset arrangements and do not represent the amount paid by the class during periods when reimbursements or reductions occur. Expenses net of fee waivers reflect expenses after reimbursement by the investment adviser but prior to reductions from expense offset arrangements. Expenses net of all reductions represent the net expenses paid by the class but do not include expenses of the investment companies in which the Fund invests.
See accompanying notes which are an integral part of the financial statements.
Annual Report
Fidelity Income Replacement 2028 Fund
Investment Changes (Unaudited)
Fund Holdings as of July 31, 2011 |
| % of fund's
net assets | % of fund's net assets
6 months ago |
Domestic Equity Funds | | |
Fidelity Advisor Mid Cap II Fund Institutional Class | 5.2 | 5.3 |
Fidelity Disciplined Equity Fund | 5.4 | 5.5 |
Fidelity Equity-Income Fund | 5.4 | 5.5 |
Fidelity Large Cap Core Enhanced Index Fund | 8.8 | 8.9 |
Fidelity Series 100 Index Fund | 6.7 | 6.6 |
Fidelity Series Broad Market Opportunities Fund | 8.7 | 8.9 |
Fidelity Series Small Cap Opportunities Fund | 3.5 | 3.5 |
| 43.7 | 44.2 |
International Equity Funds | | |
Fidelity Advisor International Discovery Fund Institutional Class | 7.0 | 7.2 |
High Yield Fixed-Income Funds | | |
Fidelity Capital & Income Fund | 2.3 | 2.4 |
Fidelity Strategic Income Fund | 2.4 | 2.3 |
| 4.7 | 4.7 |
Investment Grade Fixed-Income Funds | | |
Fidelity Government Income Fund | 6.0 | 5.9 |
Fidelity Strategic Real Return Fund | 6.0 | 6.0 |
Fidelity Total Bond Fund | 18.0 | 17.8 |
| 30.0 | 29.7 |
Short-Term Funds | | |
Fidelity Institutional Money Market Portfolio Institutional Class | 7.3 | 7.1 |
Fidelity Short-Term Bond Fund | 7.3 | 7.1 |
| 14.6 | 14.2 |
Net Other Assets (Liabilities)* | 0.0 | 0.0 |
| 100.0 | 100.0 |
* Amount represents less than 0.1% |
Asset Allocation (% of fund's net assets) |
Current |
| Domestic Equity Funds | 43.7% | |
| International Equity Funds | 7.0% | |
 | High Yield
Fixed-Income Funds | 4.7% | |
| Investment Grade Fixed-Income Funds | 30.0% | |
| Short-Term Funds | 14.6% | |

Six months ago |
| Domestic Equity Funds | 44.2% | |
| International Equity Funds | 7.2% | |
| High Yield
Fixed-Income Funds | 4.7% | |
| Investment Grade Fixed-Income Funds | 29.7% | |
| Short-Term Funds | 14.2% | |

Expected |
| Domestic Equity Funds | 43.6% | |
| International Equity Funds | 6.8% | |
| High Yield
Fixed-Income Funds | 4.6% | |
| Investment Grade Fixed-Income Funds | 30.1% | |
| Short-Term Funds | 14.9% | |

The fund invests according to an asset allocation strategy that becomes increasingly conservative over time. The six months ago allocation is based on the fund's holdings as of January 31, 2011. The current allocation is based on the fund's holdings as of July 31, 2011. The expected allocation represents the fund's anticipated allocation at January 31, 2012. |
Annual Report
Fidelity Income Replacement 2028 Fund
Investments July 31, 2011
Showing Percentage of Net Assets
Equity Funds - 50.7% |
| Shares | | Value |
Domestic Equity Funds - 43.7% |
Fidelity Advisor Mid Cap II Fund Institutional Class (a) | 17,596 | | $ 319,008 |
Fidelity Disciplined Equity Fund | 14,289 | | 332,641 |
Fidelity Equity-Income Fund | 7,396 | | 328,096 |
Fidelity Large Cap Core Enhanced Index Fund | 60,340 | | 541,253 |
Fidelity Series 100 Index Fund | 44,955 | | 406,839 |
Fidelity Series Broad Market Opportunities Fund | 51,796 | | 533,504 |
Fidelity Series Small Cap Opportunities Fund | 18,857 | | 211,575 |
TOTAL DOMESTIC EQUITY FUNDS | | 2,672,916 |
International Equity Funds - 7.0% |
Fidelity Advisor International Discovery Fund Institutional Class | 12,762 | | 429,191 |
TOTAL EQUITY FUNDS (Cost $2,893,214) | 3,102,107 |
Fixed-Income Funds - 34.7% |
| | | |
High Yield Fixed-Income Funds - 4.7% |
Fidelity Capital & Income Fund | 14,925 | | 142,835 |
Fidelity Strategic Income Fund | 12,928 | | 147,120 |
TOTAL HIGH YIELD FIXED-INCOME FUNDS | | 289,955 |
|
| Shares | | Value |
Investment Grade Fixed-Income Funds - 30.0% |
Fidelity Government Income Fund | 34,396 | | $ 367,347 |
Fidelity Strategic Real Return Fund | 36,854 | | 366,332 |
Fidelity Total Bond Fund | 99,916 | | 1,100,075 |
TOTAL INVESTMENT GRADE FIXED-INCOME FUNDS | | 1,833,754 |
TOTAL FIXED-INCOME FUNDS (Cost $1,984,070) | 2,123,709 |
Short-Term Funds - 14.6% |
| | | |
Fidelity Institutional Money Market Portfolio Institutional Class | 447,019 | | 447,019 |
Fidelity Short-Term Bond Fund | 52,693 | | 449,997 |
TOTAL SHORT-TERM FUNDS (Cost $887,417) | 897,016 |
TOTAL INVESTMENT PORTFOLIO - 100.0% (Cost $5,764,701) | | 6,122,832 |
NET OTHER ASSETS (LIABILITIES) - 0.0% | | (121) |
NET ASSETS - 100% | $ 6,122,711 |
Legend |
(a) Non-income producing |
Other Information |
All investments are categorized as Level 1 under the Fair Value Hierarchy. The inputs or methodology used for valuing securities may not be an indication of the risk associated with investing in those securities. For more information on valuation inputs, please refer to the Security Valuation section in the accompanying Notes to Financial Statements. |
Income Tax Information |
At July 31, 2011, the Fund had a capital loss carryforward of approximately $600,001 of which $7,815, $381,761 and $210,425 will expire in fiscal 2017, 2018 and 2019, respectively. Capital loss carryforwards are only available to offset future capital gains of the Fund to the extent provided by regulations and may be limited. |
See accompanying notes which are an integral part of the financial statements.
Annual Report
Fidelity Income Replacement 2028 Fund
Statement of Assets and Liabilities
| July 31, 2011 |
| | |
Assets | | |
Investment in securities, at value (cost $5,764,701) - See accompanying schedule | | $ 6,122,832 |
Cash | | 1 |
Total assets | | 6,122,833 |
| | |
Liabilities | | |
Distribution and service plan fees payable | | 122 |
| | |
Net Assets | | $ 6,122,711 |
Net Assets consist of: | | |
Paid in capital | | $ 6,478,326 |
Undistributed net investment income | | 1,283 |
Accumulated undistributed net realized gain (loss) on investments | | (715,029) |
Net unrealized appreciation (depreciation) on investments | | 358,131 |
Net Assets | | $ 6,122,711 |
| | |
Calculation of Maximum Offering Price Class A:
Net Asset Value and redemption price per share ($133,341 ÷ 2,671.2 shares) | | $ 49.92 |
| | |
Maximum offering price per share (100/94.25 of $49.92) | | $ 52.97 |
| | |
Class T:
Net Asset Value and redemption price per share ($130,222 ÷ 2,607.4 shares) | | $ 49.94 |
| | |
Maximum offering price per share (100/96.50 of $49.94) | | $ 51.75 |
| | |
Class C:
Net Asset Value and offering price per share ($48,899 ÷ 979.2 shares)A | | $ 49.94 |
| | |
Income Replacement 2028:
Net Asset Value, offering price and redemption price per share ($5,782,807 ÷ 115,831.5 shares) | | $ 49.92 |
| | |
Institutional Class:
Net Asset Value, offering price and redemption price per share ($27,442 ÷ 549.7 shares) | | $ 49.92 |
A Redemption price per share is equal to net asset value less any applicable contingent deferred sales charge.
Statement of Operations
| Year ended July 31, 2011 |
| | |
Investment Income | | |
Income distributions from underlying funds | | $ 118,343 |
| | |
Expenses | | |
Distribution and service plan fees | $ 2,069 | |
Independent trustees' compensation | 23 | |
Total expenses before reductions | 2,092 | |
Expense reductions | (23) | 2,069 |
Net investment income (loss) | | 116,274 |
Realized and Unrealized Gain (Loss) Realized gain (loss) on sale of underlying fund shares | (40,097) | |
Capital gain distributions from underlying funds | 35,036 | |
Total net realized gain (loss) | | (5,061) |
Change in net unrealized appreciation (depreciation) on underlying funds | | 647,446 |
Net gain (loss) | | 642,385 |
Net increase (decrease) in net assets resulting from operations | | $ 758,659 |
See accompanying notes which are an integral part of the financial statements.
Annual Report
Fidelity Income Replacement 2028 Fund
Financial Statements - continued
Statement of Changes in Net Assets
| Year ended
July 31, 2011 | Year ended
July 31, 2010 |
Increase (Decrease) in Net Assets | | |
Operations | | |
Net investment income (loss) | $ 116,274 | $ 130,949 |
Net realized gain (loss) | (5,061) | (193,465) |
Change in net unrealized appreciation (depreciation) | 647,446 | 828,403 |
Net increase (decrease) in net assets resulting from operations | 758,659 | 765,887 |
Distributions to shareholders from net investment income | (116,717) | (131,065) |
Distributions to shareholders from net realized gain | (25,763) | (16,965) |
Total distributions | (142,480) | (148,030) |
Share transactions - net increase (decrease) | (649,489) | (832,893) |
Total increase (decrease) in net assets | (33,310) | (215,036) |
| | |
Net Assets | | |
Beginning of period | 6,156,021 | 6,371,057 |
End of period (including undistributed net investment income of $1,283 and undistributed net investment income of $1,839, respectively) | $ 6,122,711 | $ 6,156,021 |
Financial Highlights - Class A
Years ended July 31, | 2011 | 2010 | 2009 | 2008G |
Selected Per-Share Data | | | | |
Net asset value, beginning of period | $ 45.17 | $ 41.16 | $ 46.81 | $ 50.00 |
Income from Investment Operations | | | | |
Net investment income (loss)E | .802 | .789 | 1.000 | .966 |
Net realized and unrealized gain (loss) | 4.972 | 4.116 | (5.341) | (3.085) |
Total from investment operations | 5.774 | 4.905 | (4.341) | (2.119) |
Distributions from net investment income | (.815) | (.785) | (.979) | (.911) |
Distributions from net realized gain | (.209) | (.110) | (.330) | (.160) |
Total distributions | (1.024) | (.895) | (1.309) | (1.071) |
Net asset value, end of period | $ 49.92 | $ 45.17 | $ 41.16 | $ 46.81 |
Total ReturnB,C,D | 12.85% | 11.96% | (8.93)% | (4.36)% |
Ratios to Average Net AssetsF,H | | | | |
Expenses before reductions | .25% | .25% | .25% | .25%A |
Expenses net of fee waivers, if any | .25% | .25% | .25% | .25%A |
Expenses net of all reductions | .25% | .25% | .25% | .25%A |
Net investment income (loss) | 1.65% | 1.78% | 2.60% | 2.16%A |
Supplemental Data | | | | |
Net assets, end of period (000 omitted) | $ 133 | $ 359 | $ 278 | $ 371 |
Portfolio turnover rate | 17% | 16% | 53% | 33%A |
A Annualized
B Total returns for periods of less than one year are not annualized.
C Total returns would have been lower if certain expenses had not been reduced during the applicable periods shown.
D Total returns do not include the effect of the sales charges.
E Calculated based on average shares outstanding during the period.
F Amounts do not include the activity of the underlying funds.
G For the period August 30, 2007 (commencement of operations) to July 31, 2008.
H Expense ratios reflect operating expenses of the class. Expenses before reductions do not reflect amounts reimbursed by the investment adviser or reductions from expense offset arrangements and do not represent the amount paid by the class during periods when reimbursements or reductions occur. Expenses net of fee waivers reflect expenses after reimbursement by the investment adviser but prior to reductions from expense offset arrangements. Expenses net of all reductions represent the net expenses paid by the class but do not include expenses of the investment companies in which the Fund invests.
See accompanying notes which are an integral part of the financial statements.
Annual Report
Financial Highlights - Class T
Years ended July 31, | 2011 | 2010 | 2009 | 2008G |
Selected Per-Share Data | | | | |
Net asset value, beginning of period | $ 45.16 | $ 41.16 | $ 46.80 | $ 50.00 |
Income from Investment Operations | | | | |
Net investment income (loss)E | .682 | .678 | .905 | .847 |
Net realized and unrealized gain (loss) | 4.975 | 4.107 | (5.340) | (3.079) |
Total from investment operations | 5.657 | 4.785 | (4.435) | (2.232) |
Distributions from net investment income | (.668) | (.675) | (.875) | (.808) |
Distributions from net realized gain | (.209) | (.110) | (.330) | (.160) |
Total distributions | (.877) | (.785) | (1.205) | (.968) |
Net asset value, end of period | $ 49.94 | $ 45.16 | $ 41.16 | $ 46.80 |
Total ReturnB,C,D | 12.57% | 11.66% | (9.15)% | (4.57)% |
Ratios to Average Net AssetsF,H | | | | |
Expenses before reductions | .50% | .50% | .50% | .50%A |
Expenses net of fee waivers, if any | .50% | .50% | .50% | .50%A |
Expenses net of all reductions | .50% | .50% | .50% | .50%A |
Net investment income (loss) | 1.40% | 1.53% | 2.35% | 1.91%A |
Supplemental Data | | | | |
Net assets, end of period (000 omitted) | $ 130 | $ 328 | $ 311 | $ 606 |
Portfolio turnover rate | 17% | 16% | 53% | 33%A |
A Annualized
B Total returns for periods of less than one year are not annualized.
C Total returns would have been lower if certain expenses had not been reduced during the applicable periods shown.
D Total returns do not include the effect of the sales charges.
E Calculated based on average shares outstanding during the period.
F Amounts do not include the activity of the underlying funds.
G For the period August 30, 2007 (commencement of operations) to July 31, 2008.
H Expense ratios reflect operating expenses of the class. Expenses before reductions do not reflect amounts reimbursed by the investment adviser or reductions from expense offset arrangements and do not represent the amount paid by the class during periods when reimbursements or reductions occur. Expenses net of fee waivers reflect expenses after reimbursement by the investment adviser but prior to reductions from expense offset arrangements. Expenses net of all reductions represent the net expenses paid by the class but do not include expenses of the investment companies in which the Fund invests.
Financial Highlights - Class C
Years ended July 31, | 2011 | 2010 | 2009 | 2008G |
Selected Per-Share Data | | | | |
Net asset value, beginning of period | $ 45.19 | $ 41.16 | $ 46.79 | $ 50.00 |
Income from Investment Operations | | | | |
Net investment income (loss)E | .438 | .454 | .711 | .639 |
Net realized and unrealized gain (loss) | 4.974 | 4.117 | (5.333) | (3.104) |
Total from investment operations | 5.412 | 4.571 | (4.622) | (2.465) |
Distributions from net investment income | (.453) | (.431) | (.678) | (.585) |
Distributions from net realized gain | (.209) | (.110) | (.330) | (.160) |
Total distributions | (.662) | (.541) | (1.008) | (.745) |
Net asset value, end of period | $ 49.94 | $ 45.19 | $ 41.16 | $ 46.79 |
Total ReturnB,C,D | 12.01% | 11.13% | (9.60)% | (5.02)% |
Ratios to Average Net AssetsF,H | | | | |
Expenses before reductions | 1.00% | 1.00% | 1.00% | 1.00%A |
Expenses net of fee waivers, if any | 1.00% | 1.00% | 1.00% | 1.00%A |
Expenses net of all reductions | 1.00% | 1.00% | 1.00% | 1.00%A |
Net investment income (loss) | .90% | 1.02% | 1.84% | 1.41%A |
Supplemental Data | | | | |
Net assets, end of period (000 omitted) | $ 49 | $ 51 | $ 86 | $ 150 |
Portfolio turnover rate | 17% | 16% | 53% | 33%A |
A Annualized
B Total returns for periods of less than one year are not annualized.
C Total returns would have been lower if certain expenses had not been reduced during the applicable periods shown.
D Total returns do not include the effect of the contingent deferred sales charge.
E Calculated based on average shares outstanding during the period.
F Amounts do not include the activity of the underlying funds.
G For the period August 30, 2007 (commencement of operations) to July 31, 2008.
H Expense ratios reflect operating expenses of the class. Expenses before reductions do not reflect amounts reimbursed by the investment adviser or reductions from expense offset arrangements and do not represent the amount paid by the class during periods when reimbursements or reductions occur. Expenses net of fee waivers reflect expenses after reimbursement by the investment adviser but prior to reductions from expense offset arrangements. Expenses net of all reductions represent the net expenses paid by the class but do not include expenses of the investment companies in which the Fund invests.
See accompanying notes which are an integral part of the financial statements.
Annual Report
Financial Highlights - Income Replacement 2028
Years ended July 31, | 2011 | 2010 | 2009 | 2008G |
Selected Per-Share Data | | | | |
Net asset value, beginning of period | $ 45.18 | $ 41.17 | $ 46.82 | $ 50.00 |
Income from Investment Operations | | | | |
Net investment income (loss)D | .925 | .900 | 1.087 | 1.067 |
Net realized and unrealized gain (loss) | 4.965 | 4.115 | (5.330) | (3.072) |
Total from investment operations | 5.890 | 5.015 | (4.243) | (2.005) |
Distributions from net investment income | (.941) | (.895) | (1.077) | (1.015) |
Distributions from net realized gain | (.209) | (.110) | (.330) | (.160) |
Total distributions | (1.150) | (1.005) | (1.407) | (1.175) |
Net asset value, end of period | $ 49.92 | $ 45.18 | $ 41.17 | $ 46.82 |
Total ReturnB,C | 13.12% | 12.24% | (8.69)% | (4.14)% |
Ratios to Average Net AssetsE,H | | | | |
Expenses before reductionsF | .00% | .00% | .00% | .00%A |
Expenses net of fee waivers, if any | .00% | .00% | .00% | .00%A |
Expenses net of all reductions | .00% | .00% | .00% | .00%A |
Net investment income (loss) | 1.90% | 2.03% | 2.85% | 2.40%A |
Supplemental Data | | | | |
Net assets, end of period (000 omitted) | $ 5,783 | $ 5,383 | $ 5,641 | $ 6,068 |
Portfolio turnover rate | 17% | 16% | 53% | 33%A |
A Annualized
B Total returns for periods of less than one year are not annualized.
C Total returns would have been lower if certain expenses had not been reduced during the applicable periods shown.
D Calculated based on average shares outstanding during the period.
E Amounts do not include the activity of the underlying funds.
F Amount represents less than .01%.
G For the period August 30, 2007 (commencement of operations) to July 31, 2008.
H Expense ratios reflect operating expenses of the class. Expenses before reductions do not reflect amounts reimbursed by the investment adviser or reductions from expense offset arrangements and do not represent the amount paid by the class during periods when reimbursements or reductions occur. Expenses net of fee waivers reflect expenses after reimbursement by the investment adviser but prior to reductions from expense offset arrangements. Expenses net of all reductions represent the net expenses paid by the class but do not include expenses of the investment companies in which the Fund invests.
Financial Highlights - Institutional Class
Years ended July 31, | 2011 | 2010 | 2009 | 2008G |
Selected Per-Share Data | | | | |
Net asset value, beginning of period | $ 45.18 | $ 41.17 | $ 46.82 | $ 50.00 |
Income from Investment Operations | | | | |
Net investment income (loss)D | .923 | .899 | 1.097 | 1.101 |
Net realized and unrealized gain (loss) | 4.967 | 4.116 | (5.340) | (3.106) |
Total from investment operations | 5.890 | 5.015 | (4.243) | (2.005) |
Distributions from net investment income | (.941) | (.895) | (1.077) | (1.015) |
Distributions from net realized gain | (.209) | (.110) | (.330) | (.160) |
Total distributions | (1.150) | (1.005) | (1.407) | (1.175) |
Net asset value, end of period | $ 49.92 | $ 45.18 | $ 41.17 | $ 46.82 |
Total ReturnB,C | 13.12% | 12.24% | (8.69)% | (4.14)% |
Ratios to Average Net AssetsE,H | | | | |
Expenses before reductions F | .00% | .00% | .00% | .00%A |
Expenses net of fee waivers, if any | .00% | .00% | .00% | .00%A |
Expenses net of all reductions | .00% | .00% | .00% | .00%A |
Net investment income (loss) | 1.90% | 2.03% | 2.85% | 2.40%A |
Supplemental Data | | | | |
Net assets, end of period (000 omitted) | $ 27 | $ 36 | $ 56 | $ 96 |
Portfolio turnover rate | 17% | 16% | 53% | 33%A |
A Annualized
B Total returns for periods of less than one year are not annualized.
C Total returns would have been lower if certain expenses had not been reduced during the applicable periods shown.
D Calculated based on average shares outstanding during the period.
E Amounts do not include the activity of the underlying funds.
F Amount represents less than .01%.
G For the period August 30, 2007 (commencement of operations) to July 31, 2008.
H Expense ratios reflect operating expenses of the class. Expenses before reductions do not reflect amounts reimbursed by the investment adviser or reductions from expense offset arrangements and do not represent the amount paid by the class during periods when reimbursements or reductions occur. Expenses net of fee waivers reflect expenses after reimbursement by the investment adviser but prior to reductions from expense offset arrangements. Expenses net of all reductions represent the net expenses paid by the class but do not include expenses of the investment companies in which the Fund invests.
See accompanying notes which are an integral part of the financial statements.
Annual Report
Fidelity Income Replacement 2030 Fund
Investment Changes (Unaudited)
Fund Holdings as of July 31, 2011 |
| % of fund's
net assets | % of fund's net assets
6 months ago |
Domestic Equity Funds | | |
Fidelity Advisor Mid Cap II Fund Institutional Class | 5.3 | 5.4 |
Fidelity Disciplined Equity Fund | 5.6 | 5.7 |
Fidelity Equity-Income Fund | 5.5 | 5.7 |
Fidelity Large Cap Core Enhanced Index Fund | 9.0 | 9.0 |
Fidelity Series 100 Index Fund | 6.8 | 6.8 |
Fidelity Series Broad Market Opportunities Fund | 8.9 | 9.0 |
Fidelity Series Small Cap Opportunities Fund | 3.5 | 3.6 |
| 44.6 | 45.2 |
International Equity Funds | | |
Fidelity Advisor International Discovery Fund Institutional Class | 7.8 | 8.0 |
High Yield Fixed-Income Funds | | |
Fidelity Capital & Income Fund | 2.5 | 2.5 |
Fidelity Strategic Income Fund | 2.5 | 2.5 |
| 5.0 | 5.0 |
Investment Grade Fixed-Income Funds | | |
Fidelity Government Income Fund | 5.8 | 5.7 |
Fidelity Strategic Real Return Fund | 5.8 | 5.7 |
Fidelity Total Bond Fund | 17.4 | 17.1 |
| 29.0 | 28.5 |
Short-Term Funds | | |
Fidelity Institutional Money Market Portfolio Institutional Class | 6.8 | 6.6 |
Fidelity Short-Term Bond Fund | 6.8 | 6.7 |
| 13.6 | 13.3 |
Net Other Assets (Liabilities)* | 0.0 | 0.0 |
| 100.0 | 100.0 |
* Amount represents less than 0.1% |
Asset Allocation (% of fund's net assets) |
Current |
| Domestic Equity Funds | 44.6% | |
| International Equity Funds | 7.8% | |
| High Yield
Fixed-Income Funds | 5.0% | |
| Investment Grade Fixed-Income Funds | 29.0% | |
| Short-Term Funds | 13.6% | |

Six months ago |
| Domestic Equity Funds | 45.2% | |
| International Equity Funds | 8.0% | |
| High Yield
Fixed-Income Funds | 5.0% | |
| Investment Grade Fixed-Income Funds | 28.5% | |
| Short-Term Funds | 13.3% | |

Expected |
| Domestic Equity Funds | 44.8% | |
| International Equity Funds | 7.6% | |
| High Yield
Fixed-Income Funds | 4.8% | |
| Investment Grade Fixed-Income Funds | 29.3% | |
| Short-Term Funds | 13.5% | |

The fund invests according to an asset allocation strategy that becomes increasingly conservative over time. The six months ago allocation is based on the fund's holdings as of January 31, 2011. The current allocation is based on the fund's holdings as of July 31, 2011. The expected allocation represents the fund's anticipated allocation at January 31, 2012. |
Annual Report
Fidelity Income Replacement 2030 Fund
Investments July 31, 2011
Showing Percentage of Net Assets
Equity Funds - 52.4% |
| Shares | | Value |
Domestic Equity Funds - 44.6% |
Fidelity Advisor Mid Cap II Fund Institutional Class (a) | 12,799 | | $ 232,051 |
Fidelity Disciplined Equity Fund | 10,362 | | 241,225 |
Fidelity Equity-Income Fund | 5,369 | | 238,151 |
Fidelity Large Cap Core Enhanced Index Fund | 43,733 | | 392,287 |
Fidelity Series 100 Index Fund | 32,593 | | 294,970 |
Fidelity Series Broad Market Opportunities Fund | 37,578 | | 387,050 |
Fidelity Series Small Cap Opportunities Fund | 13,677 | | 153,458 |
TOTAL DOMESTIC EQUITY FUNDS | | 1,939,192 |
International Equity Funds - 7.8% |
Fidelity Advisor International Discovery Fund Institutional Class | 10,085 | | 339,163 |
TOTAL EQUITY FUNDS (Cost $2,131,023) | 2,278,355 |
Fixed-Income Funds - 34.0% |
| | | |
High Yield Fixed-Income Funds - 5.0% |
Fidelity Capital & Income Fund | 11,191 | | 107,099 |
Fidelity Strategic Income Fund | 9,671 | | 110,054 |
TOTAL HIGH YIELD FIXED-INCOME FUNDS | | 217,153 |
|
| Shares | | Value |
Investment Grade Fixed-Income Funds - 29.0% |
Fidelity Government Income Fund | 23,635 | | $ 252,421 |
Fidelity Strategic Real Return Fund | 25,326 | | 251,737 |
Fidelity Total Bond Fund | 68,744 | | 756,876 |
TOTAL INVESTMENT GRADE FIXED-INCOME FUNDS | | 1,261,034 |
TOTAL FIXED-INCOME FUNDS (Cost $1,435,010) | 1,478,187 |
Short-Term Funds - 13.6% |
| | | |
Fidelity Institutional Money Market Portfolio Institutional Class | 293,874 | | 293,874 |
Fidelity Short-Term Bond Fund | 34,617 | | 295,628 |
TOTAL SHORT-TERM FUNDS (Cost $586,052) | 589,502 |
TOTAL INVESTMENT PORTFOLIO - 100.0% (Cost $4,152,085) | | 4,346,044 |
NET OTHER ASSETS (LIABILITIES) - 0.0% | | (251) |
NET ASSETS - 100% | $ 4,345,793 |
Legend |
(a) Non-income producing |
Other Information |
All investments are categorized as Level 1 under the Fair Value Hierarchy. The inputs or methodology used for valuing securities may not be an indication of the risk associated with investing in those securities. For more information on valuation inputs, please refer to the Security Valuation section in the accompanying Notes to Financial Statements. |
Income Tax Information |
At July 31, 2011, the Fund had a capital loss carryforward of approximately $119,726 of which $33,830 and $85,896 will expire in fiscal 2017 and 2018, respectively. Capital loss carryforwards are only available to offset future capital gains of the Fund to the extent provided by regulations and may be limited. |
See accompanying notes which are an integral part of the financial statements.
Annual Report
Fidelity Income Replacement 2030 Fund
Statement of Assets and Liabilities
| July 31, 2011 |
| | |
Assets | | |
Investment in securities, at value (cost $4,152,085) - See accompanying schedule | | $ 4,346,044 |
| | |
Liabilities | | |
Distribution and service plan fees payable | | 251 |
| | |
Net Assets | | $ 4,345,793 |
Net Assets consist of: | | |
Paid in capital | | $ 4,322,386 |
Undistributed net investment income | | 793 |
Accumulated undistributed net realized gain (loss) on investments | | (171,345) |
Net unrealized appreciation (depreciation) on investments | | 193,959 |
Net Assets | | $ 4,345,793 |
| | |
Calculation of Maximum Offering Price Class A:
Net Asset Value and redemption price per share ($71,557 ÷ 1,441.26 shares) | | $ 49.65 |
| | |
Maximum offering price per share (100/94.25 of $49.65) | | $ 52.68 |
| | |
Class T:
Net Asset Value and redemption price per share ($14,774 ÷ 297.44 shares) | | $ 49.67 |
| | |
Maximum offering price per share (100/96.50 of $49.67) | | $ 51.47 |
| | |
Class C:
Net Asset Value and offering price per share ($270,005 ÷ 5,442.71 shares)A | | $ 49.61 |
| | |
Income Replacement 2030:
Net Asset Value, offering price and redemption price per share ($3,962,058 ÷ 79,813.06 shares) | | $ 49.64 |
| | |
Institutional Class:
Net Asset Value, offering price and redemption price per share ($27,399 ÷ 551.93 shares) | | $ 49.64 |
A Redemption price per share is equal to net asset value less any applicable contingent deferred sales charge.
Statement of Operations
| Year ended July 31, 2011 |
| | |
Investment Income | | |
Income distributions from underlying funds | | $ 57,450 |
| | |
Expenses | | |
Distribution and service plan fees | $ 2,450 | |
Independent trustees' compensation | 10 | |
Total expenses before reductions | 2,460 | |
Expense reductions | (10) | 2,450 |
Net investment income (loss) | | 55,000 |
Realized and Unrealized Gain (Loss) Realized gain (loss) on sale of underlying fund shares | (23,045) | |
Capital gain distributions from underlying funds | 15,030 | |
Total net realized gain (loss) | | (8,015) |
Change in net unrealized appreciation (depreciation) on underlying funds | | 250,028 |
Net gain (loss) | | 242,013 |
Net increase (decrease) in net assets resulting from operations | | $ 297,013 |
See accompanying notes which are an integral part of the financial statements.
Annual Report
Statement of Changes in Net Assets
| Year ended
July 31, 2011 | Year ended
July 31, 2010 |
Increase (Decrease) in Net Assets | | |
Operations | | |
Net investment income (loss) | $ 55,000 | $ 14,472 |
Net realized gain (loss) | (8,015) | 212 |
Change in net unrealized appreciation (depreciation) | 250,028 | 65,683 |
Net increase (decrease) in net assets resulting from operations | 297,013 | 80,367 |
Distributions to shareholders from net investment income | (54,641) | (14,213) |
Distributions to shareholders from net realized gain | (10,723) | (1,857) |
Total distributions | (65,364) | (16,070) |
Share transactions - net increase (decrease) | 2,153,245 | 1,233,775 |
Total increase (decrease) in net assets | 2,384,894 | 1,298,072 |
| | |
Net Assets | | |
Beginning of period | 1,960,899 | 662,827 |
End of period (including undistributed net investment income of $793 and undistributed net investment income of $439, respectively) | $ 4,345,793 | $ 1,960,899 |
Financial Highlights - Class A
Years ended July 31, | 2011 | 2010 | 2009 | 2008G |
Selected Per-Share Data | | | | |
Net asset value, beginning of period | $ 44.77 | $ 40.69 | $ 46.61 | $ 50.00 |
Income from Investment Operations | | | | |
Net investment income (loss)E | .791 | .718 | .978 | 1.034 |
Net realized and unrealized gain (loss) | 5.066 | 4.180 | (5.404) | (3.239) |
Total from investment operations | 5.857 | 4.898 | (4.426) | (2.205) |
Distributions from net investment income | (.801) | (.713) | (1.004) | (.995) |
Distributions from net realized gain | (.176) | (.105) | (.490) | (.190) |
Total distributions | (.977) | (.818) | (1.494) | (1.185) |
Net asset value, end of period | $ 49.65 | $ 44.77 | $ 40.69 | $ 46.61 |
Total ReturnB,C,D | 13.15% | 12.08% | (9.22)% | (4.55)% |
Ratios to Average Net AssetsF,H | | | | |
Expenses before reductions | .25% | .25% | .25% | .25%A |
Expenses net of fee waivers, if any | .25% | .25% | .25% | .25%A |
Expenses net of all reductions | .25% | .25% | .25% | .25%A |
Net investment income (loss) | 1.63% | 1.63% | 2.57% | 2.26%A |
Supplemental Data | | | | |
Net assets, end of period (000 omitted) | $ 72 | $ 66 | $ 55 | $ 95 |
Portfolio turnover rate | 24% | 31% | 53% | 12%A |
A Annualized
B Total returns for periods of less than one year are not annualized.
C Total returns would have been lower if certain expenses had not been reduced during the applicable periods shown.
D Total returns do not include the effect of the sales charges.
E Calculated based on average shares outstanding during the period.
F Amounts do not include the activity of the underlying funds.
G For the period August 30, 2007 (commencement of operations) to July 31, 2008.
H Expense ratios reflect operating expenses of the class. Expenses before reductions do not reflect amounts reimbursed by the investment adviser or reductions from expense offset arrangements and do not represent the amount paid by the class during periods when reimbursements or reductions occur. Expenses net of fee waivers reflect expenses after reimbursement by the investment adviser but prior to reductions from expense offset arrangements. Expenses net of all reductions represent the net expenses paid by the class but do not include expenses of the investment companies in which the Fund invests.
See accompanying notes which are an integral part of the financial statements.
Annual Report
Financial Highlights - Class T
Years ended July 31, | 2011 | 2010 | 2009 | 2008G |
Selected Per-Share Data | | | | |
Net asset value, beginning of period | $ 44.78 | $ 40.69 | $ 46.61 | $ 50.00 |
Income from Investment Operations | | | | |
Net investment income (loss)E | .655 | .603 | .881 | .920 |
Net realized and unrealized gain (loss) | 5.076 | 4.182 | (5.402) | (3.234) |
Total from investment operations | 5.731 | 4.785 | (4.521) | (2.314) |
Distributions from net investment income | (.665) | (.590) | (.909) | (.886) |
Distributions from net realized gain | (.176) | (.105) | (.490) | (.190) |
Total distributions | (.841) | (.695) | (1.399) | (1.076) |
Net asset value, end of period | $ 49.67 | $ 44.78 | $ 40.69 | $ 46.61 |
Total ReturnB,C,D | 12.85% | 11.79% | (9.45)% | (4.76)% |
Ratios to Average Net AssetsF,H | | | | |
Expenses before reductions | .50% | .50% | .50% | .50%A |
Expenses net of fee waivers, if any | .50% | .50% | .50% | .50%A |
Expenses net of all reductions | .50% | .50% | .50% | .50%A |
Net investment income (loss) | 1.38% | 1.37% | 2.32% | 2.01%A |
Supplemental Data | | | | |
Net assets, end of period (000 omitted) | $ 15 | $ 45 | $ 71 | $ 95 |
Portfolio turnover rate | 24% | 31% | 53% | 12%A |
A Annualized
B Total returns for periods of less than one year are not annualized.
C Total returns would have been lower if certain expenses had not been reduced during the applicable periods shown.
D Total returns do not include the effect of the sales charges.
E Calculated based on average shares outstanding during the period.
F Amounts do not include the activity of the underlying funds.
G For the period August 30, 2007 (commencement of operations) to July 31, 2008.
H Expense ratios reflect operating expenses of the class. Expenses before reductions do not reflect amounts reimbursed by the investment adviser or reductions from expense offset arrangements and do not represent the amount paid by the class during periods when reimbursements or reductions occur. Expenses net of fee waivers reflect expenses after reimbursement by the investment adviser but prior to reductions from expense offset arrangements. Expenses net of all reductions represent the net expenses paid by the class but do not include expenses of the investment companies in which the Fund invests.
Financial Highlights - Class C
Years ended July 31, | 2011 | 2010 | 2009 | 2008G |
Selected Per-Share Data | | | | |
Net asset value, beginning of period | $ 44.75 | $ 40.67 | $ 46.58 | $ 50.00 |
Income from Investment Operations | | | | |
Net investment income (loss)E | .428 | .385 | .693 | .682 |
Net realized and unrealized gain (loss) | 5.060 | 4.185 | (5.400) | (3.227) |
Total from investment operations | 5.488 | 4.570 | (4.707) | (2.545) |
Distributions from net investment income | (.452) | (.385) | (.713) | (.685) |
Distributions from net realized gain | (.176) | (.105) | (.490) | (.190) |
Total distributions | (.628) | (.490) | (1.203) | (.875) |
Net asset value, end of period | $ 49.61 | $ 44.75 | $ 40.67 | $ 46.58 |
Total ReturnB,C,D | 12.30% | 11.26% | (9.91)% | (5.21)% |
Ratios to Average Net AssetsF,H | | | | |
Expenses before reductions | 1.00% | 1.00% | 1.00% | 1.00%A |
Expenses net of fee waivers, if any | 1.00% | 1.00% | 1.00% | 1.00%A |
Expenses net of all reductions | 1.00% | 1.00% | 1.00% | 1.00%A |
Net investment income (loss) | .88% | .88% | 1.82% | 1.51%A |
Supplemental Data | | | | |
Net assets, end of period (000 omitted) | $ 270 | $ 186 | $ 178 | $ 297 |
Portfolio turnover rate | 24% | 31% | 53% | 12%A |
A Annualized
B Total returns for periods of less than one year are not annualized.
C Total returns would have been lower if certain expenses had not been reduced during the applicable periods shown.
D Total returns do not include the effect of the contingent deferred sales charge.
E Calculated based on average shares outstanding during the period.
F Amounts do not include the activity of the underlying funds.
G For the period August 30, 2007 (commencement of operations) to July 31, 2008.
H Expense ratios reflect operating expenses of the class. Expenses before reductions do not reflect amounts reimbursed by the investment adviser or reductions from expense offset arrangements and do not represent the amount paid by the class during periods when reimbursements or reductions occur. Expenses net of fee waivers reflect expenses after reimbursement by the investment adviser but prior to reductions from expense offset arrangements. Expenses net of all reductions represent the net expenses paid by the class but do not include expenses of the investment companies in which the Fund invests.
See accompanying notes which are an integral part of the financial statements.
Annual Report
Financial Highlights - Income Replacement 2030
Years ended July 31, | 2011 | 2010 | 2009 | 2008G |
Selected Per-Share Data | | | | |
Net asset value, beginning of period | $ 44.76 | $ 40.69 | $ 46.61 | $ 50.00 |
Income from Investment Operations | | | | |
Net investment income (loss)D | .917 | .821 | 1.101 | 1.117 |
Net realized and unrealized gain (loss) | 5.062 | 4.178 | (5.429) | (3.209) |
Total from investment operations | 5.979 | 4.999 | (4.328) | (2.092) |
Distributions from net investment income | (.923) | (.824) | (1.102) | (1.108) |
Distributions from net realized gain | (.176) | (.105) | (.490) | (.190) |
Total distributions | (1.099) | (.929) | (1.592) | (1.298) |
Net asset value, end of period | $ 49.64 | $ 44.76 | $ 40.69 | $ 46.61 |
Total ReturnB,C | 13.43% | 12.34% | (8.99)% | (4.33)% |
Ratios to Average Net AssetsE,H | | | | |
Expenses before reductionsF | .00% | .00% | .00% | .00%A |
Expenses net of fee waivers, if any | .00% | .00% | .00% | .00%A |
Expenses net of all reductions | .00% | .00% | .00% | .00%A |
Net investment income (loss) | 1.88% | 1.88% | 2.82% | 2.51%A |
Supplemental Data | | | | |
Net assets, end of period (000 omitted) | $ 3,962 | $ 1,628 | $ 303 | $ 653 |
Portfolio turnover rate | 24% | 31% | 53% | 12%A |
A Annualized
B Total returns for periods of less than one year are not annualized.
C Total returns would have been lower if certain expenses had not been reduced during the applicable periods shown.
D Calculated based on average shares outstanding during the period.
E Amounts do not include the activity of the underlying funds.
F Amount represents less than .01%.
G For the period August 30, 2007 (commencement of operations) to July 31, 2008.
H Expense ratios reflect operating expenses of the class. Expenses before reductions do not reflect amounts reimbursed by the investment adviser or reductions from expense offset arrangements and do not represent the amount paid by the class during periods when reimbursements or reductions occur. Expenses net of fee waivers reflect expenses after reimbursement by the investment adviser but prior to reductions from expense offset arrangements. Expenses net of all reductions represent the net expenses paid by the class but do not include expenses of the investment companies in which the Fund invests.
Financial Highlights - Institutional Class
Years ended July 31, | 2011 | 2010 | 2009 | 2008G |
Selected Per-Share Data | | | | |
Net asset value, beginning of period | $ 44.77 | $ 40.69 | $ 46.61 | $ 50.00 |
Income from Investment Operations | | | | |
Net investment income (loss)D | .911 | .825 | 1.074 | 1.149 |
Net realized and unrealized gain (loss) | 5.058 | 4.184 | (5.402) | (3.241) |
Total from investment operations | 5.969 | 5.009 | (4.328) | (2.092) |
Distributions from net investment income | (.923) | (.824) | (1.102) | (1.108) |
Distributions from net realized gain | (.176) | (.105) | (.490) | (.190) |
Total distributions | (1.099) | (.929) | (1.592) | (1.298) |
Net asset value, end of period | $ 49.64 | $ 44.77 | $ 40.69 | $ 46.61 |
Total ReturnB,C | 13.41% | 12.36% | (8.99)% | (4.33)% |
Ratios to Average Net AssetsE,H | | | | |
Expenses before reductionsF | .00% | .00% | .00% | .00%A |
Expenses net of fee waivers, if any | .00% | .00% | .00% | .00%A |
Expenses net of all reductions | .00% | .00% | .00% | .00%A |
Net investment income (loss) | 1.88% | 1.88% | 2.82% | 2.51%A |
Supplemental Data | | | | |
Net assets, end of period (000 omitted) | $ 27 | $ 36 | $ 55 | $ 96 |
Portfolio turnover rate | 24% | 31% | 53% | 12%A |
A Annualized
B Total returns for periods of less than one year are not annualized.
C Total returns would have been lower if certain expenses had not been reduced during the applicable periods shown.
D Calculated based on average shares outstanding during the period.
E Amounts do not include the activity of the underlying funds.
F Amount represents less than .01%.
G For the period August 30, 2007 (commencement of operations) to July 31, 2008.
H Expense ratios reflect operating expenses of the class. Expenses before reductions do not reflect amounts reimbursed by the investment adviser or reductions from expense offset arrangements and do not represent the amount paid by the class during periods when reimbursements or reductions occur. Expenses net of fee waivers reflect expenses after reimbursement by the investment adviser but prior to reductions from expense offset arrangements. Expenses net of all reductions represent the net expenses paid by the class but do not include expenses of the investment companies in which the Fund invests.
See accompanying notes which are an integral part of the financial statements.
Annual Report
Fidelity Income Replacement 2032 Fund
Investment Changes (Unaudited)
Fund Holdings as of July 31, 2011 |
| % of fund's
net assets | % of fund's net assets
6 months ago |
Domestic Equity Funds | | |
Fidelity Advisor Mid Cap II Fund Institutional Class | 5.4 | 5.5 |
Fidelity Disciplined Equity Fund | 5.6 | 5.8 |
Fidelity Equity-Income Fund | 5.6 | 5.7 |
Fidelity Large Cap Core Enhanced Index Fund | 9.2 | 9.2 |
Fidelity Series 100 Index Fund | 6.9 | 6.9 |
Fidelity Series Broad Market Opportunities Fund | 9.0 | 9.2 |
Fidelity Series Small Cap Opportunities Fund | 3.6 | 3.7 |
| 45.3 | 46.0 |
International Equity Funds | | |
Fidelity Advisor International Discovery Fund Institutional Class | 8.4 | 8.8 |
High Yield Fixed-Income Funds | | |
Fidelity Capital & Income Fund | 2.6 | 2.6 |
Fidelity Strategic Income Fund | 2.7 | 2.6 |
| 5.3 | 5.2 |
Investment Grade Fixed-Income Funds | | |
Fidelity Government Income Fund | 5.7 | 5.6 |
Fidelity Strategic Real Return Fund | 5.6 | 5.6 |
Fidelity Total Bond Fund | 17.0 | 16.7 |
| 28.3 | 27.9 |
Short-Term Funds | | |
Fidelity Institutional Money Market Portfolio Institutional Class | 6.3 | 6.1 |
Fidelity Short-Term Bond Fund | 6.4 | 6.0 |
| 12.7 | 12.1 |
Net Other Assets (Liabilities)* | 0.0 | 0.0 |
| 100.0 | 100.0 |
* Amount represents less than 0.1% |
Asset Allocation (% of fund's net assets) |
Current |
| Domestic Equity Funds | 45.3% | |
| International Equity Funds | 8.4% | |
| High Yield
Fixed-Income Funds | 5.3% | |
| Investment Grade Fixed-Income Funds | 28.3% | |
| Short-Term Funds | 12.7% | |

Six months ago |
| Domestic Equity Funds | 46.0% | |
| International Equity Funds | 8.8% | |
| High Yield
Fixed-Income Funds | 5.2% | |
| Investment Grade Fixed-Income Funds | 27.9% | |
| Short-Term Funds | 12.1% | |

Expected |
| Domestic Equity Funds | 45.6% | |
| International Equity Funds | 8.3% | |
| High Yield
Fixed-Income Funds | 5.1% | |
| Investment Grade Fixed-Income Funds | 28.2% | |
| Short-Term Funds | 12.8% | |

The fund invests according to an asset allocation strategy that becomes increasingly conservative over time. The six months ago allocation is based on the fund's holdings as of January 31, 2011. The current allocation is based on the fund's holdings as of July 31, 2011. The expected allocation represents the fund's anticipated allocation at January 31, 2012. |
Annual Report
Fidelity Income Replacement 2032 Fund
Investments July 31, 2011
Showing Percentage of Net Assets
Equity Funds - 53.7% |
| Shares | | Value |
Domestic Equity Funds - 45.3% |
Fidelity Advisor Mid Cap II Fund Institutional Class (a) | 4,677 | | $ 84,790 |
Fidelity Disciplined Equity Fund | 3,823 | | 89,010 |
Fidelity Equity-Income Fund | 1,975 | | 87,630 |
Fidelity Large Cap Core Enhanced Index Fund | 16,216 | | 145,455 |
Fidelity Series 100 Index Fund | 12,043 | | 108,985 |
Fidelity Series Broad Market Opportunities Fund | 13,822 | | 142,370 |
Fidelity Series Small Cap Opportunities Fund | 5,068 | | 56,868 |
TOTAL DOMESTIC EQUITY FUNDS | | 715,108 |
International Equity Funds - 8.4% |
Fidelity Advisor International Discovery Fund Institutional Class | 3,962 | | 133,251 |
TOTAL EQUITY FUNDS (Cost $710,799) | 848,359 |
Fixed-Income Funds - 33.6% |
| | | |
High Yield Fixed-Income Funds - 5.3% |
Fidelity Capital & Income Fund | 4,260 | | 40,772 |
Fidelity Strategic Income Fund | 3,738 | | 42,535 |
TOTAL HIGH YIELD FIXED-INCOME FUNDS | | 83,307 |
|
| Shares | | Value |
Investment Grade Fixed-Income Funds - 28.3% |
Fidelity Government Income Fund | 8,409 | | $ 89,804 |
Fidelity Strategic Real Return Fund | 8,905 | | 88,517 |
Fidelity Total Bond Fund | 24,415 | | 268,810 |
TOTAL INVESTMENT GRADE FIXED-INCOME FUNDS | | 447,131 |
TOTAL FIXED-INCOME FUNDS (Cost $512,270) | 530,438 |
Short-Term Funds - 12.7% |
| | | |
Fidelity Institutional Money Market Portfolio Institutional Class | 99,673 | | 99,673 |
Fidelity Short-Term Bond Fund | 11,771 | | 100,522 |
TOTAL SHORT-TERM FUNDS (Cost $199,272) | 200,195 |
TOTAL INVESTMENT PORTFOLIO - 100.0% (Cost $1,422,341) | | 1,578,992 |
NET OTHER ASSETS (LIABILITIES) - 0.0% | | (76) |
NET ASSETS - 100% | $ 1,578,916 |
Legend |
(a) Non-income producing |
Other Information |
All investments are categorized as Level 1 under the Fair Value Hierarchy. The inputs or methodology used for valuing securities may not be an indication of the risk associated with investing in those securities. For more information on valuation inputs, please refer to the Security Valuation section in the accompanying Notes to Financial Statements. |
Income Tax Information |
At July 31, 2011, the Fund had a capital loss carryforward of approximately $160,350 all of which will expire in fiscal 2018. Capital loss carryforwards are only available to offset future capital gains of the Fund to the extent provided by regulations and may be limited. |
See accompanying notes which are an integral part of the financial statements.
Annual Report
Fidelity Income Replacement 2032 Fund
Statement of Assets and Liabilities
| July 31, 2011 |
| | |
Assets | | |
Investment in securities, at value (cost $1,422,341) - See accompanying schedule | | $ 1,578,992 |
| | |
Liabilities | | |
Distribution and service plan fees payable | | 76 |
| | |
Net Assets | | $ 1,578,916 |
Net Assets consist of: | | |
Paid in capital | | $ 1,583,929 |
Undistributed net investment income | | 290 |
Accumulated undistributed net realized gain (loss) on investments | | (161,954) |
Net unrealized appreciation (depreciation) on investments | | 156,651 |
Net Assets | | $ 1,578,916 |
| | |
Calculation of Maximum Offering Price Class A:
Net Asset Value and redemption price per share ($213,829 ÷ 4,357.23 shares) | | $ 49.07 |
| | |
Maximum offering price per share (100/94.25 of $49.07) | | $ 52.06 |
| | |
Class T:
Net Asset Value and redemption price per share ($26,761 ÷ 545.05 shares) | | $ 49.10 |
| | |
Maximum offering price per share (100/96.50 of $49.10) | | $ 50.88 |
| | |
Class C:
Net Asset Value and offering price per share ($22,168 ÷ 451.28 shares)A | | $ 49.12 |
| | |
Income Replacement 2032:
Net Asset Value, offering price and redemption price per share ($1,297,438 ÷ 26,433.69 shares) | | $ 49.08 |
| | |
Institutional Class:
Net Asset Value, offering price and redemption price per share ($18,720 ÷ 381.40 shares) | | $ 49.08 |
A Redemption price per share is equal to net asset value less any applicable contingent deferred sales charge.
Statement of Operations
| Year ended July 31, 2011 |
| | |
Investment Income | | |
Income distributions from underlying funds | | $ 40,022 |
| | |
Expenses | | |
Distribution and service plan fees | $ 967 | |
Independent trustees' compensation | 7 | |
Total expenses before reductions | 974 | |
Expense reductions | (7) | 967 |
Net investment income (loss) | | 39,055 |
Realized and Unrealized Gain (Loss) Realized gain (loss) on sale of underlying fund shares | 193,243 | |
Capital gain distributions from underlying funds | 11,771 | |
Total net realized gain (loss) | | 205,014 |
Change in net unrealized appreciation (depreciation) on underlying funds | | 10,190 |
Net gain (loss) | | 215,204 |
Net increase (decrease) in net assets resulting from operations | | $ 254,259 |
See accompanying notes which are an integral part of the financial statements.
Annual Report
Statement of Changes in Net Assets
| Year ended
July 31, 2011 | Year ended
July 31, 2010 |
Increase (Decrease) in Net Assets | | |
Operations | | |
Net investment income (loss) | $ 39,055 | $ 18,688 |
Net realized gain (loss) | 205,014 | (147,241) |
Change in net unrealized appreciation (depreciation) | 10,190 | 292,353 |
Net increase (decrease) in net assets resulting from operations | 254,259 | 163,800 |
Distributions to shareholders from net investment income | (39,246) | (18,690) |
Distributions to shareholders from net realized gain | (8,488) | (2,138) |
Total distributions | (47,734) | (20,828) |
Share transactions - net increase (decrease) | (344,791) | (49,316) |
Total increase (decrease) in net assets | (138,266) | 93,656 |
| | |
Net Assets | | |
Beginning of period | 1,717,182 | 1,623,526 |
End of period (including undistributed net investment income of $290 and undistributed net investment income of $493, respectively) | $ 1,578,916 | $ 1,717,182 |
Financial Highlights - Class A
Years ended July 31, | 2011 | 2010 | 2009 | 2008G |
Selected Per-Share Data | | | | |
Net asset value, beginning of period | $ 44.19 | $ 40.21 | $ 46.52 | $ 50.00 |
Income from Investment Operations | | | | |
Net investment income (loss)E | .796 | .727 | .930 | 1.019 |
Net realized and unrealized gain (loss) | 5.086 | 4.154 | (5.570) | (3.322) |
Total from investment operations | 5.882 | 4.881 | (4.640) | (2.303) |
Distributions from net investment income | (.812) | (.796) | (.960) | (.987) |
Distributions from net realized gain | (.190) | (.105) | (.710) | (.190) |
Total distributions | (1.002) | (.901) | (1.670) | (1.177) |
Net asset value, end of period | $ 49.07 | $ 44.19 | $ 40.21 | $ 46.52 |
Total ReturnB,C,D | 13.38% | 12.19% | (9.66)% | (4.75)% |
Ratios to Average Net AssetsF,H | | | | |
Expenses before reductions | .25% | .25% | .25% | .25%A |
Expenses net of fee waivers, if any | .25% | .25% | .25% | .25%A |
Expenses net of all reductions | .25% | .25% | .25% | .25%A |
Net investment income (loss) | 1.66% | 1.67% | 2.43% | 2.27%A |
Supplemental Data | | | | |
Net assets, end of period (000 omitted) | $ 214 | $ 200 | $ 183 | $ 402 |
Portfolio turnover rate | 45% | 95% | 82% | 23%A |
A Annualized
B Total returns for periods of less than one year are not annualized.
C Total returns would have been lower if certain expenses had not been reduced during the applicable periods shown.
D Total returns do not include the effect of the sales charges.
E Calculated based on average shares outstanding during the period.
F Amounts do not include the activity of the underlying funds.
G For the period August 30, 2007 (commencement of operations) to July 31, 2008.
H Expense ratios reflect operating expenses of the class. Expenses before reductions do not reflect amounts reimbursed by the investment adviser or reductions from expense offset arrangements and do not represent the amount paid by the class during periods when reimbursements or reductions occur. Expenses net of fee waivers reflect expenses after reimbursement by the investment adviser but prior to reductions from expense offset arrangements. Expenses net of all reductions represent the net expenses paid by the class but do not include expenses of the investment companies in which the Fund invests.
See accompanying notes which are an integral part of the financial statements.
Annual Report
Financial Highlights - Class T
Years ended July 31, | 2011 | 2010 | 2009 | 2008G |
Selected Per-Share Data | | | | |
Net asset value, beginning of period | $ 44.20 | $ 40.22 | $ 46.52 | $ 50.00 |
Income from Investment Operations | | | | |
Net investment income (loss)E | .676 | .620 | .821 | .918 |
Net realized and unrealized gain (loss) | 5.107 | 4.147 | (5.548) | (3.339) |
Total from investment operations | 5.783 | 4.767 | (4.727) | (2.421) |
Distributions from net investment income | (.693) | (.682) | (.863) | (.869) |
Distributions from net realized gain | (.190) | (.105) | (.710) | (.190) |
Total distributions | (.883) | (.787) | (1.573) | (1.059) |
Net asset value, end of period | $ 49.10 | $ 44.20 | $ 40.22 | $ 46.52 |
Total ReturnB,C,D | 13.14% | 11.90% | (9.88)% | (4.98)% |
Ratios to Average Net AssetsF,H | | | | |
Expenses before reductions | .50% | .50% | .50% | .50%A |
Expenses net of fee waivers, if any | .50% | .50% | .50% | .50%A |
Expenses net of all reductions | .50% | .50% | .50% | .50%A |
Net investment income (loss) | 1.41% | 1.43% | 2.18% | 2.02%A |
Supplemental Data | | | | |
Net assets, end of period (000 omitted) | $ 27 | $ 35 | $ 54 | $ 95 |
Portfolio turnover rate | 45% | 95% | 82% | 23%A |
A Annualized
B Total returns for periods of less than one year are not annualized.
C Total returns would have been lower if certain expenses had not been reduced during the applicable periods shown.
D Total returns do not include the effect of the sales charges.
E Calculated based on average shares outstanding during the period.
F Amounts do not include the activity of the underlying funds.
G For the period August 30, 2007 (commencement of operations) to July 31, 2008.
H Expense ratios reflect operating expenses of the class. Expenses before reductions do not reflect amounts reimbursed by the investment adviser or reductions from expense offset arrangements and do not represent the amount paid by the class during periods when reimbursements or reductions occur. Expenses net of fee waivers reflect expenses after reimbursement by the investment adviser but prior to reductions from expense offset arrangements. Expenses net of all reductions represent the net expenses paid by the class but do not include expenses of the investment companies in which the Fund invests.
Financial Highlights - Class C
Years ended July 31, | 2011 | 2010 | 2009 | 2008G |
Selected Per-Share Data | | | | |
Net asset value, beginning of period | $ 44.22 | $ 40.23 | $ 46.51 | $ 50.00 |
Income from Investment Operations | | | | |
Net investment income (loss)E | .434 | .403 | .624 | .690 |
Net realized and unrealized gain (loss) | 5.102 | 4.143 | (5.532) | (3.342) |
Total from investment operations | 5.536 | 4.546 | (4.908) | (2.652) |
Distributions from net investment income | (.446) | (.451) | (.662) | (.648) |
Distributions from net realized gain | (.190) | (.105) | (.710) | (.190) |
Total distributions | (.636) | (.556) | (1.372) | (.838) |
Net asset value, end of period | $ 49.12 | $ 44.22 | $ 40.23 | $ 46.51 |
Total ReturnB,C,D | 12.55% | 11.33% | (10.32)% | (5.42)% |
Ratios to Average Net AssetsF,H | | | | |
Expenses before reductions | 1.00% | 1.00% | 1.00% | 1.00%A |
Expenses net of fee waivers, if any | 1.00% | 1.00% | 1.00% | 1.00%A |
Expenses net of all reductions | 1.00% | 1.00% | 1.00% | 1.00%A |
Net investment income (loss) | .91% | .93% | 1.68% | 1.52%A |
Supplemental Data | | | | |
Net assets, end of period (000 omitted) | $ 22 | $ 29 | $ 46 | $ 95 |
Portfolio turnover rate | 45% | 95% | 82% | 23%A |
A Annualized
B Total returns for periods of less than one year are not annualized.
C Total returns would have been lower if certain expenses had not been reduced during the applicable periods shown.
D Total returns do not include the effect of the contingent deferred sales charge.
E Calculated based on average shares outstanding during the period.
F Amounts do not include the activity of the underlying funds.
G For the period August 30, 2007 (commencement of operations) to July 31, 2008.
H Expense ratios reflect operating expenses of the class. Expenses before reductions do not reflect amounts reimbursed by the investment adviser or reductions from expense offset arrangements and do not represent the amount paid by the class during periods when reimbursements or reductions occur. Expenses net of fee waivers reflect expenses after reimbursement by the investment adviser but prior to reductions from expense offset arrangements. Expenses net of all reductions represent the net expenses paid by the class but do not include expenses of the investment companies in which the Fund invests.
See accompanying notes which are an integral part of the financial statements.
Annual Report
Financial Highlights - Income Replacement 2032
Years ended July 31, | 2011 | 2010 | 2009 | 2008G |
Selected Per-Share Data | | | | |
Net asset value, beginning of period | $ 44.19 | $ 40.22 | $ 46.53 | $ 50.00 |
Income from Investment Operations | | | | |
Net investment income (loss)D | .918 | .832 | 1.014 | 1.122 |
Net realized and unrealized gain (loss) | 5.095 | 4.147 | (5.557) | (3.310) |
Total from investment operations | 6.013 | 4.979 | (4.543) | (2.188) |
Distributions from net investment income | (.933) | (.904) | (1.057) | (1.092) |
Distributions from net realized gain | (.190) | (.105) | (.710) | (.190) |
Total distributions | (1.123) | (1.009) | (1.767) | (1.282) |
Net asset value, end of period | $ 49.08 | $ 44.19 | $ 40.22 | $ 46.53 |
Total ReturnB,C | 13.68% | 12.44% | (9.43)% | (4.53)% |
Ratios to Average Net AssetsE,H | | | | |
Expenses before reductionsF | .00% | .00% | .00% | .00%A |
Expenses net of fee waivers, if any | .00% | .00% | .00% | .00%A |
Expenses net of all reductions | .00% | .00% | .00% | .00%A |
Net investment income (loss) | 1.91% | 1.92% | 2.68% | 2.52%A |
Supplemental Data | | | | |
Net assets, end of period (000 omitted) | $ 1,297 | $ 1,391 | $ 1,285 | $ 731 |
Portfolio turnover rate | 45% | 95% | 82% | 23%A |
A Annualized
B Total returns for periods of less than one year are not annualized.
C Total returns would have been lower if certain expenses had not been reduced during the applicable periods shown.
D Calculated based on average shares outstanding during the period.
E Amounts do not include the activity of the underlying funds.
F Amount represents less than .01%.
G For the period August 30, 2007 (commencement of operations) to July 31, 2008.
H Expense ratios reflect operating expenses of the class. Expenses before reductions do not reflect amounts reimbursed by the investment adviser or reductions from expense offset arrangements and do not represent the amount paid by the class during periods when reimbursements or reductions occur. Expenses net of fee waivers reflect expenses after reimbursement by the investment adviser but prior to reductions from expense offset arrangements. Expenses net of all reductions represent the net expenses paid by the class but do not include expenses of the investment companies in which the Fund invests.
Financial Highlights - Institutional Class
Years ended July 31, | 2011 | 2010 | 2009 | 2008G |
Selected Per-Share Data | | | | |
Net asset value, beginning of period | $ 44.19 | $ 40.22 | $ 46.53 | $ 50.00 |
Income from Investment Operations | | | | |
Net investment income (loss)D | .904 | .834 | 1.009 | 1.147 |
Net realized and unrealized gain (loss) | 5.109 | 4.145 | (5.552) | (3.335) |
Total from investment operations | 6.013 | 4.979 | (4.543) | (2.188) |
Distributions from net investment income | (.933) | (.904) | (1.057) | (1.092) |
Distributions from net realized gain | (.190) | (.105) | (.710) | (.190) |
Total distributions | (1.123) | (1.009) | (1.767) | (1.282) |
Net asset value, end of period | $ 49.08 | $ 44.19 | $ 40.22 | $ 46.53 |
Total ReturnB,C | 13.68% | 12.44% | (9.43)% | (4.53)% |
Ratios to Average Net AssetsE,H | | | | |
Expenses before reductionsF | .00% | .00% | .00% | .00%A |
Expenses net of fee waivers, if any | .00% | .00% | .00% | .00%A |
Expenses net of all reductions | .00% | .00% | .00% | .00%A |
Net investment income (loss) | 1.91% | 1.92% | 2.68% | 2.52%A |
Supplemental Data | | | | |
Net assets, end of period (000 omitted) | $ 19 | $ 61 | $ 55 | $ 96 |
Portfolio turnover rate | 45% | 95% | 82% | 23%A |
A Annualized
B Total returns for periods of less than one year are not annualized.
C Total returns would have been lower if certain expenses had not been reduced during the applicable periods shown.
D Calculated based on average shares outstanding during the period.
E Amounts do not include the activity of the underlying funds.
F Amount represents less than .01%.
G For the period August 30, 2007 (commencement of operations) to July 31, 2008.
H Expense ratios reflect operating expenses of the class. Expenses before reductions do not reflect amounts reimbursed by the investment adviser or reductions from expense offset arrangements and do not represent the amount paid by the class during periods when reimbursements or reductions occur. Expenses net of fee waivers reflect expenses after reimbursement by the investment adviser but prior to reductions from expense offset arrangements. Expenses net of all reductions represent the net expenses paid by the class but do not include expenses of the investment companies in which the Fund invests.
See accompanying notes which are an integral part of the financial statements.
Annual Report
Fidelity Income Replacement 2034 Fund
Investment Changes (Unaudited)
Fund Holdings as of July 31, 2011 |
| % of fund's
net assets | % of fund's net assets
6 months ago |
Domestic Equity Funds | | |
Fidelity Advisor Mid Cap II Fund Institutional Class | 5.5 | 5.6 |
Fidelity Disciplined Equity Fund | 5.8 | 5.8 |
Fidelity Equity-Income Fund | 5.7 | 5.9 |
Fidelity Large Cap Core Enhanced Index Fund | 9.4 | 9.4 |
Fidelity Series 100 Index Fund | 7.0 | 7.0 |
Fidelity Series Broad Market Opportunities Fund | 9.2 | 9.4 |
Fidelity Series Small Cap Opportunities Fund | 3.7 | 3.7 |
| 46.3 | 46.8 |
International Equity Funds | | |
Fidelity Advisor International Discovery Fund Institutional Class | 9.4 | 9.6 |
High Yield Fixed-Income Funds | | |
Fidelity Capital & Income Fund | 2.7 | 2.7 |
Fidelity Strategic Income Fund | 2.8 | 2.7 |
| 5.5 | 5.4 |
Investment Grade Fixed-Income Funds | | |
Fidelity Government Income Fund | 5.6 | 5.5 |
Fidelity Strategic Real Return Fund | 5.5 | 5.5 |
Fidelity Total Bond Fund | 16.7 | 16.6 |
| 27.8 | 27.6 |
Short-Term Funds | | |
Fidelity Institutional Money Market Portfolio Institutional Class | 5.5 | 5.3 |
Fidelity Short-Term Bond Fund | 5.5 | 5.3 |
| 11.0 | 10.6 |
Net Other Assets (Liabilities)* | 0.0 | 0.0 |
| 100.0 | 100.0 |
* Amount represents less than 0.1% |
Asset Allocation (% of fund's net assets) |
Current |
| Domestic Equity Funds | 46.3% | |
| International Equity Funds | 9.4% | |
| High Yield
Fixed-Income Funds | 5.5% | |
| Investment Grade Fixed-Income Funds | 27.8% | |
| Short-Term Funds | 11.0% | |

Six months ago |
| Domestic Equity Funds | 46.8% | |
| International Equity Funds | 9.6% | |
| High Yield
Fixed-Income Funds | 5.4% | |
| Investment Grade Fixed-Income Funds | 27.6% | |
| Short-Term Funds | 10.6% | |

Expected |
| Domestic Equity Funds | 46.4% | |
| International Equity Funds | 9.2% | |
| High Yield
Fixed-Income Funds | 5.3% | |
| Investment Grade Fixed-Income Funds | 27.7% | |
| Short-Term Funds | 11.4% | |

The fund invests according to an asset allocation strategy that becomes increasingly conservative over time. The six months ago allocation is based on the fund's holdings as of January 31, 2011. The current allocation is based on the fund's holdings as of July 31, 2011. The expected allocation represents the fund's anticipated allocation at January 31, 2012. |
Annual Report
Fidelity Income Replacement 2034 Fund
Investments July 31, 2011
Showing Percentage of Net Assets
Equity Funds - 55.7% |
| Shares | | Value |
Domestic Equity Funds - 46.3% |
Fidelity Advisor Mid Cap II Fund Institutional Class (a) | 6,828 | | $ 123,787 |
Fidelity Disciplined Equity Fund | 5,540 | | 128,972 |
Fidelity Equity-Income Fund | 2,870 | | 127,323 |
Fidelity Large Cap Core Enhanced Index Fund | 23,376 | | 209,683 |
Fidelity Series 100 Index Fund | 17,425 | | 157,695 |
Fidelity Series Broad Market Opportunities Fund | 20,065 | | 206,672 |
Fidelity Series Small Cap Opportunities Fund | 7,304 | | 81,955 |
TOTAL DOMESTIC EQUITY FUNDS | | 1,036,087 |
International Equity Funds - 9.4% |
Fidelity Advisor International Discovery Fund Institutional Class | 6,262 | | 210,595 |
TOTAL EQUITY FUNDS (Cost $1,028,008) | 1,246,682 |
Fixed-Income Funds - 33.3% |
| | | |
High Yield Fixed-Income Funds - 5.5% |
Fidelity Capital & Income Fund | 6,338 | | 60,652 |
Fidelity Strategic Income Fund | 5,475 | | 62,309 |
TOTAL HIGH YIELD FIXED-INCOME FUNDS | | 122,961 |
|
| Shares | | Value |
Investment Grade Fixed-Income Funds - 27.8% |
Fidelity Government Income Fund | 11,700 | | $ 124,954 |
Fidelity Strategic Real Return Fund | 12,543 | | 124,674 |
Fidelity Total Bond Fund | 33,979 | | 374,113 |
TOTAL INVESTMENT GRADE FIXED-INCOME FUNDS | | 623,741 |
TOTAL FIXED-INCOME FUNDS (Cost $679,154) | 746,702 |
Short-Term Funds - 11.0% |
| | | |
Fidelity Institutional Money Market Portfolio Institutional Class | 123,107 | | 123,107 |
Fidelity Short-Term Bond Fund | 14,496 | | 123,800 |
TOTAL SHORT-TERM FUNDS (Cost $243,107) | 246,907 |
TOTAL INVESTMENT PORTFOLIO - 100.0% (Cost $1,950,269) | | 2,240,291 |
NET OTHER ASSETS (LIABILITIES) - 0.0% | | (33) |
NET ASSETS - 100% | $ 2,240,258 |
Legend |
(a) Non-income producing |
Other Information |
All investments are categorized as Level 1 under the Fair Value Hierarchy. The inputs or methodology used for valuing securities may not be an indication of the risk associated with investing in those securities. For more information on valuation inputs, please refer to the Security Valuation section in the accompanying Notes to Financial Statements. |
Income Tax Information |
At July 31, 2011, the Fund had a capital loss carryforward of approximately $106,484 of which $62,824 and $43,660 will expire in fiscal 2018 and 2019, respectively. Capital loss carryforwards are only available to offset future capital gains of the Fund to the extent provided by regulations and may be limited. |
See accompanying notes which are an integral part of the financial statements.
Annual Report
Fidelity Income Replacement 2034 Fund
Statement of Assets and Liabilities
| July 31, 2011 |
| | |
Assets | | |
Investment in securities, at value (cost $1,950,269) - See accompanying schedule | | $ 2,240,291 |
| | |
Liabilities | | |
Distribution and service plan fees payable | | 33 |
| | |
Net Assets | | $ 2,240,258 |
Net Assets consist of: | | |
Paid in capital | | $ 2,093,614 |
Undistributed net investment income | | 426 |
Accumulated undistributed net realized gain (loss) on investments | | (143,804) |
Net unrealized appreciation (depreciation) on investments | | 290,022 |
Net Assets | | $ 2,240,258 |
| | |
Calculation of Maximum Offering Price Class A:
Net Asset Value and redemption price per share ($20,223.1 ÷ 409.92 shares) | | $ 49.33 |
| | |
Maximum offering price per share (100/94.25 of $49.33) | | $ 52.34 |
| | |
Class T:
Net Asset Value and redemption price per share ($26,613.4 ÷ 539.42 shares) | | $ 49.34 |
| | |
Maximum offering price per share (100/96.50 of $49.34) | | $ 51.13 |
| | |
Class C:
Net Asset Value and offering price per share ($20,147.3 ÷ 408.12 shares)A | | $ 49.37 |
| | |
Income Replacement 2034:
Net Asset Value, offering price and redemption price per share ($2,066,283.9 ÷ 41,902.71 shares) | | $ 49.31 |
| | |
Institutional Class:
Net Asset Value, offering price and redemption price per share ($106,990.6 ÷ 2,169.54 shares) | | $ 49.31 |
A Redemption price per share is equal to net asset value less any applicable contingent deferred sales charge.
Statement of Operations
| Year ended July 31, 2011 |
| | |
Investment Income | | |
Income distributions from underlying funds | | $ 38,012 |
| | |
Expenses | | |
Distribution and service plan fees | $ 444 | |
Independent trustees' compensation | 7 | |
Total expenses before reductions | 451 | |
Expense reductions | (7) | 444 |
Net investment income (loss) | | 37,568 |
Realized and Unrealized Gain (Loss) Realized gain (loss) on sale of underlying fund shares | (10,325) | |
Capital gain distributions from underlying funds | 10,953 | |
Total net realized gain (loss) | | 628 |
Change in net unrealized appreciation (depreciation) on underlying funds | | 213,839 |
Net gain (loss) | | 214,467 |
Net increase (decrease) in net assets resulting from operations | | $ 252,035 |
See accompanying notes which are an integral part of the financial statements.
Annual Report
Statement of Changes in Net Assets
| Year ended
July 31, 2011 | Year ended
July 31, 2010 |
Increase (Decrease) in Net Assets | | |
Operations | | |
Net investment income (loss) | $ 37,568 | $ 38,285 |
Net realized gain (loss) | 628 | (69,132) |
Change in net unrealized appreciation (depreciation) | 213,839 | 253,583 |
Net increase (decrease) in net assets resulting from operations | 252,035 | 222,736 |
Distributions to shareholders from net investment income | (37,649) | (38,318) |
Distributions to shareholders from net realized gain | (8,111) | (8,464) |
Total distributions | (45,760) | (46,782) |
Share transactions - net increase (decrease) | 179,595 | (216,059) |
Total increase (decrease) in net assets | 385,870 | (40,105) |
| | |
Net Assets | | |
Beginning of period | 1,854,388 | 1,894,493 |
End of period (including undistributed net investment income of $426 and undistributed net investment income of $518, respectively) | $ 2,240,258 | $ 1,854,388 |
Financial Highlights - Class A
Years ended July 31, | 2011 | 2010 | 2009 | 2008G |
Selected Per-Share Data | | | | |
Net asset value, beginning of period | $ 44.27 | $ 40.29 | $ 46.40 | $ 50.00 |
Income from Investment Operations | | | | |
Net investment income (loss)E | .799 | .753 | .923 | .994 |
Net realized and unrealized gain (loss) | 5.233 | 4.174 | (5.753) | (3.438) |
Total from investment operations | 6.032 | 4.927 | (4.830) | (2.444) |
Distributions from net investment income | (.772) | (.758) | (.890) | (.956) |
Distributions from net realized gain | (.200) | (.189) | (.390) | (.200) |
Total distributions | (.972) | (.947) | (1.280) | (1.156) |
Net asset value, end of period | $ 49.33 | $ 44.27 | $ 40.29 | $ 46.40 |
Total ReturnB,C,D | 13.69% | 12.29% | (10.20)% | (5.04)% |
Ratios to Average Net AssetsF,H | | | | |
Expenses before reductions | .25% | .25% | .26% | .25%A |
Expenses net of fee waivers, if any | .25% | .25% | .26% | .25%A |
Expenses net of all reductions | .25% | .25% | .26% | .25%A |
Net investment income (loss) | 1.66% | 1.73% | 2.46% | 2.19%A |
Supplemental Data | | | | |
Net assets, end of period (000 omitted) | $ 20 | $ 27 | $ 63 | $ 138 |
Portfolio turnover rate | 39% | 22% | 46% | 12%A |
A Annualized
B Total returns for periods of less than one year are not annualized.
C Total returns would have been lower if certain expenses had not been reduced during the applicable periods shown.
D Total returns do not include the effect of the sales charges.
E Calculated based on average shares outstanding during the period.
F Amounts do not include the activity of the underlying funds.
G For the period August 30, 2007 (commencement of operations) to July 31, 2008.
H Expense ratios reflect operating expenses of the class. Expenses before reductions do not reflect amounts reimbursed by the investment adviser or reductions from expense offset arrangements and do not represent the amount paid by the class during periods when reimbursements or reductions occur. Expenses net of fee waivers reflect expenses after reimbursement by the investment adviser but prior to reductions from expense offset arrangements. Expenses net of all reductions represent the net expenses paid by the class but do not include expenses of the investment companies in which the Fund invests.
See accompanying notes which are an integral part of the financial statements.
Annual Report
Financial Highlights - Class T
Years ended July 31, | 2011 | 2010 | 2009 | 2008G |
Selected Per-Share Data | | | | |
Net asset value, beginning of period | $ 44.27 | $ 40.29 | $ 46.40 | $ 50.00 |
Income from Investment Operations | | | | |
Net investment income (loss)E | .681 | .645 | .828 | .875 |
Net realized and unrealized gain (loss) | 5.247 | 4.175 | (5.757) | (3.431) |
Total from investment operations | 5.928 | 4.820 | (4.929) | (2.556) |
Distributions from net investment income | (.658) | (.651) | (.791) | (.844) |
Distributions from net realized gain | (.200) | (.189) | (.390) | (.200) |
Total distributions | (.858) | (.840) | (1.181) | (1.044) |
Net asset value, end of period | $ 49.34 | $ 44.27 | $ 40.29 | $ 46.40 |
Total ReturnB,C,D | 13.45% | 12.01% | (10.44)% | (5.25)% |
Ratios to Average Net AssetsF,H | | | | |
Expenses before reductions | .50% | .50% | .51% | .50%A |
Expenses net of fee waivers, if any | .50% | .50% | .51% | .50%A |
Expenses net of all reductions | .50% | .50% | .51% | .50%A |
Net investment income (loss) | 1.42% | 1.48% | 2.21% | 1.94%A |
Supplemental Data | | | | |
Net assets, end of period (000 omitted) | $ 27 | $ 35 | $ 54 | $ 95 |
Portfolio turnover rate | 39% | 22% | 46% | 12%A |
A Annualized
B Total returns for periods of less than one year are not annualized.
C Total returns would have been lower if certain expenses had not been reduced during the applicable periods shown.
D Total returns do not include the effect of the sales charges.
E Calculated based on average shares outstanding during the period.
F Amounts do not include the activity of the underlying funds.
G For the period August 30, 2007 (commencement of operations) to July 31, 2008.
H Expense ratios reflect operating expenses of the class. Expenses before reductions do not reflect amounts reimbursed by the investment adviser or reductions from expense offset arrangements and do not represent the amount paid by the class during periods when reimbursements or reductions occur. Expenses net of fee waivers reflect expenses after reimbursement by the investment adviser but prior to reductions from expense offset arrangements. Expenses net of all reductions represent the net expenses paid by the class but do not include expenses of the investment companies in which the Fund invests.
Financial Highlights - Class C
Years ended July 31, | 2011 | 2010 | 2009 | 2008G |
Selected Per-Share Data | | | | |
Net asset value, beginning of period | $ 44.30 | $ 40.30 | $ 46.39 | $ 50.00 |
Income from Investment Operations | | | | |
Net investment income (loss)E | .439 | .426 | .631 | .658 |
Net realized and unrealized gain (loss) | 5.239 | 4.185 | (5.740) | (3.448) |
Total from investment operations | 5.678 | 4.611 | (5.109) | (2.790) |
Distributions from net investment income | (.408) | (.422) | (.591) | (.620) |
Distributions from net realized gain | (.200) | (.189) | (.390) | (.200) |
Total distributions | (.608) | (.611) | (.981) | (.820) |
Net asset value, end of period | $ 49.37 | $ 44.30 | $ 40.30 | $ 46.39 |
Total ReturnB,C,D | 12.85% | 11.47% | (10.88)% | (5.70)% |
Ratios to Average Net AssetsF,H | | | | |
Expenses before reductions | 1.00% | 1.00% | 1.01% | 1.00%A |
Expenses net of fee waivers, if any | 1.00% | 1.00% | 1.01% | 1.00%A |
Expenses net of all reductions | 1.00% | 1.00% | 1.01% | 1.00%A |
Net investment income (loss) | .91% | .98% | 1.71% | 1.44%A |
Supplemental Data | | | | |
Net assets, end of period (000 omitted) | $ 20 | $ 27 | $ 41 | $ 94 |
Portfolio turnover rate | 39% | 22% | 46% | 12%A |
A Annualized
B Total returns for periods of less than one year are not annualized.
C Total returns would have been lower if certain expenses had not been reduced during the applicable periods shown.
D Total returns do not include the effect of the contingent deferred sales charge.
E Calculated based on average shares outstanding during the period.
F Amounts do not include the activity of the underlying funds.
G For the period August 30, 2007 (commencement of operations) to July 31, 2008.
H Expense ratios reflect operating expenses of the class. Expenses before reductions do not reflect amounts reimbursed by the investment adviser or reductions from expense offset arrangements and do not represent the amount paid by the class during periods when reimbursements or reductions occur. Expenses net of fee waivers reflect expenses after reimbursement by the investment adviser but prior to reductions from expense offset arrangements. Expenses net of all reductions represent the net expenses paid by the class but do not include expenses of the investment companies in which the Fund invests.
See accompanying notes which are an integral part of the financial statements.
Annual Report
Financial Highlights - Income Replacement 2034
Years ended July 31, | 2011 | 2010 | 2009 | 2008G |
Selected Per-Share Data | | | | |
Net asset value, beginning of period | $ 44.26 | $ 40.28 | $ 46.40 | $ 50.00 |
Income from Investment Operations | | | | |
Net investment income (loss)D | .921 | .862 | .988 | 1.090 |
Net realized and unrealized gain (loss) | 5.227 | 4.183 | (5.729) | (3.425) |
Total from investment operations | 6.148 | 5.045 | (4.741) | (2.335) |
Distributions from net investment income | (.898) | (.876) | (.989) | (1.065) |
Distributions from net realized gain | (.200) | (.189) | (.390) | (.200) |
Total distributions | (1.098) | (1.065) | (1.379) | (1.265) |
Net asset value, end of period | $ 49.31 | $ 44.26 | $ 40.28 | $ 46.40 |
Total ReturnB,C | 13.97% | 12.59% | (9.98)% | (4.83)% |
Ratios to Average Net AssetsE,H | | | | |
Expenses before reductions | .00%F | .00%F | .01% | .00%A,F |
Expenses net of fee waivers, if any | .00% | .00% | .01% | .00%A |
Expenses net of all reductions | .00% | .00% | .01% | .00%A |
Net investment income (loss) | 1.92% | 1.98% | 2.71% | 2.44%A |
Supplemental Data | | | | |
Net assets, end of period (000 omitted) | $ 2,066 | $ 1,672 | $ 1,628 | $ 552 |
Portfolio turnover rate | 39% | 22% | 46% | 12%A |
A Annualized
B Total returns for periods of less than one year are not annualized.
C Total returns would have been lower if certain expenses had not been reduced during the applicable periods shown.
D Calculated based on average shares outstanding during the period.
E Amounts do not include the activity of the underlying funds.
F Amount represents less than .01%.
G For the period August 30, 2007 (commencement of operations) to July 31, 2008.
H Expense ratios reflect operating expenses of the class. Expenses before reductions do not reflect amounts reimbursed by the investment adviser or reductions from expense offset arrangements and do not represent the amount paid by the class during periods when reimbursements or reductions occur. Expenses net of fee waivers reflect expenses after reimbursement by the investment adviser but prior to reductions from expense offset arrangements. Expenses net of all reductions represent the net expenses paid by the class but do not include expenses of the investment companies in which the Fund invests.
Financial Highlights - Institutional Class
Years ended July 31, | 2011 | 2010 | 2009 | 2008G |
Selected Per-Share Data | | | | |
Net asset value, beginning of period | $ 44.26 | $ 40.28 | $ 46.41 | $ 50.00 |
Income from Investment Operations | | | | |
Net investment income (loss)D | .922 | .860 | 1.002 | 1.114 |
Net realized and unrealized gain (loss) | 5.226 | 4.185 | (5.753) | (3.439) |
Total from investment operations | 6.148 | 5.045 | (4.751) | (2.325) |
Distributions from net investment income | (.898) | (.876) | (.989) | (1.065) |
Distributions from net realized gain | (.200) | (.189) | (.390) | (.200) |
Total distributions | (1.098) | (1.065) | (1.379) | (1.265) |
Net asset value, end of period | $ 49.31 | $ 44.26 | $ 40.28 | $ 46.41 |
Total ReturnB,C | 13.97% | 12.59% | (10.00)% | (4.81)% |
Ratios to Average Net AssetsE,H | | | | |
Expenses before reductions | .00% F | .00% F | .01% | .00%A, F |
Expenses net of fee waivers, if any | .00% | .00% | .01% | .00%A |
Expenses net of all reductions | .00% | .00% | .01% | .00%A |
Net investment income (loss) | 1.92% | 1.98% | 2.71% | 2.44%A |
Supplemental Data | | | | |
Net assets, end of period (000 omitted) | $ 107 | $ 94 | $ 108 | $ 95 |
Portfolio turnover rate | 39% | 22% | 46% | 12%A |
A Annualized
B Total returns for periods of less than one year are not annualized.
C Total returns would have been lower if certain expenses had not been reduced during the applicable periods shown.
D Calculated based on average shares outstanding during the period.
E Amounts do not include the activity of the underlying funds.
F Amount represents less than .01%.
G For the period August 30, 2007 (commencement of operations) to July 31, 2008.
H Expense ratios reflect operating expenses of the class. Expenses before reductions do not reflect amounts reimbursed by the investment adviser or reductions from expense offset arrangements and do not represent the amount paid by the class during periods when reimbursements or reductions occur. Expenses net of fee waivers reflect expenses after reimbursement by the investment adviser but prior to reductions from expense offset arrangements. Expenses net of all reductions represent the net expenses paid by the class but do not include expenses of the investment companies in which the Fund invests.
See accompanying notes which are an integral part of the financial statements.
Annual Report
Fidelity Income Replacement 2036 Fund
Investment Changes (Unaudited)
Fund Holdings as of July 31, 2011 |
| % of fund's
net assets | % of fund's net assets
6 months ago |
Domestic Equity Funds | | |
Fidelity Advisor Mid Cap II Fund Institutional Class | 5.6 | 5.7 |
Fidelity Disciplined Equity Fund | 5.8 | 6.0 |
Fidelity Equity-Income Fund | 5.8 | 6.0 |
Fidelity Large Cap Core Enhanced Index Fund | 9.5 | 9.6 |
Fidelity Series 100 Index Fund | 7.2 | 7.2 |
Fidelity Series Broad Market Opportunities Fund | 9.4 | 9.5 |
Fidelity Series Small Cap Opportunities Fund | 3.7 | 3.8 |
| 47.0 | 47.8 |
International Equity Funds | | |
Fidelity Advisor International Discovery Fund Institutional Class | 10.3 | 10.4 |
High Yield Fixed-Income Funds | | |
Fidelity Capital & Income Fund | 2.9 | 2.9 |
Fidelity Strategic Income Fund | 2.9 | 2.8 |
| 5.8 | 5.7 |
Investment Grade Fixed-Income Funds | | |
Fidelity Government Income Fund | 5.4 | 5.4 |
Fidelity Strategic Real Return Fund | 5.4 | 5.3 |
Fidelity Total Bond Fund | 16.3 | 16.0 |
| 27.1 | 26.7 |
Short-Term Funds | | |
Fidelity Institutional Money Market Portfolio Institutional Class | 4.9 | 4.7 |
Fidelity Short-Term Bond Fund | 4.9 | 4.7 |
| 9.8 | 9.4 |
Net Other Assets (Liabilities)* | 0.0 | 0.0 |
| 100.0 | 100.0 |
* Amount represents less than 0.1% |
Asset Allocation (% of fund's net assets) |
Current |
| Domestic Equity Funds | 47.0% | |
| International Equity Funds | 10.3% | |
| High Yield
Fixed-Income Funds | 5.8% | |
| Investment Grade Fixed-Income Funds | 27.1% | |
| Short-Term Funds | 9.8% | |

Six months ago |
| Domestic Equity Funds | 47.8% | |
| International Equity Funds | 10.4% | |
| High Yield
Fixed-Income Funds | 5.7% | |
| Investment Grade Fixed-Income Funds | 26.7% | |
| Short-Term Funds | 9.4% | |

Expected |
| Domestic Equity Funds | 47.2% | |
| International Equity Funds | 10.0% | |
| High Yield
Fixed-Income Funds | 5.6% | |
| Investment Grade Fixed-Income Funds | 27.0% | |
| Short-Term Funds | 10.2% | |

The fund invests according to an asset allocation strategy that becomes increasingly conservative over time. The six months ago allocation is based on the fund's holdings as of January 31, 2011. The current allocation is based on the fund's holdings as of July 31, 2011. The expected allocation represents the fund's anticipated allocation at January 31, 2012. |
Annual Report
Fidelity Income Replacement 2036 Fund
Investments July 31, 2011
Showing Percentage of Net Assets
Equity Funds - 57.3% |
| Shares | | Value |
Domestic Equity Funds - 47.0% |
Fidelity Advisor Mid Cap II Fund Institutional Class (a) | 9,279 | | $ 168,225 |
Fidelity Disciplined Equity Fund | 7,538 | | 175,492 |
Fidelity Equity-Income Fund | 3,902 | | 173,114 |
Fidelity Large Cap Core Enhanced Index Fund | 31,736 | | 284,669 |
Fidelity Series 100 Index Fund | 23,697 | | 214,461 |
Fidelity Series Broad Market Opportunities Fund | 27,293 | | 281,115 |
Fidelity Series Small Cap Opportunities Fund | 9,947 | | 111,604 |
TOTAL DOMESTIC EQUITY FUNDS | | 1,408,680 |
International Equity Funds - 10.3% |
Fidelity Advisor International Discovery Fund Institutional Class | 9,198 | | 309,320 |
TOTAL EQUITY FUNDS (Cost $1,739,063) | 1,718,000 |
Fixed-Income Funds - 32.9% |
| | | |
High Yield Fixed-Income Funds - 5.8% |
Fidelity Capital & Income Fund | 8,916 | | 85,326 |
Fidelity Strategic Income Fund | 7,702 | | 87,653 |
TOTAL HIGH YIELD FIXED-INCOME FUNDS | | 172,979 |
|
| Shares | | Value |
Investment Grade Fixed-Income Funds - 27.1% |
Fidelity Government Income Fund | 15,232 | | $ 162,680 |
Fidelity Strategic Real Return Fund | 16,331 | | 162,335 |
Fidelity Total Bond Fund | 44,194 | | 486,575 |
TOTAL INVESTMENT GRADE FIXED-INCOME FUNDS | | 811,590 |
TOTAL FIXED-INCOME FUNDS (Cost $961,707) | 984,569 |
Short-Term Funds - 9.8% |
| | | |
Fidelity Institutional Money Market Portfolio Institutional Class | 146,429 | | 146,429 |
Fidelity Short-Term Bond Fund | 17,244 | | 147,265 |
TOTAL SHORT-TERM FUNDS (Cost $293,013) | 293,694 |
TOTAL INVESTMENT PORTFOLIO - 100.0% (Cost $2,993,783) | | 2,996,263 |
NET OTHER ASSETS (LIABILITIES) - 0.0% | | (248) |
NET ASSETS - 100% | $ 2,996,015 |
Legend |
(a) Non-income producing |
Other Information |
All investments are categorized as Level 1 under the Fair Value Hierarchy. The inputs or methodology used for valuing securities may not be an indication of the risk associated with investing in those securities. For more information on valuation inputs, please refer to the Security Valuation section in the accompanying Notes to Financial Statements. |
Income Tax Information |
At July 31, 2011, the Fund had a capital loss carryforward of approximately $206,608 of which $19,968, $183,763 and $2,877 will expire in fiscal 2017, 2018 and 2019, respectively. Capital loss carryforwards are only available to offset future capital gains of the Fund to the extent provided by regulations and may be limited. |
See accompanying notes which are an integral part of the financial statements.
Annual Report
Fidelity Income Replacement 2036 Fund
Statement of Assets and Liabilities
| July 31, 2011 |
| | |
Assets | | |
Investment in securities, at value (cost $2,993,783) - See accompanying schedule | | $ 2,996,263 |
Cash | | 75 |
Total assets | | 2,996,338 |
| | |
Liabilities | | |
Payable for investments purchased | $ 6 | |
Distribution and service plan fees payable | 317 | |
Total liabilities | | 323 |
| | |
Net Assets | | $ 2,996,015 |
Net Assets consist of: | | |
Paid in capital | | $ 3,215,676 |
Undistributed net investment income | | 528 |
Accumulated undistributed net realized gain (loss) on investments | | (222,669) |
Net unrealized appreciation (depreciation) on investments | | 2,480 |
Net Assets | | $ 2,996,015 |
| | |
Calculation of Maximum Offering Price Class A:
Net Asset Value and redemption price per share ($31,272 ÷ 639.31 shares) | | $ 48.92 |
| | |
Maximum offering price per share (100/94.25 of $48.92) | | $ 51.90 |
| | |
Class T:
Net Asset Value and redemption price per share ($287,732 ÷ 5,884.83 shares) | | $ 48.89 |
| | |
Maximum offering price per share (100/96.50 of $48.89) | | $ 50.66 |
| | |
Class C:
Net Asset Value and offering price per share ($215,963 ÷ 4,417.96 shares)A | | $ 48.88 |
| | |
Income Replacement 2036:
Net Asset Value, offering price and redemption price per share ($2,433,382 ÷ 49,755.66 shares) | | $ 48.91 |
| | |
Institutional Class:
Net Asset Value, offering price and redemption price per share ($27,666 ÷ 565.71 shares) | | $ 48.90 |
A Redemption price per share is equal to net asset value less any applicable contingent deferred sales charge.
Statement of Operations
| Year ended July 31, 2011 |
| | |
Investment Income | | |
Income distributions from underlying funds | | $ 37,375 |
| | |
Expenses | | |
Distribution and service plan fees | $ 2,913 | |
Independent trustees' compensation | 6 | |
Total expenses before reductions | 2,919 | |
Expense reductions | (6) | 2,913 |
Net investment income (loss) | | 34,462 |
Realized and Unrealized Gain (Loss) Realized gain (loss) on sale of underlying fund shares | 16,103 | |
Capital gain distributions from underlying funds | 9,107 | |
Total net realized gain (loss) | | 25,210 |
Change in net unrealized appreciation (depreciation) on underlying funds | | 122,897 |
Net gain (loss) | | 148,107 |
Net increase (decrease) in net assets resulting from operations | | $ 182,569 |
See accompanying notes which are an integral part of the financial statements.
Annual Report
Statement of Changes in Net Assets
| Year ended
July 31, 2011 | Year ended
July 31, 2010 |
Increase (Decrease) in Net Assets | | |
Operations | | |
Net investment income (loss) | $ 34,462 | $ 19,710 |
Net realized gain (loss) | 25,210 | (40,612) |
Change in net unrealized appreciation (depreciation) | 122,897 | 163,539 |
Net increase (decrease) in net assets resulting from operations | 182,569 | 142,637 |
Distributions to shareholders from net investment income | (34,152) | (19,743) |
Distributions to shareholders from net realized gain | (6,329) | (3,949) |
Total distributions | (40,481) | (23,692) |
Share transactions - net increase (decrease) | 1,729,093 | (128,803) |
Total increase (decrease) in net assets | 1,871,181 | (9,858) |
| | |
Net Assets | | |
Beginning of period | 1,124,834 | 1,134,692 |
End of period (including undistributed net investment income of $528 and undistributed net investment income of $253, respectively) | $ 2,996,015 | $ 1,124,834 |
Financial Highlights - Class A
Years ended July 31, | 2011 | 2010 | 2009 | 2008G |
Selected Per-Share Data | | | | |
Net asset value, beginning of period | $ 43.73 | $ 39.70 | $ 46.40 | $ 50.00 |
Income from Investment Operations | | | | |
Net investment income (loss)E | .811 | .748 | .937 | .951 |
Net realized and unrealized gain (loss) | 5.306 | 4.178 | (6.127) | (3.464) |
Total from investment operations | 6.117 | 4.926 | (5.190) | (2.513) |
Distributions from net investment income | (.771) | (.752) | (.940) | (.897) |
Distributions from net realized gain | (.156) | (.144) | (.570) | (.190) |
Total distributions | (.927) | (.896) | (1.510) | (1.087) |
Net asset value, end of period | $ 48.92 | $ 43.73 | $ 39.70 | $ 46.40 |
Total ReturnB,C,D | 14.05% | 12.46% | (10.72)% | (5.17)% |
Ratios to Average Net AssetsF,H | | | | |
Expenses before reductions | .25% | .25% | .25% | .25%A |
Expenses net of fee waivers, if any | .25% | .25% | .25% | .25%A |
Expenses net of all reductions | .25% | .25% | .25% | .25%A |
Net investment income (loss) | 1.70% | 1.74% | 2.52% | 2.08%A |
Supplemental Data | | | | |
Net assets, end of period (000 omitted) | $ 31 | $ 40 | $ 54 | $ 95 |
Portfolio turnover rate | 19% | 26% | 39% | 44%A |
A Annualized
B Total returns for periods of less than one year are not annualized.
C Total returns would have been lower if certain expenses had not been reduced during the applicable periods shown.
D Total returns do not include the effect of the sales charges.
E Calculated based on average shares outstanding during the period.
F Amounts do not include the activity of the underlying funds.
G For the period August 30, 2007 (commencement of operations) to July 31, 2008.
H Expense ratios reflect operating expenses of the class. Expenses before reductions do not reflect amounts reimbursed by the investment adviser or reductions from expense offset arrangements and do not represent the amount paid by the class during periods when reimbursements or reductions occur. Expenses net of fee waivers reflect expenses after reimbursement by the investment adviser but prior to reductions from expense offset arrangements. Expenses net of all reductions represent the net expenses paid by the class but do not include expenses of the investment companies in which the Fund invests.
See accompanying notes which are an integral part of the financial statements.
Annual Report
Financial Highlights - Class T
Years ended July 31, | 2011 | 2010 | 2009 | 2008G |
Selected Per-Share Data | | | | |
Net asset value, beginning of period | $ 43.72 | $ 39.69 | $ 46.39 | $ 50.00 |
Income from Investment Operations | | | | |
Net investment income (loss)E | .693 | .639 | .844 | .823 |
Net realized and unrealized gain (loss) | 5.287 | 4.183 | (6.122) | (3.449) |
Total from investment operations | 5.980 | 4.822 | (5.278) | (2.626) |
Distributions from net investment income | (.654) | (.648) | (.852) | (.794) |
Distributions from net realized gain | (.156) | (.144) | (.570) | (.190) |
Total distributions | (.810) | (.792) | (1.422) | (.984) |
Net asset value, end of period | $ 48.89 | $ 43.72 | $ 39.69 | $ 46.39 |
Total ReturnB,C,D | 13.73% | 12.19% | (10.93)% | (5.39)% |
Ratios to Average Net AssetsF,H | | | | |
Expenses before reductions | .50% | .50% | .50% | .50%A |
Expenses net of fee waivers, if any | .50% | .50% | .50% | .50%A |
Expenses net of all reductions | .50% | .50% | .50% | .50%A |
Net investment income (loss) | 1.45% | 1.49% | 2.28% | 1.83%A |
Supplemental Data | | | | |
Net assets, end of period (000 omitted) | $ 288 | $ 265 | $ 265 | $ 384 |
Portfolio turnover rate | 19% | 26% | 39% | 44%A |
A Annualized
B Total returns for periods of less than one year are not annualized.
C Total returns would have been lower if certain expenses had not been reduced during the applicable periods shown.
D Total returns do not include the effect of the sales charges.
E Calculated based on average shares outstanding during the period.
F Amounts do not include the activity of the underlying funds.
G For the period August 30, 2007 (commencement of operations) to July 31, 2008.
H Expense ratios reflect operating expenses of the class. Expenses before reductions do not reflect amounts reimbursed by the investment adviser or reductions from expense offset arrangements and do not represent the amount paid by the class during periods when reimbursements or reductions occur. Expenses net of fee waivers reflect expenses after reimbursement by the investment adviser but prior to reductions from expense offset arrangements. Expenses net of all reductions represent the net expenses paid by the class but do not include expenses of the investment companies in which the Fund invests.
Financial Highlights - Class C
Years ended July 31, | 2011 | 2010 | 2009 | 2008G |
Selected Per-Share Data | | | | |
Net asset value, beginning of period | $ 43.74 | $ 39.71 | $ 46.39 | $ 50.00 |
Income from Investment Operations | | | | |
Net investment income (loss)E | .454 | .424 | .655 | .609 |
Net realized and unrealized gain (loss) | 5.293 | 4.179 | (6.114) | (3.465) |
Total from investment operations | 5.747 | 4.603 | (5.459) | (2.856) |
Distributions from net investment income | (.451) | (.429) | (.651) | (.564) |
Distributions from net realized gain | (.156) | (.144) | (.570) | (.190) |
Total distributions | (.607) | (.573) | (1.221) | (.754) |
Net asset value, end of period | $ 48.88 | $ 43.74 | $ 39.71 | $ 46.39 |
Total ReturnB,C,D | 13.17% | 11.61% | (11.38)% | (5.82)% |
Ratios to Average Net AssetsF,H | | | | |
Expenses before reductions | 1.00% | 1.00% | 1.00% | 1.00%A |
Expenses net of fee waivers, if any | 1.00% | 1.00% | 1.00% | 1.00%A |
Expenses net of all reductions | 1.00% | 1.00% | 1.00% | 1.00%A |
Net investment income (loss) | .95% | .99% | 1.77% | 1.33%A |
Supplemental Data | | | | |
Net assets, end of period (000 omitted) | $ 216 | $ 119 | $ 116 | $ 94 |
Portfolio turnover rate | 19% | 26% | 39% | 44%A |
A Annualized
B Total returns for periods of less than one year are not annualized.
C Total returns would have been lower if certain expenses had not been reduced during the applicable periods shown.
D Total returns do not include the effect of the contingent deferred sales charge.
E Calculated based on average shares outstanding during the period.
F Amounts do not include the activity of the underlying funds.
G For the period August 30, 2007 (commencement of operations) to July 31, 2008.
H Expense ratios reflect operating expenses of the class. Expenses before reductions do not reflect amounts reimbursed by the investment adviser or reductions from expense offset arrangements and do not represent the amount paid by the class during periods when reimbursements or reductions occur. Expenses net of fee waivers reflect expenses after reimbursement by the investment adviser but prior to reductions from expense offset arrangements. Expenses net of all reductions represent the net expenses paid by the class but do not include expenses of the investment companies in which the Fund invests.
See accompanying notes which are an integral part of the financial statements.
Annual Report
Financial Highlights - Income Replacement 2036
Years ended July 31, | 2011 | 2010 | 2009 | 2008G |
Selected Per-Share Data | | | | |
Net asset value, beginning of period | $ 43.73 | $ 39.70 | $ 46.40 | $ 50.00 |
Income from Investment Operations | | | | |
Net investment income (loss)D | .939 | .854 | 1.034 | 1.043 |
Net realized and unrealized gain (loss) | 5.291 | 4.183 | (6.126) | (3.445) |
Total from investment operations | 6.230 | 5.037 | (5.092) | (2.402) |
Distributions from net investment income | (.894) | (.863) | (1.038) | (1.008) |
Distributions from net realized gain | (.156) | (.144) | (.570) | (.190) |
Total distributions | (1.050) | (1.007) | (1.608) | (1.198) |
Net asset value, end of period | $ 48.91 | $ 43.73 | $ 39.70 | $ 46.40 |
Total ReturnB,C | 14.32% | 12.75% | (10.48)% | (4.96)% |
Ratios to Average Net AssetsE,H | | | | |
Expenses before reductionsF | .00% | .00% | .00% | .00%A |
Expenses net of fee waivers, if any | .00% | .00% | .00% | .00%A |
Expenses net of all reductions | .00% | .00% | .00% | .00%A |
Net investment income (loss) | 1.95% | 1.99% | 2.78% | 2.33%A |
Supplemental Data | | | | |
Net assets, end of period (000 omitted) | $ 2,433 | $ 598 | $ 632 | $ 986 |
Portfolio turnover rate | 19% | 26% | 39% | 44%A |
A Annualized
B Total returns for periods of less than one year are not annualized.
C Total returns would have been lower if certain expenses had not been reduced during the applicable periods shown.
D Calculated based on average shares outstanding during the period.
E Amounts do not include the activity of the underlying funds.
F Amount represents less than .01%.
G For the period August 30, 2007 (commencement of operations) to July 31, 2008.
H Expense ratios reflect operating expenses of the class. Expenses before reductions do not reflect amounts reimbursed by the investment adviser or reductions from expense offset arrangements and do not represent the amount paid by the class during periods when reimbursements or reductions occur. Expenses net of fee waivers reflect expenses after reimbursement by the investment adviser but prior to reductions from expense offset arrangements. Expenses net of all reductions represent the net expenses paid by the class but do not include expenses of the investment companies in which the Fund invests.
Financial Highlights - Institutional Class
Years ended July 31, | 2011 | 2010 | 2009 | 2008G |
Selected Per-Share Data | | | | |
Net asset value, beginning of period | $ 43.73 | $ 39.70 | $ 46.40 | $ 50.00 |
Income from Investment Operations | | | | |
Net investment income (loss)D | .929 | .851 | 1.031 | 1.064 |
Net realized and unrealized gain (loss) | 5.291 | 4.186 | (6.123) | (3.466) |
Total from investment operations | 6.220 | 5.037 | (5.092) | (2.402) |
Distributions from net investment income | (.894) | (.863) | (1.038) | (1.008) |
Distributions from net realized gain | (.156) | (.144) | (.570) | (.190) |
Total distributions | (1.050) | (1.007) | (1.608) | (1.198) |
Net asset value, end of period | $ 48.90 | $ 43.73 | $ 39.70 | $ 46.40 |
Total ReturnB,C | 14.30% | 12.75% | (10.48)% | (4.96)% |
Ratios to Average Net AssetsE,H | | | | |
Expenses before reductionsF | .00% | .00% | .00% | .00%A |
Expenses net of fee waivers, if any | .00% | .00% | .00% | .00%A |
Expenses net of all reductions | .00% | .00% | .00% | .00%A |
Net investment income (loss) | 1.95% | 1.99% | 2.78% | 2.33%A |
Supplemental Data | | | | |
Net assets, end of period (000 omitted) | $ 28 | $ 103 | $ 67 | $ 119 |
Portfolio turnover rate | 19% | 26% | 39% | 44%A |
A Annualized
B Total returns for periods of less than one year are not annualized.
C Total returns would have been lower if certain expenses had not been reduced during the applicable periods shown.
D Calculated based on average shares outstanding during the period.
E Amounts do not include the activity of the underlying funds.
F Amount represents less than .01%.
G For the period August 30, 2007 (commencement of operations) to July 31, 2008.
H Expense ratios reflect operating expenses of the class. Expenses before reductions do not reflect amounts reimbursed by the investment adviser or reductions from expense offset arrangements and do not represent the amount paid by the class during periods when reimbursements or reductions occur. Expenses net of fee waivers reflect expenses after reimbursement by the investment adviser but prior to reductions from expense offset arrangements. Expenses net of all reductions represent the net expenses paid by the class but do not include expenses of the investment companies in which the Fund invests.
See accompanying notes which are an integral part of the financial statements.
Annual Report
Fidelity Income Replacement 2038 Fund
Investment Changes (Unaudited)
Fund Holdings as of July 31, 2011 |
| % of fund's
net assets | % of fund's net assets
6 months ago |
Domestic Equity Funds | | |
Fidelity Advisor Mid Cap II Fund Institutional Class | 5.8 | 5.9 |
Fidelity Disciplined Equity Fund | 6.0 | 6.1 |
Fidelity Equity-Income Fund | 5.9 | 6.1 |
Fidelity Large Cap Core Enhanced Index Fund | 9.8 | 9.8 |
Fidelity Series 100 Index Fund | 7.4 | 7.3 |
Fidelity Series Broad Market Opportunities Fund | 9.6 | 9.8 |
Fidelity Series Small Cap Opportunities Fund | 3.8 | 3.9 |
| 48.3 | 48.9 |
International Equity Funds | | |
Fidelity Advisor International Discovery Fund Institutional Class | 11.3 | 11.4 |
High Yield Fixed-Income Funds | | |
Fidelity Capital & Income Fund | 3.0 | 3.1 |
Fidelity Strategic Income Fund | 3.1 | 3.0 |
| 6.1 | 6.1 |
Investment Grade Fixed-Income Funds | | |
Fidelity Government Income Fund | 5.3 | 5.2 |
Fidelity Strategic Real Return Fund | 5.3 | 5.3 |
Fidelity Total Bond Fund | 16.0 | 15.8 |
| 26.6 | 26.3 |
Short-Term Funds | | |
Fidelity Institutional Money Market Portfolio Institutional Class | 3.8 | 3.7 |
Fidelity Short-Term Bond Fund | 3.9 | 3.6 |
| 7.7 | 7.3 |
Net Other Assets (Liabilities)* | 0.0 | 0.0 |
| 100.0 | 100.0 |
* Amount represents less than 0.1% |
Asset Allocation (% of fund's net assets) |
Current |
| Domestic Equity Funds | 48.3% | |
| International Equity Funds | 11.3% | |
| High Yield
Fixed-Income Funds | 6.1% | |
| Investment Grade Fixed-Income Funds | 26.6% | |
| Short-Term Funds | 7.7% | |

Six months ago |
| Domestic Equity Funds | 48.9% | |
| International Equity Funds | 11.4% | |
| High Yield
Fixed-Income Funds | 6.1% | |
| Investment Grade Fixed-Income Funds | 26.3% | |
| Short-Term Funds | 7.3% | |

Expected |
| Domestic Equity Funds | 48.3% | |
| International Equity Funds | 10.9% | |
| High Yield
Fixed-Income Funds | 5.9% | |
| Investment Grade Fixed-Income Funds | 26.5% | |
| Short-Term Funds | 8.4% | |

The fund invests according to an asset allocation strategy that becomes increasingly conservative over time. The six months ago allocation is based on the fund's holdings as of January 31, 2011. The current allocation is based on the fund's holdings as of July 31, 2011. The expected allocation represents the fund's anticipated allocation at January 31, 2012. |
Annual Report
Fidelity Income Replacement 2038 Fund
Investments July 31, 2011
Showing Percentage of Net Assets
Equity Funds - 59.6% |
| Shares | | Value |
Domestic Equity Funds - 48.3% |
Fidelity Advisor Mid Cap II Fund Institutional Class (a) | 5,118 | | $ 92,788 |
Fidelity Disciplined Equity Fund | 4,153 | | 96,677 |
Fidelity Equity-Income Fund | 2,150 | | 95,389 |
Fidelity Large Cap Core Enhanced Index Fund | 17,538 | | 157,316 |
Fidelity Series 100 Index Fund | 13,075 | | 118,326 |
Fidelity Series Broad Market Opportunities Fund | 15,054 | | 155,053 |
Fidelity Series Small Cap Opportunities Fund | 5,489 | | 61,591 |
TOTAL DOMESTIC EQUITY FUNDS | | 777,140 |
International Equity Funds - 11.3% |
Fidelity Advisor International Discovery Fund Institutional Class | 5,379 | | 180,901 |
TOTAL EQUITY FUNDS (Cost $762,757) | 958,041 |
Fixed-Income Funds - 32.7% |
| | | |
High Yield Fixed-Income Funds - 6.1% |
Fidelity Capital & Income Fund | 5,041 | | 48,246 |
Fidelity Strategic Income Fund | 4,364 | | 49,666 |
TOTAL HIGH YIELD FIXED-INCOME FUNDS | | 97,912 |
|
| Shares | | Value |
Investment Grade Fixed-Income Funds - 26.6% |
Fidelity Government Income Fund | 8,023 | | $ 85,688 |
Fidelity Strategic Real Return Fund | 8,598 | | 85,464 |
Fidelity Total Bond Fund | 23,309 | | 256,630 |
TOTAL INVESTMENT GRADE FIXED-INCOME FUNDS | | 427,782 |
TOTAL FIXED-INCOME FUNDS (Cost $476,587) | 525,694 |
Short-Term Funds - 7.7% |
| | | |
Fidelity Institutional Money Market Portfolio Institutional Class | 61,645 | | 61,645 |
Fidelity Short-Term Bond Fund | 7,264 | | 62,037 |
TOTAL SHORT-TERM FUNDS (Cost $121,635) | 123,682 |
TOTAL INVESTMENT PORTFOLIO - 100.0% (Cost $1,360,979) | | 1,607,417 |
NET OTHER ASSETS (LIABILITIES) - 0.0% | | (84) |
NET ASSETS - 100% | $ 1,607,333 |
Legend |
(a) Non-income producing |
Other Information |
All investments are categorized as Level 1 under the Fair Value Hierarchy. The inputs or methodology used for valuing securities may not be an indication of the risk associated with investing in those securities. For more information on valuation inputs, please refer to the Security Valuation section in the accompanying Notes to Financial Statements. |
Income Tax Information |
At July 31, 2011, the Fund had a capital loss carryforward of approximately $60,057 of which $11,570 and $48,487 will expire in fiscal 2018 and 2019, respectively. Capital loss carryforwards are only available to offset future capital gains of the Fund to the extent provided by regulations and may be limited. |
The Fund intends to elect to defer to its fiscal year ending July 31, 2012 approximately $18,954 of losses recognized during the period November 1, 2010 to July 31, 2011. |
See accompanying notes which are an integral part of the financial statements.
Annual Report
Fidelity Income Replacement 2038 Fund
Statement of Assets and Liabilities
| July 31, 2011 |
| | |
Assets | | |
Investment in securities, at value (cost $1,360,979) - See accompanying schedule | | $ 1,607,417 |
Cash | | 39 |
Total assets | | 1,607,456 |
| | |
Liabilities | | |
Distribution and service plan fees payable | | 123 |
| | |
Net Assets | | $ 1,607,333 |
Net Assets consist of: | | |
Paid in capital | | $ 1,455,086 |
Undistributed net investment income | | 293 |
Accumulated undistributed net realized gain (loss) on investments | | (94,484) |
Net unrealized appreciation (depreciation) on investments | | 246,438 |
Net Assets | | $ 1,607,333 |
| | |
Calculation of Maximum Offering Price Class A:
Net Asset Value and redemption price per share ($34,321 ÷ 712.14 shares) | | $ 48.19 |
| | |
Maximum offering price per share (100/94.25 of $48.19) | | $ 51.13 |
| | |
Class T:
Net Asset Value and redemption price per share ($126,704 ÷ 2,629.50 shares) | | $ 48.19 |
| | |
Maximum offering price per share (100/96.50 of $48.19) | | $ 49.94 |
| | |
Class C:
Net Asset Value and offering price per share ($72,462 ÷ 1,504.20 shares)A | | $ 48.17 |
| | |
Income Replacement 2038:
Net Asset Value, offering price and redemption price per share ($1,344,885 ÷ 27,907.21 shares) | | $ 48.19 |
| | |
Institutional Class:
Net Asset Value, offering price and redemption price per share ($28,961 ÷ 601.00 shares) | | $ 48.19 |
A Redemption price per share is equal to net asset value less any applicable contingent deferred sales charge.
Statement of Operations
| Year ended July 31, 2011 |
| | |
Investment Income | | |
Income distributions from underlying funds | | $ 40,965 |
| | |
Expenses | | |
Distribution and service plan fees | $ 1,096 | |
Independent trustees' compensation | 7 | |
Total expenses before reductions | 1,103 | |
Expense reductions | (7) | 1,096 |
Net investment income (loss) | | 39,869 |
Realized and Unrealized Gain (Loss) Realized gain (loss) on sale of underlying fund shares | (24,408) | |
Capital gain distributions from underlying funds | 13,137 | |
Total net realized gain (loss) | | (11,271) |
Change in net unrealized appreciation (depreciation) on underlying funds | | 277,762 |
Net gain (loss) | | 266,491 |
Net increase (decrease) in net assets resulting from operations | | $ 306,360 |
See accompanying notes which are an integral part of the financial statements.
Annual Report
Fidelity Income Replacement 2038 Fund
Financial Statements - continued
Statement of Changes in Net Assets
| Year ended
July 31, 2011 | Year ended
July 31, 2010 |
Increase (Decrease) in Net Assets | | |
Operations | | |
Net investment income (loss) | $ 39,869 | $ 44,672 |
Net realized gain (loss) | (11,271) | (45,293) |
Change in net unrealized appreciation (depreciation) | 277,762 | 254,403 |
Net increase (decrease) in net assets resulting from operations | 306,360 | 253,782 |
Distributions to shareholders from net investment income | (40,181) | (44,437) |
Distributions to shareholders from net realized gain | (9,861) | (9,084) |
Total distributions | (50,042) | (53,521) |
Share transactions - net increase (decrease) | (897,193) | 597,064 |
Total increase (decrease) in net assets | (640,875) | 797,325 |
| | |
Net Assets | | |
Beginning of period | 2,248,208 | 1,450,883 |
End of period (including undistributed net investment income of $293 and undistributed net investment income of $618, respectively) | $ 1,607,333 | $ 2,248,208 |
Financial Highlights - Class A
Years ended July 31, | 2011 | 2010 | 2009 | 2008G |
Selected Per-Share Data | | | | |
Net asset value, beginning of period | $ 43.01 | $ 38.95 | $ 45.26 | $ 50.00 |
Income from Investment Operations | | | | |
Net investment income (loss)E | .858 | .744 | .856 | .442 |
Net realized and unrealized gain (loss) | 5.317 | 4.191 | (6.093) | (4.811) |
Total from investment operations | 6.175 | 4.935 | (5.237) | (4.369) |
Distributions from net investment income | (.802) | (.710) | (.873) | (.371) |
Distributions from net realized gain | (.193) | (.165) | (.200) | - |
Total distributions | (.995) | (.875) | (1.073) | (.371) |
Net asset value, end of period | $ 48.19 | $ 43.01 | $ 38.95 | $ 45.26 |
Total ReturnB,C,D | 14.43% | 12.72% | (11.24)% | (8.76)% |
Ratios to Average Net AssetsF,H | | | | |
Expenses before reductions | .25% | .25% | .25% | .25%A |
Expenses net of fee waivers, if any | .25% | .25% | .25% | .25%A |
Expenses net of all reductions | .25% | .25% | .25% | .25%A |
Net investment income (loss) | 1.82% | 1.76% | 2.44% | 1.59%A |
Supplemental Data | | | | |
Net assets, end of period (000 omitted) | $ 34 | $ 32 | $ 115 | $ 91 |
Portfolio turnover rate | 19% | 23% | 41% | 13%A |
A Annualized
B Total returns for periods of less than one year are not annualized.
C Total returns would have been lower if certain expenses had not been reduced during the applicable periods shown.
D Total returns do not include the effect of the sales charges.
E Calculated based on average shares outstanding during the period.
F Amounts do not include the activity of the underlying funds.
G For the period December 31, 2007 (commencement of operations) to July 31, 2008.
H Expense ratios reflect operating expenses of the class. Expenses before reductions do not reflect amounts reimbursed by the investment adviser or reductions from expense offset arrangements and do not represent the amount paid by the class during periods when reimbursements or reductions occur. Expenses net of fee waivers reflect expenses after reimbursement by the investment adviser but prior to reductions from expense offset arrangements. Expenses net of all reductions represent the net expenses paid by the class but do not include expenses of the investment companies in which the Fund invests.
See accompanying notes which are an integral part of the financial statements.
Annual Report
Financial Highlights - Class T
Years ended July 31, | 2011 | 2010 | 2009 | 2008G |
Selected Per-Share Data | | | | |
Net asset value, beginning of period | $ 43.01 | $ 38.96 | $ 45.26 | $ 50.00 |
Income from Investment Operations | | | | |
Net investment income (loss)E | .736 | .636 | .791 | .373 |
Net realized and unrealized gain (loss) | 5.326 | 4.191 | (6.111) | (4.809) |
Total from investment operations | 6.062 | 4.827 | (5.320) | (4.436) |
Distributions from net investment income | (.689) | (.612) | (.780) | (.304) |
Distributions from net realized gain | (.193) | (.165) | (.200) | - |
Total distributions | (.882) | (.777) | (.980) | (.304) |
Net asset value, end of period | $ 48.19 | $ 43.01 | $ 38.96 | $ 45.26 |
Total ReturnB,C,D | 14.15% | 12.43% | (11.45)% | (8.89)% |
Ratios to Average Net AssetsF,H | | | | |
Expenses before reductions | .50% | .50% | .50% | .50%A |
Expenses net of fee waivers, if any | .50% | .50% | .50% | .50%A |
Expenses net of all reductions | .50% | .50% | .50% | .50%A |
Net investment income (loss) | 1.57% | 1.50% | 2.20% | 1.34%A |
Supplemental Data | | | | |
Net assets, end of period (000 omitted) | $ 127 | $ 37 | $ 57 | $ 91 |
Portfolio turnover rate | 19% | 23% | 41% | 13%A |
A Annualized
B Total returns for periods of less than one year are not annualized.
C Total returns would have been lower if certain expenses had not been reduced during the applicable periods shown.
D Total returns do not include the effect of the sales charges.
E Calculated based on average shares outstanding during the period.
F Amounts do not include the activity of the underlying funds.
G For the period December 31, 2007 (commencement of operations) to July 31, 2008.
H Expense ratios reflect operating expenses of the class. Expenses before reductions do not reflect amounts reimbursed by the investment adviser or reductions from expense offset arrangements and do not represent the amount paid by the class during periods when reimbursements or reductions occur. Expenses net of fee waivers reflect expenses after reimbursement by the investment adviser but prior to reductions from expense offset arrangements. Expenses net of all reductions represent the net expenses paid by the class but do not include expenses of the investment companies in which the Fund invests.
Financial Highlights - Class C
Years ended July 31, | 2011 | 2010 | 2009 | 2008G |
Selected Per-Share Data | | | | |
Net asset value, beginning of period | $ 42.98 | $ 38.95 | $ 45.24 | $ 50.00 |
Income from Investment Operations | | | | |
Net investment income (loss)E | .505 | .424 | .611 | .233 |
Net realized and unrealized gain (loss) | 5.319 | 4.192 | (6.107) | (4.812) |
Total from investment operations | 5.824 | 4.616 | (5.496) | (4.579) |
Distributions from net investment income | (.441) | (.421) | (.594) | (.181) |
Distributions from net realized gain | (.193) | (.165) | (.200) | - |
Total distributions | (.634) | (.586) | (.794) | (.181) |
Net asset value, end of period | $ 48.17 | $ 42.98 | $ 38.95 | $ 45.24 |
Total ReturnB,C,D | 13.59% | 11.87% | (11.89)% | (9.17)% |
Ratios to Average Net AssetsF,H | | | | |
Expenses before reductions | 1.00% | 1.00% | 1.00% | 1.00%A |
Expenses net of fee waivers, if any | 1.00% | 1.00% | 1.00% | 1.00%A |
Expenses net of all reductions | 1.00% | 1.00% | 1.00% | 1.00%A |
Net investment income (loss) | 1.08% | 1.01% | 1.70% | .84%A |
Supplemental Data | | | | |
Net assets, end of period (000 omitted) | $ 72 | $ 91 | $ 57 | $ 91 |
Portfolio turnover rate | 19% | 23% | 41% | 13%A |
A Annualized
B Total returns for periods of less than one year are not annualized.
C Total returns would have been lower if certain expenses had not been reduced during the applicable periods shown.
D Total returns do not include the effect of the contingent deferred sales charge.
E Calculated based on average shares outstanding during the period.
F Amounts do not include the activity of the underlying funds.
G For the period December 31, 2007 (commencement of operations) to July 31, 2008.
H Expense ratios reflect operating expenses of the class. Expenses before reductions do not reflect amounts reimbursed by the investment adviser or reductions from expense offset arrangements and do not represent the amount paid by the class during periods when reimbursements or reductions occur. Expenses net of fee waivers reflect expenses after reimbursement by the investment adviser but prior to reductions from expense offset arrangements. Expenses net of all reductions represent the net expenses paid by the class but do not include expenses of the investment companies in which the Fund invests.
See accompanying notes which are an integral part of the financial statements.
Annual Report
Financial Highlights - Income Replacement 2038
Years ended July 31, | 2011 | 2010 | 2009 | 2008G |
Selected Per-Share Data | | | | |
Net asset value, beginning of period | $ 43.00 | $ 38.96 | $ 45.27 | $ 50.00 |
Income from Investment Operations | | | | |
Net investment income (loss)D | .969 | .849 | .965 | .502 |
Net realized and unrealized gain (loss) | 5.332 | 4.187 | (6.112) | (4.795) |
Total from investment operations | 6.301 | 5.036 | (5.147) | (4.293) |
Distributions from net investment income | (.918) | (.831) | (.963) | (.437) |
Distributions from net realized gain | (.193) | (.165) | (.200) | - |
Total distributions | (1.111) | (.996) | (1.163) | (.437) |
Net asset value, end of period | $ 48.19 | $ 43.00 | $ 38.96 | $ 45.27 |
Total ReturnB,C | 14.74% | 12.99% | (11.02)% | (8.61)% |
Ratios to Average Net AssetsE,H | | | | |
Expenses before reductionsF | .00% | .00% | .00% | .00%A |
Expenses net of fee waivers, if any | .00% | .00% | .00% | .00%A |
Expenses net of all reductions | .00% | .00% | .00% | .00%A |
Net investment income (loss) | 2.07% | 2.01% | 2.69% | 1.84%A |
Supplemental Data | | | | |
Net assets, end of period (000 omitted) | $ 1,345 | $ 2,051 | $ 1,165 | $ 1,122 |
Portfolio turnover rate | 19% | 23% | 41% | 13%A |
A Annualized
B Total returns for periods of less than one year are not annualized.
C Total returns would have been lower if certain expenses had not been reduced during the applicable periods shown.
D Calculated based on average shares outstanding during the period.
E Amounts do not include the activity of the underlying funds.
F Amount represents less than .01%.
G For the period December 31, 2007 (commencement of operations) to July 31, 2008.
H Expense ratios reflect operating expenses of the class. Expenses before reductions do not reflect amounts reimbursed by the investment adviser or reductions from expense offset arrangements and do not represent the amount paid by the class during periods when reimbursements or reductions occur. Expenses net of fee waivers reflect expenses after reimbursement by the investment adviser but prior to reductions from expense offset arrangements. Expenses net of all reductions represent the net expenses paid by the class but do not include expenses of the investment companies in which the Fund invests.
Financial Highlights - Institutional Class
Years ended July 31, | 2011 | 2010 | 2009 | 2008G |
Selected Per-Share Data | | | | |
Net asset value, beginning of period | $ 43.00 | $ 38.96 | $ 45.26 | $ 50.00 |
Income from Investment Operations | | | | |
Net investment income (loss)D | .973 | .848 | .974 | .511 |
Net realized and unrealized gain (loss) | 5.328 | 4.188 | (6.111) | (4.814) |
Total from investment operations | 6.301 | 5.036 | (5.137) | (4.303) |
Distributions from net investment income | (.918) | (.831) | (.963) | (.437) |
Distributions from net realized gain | (.193) | (.165) | (.200) | - |
Total distributions | (1.111) | (.996) | (1.163) | (.437) |
Net asset value, end of period | $ 48.19 | $ 43.00 | $ 38.96 | $ 45.26 |
Total ReturnB,C | 14.74% | 12.99% | (11.00)% | (8.63)% |
Ratios to Average Net AssetsE,H | | | | |
Expenses before reductionsF | .00% | .00% | .00% | .00%A |
Expenses net of fee waivers, if any | .00% | .00% | .00% | .00%A |
Expenses net of all reductions | .00% | .00% | .00% | .00%A |
Net investment income (loss) | 2.07% | 2.01% | 2.69% | 1.84%A |
Supplemental Data | | | | |
Net assets, end of period (000 omitted) | $ 29 | $ 38 | $ 58 | $ 91 |
Portfolio turnover rate | 19% | 23% | 41% | 13%A |
A Annualized
B Total returns for periods of less than one year are not annualized.
C Total returns would have been lower if certain expenses had not been reduced during the applicable periods shown.
D Calculated based on average shares outstanding during the period.
E Amounts do not include the activity of the underlying funds.
F Amount represents less than .01%.
G For the period December 31, 2007 (commencement of operations) to July 31, 2008.
H Expense ratios reflect operating expenses of the class. Expenses before reductions do not reflect amounts reimbursed by the investment adviser or reductions from expense offset arrangements and do not represent the amount paid by the class during periods when reimbursements or reductions occur. Expenses net of fee waivers reflect expenses after reimbursement by the investment adviser but prior to reductions from expense offset arrangements. Expenses net of all reductions represent the net expenses paid by the class but do not include expenses of the investment companies in which the Fund invests.
See accompanying notes which are an integral part of the financial statements.
Annual Report
Fidelity Income Replacement 2040 Fund
Investment Changes (Unaudited)
Fund Holdings as of July 31, 2011 |
| % of fund's
net assets | % of fund's net assets
6 months ago |
Domestic Equity Funds | | |
Fidelity Advisor Mid Cap II Fund Institutional Class | 5.9 | 6.0 |
Fidelity Disciplined Equity Fund | 6.2 | 6.3 |
Fidelity Equity-Income Fund | 6.1 | 6.3 |
Fidelity Large Cap Core Enhanced Index Fund | 10.0 | 10.1 |
Fidelity Series 100 Index Fund | 7.6 | 7.5 |
Fidelity Series Broad Market Opportunities Fund | 9.9 | 10.1 |
Fidelity Series Small Cap Opportunities Fund | 3.9 | 4.0 |
| 49.6 | 50.3 |
International Equity Funds | | |
Fidelity Advisor International Discovery Fund Institutional Class | 12.4 | 12.6 |
High Yield Fixed-Income Funds | | |
Fidelity Capital & Income Fund | 3.2 | 3.2 |
Fidelity Strategic Income Fund | 3.3 | 3.2 |
| 6.5 | 6.4 |
Investment Grade Fixed-Income Funds | | |
Fidelity Government Income Fund | 5.3 | 5.2 |
Fidelity Strategic Real Return Fund | 5.3 | 5.2 |
Fidelity Total Bond Fund | 15.9 | 15.7 |
| 26.5 | 26.1 |
Short-Term Funds | | |
Fidelity Institutional Money Market Portfolio Institutional Class | 2.5 | 2.3 |
Fidelity Short-Term Bond Fund | 2.5 | 2.3 |
| 5.0 | 4.6 |
Net Other Assets (Liabilities)* | 0.0 | 0.0 |
| 100.0 | 100.0 |
* Amount represents less than 0.1% |
Asset Allocation (% of fund's net assets) |
Current |
| Domestic Equity Funds | 49.6% | |
| International Equity Funds | 12.4% | |
| High Yield
Fixed-Income Funds | 6.5% | |
| Investment Grade Fixed-Income Funds | 26.5% | |
| Short-Term Funds | 5.0% | |

Six months ago |
| Domestic Equity Funds | 50.3% | |
| International Equity Funds | 12.6% | |
| High Yield
Fixed-Income Funds | 6.4% | |
| Investment Grade Fixed-Income Funds | 26.1% | |
| Short-Term Funds | 4.6% | |

Expected |
| Domestic Equity Funds | 49.6% | |
| International Equity Funds | 12.0% | |
| High Yield
Fixed-Income Funds | 6.2% | |
| Investment Grade Fixed-Income Funds | 26.3% | |
| Short-Term Funds | 5.9% | |

The fund invests according to an asset allocation strategy that becomes increasingly conservative over time. The six months ago allocation is based on the fund's holdings as of January 31, 2011. The current allocation is based on the fund's holdings as of July 31, 2011. The expected allocation represents the fund's anticipated allocation at January 31, 2012. |
Annual Report
Fidelity Income Replacement 2040 Fund
Investments July 31, 2011
Showing Percentage of Net Assets
Equity Funds - 62.0% |
| Shares | | Value |
Domestic Equity Funds - 49.6% |
Fidelity Advisor Mid Cap II Fund Institutional Class (a) | 7,020 | | $ 127,280 |
Fidelity Disciplined Equity Fund | 5,701 | | 132,715 |
Fidelity Equity-Income Fund | 2,950 | | 130,883 |
Fidelity Large Cap Core Enhanced Index Fund | 24,065 | | 215,864 |
Fidelity Series 100 Index Fund | 17,937 | | 162,333 |
Fidelity Series Broad Market Opportunities Fund | 20,636 | | 212,552 |
Fidelity Series Small Cap Opportunities Fund | 7,523 | | 84,413 |
TOTAL DOMESTIC EQUITY FUNDS | | 1,066,040 |
International Equity Funds - 12.4% |
Fidelity Advisor International Discovery Fund Institutional Class | 7,906 | | 265,877 |
TOTAL EQUITY FUNDS (Cost $1,197,286) | 1,331,917 |
Fixed-Income Funds - 33.0% |
| | | |
High Yield Fixed-Income Funds - 6.5% |
Fidelity Capital & Income Fund | 7,179 | | 68,705 |
Fidelity Strategic Income Fund | 6,211 | | 70,685 |
TOTAL HIGH YIELD FIXED-INCOME FUNDS | | 139,390 |
|
| Shares | | Value |
Investment Grade Fixed-Income Funds - 26.5% |
Fidelity Government Income Fund | 10,696 | | $ 114,230 |
Fidelity Strategic Real Return Fund | 11,457 | | 113,878 |
Fidelity Total Bond Fund | 31,110 | | 342,525 |
TOTAL INVESTMENT GRADE FIXED-INCOME FUNDS | | 570,633 |
TOTAL FIXED-INCOME FUNDS (Cost $678,608) | 710,023 |
Short-Term Funds - 5.0% |
| | | |
Fidelity Institutional Money Market Portfolio Institutional Class | 54,026 | | 54,026 |
Fidelity Short-Term Bond Fund | 6,366 | | 54,367 |
TOTAL SHORT-TERM FUNDS (Cost $107,704) | 108,393 |
TOTAL INVESTMENT PORTFOLIO - 100.0% (Cost $1,983,598) | | 2,150,333 |
NET OTHER ASSETS (LIABILITIES) - 0.0% | | (104) |
NET ASSETS - 100% | $ 2,150,229 |
Legend |
(a) Non-income producing |
Other Information |
All investments are categorized as Level 1 under the Fair Value Hierarchy. The inputs or methodology used for valuing securities may not be an indication of the risk associated with investing in those securities. For more information on valuation inputs, please refer to the Security Valuation section in the accompanying Notes to Financial Statements. |
Income Tax Information |
At July 31, 2011, the Fund had a capital loss carryforward of approximately $169,960 of which $763, $152,507 and $16,690 will expire in fiscal 2017, 2018 and 2019, respectively. Capital loss carryforwards are only available to offset future capital gains of the Fund to the extent provided by regulations and may be limited. |
See accompanying notes which are an integral part of the financial statements.
Annual Report
Fidelity Income Replacement 2040 Fund
Statement of Assets and Liabilities
| July 31, 2011 |
| | |
Assets | | |
Investment in securities, at value (cost $1,983,598) - See accompanying schedule | | $ 2,150,333 |
Cash | | 39 |
Receivable for fund shares sold | | 1,283 |
Total assets | | 2,151,655 |
| | |
Liabilities | | |
Payable for investments purchased | $ 1,284 | |
Distribution and service plan fees payable | 142 | |
Total liabilities | | 1,426 |
| | |
Net Assets | | $ 2,150,229 |
Net Assets consist of: | | |
Paid in capital | | $ 2,178,799 |
Undistributed net investment income | | 368 |
Accumulated undistributed net realized gain (loss) on investments | | (195,673) |
Net unrealized appreciation (depreciation) on investments | | 166,735 |
Net Assets | | $ 2,150,229 |
| | |
Calculation of Maximum Offering Price Class A:
Net Asset Value and redemption price per share ($95,688 ÷ 1,975.33 shares) | | $ 48.44 |
| | |
Maximum offering price per share (100/94.25 of $48.44) | | $ 51.40 |
| | |
Class T:
Net Asset Value and redemption price per share ($130,505 ÷ 2,694.83 shares) | | $ 48.43 |
| | |
Maximum offering price per share (100/96.50 of $48.43) | | $ 50.19 |
| | |
Class C:
Net Asset Value and offering price per share ($79,231 ÷ 1,636.47 shares)A | | $ 48.42 |
| | |
Income Replacement 2040:
Net Asset Value, offering price and redemption price per share ($1,796,972 ÷ 37,110.08 shares) | | $ 48.42 |
| | |
Institutional Class:
Net Asset Value, offering price and redemption price per share ($47,833 ÷ 987.76 shares) | | $ 48.43 |
A Redemption price per share is equal to net asset value less any applicable contingent deferred sales charge.
Statement of Operations
| Year ended July 31, 2011 |
| | |
Investment Income | | |
Income distributions from underlying funds | | $ 36,024 |
| | |
Expenses | | |
Distribution and service plan fees | $ 1,635 | |
Independent trustees' compensation | 7 | |
Total expenses before reductions | 1,642 | |
Expense reductions | (7) | 1,635 |
Net investment income (loss) | | 34,389 |
Realized and Unrealized Gain (Loss) Realized gain (loss) on sale of underlying fund shares | 69,601 | |
Capital gain distributions from underlying funds | 9,917 | |
Total net realized gain (loss) | | 79,518 |
Change in net unrealized appreciation (depreciation) on underlying funds | | 119,745 |
Net gain (loss) | | 199,263 |
Net increase (decrease) in net assets resulting from operations | | $ 233,652 |
See accompanying notes which are an integral part of the financial statements.
Annual Report
Statement of Changes in Net Assets
| Year ended
July 31, 2011 | Year ended
July 31, 2010 |
Increase (Decrease) in Net Assets | | |
Operations | | |
Net investment income (loss) | $ 34,389 | $ 23,376 |
Net realized gain (loss) | 79,518 | (127,348) |
Change in net unrealized appreciation (depreciation) | 119,745 | 184,622 |
Net increase (decrease) in net assets resulting from operations | 233,652 | 80,650 |
Distributions to shareholders from net investment income | (34,374) | (23,219) |
Distributions to shareholders from net realized gain | (7,263) | (2,847) |
Total distributions | (41,637) | (26,066) |
Share transactions - net increase (decrease) | 390,065 | 856,629 |
Total increase (decrease) in net assets | 582,080 | 911,213 |
| | |
Net Assets | | |
Beginning of period | 1,568,149 | 656,936 |
End of period (including undistributed net investment income of $368 and undistributed net investment income of $385, respectively) | $ 2,150,229 | $ 1,568,149 |
Financial Highlights - Class A
Years ended July 31, | 2011 | 2010 | 2009 | 2008G |
Selected Per-Share Data | | | | |
Net asset value, beginning of period | $ 43.04 | $ 38.83 | $ 45.23 | $ 50.00 |
Income from Investment Operations | | | | |
Net investment income (loss)E | .789 | .722 | .933 | .442 |
Net realized and unrealized gain (loss) | 5.608 | 4.298 | (6.238) | (4.814) |
Total from investment operations | 6.397 | 5.020 | (5.305) | (4.372) |
Distributions from net investment income | (.805) | (.710) | (.885) | (.398) |
Distributions from net realized gain | (.192) | (.100) | (.210) | - |
Total distributions | (.997) | (.810) | (1.095) | (.398) |
Net asset value, end of period | $ 48.44 | $ 43.04 | $ 38.83 | $ 45.23 |
Total ReturnB,C,D | 14.94% | 12.97% | (11.41)% | (8.77)% |
Ratios to Average Net AssetsF,H | | | | |
Expenses before reductions | .25% | .25% | .25% | .25%A |
Expenses net of fee waivers, if any | .25% | .25% | .25% | .25%A |
Expenses net of all reductions | .25% | .25% | .25% | .25%A |
Net investment income (loss) | 1.67% | 1.70% | 2.60% | 1.60%A |
Supplemental Data | | | | |
Net assets, end of period (000 omitted) | $ 96 | $ 34 | $ 57 | $ 91 |
Portfolio turnover rate | 75% | 129% | 50% | 4%A |
A Annualized
B Total returns for periods of less than one year are not annualized.
C Total returns would have been lower if certain expenses had not been reduced during the applicable periods shown.
D Total returns do not include the effect of the sales charges.
E Calculated based on average shares outstanding during the period.
F Amounts do not include the activity of the underlying funds.
G For the period December 31, 2007 (commencement of operations) to July 31, 2008.
H Expense ratios reflect operating expenses of the class. Expenses before reductions do not reflect amounts reimbursed by the investment adviser or reductions from expense offset arrangements and do not represent the amount paid by the class during periods when reimbursements or reductions occur. Expenses net of fee waivers reflect expenses after reimbursement by the investment adviser but prior to reductions from expense offset arrangements. Expenses net of all reductions represent the net expenses paid by the class but do not include expenses of the investment companies in which the Fund invests.
See accompanying notes which are an integral part of the financial statements.
Annual Report
Financial Highlights - Class T
Years ended July 31, | 2011 | 2010 | 2009 | 2008G |
Selected Per-Share Data | | | | |
Net asset value, beginning of period | $ 43.05 | $ 38.84 | $ 45.23 | $ 50.00 |
Income from Investment Operations | | | | |
Net investment income (loss)E | .672 | .616 | .836 | .371 |
Net realized and unrealized gain (loss) | 5.604 | 4.301 | (6.227) | (4.809) |
Total from investment operations | 6.276 | 4.917 | (5.391) | (4.438) |
Distributions from net investment income | (.704) | (.607) | (.789) | (.332) |
Distributions from net realized gain | (.192) | (.100) | (.210) | - |
Total distributions | (.896) | (.707) | (.999) | (.332) |
Net asset value, end of period | $ 48.43 | $ 43.05 | $ 38.84 | $ 45.23 |
Total ReturnB,C,D | 14.64% | 12.69% | (11.62)% | (8.90)% |
Ratios to Average Net AssetsF,H | | | | |
Expenses before reductions | .50% | .50% | .50% | .50%A |
Expenses net of fee waivers, if any | .50% | .50% | .50% | .50%A |
Expenses net of all reductions | .50% | .50% | .50% | .50%A |
Net investment income (loss) | 1.42% | 1.45% | 2.35% | 1.35%A |
Supplemental Data | | | | |
Net assets, end of period (000 omitted) | $ 131 | $ 111 | $ 102 | $ 132 |
Portfolio turnover rate | 75% | 129% | 50% | 4%A |
A Annualized
B Total returns for periods of less than one year are not annualized.
C Total returns would have been lower if certain expenses had not been reduced during the applicable periods shown.
D Total returns do not include the effect of the sales charges.
E Calculated based on average shares outstanding during the period.
F Amounts do not include the activity of the underlying funds.
G For the period December 31, 2007 (commencement of operations) to July 31, 2008.
H Expense ratios reflect operating expenses of the class. Expenses before reductions do not reflect amounts reimbursed by the investment adviser or reductions from expense offset arrangements and do not represent the amount paid by the class during periods when reimbursements or reductions occur. Expenses net of fee waivers reflect expenses after reimbursement by the investment adviser but prior to reductions from expense offset arrangements. Expenses net of all reductions represent the net expenses paid by the class but do not include expenses of the investment companies in which the Fund invests.
Financial Highlights - Class C
Years ended July 31, | 2011 | 2010 | 2009 | 2008G |
Selected Per-Share Data | | | | |
Net asset value, beginning of period | $ 43.05 | $ 38.84 | $ 45.22 | $ 50.00 |
Income from Investment Operations | | | | |
Net investment income (loss)E | .435 | .402 | .664 | .234 |
Net realized and unrealized gain (loss) | 5.609 | 4.305 | (6.229) | (4.816) |
Total from investment operations | 6.044 | 4.707 | (5.565) | (4.582) |
Distributions from net investment income | (.482) | (.397) | (.605) | (.198) |
Distributions from net realized gain | (.192) | (.100) | (.210) | - |
Total distributions | (.674) | (.497) | (.815) | (.198) |
Net asset value, end of period | $ 48.42 | $ 43.05 | $ 38.84 | $ 45.22 |
Total ReturnB,C,D | 14.08% | 12.13% | (12.06)% | (9.18)% |
Ratios to Average Net AssetsF,H | | | | |
Expenses before reductions | 1.00% | 1.00% | 1.00% | 1.00%A |
Expenses net of fee waivers, if any | 1.00% | 1.00% | 1.00% | 1.00%A |
Expenses net of all reductions | 1.00% | 1.00% | 1.00% | 1.00%A |
Net investment income (loss) | .93% | .95% | 1.85% | .84%A |
Supplemental Data | | | | |
Net assets, end of period (000 omitted) | $ 79 | $ 99 | $ 57 | $ 91 |
Portfolio turnover rate | 75% | 129% | 50% | 4%A |
A Annualized
B Total returns for periods of less than one year are not annualized.
C Total returns would have been lower if certain expenses had not been reduced during the applicable periods shown.
D Total returns do not include the effect of the contingent deferred sales charge.
E Calculated based on average shares outstanding during the period.
F Amounts do not include the activity of the underlying funds.
G For the period December 31, 2007 (commencement of operations) to July 31, 2008.
H Expense ratios reflect operating expenses of the class. Expenses before reductions do not reflect amounts reimbursed by the investment adviser or reductions from expense offset arrangements and do not represent the amount paid by the class during periods when reimbursements or reductions occur. Expenses net of fee waivers reflect expenses after reimbursement by the investment adviser but prior to reductions from expense offset arrangements. Expenses net of all reductions represent the net expenses paid by the class but do not include expenses of the investment companies in which the Fund invests.
See accompanying notes which are an integral part of the financial statements.
Annual Report
Financial Highlights - Income Replacement 2040
Years ended July 31, | 2011 | 2010 | 2009 | 2008G |
Selected Per-Share Data | | | | |
Net asset value, beginning of period | $ 43.04 | $ 38.83 | $ 45.23 | $ 50.00 |
Income from Investment Operations | | | | |
Net investment income (loss)D | .910 | .833 | 1.015 | .504 |
Net realized and unrealized gain (loss) | 5.602 | 4.297 | (6.231) | (4.810) |
Total from investment operations | 6.512 | 5.130 | (5.216) | (4.306) |
Distributions from net investment income | (.940) | (.820) | (.974) | (.464) |
Distributions from net realized gain | (.192) | (.100) | (.210) | - |
Total distributions | (1.132) | (.920) | (1.184) | (.464) |
Net asset value, end of period | $ 48.42 | $ 43.04 | $ 38.83 | $ 45.23 |
Total ReturnB,C | 15.21% | 13.26% | (11.19)% | (8.64)% |
Ratios to Average Net AssetsE,H | | | | |
Expenses before reductionsF | .00% | .00% | .00% | .00%A |
Expenses net of fee waivers, if any | .00% | .00% | .00% | .00%A |
Expenses net of all reductions | .00% | .00% | .00% | .00%A |
Net investment income (loss) | 1.93% | 1.96% | 2.85% | 1.85%A |
Supplemental Data | | | | |
Net assets, end of period (000 omitted) | $ 1,797 | $ 1,262 | $ 384 | $ 598 |
Portfolio turnover rate | 75% | 129% | 50% | 4%A |
A Annualized
B Total returns for periods of less than one year are not annualized.
C Total returns would have been lower if certain expenses had not been reduced during the applicable periods shown.
D Calculated based on average shares outstanding during the period.
E Amounts do not include the activity of the underlying funds.
F Amount represents less than .01%.
G For the period December 31, 2007 (commencement of operations) to July 31, 2008.
H Expense ratios reflect operating expenses of the class. Expenses before reductions do not reflect amounts reimbursed by the investment adviser or reductions from expense offset arrangements and do not represent the amount paid by the class during periods when reimbursements or reductions occur. Expenses net of fee waivers reflect expenses after reimbursement by the investment adviser but prior to reductions from expense offset arrangements. Expenses net of all reductions represent the net expenses paid by the class but do not include expenses of the investment companies in which the Fund invests.
Financial Highlights - Institutional Class
Years ended July 31, | 2011 | 2010 | 2009 | 2008G |
Selected Per-Share Data | | | | |
Net asset value, beginning of period | $ 43.04 | $ 38.83 | $ 45.23 | $ 50.00 |
Income from Investment Operations | | | | |
Net investment income (loss)D | .906 | .828 | 1.022 | .512 |
Net realized and unrealized gain (loss) | 5.616 | 4.302 | (6.238) | (4.818) |
Total from investment operations | 6.522 | 5.130 | (5.216) | (4.306) |
Distributions from net investment income | (.940) | (.820) | (.974) | (.464) |
Distributions from net realized gain | (.192) | (.100) | (.210) | - |
Total distributions | (1.132) | (.920) | (1.184) | (.464) |
Net asset value, end of period | $ 48.43 | $ 43.04 | $ 38.83 | $ 45.23 |
Total ReturnB,C | 15.24% | 13.26% | (11.19)% | (8.64)% |
Ratios to Average Net AssetsE,H | | | | |
Expenses before reductionsF | .00% | .00% | .00% | .00%A |
Expenses net of fee waivers, if any | .00% | .00% | .00% | .00%A |
Expenses net of all reductions | .00% | .00% | .00% | .00%A |
Net investment income (loss) | 1.93% | 1.96% | 2.85% | 1.85%A |
Supplemental Data | | | | |
Net assets, end of period (000 omitted) | $ 48 | $ 62 | $ 57 | $ 91 |
Portfolio turnover rate | 75% | 129% | 50% | 4%A |
A Annualized
B Total returns for periods of less than one year are not annualized.
C Total returns would have been lower if certain expenses had not been reduced during the applicable periods shown.
D Calculated based on average shares outstanding during the period.
E Amounts do not include the activity of the underlying funds.
F Amount represents less than .01%.
G For the period December 31, 2007 (commencement of operations) to July 31, 2008.
H Expense ratios reflect operating expenses of the class. Expenses before reductions do not reflect amounts reimbursed by the investment adviser or reductions from expense offset arrangements and do not represent the amount paid by the class during periods when reimbursements or reductions occur. Expenses net of fee waivers reflect expenses after reimbursement by the investment adviser but prior to reductions from expense offset arrangements. Expenses net of all reductions represent the net expenses paid by the class but do not include expenses of the investment companies in which the Fund invests.
See accompanying notes which are an integral part of the financial statements.
Annual Report
Fidelity Income Replacement 2042 Fund
Investment Changes (Unaudited)
Fund Holdings as of July 31, 2011 |
| % of fund's
net assets | % of fund's net assets
6 months ago |
Domestic Equity Funds | | |
Fidelity Advisor Mid Cap II Fund Institutional Class | 6.1 | 6.1 |
Fidelity Disciplined Equity Fund | 6.3 | 6.4 |
Fidelity Equity-Income Fund | 6.2 | 6.4 |
Fidelity Large Cap Core Enhanced Index Fund | 10.3 | 10.2 |
Fidelity Series 100 Index Fund | 7.7 | 7.7 |
Fidelity Series Broad Market Opportunities Fund | 10.1 | 10.3 |
Fidelity Series Small Cap Opportunities Fund | 4.0 | 4.1 |
| 50.7 | 51.2 |
International Equity Funds | | |
Fidelity Advisor International Discovery Fund Institutional Class | 12.8 | 12.8 |
High Yield Fixed-Income Funds | | |
Fidelity Capital & Income Fund | 3.3 | 3.3 |
Fidelity Strategic Income Fund | 3.4 | 3.4 |
| 6.7 | 6.7 |
Investment Grade Fixed-Income Funds | | |
Fidelity Government Income Fund | 5.3 | 5.2 |
Fidelity Strategic Real Return Fund | 5.2 | 5.2 |
Fidelity Total Bond Fund | 15.8 | 15.6 |
| 26.3 | 26.0 |
Short-Term Funds | | |
Fidelity Institutional Money Market Portfolio Institutional Class | 1.7 | 1.7 |
Fidelity Short-Term Bond Fund | 1.8 | 1.6 |
| 3.5 | 3.3 |
Net Other Assets (Liabilities)* | 0.0 | 0.0 |
| 100.0 | 100.0 |
* Amount represents less than 0.1% |
Asset Allocation (% of fund's net assets) |
Current |
| Domestic Equity Funds | 50.7% | |
| International Equity Funds | 12.8% | |
| High Yield
Fixed-Income Funds | 6.7% | |
| Investment Grade Fixed-Income Funds | 26.3% | |
| Short-Term Funds | 3.5% | |

Six months ago |
| Domestic Equity Funds | 51.2% | |
| International Equity Funds | 12.8% | |
| High Yield
Fixed-Income Funds | 6.7% | |
| Investment Grade Fixed-Income Funds | 26.0% | |
| Short-Term Funds | 3.3% | |

Expected |
| Domestic Equity Funds | 50.8% | |
| International Equity Funds | 12.7% | |
| High Yield
Fixed-Income Funds | 6.6% | |
| Investment Grade Fixed-Income Funds | 26.0% | |
| Short-Term Funds | 3.9% | |

The fund invests according to an asset allocation strategy that becomes increasingly conservative over time. The six months ago allocation is based on the fund's holdings as of January 31, 2011. The current allocation is based on the fund's holdings as of July 31, 2011. The expected allocation represents the fund's anticipated allocation at January 31, 2012. |
Annual Report
Fidelity Income Replacement 2042 Fund
Investments July 31, 2011
Showing Percentage of Net Assets
Equity Funds - 63.5% |
| Shares | | Value |
Domestic Equity Funds - 50.7% |
Fidelity Advisor Mid Cap II Fund Institutional Class (a) | 18,843 | | $ 341,629 |
Fidelity Disciplined Equity Fund | 15,278 | | 355,681 |
Fidelity Equity-Income Fund | 7,911 | | 350,917 |
Fidelity Large Cap Core Enhanced Index Fund | 64,446 | | 578,082 |
Fidelity Series 100 Index Fund | 48,029 | | 434,666 |
Fidelity Series Broad Market Opportunities Fund | 55,337 | | 569,967 |
Fidelity Series Small Cap Opportunities Fund | 20,139 | | 225,955 |
TOTAL DOMESTIC EQUITY FUNDS | | 2,856,897 |
International Equity Funds - 12.8% |
Fidelity Advisor International Discovery Fund Institutional Class | 21,321 | | 717,015 |
TOTAL EQUITY FUNDS (Cost $3,179,587) | 3,573,912 |
Fixed-Income Funds - 33.0% |
| | | |
High Yield Fixed-Income Funds - 6.7% |
Fidelity Capital & Income Fund | 19,642 | | 187,976 |
Fidelity Strategic Income Fund | 17,004 | | 193,500 |
TOTAL HIGH YIELD FIXED-INCOME FUNDS | | 381,476 |
|
| Shares | | Value |
Investment Grade Fixed-Income Funds - 26.3% |
Fidelity Government Income Fund | 27,780 | | $ 296,692 |
Fidelity Strategic Real Return Fund | 29,764 | | 295,859 |
Fidelity Total Bond Fund | 80,599 | | 887,400 |
TOTAL INVESTMENT GRADE FIXED-INCOME FUNDS | | 1,479,951 |
TOTAL FIXED-INCOME FUNDS (Cost $1,738,420) | 1,861,427 |
Short-Term Funds - 3.5% |
| | | |
Fidelity Institutional Money Market Portfolio Institutional Class | 98,196 | | 98,196 |
Fidelity Short-Term Bond Fund | 11,572 | | 98,828 |
TOTAL SHORT-TERM FUNDS (Cost $195,233) | 197,024 |
TOTAL INVESTMENT PORTFOLIO - 100.0% (Cost $5,113,240) | | 5,632,363 |
NET OTHER ASSETS (LIABILITIES) - 0.0% | | 2 |
NET ASSETS - 100% | $ 5,632,365 |
Legend |
(a) Non-income producing |
Other Information |
All investments are categorized as Level 1 under the Fair Value Hierarchy. The inputs or methodology used for valuing securities may not be an indication of the risk associated with investing in those securities. For more information on valuation inputs, please refer to the Security Valuation section in the accompanying Notes to Financial Statements. |
Income Tax Information |
At July 31, 2011, the Fund had a capital loss carryforward of approximately $51,392 of which $2,106, $15,348 and $33,938 will expire in fiscal 2017, 2018 and 2019, respectively. Capital loss carryforwards are only available to offset future capital gains of the Fund to the extent provided by regulations and may be limited. |
See accompanying notes which are an integral part of the financial statements.
Annual Report
Fidelity Income Replacement 2042 Fund
Statement of Assets and Liabilities
| July 31, 2011 |
| | |
Assets | | |
Investment in securities, at value (cost $5,113,240) - See accompanying schedule | | $ 5,632,363 |
Cash | | 40 |
Receivable for fund shares sold | | 3,001 |
Total assets | | 5,635,404 |
| | |
Liabilities | | |
Payable for investments purchased | $ 2,996 | |
Distribution and service plan fees payable | 43 | |
Total liabilities | | 3,039 |
| | |
Net Assets | | $ 5,632,365 |
Net Assets consist of: | | |
Paid in capital | | $ 5,219,431 |
Undistributed net investment income | | 1,108 |
Accumulated undistributed net realized gain (loss) on investments | | (107,297) |
Net unrealized appreciation (depreciation) on investments | | 519,123 |
Net Assets | | $ 5,632,365 |
| | |
Calculation of Maximum Offering Price Class A:
Net Asset Value and redemption price per share ($22,593 ÷ 465.62 shares) | | $ 48.52 |
| | |
Maximum offering price per share (100/94.25 of $48.52) | | $ 51.48 |
| | |
Class T:
Net Asset Value and redemption price per share ($28,600 ÷ 589.33 shares) | | $ 48.53 |
| | |
Maximum offering price per share (100/96.50 of $48.53) | | $ 50.29 |
| | |
Class C:
Net Asset Value and offering price per share ($28,082 ÷ 578.73 shares)A | | $ 48.52 |
| | |
Income Replacement 2042:
Net Asset Value, offering price and redemption price per share ($5,523,957 ÷ 113,874.34 shares) | | $ 48.51 |
| | |
Institutional Class:
Net Asset Value, offering price and redemption price per share ($29,133 ÷ 600.60 shares) | | $ 48.51 |
A Redemption price per share is equal to net asset value less any applicable contingent deferred sales charge.
Statement of Operations
| Year ended July 31, 2011 |
| | |
Investment Income | | |
Income distributions from underlying funds | | $ 84,817 |
| | |
Expenses | | |
Distribution and service plan fees | $ 560 | |
Independent trustees' compensation | 16 | |
Total expenses before reductions | 576 | |
Expense reductions | (16) | 560 |
Net investment income (loss) | | 84,257 |
Realized and Unrealized Gain (Loss) Realized gain (loss) on sale of underlying fund shares | (38,325) | |
Capital gain distributions from underlying funds | 21,921 | |
Total net realized gain (loss) | | (16,404) |
Change in net unrealized appreciation (depreciation) on underlying funds | | 478,706 |
Net gain (loss) | | 462,302 |
Net increase (decrease) in net assets resulting from operations | | $ 546,559 |
See accompanying notes which are an integral part of the financial statements.
Annual Report
Fidelity Income Replacement 2042 Fund
Financial Statements - continued
Statement of Changes in Net Assets
| Year ended
July 31, 2011 | Year ended
July 31, 2010 |
Increase (Decrease) in Net Assets | | |
Operations | | |
Net investment income (loss) | $ 84,257 | $ 58,360 |
Net realized gain (loss) | (16,404) | (3,503) |
Change in net unrealized appreciation (depreciation) | 478,706 | 231,761 |
Net increase (decrease) in net assets resulting from operations | 546,559 | 286,618 |
Distributions to shareholders from net investment income | (84,042) | (57,943) |
Distributions to shareholders from net realized gain | (15,604) | (7,508) |
Total distributions | (99,646) | (65,451) |
Share transactions - net increase (decrease) | 1,650,368 | 1,660,037 |
Total increase (decrease) in net assets | 2,097,281 | 1,881,204 |
| | |
Net Assets | | |
Beginning of period | 3,535,084 | 1,653,880 |
End of period (including undistributed net investment income of $1,108 and undistributed net investment income of $933, respectively) | $ 5,632,365 | $ 3,535,084 |
Financial Highlights - Class A
Years ended July 31, | 2011 | 2010 | 2009 | 2008G |
Selected Per-Share Data | | | | |
Net asset value, beginning of period | $ 43.04 | $ 38.83 | $ 45.20 | $ 50.00 |
Income from Investment Operations | | | | |
Net investment income (loss)E | .757 | .747 | .819 | .425 |
Net realized and unrealized gain (loss) | 5.719 | 4.285 | (6.123) | (4.836) |
Total from investment operations | 6.476 | 5.032 | (5.304) | (4.411) |
Distributions from net investment income | (.801) | (.717) | (.866) | (.389) |
Distributions from net realized gain | (.195) | (.105) | (.200) | - |
Total distributions | (.996) | (.822) | (1.066) | (.389) |
Net asset value, end of period | $ 48.52 | $ 43.04 | $ 38.83 | $ 45.20 |
Total ReturnB,C,D | 15.12% | 13.00% | (11.40)% | (8.85)% |
Ratios to Average Net AssetsF,H | | | | |
Expenses before reductions | .25% | .25% | .25% | .25%A |
Expenses net of fee waivers, if any | .25% | .25% | .25% | .25%A |
Expenses net of all reductions | .25% | .25% | .25% | .25%A |
Net investment income (loss) | 1.61% | 1.77% | 2.32% | 1.57%A |
Supplemental Data | | | | |
Net assets, end of period (000 omitted) | $ 23 | $ 29 | $ 88 | $ 91 |
Portfolio turnover rate | 15% | 20% | 37% | 8%A |
A Annualized
B Total returns for periods of less than one year are not annualized.
C Total returns would have been lower if certain expenses had not been reduced during the applicable periods shown.
D Total returns do not include the effect of the sales charges.
E Calculated based on average shares outstanding during the period.
F Amounts do not include the activity of the underlying funds.
G For the period December 31, 2007 (commencement of operations) to July 31, 2008.
H Expense ratios reflect operating expenses of the class. Expenses before reductions do not reflect amounts reimbursed by the investment adviser or reductions from expense offset arrangements and do not represent the amount paid by the class during periods when reimbursements or reductions occur. Expenses net of fee waivers reflect expenses after reimbursement by the investment adviser but prior to reductions from expense offset arrangements. Expenses net of all reductions represent the net expenses paid by the class but do not include expenses of the investment companies in which the Fund invests.
See accompanying notes which are an integral part of the financial statements.
Annual Report
Financial Highlights - Class T
Years ended July 31, | 2011 | 2010 | 2009 | 2008G |
Selected Per-Share Data | | | | |
Net asset value, beginning of period | $ 43.04 | $ 38.83 | $ 45.19 | $ 50.00 |
Income from Investment Operations | | | | |
Net investment income (loss)E | .637 | .642 | .739 | .365 |
Net realized and unrealized gain (loss) | 5.727 | 4.281 | (6.128) | (4.852) |
Total from investment operations | 6.364 | 4.923 | (5.389) | (4.487) |
Distributions from net investment income | (.679) | (.608) | (.771) | (.323) |
Distributions from net realized gain | (.195) | (.105) | (.200) | - |
Total distributions | (.874) | (.713) | (.971) | (.323) |
Net asset value, end of period | $ 48.53 | $ 43.04 | $ 38.83 | $ 45.19 |
Total ReturnB,C,D | 14.85% | 12.71% | (11.62)% | (9.00)% |
Ratios to Average Net AssetsF,H | | | | |
Expenses before reductions | .50% | .50% | .50% | .50%A |
Expenses net of fee waivers, if any | .50% | .50% | .50% | .50%A |
Expenses net of all reductions | .50% | .50% | .50% | .50%A |
Net investment income (loss) | 1.35% | 1.52% | 2.07% | 1.32%A |
Supplemental Data | | | | |
Net assets, end of period (000 omitted) | $ 29 | $ 37 | $ 57 | $ 91 |
Portfolio turnover rate | 15% | 20% | 37% | 8%A |
A Annualized
B Total returns for periods of less than one year are not annualized.
C Total returns would have been lower if certain expenses had not been reduced during the applicable periods shown.
D Total returns do not include the effect of the sales charges.
E Calculated based on average shares outstanding during the period.
F Amounts do not include the activity of the underlying funds.
G For the period December 31, 2007 (commencement of operations) to July 31, 2008.
H Expense ratios reflect operating expenses of the class. Expenses before reductions do not reflect amounts reimbursed by the investment adviser or reductions from expense offset arrangements and do not represent the amount paid by the class during periods when reimbursements or reductions occur. Expenses net of fee waivers reflect expenses after reimbursement by the investment adviser but prior to reductions from expense offset arrangements. Expenses net of all reductions represent the net expenses paid by the class but do not include expenses of the investment companies in which the Fund invests.
Financial Highlights - Class C
Years ended July 31, | 2011 | 2010 | 2009 | 2008G |
Selected Per-Share Data | | | | |
Net asset value, beginning of period | $ 43.05 | $ 38.84 | $ 45.19 | $ 50.00 |
Income from Investment Operations | | | | |
Net investment income (loss)E | .402 | .430 | .560 | .226 |
Net realized and unrealized gain (loss) | 5.719 | 4.275 | (6.123) | (4.846) |
Total from investment operations | 6.121 | 4.705 | (5.563) | (4.620) |
Distributions from net investment income | (.456) | (.390) | (.587) | (.190) |
Distributions from net realized gain | (.195) | (.105) | (.200) | - |
Total distributions | (.651) | (.495) | (.787) | (.190) |
Net asset value, end of period | $ 48.52 | $ 43.05 | $ 38.84 | $ 45.19 |
Total ReturnB,C,D | 14.26% | 12.12% | (12.05)% | (9.25)% |
Ratios to Average Net AssetsF,H | | | | |
Expenses before reductions | 1.00% | 1.00% | 1.00% | 1.00%A |
Expenses net of fee waivers, if any | 1.00% | 1.00% | 1.00% | 1.00%A |
Expenses net of all reductions | 1.00% | 1.00% | 1.00% | 1.00%A |
Net investment income (loss) | .85% | 1.02% | 1.57% | .82%A |
Supplemental Data | | | | |
Net assets, end of period (000 omitted) | $ 28 | $ 37 | $ 56 | $ 91 |
Portfolio turnover rate | 15% | 20% | 37% | 8%A |
A Annualized
B Total returns for periods of less than one year are not annualized.
C Total returns would have been lower if certain expenses had not been reduced during the applicable periods shown.
D Total returns do not include the effect of the contingent deferred sales charge.
E Calculated based on average shares outstanding during the period.
F Amounts do not include the activity of the underlying funds.
G For the period December 31, 2007 (commencement of operations) to July 31, 2008.
H Expense ratios reflect operating expenses of the class. Expenses before reductions do not reflect amounts reimbursed by the investment adviser or reductions from expense offset arrangements and do not represent the amount paid by the class during periods when reimbursements or reductions occur. Expenses net of fee waivers reflect expenses after reimbursement by the investment adviser but prior to reductions from expense offset arrangements. Expenses net of all reductions represent the net expenses paid by the class but do not include expenses of the investment companies in which the Fund invests.
See accompanying notes which are an integral part of the financial statements.
Annual Report
Financial Highlights - Income Replacement 2042
Years ended July 31, | 2011 | 2010 | 2009 | 2008G |
Selected Per-Share Data | | | | |
Net asset value, beginning of period | $ 43.03 | $ 38.83 | $ 45.20 | $ 50.00 |
Income from Investment Operations | | | | |
Net investment income (loss)D | .880 | .857 | .900 | .496 |
Net realized and unrealized gain (loss) | 5.719 | 4.279 | (6.114) | (4.840) |
Total from investment operations | 6.599 | 5.136 | (5.214) | (4.344) |
Distributions from net investment income | (.924) | (.831) | (.956) | (.456) |
Distributions from net realized gain | (.195) | (.105) | (.200) | - |
Total distributions | (1.119) | (.936) | (1.156) | (.456) |
Net asset value, end of period | $ 48.51 | $ 43.03 | $ 38.83 | $ 45.20 |
Total ReturnB,C | 15.42% | 13.27% | (11.18)% | (8.72)% |
Ratios to Average Net AssetsE,H | | | | |
Expenses before reductionsF | .00% | .00% | .00% | .00%A |
Expenses net of fee waivers, if any | .00% | .00% | .00% | .00%A |
Expenses net of all reductions | .00% | .00% | .00% | .00%A |
Net investment income (loss) | 1.86% | 2.02% | 2.57% | 1.82%A |
Supplemental Data | | | | |
Net assets, end of period (000 omitted) | $ 5,524 | $ 3,395 | $ 1,395 | $ 969 |
Portfolio turnover rate | 15% | 20% | 37% | 8%A |
A Annualized
B Total returns for periods of less than one year are not annualized.
C Total returns would have been lower if certain expenses had not been reduced during the applicable periods shown.
D Calculated based on average shares outstanding during the period.
E Amounts do not include the activity of the underlying funds.
F Amount represents less than .01%.
G For the period December 31, 2007 (commencement of operations) to July 31, 2008.
H Expense ratios reflect operating expenses of the class. Expenses before reductions do not reflect amounts reimbursed by the investment adviser or reductions from expense offset arrangements and do not represent the amount paid by the class during periods when reimbursements or reductions occur. Expenses net of fee waivers reflect expenses after reimbursement by the investment adviser but prior to reductions from expense offset arrangements. Expenses net of all reductions represent the net expenses paid by the class but do not include expenses of the investment companies in which the Fund invests.
Financial Highlights - Institutional Class
Years ended July 31, | 2011 | 2010 | 2009 | 2008G |
Selected Per-Share Data | | | | |
Net asset value, beginning of period | $ 43.03 | $ 38.83 | $ 45.20 | $ 50.00 |
Income from Investment Operations | | | | |
Net investment income (loss)D | .874 | .855 | .918 | .504 |
Net realized and unrealized gain (loss) | 5.725 | 4.281 | (6.132) | (4.848) |
Total from investment operations | 6.599 | 5.136 | (5.214) | (4.344) |
Distributions from net investment income | (.924) | (.831) | (.956) | (.456) |
Distributions from net realized gain | (.195) | (.105) | (.200) | - |
Total distributions | (1.119) | (.936) | (1.156) | (.456) |
Net asset value, end of period | $ 48.51 | $ 43.03 | $ 38.83 | $ 45.20 |
Total ReturnB,C | 15.42% | 13.27% | (11.18)% | (8.72)% |
Ratios to Average Net AssetsE,H | | | | |
Expenses before reductionsF | .00% | .00% | .00% | .00%A |
Expenses net of fee waivers, if any | .00% | .00% | .00% | .00%A |
Expenses net of all reductions | .00% | .00% | .00% | .00%A |
Net investment income (loss) | 1.86% | 2.02% | 2.57% | 1.82%A |
Supplemental Data | | | | |
Net assets, end of period (000 omitted) | $ 29 | $ 38 | $ 57 | $ 91 |
Portfolio turnover rate | 15% | 20% | 37% | 8%A |
A Annualized
B Total returns for periods of less than one year are not annualized.
C Total returns would have been lower if certain expenses had not been reduced during the applicable periods shown.
D Calculated based on average shares outstanding during the period.
E Amounts do not include the activity of the underlying funds.
F Amount represents less than .01%.
G For the period December 31, 2007 (commencement of operations) to July 31, 2008.
H Expense ratios reflect operating expenses of the class. Expenses before reductions do not reflect amounts reimbursed by the investment adviser or reductions from expense offset arrangements and do not represent the amount paid by the class during periods when reimbursements or reductions occur. Expenses net of fee waivers reflect expenses after reimbursement by the investment adviser but prior to reductions from expense offset arrangements. Expenses net of all reductions represent the net expenses paid by the class but do not include expenses of the investment companies in which the Fund invests.
See accompanying notes which are an integral part of the financial statements.
Annual Report
Notes to Financial Statements
For the period ended July 31, 2011
1. Organization.
Fidelity Income Replacement 2016 Fund, Fidelity Income Replacement 2018 Fund, Fidelity Income Replacement 2020 Fund, Fidelity Income Replacement 2022 Fund, Fidelity Income Replacement 2024 Fund, Fidelity Income Replacement 2026 Fund, Fidelity Income Replacement 2028 Fund, Fidelity Income Replacement 2030 Fund, Fidelity Income Replacement 2032 Fund, Fidelity Income Replacement 2034 Fund, Fidelity Income Replacement 2036 Fund, Fidelity Income Replacement 2038 Fund, Fidelity Income Replacement 2040 Fund and Fidelity Income Replacement 2042 Fund (the Funds) are funds of Fidelity Income Fund (the Trust). The Trust is registered under the Investment Company Act of 1940, as amended (the 1940 Act), as an open-end management investment company organized as a Massachusetts business trust. Each Fund is authorized to issue an unlimited number of shares. The Funds invest primarily in a combination of other Fidelity equity, bond, and short-term funds (the Underlying Funds) managed by Fidelity Management & Research Company (FMR).
The Funds are designed for investors who seek to convert accumulated assets into regular payments over a defined period of time. The payment strategy for each Fund is designed to be implemented through a shareholder's voluntary participation in the Smart Payment Program. Participation in the Smart Payment Program will result in the gradual liquidation of the shareholder's entire investment in the Fund by its horizon date. Each Fund's name refers to the year of its horizon date.
Each Fund offers Class A, Class T, Class C, Income Replacement and Institutional Class shares, each of which has equal rights as to assets and voting privileges. Each class has exclusive voting rights with respect to matters that affect that class. Investment income, realized and unrealized capital gains and losses, the common expenses of the Fund, and certain fund-level expense reductions, if any, are allocated on a pro-rata basis to each class based on the relative net assets of each class to the total net assets of the Fund. Each class differs with respect to distribution and service plan fees incurred. Certain expense reductions may also differ by class.
2. Significant Accounting Policies.
The financial statements have been prepared in conformity with accounting principles generally accepted in the United States of America (GAAP), which require management to make certain estimates and assumptions at the date of the financial statements. Actual results could differ from those estimates. Subsequent events, if any, through the date that the financial statements were issued have been evaluated in the preparation of the financial statements. The following summarizes the significant accounting policies of the Funds:
Security Valuation. Investments are valued as of 4:00 p.m. Eastern time on the last calendar day of the period. Each Fund categorizes the inputs to valuation techniques used to value their investments into a disclosure hierarchy consisting of three levels as shown below:
Level 1 - quoted prices in active markets for identical investments
Level 2 - other significant observable inputs (including quoted prices for similar investments, interest rates, prepayment speeds, etc.)
Level 3 - unobservable inputs (including the Fund's own assumptions based on the best information available)
Valuation techniques used to value each Fund's investments by major category are as follows. Investments in the Underlying Funds are valued at their closing net asset value (NAV) each business day and are categorized as Level 1 in the hierarchy.
Investment Transactions and Income. For financial reporting purposes, the Funds' investment holdings and NAV include trades executed through the end of the last business day of the period. The NAV per share for processing shareholder transactions is calculated as of the close of business of the New York Stock Exchange (NYSE), normally 4:00 p.m. Eastern time and includes trades executed through the end of the prior business day. Gains and losses on securities sold are determined on the basis of identified cost. Income and capital gain distributions from the Underlying Funds, if any, are recorded on the ex-dividend date.
Expenses. Expenses directly attributable to a fund are charged to that fund. Expenses attributable to more than one fund are allocated among the respective funds on the basis of relative net assets or other appropriate methods. Expenses included in the accompanying financial statements reflect the expenses of the Fund and do not include any expenses associated with the Underlying Funds. Expense estimates are accrued in the period to which they relate and adjustments are made when actual amounts are known.
Income Tax Information and Distributions to Shareholders. Each year, each Fund intends to qualify as a regulated investment company, including distributing substantially all of its taxable income and realized gains under Subchapter M of the Internal Revenue Code and filing its U.S. federal tax return. As a result, no provision for income taxes is required. As of July 31, 2011, each Fund did not have any unrecognized tax benefits in the financial statements. A fund's federal tax return is subject to examination by the Internal Revenue Service (IRS) for a period of three years.
Distributions are declared and recorded on the ex-dividend date. Income dividends and capital gain distributions are declared separately for each class. Income and capital gain distributions are determined in accordance with income tax regulations, which may differ from GAAP.
Annual Report
2. Significant Accounting Policies - continued
Income Tax Information and Distributions to Shareholders - continued
Capital accounts within the financial statements are adjusted for permanent book-tax differences. These adjustments have no impact on net assets or the results of operations. Temporary book-tax differences will reverse in a subsequent period.
Book-tax differences are primarily due to the short-term gain distributions from the Underlying Funds, capital loss carryforwards, losses deferred due to wash sales and excise tax regulations.
The federal tax cost of investment securities and unrealized appreciation (depreciation) as of period end were as follows for each Fund:
| Tax cost | Gross unrealized appreciation | Gross unrealized depreciation | Net unrealized appreciation (depreciation) on securities and other investments |
Fidelity Income Replacement 2016 Fund | $ 9,508,174 | $ 578,985 | $ (80,291) | $ 498,694 |
Fidelity Income Replacement 2018 Fund | 5,185,322 | 210,196 | (110,354) | 99,842 |
Fidelity Income Replacement 2020 Fund | 3,682,885 | 320,678 | (31,825) | 288,853 |
Fidelity Income Replacement 2022 Fund | 3,438,681 | 84,225 | (126,856) | (42,631) |
Fidelity Income Replacement 2024 Fund | 1,803,498 | 118,451 | (31,414) | 87,037 |
Fidelity Income Replacement 2026 Fund | 2,096,463 | 64,069 | (44,127) | 19,942 |
Fidelity Income Replacement 2028 Fund | 5,868,593 | 378,957 | (124,718) | 254,239 |
Fidelity Income Replacement 2030 Fund | 4,203,705 | 206,049 | (63,710) | 142,339 |
Fidelity Income Replacement 2032 Fund | 1,423,946 | 160,342 | (5,296) | 155,046 |
Fidelity Income Replacement 2034 Fund | 1,987,588 | 258,796 | (6,093) | 252,703 |
Fidelity Income Replacement 2036 Fund | 3,009,844 | 71,104 | (84,685) | (13,581) |
Fidelity Income Replacement 2038 Fund | 1,376,453 | 234,451 | (3,487) | 230,964 |
Fidelity Income Replacement 2040 Fund | 2,005,007 | 161,128 | (15,802) | 145,326 |
Fidelity Income Replacement 2042 Fund | 5,169,147 | 536,316 | (73,100) | 463,216 |
The tax-based components of distributable earnings as of period end were as follows for each Fund:
| Undistributed ordinary income | Capital loss carryforward | Net unrealized appreciation (depreciation) |
Fidelity Income Replacement 2016 Fund | $ 2,169 | $ (373,492) | $ 498,694 |
Fidelity Income Replacement 2018 Fund | 1,141 | (571,622) | 99,842 |
Fidelity Income Replacement 2020 Fund | 855 | (144,422) | 288,853 |
Fidelity Income Replacement 2022 Fund | 761 | (619,540) | (42,631) |
Fidelity Income Replacement 2024 Fund | 362 | (134,792) | 87,037 |
Fidelity Income Replacement 2026 Fund | 405 | (233,577) | 19,942 |
Fidelity Income Replacement 2028 Fund | 1,283 | (600,001) | 254,239 |
Fidelity Income Replacement 2030 Fund | 793 | (119,726) | 142,339 |
Fidelity Income Replacement 2032 Fund | 290 | (160,350) | 155,046 |
Fidelity Income Replacement 2034 Fund | 426 | (106,484) | 252,703 |
Fidelity Income Replacement 2036 Fund | 528 | (206,608) | (13,581) |
Fidelity Income Replacement 2038 Fund | 293 | (60,057) | 230,964 |
Fidelity Income Replacement 2040 Fund | 368 | (169,960) | 145,326 |
Fidelity Income Replacement 2042 Fund | 1,108 | (51,392) | 463,216 |
Under the recently enacted Regulated Investment Company Modernization Act of 2010 (the Act), the Funds will be permitted to carry forward capital losses incurred in taxable years beginning after December 22, 2010 for an unlimited period. However, any losses incurred during those future taxable years will be required to be utilized prior to any losses incurred in pre-enactment taxable years, which generally expire after eight years from when they are incurred. Additionally, post-enactment capital losses that are carried forward will retain their character as either short-term or long-term capital losses rather than being considered all short-term as under previous law. The Funds' first fiscal year end subject to the Act will be July 31, 2012.
Annual Report
Notes to Financial Statements - continued
2. Significant Accounting Policies - continued
Income Tax Information and Distributions to Shareholders - continued
The tax character of distributions paid was as follows:
July 31, 2011 | Ordinary Income |
Fidelity Income Replacement 2016 Fund | $ 253,172 |
Fidelity Income Replacement 2018 Fund | 135,712 |
Fidelity Income Replacement 2020 Fund | 88,505 |
Fidelity Income Replacement 2022 Fund | 70,615 |
Fidelity Income Replacement 2024 Fund | 36,771 |
Fidelity Income Replacement 2026 Fund | 28,540 |
Fidelity Income Replacement 2028 Fund | 142,480 |
Fidelity Income Replacement 2030 Fund | 65,364 |
Fidelity Income Replacement 2032 Fund | 47,734 |
Fidelity Income Replacement 2034 Fund | 45,760 |
Fidelity Income Replacement 2036 Fund | 40,481 |
Fidelity Income Replacement 2038 Fund | 50,042 |
Fidelity Income Replacement 2040 Fund | 41,637 |
Fidelity Income Replacement 2042 Fund | 99,646 |
July 31, 2010 | |
Fidelity Income Replacement 2016 Fund | 216,155 |
Fidelity Income Replacement 2018 Fund | 117,493 |
Fidelity Income Replacement 2020 Fund | 65,924 |
Fidelity Income Replacement 2022 Fund | 76,907 |
Fidelity Income Replacement 2024 Fund | 35,066 |
Fidelity Income Replacement 2026 Fund | 15,476 |
Fidelity Income Replacement 2028 Fund | 148,030 |
Fidelity Income Replacement 2030 Fund | 16,070 |
Fidelity Income Replacement 2032 Fund | 20,828 |
Fidelity Income Replacement 2034 Fund | 46,782 |
Fidelity Income Replacement 2036 Fund | 23,692 |
Fidelity Income Replacement 2038 Fund | 53,521 |
Fidelity Income Replacement 2040 Fund | 26,066 |
Fidelity Income Replacement 2042 Fund | 65,451 |
3. Purchases and Sales of Investments.
Purchases and redemptions of the Underlying Fund shares are noted in the table below.
| Purchases ($) | Redemptions ($) |
Fidelity Income Replacement 2016 Fund | 3,411,699 | 5,113,582 |
Fidelity Income Replacement 2018 Fund | 2,212,548 | 2,768,533 |
Fidelity Income Replacement 2020 Fund | 2,254,449 | 1,884,536 |
Fidelity Income Replacement 2022 Fund | 1,483,843 | 896,535 |
Fidelity Income Replacement 2024 Fund | 654,679 | 445,200 |
Fidelity Income Replacement 2026 Fund | 1,385,169 | 367,772 |
Fidelity Income Replacement 2028 Fund | 1,086,293 | 1,727,078 |
Fidelity Income Replacement 2030 Fund | 2,895,282 | 737,307 |
Fidelity Income Replacement 2032 Fund | 913,151 | 1,254,850 |
Fidelity Income Replacement 2034 Fund | 950,303 | 767,953 |
Fidelity Income Replacement 2036 Fund | 2,093,941 | 361,646 |
Fidelity Income Replacement 2038 Fund | 365,232 | 1,259,437 |
Fidelity Income Replacement 2040 Fund | 1,775,854 | 1,383,111 |
Fidelity Income Replacement 2042 Fund | 2,357,514 | 700,626 |
Annual Report
4. Fees and Other Transactions with Affiliates.
Management Fee. Strategic Advisers, Inc. (Strategic Advisers), an affiliate of FMR, provides the Funds with investment management related services. The Funds do not pay any fees for these services. Under the management contract, Strategic Advisers pays all other fund-level expenses, except the compensation of the independent Trustees and certain other expenses such as interest expense. The management fee paid by each Fund is reduced by an amount equal to the fees and expenses paid by the Fund to the independent Trustees.
Distribution and Service Plan Fees. In accordance with Rule 12b-1 of the 1940 Act, the Fund has adopted separate Distribution and Service Plans for each class of shares. Certain classes pay Fidelity Distributors Corporation (FDC), an affiliate of FMR, separate Distribution and Service Fees, each of which is based on an annual percentage of each class' average net assets. In addition, FDC may pay financial intermediaries for selling shares of the Fund and providing shareholder support services. For the period, the Distribution and Service Fee rates, total fees and amounts retained by FDC were as follows:
Fidelity Income Replacement 2016 Fund | Distribution
Fee | Service
Fee | Total
Fees | Retained
by FDC |
Class A | -% | .25% | $ 5,200 | $ 7 |
Class T | .25% | .25% | 2,994 | 6 |
Class C | .75% | .25% | 11,323 | 622 |
| | | $ 19,517 | $ 635 |
Fidelity Income Replacement 2018 Fund | | | | |
Class A | -% | .25% | $ 2,705 | $ 30 |
Class T | .25% | .25% | 410 | 8 |
Class C | .75% | .25% | 2,027 | 371 |
| | | $ 5,142 | $ 409 |
Fidelity Income Replacement 2020 Fund | | | | |
Class A | -% | .25% | $ 1,503 | $ 520 |
Class T | .25% | .25% | 802 | 4 |
Class C | .75% | .25% | 2,815 | 136 |
| | | $ 5,120 | $ 660 |
Fidelity Income Replacement 2022 Fund | | | | |
Class A | -% | .25% | $ 158 | $ 4 |
Class T | .25% | .25% | 298 | 12 |
Class C | .75% | .25% | 380 | 139 |
| | | $ 836 | $ 155 |
Fidelity Income Replacement 2024 Fund | | | | |
Class A | -% | .25% | $ 624 | $ 13 |
Class T | .25% | .25% | 235 | 161 |
Class C | .75% | .25% | 1,698 | 42 |
| | | $ 2,557 | $ 216 |
Fidelity Income Replacement 2026 Fund | | | | |
Class A | -% | .25% | $ 135 | $ 28 |
Class T | .25% | .25% | 628 | 28 |
Class C | .75% | .25% | 1,841 | 88 |
| | | $ 2,604 | $ 144 |
Fidelity Income Replacement 2028 Fund | | | | |
Class A | -% | .25% | $ 847 | $ 26 |
Class T | .25% | .25% | 700 | 4 |
Class C | .75% | .25% | 522 | 1 |
| | | $ 2,069 | $ 31 |
Fidelity Income Replacement 2030 Fund | | | | |
Class A | -% | .25% | $ 167 | $ 34 |
Class T | .25% | .25% | 96 | 56 |
Class C | .75% | .25% | 2,187 | 418 |
| | | $ 2,450 | $ 508 |
Fidelity Income Replacement 2032 Fund | | | | |
Class A | -% | .25% | $ 556 | $ 13 |
Class T | .25% | .25% | 152 | 152 |
Class C | .75% | .25% | 259 | 259 |
| | | $ 967 | $ 424 |
Annual Report
Notes to Financial Statements - continued
4. Fees and Other Transactions with Affiliates - continued
Distribution and Service Plan Fees - continued
Fidelity Income Replacement 2034 Fund | Distribution
Fee | Service
Fee | Total
Fees | Retained
by FDC |
Class A | -% | .25% | $ 59 | $ 59 |
Class T | .25% | .25% | 150 | 150 |
Class C | .75% | .25% | 235 | 235 |
| | | $ 444 | $ 444 |
Fidelity Income Replacement 2036 Fund | | | | |
Class A | -% | .25% | $ 89 | $ 72 |
Class T | .25% | .25% | 1,458 | 28 |
Class C | .75% | .25% | 1,366 | 151 |
| | | $ 2,913 | $ 251 |
Fidelity Income Replacement 2038 Fund | | | | |
Class A | -% | .25% | $ 83 | $ 4 |
Class T | .25% | .25% | 214 | 166 |
Class C | .75% | .25% | 799 | 606 |
| | | $ 1,096 | $ 776 |
Fidelity Income Replacement 2040 Fund | | | | |
Class A | -% | .25% | $ 133 | $ 74 |
Class T | .25% | .25% | 626 | 30 |
Class C | .75% | .25% | 876 | 688 |
| | | $ 1,635 | $ 792 |
Fidelity Income Replacement 2042 Fund | | | | |
Class A | -% | .25% | $ 65 | $ 30 |
Class T | .25% | .25% | 167 | 167 |
Class C | .75% | .25% | 328 | 328 |
| | | $ 560 | $ 525 |
Sales Load. FDC may receive a front-end sales charge of up to 5.75% for selling Class A shares, and 3.50% for selling Class T shares, some of which is paid to financial intermediaries for selling shares of the Fund. Depending on the holding period, FDC may receive contingent deferred sales charges levied on Class A, Class T and Class C redemptions. These charges depend on the holding period. The deferred sales charges range from 1% for Class C, 1.00% for certain purchases of Class A shares and .25% for certain purchases of Class T shares.
For the period, sales charge amounts retained by FDC were as follows:
Fidelity Income Replacement 2016 Fund | Retained
by FDC |
Class A | $ 257 |
Class C* | 9 |
| 266 |
Fidelity Income Replacement 2018 Fund | |
Class A | $ 563 |
Fidelity Income Replacement 2020 Fund | |
Class A | $ 2 |
Fidelity Income Replacement 2022 Fund | |
Class A | $ 215 |
Fidelity Income Replacement 2026 Fund | |
Class A | $ 622 |
Class T | 9 |
| $ 631 |
Fidelity Income Replacement 2030 Fund | |
Class A | $ 212 |
Class C* | 3 |
| $ 215 |
Annual Report
4. Fees and Other Transactions with Affiliates - continued
Sales Load - continued
Fidelity Income Replacement 2036 Fund | Retained
by FDC |
Class T | $ 3 |
Class C* | 4 |
| $ 7 |
Fidelity Income Replacement 2040 Fund | |
Class A | $ 441 |
* When Class C shares are initially sold, FDC pays commissions from its own resources to financial intermediaries through which the sales are made.
5. Expense Reductions.
FMR voluntarily agreed to reimburse the Funds to the extent annual operating expenses exceeded distribution and service fees applicable to each class. Some expenses, for example interest expense, are excluded from this reimbursement.
The following Funds were in reimbursement during the period:
| Reimbursement
from adviser* |
Fidelity Income Replacement 2016 Fund | 40 |
Fidelity Income Replacement 2018 Fund | 21 |
Fidelity Income Replacement 2020 Fund | 14 |
Fidelity Income Replacement 2022 Fund | 11 |
Fidelity Income Replacement 2024 Fund | 6 |
Fidelity Income Replacement 2026 Fund | 5 |
Fidelity Income Replacement 2028 Fund | 23 |
Fidelity Income Replacement 2030 Fund | 10 |
Fidelity Income Replacement 2032 Fund | 7 |
Fidelity Income Replacement 2034 Fund | 7 |
Fidelity Income Replacement 2036 Fund | 6 |
Fidelity Income Replacement 2038 Fund | 7 |
Fidelity Income Replacement 2040 Fund | 7 |
Fidelity Income Replacement 2042 Fund | 16 |
* Represents total amount reimbursed to the Fund. Each class has received pro-rata allocation of reimbursement.
6. Distributions to Shareholders.
Distributions to shareholders of each class were as follows:
Years ended July 31, | 2011 | 2010 |
Fidelity Income Replacement 2016 Fund | | |
From net investment income | | |
Class A | $ 34,923 | $ 44,617 |
Class T | 8,720 | 10,060 |
Class C | 10,052 | 12,552 |
Income Replacement 2016 | 138,777 | 120,802 |
Institutional Class | 1,953 | 2,291 |
Total | $ 194,425 | $ 190,322 |
From net realized gain | | |
Class A | $ 11,231 | $ 6,094 |
Class T | 3,381 | 1,771 |
Class C | 6,082 | 3,226 |
Income Replacement 2016 | 37,507 | 14,426 |
Institutional Class | 546 | 316 |
Total | $ 58,747 | $ 25,833 |
Annual Report
Notes to Financial Statements - continued
6. Distributions to Shareholders - continued
Years ended July 31, | 2011 | 2010 |
Fidelity Income Replacement 2018 Fund | | |
From net investment income | | |
Class A | $ 18,636 | $ 17,039 |
Class T | 1,201 | 1,142 |
Class C | 1,971 | 1,710 |
Income Replacement 2018 | 78,313 | 76,857 |
Institutional Class | 6,785 | 7,202 |
Total | $ 106,906 | $ 103,950 |
From net realized gain | | |
Class A | $ 5,977 | $ 2,282 |
Class T | 252 | 200 |
Class C | 980 | 353 |
Income Replacement 2018 | 19,822 | 9,798 |
Institutional Class | 1,775 | 910 |
Total | $ 28,806 | $ 13,543 |
Fidelity Income Replacement 2020 Fund | | |
From net investment income | | |
Class A | $ 10,048 | $ 11,250 |
Class T | 2,330 | 2,566 |
Class C | 2,700 | 2,829 |
Income Replacement 2020 | 55,571 | 39,529 |
Institutional Class | 898 | 2,036 |
Total | $ 71,547 | $ 58,210 |
From net realized gain | | |
Class A | $ 2,797 | $ 1,618 |
Class T | 638 | 468 |
Class C | 1,402 | 667 |
Income Replacement 2020 | 11,887 | 4,645 |
Institutional Class | 234 | 316 |
Total | $ 16,958 | $ 7,714 |
Fidelity Income Replacement 2022 Fund | | |
From net investment income | | |
Class A | $ 1,130 | $ 760 |
Class T | 862 | 1,377 |
Class C | 326 | 583 |
Income Replacement 2022 | 55,484 | 52,195 |
Institutional Class | 83 | 2,258 |
Total | $ 57,885 | $ 57,173 |
From net realized gain | | |
Class A | $ 313 | $ 290 |
Class T | 343 | 657 |
Class C | 169 | 426 |
Income Replacement 2022 | 11,885 | 17,200 |
Institutional Class | 20 | 1,161 |
Total | $ 12,730 | $ 19,734 |
Fidelity Income Replacement 2024 Fund | | |
From net investment income | | |
Class A | $ 4,200 | $ 5,225 |
Class T | 640 | 1,024 |
Class C | 1,582 | 1,614 |
Income Replacement 2024 | 22,670 | 22,024 |
Institutional Class | 601 | 946 |
Total | $ 29,693 | $ 30,833 |
Annual Report
6. Distributions to Shareholders - continued
Years ended July 31, | 2011 | 2010 |
From net realized gain | | |
Class A | $ 1,169 | $ 733 |
Class T | 211 | 173 |
Class C | 755 | 389 |
Income Replacement 2024 | 4,799 | 2,820 |
Institutional Class | 144 | 118 |
Total | $ 7,078 | $ 4,233 |
Fidelity Income Replacement 2026 Fund | | |
From net investment income | | |
Class A | $ 847 | $ 1,002 |
Class T | 1,742 | 1,567 |
Class C | 1,651 | 1,940 |
Income Replacement 2026 | 19,092 | 8,207 |
Institutional Class | 582 | 937 |
Total | $ 23,914 | $ 13,653 |
From net realized gain | | |
Class A | $ 163 | $ 145 |
Class T | 515 | 294 |
Class C | 762 | 484 |
Income Replacement 2026 | 3,053 | 782 |
Institutional Class | 133 | 118 |
Total | $ 4,626 | $ 1,823 |
Fidelity Income Replacement 2028 Fund | | |
From net investment income | | |
Class A | $ 5,819 | $ 6,274 |
Class T | 1,766 | 5,032 |
Class C | 483 | 669 |
Income Replacement 2028 | 108,055 | 118,159 |
Institutional Class | 594 | 931 |
Total | $ 116,717 | $ 131,065 |
From net realized gain | | |
Class A | $ 1,624 | $ 885 |
Class T | 551 | 821 |
Class C | 224 | 172 |
Income Replacement 2028 | 23,226 | 14,970 |
Institutional Class | 138 | 117 |
Total | $ 25,763 | $ 16,965 |
Fidelity Income Replacement 2030 Fund | | |
From net investment income | | |
Class A | $ 1,034 | $ 944 |
Class T | 193 | 802 |
Class C | 2,028 | 1,647 |
Income Replacement 2030 | 50,801 | 9,950 |
Institutional Class | 585 | 870 |
Total | $ 54,641 | $ 14,213 |
From net realized gain | | |
Class A | $ 210 | $ 112 |
Class T | 35 | 143 |
Class C | 777 | 448 |
Income Replacement 2030 | 9,584 | 1,042 |
Institutional Class | 117 | 112 |
Total | $ 10,723 | $ 1,857 |
Annual Report
Notes to Financial Statements - continued
6. Distributions to Shareholders - continued
Years ended July 31, | 2011 | 2010 |
Fidelity Income Replacement 2032 Fund | | |
From net investment income | | |
Class A | $ 3,720 | $ 3,578 |
Class T | 432 | 726 |
Class C | 229 | 409 |
Income Replacement 2032 | 33,843 | 12,987 |
Institutional Class | 1,022 | 990 |
Total | $ 39,246 | $ 18,690 |
From net realized gain | | |
Class A | $ 874 | $ 469 |
Class T | 125 | 112 |
Class C | 104 | 93 |
Income Replacement 2032 | 7,076 | 1,351 |
Institutional Class | 309 | 113 |
Total | $ 8,488 | $ 2,138 |
Fidelity Income Replacement 2034 Fund | | |
From net investment income | | |
Class A | $ 364 | $ 592 |
Class T | 408 | 675 |
Class C | 191 | 337 |
Income Replacement 2034 | 34,754 | 34,804 |
Institutional Class | 1,932 | 1,910 |
Total | $ 37,649 | $ 38,318 |
From net realized gain | | |
Class A | $ 99 | $ 165 |
Class T | 130 | 218 |
Class C | 99 | 166 |
Income Replacement 2034 | 7,355 | 7,479 |
Institutional Class | 428 | 436 |
Total | $ 8,111 | $ 8,464 |
Fidelity Income Replacement 2036 Fund | | |
From net investment income | | |
Class A | $ 555 | $ 811 |
Class T | 3,944 | 4,274 |
Class C | 1,241 | 1,320 |
Income Replacement 2036 | 26,829 | 12,138 |
Institutional Class | 1,583 | 1,200 |
Total | $ 34,152 | $ 19,743 |
From net realized gain | | |
Class A | $ 116 | $ 162 |
Class T | 928 | 958 |
Class C | 398 | 467 |
Income Replacement 2036 | 4,588 | 2,158 |
Institutional Class | 299 | 204 |
Total | $ 6,329 | $ 3,949 |
Fidelity Income Replacement 2038 Fund | | |
From net investment income | | |
Class A | $ 565 | $ 1,542 |
Class T | 664 | 689 |
Class C | 725 | 569 |
Income Replacement 2038 | 37,593 | 40,695 |
Institutional Class | 634 | 942 |
Total | $ 40,181 | $ 44,437 |
Annual Report
6. Distributions to Shareholders - continued
Years ended July 31, | 2011 | 2010 |
From net realized gain | | |
Class A | $ 135 | $ 413 |
Class T | 137 | 207 |
Class C | 333 | 205 |
Income Replacement 2038 | 9,117 | 8,050 |
Institutional Class | 139 | 209 |
Total | $ 9,861 | $ 9,084 |
Fidelity Income Replacement 2040 Fund | | |
From net investment income | | |
Class A | $ 1,176 | $ 1,022 |
Class T | 1,854 | 1,586 |
Class C | 859 | 487 |
Income Replacement 2040 | 29,421 | 18,680 |
Institutional Class | 1,064 | 1,444 |
Total | $ 34,374 | $ 23,219 |
From net realized gain | | |
Class A | $ 360 | $ 174 |
Class T | 502 | 273 |
Class C | 361 | 112 |
Income Replacement 2040 | 5,813 | 2,099 |
Institutional Class | 227 | 189 |
Total | $ 7,263 | $ 2,847 |
Fidelity Income Replacement 2042 Fund | | |
From net investment income | | |
Class A | $ 425 | $1,305 |
Class T | 459 | 687 |
Class C | 302 | 442 |
Income Replacement 2042 | 82,219 | 54,565 |
Institutional Class | 637 | 944 |
Total | $ 84,042 | $ 57,943 |
From net realized gain | | |
Class A | $ 108 | $ 247 |
Class T | 138 | 121 |
Class C | 136 | 120 |
Income Replacement 2042 | 15,082 | 6,898 |
Institutional Class | 140 | 122 |
Total | $ 15,604 | $ 7,508 |
7. Share Transactions.
Transactions for each class of shares were as follows:
| Shares | Dollars |
Years ended July 31, | 2011 | 2010 | 2011 | 2010 |
Fidelity Income Replacement 2016 Fund | | | | |
Class A | | | | |
Shares sold | 1,492 | 10,966 | $ 72,585 | $ 505,595 |
Reinvestment of distributions | 780 | 904 | 38,177 | 41,700 |
Shares redeemed | (15,236) | (22,378) | (747,263) | (1,033,263) |
Net increase (decrease) | (12,964) | (10,508) | $ (636,501) | $ (485,968) |
Class T | | | | |
Shares sold | - | 6,546 | $ - | $ 302,409 |
Reinvestment of distributions | 201 | 199 | 9,845 | 9,206 |
Shares redeemed | (3,144) | (4,625) | (154,952) | (215,246) |
Net increase (decrease) | (2,943) | 2,120 | $ (145,107) | $ 96,369 |
Annual Report
Notes to Financial Statements - continued
7. Share Transactions - continued
| Shares | Dollars |
Years ended July 31, | 2011 | 2010 | 2011 | 2010 |
Class C | | | | |
Shares sold | 2,527 | 3,920 | $ 125,000 | $ 176,110 |
Reinvestment of distributions | 238 | 252 | 11,623 | 11,639 |
Shares redeemed | (10,384) | (8,175) | (518,601) | (376,188) |
Net increase (decrease) | (7,619) | (4,003) | $ (381,978) | $ (188,439) |
Income Replacement 2016 | | | | |
Shares sold | 39,876 | 78,978 | $ 1,956,078 | $ 3,659,239 |
Reinvestment of distributions | 1,346 | 721 | 66,013 | 33,372 |
Shares redeemed | (50,919) | (40,547) | (2,509,419) | (1,866,323) |
Net increase (decrease) | (9,697) | 39,152 | $ (487,328) | $ 1,826,288 |
Institutional Class | | | | |
Shares sold | 841 | 751 | $ 41,400 | $ 34,781 |
Reinvestment of distributions | 8 | 15 | 403 | 690 |
Shares redeemed | (2,264) | (975) | (113,147) | (44,681) |
Net increase (decrease) | (1,415) | (209) | $ (71,344) | $ (9,210) |
Fidelity Income Replacement 2018 Fund | | | | |
Class A | | | | |
Shares sold | 1,564 | 6,590 | $ 72,093 | $ 305,640 |
Reinvestment of distributions | 230 | 248 | 11,233 | 11,354 |
Shares redeemed | (10,781) | (1,601) | (535,725) | (73,103) |
Net increase (decrease) | (8,987) | 5,237 | $ (452,399) | $ 243,891 |
Class T | | | | |
Shares sold | 2,045 | - | $ 102,042 | $ - |
Reinvestment of distributions | 14 | 21 | 665 | 968 |
Shares redeemed | (207) | (1,030) | (10,225) | (46,978) |
Net increase (decrease) | 1,852 | (1,009) | $ 92,482 | $ (46,010) |
Class C | | | | |
Shares sold | 697 | 1,627 | $ 35,000 | $ 75,000 |
Reinvestment of distributions | 46 | 26 | 2,243 | 1,209 |
Shares redeemed | (541) | (373) | (26,508) | (17,000) |
Net increase (decrease) | 202 | 1,280 | $ 10,735 | $ 59,209 |
Income Replacement 2018 | | | | |
Shares sold | 27,556 | 11,957 | $ 1,335,152 | $ 541,219 |
Reinvestment of distributions | 432 | 258 | 21,162 | 11,837 |
Shares redeemed | (30,915) | (13,199) | (1,518,106) | (594,109) |
Net increase (decrease) | (2,927) | (984) | $ (161,792) | $ (41,053) |
Institutional Class | | | | |
Shares sold | - | - | $ - | $ - |
Reinvestment of distributions | 6 | 8 | 294 | 361 |
Shares redeemed | (1,111) | (100) | (54,894) | (4,500) |
Net increase (decrease) | (1,105) | (92) | $ (54,600) | $ (4,139) |
Fidelity Income Replacement 2020 Fund | | | | |
Class A | | | | |
Shares sold | 5 | 4,988 | $ 266 | $ 223,504 |
Reinvestment of distributions | 193 | 166 | 9,448 | 7,568 |
Shares redeemed | (4,655) | (3,855) | (230,357) | (179,660) |
Net increase (decrease) | (4,457) | 1,299 | $ (220,643) | $ 51,412 |
Class T | | | | |
Shares sold | 1,002 | 1,680 | $ 50,063 | $ 80,000 |
Reinvestment of distributions | 56 | 67 | 2,725 | 3,033 |
Shares redeemed | (41) | (2,893) | (2,073) | (131,000) |
Net increase (decrease) | 1,017 | (1,146) | $ 50,715 | $ (47,967) |
Class C | | | | |
Shares sold | - | 1,102 | $ - | $ 49,985 |
Reinvestment of distributions | 59 | 67 | 2,866 | 3,032 |
Shares redeemed | (1,882) | - | (93,646) | - |
Net increase (decrease) | (1,823) | 1,169 | $ (90,780) | $ 53,017 |
Annual Report
7. Share Transactions - continued
| Shares | Dollars |
Years ended July 31, | 2011 | 2010 | 2011 | 2010 |
Income Replacement 2020 | | | | |
Shares sold | 36,410 | 20,661 | $ 1,796,170 | $ 932,116 |
Reinvestment of distributions | 417 | 202 | 20,472 | 9,173 |
Shares redeemed | (23,522) | (10,998) | (1,171,587) | (493,006) |
Net increase (decrease) | 13,305 | 9,865 | $ 645,055 | $ 448,283 |
Institutional Class | | | | |
Shares sold | 397 | 996 | $ 20,000 | $ 45,000 |
Reinvestment of distributions | 23 | 25 | 1,132 | 1,133 |
Shares redeemed | (833) | (2,202) | (41,702) | (99,518) |
Net increase (decrease) | (413) | (1,181) | $ (20,570) | $ (53,385) |
Fidelity Income Replacement 2022 Fund | | | | |
Class A | | | | |
Shares sold | 567 | - | $ 27,240 | $ - |
Reinvestment of distributions | 15 | 8 | 735 | 338 |
Shares redeemed | (67) | (2,006) | (3,203) | (84,777) |
Net increase (decrease) | 515 | (1,998) | $ 24,772 | $ (84,439) |
Class T | | | | |
Shares sold | - | 1,105 | $ - | $ 48,498 |
Reinvestment of distributions | 15 | 31 | 718 | 1,374 |
Shares redeemed | (1,248) | (2,115) | (61,978) | (94,162) |
Net increase (decrease) | (1,233) | (979) | $ (61,260) | $ (44,290) |
Class C | | | | |
Shares sold | - | - | $ - | $ - |
Reinvestment of distributions | 4 | 14 | 172 | 640 |
Shares redeemed | (319) | (699) | (15,279) | (31,230) |
Net increase (decrease) | (315) | (685) | $ (15,107) | $ (30,590) |
Income Replacement 2022 | | | | |
Shares sold | 23,188 | 9,043 | $ 1,142,442 | $ 391,098 |
Reinvestment of distributions | 293 | 462 | 14,318 | 20,398 |
Shares redeemed | (10,448) | (13,142) | (520,826) | (587,330) |
Net increase (decrease) | 13,033 | (3,637) | $ 635,934 | $ (175,834) |
Institutional Class | | | | |
Shares sold | - | - | $ - | $ - |
Reinvestment of distributions | 2 | 4 | 103 | 166 |
Shares redeemed | (37) | (3,867) | (1,783) | (173,132) |
Net increase (decrease) | (35) | (3,863) | $ (1,680) | $ (172,966) |
Fidelity Income Replacement 2024 Fund | | | | |
Class A | | | | |
Shares sold | 117 | - | $ 5,864 | $ - |
Reinvestment of distributions | 86 | 108 | 4,191 | 4,833 |
Shares redeemed | (2,180) | (1,295) | (108,524) | (57,768) |
Net increase (decrease) | (1,977) | (1,187) | $ (98,469) | $ (52,935) |
Class T | | | | |
Shares sold | - | 295 | $ - | $ 13,015 |
Reinvestment of distributions | 17 | 27 | 851 | 1,197 |
Shares redeemed | (392) | (804) | (18,805) | (35,887) |
Net increase (decrease) | (375) | (482) | $ (17,954) | $ (21,675) |
Class C | | | | |
Shares sold | - | - | $ - | $ - |
Reinvestment of distributions | 19 | 19 | 922 | 835 |
Shares redeemed | (74) | (71) | (3,621) | (2,945) |
Net increase (decrease) | (55) | (52) | $ (2,699) | $ (2,110) |
Annual Report
Notes to Financial Statements - continued
7. Share Transactions - continued
| Shares | Dollars |
Years ended July 31, | 2011 | 2010 | 2011 | 2010 |
Income Replacement 2024 | | | | |
Shares sold | 9,431 | 9,741 | $ 469,295 | $ 422,106 |
Reinvestment of distributions | 156 | 143 | 7,661 | 6,430 |
Shares redeemed | (2,819) | (5,344) | (138,862) | (239,126) |
Net increase (decrease) | 6,768 | 4,540 | $ 338,094 | $ 189,410 |
Institutional Class | | | | |
Shares sold | - | - | $ - | $ - |
Reinvestment of distributions | 15 | 24 | 745 | 1,064 |
Shares redeemed | (268) | (580) | (12,871) | (25,832) |
Net increase (decrease) | (253) | (556) | $ (12,126) | $ (24,768) |
Fidelity Income Replacement 2026 Fund | | | | |
Class A | | | | |
Shares sold | 1,608 | - | $ 79,966 | $ - |
Reinvestment of distributions | 16 | 26 | 777 | 1,147 |
Shares redeemed | (434) | (713) | (20,829) | (31,427) |
Net increase (decrease) | 1,190 | (687) | $ 59,914 | $ (30,280) |
Class T | | | | |
Shares sold | 187 | 2,332 | $ 8,556 | $ 103,846 |
Reinvestment of distributions | 38 | 39 | 1,819 | 1,739 |
Shares redeemed | (172) | (1,146) | (7,742) | (50,896) |
Net increase (decrease) | 53 | 1,225 | $ 2,633 | $ 54,689 |
Class C | | | | |
Shares sold | - | - | $ - | $ - |
Reinvestment of distributions | 50 | 55 | 2,413 | 2,424 |
Shares redeemed | (206) | (653) | (9,967) | (29,483) |
Net increase (decrease) | (156) | (598) | $ (7,554) | $ (27,059) |
Income Replacement 2026 | | | | |
Shares sold | 24,011 | 11,631 | $ 1,180,279 | $ 516,873 |
Reinvestment of distributions | 233 | 139 | 11,328 | 6,162 |
Shares redeemed | (4,444) | (6,640) | (219,154) | (295,846) |
Net increase (decrease) | 19,800 | 5,130 | $ 972,453 | $ 227,189 |
Institutional Class | | | | |
Shares sold | - | - | $ - | $ - |
Reinvestment of distributions | 15 | 24 | 715 | 1,055 |
Shares redeemed | (269) | (581) | (12,796) | (25,621) |
Net increase (decrease) | (254) | (557) | $ (12,081) | $ (24,566) |
Fidelity Income Replacement 2028 Fund | | | | |
Class A | | | | |
Shares sold | - | 1,688 | $ - | $ 71,316 |
Reinvestment of distributions | 153 | 161 | 7,443 | 7,159 |
Shares redeemed | (5,420) | (672) | (273,625) | (29,955) |
Net increase (decrease) | (5,267) | 1,177 | $ (266,182) | $ 48,520 |
Class T | | | | |
Shares sold | - | - | $ - | $ - |
Reinvestment of distributions | 24 | 46 | 1,194 | 2,069 |
Shares redeemed | (4,677) | (340) | (209,519) | (15,095) |
Net increase (decrease) | (4,653) | (294) | $ (208,325) | $ (13,026) |
Class C | | | | |
Shares sold | - | - | $ - | $ - |
Reinvestment of distributions | 4 | 8 | 180 | 379 |
Shares redeemed | (148) | (965) | (7,212) | (42,703) |
Net increase (decrease) | (144) | (957) | $ (7,032) | $ (42,324) |
Income Replacement 2028 | | | | |
Shares sold | 9,722 | 7,291 | $ 477,899 | $ 328,341 |
Reinvestment of distributions | 871 | 860 | 42,621 | 38,493 |
Shares redeemed | (13,911) | (26,019) | (676,445) | (1,168,445) |
Net increase (decrease) | (3,318) | (17,868) | $ (155,925) | $ (801,611) |
Annual Report
7. Share Transactions - continued
| Shares | Dollars |
Years ended July 31, | 2011 | 2010 | 2011 | 2010 |
Institutional Class | | | | |
Shares sold | - | - | $ - | $ - |
Reinvestment of distributions | 15 | 24 | 732 | 1,048 |
Shares redeemed | (266) | (575) | (12,757) | (25,500) |
Net increase (decrease) | (251) | (551) | $ (12,025) | $ (24,452) |
Fidelity Income Replacement 2030 Fund | | | | |
Class A | | | | |
Shares sold | 534 | 1,608 | $ 26,388 | $ 70,708 |
Reinvestment of distributions | 10 | 22 | 506 | 972 |
Shares redeemed | (578) | (1,510) | (27,630) | (65,796) |
Net increase (decrease) | (34) | 120 | $ (736) | $ 5,884 |
Class T | | | | |
Shares sold | 130 | - | $ 6,467 | $ - |
Reinvestment of distributions | 4 | 14 | 177 | 632 |
Shares redeemed | (839) | (767) | (39,979) | (33,663) |
Net increase (decrease) | (705) | (753) | $ (33,335) | $ (33,031) |
Class C | | | | |
Shares sold | 2,512 | - | $ 125,006 | $ - |
Reinvestment of distributions | 56 | 47 | 2,702 | 2,094 |
Shares redeemed | (1,287) | (250) | (63,685) | (10,986) |
Net increase (decrease) | 1,281 | (203) | $ 64,023 | $ (8,892) |
Income Replacement 2030 | | | | |
Shares sold | 52,301 | 30,831 | $ 2,568,351 | $ 1,381,260 |
Reinvestment of distributions | 466 | 68 | 22,746 | 3,035 |
Shares redeemed | (9,315) | (1,995) | (455,782) | (90,075) |
Net increase (decrease) | 43,452 | 28,904 | $ 2,135,315 | $ 1,294,220 |
Institutional Class | | | | |
Shares sold | - | - | $ - | $ - |
Reinvestment of distributions | 14 | 22 | 702 | 982 |
Shares redeemed | (267) | (578) | (12,724) | (25,388) |
Net increase (decrease) | (253) | (556) | $ (12,022) | $ (24,406) |
Fidelity Income Replacement 2032 Fund | | | | |
Class A | | | | |
Shares sold | 1,251 | - | $ 61,087 | $ - |
Reinvestment of distributions | 92 | 93 | 4,419 | 4,047 |
Shares redeemed | (1,523) | (107) | (74,213) | (4,502) |
Net increase (decrease) | (180) | (14) | $ (8,707) | $ (455) |
Class T | | | | |
Shares sold | - | - | $ - | $ - |
Reinvestment of distributions | 12 | 19 | 557 | 838 |
Shares redeemed | (266) | (575) | (12,454) | (24,937) |
Net increase (decrease) | (254) | (556) | $ (11,897) | $ (24,099) |
Class C | | | | |
Shares sold | - | - | $ - | $ - |
Reinvestment of distributions | 7 | 12 | 333 | 502 |
Shares redeemed | (221) | (480) | (10,354) | (20,831) |
Net increase (decrease) | (214) | (468) | $ (10,021) | $ (20,329) |
Income Replacement 2032 | | | | |
Shares sold | 13,347 | 20,546 | $ 630,717 | $ 869,619 |
Reinvestment of distributions | 561 | 269 | 27,010 | 11,717 |
Shares redeemed | (18,955) | (21,297) | (922,796) | (886,611) |
Net increase (decrease) | (5,047) | (482) | $ (265,069) | $ (5,275) |
Institutional Class | | | | |
Shares sold | 550 | 565 | $ 25,000 | $ 25,000 |
Reinvestment of distributions | 11 | 25 | 530 | 1,078 |
Shares redeemed | (1,556) | (582) | (74,627) | (25,236) |
Net increase (decrease) | (995) | 8 | $ (49,097) | $ 842 |
Annual Report
Notes to Financial Statements - continued
7. Share Transactions - continued
| Shares | Dollars |
Years ended July 31, | 2011 | 2010 | 2011 | 2010 |
Fidelity Income Replacement 2034 Fund | | | | |
Class A | | | | |
Shares sold | - | - | $ - | $ - |
Reinvestment of distributions | 10 | 17 | 462 | 757 |
Shares redeemed | (199) | (984) | (9,387) | (41,642) |
Net increase (decrease) | (189) | (967) | $ (8,925) | $ (40,885) |
Class T | | | | |
Shares sold | - | - | $ - | $ - |
Reinvestment of distributions | 11 | 20 | 538 | 892 |
Shares redeemed | (263) | (569) | (12,373) | (24,737) |
Net increase (decrease) | (252) | (549) | $ (11,835) | $ (23,845) |
Class C | | | | |
Shares sold | - | - | $ - | $ - |
Reinvestment of distributions | 6 | 12 | 289 | 503 |
Shares redeemed | (199) | (434) | (9,399) | (18,880) |
Net increase (decrease) | (193) | (422) | $ (9,110) | $ (18,377) |
Income Replacement 2034 | | | | |
Shares sold | 15,037 | 5,032 | $ 741,550 | $ 225,749 |
Reinvestment of distributions | 308 | 383 | 14,854 | 16,703 |
Shares redeemed | (11,217) | (8,062) | (548,641) | (352,058) |
Net increase (decrease) | 4,128 | (2,647) | $ 207,763 | $ (109,606) |
Institutional Class | | | | |
Shares sold | - | - | $ - | $ - |
Reinvestment of distributions | 40 | 39 | 1,922 | 1,717 |
Shares redeemed | (4) | (586) | (220) | (25,063) |
Net increase (decrease) | 36 | (547) | $ 1,702 | $ (23,346) |
Fidelity Income Replacement 2036 Fund | | | | |
Class A | | | | |
Shares sold | 22 | 128 | $ 1,088 | $ 5,725 |
Reinvestment of distributions | 14 | 23 | 671 | 973 |
Shares redeemed | (305) | (600) | (14,218) | (25,767) |
Net increase (decrease) | (269) | (449) | $ (12,459) | $ (19,069) |
Class T | | | | |
Shares sold | 592 | 82 | $ 29,293 | $ 3,536 |
Reinvestment of distributions | 41 | 54 | 1,979 | 2,334 |
Shares redeemed | (810) | (756) | (39,495) | (33,710) |
Net increase (decrease) | (177) | (620) | $ (8,223) | $ (27,840) |
Class C | | | | |
Shares sold | 1,929 | 979 | $ 93,800 | $ 39,435 |
Reinvestment of distributions | 34 | 41 | 1,639 | 1,752 |
Shares redeemed | (264) | (1,217) | (12,450) | (52,088) |
Net increase (decrease) | 1,699 | (197) | $ 82,989 | $ (10,901) |
Income Replacement 2036 | | | | |
Shares sold | 36,939 | 2,159 | $ 1,794,635 | $ 86,419 |
Reinvestment of distributions | 302 | 99 | 14,515 | 4,266 |
Shares redeemed | (1,164) | (4,508) | (56,447) | (191,085) |
Net increase (decrease) | 36,077 | (2,250) | $ 1,752,703 | $ (100,400) |
Institutional Class | | | | |
Shares sold | 49 | 1,348 | $ 2,283 | $ 59,043 |
Reinvestment of distributions | 40 | 33 | 1,882 | 1,403 |
Shares redeemed | (1,881) | (723) | (90,082) | (31,039) |
Net increase (decrease) | (1,792) | 658 | $ (85,917) | $ 29,407 |
Annual Report
7. Share Transactions - continued
| Shares | Dollars |
Years ended July 31, | 2011 | 2010 | 2011 | 2010 |
Fidelity Income Replacement 2038 Fund | | | | |
Class A | | | | |
Shares sold | - | 667 | $ - | $ 28,000 |
Reinvestment of distributions | 15 | 24 | 700 | 996 |
Shares redeemed | (37) | (2,898) | (1,526) | (123,534) |
Net increase (decrease) | (22) | (2,207) | $ (826) | $ (94,538) |
Class T | | | | |
Shares sold | 2,160 | - | $ 103,818 | $ - |
Reinvestment of distributions | 13 | 21 | 597 | 896 |
Shares redeemed | (408) | (622) | (19,017) | (26,247) |
Net increase (decrease) | 1,765 | (601) | $ 85,398 | $ (25,351) |
Class C | | | | |
Shares sold | - | 1,458 | $ - | $ 65,000 |
Reinvestment of distributions | 22 | 18 | 1,058 | 774 |
Shares redeemed | (624) | (823) | (28,467) | (34,657) |
Net increase (decrease) | (602) | 653 | $ (27,409) | $ 31,117 |
Income Replacement 2038 | | | | |
Shares sold | 1,521 | 19,983 | $ 73,871 | $ 804,508 |
Reinvestment of distributions | 582 | 594 | 27,411 | 25,218 |
Shares redeemed | (21,894) | (2,784) | (1,042,929) | (118,526) |
Net increase (decrease) | (19,791) | 17,793 | $ (941,647) | $ 711,200 |
Institutional Class | | | | |
Shares sold | - | - | $ - | $ - |
Reinvestment of distributions | 16 | 27 | 773 | 1,151 |
Shares redeemed | (291) | (628) | (13,482) | (26,515) |
Net increase (decrease) | (275) | (601) | $ (12,709) | $ (25,364) |
Fidelity Income Replacement 2040 Fund | | | | |
Class A | | | | |
Shares sold | 2,779 | - | $ 131,112 | $ - |
Reinvestment of distributions | 26 | 21 | 1,246 | 909 |
Shares redeemed | (1,627) | (697) | (77,967) | (29,560) |
Net increase (decrease) | 1,178 | (676) | $ 54,391 | $ (28,651) |
Class T | | | | |
Shares sold | 59 | 766 | $ 2,795 | $ 32,205 |
Reinvestment of distributions | 50 | 44 | 2,356 | 1,859 |
Shares redeemed | (1) | (849) | (45) | (35,678) |
Net increase (decrease) | 108 | (39) | $ 5,106 | $ (1,614) |
Class C | | | | |
Shares sold | - | 1,585 | $ - | $ 67,225 |
Reinvestment of distributions | 26 | 14 | 1,220 | 599 |
Shares redeemed | (679) | (765) | (31,060) | (32,264) |
Net increase (decrease) | (653) | 834 | $ (29,840) | $ 35,560 |
Income Replacement 2040 | | | | |
Shares sold | 31,872 | 51,547 | $ 1,546,264 | $ 2,203,936 |
Reinvestment of distributions | 348 | 391 | 16,441 | 16,805 |
Shares redeemed | (24,432) | (32,503) | (1,181,522) | (1,366,427) |
Net increase (decrease) | 7,788 | 19,435 | $ 381,183 | $ 854,314 |
Institutional Class | | | | |
Shares sold | - | 857 | $ - | $ 35,012 |
Reinvestment of distributions | 27 | 39 | 1,291 | 1,633 |
Shares redeemed | (478) | (935) | (22,066) | (39,625) |
Net increase (decrease) | (451) | (39) | $ (20,775) | $ (2,980) |
Annual Report
Notes to Financial Statements - continued
7. Share Transactions - continued
| Shares | Dollars |
Years ended July 31, | 2011 | 2010 | 2011 | 2010 |
Fidelity Income Replacement 2042 Fund | | | | |
Class A | | | | |
Shares sold | 427 | 1,685 | $ 20,347 | $ 72,288 |
Reinvestment of distributions | 11 | 36 | 533 | 1,552 |
Shares redeemed | (643) | (3,326) | (30,601) | (142,410) |
Net increase (decrease) | (205) | (1,605) | $ (9,721) | $ (68,570) |
Class T | | | | |
Shares sold | - | - | $ - | $ - |
Reinvestment of distributions | 13 | 19 | 597 | 808 |
Shares redeemed | (287) | (621) | (13,228) | (26,230) |
Net increase (decrease) | (274) | (602) | $ (12,631) | $ (25,422) |
Class C | | | | |
Shares sold | - | - | $ - | $ - |
Reinvestment of distributions | 9 | 13 | 438 | 562 |
Shares redeemed | (283) | (615) | (13,030) | (25,273) |
Net increase (decrease) | (274) | (602) | $ (12,592) | $ (24,711) |
Income Replacement 2042 | | | | |
Shares sold | 40,366 | 45,150 | $ 1,950,277 | $ 1,897,966 |
Reinvestment of distributions | 1,123 | 960 | 53,152 | 40,980 |
Shares redeemed | (6,501) | (3,141) | (305,462) | (134,772) |
Net increase (decrease) | 34,988 | 42,969 | $ 1,697,967 | $ 1,804,174 |
Institutional Class | | | | |
Shares sold | - | - | $ - | $ - |
Reinvestment of distributions | 16 | 25 | 777 | 1,066 |
Shares redeemed | (291) | (627) | (13,432) | (26,500) |
Net increase (decrease) | (275) | (602) | $ (12,655) | $ (25,434) |
8. Other.
The Funds' organizational documents provide former and current trustees and officers with a limited indemnification against liabilities arising in connection with the performance of their duties to the Funds. In the normal course of business, the Funds may also enter into contracts that provide general indemnifications. The Funds' maximum exposure under these arrangements is unknown as this would be dependent on future claims that may be made against the Funds. The risk of material loss from such claims is considered remote.
The Funds do not invest in the Underlying Funds for the purpose of exercising management or control; however, investments by the Fund within their principle investment strategies may represent a significant portion of the Underlying Fund's net assets. At the end of the period, the following Funds were the owners of record of 10% or more of the total outstanding shares of the Underlying Funds.
Fund | Fidelity
Income
Replacement 2016 Fund | Fidelity
Income
Replacement 2028 Fund | Fidelity
Income
Replacement 2042 Fund |
Fidelity Series Broad Market Opportunities Fund | 11% | 13% | 14% |
The Funds, in aggregate, were the owners of record of more than 20% of the total outstanding shares of the following Underlying Funds.
Fund | % of shares held |
Fidelity Series Broad Market Opportunities Fund | 100% |
Annual Report
Report of Independent Registered Public Accounting Firm
To the Trustees of Fidelity Income Fund and the Shareholders of Fidelity Income Replacement 2016 Fund, Fidelity Income Replacement 2018 Fund, Fidelity Income Replacement 2020 Fund, Fidelity Income Replacement 2022 Fund, Fidelity Income Replacement 2024 Fund, Fidelity Income Replacement 2026 Fund, Fidelity Income Replacement 2028 Fund, Fidelity Income Replacement 2030 Fund, Fidelity Income Replacement 2032 Fund, Fidelity Income Replacement 2034 Fund, Fidelity Income Replacement 2036 Fund, Fidelity Income Replacement 2038 Fund, Fidelity Income Replacement 2040 Fund and Fidelity Income Replacement 2042 Fund:
We have audited the accompanying statements of assets and liabilities of Fidelity Income Replacement 2016 Fund, Fidelity Income Replacement 2018 Fund, Fidelity Income Replacement 2020 Fund, Fidelity Income Replacement 2022 Fund, Fidelity Income Replacement 2024 Fund, Fidelity Income Replacement 2026 Fund, Fidelity Income Replacement 2028 Fund, Fidelity Income Replacement 2030 Fund, Fidelity Income Replacement 2032 Fund, Fidelity Income Replacement 2034 Fund, Fidelity Income Replacement 2036 Fund, Fidelity Income Replacement 2038 Fund, Fidelity Income Replacement 2040 Fund and Fidelity Income Replacement 2042 Fund (the Funds) are funds of Fidelity Income Fund (the trust), including the schedules of investments, as of July 31, 2011, and the related statements of operations for the year then ended, the statements of changes in net assets for each of the two years in the period then ended, and the financial highlights for each of the periods presented. These financial statements and financial highlights are the responsibility of the Funds' management. Our responsibility is to express an opinion on these financial statements and financial highlights based on our audits.
We conducted our audits in accordance with the standards of the Public Company Accounting Oversight Board (United States). Those standards require that we plan and perform the audit to obtain reasonable assurance about whether the financial statements and financial highlights are free of material misstatement. The Funds are not required to have, nor were we engaged to perform, an audit of its internal control over financial reporting. Our audits included consideration of internal control over financial reporting as a basis for designing audit procedures that are appropriate in the circumstances, but not for the purpose of expressing an opinion on the effectiveness of the Fund's internal control over financial reporting. Accordingly, we express no such opinion. An audit also includes examining, on a test basis, evidence supporting the amounts and disclosures in the financial statements, assessing the accounting principles used and significant estimates made by management, as well as evaluating the overall financial statement presentation. Our procedures included confirmation of securities owned as of July 31, 2011, by correspondence with the custodians and brokers; where replies were not received from brokers, we performed other auditing procedures. We believe that our audits provide a reasonable basis for our opinion.
In our opinion, the financial statements and financial highlights referred to above present fairly, in all material respects, the financial position of Fidelity Income Replacement 2016 Fund, Fidelity Income Replacement 2018 Fund, Fidelity Income Replacement 2020 Fund, Fidelity Income Replacement 2022 Fund, Fidelity Income Replacement 2024 Fund, Fidelity Income Replacement 2026 Fund, Fidelity Income Replacement 2028 Fund, Fidelity Income Replacement 2030 Fund, Fidelity Income Replacement 2032 Fund, Fidelity Income Replacement 2034 Fund, Fidelity Income Replacement 2036 Fund, Fidelity Income Replacement 2038 Fund, Fidelity Income Replacement 2040 Fund and Fidelity Income Replacement 2042 Fund as of July 31, 2011, the results of their operations for the year then ended, the changes in their net assets for each of the two years in the period then ended, and their financial highlights for each of the periods presented, in conformity with accounting principles generally accepted in the United States of America.
/s/ Deloitte & Touche LLP
DELOITTE & TOUCHE LLP
Boston, Massachusetts
September 21, 2011
Annual Report
The Trustees and executive officers of the trust and funds, as applicable, are listed below. The Board of Trustees governs each Fidelity Income Replacement Fund and is responsible for protecting the interests of shareholders. The Trustees are experienced executives who meet periodically throughout the year to oversee each Fidelity Income Replacement Fund's activities, review contractual arrangements with companies that provide services to each Fidelity Income Replacement Fund, oversee management of the risks associated with such activities and contractual arrangements, and review each Fidelity Income Replacement Fund's performance. If the interests of a Fidelity Income Replacement Fund and an underlying Fidelity fund were to diverge, a conflict of interest could arise and affect how the Trustees fulfill their fiduciary duties to the affected funds. Strategic Advisers has structured the Fidelity Income Replacement Funds to avoid these potential conflicts, although there may be situations where a conflict of interest is unavoidable. In such instances, Strategic Advisers and the Trustees would take reasonable steps to minimize and, if possible, eliminate the conflict. Except for James C. Curvey, each of the Trustees oversees 198 funds advised by FMR or an affiliate. Mr. Curvey oversees 419 funds advised by FMR or an affiliate.
The Trustees hold office without limit in time except that (a) any Trustee may resign; (b) any Trustee may be removed by written instrument, signed by at least two-thirds of the number of Trustees prior to such removal; (c) any Trustee who requests to be retired or who has become incapacitated by illness or injury may be retired by written instrument signed by a majority of the other Trustees; and (d) any Trustee may be removed at any special meeting of shareholders by a two-thirds vote of the outstanding voting securities of the trust. Each Trustee who is not an interested person (as defined in the 1940 Act) (Independent Trustee), shall retire not later than the last day of the calendar year in which his or her 75th birthday occurs. The Independent Trustees may waive this mandatory retirement age policy with respect to individual Trustees. The executive officers hold office without limit in time, except that any officer may resign or may be removed by a vote of a majority of the Trustees at any regular meeting or any special meeting of the Trustees. Except as indicated, each individual has held the office shown or other offices in the same company for the past five years.
Experience, Skills, Attributes, and Qualifications of the Funds' Trustees. The Governance and Nominating Committee has adopted a statement of policy that describes the experience, qualifications, attributes, and skills that are necessary and desirable for potential Independent Trustee candidates (Statement of Policy). The Board believes that each Trustee satisfied at the time he or she was initially elected or appointed a Trustee, and continues to satisfy, the standards contemplated by the Statement of Policy. The Governance and Nominating Committee also engages professional search firms to help identify potential Independent Trustee candidates who have the experience, qualifications, attributes, and skills consistent with the Statement of Policy. From time to time, additional criteria based on the composition and skills of the current Independent Trustees, as well as experience or skills that may be appropriate in light of future changes to board composition, business conditions, and regulatory or other developments, have also been considered by the professional search firms and the Governance and Nominating Committee. In addition, the Board takes into account the Trustees' commitment and participation in Board and committee meetings, as well as their leadership of standing and ad hoc committees throughout their tenure.
In determining that a particular Trustee was and continues to be qualified to serve as a Trustee, the Board has considered a variety of criteria, none of which, in isolation, was controlling. The Board believes that, collectively, the Trustees have balanced and diverse experience, qualifications, attributes, and skills, which allow the Board to operate effectively in governing each fund and protecting the interests of shareholders. Information about the specific experience, skills, attributes, and qualifications of each Trustee, which in each case led to the Board's conclusion that the Trustee should serve (or continue to serve) as a trustee of the funds, is provided below.
Board Structure and Oversight Function. Abigail P. Johnson is an interested person (as defined in the 1940 Act) and currently serves as Chairman. The Trustees have determined that an interested Chairman is appropriate and benefits shareholders because an interested Chairman has a personal and professional stake in the quality and continuity of services provided to the funds. Independent Trustees exercise their informed business judgment to appoint an individual of their choosing to serve as Chairman, regardless of whether the Trustee happens to be independent or a member of management. The Independent Trustees have determined that they can act independently and effectively without having an Independent Trustee serve as Chairman and that a key structural component for assuring that they are in a position to do so is for the Independent Trustees to constitute a substantial majority for the Board. The Independent Trustees also regularly meet in executive session. Kenneth L. Wolfe serves as Chairman of the Independent Trustees and as such (i) acts as a liaison between the Independent Trustees and management with respect to matters important to the Independent Trustees and (ii) with management prepares agendas for Board meetings.
Fidelity funds are overseen by different Boards of Trustees. The funds' Board oversees Fidelity's investment-grade bond, money market, and asset allocation funds and another Board oversees Fidelity's equity and high income funds. The asset allocation funds may invest in Fidelity funds that are overseen by such other Board. The use of separate Boards, each with its own committee structure, allows the Trustees of each group of Fidelity funds to focus on the unique issues of the funds they oversee, including common research, investment, and operational issues. On occasion, the separate Boards establish joint committees to address issues of overlapping consequences for the Fidelity funds overseen by each Board.
The Trustees operate using a system of committees to facilitate the timely and efficient consideration of all matters of importance to the Trustees, each fund, and fund shareholders and to facilitate compliance with legal and regulatory requirements and oversight of the funds' activities and associated risks. The Board, acting through its committees, has charged FMR and its affiliates with (i) identifying events or circumstances the occurrence of which could have demonstrably adverse effects on the funds' business and/or reputation; (ii) implementing processes and controls to lessen the possibility that such events or circumstances occur or to mitigate the effects of such events or circumstances if they do occur; and (iii) creating and maintaining a system designed to evaluate continuously business and market conditions in order to facilitate the identification and implementation processes described in (i) and (ii) above. Because the day-to-day operations and activities of the funds are carried out by or through FMR, its affiliates and other service providers, the funds' exposure to risks is mitigated but not eliminated by the processes overseen by the Trustees. While each of the Board's committees has responsibility for overseeing different aspects of the funds' activities, oversight is exercised primarily through the Operations and Audit Committees. Appropriate personnel, including but not limited to the funds' Chief Compliance Officer (CCO), FMR's internal auditor, the independent accountants, the funds' Treasurer and portfolio management personnel, make periodic reports to the Board's committees, as appropriate. The responsibilities of each committee, including their oversight responsibilities, are described further under "Standing Committees of the Funds' Trustees."
Annual Report
Trustees and Officers - continued
The funds' Statement of Additional Information (SAI) includes more information about the Trustees. To request a free copy, call Fidelity at 1-877-208-0098.
Interested Trustees*:
Correspondence intended for each Trustee who is an interested person may be sent to Fidelity Investments, 82 Devonshire Street, Boston, Massachusetts 02109.
Name, Age; Principal Occupations and Other Relevant Experience+ |
Abigail P. Johnson (49) |
| Year of Election or Appointment: 2009 Ms. Johnson is Trustee and Chairman of the Board of Trustees of certain Trusts. Ms. Johnson serves as President of Personal, Workplace and Institutional Services (2005-present). Ms. Johnson is Chairman and Director of FMR Co., Inc. (2011-present), Chairman and Director of FMR (2011-present), and the Vice Chairman and Director (2007-present) of FMR LLC. Previously, Ms. Johnson served as President and a Director of FMR (2001-2005), a Trustee of other investment companies advised by FMR, Fidelity Investments Money Management, Inc., and FMR Co., Inc. (2001-2005), Senior Vice President of the Fidelity funds (2001-2005), and managed a number of Fidelity funds. Ms. Abigail P. Johnson and Mr. Arthur E. Johnson are not related. |
James C. Curvey (76) |
| Year of Election or Appointment: 2007 Mr. Curvey also serves as Trustee (2007-present) of other investment companies advised by FMR. Mr. Curvey is a Director of Fidelity Investments Money Management, Inc. (2009-present), Director of Fidelity Research & Analysis Co. (2009-present) and Director of FMR and FMR Co., Inc. (2007-present). Mr. Curvey is also Vice Chairman (2007-present) and Director of FMR LLC. In addition, Mr. Curvey serves as an Overseer for the Boston Symphony Orchestra and a member of the Trustees of Villanova University. Previously, Mr. Curvey was the Vice Chairman (2006-2007) and Director (2000-2007) of FMR Corp. |
* Trustees have been determined to be "Interested Trustees" by virtue of, among other things, their affiliation with the trust or various entities under common control with FMR.
+ The information above includes each Trustee's principal occupation during the last five years and other information relating to the experience, attributes, and skills relevant to each Trustee's qualifications to serve as a Trustee, which led to the conclusion that each Trustee should serve as a Trustee for each fund.
Independent Trustees:
Correspondence intended for each Independent Trustee (that is, the Trustees other than the Interested Trustees) may be sent to Fidelity Investments, P.O. Box 55235, Boston, Massachusetts 02205-5235.
Name, Age; Principal Occupations and Other Relevant Experience+ |
Albert R. Gamper, Jr. (69) |
| Year of Election or Appointment: 2006 Mr. Gamper is Vice Chairman of the Independent Trustees of the Fixed Income and Asset Allocation Funds (2011-present). Prior to his retirement in December 2004, Mr. Gamper served as Chairman of the Board of CIT Group Inc. (commercial finance). During his tenure with CIT Group Inc. Mr. Gamper served in numerous senior management positions, including Chairman (1987-1989; 1999-2001; 2002-2004), Chief Executive Officer (1987-2004), and President (2002-2003). He also served as President and Chief Executive Officer of Tyco Capital Corporation (2001-2002). Mr. Gamper currently serves as a member of the Board of Directors of Public Service Enterprise Group (utilities, 2000-present), a member of the Board of Trustees, Rutgers University (2004-present), and Chairman of the Board of Saint Barnabas Health Care System. Previously, Mr. Gamper served as Chairman of the Board of Governors, Rutgers University (2004-2007). |
Robert F. Gartland (59) |
| Year of Election or Appointment: 2010 Mr. Gartland is a partner and investor of Vietnam Partners LLC (investments and consulting, 2008-present) and is Chairman and an investor in Gartland and Mellina Group Corp. (consulting, 2009-present). Prior to his retirement, Mr. Gartland held a variety of positions at Morgan Stanley (financial services, 1979-2007) including Managing Director (1987-2007). |
Arthur E. Johnson (64) |
| Year of Election or Appointment: 2008 Mr. Johnson serves as a member of the Board of Directors of Eaton Corporation (diversified power management, 2009-present) and AGL Resources, Inc. (holding company). Prior to his retirement, Mr. Johnson served as Senior Vice President of Corporate Strategic Development of Lockheed Martin Corporation (defense contractor, 1999-2009). He previously served on the Board of Directors of IKON Office Solutions, Inc. (1999-2008) and Delta Airlines (2005-2007). Mr. Arthur E. Johnson and Ms. Abigail P. Johnson are not related. |
Michael E. Kenneally (57) |
| Year of Election or Appointment: 2009 Previously, Mr. Kenneally served as a Member of the Advisory Board for certain Fidelity Fixed Income and Asset Allocation Funds (2008-2009). Prior to his retirement, Mr. Kenneally served as Chairman and Global Chief Executive Officer of Credit Suisse Asset Management (2003-2005). Mr. Kenneally was a Director of the Credit Suisse Funds (U.S. mutual funds, 2004-2008) and certain other closed-end funds (2004-2005) and was awarded the Chartered Financial Analyst (CFA) designation in 1991. |
James H. Keyes (70) |
| Year of Election or Appointment: 2007 Mr. Keyes serves as a member of the Boards of Navistar International Corporation (manufacture and sale of trucks, buses, and diesel engines, since 2002) and Pitney Bowes, Inc. (integrated mail, messaging, and document management solutions, since 1998). Prior to his retirement, Mr. Keyes served as Chairman and Chief Executive Officer of Johnson Controls (automotive, building, and energy, 1998-2002) and as a member of the Board of LSI Logic Corporation (semiconductor technologies, 1984-2008). |
Marie L. Knowles (64) |
| Year of Election or Appointment: 2001 Prior to Ms. Knowles' retirement in June 2000, she served as Executive Vice President and Chief Financial Officer of Atlantic Richfield Company (ARCO) (diversified energy, 1996-2000). From 1993 to 1996, she was a Senior Vice President of ARCO and President of ARCO Transportation Company. She served as a Director of ARCO from 1996 to 1998. Ms. Knowles currently serves as a Director and Chairman of the Audit Committee of McKesson Corporation (healthcare service, since 2002). Ms. Knowles is an Honorary Trustee of the Brookings Institution and a member of the Board of the Catalina Island Conservancy and of the Santa Catalina Island Company (2009-present). She also serves as a member of the Advisory Board for the School of Engineering of the University of Southern California and the Foundation Board of the School of Architecture at the University of Virginia (2007-present). Previously, Ms. Knowles served as a Director of Phelps Dodge Corporation (copper mining and manufacturing, 1994-2007). |
Kenneth L. Wolfe (72) |
| Year of Election or Appointment: 2005 Mr. Wolfe is Chairman of the Independent Trustees of the Fixed Income and Asset Allocation Funds (2008-present). Prior to his retirement, Mr. Wolfe served as Chairman and a Director (2007-2009) and Chairman and Chief Executive Officer (1994-2001) of Hershey Foods Corporation. He also served as a member of the Boards of Adelphia Communications Corporation (telecommunications, 2003-2006), Bausch & Lomb, Inc. (medical/pharmaceutical, 1993-2007), and Revlon, Inc. (personal care products, 2004-2009). |
+ The information above includes each Trustee's principal occupation during the last five years and other information relating to the experience, attributes, and skills relevant to each Trustee's qualifications to serve as a Trustee, which led to the conclusion that each Trustee should serve as a Trustee for each fund.
Executive Officers:
Correspondence intended for each executive officer may be sent to Fidelity Investments, 82 Devonshire Street, Boston, Massachusetts 02109.
Name, Age; Principal Occupation |
John R. Hebble (53) |
| Year of Election or Appointment: 2008 President and Treasurer of Fidelity's Fixed Income and Asset Allocation Funds. Mr. Hebble also serves as President (2011-present), Treasurer, and Chief Financial Officer of The North Carolina Capital Management Trust: Cash and Term Portfolios (2008-present), Assistant Treasurer of other Fidelity funds (2009-present) and is an employee of Fidelity Investments. |
Derek L. Young (46) |
| Year of Election or Appointment: 2009 Vice President of Fidelity's Asset Allocation Funds. Mr. Young also serves as Chief Investment Officer of the Global Asset Allocation Group (2009-present). Previously, Mr. Young served as a portfolio manager. |
Scott C. Goebel (43) |
| Year of Election or Appointment: 2008 Secretary and Chief Legal Officer (CLO) of the Fidelity funds. Mr. Goebel also serves as Secretary of Fidelity Investments Money Management, Inc. (FIMM) (2010-present) and Fidelity Research and Analysis Company (FRAC) (2010-present); Secretary and CLO of The North Carolina Capital Management Trust: Cash and Term Portfolios (2008-present); General Counsel, Secretary, and Senior Vice President of FMR (2008-present) and FMR Co., Inc. (2008-present); employed by FMR LLC or an affiliate (2001-present); Chief Legal Officer of Fidelity Management & Research (Hong Kong) Limited (2008-present) and Assistant Secretary of Fidelity Management & Research (Japan) Inc. (2008-present), and Fidelity Management & Research (U.K.) Inc. (2008-present). Previously, Mr. Goebel served as Assistant Secretary of FIMM (2008-2010), FRAC (2008-2010), and the Funds (2007-2008) and as Vice President and Secretary of Fidelity Distributors Corporation (FDC) (2005-2007). |
David J. Carter (38) |
| Year of Election or Appointment: 2010 Assistant Secretary of Fidelity's Fixed Income and Asset Allocation Funds. Mr. Carter also serves as Vice President, Associate General Counsel (2010-present) and is an employee of Fidelity Investments (2005-present). |
Holly C. Laurent (57) |
| Year of Election or Appointment: 2008 Anti-Money Laundering (AML) Officer of the Fidelity funds. Ms. Laurent also serves as AML Officer of The North Carolina Capital Management Trust: Cash and Term Portfolios (2008-present) and is an employee of Fidelity Investments. Previously, Ms. Laurent was Senior Vice President and Head of Legal for Fidelity Business Services India Pvt. Ltd. (2006-2008), and Senior Vice President, Deputy General Counsel and Group Head for FMR LLC (2005-2006). |
Christine Reynolds (52) |
| Year of Election or Appointment: 2008 Chief Financial Officer of the Fidelity funds. Ms. Reynolds became President of Fidelity Pricing and Cash Management Services (FPCMS) in August 2008. Ms. Reynolds served as Chief Operating Officer of FPCMS (2007-2008). Previously, Ms. Reynolds served as President, Treasurer, and Anti-Money Laundering officer of the Fidelity funds (2004-2007). |
Michael H. Whitaker (44) |
| Year of Election or Appointment: 2008 Chief Compliance Officer of Fidelity's Fixed Income and Asset Allocation Funds. Mr. Whitaker also serves as Chief Compliance Officer of The North Carolina Capital Management Trust: Cash and Term Portfolios (2008-present). Mr. Whitaker is an employee of Fidelity Investments (2007-present). Prior to joining Fidelity Investments, Mr. Whitaker worked at MFS Investment Management where he served as Senior Vice President and Chief Compliance Officer (2004-2006), and Assistant General Counsel. |
Jeffrey S. Christian (49) |
| Year of Election or Appointment: 2009 Deputy Treasurer of the Fidelity funds. Mr. Christian is an employee of Fidelity Investments. Previously, Mr. Christian served as Chief Financial Officer (2008-2009) of certain Fidelity funds and Senior Vice President of Fidelity Pricing and Cash Management Services (FPCMS) (2004-2009). |
Bryan A. Mehrmann (50) |
| Year of Election or Appointment: 2005 Deputy Treasurer of the Fidelity funds. Mr. Mehrmann is an employee of Fidelity Investments. |
Stephanie J. Dorsey (42) |
| Year of Election or Appointment: 2008 Deputy Treasurer of Fidelity's Fixed Income and Asset Allocation Funds. Ms. Dorsey also serves as Assistant Treasurer of other Fidelity funds (2010-present) and is an employee of Fidelity Investments (2008-present). Previously, Ms. Dorsey served as Treasurer (2004-2008) of the JPMorgan Mutual Funds and Vice President (2004-2008) of JPMorgan Chase Bank. |
Adrien E. Deberghes (43) |
| Year of Election or Appointment: 2010 Assistant Treasurer of Fidelity's Fixed Income and Asset Allocation Funds. Mr. Deberghes also serves as Deputy Treasurer of other Fidelity funds (2008-present) and is an employee of Fidelity Investments (2008-present). Previously, Mr. Deberghes served as Senior Vice President of Mutual Fund Administration at State Street Corporation (2007-2008), Senior Director of Mutual Fund Administration at Investors Bank & Trust (2005-2007), and Director of Finance for Dunkin' Brands (2000-2005). |
Kenneth B. Robins (41) |
| Year of Election or Appointment: 2009 Assistant Treasurer of the Fidelity Fixed Income and Asset Allocation Funds. Mr. Robins also serves as President and Treasurer of other Fidelity funds (2008-present; 2010-present) and is an employee of Fidelity Investments (2004-present). Previously, Mr. Robins served as Deputy Treasurer of the Fidelity funds (2005-2008) and Treasurer and Chief Financial Officer of The North Carolina Capital Management Trust: Cash and Term Portfolios (2006-2008). |
Gary W. Ryan (52) |
| Year of Election or Appointment: 2005 Assistant Treasurer of the Fidelity funds. Mr. Ryan is an employee of Fidelity Investments. Previously, Mr. Ryan served as Vice President of Fund Reporting in Fidelity Pricing and Cash Management Services (FPCMS) (1999-2005). |
Jonathan Davis (43) |
| Year of Election or Appointment: 2010 Assistant Treasurer of the Fidelity funds. Mr. Davis is an employee of Fidelity Investments. Previously, Mr. Davis served as Vice President and Associate General Counsel of FMR LLC (2003-2010). |
Annual Report
A percentage of the dividends distributed during the fiscal year for the following funds was derived from interest on U.S. Government securities which is generally exempt from state income tax:
Income Replacement 2016 | |
Institutional Class | 10.66% |
Income Replacement 2018 | |
Institutional Class | 9.57% |
Income Replacement 2020 | |
Institutional Class | 9.16% |
Income Replacement 2022 | |
Institutional Class | 8.70% |
Income Replacement 2024 | |
Institutional Class | 8.26% |
Income Replacement 2026 | |
Institutional Class | 8.55% |
Income Replacement 2028 | |
Institutional Class | 7.60% |
Income Replacement 2030 | |
Institutional Class | 7.54% |
Income Replacement 2032 | |
Institutional Class | 6.99% |
Income Replacement 2034 | |
Institutional Class | 6.96% |
Income Replacement 2036 | |
Institutional Class | 6.72% |
Income Replacement 2038 | |
Institutional Class | 5.96% |
Income Replacement 2040 | |
Institutional Class | 6.33% |
Income Replacement 2042 | |
Institutional Class | 6.54% |
Annual Report
A percentage of the dividends distributed during the fiscal year for the following funds may be taken into account as a dividend for purposes of the maximum rate under section 1(h)(11) of the Internal Revenue Code.
| Institutional Class |
Income Replacement 2016 | |
August 2010 | 11% |
September 2010 | 17% |
October 2010 | 17% |
November 2010 | 16% |
December 2010 (Ex-Date 12/22/10) | 19% |
December 2010 (Ex-Date 12/30/10) | 18% |
January 2011 | 4% |
February 2011 | 4% |
March 2011 | 4% |
April 2011 | 4% |
May 2011 | 4% |
June 2011 | 4% |
July 2011 | 5% |
| Institutional Class |
Income Replacement 2018 | |
August 2010 | 14% |
September 2010 | 22% |
October 2010 | 23% |
November 2010 | 22% |
December 2010 (Ex-Date 12/22/10) | 24% |
December 2010 (Ex-Date 12/30/10) | 23% |
January 2011 | 6% |
February 2011 | 5% |
March 2011 | 6% |
April 2011 | 6% |
May 2011 | 6% |
June 2011 | 6% |
July 2011 | 6% |
| Institutional Class |
Income Replacement 2020 | |
August 2010 | 15% |
September 2010 | 26% |
October 2010 | 27% |
November 2010 | 26% |
December 2010 (Ex-Date 12/22/10) | 29% |
December 2010 (Ex-Date 12/30/10) | 28% |
January 2011 | 7% |
February 2011 | 7% |
March 2011 | 7% |
April 2011 | 7% |
May 2011 | 7% |
June 2011 | 7% |
July 2011 | 7% |
| Institutional Class |
Income Replacement 2022 | |
August 2010 | 18% |
September 2010 | 31% |
October 2010 | 31% |
November 2010 | 31% |
December 2010 (Ex-Date 12/22/10) | 32% |
December 2010 (Ex-Date 12/30/10) | 32% |
January 2011 | 8% |
February 2011 | 8% |
March 2011 | 8% |
April 2011 | 8% |
May 2011 | 8% |
June 2011 | 8% |
July 2011 | 8% |
| Institutional Class |
Income Replacement 2024 | |
August 2010 | 15% |
September 2010 | 31% |
October 2010 | 32% |
November 2010 | 32% |
December 2010 (Ex-Date 12/22/10) | 35% |
December 2010 (Ex-Date 12/30/10) | 34% |
January 2011 | 9% |
February 2011 | 9% |
March 2011 | 9% |
April 2011 | 9% |
May 2011 | 9% |
June 2011 | 9% |
July 2011 | 9% |
| Institutional Class |
Income Replacement 2026 | |
August 2010 | 15% |
September 2010 | 33% |
October 2010 | 33% |
November 2010 | 34% |
December 2010 (Ex-Date 12/22/10) | 38% |
December 2010 (Ex-Date 12/30/10) | 36% |
January 2011 | 10% |
February 2011 | 10% |
March 2011 | 10% |
April 2011 | 10% |
May 2011 | 11% |
June 2011 | 10% |
July 2011 | 10% |
| Institutional Class |
Income Replacement 2028 | |
August 2010 | 20% |
September 2010 | 36% |
October 2010 | 36% |
November 2010 | 36% |
December 2010 (Ex-Date 12/22/10) | 37% |
December 2010 (Ex-Date 12/30/10) | 37% |
January 2011 | 10% |
February 2011 | 10% |
March 2011 | 10% |
April 2011 | 10% |
May 2011 | 10% |
June 2011 | 10% |
July 2011 | 10% |
| Institutional Class |
Income Replacement 2030 | |
August 2010 | 20% |
September 2010 | 40% |
October 2010 | 40% |
November 2010 | 41% |
December 2010 (Ex-Date 12/22/10) | 42% |
December 2010 (Ex-Date 12/30/10) | 41% |
January 2011 | 11% |
February 2011 | 11% |
March 2011 | 10% |
April 2011 | 11% |
May 2011 | 10% |
June 2011 | 11% |
July 2011 | 11% |
| Institutional Class |
Income Replacement 2032 | |
August 2010 | 23% |
September 2010 | 39% |
October 2010 | 40% |
November 2010 | 40% |
December 2010 (Ex-Date 12/22/10) | 41% |
December 2010 (Ex-Date 12/30/10) | 41% |
January 2011 | 9% |
February 2011 | 9% |
March 2011 | 9% |
April 2010 | 9% |
May 2011 | 9% |
June 2011 | 9% |
July 2011 | 9% |
| Institutional Class |
Income Replacement 2034 | |
August 2010 | 19% |
September 2010 | 41% |
October 2010 | 41% |
November 2010 | 41% |
December 2010 (Ex-Date 12/22/10) | 41% |
December 2010 (Ex-Date 12/30/10) | 41% |
January 2011 | 10% |
February 2011 | 10% |
March 2011 | 10% |
April 2011 | 10% |
May 2011 | 10% |
June 2011 | 11% |
July 2011 | 11% |
| Institutional Class |
Income Replacement 2036 | |
August 2010 | 17% |
September 2010 | 42% |
October 2010 | 43% |
November 2010 | 46% |
December 2010 (Ex-Date 12/22/10) | 49% |
December 2010 (Ex-Date 12/30/10) | 48% |
January 2011 | 12% |
February 201 | 12% |
March 2011 | 11% |
April 2011 | 12% |
May 2011 | 12% |
June 2011 | 11% |
July 2011 | 12% |
| Institutional Class |
Income Replacement 2038 | |
August 2010 | 20% |
September 2010 | 43% |
October 2010 | 43% |
November 2010 | 43% |
December 2010 (Ex-Date 12/22/10) | 44% |
December 2010 (Ex-Date 12/30/10) | 44% |
January 2011 | 11% |
February 2011 | 11% |
March 2011 | 11% |
April 2011 | 11% |
May 2011 | 11% |
June 2011 | 11% |
July 2011 | 11% |
�� | |
| Institutional Class |
Income Replacement 2040 | |
August 2010 | 17% |
September 2010 | 44% |
October 2010 | 43% |
November 2010 | 44% |
December 2010 (Ex-Date 12/22/10) | 46% |
December 2010 (Ex-Date 12/30/10) | 45% |
January 2011 | 11% |
February 2011 | 11% |
March 2011 | 11% |
April 2011 | 11% |
May 2011 | 11% |
June 2011 | 11% |
July 2011 | 11% |
| Institutional Class |
Income Replacement 2042 | |
August 2010 | 25% |
September 2010 | 45% |
October 2010 | 45% |
November 2010 | 45% |
December 2010 (Ex-Date 12/22/10) | 45% |
December 2010 (Ex-Date 12/30/10) | 45% |
January 2011 | 13% |
February 2011 | 13% |
March 2011 | 13% |
April 2011 | 13% |
May 2011 | 13% |
June 2011 | 13% |
July 2011 | 13% |
The fund will notify shareholders in January 2012 of amounts for use in preparing 2011 income tax returns.
Annual Report
Investment Adviser
Strategic Advisers, Inc.
Boston, MA
General Distributor
Fidelity Distributors Corporation
Boston, MA
Transfer and Service Agents
Fidelity Investments Institutional Operations Company, Inc.
Boston, MA
Fidelity Service Company, Inc.
Boston, MA
Custodian
The Bank of New York Mellon
New York, NY
ARWI-UANN-0911
1.848183.103
Fidelity®
Ultra-Short Bond
Fund
Annual Report
July 31, 2011
(2_fidelity_logos) (Registered_Trademark)
Contents
Chairman's Message | <Click Here> | The Chairman's message to shareholders. |
Performance | <Click Here> | How the fund has done over time. |
Management's Discussion of Fund Performance | <Click Here> | The Portfolio Manager's review of fund performance and strategy. |
Shareholder Expense Example | <Click Here> | An example of shareholder expenses. |
Investment Changes | <Click Here> | A summary of major shifts in the fund's investments over the past six months. |
Investments | <Click Here> | A complete list of the fund's investments with their market values. |
Financial Statements | <Click Here> | Statements of assets and liabilities, operations, and changes in net assets, as well as financial highlights. |
Notes | <Click Here> | Notes to the financial statements. |
Report of Independent Registered Public Accounting Firm | <Click Here> | |
Trustees and Officers | <Click Here> | |
Distributions | <Click Here> | |
To view a fund's proxy voting guidelines and proxy voting record for the 12-month period ended June 30, visit http://www.fidelity.com/proxyvotingresults or visit the Securities and Exchange Commission's (SEC) web site at http://www.sec.gov. You may also call 1-800-544-8544 to request a free copy of the proxy voting guidelines.
Standard & Poor's, S&P and S&P 500 are registered service marks of The McGraw-Hill Companies, Inc. and have been licensed for use by Fidelity Distributors Corporation.
Other third party marks appearing herein are the property of their respective owners.
All other marks appearing herein are registered or unregistered trademarks or service marks of FMR LLC or an affiliated company.
This report and the financial statements contained herein are submitted for the general information of the shareholders of the fund. This report is not authorized for distribution to prospective investors in the fund unless preceded or accompanied by an effective prospectus.
A fund files its complete schedule of portfolio holdings with the SEC for the first and third quarters of each fiscal year on Form N-Q. Forms N-Q are available on the SEC's web site at http://www.sec.gov. A fund's Forms N-Q may be reviewed and copied at the SEC's Public Reference Room in Washington, DC. Information regarding the operation of the SEC's Public Reference Room may be obtained by calling 1-800-SEC-0330. For a complete list of a fund's portfolio holdings, view the most recent holdings listing, semiannual report, or annual report on Fidelity's web site at http://www.fidelity.com, http://www.advisor.fidelity.com, or http://www.401k.com, as applicable.
NOT FDIC INSURED • MAY LOSE VALUE • NO BANK GUARANTEE
Neither the fund nor Fidelity Distributors Corporation is a bank.
Annual Report
(photo_of_Abigail_P_Johnson)
Dear Shareholder:
The second half of 2011 began with U.S. equities continuing to give back some of the gains achieved earlier in the year. In the days leading up to July 31, markets were shaken by a political stalemate in which Congress struggled to address the debt ceiling issue before an early-August deadline. The resulting uncertainty held back markets in July, the third consecutive monthly decline for equities, effectively reversing the positive momentum seen through the end of April. Financial markets are always unpredictable, of course, but there are several time-tested investment principles that can help put the odds in your favor.
One of the basic tenets is to invest for the long term. Over time, riding out the markets' inevitable ups and downs has proven much more effective than selling into panic or chasing the hottest trend. Even missing only a few of the markets' best days can significantly diminish investor returns. Patience also affords the benefits of compounding - of earning interest on additional income or reinvested dividends and capital gains. There can be tax advantages and cost benefits to consider as well. While staying the course doesn't eliminate risk, it can considerably lessen the effect of short-term declines.
You can further manage your investing risk through diversification. And today, more than ever, geographic diversification should be taken into account. Studies indicate that asset allocation is the single most important determinant of a portfolio's long-term success. The right mix of stocks, bonds and cash - aligned to your particular risk tolerance and investment objective - is very important. Age-appropriate rebalancing is also an essential aspect of asset allocation. For younger investors, an emphasis on equities - which historically have been the best-performing asset class over time - is encouraged. As investors near their specific goal, such as retirement or sending a child to college, consideration may be given to replacing volatile assets (e.g. common stocks) with more-stable fixed investments (bonds or savings plans).
A third principle - investing regularly - can help lower the average cost of your purchases. Investing a certain amount of money each month or quarter helps ensure you won't pay for all your shares at market highs. This strategy - known as dollar cost averaging - also reduces "emotion" from investing, helping shareholders avoid selling weak performers just prior to an upswing, or chasing a hot performer just before a correction.
We invite you to contact us via the Internet, through our Investor Centers or by phone. It is our privilege to provide you the information you need to make the investments that are right for you.
Sincerely,
(The chairman's signature appears here.)
Abigail P. Johnson
Annual Report
Average annual total return reflects the change in the value of an investment, assuming reinvestment of the class' distributions from dividend income and capital gains (the profits earned upon the sale of securities that have grown in value, if any) and assuming a constant rate of performance each year. The $10,000 table and the fund's returns do not reflect the deduction of taxes that a shareholder would pay on fund distributions or the redemption of fund shares. During periods of reimbursement by Fidelity, a fund's total return will be greater than it would be had the reimbursement not occurred. How a fund did yesterday is no guarantee of how it will do tomorrow.
Average Annual Total Returns
Periods ended July 31, 2011 | Past 1
year | Past 5
years | Life of
fund A |
Fidelity® Ultra-Short Bond Fund | 0.99% | -1.72% | 0.12% |
A From August 29, 2002.
$10,000 Over Life of Fund
Let's say hypothetically that $10,000 was invested in Fidelity® Ultra-Short Bond Fund, a class of the fund, on August 29, 2002, when the fund started. The chart shows how the value of your investment would have changed, and also shows how the Barclays Capital® 6 Month Swap Index performed over the same period.
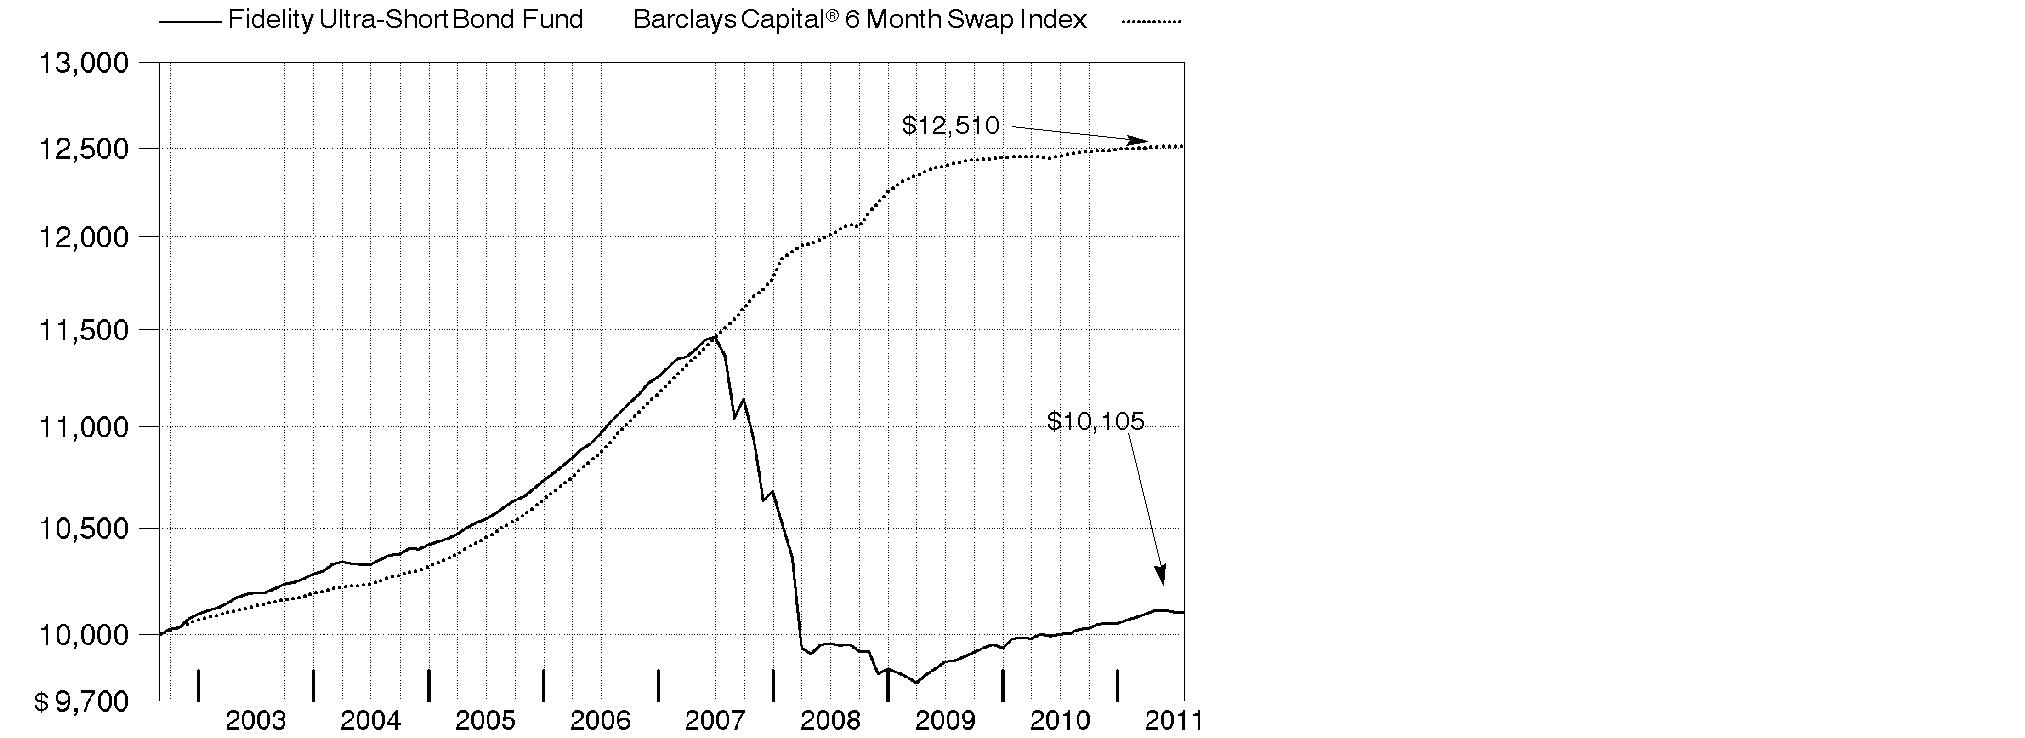
Annual Report
Market Recap: Amid ultra-low interest rates and heightened market volatility, U.S. taxable investment-grade bonds generated solid results for the year ending July 31, 2011, as evidenced by the 4.44% advance of the Barclays Capital® U.S. Aggregate Bond Index. The best-performing categories within the index were those on the riskier end of the spectrum that benefited during intervals when data pointed to an improving economy. Buoyed by a strong first-half showing, commercial mortgage-backed securities (CMBS) fared best, gaining 10.01% amid modest improvement in commercial real estate fundamentals. Corporate bonds rose 6.70%, due in large part to increased corporate profitability, high cash balances, reduced debt levels and improved credit conditions. Residential mortgage-backed securities, supported by a combination of strong demand from yield-hungry investors and slower prepayment rates, rose a solid 3.85%. Meanwhile, U.S. Treasury and agency securities gained 3.39% and 2.53%, respectively. These securities, which lagged in the first half of the period, when economic data was strong and inflation worries were muted, performed comparatively well in the second half amid signs of a weakening economic recovery and heightened concern about the sovereign debt crisis in Europe.
Comments from Robert Galusza, Portfolio Manager of Fidelity® Ultra-Short Bond Fund: For the year, the fund's Retail Class shares returned 0.99%, while the Barclays Capital® 6 Month Swap Index gained 0.33%. By way of review, the fund may invest in many different types of debt securities in an effort to achieve its investment objective, including securities that are not part of the Barclays Capital index. Against that backdrop, out-of-index exposure to all major segments of the short-term bond market aided performance because each of these groups outpaced the index. Emphasizing higher-yielding, riskier securities within the fund's investment-grade mandate - including asset-backed, commercial mortgage-backed and corporate debt - was particularly beneficial in the first half of the period when these sectors held up well relative to their lower-yielding government counterparts. My choices among investment-grade corporates also proved advantageous. Elsewhere, holding government-backed securities, including U.S. Treasuries, Treasury Inflation-Protected Securities (TIPS), which I sold by the end of the period, and agency-backed debentures, aided the fund's performance because they also outpaced the index, even though they generally lagged riskier segments for the 12-month period.
The views expressed above reflect those of the portfolio manager(s) only through the end of the period as stated on the cover of this report and do not necessarily represent the views of Fidelity or any other person in the Fidelity organization. Any such views are subject to change at any time based upon market or other conditions and Fidelity disclaims any responsibility to update such views. These views may not be relied on as investment advice and, because investment decisions for a Fidelity fund are based on numerous factors, may not be relied on as an indication of trading intent on behalf of any Fidelity fund.
Annual Report
Shareholder Expense Example
As a shareholder of the Fund, you incur two types of costs: (1) transaction costs, including redemption fees, and (2) ongoing costs, including management fees, distribution and/or service (12b-1) fees and other Fund expenses. This Example is intended to help you understand your ongoing costs (in dollars) of investing in the Fund and to compare these costs with the ongoing costs of investing in other mutual funds.
The Example is based on an investment of $1,000 invested at the beginning of the period and held for the entire period (February 1, 2011 to July 31, 2011).
Actual Expenses
The first line of the accompanying table for each class of the Fund provides information about actual account values and actual expenses. You may use the information in this line, together with the amount you invested, to estimate the expenses that you paid over the period. Simply divide your account value by $1,000.00 (for example, an $8,600 account value divided by $1,000.00 = 8.6), then multiply the result by the number in the first line for a class of the Fund under the heading entitled "Expenses Paid During Period" to estimate the expenses you paid on your account during this period.
Hypothetical Example for Comparison Purposes
The second line of the accompanying table for each class of the Fund provides information about hypothetical account values and hypothetical expenses based on a Class' actual expense ratio and an assumed rate of return of 5% per year before expenses, which is not the Class' actual return. The hypothetical account values and expenses may not be used to estimate the actual ending account balance or expenses you paid for the period. You may use this information to compare the ongoing costs of investing in the Fund and other funds. To do so, compare this 5% hypothetical example with the 5% hypothetical examples that appear in the shareholder reports of the other funds.
Please note that the expenses shown in the table are meant to highlight your ongoing costs only and do not reflect any transaction costs. Therefore, the second line of the table is useful in comparing ongoing costs only, and will not help you determine the relative total costs of owning different funds. In addition, if these transactional costs were included, your costs would have been higher.
Annual Report
Shareholder Expense Example - continued
| Annualized Expense Ratio | Beginning
Account Value
February 1, 2011 | Ending
Account Value
July 31, 2011 | Expenses Paid
During Period*
February 1, 2011
to July 31, 2011 |
Class A | .65% | | | |
Actual | | $ 1,000.00 | $ 1,004.00 | $ 3.23 |
HypotheticalA | | $ 1,000.00 | $ 1,021.57 | $ 3.26 |
Class T | .70% | | | |
Actual | | $ 1,000.00 | $ 1,002.50 | $ 3.48 |
HypotheticalA | | $ 1,000.00 | $ 1,021.32 | $ 3.51 |
Ultra-Short Bond | .45% | | | |
Actual | | $ 1,000.00 | $ 1,003.80 | $ 2.24 |
HypotheticalA | | $ 1,000.00 | $ 1,022.56 | $ 2.26 |
Institutional Class | .49% | | | |
Actual | | $ 1,000.00 | $ 1,003.60 | $ 2.43 |
HypotheticalA | | $ 1,000.00 | $ 1,022.36 | $ 2.46 |
A 5% return per year before expenses
* Expenses are equal to each Class' annualized expense ratio, multiplied by the average account value over the period, multiplied by 181/365 (to reflect the one-half year period).
Annual Report
Investment Changes (Unaudited)
Quality Diversification (% of fund's net assets) as of July 31, 2011 |
As of July 31, 2011 * | As of January 31, 2011 ** |
| U.S. Government
and U.S. Government Agency Obligations†34.0% | | | U.S. Government
and U.S. Government Agency Obligations†40.8% | |
 | AAA 23.7% | | | AAA 15.5% | |
| AA 19.3% | | | AA 14.3% | |
 | A 12.5% | | | A 9.6% | |
 | BBB 6.6% | | | BBB 9.2% | |
| BB and Below 0.4% | | | BB and Below 0.3% | |
 | Not Rated 1.5% | | | Not Rated 1.1% | |
| Short-Term
Investments and
Net Other Assets 2.0% | | | Short-Term
Investments and
Net Other Assets 9.2% | |

We have used ratings from Moody's Investors Service, Inc. Where Moody's® ratings are not available, we have used S&P® ratings. All ratings are as of the date indicated and do not reflect subsequent changes. Securities rated BB or below were rated investment grade at the time of acquisition. |
Weighted Average Maturity as of July 31, 2011 |
| | 6 months ago |
Years | 1.6 | 1.3 |
This is a weighted average of all the maturities of the securities held in a fund. Weighted Average Maturity (WAM) can be used as a measure of sensitivity to interest rate changes and markets changes. Generally, the longer the maturity, the greater the sensitivity to such changes. WAM is based on the dollar-weighted average length of time until principal payments must be paid. Depending on the types of securities held in a fund, certain maturity shortening devices (e.g., demand features, interest rate resets, and call options) may be taken into account when calculating the WAM. |
Duration as of July 31, 2011 |
| | 6 months ago |
Years | 0.5 | 0.4 |
Duration estimates how much a bond fund's price will change with a change in comparable interest rates. If rates rise 1%, for example, a fund with a 5-year duration is likely to lose about 5% of its value. Other factors also can influence a bond fund's performance and share price. Accordingly, a bond fund's actual performance may differ from this example. Duration takes into account any call or put option embedded in the bonds. |
Asset Allocation (% of fund's net assets) |
As of July 31, 2011 * | As of January 31, 2011 ** |
| Corporate Bonds 40.8% | | | Corporate Bonds 30.5% | |
| U.S. Government
and U.S. Government Agency Obligations† 34.0% | | | U.S. Government
and U.S. Government
Agency Obligations† 40.8% | |
| Asset-Backed
Securities 18.4% | | | Asset-Backed
Securities 15.7% | |
| CMOs and Other Mortgage Related Securities 4.2% | | | CMOs and Other Mortgage Related Securities 2.6% | |
| Other Investments 0.6% | | | Other Investments 1.2% | |
| Short-Term
Investments and
Net Other Assets 2.0% | | | Short-Term
Investments and
Net Other Assets 9.2% | |

* Foreign investments | 16.1% | | ** Foreign investments | 12.5% | |
* Futures and Swaps | 3.9% | | ** Futures and Swaps | 3.7% | |
† Includes FDIC Guaranteed Corporate Securities |
Annual Report
Investments July 31, 2011
Showing Percentage of Net Assets
Nonconvertible Bonds - 40.8% |
| Principal Amount | | Value |
CONSUMER DISCRETIONARY - 1.0% |
Media - 1.0% |
AOL Time Warner, Inc. 6.875% 5/1/12 | | $ 1,000,000 | | $ 1,044,568 |
Time Warner Cable, Inc. 5.4% 7/2/12 | | 1,500,000 | | 1,564,193 |
| | 2,608,761 |
CONSUMER STAPLES - 1.5% |
Beverages - 0.8% |
Anheuser-Busch InBev Worldwide, Inc. 0.609% 7/14/14 (e) | | 2,000,000 | | 2,006,420 |
Food Products - 0.7% |
Kraft Foods, Inc. 5.625% 11/1/11 | | 1,758,000 | | 1,779,404 |
TOTAL CONSUMER STAPLES | | 3,785,824 |
ENERGY - 1.6% |
Oil, Gas & Consumable Fuels - 1.6% |
Enterprise Products Operating LP 7.625% 2/15/12 | | 1,000,000 | | 1,034,672 |
Shell International Finance BV 1.3% 9/22/11 | | 1,000,000 | | 1,001,607 |
Total Capital Canada Ltd. 0.6298% 1/17/14 (e) | | 2,000,000 | | 2,012,940 |
| | 4,049,219 |
FINANCIALS - 31.9% |
Capital Markets - 5.2% |
BlackRock, Inc. 0.5575% 5/24/13 (e) | | 1,000,000 | | 999,463 |
Goldman Sachs Group, Inc. 1.2683% 2/7/14 (e) | | 2,000,000 | | 1,980,374 |
HSBC Bank PLC 1.0498% 1/17/14 (b)(e) | | 2,000,000 | | 2,010,406 |
JPMorgan Chase & Co. 1.053% 1/24/14 (e) | | 4,000,000 | | 3,993,624 |
State Street Corp. 0.602% 3/7/14 (e) | | 1,000,000 | | 1,000,567 |
The Bank of New York Mellon Corp. 0.5239% 7/28/14 (e) | | 2,000,000 | | 2,000,578 |
UBS AG Stamford Branch 1.2526% 1/28/14 (e) | | 1,500,000 | | 1,502,271 |
| | 13,487,283 |
Commercial Banks - 15.8% |
ANZ Banking Group Ltd. 0.9861% 1/10/14 (b)(e) | | 1,000,000 | | 1,002,979 |
Bank of Montreal 0.7229% 4/29/14 (e) | | 2,000,000 | | 2,001,180 |
Barclays Bank PLC 1.2861% 1/13/14 (e) | | 2,000,000 | | 2,004,040 |
Commonwealth Bank of Australia 0.975% 3/17/14 (b)(e) | | 1,500,000 | | 1,502,430 |
Credit Agricole SA 0.6233% 2/2/12 (b)(e) | | 2,000,000 | | 1,995,048 |
Credit Suisse New York Branch 1.209% 1/14/14 (e) | | 2,500,000 | | 2,501,433 |
Danske Bank A/S 1.299% 4/14/14 (b)(e) | | 500,000 | | 500,028 |
Nonconvertible Bonds - continued |
| Principal Amount | | Value |
FINANCIALS - continued |
Commercial Banks - continued |
Deutsche Bank 0.8998% 1/18/13 (e) | | $ 2,000,000 | | $ 2,001,654 |
Fifth Third Bank 0.3705% 5/17/13 (e) | | 2,500,000 | | 2,461,308 |
ING Bank NV 1.6518% 6/9/14 (b)(e) | | 2,000,000 | | 2,002,214 |
Manufacturers & Traders Trust Co. 1.7458% 4/1/13 (e) | | 930,000 | | 929,586 |
Marshall & Ilsley Bank 6.375% 9/1/11 | | 287,000 | | 287,958 |
National Australia Bank Ltd. 0.7258% 1/8/13 (b)(e) | | 1,000,000 | | 999,710 |
Rabobank (Netherlands) NV 0.599% 4/14/14 (e) | | 5,000,000 | | 4,981,375 |
Royal Bank of Canada 0.5498% 4/17/14 (e) | | 3,000,000 | | 3,003,063 |
Santander US Debt SA Unipersonal 1.0458% 3/30/12 (b)(e) | | 800,000 | | 798,463 |
Sumitomo Mitsui Banking Corp. 1.203% 7/22/14 (b)(e) | | 1,000,000 | | 1,003,495 |
Svenska Handelsbanken AB 2.875% 9/14/12 (b) | | 2,500,000 | | 2,556,442 |
Toronto Dominion Bank 0.549% 7/14/14 (e) | | 2,000,000 | | 2,005,840 |
U.S. Bank NA 0.473% 10/26/12 (e) | | 2,000,000 | | 2,003,192 |
Union Bank NA 1.2029% 6/6/14 (e) | | 2,000,000 | | 2,003,346 |
Wachovia Bank NA 0.6533% 11/3/14 (e) | | 1,500,000 | | 1,451,219 |
Westpac Banking Corp. 0.9758% 3/31/14 (b)(e) | | 1,000,000 | | 1,001,129 |
| | 40,997,132 |
Consumer Finance - 3.5% |
American Express Credit Corp. 1.0955% 6/24/14 (e) | | 1,000,000 | | 998,575 |
American Honda Finance Corp. 0.6383% 11/7/12 (b)(e) | | 2,000,000 | | 1,996,256 |
Capital One Financial Corp.: | | | | |
1.3998% 7/15/14 (e) | | 2,000,000 | | 2,002,294 |
5.7% 9/15/11 | | 1,000,000 | | 1,005,908 |
General Electric Capital Corp. 1.0958% 1/7/14 (e) | | 3,000,000 | | 3,000,249 |
| | 9,003,282 |
Diversified Financial Services - 5.1% |
BB&T Corp. 0.9526% 4/28/14 (e) | | 2,000,000 | | 2,000,094 |
BNP Paribas 1.1461% 1/10/14 (e) | | 1,000,000 | | 987,225 |
BP Capital Markets PLC 0.8495% 3/11/14 (e) | | 1,000,000 | | 1,002,378 |
Citigroup, Inc.: | | | | |
1.1108% 2/15/13 (e) | | 1,000,000 | | 1,000,021 |
1.6961% 1/13/14 (e) | | 2,341,000 | | 2,349,617 |
MassMutual Global Funding II 0.629% 1/14/14 (b)(e) | | 394,000 | | 394,117 |
Metlife Institutional Funding II 1.1458% 4/4/14 (b)(e) | | 2,500,000 | | 2,505,425 |
Nonconvertible Bonds - continued |
| Principal Amount | | Value |
FINANCIALS - continued |
Diversified Financial Services - continued |
New York Life Global Fund 0.5058% 4/4/14 (b)(e) | | $ 2,000,000 | | $ 2,000,698 |
Volkswagen International Finance NV 0.8558% 4/1/14 (b)(e) | | 1,000,000 | | 1,003,249 |
| | 13,242,824 |
Insurance - 1.5% |
Berkshire Hathaway Finance Corp. 0.5761% 1/10/14 (e) | | 2,000,000 | | 2,006,284 |
Prudential Financial, Inc. 5.1% 12/14/11 | | 2,000,000 | | 2,029,012 |
| | 4,035,296 |
Thrifts & Mortgage Finance - 0.8% |
Bank of America Corp. 1.7961% 7/11/14 (e) | | 2,000,000 | | 1,993,712 |
TOTAL FINANCIALS | | 82,759,529 |
HEALTH CARE - 1.2% |
Pharmaceuticals - 1.2% |
Sanofi-Aventis 0.4463% 3/28/13 (e) | | 2,000,000 | | 2,005,776 |
Teva Pharmaceutical Finance III BV 0.7465% 3/21/14 (e) | | 1,000,000 | | 1,006,873 |
| | 3,012,649 |
INFORMATION TECHNOLOGY - 1.3% |
Computers & Peripherals - 0.8% |
Hewlett-Packard Co. 0.5295% 5/24/13 (e) | | 2,000,000 | | 2,004,322 |
IT Services - 0.2% |
The Western Union Co. 0.832% 3/7/13 (e) | | 530,000 | | 531,960 |
Office Electronics - 0.3% |
Xerox Corp.: | | | | |
1.0805% 5/16/14 (e) | | 435,000 | | 437,633 |
6.875% 8/15/11 | | 500,000 | | 501,049 |
| | 938,682 |
TOTAL INFORMATION TECHNOLOGY | | 3,474,964 |
TELECOMMUNICATION SERVICES - 1.4% |
Diversified Telecommunication Services - 1.4% |
Qwest Corp. 3.497% 6/15/13 (e) | | 1,000,000 | | 1,023,750 |
Verizon Communications, Inc. 0.8563% 3/28/14 (e) | | 2,500,000 | | 2,526,563 |
| | 3,550,313 |
Nonconvertible Bonds - continued |
| Principal Amount | | Value |
UTILITIES - 0.9% |
Multi-Utilities - 0.9% |
DTE Energy Co. 0.955% 6/3/13 (e) | | $ 443,000 | | $ 444,775 |
Sempra Energy 1.007% 3/15/14 (e) | | 2,000,000 | | 2,008,422 |
| | 2,453,197 |
TOTAL NONCONVERTIBLE BONDS (Cost $105,683,754) | 105,694,456 |
U.S. Government and Government Agency Obligations - 25.3% |
|
U.S. Government Agency Obligations - 24.0% |
Fannie Mae: | | | | |
1% 4/4/12 | | 39,000,000 | | 39,178,075 |
4.375% 9/15/12 | | 22,000,000 | | 22,988,130 |
TOTAL U.S. GOVERNMENT AGENCY OBLIGATIONS | | 62,166,205 |
Other Government Related - 1.3% |
Bank of America Corp. 0.5529% 4/30/12 (FDIC Guaranteed) (c)(e) | | 1,500,000 | | 1,504,335 |
Goldman Sachs Group, Inc. 0.5183% 11/9/11 (FDIC Guaranteed) (c)(e) | | 2,000,000 | | 2,001,518 |
TOTAL OTHER GOVERNMENT RELATED | | 3,505,853 |
TOTAL U.S. GOVERNMENT AND GOVERNMENT AGENCY OBLIGATIONS (Cost $65,664,913) | 65,672,058 |
U.S. Government Agency - Mortgage Securities - 2.8% |
|
Fannie Mae - 2.8% |
2.452% 2/1/34 (e) | | 317,877 | | 329,120 |
2.484% 6/1/35 (e) | | 435,114 | | 455,152 |
2.549% 7/1/35 (e) | | 863,939 | | 909,366 |
2.552% 12/1/34 (e) | | 603,751 | | 637,160 |
2.559% 6/1/35 (e) | | 1,092,648 | | 1,145,809 |
2.588% 10/1/35 (e) | | 1,171,448 | | 1,231,625 |
2.6% 7/1/34 (e) | | 508,358 | | 532,240 |
2.619% 11/1/34 (e) | | 542,232 | | 564,388 |
U.S. Government Agency - Mortgage Securities - continued |
| Principal Amount | | Value |
Fannie Mae - continued |
2.68% 11/1/34 (e) | | $ 597,785 | | $ 631,836 |
3.765% 10/1/39 (e) | | 832,648 | | 875,878 |
TOTAL U.S. GOVERNMENT AGENCY - MORTGAGE SECURITIES (Cost $7,128,104) | 7,312,574 |
Asset-Backed Securities - 18.4% |
|
ACE Securities Corp. Home Equity Loan Trust Series 2004-HE1 Class M1, 0.9373% 3/25/34 (e) | | 1,506 | | 1,500 |
Ally Auto Receivables Trust: | | | | |
Series 2009-B Class A2, 1.21% 6/15/12 (b) | | 91,264 | | 91,285 |
Series 2010-4 Class A2, 0.71% 2/15/13 | | 889,578 | | 889,718 |
Series 2011-1 Class A2, 0.81% 10/15/13 | | 996,688 | | 997,158 |
Ally Master Owner Trust: | | | | |
Series 2010-1 Class A, 1.9365% 1/15/15 (b)(e) | | 700,000 | | 711,894 |
Series 2011-1 Class A1, 1.0565% 1/15/16 (e) | | 500,000 | | 503,682 |
AmeriCredit Automobile Receivables Trust: | | | | |
Series 2007-AX Class A4, 0.2251% 10/6/13 (XL Capital Assurance, Inc. Insured) (e) | | 694,257 | | 689,904 |
Series 2007-CM Class A4B, 0.2651% 4/7/14 (National Public Finance Guarantee Corp. Insured) (e) | | 419,025 | | 415,851 |
Series 2010-3 Class A2, 0.77% 12/9/13 | | 669,344 | | 669,594 |
Series 2010-B Class A2, 1.18% 2/6/14 (Assured Guaranty Corp. Insured) | | 665,422 | | 664,823 |
Series 2011-1 Class A2, 0.84% 6/9/14 | | 1,000,000 | | 1,000,120 |
Series 2011-2 Class A2, 0.9% 9/8/14 | | 1,000,000 | | 1,001,191 |
Bank of America Auto Trust: | | | | |
Series 2009-1A Class A3, 2.67% 7/15/13 (b) | | 385,185 | | 387,498 |
Series 2010-2 Class A2, 0.91% 10/15/12 | | 194,122 | | 194,174 |
Bank One Issuance Trust Series 2003-A8, 0.4365% 5/16/16 (e) | | 500,000 | | 501,048 |
BMW Vehicle Lease Trust: | | | | |
Series 2010-1 Class A2, 0.58% 9/17/12 | | 591,188 | | 591,173 |
Series 2011-1 Class A2, 0.64% 4/22/13 | | 1,000,000 | | 1,000,132 |
Capital One Auto Finance Trust Series 2007-C Class A4, 5.23% 7/15/14 (FGIC Insured) | | 337,266 | | 343,715 |
Carmax Auto Owner Trust Series 2011-1 Class A2, 0.72% 11/15/13 | | 1,000,000 | | 1,000,371 |
Chase Issuance Trust: | | | | |
Series 2005-A2 Class A2, 0.2565% 12/15/14 (e) | | 1,600,000 | | 1,599,284 |
Series 2005-A6 Class A6, 0.2565% 7/15/14 (e) | | 1,730,000 | | 1,729,381 |
Asset-Backed Securities - continued |
| Principal Amount | | Value |
Chase Issuance Trust: - continued | | | | |
Series 2006-A4 Class A4, 0.2065% 10/15/13 (e) | | $ 1,000,000 | | $ 999,936 |
Series 2007-A17 Class A, 5.12% 10/15/14 | | 790,000 | | 833,315 |
Series 2009-A2 Class A2, 1.7365% 4/15/14 (e) | | 2,500,000 | | 2,527,028 |
Series 2011-A1 Class A1, 0.3765% 3/16/15 (e) | | 640,000 | | 639,969 |
Series 2011-A2 Class A2, 0.2753% 5/15/15 (e) | | 990,000 | | 989,948 |
Chrysler Financial Auto Securitization Trust Series 2010-A Class A2, 0.69% 1/8/13 | | 1,163,246 | | 1,163,371 |
Citibank Credit Card Issuance Trust: | | | | |
Series 2009-A1 Class A1, 1.9365% 3/17/14 (e) | | 4,350,000 | | 4,395,725 |
Series 2009-A2 Class A2, 1.7365% 5/15/14 (e) | | 1,500,000 | | 1,517,523 |
CitiFinancial Auto Issuance Trust Series 2009-1 Class A2, 1.83% 11/15/12 (b) | | 61,479 | | 61,526 |
Discover Card Master Trust Series 2011-A2 Class A2, 0.3998% 11/16/15 (e) | | 1,000,000 | | 999,947 |
Fannie Mae subordinate REMIC pass-thru certificates Series 2004-T5: | | | | |
Class AB1, 0.7634% 5/28/35 (e) | | 80,751 | | 59,727 |
Class AB3, 0.7053% 5/28/35 (e) | | 32,052 | | 22,459 |
Ford Credit Auto Lease Trust Series 2010-B Class A2, 0.75% 10/15/12 (b) | | 1,964,226 | | 1,964,807 |
Ford Credit Auto Lease Trust 2011-A Series 2011-A Class A2, 0.74% 9/15/13 | | 1,000,000 | | 999,788 |
Ford Credit Auto Owner Trust: | | | | |
Series 2009-D Class A3, 2.17% 10/15/13 | | 62,265 | | 62,768 |
Series 2010-B Class A2, 0.65% 12/15/12 | | 740,798 | | 740,998 |
Series 2011-B Class A2, 0.68% 1/15/14 | | 1,000,000 | | 1,002,610 |
Ford Credit Floorplan Master Owner Trust: | | | | |
Series 2010-1 Class A, 1.8365% 12/15/14 (b)(e) | | 490,000 | | 498,083 |
Series 2010-5 Class A1, 1.5% 9/15/15 | | 240,000 | | 241,859 |
Fremont Home Loan Trust Series 2005-A Class M4, 0.8673% 1/25/35 (e) | | 125,000 | | 35,238 |
GE Capital Credit Card Master Note Trust Series 2009-3 Class A, 2.54% 9/15/14 | | 1,000,000 | | 1,002,433 |
GSAMP Trust Series 2007-HE1 Class M1, 0.4373% 3/25/47 (e) | | 335,000 | | 16,480 |
Home Equity Asset Trust Series 2003-5 Class A2, 0.8873% 12/25/33 (e) | | 10,566 | | 7,593 |
Honda Auto Receivables Owner Trust Series 2011-2 Class A2, 0.57% 7/18/13 | | 1,000,000 | | 999,683 |
Hyundai Auto Receivables Trust: | | | | |
Series 2009-A Class A3, 2.03% 8/15/13 | | 94,492 | | 95,117 |
Series 2011-A Class A2, 0.69% 11/15/13 | | 1,000,000 | | 1,000,648 |
Asset-Backed Securities - continued |
| Principal Amount | | Value |
John Deere Owner Trust Series 2011-A Class A2, 0.64% 6/16/14 | | $ 2,000,000 | | $ 2,000,222 |
Mercedes-Benz Auto Lease Trust Series 2011-1A Class A2, 0.79% 4/15/13 (b) | | 1,000,000 | | 1,000,528 |
Mercedes-Benz Auto Receivables Trust Series 2009-1 Class A3, 1.67% 1/15/14 | | 139,959 | | 140,948 |
Merrill Lynch Mortgage Investors Trust Series 2004-HE2 Class A1B, 0.6573% 8/25/35 (e) | | 20,366 | | 16,389 |
Morgan Stanley ABS Capital I Trust Series 2004-HE6 Class A2, 0.5273% 8/25/34 (e) | | 65,756 | | 49,869 |
Nissan Auto Lease Trust: | | | | |
Series 2009-B Class A3, 2.07% 1/15/15 | | 91,431 | | 91,558 |
Series 2010-B Class A2, 0.9% 5/15/13 | | 994,169 | | 995,589 |
Series 2011-A Class A2, 0.7% 1/15/14 | | 1,000,000 | | 999,857 |
Nissan Auto Receivables Owner Trust Series 2011-A Class A2, 0.65% 12/16/13 | | 1,000,000 | | 1,002,314 |
Ocala Funding LLC Series 2006-1A Class A, 1.5863% 3/20/11 (a)(b)(e) | | 965,000 | | 0 |
Park Place Securities, Inc. Series 2004-WCW1 Class M4, 1.6373% 9/25/34 (e) | | 435,000 | | 151,586 |
Salomon Brothers Mortgage Securities VII, Inc. Series 2003-HE1 Class A, 0.9873% 4/25/33 (e) | | 1,451 | | 1,195 |
Santander Drive Auto Receivables Trust: | | | | |
Series 2010-3 Class A2, 0.93% 6/17/13 | | 500,000 | | 500,378 |
Series 2011-1, Class A2, 0.94% 2/18/14 | | 300,000 | | 299,815 |
Terwin Mortgage Trust Series 2003-4HE Class A1, 1.0473% 9/25/34 (e) | | 21,802 | | 16,046 |
USAA Auto Owner Trust Series 2010-1 Class A3, 1.3% 6/16/14 | | 703,196 | | 706,159 |
Volkswagen Auto Lease Trust: | | | | |
Series 2009-A Class A3, 3.41% 4/16/12 | | 114,735 | | 114,963 |
Series 2010-A Class A2, 0.77% 1/22/13 | | 882,847 | | 883,203 |
Wachovia Auto Owner Trust Series 2008-A Class A4B, 1.3363% 3/20/14 (e) | | 886,977 | | 892,052 |
TOTAL ASSET-BACKED SECURITIES (Cost $49,371,653) | 47,724,746 |
Collateralized Mortgage Obligations - 7.5% |
| Principal Amount | | Value |
Private Sponsor - 1.6% |
Arran Residential Mortgages Funding PLC floater Series 2011-1A Clasee A1C, 1.5372% 11/19/47 (b)(e) | | $ 500,000 | | $ 499,820 |
Gracechurch Mortgage Financing PLC floater Series 2007-1A Class 3A1, 0.34% 11/20/56 (b)(e) | | 391,190 | | 388,290 |
Granite Mortgages Series 2003-2 Class 1A3, 0.7513% 7/20/43 (e) | | 166,632 | | 159,258 |
Granite Mortgages PLC floater Series 2004-1 Class 2A1, 0.5665% 3/20/44 (e) | | 142,998 | | 135,955 |
GSR Mortgage Loan Trust floater Series 2004-11 Class 2A1, 0.5173% 12/25/34 (e) | | 260,902 | | 221,625 |
Holmes Master Issuer PLC floater Series 2007-2A Class 3A1, 0.3293% 7/15/21 (e) | | 280,000 | | 279,282 |
Permanent Master Issuer PLC floater Series 2007-1 Class 4A, 0.3293% 10/15/33 (e) | | 660,000 | | 656,530 |
TBW Mortgage-Backed pass-thru certificates floater Series 2006-4 Class A3, 0.3858% 9/25/36 (e) | | 1,000,000 | | 739,516 |
World Omni Auto Receivables Trust sequential payer Series 2011-A Class A2, 0.64% 11/15/13 | | 1,000,000 | | 1,000,159 |
TOTAL PRIVATE SPONSOR | | 4,080,435 |
U.S. Government Agency - 5.9% |
Fannie Mae subordinate REMIC pass-thru certificates: | | | | |
floater: | | | | |
Series 2008-76 Class EF, 0.6873% 9/25/23 (e) | | 77,440 | | 77,534 |
Series 2010-86 Class FE, 0.6373% 8/25/25 (d)(e) | | 698,683 | | 700,922 |
sequential payer: | | | | |
Series 2003-129 Class GF, 0.5873% 4/25/30 (e) | | 885,979 | | 887,482 |
Series 2005-47 Class HA, 4.5% 7/25/19 | | 1,288,722 | | 1,340,713 |
Series 2011-16 Class FB, 0.3373% 3/25/31 (e) | | 2,898,003 | | 2,891,833 |
Freddie Mac Multi-class participation certificates guaranteed: | | | | |
floater Series 3346 Class FA, 0.4165% 2/15/19 (e) | | 4,575,543 | | 4,582,502 |
planned amortization Series 3792, 0.5865% 11/15/40 (e) | | 966,254 | | 971,214 |
sequential payer: | | | | |
Series 2924 Class DA, 4.5% 2/15/19 | | 1,095,456 | | 1,138,823 |
Collateralized Mortgage Obligations - continued |
| Principal Amount | | Value |
U.S. Government Agency - continued |
Freddie Mac Multi-class participation certificates guaranteed: - continued | | | | |
Series 3560 Class LA, 2% 8/15/14 | | $ 1,253,006 | | $ 1,265,948 |
Series 3573 Class LC, 1.85% 8/15/14 | | 1,407,081 | | 1,422,834 |
TOTAL U.S. GOVERNMENT AGENCY | | 15,279,805 |
TOTAL COLLATERALIZED MORTGAGE OBLIGATIONS (Cost $19,659,885) | 19,360,240 |
Commercial Mortgage Securities - 2.6% |
|
Banc of America Commercial Mortgage, Inc. sequential payer Series 2007-1 Class A2, 5.381% 1/15/49 | | 1,469,410 | | 1,476,261 |
Banc of America Large Loan, Inc. floater: | | | | |
Series 2005-MIB1: | | | | |
Class G, 0.7165% 3/15/22 (b)(e) | | 100,000 | | 94,250 |
Class H, 0.9665% 3/15/22 (b)(e) | | 110,000 | | 100,650 |
Series 2006-BIX1 Class B, 0.3265% 10/15/19 (b)(e) | | 110,000 | | 109,465 |
COMM pass-thru certificates floater: | | | | |
Series 2005-F10A Class B, 0.4165% 4/15/17 (b)(e) | | 110,000 | | 105,624 |
Series 2006-CN2A Class A2FL, 0.4051% 2/5/19 (b)(e) | | 800,000 | | 789,438 |
Credit Suisse Commercial Mortgage Trust sequential payer Series 2007-C3 Class A2, 5.905% 6/15/39 (e) | | 229,781 | | 233,376 |
Credit Suisse First Boston Mortgage Securities Corp. Series 2003-C4 Class A4, 5.137% 8/15/36 | | 240,000 | | 253,719 |
GMAC Commercial Mortgage Securities, Inc. sequential payer Series 2003-C2 Class A2, 5.6539% 5/10/40 (e) | | 120,000 | | 128,259 |
Greenwich Capital Commercial Funding Corp. sequential payer Series 2005-GG3 Class A2, 4.305% 8/10/42 (e) | | 1,170,220 | | 1,171,969 |
GS Mortgage Securities Corp. II sequential payer Series 2005-GG4 Class A3, 4.607% 7/10/39 | | 150,000 | | 151,979 |
GS Mortgage Securities Trust sequential payer Series 2006-GG8 Class A2, 5.479% 11/10/39 | | 292,841 | | 293,240 |
JP Morgan Chase Commercial Mortgage Securities Corp.: | | | | |
sequential payer Series 2003-C1 Class A2, 4.985% 1/12/37 | | 130,000 | | 135,442 |
Series 2003-CB7 Class A4, 4.879% 1/12/38 (e) | | 109,113 | | 115,764 |
Commercial Mortgage Securities - continued |
| Principal Amount | | Value |
JP Morgan Chase Commercial Mortgage Securities Trust sequential payer Series 2005-LDP5 Class A2, 5.198% 12/15/44 | | $ 240,000 | | $ 243,317 |
JPMorgan Chase Commercial Mortgage Securities Trust sequential payer Series 2007-LD11 Class A2, 5.9896% 6/15/49 (e) | | 240,000 | | 245,075 |
Morgan Stanley Capital I Trust: | | | | |
floater: | | | | |
Series 2006-XLF Class C, 1.387% 7/15/19 (b)(e) | | 247,826 | | 148,696 |
Series 2007-XLFA Class B, 0.317% 10/15/20 (b)(e) | | 440,000 | | 407,780 |
sequential payer Series 2003-IQ4 Class A2, 4.07% 5/15/40 | | 85,719 | | 88,674 |
Morgan Stanley Dean Witter Capital I Trust sequential payer Series 2003-T11 Class A4, 5.15% 6/13/41 | | 110,000 | | 116,282 |
Wachovia Bank Commercial Mortgage Trust floater Series 2006-WL7A Class A1, 0.2771% 9/15/21 (b)(e) | | 455,539 | | 439,285 |
TOTAL COMMERCIAL MORTGAGE SECURITIES (Cost $7,280,316) | 6,848,545 |
Municipal Securities - 0.6% |
|
Indiana Fin. Auth.'s Econ. Dev. Bonds (Republic Svcs., Inc. Proj.) Series A, 1.25%, tender 9/1/11 (e)(f) | | 400,000 | | 400,020 |
Louisville/Jefferson County Metropolitan Govt. Poll. Cont. Rev. Bonds (Louisville Gas and Electronic Co. Proj.): | | | | |
Series 2003 A, 1.9%, tender 4/2/12 (e) | | 500,000 | | 503,300 |
Series 2007 B, 1.9%, tender 6/1/12 (e) | | 500,000 | | 503,990 |
Pennsylvania Econ. Dev. Fing. Auth. Solid Waste Disp. Rev. Bonds (Republic Svcs., Inc. Proj.) Series 2010 A, 1.25%, tender 10/3/11 (e)(f) | | 100,000 | | 100,006 |
TOTAL MUNICIPAL SECURITIES (Cost $1,500,000) | 1,507,316 |
Bank Notes - 0.8% |
|
National City Bank, Cleveland 0.3539% 3/1/13 (e)
(Cost $1,979,328) | | 2,000,000 | | 1,991,966 |
Certificates of Deposit - 0.4% |
| Principal Amount | | Value |
Nordea Bank Finland PLC yankee 0.7483% 2/7/13 (e)
(Cost $1,001,117) | | $ 1,000,000 | | $ 1,002,111 |
Cash Equivalents - 0.5% |
| Maturity Amount | | |
Investments in repurchase agreements in a joint trading account at 0.17%, dated 7/29/11 due 8/1/11 (Collateralized by U.S. Government Obligations) #
(Cost $1,268,000) | $ 1,268,018 | | 1,268,000 |
TOTAL INVESTMENT PORTFOLIO - 99.7% (Cost $260,537,070) | 258,382,012 |
NET OTHER ASSETS (LIABILITIES) - 0.3% | | 837,076 |
NET ASSETS - 100% | $ 259,219,088 |
Futures Contracts |
| Expiration Date | | Underlying Face Amount at Value | | Unrealized Appreciation/
(Depreciation) |
Purchased |
Eurodollar Contracts |
10 Eurodollar 90 Day Index Contracts | Dec. 2011 | | $ 9,987,625 | | $ (1,276) |
10 Eurodollar 90 Day Index Contracts | March 2012 | | 9,986,625 | | (1,651) |
10 Eurodollar 90 Day Index Contracts | Sept. 2011 | | 9,990,625 | | 2,975 |
TOTAL EURODOLLAR CONTRACTS | | $ 29,964,875 | | $ 48 |
Legend |
(a) Non-income producing - Security is in default. |
(b) Security exempt from registration under Rule 144A of the Securities Act of 1933. These securities may be resold in transactions exempt from registration, normally to qualified institutional buyers. At the end of the period, the value of these securities amounted to $31,071,008 or 12.0% of net assets. |
(c) Under the Temporary Liquidity Guarantee Program, the Federal Deposit Insurance Corporation guarantees principal and interest in the event of payment default or bankruptcy until the earlier of maturity date of the debt or until June 30, 2012. At the end of the period these securities amounted to $3,505,853 or 1.3% of net assets. |
(d) Security or a portion of the security was pledged to cover margin requirements for futures contracts. At the period end, the value of securities pledged amounted to $30,096. |
(e) Coupon rates for floating and adjustable rate securities reflect the rates in effect at period end. |
(f) Private activity obligations whose interest is subject to the federal alternative minimum tax for individuals. |
# Additional information on each counterparty to the repurchase agreement is as follows: |
Repurchase Agreement / Counterparty | Value |
$1,268,000 due 8/01/11 at 0.17% |
Bank of America NA | $ 917,336 |
J.P. Morgan Securities, Inc. | 34,291 |
Mizuho Securities USA, Inc. | 316,373 |
| $ 1,268,000 |
Other Information |
The following is a summary of the inputs used, as of July 31, 2011, involving the Fund's assets and liabilities carried at fair value. The inputs or methodology used for valuing securities may not be an indication of the risk associated with investing in those securities. For more information on valuation inputs, and their aggregation into the levels used in the tables below, please refer to the Security Valuation section in the accompanying Notes to Financial Statements. |
Valuation Inputs at Reporting Date: |
Description | Total | Level 1 | Level 2 | Level 3 |
Investments in Securities: | | | | |
Corporate Bonds | $ 105,694,456 | $ - | $ 105,694,456 | $ - |
U.S. Government and Government Agency Obligations | 65,672,058 | - | 65,672,058 | - |
U.S. Government Agency - Mortgage Securities | 7,312,574 | - | 7,312,574 | - |
Asset-Backed Securities | 47,724,746 | - | 47,475,001 | 249,745 |
Collateralized Mortgage Obligations | 19,360,240 | - | 19,360,240 | - |
Commercial Mortgage Securities | 6,848,545 | - | 6,292,069 | 556,476 |
Municipal Securities | 1,507,316 | - | 1,507,316 | - |
Bank Notes | 1,991,966 | - | 1,991,966 | - |
Certificates of Deposit | 1,002,111 | - | 1,002,111 | - |
Cash Equivalents | 1,268,000 | - | 1,268,000 | - |
Total Investments in Securities: | $ 258,382,012 | $ - | $ 257,575,791 | $ 806,221 |
Derivative Instruments: | | | | |
Assets | | | | |
Futures Contracts | $ 2,975 | $ 2,975 | $ - | $ - |
Liabilities | | | | |
Futures Contracts | $ (2,927) | $ (2,927) | $ - | $ - |
Total Derivative Instruments: | $ 48 | $ 48 | $ - | $ - |
The following is a reconciliation of Investments in Securities for which Level 3 inputs were used in determining value: |
Investments in Securities: | |
Beginning Balance | $ 583,242 |
Total Realized Gain (Loss) | (1,553,394) |
Total Unrealized Gain (Loss) | 2,131,415 |
Cost of Purchases | 2,324 |
Proceeds of Sales | (786,299) |
Amortization/Accretion | (24,596) |
Transfers in to Level 3 | 453,529 |
Transfers out of Level 3 | - |
Ending Balance | $ 806,221 |
The change in unrealized gain (loss) for the period attributable to Level 3 securities held at July 31, 2011 | $ 1,848 |
The information used in the above reconciliation represents fiscal year to date activity for any Investments in Securities identified as using Level 3 inputs at either the beginning or the end of the current fiscal period. Transfers in or out of Level 3 represent the beginning value of any Security or Instrument where a change in the pricing level occurred from the beginning to the end of the period. The cost of purchases and the proceeds of sales may include securities received or delivered through corporate actions or exchanges. Realized and unrealized gains (losses) disclosed in the reconciliation are included in Net Gain (Loss) on the Fund's Statement of Operations. |
Value of Derivative Instruments |
The following table is a summary of the Fund's value of derivative instruments by risk exposure as of July 31, 2011. For additional information on derivative instruments, please refer to the Derivative Instruments section in the accompanying Notes to Financial Statements. |
Risk Exposure /
Derivative Type | Value |
| Asset | Liability |
Interest Rate Risk | | |
Futures Contracts (a) | $ 2,975 | $ (2,927) |
Total Value of Derivatives | $ 2,975 | $ (2,927) |
(a) Reflects cumulative appreciation/(depreciation) on futures contracts as disclosed on the Schedule of Investments. Only the period end variation margin is separately disclosed on the Statement of Assets and Liabilities. |
Other Information |
Distribution of investments by country of issue, as a percentage of total net assets, is as follows: (Unaudited) |
United States of America | 83.9% |
Canada | 3.5% |
Netherlands | 3.5% |
United Kingdom | 2.6% |
France | 2.0% |
Australia | 1.8% |
Sweden | 1.0% |
Others (Individually Less Than 1%) | 1.7% |
| 100.0% |
Income Tax Information |
At July 31, 2011, the Fund had a capital loss carryforward of approximately $125,615,360 of which $1,917,431, $518,690, $12,186,304, $97,397,499, $9,829,719 and $3,765,717 will expire in fiscal 2014, 2015, 2016, 2017, 2018 and 2019, respectively. Capital loss carryforwards are only available to offset future capital gains of the Fund to the extent provided by regulations and may be limited. |
See accompanying notes which are an integral part of the financial statements.
Annual Report
Statement of Assets and Liabilities
| July 31, 2011 |
| | |
Assets | | |
Investment in securities, at value (including repurchase agreements of $1,268,000) - See accompanying schedule: Unaffiliated issuers (cost $260,537,070) | | $ 258,382,012 |
Cash | | 860 |
Receivable for investments sold | | 585 |
Receivable for fund shares sold | | 724,672 |
Interest receivable | | 821,093 |
Receivable for daily variation margin on futures contracts | | 125 |
Other receivables | | 27 |
Total assets | | 259,929,374 |
| | |
Liabilities | | |
Payable for fund shares redeemed | $ 608,179 | |
Distributions payable | 1,722 | |
Accrued management fee | 68,236 | |
Distribution and service plan fees payable | 2,077 | |
Other affiliated payables | 30,072 | |
Total liabilities | | 710,286 |
| | |
Net Assets | | $ 259,219,088 |
Net Assets consist of: | | |
Paid in capital | | $ 388,425,175 |
Distributions in excess of net investment income | | (61,884) |
Accumulated undistributed net realized gain (loss) on investments | | (126,989,194) |
Net unrealized appreciation (depreciation) on investments | | (2,155,009) |
Net Assets | | $ 259,219,088 |
See accompanying notes which are an integral part of the financial statements.
Annual Report
Financial Statements - continued
Statement of Assets and Liabilities - continued
| July 31, 2011 |
| | |
Calculation of Maximum Offering Price
Class A:
Net Asset Value and redemption price per share
($12,241,589 ÷ 1,492,766 shares) | | $ 8.20 |
| | |
Maximum offering price per share (100/98.50 of $8.20) | | $ 8.32 |
Class T:
Net Asset Value and redemption price per share ($4,811,352 ÷ 586,661 shares) | | $ 8.20 |
| | |
Maximum offering price per share (100/98.50 of $8.20) | | $ 8.32 |
Ultra-Short Bond:
Net Asset Value, offering price and redemption price per share ($239,921,423 ÷ 29,253,153 shares) | | $ 8.20 |
| | |
Institutional Class:
Net Asset Value, offering price and redemption price per share ($2,244,724 ÷ 273,711 shares) | | $ 8.20 |
See accompanying notes which are an integral part of the financial statements.
Annual Report
Statement of Operations
| Year ended July 31, 2011 |
| | |
Investment Income | | |
Interest | | $ 2,092,565 |
| | |
Expenses | | |
Management fee | $ 833,807 | |
Transfer agent fees | 273,052 | |
Distribution and service plan fees | 28,129 | |
Fund wide operations fee | 90,596 | |
Independent trustees' compensation | 962 | |
Miscellaneous | 895 | |
Total expenses before reductions | 1,227,441 | |
Expense reductions | (135) | 1,227,306 |
Net investment income (loss) | | 865,259 |
Realized and Unrealized Gain (Loss) Net realized gain (loss) on: | | |
Investment securities: | | |
Unaffiliated issuers | (1,589,005) | |
Futures contracts | 32,980 | |
Total net realized gain (loss) | | (1,556,025) |
Change in net unrealized appreciation (depreciation) on: Investment securities | 3,156,644 | |
Futures contracts | (15,646) | |
Total change in net unrealized appreciation (depreciation) | | 3,140,998 |
Net gain (loss) | | 1,584,973 |
Net increase (decrease) in net assets resulting from operations | | $ 2,450,232 |
See accompanying notes which are an integral part of the financial statements.
Annual Report
Financial Statements - continued
Statement of Changes in Net Assets
| Year ended
July 31,
2011 | Year ended
July 31,
2010 |
Increase (Decrease) in Net Assets | | |
Operations | | |
Net investment income (loss) | $ 865,259 | $ 1,890,067 |
Net realized gain (loss) | (1,556,025) | (8,164,438) |
Change in net unrealized appreciation (depreciation) | 3,140,998 | 9,508,825 |
Net increase (decrease) in net assets resulting
from operations | 2,450,232 | 3,234,454 |
Distributions to shareholders from net investment income | (936,826) | (1,887,049) |
Share transactions - net increase (decrease) | (6,245,769) | 33,525,237 |
Redemption fees | 16,839 | 9,556 |
Total increase (decrease) in net assets | (4,715,524) | 34,882,198 |
| | |
Net Assets | | |
Beginning of period | 263,934,612 | 229,052,414 |
End of period (including distributions in excess of net investment income of $(61,884) and undistributed net investment income of $11,746, respectively) | $ 259,219,088 | $ 263,934,612 |
See accompanying notes which are an integral part of the financial statements.
Annual Report
Financial Highlights - Class A
Years ended July 31, | 2011 | 2010 | 2009 | 2008 | 2007 |
Selected Per-Share Data | | | | | |
Net asset value, beginning of period | $ 8.15 | $ 8.11 | $ 8.26 | $ 9.82 | $ 10.02 |
Income from Investment Operations | | | | | |
Net investment income (loss) C | .013 | .047 | .091 | .384 | .493 |
Net realized and unrealized gain (loss) | .051 | .040 | (.167) | (1.612) | (.198) |
Total from investment operations | .064 | .087 | (.076) | (1.228) | .295 |
Distributions from net investment income | (.015) | (.047) | (.071) | (.294) | (.495) |
Tax return of capital | - | - | (.003) | (.039) | - |
Total distributions | (.015) | (.047) | (.074) | (.333) | (.495) |
Redemption fees added to paid in capital C | .001 | - E | - E | .001 | - E |
Net asset value, end of period | $ 8.20 | $ 8.15 | $ 8.11 | $ 8.26 | $ 9.82 |
Total Return A,B | .80% | 1.08% | (.92)% | (12.71)% | 2.97% |
Ratios to Average Net Assets D | | | | | |
Expenses before reductions | .63% | .64% | .68% | .67% | .66% |
Expenses net of fee waivers, if any | .63% | .64% | .68% | .67% | .66% |
Expenses net of all reductions | .63% | .64% | .67% | .66% | .66% |
Net investment income (loss) | .16% | .58% | 1.13% | 4.26% | 4.96% |
Supplemental Data | | | | | |
Net assets, end of period (000 omitted) | $ 12,242 | $ 18,129 | $ 8,033 | $ 6,268 | $ 13,735 |
Portfolio turnover rate | 103% | 95% | 92% | 11% | 29% |
A Total returns would have been lower if certain expenses had not been reduced during the applicable periods shown.
B Total returns do not include the effect of the sales charges.
C Calculated based on average shares outstanding during the period.
D Expense ratios reflect operating expenses of the class. Expenses before reductions do not reflect amounts reimbursed by the investment adviser or reductions from expense offset arrangements and do not represent the amount paid by the class during periods when reimbursements or reductions occur. Expenses net of fee waivers reflect expenses after reimbursement by the investment adviser but prior to reductions from expense offset arrangements. Expenses net of all reductions represent the net expenses paid by the class.
E Amount represents less than $.001 per share.
See accompanying notes which are an integral part of the financial statements.
Annual Report
Financial Highlights - Class T
Years ended July 31, | 2011 | 2010 | 2009 | 2008 | 2007 |
Selected Per-Share Data | | | | | |
Net asset value, beginning of period | $ 8.15 | $ 8.11 | $ 8.26 | $ 9.82 | $ 10.02 |
Income from Investment Operations | | | | | |
Net investment income (loss) C | .009 | .044 | .090 | .377 | .491 |
Net realized and unrealized gain (loss) | .052 | .040 | (.168) | (1.607) | (.199) |
Total from investment operations | .061 | .084 | (.078) | (1.230) | .292 |
Distributions from net investment income | (.012) | (.044) | (.069) | (.292) | (.492) |
Tax return of capital | - | - | (.003) | (.039) | - |
Total distributions | (.012) | (.044) | (.072) | (.331) | (.492) |
Redemption fees added to paid in capital C | .001 | - E | - E | .001 | - E |
Net asset value, end of period | $ 8.20 | $ 8.15 | $ 8.11 | $ 8.26 | $ 9.82 |
Total Return A,B | .76% | 1.03% | (.94)% | (12.72)% | 2.95% |
Ratios to Average Net Assets D | | | | | |
Expenses before reductions | .68% | .68% | .69% | .69% | .69% |
Expenses net of fee waivers, if any | .68% | .68% | .69% | .69% | .69% |
Expenses net of all reductions | .68% | .68% | .69% | .69% | .69% |
Net investment income (loss) | .12% | .54% | 1.11% | 4.23% | 4.93% |
Supplemental Data | | | | | |
Net assets, end of period (000 omitted) | $ 4,811 | $ 5,334 | $ 3,114 | $ 2,910 | $ 4,818 |
Portfolio turnover rate | 103% | 95% | 92% | 11% | 29% |
A Total returns would have been lower if certain expenses had not been reduced during the applicable periods shown.
B Total returns do not include the effect of the sales charges.
C Calculated based on average shares outstanding during the period.
D Expense ratios reflect operating expenses of the class. Expenses before reductions do not reflect amounts reimbursed by the investment adviser or reductions from expense offset arrangements and do not represent the amount paid by the class during periods when reimbursements or reductions occur. Expenses net of fee waivers reflect expenses after reimbursement by the investment adviser but prior to reductions from expense offset arrangements. Expenses net of all reductions represent the net expenses paid by the class.
E Amount represents less than $.001 per share.
See accompanying notes which are an integral part of the financial statements.
Annual Report
Financial Highlights - Ultra-Short Bond
Years ended July 31, | 2011 | 2010 | 2009 | 2008 | 2007 |
Selected Per-Share Data | | | | | |
Net asset value, beginning of period | $ 8.15 | $ 8.11 | $ 8.26 | $ 9.81 | $ 10.02 |
Income from Investment Operations | | | | | |
Net investment income (loss) B | .028 | .063 | .111 | .404 | .516 |
Net realized and unrealized gain (loss) | .051 | .040 | (.169) | (1.603) | (.210) |
Total from investment operations | .079 | .103 | (.058) | (1.199) | .306 |
Distributions from net investment income | (.030) | (.063) | (.088) | (.310) | (.516) |
Tax return of capital | - | - | (.004) | (.042) | - |
Total distributions | (.030) | (.063) | (.092) | (.352) | (.516) |
Redemption fees added to paid in capital B | .001 | - D | - D | .001 | - D |
Net asset value, end of period | $ 8.20 | $ 8.15 | $ 8.11 | $ 8.26 | $ 9.81 |
Total Return A | .99% | 1.27% | (.70)% | (12.42)% | 3.09% |
Ratios to Average Net Assets C | | | | | |
Expenses before reductions | .45% | .45% | .45% | .45% | .45% |
Expenses net of fee waivers, if any | .45% | .45% | .45% | .45% | .45% |
Expenses net of all reductions | .45% | .45% | .44% | .45% | .45% |
Net investment income (loss) | .34% | .77% | 1.36% | 4.47% | 5.17% |
Supplemental Data | | | | | |
Net assets, end of period (000 omitted) | $ 239,921 | $ 239,266 | $ 217,282 | $ 315,401 | $ 974,602 |
Portfolio turnover rate | 103% | 95% | 92% | 11% | 29% |
A Total returns would have been lower if certain expenses had not been reduced during the applicable periods shown.
B Calculated based on average shares outstanding during the period.
C Expense ratios reflect operating expenses of the class. Expenses before reductions do not reflect amounts reimbursed by the investment adviser or reductions from expense offset arrangements and do not represent the amount paid by the class during periods when reimbursements or reductions occur. Expenses net of fee waivers reflect expenses after reimbursement by the investment adviser but prior to reductions from expense offset arrangements. Expenses net of all reductions represent the net expenses paid by the class.
D Amount represents less than $.001 per share.
See accompanying notes which are an integral part of the financial statements.
Annual Report
Financial Highlights - Institutional Class
Years ended July 31, | 2011 | 2010 | 2009 | 2008 | 2007 |
Selected Per-Share Data | | | | | |
Net asset value, beginning of period | $ 8.15 | $ 8.11 | $ 8.26 | $ 9.81 | $ 10.02 |
Income from Investment Operations | | | | | |
Net investment income (loss) B | .025 | .057 | .102 | .416 | .510 |
Net realized and unrealized gain (loss) | .051 | .040 | (.168) | (1.619) | (.206) |
Total from investment operations | .076 | .097 | (.066) | (1.203) | .304 |
Distributions from net investment income | (.027) | (.057) | (.081) | (.306) | (.514) |
Tax return of capital | - | - | (.003) | (.042) | - |
Total distributions | (.027) | (.057) | (.084) | (.348) | (.514) |
Redemption fees added to paid in capital B | .001 | - D | - D | .001 | - D |
Net asset value, end of period | $ 8.20 | $ 8.15 | $ 8.11 | $ 8.26 | $ 9.81 |
Total Return A | .95% | 1.20% | (.80)% | (12.46)% | 3.06% |
Ratios to Average Net Assets C | | | | | |
Expenses before reductions | .49% | .52% | .58% | .48% | .48% |
Expenses net of fee waivers, if any | .49% | .52% | .55% | .48% | .48% |
Expenses net of all reductions | .49% | .52% | .54% | .48% | .48% |
Net investment income (loss) | .31% | .70% | 1.26% | 4.44% | 5.14% |
Supplemental Data | | | | | |
Net assets, end of period (000 omitted) | $ 2,245 | $ 1,206 | $ 623 | $ 594 | $ 8,312 |
Portfolio turnover rate | 103% | 95% | 92% | 11% | 29% |
A Total returns would have been lower if certain expenses had not been reduced during the applicable periods shown.
B Calculated based on average shares outstanding during the period.
C Expense ratios reflect operating expenses of the class. Expenses before reductions do not reflect amounts reimbursed by the investment adviser or reductions from expense offset arrangements and do not represent the amount paid by the class during periods when reimbursements or reductions occur. Expenses net of fee waivers reflect expenses after reimbursement by the investment adviser but prior to reductions from expense offset arrangements. Expenses net of all reductions represent the net expenses paid by the class.
D Amount represents less than $.001 per share.
See accompanying notes which are an integral part of the financial statements.
Annual Report
Notes to Financial Statements
For the period ended July 31, 2011
1. Organization.
Fidelity Ultra-Short Bond Fund (the Fund) is a fund of Fidelity Income Fund (the Trust) and is authorized to issue an unlimited number of shares. The Trust is registered under the Investment Company Act of 1940, as amended (the 1940 Act), as an open-end management investment company organized as a Massachusetts business trust. The Fund offers Class A, Class T, Ultra-Short Bond Class and Institutional Class shares, each of which has equal rights as to assets and voting privileges. Each class has exclusive voting rights with respect to matters that affect that class. Investment income, realized and unrealized capital gains and losses, the common expenses of the Fund, and certain fund-level expense reductions, if any, are allocated on a pro-rata basis to each class based on the relative net assets of each class to the total net assets of the Fund. Each class differs with respect to transfer agent and distribution and service plan fees incurred. Certain expense reductions may also differ by class.
2. Significant Accounting Policies.
The financial statements have been prepared in conformity with accounting principles generally accepted in the United States of America (GAAP), which require management to make certain estimates and assumptions at the date of the financial statements. Actual results could differ from those estimates. Subsequent events, if any, through the date that the financial statements were issued have been evaluated in the preparation of the financial statements. The following summarizes the significant accounting policies of the Fund:
Security Valuation. Investments are valued as of 4:00 p.m. Eastern time on the last calendar day of the period. The Fund uses independent pricing services approved by the Board of Trustees to value its investments. When current market prices or quotations are not readily available or reliable, valuations may be determined in good faith in accordance with procedures adopted by the Board of Trustees. Factors used in determining value may include market or security specific events, changes in interest rates and credit quality. The frequency with which these procedures are used cannot be predicted and they may be utilized to a significant extent. The value used for net asset value (NAV) calculation under these procedures may differ from published prices for the same securities.
The Fund categorizes the inputs to valuation techniques used to value its investments into a disclosure hierarchy consisting of three levels as shown below:
Level 1 - quoted prices in active markets for identical investments
Level 2 - other significant observable inputs (including quoted prices for similar investments, interest rates, prepayment speeds, etc.)
Level 3 - unobservable inputs (including the Fund's own assumptions based on the best information available)
Annual Report
Notes to Financial Statements - continued
2. Significant Accounting Policies - continued
Security Valuation - continued
Changes in valuation techniques may result in transfers in or out of an assigned level within the disclosure hierarchy. The aggregate value of investments by input level, as of July 31, 2011 for the Fund's investments, as well as a roll forward of Level 3 securities, is included at the end of the Fund's Schedule of Investments. Valuation techniques used to value the Fund's investments by major category are as follows:
Debt securities, including restricted securities, are valued based on evaluated prices received from independent pricing services or from dealers who make markets in such securities. For corporate bonds, bank notes, U.S. government and government agency obligations and certificates of deposit, pricing services utilize matrix pricing which considers yield or price of bonds of comparable quality, coupon, maturity and type as well as dealer supplied prices and are generally categorized as Level 2 in the hierarchy. For asset backed securities, collateralized mortgage obligations, commercial mortgage securities and U.S. government agency mortgage securities, pricing services utilize matrix pricing which considers prepayment speed assumptions, attributes of the collateral, yield or price of bonds of comparable quality, coupon, maturity and type as well as dealer supplied prices and, accordingly, such securities are generally categorized as Level 2 in the hierarchy.
When independent prices are unavailable or unreliable, debt securities may be valued utilizing pricing matrices which consider similar factors that would be used by independent pricing services. These are generally categorized as Level 2 in the hierarchy but may be Level 3 depending on the circumstances.
Short-term securities with remaining maturities of sixty days or less may be valued at amortized cost, which approximates fair value, and are categorized as Level 2 in the hierarchy.
Futures contracts are valued at the settlement price established each day by the board of trade or exchange on which they are traded and are categorized as Level 1 in the hierarchy.
Investment Transactions and Income. For financial reporting purposes, the Fund's investment holdings and NAV include trades executed through the end of the last business day of the period. The NAV per share for processing shareholder transactions is calculated as of the close of business of the New York Stock Exchange (NYSE), normally 4:00 p.m. Eastern time and includes trades executed through the end of the prior business day. Gains and losses on securities sold are determined on the basis of identified cost. Interest income is accrued as earned. Interest income includes coupon interest and amortization of premium and accretion of discount on debt securities. The principal value on inflation-indexed securities is periodically adjusted to the rate of inflation and
Annual Report
2. Significant Accounting Policies - continued
Investment Transactions and Income - continued
interest is accrued based on the principal value. The adjustments to principal due to inflation are reflected as increases or decreases to interest income even though principal is not received until maturity. Debt obligations may be placed on non-accrual status and related interest income may be reduced by ceasing current accruals and writing off interest receivables when the collection of all or a portion of interest has become doubtful based on consistently applied procedures. A debt obligation is removed from non-accrual status when the issuer resumes interest payments or when collectability of interest is reasonably assured.
Expenses. Expenses directly attributable to a fund are charged to that fund. Expenses attributable to more than one fund are allocated among the respective funds on the basis of relative net assets or other appropriate methods. Expense estimates are accrued in the period to which they relate and adjustments are made when actual amounts are known.
Income Tax Information and Distributions to Shareholders. Each year, the Fund intends to qualify as a regulated investment company, including distributing substantially all of its taxable income and realized gains under Subchapter M of the Internal Revenue Code and filing its U.S. federal tax return. As a result, no provision for income taxes is required. As of July 31, 2011, the Fund did not have any unrecognized tax benefits in the financial statements. A fund's federal tax return is subject to examination by the Internal Revenue Service (IRS) for a period of three years.
Dividends are declared and recorded daily and paid monthly from net investment income. Distributions from realized gains, if any, are declared and recorded on the ex-dividend date. Income dividends and capital gain distributions are declared separately for each class. Income and capital gain distributions are determined in accordance with income tax regulations, which may differ from GAAP.
Capital accounts within the financial statements are adjusted for permanent book-tax differences. These adjustments have no impact on net assets or the results of operations. Temporary book-tax differences will reverse in a subsequent period.
Book-tax differences are primarily due to futures transactions, premium on debt securities, market discount, capital loss carryforwards and losses deferred due to excise tax regulations.
Annual Report
Notes to Financial Statements - continued
2. Significant Accounting Policies - continued
Income Tax Information and Distributions to Shareholders - continued
The federal tax cost of investment securities and unrealized appreciation (depreciation) as of period end were as follows:
Gross unrealized appreciation | $ 526,666 |
Gross unrealized depreciation | (2,698,472) |
Net unrealized appreciation (depreciation) on securities and other investments | $ (2,171,806) |
| |
Tax Cost | $ 260,553,818 |
The tax-based components of distributable earnings as of period end were as follows:
Capital loss carryforward | $ (125,615,360) |
Net unrealized appreciation (depreciation) | $ (2,171,806) |
Under the recently enacted Regulated Investment Company Modernization Act of 2010 (the Act), the Fund will be permitted to carry forward capital losses incurred in taxable years beginning after December 22, 2010 for an unlimited period. However, any losses incurred during those future taxable years will be required to be utilized prior to any losses incurred in pre-enactment taxable years, which generally expire after eight years from when they are incurred. Additionally, post-enactment capital losses that are carried forward will retain their character as either short-term or long-term capital losses rather than being considered all short-term as under previous law. The Fund's first fiscal year end subject to the Act will be July 31, 2012.
The tax character of distributions paid was as follows:
| July 31, 2011 | July 31, 2010 |
Ordinary Income | $ 936,826 | $ 1,887,049 |
Short-Term Trading (Redemption) Fees. Shares held by investors in the Fund less than 60 days are subject to a redemption fee equal to .25% of the net asset value of shares redeemed. All redemption fees, which reduce the proceeds of the shareholder redemption, are retained by the Fund and accounted for as an addition to paid in capital.
Annual Report
2. Significant Accounting Policies - continued
New Accounting Pronouncements. In May 2011, the Financial Accounting Standards Board (FASB) issued an update to Topic 860 - Transfers and Servicing. The update clarifies the assessment of effective control by removing the collateral provision requirement that the seller maintains at all times collateral sufficient to fund substantially all of the cost of purchasing replacement financial assets from others. This may result in a change in accounting treatment from purchases and sales to secured borrowings for certain mortgage dollar roll transactions, and therefore separate accounting of the income and expenses associated with the secured borrowings. This change would have no effect on the net assets or total return of the Fund. The update is effective for transactions entered into on or after December 15, 2011. Management is currently evaluating the potential impact of the update on the accounting for mortgage dollar roll transactions entered into by the Fund. Also in May 2011, the FASB issued Accounting Standard Update No. 2011-04, Fair Value Measurement (Topic 820) - Amendments to Achieve Common Fair Value Measurement and Disclosure Requirements in U.S. GAAP and IFRSs. The update changes the wording used to describe the requirements in GAAP for measuring fair value and for disclosing information about fair value measurements. The update is effective during interim and annual periods beginning after December 15, 2011. Management is currently evaluating the impact of the update's adoption on the Fund's financial statement disclosures.
3. Operating Policies.
Repurchase Agreements. Fidelity Management & Research Company (FMR) has received an Exemptive Order from the Securities and Exchange Commission (the SEC) which permits the Fund and other affiliated entities of FMR to transfer uninvested cash balances into joint trading accounts which are then invested in repurchase agreements. The Fund may also invest directly with institutions in repurchase agreements. Repurchase agreements are collateralized by government or non-government securities. Upon settlement date, collateral is held in segregated accounts with custodian banks and may be obtained in the event of a default of the counterparty. The Fund monitors, on a daily basis, the value of the collateral to ensure it is at least equal to the principal amount of the repurchase agreement (including accrued interest). In the event of a default by the counterparty, realization of the collateral proceeds could be delayed, during which time the value of the collateral may decline.
Restricted Securities. The Fund may invest in securities that are subject to legal or contractual restrictions on resale. These securities generally may be resold in transactions exempt from registration or to the public if the securities are registered. Disposal of these securities may involve time-consuming negotiations and expense, and prompt sale at an acceptable price may be difficult. Information regarding restricted securities is included at the end of the Fund's Schedule of Investments.
Annual Report
Notes to Financial Statements - continued
4. Derivative Instruments.
Risk Exposures and the Use of Derivative Instruments. The Fund used derivative instruments (derivatives), including futures contracts, in order to meet its investment objectives. The strategy is to use derivatives to increase returns, to gain exposure to certain types of assets and to manage exposure to certain risks as defined below. The success of any strategy involving derivatives depends on analysis of numerous economic factors, and if the strategies for investment do not work as intended, the Fund may not achieve its objectives.
The Fund's use of derivatives increased or decreased its exposure to the following risk:
Interest Rate Risk | Interest rate risk relates to the fluctuations in the value of interest-bearing securities due to changes in the prevailing levels of market interest rates. |
The Fund is also exposed to additional risks from investing in derivatives, such as liquidity risk and counterparty credit risk. Liquidity risk is the risk that the Fund will be unable to sell the derivative in the open market in a timely manner. Counterparty credit risk is the risk that the counterparty will not be able to fulfill its obligation to the Fund. The Fund's maximum risk of loss from counterparty credit risk is generally the aggregate unrealized appreciation and unpaid counterparty payments in excess of any collateral pledged by the counterparty to the Fund. Counterparty risk related to exchange-traded futures contracts is minimal because of the protection provided by the exchange on which they trade. Derivatives involve, to varying degrees, risk of loss in excess of the amounts recognized in the Statement of Assets and Liabilities.
Futures Contracts. A futures contract is an agreement between two parties to buy or sell a specified underlying instrument for a fixed price at a specified future date. The Fund used futures contracts to manage its exposure to the bond, and to fluctuations in interest rates.
Upon entering into a futures contract, a fund is required to deposit either cash or securities (initial margin) with a clearing broker in an amount equal to a certain percentage of the face value of the contract. Futures contracts are marked-to-market daily and subsequent payments (variation margin) are made or received by a fund depending on the daily fluctuations in the value of the futures contracts and are recorded as unrealized appreciation or (depreciation). This receivable and/or payable is included in daily variation margin on futures contracts in the Statement of Assets and Liabilities. Realized gain or (loss) is recorded upon the expiration or closing of a futures contract.
Annual Report
4. Derivative Instruments - continued
Futures Contracts - continued
The underlying face amount at value of open futures contracts at period end, if any, is shown in the Schedule of Investments under the caption "Futures Contracts." This amount reflects each contract's exposure to the underlying instrument at period end. Securities deposited to meet initial margin requirements are identified in the Schedule of Investments.
Certain risks arise upon entering into futures contracts, including the risk that an illiquid market limits the ability to close out a futures contract prior to settlement date.
During the period the Fund recognized net realized gain (loss) of $32,980 and a change in net unrealized appreciation (depreciation) of $(15,646) related to its investment in futures contracts. These amounts are included in the Statement of Operations.
5. Purchases and Sales of Investments.
Purchases and sales of securities, other than short-term securities and U.S. government securities, aggregated $184,024,578 and $115,621,820, respectively.
6. Fees and Other Transactions with Affiliates.
Management Fee. FMR and its affiliates provide the Fund with investment management related services for which the Fund pays a monthly management fee. The management fee is the sum of an individual fund fee rate that is based on an annual rate of .20% of the Fund's average net assets and a group fee rate that averaged .12% during the period. The group fee rate is based upon the average net assets of all the mutual funds advised by FMR. The group fee rate decreases as assets under management increase and increases as assets under management decrease. For the period, the total annual management fee rate was .32% of the Fund's average net assets.
Distribution and Service Plan Fees. In accordance with Rule 12b-1 of the 1940 Act, the Fund has adopted separate Distribution and Service Plans for each class of shares. Certain classes pay Fidelity Distributors Corporation (FDC), an affiliate of FMR, separate Distribution and Service Fees, each of which is based on an annual percentage of each class' average net assets. In addition, FDC may pay financial intermediaries for selling shares of the Fund and providing shareholder support services. For the period, the Distribution and Service Fee rates, total fees and amounts retained by FDC were as follows:
| Distribution
Fee | Service
Fee | Total Fees | Retained
by FDC |
Class A | 0% | .15% | $ 21,556 | $ 2,014 |
Class T | 0% | .15% | 6,573 | 9 |
| | | $ 28,129 | $ 2,023 |
Annual Report
Notes to Financial Statements - continued
6. Fees and Other Transactions with Affiliates - continued
Sales Load. FDC may receive a front-end sales charge of up to 1.50% for selling Class A and Class T shares, some of which is paid to financial intermediaries for selling shares of the Fund. Depending on the holding period, FDC may receive a contingent deferred sales charges levied on Class A and Class T redemptions. The deferred sales charges range from, .75% or .50% for certain purchases of Class A shares (.75% prior to February 18, 2011) and .25% for certain purchases of Class T shares.
For the period, sales charge amounts retained by FDC were as follows:
| Retained
by FDC |
Class A | $ 7,465 |
Class T | 612 |
| $ 8,077 |
Transfer Agent Fees. Fidelity Investments Institutional Operations Company, Inc. (FIIOC), an affiliate of FMR, is the transfer, dividend disbursing and shareholder servicing agent for each class of the Fund. FIIOC receives account fees and asset-based fees that vary according to the account size and type of account of the shareholders of each respective class of the Fund, with the exception of Ultra Short Bond. FIIOC receives an asset-based fee of .10% of Ultra-Short Bond's average net assets. FIIOC pays for typesetting, printing and mailing of shareholder reports, except proxy statements. For the period, transfer agent fees for each class were as follows:
| Amount | % of
Average
Net Assets |
Class A | $ 19,230 | .13 |
Class T | 7,717 | .18 |
Ultra-Short Bond | 244,304 | .10 |
Institutional Class | 1,801 | .14 |
| $ 273,052 | |
Fund Wide Operations Fee. Pursuant to the Fund Wide Operations and Expense Agreement (FWOE), FMR has agreed to provide for fund level expenses (which do not include transfer agent, Rule 12b-1 fees, compensation of the independent Trustees, interest (including commitment fees), taxes or extraordinary expenses, if any) in return for a FWOE fee equal to .35% less the total amount of the management fee. The FWOE paid by the Fund is reduced by an amount equal to the fees and expenses paid to the independent Trustees. For the period, the FWOE fee was equivalent to an annual rate of .03% of average net assets.
Annual Report
7. Committed Line of Credit.
The Fund participates with other funds managed by FMR or an affiliate in a $4.0 billion credit facility (the "line of credit") to be utilized for temporary or emergency purposes to fund shareholder redemptions or for other short-term liquidity purposes. The Fund has agreed to pay commitment fees on its pro-rata portion of the line of credit, which amounted to $895 and is reflected in Miscellaneous expenses on the Statement of Operations. During the period, there were no borrowings on this line of credit.
8. Expense Reductions.
Through arrangements with the Fund's custodian, credits realized as a result of uninvested cash balances were used to reduce the Fund's expenses. During the period, these credits reduced the Fund's expenses by $135.
9. Distributions to Shareholders.
Distributions to shareholders of each class were as follows:
Years ended July 31, | 2011 | 2010 |
From net investment income | | |
Class A | $ 30,970 | $ 70,804 |
Class T | 7,200 | 19,435 |
Ultra-Short Bond | 894,223 | 1,791,150 |
Institutional Class | 4,433 | 5,660 |
Total | $ 936,826 | $ 1,887,049 |
10. Share Transactions.
Transactions for each class of shares were as follows:
| Shares | Dollars |
Years ended July 31, | 2011 | 2010 | 2011 | 2010 |
Class A | | | | |
Shares sold | 1,065,924 | 1,996,126 | $ 8,721,384 | $ 16,257,557 |
Reinvestment of distributions | 2,786 | 6,739 | 22,762 | 54,896 |
Shares redeemed | (1,799,361) | (770,234) | (14,718,442) | (6,273,379) |
Net increase (decrease) | (730,651) | 1,232,631 | $ (5,974,296) | $ 10,039,074 |
Class T | | | | |
Shares sold | 231,971 | 590,657 | $ 1,901,011 | $ 4,813,729 |
Reinvestment of distributions | 787 | 2,161 | 6,425 | 17,605 |
Shares redeemed | (300,216) | (322,791) | (2,455,991) | (2,628,531) |
Net increase (decrease) | (67,458) | 270,027 | $ (548,555) | $ 2,202,803 |
Annual Report
Notes to Financial Statements - continued
10. Share Transactions - continued
| Shares | Dollars |
Years ended July 31, | 2011 | 2010 | 2011 | 2010 |
Ultra-Short Bond | | | | |
Shares sold | 10,075,512 | 9,420,448 | $ 82,446,504 | $ 76,695,898 |
Reinvestment of distributions | 105,881 | 211,789 | 866,057 | 1,725,137 |
Shares redeemed | (10,269,460) | (7,087,084) | (84,068,521) | (57,716,904) |
Net increase (decrease) | (88,067) | 2,545,153 | $ (755,960) | $ 20,704,131 |
Institutional Class | | | | |
Shares sold | 250,678 | 142,602 | $ 2,055,596 | $ 1,161,563 |
Reinvestment of distributions | 412 | 362 | 3,373 | 2,947 |
Shares redeemed | (125,316) | (71,879) | (1,025,927) | (585,281) |
Net increase (decrease) | 125,774 | 71,085 | $ 1,033,042 | $ 579,229 |
11. Other.
The Fund's organizational documents provide former and current trustees and officers with a limited indemnification against liabilities arising in connection with the performance of their duties to the Fund. In the normal course of business, the Fund may also enter into contracts that provide general indemnifications. The Fund's maximum exposure under these arrangements is unknown as this would be dependent on future claims that may be made against the Fund. The risk of material loss from such claims is considered remote.
Annual Report
To the Trustees of Fidelity Income Fund and the Shareholders of Fidelity Ultra-Short Bond Fund:
In our opinion, the accompanying statement of assets and liabilities, including the schedule of investments, and the related statements of operations and of changes in net assets and the financial highlights present fairly, in all material respects, the financial position of Fidelity Ultra-Short Bond Fund (a fund of Fidelity Income Fund) at July 31, 2011, the results of its operations for the year then ended, the changes in its net assets for each of the two years in the period then ended and the financial highlights for each of the five years in the period then ended, in conformity with accounting principles generally accepted in the United States of America. These financial statements and financial highlights (hereafter referred to as "financial statements") are the responsibility of the Fidelity Ultra-Short Bond Fund's management. Our responsibility is to express an opinion on these financial statements based on our audits. We conducted our audits of these financial statements in accordance with the standards of the Public Company Accounting Oversight Board (United States). Those standards require that we plan and perform the audit to obtain reasonable assurance about whether the financial statements are free of material misstatement. An audit includes examining, on a test basis, evidence supporting the amounts and disclosures in the financial statements, assessing the accounting principles used and significant estimates made by management, and evaluating the overall financial statement presentation. We believe that our audits, which included confirmation of securities at July 31, 2011 by correspondence with the custodian and brokers, provide a reasonable basis for our opinion.
/s/ PricewaterhouseCoopers LLP
PricewaterhouseCoopers LLP
Boston, Massachusetts
September 16, 2011
Annual Report
The Trustees and executive officers of the trust and fund, as applicable, are listed below. The Board of Trustees governs the fund and is responsible for protecting the interests of shareholders. The Trustees are experienced executives who meet periodically throughout the year to oversee the fund's activities, review contractual arrangements with companies that provide services to the fund, oversee management of the risks associated with such activities and contractual arrangements, and review the fund's performance. Except for James C. Curvey, each of the Trustees oversees 198 funds advised by FMR or an affiliate. Mr. Curvey oversees 419 funds advised by FMR or an affiliate.
The Trustees hold office without limit in time except that (a) any Trustee may resign; (b) any Trustee may be removed by written instrument, signed by at least two-thirds of the number of Trustees prior to such removal; (c) any Trustee who requests to be retired or who has become incapacitated by illness or injury may be retired by written instrument signed by a majority of the other Trustees; and (d) any Trustee may be removed at any special meeting of shareholders by a two-thirds vote of the outstanding voting securities of the trust. Each Trustee who is not an interested person (as defined in the 1940 Act) (Independent Trustee), shall retire not later than the last day of the calendar year in which his or her 75th birthday occurs. The Independent Trustees may waive this mandatory retirement age policy with respect to individual Trustees. The executive officers hold office without limit in time, except that any officer may resign or may be removed by a vote of a majority of the Trustees at any regular meeting or any special meeting of the Trustees. Except as indicated, each individual has held the office shown or other offices in the same company for the past five years.
Experience, Skills, Attributes, and Qualifications of the Fund's Trustees. The Governance and Nominating Committee has adopted a statement of policy that describes the experience, qualifications, attributes, and skills that are necessary and desirable for potential Independent Trustee candidates (Statement of Policy). The Board believes that each Trustee satisfied at the time he or she was initially elected or appointed a Trustee, and continues to satisfy, the standards contemplated by the Statement of Policy. The Governance and Nominating Committee also engages professional search firms to help identify potential Independent Trustee candidates who have the experience, qualifications, attributes, and skills consistent with the Statement of Policy. From time to time, additional criteria based on the composition and skills of the current Independent Trustees, as well as experience or skills that may be appropriate in light of future changes to board composition, business conditions, and regulatory or other developments, have also been considered by the professional search firms and the Governance and Nominating Committee. In addition, the Board takes into account the Trustees' commitment and participation in Board and committee meetings, as well as their leadership of standing and ad hoc committees throughout their tenure.
In determining that a particular Trustee was and continues to be qualified to serve as a Trustee, the Board has considered a variety of criteria, none of which, in isolation, was controlling. The Board believes that, collectively, the Trustees have balanced and diverse experience, qualifications, attributes, and skills, which allow the Board to operate effectively in governing the fund and protecting the interests of shareholders. Information about the specific experience, skills, attributes, and qualifications of each Trustee, which in each case led to the Board's conclusion that the Trustee should serve (or continue to serve) as a trustee of the fund, is provided below.
Annual Report
Board Structure and Oversight Function. Abigail P. Johnson is an interested person (as defined in the 1940 Act) and currently serves as Chairman. The Trustees have determined that an interested Chairman is appropriate and benefits shareholders because an interested Chairman has a personal and professional stake in the quality and continuity of services provided to the fund. Independent Trustees exercise their informed business judgment to appoint an individual of their choosing to serve as Chairman, regardless of whether the Trustee happens to be independent or a member of management. The Independent Trustees have determined that they can act independently and effectively without having an Independent Trustee serve as Chairman and that a key structural component for assuring that they are in a position to do so is for the Independent Trustees to constitute a substantial majority for the Board. The Independent Trustees also regularly meet in executive session. Kenneth L. Wolfe serves as Chairman of the Independent Trustees and as such (i) acts as a liaison between the Independent Trustees and management with respect to matters important to the Independent Trustees and (ii) with management prepares agendas for Board meetings.
Fidelity funds are overseen by different Boards of Trustees. The fund's Board oversees Fidelity's investment-grade bond, money market, and asset allocation funds and another Board oversees Fidelity's equity and high income funds. The asset allocation funds may invest in Fidelity funds that are overseen by such other Board. The use of separate Boards, each with its own committee structure, allows the Trustees of each group of Fidelity funds to focus on the unique issues of the funds they oversee, including common research, investment, and operational issues. On occasion, the separate Boards establish joint committees to address issues of overlapping consequences for the Fidelity funds overseen by each Board.
The Trustees operate using a system of committees to facilitate the timely and efficient consideration of all matters of importance to the Trustees, the fund, and fund shareholders and to facilitate compliance with legal and regulatory requirements and oversight of the fund's activities and associated risks. The Board, acting through its committees, has charged FMR and its affiliates with (i) identifying events or circumstances the occurrence of which could have demonstrably adverse effects on the fund's business and/or reputation; (ii) implementing processes and controls to lessen the possibility that such events or circumstances occur or to mitigate the effects of such events or circumstances if they do occur; and (iii) creating and maintaining a system designed to evaluate continuously business and market conditions in order to facilitate the identification and implementation processes described in (i) and (ii) above. Because the day-to-day operations and activities of the fund are carried out by or through FMR, its affiliates and other service providers, the fund's exposure to risks is mitigated but not eliminated by the processes overseen by the Trustees. While each of the Board's committees has responsibility for overseeing different aspects of the fund's activities, oversight is exercised primarily through the Operations and Audit Committees. Appropriate personnel, including but not limited to the fund's Chief Compliance Officer (CCO), FMR's internal auditor, the independent accountants, the fund's Treasurer and portfolio management personnel, make periodic reports to the Board's committees, as appropriate. The responsibilities of each committee, including their oversight responsibilities, are described further under "Standing Committees of the Fund's Trustees."
Annual Report
Trustees and Officers - continued
The fund's Statement of Additional Information (SAI) includes more information about the Trustees. To request a free copy, call Fidelity at 1-800-544-8544.
Interested Trustees*:
Correspondence intended for each Trustee who is an interested person may be sent to Fidelity Investments, 82 Devonshire Street, Boston, Massachusetts 02109.
Name, Age; Principal Occupations and Other Relevant Experience+ |
Abigail P. Johnson (49) |
| Year of Election or Appointment: 2009 Ms. Johnson is Trustee and Chairman of the Board of Trustees of certain Trusts. Ms. Johnson serves as President of Personal, Workplace and Institutional Services (2005-present). Ms. Johnson is Chairman and Director of FMR Co., Inc. (2011-present), Chairman and Director of FMR (2011-present), and the Vice Chairman and Director (2007-present) of FMR LLC. Previously, Ms. Johnson served as President and a Director of FMR (2001-2005), a Trustee of other investment companies advised by FMR, Fidelity Investments Money Management, Inc., and FMR Co., Inc. (2001-2005), Senior Vice President of the Fidelity funds (2001-2005), and managed a number of Fidelity funds. Ms. Abigail P. Johnson and Mr. Arthur E. Johnson are not related. |
James C. Curvey (76) |
| Year of Election or Appointment: 2007 Mr. Curvey also serves as Trustee (2007-present) of other investment companies advised by FMR. Mr. Curvey is a Director of Fidelity Investments Money Management, Inc. (2009-present), Director of Fidelity Research & Analysis Co. (2009-present) and Director of FMR and FMR Co., Inc. (2007-present). Mr. Curvey is also Vice Chairman (2007-present) and Director of FMR LLC. In addition, Mr. Curvey serves as an Overseer for the Boston Symphony Orchestra and a member of the Trustees of Villanova University. Previously, Mr. Curvey was the Vice Chairman (2006-2007) and Director (2000-2007) of FMR Corp. |
Annual Report
* Trustees have been determined to be "Interested Trustees" by virtue of, among other things, their affiliation with the trust or various entities under common control with FMR.
+ The information above includes each Trustee's principal occupation during the last five years and other information relating to the experience, attributes, and skills relevant to each Trustee's qualifications to serve as a Trustee, which led to the conclusion that each Trustee should serve as a Trustee for the fund.
Independent Trustees:
Correspondence intended for each Independent Trustee (that is, the Trustees other than the Interested Trustees) may be sent to Fidelity Investments, P.O. Box 55235, Boston, Massachusetts 02205-5235.
Name, Age; Principal Occupations and Other Relevant Experience+ |
Albert R. Gamper, Jr. (69) |
| Year of Election or Appointment: 2006 Mr. Gamper is Vice Chairman of the Independent Trustees of the Fixed Income and Asset Allocation Funds (2011-present). Prior to his retirement in December 2004, Mr. Gamper served as Chairman of the Board of CIT Group Inc. (commercial finance). During his tenure with CIT Group Inc. Mr. Gamper served in numerous senior management positions, including Chairman (1987-1989; 1999-2001; 2002-2004), Chief Executive Officer (1987-2004), and President (2002-2003). He also served as President and Chief Executive Officer of Tyco Capital Corporation (2001-2002). Mr. Gamper currently serves as a member of the Board of Directors of Public Service Enterprise Group (utilities, 2000-present), a member of the Board of Trustees, Rutgers University (2004-present), and Chairman of the Board of Saint Barnabas Health Care System. Previously, Mr. Gamper served as Chairman of the Board of Governors, Rutgers University (2004-2007). |
Robert F. Gartland (59) |
| Year of Election or Appointment: 2010 Mr. Gartland is a partner and investor of Vietnam Partners LLC (investments and consulting, 2008-present) and is Chairman and an investor in Gartland and Mellina Group Corp. (consulting, 2009-present). Prior to his retirement, Mr. Gartland held a variety of positions at Morgan Stanley (financial services, 1979-2007) including Managing Director (1987-2007). |
Arthur E. Johnson (64) |
| Year of Election or Appointment: 2008 Mr. Johnson serves as a member of the Board of Directors of Eaton Corporation (diversified power management, 2009-present) and AGL Resources, Inc. (holding company). Prior to his retirement, Mr. Johnson served as Senior Vice President of Corporate Strategic Development of Lockheed Martin Corporation (defense contractor, 1999-2009). He previously served on the Board of Directors of IKON Office Solutions, Inc. (1999-2008) and Delta Airlines (2005-2007). Mr. Arthur E. Johnson and Ms. Abigail P. Johnson are not related. |
Michael E. Kenneally (57) |
| Year of Election or Appointment: 2009 Previously, Mr. Kenneally served as a Member of the Advisory Board for certain Fidelity Fixed Income and Asset Allocation Funds (2008-2009). Prior to his retirement, Mr. Kenneally served as Chairman and Global Chief Executive Officer of Credit Suisse Asset Management (2003-2005). Mr. Kenneally was a Director of the Credit Suisse Funds (U.S. mutual funds, 2004-2008) and certain other closed-end funds (2004-2005) and was awarded the Chartered Financial Analyst (CFA) designation in 1991. |
James H. Keyes (70) |
| Year of Election or Appointment: 2007 Mr. Keyes serves as a member of the Boards of Navistar International Corporation (manufacture and sale of trucks, buses, and diesel engines, since 2002) and Pitney Bowes, Inc. (integrated mail, messaging, and document management solutions, since 1998). Prior to his retirement, Mr. Keyes served as Chairman and Chief Executive Officer of Johnson Controls (automotive, building, and energy, 1998-2002) and as a member of the Board of LSI Logic Corporation (semiconductor technologies, 1984-2008). |
Marie L. Knowles (64) |
| Year of Election or Appointment: 2001 Prior to Ms. Knowles' retirement in June 2000, she served as Executive Vice President and Chief Financial Officer of Atlantic Richfield Company (ARCO) (diversified energy, 1996-2000). From 1993 to 1996, she was a Senior Vice President of ARCO and President of ARCO Transportation Company. She served as a Director of ARCO from 1996 to 1998. Ms. Knowles currently serves as a Director and Chairman of the Audit Committee of McKesson Corporation (healthcare service, since 2002). Ms. Knowles is an Honorary Trustee of the Brookings Institution and a member of the Board of the Catalina Island Conservancy and of the Santa Catalina Island Company (2009-present). She also serves as a member of the Advisory Board for the School of Engineering of the University of Southern California and the Foundation Board of the School of Architecture at the University of Virginia (2007-present). Previously, Ms. Knowles served as a Director of Phelps Dodge Corporation (copper mining and manufacturing, 1994-2007). |
Kenneth L. Wolfe (72) |
| Year of Election or Appointment: 2005 Mr. Wolfe is Chairman of the Independent Trustees of the Fixed Income and Asset Allocation Funds (2008-present). Prior to his retirement, Mr. Wolfe served as Chairman and a Director (2007-2009) and Chairman and Chief Executive Officer (1994-2001) of Hershey Foods Corporation. He also served as a member of the Boards of Adelphia Communications Corporation (telecommunications, 2003-2006), Bausch & Lomb, Inc. (medical/pharmaceutical, 1993-2007), and Revlon, Inc. (personal care products, 2004-2009). |
+ The information above includes each Trustee's principal occupation during the last five years and other information relating to the experience, attributes, and skills relevant to each Trustee's qualifications to serve as a Trustee, which led to the conclusion that each Trustee should serve as a Trustee for the fund.
Annual Report
Trustees and Officers - continued
Executive Officers:
Correspondence intended for each executive officer may be sent to Fidelity Investments, 82 Devonshire Street, Boston, Massachusetts 02109.
Name, Age; Principal Occupation |
John R. Hebble (53) |
| Year of Election or Appointment: 2008 President and Treasurer of Fidelity's Fixed Income and Asset Allocation Funds. Mr. Hebble also serves as President (2011-present), Treasurer, and Chief Financial Officer of The North Carolina Capital Management Trust: Cash and Term Portfolios (2008-present), Assistant Treasurer of other Fidelity funds (2009-present) and is an employee of Fidelity Investments. |
Christopher P. Sullivan (57) |
| Year of Election or Appointment: 2009 Vice President of Fidelity's Bond Funds. Mr. Sullivan also serves as President of Fidelity's Bond Division (2009-present). Mr. Sullivan is Executive Vice President of Fidelity Investments Money Management, Inc. (2009-present), and a Director of Fidelity Management & Research (U.K.) Inc. (2010-present). Previously, Mr. Sullivan served as Managing Director, Co-Head of U.S. Fixed Income at Goldman Sachs Asset Management (2001-2009). |
Christine J. Thompson (53) |
| Year of Election or Appointment: 2010 Vice President of Fidelity's Bond Funds. Ms. Thompson also serves as Chief Investment Officer of FMR's Bond Group (2010-present) and is an employee of Fidelity Investments. Previously, Ms. Thompson served as Director of Municipal Bond Portfolio Managers (2002-2010). |
Scott C. Goebel (43) |
| Year of Election or Appointment: 2008 Secretary and Chief Legal Officer (CLO) of the Fidelity funds. Mr. Goebel also serves as Secretary of Fidelity Investments Money Management, Inc. (FIMM) (2010-present) and Fidelity Research and Analysis Company (FRAC) (2010-present); Secretary and CLO of The North Carolina Capital Management Trust: Cash and Term Portfolios (2008-present); General Counsel, Secretary, and Senior Vice President of FMR (2008-present) and FMR Co., Inc. (2008-present); employed by FMR LLC or an affiliate (2001-present); Chief Legal Officer of Fidelity Management & Research (Hong Kong) Limited (2008-present) and Assistant Secretary of Fidelity Management & Research (Japan) Inc. (2008-present), and Fidelity Management & Research (U.K.) Inc. (2008-present). Previously, Mr. Goebel served as Assistant Secretary of FIMM (2008-2010), FRAC (2008-2010), and the Funds (2007-2008) and as Vice President and Secretary of Fidelity Distributors Corporation (FDC) (2005-2007). |
David J. Carter (38) |
| Year of Election or Appointment: 2010 Assistant Secretary of Fidelity's Fixed Income and Asset Allocation Funds. Mr. Carter also serves as Vice President, Associate General Counsel (2010-present) and is an employee of Fidelity Investments (2005-present). |
Holly C. Laurent (57) |
| Year of Election or Appointment: 2008 Anti-Money Laundering (AML) Officer of the Fidelity funds. Ms. Laurent also serves as AML Officer of The North Carolina Capital Management Trust: Cash and Term Portfolios (2008-present) and is an employee of Fidelity Investments. Previously, Ms. Laurent was Senior Vice President and Head of Legal for Fidelity Business Services India Pvt. Ltd. (2006-2008), and Senior Vice President, Deputy General Counsel and Group Head for FMR LLC (2005-2006). |
Christine Reynolds (52) |
| Year of Election or Appointment: 2008 Chief Financial Officer of the Fidelity funds. Ms. Reynolds became President of Fidelity Pricing and Cash Management Services (FPCMS) in August 2008. Ms. Reynolds served as Chief Operating Officer of FPCMS (2007-2008). Previously, Ms. Reynolds served as President, Treasurer, and Anti-Money Laundering officer of the Fidelity funds (2004-2007). |
Michael H. Whitaker (44) |
| Year of Election or Appointment: 2008 Chief Compliance Officer of Fidelity's Fixed Income and Asset Allocation Funds. Mr. Whitaker also serves as Chief Compliance Officer of The North Carolina Capital Management Trust: Cash and Term Portfolios (2008-present). Mr. Whitaker is an employee of Fidelity Investments (2007-present). Prior to joining Fidelity Investments, Mr. Whitaker worked at MFS Investment Management where he served as Senior Vice President and Chief Compliance Officer (2004-2006), and Assistant General Counsel. |
Jeffrey S. Christian (49) |
| Year of Election or Appointment: 2009 Deputy Treasurer of the Fidelity funds. Mr. Christian is an employee of Fidelity Investments. Previously, Mr. Christian served as Chief Financial Officer (2008-2009) of certain Fidelity funds and Senior Vice President of Fidelity Pricing and Cash Management Services (FPCMS) (2004-2009). |
Bryan A. Mehrmann (50) |
| Year of Election or Appointment: 2005 Deputy Treasurer of the Fidelity funds. Mr. Mehrmann is an employee of Fidelity Investments. |
Stephanie J. Dorsey (42) |
| Year of Election or Appointment: 2008 Deputy Treasurer of Fidelity's Fixed Income and Asset Allocation Funds. Ms. Dorsey also serves as Assistant Treasurer of other Fidelity funds (2010-present) and is an employee of Fidelity Investments (2008-present). Previously, Ms. Dorsey served as Treasurer (2004-2008) of the JPMorgan Mutual Funds and Vice President (2004-2008) of JPMorgan Chase Bank. |
Adrien E. Deberghes (43) |
| Year of Election or Appointment: 2010 Assistant Treasurer of Fidelity's Fixed Income and Asset Allocation Funds. Mr. Deberghes also serves as Deputy Treasurer of other Fidelity funds (2008-present) and is an employee of Fidelity Investments (2008-present). Previously, Mr. Deberghes served as Senior Vice President of Mutual Fund Administration at State Street Corporation (2007-2008), Senior Director of Mutual Fund Administration at Investors Bank & Trust (2005-2007), and Director of Finance for Dunkin' Brands (2000-2005). |
Kenneth B. Robins (41) |
| Year of Election or Appointment: 2009 Assistant Treasurer of the Fidelity Fixed Income and Asset Allocation Funds. Mr. Robins also serves as President and Treasurer of other Fidelity funds (2008-present; 2010-present) and is an employee of Fidelity Investments (2004-present). Previously, Mr. Robins served as Deputy Treasurer of the Fidelity funds (2005-2008) and Treasurer and Chief Financial Officer of The North Carolina Capital Management Trust: Cash and Term Portfolios (2006-2008). |
Gary W. Ryan (52) |
| Year of Election or Appointment: 2005 Assistant Treasurer of the Fidelity funds. Mr. Ryan is an employee of Fidelity Investments. Previously, Mr. Ryan served as Vice President of Fund Reporting in Fidelity Pricing and Cash Management Services (FPCMS) (1999-2005). |
Jonathan Davis (43) |
| Year of Election or Appointment: 2010 Assistant Treasurer of the Fidelity funds. Mr. Davis is an employee of Fidelity Investments. Previously, Mr. Davis served as Vice President and Associate General Counsel of FMR LLC (2003-2010). |
Annual Report
A total of 9.73% of the dividends distributed during the fiscal year was derived from interest on U.S. Government securities which is generally exempt from state income tax.
The fund designates $382,768 of distributions paid during the period January 1, 2011 to July 31, 2011 as qualifying to be taxed as interest-related dividends for nonresident alien shareholders.
The fund will notify shareholders in January 2012 amounts for use in preparing 2011 income tax returns.
Annual Report
Managing Your Investments
Fidelity offers several ways to conveniently manage your personal investments via your telephone or PC. You can access your account information, conduct trades and research your investments 24 hours a day.
By Phone
Fidelity Automated Service Telephone provides a single toll-free number to access account balances, positions, quotes and trading. It's easy to navigate the service, and on your first call, the system will help you create a personal identification number (PIN) for security.
(phone_graphic)
Fidelity Automated
Service Telephone (FAST®)
1-800-544-5555
Press
For mutual fund and brokerage trading.
For quotes.*
For account balances and holdings.
To review orders and mutual
fund activity.
To change your PIN.
To speak to a Fidelity representative.
By PC
Fidelity's web site on the Internet provides a wide range of information, including daily financial news, fund performance, interactive planning tools and news about Fidelity products and services.
(computer_graphic)
Fidelity's Web Site
www.fidelity.com
* When you call the quotes line, please remember that a fund's yield and return will vary and, except for money market funds, share price will also vary. This means that you may have a gain or loss when you sell your shares. There is no assurance that money market funds will be able to maintain a stable $1 share price; an investment in a money market fund is not insured or guaranteed by the U.S. government. Total returns are historical and include changes in share price, reinvestment of dividends and capital gains distributions, and the effects of any sales charges.
Annual Report
Investment Adviser
Fidelity Management & Research Company
Boston, MA
Investment Sub-Advisers
Fidelity Investments
Money Management, Inc.
Fidelity Management & Research
(U.K.) Inc.
Fidelity Management & Research
(Japan) Inc.
Fidelity Management & Research
(Hong Kong) Limited
General Distributor
Fidelity Distributors Corporation
Boston, MA
Transfer and Service Agents
Fidelity Investments Institutional
Operations Company, Inc.
Boston, MA
Fidelity Service Company, Inc.
Boston, MA
Custodian
Citibank, N.A.
New York, NY
The Fidelity Telephone Connection
Mutual Fund 24-Hour Service
Exchanges/Redemptions
and Account Assistance 1-800-544-6666
Product Information 1-800-544-6666
Retirement Accounts 1-800-544-4774
(8 a.m. - 9 p.m.)
TDD Service 1-800-544-0118
for the deaf and hearing impaired
(9 a.m. - 9 p.m. Eastern time)
Fidelity Automated Service
Telephone (FAST®)
1-800-544-5555
Automated line for quickest service
ULB-UANN-0911
1.789713.108
(Fidelity Investment logo)(registered trademark)
Fidelity Advisor®
Ultra-Short Bond
Fund - Class A and Class T
Annual Report
July 31, 2011
Class A and Class T
are classes of
Fidelity® Ultra-Short Bond Fund
(2_fidelity_logos) (Registered_Trademark)
Contents
Chairman's Message | <Click Here> | The Chairman's message to shareholders. |
Performance | <Click Here> | How the fund has done over time. |
Management's Discussion of Fund Performance | <Click Here> | The Portfolio Manager's review of fund performance and strategy. |
Shareholder Expense Example | <Click Here> | An example of shareholder expenses. |
Investment Changes | <Click Here> | A summary of major shifts in the fund's investments over the past six months. |
Investments | <Click Here> | A complete list of the fund's investments with their market values. |
Financial Statements | <Click Here> | Statements of assets and liabilities, operations, and changes in net assets, as well as financial highlights. |
Notes | <Click Here> | Notes to the financial statements. |
Report of Independent Registered Public Accounting Firm | <Click Here> | |
Trustees and Officers | <Click Here> | |
Distributions | <Click Here> | |
To view a fund's proxy voting guidelines and proxy voting record for the 12-month period ended June 30, visit http://www.fidelity.com/proxyvotingresults or visit the Securities and Exchange Commission's (SEC) web site at http://www.sec.gov. You may also call 1-877-208-0098 to request a free copy of the proxy voting guidelines.
Standard & Poor's, S&P and S&P 500 are registered service marks of The McGraw-Hill Companies, Inc. and have been licensed for use by Fidelity Distributors Corporation.
Other third party marks appearing herein are the property of their respective owners.
All other marks appearing herein are registered or unregistered trademarks or service marks of FMR LLC or an affiliated company.
This report and the financial statements contained herein are submitted for the general information of the shareholders of the fund. This report is not authorized for distribution to prospective investors in the fund unless preceded or accompanied by an effective prospectus.
A fund files its complete schedule of portfolio holdings with the SEC for the first and third quarters of each fiscal year on Form N-Q. Forms N-Q are available on the SEC's web site at http://www.sec.gov. A fund's Forms N-Q may be reviewed and copied at the SEC's Public Reference Room in Washington, DC. Information regarding the operation of the SEC's Public Reference Room may be obtained by calling 1-800-SEC-0330. For a complete list of a fund's portfolio holdings, view the most recent holdings listing, semiannual report, or annual report on Fidelity's web site at http://www.fidelity.com, http://www.advisor.fidelity.com, or http://www.401k.com, as applicable.
NOT FDIC INSURED • MAY LOSE VALUE • NO BANK GUARANTEE
Neither the fund nor Fidelity Distributors Corporation is a bank.
Annual Report
(photo_of_Abigail_P_Johnson)
Dear Shareholder:
The second half of 2011 began with U.S. equities continuing to give back some of the gains achieved earlier in the year. In the days leading up to July 31, markets were shaken by a political stalemate in which Congress struggled to address the debt ceiling issue before an early-August deadline. The resulting uncertainty held back markets in July, the third consecutive monthly decline for equities, effectively reversing the positive momentum seen through the end of April. Financial markets are always unpredictable, of course, but there are several time-tested investment principles that can help put the odds in your favor.
One of the basic tenets is to invest for the long term. Over time, riding out the markets' inevitable ups and downs has proven much more effective than selling into panic or chasing the hottest trend. Even missing only a few of the markets' best days can significantly diminish investor returns. Patience also affords the benefits of compounding - of earning interest on additional income or reinvested dividends and capital gains. There can be tax advantages and cost benefits to consider as well. While staying the course doesn't eliminate risk, it can considerably lessen the effect of short-term declines.
You can further manage your investing risk through diversification. And today, more than ever, geographic diversification should be taken into account. Studies indicate that asset allocation is the single most important determinant of a portfolio's long-term success. The right mix of stocks, bonds and cash - aligned to your particular risk tolerance and investment objective - is very important. Age-appropriate rebalancing is also an essential aspect of asset allocation. For younger investors, an emphasis on equities - which historically have been the best-performing asset class over time - is encouraged. As investors near their specific goal, such as retirement or sending a child to college, consideration may be given to replacing volatile assets (e.g. common stocks) with more-stable fixed investments (bonds or savings plans).
A third principle - investing regularly - can help lower the average cost of your purchases. Investing a certain amount of money each month or quarter helps ensure you won't pay for all your shares at market highs. This strategy - known as dollar cost averaging - also reduces "emotion" from investing, helping shareholders avoid selling weak performers just prior to an upswing, or chasing a hot performer just before a correction.
We invite you to contact us via the Internet, through our Investor Centers or by phone. It is our privilege to provide you the information you need to make the investments that are right for you.
Sincerely,
(The chairman's signature appears here.)
Abigail P. Johnson
Annual Report
Average annual total return reflects the change in the value of an investment, assuming reinvestment of the class' distributions from dividend income and capital gains (the profits earned upon the sale of securities that have grown in value, if any) and assuming a constant rate of performance each year. The $10,000 table and the fund's returns do not reflect the deduction of taxes that a shareholder would pay on fund distributions or the redemption of fund shares. During periods of reimbursement by Fidelity, a fund's total return will be greater than it would be had the reimbursement not occurred. How a fund did yesterday is no guarantee of how it will do tomorrow.
Average Annual Total Returns
Periods ended July 31, 2011 | Past 1
year | Past 5
years | Life of
fund A |
Class A (incl. 1.50% sales charge) B | -0.71% | -2.22% | -0.22% |
Class T (incl. 1.50% sales charge) C | -0.75% | -2.25% | -0.23% |
A Since August 29, 2002
B Class A shares bear a 0.15% 12b-1 fee. The initial offering of Class A shares took place on June 16, 2004. Returns prior to June 16, 2004 are those of Fidelity® Ultra-Short Bond Fund, the original class of the fund, which does not bear a 12b-1 fee. Had Class A shares' 12b-1 fee been reflected, returns prior to June 16, 2004 would have been lower.
C Class T shares bear a 0.15% 12b-1 fee. The initial offering of Class T shares took place on June 16, 2004. Returns prior to June 16, 2004 are those of Fidelity Ultra-Short Bond Fund, the original class of the fund, which does not bear a 12b-1 fee. Had Class T shares' 12b-1 fee been reflected, returns prior to June 16, 2004 would have been lower.
Annual Report
$10,000 Over Life of Fund
Let's say hypothetically that $10,000 was invested in Fidelity Advisor® Ultra-Short Bond Fund - Class A on August 29, 2002, when the fund started, and the current 1.50% sales charge was paid. The chart shows how the value of your investment would have changed, and also shows how the Barclays Capital® 6 Month Swap Index performed over the same period. The initial offering of Class A took place on June 16, 2004. See the previous page for additional information regarding the performance of Class A.
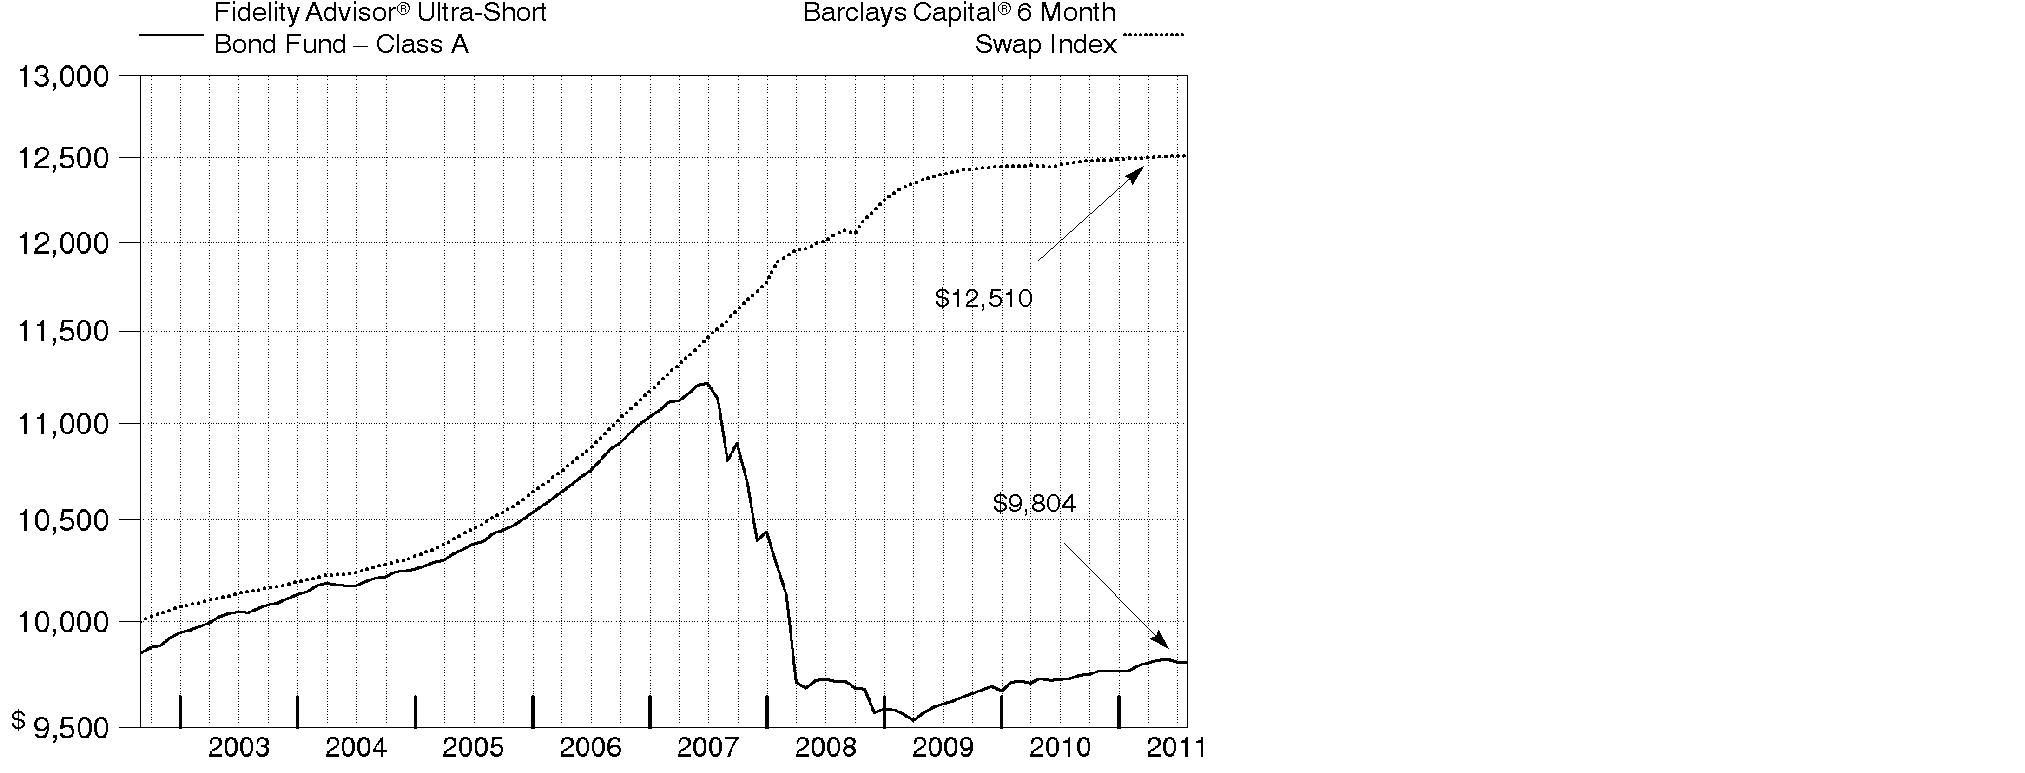
Annual Report
Market Recap: Amid ultra-low interest rates and heightened market volatility, U.S. taxable investment-grade bonds generated solid results for the year ending July 31, 2011, as evidenced by the 4.44% advance of the Barclays Capital® U.S. Aggregate Bond Index. The best-performing categories within the index were those on the riskier end of the spectrum that benefited during intervals when data pointed to an improving economy. Buoyed by a strong first-half showing, commercial mortgage-backed securities (CMBS) fared best, gaining 10.01% amid modest improvement in commercial real estate fundamentals. Corporate bonds rose 6.70%, due in large part to increased corporate profitability, high cash balances, reduced debt levels and improved credit conditions. Residential mortgage-backed securities, supported by a combination of strong demand from yield-hungry investors and slower prepayment rates, rose a solid 3.85%. Meanwhile, U.S. Treasury and agency securities gained 3.39% and 2.53%, respectively. These securities, which lagged in the first half of the period, when economic data was strong and inflation worries were muted, performed comparatively well in the second half amid signs of a weakening economic recovery and heightened concern about the sovereign debt crisis in Europe.
Comments from Robert Galusza, Portfolio Manager of Fidelity Advisor® Ultra-Short Bond Fund: For the year, the fund's Class A and Class T shares returned 0.80% and 0.76%, respectively (excluding sales charges), while the Barclays Capital® 6 Month Swap Index gained 0.33%. By way of review, the fund may invest in many different types of debt securities in an effort to achieve its investment objective, including securities that are not part of the Barclays Capital index. Against that backdrop, out-of-index exposure to all major segments of the short-term bond market aided performance because each of these groups outpaced the index. Emphasizing higher-yielding, riskier securities within the fund's investment-grade mandate - including asset-backed, commercial mortgage-backed and corporate debt - was particularly beneficial in the first half of the period when these sectors held up well relative to their lower-yielding government counterparts. My choices among investment-grade corporates also proved advantageous. Elsewhere, holding government-backed securities, including U.S. Treasuries, Treasury Inflation-Protected Securities (TIPS), which I sold by the end of the period, and agency-backed debentures, aided the fund's performance because they also outpaced the index, even though they generally lagged riskier segments for the 12-month period.
The views expressed above reflect those of the portfolio manager(s) only through the end of the period as stated on the cover of this report and do not necessarily represent the views of Fidelity or any other person in the Fidelity organization. Any such views are subject to change at any time based upon market or other conditions and Fidelity disclaims any responsibility to update such views. These views may not be relied on as investment advice and, because investment decisions for a Fidelity fund are based on numerous factors, may not be relied on as an indication of trading intent on behalf of any Fidelity fund.
Annual Report
Shareholder Expense Example
As a shareholder of the Fund, you incur two types of costs: (1) transaction costs, including redemption fees, and (2) ongoing costs, including management fees, distribution and/or service (12b-1) fees and other Fund expenses. This Example is intended to help you understand your ongoing costs (in dollars) of investing in the Fund and to compare these costs with the ongoing costs of investing in other mutual funds.
The Example is based on an investment of $1,000 invested at the beginning of the period and held for the entire period (February 1, 2011 to July 31, 2011).
Actual Expenses
The first line of the accompanying table for each class of the Fund provides information about actual account values and actual expenses. You may use the information in this line, together with the amount you invested, to estimate the expenses that you paid over the period. Simply divide your account value by $1,000.00 (for example, an $8,600 account value divided by $1,000.00 = 8.6), then multiply the result by the number in the first line for a class of the Fund under the heading entitled "Expenses Paid During Period" to estimate the expenses you paid on your account during this period.
Hypothetical Example for Comparison Purposes
The second line of the accompanying table for each class of the Fund provides information about hypothetical account values and hypothetical expenses based on a Class' actual expense ratio and an assumed rate of return of 5% per year before expenses, which is not the Class' actual return. The hypothetical account values and expenses may not be used to estimate the actual ending account balance or expenses you paid for the period. You may use this information to compare the ongoing costs of investing in the Fund and other funds. To do so, compare this 5% hypothetical example with the 5% hypothetical examples that appear in the shareholder reports of the other funds.
Please note that the expenses shown in the table are meant to highlight your ongoing costs only and do not reflect any transaction costs. Therefore, the second line of the table is useful in comparing ongoing costs only, and will not help you determine the relative total costs of owning different funds. In addition, if these transactional costs were included, your costs would have been higher.
Annual Report
| Annualized Expense Ratio | Beginning
Account Value
February 1, 2011 | Ending
Account Value
July 31, 2011 | Expenses Paid
During Period*
February 1, 2011
to July 31, 2011 |
Class A | .65% | | | |
Actual | | $ 1,000.00 | $ 1,004.00 | $ 3.23 |
HypotheticalA | | $ 1,000.00 | $ 1,021.57 | $ 3.26 |
Class T | .70% | | | |
Actual | | $ 1,000.00 | $ 1,002.50 | $ 3.48 |
HypotheticalA | | $ 1,000.00 | $ 1,021.32 | $ 3.51 |
Ultra-Short Bond | .45% | | | |
Actual | | $ 1,000.00 | $ 1,003.80 | $ 2.24 |
HypotheticalA | | $ 1,000.00 | $ 1,022.56 | $ 2.26 |
Institutional Class | .49% | | | |
Actual | | $ 1,000.00 | $ 1,003.60 | $ 2.43 |
HypotheticalA | | $ 1,000.00 | $ 1,022.36 | $ 2.46 |
A 5% return per year before expenses
* Expenses are equal to each Class' annualized expense ratio, multiplied by the average account value over the period, multiplied by 181/365 (to reflect the one-half year period).
Annual Report
Investment Changes (Unaudited)
Quality Diversification (% of fund's net assets) as of July 31, 2011 |
As of July 31, 2011 * | As of January 31, 2011 ** |
| U.S. Government
and U.S. Government Agency Obligations†34.0% | | | U.S. Government
and U.S. Government Agency Obligations†40.8% | |
| AAA 23.7% | | | AAA 15.5% | |
| AA 19.3% | | | AA 14.3% | |
| A 12.5% | | | A 9.6% | |
| BBB 6.6% | | | BBB 9.2% | |
| BB and Below 0.4% | | | BB and Below 0.3% | |
| Not Rated 1.5% | | | Not Rated 1.1% | |
| Short-Term
Investments and
Net Other Assets 2.0% | | | Short-Term
Investments and
Net Other Assets 9.2% | |

We have used ratings from Moody's Investors Service, Inc. Where Moody's® ratings are not available, we have used S&P® ratings. All ratings are as of the date indicated and do not reflect subsequent changes. Securities rated BB or below were rated investment grade at the time of acquisition. |
Weighted Average Maturity as of July 31, 2011 |
| | 6 months ago |
Years | 1.6 | 1.3 |
This is a weighted average of all the maturities of the securities held in a fund. Weighted Average Maturity (WAM) can be used as a measure of sensitivity to interest rate changes and markets changes. Generally, the longer the maturity, the greater the sensitivity to such changes. WAM is based on the dollar-weighted average length of time until principal payments must be paid. Depending on the types of securities held in a fund, certain maturity shortening devices (e.g., demand features, interest rate resets, and call options) may be taken into account when calculating the WAM. |
Duration as of July 31, 2011 |
| | 6 months ago |
Years | 0.5 | 0.4 |
Duration estimates how much a bond fund's price will change with a change in comparable interest rates. If rates rise 1%, for example, a fund with a 5-year duration is likely to lose about 5% of its value. Other factors also can influence a bond fund's performance and share price. Accordingly, a bond fund's actual performance may differ from this example. Duration takes into account any call or put option embedded in the bonds. |
Asset Allocation (% of fund's net assets) |
As of July 31, 2011 * | As of January 31, 2011 ** |
| Corporate Bonds 40.8% | | | Corporate Bonds 30.5% | |
| U.S. Government
and U.S. Government Agency Obligations† 34.0% | | | U.S. Government
and U.S. Government
Agency Obligations† 40.8% | |
| Asset-Backed
Securities 18.4% | | | Asset-Backed
Securities 15.7% | |
| CMOs and Other Mortgage Related Securities 4.2% | | | CMOs and Other Mortgage Related Securities 2.6% | |
| Other Investments 0.6% | | | Other Investments 1.2% | |
| Short-Term
Investments and
Net Other Assets 2.0% | | | Short-Term
Investments and
Net Other Assets 9.2% | |

* Foreign investments | 16.1% | | ** Foreign investments | 12.5% | |
* Futures and Swaps | 3.9% | | ** Futures and Swaps | 3.7% | |
† Includes FDIC Guaranteed Corporate Securities |
Annual Report
Investments July 31, 2011
Showing Percentage of Net Assets
Nonconvertible Bonds - 40.8% |
| Principal Amount | | Value |
CONSUMER DISCRETIONARY - 1.0% |
Media - 1.0% |
AOL Time Warner, Inc. 6.875% 5/1/12 | | $ 1,000,000 | | $ 1,044,568 |
Time Warner Cable, Inc. 5.4% 7/2/12 | | 1,500,000 | | 1,564,193 |
| | 2,608,761 |
CONSUMER STAPLES - 1.5% |
Beverages - 0.8% |
Anheuser-Busch InBev Worldwide, Inc. 0.609% 7/14/14 (e) | | 2,000,000 | | 2,006,420 |
Food Products - 0.7% |
Kraft Foods, Inc. 5.625% 11/1/11 | | 1,758,000 | | 1,779,404 |
TOTAL CONSUMER STAPLES | | 3,785,824 |
ENERGY - 1.6% |
Oil, Gas & Consumable Fuels - 1.6% |
Enterprise Products Operating LP 7.625% 2/15/12 | | 1,000,000 | | 1,034,672 |
Shell International Finance BV 1.3% 9/22/11 | | 1,000,000 | | 1,001,607 |
Total Capital Canada Ltd. 0.6298% 1/17/14 (e) | | 2,000,000 | | 2,012,940 |
| | 4,049,219 |
FINANCIALS - 31.9% |
Capital Markets - 5.2% |
BlackRock, Inc. 0.5575% 5/24/13 (e) | | 1,000,000 | | 999,463 |
Goldman Sachs Group, Inc. 1.2683% 2/7/14 (e) | | 2,000,000 | | 1,980,374 |
HSBC Bank PLC 1.0498% 1/17/14 (b)(e) | | 2,000,000 | | 2,010,406 |
JPMorgan Chase & Co. 1.053% 1/24/14 (e) | | 4,000,000 | | 3,993,624 |
State Street Corp. 0.602% 3/7/14 (e) | | 1,000,000 | | 1,000,567 |
The Bank of New York Mellon Corp. 0.5239% 7/28/14 (e) | | 2,000,000 | | 2,000,578 |
UBS AG Stamford Branch 1.2526% 1/28/14 (e) | | 1,500,000 | | 1,502,271 |
| | 13,487,283 |
Commercial Banks - 15.8% |
ANZ Banking Group Ltd. 0.9861% 1/10/14 (b)(e) | | 1,000,000 | | 1,002,979 |
Bank of Montreal 0.7229% 4/29/14 (e) | | 2,000,000 | | 2,001,180 |
Barclays Bank PLC 1.2861% 1/13/14 (e) | | 2,000,000 | | 2,004,040 |
Commonwealth Bank of Australia 0.975% 3/17/14 (b)(e) | | 1,500,000 | | 1,502,430 |
Credit Agricole SA 0.6233% 2/2/12 (b)(e) | | 2,000,000 | | 1,995,048 |
Credit Suisse New York Branch 1.209% 1/14/14 (e) | | 2,500,000 | | 2,501,433 |
Danske Bank A/S 1.299% 4/14/14 (b)(e) | | 500,000 | | 500,028 |
Nonconvertible Bonds - continued |
| Principal Amount | | Value |
FINANCIALS - continued |
Commercial Banks - continued |
Deutsche Bank 0.8998% 1/18/13 (e) | | $ 2,000,000 | | $ 2,001,654 |
Fifth Third Bank 0.3705% 5/17/13 (e) | | 2,500,000 | | 2,461,308 |
ING Bank NV 1.6518% 6/9/14 (b)(e) | | 2,000,000 | | 2,002,214 |
Manufacturers & Traders Trust Co. 1.7458% 4/1/13 (e) | | 930,000 | | 929,586 |
Marshall & Ilsley Bank 6.375% 9/1/11 | | 287,000 | | 287,958 |
National Australia Bank Ltd. 0.7258% 1/8/13 (b)(e) | | 1,000,000 | | 999,710 |
Rabobank (Netherlands) NV 0.599% 4/14/14 (e) | | 5,000,000 | | 4,981,375 |
Royal Bank of Canada 0.5498% 4/17/14 (e) | | 3,000,000 | | 3,003,063 |
Santander US Debt SA Unipersonal 1.0458% 3/30/12 (b)(e) | | 800,000 | | 798,463 |
Sumitomo Mitsui Banking Corp. 1.203% 7/22/14 (b)(e) | | 1,000,000 | | 1,003,495 |
Svenska Handelsbanken AB 2.875% 9/14/12 (b) | | 2,500,000 | | 2,556,442 |
Toronto Dominion Bank 0.549% 7/14/14 (e) | | 2,000,000 | | 2,005,840 |
U.S. Bank NA 0.473% 10/26/12 (e) | | 2,000,000 | | 2,003,192 |
Union Bank NA 1.2029% 6/6/14 (e) | | 2,000,000 | | 2,003,346 |
Wachovia Bank NA 0.6533% 11/3/14 (e) | | 1,500,000 | | 1,451,219 |
Westpac Banking Corp. 0.9758% 3/31/14 (b)(e) | | 1,000,000 | | 1,001,129 |
| | 40,997,132 |
Consumer Finance - 3.5% |
American Express Credit Corp. 1.0955% 6/24/14 (e) | | 1,000,000 | | 998,575 |
American Honda Finance Corp. 0.6383% 11/7/12 (b)(e) | | 2,000,000 | | 1,996,256 |
Capital One Financial Corp.: | | | | |
1.3998% 7/15/14 (e) | | 2,000,000 | | 2,002,294 |
5.7% 9/15/11 | | 1,000,000 | | 1,005,908 |
General Electric Capital Corp. 1.0958% 1/7/14 (e) | | 3,000,000 | | 3,000,249 |
| | 9,003,282 |
Diversified Financial Services - 5.1% |
BB&T Corp. 0.9526% 4/28/14 (e) | | 2,000,000 | | 2,000,094 |
BNP Paribas 1.1461% 1/10/14 (e) | | 1,000,000 | | 987,225 |
BP Capital Markets PLC 0.8495% 3/11/14 (e) | | 1,000,000 | | 1,002,378 |
Citigroup, Inc.: | | | | |
1.1108% 2/15/13 (e) | | 1,000,000 | | 1,000,021 |
1.6961% 1/13/14 (e) | | 2,341,000 | | 2,349,617 |
MassMutual Global Funding II 0.629% 1/14/14 (b)(e) | | 394,000 | | 394,117 |
Metlife Institutional Funding II 1.1458% 4/4/14 (b)(e) | | 2,500,000 | | 2,505,425 |
Nonconvertible Bonds - continued |
| Principal Amount | | Value |
FINANCIALS - continued |
Diversified Financial Services - continued |
New York Life Global Fund 0.5058% 4/4/14 (b)(e) | | $ 2,000,000 | | $ 2,000,698 |
Volkswagen International Finance NV 0.8558% 4/1/14 (b)(e) | | 1,000,000 | | 1,003,249 |
| | 13,242,824 |
Insurance - 1.5% |
Berkshire Hathaway Finance Corp. 0.5761% 1/10/14 (e) | | 2,000,000 | | 2,006,284 |
Prudential Financial, Inc. 5.1% 12/14/11 | | 2,000,000 | | 2,029,012 |
| | 4,035,296 |
Thrifts & Mortgage Finance - 0.8% |
Bank of America Corp. 1.7961% 7/11/14 (e) | | 2,000,000 | | 1,993,712 |
TOTAL FINANCIALS | | 82,759,529 |
HEALTH CARE - 1.2% |
Pharmaceuticals - 1.2% |
Sanofi-Aventis 0.4463% 3/28/13 (e) | | 2,000,000 | | 2,005,776 |
Teva Pharmaceutical Finance III BV 0.7465% 3/21/14 (e) | | 1,000,000 | | 1,006,873 |
| | 3,012,649 |
INFORMATION TECHNOLOGY - 1.3% |
Computers & Peripherals - 0.8% |
Hewlett-Packard Co. 0.5295% 5/24/13 (e) | | 2,000,000 | | 2,004,322 |
IT Services - 0.2% |
The Western Union Co. 0.832% 3/7/13 (e) | | 530,000 | | 531,960 |
Office Electronics - 0.3% |
Xerox Corp.: | | | | |
1.0805% 5/16/14 (e) | | 435,000 | | 437,633 |
6.875% 8/15/11 | | 500,000 | | 501,049 |
| | 938,682 |
TOTAL INFORMATION TECHNOLOGY | | 3,474,964 |
TELECOMMUNICATION SERVICES - 1.4% |
Diversified Telecommunication Services - 1.4% |
Qwest Corp. 3.497% 6/15/13 (e) | | 1,000,000 | | 1,023,750 |
Verizon Communications, Inc. 0.8563% 3/28/14 (e) | | 2,500,000 | | 2,526,563 |
| | 3,550,313 |
Nonconvertible Bonds - continued |
| Principal Amount | | Value |
UTILITIES - 0.9% |
Multi-Utilities - 0.9% |
DTE Energy Co. 0.955% 6/3/13 (e) | | $ 443,000 | | $ 444,775 |
Sempra Energy 1.007% 3/15/14 (e) | | 2,000,000 | | 2,008,422 |
| | 2,453,197 |
TOTAL NONCONVERTIBLE BONDS (Cost $105,683,754) | 105,694,456 |
U.S. Government and Government Agency Obligations - 25.3% |
|
U.S. Government Agency Obligations - 24.0% |
Fannie Mae: | | | | |
1% 4/4/12 | | 39,000,000 | | 39,178,075 |
4.375% 9/15/12 | | 22,000,000 | | 22,988,130 |
TOTAL U.S. GOVERNMENT AGENCY OBLIGATIONS | | 62,166,205 |
Other Government Related - 1.3% |
Bank of America Corp. 0.5529% 4/30/12 (FDIC Guaranteed) (c)(e) | | 1,500,000 | | 1,504,335 |
Goldman Sachs Group, Inc. 0.5183% 11/9/11 (FDIC Guaranteed) (c)(e) | | 2,000,000 | | 2,001,518 |
TOTAL OTHER GOVERNMENT RELATED | | 3,505,853 |
TOTAL U.S. GOVERNMENT AND GOVERNMENT AGENCY OBLIGATIONS (Cost $65,664,913) | 65,672,058 |
U.S. Government Agency - Mortgage Securities - 2.8% |
|
Fannie Mae - 2.8% |
2.452% 2/1/34 (e) | | 317,877 | | 329,120 |
2.484% 6/1/35 (e) | | 435,114 | | 455,152 |
2.549% 7/1/35 (e) | | 863,939 | | 909,366 |
2.552% 12/1/34 (e) | | 603,751 | | 637,160 |
2.559% 6/1/35 (e) | | 1,092,648 | | 1,145,809 |
2.588% 10/1/35 (e) | | 1,171,448 | | 1,231,625 |
2.6% 7/1/34 (e) | | 508,358 | | 532,240 |
2.619% 11/1/34 (e) | | 542,232 | | 564,388 |
U.S. Government Agency - Mortgage Securities - continued |
| Principal Amount | | Value |
Fannie Mae - continued |
2.68% 11/1/34 (e) | | $ 597,785 | | $ 631,836 |
3.765% 10/1/39 (e) | | 832,648 | | 875,878 |
TOTAL U.S. GOVERNMENT AGENCY - MORTGAGE SECURITIES (Cost $7,128,104) | 7,312,574 |
Asset-Backed Securities - 18.4% |
|
ACE Securities Corp. Home Equity Loan Trust Series 2004-HE1 Class M1, 0.9373% 3/25/34 (e) | | 1,506 | | 1,500 |
Ally Auto Receivables Trust: | | | | |
Series 2009-B Class A2, 1.21% 6/15/12 (b) | | 91,264 | | 91,285 |
Series 2010-4 Class A2, 0.71% 2/15/13 | | 889,578 | | 889,718 |
Series 2011-1 Class A2, 0.81% 10/15/13 | | 996,688 | | 997,158 |
Ally Master Owner Trust: | | | | |
Series 2010-1 Class A, 1.9365% 1/15/15 (b)(e) | | 700,000 | | 711,894 |
Series 2011-1 Class A1, 1.0565% 1/15/16 (e) | | 500,000 | | 503,682 |
AmeriCredit Automobile Receivables Trust: | | | | |
Series 2007-AX Class A4, 0.2251% 10/6/13 (XL Capital Assurance, Inc. Insured) (e) | | 694,257 | | 689,904 |
Series 2007-CM Class A4B, 0.2651% 4/7/14 (National Public Finance Guarantee Corp. Insured) (e) | | 419,025 | | 415,851 |
Series 2010-3 Class A2, 0.77% 12/9/13 | | 669,344 | | 669,594 |
Series 2010-B Class A2, 1.18% 2/6/14 (Assured Guaranty Corp. Insured) | | 665,422 | | 664,823 |
Series 2011-1 Class A2, 0.84% 6/9/14 | | 1,000,000 | | 1,000,120 |
Series 2011-2 Class A2, 0.9% 9/8/14 | | 1,000,000 | | 1,001,191 |
Bank of America Auto Trust: | | | | |
Series 2009-1A Class A3, 2.67% 7/15/13 (b) | | 385,185 | | 387,498 |
Series 2010-2 Class A2, 0.91% 10/15/12 | | 194,122 | | 194,174 |
Bank One Issuance Trust Series 2003-A8, 0.4365% 5/16/16 (e) | | 500,000 | | 501,048 |
BMW Vehicle Lease Trust: | | | | |
Series 2010-1 Class A2, 0.58% 9/17/12 | | 591,188 | | 591,173 |
Series 2011-1 Class A2, 0.64% 4/22/13 | | 1,000,000 | | 1,000,132 |
Capital One Auto Finance Trust Series 2007-C Class A4, 5.23% 7/15/14 (FGIC Insured) | | 337,266 | | 343,715 |
Carmax Auto Owner Trust Series 2011-1 Class A2, 0.72% 11/15/13 | | 1,000,000 | | 1,000,371 |
Chase Issuance Trust: | | | | |
Series 2005-A2 Class A2, 0.2565% 12/15/14 (e) | | 1,600,000 | | 1,599,284 |
Series 2005-A6 Class A6, 0.2565% 7/15/14 (e) | | 1,730,000 | | 1,729,381 |
Asset-Backed Securities - continued |
| Principal Amount | | Value |
Chase Issuance Trust: - continued | | | | |
Series 2006-A4 Class A4, 0.2065% 10/15/13 (e) | | $ 1,000,000 | | $ 999,936 |
Series 2007-A17 Class A, 5.12% 10/15/14 | | 790,000 | | 833,315 |
Series 2009-A2 Class A2, 1.7365% 4/15/14 (e) | | 2,500,000 | | 2,527,028 |
Series 2011-A1 Class A1, 0.3765% 3/16/15 (e) | | 640,000 | | 639,969 |
Series 2011-A2 Class A2, 0.2753% 5/15/15 (e) | | 990,000 | | 989,948 |
Chrysler Financial Auto Securitization Trust Series 2010-A Class A2, 0.69% 1/8/13 | | 1,163,246 | | 1,163,371 |
Citibank Credit Card Issuance Trust: | | | | |
Series 2009-A1 Class A1, 1.9365% 3/17/14 (e) | | 4,350,000 | | 4,395,725 |
Series 2009-A2 Class A2, 1.7365% 5/15/14 (e) | | 1,500,000 | | 1,517,523 |
CitiFinancial Auto Issuance Trust Series 2009-1 Class A2, 1.83% 11/15/12 (b) | | 61,479 | | 61,526 |
Discover Card Master Trust Series 2011-A2 Class A2, 0.3998% 11/16/15 (e) | | 1,000,000 | | 999,947 |
Fannie Mae subordinate REMIC pass-thru certificates Series 2004-T5: | | | | |
Class AB1, 0.7634% 5/28/35 (e) | | 80,751 | | 59,727 |
Class AB3, 0.7053% 5/28/35 (e) | | 32,052 | | 22,459 |
Ford Credit Auto Lease Trust Series 2010-B Class A2, 0.75% 10/15/12 (b) | | 1,964,226 | | 1,964,807 |
Ford Credit Auto Lease Trust 2011-A Series 2011-A Class A2, 0.74% 9/15/13 | | 1,000,000 | | 999,788 |
Ford Credit Auto Owner Trust: | | | | |
Series 2009-D Class A3, 2.17% 10/15/13 | | 62,265 | | 62,768 |
Series 2010-B Class A2, 0.65% 12/15/12 | | 740,798 | | 740,998 |
Series 2011-B Class A2, 0.68% 1/15/14 | | 1,000,000 | | 1,002,610 |
Ford Credit Floorplan Master Owner Trust: | | | | |
Series 2010-1 Class A, 1.8365% 12/15/14 (b)(e) | | 490,000 | | 498,083 |
Series 2010-5 Class A1, 1.5% 9/15/15 | | 240,000 | | 241,859 |
Fremont Home Loan Trust Series 2005-A Class M4, 0.8673% 1/25/35 (e) | | 125,000 | | 35,238 |
GE Capital Credit Card Master Note Trust Series 2009-3 Class A, 2.54% 9/15/14 | | 1,000,000 | | 1,002,433 |
GSAMP Trust Series 2007-HE1 Class M1, 0.4373% 3/25/47 (e) | | 335,000 | | 16,480 |
Home Equity Asset Trust Series 2003-5 Class A2, 0.8873% 12/25/33 (e) | | 10,566 | | 7,593 |
Honda Auto Receivables Owner Trust Series 2011-2 Class A2, 0.57% 7/18/13 | | 1,000,000 | | 999,683 |
Hyundai Auto Receivables Trust: | | | | |
Series 2009-A Class A3, 2.03% 8/15/13 | | 94,492 | | 95,117 |
Series 2011-A Class A2, 0.69% 11/15/13 | | 1,000,000 | | 1,000,648 |
Asset-Backed Securities - continued |
| Principal Amount | | Value |
John Deere Owner Trust Series 2011-A Class A2, 0.64% 6/16/14 | | $ 2,000,000 | | $ 2,000,222 |
Mercedes-Benz Auto Lease Trust Series 2011-1A Class A2, 0.79% 4/15/13 (b) | | 1,000,000 | | 1,000,528 |
Mercedes-Benz Auto Receivables Trust Series 2009-1 Class A3, 1.67% 1/15/14 | | 139,959 | | 140,948 |
Merrill Lynch Mortgage Investors Trust Series 2004-HE2 Class A1B, 0.6573% 8/25/35 (e) | | 20,366 | | 16,389 |
Morgan Stanley ABS Capital I Trust Series 2004-HE6 Class A2, 0.5273% 8/25/34 (e) | | 65,756 | | 49,869 |
Nissan Auto Lease Trust: | | | | |
Series 2009-B Class A3, 2.07% 1/15/15 | | 91,431 | | 91,558 |
Series 2010-B Class A2, 0.9% 5/15/13 | | 994,169 | | 995,589 |
Series 2011-A Class A2, 0.7% 1/15/14 | | 1,000,000 | | 999,857 |
Nissan Auto Receivables Owner Trust Series 2011-A Class A2, 0.65% 12/16/13 | | 1,000,000 | | 1,002,314 |
Ocala Funding LLC Series 2006-1A Class A, 1.5863% 3/20/11 (a)(b)(e) | | 965,000 | | 0 |
Park Place Securities, Inc. Series 2004-WCW1 Class M4, 1.6373% 9/25/34 (e) | | 435,000 | | 151,586 |
Salomon Brothers Mortgage Securities VII, Inc. Series 2003-HE1 Class A, 0.9873% 4/25/33 (e) | | 1,451 | | 1,195 |
Santander Drive Auto Receivables Trust: | | | | |
Series 2010-3 Class A2, 0.93% 6/17/13 | | 500,000 | | 500,378 |
Series 2011-1, Class A2, 0.94% 2/18/14 | | 300,000 | | 299,815 |
Terwin Mortgage Trust Series 2003-4HE Class A1, 1.0473% 9/25/34 (e) | | 21,802 | | 16,046 |
USAA Auto Owner Trust Series 2010-1 Class A3, 1.3% 6/16/14 | | 703,196 | | 706,159 |
Volkswagen Auto Lease Trust: | | | | |
Series 2009-A Class A3, 3.41% 4/16/12 | | 114,735 | | 114,963 |
Series 2010-A Class A2, 0.77% 1/22/13 | | 882,847 | | 883,203 |
Wachovia Auto Owner Trust Series 2008-A Class A4B, 1.3363% 3/20/14 (e) | | 886,977 | | 892,052 |
TOTAL ASSET-BACKED SECURITIES (Cost $49,371,653) | 47,724,746 |
Collateralized Mortgage Obligations - 7.5% |
| Principal Amount | | Value |
Private Sponsor - 1.6% |
Arran Residential Mortgages Funding PLC floater Series 2011-1A Clasee A1C, 1.5372% 11/19/47 (b)(e) | | $ 500,000 | | $ 499,820 |
Gracechurch Mortgage Financing PLC floater Series 2007-1A Class 3A1, 0.34% 11/20/56 (b)(e) | | 391,190 | | 388,290 |
Granite Mortgages Series 2003-2 Class 1A3, 0.7513% 7/20/43 (e) | | 166,632 | | 159,258 |
Granite Mortgages PLC floater Series 2004-1 Class 2A1, 0.5665% 3/20/44 (e) | | 142,998 | | 135,955 |
GSR Mortgage Loan Trust floater Series 2004-11 Class 2A1, 0.5173% 12/25/34 (e) | | 260,902 | | 221,625 |
Holmes Master Issuer PLC floater Series 2007-2A Class 3A1, 0.3293% 7/15/21 (e) | | 280,000 | | 279,282 |
Permanent Master Issuer PLC floater Series 2007-1 Class 4A, 0.3293% 10/15/33 (e) | | 660,000 | | 656,530 |
TBW Mortgage-Backed pass-thru certificates floater Series 2006-4 Class A3, 0.3858% 9/25/36 (e) | | 1,000,000 | | 739,516 |
World Omni Auto Receivables Trust sequential payer Series 2011-A Class A2, 0.64% 11/15/13 | | 1,000,000 | | 1,000,159 |
TOTAL PRIVATE SPONSOR | | 4,080,435 |
U.S. Government Agency - 5.9% |
Fannie Mae subordinate REMIC pass-thru certificates: | | | | |
floater: | | | | |
Series 2008-76 Class EF, 0.6873% 9/25/23 (e) | | 77,440 | | 77,534 |
Series 2010-86 Class FE, 0.6373% 8/25/25 (d)(e) | | 698,683 | | 700,922 |
sequential payer: | | | | |
Series 2003-129 Class GF, 0.5873% 4/25/30 (e) | | 885,979 | | 887,482 |
Series 2005-47 Class HA, 4.5% 7/25/19 | | 1,288,722 | | 1,340,713 |
Series 2011-16 Class FB, 0.3373% 3/25/31 (e) | | 2,898,003 | | 2,891,833 |
Freddie Mac Multi-class participation certificates guaranteed: | | | | |
floater Series 3346 Class FA, 0.4165% 2/15/19 (e) | | 4,575,543 | | 4,582,502 |
planned amortization Series 3792, 0.5865% 11/15/40 (e) | | 966,254 | | 971,214 |
sequential payer: | | | | |
Series 2924 Class DA, 4.5% 2/15/19 | | 1,095,456 | | 1,138,823 |
Collateralized Mortgage Obligations - continued |
| Principal Amount | | Value |
U.S. Government Agency - continued |
Freddie Mac Multi-class participation certificates guaranteed: - continued | | | | |
Series 3560 Class LA, 2% 8/15/14 | | $ 1,253,006 | | $ 1,265,948 |
Series 3573 Class LC, 1.85% 8/15/14 | | 1,407,081 | | 1,422,834 |
TOTAL U.S. GOVERNMENT AGENCY | | 15,279,805 |
TOTAL COLLATERALIZED MORTGAGE OBLIGATIONS (Cost $19,659,885) | 19,360,240 |
Commercial Mortgage Securities - 2.6% |
|
Banc of America Commercial Mortgage, Inc. sequential payer Series 2007-1 Class A2, 5.381% 1/15/49 | | 1,469,410 | | 1,476,261 |
Banc of America Large Loan, Inc. floater: | | | | |
Series 2005-MIB1: | | | | |
Class G, 0.7165% 3/15/22 (b)(e) | | 100,000 | | 94,250 |
Class H, 0.9665% 3/15/22 (b)(e) | | 110,000 | | 100,650 |
Series 2006-BIX1 Class B, 0.3265% 10/15/19 (b)(e) | | 110,000 | | 109,465 |
COMM pass-thru certificates floater: | | | | |
Series 2005-F10A Class B, 0.4165% 4/15/17 (b)(e) | | 110,000 | | 105,624 |
Series 2006-CN2A Class A2FL, 0.4051% 2/5/19 (b)(e) | | 800,000 | | 789,438 |
Credit Suisse Commercial Mortgage Trust sequential payer Series 2007-C3 Class A2, 5.905% 6/15/39 (e) | | 229,781 | | 233,376 |
Credit Suisse First Boston Mortgage Securities Corp. Series 2003-C4 Class A4, 5.137% 8/15/36 | | 240,000 | | 253,719 |
GMAC Commercial Mortgage Securities, Inc. sequential payer Series 2003-C2 Class A2, 5.6539% 5/10/40 (e) | | 120,000 | | 128,259 |
Greenwich Capital Commercial Funding Corp. sequential payer Series 2005-GG3 Class A2, 4.305% 8/10/42 (e) | | 1,170,220 | | 1,171,969 |
GS Mortgage Securities Corp. II sequential payer Series 2005-GG4 Class A3, 4.607% 7/10/39 | | 150,000 | | 151,979 |
GS Mortgage Securities Trust sequential payer Series 2006-GG8 Class A2, 5.479% 11/10/39 | | 292,841 | | 293,240 |
JP Morgan Chase Commercial Mortgage Securities Corp.: | | | | |
sequential payer Series 2003-C1 Class A2, 4.985% 1/12/37 | | 130,000 | | 135,442 |
Series 2003-CB7 Class A4, 4.879% 1/12/38 (e) | | 109,113 | | 115,764 |
Commercial Mortgage Securities - continued |
| Principal Amount | | Value |
JP Morgan Chase Commercial Mortgage Securities Trust sequential payer Series 2005-LDP5 Class A2, 5.198% 12/15/44 | | $ 240,000 | | $ 243,317 |
JPMorgan Chase Commercial Mortgage Securities Trust sequential payer Series 2007-LD11 Class A2, 5.9896% 6/15/49 (e) | | 240,000 | | 245,075 |
Morgan Stanley Capital I Trust: | | | | |
floater: | | | | |
Series 2006-XLF Class C, 1.387% 7/15/19 (b)(e) | | 247,826 | | 148,696 |
Series 2007-XLFA Class B, 0.317% 10/15/20 (b)(e) | | 440,000 | | 407,780 |
sequential payer Series 2003-IQ4 Class A2, 4.07% 5/15/40 | | 85,719 | | 88,674 |
Morgan Stanley Dean Witter Capital I Trust sequential payer Series 2003-T11 Class A4, 5.15% 6/13/41 | | 110,000 | | 116,282 |
Wachovia Bank Commercial Mortgage Trust floater Series 2006-WL7A Class A1, 0.2771% 9/15/21 (b)(e) | | 455,539 | | 439,285 |
TOTAL COMMERCIAL MORTGAGE SECURITIES (Cost $7,280,316) | 6,848,545 |
Municipal Securities - 0.6% |
|
Indiana Fin. Auth.'s Econ. Dev. Bonds (Republic Svcs., Inc. Proj.) Series A, 1.25%, tender 9/1/11 (e)(f) | | 400,000 | | 400,020 |
Louisville/Jefferson County Metropolitan Govt. Poll. Cont. Rev. Bonds (Louisville Gas and Electronic Co. Proj.): | | | | |
Series 2003 A, 1.9%, tender 4/2/12 (e) | | 500,000 | | 503,300 |
Series 2007 B, 1.9%, tender 6/1/12 (e) | | 500,000 | | 503,990 |
Pennsylvania Econ. Dev. Fing. Auth. Solid Waste Disp. Rev. Bonds (Republic Svcs., Inc. Proj.) Series 2010 A, 1.25%, tender 10/3/11 (e)(f) | | 100,000 | | 100,006 |
TOTAL MUNICIPAL SECURITIES (Cost $1,500,000) | 1,507,316 |
Bank Notes - 0.8% |
|
National City Bank, Cleveland 0.3539% 3/1/13 (e)
(Cost $1,979,328) | | 2,000,000 | | 1,991,966 |
Certificates of Deposit - 0.4% |
| Principal Amount | | Value |
Nordea Bank Finland PLC yankee 0.7483% 2/7/13 (e)
(Cost $1,001,117) | | $ 1,000,000 | | $ 1,002,111 |
Cash Equivalents - 0.5% |
| Maturity Amount | | |
Investments in repurchase agreements in a joint trading account at 0.17%, dated 7/29/11 due 8/1/11 (Collateralized by U.S. Government Obligations) #
(Cost $1,268,000) | $ 1,268,018 | | 1,268,000 |
TOTAL INVESTMENT PORTFOLIO - 99.7% (Cost $260,537,070) | 258,382,012 |
NET OTHER ASSETS (LIABILITIES) - 0.3% | | 837,076 |
NET ASSETS - 100% | $ 259,219,088 |
Futures Contracts |
| Expiration Date | | Underlying Face Amount at Value | | Unrealized Appreciation/
(Depreciation) |
Purchased |
Eurodollar Contracts |
10 Eurodollar 90 Day Index Contracts | Dec. 2011 | | $ 9,987,625 | | $ (1,276) |
10 Eurodollar 90 Day Index Contracts | March 2012 | | 9,986,625 | | (1,651) |
10 Eurodollar 90 Day Index Contracts | Sept. 2011 | | 9,990,625 | | 2,975 |
TOTAL EURODOLLAR CONTRACTS | | $ 29,964,875 | | $ 48 |
Legend |
(a) Non-income producing - Security is in default. |
(b) Security exempt from registration under Rule 144A of the Securities Act of 1933. These securities may be resold in transactions exempt from registration, normally to qualified institutional buyers. At the end of the period, the value of these securities amounted to $31,071,008 or 12.0% of net assets. |
(c) Under the Temporary Liquidity Guarantee Program, the Federal Deposit Insurance Corporation guarantees principal and interest in the event of payment default or bankruptcy until the earlier of maturity date of the debt or until June 30, 2012. At the end of the period these securities amounted to $3,505,853 or 1.3% of net assets. |
(d) Security or a portion of the security was pledged to cover margin requirements for futures contracts. At the period end, the value of securities pledged amounted to $30,096. |
(e) Coupon rates for floating and adjustable rate securities reflect the rates in effect at period end. |
(f) Private activity obligations whose interest is subject to the federal alternative minimum tax for individuals. |
# Additional information on each counterparty to the repurchase agreement is as follows: |
Repurchase Agreement / Counterparty | Value |
$1,268,000 due 8/01/11 at 0.17% |
Bank of America NA | $ 917,336 |
J.P. Morgan Securities, Inc. | 34,291 |
Mizuho Securities USA, Inc. | 316,373 |
| $ 1,268,000 |
Other Information |
The following is a summary of the inputs used, as of July 31, 2011, involving the Fund's assets and liabilities carried at fair value. The inputs or methodology used for valuing securities may not be an indication of the risk associated with investing in those securities. For more information on valuation inputs, and their aggregation into the levels used in the tables below, please refer to the Security Valuation section in the accompanying Notes to Financial Statements. |
Valuation Inputs at Reporting Date: |
Description | Total | Level 1 | Level 2 | Level 3 |
Investments in Securities: | | | | |
Corporate Bonds | $ 105,694,456 | $ - | $ 105,694,456 | $ - |
U.S. Government and Government Agency Obligations | 65,672,058 | - | 65,672,058 | - |
U.S. Government Agency - Mortgage Securities | 7,312,574 | - | 7,312,574 | - |
Asset-Backed Securities | 47,724,746 | - | 47,475,001 | 249,745 |
Collateralized Mortgage Obligations | 19,360,240 | - | 19,360,240 | - |
Commercial Mortgage Securities | 6,848,545 | - | 6,292,069 | 556,476 |
Municipal Securities | 1,507,316 | - | 1,507,316 | - |
Bank Notes | 1,991,966 | - | 1,991,966 | - |
Certificates of Deposit | 1,002,111 | - | 1,002,111 | - |
Cash Equivalents | 1,268,000 | - | 1,268,000 | - |
Total Investments in Securities: | $ 258,382,012 | $ - | $ 257,575,791 | $ 806,221 |
Derivative Instruments: | | | | |
Assets | | | | |
Futures Contracts | $ 2,975 | $ 2,975 | $ - | $ - |
Liabilities | | | | |
Futures Contracts | $ (2,927) | $ (2,927) | $ - | $ - |
Total Derivative Instruments: | $ 48 | $ 48 | $ - | $ - |
The following is a reconciliation of Investments in Securities for which Level 3 inputs were used in determining value: |
Investments in Securities: | |
Beginning Balance | $ 583,242 |
Total Realized Gain (Loss) | (1,553,394) |
Total Unrealized Gain (Loss) | 2,131,415 |
Cost of Purchases | 2,324 |
Proceeds of Sales | (786,299) |
Amortization/Accretion | (24,596) |
Transfers in to Level 3 | 453,529 |
Transfers out of Level 3 | - |
Ending Balance | $ 806,221 |
The change in unrealized gain (loss) for the period attributable to Level 3 securities held at July 31, 2011 | $ 1,848 |
The information used in the above reconciliation represents fiscal year to date activity for any Investments in Securities identified as using Level 3 inputs at either the beginning or the end of the current fiscal period. Transfers in or out of Level 3 represent the beginning value of any Security or Instrument where a change in the pricing level occurred from the beginning to the end of the period. The cost of purchases and the proceeds of sales may include securities received or delivered through corporate actions or exchanges. Realized and unrealized gains (losses) disclosed in the reconciliation are included in Net Gain (Loss) on the Fund's Statement of Operations. |
Value of Derivative Instruments |
The following table is a summary of the Fund's value of derivative instruments by risk exposure as of July 31, 2011. For additional information on derivative instruments, please refer to the Derivative Instruments section in the accompanying Notes to Financial Statements. |
Risk Exposure /
Derivative Type | Value |
| Asset | Liability |
Interest Rate Risk | | |
Futures Contracts (a) | $ 2,975 | $ (2,927) |
Total Value of Derivatives | $ 2,975 | $ (2,927) |
(a) Reflects cumulative appreciation/(depreciation) on futures contracts as disclosed on the Schedule of Investments. Only the period end variation margin is separately disclosed on the Statement of Assets and Liabilities. |
Other Information |
Distribution of investments by country of issue, as a percentage of total net assets, is as follows: (Unaudited) |
United States of America | 83.9% |
Canada | 3.5% |
Netherlands | 3.5% |
United Kingdom | 2.6% |
France | 2.0% |
Australia | 1.8% |
Sweden | 1.0% |
Others (Individually Less Than 1%) | 1.7% |
| 100.0% |
Income Tax Information |
At July 31, 2011, the Fund had a capital loss carryforward of approximately $125,615,360 of which $1,917,431, $518,690, $12,186,304, $97,397,499, $9,829,719 and $3,765,717 will expire in fiscal 2014, 2015, 2016, 2017, 2018 and 2019, respectively. Capital loss carryforwards are only available to offset future capital gains of the Fund to the extent provided by regulations and may be limited. |
See accompanying notes which are an integral part of the financial statements.
Annual Report
Statement of Assets and Liabilities
| July 31, 2011 |
| | |
Assets | | |
Investment in securities, at value (including repurchase agreements of $1,268,000) - See accompanying schedule: Unaffiliated issuers (cost $260,537,070) | | $ 258,382,012 |
Cash | | 860 |
Receivable for investments sold | | 585 |
Receivable for fund shares sold | | 724,672 |
Interest receivable | | 821,093 |
Receivable for daily variation margin on futures contracts | | 125 |
Other receivables | | 27 |
Total assets | | 259,929,374 |
| | |
Liabilities | | |
Payable for fund shares redeemed | $ 608,179 | |
Distributions payable | 1,722 | |
Accrued management fee | 68,236 | |
Distribution and service plan fees payable | 2,077 | |
Other affiliated payables | 30,072 | |
Total liabilities | | 710,286 |
| | |
Net Assets | | $ 259,219,088 |
Net Assets consist of: | | |
Paid in capital | | $ 388,425,175 |
Distributions in excess of net investment income | | (61,884) |
Accumulated undistributed net realized gain (loss) on investments | | (126,989,194) |
Net unrealized appreciation (depreciation) on investments | | (2,155,009) |
Net Assets | | $ 259,219,088 |
See accompanying notes which are an integral part of the financial statements.
Annual Report
Statement of Assets and Liabilities - continued
| July 31, 2011 |
| | |
Calculation of Maximum Offering Price
Class A:
Net Asset Value and redemption price per share
($12,241,589 ÷ 1,492,766 shares) | | $ 8.20 |
| | |
Maximum offering price per share (100/98.50 of $8.20) | | $ 8.32 |
Class T:
Net Asset Value and redemption price per share ($4,811,352 ÷ 586,661 shares) | | $ 8.20 |
| | |
Maximum offering price per share (100/98.50 of $8.20) | | $ 8.32 |
Ultra-Short Bond:
Net Asset Value, offering price and redemption price per share ($239,921,423 ÷ 29,253,153 shares) | | $ 8.20 |
| | |
Institutional Class:
Net Asset Value, offering price and redemption price per share ($2,244,724 ÷ 273,711 shares) | | $ 8.20 |
See accompanying notes which are an integral part of the financial statements.
Annual Report
Financial Statements - continued
Statement of Operations
| Year ended July 31, 2011 |
| | |
Investment Income | | |
Interest | | $ 2,092,565 |
| | |
Expenses | | |
Management fee | $ 833,807 | |
Transfer agent fees | 273,052 | |
Distribution and service plan fees | 28,129 | |
Fund wide operations fee | 90,596 | |
Independent trustees' compensation | 962 | |
Miscellaneous | 895 | |
Total expenses before reductions | 1,227,441 | |
Expense reductions | (135) | 1,227,306 |
Net investment income (loss) | | 865,259 |
Realized and Unrealized Gain (Loss) Net realized gain (loss) on: | | |
Investment securities: | | |
Unaffiliated issuers | (1,589,005) | |
Futures contracts | 32,980 | |
Total net realized gain (loss) | | (1,556,025) |
Change in net unrealized appreciation (depreciation) on: Investment securities | 3,156,644 | |
Futures contracts | (15,646) | |
Total change in net unrealized appreciation (depreciation) | | 3,140,998 |
Net gain (loss) | | 1,584,973 |
Net increase (decrease) in net assets resulting from operations | | $ 2,450,232 |
See accompanying notes which are an integral part of the financial statements.
Annual Report
Statement of Changes in Net Assets
| Year ended
July 31,
2011 | Year ended
July 31,
2010 |
Increase (Decrease) in Net Assets | | |
Operations | | |
Net investment income (loss) | $ 865,259 | $ 1,890,067 |
Net realized gain (loss) | (1,556,025) | (8,164,438) |
Change in net unrealized appreciation (depreciation) | 3,140,998 | 9,508,825 |
Net increase (decrease) in net assets resulting
from operations | 2,450,232 | 3,234,454 |
Distributions to shareholders from net investment income | (936,826) | (1,887,049) |
Share transactions - net increase (decrease) | (6,245,769) | 33,525,237 |
Redemption fees | 16,839 | 9,556 |
Total increase (decrease) in net assets | (4,715,524) | 34,882,198 |
| | |
Net Assets | | |
Beginning of period | 263,934,612 | 229,052,414 |
End of period (including distributions in excess of net investment income of $(61,884) and undistributed net investment income of $11,746, respectively) | $ 259,219,088 | $ 263,934,612 |
See accompanying notes which are an integral part of the financial statements.
Annual Report
Financial Highlights - Class A
Years ended July 31, | 2011 | 2010 | 2009 | 2008 | 2007 |
Selected Per-Share Data | | | | | |
Net asset value, beginning of period | $ 8.15 | $ 8.11 | $ 8.26 | $ 9.82 | $ 10.02 |
Income from Investment Operations | | | | | |
Net investment income (loss) C | .013 | .047 | .091 | .384 | .493 |
Net realized and unrealized gain (loss) | .051 | .040 | (.167) | (1.612) | (.198) |
Total from investment operations | .064 | .087 | (.076) | (1.228) | .295 |
Distributions from net investment income | (.015) | (.047) | (.071) | (.294) | (.495) |
Tax return of capital | - | - | (.003) | (.039) | - |
Total distributions | (.015) | (.047) | (.074) | (.333) | (.495) |
Redemption fees added to paid in capital C | .001 | - E | - E | .001 | - E |
Net asset value, end of period | $ 8.20 | $ 8.15 | $ 8.11 | $ 8.26 | $ 9.82 |
Total Return A,B | .80% | 1.08% | (.92)% | (12.71)% | 2.97% |
Ratios to Average Net Assets D | | | | | |
Expenses before reductions | .63% | .64% | .68% | .67% | .66% |
Expenses net of fee waivers, if any | .63% | .64% | .68% | .67% | .66% |
Expenses net of all reductions | .63% | .64% | .67% | .66% | .66% |
Net investment income (loss) | .16% | .58% | 1.13% | 4.26% | 4.96% |
Supplemental Data | | | | | |
Net assets, end of period (000 omitted) | $ 12,242 | $ 18,129 | $ 8,033 | $ 6,268 | $ 13,735 |
Portfolio turnover rate | 103% | 95% | 92% | 11% | 29% |
A Total returns would have been lower if certain expenses had not been reduced during the applicable periods shown.
B Total returns do not include the effect of the sales charges.
C Calculated based on average shares outstanding during the period.
D Expense ratios reflect operating expenses of the class. Expenses before reductions do not reflect amounts reimbursed by the investment adviser or reductions from expense offset arrangements and do not represent the amount paid by the class during periods when reimbursements or reductions occur. Expenses net of fee waivers reflect expenses after reimbursement by the investment adviser but prior to reductions from expense offset arrangements. Expenses net of all reductions represent the net expenses paid by the class.
E Amount represents less than $.001 per share.
See accompanying notes which are an integral part of the financial statements.
Annual Report
Financial Highlights - Class T
Years ended July 31, | 2011 | 2010 | 2009 | 2008 | 2007 |
Selected Per-Share Data | | | | | |
Net asset value, beginning of period | $ 8.15 | $ 8.11 | $ 8.26 | $ 9.82 | $ 10.02 |
Income from Investment Operations | | | | | |
Net investment income (loss) C | .009 | .044 | .090 | .377 | .491 |
Net realized and unrealized gain (loss) | .052 | .040 | (.168) | (1.607) | (.199) |
Total from investment operations | .061 | .084 | (.078) | (1.230) | .292 |
Distributions from net investment income | (.012) | (.044) | (.069) | (.292) | (.492) |
Tax return of capital | - | - | (.003) | (.039) | - |
Total distributions | (.012) | (.044) | (.072) | (.331) | (.492) |
Redemption fees added to paid in capital C | .001 | - E | - E | .001 | - E |
Net asset value, end of period | $ 8.20 | $ 8.15 | $ 8.11 | $ 8.26 | $ 9.82 |
Total Return A,B | .76% | 1.03% | (.94)% | (12.72)% | 2.95% |
Ratios to Average Net Assets D | | | | | |
Expenses before reductions | .68% | .68% | .69% | .69% | .69% |
Expenses net of fee waivers, if any | .68% | .68% | .69% | .69% | .69% |
Expenses net of all reductions | .68% | .68% | .69% | .69% | .69% |
Net investment income (loss) | .12% | .54% | 1.11% | 4.23% | 4.93% |
Supplemental Data | | | | | |
Net assets, end of period (000 omitted) | $ 4,811 | $ 5,334 | $ 3,114 | $ 2,910 | $ 4,818 |
Portfolio turnover rate | 103% | 95% | 92% | 11% | 29% |
A Total returns would have been lower if certain expenses had not been reduced during the applicable periods shown.
B Total returns do not include the effect of the sales charges.
C Calculated based on average shares outstanding during the period.
D Expense ratios reflect operating expenses of the class. Expenses before reductions do not reflect amounts reimbursed by the investment adviser or reductions from expense offset arrangements and do not represent the amount paid by the class during periods when reimbursements or reductions occur. Expenses net of fee waivers reflect expenses after reimbursement by the investment adviser but prior to reductions from expense offset arrangements. Expenses net of all reductions represent the net expenses paid by the class.
E Amount represents less than $.001 per share.
See accompanying notes which are an integral part of the financial statements.
Annual Report
Financial Highlights - Ultra-Short Bond
Years ended July 31, | 2011 | 2010 | 2009 | 2008 | 2007 |
Selected Per-Share Data | | | | | |
Net asset value, beginning of period | $ 8.15 | $ 8.11 | $ 8.26 | $ 9.81 | $ 10.02 |
Income from Investment Operations | | | | | |
Net investment income (loss) B | .028 | .063 | .111 | .404 | .516 |
Net realized and unrealized gain (loss) | .051 | .040 | (.169) | (1.603) | (.210) |
Total from investment operations | .079 | .103 | (.058) | (1.199) | .306 |
Distributions from net investment income | (.030) | (.063) | (.088) | (.310) | (.516) |
Tax return of capital | - | - | (.004) | (.042) | - |
Total distributions | (.030) | (.063) | (.092) | (.352) | (.516) |
Redemption fees added to paid in capital B | .001 | - D | - D | .001 | - D |
Net asset value, end of period | $ 8.20 | $ 8.15 | $ 8.11 | $ 8.26 | $ 9.81 |
Total Return A | .99% | 1.27% | (.70)% | (12.42)% | 3.09% |
Ratios to Average Net Assets C | | | | | |
Expenses before reductions | .45% | .45% | .45% | .45% | .45% |
Expenses net of fee waivers, if any | .45% | .45% | .45% | .45% | .45% |
Expenses net of all reductions | .45% | .45% | .44% | .45% | .45% |
Net investment income (loss) | .34% | .77% | 1.36% | 4.47% | 5.17% |
Supplemental Data | | | | | |
Net assets, end of period (000 omitted) | $ 239,921 | $ 239,266 | $ 217,282 | $ 315,401 | $ 974,602 |
Portfolio turnover rate | 103% | 95% | 92% | 11% | 29% |
A Total returns would have been lower if certain expenses had not been reduced during the applicable periods shown.
B Calculated based on average shares outstanding during the period.
C Expense ratios reflect operating expenses of the class. Expenses before reductions do not reflect amounts reimbursed by the investment adviser or reductions from expense offset arrangements and do not represent the amount paid by the class during periods when reimbursements or reductions occur. Expenses net of fee waivers reflect expenses after reimbursement by the investment adviser but prior to reductions from expense offset arrangements. Expenses net of all reductions represent the net expenses paid by the class.
D Amount represents less than $.001 per share.
See accompanying notes which are an integral part of the financial statements.
Annual Report
Financial Highlights - Institutional Class
Years ended July 31, | 2011 | 2010 | 2009 | 2008 | 2007 |
Selected Per-Share Data | | | | | |
Net asset value, beginning of period | $ 8.15 | $ 8.11 | $ 8.26 | $ 9.81 | $ 10.02 |
Income from Investment Operations | | | | | |
Net investment income (loss) B | .025 | .057 | .102 | .416 | .510 |
Net realized and unrealized gain (loss) | .051 | .040 | (.168) | (1.619) | (.206) |
Total from investment operations | .076 | .097 | (.066) | (1.203) | .304 |
Distributions from net investment income | (.027) | (.057) | (.081) | (.306) | (.514) |
Tax return of capital | - | - | (.003) | (.042) | - |
Total distributions | (.027) | (.057) | (.084) | (.348) | (.514) |
Redemption fees added to paid in capital B | .001 | - D | - D | .001 | - D |
Net asset value, end of period | $ 8.20 | $ 8.15 | $ 8.11 | $ 8.26 | $ 9.81 |
Total Return A | .95% | 1.20% | (.80)% | (12.46)% | 3.06% |
Ratios to Average Net Assets C | | | | | |
Expenses before reductions | .49% | .52% | .58% | .48% | .48% |
Expenses net of fee waivers, if any | .49% | .52% | .55% | .48% | .48% |
Expenses net of all reductions | .49% | .52% | .54% | .48% | .48% |
Net investment income (loss) | .31% | .70% | 1.26% | 4.44% | 5.14% |
Supplemental Data | | | | | |
Net assets, end of period (000 omitted) | $ 2,245 | $ 1,206 | $ 623 | $ 594 | $ 8,312 |
Portfolio turnover rate | 103% | 95% | 92% | 11% | 29% |
A Total returns would have been lower if certain expenses had not been reduced during the applicable periods shown.
B Calculated based on average shares outstanding during the period.
C Expense ratios reflect operating expenses of the class. Expenses before reductions do not reflect amounts reimbursed by the investment adviser or reductions from expense offset arrangements and do not represent the amount paid by the class during periods when reimbursements or reductions occur. Expenses net of fee waivers reflect expenses after reimbursement by the investment adviser but prior to reductions from expense offset arrangements. Expenses net of all reductions represent the net expenses paid by the class.
D Amount represents less than $.001 per share.
See accompanying notes which are an integral part of the financial statements.
Annual Report
Notes to Financial Statements
For the period ended July 31, 2011
1. Organization.
Fidelity Ultra-Short Bond Fund (the Fund) is a fund of Fidelity Income Fund (the Trust) and is authorized to issue an unlimited number of shares. The Trust is registered under the Investment Company Act of 1940, as amended (the 1940 Act), as an open-end management investment company organized as a Massachusetts business trust. The Fund offers Class A, Class T, Ultra-Short Bond Class and Institutional Class shares, each of which has equal rights as to assets and voting privileges. Each class has exclusive voting rights with respect to matters that affect that class. Investment income, realized and unrealized capital gains and losses, the common expenses of the Fund, and certain fund-level expense reductions, if any, are allocated on a pro-rata basis to each class based on the relative net assets of each class to the total net assets of the Fund. Each class differs with respect to transfer agent and distribution and service plan fees incurred. Certain expense reductions may also differ by class.
2. Significant Accounting Policies.
The financial statements have been prepared in conformity with accounting principles generally accepted in the United States of America (GAAP), which require management to make certain estimates and assumptions at the date of the financial statements. Actual results could differ from those estimates. Subsequent events, if any, through the date that the financial statements were issued have been evaluated in the preparation of the financial statements. The following summarizes the significant accounting policies of the Fund:
Security Valuation. Investments are valued as of 4:00 p.m. Eastern time on the last calendar day of the period. The Fund uses independent pricing services approved by the Board of Trustees to value its investments. When current market prices or quotations are not readily available or reliable, valuations may be determined in good faith in accordance with procedures adopted by the Board of Trustees. Factors used in determining value may include market or security specific events, changes in interest rates and credit quality. The frequency with which these procedures are used cannot be predicted and they may be utilized to a significant extent. The value used for net asset value (NAV) calculation under these procedures may differ from published prices for the same securities.
The Fund categorizes the inputs to valuation techniques used to value its investments into a disclosure hierarchy consisting of three levels as shown below:
Level 1 - quoted prices in active markets for identical investments
Level 2 - other significant observable inputs (including quoted prices for similar investments, interest rates, prepayment speeds, etc.)
Level 3 - unobservable inputs (including the Fund's own assumptions based on the best information available)
Annual Report
2. Significant Accounting Policies - continued
Security Valuation - continued
Changes in valuation techniques may result in transfers in or out of an assigned level within the disclosure hierarchy. The aggregate value of investments by input level, as of July 31, 2011 for the Fund's investments, as well as a roll forward of Level 3 securities, is included at the end of the Fund's Schedule of Investments. Valuation techniques used to value the Fund's investments by major category are as follows:
Debt securities, including restricted securities, are valued based on evaluated prices received from independent pricing services or from dealers who make markets in such securities. For corporate bonds, bank notes, U.S. government and government agency obligations and certificates of deposit, pricing services utilize matrix pricing which considers yield or price of bonds of comparable quality, coupon, maturity and type as well as dealer supplied prices and are generally categorized as Level 2 in the hierarchy. For asset backed securities, collateralized mortgage obligations, commercial mortgage securities and U.S. government agency mortgage securities, pricing services utilize matrix pricing which considers prepayment speed assumptions, attributes of the collateral, yield or price of bonds of comparable quality, coupon, maturity and type as well as dealer supplied prices and, accordingly, such securities are generally categorized as Level 2 in the hierarchy.
When independent prices are unavailable or unreliable, debt securities may be valued utilizing pricing matrices which consider similar factors that would be used by independent pricing services. These are generally categorized as Level 2 in the hierarchy but may be Level 3 depending on the circumstances.
Short-term securities with remaining maturities of sixty days or less may be valued at amortized cost, which approximates fair value, and are categorized as Level 2 in the hierarchy.
Futures contracts are valued at the settlement price established each day by the board of trade or exchange on which they are traded and are categorized as Level 1 in the hierarchy.
Investment Transactions and Income. For financial reporting purposes, the Fund's investment holdings and NAV include trades executed through the end of the last business day of the period. The NAV per share for processing shareholder transactions is calculated as of the close of business of the New York Stock Exchange (NYSE), normally 4:00 p.m. Eastern time and includes trades executed through the end of the prior business day. Gains and losses on securities sold are determined on the basis of identified cost. Interest income is accrued as earned. Interest income includes coupon interest and amortization of premium and accretion of discount on debt securities. The principal value on inflation-indexed securities is periodically adjusted to the rate of inflation and
Annual Report
Notes to Financial Statements - continued
2. Significant Accounting Policies - continued
Investment Transactions and Income - continued
interest is accrued based on the principal value. The adjustments to principal due to inflation are reflected as increases or decreases to interest income even though principal is not received until maturity. Debt obligations may be placed on non-accrual status and related interest income may be reduced by ceasing current accruals and writing off interest receivables when the collection of all or a portion of interest has become doubtful based on consistently applied procedures. A debt obligation is removed from non-accrual status when the issuer resumes interest payments or when collectability of interest is reasonably assured.
Expenses. Expenses directly attributable to a fund are charged to that fund. Expenses attributable to more than one fund are allocated among the respective funds on the basis of relative net assets or other appropriate methods. Expense estimates are accrued in the period to which they relate and adjustments are made when actual amounts are known.
Income Tax Information and Distributions to Shareholders. Each year, the Fund intends to qualify as a regulated investment company, including distributing substantially all of its taxable income and realized gains under Subchapter M of the Internal Revenue Code and filing its U.S. federal tax return. As a result, no provision for income taxes is required. As of July 31, 2011, the Fund did not have any unrecognized tax benefits in the financial statements. A fund's federal tax return is subject to examination by the Internal Revenue Service (IRS) for a period of three years.
Dividends are declared and recorded daily and paid monthly from net investment income. Distributions from realized gains, if any, are declared and recorded on the ex-dividend date. Income dividends and capital gain distributions are declared separately for each class. Income and capital gain distributions are determined in accordance with income tax regulations, which may differ from GAAP.
Capital accounts within the financial statements are adjusted for permanent book-tax differences. These adjustments have no impact on net assets or the results of operations. Temporary book-tax differences will reverse in a subsequent period.
Book-tax differences are primarily due to futures transactions, premium on debt securities, market discount, capital loss carryforwards and losses deferred due to excise tax regulations.
Annual Report
2. Significant Accounting Policies - continued
Income Tax Information and Distributions to Shareholders - continued
The federal tax cost of investment securities and unrealized appreciation (depreciation) as of period end were as follows:
Gross unrealized appreciation | $ 526,666 |
Gross unrealized depreciation | (2,698,472) |
Net unrealized appreciation (depreciation) on securities and other investments | $ (2,171,806) |
| |
Tax Cost | $ 260,553,818 |
The tax-based components of distributable earnings as of period end were as follows:
Capital loss carryforward | $ (125,615,360) |
Net unrealized appreciation (depreciation) | $ (2,171,806) |
Under the recently enacted Regulated Investment Company Modernization Act of 2010 (the Act), the Fund will be permitted to carry forward capital losses incurred in taxable years beginning after December 22, 2010 for an unlimited period. However, any losses incurred during those future taxable years will be required to be utilized prior to any losses incurred in pre-enactment taxable years, which generally expire after eight years from when they are incurred. Additionally, post-enactment capital losses that are carried forward will retain their character as either short-term or long-term capital losses rather than being considered all short-term as under previous law. The Fund's first fiscal year end subject to the Act will be July 31, 2012.
The tax character of distributions paid was as follows:
| July 31, 2011 | July 31, 2010 |
Ordinary Income | $ 936,826 | $ 1,887,049 |
Short-Term Trading (Redemption) Fees. Shares held by investors in the Fund less than 60 days are subject to a redemption fee equal to .25% of the net asset value of shares redeemed. All redemption fees, which reduce the proceeds of the shareholder redemption, are retained by the Fund and accounted for as an addition to paid in capital.
Annual Report
Notes to Financial Statements - continued
2. Significant Accounting Policies - continued
New Accounting Pronouncements. In May 2011, the Financial Accounting Standards Board (FASB) issued an update to Topic 860 - Transfers and Servicing. The update clarifies the assessment of effective control by removing the collateral provision requirement that the seller maintains at all times collateral sufficient to fund substantially all of the cost of purchasing replacement financial assets from others. This may result in a change in accounting treatment from purchases and sales to secured borrowings for certain mortgage dollar roll transactions, and therefore separate accounting of the income and expenses associated with the secured borrowings. This change would have no effect on the net assets or total return of the Fund. The update is effective for transactions entered into on or after December 15, 2011. Management is currently evaluating the potential impact of the update on the accounting for mortgage dollar roll transactions entered into by the Fund. Also in May 2011, the FASB issued Accounting Standard Update No. 2011-04, Fair Value Measurement (Topic 820) - Amendments to Achieve Common Fair Value Measurement and Disclosure Requirements in U.S. GAAP and IFRSs. The update changes the wording used to describe the requirements in GAAP for measuring fair value and for disclosing information about fair value measurements. The update is effective during interim and annual periods beginning after December 15, 2011. Management is currently evaluating the impact of the update's adoption on the Fund's financial statement disclosures.
3. Operating Policies.
Repurchase Agreements. Fidelity Management & Research Company (FMR) has received an Exemptive Order from the Securities and Exchange Commission (the SEC) which permits the Fund and other affiliated entities of FMR to transfer uninvested cash balances into joint trading accounts which are then invested in repurchase agreements. The Fund may also invest directly with institutions in repurchase agreements. Repurchase agreements are collateralized by government or non-government securities. Upon settlement date, collateral is held in segregated accounts with custodian banks and may be obtained in the event of a default of the counterparty. The Fund monitors, on a daily basis, the value of the collateral to ensure it is at least equal to the principal amount of the repurchase agreement (including accrued interest). In the event of a default by the counterparty, realization of the collateral proceeds could be delayed, during which time the value of the collateral may decline.
Restricted Securities. The Fund may invest in securities that are subject to legal or contractual restrictions on resale. These securities generally may be resold in transactions exempt from registration or to the public if the securities are registered. Disposal of these securities may involve time-consuming negotiations and expense, and prompt sale at an acceptable price may be difficult. Information regarding restricted securities is included at the end of the Fund's Schedule of Investments.
Annual Report
4. Derivative Instruments.
Risk Exposures and the Use of Derivative Instruments. The Fund used derivative instruments (derivatives), including futures contracts, in order to meet its investment objectives. The strategy is to use derivatives to increase returns, to gain exposure to certain types of assets and to manage exposure to certain risks as defined below. The success of any strategy involving derivatives depends on analysis of numerous economic factors, and if the strategies for investment do not work as intended, the Fund may not achieve its objectives.
The Fund's use of derivatives increased or decreased its exposure to the following risk:
Interest Rate Risk | Interest rate risk relates to the fluctuations in the value of interest-bearing securities due to changes in the prevailing levels of market interest rates. |
The Fund is also exposed to additional risks from investing in derivatives, such as liquidity risk and counterparty credit risk. Liquidity risk is the risk that the Fund will be unable to sell the derivative in the open market in a timely manner. Counterparty credit risk is the risk that the counterparty will not be able to fulfill its obligation to the Fund. The Fund's maximum risk of loss from counterparty credit risk is generally the aggregate unrealized appreciation and unpaid counterparty payments in excess of any collateral pledged by the counterparty to the Fund. Counterparty risk related to exchange-traded futures contracts is minimal because of the protection provided by the exchange on which they trade. Derivatives involve, to varying degrees, risk of loss in excess of the amounts recognized in the Statement of Assets and Liabilities.
Futures Contracts. A futures contract is an agreement between two parties to buy or sell a specified underlying instrument for a fixed price at a specified future date. The Fund used futures contracts to manage its exposure to the bond, and to fluctuations in interest rates.
Upon entering into a futures contract, a fund is required to deposit either cash or securities (initial margin) with a clearing broker in an amount equal to a certain percentage of the face value of the contract. Futures contracts are marked-to-market daily and subsequent payments (variation margin) are made or received by a fund depending on the daily fluctuations in the value of the futures contracts and are recorded as unrealized appreciation or (depreciation). This receivable and/or payable is included in daily variation margin on futures contracts in the Statement of Assets and Liabilities. Realized gain or (loss) is recorded upon the expiration or closing of a futures contract.
Annual Report
Notes to Financial Statements - continued
4. Derivative Instruments - continued
Futures Contracts - continued
The underlying face amount at value of open futures contracts at period end, if any, is shown in the Schedule of Investments under the caption "Futures Contracts." This amount reflects each contract's exposure to the underlying instrument at period end. Securities deposited to meet initial margin requirements are identified in the Schedule of Investments.
Certain risks arise upon entering into futures contracts, including the risk that an illiquid market limits the ability to close out a futures contract prior to settlement date.
During the period the Fund recognized net realized gain (loss) of $32,980 and a change in net unrealized appreciation (depreciation) of $(15,646) related to its investment in futures contracts. These amounts are included in the Statement of Operations.
5. Purchases and Sales of Investments.
Purchases and sales of securities, other than short-term securities and U.S. government securities, aggregated $184,024,578 and $115,621,820, respectively.
6. Fees and Other Transactions with Affiliates.
Management Fee. FMR and its affiliates provide the Fund with investment management related services for which the Fund pays a monthly management fee. The management fee is the sum of an individual fund fee rate that is based on an annual rate of .20% of the Fund's average net assets and a group fee rate that averaged .12% during the period. The group fee rate is based upon the average net assets of all the mutual funds advised by FMR. The group fee rate decreases as assets under management increase and increases as assets under management decrease. For the period, the total annual management fee rate was .32% of the Fund's average net assets.
Distribution and Service Plan Fees. In accordance with Rule 12b-1 of the 1940 Act, the Fund has adopted separate Distribution and Service Plans for each class of shares. Certain classes pay Fidelity Distributors Corporation (FDC), an affiliate of FMR, separate Distribution and Service Fees, each of which is based on an annual percentage of each class' average net assets. In addition, FDC may pay financial intermediaries for selling shares of the Fund and providing shareholder support services. For the period, the Distribution and Service Fee rates, total fees and amounts retained by FDC were as follows:
| Distribution
Fee | Service
Fee | Total Fees | Retained
by FDC |
Class A | 0% | .15% | $ 21,556 | $ 2,014 |
Class T | 0% | .15% | 6,573 | 9 |
| | | $ 28,129 | $ 2,023 |
Annual Report
6. Fees and Other Transactions with Affiliates - continued
Sales Load. FDC may receive a front-end sales charge of up to 1.50% for selling Class A and Class T shares, some of which is paid to financial intermediaries for selling shares of the Fund. Depending on the holding period, FDC may receive a contingent deferred sales charges levied on Class A and Class T redemptions. The deferred sales charges range from, .75% or .50% for certain purchases of Class A shares (.75% prior to February 18, 2011) and .25% for certain purchases of Class T shares.
For the period, sales charge amounts retained by FDC were as follows:
| Retained
by FDC |
Class A | $ 7,465 |
Class T | 612 |
| $ 8,077 |
Transfer Agent Fees. Fidelity Investments Institutional Operations Company, Inc. (FIIOC), an affiliate of FMR, is the transfer, dividend disbursing and shareholder servicing agent for each class of the Fund. FIIOC receives account fees and asset-based fees that vary according to the account size and type of account of the shareholders of each respective class of the Fund, with the exception of Ultra Short Bond. FIIOC receives an asset-based fee of .10% of Ultra-Short Bond's average net assets. FIIOC pays for typesetting, printing and mailing of shareholder reports, except proxy statements. For the period, transfer agent fees for each class were as follows:
| Amount | % of
Average
Net Assets |
Class A | $ 19,230 | .13 |
Class T | 7,717 | .18 |
Ultra-Short Bond | 244,304 | .10 |
Institutional Class | 1,801 | .14 |
| $ 273,052 | |
Fund Wide Operations Fee. Pursuant to the Fund Wide Operations and Expense Agreement (FWOE), FMR has agreed to provide for fund level expenses (which do not include transfer agent, Rule 12b-1 fees, compensation of the independent Trustees, interest (including commitment fees), taxes or extraordinary expenses, if any) in return for a FWOE fee equal to .35% less the total amount of the management fee. The FWOE paid by the Fund is reduced by an amount equal to the fees and expenses paid to the independent Trustees. For the period, the FWOE fee was equivalent to an annual rate of .03% of average net assets.
Annual Report
Notes to Financial Statements - continued
7. Committed Line of Credit.
The Fund participates with other funds managed by FMR or an affiliate in a $4.0 billion credit facility (the "line of credit") to be utilized for temporary or emergency purposes to fund shareholder redemptions or for other short-term liquidity purposes. The Fund has agreed to pay commitment fees on its pro-rata portion of the line of credit, which amounted to $895 and is reflected in Miscellaneous expenses on the Statement of Operations. During the period, there were no borrowings on this line of credit.
8. Expense Reductions.
Through arrangements with the Fund's custodian, credits realized as a result of uninvested cash balances were used to reduce the Fund's expenses. During the period, these credits reduced the Fund's expenses by $135.
9. Distributions to Shareholders.
Distributions to shareholders of each class were as follows:
Years ended July 31, | 2011 | 2010 |
From net investment income | | |
Class A | $ 30,970 | $ 70,804 |
Class T | 7,200 | 19,435 |
Ultra-Short Bond | 894,223 | 1,791,150 |
Institutional Class | 4,433 | 5,660 |
Total | $ 936,826 | $ 1,887,049 |
10. Share Transactions.
Transactions for each class of shares were as follows:
| Shares | Dollars |
Years ended July 31, | 2011 | 2010 | 2011 | 2010 |
Class A | | | | |
Shares sold | 1,065,924 | 1,996,126 | $ 8,721,384 | $ 16,257,557 |
Reinvestment of distributions | 2,786 | 6,739 | 22,762 | 54,896 |
Shares redeemed | (1,799,361) | (770,234) | (14,718,442) | (6,273,379) |
Net increase (decrease) | (730,651) | 1,232,631 | $ (5,974,296) | $ 10,039,074 |
Class T | | | | |
Shares sold | 231,971 | 590,657 | $ 1,901,011 | $ 4,813,729 |
Reinvestment of distributions | 787 | 2,161 | 6,425 | 17,605 |
Shares redeemed | (300,216) | (322,791) | (2,455,991) | (2,628,531) |
Net increase (decrease) | (67,458) | 270,027 | $ (548,555) | $ 2,202,803 |
Annual Report
10. Share Transactions - continued
| Shares | Dollars |
Years ended July 31, | 2011 | 2010 | 2011 | 2010 |
Ultra-Short Bond | | | | |
Shares sold | 10,075,512 | 9,420,448 | $ 82,446,504 | $ 76,695,898 |
Reinvestment of distributions | 105,881 | 211,789 | 866,057 | 1,725,137 |
Shares redeemed | (10,269,460) | (7,087,084) | (84,068,521) | (57,716,904) |
Net increase (decrease) | (88,067) | 2,545,153 | $ (755,960) | $ 20,704,131 |
Institutional Class | | | | |
Shares sold | 250,678 | 142,602 | $ 2,055,596 | $ 1,161,563 |
Reinvestment of distributions | 412 | 362 | 3,373 | 2,947 |
Shares redeemed | (125,316) | (71,879) | (1,025,927) | (585,281) |
Net increase (decrease) | 125,774 | 71,085 | $ 1,033,042 | $ 579,229 |
11. Other.
The Fund's organizational documents provide former and current trustees and officers with a limited indemnification against liabilities arising in connection with the performance of their duties to the Fund. In the normal course of business, the Fund may also enter into contracts that provide general indemnifications. The Fund's maximum exposure under these arrangements is unknown as this would be dependent on future claims that may be made against the Fund. The risk of material loss from such claims is considered remote.
Annual Report
To the Trustees of Fidelity Income Fund and the Shareholders of Fidelity Ultra-Short Bond Fund:
In our opinion, the accompanying statement of assets and liabilities, including the schedule of investments, and the related statements of operations and of changes in net assets and the financial highlights present fairly, in all material respects, the financial position of Fidelity Ultra-Short Bond Fund (a fund of Fidelity Income Fund) at July 31, 2011, the results of its operations for the year then ended, the changes in its net assets for each of the two years in the period then ended and the financial highlights for each of the five years in the period then ended, in conformity with accounting principles generally accepted in the United States of America. These financial statements and financial highlights (hereafter referred to as "financial statements") are the responsibility of the Fidelity Ultra-Short Bond Fund's management. Our responsibility is to express an opinion on these financial statements based on our audits. We conducted our audits of these financial statements in accordance with the standards of the Public Company Accounting Oversight Board (United States). Those standards require that we plan and perform the audit to obtain reasonable assurance about whether the financial statements are free of material misstatement. An audit includes examining, on a test basis, evidence supporting the amounts and disclosures in the financial statements, assessing the accounting principles used and significant estimates made by management, and evaluating the overall financial statement presentation. We believe that our audits, which included confirmation of securities at July 31, 2011 by correspondence with the custodian and brokers, provide a reasonable basis for our opinion.
/s/ PricewaterhouseCoopers LLP
PricewaterhouseCoopers LLP
Boston, Massachusetts
September 16, 2011
Annual Report
The Trustees and executive officers of the trust and fund, as applicable, are listed below. The Board of Trustees governs the fund and is responsible for protecting the interests of shareholders. The Trustees are experienced executives who meet periodically throughout the year to oversee the fund's activities, review contractual arrangements with companies that provide services to the fund, oversee management of the risks associated with such activities and contractual arrangements, and review the fund's performance. Except for James C. Curvey, each of the Trustees oversees 198 funds advised by FMR or an affiliate. Mr. Curvey oversees 419 funds advised by FMR or an affiliate.
The Trustees hold office without limit in time except that (a) any Trustee may resign; (b) any Trustee may be removed by written instrument, signed by at least two-thirds of the number of Trustees prior to such removal; (c) any Trustee who requests to be retired or who has become incapacitated by illness or injury may be retired by written instrument signed by a majority of the other Trustees; and (d) any Trustee may be removed at any special meeting of shareholders by a two-thirds vote of the outstanding voting securities of the trust. Each Trustee who is not an interested person (as defined in the 1940 Act) (Independent Trustee), shall retire not later than the last day of the calendar year in which his or her 75th birthday occurs. The Independent Trustees may waive this mandatory retirement age policy with respect to individual Trustees. The executive officers hold office without limit in time, except that any officer may resign or may be removed by a vote of a majority of the Trustees at any regular meeting or any special meeting of the Trustees. Except as indicated, each individual has held the office shown or other offices in the same company for the past five years.
Experience, Skills, Attributes, and Qualifications of the Fund's Trustees. The Governance and Nominating Committee has adopted a statement of policy that describes the experience, qualifications, attributes, and skills that are necessary and desirable for potential Independent Trustee candidates (Statement of Policy). The Board believes that each Trustee satisfied at the time he or she was initially elected or appointed a Trustee, and continues to satisfy, the standards contemplated by the Statement of Policy. The Governance and Nominating Committee also engages professional search firms to help identify potential Independent Trustee candidates who have the experience, qualifications, attributes, and skills consistent with the Statement of Policy. From time to time, additional criteria based on the composition and skills of the current Independent Trustees, as well as experience or skills that may be appropriate in light of future changes to board composition, business conditions, and regulatory or other developments, have also been considered by the professional search firms and the Governance and Nominating Committee. In addition, the Board takes into account the Trustees' commitment and participation in Board and committee meetings, as well as their leadership of standing and ad hoc committees throughout their tenure.
In determining that a particular Trustee was and continues to be qualified to serve as a Trustee, the Board has considered a variety of criteria, none of which, in isolation, was controlling. The Board believes that, collectively, the Trustees have balanced and diverse experience, qualifications, attributes, and skills, which allow the Board to operate effectively in governing the fund and protecting the interests of shareholders. Information about the specific experience, skills, attributes, and qualifications of each Trustee, which in each case led to the Board's conclusion that the Trustee should serve (or continue to serve) as a trustee of the fund, is provided below.
Annual Report
Trustees and Officers - continued
Board Structure and Oversight Function. Abigail P. Johnson is an interested person (as defined in the 1940 Act) and currently serves as Chairman. The Trustees have determined that an interested Chairman is appropriate and benefits shareholders because an interested Chairman has a personal and professional stake in the quality and continuity of services provided to the fund. Independent Trustees exercise their informed business judgment to appoint an individual of their choosing to serve as Chairman, regardless of whether the Trustee happens to be independent or a member of management. The Independent Trustees have determined that they can act independently and effectively without having an Independent Trustee serve as Chairman and that a key structural component for assuring that they are in a position to do so is for the Independent Trustees to constitute a substantial majority for the Board. The Independent Trustees also regularly meet in executive session. Kenneth L. Wolfe serves as Chairman of the Independent Trustees and as such (i) acts as a liaison between the Independent Trustees and management with respect to matters important to the Independent Trustees and (ii) with management prepares agendas for Board meetings.
Fidelity funds are overseen by different Boards of Trustees. The fund's Board oversees Fidelity's investment-grade bond, money market, and asset allocation funds and another Board oversees Fidelity's equity and high income funds. The asset allocation funds may invest in Fidelity funds that are overseen by such other Board. The use of separate Boards, each with its own committee structure, allows the Trustees of each group of Fidelity funds to focus on the unique issues of the funds they oversee, including common research, investment, and operational issues. On occasion, the separate Boards establish joint committees to address issues of overlapping consequences for the Fidelity funds overseen by each Board.
The Trustees operate using a system of committees to facilitate the timely and efficient consideration of all matters of importance to the Trustees, the fund, and fund shareholders and to facilitate compliance with legal and regulatory requirements and oversight of the fund's activities and associated risks. The Board, acting through its committees, has charged FMR and its affiliates with (i) identifying events or circumstances the occurrence of which could have demonstrably adverse effects on the fund's business and/or reputation; (ii) implementing processes and controls to lessen the possibility that such events or circumstances occur or to mitigate the effects of such events or circumstances if they do occur; and (iii) creating and maintaining a system designed to evaluate continuously business and market conditions in order to facilitate the identification and implementation processes described in (i) and (ii) above. Because the day-to-day operations and activities of the fund are carried out by or through FMR, its affiliates and other service providers, the fund's exposure to risks is mitigated but not eliminated by the processes overseen by the Trustees. While each of the Board's committees has responsibility for overseeing different aspects of the fund's activities, oversight is exercised primarily through the Operations and Audit Committees. Appropriate personnel, including but not limited to the fund's Chief Compliance Officer (CCO), FMR's internal auditor, the independent accountants, the fund's Treasurer and portfolio management personnel, make periodic reports to the Board's committees, as appropriate. The responsibilities of each committee, including their oversight responsibilities, are described further under "Standing Committees of the Fund's Trustees."
Annual Report
The fund's Statement of Additional Information (SAI) includes more information about the Trustees. To request a free copy, call Fidelity at 1-877-208-0098.
Interested Trustees*:
Correspondence intended for each Trustee who is an interested person may be sent to Fidelity Investments, 82 Devonshire Street, Boston, Massachusetts 02109.
Name, Age; Principal Occupations and Other Relevant Experience+ |
Abigail P. Johnson (49) |
| Year of Election or Appointment: 2009 Ms. Johnson is Trustee and Chairman of the Board of Trustees of certain Trusts. Ms. Johnson serves as President of Personal, Workplace and Institutional Services (2005-present). Ms. Johnson is Chairman and Director of FMR Co., Inc. (2011-present), Chairman and Director of FMR (2011-present), and the Vice Chairman and Director (2007-present) of FMR LLC. Previously, Ms. Johnson served as President and a Director of FMR (2001-2005), a Trustee of other investment companies advised by FMR, Fidelity Investments Money Management, Inc., and FMR Co., Inc. (2001-2005), Senior Vice President of the Fidelity funds (2001-2005), and managed a number of Fidelity funds. Ms. Abigail P. Johnson and Mr. Arthur E. Johnson are not related. |
James C. Curvey (76) |
| Year of Election or Appointment: 2007 Mr. Curvey also serves as Trustee (2007-present) of other investment companies advised by FMR. Mr. Curvey is a Director of Fidelity Investments Money Management, Inc. (2009-present), Director of Fidelity Research & Analysis Co. (2009-present) and Director of FMR and FMR Co., Inc. (2007-present). Mr. Curvey is also Vice Chairman (2007-present) and Director of FMR LLC. In addition, Mr. Curvey serves as an Overseer for the Boston Symphony Orchestra and a member of the Trustees of Villanova University. Previously, Mr. Curvey was the Vice Chairman (2006-2007) and Director (2000-2007) of FMR Corp. |
* Trustees have been determined to be "Interested Trustees" by virtue of, among other things, their affiliation with the trust or various entities under common control with FMR.
+ The information above includes each Trustee's principal occupation during the last five years and other information relating to the experience, attributes, and skills relevant to each Trustee's qualifications to serve as a Trustee, which led to the conclusion that each Trustee should serve as a Trustee for the fund.
Annual Report
Trustees and Officers - continued
Independent Trustees:
Correspondence intended for each Independent Trustee (that is, the Trustees other than the Interested Trustees) may be sent to Fidelity Investments, P.O. Box 55235, Boston, Massachusetts 02205-5235.
Name, Age; Principal Occupations and Other Relevant Experience+ |
Albert R. Gamper, Jr. (69) |
| Year of Election or Appointment: 2006 Mr. Gamper is Vice Chairman of the Independent Trustees of the Fixed Income and Asset Allocation Funds (2011-present). Prior to his retirement in December 2004, Mr. Gamper served as Chairman of the Board of CIT Group Inc. (commercial finance). During his tenure with CIT Group Inc. Mr. Gamper served in numerous senior management positions, including Chairman (1987-1989; 1999-2001; 2002-2004), Chief Executive Officer (1987-2004), and President (2002-2003). He also served as President and Chief Executive Officer of Tyco Capital Corporation (2001-2002). Mr. Gamper currently serves as a member of the Board of Directors of Public Service Enterprise Group (utilities, 2000-present), a member of the Board of Trustees, Rutgers University (2004-present), and Chairman of the Board of Saint Barnabas Health Care System. Previously, Mr. Gamper served as Chairman of the Board of Governors, Rutgers University (2004-2007). |
Robert F. Gartland (59) |
| Year of Election or Appointment: 2010 Mr. Gartland is a partner and investor of Vietnam Partners LLC (investments and consulting, 2008-present) and is Chairman and an investor in Gartland and Mellina Group Corp. (consulting, 2009-present). Prior to his retirement, Mr. Gartland held a variety of positions at Morgan Stanley (financial services, 1979-2007) including Managing Director (1987-2007). |
Arthur E. Johnson (64) |
| Year of Election or Appointment: 2008 Mr. Johnson serves as a member of the Board of Directors of Eaton Corporation (diversified power management, 2009-present) and AGL Resources, Inc. (holding company). Prior to his retirement, Mr. Johnson served as Senior Vice President of Corporate Strategic Development of Lockheed Martin Corporation (defense contractor, 1999-2009). He previously served on the Board of Directors of IKON Office Solutions, Inc. (1999-2008) and Delta Airlines (2005-2007). Mr. Arthur E. Johnson and Ms. Abigail P. Johnson are not related. |
Michael E. Kenneally (57) |
| Year of Election or Appointment: 2009 Previously, Mr. Kenneally served as a Member of the Advisory Board for certain Fidelity Fixed Income and Asset Allocation Funds (2008-2009). Prior to his retirement, Mr. Kenneally served as Chairman and Global Chief Executive Officer of Credit Suisse Asset Management (2003-2005). Mr. Kenneally was a Director of the Credit Suisse Funds (U.S. mutual funds, 2004-2008) and certain other closed-end funds (2004-2005) and was awarded the Chartered Financial Analyst (CFA) designation in 1991. |
James H. Keyes (70) |
| Year of Election or Appointment: 2007 Mr. Keyes serves as a member of the Boards of Navistar International Corporation (manufacture and sale of trucks, buses, and diesel engines, since 2002) and Pitney Bowes, Inc. (integrated mail, messaging, and document management solutions, since 1998). Prior to his retirement, Mr. Keyes served as Chairman and Chief Executive Officer of Johnson Controls (automotive, building, and energy, 1998-2002) and as a member of the Board of LSI Logic Corporation (semiconductor technologies, 1984-2008). |
Marie L. Knowles (64) |
| Year of Election or Appointment: 2001 Prior to Ms. Knowles' retirement in June 2000, she served as Executive Vice President and Chief Financial Officer of Atlantic Richfield Company (ARCO) (diversified energy, 1996-2000). From 1993 to 1996, she was a Senior Vice President of ARCO and President of ARCO Transportation Company. She served as a Director of ARCO from 1996 to 1998. Ms. Knowles currently serves as a Director and Chairman of the Audit Committee of McKesson Corporation (healthcare service, since 2002). Ms. Knowles is an Honorary Trustee of the Brookings Institution and a member of the Board of the Catalina Island Conservancy and of the Santa Catalina Island Company (2009-present). She also serves as a member of the Advisory Board for the School of Engineering of the University of Southern California and the Foundation Board of the School of Architecture at the University of Virginia (2007-present). Previously, Ms. Knowles served as a Director of Phelps Dodge Corporation (copper mining and manufacturing, 1994-2007). |
Kenneth L. Wolfe (72) |
| Year of Election or Appointment: 2005 Mr. Wolfe is Chairman of the Independent Trustees of the Fixed Income and Asset Allocation Funds (2008-present). Prior to his retirement, Mr. Wolfe served as Chairman and a Director (2007-2009) and Chairman and Chief Executive Officer (1994-2001) of Hershey Foods Corporation. He also served as a member of the Boards of Adelphia Communications Corporation (telecommunications, 2003-2006), Bausch & Lomb, Inc. (medical/pharmaceutical, 1993-2007), and Revlon, Inc. (personal care products, 2004-2009). |
+ The information above includes each Trustee's principal occupation during the last five years and other information relating to the experience, attributes, and skills relevant to each Trustee's qualifications to serve as a Trustee, which led to the conclusion that each Trustee should serve as a Trustee for the fund.
Executive Officers:
Correspondence intended for each executive officer may be sent to Fidelity Investments, 82 Devonshire Street, Boston, Massachusetts 02109.
Name, Age; Principal Occupation |
John R. Hebble (53) |
| Year of Election or Appointment: 2008 President and Treasurer of Fidelity's Fixed Income and Asset Allocation Funds. Mr. Hebble also serves as President (2011-present), Treasurer, and Chief Financial Officer of The North Carolina Capital Management Trust: Cash and Term Portfolios (2008-present), Assistant Treasurer of other Fidelity funds (2009-present) and is an employee of Fidelity Investments. |
Christopher P. Sullivan (57) |
| Year of Election or Appointment: 2009 Vice President of Fidelity's Bond Funds. Mr. Sullivan also serves as President of Fidelity's Bond Division (2009-present). Mr. Sullivan is Executive Vice President of Fidelity Investments Money Management, Inc. (2009-present), and a Director of Fidelity Management & Research (U.K.) Inc. (2010-present). Previously, Mr. Sullivan served as Managing Director, Co-Head of U.S. Fixed Income at Goldman Sachs Asset Management (2001-2009). |
Christine J. Thompson (53) |
| Year of Election or Appointment: 2010 Vice President of Fidelity's Bond Funds. Ms. Thompson also serves as Chief Investment Officer of FMR's Bond Group (2010-present) and is an employee of Fidelity Investments. Previously, Ms. Thompson served as Director of Municipal Bond Portfolio Managers (2002-2010). |
Scott C. Goebel (43) |
| Year of Election or Appointment: 2008 Secretary and Chief Legal Officer (CLO) of the Fidelity funds. Mr. Goebel also serves as Secretary of Fidelity Investments Money Management, Inc. (FIMM) (2010-present) and Fidelity Research and Analysis Company (FRAC) (2010-present); Secretary and CLO of The North Carolina Capital Management Trust: Cash and Term Portfolios (2008-present); General Counsel, Secretary, and Senior Vice President of FMR (2008-present) and FMR Co., Inc. (2008-present); employed by FMR LLC or an affiliate (2001-present); Chief Legal Officer of Fidelity Management & Research (Hong Kong) Limited (2008-present) and Assistant Secretary of Fidelity Management & Research (Japan) Inc. (2008-present), and Fidelity Management & Research (U.K.) Inc. (2008-present). Previously, Mr. Goebel served as Assistant Secretary of FIMM (2008-2010), FRAC (2008-2010), and the Funds (2007-2008) and as Vice President and Secretary of Fidelity Distributors Corporation (FDC) (2005-2007). |
David J. Carter (38) |
| Year of Election or Appointment: 2010 Assistant Secretary of Fidelity's Fixed Income and Asset Allocation Funds. Mr. Carter also serves as Vice President, Associate General Counsel (2010-present) and is an employee of Fidelity Investments (2005-present). |
Holly C. Laurent (57) |
| Year of Election or Appointment: 2008 Anti-Money Laundering (AML) Officer of the Fidelity funds. Ms. Laurent also serves as AML Officer of The North Carolina Capital Management Trust: Cash and Term Portfolios (2008-present) and is an employee of Fidelity Investments. Previously, Ms. Laurent was Senior Vice President and Head of Legal for Fidelity Business Services India Pvt. Ltd. (2006-2008), and Senior Vice President, Deputy General Counsel and Group Head for FMR LLC (2005-2006). |
Christine Reynolds (52) |
| Year of Election or Appointment: 2008 Chief Financial Officer of the Fidelity funds. Ms. Reynolds became President of Fidelity Pricing and Cash Management Services (FPCMS) in August 2008. Ms. Reynolds served as Chief Operating Officer of FPCMS (2007-2008). Previously, Ms. Reynolds served as President, Treasurer, and Anti-Money Laundering officer of the Fidelity funds (2004-2007). |
Michael H. Whitaker (44) |
| Year of Election or Appointment: 2008 Chief Compliance Officer of Fidelity's Fixed Income and Asset Allocation Funds. Mr. Whitaker also serves as Chief Compliance Officer of The North Carolina Capital Management Trust: Cash and Term Portfolios (2008-present). Mr. Whitaker is an employee of Fidelity Investments (2007-present). Prior to joining Fidelity Investments, Mr. Whitaker worked at MFS Investment Management where he served as Senior Vice President and Chief Compliance Officer (2004-2006), and Assistant General Counsel. |
Jeffrey S. Christian (49) |
| Year of Election or Appointment: 2009 Deputy Treasurer of the Fidelity funds. Mr. Christian is an employee of Fidelity Investments. Previously, Mr. Christian served as Chief Financial Officer (2008-2009) of certain Fidelity funds and Senior Vice President of Fidelity Pricing and Cash Management Services (FPCMS) (2004-2009). |
Bryan A. Mehrmann (50) |
| Year of Election or Appointment: 2005 Deputy Treasurer of the Fidelity funds. Mr. Mehrmann is an employee of Fidelity Investments. |
Stephanie J. Dorsey (42) |
| Year of Election or Appointment: 2008 Deputy Treasurer of Fidelity's Fixed Income and Asset Allocation Funds. Ms. Dorsey also serves as Assistant Treasurer of other Fidelity funds (2010-present) and is an employee of Fidelity Investments (2008-present). Previously, Ms. Dorsey served as Treasurer (2004-2008) of the JPMorgan Mutual Funds and Vice President (2004-2008) of JPMorgan Chase Bank. |
Adrien E. Deberghes (43) |
| Year of Election or Appointment: 2010 Assistant Treasurer of Fidelity's Fixed Income and Asset Allocation Funds. Mr. Deberghes also serves as Deputy Treasurer of other Fidelity funds (2008-present) and is an employee of Fidelity Investments (2008-present). Previously, Mr. Deberghes served as Senior Vice President of Mutual Fund Administration at State Street Corporation (2007-2008), Senior Director of Mutual Fund Administration at Investors Bank & Trust (2005-2007), and Director of Finance for Dunkin' Brands (2000-2005). |
Kenneth B. Robins (41) |
| Year of Election or Appointment: 2009 Assistant Treasurer of the Fidelity Fixed Income and Asset Allocation Funds. Mr. Robins also serves as President and Treasurer of other Fidelity funds (2008-present; 2010-present) and is an employee of Fidelity Investments (2004-present). Previously, Mr. Robins served as Deputy Treasurer of the Fidelity funds (2005-2008) and Treasurer and Chief Financial Officer of The North Carolina Capital Management Trust: Cash and Term Portfolios (2006-2008). |
Gary W. Ryan (52) |
| Year of Election or Appointment: 2005 Assistant Treasurer of the Fidelity funds. Mr. Ryan is an employee of Fidelity Investments. Previously, Mr. Ryan served as Vice President of Fund Reporting in Fidelity Pricing and Cash Management Services (FPCMS) (1999-2005). |
Jonathan Davis (43) |
| Year of Election or Appointment: 2010 Assistant Treasurer of the Fidelity funds. Mr. Davis is an employee of Fidelity Investments. Previously, Mr. Davis served as Vice President and Associate General Counsel of FMR LLC (2003-2010). |
Annual Report
A total of 9.73% of the dividends distributed during the fiscal year was derived from interest on U.S. Government securities which is generally exempt from state income tax.
The fund designates $382,768 of distributions paid during the period January 1, 2011 to July 31, 2011 as qualifying to be taxed as interest-related dividends for nonresident alien shareholders.
The fund will notify shareholders in January 2012 amounts for use in preparing 2011 income tax returns.
Annual Report
Investment Adviser
Fidelity Management & Research Company
Boston, MA
Investment Sub-Advisers
Fidelity Investments
Money Management, Inc.
Fidelity Management & Research
(U.K.) Inc.
Fidelity Management & Research
(Japan) Inc.
Fidelity Management & Research
(Hong Kong) Limited
General Distributor
Fidelity Distributors Corporation
Boston, MA
Transfer and Service Agents
Fidelity Investments Institutional
Operations Company, Inc.
Boston, MA
Fidelity Service Company, Inc.
Boston, MA
Custodian
Citibank, N.A.
New York, NY
AUSB-UANN-0911
1.804587.107
(Fidelity Investment logo)(registered trademark)
Fidelity Advisor®
Ultra-Short Bond
Fund - Institutional Class
Annual Report
July 31, 2011
Institutional Class
is a class of
Fidelity® Ultra-Short Bond Fund
(2_fidelity_logos) (Registered_Trademark)
Contents
Chairman's Message | <Click Here> | The Chairman's message to shareholders. |
Performance | <Click Here> | How the fund has done over time. |
Management's Discussion of Fund Performance | <Click Here> | The Portfolio Manager's review of fund performance and strategy. |
Shareholder Expense Example | <Click Here> | An example of shareholder expenses. |
Investment Changes | <Click Here> | A summary of major shifts in the fund's investments over the past six months. |
Investments | <Click Here> | A complete list of the fund's investments with their market values. |
Financial Statements | <Click Here> | Statements of assets and liabilities, operations, and changes in net assets, as well as financial highlights. |
Notes | <Click Here> | Notes to the financial statements. |
Report of Independent Registered Public Accounting Firm | <Click Here> | |
Trustees and Officers | <Click Here> | |
Distributions | <Click Here> | |
To view a fund's proxy voting guidelines and proxy voting record for the 12-month period ended June 30, visit http://www.fidelity.com/proxyvotingresults or visit the Securities and Exchange Commission's (SEC) web site at http://www.sec.gov. You may also call 1-877-208-0098 to request a free copy of the proxy voting guidelines.
Standard & Poor's, S&P and S&P 500 are registered service marks of The McGraw-Hill Companies, Inc. and have been licensed for use by Fidelity Distributors Corporation.
Other third party marks appearing herein are the property of their respective owners.
All other marks appearing herein are registered or unregistered trademarks or service marks of FMR LLC or an affiliated company.
Annual Report
This report and the financial statements contained herein are submitted for the general information of the shareholders of the fund. This report is not authorized for distribution to prospective investors in the fund unless preceded or accompanied by an effective prospectus.
A fund files its complete schedule of portfolio holdings with the SEC for the first and third quarters of each fiscal year on Form N-Q. Forms N-Q are available on the SEC's web site at http://www.sec.gov. A fund's Forms N-Q may be reviewed and copied at the SEC's Public Reference Room in Washington, DC. Information regarding the operation of the SEC's Public Reference Room may be obtained by calling 1-800-SEC-0330. For a complete list of a fund's portfolio holdings, view the most recent holdings listing, semiannual report, or annual report on Fidelity's web site at http://www.fidelity.com, http://www.advisor.fidelity.com, or http://www.401k.com, as applicable.
NOT FDIC INSURED • MAY LOSE VALUE • NO BANK GUARANTEE
Neither the fund nor Fidelity Distributors Corporation is a bank.
Annual Report
(photo_of_Abigail_P_Johnson)
Dear Shareholder:
The second half of 2011 began with U.S. equities continuing to give back some of the gains achieved earlier in the year. In the days leading up to July 31, markets were shaken by a political stalemate in which Congress struggled to address the debt ceiling issue before an early-August deadline. The resulting uncertainty held back markets in July, the third consecutive monthly decline for equities, effectively reversing the positive momentum seen through the end of April. Financial markets are always unpredictable, of course, but there are several time-tested investment principles that can help put the odds in your favor.
One of the basic tenets is to invest for the long term. Over time, riding out the markets' inevitable ups and downs has proven much more effective than selling into panic or chasing the hottest trend. Even missing only a few of the markets' best days can significantly diminish investor returns. Patience also affords the benefits of compounding - of earning interest on additional income or reinvested dividends and capital gains. There can be tax advantages and cost benefits to consider as well. While staying the course doesn't eliminate risk, it can considerably lessen the effect of short-term declines.
You can further manage your investing risk through diversification. And today, more than ever, geographic diversification should be taken into account. Studies indicate that asset allocation is the single most important determinant of a portfolio's long-term success. The right mix of stocks, bonds and cash - aligned to your particular risk tolerance and investment objective - is very important. Age-appropriate rebalancing is also an essential aspect of asset allocation. For younger investors, an emphasis on equities - which historically have been the best-performing asset class over time - is encouraged. As investors near their specific goal, such as retirement or sending a child to college, consideration may be given to replacing volatile assets (e.g. common stocks) with more-stable fixed investments (bonds or savings plans).
A third principle - investing regularly - can help lower the average cost of your purchases. Investing a certain amount of money each month or quarter helps ensure you won't pay for all your shares at market highs. This strategy - known as dollar cost averaging - also reduces "emotion" from investing, helping shareholders avoid selling weak performers just prior to an upswing, or chasing a hot performer just before a correction.
We invite you to contact us via the Internet, through our Investor Centers or by phone. It is our privilege to provide you the information you need to make the investments that are right for you.
Sincerely,
(The chairman's signature appears here.)
Abigail P. Johnson
Annual Report
Average annual total return reflects the change in the value of an investment, assuming reinvestment of the class' distributions from dividend income and capital gains (the profits earned upon the sale of securities that have grown in value, if any) and assuming a constant rate of performance each year. The $10,000 table and the fund's returns do not reflect the deduction of taxes that a shareholder would pay on fund distributions or the redemption of fund shares. During periods of reimbursement by Fidelity, a fund's total return will be greater than it would be had the reimbursement not occurred. How a fund did yesterday is no guarantee of how it will do tomorrow.
Average Annual Total Returns
Periods ended July 31, 2011 | Past 1
year | Past 5
years | Life of
fund A |
Institutional Class B | 0.95% | -1.78% | 0.08% |
A From August 29, 2002
B Institutional Class shares are sold to eligible investors without a sales load or 12b-1 fee. The initial offering of Institutional Class shares took place on June 16, 2004. Returns prior to June 16, 2004 are those of Fidelity® Ultra-Short Bond Fund, the original class of the fund.
$10,000 Over Life of Fund
Let's say hypothetically that $10,000 was invested in Fidelity Advisor® Ultra-Short Bond Fund - Institutional Class on August 29, 2002, when the fund started. The chart shows how the value of your investment would have changed, and also shows how the Barclays Capital® 6 Month Swap Index performed over the same period. The initial offering of Institutional Class took place on June 16, 2004. See above for additional information regarding the performance of Institutional Class.
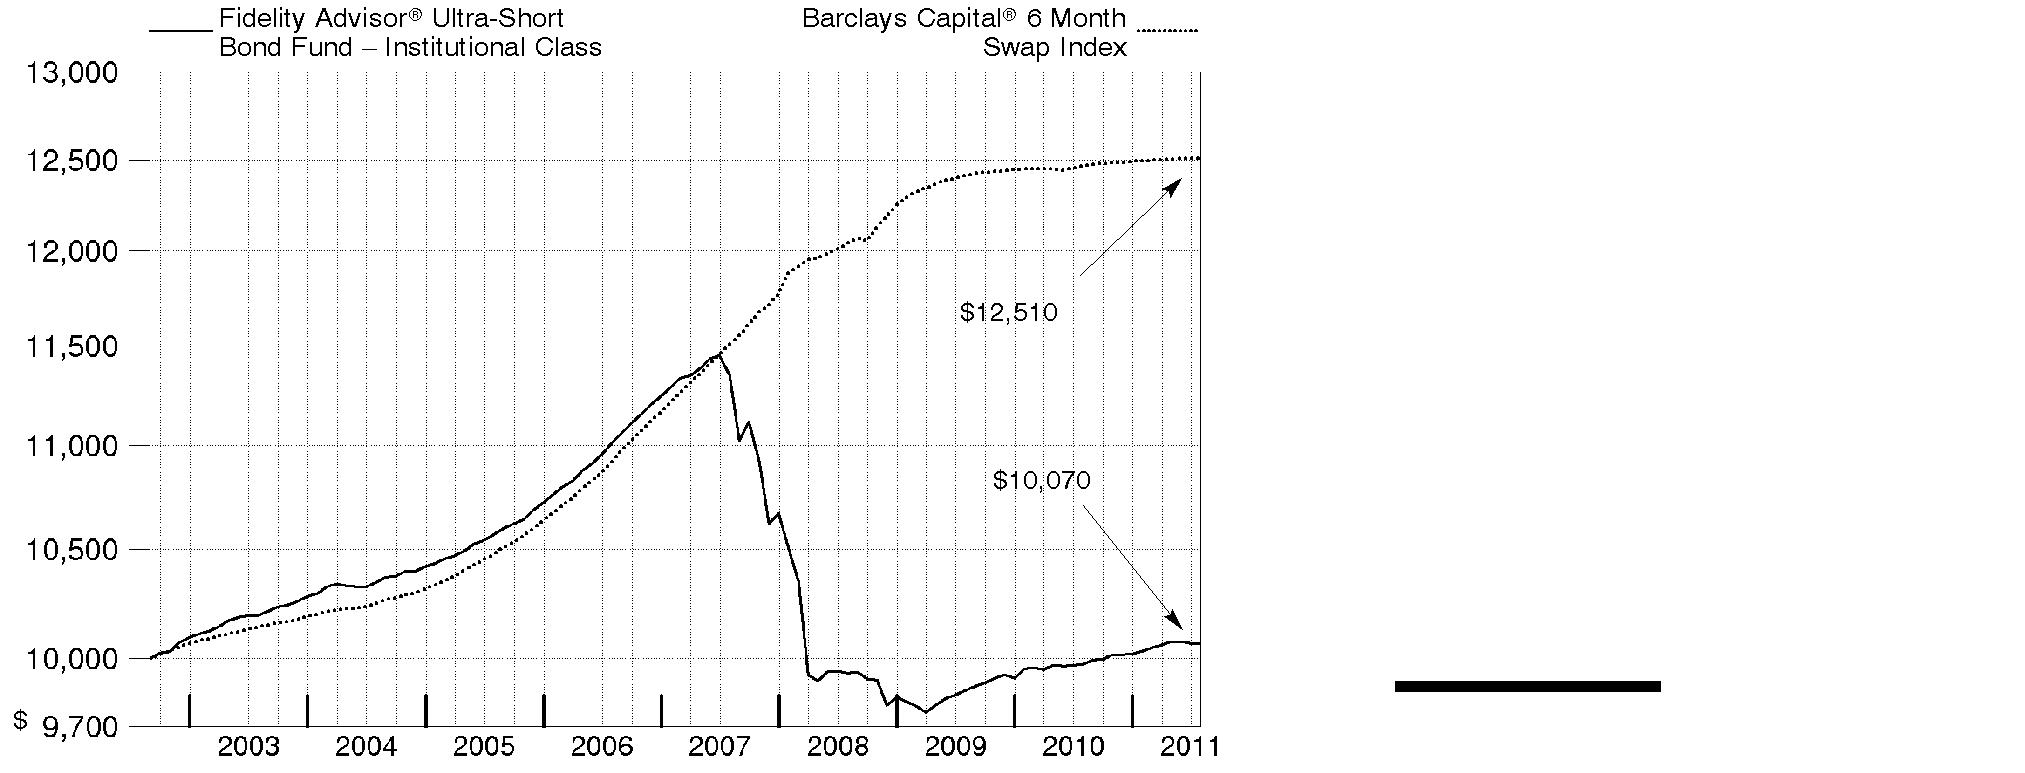
Annual Report
Market Recap: Amid ultra-low interest rates and heightened market volatility, U.S. taxable investment-grade bonds generated solid results for the year ending July 31, 2011, as evidenced by the 4.44% advance of the Barclays Capital® U.S. Aggregate Bond Index. The best-performing categories within the index were those on the riskier end of the spectrum that benefited during intervals when data pointed to an improving economy. Buoyed by a strong first-half showing, commercial mortgage-backed securities (CMBS) fared best, gaining 10.01% amid modest improvement in commercial real estate fundamentals. Corporate bonds rose 6.70%, due in large part to increased corporate profitability, high cash balances, reduced debt levels and improved credit conditions. Residential mortgage-backed securities, supported by a combination of strong demand from yield-hungry investors and slower prepayment rates, rose a solid 3.85%. Meanwhile, U.S. Treasury and agency securities gained 3.39% and 2.53%, respectively. These securities, which lagged in the first half of the period, when economic data was strong and inflation worries were muted, performed comparatively well in the second half amid signs of a weakening economic recovery and heightened concern about the sovereign debt crisis in Europe.
Comments from Robert Galusza, Portfolio Manager of Fidelity Advisor® Ultra-Short Bond Fund: For the year, the fund's Institutional Class shares returned 0.95%, while the Barclays Capital® 6 Month Swap Index gained 0.33%. By way of review, the fund may invest in many different types of debt securities in an effort to achieve its investment objective, including securities that are not part of the Barclays Capital index. Against that backdrop, out-of-index exposure to all major segments of the short-term bond market aided performance because each of these groups outpaced the index. Emphasizing higher-yielding, riskier securities within the fund's investment-grade mandate - including asset-backed, commercial mortgage-backed and corporate debt - was particularly beneficial in the first half of the period when these sectors held up well relative to their lower-yielding government counterparts. My choices among investment-grade corporates also proved advantageous. Elsewhere, holding government-backed securities, including U.S. Treasuries, Treasury Inflation-Protected Securities (TIPS), which I sold by the end of the period, and agency-backed debentures, aided the fund's performance because they also outpaced the index, even though they generally lagged riskier segments for the 12-month period.
The views expressed above reflect those of the portfolio manager(s) only through the end of the period as stated on the cover of this report and do not necessarily represent the views of Fidelity or any other person in the Fidelity organization. Any such views are subject to change at any time based upon market or other conditions and Fidelity disclaims any responsibility to update such views. These views may not be relied on as investment advice and, because investment decisions for a Fidelity fund are based on numerous factors, may not be relied on as an indication of trading intent on behalf of any Fidelity fund.
Annual Report
Shareholder Expense Example
As a shareholder of the Fund, you incur two types of costs: (1) transaction costs, including redemption fees, and (2) ongoing costs, including management fees, distribution and/or service (12b-1) fees and other Fund expenses. This Example is intended to help you understand your ongoing costs (in dollars) of investing in the Fund and to compare these costs with the ongoing costs of investing in other mutual funds.
The Example is based on an investment of $1,000 invested at the beginning of the period and held for the entire period (February 1, 2011 to July 31, 2011).
Actual Expenses
The first line of the accompanying table for each class of the Fund provides information about actual account values and actual expenses. You may use the information in this line, together with the amount you invested, to estimate the expenses that you paid over the period. Simply divide your account value by $1,000.00 (for example, an $8,600 account value divided by $1,000.00 = 8.6), then multiply the result by the number in the first line for a class of the Fund under the heading entitled "Expenses Paid During Period" to estimate the expenses you paid on your account during this period.
Hypothetical Example for Comparison Purposes
The second line of the accompanying table for each class of the Fund provides information about hypothetical account values and hypothetical expenses based on a Class' actual expense ratio and an assumed rate of return of 5% per year before expenses, which is not the Class' actual return. The hypothetical account values and expenses may not be used to estimate the actual ending account balance or expenses you paid for the period. You may use this information to compare the ongoing costs of investing in the Fund and other funds. To do so, compare this 5% hypothetical example with the 5% hypothetical examples that appear in the shareholder reports of the other funds.
Please note that the expenses shown in the table are meant to highlight your ongoing costs only and do not reflect any transaction costs. Therefore, the second line of the table is useful in comparing ongoing costs only, and will not help you determine the relative total costs of owning different funds. In addition, if these transactional costs were included, your costs would have been higher.
Annual Report
| Annualized Expense Ratio | Beginning
Account Value
February 1, 2011 | Ending
Account Value
July 31, 2011 | Expenses Paid
During Period*
February 1, 2011
to July 31, 2011 |
Class A | .65% | | | |
Actual | | $ 1,000.00 | $ 1,004.00 | $ 3.23 |
HypotheticalA | | $ 1,000.00 | $ 1,021.57 | $ 3.26 |
Class T | .70% | | | |
Actual | | $ 1,000.00 | $ 1,002.50 | $ 3.48 |
HypotheticalA | | $ 1,000.00 | $ 1,021.32 | $ 3.51 |
Ultra-Short Bond | .45% | | | |
Actual | | $ 1,000.00 | $ 1,003.80 | $ 2.24 |
HypotheticalA | | $ 1,000.00 | $ 1,022.56 | $ 2.26 |
Institutional Class | .49% | | | |
Actual | | $ 1,000.00 | $ 1,003.60 | $ 2.43 |
HypotheticalA | | $ 1,000.00 | $ 1,022.36 | $ 2.46 |
A 5% return per year before expenses
* Expenses are equal to each Class' annualized expense ratio, multiplied by the average account value over the period, multiplied by 181/365 (to reflect the one-half year period).
Annual Report
Investment Changes (Unaudited)
Quality Diversification (% of fund's net assets) as of July 31, 2011 |
As of July 31, 2011 * | As of January 31, 2011 ** |
| U.S. Government
and U.S. Government Agency Obligations†34.0% | | | U.S. Government
and U.S. Government Agency Obligations†40.8% | |
| AAA 23.7% | | | AAA 15.5% | |
| AA 19.3% | | | AA 14.3% | |
| A 12.5% | | | A 9.6% | |
| BBB 6.6% | | | BBB 9.2% | |
| BB and Below 0.4% | | | BB and Below 0.3% | |
| Not Rated 1.5% | | | Not Rated 1.1% | |
| Short-Term
Investments and
Net Other Assets 2.0% | | | Short-Term
Investments and
Net Other Assets 9.2% | |

We have used ratings from Moody's Investors Service, Inc. Where Moody's® ratings are not available, we have used S&P® ratings. All ratings are as of the date indicated and do not reflect subsequent changes. Securities rated BB or below were rated investment grade at the time of acquisition. |
Weighted Average Maturity as of July 31, 2011 |
| | 6 months ago |
Years | 1.6 | 1.3 |
This is a weighted average of all the maturities of the securities held in a fund. Weighted Average Maturity (WAM) can be used as a measure of sensitivity to interest rate changes and markets changes. Generally, the longer the maturity, the greater the sensitivity to such changes. WAM is based on the dollar-weighted average length of time until principal payments must be paid. Depending on the types of securities held in a fund, certain maturity shortening devices (e.g., demand features, interest rate resets, and call options) may be taken into account when calculating the WAM. |
Duration as of July 31, 2011 |
| | 6 months ago |
Years | 0.5 | 0.4 |
Duration estimates how much a bond fund's price will change with a change in comparable interest rates. If rates rise 1%, for example, a fund with a 5-year duration is likely to lose about 5% of its value. Other factors also can influence a bond fund's performance and share price. Accordingly, a bond fund's actual performance may differ from this example. Duration takes into account any call or put option embedded in the bonds. |
Asset Allocation (% of fund's net assets) |
As of July 31, 2011 * | As of January 31, 2011 ** |
| Corporate Bonds 40.8% | | | Corporate Bonds 30.5% | |
| U.S. Government
and U.S. Government Agency Obligations† 34.0% | | | U.S. Government
and U.S. Government
Agency Obligations† 40.8% | |
| Asset-Backed
Securities 18.4% | | | Asset-Backed
Securities 15.7% | |
| CMOs and Other Mortgage Related Securities 4.2% | | | CMOs and Other Mortgage Related Securities 2.6% | |
| Other Investments 0.6% | | | Other Investments 1.2% | |
| Short-Term
Investments and
Net Other Assets 2.0% | | | Short-Term
Investments and
Net Other Assets 9.2% | |

* Foreign investments | 16.1% | | ** Foreign investments | 12.5% | |
* Futures and Swaps | 3.9% | | ** Futures and Swaps | 3.7% | |
† Includes FDIC Guaranteed Corporate Securities |
Annual Report
Investments July 31, 2011
Showing Percentage of Net Assets
Nonconvertible Bonds - 40.8% |
| Principal Amount | | Value |
CONSUMER DISCRETIONARY - 1.0% |
Media - 1.0% |
AOL Time Warner, Inc. 6.875% 5/1/12 | | $ 1,000,000 | | $ 1,044,568 |
Time Warner Cable, Inc. 5.4% 7/2/12 | | 1,500,000 | | 1,564,193 |
| | 2,608,761 |
CONSUMER STAPLES - 1.5% |
Beverages - 0.8% |
Anheuser-Busch InBev Worldwide, Inc. 0.609% 7/14/14 (e) | | 2,000,000 | | 2,006,420 |
Food Products - 0.7% |
Kraft Foods, Inc. 5.625% 11/1/11 | | 1,758,000 | | 1,779,404 |
TOTAL CONSUMER STAPLES | | 3,785,824 |
ENERGY - 1.6% |
Oil, Gas & Consumable Fuels - 1.6% |
Enterprise Products Operating LP 7.625% 2/15/12 | | 1,000,000 | | 1,034,672 |
Shell International Finance BV 1.3% 9/22/11 | | 1,000,000 | | 1,001,607 |
Total Capital Canada Ltd. 0.6298% 1/17/14 (e) | | 2,000,000 | | 2,012,940 |
| | 4,049,219 |
FINANCIALS - 31.9% |
Capital Markets - 5.2% |
BlackRock, Inc. 0.5575% 5/24/13 (e) | | 1,000,000 | | 999,463 |
Goldman Sachs Group, Inc. 1.2683% 2/7/14 (e) | | 2,000,000 | | 1,980,374 |
HSBC Bank PLC 1.0498% 1/17/14 (b)(e) | | 2,000,000 | | 2,010,406 |
JPMorgan Chase & Co. 1.053% 1/24/14 (e) | | 4,000,000 | | 3,993,624 |
State Street Corp. 0.602% 3/7/14 (e) | | 1,000,000 | | 1,000,567 |
The Bank of New York Mellon Corp. 0.5239% 7/28/14 (e) | | 2,000,000 | | 2,000,578 |
UBS AG Stamford Branch 1.2526% 1/28/14 (e) | | 1,500,000 | | 1,502,271 |
| | 13,487,283 |
Commercial Banks - 15.8% |
ANZ Banking Group Ltd. 0.9861% 1/10/14 (b)(e) | | 1,000,000 | | 1,002,979 |
Bank of Montreal 0.7229% 4/29/14 (e) | | 2,000,000 | | 2,001,180 |
Barclays Bank PLC 1.2861% 1/13/14 (e) | | 2,000,000 | | 2,004,040 |
Commonwealth Bank of Australia 0.975% 3/17/14 (b)(e) | | 1,500,000 | | 1,502,430 |
Credit Agricole SA 0.6233% 2/2/12 (b)(e) | | 2,000,000 | | 1,995,048 |
Credit Suisse New York Branch 1.209% 1/14/14 (e) | | 2,500,000 | | 2,501,433 |
Danske Bank A/S 1.299% 4/14/14 (b)(e) | | 500,000 | | 500,028 |
Nonconvertible Bonds - continued |
| Principal Amount | | Value |
FINANCIALS - continued |
Commercial Banks - continued |
Deutsche Bank 0.8998% 1/18/13 (e) | | $ 2,000,000 | | $ 2,001,654 |
Fifth Third Bank 0.3705% 5/17/13 (e) | | 2,500,000 | | 2,461,308 |
ING Bank NV 1.6518% 6/9/14 (b)(e) | | 2,000,000 | | 2,002,214 |
Manufacturers & Traders Trust Co. 1.7458% 4/1/13 (e) | | 930,000 | | 929,586 |
Marshall & Ilsley Bank 6.375% 9/1/11 | | 287,000 | | 287,958 |
National Australia Bank Ltd. 0.7258% 1/8/13 (b)(e) | | 1,000,000 | | 999,710 |
Rabobank (Netherlands) NV 0.599% 4/14/14 (e) | | 5,000,000 | | 4,981,375 |
Royal Bank of Canada 0.5498% 4/17/14 (e) | | 3,000,000 | | 3,003,063 |
Santander US Debt SA Unipersonal 1.0458% 3/30/12 (b)(e) | | 800,000 | | 798,463 |
Sumitomo Mitsui Banking Corp. 1.203% 7/22/14 (b)(e) | | 1,000,000 | | 1,003,495 |
Svenska Handelsbanken AB 2.875% 9/14/12 (b) | | 2,500,000 | | 2,556,442 |
Toronto Dominion Bank 0.549% 7/14/14 (e) | | 2,000,000 | | 2,005,840 |
U.S. Bank NA 0.473% 10/26/12 (e) | | 2,000,000 | | 2,003,192 |
Union Bank NA 1.2029% 6/6/14 (e) | | 2,000,000 | | 2,003,346 |
Wachovia Bank NA 0.6533% 11/3/14 (e) | | 1,500,000 | | 1,451,219 |
Westpac Banking Corp. 0.9758% 3/31/14 (b)(e) | | 1,000,000 | | 1,001,129 |
| | 40,997,132 |
Consumer Finance - 3.5% |
American Express Credit Corp. 1.0955% 6/24/14 (e) | | 1,000,000 | | 998,575 |
American Honda Finance Corp. 0.6383% 11/7/12 (b)(e) | | 2,000,000 | | 1,996,256 |
Capital One Financial Corp.: | | | | |
1.3998% 7/15/14 (e) | | 2,000,000 | | 2,002,294 |
5.7% 9/15/11 | | 1,000,000 | | 1,005,908 |
General Electric Capital Corp. 1.0958% 1/7/14 (e) | | 3,000,000 | | 3,000,249 |
| | 9,003,282 |
Diversified Financial Services - 5.1% |
BB&T Corp. 0.9526% 4/28/14 (e) | | 2,000,000 | | 2,000,094 |
BNP Paribas 1.1461% 1/10/14 (e) | | 1,000,000 | | 987,225 |
BP Capital Markets PLC 0.8495% 3/11/14 (e) | | 1,000,000 | | 1,002,378 |
Citigroup, Inc.: | | | | |
1.1108% 2/15/13 (e) | | 1,000,000 | | 1,000,021 |
1.6961% 1/13/14 (e) | | 2,341,000 | | 2,349,617 |
MassMutual Global Funding II 0.629% 1/14/14 (b)(e) | | 394,000 | | 394,117 |
Metlife Institutional Funding II 1.1458% 4/4/14 (b)(e) | | 2,500,000 | | 2,505,425 |
Nonconvertible Bonds - continued |
| Principal Amount | | Value |
FINANCIALS - continued |
Diversified Financial Services - continued |
New York Life Global Fund 0.5058% 4/4/14 (b)(e) | | $ 2,000,000 | | $ 2,000,698 |
Volkswagen International Finance NV 0.8558% 4/1/14 (b)(e) | | 1,000,000 | | 1,003,249 |
| | 13,242,824 |
Insurance - 1.5% |
Berkshire Hathaway Finance Corp. 0.5761% 1/10/14 (e) | | 2,000,000 | | 2,006,284 |
Prudential Financial, Inc. 5.1% 12/14/11 | | 2,000,000 | | 2,029,012 |
| | 4,035,296 |
Thrifts & Mortgage Finance - 0.8% |
Bank of America Corp. 1.7961% 7/11/14 (e) | | 2,000,000 | | 1,993,712 |
TOTAL FINANCIALS | | 82,759,529 |
HEALTH CARE - 1.2% |
Pharmaceuticals - 1.2% |
Sanofi-Aventis 0.4463% 3/28/13 (e) | | 2,000,000 | | 2,005,776 |
Teva Pharmaceutical Finance III BV 0.7465% 3/21/14 (e) | | 1,000,000 | | 1,006,873 |
| | 3,012,649 |
INFORMATION TECHNOLOGY - 1.3% |
Computers & Peripherals - 0.8% |
Hewlett-Packard Co. 0.5295% 5/24/13 (e) | | 2,000,000 | | 2,004,322 |
IT Services - 0.2% |
The Western Union Co. 0.832% 3/7/13 (e) | | 530,000 | | 531,960 |
Office Electronics - 0.3% |
Xerox Corp.: | | | | |
1.0805% 5/16/14 (e) | | 435,000 | | 437,633 |
6.875% 8/15/11 | | 500,000 | | 501,049 |
| | 938,682 |
TOTAL INFORMATION TECHNOLOGY | | 3,474,964 |
TELECOMMUNICATION SERVICES - 1.4% |
Diversified Telecommunication Services - 1.4% |
Qwest Corp. 3.497% 6/15/13 (e) | | 1,000,000 | | 1,023,750 |
Verizon Communications, Inc. 0.8563% 3/28/14 (e) | | 2,500,000 | | 2,526,563 |
| | 3,550,313 |
Nonconvertible Bonds - continued |
| Principal Amount | | Value |
UTILITIES - 0.9% |
Multi-Utilities - 0.9% |
DTE Energy Co. 0.955% 6/3/13 (e) | | $ 443,000 | | $ 444,775 |
Sempra Energy 1.007% 3/15/14 (e) | | 2,000,000 | | 2,008,422 |
| | 2,453,197 |
TOTAL NONCONVERTIBLE BONDS (Cost $105,683,754) | 105,694,456 |
U.S. Government and Government Agency Obligations - 25.3% |
|
U.S. Government Agency Obligations - 24.0% |
Fannie Mae: | | | | |
1% 4/4/12 | | 39,000,000 | | 39,178,075 |
4.375% 9/15/12 | | 22,000,000 | | 22,988,130 |
TOTAL U.S. GOVERNMENT AGENCY OBLIGATIONS | | 62,166,205 |
Other Government Related - 1.3% |
Bank of America Corp. 0.5529% 4/30/12 (FDIC Guaranteed) (c)(e) | | 1,500,000 | | 1,504,335 |
Goldman Sachs Group, Inc. 0.5183% 11/9/11 (FDIC Guaranteed) (c)(e) | | 2,000,000 | | 2,001,518 |
TOTAL OTHER GOVERNMENT RELATED | | 3,505,853 |
TOTAL U.S. GOVERNMENT AND GOVERNMENT AGENCY OBLIGATIONS (Cost $65,664,913) | 65,672,058 |
U.S. Government Agency - Mortgage Securities - 2.8% |
|
Fannie Mae - 2.8% |
2.452% 2/1/34 (e) | | 317,877 | | 329,120 |
2.484% 6/1/35 (e) | | 435,114 | | 455,152 |
2.549% 7/1/35 (e) | | 863,939 | | 909,366 |
2.552% 12/1/34 (e) | | 603,751 | | 637,160 |
2.559% 6/1/35 (e) | | 1,092,648 | | 1,145,809 |
2.588% 10/1/35 (e) | | 1,171,448 | | 1,231,625 |
2.6% 7/1/34 (e) | | 508,358 | | 532,240 |
2.619% 11/1/34 (e) | | 542,232 | | 564,388 |
U.S. Government Agency - Mortgage Securities - continued |
| Principal Amount | | Value |
Fannie Mae - continued |
2.68% 11/1/34 (e) | | $ 597,785 | | $ 631,836 |
3.765% 10/1/39 (e) | | 832,648 | | 875,878 |
TOTAL U.S. GOVERNMENT AGENCY - MORTGAGE SECURITIES (Cost $7,128,104) | 7,312,574 |
Asset-Backed Securities - 18.4% |
|
ACE Securities Corp. Home Equity Loan Trust Series 2004-HE1 Class M1, 0.9373% 3/25/34 (e) | | 1,506 | | 1,500 |
Ally Auto Receivables Trust: | | | | |
Series 2009-B Class A2, 1.21% 6/15/12 (b) | | 91,264 | | 91,285 |
Series 2010-4 Class A2, 0.71% 2/15/13 | | 889,578 | | 889,718 |
Series 2011-1 Class A2, 0.81% 10/15/13 | | 996,688 | | 997,158 |
Ally Master Owner Trust: | | | | |
Series 2010-1 Class A, 1.9365% 1/15/15 (b)(e) | | 700,000 | | 711,894 |
Series 2011-1 Class A1, 1.0565% 1/15/16 (e) | | 500,000 | | 503,682 |
AmeriCredit Automobile Receivables Trust: | | | | |
Series 2007-AX Class A4, 0.2251% 10/6/13 (XL Capital Assurance, Inc. Insured) (e) | | 694,257 | | 689,904 |
Series 2007-CM Class A4B, 0.2651% 4/7/14 (National Public Finance Guarantee Corp. Insured) (e) | | 419,025 | | 415,851 |
Series 2010-3 Class A2, 0.77% 12/9/13 | | 669,344 | | 669,594 |
Series 2010-B Class A2, 1.18% 2/6/14 (Assured Guaranty Corp. Insured) | | 665,422 | | 664,823 |
Series 2011-1 Class A2, 0.84% 6/9/14 | | 1,000,000 | | 1,000,120 |
Series 2011-2 Class A2, 0.9% 9/8/14 | | 1,000,000 | | 1,001,191 |
Bank of America Auto Trust: | | | | |
Series 2009-1A Class A3, 2.67% 7/15/13 (b) | | 385,185 | | 387,498 |
Series 2010-2 Class A2, 0.91% 10/15/12 | | 194,122 | | 194,174 |
Bank One Issuance Trust Series 2003-A8, 0.4365% 5/16/16 (e) | | 500,000 | | 501,048 |
BMW Vehicle Lease Trust: | | | | |
Series 2010-1 Class A2, 0.58% 9/17/12 | | 591,188 | | 591,173 |
Series 2011-1 Class A2, 0.64% 4/22/13 | | 1,000,000 | | 1,000,132 |
Capital One Auto Finance Trust Series 2007-C Class A4, 5.23% 7/15/14 (FGIC Insured) | | 337,266 | | 343,715 |
Carmax Auto Owner Trust Series 2011-1 Class A2, 0.72% 11/15/13 | | 1,000,000 | | 1,000,371 |
Chase Issuance Trust: | | | | |
Series 2005-A2 Class A2, 0.2565% 12/15/14 (e) | | 1,600,000 | | 1,599,284 |
Series 2005-A6 Class A6, 0.2565% 7/15/14 (e) | | 1,730,000 | | 1,729,381 |
Asset-Backed Securities - continued |
| Principal Amount | | Value |
Chase Issuance Trust: - continued | | | | |
Series 2006-A4 Class A4, 0.2065% 10/15/13 (e) | | $ 1,000,000 | | $ 999,936 |
Series 2007-A17 Class A, 5.12% 10/15/14 | | 790,000 | | 833,315 |
Series 2009-A2 Class A2, 1.7365% 4/15/14 (e) | | 2,500,000 | | 2,527,028 |
Series 2011-A1 Class A1, 0.3765% 3/16/15 (e) | | 640,000 | | 639,969 |
Series 2011-A2 Class A2, 0.2753% 5/15/15 (e) | | 990,000 | | 989,948 |
Chrysler Financial Auto Securitization Trust Series 2010-A Class A2, 0.69% 1/8/13 | | 1,163,246 | | 1,163,371 |
Citibank Credit Card Issuance Trust: | | | | |
Series 2009-A1 Class A1, 1.9365% 3/17/14 (e) | | 4,350,000 | | 4,395,725 |
Series 2009-A2 Class A2, 1.7365% 5/15/14 (e) | | 1,500,000 | | 1,517,523 |
CitiFinancial Auto Issuance Trust Series 2009-1 Class A2, 1.83% 11/15/12 (b) | | 61,479 | | 61,526 |
Discover Card Master Trust Series 2011-A2 Class A2, 0.3998% 11/16/15 (e) | | 1,000,000 | | 999,947 |
Fannie Mae subordinate REMIC pass-thru certificates Series 2004-T5: | | | | |
Class AB1, 0.7634% 5/28/35 (e) | | 80,751 | | 59,727 |
Class AB3, 0.7053% 5/28/35 (e) | | 32,052 | | 22,459 |
Ford Credit Auto Lease Trust Series 2010-B Class A2, 0.75% 10/15/12 (b) | | 1,964,226 | | 1,964,807 |
Ford Credit Auto Lease Trust 2011-A Series 2011-A Class A2, 0.74% 9/15/13 | | 1,000,000 | | 999,788 |
Ford Credit Auto Owner Trust: | | | | |
Series 2009-D Class A3, 2.17% 10/15/13 | | 62,265 | | 62,768 |
Series 2010-B Class A2, 0.65% 12/15/12 | | 740,798 | | 740,998 |
Series 2011-B Class A2, 0.68% 1/15/14 | | 1,000,000 | | 1,002,610 |
Ford Credit Floorplan Master Owner Trust: | | | | |
Series 2010-1 Class A, 1.8365% 12/15/14 (b)(e) | | 490,000 | | 498,083 |
Series 2010-5 Class A1, 1.5% 9/15/15 | | 240,000 | | 241,859 |
Fremont Home Loan Trust Series 2005-A Class M4, 0.8673% 1/25/35 (e) | | 125,000 | | 35,238 |
GE Capital Credit Card Master Note Trust Series 2009-3 Class A, 2.54% 9/15/14 | | 1,000,000 | | 1,002,433 |
GSAMP Trust Series 2007-HE1 Class M1, 0.4373% 3/25/47 (e) | | 335,000 | | 16,480 |
Home Equity Asset Trust Series 2003-5 Class A2, 0.8873% 12/25/33 (e) | | 10,566 | | 7,593 |
Honda Auto Receivables Owner Trust Series 2011-2 Class A2, 0.57% 7/18/13 | | 1,000,000 | | 999,683 |
Hyundai Auto Receivables Trust: | | | | |
Series 2009-A Class A3, 2.03% 8/15/13 | | 94,492 | | 95,117 |
Series 2011-A Class A2, 0.69% 11/15/13 | | 1,000,000 | | 1,000,648 |
Asset-Backed Securities - continued |
| Principal Amount | | Value |
John Deere Owner Trust Series 2011-A Class A2, 0.64% 6/16/14 | | $ 2,000,000 | | $ 2,000,222 |
Mercedes-Benz Auto Lease Trust Series 2011-1A Class A2, 0.79% 4/15/13 (b) | | 1,000,000 | | 1,000,528 |
Mercedes-Benz Auto Receivables Trust Series 2009-1 Class A3, 1.67% 1/15/14 | | 139,959 | | 140,948 |
Merrill Lynch Mortgage Investors Trust Series 2004-HE2 Class A1B, 0.6573% 8/25/35 (e) | | 20,366 | | 16,389 |
Morgan Stanley ABS Capital I Trust Series 2004-HE6 Class A2, 0.5273% 8/25/34 (e) | | 65,756 | | 49,869 |
Nissan Auto Lease Trust: | | | | |
Series 2009-B Class A3, 2.07% 1/15/15 | | 91,431 | | 91,558 |
Series 2010-B Class A2, 0.9% 5/15/13 | | 994,169 | | 995,589 |
Series 2011-A Class A2, 0.7% 1/15/14 | | 1,000,000 | | 999,857 |
Nissan Auto Receivables Owner Trust Series 2011-A Class A2, 0.65% 12/16/13 | | 1,000,000 | | 1,002,314 |
Ocala Funding LLC Series 2006-1A Class A, 1.5863% 3/20/11 (a)(b)(e) | | 965,000 | | 0 |
Park Place Securities, Inc. Series 2004-WCW1 Class M4, 1.6373% 9/25/34 (e) | | 435,000 | | 151,586 |
Salomon Brothers Mortgage Securities VII, Inc. Series 2003-HE1 Class A, 0.9873% 4/25/33 (e) | | 1,451 | | 1,195 |
Santander Drive Auto Receivables Trust: | | | | |
Series 2010-3 Class A2, 0.93% 6/17/13 | | 500,000 | | 500,378 |
Series 2011-1, Class A2, 0.94% 2/18/14 | | 300,000 | | 299,815 |
Terwin Mortgage Trust Series 2003-4HE Class A1, 1.0473% 9/25/34 (e) | | 21,802 | | 16,046 |
USAA Auto Owner Trust Series 2010-1 Class A3, 1.3% 6/16/14 | | 703,196 | | 706,159 |
Volkswagen Auto Lease Trust: | | | | |
Series 2009-A Class A3, 3.41% 4/16/12 | | 114,735 | | 114,963 |
Series 2010-A Class A2, 0.77% 1/22/13 | | 882,847 | | 883,203 |
Wachovia Auto Owner Trust Series 2008-A Class A4B, 1.3363% 3/20/14 (e) | | 886,977 | | 892,052 |
TOTAL ASSET-BACKED SECURITIES (Cost $49,371,653) | 47,724,746 |
Collateralized Mortgage Obligations - 7.5% |
| Principal Amount | | Value |
Private Sponsor - 1.6% |
Arran Residential Mortgages Funding PLC floater Series 2011-1A Clasee A1C, 1.5372% 11/19/47 (b)(e) | | $ 500,000 | | $ 499,820 |
Gracechurch Mortgage Financing PLC floater Series 2007-1A Class 3A1, 0.34% 11/20/56 (b)(e) | | 391,190 | | 388,290 |
Granite Mortgages Series 2003-2 Class 1A3, 0.7513% 7/20/43 (e) | | 166,632 | | 159,258 |
Granite Mortgages PLC floater Series 2004-1 Class 2A1, 0.5665% 3/20/44 (e) | | 142,998 | | 135,955 |
GSR Mortgage Loan Trust floater Series 2004-11 Class 2A1, 0.5173% 12/25/34 (e) | | 260,902 | | 221,625 |
Holmes Master Issuer PLC floater Series 2007-2A Class 3A1, 0.3293% 7/15/21 (e) | | 280,000 | | 279,282 |
Permanent Master Issuer PLC floater Series 2007-1 Class 4A, 0.3293% 10/15/33 (e) | | 660,000 | | 656,530 |
TBW Mortgage-Backed pass-thru certificates floater Series 2006-4 Class A3, 0.3858% 9/25/36 (e) | | 1,000,000 | | 739,516 |
World Omni Auto Receivables Trust sequential payer Series 2011-A Class A2, 0.64% 11/15/13 | | 1,000,000 | | 1,000,159 |
TOTAL PRIVATE SPONSOR | | 4,080,435 |
U.S. Government Agency - 5.9% |
Fannie Mae subordinate REMIC pass-thru certificates: | | | | |
floater: | | | | |
Series 2008-76 Class EF, 0.6873% 9/25/23 (e) | | 77,440 | | 77,534 |
Series 2010-86 Class FE, 0.6373% 8/25/25 (d)(e) | | 698,683 | | 700,922 |
sequential payer: | | | | |
Series 2003-129 Class GF, 0.5873% 4/25/30 (e) | | 885,979 | | 887,482 |
Series 2005-47 Class HA, 4.5% 7/25/19 | | 1,288,722 | | 1,340,713 |
Series 2011-16 Class FB, 0.3373% 3/25/31 (e) | | 2,898,003 | | 2,891,833 |
Freddie Mac Multi-class participation certificates guaranteed: | | | | |
floater Series 3346 Class FA, 0.4165% 2/15/19 (e) | | 4,575,543 | | 4,582,502 |
planned amortization Series 3792, 0.5865% 11/15/40 (e) | | 966,254 | | 971,214 |
sequential payer: | | | | |
Series 2924 Class DA, 4.5% 2/15/19 | | 1,095,456 | | 1,138,823 |
Collateralized Mortgage Obligations - continued |
| Principal Amount | | Value |
U.S. Government Agency - continued |
Freddie Mac Multi-class participation certificates guaranteed: - continued | | | | |
Series 3560 Class LA, 2% 8/15/14 | | $ 1,253,006 | | $ 1,265,948 |
Series 3573 Class LC, 1.85% 8/15/14 | | 1,407,081 | | 1,422,834 |
TOTAL U.S. GOVERNMENT AGENCY | | 15,279,805 |
TOTAL COLLATERALIZED MORTGAGE OBLIGATIONS (Cost $19,659,885) | 19,360,240 |
Commercial Mortgage Securities - 2.6% |
|
Banc of America Commercial Mortgage, Inc. sequential payer Series 2007-1 Class A2, 5.381% 1/15/49 | | 1,469,410 | | 1,476,261 |
Banc of America Large Loan, Inc. floater: | | | | |
Series 2005-MIB1: | | | | |
Class G, 0.7165% 3/15/22 (b)(e) | | 100,000 | | 94,250 |
Class H, 0.9665% 3/15/22 (b)(e) | | 110,000 | | 100,650 |
Series 2006-BIX1 Class B, 0.3265% 10/15/19 (b)(e) | | 110,000 | | 109,465 |
COMM pass-thru certificates floater: | | | | |
Series 2005-F10A Class B, 0.4165% 4/15/17 (b)(e) | | 110,000 | | 105,624 |
Series 2006-CN2A Class A2FL, 0.4051% 2/5/19 (b)(e) | | 800,000 | | 789,438 |
Credit Suisse Commercial Mortgage Trust sequential payer Series 2007-C3 Class A2, 5.905% 6/15/39 (e) | | 229,781 | | 233,376 |
Credit Suisse First Boston Mortgage Securities Corp. Series 2003-C4 Class A4, 5.137% 8/15/36 | | 240,000 | | 253,719 |
GMAC Commercial Mortgage Securities, Inc. sequential payer Series 2003-C2 Class A2, 5.6539% 5/10/40 (e) | | 120,000 | | 128,259 |
Greenwich Capital Commercial Funding Corp. sequential payer Series 2005-GG3 Class A2, 4.305% 8/10/42 (e) | | 1,170,220 | | 1,171,969 |
GS Mortgage Securities Corp. II sequential payer Series 2005-GG4 Class A3, 4.607% 7/10/39 | | 150,000 | | 151,979 |
GS Mortgage Securities Trust sequential payer Series 2006-GG8 Class A2, 5.479% 11/10/39 | | 292,841 | | 293,240 |
JP Morgan Chase Commercial Mortgage Securities Corp.: | | | | |
sequential payer Series 2003-C1 Class A2, 4.985% 1/12/37 | | 130,000 | | 135,442 |
Series 2003-CB7 Class A4, 4.879% 1/12/38 (e) | | 109,113 | | 115,764 |
Commercial Mortgage Securities - continued |
| Principal Amount | | Value |
JP Morgan Chase Commercial Mortgage Securities Trust sequential payer Series 2005-LDP5 Class A2, 5.198% 12/15/44 | | $ 240,000 | | $ 243,317 |
JPMorgan Chase Commercial Mortgage Securities Trust sequential payer Series 2007-LD11 Class A2, 5.9896% 6/15/49 (e) | | 240,000 | | 245,075 |
Morgan Stanley Capital I Trust: | | | | |
floater: | | | | |
Series 2006-XLF Class C, 1.387% 7/15/19 (b)(e) | | 247,826 | | 148,696 |
Series 2007-XLFA Class B, 0.317% 10/15/20 (b)(e) | | 440,000 | | 407,780 |
sequential payer Series 2003-IQ4 Class A2, 4.07% 5/15/40 | | 85,719 | | 88,674 |
Morgan Stanley Dean Witter Capital I Trust sequential payer Series 2003-T11 Class A4, 5.15% 6/13/41 | | 110,000 | | 116,282 |
Wachovia Bank Commercial Mortgage Trust floater Series 2006-WL7A Class A1, 0.2771% 9/15/21 (b)(e) | | 455,539 | | 439,285 |
TOTAL COMMERCIAL MORTGAGE SECURITIES (Cost $7,280,316) | 6,848,545 |
Municipal Securities - 0.6% |
|
Indiana Fin. Auth.'s Econ. Dev. Bonds (Republic Svcs., Inc. Proj.) Series A, 1.25%, tender 9/1/11 (e)(f) | | 400,000 | | 400,020 |
Louisville/Jefferson County Metropolitan Govt. Poll. Cont. Rev. Bonds (Louisville Gas and Electronic Co. Proj.): | | | | |
Series 2003 A, 1.9%, tender 4/2/12 (e) | | 500,000 | | 503,300 |
Series 2007 B, 1.9%, tender 6/1/12 (e) | | 500,000 | | 503,990 |
Pennsylvania Econ. Dev. Fing. Auth. Solid Waste Disp. Rev. Bonds (Republic Svcs., Inc. Proj.) Series 2010 A, 1.25%, tender 10/3/11 (e)(f) | | 100,000 | | 100,006 |
TOTAL MUNICIPAL SECURITIES (Cost $1,500,000) | 1,507,316 |
Bank Notes - 0.8% |
|
National City Bank, Cleveland 0.3539% 3/1/13 (e)
(Cost $1,979,328) | | 2,000,000 | | 1,991,966 |
Certificates of Deposit - 0.4% |
| Principal Amount | | Value |
Nordea Bank Finland PLC yankee 0.7483% 2/7/13 (e)
(Cost $1,001,117) | | $ 1,000,000 | | $ 1,002,111 |
Cash Equivalents - 0.5% |
| Maturity Amount | | |
Investments in repurchase agreements in a joint trading account at 0.17%, dated 7/29/11 due 8/1/11 (Collateralized by U.S. Government Obligations) #
(Cost $1,268,000) | $ 1,268,018 | | 1,268,000 |
TOTAL INVESTMENT PORTFOLIO - 99.7% (Cost $260,537,070) | 258,382,012 |
NET OTHER ASSETS (LIABILITIES) - 0.3% | | 837,076 |
NET ASSETS - 100% | $ 259,219,088 |
Futures Contracts |
| Expiration Date | | Underlying Face Amount at Value | | Unrealized Appreciation/
(Depreciation) |
Purchased |
Eurodollar Contracts |
10 Eurodollar 90 Day Index Contracts | Dec. 2011 | | $ 9,987,625 | | $ (1,276) |
10 Eurodollar 90 Day Index Contracts | March 2012 | | 9,986,625 | | (1,651) |
10 Eurodollar 90 Day Index Contracts | Sept. 2011 | | 9,990,625 | | 2,975 |
TOTAL EURODOLLAR CONTRACTS | | $ 29,964,875 | | $ 48 |
Legend |
(a) Non-income producing - Security is in default. |
(b) Security exempt from registration under Rule 144A of the Securities Act of 1933. These securities may be resold in transactions exempt from registration, normally to qualified institutional buyers. At the end of the period, the value of these securities amounted to $31,071,008 or 12.0% of net assets. |
(c) Under the Temporary Liquidity Guarantee Program, the Federal Deposit Insurance Corporation guarantees principal and interest in the event of payment default or bankruptcy until the earlier of maturity date of the debt or until June 30, 2012. At the end of the period these securities amounted to $3,505,853 or 1.3% of net assets. |
(d) Security or a portion of the security was pledged to cover margin requirements for futures contracts. At the period end, the value of securities pledged amounted to $30,096. |
(e) Coupon rates for floating and adjustable rate securities reflect the rates in effect at period end. |
(f) Private activity obligations whose interest is subject to the federal alternative minimum tax for individuals. |
# Additional information on each counterparty to the repurchase agreement is as follows: |
Repurchase Agreement / Counterparty | Value |
$1,268,000 due 8/01/11 at 0.17% |
Bank of America NA | $ 917,336 |
J.P. Morgan Securities, Inc. | 34,291 |
Mizuho Securities USA, Inc. | 316,373 |
| $ 1,268,000 |
Other Information |
The following is a summary of the inputs used, as of July 31, 2011, involving the Fund's assets and liabilities carried at fair value. The inputs or methodology used for valuing securities may not be an indication of the risk associated with investing in those securities. For more information on valuation inputs, and their aggregation into the levels used in the tables below, please refer to the Security Valuation section in the accompanying Notes to Financial Statements. |
Valuation Inputs at Reporting Date: |
Description | Total | Level 1 | Level 2 | Level 3 |
Investments in Securities: | | | | |
Corporate Bonds | $ 105,694,456 | $ - | $ 105,694,456 | $ - |
U.S. Government and Government Agency Obligations | 65,672,058 | - | 65,672,058 | - |
U.S. Government Agency - Mortgage Securities | 7,312,574 | - | 7,312,574 | - |
Asset-Backed Securities | 47,724,746 | - | 47,475,001 | 249,745 |
Collateralized Mortgage Obligations | 19,360,240 | - | 19,360,240 | - |
Commercial Mortgage Securities | 6,848,545 | - | 6,292,069 | 556,476 |
Municipal Securities | 1,507,316 | - | 1,507,316 | - |
Bank Notes | 1,991,966 | - | 1,991,966 | - |
Certificates of Deposit | 1,002,111 | - | 1,002,111 | - |
Cash Equivalents | 1,268,000 | - | 1,268,000 | - |
Total Investments in Securities: | $ 258,382,012 | $ - | $ 257,575,791 | $ 806,221 |
Derivative Instruments: | | | | |
Assets | | | | |
Futures Contracts | $ 2,975 | $ 2,975 | $ - | $ - |
Liabilities | | | | |
Futures Contracts | $ (2,927) | $ (2,927) | $ - | $ - |
Total Derivative Instruments: | $ 48 | $ 48 | $ - | $ - |
The following is a reconciliation of Investments in Securities for which Level 3 inputs were used in determining value: |
Investments in Securities: | |
Beginning Balance | $ 583,242 |
Total Realized Gain (Loss) | (1,553,394) |
Total Unrealized Gain (Loss) | 2,131,415 |
Cost of Purchases | 2,324 |
Proceeds of Sales | (786,299) |
Amortization/Accretion | (24,596) |
Transfers in to Level 3 | 453,529 |
Transfers out of Level 3 | - |
Ending Balance | $ 806,221 |
The change in unrealized gain (loss) for the period attributable to Level 3 securities held at July 31, 2011 | $ 1,848 |
The information used in the above reconciliation represents fiscal year to date activity for any Investments in Securities identified as using Level 3 inputs at either the beginning or the end of the current fiscal period. Transfers in or out of Level 3 represent the beginning value of any Security or Instrument where a change in the pricing level occurred from the beginning to the end of the period. The cost of purchases and the proceeds of sales may include securities received or delivered through corporate actions or exchanges. Realized and unrealized gains (losses) disclosed in the reconciliation are included in Net Gain (Loss) on the Fund's Statement of Operations. |
Value of Derivative Instruments |
The following table is a summary of the Fund's value of derivative instruments by risk exposure as of July 31, 2011. For additional information on derivative instruments, please refer to the Derivative Instruments section in the accompanying Notes to Financial Statements. |
Risk Exposure /
Derivative Type | Value |
| Asset | Liability |
Interest Rate Risk | | |
Futures Contracts (a) | $ 2,975 | $ (2,927) |
Total Value of Derivatives | $ 2,975 | $ (2,927) |
(a) Reflects cumulative appreciation/(depreciation) on futures contracts as disclosed on the Schedule of Investments. Only the period end variation margin is separately disclosed on the Statement of Assets and Liabilities. |
Other Information |
Distribution of investments by country of issue, as a percentage of total net assets, is as follows: (Unaudited) |
United States of America | 83.9% |
Canada | 3.5% |
Netherlands | 3.5% |
United Kingdom | 2.6% |
France | 2.0% |
Australia | 1.8% |
Sweden | 1.0% |
Others (Individually Less Than 1%) | 1.7% |
| 100.0% |
Income Tax Information |
At July 31, 2011, the Fund had a capital loss carryforward of approximately $125,615,360 of which $1,917,431, $518,690, $12,186,304, $97,397,499, $9,829,719 and $3,765,717 will expire in fiscal 2014, 2015, 2016, 2017, 2018 and 2019, respectively. Capital loss carryforwards are only available to offset future capital gains of the Fund to the extent provided by regulations and may be limited. |
See accompanying notes which are an integral part of the financial statements.
Annual Report
Statement of Assets and Liabilities
| July 31, 2011 |
| | |
Assets | | |
Investment in securities, at value (including repurchase agreements of $1,268,000) - See accompanying schedule: Unaffiliated issuers (cost $260,537,070) | | $ 258,382,012 |
Cash | | 860 |
Receivable for investments sold | | 585 |
Receivable for fund shares sold | | 724,672 |
Interest receivable | | 821,093 |
Receivable for daily variation margin on futures contracts | | 125 |
Other receivables | | 27 |
Total assets | | 259,929,374 |
| | |
Liabilities | | |
Payable for fund shares redeemed | $ 608,179 | |
Distributions payable | 1,722 | |
Accrued management fee | 68,236 | |
Distribution and service plan fees payable | 2,077 | |
Other affiliated payables | 30,072 | |
Total liabilities | | 710,286 |
| | |
Net Assets | | $ 259,219,088 |
Net Assets consist of: | | |
Paid in capital | | $ 388,425,175 |
Distributions in excess of net investment income | | (61,884) |
Accumulated undistributed net realized gain (loss) on investments | | (126,989,194) |
Net unrealized appreciation (depreciation) on investments | | (2,155,009) |
Net Assets | | $ 259,219,088 |
See accompanying notes which are an integral part of the financial statements.
Annual Report
Statement of Assets and Liabilities - continued
| July 31, 2011 |
| | |
Calculation of Maximum Offering Price
Class A:
Net Asset Value and redemption price per share
($12,241,589 ÷ 1,492,766 shares) | | $ 8.20 |
| | |
Maximum offering price per share (100/98.50 of $8.20) | | $ 8.32 |
Class T:
Net Asset Value and redemption price per share ($4,811,352 ÷ 586,661 shares) | | $ 8.20 |
| | |
Maximum offering price per share (100/98.50 of $8.20) | | $ 8.32 |
Ultra-Short Bond:
Net Asset Value, offering price and redemption price per share ($239,921,423 ÷ 29,253,153 shares) | | $ 8.20 |
| | |
Institutional Class:
Net Asset Value, offering price and redemption price per share ($2,244,724 ÷ 273,711 shares) | | $ 8.20 |
See accompanying notes which are an integral part of the financial statements.
Annual Report
Financial Statements - continued
Statement of Operations
| Year ended July 31, 2011 |
| | |
Investment Income | | |
Interest | | $ 2,092,565 |
| | |
Expenses | | |
Management fee | $ 833,807 | |
Transfer agent fees | 273,052 | |
Distribution and service plan fees | 28,129 | |
Fund wide operations fee | 90,596 | |
Independent trustees' compensation | 962 | |
Miscellaneous | 895 | |
Total expenses before reductions | 1,227,441 | |
Expense reductions | (135) | 1,227,306 |
Net investment income (loss) | | 865,259 |
Realized and Unrealized Gain (Loss) Net realized gain (loss) on: | | |
Investment securities: | | |
Unaffiliated issuers | (1,589,005) | |
Futures contracts | 32,980 | |
Total net realized gain (loss) | | (1,556,025) |
Change in net unrealized appreciation (depreciation) on: Investment securities | 3,156,644 | |
Futures contracts | (15,646) | |
Total change in net unrealized appreciation (depreciation) | | 3,140,998 |
Net gain (loss) | | 1,584,973 |
Net increase (decrease) in net assets resulting from operations | | $ 2,450,232 |
See accompanying notes which are an integral part of the financial statements.
Annual Report
Statement of Changes in Net Assets
| Year ended
July 31,
2011 | Year ended
July 31,
2010 |
Increase (Decrease) in Net Assets | | |
Operations | | |
Net investment income (loss) | $ 865,259 | $ 1,890,067 |
Net realized gain (loss) | (1,556,025) | (8,164,438) |
Change in net unrealized appreciation (depreciation) | 3,140,998 | 9,508,825 |
Net increase (decrease) in net assets resulting
from operations | 2,450,232 | 3,234,454 |
Distributions to shareholders from net investment income | (936,826) | (1,887,049) |
Share transactions - net increase (decrease) | (6,245,769) | 33,525,237 |
Redemption fees | 16,839 | 9,556 |
Total increase (decrease) in net assets | (4,715,524) | 34,882,198 |
| | �� |
Net Assets | | |
Beginning of period | 263,934,612 | 229,052,414 |
End of period (including distributions in excess of net investment income of $(61,884) and undistributed net investment income of $11,746, respectively) | $ 259,219,088 | $ 263,934,612 |
See accompanying notes which are an integral part of the financial statements.
Annual Report
Financial Highlights - Class A
Years ended July 31, | 2011 | 2010 | 2009 | 2008 | 2007 |
Selected Per-Share Data | | | | | |
Net asset value, beginning of period | $ 8.15 | $ 8.11 | $ 8.26 | $ 9.82 | $ 10.02 |
Income from Investment Operations | | | | | |
Net investment income (loss) C | .013 | .047 | .091 | .384 | .493 |
Net realized and unrealized gain (loss) | .051 | .040 | (.167) | (1.612) | (.198) |
Total from investment operations | .064 | .087 | (.076) | (1.228) | .295 |
Distributions from net investment income | (.015) | (.047) | (.071) | (.294) | (.495) |
Tax return of capital | - | - | (.003) | (.039) | - |
Total distributions | (.015) | (.047) | (.074) | (.333) | (.495) |
Redemption fees added to paid in capital C | .001 | - E | - E | .001 | - E |
Net asset value, end of period | $ 8.20 | $ 8.15 | $ 8.11 | $ 8.26 | $ 9.82 |
Total Return A,B | .80% | 1.08% | (.92)% | (12.71)% | 2.97% |
Ratios to Average Net Assets D | | | | | |
Expenses before reductions | .63% | .64% | .68% | .67% | .66% |
Expenses net of fee waivers, if any | .63% | .64% | .68% | .67% | .66% |
Expenses net of all reductions | .63% | .64% | .67% | .66% | .66% |
Net investment income (loss) | .16% | .58% | 1.13% | 4.26% | 4.96% |
Supplemental Data | | | | | |
Net assets, end of period (000 omitted) | $ 12,242 | $ 18,129 | $ 8,033 | $ 6,268 | $ 13,735 |
Portfolio turnover rate | 103% | 95% | 92% | 11% | 29% |
A Total returns would have been lower if certain expenses had not been reduced during the applicable periods shown.
B Total returns do not include the effect of the sales charges.
C Calculated based on average shares outstanding during the period.
D Expense ratios reflect operating expenses of the class. Expenses before reductions do not reflect amounts reimbursed by the investment adviser or reductions from expense offset arrangements and do not represent the amount paid by the class during periods when reimbursements or reductions occur. Expenses net of fee waivers reflect expenses after reimbursement by the investment adviser but prior to reductions from expense offset arrangements. Expenses net of all reductions represent the net expenses paid by the class.
E Amount represents less than $.001 per share.
See accompanying notes which are an integral part of the financial statements.
Annual Report
Financial Highlights - Class T
Years ended July 31, | 2011 | 2010 | 2009 | 2008 | 2007 |
Selected Per-Share Data | | | | | |
Net asset value, beginning of period | $ 8.15 | $ 8.11 | $ 8.26 | $ 9.82 | $ 10.02 |
Income from Investment Operations | | | | | |
Net investment income (loss) C | .009 | .044 | .090 | .377 | .491 |
Net realized and unrealized gain (loss) | .052 | .040 | (.168) | (1.607) | (.199) |
Total from investment operations | .061 | .084 | (.078) | (1.230) | .292 |
Distributions from net investment income | (.012) | (.044) | (.069) | (.292) | (.492) |
Tax return of capital | - | - | (.003) | (.039) | - |
Total distributions | (.012) | (.044) | (.072) | (.331) | (.492) |
Redemption fees added to paid in capital C | .001 | - E | - E | .001 | - E |
Net asset value, end of period | $ 8.20 | $ 8.15 | $ 8.11 | $ 8.26 | $ 9.82 |
Total Return A,B | .76% | 1.03% | (.94)% | (12.72)% | 2.95% |
Ratios to Average Net Assets D | | | | | |
Expenses before reductions | .68% | .68% | .69% | .69% | .69% |
Expenses net of fee waivers, if any | .68% | .68% | .69% | .69% | .69% |
Expenses net of all reductions | .68% | .68% | .69% | .69% | .69% |
Net investment income (loss) | .12% | .54% | 1.11% | 4.23% | 4.93% |
Supplemental Data | | | | | |
Net assets, end of period (000 omitted) | $ 4,811 | $ 5,334 | $ 3,114 | $ 2,910 | $ 4,818 |
Portfolio turnover rate | 103% | 95% | 92% | 11% | 29% |
A Total returns would have been lower if certain expenses had not been reduced during the applicable periods shown.
B Total returns do not include the effect of the sales charges.
C Calculated based on average shares outstanding during the period.
D Expense ratios reflect operating expenses of the class. Expenses before reductions do not reflect amounts reimbursed by the investment adviser or reductions from expense offset arrangements and do not represent the amount paid by the class during periods when reimbursements or reductions occur. Expenses net of fee waivers reflect expenses after reimbursement by the investment adviser but prior to reductions from expense offset arrangements. Expenses net of all reductions represent the net expenses paid by the class.
E Amount represents less than $.001 per share.
See accompanying notes which are an integral part of the financial statements.
Annual Report
Financial Highlights - Ultra-Short Bond
Years ended July 31, | 2011 | 2010 | 2009 | 2008 | 2007 |
Selected Per-Share Data | | | | | |
Net asset value, beginning of period | $ 8.15 | $ 8.11 | $ 8.26 | $ 9.81 | $ 10.02 |
Income from Investment Operations | | | | | |
Net investment income (loss) B | .028 | .063 | .111 | .404 | .516 |
Net realized and unrealized gain (loss) | .051 | .040 | (.169) | (1.603) | (.210) |
Total from investment operations | .079 | .103 | (.058) | (1.199) | .306 |
Distributions from net investment income | (.030) | (.063) | (.088) | (.310) | (.516) |
Tax return of capital | - | - | (.004) | (.042) | - |
Total distributions | (.030) | (.063) | (.092) | (.352) | (.516) |
Redemption fees added to paid in capital B | .001 | - D | - D | .001 | - D |
Net asset value, end of period | $ 8.20 | $ 8.15 | $ 8.11 | $ 8.26 | $ 9.81 |
Total Return A | .99% | 1.27% | (.70)% | (12.42)% | 3.09% |
Ratios to Average Net Assets C | | | | | |
Expenses before reductions | .45% | .45% | .45% | .45% | .45% |
Expenses net of fee waivers, if any | .45% | .45% | .45% | .45% | .45% |
Expenses net of all reductions | .45% | .45% | .44% | .45% | .45% |
Net investment income (loss) | .34% | .77% | 1.36% | 4.47% | 5.17% |
Supplemental Data | | | | | |
Net assets, end of period (000 omitted) | $ 239,921 | $ 239,266 | $ 217,282 | $ 315,401 | $ 974,602 |
Portfolio turnover rate | 103% | 95% | 92% | 11% | 29% |
A Total returns would have been lower if certain expenses had not been reduced during the applicable periods shown.
B Calculated based on average shares outstanding during the period.
C Expense ratios reflect operating expenses of the class. Expenses before reductions do not reflect amounts reimbursed by the investment adviser or reductions from expense offset arrangements and do not represent the amount paid by the class during periods when reimbursements or reductions occur. Expenses net of fee waivers reflect expenses after reimbursement by the investment adviser but prior to reductions from expense offset arrangements. Expenses net of all reductions represent the net expenses paid by the class.
D Amount represents less than $.001 per share.
See accompanying notes which are an integral part of the financial statements.
Annual Report
Financial Highlights - Institutional Class
Years ended July 31, | 2011 | 2010 | 2009 | 2008 | 2007 |
Selected Per-Share Data | | | | | |
Net asset value, beginning of period | $ 8.15 | $ 8.11 | $ 8.26 | $ 9.81 | $ 10.02 |
Income from Investment Operations | | | | | |
Net investment income (loss) B | .025 | .057 | .102 | .416 | .510 |
Net realized and unrealized gain (loss) | .051 | .040 | (.168) | (1.619) | (.206) |
Total from investment operations | .076 | .097 | (.066) | (1.203) | .304 |
Distributions from net investment income | (.027) | (.057) | (.081) | (.306) | (.514) |
Tax return of capital | - | - | (.003) | (.042) | - |
Total distributions | (.027) | (.057) | (.084) | (.348) | (.514) |
Redemption fees added to paid in capital B | .001 | - D | - D | .001 | - D |
Net asset value, end of period | $ 8.20 | $ 8.15 | $ 8.11 | $ 8.26 | $ 9.81 |
Total Return A | .95% | 1.20% | (.80)% | (12.46)% | 3.06% |
Ratios to Average Net Assets C | | | | | |
Expenses before reductions | .49% | .52% | .58% | .48% | .48% |
Expenses net of fee waivers, if any | .49% | .52% | .55% | .48% | .48% |
Expenses net of all reductions | .49% | .52% | .54% | .48% | .48% |
Net investment income (loss) | .31% | .70% | 1.26% | 4.44% | 5.14% |
Supplemental Data | | | | | |
Net assets, end of period (000 omitted) | $ 2,245 | $ 1,206 | $ 623 | $ 594 | $ 8,312 |
Portfolio turnover rate | 103% | 95% | 92% | 11% | 29% |
A Total returns would have been lower if certain expenses had not been reduced during the applicable periods shown.
B Calculated based on average shares outstanding during the period.
C Expense ratios reflect operating expenses of the class. Expenses before reductions do not reflect amounts reimbursed by the investment adviser or reductions from expense offset arrangements and do not represent the amount paid by the class during periods when reimbursements or reductions occur. Expenses net of fee waivers reflect expenses after reimbursement by the investment adviser but prior to reductions from expense offset arrangements. Expenses net of all reductions represent the net expenses paid by the class.
D Amount represents less than $.001 per share.
See accompanying notes which are an integral part of the financial statements.
Annual Report
Notes to Financial Statements
For the period ended July 31, 2011
1. Organization.
Fidelity Ultra-Short Bond Fund (the Fund) is a fund of Fidelity Income Fund (the Trust) and is authorized to issue an unlimited number of shares. The Trust is registered under the Investment Company Act of 1940, as amended (the 1940 Act), as an open-end management investment company organized as a Massachusetts business trust. The Fund offers Class A, Class T, Ultra-Short Bond Class and Institutional Class shares, each of which has equal rights as to assets and voting privileges. Each class has exclusive voting rights with respect to matters that affect that class. Investment income, realized and unrealized capital gains and losses, the common expenses of the Fund, and certain fund-level expense reductions, if any, are allocated on a pro-rata basis to each class based on the relative net assets of each class to the total net assets of the Fund. Each class differs with respect to transfer agent and distribution and service plan fees incurred. Certain expense reductions may also differ by class.
2. Significant Accounting Policies.
The financial statements have been prepared in conformity with accounting principles generally accepted in the United States of America (GAAP), which require management to make certain estimates and assumptions at the date of the financial statements. Actual results could differ from those estimates. Subsequent events, if any, through the date that the financial statements were issued have been evaluated in the preparation of the financial statements. The following summarizes the significant accounting policies of the Fund:
Security Valuation. Investments are valued as of 4:00 p.m. Eastern time on the last calendar day of the period. The Fund uses independent pricing services approved by the Board of Trustees to value its investments. When current market prices or quotations are not readily available or reliable, valuations may be determined in good faith in accordance with procedures adopted by the Board of Trustees. Factors used in determining value may include market or security specific events, changes in interest rates and credit quality. The frequency with which these procedures are used cannot be predicted and they may be utilized to a significant extent. The value used for net asset value (NAV) calculation under these procedures may differ from published prices for the same securities.
The Fund categorizes the inputs to valuation techniques used to value its investments into a disclosure hierarchy consisting of three levels as shown below:
Level 1 - quoted prices in active markets for identical investments
Level 2 - other significant observable inputs (including quoted prices for similar investments, interest rates, prepayment speeds, etc.)
Level 3 - unobservable inputs (including the Fund's own assumptions based on the best information available)
Annual Report
2. Significant Accounting Policies - continued
Security Valuation - continued
Changes in valuation techniques may result in transfers in or out of an assigned level within the disclosure hierarchy. The aggregate value of investments by input level, as of July 31, 2011 for the Fund's investments, as well as a roll forward of Level 3 securities, is included at the end of the Fund's Schedule of Investments. Valuation techniques used to value the Fund's investments by major category are as follows:
Debt securities, including restricted securities, are valued based on evaluated prices received from independent pricing services or from dealers who make markets in such securities. For corporate bonds, bank notes, U.S. government and government agency obligations and certificates of deposit, pricing services utilize matrix pricing which considers yield or price of bonds of comparable quality, coupon, maturity and type as well as dealer supplied prices and are generally categorized as Level 2 in the hierarchy. For asset backed securities, collateralized mortgage obligations, commercial mortgage securities and U.S. government agency mortgage securities, pricing services utilize matrix pricing which considers prepayment speed assumptions, attributes of the collateral, yield or price of bonds of comparable quality, coupon, maturity and type as well as dealer supplied prices and, accordingly, such securities are generally categorized as Level 2 in the hierarchy.
When independent prices are unavailable or unreliable, debt securities may be valued utilizing pricing matrices which consider similar factors that would be used by independent pricing services. These are generally categorized as Level 2 in the hierarchy but may be Level 3 depending on the circumstances.
Short-term securities with remaining maturities of sixty days or less may be valued at amortized cost, which approximates fair value, and are categorized as Level 2 in the hierarchy.
Futures contracts are valued at the settlement price established each day by the board of trade or exchange on which they are traded and are categorized as Level 1 in the hierarchy.
Investment Transactions and Income. For financial reporting purposes, the Fund's investment holdings and NAV include trades executed through the end of the last business day of the period. The NAV per share for processing shareholder transactions is calculated as of the close of business of the New York Stock Exchange (NYSE), normally 4:00 p.m. Eastern time and includes trades executed through the end of the prior business day. Gains and losses on securities sold are determined on the basis of identified cost. Interest income is accrued as earned. Interest income includes coupon interest and amortization of premium and accretion of discount on debt securities. The principal value on inflation-indexed securities is periodically adjusted to the rate of inflation and
Annual Report
Notes to Financial Statements - continued
2. Significant Accounting Policies - continued
Investment Transactions and Income - continued
interest is accrued based on the principal value. The adjustments to principal due to inflation are reflected as increases or decreases to interest income even though principal is not received until maturity. Debt obligations may be placed on non-accrual status and related interest income may be reduced by ceasing current accruals and writing off interest receivables when the collection of all or a portion of interest has become doubtful based on consistently applied procedures. A debt obligation is removed from non-accrual status when the issuer resumes interest payments or when collectability of interest is reasonably assured.
Expenses. Expenses directly attributable to a fund are charged to that fund. Expenses attributable to more than one fund are allocated among the respective funds on the basis of relative net assets or other appropriate methods. Expense estimates are accrued in the period to which they relate and adjustments are made when actual amounts are known.
Income Tax Information and Distributions to Shareholders. Each year, the Fund intends to qualify as a regulated investment company, including distributing substantially all of its taxable income and realized gains under Subchapter M of the Internal Revenue Code and filing its U.S. federal tax return. As a result, no provision for income taxes is required. As of July 31, 2011, the Fund did not have any unrecognized tax benefits in the financial statements. A fund's federal tax return is subject to examination by the Internal Revenue Service (IRS) for a period of three years.
Dividends are declared and recorded daily and paid monthly from net investment income. Distributions from realized gains, if any, are declared and recorded on the ex-dividend date. Income dividends and capital gain distributions are declared separately for each class. Income and capital gain distributions are determined in accordance with income tax regulations, which may differ from GAAP.
Capital accounts within the financial statements are adjusted for permanent book-tax differences. These adjustments have no impact on net assets or the results of operations. Temporary book-tax differences will reverse in a subsequent period.
Book-tax differences are primarily due to futures transactions, premium on debt securities, market discount, capital loss carryforwards and losses deferred due to excise tax regulations.
Annual Report
2. Significant Accounting Policies - continued
Income Tax Information and Distributions to Shareholders - continued
The federal tax cost of investment securities and unrealized appreciation (depreciation) as of period end were as follows:
Gross unrealized appreciation | $ 526,666 |
Gross unrealized depreciation | (2,698,472) |
Net unrealized appreciation (depreciation) on securities and other investments | $ (2,171,806) |
| |
Tax Cost | $ 260,553,818 |
The tax-based components of distributable earnings as of period end were as follows:
Capital loss carryforward | $ (125,615,360) |
Net unrealized appreciation (depreciation) | $ (2,171,806) |
Under the recently enacted Regulated Investment Company Modernization Act of 2010 (the Act), the Fund will be permitted to carry forward capital losses incurred in taxable years beginning after December 22, 2010 for an unlimited period. However, any losses incurred during those future taxable years will be required to be utilized prior to any losses incurred in pre-enactment taxable years, which generally expire after eight years from when they are incurred. Additionally, post-enactment capital losses that are carried forward will retain their character as either short-term or long-term capital losses rather than being considered all short-term as under previous law. The Fund's first fiscal year end subject to the Act will be July 31, 2012.
The tax character of distributions paid was as follows:
| July 31, 2011 | July 31, 2010 |
Ordinary Income | $ 936,826 | $ 1,887,049 |
Short-Term Trading (Redemption) Fees. Shares held by investors in the Fund less than 60 days are subject to a redemption fee equal to .25% of the net asset value of shares redeemed. All redemption fees, which reduce the proceeds of the shareholder redemption, are retained by the Fund and accounted for as an addition to paid in capital.
Annual Report
Notes to Financial Statements - continued
2. Significant Accounting Policies - continued
New Accounting Pronouncements. In May 2011, the Financial Accounting Standards Board (FASB) issued an update to Topic 860 - Transfers and Servicing. The update clarifies the assessment of effective control by removing the collateral provision requirement that the seller maintains at all times collateral sufficient to fund substantially all of the cost of purchasing replacement financial assets from others. This may result in a change in accounting treatment from purchases and sales to secured borrowings for certain mortgage dollar roll transactions, and therefore separate accounting of the income and expenses associated with the secured borrowings. This change would have no effect on the net assets or total return of the Fund. The update is effective for transactions entered into on or after December 15, 2011. Management is currently evaluating the potential impact of the update on the accounting for mortgage dollar roll transactions entered into by the Fund. Also in May 2011, the FASB issued Accounting Standard Update No. 2011-04, Fair Value Measurement (Topic 820) - Amendments to Achieve Common Fair Value Measurement and Disclosure Requirements in U.S. GAAP and IFRSs. The update changes the wording used to describe the requirements in GAAP for measuring fair value and for disclosing information about fair value measurements. The update is effective during interim and annual periods beginning after December 15, 2011. Management is currently evaluating the impact of the update's adoption on the Fund's financial statement disclosures.
3. Operating Policies.
Repurchase Agreements. Fidelity Management & Research Company (FMR) has received an Exemptive Order from the Securities and Exchange Commission (the SEC) which permits the Fund and other affiliated entities of FMR to transfer uninvested cash balances into joint trading accounts which are then invested in repurchase agreements. The Fund may also invest directly with institutions in repurchase agreements. Repurchase agreements are collateralized by government or non-government securities. Upon settlement date, collateral is held in segregated accounts with custodian banks and may be obtained in the event of a default of the counterparty. The Fund monitors, on a daily basis, the value of the collateral to ensure it is at least equal to the principal amount of the repurchase agreement (including accrued interest). In the event of a default by the counterparty, realization of the collateral proceeds could be delayed, during which time the value of the collateral may decline.
Restricted Securities. The Fund may invest in securities that are subject to legal or contractual restrictions on resale. These securities generally may be resold in transactions exempt from registration or to the public if the securities are registered. Disposal of these securities may involve time-consuming negotiations and expense, and prompt sale at an acceptable price may be difficult. Information regarding restricted securities is included at the end of the Fund's Schedule of Investments.
Annual Report
4. Derivative Instruments.
Risk Exposures and the Use of Derivative Instruments. The Fund used derivative instruments (derivatives), including futures contracts, in order to meet its investment objectives. The strategy is to use derivatives to increase returns, to gain exposure to certain types of assets and to manage exposure to certain risks as defined below. The success of any strategy involving derivatives depends on analysis of numerous economic factors, and if the strategies for investment do not work as intended, the Fund may not achieve its objectives.
The Fund's use of derivatives increased or decreased its exposure to the following risk:
Interest Rate Risk | Interest rate risk relates to the fluctuations in the value of interest-bearing securities due to changes in the prevailing levels of market interest rates. |
The Fund is also exposed to additional risks from investing in derivatives, such as liquidity risk and counterparty credit risk. Liquidity risk is the risk that the Fund will be unable to sell the derivative in the open market in a timely manner. Counterparty credit risk is the risk that the counterparty will not be able to fulfill its obligation to the Fund. The Fund's maximum risk of loss from counterparty credit risk is generally the aggregate unrealized appreciation and unpaid counterparty payments in excess of any collateral pledged by the counterparty to the Fund. Counterparty risk related to exchange-traded futures contracts is minimal because of the protection provided by the exchange on which they trade. Derivatives involve, to varying degrees, risk of loss in excess of the amounts recognized in the Statement of Assets and Liabilities.
Futures Contracts. A futures contract is an agreement between two parties to buy or sell a specified underlying instrument for a fixed price at a specified future date. The Fund used futures contracts to manage its exposure to the bond, and to fluctuations in interest rates.
Upon entering into a futures contract, a fund is required to deposit either cash or securities (initial margin) with a clearing broker in an amount equal to a certain percentage of the face value of the contract. Futures contracts are marked-to-market daily and subsequent payments (variation margin) are made or received by a fund depending on the daily fluctuations in the value of the futures contracts and are recorded as unrealized appreciation or (depreciation). This receivable and/or payable is included in daily variation margin on futures contracts in the Statement of Assets and Liabilities. Realized gain or (loss) is recorded upon the expiration or closing of a futures contract.
Annual Report
Notes to Financial Statements - continued
4. Derivative Instruments - continued
Futures Contracts - continued
The underlying face amount at value of open futures contracts at period end, if any, is shown in the Schedule of Investments under the caption "Futures Contracts." This amount reflects each contract's exposure to the underlying instrument at period end. Securities deposited to meet initial margin requirements are identified in the Schedule of Investments.
Certain risks arise upon entering into futures contracts, including the risk that an illiquid market limits the ability to close out a futures contract prior to settlement date.
During the period the Fund recognized net realized gain (loss) of $32,980 and a change in net unrealized appreciation (depreciation) of $(15,646) related to its investment in futures contracts. These amounts are included in the Statement of Operations.
5. Purchases and Sales of Investments.
Purchases and sales of securities, other than short-term securities and U.S. government securities, aggregated $184,024,578 and $115,621,820, respectively.
6. Fees and Other Transactions with Affiliates.
Management Fee. FMR and its affiliates provide the Fund with investment management related services for which the Fund pays a monthly management fee. The management fee is the sum of an individual fund fee rate that is based on an annual rate of .20% of the Fund's average net assets and a group fee rate that averaged .12% during the period. The group fee rate is based upon the average net assets of all the mutual funds advised by FMR. The group fee rate decreases as assets under management increase and increases as assets under management decrease. For the period, the total annual management fee rate was .32% of the Fund's average net assets.
Distribution and Service Plan Fees. In accordance with Rule 12b-1 of the 1940 Act, the Fund has adopted separate Distribution and Service Plans for each class of shares. Certain classes pay Fidelity Distributors Corporation (FDC), an affiliate of FMR, separate Distribution and Service Fees, each of which is based on an annual percentage of each class' average net assets. In addition, FDC may pay financial intermediaries for selling shares of the Fund and providing shareholder support services. For the period, the Distribution and Service Fee rates, total fees and amounts retained by FDC were as follows:
| Distribution
Fee | Service
Fee | Total Fees | Retained
by FDC |
Class A | 0% | .15% | $ 21,556 | $ 2,014 |
Class T | 0% | .15% | 6,573 | 9 |
| | | $ 28,129 | $ 2,023 |
Annual Report
6. Fees and Other Transactions with Affiliates - continued
Sales Load. FDC may receive a front-end sales charge of up to 1.50% for selling Class A and Class T shares, some of which is paid to financial intermediaries for selling shares of the Fund. Depending on the holding period, FDC may receive a contingent deferred sales charges levied on Class A and Class T redemptions. The deferred sales charges range from, .75% or .50% for certain purchases of Class A shares (.75% prior to February 18, 2011) and .25% for certain purchases of Class T shares.
For the period, sales charge amounts retained by FDC were as follows:
| Retained
by FDC |
Class A | $ 7,465 |
Class T | 612 |
| $ 8,077 |
Transfer Agent Fees. Fidelity Investments Institutional Operations Company, Inc. (FIIOC), an affiliate of FMR, is the transfer, dividend disbursing and shareholder servicing agent for each class of the Fund. FIIOC receives account fees and asset-based fees that vary according to the account size and type of account of the shareholders of each respective class of the Fund, with the exception of Ultra Short Bond. FIIOC receives an asset-based fee of .10% of Ultra-Short Bond's average net assets. FIIOC pays for typesetting, printing and mailing of shareholder reports, except proxy statements. For the period, transfer agent fees for each class were as follows:
| Amount | % of
Average
Net Assets |
Class A | $ 19,230 | .13 |
Class T | 7,717 | .18 |
Ultra-Short Bond | 244,304 | .10 |
Institutional Class | 1,801 | .14 |
| $ 273,052 | |
Fund Wide Operations Fee. Pursuant to the Fund Wide Operations and Expense Agreement (FWOE), FMR has agreed to provide for fund level expenses (which do not include transfer agent, Rule 12b-1 fees, compensation of the independent Trustees, interest (including commitment fees), taxes or extraordinary expenses, if any) in return for a FWOE fee equal to .35% less the total amount of the management fee. The FWOE paid by the Fund is reduced by an amount equal to the fees and expenses paid to the independent Trustees. For the period, the FWOE fee was equivalent to an annual rate of .03% of average net assets.
Annual Report
Notes to Financial Statements - continued
7. Committed Line of Credit.
The Fund participates with other funds managed by FMR or an affiliate in a $4.0 billion credit facility (the "line of credit") to be utilized for temporary or emergency purposes to fund shareholder redemptions or for other short-term liquidity purposes. The Fund has agreed to pay commitment fees on its pro-rata portion of the line of credit, which amounted to $895 and is reflected in Miscellaneous expenses on the Statement of Operations. During the period, there were no borrowings on this line of credit.
8. Expense Reductions.
Through arrangements with the Fund's custodian, credits realized as a result of uninvested cash balances were used to reduce the Fund's expenses. During the period, these credits reduced the Fund's expenses by $135.
9. Distributions to Shareholders.
Distributions to shareholders of each class were as follows:
Years ended July 31, | 2011 | 2010 |
From net investment income | | |
Class A | $ 30,970 | $ 70,804 |
Class T | 7,200 | 19,435 |
Ultra-Short Bond | 894,223 | 1,791,150 |
Institutional Class | 4,433 | 5,660 |
Total | $ 936,826 | $ 1,887,049 |
10. Share Transactions.
Transactions for each class of shares were as follows:
| Shares | Dollars |
Years ended July 31, | 2011 | 2010 | 2011 | 2010 |
Class A | | | | |
Shares sold | 1,065,924 | 1,996,126 | $ 8,721,384 | $ 16,257,557 |
Reinvestment of distributions | 2,786 | 6,739 | 22,762 | 54,896 |
Shares redeemed | (1,799,361) | (770,234) | (14,718,442) | (6,273,379) |
Net increase (decrease) | (730,651) | 1,232,631 | $ (5,974,296) | $ 10,039,074 |
Class T | | | | |
Shares sold | 231,971 | 590,657 | $ 1,901,011 | $ 4,813,729 |
Reinvestment of distributions | 787 | 2,161 | 6,425 | 17,605 |
Shares redeemed | (300,216) | (322,791) | (2,455,991) | (2,628,531) |
Net increase (decrease) | (67,458) | 270,027 | $ (548,555) | $ 2,202,803 |
Annual Report
10. Share Transactions - continued
| Shares | Dollars |
Years ended July 31, | 2011 | 2010 | 2011 | 2010 |
Ultra-Short Bond | | | | |
Shares sold | 10,075,512 | 9,420,448 | $ 82,446,504 | $ 76,695,898 |
Reinvestment of distributions | 105,881 | 211,789 | 866,057 | 1,725,137 |
Shares redeemed | (10,269,460) | (7,087,084) | (84,068,521) | (57,716,904) |
Net increase (decrease) | (88,067) | 2,545,153 | $ (755,960) | $ 20,704,131 |
Institutional Class | | | | |
Shares sold | 250,678 | 142,602 | $ 2,055,596 | $ 1,161,563 |
Reinvestment of distributions | 412 | 362 | 3,373 | 2,947 |
Shares redeemed | (125,316) | (71,879) | (1,025,927) | (585,281) |
Net increase (decrease) | 125,774 | 71,085 | $ 1,033,042 | $ 579,229 |
11. Other.
The Fund's organizational documents provide former and current trustees and officers with a limited indemnification against liabilities arising in connection with the performance of their duties to the Fund. In the normal course of business, the Fund may also enter into contracts that provide general indemnifications. The Fund's maximum exposure under these arrangements is unknown as this would be dependent on future claims that may be made against the Fund. The risk of material loss from such claims is considered remote.
Annual Report
To the Trustees of Fidelity Income Fund and the Shareholders of Fidelity Ultra-Short Bond Fund:
In our opinion, the accompanying statement of assets and liabilities, including the schedule of investments, and the related statements of operations and of changes in net assets and the financial highlights present fairly, in all material respects, the financial position of Fidelity Ultra-Short Bond Fund (a fund of Fidelity Income Fund) at July 31, 2011, the results of its operations for the year then ended, the changes in its net assets for each of the two years in the period then ended and the financial highlights for each of the five years in the period then ended, in conformity with accounting principles generally accepted in the United States of America. These financial statements and financial highlights (hereafter referred to as "financial statements") are the responsibility of the Fidelity Ultra-Short Bond Fund's management. Our responsibility is to express an opinion on these financial statements based on our audits. We conducted our audits of these financial statements in accordance with the standards of the Public Company Accounting Oversight Board (United States). Those standards require that we plan and perform the audit to obtain reasonable assurance about whether the financial statements are free of material misstatement. An audit includes examining, on a test basis, evidence supporting the amounts and disclosures in the financial statements, assessing the accounting principles used and significant estimates made by management, and evaluating the overall financial statement presentation. We believe that our audits, which included confirmation of securities at July 31, 2011 by correspondence with the custodian and brokers, provide a reasonable basis for our opinion.
/s/ PricewaterhouseCoopers LLP
PricewaterhouseCoopers LLP
Boston, Massachusetts
September 16, 2011
Annual Report
The Trustees and executive officers of the trust and fund, as applicable, are listed below. The Board of Trustees governs the fund and is responsible for protecting the interests of shareholders. The Trustees are experienced executives who meet periodically throughout the year to oversee the fund's activities, review contractual arrangements with companies that provide services to the fund, oversee management of the risks associated with such activities and contractual arrangements, and review the fund's performance. Except for James C. Curvey, each of the Trustees oversees 198 funds advised by FMR or an affiliate. Mr. Curvey oversees 419 funds advised by FMR or an affiliate.
The Trustees hold office without limit in time except that (a) any Trustee may resign; (b) any Trustee may be removed by written instrument, signed by at least two-thirds of the number of Trustees prior to such removal; (c) any Trustee who requests to be retired or who has become incapacitated by illness or injury may be retired by written instrument signed by a majority of the other Trustees; and (d) any Trustee may be removed at any special meeting of shareholders by a two-thirds vote of the outstanding voting securities of the trust. Each Trustee who is not an interested person (as defined in the 1940 Act) (Independent Trustee), shall retire not later than the last day of the calendar year in which his or her 75th birthday occurs. The Independent Trustees may waive this mandatory retirement age policy with respect to individual Trustees. The executive officers hold office without limit in time, except that any officer may resign or may be removed by a vote of a majority of the Trustees at any regular meeting or any special meeting of the Trustees. Except as indicated, each individual has held the office shown or other offices in the same company for the past five years.
Experience, Skills, Attributes, and Qualifications of the Fund's Trustees. The Governance and Nominating Committee has adopted a statement of policy that describes the experience, qualifications, attributes, and skills that are necessary and desirable for potential Independent Trustee candidates (Statement of Policy). The Board believes that each Trustee satisfied at the time he or she was initially elected or appointed a Trustee, and continues to satisfy, the standards contemplated by the Statement of Policy. The Governance and Nominating Committee also engages professional search firms to help identify potential Independent Trustee candidates who have the experience, qualifications, attributes, and skills consistent with the Statement of Policy. From time to time, additional criteria based on the composition and skills of the current Independent Trustees, as well as experience or skills that may be appropriate in light of future changes to board composition, business conditions, and regulatory or other developments, have also been considered by the professional search firms and the Governance and Nominating Committee. In addition, the Board takes into account the Trustees' commitment and participation in Board and committee meetings, as well as their leadership of standing and ad hoc committees throughout their tenure.
In determining that a particular Trustee was and continues to be qualified to serve as a Trustee, the Board has considered a variety of criteria, none of which, in isolation, was controlling. The Board believes that, collectively, the Trustees have balanced and diverse experience, qualifications, attributes, and skills, which allow the Board to operate effectively in governing the fund and protecting the interests of shareholders. Information about the specific experience, skills, attributes, and qualifications of each Trustee, which in each case led to the Board's conclusion that the Trustee should serve (or continue to serve) as a trustee of the fund, is provided below.
Annual Report
Trustees and Officers - continued
Board Structure and Oversight Function. Abigail P. Johnson is an interested person (as defined in the 1940 Act) and currently serves as Chairman. The Trustees have determined that an interested Chairman is appropriate and benefits shareholders because an interested Chairman has a personal and professional stake in the quality and continuity of services provided to the fund. Independent Trustees exercise their informed business judgment to appoint an individual of their choosing to serve as Chairman, regardless of whether the Trustee happens to be independent or a member of management. The Independent Trustees have determined that they can act independently and effectively without having an Independent Trustee serve as Chairman and that a key structural component for assuring that they are in a position to do so is for the Independent Trustees to constitute a substantial majority for the Board. The Independent Trustees also regularly meet in executive session. Kenneth L. Wolfe serves as Chairman of the Independent Trustees and as such (i) acts as a liaison between the Independent Trustees and management with respect to matters important to the Independent Trustees and (ii) with management prepares agendas for Board meetings.
Fidelity funds are overseen by different Boards of Trustees. The fund's Board oversees Fidelity's investment-grade bond, money market, and asset allocation funds and another Board oversees Fidelity's equity and high income funds. The asset allocation funds may invest in Fidelity funds that are overseen by such other Board. The use of separate Boards, each with its own committee structure, allows the Trustees of each group of Fidelity funds to focus on the unique issues of the funds they oversee, including common research, investment, and operational issues. On occasion, the separate Boards establish joint committees to address issues of overlapping consequences for the Fidelity funds overseen by each Board.
The Trustees operate using a system of committees to facilitate the timely and efficient consideration of all matters of importance to the Trustees, the fund, and fund shareholders and to facilitate compliance with legal and regulatory requirements and oversight of the fund's activities and associated risks. The Board, acting through its committees, has charged FMR and its affiliates with (i) identifying events or circumstances the occurrence of which could have demonstrably adverse effects on the fund's business and/or reputation; (ii) implementing processes and controls to lessen the possibility that such events or circumstances occur or to mitigate the effects of such events or circumstances if they do occur; and (iii) creating and maintaining a system designed to evaluate continuously business and market conditions in order to facilitate the identification and implementation processes described in (i) and (ii) above. Because the day-to-day operations and activities of the fund are carried out by or through FMR, its affiliates and other service providers, the fund's exposure to risks is mitigated but not eliminated by the processes overseen by the Trustees. While each of the Board's committees has responsibility for overseeing different aspects of the fund's activities, oversight is exercised primarily through the Operations and Audit Committees. Appropriate personnel, including but not limited to the fund's Chief Compliance Officer (CCO), FMR's internal auditor, the independent accountants, the fund's Treasurer and portfolio management personnel, make periodic reports to the Board's committees, as appropriate. The responsibilities of each committee, including their oversight responsibilities, are described further under "Standing Committees of the Fund's Trustees."
Annual Report
The fund's Statement of Additional Information (SAI) includes more information about the Trustees. To request a free copy, call Fidelity at 1-877-208-0098.
Interested Trustees*:
Correspondence intended for each Trustee who is an interested person may be sent to Fidelity Investments, 82 Devonshire Street, Boston, Massachusetts 02109.
Name, Age; Principal Occupations and Other Relevant Experience+ |
Abigail P. Johnson (49) |
| Year of Election or Appointment: 2009 Ms. Johnson is Trustee and Chairman of the Board of Trustees of certain Trusts. Ms. Johnson serves as President of Personal, Workplace and Institutional Services (2005-present). Ms. Johnson is Chairman and Director of FMR Co., Inc. (2011-present), Chairman and Director of FMR (2011-present), and the Vice Chairman and Director (2007-present) of FMR LLC. Previously, Ms. Johnson served as President and a Director of FMR (2001-2005), a Trustee of other investment companies advised by FMR, Fidelity Investments Money Management, Inc., and FMR Co., Inc. (2001-2005), Senior Vice President of the Fidelity funds (2001-2005), and managed a number of Fidelity funds. Ms. Abigail P. Johnson and Mr. Arthur E. Johnson are not related. |
James C. Curvey (76) |
| Year of Election or Appointment: 2007 Mr. Curvey also serves as Trustee (2007-present) of other investment companies advised by FMR. Mr. Curvey is a Director of Fidelity Investments Money Management, Inc. (2009-present), Director of Fidelity Research & Analysis Co. (2009-present) and Director of FMR and FMR Co., Inc. (2007-present). Mr. Curvey is also Vice Chairman (2007-present) and Director of FMR LLC. In addition, Mr. Curvey serves as an Overseer for the Boston Symphony Orchestra and a member of the Trustees of Villanova University. Previously, Mr. Curvey was the Vice Chairman (2006-2007) and Director (2000-2007) of FMR Corp. |
* Trustees have been determined to be "Interested Trustees" by virtue of, among other things, their affiliation with the trust or various entities under common control with FMR.
+ The information above includes each Trustee's principal occupation during the last five years and other information relating to the experience, attributes, and skills relevant to each Trustee's qualifications to serve as a Trustee, which led to the conclusion that each Trustee should serve as a Trustee for the fund.
Annual Report
Trustees and Officers - continued
Independent Trustees:
Correspondence intended for each Independent Trustee (that is, the Trustees other than the Interested Trustees) may be sent to Fidelity Investments, P.O. Box 55235, Boston, Massachusetts 02205-5235.
Name, Age; Principal Occupations and Other Relevant Experience+ |
Albert R. Gamper, Jr. (69) |
| Year of Election or Appointment: 2006 Mr. Gamper is Vice Chairman of the Independent Trustees of the Fixed Income and Asset Allocation Funds (2011-present). Prior to his retirement in December 2004, Mr. Gamper served as Chairman of the Board of CIT Group Inc. (commercial finance). During his tenure with CIT Group Inc. Mr. Gamper served in numerous senior management positions, including Chairman (1987-1989; 1999-2001; 2002-2004), Chief Executive Officer (1987-2004), and President (2002-2003). He also served as President and Chief Executive Officer of Tyco Capital Corporation (2001-2002). Mr. Gamper currently serves as a member of the Board of Directors of Public Service Enterprise Group (utilities, 2000-present), a member of the Board of Trustees, Rutgers University (2004-present), and Chairman of the Board of Saint Barnabas Health Care System. Previously, Mr. Gamper served as Chairman of the Board of Governors, Rutgers University (2004-2007). |
Robert F. Gartland (59) |
| Year of Election or Appointment: 2010 Mr. Gartland is a partner and investor of Vietnam Partners LLC (investments and consulting, 2008-present) and is Chairman and an investor in Gartland and Mellina Group Corp. (consulting, 2009-present). Prior to his retirement, Mr. Gartland held a variety of positions at Morgan Stanley (financial services, 1979-2007) including Managing Director (1987-2007). |
Arthur E. Johnson (64) |
| Year of Election or Appointment: 2008 Mr. Johnson serves as a member of the Board of Directors of Eaton Corporation (diversified power management, 2009-present) and AGL Resources, Inc. (holding company). Prior to his retirement, Mr. Johnson served as Senior Vice President of Corporate Strategic Development of Lockheed Martin Corporation (defense contractor, 1999-2009). He previously served on the Board of Directors of IKON Office Solutions, Inc. (1999-2008) and Delta Airlines (2005-2007). Mr. Arthur E. Johnson and Ms. Abigail P. Johnson are not related. |
Michael E. Kenneally (57) |
| Year of Election or Appointment: 2009 Previously, Mr. Kenneally served as a Member of the Advisory Board for certain Fidelity Fixed Income and Asset Allocation Funds (2008-2009). Prior to his retirement, Mr. Kenneally served as Chairman and Global Chief Executive Officer of Credit Suisse Asset Management (2003-2005). Mr. Kenneally was a Director of the Credit Suisse Funds (U.S. mutual funds, 2004-2008) and certain other closed-end funds (2004-2005) and was awarded the Chartered Financial Analyst (CFA) designation in 1991. |
James H. Keyes (70) |
| Year of Election or Appointment: 2007 Mr. Keyes serves as a member of the Boards of Navistar International Corporation (manufacture and sale of trucks, buses, and diesel engines, since 2002) and Pitney Bowes, Inc. (integrated mail, messaging, and document management solutions, since 1998). Prior to his retirement, Mr. Keyes served as Chairman and Chief Executive Officer of Johnson Controls (automotive, building, and energy, 1998-2002) and as a member of the Board of LSI Logic Corporation (semiconductor technologies, 1984-2008). |
Marie L. Knowles (64) |
| Year of Election or Appointment: 2001 Prior to Ms. Knowles' retirement in June 2000, she served as Executive Vice President and Chief Financial Officer of Atlantic Richfield Company (ARCO) (diversified energy, 1996-2000). From 1993 to 1996, she was a Senior Vice President of ARCO and President of ARCO Transportation Company. She served as a Director of ARCO from 1996 to 1998. Ms. Knowles currently serves as a Director and Chairman of the Audit Committee of McKesson Corporation (healthcare service, since 2002). Ms. Knowles is an Honorary Trustee of the Brookings Institution and a member of the Board of the Catalina Island Conservancy and of the Santa Catalina Island Company (2009-present). She also serves as a member of the Advisory Board for the School of Engineering of the University of Southern California and the Foundation Board of the School of Architecture at the University of Virginia (2007-present). Previously, Ms. Knowles served as a Director of Phelps Dodge Corporation (copper mining and manufacturing, 1994-2007). |
Kenneth L. Wolfe (72) |
| Year of Election or Appointment: 2005 Mr. Wolfe is Chairman of the Independent Trustees of the Fixed Income and Asset Allocation Funds (2008-present). Prior to his retirement, Mr. Wolfe served as Chairman and a Director (2007-2009) and Chairman and Chief Executive Officer (1994-2001) of Hershey Foods Corporation. He also served as a member of the Boards of Adelphia Communications Corporation (telecommunications, 2003-2006), Bausch & Lomb, Inc. (medical/pharmaceutical, 1993-2007), and Revlon, Inc. (personal care products, 2004-2009). |
+ The information above includes each Trustee's principal occupation during the last five years and other information relating to the experience, attributes, and skills relevant to each Trustee's qualifications to serve as a Trustee, which led to the conclusion that each Trustee should serve as a Trustee for the fund.
Executive Officers:
Correspondence intended for each executive officer may be sent to Fidelity Investments, 82 Devonshire Street, Boston, Massachusetts 02109.
Name, Age; Principal Occupation |
John R. Hebble (53) |
| Year of Election or Appointment: 2008 President and Treasurer of Fidelity's Fixed Income and Asset Allocation Funds. Mr. Hebble also serves as President (2011-present), Treasurer, and Chief Financial Officer of The North Carolina Capital Management Trust: Cash and Term Portfolios (2008-present), Assistant Treasurer of other Fidelity funds (2009-present) and is an employee of Fidelity Investments. |
Christopher P. Sullivan (57) |
| Year of Election or Appointment: 2009 Vice President of Fidelity's Bond Funds. Mr. Sullivan also serves as President of Fidelity's Bond Division (2009-present). Mr. Sullivan is Executive Vice President of Fidelity Investments Money Management, Inc. (2009-present), and a Director of Fidelity Management & Research (U.K.) Inc. (2010-present). Previously, Mr. Sullivan served as Managing Director, Co-Head of U.S. Fixed Income at Goldman Sachs Asset Management (2001-2009). |
Christine J. Thompson (53) |
| Year of Election or Appointment: 2010 Vice President of Fidelity's Bond Funds. Ms. Thompson also serves as Chief Investment Officer of FMR's Bond Group (2010-present) and is an employee of Fidelity Investments. Previously, Ms. Thompson served as Director of Municipal Bond Portfolio Managers (2002-2010). |
Scott C. Goebel (43) |
| Year of Election or Appointment: 2008 Secretary and Chief Legal Officer (CLO) of the Fidelity funds. Mr. Goebel also serves as Secretary of Fidelity Investments Money Management, Inc. (FIMM) (2010-present) and Fidelity Research and Analysis Company (FRAC) (2010-present); Secretary and CLO of The North Carolina Capital Management Trust: Cash and Term Portfolios (2008-present); General Counsel, Secretary, and Senior Vice President of FMR (2008-present) and FMR Co., Inc. (2008-present); employed by FMR LLC or an affiliate (2001-present); Chief Legal Officer of Fidelity Management & Research (Hong Kong) Limited (2008-present) and Assistant Secretary of Fidelity Management & Research (Japan) Inc. (2008-present), and Fidelity Management & Research (U.K.) Inc. (2008-present). Previously, Mr. Goebel served as Assistant Secretary of FIMM (2008-2010), FRAC (2008-2010), and the Funds (2007-2008) and as Vice President and Secretary of Fidelity Distributors Corporation (FDC) (2005-2007). |
David J. Carter (38) |
| Year of Election or Appointment: 2010 Assistant Secretary of Fidelity's Fixed Income and Asset Allocation Funds. Mr. Carter also serves as Vice President, Associate General Counsel (2010-present) and is an employee of Fidelity Investments (2005-present). |
Holly C. Laurent (57) |
| Year of Election or Appointment: 2008 Anti-Money Laundering (AML) Officer of the Fidelity funds. Ms. Laurent also serves as AML Officer of The North Carolina Capital Management Trust: Cash and Term Portfolios (2008-present) and is an employee of Fidelity Investments. Previously, Ms. Laurent was Senior Vice President and Head of Legal for Fidelity Business Services India Pvt. Ltd. (2006-2008), and Senior Vice President, Deputy General Counsel and Group Head for FMR LLC (2005-2006). |
Christine Reynolds (52) |
| Year of Election or Appointment: 2008 Chief Financial Officer of the Fidelity funds. Ms. Reynolds became President of Fidelity Pricing and Cash Management Services (FPCMS) in August 2008. Ms. Reynolds served as Chief Operating Officer of FPCMS (2007-2008). Previously, Ms. Reynolds served as President, Treasurer, and Anti-Money Laundering officer of the Fidelity funds (2004-2007). |
Michael H. Whitaker (44) |
| Year of Election or Appointment: 2008 Chief Compliance Officer of Fidelity's Fixed Income and Asset Allocation Funds. Mr. Whitaker also serves as Chief Compliance Officer of The North Carolina Capital Management Trust: Cash and Term Portfolios (2008-present). Mr. Whitaker is an employee of Fidelity Investments (2007-present). Prior to joining Fidelity Investments, Mr. Whitaker worked at MFS Investment Management where he served as Senior Vice President and Chief Compliance Officer (2004-2006), and Assistant General Counsel. |
Jeffrey S. Christian (49) |
| Year of Election or Appointment: 2009 Deputy Treasurer of the Fidelity funds. Mr. Christian is an employee of Fidelity Investments. Previously, Mr. Christian served as Chief Financial Officer (2008-2009) of certain Fidelity funds and Senior Vice President of Fidelity Pricing and Cash Management Services (FPCMS) (2004-2009). |
Bryan A. Mehrmann (50) |
| Year of Election or Appointment: 2005 Deputy Treasurer of the Fidelity funds. Mr. Mehrmann is an employee of Fidelity Investments. |
Stephanie J. Dorsey (42) |
| Year of Election or Appointment: 2008 Deputy Treasurer of Fidelity's Fixed Income and Asset Allocation Funds. Ms. Dorsey also serves as Assistant Treasurer of other Fidelity funds (2010-present) and is an employee of Fidelity Investments (2008-present). Previously, Ms. Dorsey served as Treasurer (2004-2008) of the JPMorgan Mutual Funds and Vice President (2004-2008) of JPMorgan Chase Bank. |
Adrien E. Deberghes (43) |
| Year of Election or Appointment: 2010 Assistant Treasurer of Fidelity's Fixed Income and Asset Allocation Funds. Mr. Deberghes also serves as Deputy Treasurer of other Fidelity funds (2008-present) and is an employee of Fidelity Investments (2008-present). Previously, Mr. Deberghes served as Senior Vice President of Mutual Fund Administration at State Street Corporation (2007-2008), Senior Director of Mutual Fund Administration at Investors Bank & Trust (2005-2007), and Director of Finance for Dunkin' Brands (2000-2005). |
Kenneth B. Robins (41) |
| Year of Election or Appointment: 2009 Assistant Treasurer of the Fidelity Fixed Income and Asset Allocation Funds. Mr. Robins also serves as President and Treasurer of other Fidelity funds (2008-present; 2010-present) and is an employee of Fidelity Investments (2004-present). Previously, Mr. Robins served as Deputy Treasurer of the Fidelity funds (2005-2008) and Treasurer and Chief Financial Officer of The North Carolina Capital Management Trust: Cash and Term Portfolios (2006-2008). |
Gary W. Ryan (52) |
| Year of Election or Appointment: 2005 Assistant Treasurer of the Fidelity funds. Mr. Ryan is an employee of Fidelity Investments. Previously, Mr. Ryan served as Vice President of Fund Reporting in Fidelity Pricing and Cash Management Services (FPCMS) (1999-2005). |
Jonathan Davis (43) |
| Year of Election or Appointment: 2010 Assistant Treasurer of the Fidelity funds. Mr. Davis is an employee of Fidelity Investments. Previously, Mr. Davis served as Vice President and Associate General Counsel of FMR LLC (2003-2010). |
Annual Report
A total of 9.73% of the dividends distributed during the fiscal year was derived from interest on U.S. Government securities which is generally exempt from state income tax.
The fund designates $382,768 of distributions paid during the period January 1, 2011 to July 31, 2011 as qualifying to be taxed as interest-related dividends for nonresident alien shareholders.
The fund will notify shareholders in January 2012 amounts for use in preparing 2011 income tax returns.
Annual Report
Investment Adviser
Fidelity Management & Research Company
Boston, MA
Investment Sub-Advisers
Fidelity Investments
Money Management, Inc.
Fidelity Management & Research
(U.K.) Inc.
Fidelity Management & Research
(Japan) Inc.
Fidelity Management & Research
(Hong Kong) Limited
General Distributor
Fidelity Distributors Corporation
Boston, MA
Transfer and Service Agents
Fidelity Investments Institutional
Operations Company, Inc.
Boston, MA
Fidelity Service Company, Inc.
Boston, MA
Custodian
Citibank, N.A.
New York, NY
AUSBI-UANN-0911
1.804593.107
Item 2. Code of Ethics
As of the end of the period, July 31, 2011, Fidelity Income Fund (the trust) has adopted a code of ethics, as defined in Item 2 of Form N-CSR, that applies to its President and Treasurer and its Chief Financial Officer. A copy of the code of ethics is filed as an exhibit to this Form N-CSR.
Item 3. Audit Committee Financial Expert
The Board of Trustees of the trust has determined that Marie L. Knowles is an audit committee financial expert, as defined in Item 3 of Form N-CSR. Ms. Knowles is independent for purposes of Item 3 of Form N-CSR.
Item 4. Principal Accountant Fees and Services
Fees and Services
The following table presents fees billed by Deloitte & Touche LLP, the member firms of Deloitte Touche Tohmatsu, and their respective affiliates (collectively, "Deloitte Entities") in each of the last two fiscal years for services rendered to Fidelity Income Replacement 2016 Fund, Fidelity Income Replacement 2018 Fund, Fidelity Income Replacement 2020 Fund, Fidelity Income Replacement 2022 Fund, Fidelity Income Replacement 2024 Fund, Fidelity Income Replacement 2026 Fund, Fidelity Income Replacement 2028 Fund, Fidelity Income Replacement 2030 Fund, Fidelity Income Replacement 2032 Fund, Fidelity Income Replacement 2034 Fund, Fidelity Income Replacement 2036 Fund, Fidelity Income Replacement 2038 Fund, Fidelity Income Replacement 2040 Fund, and Fidelity Income Replacement 2042 Fund (the "Funds"):
Services Billed by Deloitte Entities
July 31, 2011 FeesA
| Audit Fees | Audit-Related Fees | Tax Fees | All Other Fees |
Fidelity Income Replacement 2016 Fund | $22,000 | $- | $4,800 | $200 |
Fidelity Income Replacement 2018 Fund | $22,000 | $- | $4,800 | $200 |
Fidelity Income Replacement 2020 Fund | $22,000 | $- | $4,800 | $200 |
Fidelity Income Replacement 2022 Fund | $22,000 | $- | $4,800 | $200 |
Fidelity Income Replacement 2024 Fund | $22,000 | $- | $4,800 | $200 |
Fidelity Income Replacement 2026 Fund | $22,000 | $- | $4,800 | $200 |
Fidelity Income Replacement 2028 Fund | $22,000 | $- | $4,800 | $200 |
Fidelity Income Replacement 2030 Fund | $22,000 | $- | $4,800 | $200 |
Fidelity Income Replacement 2032 Fund | $22,000 | $- | $4,800 | $200 |
Fidelity Income Replacement 2034 Fund | $22,000 | $- | $4,800 | $200 |
Fidelity Income Replacement 2036 Fund | $22,000 | $- | $4,800 | $200 |
Fidelity Income Replacement 2038 Fund | $19,000 | $- | $4,500 | $200 |
Fidelity Income Replacement 2040 Fund | $19,000 | $- | $4,500 | $200 |
Fidelity Income Replacement 2042 Fund | $19,000 | $- | $4,500 | $200 |
July 31, 2010 FeesA
| Audit Fees | Audit-Related Fees | Tax Fees | All Other Fees |
Fidelity Income Replacement 2016 Fund | $25,000 | $- | $4,700 | $- |
Fidelity Income Replacement 2018 Fund | $25,000 | $- | $4,700 | $- |
Fidelity Income Replacement 2020 Fund | $25,000 | $- | $4,700 | $- |
Fidelity Income Replacement 2022 Fund | $25,000 | $- | $4,700 | $- |
Fidelity Income Replacement 2024 Fund | $25,000 | $- | $4,700 | $- |
Fidelity Income Replacement 2026 Fund | $25,000 | $- | $4,700 | $- |
Fidelity Income Replacement 2028 Fund | $25,000 | $- | $4,700 | $- |
Fidelity Income Replacement 2030 Fund | $25,000 | $- | $4,700 | $- |
Fidelity Income Replacement 2032 Fund | $25,000 | $- | $4,700 | $- |
Fidelity Income Replacement 2034 Fund | $25,000 | $- | $4,700 | $- |
Fidelity Income Replacement 2036 Fund | $25,000 | $- | $4,700 | $- |
Fidelity Income Replacement 2038 Fund | $25,000 | $- | $4,400 | $- |
Fidelity Income Replacement 2040 Fund | $25,000 | $- | $4,400 | $- |
Fidelity Income Replacement 2042 Fund | $25,000 | $- | $4,400 | $- |
A Amounts may reflect rounding.
The following table presents fees billed by PricewaterhouseCoopers LLP ("PwC") in each of the last two fiscal years for services rendered to Fidelity GNMA Fund, Fidelity Government Income Fund, Fidelity Intermediate Government Income Fund, and Fidelity Ultra-Short Bond Fund (the "Funds"):
Services Billed by PwC
July 31, 2011 FeesA
| Audit Fees | Audit-Related Fees | Tax Fees | All Other Fees |
Fidelity GNMA Fund | $101,000 | $- | $4,500 | $5,600 |
Fidelity Government Income Fund | $77,000 | $- | $3,300 | $4,500 |
Fidelity Intermediate Government Income Fund | $70,000 | $- | $3,300 | $2,400 |
Fidelity Ultra-Short Bond Fund | $51,000 | $- | $2,000 | $1,800 |
July 31, 2010 FeesA
| Audit Fees | Audit-Related Fees | Tax Fees | All Other Fees |
Fidelity GNMA Fund | $102,000 | $- | $4,300 | $4,700 |
Fidelity Government Income Fund | $78,000 | $- | $3,200 | $4,100 |
Fidelity Intermediate Government Income Fund | $70,000 | $- | $3,200 | $2,100 |
Fidelity Ultra-Short Bond Fund | $53,000 | $- | $2,000 | $1,500 |
A Amounts may reflect rounding.
The following table presents fees billed by PwC and Deloitte Entities that were required to be approved by the Audit Committee for services that relate directly to the operations and financial reporting of the Funds and that are rendered on behalf of Fidelity Management & Research Company ("FMR") and entities controlling, controlled by, or under common control with FMR (not including any sub-adviser whose role is primarily portfolio management and is subcontracted with or overseen by another investment adviser) that provide ongoing services to the Funds ("Fund Service Providers"):
Services Billed by Deloitte Entities
| July 31, 2011A | July 31, 2010A |
Audit-Related Fees | $645,000 | $720,000 |
Tax Fees | $- | $- |
All Other Fees | $730,000 | $450,000 |
A Amounts may reflect rounding.
Services Billed by PwC
| July 31, 2011A | July 31, 2010A |
Audit-Related Fees | $1,860,000 | $2,180,000 |
Tax Fees | $- | $- |
All Other Fees | $365,000 | $145,000 |
A Amounts may reflect rounding.
"Audit-Related Fees" represent fees billed for assurance and related services that are reasonably related to the performance of the fund audit or the review of the fund's financial statements and that are not reported under Audit Fees.
"Tax Fees" represent fees billed for tax compliance, tax advice or tax planning that relate directly to the operations and financial reporting of the fund.
"All Other Fees" represent fees billed for services provided to the fund or Fund Service Provider, a significant portion of which are assurance related, that relate directly to the operations and financial reporting of the fund, excluding those services that are reported under Audit Fees, Audit-Related Fees or Tax Fees.
Assurance services must be performed by an independent public accountant.
* * *
The aggregate non-audit fees billed by PwC and Deloitte Entities for services rendered to the Funds, FMR (not including any sub-adviser whose role is primarily portfolio management and is subcontracted with or overseen by another investment adviser), and any Fund Service Provider for each of the last two fiscal years of the Funds are as follows:
Billed By | July 31, 2011 A | July 31, 2010 A |
PwC | $4,120,000 | $4,515,000 |
Deloitte Entities | $1,540,000 | $1,270,000 |
A Amounts may reflect rounding.
The trust's Audit Committee has considered non-audit services that were not pre-approved that were provided by PwC and Deloitte Entities to Fund Service Providers to be compatible with maintaining the independence of PwC and Deloitte Entities in their audits of the Funds, taking into account representations from PwC and Deloitte Entities, in accordance with Public Company Accounting Oversight Board rules, regarding their independence from the Funds and their related entities and FMR's review of the appropriateness and permissibility under applicable law of such non-audit services prior to their provision to the Fund Service Providers.
Audit Committee Pre-Approval Policies and Procedures
The trust's Audit Committee must pre-approve all audit and non-audit services provided by a fund's independent registered public accounting firm relating to the operations or financial reporting of the fund. Prior to the commencement of any audit or non-audit services to a fund, the Audit Committee reviews the services to determine whether they are appropriate and permissible under applicable law.
The Audit Committee has adopted policies and procedures to, among other purposes, provide a framework for the Committee's consideration of non-audit services by the audit firms that audit the Fidelity funds. The policies and procedures require that any non-audit service provided by a fund audit firm to a Fidelity fund and any non-audit service provided by a fund auditor to a Fund Service Provider that relates directly to the operations and financial reporting of a Fidelity fund ("Covered Service") are subject to approval by the Audit Committee before such service is provided.
All Covered Services must be approved in advance of provision of the service either: (i) by formal resolution of the Audit Committee, or (ii) by oral or written approval of the service by the Chair of the Audit Committee (or if the Chair is unavailable, such other member of the Audit Committee as may be designated by the Chair to act in the Chair's absence). The approval contemplated by (ii) above is permitted where the Treasurer determines that action on such an engagement is necessary before the next meeting of the Audit Committee.
Non-audit services provided by a fund audit firm to a Fund Service Provider that do not relate directly to the operations and financial reporting of a Fidelity fund are reported to the Audit Committee on a periodic basis.
Non-Audit Services Approved Pursuant to Rule 2-01(c)(7)(i)(C) and (ii) of Regulation S-X ("De Minimis Exception")
There were no non-audit services approved or required to be approved by the Audit Committee pursuant to the De Minimis Exception during the Funds' last two fiscal years relating to services provided to (i) the Funds or (ii) any Fund Service Provider that relate directly to the operations and financial reporting of the Funds.
Item 5. Audit Committee of Listed Registrants
Not applicable.
Item 6. Investments
(a) Not applicable.
(b) Not applicable
Item 7. Disclosure of Proxy Voting Policies and Procedures for Closed-End Management Investment Companies
Not applicable.
Item 8. Portfolio Managers of Closed-End Management Investment Companies
Not applicable.
Item 9. Purchase of Equity Securities by Closed-End Management Investment Company and Affiliated Purchasers
Not applicable.
Item 10. Submission of Matters to a Vote of Security Holders
There were no material changes to the procedures by which shareholders may recommend nominees to the trust's Board of Trustees.
Item 11. Controls and Procedures
(a)(i) The President and Treasurer and the Chief Financial Officer have concluded that the trust's disclosure controls and procedures (as defined in Rule 30a-3(c) under the Investment Company Act) provide reasonable assurances that material information relating to the trust is made known to them by the appropriate persons, based on their evaluation of these controls and procedures as of a date within 90 days of the filing date of this report.
(a)(ii) There was no change in the trust's internal control over financial reporting (as defined in Rule 30a-3(d) under the Investment Company Act) that occurred during the second fiscal quarter of the period covered by this report that has materially affected, or is reasonably likely to materially affect, the trust's internal control over financial reporting.
Item 12. Exhibits
(a) | (1) | Code of Ethics pursuant to Item 2 of Form N-CSR is filed and attached hereto as EX-99.CODE ETH. |
(a) | (2) | Certification pursuant to Rule 30a-2(a) under the Investment Company Act of 1940 (17 CFR 270.30a-2(a)) is filed and attached hereto as Exhibit 99.CERT. |
(a) | (3) | Not applicable. |
(b) | | Certification pursuant to Rule 30a-2(b) under the Investment Company Act of 1940 (17 CFR 270.30a-2(b)) is furnished and attached hereto as Exhibit 99.906CERT. |
SIGNATURES
Pursuant to the requirements of the Securities Exchange Act of 1934 and the Investment Company Act of 1940, the registrant has duly caused this report to be signed on its behalf by the undersigned, thereunto duly authorized.
Fidelity Income Fund
By: | /s/John R. Hebble |
| John R. Hebble |
| President and Treasurer |
| |
Date: | September 26, 2011 |
Pursuant to the requirements of the Securities Exchange Act of 1934 and the Investment Company Act of 1940, this report has been signed below by the following persons on behalf of the registrant and in the capacities and on the dates indicated.
By: | /s/John R. Hebble |
| John R. Hebble |
| President and Treasurer |
| |
Date: | September 26, 2011 |
By: | /s/Christine Reynolds |
| Christine Reynolds |
| Chief Financial Officer |
| |
Date: | September 26, 2011 |