Table of Contents
UNITED STATES
SECURITIES AND EXCHANGE COMMISSION
Washington, D.C. 20549
FORM N-CSR
CERTIFIED SHAREHOLDER REPORT OF
REGISTERED MANAGEMENT INVESTMENT COMPANIES
Investment Company Act file number 811-4096
MFS MUNICIPAL SERIES TRUST
(Exact name of registrant as specified in charter)
500 Boylston Street, Boston, Massachusetts 02116
(Address of principal executive offices) (Zip code)
Susan S. Newton
Massachusetts Financial Services Company
500 Boylston Street
Boston, Massachusetts 02116
(Name and address of agents for service)
Registrant’s telephone number, including area code: (617) 954-5000
Date of fiscal year end: March 31
Date of reporting period: March 31, 2009
Table of Contents
| ITEM 1. | REPORTS TO STOCKHOLDERS. |
Table of Contents
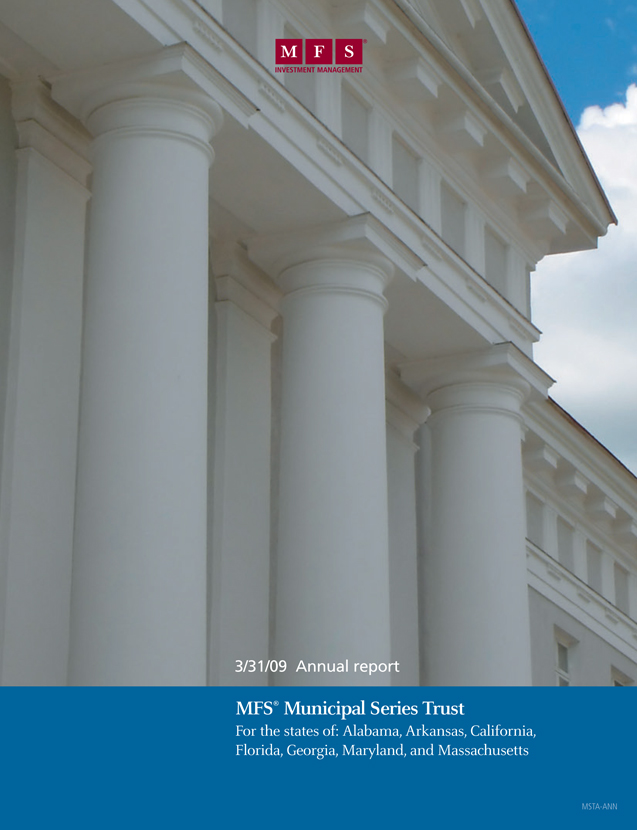
Table of Contents
Alabama, Arkansas, California, Florida, Georgia, Maryland and Massachusetts
| CONTACT INFORMATION | BACK COVER |
SIPC Contact Information: You may obtain information about the Securities Investor Protection Corporation (“SIPC”), including the SIPC Brochure, by contacting SIPC either by telephone (202-371-8300) or by accessing SIPC’s website address (www.sipc.org).
The report is prepared for the general information of shareholders. It is authorized for distribution to prospective investors only when preceded or accompanied by a current prospectus.
NOT FDIC INSURED • MAY LOSE VALUE •
NO BANK GUARANTEE
Table of Contents

Dear Shareholders:
The market downturns and economic setbacks of late probably rank among the worst financial declines most of us have experienced. Inevitably, people may be questioning their commitment to investing. Still, it is important to remember that downturns are an inescapable part of the business cycle. Such troughs have been seen before, and if we can use history as a guide, market recoveries typically have followed.
Recent events have clearly shown us the value of certain types of investments. In this environment, two of the hallmarks of mutual funds — transparency and liquidity — have become critically important. Unlike some other types of investments, the operations of mutual funds are relatively transparent to their shareholders. With their daily redemption feature, mutual funds also generally provide easy, convenient access to one’s money. Through these recent market upheavals, this level of liquidity enhanced the ability of mutual fund investors to respond and modify their investments as they and their advisors saw fit — a flexibility that those in less liquid investments simply did not have at their disposal.
At MFS® we take particular pride in how well mutual funds can serve investors because we invented the mutual fund in the United States. Established in 1924, Massachusetts Investors Trust was the nation’s first fund. Recent market events only reinforce what we have learned through 85 years — that mutual funds provide unique features that are important to investors in any type of market climate.
Respectfully,

Robert J. Manning
Chief Executive Officer and Chief Investment Officer
MFS Investment Management®
May 15, 2009
The opinions expressed in this letter are subject to change, may not be relied upon for investment advice, and no forecasts can be guaranteed.
Before investing, consider the fund’s investment objectives, risks, charges, and expenses. For a prospectus containing this and other information, contact your investment professional or view online. Read it carefully.
MFS Fund Distributors, Inc., 500 Boylston Street, Boston, MA 02116
1
Table of Contents
MFS® Alabama Municipal Bond Fund
Portfolio structure (i)

| Top five industries (i) | ||
| Water & Sewer Utility Revenue | 17.6% | |
| Universities – Colleges | 17.0% | |
| Healthcare Revenue – Hospitals | 12.6% | |
| General Obligations – General Purpose | 9.1% | |
| General Obligations – Schools | 7.7% | |
| Credit quality of bonds (r) | ||
| AAA | 11.5% | |
| AA | 47.4% | |
| A | 16.1% | |
| BBB | 21.1% | |
| BB | 1.3% | |
| B | 0.2% | |
| Not Rated | 2.4% | |
| Portfolio facts | ||
| Average Duration (d)(i) | 9.4 | |
| Average Life (i)(m) | 18.0 yrs. | |
| Average Maturity (i)(m) | 20.4 yrs. | |
| Average Credit Quality of Rated Securities (long-term) (a) | A+ | |
MFS® Arkansas Municipal Bond Fund
Portfolio structure (i)

| Top five industries (i) | ||
| Universities – Colleges | 23.2% | |
| Water & Sewer Utility Revenue | 13.3% | |
| Healthcare Revenue – Hospitals | 11.3% | |
| General Obligations – General Purpose | 9.0% | |
| Utilities – Municipal Owned | 7.3% | |
| Credit quality of bonds (r) | ||
| AAA | 18.8% | |
| AA | 42.4% | |
| A | 11.9% | |
| BBB | 25.7% | |
| BB | 0.1% | |
| B | 0.1% | |
| CCC | 0.4% | |
| Not Rated | 0.6% | |
| Portfolio facts | ||
| Average Duration (d)(i) | 9.1 | |
| Average Life (i)(m) | 16.7 yrs. | |
| Average Maturity (i)(m) | 19.1 yrs. | |
| Average Credit Quality of Rated Securities (long-term) (a) | A+ | |
MFS® California Municipal Bond Fund
Portfolio structure (i)

| Top five industries (i) | ||
| General Obligations – Schools | 15.7% | |
| Healthcare Revenue – Hospitals | 14.7% | |
| State & Local Agencies | 12.4% | |
| Universities – Colleges | 8.8% | |
| Water & Sewer Utility Revenue | 8.4% | |
| Credit quality of bonds (r) | ||
| AAA | 9.0% | |
| AA | 37.7% | |
| A | 30.7% | |
| BBB | 17.2% | |
| BB | 0.8% | |
| B | 0.1% | |
| C | 0.1% | |
| Not Rated | 4.4% | |
| Portfolio facts | ||
| Average Duration (d)(i) | 9.9 | |
| Average Life (i)(m) | 18.6 yrs. | |
| Average Maturity (i)(m) | 21.6 yrs. | |
| Average Credit Quality of Rated Securities (long-term) (a) | A+ | |
| (a) | The average credit quality of rated securities is based upon a market weighted average of portfolio holdings that are rated by public rating agencies. |
| (d) | Duration is a measure of how much a bond’s price is likely to fluctuate with general changes in interest rates, e.g., if rates rise 1.00%, a bond with a 5-year duration is likely to lose about 5.00% of its value. |
| (i) | For purposes of this presentation, the bond component includes accrued interest amounts and may be positively or negatively impacted by the equivalent exposure from any derivative holdings, if applicable. |
| (m) | The average maturity shown is calculated using the final stated maturity on the portfolio’s holdings without taking into account any holdings which have been pre-refunded or pre-paid to an earlier date or which have a mandatory put date prior to the stated maturity. The average life shown takes into account these earlier dates. |
| (r) | Each security is assigned a rating from Moody’s Investors Service. If not rated by Moody’s, the rating will be that assigned by Standard & Poor’s. Likewise, if not assigned a rating by Standard & Poor’s, it will be based on the rating assigned by Fitch, Inc. For those portfolios that hold a security which is not rated by any of the three agencies, the security is considered Not Rated. Holdings in U.S. Treasuries and government agency mortgage-backed securities, if any, are included in the “AAA”-rating category. Percentages are based on the total market value of investments as of 3/31/09. |
Percentages are based on net assets as of 3/31/09, unless otherwise noted.
The portfolio is actively managed and current holdings may be different.
2
Table of Contents
Portfolio Composition – continued
MFS® Florida Municipal Bond Fund
Portfolio structure (i)

| Top five industries (i) | ||
| Healthcare Revenue – Hospitals | 19.3% | |
| Water & Sewer Utility Revenue | 17.2% | |
| General Obligations – Schools | 9.5% | |
| Airport & Port Revenue | 7.0% | |
| State & Local Agencies | 5.0% | |
| Credit quality of bonds (r) | ||
| AAA | 2.1% | |
| AA | 43.1% | |
| A | 20.6% | |
| BBB | 28.0% | |
| BB | 0.8% | |
| B | 0.2% | |
| Not Rated | 5.2% | |
| Portfolio facts | ||
| Average Duration (d)(i) | 8.7 | |
| Average Life (i)(m) | 15.8 yrs. | |
| Average Maturity (i)(m) | 17.6 yrs. | |
| Average Credit Quality of Rated Securities (long-term) (a) | A+ | |
MFS® Georgia Municipal Bond Fund
Portfolio structure (i)

| Top five industries (i) | ||
| Water & Sewer Utility Revenue | 22.2% | |
| Universities – Colleges | 18.9% | |
State & Agency – Other | 7.7% | |
| Healthcare Revenue – Hospitals | 6.2% | |
| Utilities – Municipal Owned | 5.8% | |
| Credit quality of bonds (r) | ||
| AAA | 8.2% | |
| AA | 51.8% | |
| A | 27.6% | |
| BBB | 9.6% | |
| BB | 0.3% | |
| B | 0.3% | |
| Not Rated | 2.2% | |
| Portfolio facts | ||
| Average Duration (d)(i) | 9.2 | |
| Average Life (i)(m) | 17.3 yrs. | |
| Average Maturity (i)(m) | 19.1 yrs. | |
| Average Credit Quality of Rated Securities (long-term) (a) | A+ | |
MFS® Maryland Municipal Bond Fund
Portfolio structure (i)

| Top five industries (i) | ||
| Healthcare Revenue – Hospitals | 23.8% | |
| Universities – Colleges | 14.2% | |
| General Obligations – General Purpose | 8.9% | |
| Water & Sewer Utility Revenue | 7.8% | |
| Multi-Family Housing Revenue | 5.3% | |
| Credit quality of bonds (r) | ||
| AAA | 16.1% | |
| AA | 30.6% | |
| A | 24.2% | |
| BBB | 24.5% | |
| BB | 0.7% | |
| Not Rated | 3.9% | |
| Portfolio facts | ||
| Average Duration (d)(i) | 8.9 | |
| Average Life (i)(m) | 16.9 yrs. | |
| Average Maturity (i)(m) | 18.3 yrs. | |
| Average Credit Quality of Rated Securities (long-term) (a) | A+ | |
| (a) | The average credit quality of rated securities is based upon a market weighted average of portfolio holdings that are rated by public rating agencies. |
| (d) | Duration is a measure of how much a bond’s price is likely to fluctuate with general changes in interest rates, e.g., if rates rise 1.00%, a bond with a 5-year duration is likely to lose about 5.00% of its value. |
| (i) | For purposes of this presentation, the bond component includes accrued interest amounts and may be positively or negatively impacted by the equivalent exposure from any derivative holdings, if applicable. |
| (m) | The average maturity shown is calculated using the final stated maturity on the portfolio’s holdings without taking into account any holdings which have been pre-refunded or pre-paid to an earlier date or which have a mandatory put date prior to the stated maturity. The average life shown takes into account these earlier dates. |
| (r) | Each security is assigned a rating from Moody’s Investors Service. If not rated by Moody’s, the rating will be that assigned by Standard & Poor’s. Likewise, if not assigned a rating by Standard & Poor’s, it will be based on the rating assigned by Fitch, Inc. For those portfolios that hold a security which is not rated by any of the three agencies, the security is considered Not Rated. Holdings in U.S. Treasuries and government agency mortgage-backed securities, if any, are included in the “AAA”-rating category. Percentages are based on the total market value of investments as of 3/31/09. |
Percentages are based on net assets as of 3/31/09, unless otherwise noted.
The portfolio is actively managed and current holdings may be different.
3
Table of Contents
Portfolio Composition – continued
MFS® Massachusetts Municipal Bond Fund
Portfolio structure (i)

| Top five industries (i) | ||
| Universities – Colleges | 22.3% | |
| Healthcare Revenue – Hospitals | 13.3% | |
| General Obligations – General Purpose | 11.0% | |
| Water & Sewer Utility Revenue | 7.6% | |
| Multi-Family Housing Revenue | 7.6% | |
| Credit quality of bonds (r) | ||
| AAA | 11.0% | |
| AA | 47.0% | |
| A | 22.9% | |
| BBB | 14.6% | |
| BB | 1.2% | |
| B | 0.1% | |
| Not Rated | 3.2% | |
| Portfolio facts | ||
| Average Duration (d)(i) | 9.2 | |
| Average Life (i)(m) | 16.8 yrs. | |
| Average Maturity (i)(m) | 19.7 yrs. | |
| Average Credit Quality of Rated Securities (long-term) (a) | A+ | |
| (a) | The average credit quality of rated securities is based upon a market weighted average of portfolio holdings that are rated by public rating agencies. |
| (d) | Duration is a measure of how much a bond’s price is likely to fluctuate with general changes in interest rates, e.g., if rates rise 1.00%, a bond with a 5-year duration is likely to lose about 5.00% of its value. |
| (i) | For purposes of this presentation, the bond component includes accrued interest amounts and may be positively or negatively impacted by the equivalent exposure from any derivative holdings, if applicable. |
| (m) | The average maturity shown is calculated using the final stated maturity on the portfolio’s holdings without taking into account any holdings which have been pre-refunded or pre-paid to an earlier date or which have a mandatory put date prior to the stated maturity. The average life shown takes into account these earlier dates. |
| (r) | Each security is assigned a rating from Moody’s Investors Service. If not rated by Moody’s, the rating will be that assigned by Standard & Poor’s. Likewise, if not assigned a rating by Standard & Poor’s, it will be based on the rating assigned by Fitch, Inc. For those portfolios that hold a security which is not rated by any of the three agencies, the security is considered Not Rated. Holdings in U.S. Treasuries and government agency mortgage-backed securities, if any, are included in the “AAA”-rating category. Percentages are based on the total market value of investments as of 3/31/09. |
Percentages are based on net assets as of 3/31/09, unless otherwise noted.
The portfolio is actively managed and current holdings may be different.
4
Table of Contents
Market Environment
The global economy and financial markets experienced substantial deterioration and extraordinary volatility over the reporting period. Strong headwinds in the U.S. included accelerated deterioration in the housing market, anemic corporate investment, a rapidly declining job market, and a much tighter credit environment. During the period, a seemingly continuous series of tumultuous financial events hammered markets, including: the distressed sale of failing Bear Stearns to JPMorgan, the conservatorship of Government Sponsored Enterprises (GSEs) Fannie Mae and Freddie Mac, the bankruptcy of investment bank Lehman Brothers, the Federal Reserve Bank’s complex intervention of insurance company American International Group (AIG), the nationalization of several large European banks, the failure of Washington Mutual, the distressed sale of Wachovia, the virtual failure of Iceland’s banking sector, and the collapse of the global auto industry. As a result of this barrage of turbulent news, global equity markets pushed significantly lower and credit markets witnessed the worst dislocation since the beginning of the credit crisis. Though credit conditions and equity indices improved towards the end of the period, the state of financial and macroeconomic dislocation remained very severe.
While somewhat resilient during the first half of the period, the global economy and financial system increasingly experienced considerable negative spillovers from the U.S. slowdown. Not only did Europe and Japan show obvious signs of economic decline, the more powerful engine of global growth-emerging markets – also displayed weakening dynamics. The synchronized global downturn in economic activity experienced in the fourth quarter of 2008 and the first quarter of 2009 was among the most intense in the post-World War II period.
During the reporting period, the U.S. Federal Reserve Board cut interest rates aggressively and introduced a multitude of new lending facilities to alleviate ever-tightening credit markets, while the U.S. federal government designed and implemented fiscal stimulus packages. Although several other global central banks also cut rates during the early part of the reporting period, the dilemma of rising energy and food prices heightened concerns among central bankers that inflationary expectations might become unhinged despite weaker growth. Only later in the reporting period did rapidly slowing global growth result in a very precipitous decline in commodity prices, which significantly eased inflation and inflationary expectations. As inflationary concerns diminished in the face of global deleveraging, and equity and credit markets deteriorated more sharply, a coordinated rate cut marked the beginning of much more aggressive easing by the major global central banks. By the end of the period, several central banks had approached their lower bound on policy rates and were examining the implementation and ramifications of quantitative easing as a means to further loosen monetary policy to offset the continuing fall in global wealth.
The twelve months ended March 31, 2009 was a challenging period for the municipal bond market. During the first nine months of the fiscal year, the municipal bond market faced an unprecedented number of challenges which lead to a broad-based decline in bond prices, an increase in yields, and a significant increase in spreads between higher-rated securities and lower-rated or non-rated securities. Among the many factors leading to the decline in prices and the widening in credit spreads was the monoline bond insurers being downgraded from their AAA rating by at least one of the major credit rating services. This decline in credit rating led to an unwind in leverage by non-traditional participants in the municipal bond market which, when combined with a general deterioration in credit quality, led to a widening of credit spreads between higher-rated and lower-rated securities and, finally, significant redemptions by investors out of municipal bond mutual funds. However, after the turn of the calendar year, the supply-demand imbalance shifted. Mutual funds began to experience inflows and direct retail buying re-emerged. These factors, combined with a decline in the pace of leverage unwinds and expectations that the market provisions contained within the American Reinvestment and Recovery Act would provide support for the municipal market, led to a significant rebound in prices and a decline in yields.
Factors that affected performance
During the reporting period, duration (d) positioning relative to the Barclays Capital Municipal Bond Index, had a negative effect on relative performance for all funds except the Alabama, Arkansas, and Massachusetts funds where the effect was positive and the Georgia Fund where the effect was neutral.
Yield curve (y) positioning was also negative for all funds, with the exception of the Maryland Fund where the effect was neutral. In comparison to the benchmark, the negative impact was due to overweighted exposures to the middle part of the curve (represented by bonds with durations of 11- to 14- years). Credit quality was another negative factor for all funds with the exception of the Georgia Fund where the effect was neutral. This negative impact can be attributed to overweighted positions in “BBB” rated (s) bonds relative to the index.
Among the industry sectors, health care and industrials were notable detractors. The health care sector held back returns for all funds. The industrials sector was negative for all funds with the exception of the California Fund where the effect was neutral. The education sector hurt all funds except for the Alabama Fund where the effect was neutral. The general obligations sector hindered relative returns for the Alabama, Arkansas, Maryland, and Massachusetts funds.
5
Table of Contents
Management Review – continued
On the positive side, a lesser exposure to the tobacco sector boosted relative performance for all the funds except for the California and Florida funds where the effect was negative. The transportation sector aided performance for all funds, with the exception of the Arkansas and Georgia funds where the effect was neutral.
Respectfully,
Michael Dawson
Portfolio Manager
| (d) | Duration is a measure of how much a bond’s price is likely to fluctuate with general changes in interest rates, e.g., if rates rise 1.00%, a bond with a 5-year duration is likely to lose about 5.00% of its value. |
| (s) | Bonds rated “BBB”, “Baa”, or higher are considered investment grade; bonds rated “BB”, “Ba”, or below are considered non-investment grade. The primary source for bond quality ratings is Moody’s Investors Service. If not available, ratings by Standard & Poor’s are used, else ratings by Fitch, Inc. For securities which are not rated by any of the three agencies, the security is considered Not Rated. |
| (y) | A yield curve graphically depicts the yields of different maturity bonds of the same credit quality and type. A normal yield curve is upward-sloping, with short term-rates lower than long term rates. |
The views expressed in this report are those of the portfolio manager only through the end of the period of the report as stated on the cover and do not necessarily reflect the views of MFS or any other person in the MFS organization. These views are subject to change at any time based on market or other conditions, and MFS disclaims any responsibility to update such views. These views may not be relied upon as investment advice or an indication of trading intent on behalf of any MFS portfolio. References to specific securities are not recommendations of such securities, and may not be representative of any MFS portfolio’s current or future investments.
6
Table of Contents
PERFORMANCE SUMMARY THROUGH 3/31/09
The following charts illustrate a representative class of each fund’s historical performance in comparison to its benchmark(s). Performance results include the deduction of the maximum applicable sales charge and reflect the percentage change in net asset value, including reinvestment of dividends and capital gains distributions. Each fund's results have been compared to the Barclays Capital Municipal Bond Index (formerly known as Lehman Brothers Municipal Bond Index), a market-value-weighted index representative of the tax-exempt bond market. However, while this index is considered the benchmark for the performance of municipal bond funds, it is comprised of municipal bonds issued nationwide, while each of the funds is limited to investing in the bonds of a particular state. The performance of other share classes will be greater than or less than that of the class depicted below. Benchmarks are unmanaged and may not be invested in directly. Benchmark returns do not reflect sales charges, commissions or expenses. (See Notes to Performance Summary.)
Performance data shown represents past performance and is no guarantee of future results. Investment return and principal value fluctuate so your shares, when sold, may be worth more or less than the original cost; current performance may be lower or higher than quoted. The performance shown does not reflect the deduction of taxes, if any, that a shareholder would pay on fund distributions or the redemption of fund shares.
MFS® Alabama Municipal Bond Fund
Growth of a hypothetical $10,000 investment
MFS® Alabama Municipal Bond Fund
Average annual total returns through 3/31/09
Without sales charge
| Share class | Class inception date | 1-yr | 5-yr | 10-yr | ||||||||
| A | 2/01/90 | (0.59)% | 2.28% | 3.92% | ||||||||
| B | 9/07/93 | (1.34)% | 1.52% | 3.14% |
Comparative benchmark
| Barclays Capital Municipal Bond Index (f) | 2.27% | 3.21% | 4.59% | |||||||||
With sales charge
A With Initial Sales Charge (4.75%) | (5.32)% | 1.29% | 3.42% | |||||||||
B With CDSC (Declining over six years from 4% to 0%) (x) | (5.11)% | 1.18% | 3.14% | |||||||||
CDSC – Contingent Deferred Sales Charge.
| (f) | Source: FactSet Research Systems Inc. |
| (x) | Assuming redemption at the end of the applicable period. |
7
Table of Contents
Performance Summary – continued
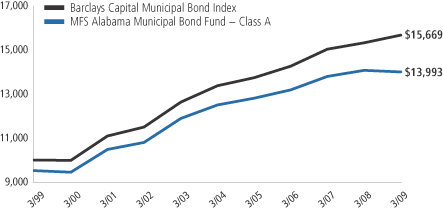
MFS® Arkansas Municipal Bond Fund
Growth of a hypothetical $10,000 investment
MFS® Arkansas Municipal Bond Fund
Average annual total returns through 3/31/09
Without sales charge
| Share class | Class inception date | 1-yr | 5-yr | 10-yr | ||||||||
| A | 2/03/92 | 1.61% | 2.79% | 4.18% | ||||||||
| B | 9/07/93 | 0.85% | 2.02% | 3.37% |
Comparative benchmark
| Barclays Capital Municipal Bond Index (f) | 2.27% | 3.21% | 4.59% | |||||||||
With sales charge
A With Initial Sales Charge (4.75%) | (3.22)% | 1.80% | 3.68% | |||||||||
B With CDSC (Declining over six years from 4% to 0%) (x) | (3.00)% | 1.68% | 3.37% | |||||||||
CDSC – Contingent Deferred Sales Charge.
| (f) | Source: FactSet Research Systems Inc. |
| (x) | Assuming redemption at the end of the applicable period. |
8
Table of Contents
Performance Summary – continued
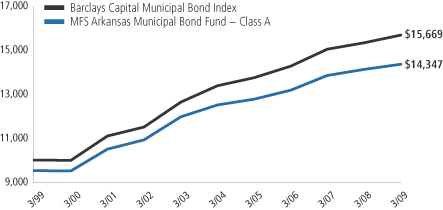
MFS® California Municipal Bond Fund
Growth of a hypothetical $10,000 investment
MFS® California Municipal Bond Fund
Average annual total returns through 3/31/09
Without sales charge
| Share class | Class inception date | 1-yr | 5-yr | 10-yr | ||||||||
| A | 6/18/85 | (2.66)% | 1.74% | 3.56% | ||||||||
| B | 9/07/93 | (3.39)% | 0.98% | 2.76% | ||||||||
| C | 1/03/94 | (3.70)% | 0.80% | 2.63% |
Comparative benchmark
| Barclays Capital Municipal Bond Index (f) | 2.27% | 3.21% | 4.59% | |||||||||
With sales charge
A With Initial Sales Charge (4.75%) | (7.28)% | 0.76% | 3.05% | |||||||||
B With CDSC (Declining over six years from 4% to 0%) (x) | (7.09)% | 0.65% | 2.76% | |||||||||
C With CDSC (1% for 12 months) (x) | (4.63)% | 0.80% | 2.63% | |||||||||
CDSC – Contingent Deferred Sales Charge.
| (f) | Source: FactSet Research Systems Inc. |
| (x) | Assuming redemption at the end of the applicable period. |
9
Table of Contents
Performance Summary – continued
MFS® Florida Municipal Bond Fund
Growth of a hypothetical $10,000 investment
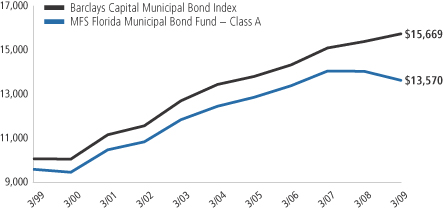
MFS® Florida Municipal Bond Fund
Average annual total returns through 3/31/09
Without sales charge
| Share class | Class inception date | 1-yr | 5-yr | 10-yr | ||||||||
| A | 2/03/92 | (2.84)% | 1.83% | 3.60% | ||||||||
| B | 9/07/93 | (3.59)% | 1.08% | 2.82% |
Comparative benchmark
| Barclays Capital Municipal Bond Index (f) | 2.27% | 3.21% | 4.59% | |||||||||
With sales charge
A With Initial Sales Charge (4.75%) | (7.46)% | 0.85% | 3.10% | |||||||||
B With CDSC (Declining over six years from 4% to 0%) (x) | (7.28)% | 0.74% | 2.82% | |||||||||
CDSC – Contingent Deferred Sales Charge.
| (f) | Source: FactSet Research Systems Inc. |
| (x) | Assuming redemption at the end of the applicable period. |
10
Table of Contents
Performance Summary – continued
MFS® Georgia Municipal Bond Fund
Growth of a hypothetical $10,000 investment
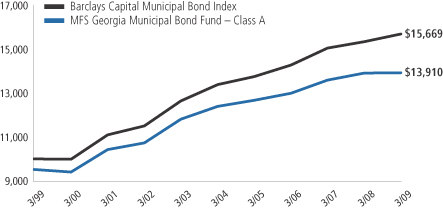
MFS® Georgia Municipal Bond Fund
Average annual total returns through 3/31/09
Without sales charge
| Share class | Class inception date | 1-yr | 5-yr | 10-yr | ||||||||
| A | 6/06/88 | 0.04% | 2.35% | 3.86% | ||||||||
| B | 9/07/93 | (0.79)% | 1.63% | 3.10% |
Comparative benchmark
| Barclays Capital Municipal Bond Index (f) | 2.27% | 3.21% | 4.59% | |||||||||
With sales charge
A With Initial Sales Charge (4.75%) | (4.71)% | 1.36% | 3.36% | |||||||||
B With CDSC (Declining over six years from 4% to 0%) (x) | (4.54)% | 1.29% | 3.10% | |||||||||
CDSC – Contingent Deferred Sales Charge.
| (f) | Source: FactSet Research Systems Inc. |
| (x) | Assuming redemption at the end of the applicable period. |
11
Table of Contents
Performance Summary – continued
MFS® Maryland Municipal Bond Fund
Growth of a hypothetical $10,000 investment
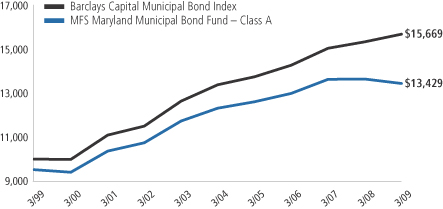
MFS® Maryland Municipal Bond Fund
Average annual total returns through 3/31/09
Without sales charge
| Share class | Class inception date | 1-yr | 5-yr | 10-yr | ||||||||
| A | 10/31/84 | (1.57)% | 1.75% | 3.49% | ||||||||
| B | 9/07/93 | (2.31)% | 1.07% | 2.82% |
Comparative benchmark
| Barclays Capital Municipal Bond Index (f) | 2.27% | 3.21% | 4.59% | |||||||||
With sales charge
A With Initial Sales Charge (4.75%) | (6.25)% | 0.77% | 2.99% | |||||||||
B With CDSC (Declining over six years from 4% to 0%) (x) | (6.06)% | 0.74% | 2.82% | |||||||||
CDSC – Contingent Deferred Sales Charge.
| (f) | Source: FactSet Research Systems Inc. |
| (x) | Assuming redemption at the end of the applicable period. |
12
Table of Contents
Performance Summary – continued
MFS® Massachusetts Municipal Bond Fund
Growth of a hypothetical $10,000 investment
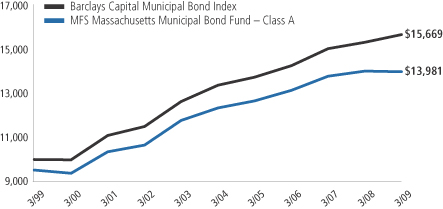
MFS® Massachusetts Municipal Bond Fund
Average annual total returns through 3/31/09
Without sales charge
| Share class | Class inception date | 1-yr | 5-yr | 10-yr | ||||||||
| A | 4/09/85 | (0.21)% | 2.54% | 3.91% | ||||||||
| B | 9/07/93 | (0.86)% | 1.87% | 3.25% |
Comparative benchmark
| Barclays Capital Municipal Bond Index (f) | 2.27% | 3.21% | 4.59% | |||||||||
With sales charge
A With Initial Sales Charge (4.75%) | (4.95)% | 1.54% | 3.41% | |||||||||
B With CDSC (Declining over six years from 4% to 0%) (x) | (4.65)% | 1.54% | 3.25% | |||||||||
CDSC – Contingent Deferred Sales Charge.
| (f) | Source: FactSet Research Systems Inc. |
| (x) | Assuming redemption at the end of the applicable period |
Notes to Performance Summary
Performance results reflect any applicable expense subsidies and waivers in effect during the periods shown. Without such subsidies and waivers each fund’s performance results would be less favorable. Please see the prospectus and financial statements for complete details.
A portion of income may be subject to state, federal, and/or alternative minimum tax. Capital gains, if any, are subject to a capital gains tax.
From time to time the funds may receive proceeds from litigation settlements, without which performance would be lower.
13
Table of Contents
Fund expenses borne by the shareholders during the period, October 1, 2008 through March 31, 2009
As a shareholder of the funds, you incur two types of costs: (1) transaction costs, including sales charges (loads) on certain purchase or redemption payments, and (2) ongoing costs, including management fees; distribution and service (12b-1) fees; and other fund expenses. These examples are intended to help you understand your ongoing costs (in dollars) of investing in the funds and to compare these costs with the ongoing costs of investing in other mutual funds.
These examples are based on an investment of $1,000 invested at the beginning of the period and held for the entire period October 1, 2008 through March 31, 2009.
Actual expenses
The first line for each share class in the following tables provides information about actual account values and actual expenses. You may use the information in this line, together with the amount you invested, to estimate the expenses that you paid over the period. Simply divide your account value by $1,000 (for example, an $8,600 account value divided by $1,000 = 8.6), then multiply the result by the number in the first line under the heading entitled “Expenses Paid During Period” to estimate the expenses you paid on your account during this period.
Hypothetical example for comparison purposes
The second line for each share class in the following tables provides information about hypothetical account values and hypothetical expenses based on each fund’s actual expense ratio and an assumed rate of return of 5% per year before expenses, which is not each fund’s actual return. The hypothetical account values and expenses may not be used to estimate the actual ending account balance or expenses you paid for the period. You may use this information to compare the ongoing costs of investing in each fund and other funds. To do so, compare this 5% hypothetical example with the 5% hypothetical examples that appear in the shareholder reports of the other funds.
Please note that the expenses shown in the tables are meant to highlight your ongoing costs only and do not reflect any transactional costs, such as sales charges (loads). Therefore, the second line for each share class in the tables is useful in comparing ongoing costs only, and will not help you determine the relative total costs of owning different funds. In addition, if these transactional costs were included, your costs would have been higher.
MFS® ALABAMA MUNICIPAL BOND FUND
| Share Class | Annualized Expense Ratio | Beginning Account Value 10/01/08 | Ending Account Value 3/31/09 | Expenses Paid During Period (p) 10/01/08-3/31/09 | ||||||
| A | Actual | 0.84% | $1,000.00 | $1,018.36 | $4.23 | |||||
| Hypothetical (h) | 0.84% | $1,000.00 | $1,020.74 | $4.23 | ||||||
| B | Actual | 1.59% | $1,000.00 | $1,014.59 | $7.99 | |||||
| Hypothetical (h) | 1.59% | $1,000.00 | $1,017.00 | $8.00 |
Expense Changes Impacting the Table
Changes to the fund’s fee arrangements occurred during the six month period. Had these fee changes been in effect throughout the entire six month period, the annualized expense ratios would have been 0.94% for Class A and 1.68% for Class B shares; the actual expenses paid during the period would have been approximately $4.73 for Class A and $8.43 for Class B shares; and the hypothetical expenses paid during the period would have been approximately $4.73 for Class A and $8.45 for Class B shares. For further information about the fund’s fee arrangements and changes to those fee arrangements, please see Note 3 in the Notes to Financial Statements.
| (h) | 5% class return per year before expenses. |
| (p) | Expenses paid is equal to each class’ annualized expense ratio, as shown above, multiplied by the average account value over the period, multiplied by the number of days in the period, divided by the number of days in the year. Expenses paid do not include any applicable sales charges (loads). If these transaction costs had been included, your costs would have been higher. |
14
Table of Contents
Expense Tables – continued
MFS® ARKANSAS MUNICIPAL BOND FUND
| Share Class | Annualized Expense Ratio | Beginning Account Value 10/01/08 | Ending Account Value 3/31/09 | Expenses Paid During Period (p) 10/01/08-3/31/09 | ||||||
| A | Actual | 0.64% | $1,000.00 | $1,040.27 | $3.26 | |||||
| Hypothetical (h) | 0.64% | $1,000.00 | $1,021.74 | $3.23 | ||||||
| B | Actual | 1.39% | $1,000.00 | $1,036.39 | $7.06 | |||||
| Hypothetical (h) | 1.39% | $1,000.00 | $1,018.00 | $6.99 |
Expense Changes Impacting the Table
Changes to the fund’s fee arrangements occurred during the six month period. Had these fee changes been in effect throughout the entire six month period, the annualized expense ratios would have been 0.76% for Class A and 1.51% for Class B shares; the actual expenses paid during the period would have been approximately $3.86 for Class A and $7.66 for Class B shares; and the hypothetical expenses paid during the period would have been approximately $3.83 for Class A and $7.59 for Class B shares. For further information about the fund’s fee arrangements and changes to those fee arrangements, please see Note 3 in the Notes to Financial Statements.
MFS® CALIFORNIA MUNICIPAL BOND FUND
| Share Class | Annualized Expense Ratio | Beginning Account Value 10/01/08 | Ending Account Value 3/31/09 | Expenses Paid During Period (p) 10/01/08-3/31/09 | ||||||
| A | Actual | 0.65% | $1,000.00 | $1,008.52 | $3.25 | |||||
| Hypothetical (h) | 0.65% | $1,000.00 | $1,021.69 | $3.28 | ||||||
| B | Actual | 1.38% | $1,000.00 | $1,004.85 | $6.90 | |||||
| Hypothetical (h) | 1.38% | $1,000.00 | $1,018.05 | $6.94 | ||||||
| C | Actual | 1.55% | $1,000.00 | $1,002.07 | $7.74 | |||||
| Hypothetical (h) | 1.55% | $1,000.00 | $1,017.20 | $7.80 |
Expense Changes Impacting the Table
Changes to the fund’s fee arrangements occurred during the six month period. Had these fee changes been in effect throughout the entire six month period, the annualized expense ratios would have been 0.77% for Class A, 1.51% for Class B and 1.67% for Class C shares; the actual expenses paid during the period would have been approximately $3.85 for Class A, $7.54 for Class B, and $8.33 for Class C shares; and the hypothetical expenses paid during the period would have been approximately $3.88 for Class A, $7.59 for Class B, and $8.40 for Class C shares. For further information about the fund’s fee arrangements and changes to those fee arrangements, please see Note 3 in the Notes to Financial Statements.
| (h) | 5% class return per year before expenses. |
| (p) | Expenses paid is equal to each class’ annualized expense ratio, as shown above, multiplied by the average account value over the period, multiplied by the number of days in the period, divided by the number of days in the year. Expenses paid do not include any applicable sales charges (loads). If these transaction costs had been included, your costs would have been higher. |
15
Table of Contents
Expense Tables – continued
MFS® FLORIDA MUNICIPAL BOND FUND
| Share Class | Annualized Expense Ratio | Beginning Account Value 10/01/08 | Ending Account Value 3/31/09 | Expenses Paid During Period (p) 10/01/08-3/31/09 | ||||||
| A | Actual | 0.67% | $1,000.00 | $1,008.39 | $3.35 | |||||
| Hypothetical (h) | 0.67% | $1,000.00 | $1,021.59 | $3.38 | ||||||
| B | Actual | 1.44% | $1,000.00 | $1,004.49 | $7.20 | |||||
| Hypothetical (h) | 1.44% | $1,000.00 | $1,017.75 | $7.24 |
Expense Changes Impacting the Table
Changes to the fund’s fee arrangements occurred during the six month period. Had these fee changes been in effect throughout the entire six month period, the annualized expense ratios would have been 0.79% for Class A and 1.56% for Class B shares. The actual expenses paid during the period would have been approximately $3.95 for Class A and $7.79 for Class B shares; and the hypothetical expenses paid during the period would have been approximately $3.98 for Class A and $7.85 for Class B shares. For further information about the fund’s fee arrangements and changes to those fee arrangements, please see Note 3 in the Notes to Financial Statements.
MFS® GEORGIA MUNICIPAL BOND FUND
| Share Class | Annualized Expense Ratio | Beginning Account Value 10/01/08 | Ending Account Value 3/31/09 | Expenses Paid During Period (p) 10/01/08-3/31/09 | ||||||
| A | Actual | 0.93% | $1,000.00 | $1,027.57 | $4.70 | |||||
| Hypothetical (h) | 0.93% | $1,000.00 | $1,020.29 | $4.68 | ||||||
| B | Actual | 1.67% | $1,000.00 | $1,023.72 | $8.43 | |||||
| Hypothetical (h) | 1.67% | $1,000.00 | $1,016.60 | $8.40 |
Expense Changes Impacting the Table
Changes to the fund’s fee arrangements occurred during the six month period. Had these fee changes been in effect throughout the entire six month period, the annualized expense ratios would have been 1.01% for Class A and 1.76% for Class B shares. The actual expenses paid during the period would have been approximately $5.10 for Class A and $8.88 for Class B shares; and the hypothetical expenses paid during the period would have been approximately $5.09 for Class A and $8.85 for Class B shares. For further information about the fund’s fee arrangements and changes to those fee arrangements, please see Note 3 in the Notes to Financial Statements.
| (h) | 5% class return per year before expenses. |
| (p) | Expenses paid is equal to each class’ annualized expense ratio, as shown above, multiplied by the average account value over the period, multiplied by the number of days in the period, divided by the number of days in the year. Expenses paid do not include any applicable sales charges (loads). If these transaction costs had been included, your costs would have been higher. |
16
Table of Contents
Expense Tables – continued
MFS® MARYLAND MUNICIPAL BOND FUND
| Share Class | Annualized Expense Ratio | Beginning Account Value 10/01/08 | Ending Account Value 3/31/09 | Expenses Paid During Period (p) 10/01/08-3/31/09 | ||||||
| A | Actual | 0.93% | $1,000.00 | $1,013.67 | $4.67 | |||||
| Hypothetical (h) | 0.93% | $1,000.00 | $1,020.29 | $4.68 | ||||||
| B | Actual | 1.59% | $1,000.00 | $1,009.32 | $7.97 | |||||
| Hypothetical (h) | 1.59% | $1,000.00 | $1,017.00 | $8.00 |
Expense Changes Impacting the Table
Changes to the fund’s fee arrangements occurred during the six month period. Had these fee changes been in effect throughout the entire six month period, the annualized expense ratios would have been 0.96% for Class A and 1.70% for Class B shares. The actual expenses paid during the period would have been approximately $4.82 for Class A and $8.51 for Class B shares; and the hypothetical expenses paid during the period would have been approximately $4.84 for Class A and $8.55 for Class B shares. For further information about the fund’s fee arrangements and changes to those fee arrangements, please see Note 3 in the Notes to Financial Statements.
MFS® MASSACHUSETTS MUNICIPAL BOND FUND
| Share Class | Annualized Expense Ratio | Beginning Account Value 10/01/08 | Ending Account Value 3/31/09 | Expenses Paid During Period (p) 10/01/08-3/31/09 | ||||||
| A | Actual | 0.87% | $1,000.00 | $1,025.87 | $4.39 | |||||
| Hypothetical (h) | 0.87% | $1,000.00 | $1,020.59 | $4.38 | ||||||
| B | Actual | 1.54% | $1,000.00 | $1,022.45 | $7.77 | |||||
| Hypothetical (h) | 1.54% | $1,000.00 | $1,017.25 | $7.75 |
Expense Changes Impacting the Table
Changes to the fund’s fee arrangements occurred during the six month period. Had these fee changes been in effect throughout the entire six month period, the annualized expense ratios would have been 0.92% for Class A and 1.66% for Class B shares. The actual expenses paid during the period would have been approximately $4.65 for Class A and $8.37 for Class B shares; and the hypothetical expenses paid during the period would have been approximately $4.63 for Class A and $8.35 for Class B shares. For further information about the fund’s fee arrangements and changes to those fee arrangements, please see Note 3 in the Notes to Financial Statements.
| (h) | 5% class return per year before expenses. |
| (p) | Expenses paid is equal to each class’ annualized expense ratio, as shown above, multiplied by the average account value over the period, multiplied by the number of days in the period, divided by the number of days in the year. Expenses paid do not include any applicable sales charges (loads). If these transaction costs had been included, your costs would have been higher. |
17
Table of Contents
3/31/09
MFS® ALABAMA MUNICIPAL BOND FUND
The Portfolio of Investments is a complete list of all securities owned by your fund. It is categorized by broad-based asset classes.
| Municipal Bonds - 96.1% | ||||||
| Issuer | Shares/Par | Value ($) | ||||
| Airport & Port Revenue - 1.4% | ||||||
| Alabama Port Authority Docks Facility, MBIA, 5.25%, 2011 (c) | $ | 1,000,000 | $ | 1,088,650 | ||
| General Obligations - General Purpose - 8.9% | ||||||
| Auburn, AL, Sewer Rev., “H”, 5.625%, 2033 | $ | 1,000,000 | $ | 1,038,810 | ||
| Boaz, AL, School Warrants, “A”, XLCA, 5%, 2029 | 650,000 | 622,804 | ||||
| Commonwealth of Puerto Rico, “A”, 5.375%, 2033 | 180,000 | 143,681 | ||||
| Commonwealth of Puerto Rico, “A”, 6%, 2038 | 305,000 | 264,322 | ||||
| Fairfield, AL, Refunding Warrants, AMBAC, 5.25%, 2025 | 1,030,000 | 1,062,218 | ||||
| Mobile County, AL, 6%, 2009 (c) | 1,345,000 | 1,369,546 | ||||
| Palm Beach County, FL, Public Improvement Rev., 5%, 2038 | 1,120,000 | 1,067,214 | ||||
| Tuscaloosa, AL, AMBAC, 4.375%, 2037 | 500,000 | 423,925 | ||||
| Tuscaloosa, AL, “A”, 5.125%, 2039 | 750,000 | 731,498 | ||||
| $ | 6,724,018 | |||||
| General Obligations - Improvement - 4.4% | ||||||
| Birmingham, AL, “A”, 5.75%, 2017 | $ | 1,000,000 | $ | 1,048,590 | ||
| Birmingham, AL, “A”, AMBAC, 4.5%, 2032 | 890,000 | 729,515 | ||||
| Birmingham, AL, “B”, AMBAC, 5%, 2030 | 560,000 | 527,061 | ||||
| Montgomery, AL, Warrants, MBIA, 5.1%, 2021 | 1,005,000 | 1,035,200 | ||||
| $ | 3,340,366 | |||||
| General Obligations - Schools - 7.7% | ||||||
| Bessemer, AL, School Warrants, AMBAC, 5.5%, 2020 | $ | 2,015,000 | $ | 2,050,666 | ||
| Huntsville, AL, School Warrants “B”, 5%, 2029 | 500,000 | 511,280 | ||||
| Jefferson County, AL, School Warrants, FSA, 5.5%, 2020 | 1,750,000 | 1,339,100 | ||||
| Lee County, AL, School Warrants, ASSD GTY, 4.75%, 2029 | 880,000 | 863,324 | ||||
| Madison County, AL, Board of Education, ASSD GTY, 5.125%, 2034 | 1,000,000 | 993,630 | ||||
| $ | 5,758,000 | |||||
| Healthcare Revenue - Hospitals - 12.4% | ||||||
| Alabama Special Care Facilities Financing Authority (Ascension Health Senior Credit), “C-2”, 5%, 2036 | $ | 750,000 | $ | 659,520 | ||
| Alabama Special Care Facilities Financing Authority (Daughters of Charity), ETM, AMBAC, 5%, 2025 (c) | 1,500,000 | 1,504,275 | ||||
| Alabama Special Care Facilities Financing Authority Rev. (Ascension Health), BHAC, 5%, 2039 | 750,000 | 730,463 | ||||
| Alexander City, AL, Special Care Facilities Financing Authority Medical Facilities Rev., “A” (Russell Hospital Corp.), 5.75%, 2036 | 500,000 | 308,575 | ||||
| Birmingham, AL, Baptist Medical Center, Special Care Facilities Rev. (Baptist Health Systems, Inc.), “A”, 5%, 2030 | 700,000 | 423,409 | ||||
| Issuer | Shares/Par | Value ($) | ||||
| Healthcare Revenue - Hospitals - continued | ||||||
| East Alabama Health Care Authority, Health Care Facilities Rev., FRN, 5.25%, 2036 (b) | $ | 1,000,000 | $ | 935,670 | ||
| Health Care Authority for Baptist Health, AL, “D”, 5%, 2021 | 400,000 | 350,028 | ||||
| Huntsville, AL, Health Care Authority Rev., 5.625%, 2011 (c) | 1,050,000 | 1,154,045 | ||||
| Lauderdale County & Florence, AL, Health Care Authority Rev., “A” (Coffee Health Group), MBIA, 5.75%, 2014 | 1,000,000 | 1,006,150 | ||||
| Louisville & Jefferson County, KY, Metropolitan Government Healthcare Systems Rev. (Norton Healthcare, Inc.), 5.25%, 2036 | 445,000 | 343,905 | ||||
| Marshall County, AL, Health Care Authority Rev., “A”, 5.75%, 2032 | 1,065,000 | 923,025 | ||||
| Montgomery, AL, Medical Clinic Board Health Care Facility Rev. (Jackson Hospital & Clinic), 5.25%, 2031 | 500,000 | 356,110 | ||||
| University of Alabama at Birmingham, AL, Hospital Rev., “A”, 5.25%, 2025 | 500,000 | 443,700 | ||||
| Valley, AL, Special Care Facilities Financing Authority, “A” (Lanier Memorial Hospital), 5.65%, 2022 | 225,000 | 168,440 | ||||
| $ | 9,307,315 | |||||
| Industrial Revenue - Metals - 0.7% | ||||||
| Mobile County, AL, Industrial Development Authority Rev. (Ipsco, Inc.), 6.875%, 2010 (c) | $ | 500,000 | $ | 528,065 | ||
| Industrial Revenue - Other - 0.5% | ||||||
| Fairfield, AL, Environment Improvement Rev. (USX Corp.), FRN, 5.4%, 2016 | $ | 400,000 | $ | 407,920 | ||
| Industrial Revenue - Paper - 2.1% | ||||||
| Butler, AL, Industrial Development Board, Solid Waste Disposal Rev. (Georgia Pacific Corp.), 5.75%, 2028 | $ | 200,000 | $ | 108,134 | ||
| Camden, AL, Industrial Development Board Exempt Facilities Rev., “B” (Weyerhaeuser Co.), 6.375%, 2013 (c) | 500,000 | 574,045 | ||||
| Phenix City, AL, Industrial Development Board Environmental Improvement Rev., “A” (MeadWestvaco Coated), 6.35%, 2035 | 750,000 | 465,023 | ||||
| Selma, AL, Industrial Development Board, “A” (International Paper Co.), 6.7%, 2018 | 500,000 | 405,550 | ||||
| $ | 1,552,752 | |||||
| Miscellaneous Revenue - Other - 0.8% | ||||||
| Birmingham, AL, Downtown Redevelopment Authority Rev. (Social Security Administrative Building), ETM, 12.5%, 2010 (c) | $ | 560,000 | $ | 593,947 | ||
18
Table of Contents
Portfolio of Investments – continued
| Municipal Bonds - continued | ||||||
| Issuer | Shares/Par | Value ($) | ||||
| Multi-Family Housing Revenue - 2.6% | ||||||
| Alabama Housing Finance Authority, Multi-Family Residential Development Rev., FHA, 7.25%, 2023 | $ | 960,000 | $ | 971,270 | ||
| Alabama Housing Finance Authority, Multi-Family Residential Development Rev., “K” (South Bay Apartments), FNMA, 5.875%, 2021 | 960,000 | 974,851 | ||||
| $ | 1,946,121 | |||||
| Sales & Excise Tax Revenue - 1.4% | ||||||
| Massachusetts Bay Transportation Authority, Sales Tax Rev., “A-1”, 5.25%, 2029 | $ | 500,000 | $ | 524,905 | ||
| Puerto Rico Sales Tax Financing Corp., Sales Tax Rev., 0%, 2056 | 5,960,000 | 203,892 | ||||
| Puerto Rico Sales Tax Financing Corp., Sales Tax Rev., 5.25%, 2057 | 400,000 | 325,352 | ||||
| $ | 1,054,149 | |||||
| Single Family Housing - State - 1.6% | ||||||
| Alabama Housing Finance Authority, Collateral Home Mortgage Bond Program II, “B”, 5.15%, 2019 | $ | 40,000 | $ | 40,341 | ||
| Alabama Housing Finance Authority, Single Family Mortgage Rev., “B”, GNMA, 5.375%, 2033 | 750,000 | 735,487 | ||||
| Alabama Housing Finance Authority, Single Family Mortgage Rev., Collateral Home Mortgage Bond Program II, “A-2”, GNMA, 5.4%, 2022 | 410,000 | 409,861 | ||||
| Alabama Housing Finance Authority, Single Family Mortgage Rev., Collateral Home Mortgage Bond Program II, “B”, 5.15%, 2019 | 40,000 | 40,308 | ||||
| $ | 1,225,997 | |||||
| State & Local Agencies - 6.7% | ||||||
| Alabama Building Renovation Authority, AMBAC, 6%, 2014 | $ | 1,515,000 | $ | 1,566,358 | ||
| Alabama Public School & College, Capital Improvement, “C”, 5.75%, 2017 | 1,000,000 | 1,022,110 | ||||
| Alabama Public School & College, Capital Improvement, “C”, 5.75%, 2018 | 1,035,000 | 1,057,335 | ||||
| Leeds Public Educational Building Authority, Educational Facilities Rev., ASSD GTY, 5.125%, 2033 | 500,000 | 487,530 | ||||
| Mississippi Development Bank Special Obligation (Harrison County), “D”, ASSD GTY, 4.75%, 2028 | 905,000 | 893,669 | ||||
| Mississippi Development Bank Special Obligation (Hinds Community College), ASSD GTY, 5.375%, 2033 | 20,000 | 20,008 | ||||
| $ | 5,047,010 | |||||
| Tax - Other - 1.2% | ||||||
| Virgin Islands Public Finance Authority, “A”, 5.5%, 2018 | $ | 1,000,000 | $ | 914,220 | ||
| Toll Roads - 1.0% | ||||||
| Bay Area Toll Authority, Toll Bridge Rev. (San Francisco Bay Area), “F1”, 5%, 2039 | $ | 770,000 | $ | 716,947 | ||
| Issuer | Shares/Par | Value ($) | ||||
| Universities - Colleges - 16.8% | ||||||
| Alabama Private Colleges & Universities, Facilities Authority Rev. (Tuskegee University), ASSD GTY, 4.75%, 2026 | $ | 700,000 | $ | 699,972 | ||
| Alabama State University Rev., General Tuition & Fee, ASSD GTY, 5%, 2038 | 1,000,000 | 977,470 | ||||
| Auburn University, General Fee Rev., AMBAC, 5%, 2029 | 1,000,000 | 1,004,900 | ||||
| Auburn University, General Fee Rev., FSA, 5%, 2038 | 2,000,000 | 1,966,700 | ||||
| Massachusetts Health & Educational Facilities Authority Rev. (Massachusetts Institute of Technology), “I-1”, 5.2%, 2028 | 720,000 | 780,451 | ||||
| Mobile, AL, Spring Hill College, Educational Building Authority Rev., “A”, 5.25%, 2034 | 1,360,000 | 1,266,242 | ||||
| New York Dormitory Authority Rev., Non State Supported Debt (New York University), “A”, 5.25%, 2048 | 830,000 | 812,371 | ||||
| University of Alabama, Birmingham Hospital Rev., “A”, MBIA, 5%, 2041 | 1,650,000 | 1,348,611 | ||||
| University of Alabama, General Rev., MBIA, 5%, 2034 | 1,000,000 | 959,770 | ||||
| University of Alabama, General Rev., “A”, MBIA, 5%, 2029 | 1,000,000 | 994,880 | ||||
| University of California Rev., “J”, FSA, 4.5%, 2035 | 760,000 | 655,796 | ||||
| University of South Alabama, University Rev., AMBAC, 5%, 2029 | 1,000,000 | 1,003,720 | ||||
| University of South Alabama, University Rev., BHAC, 5%, 2038 | 150,000 | 148,848 | ||||
| $ | 12,619,731 | |||||
| Utilities - Municipal Owned - 7.1% | ||||||
| Alabama Municipal Electric Power Authority, “A”, MBIA, 5%, 2023 | $ | 1,000,000 | $ | 1,015,100 | ||
| Guam Power Authority Rev., AMBAC, 5%, 2018 | 3,500,000 | 3,007,830 | ||||
| Long Island Power Authority, Electric Systems Rev., “A”, BHAC, 5.5%, 2033 | 390,000 | 403,088 | ||||
| Long Island Power Authority, Electric Systems Rev., “A”, 6%, 2033 | 130,000 | 134,260 | ||||
| Puerto Rico Electric Power Authority, Power Rev., “V”, FSA, 5.25%, 2027 | 450,000 | 444,245 | ||||
| Tuskegee, AL, Utilities Board, AMBAC, 5.5%, 2022 | 400,000 | 360,992 | ||||
| $ | 5,365,515 | |||||
| Utilities - Other - 1.4% | ||||||
| Foley, AL, Utilities Board Utilities Rev., FSA, 5%, 2025 | $ | 1,000,000 | $ | 1,021,880 | ||
| Water & Sewer Utility Revenue - 17.4% | ||||||
| Alabama Drinking Water Finance Authority, Revolving Fund Loan, “A”, AMBAC, 6%, 2021 | $ | 725,000 | $ | 749,730 | ||
| Alabama Drinking Water Finance Authority, Revolving Fund Loan, “C”, AMBAC, 5.75%, 2018 | 1,000,000 | 1,051,760 | ||||
| Alabama Water Pollution Control Authority, Revolving Fund Loan, AMBAC, 5.75%, 2019 | 1,000,000 | 1,009,080 | ||||
| Alabaster, AL, Sewer Rev., MBIA, 5%, 2029 | 750,000 | 731,490 | ||||
19
Table of Contents
Portfolio of Investments – continued
| Municipal Bonds - continued | ||||||
| Issuer | Shares/Par | Value ($) | ||||
| Water & Sewer Utility Revenue - continued | ||||||
| Bessemer, AL, Governmental Utilities Services Corp. Water Supply Rev., ASSD GTY, 4.75%, 2033 | $ | 1,500,000 | $ | 1,344,585 | ||
| Bessemer, AL, Governmental Utilities Services Corp. Water Supply Rev., ASSD GTY, 5%, 2039 | 1,000,000 | 936,470 | ||||
| Birmingham, AL, Waterworks & Sewer Board Rev., “A”, FGIC, 5%, 2034 | 1,365,000 | 1,247,241 | ||||
| Birmingham, AL, Waterworks & Sewer Board Rev., “A”, FSA, 4.5%, 2035 | 400,000 | 339,688 | ||||
| Birmingham, AL, Waterworks & Sewer Board Rev., “A”, FSA, 5%, 2040 | 1,190,000 | 1,105,439 | ||||
| Commonwealth of Puerto Rico Aqueduct & Sewer Authority Rev., “A”, ASSD GTY, 5%, 2028 | 400,000 | 379,132 | ||||
| Commonwealth of Puerto Rico Aqueduct & Sewer Authority Rev., “A”, 6%, 2044 | 2,000,000 | 1,679,420 | ||||
| Huntsville, AL, Water System Rev., FSA, 5%, 2033 | 1,000,000 | 1,002,860 | ||||
| Montgomery, AL, Waterworks & Sanitary Sewer Board Rev., FSA, 5%, 2024 | 1,000,000 | 1,037,740 | ||||
| South Blount County, TN, Utility District Waterworks Rev., FSA, 5.25%, 2039 | 465,000 | 454,570 | ||||
| $ | 13,069,205 | |||||
| Total Municipal Bonds (Identified Cost, $74,795,810) | $ | 72,281,808 | ||||
| Money Market Funds (v) - 2.6% | |||||
| Issuer | Shares/Par | Value ($) | |||
| MFS Institutional Money Market Portfolio, 0.23%, at Cost and Net Asset Value | 1,959,869 | $ | 1,959,869 | ||
| Total Investments (Identified Cost, $76,755,679) | $ | 74,241,677 | |||
| Other Assets, Less Liabilities - 1.3% | 962,755 | ||||
| Net Assets - 100.0% | $ | 75,204,432 | |||
See Portfolio Footnotes and Notes to Financial Statements
20
Table of Contents
PORTFOLIO OF INVESTMENTS
3/31/09
MFS® ARKANSAS MUNICIPAL BOND FUND
The Portfolio of Investments is a complete list of all securities owned by your fund. It is categorized by broad-based asset classes.
| Municipal Bonds - 96.2% | ||||||
| Issuer | Shares/Par | Value ($) | ||||
| Airport & Port Revenue - 0.5% | ||||||
| Little Rock, AR, Airport Rev., “A”, FSA, 5.25%, 2019 | $ | 800,000 | $ | 802,944 | ||
| General Obligations - General Purpose - 8.9% | ||||||
| Arkansas College Savings, “A”, ETM, 0%, 2017 (c) | $ | 1,840,000 | $ | 1,406,404 | ||
| Commonwealth of Puerto Rico, “A”, 5.25%, 2027 | 1,145,000 | 933,072 | ||||
| Commonwealth of Puerto Rico, “A”, 5.375%, 2033 | 335,000 | 267,407 | ||||
| Commonwealth of Puerto Rico, “A”, 6%, 2038 | 560,000 | 485,313 | ||||
| Commonwealth of Puerto Rico, Public Improvement, MBIA, 5.75%, 2010 (c) | 6,000,000 | 6,351,480 | ||||
| Commonwealth of Puerto Rico, Public Improvement, “A”, CIFG, 5%, 2034 | 395,000 | 297,056 | ||||
| Little Rock, AR, Library Construction and Improvement, 5%, 2027 | 500,000 | 505,430 | ||||
| Little Rock, AR, Library Construction and Improvement, 5%, 2028 | 500,000 | 501,530 | ||||
| Puerto Rico Public Buildings Authority Rev. (State Office Building), “F”, XLCA, 5.25%, 2025 | 2,000,000 | 1,629,220 | ||||
| Puerto Rico Public Buildings Authority Rev., Guaranteed, “M”, 6.25%, 2023 | 385,000 | 366,362 | ||||
| Puerto Rico Public Buildings Authority Rev., Guaranteed, “M”, 6.25%, 2031 | 420,000 | 382,767 | ||||
| $ | 13,126,041 | |||||
| General Obligations - Improvement - 0.1% | ||||||
| Guam Government, “A”, 5.25%, 2037 | $ | 255,000 | $ | 167,448 | ||
| General Obligations - Schools - 6.8% | ||||||
| Arkansas, Capital Appreciation, College Savings, “B”, ETM, 0%, 2012 (c) | $ | 1,200,000 | $ | 1,134,984 | ||
| Arkansas, Capital Appreciation, College Savings, “B”, ETM, 0%, 2013 (c) | 1,000,000 | 912,980 | ||||
| Arkansas, Capital Appreciation, College Savings, “B”, ETM, 0%, 2014 (c) | 1,150,000 | 1,006,975 | ||||
| Arkansas, Capital Appreciation, College Savings, “B”, ETM, 0%, 2015 (c) | 1,100,000 | 925,683 | ||||
| Benton, AR, School District No. 8, 4.85%, 2040 | 1,895,000 | 1,782,456 | ||||
| Cabot, AR, School District No. 4, Lonoke County, “A”, N, AMBAC, 4.7%, 2038 | 1,500,000 | 1,384,305 | ||||
| Little Rock, AR, School District, “A”, FSA, 5.4%, 2010 (c) | 1,000,000 | 1,040,850 | ||||
| Northwest Arkansas Community College District, Capital Improvement, AMBAC, 5%, 2028 | 1,380,000 | 1,366,517 | ||||
| Pine Bluff, AR, School District Construction, MBIA, 4.75%, 2033 | 565,000 | 509,268 | ||||
| $ | 10,064,018 | |||||
| Issuer | Shares/Par | Value ($) | ||||
| Healthcare Revenue - Hospitals - 11.1% | ||||||
| Arkansas Development Finance Authority Rev. (Washington Regional Medical Center), 7.25%, 2010 (c) | $ | 500,000 | $ | 521,210 | ||
| Arkansas Development Finance Authority, Health Refunding Rev. (Sister of Mercy), “A”, MBIA, 5%, 2013 | 3,895,000 | 4,054,189 | ||||
| Batesville, AR, Medical District Rev. (White River Medical Center), 5.5%, 2024 | 750,000 | 598,935 | ||||
| Baxter County, AR, Hospital Rev. (Baxter Regional Hospital), 5%, 2026 | 1,000,000 | 759,100 | ||||
| Colorado Health Facilities Authority Rev. (Poudre Valley Health Care, Inc.), “B”, FSA, 5.25%, 2036 | 1,215,000 | 1,057,220 | ||||
| Crittenden County, AR, Hospital Rev., Refunding & Improvement, 7.15%, 2010 (c) | 750,000 | 814,785 | ||||
| District of Columbia Hospital Rev. (Children’s Hospital Obligated Group), FSA, 5.25%, 2045 (f) | 2,500,000 | 2,197,325 | ||||
| Illinois Finance Authority Rev. (Children’s Memorial Hospital), “A”, ASSD GTY, 5.25%, 2047 | 825,000 | 692,373 | ||||
| Indiana Finance Authority Rev. (Sisters of St. Francis Health Services), 5.375%, 2032 | 1,085,000 | 1,006,446 | ||||
| Jefferson County, AR, Hospital Rev., Refunding & Improvement (Regional Medical Center), 5.8%, 2021 | 1,000,000 | 1,009,190 | ||||
| Little Rock, AR, Health Facilities Hospital Board Rev. (Baptist Medical Center), 6.9%, 2009 | 400,000 | 410,512 | ||||
| Louisville & Jefferson County, KY, Metropolitan Government Healthcare Systems Rev. (Norton Healthcare, Inc.), 5.25%, 2036 | 860,000 | 664,625 | ||||
| North Little Rock, AR, Health Facilities Board Rev. (Baptist Health Facilities), 5.7%, 2022 | 500,000 | 502,245 | ||||
| Ohio State Higher Educational Facility Commission Rev. (University Hospital Health System), 6.75%, 2039 | 685,000 | 676,506 | ||||
| Sebastian County, AR, Health Facilities Improvement Rev. (Sparks Regional Medical Center), “A”, 5.25%, 2021 | 1,000,000 | 599,270 | ||||
| Washington County, AR, Hospital Rev. (Regional Medical Center), “A”, 5%, 2035 | 1,000,000 | 780,260 | ||||
| $ | 16,344,191 | |||||
| Industrial Revenue - Other - 0.2% | ||||||
| Virgin Islands Public Finance Authority, Refinery Facilities Rev. (Hovensa Coker Project), 5.875%, 2022 | $ | 335,000 | $ | 228,688 | ||
| Industrial Revenue - Paper - 0.4% | ||||||
| Arkansas Development Finance Authority, Industrial Facilities Rev. (Potlatch Corp.), “A”, 7.75%, 2025 | $ | 250,000 | $ | 185,040 | ||
| Pine Bluff, AR, Environmental Improvement (International Paper Co.), “A”, 5.55%, 2022 | 250,000 | 164,200 | ||||
21
Table of Contents
Portfolio of Investments – continued
| Municipal Bonds - continued | ||||||
| Issuer | Shares/Par | Value ($) | ||||
| Industrial Revenue - Paper - continued | ||||||
| Pine Bluff, AR, Environmental Refunding (International Paper Co.), “A”, 6.7%, 2020 | $ | 300,000 | $ | 232,548 | ||
| $ | 581,788 | |||||
| Multi-Family Housing Revenue - 0.7% | ||||||
| Fort Smith, AR, Residential Housing Facilities Board Rev. (Gorman Towers), “A”, GNMA, 5.45%, 2037 | $ | 1,000,000 | $ | 991,370 | ||
| Sales & Excise Tax Revenue - 1.5% | ||||||
| Massachusetts Bay Transportation Authority, Sales Tax Rev., “A-1”, 5.25%, 2029 | $ | 1,000,000 | $ | 1,049,810 | ||
| Puerto Rico Sales Tax Financing Corp., Sales Tax Rev., 0%, 2056 | 9,770,000 | 334,232 | ||||
| Puerto Rico Sales Tax Financing Corp., Sales Tax Rev., 5.25%, 2057 | 1,010,000 | 821,514 | ||||
| $ | 2,205,556 | |||||
| Single Family Housing - Local - 6.7% | ||||||
| Harrison, AR, Residential Housing Facilities Board, Single Family Mortgage Rev., ETM, FGIC, 7.4%, 2011 (c) | $ | 4,000,000 | $ | 4,596,880 | ||
| Lonoke County, AR, Residential Housing Facilities Rev., “A-2”, FNMA, 7.9%, 2011 | 16,381 | 16,455 | ||||
| Pulaski County, AR, Public Facilities Board Rev., “A”, GNMA, 5.75%, 2034 | 1,780,000 | 1,761,132 | ||||
| Pulaski County, AR, Public Facilities Board Rev., “C”, FNMA, 0%, 2014 | 2,750,000 | 2,197,498 | ||||
| Sherwood, AR, Residential Housing Facilities Board, Single Family Rev., MBIA, 7.5%, 2010 (c) | 1,250,000 | 1,351,300 | ||||
| $ | 9,923,265 | |||||
| Single Family Housing - State - 6.1% | ||||||
| Arkansas Development Finance Authority Rev., Mortgage Backed Securities Program, “B”, GNMA, 5%, 2029 | $ | 160,000 | $ | 149,653 | ||
| Arkansas Development Finance Authority Rev., Mortgage Backed Securities Program, “B”, GNMA, 4.45%, 2034 | 360,000 | 358,078 | ||||
| Arkansas Development Finance Authority Rev., Mortgage Backed Securities Program, “C”, GNMA, 5.35%, 2027 | 1,560,000 | 1,512,170 | ||||
| Arkansas Development Finance Authority Rev., Mortgage Backed Securities Program, “C”, 5.625%, 2035 | 1,420,000 | 1,402,719 | ||||
| Arkansas Development Finance Authority Rev., Mortgage Backed Securities Program, “D”, GNMA, 5.85%, 2024 | 325,000 | 325,020 | ||||
| Arkansas Development Finance Authority Rev., Mortgage Backed Securities Program, “E”, GNMA, 5.4%, 2034 | 650,000 | 613,230 | ||||
| Arkansas Development Finance Authority, Mortgage Backed Securities Program, “C”, 5.3%, 2023 | 175,000 | 174,858 | ||||
| Arkansas Development Finance Authority, Mortgage Backed Securities Program, “I”, GNMA, 5.3%, 2033 | 250,000 | 248,175 | ||||
| Issuer | Shares/Par | Value ($) | ||||
| Single Family Housing - State - continued | ||||||
| Arkansas Development Finance Authority, Mortgage Rev., “B”, GNMA, 4.85%, 2031 | $ | 890,000 | $ | 781,972 | ||
| Arkansas Development Finance Authority, Mortgage Rev., “B”, GNMA, 5.25%, 2035 | 1,830,000 | 1,815,140 | ||||
| Arkansas Development Finance Authority, Single Family Mortgage Rev., “B”, GNMA, 5.125%, 2024 | 445,000 | 433,256 | ||||
| Arkansas Housing Development Agency, Single Family Rev., Mortgage Program, ETM, 8.375%, 2011 (c) | 1,000,000 | 1,164,230 | ||||
| $ | 8,978,501 | |||||
| State & Local Agencies - 1.8% | ||||||
| Arkansas Development Finance Authority Rev., Environmental State Agency Facilities, “A”, AMBAC, 5%, 2040 | $ | 2,500,000 | $ | 2,396,400 | ||
| Arkansas Development Finance Authority, Economic Development Rev. (Agritecsorbents LLC) “B”, 5%, 2018 | 175,000 | 175,859 | ||||
| Mississippi Development Bank Special Obligation (Hinds Community College), ASSD GTY, 5.375%, 2033 | 40,000 | 40,016 | ||||
| $ | 2,612,275 | |||||
| Tax - Other - 2.8% | ||||||
| Little Rock, AR, Hotel & Restaurant Gross Receipts Tax Rev., 7.375%, 2015 | $ | 2,790,000 | $ | 3,271,498 | ||
| Virgin Islands Public Finance Authority Rev., “A”, 5.5%, 2022 | 1,000,000 | 864,260 | ||||
| $ | 4,135,758 | |||||
| Tobacco - 1.2% | ||||||
| Arkansas Development Finance Authority, Tobacco Settlement Rev. (Cancer Research Center Project), AMBAC, 0%, 2026 | $ | 2,000,000 | $ | 825,220 | ||
| Arkansas Development Finance Authority, Tobacco Settlement Rev. (Cancer Research Center Project), AMBAC, 0%, 2027 | 1,940,000 | 747,016 | ||||
| Children’s Trust Fund, Tobacco Settlement Rev., Puerto Rico, 5.5%, 2039 | 290,000 | 193,178 | ||||
| $ | 1,765,414 | |||||
| Toll Roads - 1.0% | ||||||
| Bay Area Toll Authority, Toll Bridge Rev. (San Francisco Bay Area), “F1”, 5%, 2039 | $ | 1,515,000 | $ | 1,410,617 | ||
| Transportation - Special Tax - 2.2% | ||||||
| Commonwealth of Puerto Rico Highway & Transportation Authority, “B”, MBIA, 5.875%, 2010 (c) | $ | 2,000,000 | $ | 2,155,680 | ||
| Commonwealth of Puerto Rico Highway & Transportation Authority, “G”, 5%, 2023 | 750,000 | 619,328 | ||||
| Metropolitan Transportation Authority Rev., NY, “A”, 5%, 2037 | 590,000 | 522,864 | ||||
| $ | 3,297,872 | |||||
22
Table of Contents
Portfolio of Investments – continued
| Municipal Bonds - continued | ||||||
| Issuer | Shares/Par | Value ($) | ||||
| Universities - Colleges - 22.8% | ||||||
| Arkansas State University, Housing Systems Rev., AMBAC, 5.15%, 2021 | $ | 1,240,000 | $ | 1,276,766 | ||
| Arkansas Technical University, Housing Systems Rev., AMBAC, 5.2%, 2026 | 500,000 | 529,665 | ||||
| Arkansas University Rev., Student Fee, AMBAC, 5%, 2032 | 2,495,000 | 2,448,169 | ||||
| Connecticut Health & Educational Facilities Authority Rev. (Quinnipiac University), BHAC, 5%, 2037 | 1,150,000 | 1,149,908 | ||||
| Conway, AR, Public Facilities Board, Capital Improvement Rev. (Hendrix College), “B”, 5%, 2035 | 1,000,000 | 883,510 | ||||
| New York Dormitory Authority Rev., Non State Supported Debt (New York University), “A”, 5.25%, 2048 | 1,605,000 | 1,570,910 | ||||
| Siloam Springs, AR, Public Education Facilities, Capital Improvement Rev. (John Brown University), AMBAC, 5.35%, 2020 | 500,000 | 513,065 | ||||
| University of Arkansas Rev. (Student Fee-Phillips), 5.1%, 2034 | 750,000 | 745,695 | ||||
| University of Arkansas Rev., “A”, 5%, 2033 | 1,000,000 | 983,290 | ||||
| University of Arkansas, Administration Building Rev. , “A”, 5%, 2038 | 1,000,000 | 974,340 | ||||
| University of Arkansas, University Construction Rev. (Monticello), AMBAC, 5%, 2025 | 1,525,000 | 1,557,940 | ||||
| University of Arkansas, University Construction Rev. (UAMS Campus), “B”, MBIA, 5%, 2026 | 1,405,000 | 1,430,936 | ||||
| University of Arkansas, University Construction Rev. (UAMS Campus), “B”, MBIA, 5%, 2027 | 2,180,000 | 2,208,471 | ||||
| University of Arkansas, University Construction Rev. (UAMS Campus), “B”, MBIA, 5%, 2034 | 3,200,000 | 3,127,584 | ||||
| University of Arkansas, University Facilities Rev. (Fayetteville Campus), FGIC, 5%, 2027 | 3,155,000 | 3,177,842 | ||||
| University of Arkansas, University Facilities Rev. (Fayetteville Campus), FGIC, 5%, 2032 | 2,500,000 | 2,419,000 | ||||
| University of Arkansas, University Facilities Rev. (Pine Bluff Campus), “A”, AMBAC, 5%, 2030 | 1,000,000 | 976,660 | ||||
| University of Arkansas, University Facilities Rev. (UAMS Campus), FGIC, 5%, 2028 | 2,000,000 | 1,990,220 | ||||
| University of Arkansas, University Rev., Var Fac-Fayetteville Campus, AMBAC, 5%, 2036 | 2,500,000 | 2,388,350 | ||||
| University of California Rev., “J”, FSA, 4.5%, 2035 | 1,500,000 | 1,294,335 | ||||
| University of Central Arkansas Rev., “A”, AMBAC, 5%, 2023 | 1,100,000 | 1,100,605 | ||||
| University of Puerto Rico Rev., “Q”, 5%, 2036 | 1,145,000 | 816,179 | ||||
| $ | 33,563,440 | |||||
| Utilities - Investor Owned - 1.1% | ||||||
| Independence County, AR, Pollution Control Rev., N, AMBAC, 4.9%, 2022 | $ | 1,000,000 | $ | 884,500 | ||
| Jefferson County, AR, Pollution Control Rev. (Entergy Arkansas, Inc., Project), 4.6%, 2017 | 750,000 | 701,775 | ||||
| $ | 1,586,275 | |||||
| Issuer | Shares/Par | Value ($) | ||||
| Utilities - Municipal Owned - 7.2% | ||||||
| Benton, AR, Utilities Rev., AMBAC, 5%, 2030 | $ | 470,000 | $ | 453,221 | ||
| Benton, AR, Utilities Rev., AMBAC, 5%, 2036 | 1,000,000 | 945,800 | ||||
| Long Island Power Authority, Electric Systems Rev., “A”, BHAC, 5.5%, 2033 | 730,000 | 754,499 | ||||
| Long Island Power Authority, Electric Systems Rev., “A”, 6%, 2033 | 245,000 | 253,029 | ||||
| North Little Rock, AR, Electric Rev., “A”, MBIA, 6.5%, 2010 | 880,000 | 908,046 | ||||
| North Little Rock, AR, Electric Rev., “A”, MBIA, 6.5%, 2015 | 6,000,000 | 6,842,280 | ||||
| Puerto Rico Electric Power Authority, “TT”, 5%, 2027 | 470,000 | 384,253 | ||||
| $ | 10,541,128 | |||||
| Water & Sewer Utility Revenue - 13.1% | ||||||
| Arkansas Development Finance Authority, Economic Development Rev., “I”, AMBAC, 5.65%, 2014 | $ | 70,000 | $ | 70,000 | ||
| Commonwealth of Puerto Rico Aqueduct & Sewer Authority Rev., “A”, ASSD GTY, 5%, 2028 | 1,200,000 | 1,137,396 | ||||
| Commonwealth of Puerto Rico Aqueduct & Sewer Authority Rev., “A”, 6%, 2044 | 2,000,000 | 1,679,420 | ||||
| Fort Smith, AR, Water & Sewer Rev., AMBAC, 5.65%, 2009 (c) | 1,000,000 | 1,025,300 | ||||
| Fort Smith, AR, Water & Sewer Rev., N, FSA, 5%, 2032 | 2,000,000 | 1,879,020 | ||||
| Fort Smith, AR, Water & Sewer Rev., “C”, FSA, 5.25%, 2020 | 1,315,000 | 1,372,032 | ||||
| King County, WA, Sewer Rev., 5%, 2038 | 1,625,000 | 1,595,685 | ||||
| Little Rock, AR, Sewer Rev., 5.5%, 2030 | 750,000 | 760,515 | ||||
| Little Rock, AR, Sewer Rev., 5.75%, 2038 | 1,000,000 | 1,016,820 | ||||
| Little Rock, AR, Sewer Rev., “A”, FSA, 4.375%, 2033 | 750,000 | 638,160 | ||||
| Little Rock, AR, Sewer Rev., Refunding & Construction, 5%, 2022 | 1,750,000 | 1,770,173 | ||||
| New York Environmental Facilities Corp., Clean Water & Drinking Rev., “B”, 5%, 2033 | 1,535,000 | 1,488,781 | ||||
| Paragould, AR, Water Sewer & Electric Rev., AMBAC, 5.6%, 2010 (c) | 765,000 | 825,466 | ||||
| Rogers, AR Sewer Rev., Improvement, AMBAC, 5%, 2037 | 1,000,000 | 928,900 | ||||
| South Blount County, TN, Utility District Waterworks Rev., FSA, 5.25%, 2039 | 925,000 | 904,252 | ||||
| South Sebastian County, AR, Water Refunding Rev., MBIA, 5%, 2038 | 1,000,000 | 952,790 | ||||
| Virgin Islands Water & Power Authority Rev., RADIAN, 5.3%, 2018 | 1,250,000 | 1,251,600 | ||||
| $ | 19,296,310 | |||||
| Total Municipal Bonds (Identified Cost, $143,985,757) | $ | 141,622,899 | ||||
23
Table of Contents
Portfolio of Investments – continued
| Money Market Funds (v) - 2.9% | |||||
| Issuer | Shares/Par | Value ($) | |||
| MFS Institutional Money Market Portfolio, 0.23%, at Cost and Net Asset Value | 4,265,949 | $ | 4,265,949 | ||
| Total Investments (Identified Cost, $148,251,706) | $ | 145,888,848 | |||
| Other Assets, Less Liabilities - 0.9% | 1,322,083 | ||||
| Net Assets - 100.0% | $ | 147,210,931 | |||
Derivative Contracts at 3/31/09
Futures contracts outstanding at 3/31/09
| Description | Contracts | Value | Expiration Date | Unrealized Appreciation (Depreciation) | |||||
| U.S. Treasury Bond 30 yr (Short) | 11 | $1,426,734 | Jun-09 | $(32,953 | ) |
At March 31, 2009, the fund had sufficient cash and/or other liquid securities to cover any commitments under these derivative contracts.
See Portfolio Footnotes and Notes to Financial Statements
24
Table of Contents
PORTFOLIO OF INVESTMENTS
3/31/09
MFS® CALIFORNIA MUNICIPAL BOND FUND
The Portfolio of Investments is a complete list of all securities owned by your fund. It is categorized by broad-based asset classes.
| Municipal Bonds - 97.1% | ||||||
| Issuer | Shares/Par | Value ($) | ||||
| Airport & Port Revenue - 4.1% | ||||||
| Long Beach, CA, Harbor Rev., “A”, FGIC, 5.25%, 2018 | $ | 3,500,000 | $ | 3,517,741 | ||
| Palm Springs, CA, Palm Springs International Airport, 5.55%, 2028 | 490,000 | 337,620 | ||||
| Port Oakland, CA, “K”, FGIC, 5.75%, 2020 | 4,000,000 | 3,784,600 | ||||
| Port of Oakland, CA, “A”, MBIA, 5%, 2026 | 3,000,000 | 2,370,420 | ||||
| San Francisco, CA, City & County Airports Commission, International Airport Rev., FRN, 5.5%, 2019 (b) | 1,730,000 | 1,766,226 | ||||
| San Jose CA, Airport Rev., “A”, BHAC, 5.5%, 2023 | 2,345,000 | 2,335,855 | ||||
| $ | 14,112,462 | |||||
| General Obligations - General Purpose - 2.5% | ||||||
| State of California, 6.5%, 2033 | $ | 3,000,000 | $ | 3,152,940 | ||
| State of California, AMBAC, 6.3%, 2010 | 3,000,000 | 3,160,020 | ||||
| State of California, AMBAC, 7%, 2010 | 2,000,000 | 2,131,820 | ||||
| $ | 8,444,780 | |||||
| General Obligations - Improvement - 0.2% | ||||||
| Guam Government, “A”, 5.25%, 2037 | $ | 815,000 | $ | 535,178 | ||
| General Obligations - Schools - 15.6% | ||||||
| Antelope Valley, CA (Union High School), “A”, MBIA, 5%, 2027 | $ | 1,400,000 | $ | 1,375,598 | ||
| Beverly Hills, CA, Unified School District (Election of 2008), 0%, 2029 | 4,335,000 | 1,339,949 | ||||
| Butte Glenn Community College District, “A”, MBIA, 5%, 2026 | 1,885,000 | 1,852,710 | ||||
| Cabrillo, CA, Community College District Capital Appreciation, “A”, MBIA, 0%, 2028 | 1,000,000 | 332,440 | ||||
| Capistrano, CA, Union High School District, “A”, FGIC, 5.875%, 2020 | 1,185,000 | 1,213,002 | ||||
| Chaffey, CA, Union High School District, “C”, FSA, 5%, 2027 | 1,000,000 | 988,240 | ||||
| Colton, CA, Joint Union School District, “A”, FGIC, 5.375%, 2026 | 1,200,000 | 1,215,696 | ||||
| Colton, CA, Joint Union School District, Election of 2001, “C”, FGIC, 0%, 2032 | 1,000,000 | 213,220 | ||||
| Colton, CA, Joint Union School District, Election of 2001, “C”, FGIC, 0%, 2033 | 3,000,000 | 591,840 | ||||
| Coronado, CA, Union School District, “A”, 5.7%, 2020 | 1,285,000 | 1,336,978 | ||||
| Desert, CA, Community College District, “C”, FSA, 5%, 2037 | 3,000,000 | 2,822,520 | ||||
| Foothill-De Anza, CA, Community College District, “A”, AMBAC, 4.5%, 2031 | 5,000,000 | 4,407,100 | ||||
| Gilroy Cauni School District, Election of 2002, “N”, FGIC, 5%, 2027 | 1,190,000 | 1,148,374 | ||||
| Glendale, CA, Community College District, Election 2002, “D”, MBIA, 5%, 2031 | 2,710,000 | 2,593,253 | ||||
| Issuer | Shares/Par | Value ($) | ||||
| General Obligations - Schools - continued | ||||||
| Hillsborough, CA, School District, Capital Appreciation, Election of 2002, “B”, 0%, 2023 | $ | 2,285,000 | $ | 1,132,606 | ||
| Hillsborough, CA, School District, Capital Appreciation, Election of 2002, “B”, 0%, 2024 | 2,640,000 | 1,207,615 | ||||
| Little Lake, CA, City School District, “A”, FSA, 6.125%, 2010 (c)(f) | 1,035,000 | 1,117,407 | ||||
| Long Beach, CA, Community College District, Election of 2008, “A”, FSA, 0%, 2028 | 1,375,000 | 465,781 | ||||
| Los Angeles, CA, Unified School District, “D”, 5%, 2034 | 2,000,000 | 1,880,940 | ||||
| Los Angeles, CA, Unified School District, Election 2002, “B”, AMBAC, 4.5%, 2031 | 3,325,000 | 2,860,265 | ||||
| Moorpark, CA, Unified School District, Election of 2008, “A”, N, 0%, 2033 | 3,000,000 | 608,010 | ||||
| Moreland, CA, School District, Election of 2002, “B”, FGIC, 0%, 2028 | 1,440,000 | 478,714 | ||||
| Natomas Union School District, Election of 2002, “B”, FGIC, 5%, 2028 | 1,430,000 | 1,333,718 | ||||
| Oceanside, CA, Union School District, N, 0%, 2031 | 3,210,000 | 767,896 | ||||
| Oceanside, CA, Union School District, Election of 2000, “C”, MBIA, 5.25%, 2032 | 1,940,000 | 1,893,964 | ||||
| Peralta, CA, Community College District, FSA, 5%, 2032 | 2,500,000 | 2,406,550 | ||||
| Perris, CA, Union School District, “A”, FGIC, 0%, 2027 | 3,100,000 | 1,014,165 | ||||
| Sacramento, CA, City Unified School District, FSA, 0%, 2025 | 5,510,000 | 2,241,358 | ||||
| San Lorenzo, CA, Unified School District, Alameda County, Election 2004, “B”, FGIC, 4.75%, 2037 | 4,115,000 | 3,720,618 | ||||
| San Ysidro, CA, School District, AMBAC, 6.125%, 2021 | 960,000 | 1,068,634 | ||||
| Santa Barbara, CA, Community College District, “A”, 5.25%, 2033 | 2,000,000 | 2,018,940 | ||||
| Santa Clara, CA, Union School District, FGIC, 5.5%, 2019 | 2,210,000 | 2,277,007 | ||||
| Santa Monica, CA (Community College District, 2002 Election), “C”, MBIA, 0%, 2027 | 2,000,000 | 680,520 | ||||
| Sausalito Marin City, CA, School District, Capital Appreciation, Election of 2004, “B”, MBIA, 0%, 2039 | 1,315,000 | 186,230 | ||||
| Sausalito Marin City, CA, School District, Capital Appreciation, Election of 2004, “B”, MBIA, 0%, 2040 | 1,400,000 | 185,318 | ||||
| Shasta, CA, Union High School District, Election 2001, MBIA, 0%, 2027 | 2,020,000 | 634,947 | ||||
| Walnut Valley, CA, Union School District, Election of 2000, “E”, FSA, 0%, 2028 | 1,535,000 | 519,966 | ||||
| Washington, CA, Union School District, Election of 1999, “A”, FGIC, 5.625%, 2021 | 1,000,000 | 1,040,080 | ||||
| $ | 53,172,169 | |||||
25
Table of Contents
Portfolio of Investments – continued
| Municipal Bonds - continued | ||||||
| Issuer | Shares/Par | Value ($) | ||||
| Healthcare Revenue - Hospitals - 14.5% | ||||||
| ABAG Finance Authority Rev. (San Diego Hospital), “C”, 5.375%, 2020 | $ | 2,000,000 | $ | 1,837,000 | ||
| California Health Facilities Financing Authority Rev. (Sutter Health), “A”, 5%, 2042 | 3,000,000 | 2,449,140 | ||||
| California Health Facilities Financing Authority Rev., (Providence Health & Services), “C”, 6.5%, 2033 | 1,500,000 | 1,573,590 | ||||
| California Health Facilities Financing Authority Rev., (Providence Health & Services), “C”, 6.5%, 2038 | 1,750,000 | 1,822,905 | ||||
| California Health Facilities Financing Authority Rev., Catholic Healthcare West, “G”, 5.25%, 2023 | 2,000,000 | 1,841,200 | ||||
| California Health Facilities Financing Authority Rev., Cedars Sinai Medical Center, 5%, 2027 | 1,000,000 | 861,110 | ||||
| California Health Facilities Financing Authority Rev., Health Facilities (Adventist Health Systems), “A”, 5%, 2033 | 1,750,000 | 1,390,690 | ||||
| California Municipal Finance Authority, COP (Community Hospitals, Central California), 5.25%, 2037 | 2,000,000 | 1,365,180 | ||||
| California Statewide Communities Development Authority Rev., 5%, 2035 | 2,000,000 | 1,579,980 | ||||
| California Statewide Communities Development Authority Rev. (Adventist), ASSD GTY, 5%, 2037 | 2,595,000 | 2,124,293 | ||||
| California Statewide Communities Development Authority Rev. (Enloe Medical Center), CALHF, 6.25%, 2033 | 2,000,000 | 1,899,320 | ||||
| California Statewide Communities Development Authority Rev. (Enloe Medical Center), “A”, CALHF, 5.5%, 2023 | 1,000,000 | 971,900 | ||||
| California Statewide Communities Development Authority Rev. (Henry Mayo Newhall Memorial Hospital), “A”, CHFC, 5%, 2018 | 2,000,000 | 1,992,500 | ||||
| California Statewide Communities Development Authority Rev. (Kaiser Permanente), “A”, 5.5%, 2032 | 2,000,000 | 1,753,580 | ||||
| California Statewide Communities Development Authority Rev. (Los Angeles Children’s Hospital), 5.125%, 2019 | 4,000,000 | 3,336,120 | ||||
| California Statewide Communities Development Authority Rev. (St. Joseph Health System), FGIC, 5.75%, 2047 | 4,000,000 | 3,725,600 | ||||
| California Statewide Communities Development Authority Rev. (Sutter Health), “B”, AMBAC, 5%, 2038 | 3,000,000 | 2,529,660 | ||||
| California Statewide Communities Development Authority Rev. (Valleycare Health Systems), “A”, 5.125%, 2031 | 2,000,000 | 1,219,020 | ||||
| California Statewide Communities Development Authority Rev., “B”, 5.625%, 2042 | 4,000,000 | 3,735,520 | ||||
| California Statewide Communities Development Authority Rev., Health Facilities (Memorial Health Services), “A”, 6%, 2023 | 1,500,000 | 1,511,085 | ||||
| Issuer | Shares/Par | Value ($) | ||||
| Healthcare Revenue - Hospitals - continued | ||||||
| Central California Joint Powers Health Financing (Community Hospitals of Central California), 5.625%, 2011 (c) | $ | 1,000,000 | $ | 1,095,100 | ||
| Rancho Mirage, CA, Joint Powers (Eisenhower Medical Center), “A”, 5%, 2047 | 2,000,000 | 1,504,780 | ||||
| Santa Clara County, CA, Financing Authority Rev. (El Camino Hospital), AMBAC, 5.125%, 2041 | 2,600,000 | 2,141,880 | ||||
| Sierra View, CA, Local Health Care District Rev., 5.25%, 2037 | 1,000,000 | 758,370 | ||||
| Tahoe Forest California Hospital District, “A”, 5.85%, 2009 (c) | 795,000 | 820,496 | ||||
| Tahoe Forest California Hospital District, “A”, 5.85%, 2022 | 205,000 | 172,175 | ||||
| Turlock, CA, Health Facilities Rev. (Emanuel Medical Center), 5%, 2024 | 500,000 | 356,025 | ||||
| Valley Health Systems, CA, Partners Refunding Project, 6.875%, 2023 | 385,000 | 246,400 | ||||
| Washington Township, CA, Health Care Rev., 5%, 2018 | 1,000,000 | 971,810 | ||||
| West Contra Costa, CA, Healthcare District, AMBAC, 5.5%, 2029 | 2,000,000 | 1,826,400 | ||||
| $ | 49,412,829 | |||||
| Healthcare Revenue - Long Term Care - 0.8% | ||||||
| California Health Facilities Financing Authority Rev. (Paradise Valley Estates), 5.125%, 2022 | $ | 1,000,000 | $ | 947,970 | ||
| California Statewide Communities Development Authority Rev. (Senior Living Presbyterian Homes), 4.875%, 2036 | 1,000,000 | 640,790 | ||||
| La Verne, CA, COP (Brethren Hillcrest Homes), “B”, 6.625%, 2025 | 1,000,000 | 796,270 | ||||
| Millbrae, CA, Residential Facilities Rev. (Magnolia of Millbrae), “A”, 7.375%, 2027 | 410,000 | 347,975 | ||||
| $ | 2,733,005 | |||||
| Human Services - 0.2% | ||||||
| California Statewide Communities Development Authority Rev. (Inland Regional Center), 5.375%, 2037 | $ | 860,000 | $ | 623,122 | ||
| Industrial Revenue - Environmental Services - 1.4% | ||||||
| California Pollution Control Financing Authority, Solid Waste Disposal Rev. (Browning Ferris, Inc.), “A”, 5.8%, 2016 | $ | 2,000,000 | $ | 1,851,500 | ||
| California Pollution Control Financing Authority, Solid Waste Disposal Rev. (Waste Management, Inc.), “A”, FRN, 5.125%, 2031 (b) | �� | 2,250,000 | 2,037,308 | |||
| California Pollution Control Financing Authority, Solid Waste Disposal Rev. (Waste Management, Inc.), “A-2”, 5.4%, 2025 | 1,250,000 | 959,600 | ||||
| $ | 4,848,408 | |||||
| Industrial Revenue - Other - 0.4% | ||||||
| California Enterprise Development Authority Sewer Facilities Rev. (Anheuser-Busch), 5.3%, 2047 | $ | 1,000,000 | $ | 690,210 | ||
26
Table of Contents
Portfolio of Investments – continued
| Municipal Bonds - continued | ||||||
| Issuer | Shares/Par | Value ($) | ||||
| Industrial Revenue - Other - continued | ||||||
| Virgin Islands Public Finance Authority, Refinery Facilities Rev. (Hovensa Coker Project), 5.875%, 2022 | $ | 960,000 | $ | 655,344 | ||
| $ | 1,345,554 | |||||
| Miscellaneous Revenue - Other - 1.9% | ||||||
| ABAG Finance Authority Rev. (Jackson Lab), 5.75%, 2037 | $ | 2,615,000 | $ | 2,249,894 | ||
| California Infrastructure & Economic Development Bank Rev. (Walt Disney Family Museum), 5.25%, 2033 | 1,090,000 | 1,010,365 | ||||
| San Diego County, CA, COP (Burnham Institute for Medical Research), 5%, 2034 | 1,000,000 | 680,850 | ||||
| San Diego County, CA, COP (Burnham Institute), 6.25%, 2009 (c) | 2,300,000 | 2,376,015 | ||||
| $ | 6,317,124 | |||||
| Multi-Family Housing Revenue - 0.9% | ||||||
| San Bernardino County, CA (Equity Residential/Redlands), “A”, 5.2%, 2029 (b) | $ | 3,000,000 | $ | 3,014,670 | ||
| Parking - 0.3% | ||||||
| San Francisco, CA, Union Square, MBIA, 6%, 2020 | $ | 1,000,000 | $ | 1,059,640 | ||
| Single Family Housing - Local - 0.8% | ||||||
| California Rural Home Mortgage Finance Authority Rev., GNMA, 7.3%, 2031 | $ | 15,000 | $ | 15,670 | ||
| California Rural Home Mortgage Finance Authority Rev., GNMA, 5.4%, 2036 | 2,365,000 | 2,321,555 | ||||
| California Rural Home Mortgage Finance Authority Rev., Mortgage Backed Securities Program, “B4”, GNMA, 6.35%, 2029 | 20,000 | 20,221 | ||||
| Pomona, CA, Single Family Mortgage Rev., ETM, GNMA, 7.375%, 2010 (c) | 465,000 | 481,675 | ||||
| $ | 2,839,121 | |||||
| Single Family Housing - State - 4.0% | ||||||
| California Housing Finance Agency Rev. (Home Mortgage), “L”, 5.5%, 2038 | $ | 3,000,000 | $ | 2,801,700 | ||
| California Housing Finance Agency Rev., “A”, 4.95%, 2036 | 3,400,000 | 2,461,294 | ||||
| California Housing Finance Agency Rev., “J”, 5.75%, 2047 | 2,495,000 | 2,477,310 | ||||
| California Housing Finance Agency Rev., Home Mortgage, FSA, 0%, 2019 | 850,000 | 457,912 | ||||
| California Housing Finance Agency Rev., Home Mortgage, MBIA, 0%, 2028 | 3,400,000 | 1,109,862 | ||||
| California Housing Finance Agency Rev., Home Mortgage, “E”, FGIC, 5.05%, 2026 | 2,480,000 | 2,102,643 | ||||
| California Housing Finance Agency Rev., Home Mortgage, “I”, 4.75%, 2031 | 3,000,000 | 2,289,990 | ||||
| $ | 13,700,711 | |||||
| Issuer | Shares/Par | Value ($) | ||||
| Solid Waste Revenue - 0.9% | ||||||
| California Pollution Control Financing Authority, Solid Waste Disposal Rev. (West County Resource Recovery), “A”, 5.125%, 2014 | $ | 1,000,000 | $ | 1,000,900 | ||
| South Bayside Waste Management Authority, California Solid Waste System Rev., AMBAC, 5.75%, 2020 | 2,100,000 | 2,116,485 | ||||
| $ | 3,117,385 | |||||
| State & Agency - Other - 1.3% | ||||||
| Pasadena CA, COP, Old Pasadena Parking Facilities Project, 6.25%, 2018 | $ | 2,435,000 | $ | 2,756,907 | ||
| Sacramento County, CA, COP, Capital Projects, AMBAC, 5.75%, 2018 | 1,500,000 | 1,537,770 | ||||
| $ | 4,294,677 | |||||
| State & Local Agencies - 12.2% | ||||||
| Banning, CA, COP, Water Systems Improvement Project, ETM, AMBAC, 8%, 2019 | $ | 780,000 | $ | 993,080 | ||
| Calabasas, CA, Certificate Participants (City Hall & Civic Center Project), AMBAC, 4.5%, 2041 | 1,000,000 | 794,570 | ||||
| California Department of Water Resources, Power Supply Rev., “C”, 5.25%, 2028 | 2,500,000 | 2,271,400 | ||||
| California Public Works Board Lease Rev., Department of Corrections State Prison, “A”, 7.4%, 2010 | 5,000,000 | 5,313,700 | ||||
| California Public Works Board, Department of Justice, “D”, 5.25%, 2020 | 1,565,000 | 1,544,921 | ||||
| Golden State, CA, Tobacco Securitization Corp., Tobacco Settlement Rev., “A”, FSA, 0% to 2010, 4.55% to 2022 | 3,000,000 | 2,501,910 | ||||
| Golden State, CA, Tobacco Securitization Corp., Tobacco Settlement Rev., Enhanced, “A”, 5%, 2045 | 5,500,000 | 4,008,565 | ||||
| Golden State, CA, Tobacco Securitization Corp., Tobacco Settlement Rev., Enhanced, “A”, FGIC, 5%, 2035 | 2,000,000 | 1,578,400 | ||||
| Golden State, CA, Tobacco Securitization Corp., Tobacco Settlement Rev., Enhanced, “B”, 5.625%, 2013 (c) | 5,000,000 | 5,666,600 | ||||
| Los Angeles, CA, COP, Real Property Program, AMBAC, 5.3%, 2027 | 3,000,000 | 3,037,200 | ||||
| Pomona, CA, Public Financing Authority Rev., “A”, AMBAC, 5%, 2042 | 3,735,000 | 3,013,659 | ||||
| Pomona, CA, Public Financing Authority Rev., “P”, 6.25%, 2010 | 2,130,000 | 2,221,526 | ||||
| Sacramento, CA, City Financing Authority Rev., Capital Improvement, 5.5%, 2010 (c) | 1,635,000 | 1,747,766 | ||||
| San Diego, CA, Regional Building Authority Lease Rev. (County Operations Center & Annex), “A”, 5.375%, 2036 | 3,000,000 | 2,943,360 | ||||
| San Francisco, CA, City & County, COP (San Bruno Jail No. 3), AMBAC, 5.25%, 2033 | 3,930,000 | 3,919,232 | ||||
| $ | 41,555,889 | |||||
27
Table of Contents
Portfolio of Investments – continued
| Municipal Bonds - continued | ||||||
| Issuer | Shares/Par | Value ($) | ||||
| Tax - Other - 1.0% | ||||||
| Virgin Islands Public Finance Authority Rev., “A”, 5.5%, 2022 | $ | 2,000,000 | $ | 1,728,520 | ||
| Virgin Islands Public Finance Authority Rev., “E”, 5.875%, 2018 | 1,600,000 | 1,499,824 | ||||
| $ | 3,228,344 | |||||
| Tax Assessment - 4.4% | ||||||
| Bay Area Governments Association, Tax Allocation, “A”, AMBAC, 5%, 2033 | $ | 3,700,000 | $ | 2,719,241 | ||
| Fontana, CA, Redevelopment Agency Tax Allocation (Jurupa Hills Redevelopment Project), “A”, 5.5%, 2027 | 3,350,000 | 3,214,895 | ||||
| La Mirada, CA, Redevelopment Agency, Special Tax Rev., Community Facilities District No. 89-1, 5.7%, 2020 | 1,350,000 | 1,163,120 | ||||
| Orange County, CA, Community Facilities District, Special Tax (Rancho Santa Margarita), “A”, 5.55%, 2017 | 1,000,000 | 990,050 | ||||
| Poway, CA, Community Facilities District, Special Tax (Parkway Business Center), 6.5%, 2010 | 715,000 | 725,532 | ||||
| Riverside County, CA, Redevelopment Agency, Tax Allocation, “A”, XLCA, 5%, 2037 | 1,900,000 | 1,426,786 | ||||
| San Diego, CA, Redevelopment Agency, Tax Allocation (Centre City), “B”, AMBAC, 5.3%, 2020 | 1,250,000 | 1,223,775 | ||||
| Santa Fe Springs, CA, Community Development Commission, Tax Allocation, MBIA, 0%, 2026 | 4,720,000 | 1,574,309 | ||||
| Yuba, CA, Levee Financing Authority Rev. (Levee Financing Project), “A”, ASSD GTY, 5%, 2038 | 2,170,000 | 1,922,642 | ||||
| $ | 14,960,350 | |||||
| Tobacco - 3.3% | ||||||
| Golden State, CA, Tobacco Securitization Corp., Tobacco Settlement Rev., “A-1”, 6.75%, 2013 (c) | $ | 2,645,000 | $ | 3,109,409 | ||
| Golden State, CA, Tobacco Securitization Corp., Tobacco Settlement Rev., “A-1”, 6.25%, 2013 (c) | 2,740,000 | 3,027,864 | ||||
| Golden State, CA, Tobacco Securitization Corp., Tobacco Settlement Rev., “A-1”, 5.75%, 2047 | 8,000,000 | 4,558,960 | ||||
| Inland Empire, CA, Tobacco Securitization Corp., Tobacco Settlement Rev., Asset Backed, “C-1”, 0%, 2036 | 5,000,000 | 296,600 | ||||
| Silicon Valley Tobacco Securitization Authority, CA, Tobacco Settlement Rev. (Turbo-Santa Clara), “A”, 0%, 2036 | 5,000,000 | 304,200 | ||||
| $ | 11,297,033 | |||||
| Toll Roads - 2.2% | ||||||
| Bay Area Toll Authority, Toll Bridge Rev. (San Francisco Bay Area), “F1”, 5.125%, 2047 | $ | 5,000,000 | $ | 4,687,400 | ||
| Foothill/Eastern Corridor Agency, CA, Toll Road Rev., Capital Appreciation, “A”, 7.1%, 2010 (c) | 2,500,000 | 2,672,250 | ||||
| $ | 7,359,650 | |||||
| Universities - Colleges - 8.6% | ||||||
| California Educational Facilities Authority Rev. (Claremont Graduate University), “A”, 6%, 2033 | $ | 1,500,000 | $ | 1,459,110 | ||
| Issuer | Shares/Par | Value ($) | ||||
| Universities - Colleges - continued | ||||||
| California Educational Facilities Authority Rev. (Dominican University), 5%, 2036 | $ | 1,150,000 | $ | 712,874 | ||
| California Educational Facilities Authority Rev. (Fresno Pacific University), “A”, 6.75%, 2019 | 2,000,000 | 1,913,680 | ||||
| California Educational Facilities Authority Rev. (Lutheran University), “C”, 5%, 2029 | 2,500,000 | 1,777,675 | ||||
| California Educational Facilities Authority Rev. (Pepperdine University), “A”, AMBAC, 5%, 2035 | 1,000,000 | 937,050 | ||||
| California Educational Facilities Authority Rev. (Santa Clara University), “A”, MBIA, 5%, 2027 | 1,340,000 | 1,332,094 | ||||
| California Educational Facilities Authority Rev. (University Financing Project), 5%, 2017 | 685,000 | 582,010 | ||||
| California Educational Facilities Authority Rev. (University Financing Project), 5%, 2026 | 1,315,000 | 936,280 | ||||
| California Educational Facilities Authority Rev. (University of La Verne), “A”, 5%, 2029 | 1,500,000 | 1,061,160 | ||||
| California Educational Facilities Authority Rev., “A”, 4.5%, 2033 | 3,000,000 | 2,651,340 | ||||
| California Educational Facilities Authority Rev., “B”, 6.625%, 2010 (c) | 170,000 | 183,520 | ||||
| California Municipal Finance Authority Rev. (Biola University), 5.8%, 2028 | 2,000,000 | 1,674,240 | ||||
| California State University Rev., “A”, AMBAC, 5%, 2035 | 5,000,000 | 4,517,450 | ||||
| California Statewide Communities, Notre Dame de Namur University, 6.625%, 2033 | 1,000,000 | 673,670 | ||||
| Foothill-De Anza, CA, Community College District, Election of 1999, “B”, FGIC, 0%, 2025 | 1,500,000 | 607,800 | ||||
| Hastings College of the Law, CA, ASSD GTY, 4.75%, 2037 | 1,290,000 | 1,122,661 | ||||
| University of California Rev., “A”, AMBAC, 5%, 2033 | 4,000,000 | 3,775,160 | ||||
| University of California Rev., “J”, FSA, 4.5%, 2035 | 4,000,000 | 3,451,560 | ||||
| $ | 29,369,334 | |||||
| Universities - Dormitories - 0.8% | ||||||
| California Statewide Communities Development Authority Rev. (Lancer Educational Student Housing Project), 5.625%, 2033 | $ | 2,000,000 | $ | 1,201,480 | ||
| California Statewide Communities Development Authority Rev. (Student Housing, SUCI East Campus), 6%, 2040 | 2,000,000 | 1,596,400 | ||||
| $ | 2,797,880 | |||||
| Universities - Secondary Schools - 1.0% | ||||||
| California Statewide Communities Development Authority Rev. (Escondido Charter High School), 7.5%, 2011 (c) | $ | 1,000,000 | $ | 1,171,010 | ||
| California Statewide Communities Development Authority Rev., Aspire Public Schools (Oakland Project), “A”, 7.25%, 2031 | 930,000 | 704,996 | ||||
| Los Angeles, CA, COP, 5.7%, 2018 | 1,800,000 | 1,642,086 | ||||
| $ | 3,518,092 | |||||
28
Table of Contents
Portfolio of Investments – continued
| Municipal Bonds - continued | ||||||
| Issuer | Shares/Par | Value ($) | ||||
| Utilities - Investor Owned - 1.6% | ||||||
| California Pollution Control Financing Authority, Pollution Control Rev. (Pacific Gas & Electric Co.), MBIA, 5.35%, 2016 | $ | 3,500,000 | $ | 3,369,905 | ||
| Chula Vista, CA, Industrial Development Rev. (San Diego Gas), “B”, 5%, 2027 | 2,500,000 | 1,935,675 | ||||
| $ | 5,305,580 | |||||
| Utilities - Municipal Owned - 3.4% | ||||||
| Glendale, CA, Electric Works Rev., MBIA, 5.75%, 2010 (c) | $ | 1,420,000 | $ | 1,497,475 | ||
| Glendale, CA, Electric Works Rev., MBIA, 5.75%, 2010 (c) | 1,160,000 | 1,223,290 | ||||
| Los Angeles, CA, Department of Water & Power Rev., “A-1”, 5.25%, 2038 | 3,000,000 | 2,990,850 | ||||
| Los Angeles, CA, Department of Water & Power Rev., “A-1”, FSA, 4.625%, 2037 | 3,500,000 | 3,174,710 | ||||
| Northern California Power Agency Public Power Rev., 5.85%, 2010 | 880,000 | 920,630 | ||||
| Virgin Islands Water & Power Authority Rev., 5.5%, 2017 | 800,000 | 769,272 | ||||
| Virgin Islands Water & Power Authority Rev., “A”, 5.125%, 2013 | 1,000,000 | 990,730 | ||||
| $ | 11,566,957 | |||||
| Utilities - Other - 0.5% | ||||||
| Southern California Public Power Authority (Natural Gas Project No. 1), “A”, 5%, 2033 | $ | 2,565,000 | $ | 1,718,601 | ||
| Water & Sewer Utility Revenue - 8.3% | ||||||
| Brentwood, CA, Infrastructure Financing Authority Water Rev., 5.75%, 2038 | $ | 1,080,000 | $ | 1,105,542 | ||
| California Department of Water Resources, Center Valley Project Rev., 7%, 2012 | 1,070,000 | 1,270,015 | ||||
| California Department of Water Resources, Center Valley Project Rev., FGIC, 5%, 2012 (c) | 20,000 | 22,737 | ||||
| California Department of Water Resources, Center Valley Project Rev., FGIC, 5%, 2029 | 1,980,000 | 1,984,455 | ||||
| California Department of Water Resources, Center Valley Project Rev., ETM, 7%, 2012 (c) | 20,000 | 24,166 | ||||
| Issuer | Shares/Par | Value ($) | ||||
| Water & Sewer Utility Revenue - continued | ||||||
| Chino Basin, CA, Desalter Authority Rev., “A”, ASSD GTY, 5%, 2035 | $ | 1,000,000 | $ | 944,230 | ||
| Culver City, CA, Wastewater Facilities Rev., “A”, FGIC, 5.6%, 2019 | 1,000,000 | 1,025,980 | ||||
| El Monte, CA, Water Authority Rev., Water Systems Project, AMBAC, 6%, 2010 (c) | 1,065,000 | 1,166,005 | ||||
| Hollister, CA, Joint Powers Financing Authority Wastewater Rev. (Refining & Improvement Project), “1”, FSA, 5%, 2037 | 4,000,000 | 3,493,520 | ||||
| Livermore Amador Valley Water Management Rev., “A”, AMBAC, 5%, 2031 | 4,875,000 | 4,635,540 | ||||
| Los Angeles, CA, Department of Water & Power Waterworks Rev., “A-1”, N, 5%, 2038 | 3,000,000 | 2,836,920 | ||||
| Placerville, CA, Public Financing Authority Rev. (Wastewater Systems Refining & Improvement Project), XLCA, 5%, 2034 | 2,000,000 | 1,684,840 | ||||
| Sacramento County, CA, Sanitation District, Financing Authority Rev., MBIA, 5%, 2035 | 1,460,000 | 1,368,604 | ||||
| San Diego County, CA, Water Authority Rev., “A”, FSA, 5%, 2038 | 3,000,000 | 2,858,610 | ||||
| San Diego, CA, Public Facilities Financing Authority Water Rev., “A”, 5.25%, 2038 | 1,500,000 | 1,441,365 | ||||
| West Sacramento, CA, Financing Authority Rev., Water Systems Improvement Project, FGIC, 5%, 2032 | 2,750,000 | 2,380,923 | ||||
| $ | 28,243,452 | |||||
| Total Municipal Bonds (Identified Cost, $360,384,653) | $ | 330,491,997 | ||||
| Money Market Funds (v) - 2.5% | ||||||
| MFS Institutional Money Market Portfolio, 0.23%, at Cost and Net Asset Value | 8,577,179 | $ | 8,577,179 | |||
| Total Investments (Identified Cost, $368,961,832) | $ | 339,069,176 | ||||
| Other Assets, Less Liabilities - 0.4% | 1,396,518 | |||||
| Net Assets - 100.0% | $ | 340,465,694 | ||||
Derivative Contracts at 3/31/09
Futures contracts outstanding at 3/31/09
| Description | Contracts | Value | Expiration Date | Unrealized Appreciation (Depreciation) | |||||
| U.S. Treasury Bond 30 yr (Short) | 56 | $7,263,375 | Jun-09 | $(167,759 | ) |
At March 31, 2009, the fund had sufficient cash and/or other liquid securities to cover any commitments under these derivative contracts.
See Portfolio Footnotes and Notes to Financial Statements
29
Table of Contents
PORTFOLIO OF INVESTMENTS
3/31/09
MFS® FLORIDA MUNICIPAL BOND FUND
The Portfolio of Investments is a complete list of all securities owned by your fund. It is categorized by broad-based asset classes.
| Municipal Bonds - 95.0% | ||||||
| Issuer | Shares/Par | Value ($) | ||||
| Airport & Port Revenue - 6.8% | ||||||
| Greater Orlando Aviation Authority Rev., “A”, FGIC, 5.25%, 2018 | $ | 1,000,000 | $ | 953,880 | ||
| Lee County, FL, Airport Rev., “A”, FSA, 5.875%, 2018 | 1,000,000 | 1,016,300 | ||||
| Miami-Dade County, FL, Aviation Rev. (Miami International Airport), “B”, FSA, 5%, 2041 | 1,000,000 | 892,780 | ||||
| Pensacola, FL, Airport Rev., “B”, MBIA, 5.625%, 2014 | 440,000 | 442,149 | ||||
| $ | 3,305,109 | |||||
| General Obligations - General Purpose - 4.1% | ||||||
| Palm Beach County, FL, Industrial Development Rev. (South Florida Fair Project), MBIA, 5.5%, 2020 | $ | 1,000,000 | $ | 946,740 | ||
| Palm Beach County, FL, Public Improvement Rev. “2”, 5.375%, 2028 | 1,000,000 | 1,038,250 | ||||
| $ | 1,984,990 | |||||
| General Obligations - Schools - 9.3% | ||||||
| Florida Board of Education, Capital Outlay, 9.125%, 2014 (f) | $ | 2,600,000 | $ | 2,994,030 | ||
| Florida Board of Education, Capital Outlay, ETM, 9.125%, 2014 (c) | 400,000 | 520,092 | ||||
| Florida Board of Education, Public Education, “J”, 5%, 2033 | 1,000,000 | 990,240 | ||||
| $ | 4,504,362 | |||||
| Healthcare Revenue - Hospitals - 18.9% | ||||||
| Citrus County, FL, Hospital Development Authority Rev. (Citrus Memorial Hospital), 6.25%, 2023 | $ | 430,000 | $ | 367,998 | ||
| Hillsborough County, FL, Industrial Development Authority Rev. (University Community Hospital), MBIA, 6.5%, 2019 | 1,000,000 | 1,037,680 | ||||
| Hillsborough County, FL, Industrial Development Authority Rev. (University Community Hospital), “A”, 5.625%, 2029 | 300,000 | 223,380 | ||||
| Indiana Health & Educational Facilities Authority, Hospital Rev. (Community Foundation of Northwest Indiana), “A”, 6.375%, 2011 (c) | 380,000 | 423,928 | ||||
| Indiana Health & Educational Facilities Authority, Hospital Rev. (Community Foundation of Northwest Indiana), “A”, 6.375%, 2031 | 120,000 | 103,270 | ||||
| Jacksonville, FL, Health Facilities Rev. (Ascencion Health), “A”, 5.25%, 2032 | 1,000,000 | 932,110 | ||||
| Jacksonville, FL, Health Facilities Rev. (Brooks Health Systems), 5.25%, 2038 | 500,000 | 388,120 | ||||
| Leesburg, FL, Hospital Rev. (Leesburg Regional Medical Center), 5.5%, 2032 | 750,000 | 558,405 | ||||
| Louisville & Jefferson County, KY, Metropolitan Government Healthcare Systems Rev. (Norton Healthcare, Inc.), 5.25%, 2036 | 305,000 | 235,710 | ||||
| Issuer | Shares/Par | Value ($) | ||||
| Healthcare Revenue - Hospitals - continued | ||||||
| Marion County, FL, Hospital District Rev., 5.5%, 2014 | $ | 20,000 | $ | 20,208 | ||
| Marshall County, AL, Health Care Authority Rev., “A”, 6.25%, 2022 | 500,000 | 501,260 | ||||
| Miami Beach, FL, Health Facilities Authority Rev. (Mount Sinai Medical Center), “A”, 6.7%, 2019 | 250,000 | 190,275 | ||||
| New Hampshire Health & Education Facilities Authority Rev. (Exeter Hospital), 6%, 2024 | 500,000 | 501,165 | ||||
| Orange County, FL, Health Facilities Authority Hospital Rev. (Orlando Regional Healthcare), “C”, 5.25%, 2035 | 1,000,000 | 781,050 | ||||
| Rhode Island Health & Educational Building Corp., Hospital Financing (Lifespan Obligated Group), 6.5%, 2012 (c) | 500,000 | 579,620 | ||||
| South Broward, FL, Hospital District Rev., 5%, 2036 | 1,015,000 | 850,814 | ||||
| South Dakota Health & Education Facilities Authority Rev. (Prairie Lakes Health Care System), 5.625%, 2032 | 500,000 | 424,055 | ||||
| Tallahassee, FL, Health Facilities Rev. (Tallahassee Memorial Healthcare), 6.25%, 2020 | 300,000 | 268,575 | ||||
| Tallahassee, FL, Health Facilities Rev. (Tallahassee Memorial Regional Medical Center), MBIA, 6.625%, 2013 | 760,000 | 759,970 | ||||
| $ | 9,147,593 | |||||
| Healthcare Revenue - Long Term Care - 0.3% | ||||||
| Orange County, FL, Health Facilities Authority Rev. (Orlando Lutheran Towers), 5.7%, 2026 | $ | 250,000 | $ | 166,053 | ||
| Human Services - 0.6% | ||||||
| Orange County, FL, Health Facilities Authority Rev. (GF/Orlando Healthcare Facilities), 8.875%, 2021 | $ | 300,000 | $ | 289,029 | ||
| Industrial Revenue - Chemicals - 1.0% | ||||||
| Brazos River, TX, Brazoria County Environmental Rev. (Dow Chemical, Co.), “A-7”, 6.625%, 2033 | $ | 500,000 | 369,175 | |||
| Red River Authority, TX, Pollution Control Rev. (Celanese Project) “B”, 6.7%, 2030 | 200,000 | 114,048 | ||||
| $ | 483,223 | |||||
| Industrial Revenue - Environmental Services - 0.6% | ||||||
| Director of the State of Nevada Department of Business & Industry Rev. (Republic Services, Inc.), 5.625%, 2026 (b) | $ | 300,000 | $ | 267,375 | ||
| Industrial Revenue - Other - 1.2% | ||||||
| Park Creek Metropolitan District, CO, Rev. (Custodial Receipts), “CR-2”, 7.875%, 2032 (b)(n) | $ | 160,000 | $ | 143,654 | ||
| Tooele County, UT, Hazardous Waste Treatment Rev. (Union Pacific Corp.), 5.7%, 2026 | 500,000 | 425,975 | ||||
| $ | 569,629 | |||||
30
Table of Contents
Portfolio of Investments – continued
| Municipal Bonds - continued | ||||||
| Issuer | Shares/Par | Value ($) | ||||
| Industrial Revenue - Paper - 1.2% | ||||||
| Delta County, MI, Economic Development Corp., Environmental Improvements Rev. (Mead Westvaco Escanaba), “A”, 6.25%, 2012 (c) | $ | 500,000 | $ | 565,865 | ||
| Miscellaneous Revenue - Other - 0.5% | ||||||
| Madison County, FL, Rev. (Twin Oaks Project), “A”, 6%, 2025 | $ | 130,000 | $ | 94,042 | ||
| Summit County, OH, Port Authority Building Rev. (Seville Project), “A”, 5.1%, 2025 | 200,000 | 140,008 | ||||
| $ | 234,050 | |||||
| Multi-Family Housing Revenue - 2.9% | ||||||
| Bay County, FL, Housing Finance Authority, Multi-Family Rev. (Andrews Place II Apartments), FSA, 5%, 2035 | $ | 500,000 | $ | 437,650 | ||
| Florida Housing Finance Corp., Housing Rev. (Crossing at University Apartments), “Q-1”, AMBAC, 5.1%, 2018 | 905,000 | 909,516 | ||||
| Palm Beach County, FL, Housing Finance Authority Rev. (Westlake Apartments Project, Phase II), FSA, 4.3%, 2012 | 80,000 | 79,875 | ||||
| $ | 1,427,041 | |||||
| Sales & Excise Tax Revenue - 4.4% | ||||||
| Miami-Dade County, FL, Special Obligations, Capital Appreciation, “A”, MBIA, 0%, 2032 | $ | 2,000,000 | $ | 380,180 | ||
| Pasco County, FL, Sales Tax Rev. (Half Central), AMBAC, 5%, 2023 | 1,000,000 | 969,610 | ||||
| Volusia County, FL, Tourist Development Tax Rev., FSA, 5%, 2034 | 815,000 | 781,968 | ||||
| $ | 2,131,758 | |||||
| Single Family Housing - Local - 0.9% | ||||||
| Brevard County, FL, Housing Finance Authority Rev., “B”, GNMA, 6.5%, 2022 | $ | 24,000 | $ | 25,545 | ||
| Lee County, FL, Housing Finance Authority Rev. (Multi-County Program), “A-1”, GNMA, 7.2%, 2033 | 25,000 | 25,629 | ||||
| Manatee County, FL, Housing Finance Mortgage Rev. (Single Family, Subordinated), Series 3, GNMA, 5.3%, 2028 | 45,000 | 44,156 | ||||
| Miami-Dade County, FL, Housing Finance Authority Rev. (Home Ownership Mortgage), “A-1”, GNMA, 5.2%, 2031 | 350,000 | 347,820 | ||||
| $ | 443,150 | |||||
| Single Family Housing - State - 1.5% | ||||||
| Florida Housing Finance Corp. Rev. (Homeowner Mortgage), “1”, GNMA, 4.8%, 2031 | $ | 860,000 | $ | 735,618 | ||
| Solid Waste Revenue - 0.4% | ||||||
| Delaware County, PA, Industrial Development Authority, Resource Recovery Facilities Rev. (American Ref-Fuel Co.), “A”, 6.2%, 2019 | $ | 200,000 | $ | 184,428 | ||
| State & Local Agencies - 4.9% | ||||||
| Florida Municipal Loan Council Rev., “C”, MBIA, 5.25%, 2022 | $ | 1,000,000 | $ | 1,016,200 | ||
| Issuer | Shares/Par | Value ($) | ||||
| State & Local Agencies - continued | ||||||
| Miami-Dade County School Board, FL, COP, “B”, ASSD GTY, 5%, 2033 | $ | 1,500,000 | $ | 1,362,435 | ||
| $ | 2,378,635 | |||||
| Tax - Other - 0.2% | ||||||
| Virgin Islands Public Finance Authority Rev., “A”, 5.25%, 2024 | $ | 130,000 | $ | 106,734 | ||
| Tax Assessment - 3.5% | ||||||
| Arborwood Community Development District, FL, Special Assessment (Master Infrastructure Projects), “B”, 5.1%, 2014 | $ | 185,000 | $ | 147,985 | ||
| Ave Maria Stewardship Community District, FL, “A”, 5.125%, 2038 | 195,000 | 97,615 | ||||
| Concord Station Community Development District, FL, Special Assessment, 5%, 2015 | 145,000 | 113,561 | ||||
| Concorde Estates, FL, Community Development District, “B”, 5%, 2011 | 185,000 | 141,399 | ||||
| Durbin Crossing Community Development District, FL, Special Assessment, “B-1”, 4.875%, 2010 | 165,000 | 113,532 | ||||
| Greyhawk Landing Community Development District, FL, Special Assessment, “B”, 6.25%, 2009 | 40,000 | 39,927 | ||||
| Killarney Community Development District, FL, Special Assessment, “B”, 5.125%, 2009 | 85,000 | 67,991 | ||||
| Lakes by the Bay South Community Development District, FL, Rev., “B”, 5.3%, 2009 | 100,000 | 56,999 | ||||
| Middle Village Community Development District, FL, Special Assessment, “A”, 5.8%, 2022 | 85,000 | 58,732 | ||||
| Middle Village Community Development District, FL, Special Assessment, “B”, 5%, 2009 | 20,000 | 19,920 | ||||
| New Port Tampa Bay Community Development District, FL, Special Assessment, “B”, 5.3%, 2012 | 200,000 | 84,186 | ||||
| North Springs Improvement District, FL, Special Assessment (Parkland Golf Country Club), “B-2”, 5.125%, 2015 | 105,000 | 80,968 | ||||
| Old Palm Community Development District, FL, Special Assessment (Palm Beach Gardens), “B”, 5.375%, 2014 | 90,000 | 72,770 | ||||
| Panther Trace II, Community Development District, FL, Special Assessment, “B”, 5%, 2010 | 65,000 | 58,189 | ||||
| Parkway Center Community Development District, FL, Special Assessment, “B”, 5.625%, 2014 | 80,000 | 65,928 | ||||
| Sterling Hill Community Development District, FL, Special Assessment, 5.5%, 2010 | 60,000 | 58,267 | ||||
| Tuscany Reserve Community Development District, FL, Special Assessment, “B”, 5.25%, 2016 | 220,000 | 119,328 | ||||
| Villa Portofino West Community Development District, FL, Special Assessment, “A”, 5.35%, 2036 | 185,000 | 115,471 | ||||
| Watergrass Community Development District, FL, Special Assessment, “B”, 4.875%, 2010 | 130,000 | 70,980 | ||||
| Wentworth Estates Community Development District, FL, Special Assessment, “B”, 5.125%, 2012 | 155,000 | 92,242 | ||||
| $ | 1,675,990 | |||||
31
Table of Contents
Portfolio of Investments – continued
| Municipal Bonds - continued | ||||||
| Issuer | Shares/Par | Value ($) | ||||
| Tobacco - 2.2% | ||||||
| Buckeye, OH, Tobacco Settlement Rev., Asset Backed, “A-2”, 5.875%, 2030 | $ | 500,000 | $ | 312,590 | ||
| Buckeye, OH, Tobacco Settlement Rev., Asset Backed, “A-2”, 5.875%, 2047 | 1,050,000 | 575,547 | ||||
| Louisiana Tobacco Settlement Authority Rev., “2001-B”, 5.875%, 2039 | 250,000 | 156,568 | ||||
| $ | 1,044,705 | |||||
| Universities - Colleges - 4.4% | ||||||
| Florida Board Regents, Housing Rev., MBIA, 5.3%, 2020 | $ | 610,000 | $ | 611,739 | ||
| Florida State University Board of Governors, System Improvement Rev., 6.25%, 2030 | 500,000 | 531,035 | ||||
| Miami-Dade County, FL, Educational Facilities Authority Rev. (University of Miami), “A”, 5.75%, 2028 | 1,000,000 | 993,150 | ||||
| $ | 2,135,924 | |||||
| Universities - Dormitories - 4.1% | ||||||
| Florida Board Regents, Housing Rev. (University of Central Florida), FGIC, 5.25%, 2020 | $ | 1,185,000 | $ | 1,200,725 | ||
| Florida Finance Authority, Capital Loan Projects Rev., “F”, MBIA, 5.125%, 2021 | 1,000,000 | 792,270 | ||||
| $ | 1,992,995 | |||||
| Utilities - Investor Owned - 1.0% | ||||||
| Hillsborough County, FL, Industrial Development Authority, Pollution Control Rev. (Tempa Electric Co.), “A”, 5.65%, 2018 | $ | 500,000 | $ | 492,765 | ||
| Utilities - Municipal Owned - 3.2% | ||||||
| Florida Power Agency Rev., “A”, 5%, 2031 | $ | 1,000,000 | $ | 893,270 | ||
| Issuer | Shares/Par | Value ($) | ||||
| Utilities - Municipal Owned - continued | ||||||
| St. Lucie West, FL, Utility Rev., MBIA, 5.25%, 2034 | $ | 720,000 | $ | 657,274 | ||
| $ | 1,550,544 | |||||
| Water & Sewer Utility Revenue - 16.9% | ||||||
| Miami Beach, FL, Stormwater Rev., FGIC, 5.25%, 2020 | $ | 1,000,000 | $ | 1,018,520 | ||
| Pinellas County, FL, Sewer Rev., FSA, 5%, 2032 | 1,500,000 | 1,483,635 | ||||
| Polk County, FL, Utility Systems Rev., FGIC, 5%, 2023 | 1,000,000 | 1,001,190 | ||||
| Polk County, FL, Utility Systems Rev., “A”, FGIC, 5%, 2030 | 1,000,000 | 950,710 | ||||
| Seminole County, FL, Water & Sewer Rev., Unrefunded Balance, MBIA, 6%, 2019 | 940,000 | 1,093,859 | ||||
| Tallahassee, FL, Consolidated Utility Systems Rev., 5%, 2037 | 505,000 | 495,223 | ||||
| Tampa Bay Water, FL, Regional Water Supply Authority, Utility System Rev., FGIC, 4.75%, 2033 | 2,115,000 | 1,870,252 | ||||
| Tampa Bay Water, FL, Regional Water Supply Authority, Utility System Rev., 5%, 2038 | 250,000 | 242,133 | ||||
| $ | 8,155,522 | |||||
| Total Municipal Bonds (Identified Cost, $49,771,826) | $ | 45,973,087 | ||||
| Money Market Funds (v) - 2.1% | ||||||
| MFS Institutional Money Market Portfolio, 0.23%, at Cost and Net Asset Value | 984,804 | $ | 984,804 | |||
| Total Investments (Identified Cost, $50,756,630) | $ | 46,957,891 | ||||
| Other Assets, Less Liabilities - 2.9% | 1,424,475 | |||||
| Net Assets - 100.0% | $ | 48,382,366 | ||||
Derivative Contracts at 3/31/09
Futures contracts outstanding at 3/31/09
| Description | Contracts | Value | Expiration Date | Unrealized Appreciation (Depreciation) | |||||
| U.S. Treasury Bond 30 yr (Short) | 6 | $778,219 | Jun-09 | $(17,974 | ) |
At March 31, 2009, the fund had sufficient cash and/or other liquid securities to cover any commitments under these derivative contracts.
See Portfolio Footnotes and Notes to Financial Statements
32
Table of Contents
PORTFOLIO OF INVESTMENTS
3/31/09
MFS® GEORGIA MUNICIPAL BOND FUND
The Portfolio of Investments is a complete list of all securities owned by your fund. It is categorized by broad-based asset classes.
| Municipal Bonds - 97.1% | ||||||
| Issuer | Shares/Par | Value ($) | ||||
| Airport & Port Revenue - 4.8% | ||||||
| Atlanta, GA, Airport Passenger Facilities Rev., “J”, FSA, 5%, 2029 | $ | 750,000 | $ | 752,918 | ||
| Atlanta, GA, Airport Passenger Facilities Rev., “J”, FSA, 5%, 2034 | 750,000 | 740,505 | ||||
| Atlanta, GA, Airport Rev., “B”, FSA, 5.25%, 2033 | 1,000,000 | 1,010,410 | ||||
| Augusta, GA, Airport Rev., “B”, 5.35%, 2028 | 350,000 | 236,443 | ||||
| $ | 2,740,276 | |||||
| General Obligations - General Purpose - 4.3% | ||||||
| Atlanta & Fulton County, GA, Park Improvement, “A”, MBIA, 5%, 2030 | $ | 500,000 | $ | 499,310 | ||
| Cherokee County, GA, 4.5%, 2029 | 500,000 | 485,865 | ||||
| Lagrange-Troup County, GA, Hospital Authority Rev., 5.5%, 2038 | 500,000 | 454,340 | ||||
| Macon Bibb County, GA, Urban Development Rev. (Bibb County Public Facilities Project), 5.5%, 2022 | 1,000,000 | 1,043,520 | ||||
| $ | 2,483,035 | |||||
| General Obligations - Improvement - 0.1% | ||||||
| Guam Government, “A”, 5.25%, 2037 | $ | 100,000 | $ | 65,666 | ||
| General Obligations - Schools - 4.3% | ||||||
| Fayette County, GA, School District Rev., FSA, 0% to 2010, 4.9% to 2024 | $ | 575,000 | $ | 531,668 | ||
| Forsyth County, GA, School District, 6%, 2010 (c) | 750,000 | 797,985 | ||||
| Fulton County, GA, School District, 6.375%, 2010 | 1,080,000 | 1,107,410 | ||||
| $ | 2,437,063 | |||||
| Healthcare Revenue - Hospitals - 6.1% | ||||||
| Brunswick, GA, Hospital Authority Rev. (Glynn-Brunswick Memorial Hospital), 5.625%, 2034 | $ | 750,000 | $ | 661,920 | ||
| Chatham County, GA, Hospital Authority Rev. (Memorial Health Medical Center), “A”, 6%, 2017 | 350,000 | 316,859 | ||||
| Chatham County, GA, Hospital Authority Rev., Hospital Improvement (Memorial Health University), “A”, 5.375%, 2026 | 200,000 | 146,682 | ||||
| Coffee County, GA, Hospital Authority Rev. (Coffee Regional Medical Center, Inc.), 5%, 2026 | 350,000 | 258,468 | ||||
| Georgia Medical Center Hospital Authority Rev. (Columbus Regional Healthcare System, Inc.), ASSD GTY, 6.5%, 2038 | 300,000 | 310,998 | ||||
| Houston County, GA, Hospital Authority Rev. Anticipation Certificates (Houston Healthcare Project), 5.25%, 2042 | 500,000 | 390,535 | ||||
| Indiana Finance Authority Rev. (Sisters of St. Francis Health Services), 5.375%, 2032 | 435,000 | 403,506 | ||||
| Louisville & Jefferson County, KY, Metropolitan Government Healthcare Systems Rev. (Norton Healthcare, Inc.), 5.25%, 2036 | 335,000 | 258,895 | ||||
| Royston, GA, Hospital Authority Rev. (Ty Cobb Healthcare System, Inc.), 6.125%, 2009 | 80,000 | 79,959 | ||||
| Issuer | Shares/Par | Value ($) | ||||
| Healthcare Revenue - Hospitals - continued | ||||||
| Tarrant County, TX, Cultural Education Facilities Finance Corp. (Scott & White Memorial Hospital), “A”, 5.5%, 2031 | $ | 110,000 | $ | 103,168 | ||
| Valdosta & Lowndes County, GA, Hospital Authority Rev. (Southern Georgia Medical Center Project), AMBAC, 5.25%, 2027 | 500,000 | 395,985 | ||||
| Valdosta & Lowndes County, GA, Hospital Authority Rev. (Southern Georgia Medical Center Project), 5%, 2033 | 240,000 | 188,599 | ||||
| $ | 3,515,574 | |||||
| Healthcare Revenue - Long Term Care - 0.6% | ||||||
| Fulton County, GA, Residential Care Facilities (Canterbury Court), “A”, 6.125%, 2034 | $ | 150,000 | $ | 103,896 | ||
| Fulton County, GA, Residential Care Facilities (Lenbrook Project), “A”, 5%, 2027 | 150,000 | 92,356 | ||||
| Georgia Medical Center Hospital Authority Rev. (Spring Harbor Green Island Project), 5.25%, 2037 | 200,000 | 121,108 | ||||
| $ | 317,360 | |||||
| Industrial Revenue - Environmental Services - 0.8% | ||||||
| Savannah, GA, Economic Development Authority, Solid Waste Disposal Rev. (Georgia Waste Management Project), “A”, 5.5%, 2016 | $ | 500,000 | $ | 467,310 | ||
| Industrial Revenue - Other - 1.3% | ||||||
| Cartersville, GA, Development Authority Waste & Water Facilities Rev. (Anheuser-Busch Project), 5.95%, 2032 | $ | 750,000 | $ | 608,460 | ||
| Virgin Islands Public Finance Authority, Refinery Facilities Rev. (Hovensa Coker Project), 5.875%, 2022 | 160,000 | 109,224 | ||||
| $ | 717,684 | |||||
| Industrial Revenue - Paper - 1.1% | ||||||
| Effingham County, GA, Development Authority, Solid Waste Disposal Rev. (Fort James), 5.625%, 2018 | $ | 150,000 | $ | 103,374 | ||
| Rockdale County, GA, Development Authority Project Rev. (Visy Paper Project), “A”, 6.125%, 2034 | 150,000 | 94,236 | ||||
| Savannah, GA, Economic Development Pollution (Union Camp Corp.), 6.15%, 2017 | 500,000 | 442,475 | ||||
| $ | 640,085 | |||||
| Multi-Family Housing Revenue - 2.4% | ||||||
| East Point Housing Authority, Multi-Family Rev. (Laurel Ridge at Washington Road Apartments LP), FNMA, FRN, 5%, 2032 (b) | $ | 500,000 | $ | 472,670 | ||
| Hinesville, GA, Leased Housing Corp., “A”, FHA, 6.7%, 2017 | 900,000 | 901,332 | ||||
| $ | 1,374,002 | |||||
33
Table of Contents
Portfolio of Investments – continued
| Municipal Bonds - continued | ||||||
| Issuer | Shares/Par | Value ($) | ||||
| Sales & Excise Tax Revenue - 3.9% | ||||||
| Massachusetts Bay Transportation Authority, Sales Tax Rev., “A-1”, 5.25%, 2029 | $ | 500,000 | $ | 524,905 | ||
| Metropolitan Atlanta, GA, Rapid Transit Authority Rev., “B”, FSA, 5%, 2037 | 1,500,000 | 1,484,205 | ||||
| Puerto Rico Sales Tax Financing Corp., Sales Tax Rev., 5.25%, 2057 | 280,000 | 227,746 | ||||
| $ | 2,236,856 | |||||
| Single Family Housing - State - 4.6% | ||||||
| Georgia Housing & Finance Authority Rev., 5.5%, 2032 | $ | 1,000,000 | $ | 948,530 | ||
| Georgia Housing & Finance Authority Rev., Single Family Mortgage, “A”, 5.6%, 2032 | 555,000 | 517,404 | ||||
| Georgia Housing & Finance Authority Rev., Single Family Mortgage, “C-2”, 5.1%, 2022 | 750,000 | 739,072 | ||||
| Georgia Housing & Finance Authority Rev., Single Family Mortgage, “D-2”, 5.2%, 2032 | 500,000 | 455,025 | ||||
| $ | 2,660,031 | |||||
| State & Agency - Other - 7.6% | ||||||
| Carroll City-County, GA, Hospital Authority Rev. (Tanner Medical Center), ASSD GTY, 5%, 2038 | $ | 1,000,000 | $ | 816,070 | ||
| County Commissioners of Georgia Assn., Leasing Program, Rockdale County, GA (Public Purpose Project), AMBAC, 5.625%, 2010 (c) | 335,000 | 359,599 | ||||
| County Commissioners of Georgia Assn., Leasing Program, Rockdale County, GA (Public Purpose Project), AMBAC, 5.625%, 2020 | 165,000 | 171,051 | ||||
| Fulton County, GA, Facilities Corp., Fulton County, GA (Public Purpose Project), AMBAC, 5.9%, 2019 | 1,000,000 | 1,030,530 | ||||
| Tift County, GA, Hospital Authority Rev., Anticipation Certificates, AMBAC, 5%, 2022 | 2,000,000 | 2,001,520 | ||||
| $ | 4,378,770 | |||||
| State & Local Agencies - 4.9% | ||||||
| Clayton County, GA, Development Authority Rev., “A”, 6.25%, 2009 (c) | $ | 500,000 | $ | 519,605 | ||
| Fayette County, GA, Public Facilities Authority (Criminal Justice Center Project), 6.25%, 2010 (c) | 755,000 | 812,697 | ||||
| Georgia Municipal Association, Inc. (Riverdale Public Purpose Project), ASSD GTY, 5.5%, 2038 | 1,000,000 | 1,000,720 | ||||
| Gilmer County, GA, Building Authority Rev., Courthouse Project, “A”, XLCA, 5%, 2029 | 500,000 | 485,840 | ||||
| Mississippi Development Bank Special Obligation (Hinds Community College), ASSD GTY, 5.375%, 2033 | 15,000 | 15,006 | ||||
| $ | 2,833,868 | |||||
| Tax - Other - 1.6% | ||||||
| Virgin Islands Public Finance Authority Rev., RADIAN, 5.5%, 2018 | $ | 1,000,000 | $ | 914,220 | ||
| Tax Assessment - 0.3% | ||||||
| Atlanta, GA, Tax Allocation (Eastside Project), “B”, 5.6%, 2030 | $ | 150,000 | $ | 107,676 | ||
| Atlanta, GA, Tax Allocation (Princeton Lakes Project), 5.5%, 2031 | 125,000 | 83,364 | ||||
| $ | 191,040 | |||||
| Issuer | Shares/Par | Value ($) | ||||
| Toll Roads - 1.0% | ||||||
| Bay Area Toll Authority, Toll Bridge Rev. (San Francisco Bay Area), “F1”, 5%, 2039 | $ | 595,000 | $ | 554,005 | ||
| Transportation - Special Tax - 0.3% | ||||||
| Commonwealth of Puerto Rico Highway & Transportation Authority Rev., “CC”, FSA, 5.5%, 2028 | $ | 185,000 | $ | 189,638 | ||
| Universities - Colleges - 18.6% | ||||||
| Athens-Clarke County, GA, Unified Government Development Authority, Educational Facilities Rev., 0%, 2024 | $ | 250,000 | $ | 198,168 | ||
| Athens-Clarke County, GA, Unified Government Development Authority, Educational Facilities Rev., 0%, 2031 | 250,000 | 169,260 | ||||
| Atlanta, GA, Development Authority Educational Facilities Rev. (Science Park LLC), 5%, 2032 | 500,000 | 426,120 | ||||
| Atlanta, GA, Development Authority Educational Facilities Rev. (Science Park LLC), 5%, 2039 | 500,000 | 417,915 | ||||
| Bleckley-Dodge County, GA, Student Housing Facilities Rev. (Middle Georgia College), 5.25%, 2038 | 500,000 | 447,470 | ||||
| Cobb County, GA, Development Authority, Dining Hall Lease Rev. (KSU Dining Hall), ASSD GTY, 5.75%, 2039 | 1,000,000 | 1,023,730 | ||||
| Dekalb Newton & Gwinnett Counties Joint Development Authority Rev. (GGC Foundation LLC), 6%, 2034 | 500,000 | 476,865 | ||||
| Fulton County, GA (Morehouse College), AMBAC, 6.25%, 2010 (c) | 980,000 | 1,076,755 | ||||
| Fulton County, GA, Development Authority Rev. (Georgia Tech Foundation Funding), “A”, 5%, 2031 | 265,000 | 266,338 | ||||
| Fulton County, GA, Development Authority Rev. (Georgia Tech Foundation), XLCA, 5%, 2032 | 500,000 | 482,675 | ||||
| Fulton County, GA, Development Authority Rev. (Molecular Science Building), MBIA, 5%, 2034 | 1,000,000 | 974,850 | ||||
| Fulton County, GA, Development Authority Rev. (Spelman College), 5%, 2032 | 1,250,000 | 1,219,762 | ||||
| Georgia Higher Education Facilities Authority Rev. (Real Estate Foundation), 6%, 2034 | 300,000 | 302,286 | ||||
| Marietta, GA, Development Facilities Authority Rev. (Life University), 7%, 2030 | 100,000 | 76,827 | ||||
| Massachusetts Health & Educational Facilities Authority Rev. (Massachusetts Institute of Technology), “I-1”, 5.2%, 2028 | 555,000 | 601,598 | ||||
| Private Colleges & Universities, GA, Authority Rev. (Emory University ), “C”, 5%, 2038 | 1,000,000 | 989,310 | ||||
| Savannah, GA, Economic Development Authority Rev. (AASU Student Union, LLC), ASSD GTY, 5.125%, 2039 | 500,000 | 495,030 | ||||
| Savannah, GA, Economic Development Authority Rev. (College of Art & Design, Inc.), ETM, 6.2%, 2009 (c) | 160,000 | 160,062 | ||||
| South Regional, GA, Joint Development Authority Rev. (VSU Auxiliary Student Services), “A”, ASSD GTY, 5%, 2036 | 1,000,000 | 889,030 | ||||
| $ | 10,694,051 | |||||
34
Table of Contents
Portfolio of Investments – continued
| Municipal Bonds - continued | ||||||
| Issuer | Shares/Par | Value ($) | ||||
| Universities - Dormitories - 0.7% | ||||||
| Georgia Private College & University Authority Rev. (Mercer Housing Corp.), “A”, 6%, 2021 | $ | 500,000 | $ | 415,935 | ||
| Utilities - Municipal Owned - 5.7% | ||||||
| Georgia Municipal Electric Authority Power Rev., “A”, MBIA, 6.5%, 2020 | $ | 1,250,000 | $ | 1,423,650 | ||
| Long Island Power Authority, Electric Systems Rev., “A”, BHAC, 5.5%, 2033 | 300,000 | 310,068 | ||||
| Long Island Power Authority, Electric Systems Rev., “A”, 6%, 2033 | 100,000 | 103,277 | ||||
| Monroe County, GA, Pollution Control Rev. (Oglethorpe Power Corp.), “A”, 6.8%, 2012 | 1,000,000 | 1,049,450 | ||||
| Summerville, GA, Public Utility Rev., Refunding & Improvement, 5.75%, 2012 (c) | 350,000 | 395,024 | ||||
| $ | 3,281,469 | |||||
| Utilities - Other - 0.3% | ||||||
| Main Street Natural Gas, Inc., GA, Gas Project Rev., “B”, 5%, 2019 | $ | 250,000 | $ | 171,247 | ||
| Water & Sewer Utility Revenue - 21.8% | ||||||
| Athens-Clarke County, GA, Unified Government Water & Sewer Rev., 5.625%, 2033 | $ | 500,000 | $ | 517,200 | ||
| Atlanta, GA, Water & Wastewater Rev., FSA, 5%, 2037 | 870,000 | 854,384 | ||||
| Atlanta, GA, Water & Wastewater Rev., “A”, MBIA, 5%, 2033 | 200,000 | 167,780 | ||||
| Augusta, GA, Water & Sewer Rev., FSA, 5.25%, 2034 | 1,000,000 | 1,008,060 | ||||
| Cherokee County, GA, Water & Sewer Authority Rev., FSA, 5%, 2035 (f) | 1,000,000 | 981,270 | ||||
| Issuer | Shares/Par | Value ($) | ||||
| Water & Sewer Utility Revenue - continued | ||||||
| Clayton County, GA, Water Authority, Water & Sewer Rev., 6.25%, 2010 (c) | $ | 1,000,000 | $ | 1,071,670 | ||
| Columbia County, GA, Water & Sewer Rev., FGIC, 6.25%, 2010 (c) | 470,000 | 501,246 | ||||
| Commonwealth of Puerto Rico Aqueduct & Sewer Authority Rev., “A”, ASSD GTY, 5%, 2028 | 400,000 | 379,132 | ||||
| Commonwealth of Puerto Rico Aqueduct & Sewer Authority Rev., “A”, 6%, 2044 | 1,000,000 | 839,710 | ||||
| Fairburn, GA, Utility Rev., 5.75%, 2010 (c) | 500,000 | 541,240 | ||||
| Forsyth County, GA, Water & Sewer Authority, 6.25%, 2010 (c) | 1,105,000 | 1,178,947 | ||||
| Fulton County, GA, Water & Sewer Rev., FGIC, 6.375%, 2014 | 100,000 | 111,919 | ||||
| Fulton County, GA, Water & Sewer Rev., ETM, FGIC, 6.375%, 2014 (c) | 2,150,000 | 2,415,783 | ||||
| New York, NY, City Municipal Water Finance Authority, Water & Sewer Systems Rev. “DD”, 4.75%, 2035 | 270,000 | 249,024 | ||||
| Walton County, GA, Water & Sewer Authority Rev. (Oconee-Hard Creek), FSA, 5%, 2038 | 750,000 | 738,682 | ||||
| Walton County, GA, Water & Sewer Authority Rev. (Walton-Hard Labor Creek Project), FSA, 5%, 2038 | 1,000,000 | 968,770 | ||||
| $ | 12,524,817 | |||||
| Total Municipal Bonds (Identified Cost, $57,318,839) | $ | 55,804,002 | ||||
| Money Market Funds (v) - 1.3% | ||||||
| MFS Institutional Money Market Portfolio, 0.23%, at Cost and Net Asset Value | 774,568 | $ | 774,568 | |||
| Total Investments (Identified Cost, $58,093,407) | $ | 56,578,570 | ||||
| Other Assets, Less Liabilities - 1.6% | 921,264 | |||||
| Net Assets - 100.0% | $ | 57,499,834 | ||||
Derivative Contracts at 3/31/09
Futures contracts outstanding at 3/31/09
| Description | Contracts | Value | Expiration Date | Unrealized Appreciation (Depreciation) | |||||
| U.S. Treasury Bond 30 yr (Short) | 6 | $778,219 | Jun-09 | $(17,974 | ) |
At March 31, 2009, the fund had sufficient cash and/or other liquid securities to cover any commitments under these derivative contracts.
See Portfolio Footnotes and Notes to Financial Statements
35
Table of Contents
PORTFOLIO OF INVESTMENTS
3/31/09
MFS® MARYLAND MUNICIPAL BOND FUND
The Portfolio of Investments is a complete list of all securities owned by your fund. It is categorized by broad-based asset classes.
| Municipal Bonds - 98.4% | ||||||
| Issuer | Shares/Par | Value ($) | ||||
| Airport & Port Revenue - 1.0% | ||||||
| Maryland Transportation Authority Rev. (Baltimore/Washington International Airport), “A”, AMBAC, 5%, 2027 | $ | 1,000,000 | $ | 1,003,410 | ||
| General Obligations - General Purpose - 8.7% | ||||||
| Baltimore, MD, “B”, 7.15%, 2009 | $ | 2,120,000 | $ | 2,194,052 | ||
| Baltimore, MD, Public Improvement, “A”, FSA, 5%, 2027 | 1,050,000 | 1,085,385 | ||||
| Baltimore, MD, UT, Public Improvement, “A”, MBIA, 7%, 2009 | 1,000,000 | 1,033,580 | ||||
| Commonwealth of Puerto Rico, “A”, 5.375%, 2033 | 260,000 | 207,540 | ||||
| Commonwealth of Puerto Rico, “A”, 6%, 2038 | 415,000 | 359,651 | ||||
| Commonwealth of Puerto Rico, Public Improvement, “A”, 5.25%, 2026 | 2,330,000 | 1,910,064 | ||||
| Puerto Rico Municipal Finance Agency, FSA, 5.5%, 2009 (c) | 2,000,000 | 2,053,880 | ||||
| $ | 8,844,152 | |||||
| General Obligations - Improvement - 3.9% | ||||||
| Prince George’s County, MD, Unrefunded Balance, Public Improvement, FSA, 5.375%, 2009 (c) | $ | 80,000 | $ | 82,754 | ||
| Worcester County, MD, Public Improvement, 5.625%, 2010 (c) | 1,620,000 | 1,712,275 | ||||
| Worcester County, MD, Public Improvement, 5.625%, 2010 (c) | 2,030,000 | 2,145,629 | ||||
| $ | 3,940,658 | |||||
| Healthcare Revenue - Hospitals - 23.4% | ||||||
| Indiana Finance Authority Rev. (Sisters of St. Francis Health Services), 5.375%, 2032 | $ | 830,000 | $ | 769,908 | ||
| Louisville & Jefferson County, KY, Metropolitan Government Healthcare Systems Rev. (Norton Healthcare, Inc.), 5.25%, 2036 | 640,000 | 494,605 | ||||
| Maryland Health & Higher Educational Facilities Authority Rev. (Adventist Healthcare), “A”, 5.75%, 2025 | 500,000 | 413,035 | ||||
| Maryland Health & Higher Educational Facilities Authority Rev. (Anne Arundel Health System), “A”, 6.75%, 2039 | 1,000,000 | 1,019,850 | ||||
| Maryland Health & Higher Educational Facilities Authority Rev. (Calvert Health Systems), 5.5%, 2039 | 1,000,000 | 863,690 | ||||
| Maryland Health & Higher Educational Facilities Authority Rev. (Carroll County General Hospital), 6%, 2037 | 1,000,000 | 890,900 | ||||
| Maryland Health & Higher Educational Facilities Authority Rev. (Catholic Health), “A”, 6%, 2020 | 245,000 | 251,786 | ||||
| Issuer | Shares/Par | Value ($) | ||||
| Healthcare Revenue - Hospitals - continued | ||||||
| Maryland Health & Higher Educational Facilities Authority Rev. (Catholic Health), “A”, ETM, 6%, 2020 (c) | $ | 755,000 | $ | 797,839 | ||
| Maryland Health & Higher Educational Facilities Authority Rev. (Doctors Community Hospital), “A”, 5%, 2029 | 750,000 | 537,878 | ||||
| Maryland Health & Higher Educational Facilities Authority Rev. (Frederick Memorial Hospital), 5.125%, 2035 | 1,000,000 | 703,810 | ||||
| Maryland Health & Higher Educational Facilities Authority Rev. (Good Samaritan Hospital), ETM, 5.7%, 2009 (c) | 560,000 | 566,860 | ||||
| Maryland Health & Higher Educational Facilities Authority Rev. (Johns Hopkins Hospital), 5%, 2021 | 750,000 | 750,105 | ||||
| Maryland Health & Higher Educational Facilities Authority Rev. (Johns Hopkins Medical Institutions), “A”, 5%, 2037 | 750,000 | 654,105 | ||||
| Maryland Health & Higher Educational Facilities Authority Rev. (Lifebridge Health), 4.75%, 2038 | 965,000 | 851,381 | ||||
| Maryland Health & Higher Educational Facilities Authority Rev. (Lifebridge Health), 4.75%, 2039 | 590,000 | 444,093 | ||||
| Maryland Health & Higher Educational Facilities Authority Rev. (Medlantic/Helix Parent, Inc.), “A”, 5.25%, 2038 | 2,000,000 | 1,953,040 | ||||
| Maryland Health & Higher Educational Facilities Authority Rev. (Medstar Health), 5.5%, 2033 | 800,000 | 705,288 | ||||
| Maryland Health & Higher Educational Facilities Authority Rev. (Medstar Health), BHAC, 5.25%, 2046 | 2,000,000 | 1,948,880 | ||||
| Maryland Health & Higher Educational Facilities Authority Rev. (Mercy Medical Center), “A”, 5.5%, 2042 | 750,000 | 584,310 | ||||
| Maryland Health & Higher Educational Facilities Authority Rev. (North Arundel Hospital), 6.5%, 2010 (c) | 500,000 | 540,490 | ||||
| Maryland Health & Higher Educational Facilities Authority Rev. (Peninsula Regional Medical Center), 5%, 2036 | 1,000,000 | 813,590 | ||||
| Maryland Health & Higher Educational Facilities Authority Rev. (Suburban Hospital), “A”, 5.5%, 2016 | 1,000,000 | 1,030,630 | ||||
| Maryland Health & Higher Educational Facilities Authority Rev. (Union Hospital of Cecil County Issue), 5.625%, 2032 | 1,000,000 | 893,430 | ||||
| Maryland Health & Higher Educational Facilities Authority Rev. (Union Hospital of Cecil County Issue), 5%, 2035 | 500,000 | 396,695 | ||||
| Maryland Health & Higher Educational Facilities Authority Rev. (University of Maryland Medical System), 6.625%, 2010 (c) | 945,000 | 1,004,478 | ||||
36
Table of Contents
Portfolio of Investments – continued
| Municipal Bonds - continued | ||||||
| Issuer | Shares/Par | Value ($) | ||||
| Healthcare Revenue - Hospitals - continued | ||||||
| Maryland Health & Higher Educational Facilities Authority Rev. (University of Maryland Medical System), 5%, 2031 | $ | 1,000,000 | $ | 915,820 | ||
| Maryland Health & Higher Educational Facilities Authority Rev. (University of Maryland Medical System), “A”, 5%, 2041 | 500,000 | 398,265 | ||||
| Maryland Health & Higher Educational Facilities Authority Rev. (Washington County Hospital), 5.75%, 2038 | 500,000 | 386,805 | ||||
| Maryland Industrial Development Authority, Economic Development Rev., RIBS, FSA, FRN, 10.573%, 2022 (p) | 1,350,000 | 1,520,397 | ||||
| Montgomery County, MD, Economic Development Rev. (Trinity Healthcare Group), 5.125%, 2022 | 500,000 | 496,330 | ||||
| Tarrant County, TX, Cultural Education Facilities Finance Corp. (Scott & White Memorial Hospital), “A”, 5.5%, 2031 | 200,000 | 187,578 | ||||
| $ | 23,785,871 | |||||
| Healthcare Revenue - Long Term Care - 0.7% | ||||||
| Gaithersburg, MD, Economic Development Rev. (Asbury Maryland Obligations Group), “A”, 5.125%, 2036 | $ | 400,000 | $ | 257,672 | ||
| Howard County, MD, Retirement Rev. (Vantage House Facilities), “B”, 5.25%, 2037 | 300,000 | 174,465 | ||||
| Maryland Health & Higher Educational Facilities Authority Rev. (King Farm Presbyterian Community), “A”, 5.3%, 2037 | 300,000 | 156,792 | ||||
| Maryland Health & Higher Educational Facilities Authority Rev. (Mercy Ridge), “A”, 6%, 2013 (c) | 150,000 | 172,746 | ||||
| $ | 761,675 | |||||
| Human Services - 0.6% | ||||||
| Maryland Economic Development Corp., Economic Development Rev. (Lutheran World Relief Refugee), 5.25%, 2019 | $ | 250,000 | $ | 205,978 | ||
| Maryland Economic Development Corp., Economic Development Rev. (Lutheran World Relief Refugee), 5.25%, 2029 | 565,000 | 388,070 | ||||
| $ | 594,048 | |||||
| Industrial Revenue - Chemicals - 1.5% | ||||||
| Baltimore, MD, Port Facilities Rev., Consolidated Coal Sales (Dupont), “B”, 6.5%, 2011 | $ | 1,500,000 | $ | 1,557,120 | ||
| Industrial Revenue - Environmental Services - 0.7% | ||||||
| Northeast Maryland Waste Disposal Authority Resources Recovery Rev. (Baltimore Resco Retrofit Project), 5%, 2012 | $ | 690,000 | $ | 670,852 | ||
| Industrial Revenue - Other - 0.3% | ||||||
| Virgin Islands Public Finance Authority, Refinery Facilities Rev. (Hovensa Coker Project), 5.875%, 2022 | $ | 375,000 | $ | 255,994 | ||
| Issuer | Shares/Par | Value ($) | ||||
| Miscellaneous Revenue - Other - 1.5% | ||||||
| Harford County, MD, Economic Development Rev. (Battelle Memorial Institute Project), 5.25%, 2034 | $ | 1,600,000 | $ | 1,554,464 | ||
| Multi-Family Housing Revenue - 5.2% | ||||||
| Maryland Community Development Administration (Waters Landing II Apartments), “A”, GNMA, FRN, 5.875%, 2033 | $ | 1,500,000 | $ | 1,539,225 | ||
| Maryland Community Development Administration, “A”, 5%, 2034 | 910,000 | 781,426 | ||||
| Maryland Community Development Administration, “A”, 5.1%, 2044 | 970,000 | 845,054 | ||||
| Maryland Community Development Administration, “A”, 5.05%, 2047 | 1,000,000 | 825,330 | ||||
| Maryland Community Development Administration, “B”, FNMA, 5%, 2039 | 500,000 | 438,470 | ||||
| Maryland Community Development Administration, “D”, 5%, 2032 | 1,000,000 | 873,420 | ||||
| $ | 5,302,925 | |||||
| Parking - 1.2% | ||||||
| Maryland Health & Higher Educational Facilities Authority Rev. (Johns Hopkins Medical Institutions), AMBAC, 5%, 2034 | $ | 1,500,000 | $ | 1,219,365 | ||
| Sales & Excise Tax Revenue - 0.3% | ||||||
| Puerto Rico Sales Tax Financing Corp., Sales Tax Rev., 5.25%, 2057 | $ | 335,000 | $ | 272,482 | ||
| Single Family Housing Revenue - Local - 0.0% | ||||||
| Prince George’s County, MD, Housing Single Family Collateral, “A”, GNMA, 5.6%, 2034 | $ | 25,000 | $ | 24,927 | ||
| Single Family Housing - State - 5.1% | ||||||
| Maryland Community Development Administration Housing, 5.1%, 2037 | $ | 1,000,000 | $ | 895,380 | ||
| Maryland Community Development Administration Housing, 5.65%, 2048 | 1,000,000 | 1,007,930 | ||||
| Maryland Community Development Administration Housing, “A”, 5.875%, 2016 | 715,000 | 715,400 | ||||
| Maryland Community Development Administration Residential, “B”, 4.75%, 2019 | 305,000 | 297,573 | ||||
| Maryland Community Development Administration, “I”, 6%, 2041 | 815,000 | 822,050 | ||||
| Montgomery County, MD, Housing Opportunities Commission (Single Family Mortgage Rev.), “B”, 4.55%, 2026 | 1,505,000 | 1,311,908 | ||||
| Puerto Rico Housing Finance Authority, Home Mortgage Rev., Mortgage Backed Securities, “A”, 4.75%, 2023 | 175,000 | 164,486 | ||||
| $ | 5,214,727 | |||||
| State & Agency - Other - 3.2% | ||||||
| Howard County, MD, COP, 8%, 2019 | $ | 805,000 | $ | 1,111,681 | ||
| Howard County, MD, COP, 8%, 2019 | 385,000 | 531,673 | ||||
| Howard County, MD, COP, 8%, 2019 | 680,000 | 939,060 | ||||
37
Table of Contents
Portfolio of Investments – continued
| Municipal Bonds - continued | ||||||
| Issuer | Shares/Par | Value ($) | ||||
| State & Agency - Other - continued | ||||||
| Howard County, MD, COP, “B”, 8.15%, 2021 | $ | 450,000 | $ | 629,739 | ||
| $ | 3,212,153 | |||||
| State & Local Agencies - 3.9% | ||||||
| Prince George’s County, MD, Lease Development Authority Rev., MBIA, 0%, 2009 | $ | 1,500,000 | $ | 1,491,960 | ||
| Puerto Rico Public Finance Corp., AMBAC, 5.375%, 2016 | 1,040,000 | 1,202,417 | ||||
| Puerto Rico Public Finance Corp., Commonwealth Appropriations, “E”, 5.7%, 2010 (c) | 1,235,000 | 1,283,758 | ||||
| $ | 3,978,135 | |||||
| Tax - Other - 1.8% | ||||||
| Virgin Islands Public Finance Authority Rev., “A”, 5.5%, 2022 | $ | 1,000,000 | $ | 864,260 | ||
| Virgin Islands Public Finance Authority Rev., “E”, 5.875%, 2018 | 1,000,000 | 937,390 | ||||
| $ | 1,801,650 | |||||
| Tax Assessment - 2.3% | ||||||
| Anne Arundel County, MD, Special Obligations (Arundel Mills Project), 5.125%, 2029 (f) | $ | 1,555,000 | $ | 1,597,654 | ||
| Baltimore, MD, Special Obligation, “A”, 7%, 2038 | 400,000 | 315,720 | ||||
| Brunswick, MD, Special Obligation (Brunswick Crossing Special Taxing), 5.5%, 2036 | 250,000 | 143,433 | ||||
| Prince George’s County, MD, Special Obligation (National Harbor Project), 5.2%, 2034 | 500,000 | 258,625 | ||||
| $ | 2,315,432 | |||||
| Tobacco - 0.6% | ||||||
| Guam Economic Development Authority Tobacco Settlement, “B”, 5.5%, 2011 (c) | $ | 400,000 | $ | 436,188 | ||
| Virgin Islands Tobacco Settlement Financing Corp., 5%, 2021 | 195,000 | 158,693 | ||||
| $ | 594,881 | |||||
| Toll Roads - 0.9% | ||||||
| Bay Area Toll Authority, Toll Bridge Rev. (San Francisco Bay Area), “F1”, 5%, 2039 | $ | 985,000 | $ | 917,134 | ||
| Transportation - Special Tax - 3.0% | ||||||
| Commonwealth of Puerto Rico Highway & Transportation Authority Rev., FSA, 5.25%, 2033 | $ | 1,365,000 | $ | 1,317,716 | ||
| Maryland Department of Transportation, Port Administration Facilities Project, AMBAC, 5.25%, 2020 | 1,690,000 | 1,704,990 | ||||
| $ | 3,022,706 | |||||
| Universities - Colleges - 14.0% | ||||||
| Annapolis, MD, Economic Development Rev. (St. John’s College), 5.5%, 2018 | $ | 180,000 | $ | 180,002 | ||
| Anne Arundel County, MD, Economic Development (Community College Project), 5.25%, 2028 | 1,600,000 | 1,545,152 | ||||
| Issuer | Shares/Par | Value ($) | ||||
| Universities - Colleges - continued | ||||||
| Frederick County, MD, Educational Facilities Rev. (Mount St. Mary’s College), 5%, 2030 | $ | 1,000,000 | $ | 707,490 | ||
| Frederick County, MD, Educational Facilities Rev. (Mount St. Mary’s College), “A”, 5.7%, 2010 (c) | 850,000 | 894,957 | ||||
| Maryland Health & Higher Education (Loyola College), “A”, 5%, 2040 | 1,000,000 | 843,450 | ||||
| Maryland Health & Higher Education (Maryland Institute College of Art), 5%, 2030 | 750,000 | 559,597 | ||||
| Maryland Health & Higher Educational Facilities Authority Rev. (Goucher College), 5.375%, 2025 | 500,000 | 484,945 | ||||
| Maryland Health & Higher Educational Facilities Authority Rev. (Johns Hopkins University), “A”, 5%, 2032 | 2,000,000 | 2,006,980 | ||||
| Maryland Health & Higher Educational Facilities Authority Rev. (Loyola College), “A”, 5.125%, 2045 | 1,600,000 | 1,361,504 | ||||
| Massachusetts Health & Educational Facilities Authority Rev. (Massachusetts Institute of Technology), “I-1”, 5.2%, 2028 | 1,020,000 | 1,105,639 | ||||
| Massachusetts State College, Building Authority Project Rev., “A”, 5.5%, 2049 | 825,000 | 809,251 | ||||
| Morgan State University, MD, Academic, MBIA, 6.05%, 2015 | 1,500,000 | 1,713,465 | ||||
| Westminster, MD, Educational Facilities Rev. (McDaniel College, Inc.), 5.5%, 2012 (c) | 1,000,000 | 1,140,450 | ||||
| Westminster, MD, Educational Facilities Rev. (McDaniel College, Inc.), 5%, 2031 | 1,000,000 | 828,760 | ||||
| $ | 14,181,642 | |||||
| Universities - Dormitories - 2.1% | ||||||
| Maryland Economic Development Corp. (Morgan State University Project), “A”, 6%, 2034 | $ | 1,000,000 | $ | 663,370 | ||
| Maryland Economic Development Corp., Collegiate Housing (Salisbury), “A”, 6%, 2019 | 1,000,000 | 831,500 | ||||
| Maryland Economic Development Corp., Collegiate Housing Rev. (Towson University), “A”, 5.75%, 2029 | 1,000,000 | 661,780 | ||||
| $ | 2,156,650 | |||||
| Universities - Secondary Schools - 0.6% | ||||||
| Maryland Health & Higher Educational Facilities Authority Rev. (Washington Christian Academy), 5.5%, 2038 | $ | 500,000 | $ | 299,500 | ||
| Maryland Industrial Development Financing Authority, Economic Development Authority Rev. (Our Lady of Good Council), “A”, 6%, 2035 | 400,000 | 269,872 | ||||
| $ | 569,372 | |||||
| Utilities - Investor Owned - 0.5% | ||||||
| Maryland Economic Development Corp., Pollution Control Rev. (Potomac Electric Power Co.), 6.2%, 2022 | $ | 500,000 | $ | 512,235 | ||
38
Table of Contents
Portfolio of Investments – continued
| Municipal Bonds - continued | ||||||
| Issuer | Shares/Par | Value ($) | ||||
| Utilities - Municipal Owned - 3.8% | ||||||
| Guam Power Authority Rev., AMBAC, 5.25%, 2015 | $ | 3,360,000 | $ | 3,120,298 | ||
| Long Island Power Authority, Electric Systems Rev., “A”, BHAC, 5.5%, 2033 | 540,000 | 558,122 | ||||
| Long Island Power Authority, Electric Systems Rev., “A”, 6%, 2033 | 185,000 | 191,062 | ||||
| $ | 3,869,482 | |||||
| Water & Sewer Utility Revenue - 7.6% | ||||||
| Baltimore, MD, Rev., LEVRRS, MBIA, FRN, 10.03%, 2020 (p) | $ | 3,000,000 | $ | 3,787,800 | ||
| Baltimore, MD, Wastewater Rev. Project, “A”, MBIA, 5.65%, 2020 | 2,000,000 | 2,262,600 | ||||
| Commonwealth of Puerto Rico Aqueduct & Sewer Authority Rev., “A”, ASSD GTY, 5%, 2028 | 400,000 | 379,132 | ||||
| Commonwealth of Puerto Rico Aqueduct & Sewer Authority Rev., “A”, 6%, 2044 | 1,000,000 | 839,710 | ||||
| Issuer | Shares/Par | Value ($) | ||||
| Water & Sewer Utility Revenue - continued | ||||||
| Commonwealth of Puerto Rico Aqueduct & Sewer Authority Rev., ETM, 10.25%, 2009 (c) | $ | 40,000 | $ | 40,959 | ||
| New York, NY, City Municipal Water Finance Authority, Water & Sewer Systems Rev. “DD”, 4.75%, 2035 | 480,000 | 442,709 | ||||
| $ | 7,752,910 | |||||
| Total Municipal Bonds (Identified Cost, $105,066,022) | $ | 99,887,052 | ||||
| Money Market Funds (v) - 0.2% | ||||||
| MFS Institutional Money Market Portfolio, 0.23%, at Cost and Net Asset Value | 194,806 | $ | 194,806 | |||
| Total Investments (Identified Cost, $105,260,828) | $ | 100,081,858 | ||||
| Other Assets, Less Liabilities - 1.4% | 1,378,621 | |||||
| Net Assets - 100.0% | $ | 101,460,479 | ||||
Derivative Contracts at 3/31/09
Futures contracts outstanding at 3/31/09
| Description | Contracts | Value | Expiration Date | Unrealized Appreciation (Depreciation) | |||||
| U.S. Treasury Bond 30 yr (Short) | 12 | $1,556,438 | Jun-09 | $(35,949 | ) |
At March 31, 2009, the fund had sufficient cash and/or other liquid securities to cover any commitments under these derivative contracts.
See Portfolio Footnotes and Notes to Financial Statements
39
Table of Contents
PORTFOLIO OF INVESTMENTS
3/31/09
MFS® MASSACHUSETTS MUNICIPAL BOND FUND
The Portfolio of Investments is a complete list of all securities owned by your fund. It is categorized by broad-based asset classes.
| Municipal Bonds - 96.7% | ||||||
| Issuer | Shares/Par | Value ($) | ||||
| Airport & Port Revenue - 2.5% | ||||||
| Massachusetts Port Authority Rev., “A”, MBIA, 5%, 2033 | $ | 3,000,000 | $ | 2,909,569 | ||
| Massachusetts Port Authority Rev., “C”, 6.125%, 2010 (c) | 1,460,000 | 1,535,482 | ||||
| Massachusetts Port Authority Rev., ETM, 13%, 2013 (c) | 485,000 | 614,854 | ||||
| $ | 5,059,905 | |||||
| General Obligations - General Purpose - 10.8% | ||||||
| Boston, MA, “A”, 5.75%, 2010 (c) | $ | 3,645,000 | $ | 3,802,865 | ||
| Brookline, MA, 5.375%, 2019 | 1,800,000 | 1,856,358 | ||||
| Commonwealth of Massachusetts, “B”, 5.25%, 2028 | 2,500,000 | 2,656,775 | ||||
| Greater Lawrence, MA, Sanitation District, MBIA, 5.625%, 2010 (c) | 1,640,000 | 1,756,719 | ||||
| Massachusetts Consolidated Loan, “A”, 6%, 2010 (c) | 3,000,000 | 3,154,350 | ||||
| Massachusetts Consolidated Loan, “B”, 5.75%, 2010 (c) | 1,000,000 | 1,061,300 | ||||
| Massachusetts Consolidated Loan, “C”, 5.75%, 2010 (c) | 1,500,000 | 1,599,630 | ||||
| Middleborough, MA, FGIC, 5.6%, 2010 (c) | 75,000 | 78,703 | ||||
| Puerto Rico Public Buildings Authority Rev., Guaranteed, “M”, 6.25%, 2023 | 605,000 | 575,712 | ||||
| State of Massachusetts, “A”, 5%, 2039 | 1,000,000 | 975,700 | ||||
| Sutton, MA, MBIA, 5.5%, 2017 | 1,000,000 | 1,028,540 | ||||
| Sutton, MA, MBIA, 5.5%, 2019 | 1,000,000 | 1,025,380 | ||||
| Westford, MA, FGIC, 5.25%, 2010 (c) | 2,250,000 | 2,378,273 | ||||
| $ | 21,950,305 | |||||
| General Obligations - Improvement - 1.7% | ||||||
| Guam Government, “A”, 5.25%, 2037 | $ | 395,000 | $ | 259,381 | ||
| Worcester, MA, “A”, FSA, 6%, 2010 (c)(f) | 2,955,000 | 3,145,420 | ||||
| $ | 3,404,801 | |||||
| General Obligations - Schools - 0.9% | ||||||
| Narragansett, MA, Regional School District, AMBAC, 6%, 2019 | $ | 1,720,000 | $ | 1,778,738 | ||
| Healthcare Revenue - Hospitals - 13.1% | ||||||
| Indiana Health & Educational Facilities Financing Authority Rev. (Sisters of St. Francis Health Services, Inc.), “E”, FSA, 5.25%, 2041 | $ | 1,000,000 | $ | 911,330 | ||
| Louisville & Jefferson County, KY, Metropolitan Government Healthcare Systems Rev. (Norton Healthcare, Inc.), 5.25%, 2036 | 1,180,000 | 911,928 | ||||
| Massachusetts Development Finance Agency Rev. (Massachusetts Biomedical Research), “C”, 6.375%, 2016 | 50,000 | 52,397 | ||||
| Massachusetts Health & Educational Facilities Authority Rev., 6.5%, 2012 (c) | 15,000 | 17,232 | ||||
| Issuer | Shares/Par | Value ($) | ||||
| Healthcare Revenue - Hospitals - continued | ||||||
| Massachusetts Health & Educational Facilities Authority Rev. (Bay State Medical Center), “F”, 5.75%, 2033 | $ | 2,000,000 | $ | 1,831,360 | ||
| Massachusetts Health & Educational Facilities Authority Rev. (Berkshire Health Systems), “E”, 6.25%, 2031 | 1,350,000 | 1,152,414 | ||||
| Massachusetts Health & Educational Facilities Authority Rev. (Boston Medical Center), 5.25%, 2038 | 2,000,000 | 1,505,580 | ||||
| Massachusetts Health & Educational Facilities Authority Rev. (Caregroup, Inc.), 5.125%, 2038 | 2,000,000 | 1,482,180 | ||||
| Massachusetts Health & Educational Facilities Authority Rev. (Caritas Christi), “B”, 6.25%, 2022 | 20,000 | 18,123 | ||||
| Massachusetts Health & Educational Facilities Authority Rev. (Catholic Health East Issue), 5.5%, 2012 (c) | 1,575,000 | 1,806,746 | ||||
| Massachusetts Health & Educational Facilities Authority Rev. (Healthcare Systems), 6.5%, 2017 | 60,000 | 62,361 | ||||
| Massachusetts Health & Educational Facilities Authority Rev. (Healthcare Systems), 6%, 2031 | 790,000 | 725,568 | ||||
| Massachusetts Health & Educational Facilities Authority Rev. (Jordan Hospital), “D”, 5.25%, 2018 | 1,330,000 | 1,000,665 | ||||
| Massachusetts Health & Educational Facilities Authority Rev. (Lahey Clinic), “D”, 5.25%, 2037 | 1,550,000 | 1,245,270 | ||||
| Massachusetts Health & Educational Facilities Authority Rev. (Milford-Whitinsville Hospital), “C”, 5.25%, 2018 | 1,500,000 | 1,226,265 | ||||
| Massachusetts Health & Educational Facilities Authority Rev. (Milton Hospital), “C”, 5.5%, 2016 | 600,000 | 489,330 | ||||
| Massachusetts Health & Educational Facilities Authority Rev. (New England Medical Center Hospital), “H”, FGIC, 5.375%, 2012 (c) | 815,000 | 907,633 | ||||
| Massachusetts Health & Educational Facilities Authority Rev. (New England), “H”, FGIC, 5%, 2012 (c) | 45,000 | 49,460 | ||||
| Massachusetts Health & Educational Facilities Authority Rev. (New England), “H”, FGIC, 5%, 2025 | 1,090,000 | 796,605 | ||||
| Massachusetts Health & Educational Facilities Authority Rev. (Partners Healthcare Systems), “C”, 5.75%, 2021 | 100,000 | 102,483 | ||||
| Massachusetts Health & Educational Facilities Authority Rev. (Partners Healthcare Systems), “G”, 5%, 2032 | 2,000,000 | 1,921,940 | ||||
40
Table of Contents
Portfolio of Investments – continued
| Municipal Bonds - continued | ||||||
| Issuer | Shares/Par | Value ($) | ||||
| Healthcare Revenue - Hospitals - continued | ||||||
| Massachusetts Health & Educational Facilities Authority Rev. (Quincy Medical Center), “A”, 6.5%, 2038 | $ | 1,000,000 | $ | 675,620 | ||
| Massachusetts Health & Educational Facilities Authority Rev. (South Shore), 5.625%, 2019 | 740,000 | 728,345 | ||||
| Massachusetts Health & Educational Facilities Authority Rev. (University of Massachusetts Memorial Hospital), “C”, 6.5%, 2021 | 1,000,000 | 932,760 | ||||
| Massachusetts Health & Educational Facilities Authority Rev., “C”, FGIC, 4.5%, 2035 | 1,045,000 | 747,562 | ||||
| Massachusetts Industrial Finance Agency Rev., Capital Appreciation (Massachusetts Biomedical Research), “A”, 0%, 2010 | 5,300,000 | 5,155,681 | ||||
| $ | 26,456,838 | |||||
| Healthcare Revenue - Long Term Care - 0.5% | ||||||
| Massachusetts Development Finance Agency Rev. (Adventcare), “A”, 6.75%, 2037 | $ | 500,000 | $ | 349,240 | ||
| Massachusetts Development Finance Agency Rev. (Linden Ponds, Inc.), “A”, 5.75%, 2035 | 500,000 | 282,510 | ||||
| Massachusetts Development Finance Agency Rev. (Loomis Communities, Inc.), “A”, 6.9%, 2032 | 530,000 | 436,773 | ||||
| $ | 1,068,523 | |||||
| Healthcare Revenue - Other - 0.9% | ||||||
| Massachusetts Health & Educational Facilities Authority Rev. (Dana Faber Cancer Institute), “K”, 5%, 2037 | $ | 2,000,000 | $ | 1,764,300 | ||
| Human Services - 0.4% | ||||||
| Massachusetts Health & Educational Facilities Authority Rev. (Learning Center for Deaf Children), “C”, 6.1%, 2019 | $ | 1,000,000 | $ | 842,680 | ||
| Industrial Revenue - Airlines - 1.3% | ||||||
| Massachusetts Port Authority Rev., Special Facilities (U.S. Airways), “A”, MBIA, 5.625%, 2011 | $ | 1,140,000 | $ | 1,080,401 | ||
| Massachusetts Port Authority Rev., Special Facilities (U.S. Airways), MBIA, 5.875%, 2016 | 1,900,000 | 1,621,289 | ||||
| $ | 2,701,690 | |||||
| Industrial Revenue - Environmental Services - 0.8% | ||||||
| Massachusetts Development Finance Agency Rev. (Waste Management, Inc.), FRN, 5.5%, 2027 (b) | $ | 750,000 | $ | 714,533 | ||
| Massachusetts Development Finance Agency Rev. (Waste Management, Inc.), “B”, FRN, 6.9%, 2029 (b) | 1,000,000 | 1,007,620 | ||||
| $ | 1,722,153 | |||||
| Industrial Revenue - Other - 2.1% | ||||||
| Massachusetts Development Finance Agency Rev., Resource Recovery (Fluor Corp.), 5.625%, 2019 | $ | 1,675,000 | $ | 1,693,341 | ||
| Massachusetts Industrial Finance Agency Rev. (Welch Foods, Inc.), 5.6%, 2017 | 2,100,000 | 2,111,760 | ||||
| Issuer | Shares/Par | Value ($) | ||||
| Industrial Revenue - Other - continued | ||||||
| Virgin Islands Public Finance Authority, Refinery Facilities Rev. (Hovensa Coker Project), 5.875%, 2022 | $ | 595,000 | $ | 406,177 | ||
| $ | 4,211,278 | |||||
| Miscellaneous Revenue - Other - 2.7% | ||||||
| Martha’s Vineyard, MA, Land Bank Rev., AMBAC, 5%, 2029 | $ | 785,000 | $ | 723,346 | ||
| Massachusetts Port Authority Facilities Rev. (Boston Fuel Project), FGIC, 5%, 2024 | 2,000,000 | 1,807,760 | ||||
| Massachusetts St. Development Finance Agency Rev., 5.5%, 2020 | 1,205,000 | 1,345,551 | ||||
| Massachusetts St. Health & Educational Facilities Authority Rev., 5.5%, 2034 | 1,500,000 | 1,502,010 | ||||
| $ | 5,378,667 | |||||
| Multi-Family Housing Revenue - 7.5% | ||||||
| Massachusetts Development Finance Agency Rev. (Credit Housing-Chelsea Homes), “I-A”, LOC, 5%, 2024 | $ | 1,185,000 | $ | 1,133,808 | ||
| Massachusetts Development Finance Agency Rev. (Morville House Apartments), “A”, LOC, 4.95%, 2023 | 2,500,000 | 2,340,775 | ||||
| Massachusetts Housing Finance Agency Rev., “A”, 5%, 2028 | 2,325,000 | 2,123,562 | ||||
| Massachusetts Housing Finance Agency Rev., “A”, 5.2%, 2037 | 1,500,000 | 1,323,780 | ||||
| Massachusetts Housing Finance Agency Rev., “A”, AMBAC, 5.5%, 2040 | 1,565,000 | 1,229,370 | ||||
| Massachusetts Housing Finance Agency Rev., “A”, 5.25%, 2048 | 1,000,000 | 882,820 | ||||
| Massachusetts Housing Finance Agency Rev., “E”, 5%, 2028 | 1,900,000 | 1,735,384 | ||||
| Massachusetts Housing Finance Agency Rev., “F”, 5.125%, 2034 | 720,000 | 625,025 | ||||
| Massachusetts Housing Finance Agency Rev., “P”, 5%, 2023 | 1,240,000 | 1,156,734 | ||||
| Massachusetts Housing Finance Agency Rev., “P”, 5.2%, 2045 | 1,445,000 | 1,217,586 | ||||
| Massachusetts Housing Finance Agency Rev., Rental Mortgage, “A”, AMBAC, 5.7%, 2020 | 1,375,000 | 1,377,173 | ||||
| $ | 15,146,017 | |||||
| Parking - 0.6% | ||||||
| Rail Connections, Inc., Massachusetts Rev. (Route 128 Parking Garage), “A”, 6%, 2009 (c) | $ | 450,000 | $ | 465,174 | ||
| Rail Connections, Inc., Massachusetts Rev. (Route 128 Parking Garage), “A”, 6%, 2009 (c) | 500,000 | 516,860 | ||||
| Rail Connections, Inc., Massachusetts Rev. (Route 128 Parking Garage), “A”, 6%, 2009 (c) | 250,000 | 258,430 | ||||
| $ | 1,240,464 | |||||
| Sales & Excise Tax Revenue - 4.3% | ||||||
| Massachusetts Bay Transportation Authority, Sales Tax Rev., 0%, 2034 | $ | 6,000,000 | $ | 1,390,260 | ||
| Massachusetts Bay Transportation Authority, Sales Tax Rev., “A-1”, 5.25%, 2029 | 1,850,000 | 1,942,149 | ||||
41
Table of Contents
Portfolio of Investments – continued
| Municipal Bonds - continued | ||||||
| Issuer | Shares/Par | Value ($) | ||||
| Sales & Excise Tax Revenue - continued | ||||||
| Massachusetts Bay Transportation Authority, Sales Tax Rev., “B”, 5.25%, 2033 | $ | 1,000,000 | $ | 1,031,960 | ||
| Massachusetts School Building Authority, Dedicated Sales Tax Rev., AMBAC, 4.75%, 2032 | 2,000,000 | 1,871,260 | ||||
| Massachusetts School Building Authority, Dedicated Sales Tax Rev., “A”, AMBAC, 4.5%, 2035 | 1,000,000 | 888,300 | ||||
| Route 3 North Transit Improvement Associates Rev., MBIA, 5.625%, 2010 (c) | 1,500,000 | 1,591,845 | ||||
| $ | 8,715,774 | |||||
| Single Family Housing Revenue - Local - 1.5% | ||||||
| Boston Housing Authority Capital Program Rev., FSA, 5%, 2028 | $ | 3,000,000 | $ | 2,967,360 | ||
| Single Family Housing - State - 3.1% | ||||||
| Massachusetts Housing Finance Agency, Single Family Housing Rev., “102”, 5%, 2029 | $ | 1,500,000 | $ | 1,356,645 | ||
| Massachusetts Housing Finance Agency, Single Family Housing Rev., “122”, 4.85%, 2031 | 1,625,000 | 1,407,624 | ||||
| Massachusetts Housing Finance Agency, Single Family Housing Rev., “128”, FSA, 4.875%, 2038 | 1,735,000 | 1,485,004 | ||||
| Massachusetts Housing Finance Agency, Single Family Housing Rev., “138”, 5.35%, 2033 | 2,000,000 | 1,962,260 | ||||
| $ | 6,211,533 | |||||
| Solid Waste Revenue - 1.0% | ||||||
| Massachusetts Development Finance Agency, Resource Recovery Rev. (Ogden Haverhill Associates), “A”, 6.7%, 2014 | $ | 405,000 | $ | 394,754 | ||
| Massachusetts Industrial Finance Agency, Resource Recovery Rev. (Ogden Haverhill Associates), “A”, 5.6%, 2019 | 1,925,000 | 1,573,514 | ||||
| $ | 1,968,268 | |||||
| State & Agency - Other - 0.7% | ||||||
| Massachusetts Development Finance Agency Rev. (Visual & Performing Arts Project), 6%, 2015 | $ | 1,235,000 | $ | 1,404,319 | ||
| Student Loan Revenue - 2.1% | ||||||
| Massachusetts Educational Financing Authority, Education Loan Rev., “E”, AMBAC, 5%, 2015 | $ | 90,000 | $ | 86,278 | ||
| Massachusetts Educational Financing Authority, Education Loan Rev., “H”, ASSD GTY, 6.35%, 2030 | 3,000,000 | 2,827,020 | ||||
| Massachusetts Educational Financing Authority, Education Loan Rev., “Issue E”, AMBAC, 5.3%, 2016 | 1,360,000 | 1,312,754 | ||||
| Massachusetts Educational Financing Authority, Education Loan Rev., “Issue G”, “A”, MBIA, 6.05%, 2017 | 40,000 | 40,346 | ||||
| $ | 4,266,398 | |||||
| Issuer | Shares/Par | Value ($) | ||||
| Tax - Other - 0.8% | ||||||
| Massachusetts Bay Transportation Authority, Unrefunded Balance, “A”, 5.75%, 2018 | $ | 320,000 | $ | 331,290 | ||
| Virgin Islands Public Finance Authority Rev., “E”, 5.875%, 2018 | 1,420,000 | 1,331,094 | ||||
| $ | 1,662,384 | |||||
| Tax Assessment - 0.1% | ||||||
| Massachusetts Bay Transportation Authority Rev., 5.25%, 2030 | $ | 245,000 | $ | 246,034 | ||
| Tobacco - 0.1% | ||||||
| Children’s Trust Fund, Tobacco Settlement Rev., Puerto Rico, 5.5%, 2039 | $ | 400,000 | $ | 266,452 | ||
| Toll Roads - 1.0% | ||||||
| Bay Area Toll Authority, Toll Bridge Rev. (San Francisco Bay Area), “F1”, 5%, 2039 | $ | 2,085,000 | $ | 1,941,344 | ||
| Transportation - Special Tax - 0.8% | ||||||
| Indiana Finance Authority Highway Rev., “A”, MBIA, 4.5%, 2029 | $ | 1,805,000 | $ | 1,667,098 | ||
| Universities - Colleges - 22.0% | ||||||
| Massachusetts College Building Authority Project Rev., “A”, XLCA, 0%, 2022 | $ | 8,310,000 | $ | 4,356,268 | ||
| Massachusetts College Building Authority Project Rev., “A”, XLCA, 5.25%, 2023 | 1,000,000 | 1,026,870 | ||||
| Massachusetts College Building Authority Project Rev., “A”, XLCA, 5%, 2043 | 2,110,000 | 1,936,178 | ||||
| Massachusetts Development Finance Agency Rev. (Boston College), “P”, 5%, 2042 | 2,250,000 | 2,121,413 | ||||
| Massachusetts Development Finance Agency Rev. (Curry College), “A”, ACA, 5%, 2036 | 2,000,000 | 1,397,220 | ||||
| Massachusetts Development Finance Agency Rev. (Hampshire College), 5.7%, 2034 | 1,000,000 | 740,290 | ||||
| Massachusetts Development Finance Agency Rev. (Massachusetts College of Pharmacy), “B”, 6.625%, 2010 (c) | 50,000 | 52,790 | ||||
| Massachusetts Development Finance Agency Rev. (Massachusetts College of Pharmacy), “C”, 5.75%, 2013 (c) | 1,000,000 | 1,174,450 | ||||
| Massachusetts Development Finance Agency Rev. (Mount Holyoke College), 5.125%, 2021 | 1,000,000 | 1,028,410 | ||||
| Massachusetts Development Finance Agency Rev. (New England Conservatory of Music), 5.25%, 2038 | 2,000,000 | 1,491,860 | ||||
| Massachusetts Development Finance Agency Rev. (Olin College), “B”, XLCA, 5.25%, 2033 | 3,000,000 | 2,728,260 | ||||
| Massachusetts Development Finance Agency Rev. (Simmons College), XLCA, 5.25%, 2026 | 2,000,000 | 1,590,200 | ||||
| Massachusetts Development Finance Agency Rev. (Smith College), 5%, 2035 | 1,000,000 | 981,290 | ||||
42
Table of Contents
Portfolio of Investments – continued
| Municipal Bonds - continued | ||||||
| Issuer | Shares/Par | Value ($) | ||||
| Universities - Colleges - continued | ||||||
| Massachusetts Development Finance Agency Rev. (Western New England College), 6.125%, 2012 (c) | $ | 1,115,000 | $ | 1,296,823 | ||
| Massachusetts Development Finance Agency Rev. (Wheelock College), “C”, 5.25%, 2037 | 1,500,000 | 1,149,345 | ||||
| Massachusetts Health & Educational Facilities Authority Rev., 5.5%, 2036 | 1,500,000 | 1,590,720 | ||||
| Massachusetts Health & Educational Facilities Authority Rev., 5%, 2037 | 2,000,000 | 1,800,240 | ||||
| Massachusetts Health & Educational Facilities Authority Rev. (Boston College), 5.5%, 2027 | 1,735,000 | 1,898,715 | ||||
| Massachusetts Health & Educational Facilities Authority Rev. (Lesley University), “A”, ASSD GTY, 5.25%, 2039 | 1,000,000 | 971,870 | ||||
| Massachusetts Health & Educational Facilities Authority Rev. (Massachusetts Institute of Technology), “A”, 5%, 2038 | 2,000,000 | 2,028,180 | ||||
| Massachusetts Health & Educational Facilities Authority Rev. (Massachusetts Institute of Technology), “I-1”, 5.2%, 2028 | 1,000,000 | 1,083,960 | ||||
| Massachusetts Health & Educational Facilities Authority Rev. (Simmons College), “I”, 8%, 2029 | 500,000 | 514,730 | ||||
| Massachusetts Health & Educational Facilities Authority Rev. (Tufts University), 5.375%, 2038 | 850,000 | 864,017 | ||||
| Massachusetts Health & Educational Facilities Authority Rev. (UMass Worcester) ,”B”, FGIC, 5.125%, 2019 | 1,005,000 | 1,026,798 | ||||
| Massachusetts Health & Educational Facilities Authority Rev. (University of Massachusetts), “A”, FGIC, 5.85%, 2010 (c) | 1,200,000 | 1,296,996 | ||||
| Massachusetts Health & Educational Facilities Authority Rev. (Wellesley College), 5%, 2033 | 1,000,000 | 1,007,140 | ||||
| Massachusetts Health & Higher Educational Facilities Authority Rev. (Williams College), “H”, 5%, 2028 | 1,000,000 | 1,007,520 | ||||
| Massachusetts Industrial Finance Agency Rev. (Brandeis University), “C”, MBIA, 0%, 2009 | 1,000,000 | 993,130 | ||||
| Massachusetts Industrial Finance Agency Rev. (Brandeis University), “C”, MBIA, 0%, 2010 | 1,000,000 | 976,470 | ||||
| Massachusetts Industrial Finance Agency Rev. (Brandeis University), “C”, MBIA, 0%, 2011 | 500,000 | 478,145 | ||||
| Massachusetts State College, Building Authority Project Rev., “A”, 5.5%, 2049 | 1,680,000 | 1,647,929 | ||||
| New York Dormitory Authority Rev., Non State Supported Debt (New York University), “A”, 5.25%, 2048 | 2,245,000 | 2,197,316 | ||||
| $ | 44,455,543 | |||||
| Universities - Secondary Schools - 4.2% | ||||||
| Massachusetts Development Finance Agency Rev. (Belmont Hill School), 4.375%, 2031 | $ | 2,260,000 | $ | 1,754,687 | ||
| Massachusetts Development Finance Agency Rev. (Belmont Hill School), 4.5%, 2036 | 1,000,000 | 762,910 | ||||
| Issuer | Shares/Par | Value ($) | ||||
| Universities - Secondary Schools - continued | ||||||
| Massachusetts Development Finance Agency Rev. (Dexter School), 4.75%, 2032 | $ | 1,130,000 | $ | 990,615 | ||
| Massachusetts Development Finance Agency Rev. (Dexter School), 5%, 2037 | 1,000,000 | 900,500 | ||||
| Massachusetts Development Finance Agency Rev. (Middlesex School), 5.125%, 2023 | 500,000 | 508,495 | ||||
| Massachusetts Development Finance Agency Rev. (Xaverian Brothers High School), 5.55%, 2019 | 1,000,000 | 867,330 | ||||
| Massachusetts Development Finance Agency Rev. (Xaverian Brothers High School), 5.65%, 2029 | 1,000,000 | 776,060 | ||||
| Massachusetts Industrial Finance Agency Rev. (Concord Academy), 5.5%, 2027 | 2,000,000 | 1,870,080 | ||||
| $ | 8,430,677 | |||||
| Utilities - Municipal Owned - 1.7% | ||||||
| Long Island Power Authority, Electrical Systems Rev., “C”, FSA, 5%, 2035 | $ | 1,480,000 | $ | 1,425,344 | ||
| Massachusetts Development Finance Agency Rev. (Devens Electric Systems), 5.625%, 2016 | 725,000 | 726,762 | ||||
| Puerto Rico Electric Power Authority, Power Rev., “V”, FSA, 5.25%, 2027 | 1,365,000 | 1,347,542 | ||||
| $ | 3,499,648 | |||||
| Water & Sewer Utility Revenue - 7.5% | ||||||
| King County, WA, Sewer Rev., 5%, 2038 | $ | 2,220,000 | $ | 2,179,951 | ||
| Massachusetts Water Pollution Abatement Trust, 5.25%, 2030 | 2,310,000 | 2,431,783 | ||||
| Massachusetts Water Pollution Abatement Trust, 5.25%, 2033 | 2,000,000 | 2,075,520 | ||||
| Massachusetts Water Pollution Abatement Trust Rev., Unrefunded Balance, “5”, 5.75%, 2017 | 25,000 | 25,495 | ||||
| Massachusetts Water Pollution Abatement Trust, “10”, 5%, 2029 | 160,000 | 161,403 | ||||
| Massachusetts Water Pollution Abatement Trust, “10”, 5%, 2034 | 145,000 | 144,783 | ||||
| Massachusetts Water Pollution Abatement Trust, “A”, 5%, 2032 | 75,000 | 75,041 | ||||
| Massachusetts Water Resources Authority, General Rev., “A”, FGIC, 6%, 2010 (c) | 1,000,000 | 1,077,730 | ||||
| Massachusetts Water Resources Authority, General Rev., “J”, FSA, 5%, 2023 | 500,000 | 512,740 | ||||
| New York Environmental Facilities Corp., Clean Water & Drinking Rev., “B”, 5%, 2033 | 2,120,000 | 2,056,167 | ||||
| New York, NY, Municipal Water & Sewer Finance Authority Rev., 4.75%, 2030 | 3,000,000 | 2,809,170 | ||||
| Puerto Rico Aqueduct & Sewer Authority Rev., “A”, 6%, 2038 | 2,000,000 | 1,711,940 | ||||
| $ | 15,261,723 | |||||
| Total Municipal Bonds (Identified Cost, $201,114,409) | $ | 195,690,914 | ||||
43
Table of Contents
Portfolio of Investments – continued
| Money Market Funds (v) - 2.8% | |||||
| Issuer | Shares/Par | Value ($) | |||
| MFS Institutional Money Market Portfolio, 0.23%, at Cost and Net Asset Value | 5,580,865 | $ | 5,580,865 | ||
| Total Investments (Identified Cost, $206,695,274) | $ | 201,271,779 | |||
| Other Assets, Less Liabilities - 0.5% | 999,488 | ||||
| Net Assets - 100.0% | $ | 202,271,267 | |||
Derivative Contracts at 3/31/09
Futures contracts outstanding at 3/31/09
| Description | Contracts | Value | Expiration Date | Unrealized Appreciation (Depreciation) | |||||
| U.S. Treasury Bond 30 yr (Short) | 27 | $3,501,984 | Jun-09 | $(80,884 | ) |
At March 31, 2009, the fund had sufficient cash and/or other liquid securities to cover any commitments under these derivative contracts.
Portfolio Footnotes:
| (b) | Mandatory tender date is earlier than stated maturity date. |
| (c) | Refunded bond. |
| (f) | All or a portion of the security has been segregated as collateral for open futures contracts. |
| (n) | Securities exempt from registration under Rule 144A of the Securities Act of 1933. These securities may be sold in the ordinary course of business in transactions exempt from registration, normally to qualified institutional buyers. At period end, the aggregate value of these securities was $143,654, representing 0.30% of net assets for the Florida Fund. |
| (p) | Primary inverse floater. |
| (v) | Underlying fund that is available only to investment companies managed by MFS. The rate quoted is the annualized seven-day yield of the fund at period end. |
The following abbreviations are used in this report and are defined:
| COP | Certificate of Participation | |||||
| ETM | Escrowed to Maturity | |||||
| FRN | Floating Rate Note. Interest rate resets periodically and may not be the rate reported at period end. | |||||
| LOC | Letter of Credit | |||||
| Insurers | Inverse Floaters | |||||
| ACA | ACA Financial Guaranty Corp. | LEVRRS | Leveraged Reverse Rate Security | |||
| AMBAC | AMBAC Indemnity Corp. | RIBS | Residual Interest Bonds | |||
| ASSD GTY | Assured Guaranty Insurance Co. | |||||
| BHAC | Berkshire Hathaway Assurance Corp. | |||||
| CALHF | California Health Construction Loan Insurance | |||||
| FGIC | Financial Guaranty Insurance Co. | |||||
| FHA | Federal Housing Administration | |||||
| FNMA | Federal National Mortgage Assn. | |||||
| FSA | Financial Security Assurance Inc. | |||||
| GNMA | Government National Mortgage Assn. | |||||
| MBIA | MBIA Insurance Corp. | |||||
| RADIAN | Radian Asset Assurance, Inc. | |||||
| XLCA | XL Capital Insurance Co. | |||||
See Notes to Financial Statements
44
Table of Contents
Financial Statements
STATEMENTS OF ASSETS AND LIABILITIES
At 3/31/09
These statements represent each fund’s balance sheet, which details the assets and liabilities comprising the total value of each fund.
| Alabama Fund | Arkansas Fund | California Fund | Florida Fund | |||||||||
| Assets | ||||||||||||
| Investments – | ||||||||||||
Non-affiliated issuers, at identified cost | $74,795,810 | $143,985,757 | $360,384,653 | $49,771,826 | ||||||||
Underlying funds, at cost and net asset value | 1,959,869 | 4,265,949 | 8,577,179 | 984,804 | ||||||||
| Total investments, at identified cost | $76,755,679 | $148,251,706 | $368,961,832 | $50,756,630 | ||||||||
Unrealized appreciation (depreciation) | (2,514,002 | ) | (2,362,858 | ) | (29,892,656 | ) | (3,798,739 | ) | ||||
Total investments, at value | $74,241,677 | $145,888,848 | $339,069,176 | $46,957,891 | ||||||||
Receivable for investments sold | 25,000 | 373,363 | — | 510,462 | ||||||||
Receivable for fund shares sold | 97,876 | 287,865 | 681,376 | 28,865 | ||||||||
Interest and dividends receivable | 1,083,263 | 2,009,005 | 4,962,563 | 1,067,579 | ||||||||
Other assets | 1,546 | 2,457 | 5,079 | 1,203 | ||||||||
Total assets | $75,449,362 | $148,561,538 | $344,718,194 | $48,566,000 | ||||||||
| Liabilities | ||||||||||||
Distributions payable | $110,165 | $214,708 | $650,206 | $104,944 | ||||||||
Payable for daily variation margin on open futures contracts | — | 8,250 | 42,000 | 4,500 | ||||||||
Payable for investments purchased | — | 998,061 | 3,135,002 | — | ||||||||
Payable for fund shares reacquired | 69,002 | 50,918 | 282,556 | 12,128 | ||||||||
Payable to affiliates | ||||||||||||
Management fee | 1,845 | 3,612 | 8,365 | 1,191 | ||||||||
Shareholder servicing costs | 9,483 | 13,324 | 39,103 | 7,012 | ||||||||
Distribution and service fees | 1,307 | 2,768 | 10,330 | 512 | ||||||||
Administrative services fee | 123 | 200 | 407 | 96 | ||||||||
Payable for independent trustees’ compensation | 8,199 | 7,870 | 16,854 | 8,026 | ||||||||
Accrued expenses and other liabilities | 44,806 | 50,896 | 67,677 | 45,225 | ||||||||
Total liabilities | $244,930 | $1,350,607 | $4,252,500 | $183,634 | ||||||||
Net assets | $75,204,432 | $147,210,931 | $340,465,694 | $48,382,366 | ||||||||
| Net assets consist of | ||||||||||||
Paid-in capital | $77,930,792 | $149,460,165 | $373,395,956 | $52,343,826 | ||||||||
Unrealized appreciation (depreciation) on investments | (2,514,002 | ) | (2,395,811 | ) | (30,060,415 | ) | (3,816,713 | ) | ||||
Accumulated net realized gain (loss) on investments | (259,099 | ) | 118,274 | (3,161,282 | ) | (159,577 | ) | |||||
Undistributed net investment income | 46,741 | 28,303 | 291,435 | 14,830 | ||||||||
Net assets | $75,204,432 | $147,210,931 | $340,465,694 | $48,382,366 | ||||||||
45
Table of Contents
Statements of Assets and Liabilities – continued
| Alabama Fund | Arkansas Fund | California Fund | Florida Fund | |||||
Net assets | ||||||||
Class A | $68,320,051 | $141,099,546 | $291,508,976 | $43,401,420 | ||||
Class B | 6,884,381 | 6,111,385 | 19,476,560 | 4,980,946 | ||||
Class C | — | — | 29,480,158 | — | ||||
Total net assets | $75,204,432 | $147,210,931 | $340,465,694 | $48,382,366 | ||||
Shares of beneficial interest outstanding | ||||||||
Class A | 7,113,870 | 14,965,387 | 56,657,534 | 4,868,888 | ||||
Class B | 716,899 | 647,575 | 3,784,408 | 558,665 | ||||
Class C | — | — | 5,710,201 | — | ||||
Total shares of beneficial interest outstanding | 7,830,769 | 15,612,962 | 66,152,143 | 5,427,553 | ||||
Class A shares | ||||||||
Net asset value per share | ||||||||
(net assets/shares of beneficial interest outstanding) | $9.60 | $9.43 | $5.15 | $8.91 | ||||
Offering price per share (100/95.25 × net asset value per share) | $10.08 | $9.90 | $5.41 | $9.35 | ||||
Class B shares | ||||||||
Net asset value and offering price per share | ||||||||
(net assets/shares of beneficial interest outstanding) | $9.60 | $9.44 | $5.15 | $8.92 | ||||
Class C shares | ||||||||
Net asset value and offering price per share | ||||||||
(net assets/shares of beneficial interest outstanding) | $— | $— | $5.16 | $— | ||||
On sales of $50,000 or more, the offering price of Class A shares is reduced. A contingent deferred sales charge may be imposed on redemptions of Class A, Class B, and Class C shares.
See Notes to Financial Statements
46
Table of Contents
Statements of Assets and Liabilities – continued
| At 3/31/09 | Georgia Fund | Maryland Fund | Massachusetts Fund | ||||||
| Assets | |||||||||
| Investments – | |||||||||
Non-affiliated issuers, at identified cost | $57,318,839 | $105,066,022 | $201,114,409 | ||||||
Underlying funds, at cost and net asset value | 774,568 | 194,806 | 5,580,865 | ||||||
| Total investments, at identified cost | $58,093,407 | $105,260,828 | $206,695,274 | ||||||
Unrealized appreciation (depreciation) | (1,514,837 | ) | (5,178,970 | ) | (5,423,495 | ) | |||
Total investments, at value | $56,578,570 | $100,081,858 | $201,271,779 | ||||||
Receivable for investments sold | 92,536 | 118,087 | 101,900 | ||||||
Receivable for fund shares sold | 88,138 | 18,451 | 213,247 | ||||||
Interest and dividends receivable | 924,447 | 1,611,142 | 3,006,906 | ||||||
Other assets | 1,285 | 2,015 | 3,216 | ||||||
Total assets | $57,684,976 | $101,831,553 | $204,597,048 | ||||||
| Liabilities | |||||||||
| Distributions payable | $78,736 | $152,217 | $364,364 | ||||||
| Payable for daily variation margin on open futures contracts | 4,500 | 9,000 | 20,250 | ||||||
| Payable for investments purchased | — | — | 1,727,840 | ||||||
| Payable for fund shares reacquired | 37,754 | 131,327 | 116,809 | ||||||
| Payable to affiliates | |||||||||
Management fee | 1,413 | 2,491 | 4,970 | ||||||
Shareholder servicing costs | 7,614 | 12,907 | 20,307 | ||||||
Distribution and service fees | 963 | 1,727 | 3,463 | ||||||
Administrative services fee | 104 | 151 | 259 | ||||||
Payable for independent trustees’ compensation | 9,277 | 12,235 | 12,509 | ||||||
Accrued expenses and other liabilities | 44,781 | 49,019 | 55,010 | ||||||
Total liabilities | $185,142 | $371,074 | $2,325,781 | ||||||
Net assets | $57,499,834 | $101,460,479 | $202,271,267 | ||||||
| Net assets consist of | |||||||||
Paid-in capital | $59,040,947 | $106,774,707 | $206,261,328 | ||||||
Unrealized appreciation (depreciation) on investments | (1,532,811 | ) | (5,214,919 | ) | (5,504,379 | ) | |||
Accumulated net realized gain (loss) on investments | (61,283 | ) | (217,107 | ) | 1,289,067 | ||||
Undistributed net investment income | 52,981 | 117,798 | 225,251 | ||||||
Net assets | $57,499,834 | $101,460,479 | $202,271,267 | ||||||
47
Table of Contents
Statements of Assets and Liabilities – continued
| Georgia Fund | Maryland Fund | Massachusetts Fund | ||||
Net assets | ||||||
Class A | $53,156,049 | $93,075,344 | $185,105,041 | |||
Class B | 4,343,785 | 8,385,135 | 17,166,226 | |||
Total net assets | $57,499,834 | $101,460,479 | $202,271,267 | |||
Shares of beneficial interest outstanding | ||||||
Class A | 5,322,664 | 9,173,910 | 17,878,255 | |||
Class B | 433,364 | 826,825 | 1,655,183 | |||
Total shares of beneficial interest outstanding | 5,756,028 | 10,000,735 | 19,533,438 | |||
Class A shares | ||||||
Net asset value per share | ||||||
(net assets/shares of beneficial interest outstanding) | $9.99 | $10.15 | $10.35 | |||
Offering price per share (100/95.25 × net asset value per share) | $10.49 | $10.66 | $10.87 | |||
Class B shares | ||||||
Net asset value and offering price per share | ||||||
(net assets/shares of beneficial interest outstanding) | $10.02 | $10.14 | $10.37 | |||
On sales of $50,000 or more, the offering price of Class A shares is reduced. A contingent deferred sales charge may be imposed on redemptions of Class A and Class B shares.
See Notes to Financial Statements
48
Table of Contents
Financial Statements
Year ended 3/31/09
These statements describe how much each fund earned in investment income and accrued in expenses. They also describe any gains or losses generated by each fund’s operations.
| Alabama Fund | Arkansas Fund | California Fund | Florida Fund | |||||||||
| Net investment income | ||||||||||||
| Interest | $3,963,764 | $7,441,693 | $20,814,107 | $2,961,996 | ||||||||
Dividends from underlying funds | 2,005 | 2,618 | 5,257 | 332 | ||||||||
Total investment income | $3,965,769 | $7,444,311 | $20,819,364 | $2,962,328 | ||||||||
| Expenses | ||||||||||||
Management fee | $370,135 | $702,466 | $1,782,808 | $264,775 | ||||||||
Distribution and service fees | 248,647 | 193,853 | 815,568 | 46,046 | ||||||||
Shareholder servicing costs | 46,876 | 83,093 | 225,048 | 37,952 | ||||||||
Administrative services fee | 21,769 | 33,250 | 69,177 | 18,146 | ||||||||
Independent trustees’ compensation | 4,214 | 6,705 | 13,745 | 4,070 | ||||||||
Custodian fee | 21,631 | 30,555 | 62,824 | 20,050 | ||||||||
Shareholder communications | 5,036 | 9,573 | 19,433 | 4,561 | ||||||||
Auditing fees | 41,977 | 41,977 | 41,977 | 41,977 | ||||||||
Legal fees | 2,421 | 5,057 | 29,588 | 4,380 | ||||||||
Registration fees | — | — | — | 27,592 | ||||||||
Interest expense and fees | 24,550 | 94,159 | 260,027 | — | ||||||||
Miscellaneous | 42,252 | 56,700 | 95,808 | 13,960 | ||||||||
Total expenses | $829,508 | $1,257,388 | $3,416,003 | $483,509 | ||||||||
Fees paid indirectly | (8,667 | ) | (15,160 | ) | (32,726 | ) | (5,189 | ) | ||||
Reduction of expenses by investment adviser | (132,123 | ) | (249,043 | ) | (641,400 | ) | (95,172 | ) | ||||
Net expenses | $688,718 | $993,185 | $2,741,877 | $383,148 | ||||||||
Net investment income | $3,277,051 | $6,451,126 | $18,077,487 | $2,579,180 | ||||||||
| Realized and unrealized gain (loss) on investments | ||||||||||||
| Realized gain (loss) (identified cost basis) | ||||||||||||
Investment transactions | $(239,489 | ) | $763,399 | $1,525,355 | $72,217 | |||||||
Futures contracts | 29,002 | (263,613 | ) | (663,384 | ) | (75,584 | ) | |||||
Swap transactions | 58,690 | 46,234 | — | 21,695 | ||||||||
Net realized gain (loss) on investments | $(151,797 | ) | $546,020 | $861,971 | $18,328 | |||||||
| Change in unrealized appreciation (depreciation) | ||||||||||||
Investments | $(3,758,782 | ) | $(4,986,610 | ) | $(30,731,406 | ) | $(4,351,917 | ) | ||||
Futures contracts | — | (47,454 | ) | (208,039 | ) | (22,807 | ) | |||||
Swap transactions | (27,659 | ) | (51,308 | ) | — | (25,654 | ) | |||||
Net unrealized gain (loss) on investments | $(3,786,441 | ) | $(5,085,372 | ) | $(30,939,445 | ) | $(4,400,378 | ) | ||||
Net realized and unrealized gain (loss) on investments | $(3,938,238 | ) | $(4,539,352 | ) | $(30,077,474 | ) | $(4,382,050 | ) | ||||
Change in net assets from operations | $(661,187 | ) | $1,911,774 | $(11,999,987 | ) | $(1,802,870 | ) | |||||
See Notes to Financial Statements
49
Table of Contents
Statements of Operations – continued
| Year ended 3/31/09 | Georgia Fund | Maryland Fund | Massachusetts Fund | ||||||
| Net investment income | |||||||||
| Interest | $3,097,643 | $6,099,698 | $11,397,522 | ||||||
Dividends from underlying funds | 492 | 665 | 2,060 | ||||||
Total investment income | $3,098,135 | $6,100,363 | $11,399,582 | ||||||
| Expenses | |||||||||
Management fee | $276,003 | $528,123 | $995,393 | ||||||
Distribution and service fees | 187,610 | 440,700 | 834,676 | ||||||
Shareholder servicing costs | 38,418 | 91,430 | 145,218 | ||||||
Administrative services fee | 18,655 | 27,082 | 43,074 | ||||||
Independent trustees’ compensation | 4,026 | 6,865 | 12,568 | ||||||
Custodian fee | 20,038 | 28,874 | 40,683 | ||||||
Shareholder communications | 5,217 | 8,965 | 12,370 | ||||||
Auditing fees | 41,976 | 41,977 | 41,977 | ||||||
Legal fees | 10,830 | 7,786 | 5,654 | ||||||
Interest expense and fees | 7,988 | 48,071 | 86,748 | ||||||
Miscellaneous | 38,497 | 50,076 | 61,217 | ||||||
Total expenses | $649,258 | $1,279,949 | $2,279,578 | ||||||
Fees paid indirectly | (7,433 | ) | (9,911 | ) | (17,829 | ) | |||
Reduction of expenses by investment adviser | (97,838 | ) | (189,453 | ) | (354,836 | ) | |||
Net expenses | $543,987 | $1,080,585 | $1,906,913 | ||||||
Net investment income | $2,554,148 | $5,019,778 | $9,492,669 | ||||||
| Realized and unrealized gain (loss) on investments | |||||||||
| Realized gain (loss) (identified cost basis) | |||||||||
Investment transactions | $(133,367 | ) | $99,312 | $3,563,200 | |||||
Futures contracts | (109,401 | ) | (162,883 | ) | (287,528 | ) | |||
Swap transactions | 55,571 | 8,750 | 120,588 | ||||||
Net realized gain (loss) on investments | $(187,197 | ) | $(54,821 | ) | $3,396,260 | ||||
| Change in unrealized appreciation (depreciation) | |||||||||
Investments | $(2,556,155 | ) | $(7,186,260 | ) | $(13,828,835 | ) | |||
Futures contracts | (17,974 | ) | (47,227 | ) | (101,829 | ) | |||
Swap transactions | (25,654 | ) | (3,514 | ) | (51,308 | ) | |||
Net unrealized gain (loss) on investments | $(2,599,783 | ) | $(7,237,001 | ) | $(13,981,972 | ) | |||
Net realized and unrealized gain (loss) on investments | $(2,786,980 | ) | $(7,291,822 | ) | $(10,585,712 | ) | |||
Change in net assets from operations | $(232,832 | ) | $(2,272,044 | ) | $(1,093,043 | ) | |||
See Notes to Financial Statements
50
Table of Contents
Financial Statements
STATEMENTS OF CHANGES IN NET ASSETS
These statements describe the increases and/or decreases in net assets resulting from operations, any distributions, and any shareholder transactions.
| Year ended 3/31/09 | Alabama Fund | Arkansas Fund | California Fund | Florida Fund | ||||||||
| Change in net assets | ||||||||||||
| From operations | ||||||||||||
| Net investment income | $3,277,051 | $6,451,126 | $18,077,487 | $2,579,180 | ||||||||
Net realized gain (loss) on investments | (151,797 | ) | 546,020 | 861,971 | 18,328 | |||||||
Net unrealized gain (loss) on investments | (3,786,441 | ) | (5,085,372 | ) | (30,939,445 | ) | (4,400,378 | ) | ||||
Change in net assets from operations | $(661,187 | ) | $1,911,774 | $(11,999,987 | ) | $(1,802,870 | ) | |||||
| Distributions declared to shareholders | ||||||||||||
| From net investment income | ||||||||||||
Class A | $(3,084,759 | ) | $(6,263,853 | ) | $(15,431,046 | ) | $(2,323,816 | ) | ||||
Class B | (289,762 | ) | (241,788 | ) | (1,064,540 | ) | (240,000 | ) | ||||
Class C | — | — | (1,151,890 | ) | — | |||||||
From net realized gain on investments | ||||||||||||
Class A | (437,088 | ) | (1,228,299 | ) | — | (80,823 | ) | |||||
Class B | (48,867 | ) | (54,697 | ) | — | (9,728 | ) | |||||
Total distributions declared to shareholders | $(3,860,476 | ) | $(7,788,637 | ) | $(17,647,476 | ) | $(2,654,367 | ) | ||||
Change in net assets from fund share transactions | $(144,553 | ) | $7,422,543 | $(28,087,589 | ) | $(6,161,845 | ) | |||||
Total change in net assets | $(4,666,216 | ) | $1,545,680 | $(57,735,052 | ) | $(10,619,082 | ) | |||||
| Net assets | ||||||||||||
| At beginning of period | 79,870,648 | 145,665,251 | 398,200,746 | 59,001,448 | ||||||||
At end of period | $75,204,432 | $147,210,931 | $340,465,694 | $48,382,366 | ||||||||
Undistributed net investment income included in net assets at end of period | $46,741 | $28,303 | $291,435 | $14,830 | ||||||||
| Year ended 3/31/09 | Georgia Fund | Maryland Fund | Massachusetts Fund | |||||||||
| Change in net assets | ||||||||||||
| From operations | ||||||||||||
| Net investment income | $2,554,148 | $5,019,778 | $9,492,669 | |||||||||
Net realized gain (loss) on investments | (187,197 | ) | (54,821 | ) | 3,396,260 | |||||||
Net unrealized gain (loss) on investments | (2,599,783 | ) | (7,237,001 | ) | (13,981,972 | ) | ||||||
Change in net assets from operations | $(232,832 | ) | $(2,272,044 | ) | $(1,093,043 | ) | ||||||
| Distributions declared to shareholders | ||||||||||||
| From net investment income | ||||||||||||
Class A | $(2,191,037 | ) | $(4,459,411 | ) | $(8,464,596 | ) | ||||||
Class B | (210,838 | ) | (403,205 | ) | (798,039 | ) | ||||||
From net realized gain on investments | ||||||||||||
Class A | (1,014,196 | ) | (338,022 | ) | (830,826 | ) | ||||||
Class B | (113,391 | ) | (33,688 | ) | (83,061 | ) | ||||||
Total distributions declared to shareholders | $(3,529,462 | ) | $(5,234,326 | ) | $(10,176,522 | ) | ||||||
Change in net assets from fund share transactions | $5,005,067 | $(7,080,089 | ) | $(616,371 | ) | |||||||
Total change in net assets | $1,242,773 | $(14,586,459 | ) | $(11,885,936 | ) | |||||||
| Net assets | ||||||||||||
| At beginning of period | 56,257,061 | 116,046,938 | 214,157,203 | |||||||||
At end of period | $57,499,834 | $101,460,479 | $202,271,267 | |||||||||
Undistributed net investment income included in net assets at end of period | $52,981 | $117,798 | $225,251 | |||||||||
See Notes to Financial Statements
51
Table of Contents
Statements of Changes in Net Assets – continued
| Year ended 3/31/08 | Alabama Fund | Arkansas Fund | California Fund | Florida Fund | ||||||||
| Change in net assets | ||||||||||||
| From operations | ||||||||||||
| Net investment income | $3,762,808 | $6,211,310 | $18,339,848 | $3,005,614 | ||||||||
| Net realized gain (loss) on investments | 186,620 | 577,112 | (2,902,478 | ) | 15,967 | |||||||
Net unrealized gain (loss) on investments | (2,415,611 | ) | (4,047,204 | ) | (20,544,942 | ) | (3,050,041 | ) | ||||
Change in net assets from operations | $1,533,817 | $2,741,218 | $(5,107,572 | ) | $(28,460 | ) | ||||||
| Distributions declared to shareholders | ||||||||||||
| From net investment income | ||||||||||||
Class A | $(3,273,616 | ) | $(6,021,909 | ) | $(16,121,843 | ) | $(2,591,006 | ) | ||||
Class B | (348,527 | ) | (290,388 | ) | (1,452,869 | ) | (334,886 | ) | ||||
Class C | — | — | (1,056,821 | ) | — | |||||||
| From net realized gain on investments | ||||||||||||
Class A | (167,292 | ) | (240,997 | ) | — | — | ||||||
Class B | (20,782 | ) | (13,273 | ) | — | — | ||||||
Total distributions declared to shareholders | $(3,810,217 | ) | $(6,566,567 | ) | $(18,631,533 | ) | $(2,925,892 | ) | ||||
Change in net assets from fund share transactions | $(1,834,102 | ) | $13,021,156 | $(22,540,529 | ) | $(12,540,514 | ) | |||||
Total change in net assets | $(4,110,502 | ) | $9,195,807 | $(46,279,634 | ) | $(15,494,866 | ) | |||||
| Net assets | ||||||||||||
| At beginning of period | 83,981,150 | 136,469,444 | 444,480,380 | 74,496,314 | ||||||||
At end of period | $79,870,648 | $145,665,251 | $398,200,746 | $59,001,448 | ||||||||
Accumulated undistributed (distributions in excess of) net investment income included in net assets at end of period | $22,635 | $(28,735 | ) | $229,924 | $(52,428 | ) | ||||||
| Year ended 3/31/08 | Georgia Fund | Maryland Fund | Massachusetts Fund | |||||||||
| Change in net assets | ||||||||||||
| From operations | ||||||||||||
| Net investment income | $2,393,119 | $5,519,066 | $8,468,104 | |||||||||
| Net realized gain (loss) on investments | 1,303,788 | (260,289 | ) | 369,110 | ||||||||
Net unrealized gain (loss) on investments | (2,382,310 | ) | (5,058,458 | ) | (5,354,463 | ) | ||||||
Change in net assets from operations | $1,314,597 | $200,319 | $3,482,751 | |||||||||
| From net investment income | ||||||||||||
Class A | $(2,066,945 | ) | $(4,710,452 | ) | $(8,055,746 | ) | ||||||
Class B | (259,309 | ) | (506,249 | ) | (1,001,038 | ) | ||||||
| From net realized gain on investments | ||||||||||||
Class A | — | (188,563 | ) | (884,860 | ) | |||||||
Class B | — | (23,166 | ) | (124,524 | ) | |||||||
Total distributions declared to shareholders | $(2,326,254 | ) | $(5,428,430 | ) | $(10,066,168 | ) | ||||||
Change in net assets from fund share transactions | $(1,920,966 | ) | $(12,838,056 | ) | $276,909 | |||||||
Total change in net assets | $(2,932,623 | ) | $(18,066,167 | ) | $(6,306,508 | ) | ||||||
| Net assets | ||||||||||||
| At beginning of period | 59,189,684 | 134,113,105 | 220,463,711 | |||||||||
At end of period | $56,257,061 | $116,046,938 | $214,157,203 | |||||||||
Accumulated undistributed (distributions in excess of) net investment income included in net assets at end of period | $(61,863 | ) | $59,061 | $81,859 | ||||||||
See Notes to Financial Statements
52
Table of Contents
Financial Statements
MFS® ALABAMA MUNICIPAL BOND FUND
The financial highlights table is intended to help you understand the fund financial performance for the past 5 years. Certain information reflects financial results for a single fund share. The total returns in the table represent the rate by which an investor would have earned (or lost) on an investment in the fund share class (assuming reinvestment of all distributions) held for the entire period.
| Years ended 3/31 | |||||||||||||||
| Class A | 2009 | 2008 | 2007 | 2006 | 2005 | ||||||||||
Net asset value, beginning of period | $10.17 | $10.45 | $10.47 | $10.62 | $10.88 | ||||||||||
| Income (loss) from investment operations | |||||||||||||||
| Net investment income (d) | $0.43 | $0.48 | $0.49 | (z) | $0.46 | $0.48 | |||||||||
Net realized and unrealized gain (loss) on investments | (0.50 | ) | (0.28 | ) | (0.01 | )(z) | (0.15 | ) | (0.22 | ) | |||||
Total from investment operations | $(0.07 | ) | $0.20 | $0.48 | $0.31 | $0.26 | |||||||||
| Less distributions declared to shareholders | |||||||||||||||
| From net investment income | $(0.44 | ) | $(0.46 | ) | $(0.45 | ) | $(0.46 | ) | $(0.48 | ) | |||||
From net realized gain on investments | (0.06 | ) | (0.02 | ) | (0.05 | ) | — | (0.04 | ) | ||||||
Total distributions declared to shareholders | $(0.50 | ) | $(0.48 | ) | $(0.50 | ) | $(0.46 | ) | $(0.52 | ) | |||||
Net asset value, end of period | $9.60 | $10.17 | $10.45 | $10.47 | $10.62 | ||||||||||
Total return (%) (r)(s)(t) | (0.59 | ) | 2.03 | 4.66 | 2.97 | 2.40 | |||||||||
| Ratios (%) (to average net assets) and Supplemental data: | |||||||||||||||
| Expenses before expense reductions (f) | 1.01 | 1.34 | 1.40 | 1.33 | 1.21 | ||||||||||
Expenses after expense reductions (f) | 0.84 | 1.09 | 1.15 | 1.08 | 0.96 | ||||||||||
Expenses after expense reductions and excluding interest expense and fees (f)(l) | 0.80 | 0.82 | 0.86 | 0.87 | 0.84 | ||||||||||
Net investment income | 4.36 | 4.67 | 4.70 | (z) | 4.37 | 4.46 | |||||||||
Portfolio turnover | 35 | 17 | 9 | 9 | 17 | ||||||||||
Net assets at end of period (000 Omitted) | $68,320 | $71,315 | $73,560 | $74,204 | $77,499 | ||||||||||
See Notes to Financial Statements
53
Table of Contents
Financial Highlights – continued
MFS® ALABAMA MUNICIPAL BOND FUND – continued
| Years ended 3/31 | |||||||||||||||
| Class B | 2009 | 2008 | 2007 | 2006 | 2005 | ||||||||||
Net asset value, beginning of period | $10.17 | $10.45 | $10.47 | $10.62 | $10.88 | ||||||||||
| Income (loss) from investment operations | |||||||||||||||
| Net investment income (d) | $0.36 | $0.40 | $0.41 | (z) | $0.38 | $0.40 | |||||||||
Net realized and unrealized gain (loss) on investments | (0.50 | ) | (0.27 | ) | (0.01 | )(z) | (0.15 | ) | (0.23 | ) | |||||
Total from investment operations | $(0.14 | ) | $0.13 | $0.40 | $0.23 | $0.17 | |||||||||
| Less distributions declared to shareholders | |||||||||||||||
| From net investment income | $(0.37 | ) | $(0.39 | ) | $(0.37 | ) | $(0.38 | ) | $(0.39 | ) | |||||
From net realized gain on investments | (0.06 | ) | (0.02 | ) | (0.05 | ) | — | (0.04 | ) | ||||||
Total distributions declared to shareholders | $(0.43 | ) | $(0.41 | ) | $(0.42 | ) | $(0.38 | ) | $(0.43 | ) | |||||
Net asset value, end of period | $9.60 | $10.17 | $10.45 | $10.47 | $10.62 | ||||||||||
Total return (%) (r)(s)(t) | (1.34 | ) | 1.27 | 3.88 | 2.20 | 1.63 | |||||||||
| Ratios (%) (to average net assets) and Supplemental data: | |||||||||||||||
| Expenses before expense reductions (f) | 1.76 | 2.09 | 2.15 | 2.08 | 1.96 | ||||||||||
Expenses after expense reductions (f) | 1.58 | 1.84 | 1.90 | 1.83 | 1.71 | ||||||||||
Expenses after expense reductions and excluding interest expense and fees (f)(l) | 1.55 | 1.57 | 1.61 | 1.62 | 1.59 | ||||||||||
Net investment income | 3.62 | 3.92 | 3.93 | (z) | 3.61 | 3.71 | |||||||||
Portfolio turnover | 35 | 17 | 9 | 9 | 17 | ||||||||||
Net assets at end of period (000 Omitted) | $6,884 | $8,555 | $10,421 | $13,443 | $15,118 | ||||||||||
| (d) | Per share data is based on average shares outstanding. |
| (f) | Ratios do not reflect reductions from fees paid indirectly, if applicable. |
| (l) | Interest expense and fees relate to payments made to the holder of the floating rate certificate from trust assets. |
| (r) | Certain expenses have been reduced without which performance would have been lower. |
| (s) | From time to time the fund may receive proceeds from litigation settlements, without which performance would be lower. |
| (t) | Total returns do not include any applicable sales charges. |
| (z) | The fund applied a change in estimate for amortization of premium on certain debt securities that resulted in an increase of $0.02 per share to net investment income, a decrease of $0.02 per share to net realized and unrealized gain (loss) on investments, and an increase of 0.21% to the net investment income ratio for each class for the year ended March 31, 2007. The change in estimate had no impact on net assets, net asset value per share or total return of each class. |
See Notes to Financial Statements
54
Table of Contents
Financial Highlights – continued
MFS® ARKANSAS MUNICIPAL BOND FUND
The financial highlights table is intended to help you understand the fund financial performance for the past 5 years. Certain information reflects financial results for a single fund share. The total returns in the table represent the rate by which an investor would have earned (or lost) on an investment in the fund share class (assuming reinvestment of all distributions) held for the entire period.
| Years ended 3/31 | |||||||||||||||
| Class A | 2009 | 2008 | 2007 | 2006 | 2005 | ||||||||||
Net asset value, beginning of period | $9.80 | $10.08 | $10.04 | $10.17 | $10.41 | ||||||||||
| Income (loss) from investment operations | |||||||||||||||
| Net investment income (d) | $0.43 | $0.46 | $0.50 | (z) | $0.45 | $0.45 | |||||||||
Net realized and unrealized gain (loss) on investments | (0.29 | ) | (0.25 | ) | (0.01 | )(z) | (0.13 | ) | (0.23 | ) | |||||
Total from investment operations | $0.14 | $0.21 | $0.49 | $0.32 | $0.22 | ||||||||||
| Less distributions declared to shareholders | |||||||||||||||
| From net investment income | $(0.43 | ) | $(0.47 | ) | $(0.45 | ) | $(0.45 | ) | $(0.46 | ) | |||||
From net realized gain on investments | (0.08 | ) | (0.02 | ) | — | — | — | ||||||||
Total distributions declared to shareholders | $(0.51 | ) | $(0.49 | ) | $(0.45 | ) | $(0.45 | ) | $(0.46 | ) | |||||
Net asset value, end of period | $9.43 | $9.80 | $10.08 | $10.04 | $10.17 | ||||||||||
Total return (%) (r)(s)(t) | 1.61 | 2.07 | 5.02 | 3.17 | 2.14 | ||||||||||
| Ratios (%) (to average net assets) and Supplemental data: | |||||||||||||||
| Expenses before expense reductions (f) | 0.83 | 1.06 | 1.14 | 1.10 | 1.00 | ||||||||||
Expenses after expense reductions (f) | 0.66 | 0.81 | 0.89 | 0.85 | 0.75 | ||||||||||
Expenses after expense reductions and excluding interest expense and fees (f)(l) | 0.60 | 0.60 | 0.66 | 0.67 | 0.65 | ||||||||||
Net investment income | 4.48 | 4.60 | 4.98 | (z) | 4.45 | 4.47 | |||||||||
Portfolio turnover | 23 | 9 | 10 | 10 | 13 | ||||||||||
Net assets at end of period (000 Omitted) | $141,100 | $138,938 | $127,477 | $122,067 | $127,075 | ||||||||||
See Notes to Financial Statements
55
Table of Contents
Financial Highlights – continued
MFS® ARKANSAS MUNICIPAL BOND FUND – continued
| Years ended 3/31 | |||||||||||||||
| Class B | 2009 | 2008 | 2007 | 2006 | 2005 | ||||||||||
Net asset value, beginning of period | $9.81 | $10.09 | $10.05 | $10.18 | $10.42 | ||||||||||
| Income (loss) from investment operations | |||||||||||||||
| Net investment income (d) | $0.35 | $0.38 | $0.43 | (z) | $0.38 | $0.38 | |||||||||
Net realized and unrealized gain (loss) on investments | (0.28 | ) | (0.25 | ) | (0.01 | )(z) | (0.14 | ) | (0.24 | ) | |||||
Total from investment operations | $0.07 | $0.13 | $0.42 | $0.24 | $0.14 | ||||||||||
| Less distributions declared to shareholders | |||||||||||||||
| From net investment income | $(0.36 | ) | $(0.39 | ) | $(0.38 | ) | $(0.37 | ) | $(0.38 | ) | |||||
From net realized gain on investments | (0.08 | ) | (0.02 | ) | — | — | — | ||||||||
Total distributions declared to shareholders | $(0.44 | ) | $(0.41 | ) | $(0.38 | ) | $(0.37 | ) | $(0.38 | ) | |||||
Net asset value, end of period | $9.44 | $9.81 | $10.09 | $10.05 | $10.18 | ||||||||||
Total return (%) (r)(s)(t) | 0.85 | 1.30 | 4.21 | 2.39 | 1.37 | ||||||||||
| Ratios (%) (to average net assets) and Supplemental data: | |||||||||||||||
| Expenses before expense reductions (f) | 1.59 | 1.81 | 1.91 | 1.87 | 1.76 | ||||||||||
Expenses after expense reductions (f) | 1.42 | 1.56 | 1.66 | 1.62 | 1.51 | ||||||||||
Expenses after expense reductions and excluding interest expense and fees (f)(l) | 1.35 | 1.36 | 1.43 | 1.44 | 1.41 | ||||||||||
Net investment income | 3.71 | 3.86 | 4.21 | (z) | 3.68 | 3.71 | |||||||||
Portfolio turnover | 23 | 9 | 10 | 10 | 13 | ||||||||||
Net assets at end of period (000 Omitted) | $6,111 | $6,727 | $8,992 | $10,648 | $11,259 | ||||||||||
Any redemption fees charged by the fund during the 2005 fiscal year resulted in a par share impact of less than 0.01%.
| (d) | Per share data is based on average shares outstanding. |
| (f) | Ratios do not reflect reductions from fees paid indirectly, if applicable. |
| (l) | Interest expense and fees relate to payments made to the holder of the floating rate certificate from trust assets. |
| (r) | Certain expenses have been reduced without which performance would have been lower. |
| (s) | From time to time the fund may receive proceeds from litigation settlements, without which performance would be lower. |
| (t) | Total returns do not include any applicable sales charges. |
| (z) | The fund applied a change in estimate for amortization of premium on certain debt securities that resulted in an increase of $0.03 per share to net investment income, a decrease of $0.03 per share to net realized and unrealized gain (loss) on investments, and an increase of 0.30% to the net investment income ratio for each class for the year ended March 31, 2007. The change in estimate had no impact on net assets, net asset value per share or total return of each class. |
See Notes to Financial Statements
56
Table of Contents
Financial Highlights – continued
MFS® CALIFORNIA MUNICIPAL BOND FUND
The financial highlights table is intended to help you understand the fund financial performance for the past 5 years. Certain information reflects financial results for a single fund share. The total returns in the table represent the rate by which an investor would have earned (or lost) on an investment in the fund share class (assuming reinvestment of all distributions) held for the entire period.
| Years ended 3/31 | |||||||||||||||
| Class A | 2009 | 2008 | 2007 | 2006 | 2005 | ||||||||||
Net asset value, beginning of period | $5.56 | $5.88 | $5.84 | $5.88 | $5.98 | ||||||||||
| Income (loss) from investment operations | |||||||||||||||
| Net investment income (d) | $0.27 | $0.26 | $0.27 | (z) | $0.28 | $0.29 | |||||||||
Net realized and unrealized gain (loss) on investments | (0.42 | ) | (0.32 | ) | 0.03 | (z) | (0.03 | ) | (0.11 | ) | |||||
Total from investment operations | $(0.15 | ) | $(0.06 | ) | $0.30 | $0.25 | $0.18 | ||||||||
| Less distributions declared to shareholders | |||||||||||||||
| From net investment income | $(0.26 | ) | $(0.26 | ) | $(0.26 | ) | $(0.28 | ) | $(0.28 | ) | |||||
From net realized gain on investments | — | — | — | (0.01 | ) | — | |||||||||
Total distributions declared to shareholders | $(0.26 | ) | $(0.26 | ) | $(0.26 | ) | $(0.29 | ) | $(0.28 | ) | |||||
Net asset value, end of period | $5.15 | $5.56 | $5.88 | $5.84 | $5.88 | ||||||||||
Total return (%) (r)(s)(t) | (2.66 | ) | (1.05 | ) | 5.30 | 4.22 | 3.14 | ||||||||
| Ratios (%) (to average net assets) and Supplemental data: | |||||||||||||||
| Expenses before expense reductions (f) | 0.81 | 0.99 | 1.11 | 1.09 | 0.97 | ||||||||||
Expenses after expense reductions (f) | 0.63 | 0.74 | 0.86 | 0.84 | 0.72 | ||||||||||
Expenses after expense reductions and excluding interest expense and fees (f)(l) | 0.56 | 0.55 | 0.60 | 0.63 | 0.61 | ||||||||||
Net investment income | 5.05 | 4.46 | 4.66 | (z) | 4.69 | 4.91 | |||||||||
Portfolio turnover | 27 | 30 | 16 | 9 | 12 | ||||||||||
Net assets at end of period (000 Omitted) | $291,509 | $339,099 | $366,861 | $291,656 | $295,332 | ||||||||||
| Years ended 3/31 | |||||||||||||||
| Class B | 2009 | 2008 | 2007 | 2006 | 2005 | ||||||||||
Net asset value, beginning of period | $5.56 | $5.88 | $5.84 | $5.88 | $5.98 | ||||||||||
| Income (loss) from investment operations | |||||||||||||||
| Net investment income (d) | $0.23 | $0.21 | $0.23 | (z) | $0.23 | $0.25 | |||||||||
Net realized and unrealized gain (loss) on investments | (0.42 | ) | (0.31 | ) | 0.03 | (z) | (0.03 | ) | (0.11 | ) | |||||
Total from investment operations | $(0.19 | ) | $(0.10 | ) | $0.26 | $0.20 | $0.14 | ||||||||
| Less distributions declared to shareholders | |||||||||||||||
| From net investment income | $(0.22 | ) | $(0.22 | ) | $(0.22 | ) | $(0.23 | ) | $(0.24 | ) | |||||
From net realized gain on investments | — | — | — | (0.01 | ) | — | |||||||||
Total distributions declared to shareholders | $(0.22 | ) | $(0.22 | ) | $(0.22 | ) | $(0.24 | ) | $(0.24 | ) | |||||
Net asset value, end of period | $5.15 | $5.56 | $5.88 | $5.84 | $5.88 | ||||||||||
Total return (%) (r)(s)(t) | (3.39 | ) | (1.80 | ) | 4.51 | 3.44 | 2.38 | ||||||||
| Ratios (%) (to average net assets) and Supplemental data: | |||||||||||||||
| Expenses before expense reductions (f) | 1.57 | 1.75 | 1.88 | 1.85 | 1.70 | ||||||||||
Expenses after expense reductions (f) | 1.39 | 1.50 | 1.62 | 1.60 | 1.45 | ||||||||||
Expenses after expense reductions and excluding interest expense and fees (f)(l) | 1.32 | 1.31 | 1.37 | 1.39 | 1.34 | ||||||||||
Net investment income | 4.29 | 3.70 | 3.91 | (z) | 3.94 | 4.17 | |||||||||
Portfolio turnover | 27 | 30 | 16 | 9 | 12 | ||||||||||
Net assets at end of period (000 Omitted) | $19,477 | $31,239 | $47,127 | $58,338 | $69,142 | ||||||||||
See Notes to Financial Statements
57
Table of Contents
Financial Highlights – continued
MFS® CALIFORNIA MUNICIPAL BOND FUND – continued
| Years ended 3/31 | |||||||||||||||
| Class C | 2009 | 2008 | 2007 | 2006 | 2005 | ||||||||||
Net asset value, beginning of period | $5.58 | $5.90 | $5.86 | $5.90 | $6.00 | ||||||||||
| Income (loss) from investment operations | |||||||||||||||
| Net investment income (d) | $0.22 | $0.20 | $0.22 | (z) | $0.23 | $0.24 | |||||||||
Net realized and unrealized gain (loss) on investments | (0.42 | ) | (0.31 | ) | 0.03 | (z) | (0.04 | ) | (0.11 | ) | |||||
Total from investment operations | $(0.20 | ) | $(0.11 | ) | $0.25 | $0.19 | $0.13 | ||||||||
| Less distributions declared to shareholders | |||||||||||||||
| From net investment income | $(0.22 | ) | $(0.21 | ) | $(0.21 | ) | $(0.22 | ) | $(0.23 | ) | |||||
From net realized gain on investments | — | — | — | (0.01 | ) | — | |||||||||
Total distributions declared to shareholders | $(0.22 | ) | $(0.21 | ) | $(0.21 | ) | $(0.23 | ) | $(0.23 | ) | |||||
Net asset value, end of period | $5.16 | $5.58 | $5.90 | $5.86 | $5.90 | ||||||||||
Total return (%) (r)(s)(t) | (3.70 | ) | (1.93 | ) | 4.36 | 3.29 | 2.22 | ||||||||
| Ratios (%) (to average net assets) and Supplemental data: | |||||||||||||||
| Expenses before expense reductions (f) | 1.70 | 1.89 | 2.01 | 1.99 | 1.87 | ||||||||||
Expenses after expense reductions (f) | 1.53 | 1.64 | 1.76 | 1.74 | 1.62 | ||||||||||
Expenses after expense reductions and excluding interest expense and fees (f)(l) | 1.46 | 1.45 | 1.50 | 1.53 | 1.51 | ||||||||||
Net investment income | 4.14 | 3.55 | 3.77 | (z) | 3.79 | 4.01 | |||||||||
Portfolio turnover | 27 | 30 | 16 | 9 | 12 | ||||||||||
Net assets at end of period (000 Omitted) | $29,480 | $27,862 | $30,492 | $29,880 | $33,162 | ||||||||||
Any redemption fees charged by the fund during the 2005 fiscal year resulted in a per share impact of less than $0.01.
| (d) | Per share data is based on average shares outstanding. |
| (f) | Ratios do not reflect reductions from fees paid indirectly, if applicable. |
| (l) | Interest expense and fees relate to payments made to the holder of the floating rate certificate from trust assets. |
| (r) | Certain expenses have been reduced without which performance would have been lower. |
| (s) | From time to time the fund may receive proceeds from litigation settlements, without which performance would be lower. |
| (t) | Total returns do not include any applicable sales charges. |
| (z) | The fund applied a change in estimate for amortization of premium on certain debt securities in the current year that resulted in an increase of less than $0.01 per share to net investment income, a decrease of less than $0.01 per share to net realized and unrealized gain (loss) on investments, and an increase of 0.06% to the net investment income ratio for each class for the six months ended March 31, 2007. The change in estimate had no impact on net assets, net asset value per share or total return of each class. |
See Notes to Financial Statements
58
Table of Contents
Financial Highlights – continued
MFS® FLORIDA MUNICIPAL BOND FUND
The financial highlights table is intended to help you understand the fund financial performance for the past 5 years. Certain information reflects financial results for a single fund share. The total returns in the table represent the rate by which an investor would have earned (or lost) on an investment in the fund share class (assuming reinvestment of all distributions) held for the entire period.
| Years ended 3/31 | |||||||||||||||
| Class A | 2009 | 2008 | 2007 | 2006 | 2005 | ||||||||||
Net asset value, beginning of period | $9.64 | $10.09 | $10.05 | $10.09 | $10.24 | ||||||||||
| Income (loss) from investment operations | |||||||||||||||
| Net investment income (d) | $0.44 | $0.46 | $0.46 | (z) | $0.45 | $0.47 | |||||||||
Net realized and unrealized gain (loss) on investments | (0.71 | ) | (0.47 | ) | 0.02 | (z) | (0.04 | ) | (0.15 | ) | |||||
Total from investment operations | $(0.27 | ) | $(0.01 | ) | $0.48 | $0.41 | $0.32 | ||||||||
| Less distributions declared to shareholders | |||||||||||||||
| From net investment income | $(0.44 | ) | $(0.44 | ) | $(0.44 | ) | $(0.45 | ) | $(0.47 | ) | |||||
From net realized gain on investments | (0.02 | ) | — | — | — | — | |||||||||
Total distributions declared to shareholders | $(0.46 | ) | $(0.44 | ) | $(0.44 | ) | $(0.45 | ) | $(0.47 | ) | |||||
Net asset value, end of period | $8.91 | $9.64 | $10.09 | $10.05 | $10.09 | ||||||||||
Total return (%) (r)(s)(t) | (2.84 | ) | (0.08 | ) | 4.92 | 4.14 | 3.25 | ||||||||
| Ratios (%) (to average net assets) and Supplemental data: | |||||||||||||||
| Expenses before expense reductions (f) | 0.80 | 1.16 | 1.19 | 1.11 | 0.94 | ||||||||||
Expenses after expense reductions (f) | 0.63 | 0.91 | 0.94 | 0.86 | 0.69 | ||||||||||
Expenses after expense reductions and excluding interest expense and fees (f)(l) | N/A | 0.61 | 0.64 | 0.64 | 0.57 | ||||||||||
Net investment income | 4.82 | 4.60 | 4.53 | (z) | 4.46 | 4.68 | |||||||||
Portfolio turnover | 34 | 7 | 9 | 17 | 18 | ||||||||||
Net assets at end of period (000 Omitted) | $43,401 | $51,504 | $63,590 | $70,402 | $69,082 | ||||||||||
See Notes to Financial Statements
59
Table of Contents
Financial Highlights – continued
MFS® FLORIDA MUNICIPAL BOND FUND – continued
| Years ended 3/31 | |||||||||||||||
| Class B | 2009 | 2008 | 2007 | 2006 | 2005 | ||||||||||
Net asset value, beginning of period | $9.65 | $10.09 | $10.05 | $10.09 | $10.24 | ||||||||||
| Income (loss) from investment operations | |||||||||||||||
| Net investment income (d) | $0.37 | $0.38 | $0.38 | (z) | $0.38 | $0.40 | |||||||||
Net realized and unrealized gain (loss) on investments | (0.71 | ) | (0.45 | ) | 0.03 | (z) | (0.04 | ) | (0.16 | ) | |||||
Total from investment operations | $(0.34 | ) | $(0.07 | ) | $0.41 | $0.34 | $0.24 | ||||||||
| Less distributions declared to shareholders | |||||||||||||||
| From net investment income | $(0.37 | ) | $(0.37 | ) | $(0.37 | ) | $(0.38 | ) | $(0.39 | ) | |||||
From net realized gain on investments | (0.02 | ) | — | — | — | — | |||||||||
Total distributions declared to shareholders | $(0.39 | ) | $(0.37 | ) | $(0.37 | ) | $(0.38 | ) | $(0.39 | ) | |||||
Net asset value, end of period | $8.92 | $9.65 | $10.09 | $10.05 | $10.09 | ||||||||||
Total return (%) (r)(s)(t) | (3.59 | ) | (0.73 | ) | 4.12 | 3.35 | 2.45 | ||||||||
| Ratios (%) (to average net assets) and Supplemental data: | |||||||||||||||
| Expenses before expense reductions (f) | 1.57 | 1.92 | 1.96 | 1.87 | 1.71 | ||||||||||
Expenses after expense reductions (f) | 1.39 | 1.67 | 1.71 | 1.62 | 1.46 | ||||||||||
Expenses after expense reductions and excluding interest expense and fees (f)(l) | N/A | 1.37 | 1.40 | 1.40 | 1.34 | ||||||||||
Net investment income | 4.03 | 3.85 | 3.77 | (z) | 3.70 | 3.92 | |||||||||
Portfolio turnover | 34 | 7 | 9 | 17 | 18 | ||||||||||
Net assets at end of period (000 Omitted) | $4,981 | $7,497 | $10,906 | $14,970 | $18,382 | ||||||||||
| (d) | Per share data is based on average shares outstanding. |
| (f) | Ratios do not reflect reductions from fees paid indirectly, if applicable. |
| (l) | Interest expense and fees relate to payments made to the holder of the floating rate certificate from trust assets. |
| (r) | Certain expenses have been reduced without which performance would have been lower. |
| (s) | From time to time the fund may receive proceeds from litigation settlements, without which performance would be lower. |
| (t) | Total returns do not include any applicable sales charges. |
| (z) | The fund applied a change in estimate for amortization of premium on certain debt securities that resulted in an increase of $0.01 per share to net investment income, a decrease of $0.01 per share to net realized and unrealized gain (loss) on investments, and an increase of 0.06% to the net investment income ratio for each class for the year ended March 31, 2007. The change in estimate had no impact on net assets, net asset value per share or total return of each class. |
See Notes to Financial Statements
60
Table of Contents
Financial Highlights – continued
MFS® GEORGIA MUNICIPAL BOND FUND
The financial highlights table is intended to help you understand the fund financial performance for the past 5 years. Certain information reflects financial results for a single fund share. The total returns in the table represent the rate by which an investor would have earned (or lost) on an investment in the fund share class (assuming reinvestment of all distributions) held for the entire period.
| Years ended 3/31 | |||||||||||||||
| Class A | 2009 | 2008 | 2007 | 2006 | 2005 | ||||||||||
Net asset value, beginning of period | $10.64 | $10.83 | $10.80 | $10.99 | $11.22 | ||||||||||
| Income (loss) from investment operations | |||||||||||||||
| Net investment income (d) | $0.47 | $0.46 | $0.47 | (z) | $0.46 | $0.48 | |||||||||
Net realized and unrealized gain (loss) on investments | (0.48 | ) | (0.20 | ) | 0.01 | (z) | (0.18 | ) | (0.23 | ) | |||||
Total from investment operations | $(0.01 | ) | $0.26 | $0.48 | $0.28 | $0.25 | |||||||||
| Less distributions declared to shareholders | |||||||||||||||
| From net investment income | $(0.44 | ) | $(0.45 | ) | $(0.45 | ) | $(0.47 | ) | $(0.48 | ) | |||||
From net realized gain on investments | (0.20 | ) | — | — | — | — | |||||||||
Total distributions declared to shareholders | $(0.64 | ) | $(0.45 | ) | $(0.45 | ) | $(0.47 | ) | $(0.48 | ) | |||||
Net asset value, end of period | $9.99 | $10.64 | $10.83 | $10.80 | $10.99 | ||||||||||
Total return (%) (r)(s)(t) | 0.04 | 2.43 | 4.55 | 2.53 | 2.27 | ||||||||||
| Ratios (%) (to average net assets) and Supplemental data: | |||||||||||||||
| Expenses before expense reductions (f) | 1.06 | 1.41 | 1.47 | 1.39 | 1.24 | ||||||||||
Expenses after expense reductions (f) | 0.89 | 1.16 | 1.22 | 1.14 | 0.99 | ||||||||||
Expenses after expense reductions and excluding interest expense and fees (f)(l) | 0.87 | 0.88 | 0.93 | 0.93 | 0.88 | ||||||||||
Net investment income | 4.55 | 4.29 | 4.37 | (z) | 4.22 | 4.35 | |||||||||
Portfolio turnover | 26 | 26 | 6 | 5 | 18 | ||||||||||
Net assets at end of period (000 Omitted) | $53,156 | $49,477 | $51,015 | $51,681 | $53,190 | ||||||||||
See Notes to Financial Statements
61
Table of Contents
Financial Highlights – continued
MFS® GEORGIA MUNICIPAL BOND FUND – continued
| Years ended 3/31 | |||||||||||||||
| Class B | 2009 | 2008 | 2007 | 2006 | 2005 | ||||||||||
Net asset value, beginning of period | $10.68 | $10.87 | $10.84 | $11.00 | $11.23 | ||||||||||
| Income (loss) from investment operations | |||||||||||||||
| Net investment income (d) | $0.39 | $0.38 | $0.40 | (z) | $0.41 | $0.40 | |||||||||
Net realized and unrealized gain (loss) on investments | (0.49 | ) | (0.20 | ) | 0.00 | (w)(z) | (0.18 | ) | (0.24 | ) | |||||
Total from investment operations | $(0.10 | ) | $0.18 | $0.40 | $0.23 | $0.16 | |||||||||
| Less distributions declared to shareholders | |||||||||||||||
| From net investment income | $(0.36 | ) | $(0.37 | ) | $(0.37 | ) | $(0.39 | ) | $(0.39 | ) | |||||
From net realized gain on investments | (0.20 | ) | — | — | — | — | |||||||||
Total distributions declared to shareholders | $(0.56 | ) | $(0.37 | ) | $(0.37 | ) | $(0.39 | ) | $(0.39 | ) | |||||
Net asset value, end of period | $10.02 | $10.68 | $10.87 | $10.84 | $11.00 | ||||||||||
Total return (%) (r)(s)(t) | (0.79 | ) | 1.67 | 3.77 | 2.05 | 1.51 | |||||||||
| Ratios (%) (to average net assets) and Supplemental data: | |||||||||||||||
| Expenses before expense reductions (f) | 1.80 | 2.16 | 2.22 | 2.14 | 1.99 | ||||||||||
Expenses after expense reductions (f) | 1.62 | 1.91 | 1.97 | 1.89 | 1.74 | ||||||||||
Expenses after expense reductions and excluding interest expense and fees (f)(l) | 1.61 | 1.63 | 1.68 | 1.68 | 1.63 | ||||||||||
Net investment income | 3.78 | 3.54 | 3.63 | (z) | 3.72 | 3.60 | |||||||||
Portfolio turnover | 26 | 26 | 6 | 5 | 18 | ||||||||||
Net assets at end of period (000 Omitted) | $4,344 | $6,780 | $8,175 | $9,816 | $13,280 | ||||||||||
Any redemption fees charged by the fund during the 2005 fiscal year resulted in a per share impact of less than $0.01.
| (d) | Per share data is based on average shares outstanding. |
| (f) | Ratios do not reflect reductions from fees paid indirectly, if applicable. |
| (l) | Interest expense and fees relate to payments made to the holder of the floating rate certificates from trust assets. |
| (r) | Certain expenses have been reduced without which performance would have been lower. |
| (s) | From time to time the fund may receive proceeds from litigation settlements, without which performance would be lower. |
| (t) | Total returns do not include any applicable sales charges. |
| (w) | Per share amount was less than $0.01. |
| (z) | The fund applied a change in estimate for amortization of premium on certain debt securities that resulted in an increase of $0.01 per share to net investment income, a decrease of $0.01 per share to net realized and unrealized gain (loss) on investments, and an increase of 0.12% to the net investment income ratio for each class for the year ended March 31, 2007. The change in estimate had no impact on net assets, net asset value per share or total return of each class. |
See Notes to Financial Statements
62
Table of Contents
Financial Highlights – continued
MFS® MARYLAND MUNICIPAL BOND FUND
The financial highlights table is intended to help you understand the fund financial performance for the past 5 years. Certain information reflects financial results for a single fund share. The total returns in the table represent the rate by which an investor would have earned (or lost) on an investment in the fund share class (assuming reinvestment of all distributions) held for the entire period.
| Years ended 3/31 | |||||||||||||||
| Class A | 2009 | 2008 | 2007 | 2006 | 2005 | ||||||||||
Net asset value, beginning of period | $10.83 | $11.30 | $11.27 | $11.49 | $11.74 | ||||||||||
| Income (loss) from investment operations | |||||||||||||||
| Net investment income (d) | $0.48 | $0.50 | $ 0.50 | (z) | $0.50 | $0.52 | |||||||||
Net realized and unrealized gain (loss) on investments | (0.65 | ) | (0.48 | ) | 0.04 | (z) | (0.15 | ) | (0.25 | ) | |||||
Total from investment operations | $(0.17 | ) | $0.02 | $0.54 | $0.35 | $0.27 | |||||||||
| Less distributions declared to shareholders | |||||||||||||||
| From net investment income | $(0.47 | ) | $(0.47 | ) | $(0.48 | ) | $(0.50 | ) | $(0.51 | ) | |||||
From net realized gain on investments | (0.04 | ) | (0.02 | ) | (0.03 | ) | (0.07 | ) | (0.01 | ) | |||||
Total distributions declared to shareholders | $(0.51 | ) | $(0.49 | ) | $(0.51 | ) | $(0.57 | ) | $(0.52 | ) | |||||
Net asset value, end of period | $10.15 | $10.83 | $11.30 | $11.27 | $11.49 | ||||||||||
Total return (%) (r)(s)(t) | (1.57 | ) | 0.15 | 4.88 | 3.06 | 2.36 | |||||||||
| Ratios (%) (to average net assets) and Supplemental data: | |||||||||||||||
| Expenses before expense reductions (f) | 1.11 | 1.26 | 1.29 | 1.19 | 1.14 | ||||||||||
Expenses after expense reductions (f) | 0.94 | 1.01 | 1.04 | 0.94 | 0.89 | ||||||||||
Expenses after expense reductions and excluding interest expense and fees (f)(l) | 0.89 | 0.88 | 0.91 | 0.94 | 0.89 | ||||||||||
Net investment income | 4.67 | 4.46 | 4.48 | (z) | 4.38 | 4.48 | |||||||||
Portfolio turnover | 24 | 7 | 16 | 9 | 12 | ||||||||||
Net assets at end of period (000 Omitted) | $93,075 | $103,894 | $117,598 | $115,307 | $124,261 | ||||||||||
See Notes to Financial Statements
63
Table of Contents
Financial Highlights – continued
MFS® MARYLAND MUNICIPAL BOND FUND – continued
| Years ended 3/31 | |||||||||||||||
| Class B | 2009 | 2008 | 2007 | 2006 | 2005 | ||||||||||
Net asset value, beginning of period | $10.83 | $11.29 | $11.26 | $11.49 | $11.74 | ||||||||||
| Income (loss) from investment operations | |||||||||||||||
| Net investment income (d) | $0.42 | $0.42 | $0.43 | (z) | $0.43 | $0.44 | |||||||||
Net realized and unrealized gain (loss) on investments | (0.67 | ) | (0.46 | ) | 0.03 | (z) | (0.17 | ) | (0.25 | ) | |||||
Total from investment operations | $(0.25 | ) | $(0.04 | ) | $0.46 | $0.26 | $0.19 | ||||||||
| Less distributions declared to shareholders | |||||||||||||||
| From net investment income | $(0.40 | ) | $(0.40 | ) | $(0.40 | ) | $(0.42 | ) | $(0.44 | ) | |||||
From net realized gain on investments | (0.04 | ) | (0.02 | ) | (0.03 | ) | (0.07 | ) | (0.00 | )(w) | |||||
Total distributions declared to shareholders | $(0.44 | ) | $(0.42 | ) | $(0.43 | ) | $(0.49 | ) | $(0.44 | ) | |||||
Net asset value, end of period | $10.14 | $10.83 | $11.29 | $11.26 | $11.49 | ||||||||||
Total return (%) (r)(s)(t) | (2.31 | ) | (0.41 | ) | 4.21 | 2.30 | 1.69 | ||||||||
| Ratios (%) (to average net assets) and Supplemental data: | |||||||||||||||
| Expenses before expense reductions (f) | 1.77 | 1.91 | 1.95 | 1.84 | 1.79 | ||||||||||
Expenses after expense reductions (f) | 1.59 | 1.66 | 1.70 | 1.59 | 1.54 | ||||||||||
Expenses after expense reductions and excluding interest expense and fees (f)(l) | 1.55 | 1.53 | 1.56 | 1.59 | 1.54 | ||||||||||
Net investment income | 4.01 | 3.81 | 3.83 | (z) | 3.72 | 3.83 | |||||||||
Portfolio turnover | 24 | 7 | 16 | 9 | 12 | ||||||||||
Net assets at end of period (000 Omitted) | $8,385 | $12,153 | $16,515 | $21,011 | $25,716 | ||||||||||
| (d) | Per share data is based on average shares outstanding. |
| (f) | Ratios do not reflect reductions from fees paid indirectly, if applicable. |
| (l) | Interest expense and fees relate to payments made to the holder of the floating rate certificate from trust assets. |
| (r) | Certain expenses have been reduced without which performance would have been lower. |
| (s) | From time to time the fund may receive proceeds from litigation settlements, without which performance would be lower. |
| (t) | Total returns do not include any applicable sales charges. |
| (w) | Per share amount was less than $0.01. |
| (z) | The fund applied a change in estimate for amortization of premium on certain debt securities that resulted in an increase of $0.01 per share to net investment income, a decrease of $0.01 per share to net realized and unrealized gain(loss) on investments, and an increase of 0.12% to the net investment income ratio for each class for the year ended March 31, 2007. The change in estimate had no impact on net assets, net asset value per share or total return of each class. |
See Notes to Financial Statements
64
Table of Contents
Financial Highlights – continued
MFS® MASSACHUSETTS MUNICIPAL BOND FUND
The financial highlights table is intended to help you understand the fund financial performance for the past 5 years. Certain information reflects financial results for a single fund share. The total returns in the table represent the rate by which an investor would have earned (or lost) on an investment in the fund share class (assuming reinvestment of all distributions) held for the entire period.
| Years ended 3/31 | |||||||||||||||
| Class A | 2009 | 2008 | 2007 | 2006 | 2005 | ||||||||||
Net asset value, beginning of period | $10.91 | $11.25 | $11.22 | $11.31 | $11.52 | ||||||||||
| Income (loss) from investment operations | |||||||||||||||
| Net investment income (d) | $0.49 | $0.44 | $ 0.51 | (z) | $0.48 | $0.51 | |||||||||
Net realized and unrealized gain (loss) on investments | (0.52 | ) | (0.26 | ) | 0.02 | (z) | (0.05 | ) | (0.22 | ) | |||||
Total from investment operations | $(0.03 | ) | $0.18 | $0.53 | $0.43 | $0.29 | |||||||||
| Less distributions declared to shareholders | |||||||||||||||
| From net investment income | $(0.48 | ) | $(0.47 | ) | $(0.47 | ) | $(0.48 | ) | $(0.50 | ) | |||||
From net realized gain on investments | (0.05 | ) | (0.05 | ) | (0.03 | ) | (0.04 | ) | — | ||||||
Total distributions declared to shareholders | $(0.53 | ) | $(0.52 | ) | $(0.50 | ) | $(0.52 | ) | $(0.50 | ) | |||||
Net asset value, end of period | $10.35 | $10.91 | $11.25 | $11.22 | $11.31 | ||||||||||
Total return (%) (r)(s)(t) | (0.21 | ) | 1.69 | 4.80 | 3.83 | 2.63 | |||||||||
| Ratios (%) (to average net assets) and Supplemental data: | |||||||||||||||
| Expenses before expense reductions (f) | 1.04 | 1.35 | 1.39 | 1.34 | 1.19 | ||||||||||
Expenses after expense reductions (f) | 0.87 | 1.10 | 1.14 | 1.09 | 0.94 | ||||||||||
Expenses after expense reductions and excluding interest expense and fees (f)(l) | 0.83 | 0.82 | 0.87 | 0.90 | 0.84 | ||||||||||
Net investment income | 4.69 | 4.00 | 4.57 | (z) | 4.23 | 4.48 | |||||||||
Portfolio turnover | 40 | 20 | 5 | 10 | 11 | ||||||||||
Net assets at end of period (000 Omitted) | $185,105 | $189,804 | $189,049 | $196,992 | $210,103 | ||||||||||
See Notes to Financial Statements
65
Table of Contents
Financial Highlights – continued
MFS® MASSACHUSETTS MUNICIPAL BOND FUND – continued
| Years ended 3/31 | |||||||||||||||
| Class B | 2009 | 2008 | 2007 | 2006 | 2005 | ||||||||||
Net asset value, beginning of period | $10.93 | $11.27 | $11.24 | $11.33 | $11.54 | ||||||||||
| Income (loss) from investment operations | |||||||||||||||
| Net investment income (d) | $0.42 | $0.37 | $0.44 | (z) | $0.41 | $0.43 | |||||||||
Net realized and unrealized gain (loss) on investments | (0.52 | ) | (0.26 | ) | 0.02 | (z) | (0.05 | ) | (0.21 | ) | |||||
Total from investment operations | $(0.10 | ) | $0.11 | $0.46 | $0.36 | $0.22 | |||||||||
| Less distributions declared to shareholders | |||||||||||||||
| From net investment income | $(0.41 | ) | $(0.40 | ) | $(0.40 | ) | $(0.41 | ) | $(0.43 | ) | |||||
From net realized gain on investments | (0.05 | ) | (0.05 | ) | (0.03 | ) | (0.04 | ) | — | ||||||
Total distributions declared to shareholders | $(0.46 | ) | $(0.45 | ) | $(0.43 | ) | $(0.45 | ) | $(0.43 | ) | |||||
Net asset value, end of period | $10.37 | $10.93 | $11.27 | $11.24 | $11.33 | ||||||||||
Total return (%) (r)(s)(t) | (0.86 | ) | 1.04 | 4.12 | 3.16 | 1.97 | |||||||||
| Ratios (%) (to average net assets) and Supplemental data: | |||||||||||||||
| Expenses before expense reductions (f) | 1.70 | 2.00 | 2.04 | 1.99 | 1.84 | ||||||||||
Expenses after expense reductions (f) | 1.53 | 1.75 | 1.79 | 1.74 | 1.59 | ||||||||||
Expenses after expense reductions and excluding interest expense and fees (f)(l) | 1.48 | 1.48 | 1.52 | 1.55 | 1.49 | ||||||||||
Net investment income | 4.01 | 3.35 | 3.92 | (z) | 3.58 | 3.83 | |||||||||
Portfolio turnover | 40 | 20 | 5 | 10 | 11 | ||||||||||
Net assets at end of period (000 Omitted) | $17,166 | $24,353 | $31,415 | $36,924 | $40,766 | ||||||||||
Any redemption fees charged by the fund during the 2005 fiscal year resulted in a per share impact of less than $0.01.
| (d) | Per share data is based on average shares outstanding. |
| (f) | Ratios do not reflect reductions from fees paid indirectly, if applicable. |
| (l) | Interest expense and fees relate to payments made to the holder of the floating rate certificate from trust assets. |
| (r) | Certain expenses have been reduced without which performance would have been lower. |
| (s) | From time to time the fund may receive proceeds from litigation settlements, without which performance would be lower. |
| (t) | Total returns do not include any applicable sales charges. |
| (z) | The fund applied a change in estimate for amortization of premium on certain debt securities that resulted in an increase of $0.02 per share to net investment income, a decrease of $0.02 per share to net realized and unrealized gain (loss) on investments, and an increase of 0.20% to the net investment income ratio for each class for the year ended March 31, 2007. The change in estimate had no impact on net assets, net asset value per share or total return of each class. |
See Notes to Financial Statements
66
Table of Contents
| (1) | Business and Organization |
MFS Alabama Municipal Bond Fund (Alabama Fund), MFS Arkansas Municipal Bond Fund (Arkansas Fund), MFS California Municipal Bond Fund (California Fund), MFS Florida Municipal Bond Fund (Florida Fund), MFS Georgia Municipal Bond Fund (Georgia Fund), MFS Maryland Municipal Bond Fund (Maryland Fund), and MFS Massachusetts Municipal Bond Fund (Massachusetts Fund) are each a series of MFS Municipal Series Trust which is organized as a Massachusetts business trust and is registered under the Investment Company Act of 1940, as amended, as an open-end management investment company.
| (2) | Significant Accounting Policies |
General – The preparation of financial statements in conformity with U.S. generally accepted accounting principles requires management to make estimates and assumptions that affect the reported amounts of assets and liabilities, and disclosure of contingent assets and liabilities at the date of the financial statements and the reported amounts of revenues and expenses during the reporting period. Actual results could differ from those estimates. The value of municipal instruments can be affected by changes in their actual or perceived credit quality. The credit quality of municipal instruments can be affected by, among other things, the financial condition of the issuer or guarantor, the issuer’s future borrowing plans and sources of revenue, the economic feasibility of the revenue bond project or general borrowing purpose, political or economic developments in the region or state where the instrument is issued and the liquidity of the security. Municipal instruments generally trade in the over-the-counter market. Municipal instruments backed by current and anticipated revenues from a specific project or specific assets can be negatively affected by the discontinuance of the taxation supporting the projects or assets or the inability to collect revenues for the project or from the assets. If the Internal Revenue Service determines an issuer of a municipal instrument has not complied with the applicable tax requirements, the security could decline in value, interest from the security could become taxable and the funds may be required to issue Forms 1099-DIV.
Investment Valuations – Debt instruments and floating rate loans (other than short-term instruments), including restricted debt instruments, are generally valued at an evaluated or composite bid as provided by a third-party pricing service. Short-term instruments with a maturity at issuance of 60 days or less generally are valued at amortized cost, which approximates market value. Futures contracts are generally valued at last posted settlement price as provided by a third-party pricing service on the market on which they are primarily traded. Futures contracts for which there were no trades that day for a particular position are generally valued at the closing bid quotation as provided by a third-party pricing service on the market on which such futures contracts are primarily traded. Swaps are generally valued at valuations provided by a third-party pricing service. Open-end investment companies are generally valued at net asset value per share. Securities and other assets generally valued on the basis of information from a third-party pricing service may also be valued at a broker/dealer bid quotation. Values obtained from pricing services can utilize both dealer-supplied valuations and electronic data processing techniques, which take into account factors such as institutional-size trading in similar groups of securities, yield, quality, coupon rate, maturity, type of issue, trading characteristics, and other market data.
The Board of Trustees has delegated primary responsibility for determining or causing to be determined the value of each fund’s investments (including any fair valuation) to the adviser pursuant to valuation policies and procedures approved by the Board. If the adviser determines that reliable market quotations are not readily available, investments are valued at fair value as determined in good faith by the adviser in accordance with such procedures under the oversight of the Board of Trustees. Under each fund’s valuation policies and procedures, market quotations are not considered to be readily available for most types of debt instruments and floating rate loans and many types of derivatives. These investments are generally valued at fair value based on information from third-party pricing services. In addition, investments may be valued at fair value if the adviser determines that an investment’s value has been materially affected by events occurring after the close of the exchange or market on which the investment is principally traded (such as foreign exchange or market) and prior to the determination of each fund’s net asset value, or after the halting of trading of a specific security where trading does not resume prior to the close of the exchange or market on which the security is principally traded. The adviser generally relies on third party pricing services or other information (such as the correlation with price movements of similar securities in the same or other markets; the type, cost and investment characteristics of the security; the business and financial condition of the issuer; and trading and other market data) to assist in determining whether to fair value and at what value to fair value an investment. The value of an investment for purposes of calculating each fund’s net asset value can differ depending on the source and method used to determine value. When fair valuation is used, the value of investments used to determine each fund’s net asset value may differ from quoted or published prices for the same investments. There can be no assurance that each fund could obtain the fair value assigned to an investment if it were to sell the investment at the same time at which each fund determines its net asset value per share.
The funds adopted FASB Statement No. 157, Fair Value Measurements (the “Statement”). This Statement provides a single definition of fair value, a hierarchy for measuring fair value and expanded disclosures about fair value measurements.
67
Table of Contents
Notes to Financial Statements – continued
Various inputs are used in determining the value of each fund’s assets or liabilities carried at market value. These inputs are categorized into three broad levels. Level 1 includes quoted prices in active markets for identical assets or liabilities. Level 2 includes other significant observable market-based inputs (including quoted prices for similar securities, interest rates, prepayment speed, and credit risk). Level 3 includes unobservable inputs, which may include the adviser’s own assumptions in determining the fair value of investments. Other financial instruments are derivative instruments not reflected in total investments, such as futures, forwards, swap contracts and written options. The following is a summary of the levels used as of March 31, 2009 in valuing each fund’s assets or liabilities carried at market value:
| Level 1 | Level 2 | Level 3 | Total | |||||||
| Alabama Fund | ||||||||||
| Investments in Securities | $1,959,869 | $72,281,808 | $— | $74,241,677 | ||||||
| Other Financial Instruments | $— | $— | $— | $— | ||||||
| Arkansas Fund | ||||||||||
| Investments in Securities | $4,265,949 | $141,622,899 | $— | $145,888,848 | ||||||
| Other Financial Instruments | $(32,953 | ) | $— | $— | $(32,953 | ) | ||||
| California Fund | ||||||||||
| Investments in Securities | $8,577,179 | $330,491,997 | $— | $339,069,176 | ||||||
| Other Financial Instruments | $(167,759 | ) | $— | $— | $(167,759 | ) | ||||
| Florida Fund | ||||||||||
| Investments in Securities | $984,804 | $45,973,087 | $— | $46,957,891 | ||||||
| Other Financial Instruments | $(17,974 | ) | $— | $— | $(17,974 | ) | ||||
| Georgia Fund | ||||||||||
| Investments in Securities | $774,568 | $55,804,002 | $— | $56,578,570 | ||||||
| Other Financial Instruments | $(17,974 | ) | $— | $— | $(17,974 | ) | ||||
| Maryland Fund | ||||||||||
| Investments in Securities | $194,806 | $99,887,052 | $— | $100,081,858 | ||||||
| Other Financial Instruments | $(35,949 | ) | $— | $— | $(35,949 | ) | ||||
| Massachusetts Fund | ||||||||||
| Investments in Securities | $5,580,865 | $195,690,914 | $— | $201,271,779 | ||||||
| Other Financial Instruments | $(80,884 | ) | $— | $— | $(80,884 | ) | ||||
Derivative Risk – Each fund may invest in derivatives for hedging or non-hedging purposes. While hedging can reduce or eliminate losses, it can also reduce or eliminate gains. When the funds use derivatives as an investment to gain market exposure, or for hedging purposes, gains and losses from derivative instruments may be substantially greater than the derivative’s original cost. Cash that has been segregated on behalf of certain derivative contracts will be reported separately on the Statements of Assets and Liabilities as restricted cash. On some over-the-counter derivatives, the funds attempt to reduce their exposure to counterparty credit risk by entering into an ISDA Master Agreement on a bilateral basis with each of the counterparties with whom it undertakes a significant volume of transactions. The ISDA Master Agreement gives the funds the right, upon an event of default by the applicable counterparty, to close out all transactions traded under such agreement and to net amounts owed under each transaction to one net amount payable by one party to the other. This right to close out and net payments across all transactions traded under the ISDA Master Agreement could result in a reduction of the funds’ credit risk to such counterparty equal to any amounts payable by the funds under the applicable transactions, if any. However, absent an event of default by the counterparty, the ISDA Master Agreement does not result in an offset of reported balance sheet assets and liabilities across transactions between the funds and the applicable counterparty. Derivative instruments include futures contracts and swap agreements.
In March 2008, FASB Statement No. 161, Disclosures about Derivative Instruments and Hedging Activities (the “Standard”) was issued, and is effective for financial statements issued for fiscal years and interim periods beginning after November 15, 2008. This Standard provides enhanced disclosures about the funds’ use of and accounting for derivative instruments and the effect of derivative instruments on the funds’ results of operations and financial position. Management is evaluating the application of the Standard on the funds, and believes the impact resulting from the adoption of this Standard will be limited to expanded disclosure in the funds’ financial statements.
FASB Staff Position (FSP) 133-1 was implemented during the period. FSP 133-1 amends FAS 133 to require sellers of credit derivatives to make disclosures that will enable financial statement users to assess the potential effects of those credit
68
Table of Contents
Notes to Financial Statements – continued
derivatives on an entity’s financial position, financial performance and cash flows. There was no impact from implementing FSP 133-1 as the funds did not hold any of these credit derivatives at period end.
Futures Contracts – Each fund may enter into futures contracts for the delayed delivery of securities or currency, or contracts based on financial indices at a fixed price on a future date. In entering such contracts, the funds are required to deposit with the broker either in cash or securities an amount equal to a certain percentage of the contract amount. Subsequent payments are made or received by the funds each day, depending on the daily fluctuations in the value of the contract, and are recorded for financial statement purposes as unrealized gains or losses by the funds. Upon entering into such contracts, the funds bear the risk of interest or exchange rates or securities prices moving unexpectedly, in which case, the funds may not achieve the anticipated benefits of the futures contracts and may realize a loss.
Swap Agreements – Each fund may enter into swap agreements. A swap is generally an exchange of cash payments, at specified intervals or upon the occurrence of specified events, between each fund and a counterparty. The net cash payments exchanged are recorded as a realized gain or loss on swap transactions in the Statements of Operations. The value of the swap, which is adjusted daily and includes any related interest accruals to be paid or received by each fund, is recorded on the Statements of Assets and Liabilities. The daily change in value, including any related interest accruals to be paid or received, is recorded as unrealized appreciation or depreciation on swap transactions in the Statements of Operations. Amounts paid or received at the inception of the swap are reflected as premiums paid or received on the Statements of Assets and Liabilities and are amortized using the effective interest method over the term of the agreement. A liquidation payment received or made upon early termination is recorded as a realized gain or loss on swap transactions in the Statements of Operations.
Risks related to swap agreements include the possible lack of a liquid market, unfavorable market and interest rate movements of the underlying instrument and the failure of the counterparty to perform under the terms of the agreements. To address counterparty risk, swap transactions are limited to only highly-rated counterparties and collateral, in the form of cash or securities, may be required to be posted by the counterparty to each fund and held in segregated accounts with each fund’s custodian. Counterparty risk is further mitigated by having ISDA Master Agreements between each fund and its counterparties providing for netting as described above.
The funds may enter into an interest rate swap in order to manage its exposure to interest rate fluctuations. Interest rate swap agreements involve the periodic exchange of cash flows, between each fund and a counterparty, based on the difference between two interest rates applied to a notional principal amount. The two interest rates exchanged may either be a fixed rate and a floating rate or two floating rates based on different indices.
Inverse Floaters – The funds may invest in municipal inverse floating rate securities which are structured by the issuer (known as primary market inverse floating rate securities) or by an investment banker utilizing municipal bonds which have already been issued (known as secondary market inverse floating rate securities) to have variable rates of interest which typically move in the opposite direction of short term interest rates. A secondary market inverse floating rate security is created when an investment banker transfers a fixed rate municipal bond to a special purpose trust, and causes the trust to (a) issue floating rate certificates to third-parties, in an amount equal to a fraction of the par amount of the deposited bonds (these certificates usually pay tax-exempt interest at short-term interest rates that typically reset weekly; and the certificate holders typically, on seven days notice, have the option to tender their certificates to the investment banker or another party for redemption at par plus accrued interest), and (b) issue inverse floating rate certificates (sometimes referred to as “inverse floaters”). If the holder of the inverse floater transfers the municipal bonds to an investment banker for the purpose of depositing the municipal bonds into the special purpose trust, the inverse floating rate certificates that are issued by the trust are referred to as “self-deposited inverse floaters.” If the bonds held by the trust are purchased by the investment banker for deposit into the trust from someone other than the purchasers of the inverse floaters, the inverse floating rate certificates that are issued by the trust are referred to as “externally deposited inverse floaters.” Such self-deposited inverse floaters held by certain funds are accounted for as secured borrowings, with the municipal bonds reflected in the investments of certain funds and amounts owed to the holder of the floating rate certificate under the provisions of the trust, which amounts are paid solely from the assets of the trust, reflected as liabilities of certain funds in the Statements of Assets and Liabilities under the caption, “Payable to the holder of the floating rate certificate from trust assets”. At March 31, 2009, the funds did not hold any floating rate certificates. For the year ended March 31, 2009, the average daily payable to the holder of the floating rate certificate from
69
Table of Contents
Notes to Financial Statements – continued
trust assets, the weighted average interest rate related to this payable, and the interest expense and fees related to interest payments made to the holder of certain floating rate certificates and associated fees, both of which are made from trust assets were as follows:
| Average payable to the holder of the floating rate certificate from trust assets for the year ended March 31, 2009 | Weighted average interest rate for the year ended March 31, 2009, on floating rate certificates issued by the trust | Interest expense and fees in connection with self- deposited inverse floaters for the year ended March 31, 2009 | ||||
| Fund | ||||||
| Alabama Fund | $743,836 | 3.30% | $24,550 | |||
| Arkansas Fund | 2,897,178 | 3.25% | 94,159 | |||
| California Fund | 8,302,575 | 3.13% | 260,027 | |||
| Georgia Fund | 276,712 | 2.89% | 7,988 | |||
| Maryland Fund | 1,494,247 | 3.22% | 48,071 | |||
| Massachusetts Fund | 3,543,301 | 2.45% | 86,748 |
Interest expense and fees are recorded as incurred. Primary and externally deposited inverse floaters held by certain funds are not accounted for as secured borrowings.
Indemnifications – Under each fund’s organizational documents, its officers and trustees may be indemnified against certain liabilities and expenses arising out of the performance of their duties to each fund. Additionally, in the normal course of business, each fund enters into agreements with service providers that may contain indemnification clauses. Each fund’s maximum exposure under these agreements is unknown as this would involve future claims that may be made against each fund that have not yet occurred.
Investment Transactions and Income – Investment transactions are recorded on the trade date. Interest income is recorded on the accrual basis. All premium and discount is amortized or accreted for financial statement purposes in accordance with U.S. generally accepted accounting principles. Dividends received in cash are recorded on the ex-dividend date. Dividend and interest payments received in additional securities are recorded on the ex-dividend or ex-interest date in an amount equal to the value of the security on such date.
Each fund may receive proceeds from litigation settlements. Any proceeds received from litigation involving portfolio holdings are reflected in the Statements of Operations in realized gain/loss if the security has been disposed of by the fund or in unrealized gain/loss if the security is still held by the fund. Any other proceeds from litigation not related to portfolio holdings are reflected as other income in the Statements of Operations.
Legal fees and other related expenses incurred to preserve and protect the value of a security owned are added to the cost of the security; other legal fees are expensed. Capital infusions made directly to the security issuer, which are generally non-recurring, incurred to protect or enhance the value of high-yield debt securities, are reported as additions to the cost basis of the security. Costs that are incurred to negotiate the terms or conditions of capital infusions or that are expected to result in a plan of reorganization are reported as realized losses. Ongoing costs incurred to protect or enhance an investment, or costs incurred to pursue other claims or legal actions, are expensed.
Fees Paid Indirectly – Each fund’s custody fee may be reduced according to an arrangement that measures the value of cash deposited with the custodian by each fund. This amount, for the year ended March 31, 2009, is shown as a reduction of total expenses on the Statements of Operations.
Tax Matters and Distributions – Each fund intends to qualify as a regulated investment company, as defined under Subchapter M of the Internal Revenue Code, and to distribute all of its taxable and tax-exempt income, including realized capital gains. As a result, no provision for federal income taxes is required. Each fund’s federal tax returns for the prior three fiscal years remain subject to examination by the Internal Revenue Service.
Distributions to shareholders are recorded on the ex-dividend date. Income and capital gain distributions are determined in accordance with income tax regulations, which may differ from U.S. generally accepted accounting principles. Certain capital accounts in the financial statements are periodically adjusted for permanent differences in order to reflect their tax character. These adjustments have no impact on net assets or net asset value per share. Temporary differences which arise from recognizing certain items of income, expense, gain or loss in different periods for financial statement and tax purposes will reverse at some time in the future. Distributions in excess of net investment income or net realized gains are temporary overdistributions for financial statement purposes resulting from differences in the recognition or classification of income or distributions for financial statement and tax purposes.
Book/tax differences primarily relate to amortization and accretion of debt securities, derivative transactions, and secured borrowings.
70
Table of Contents
Notes to Financial Statements – continued
The tax character of distributions declared to shareholders for the last two fiscal years is as follows:
| Year Ended 3/31/09 | Alabama Fund | Arkansas Fund | California Fund | Florida Fund | Georgia Fund | Maryland Fund | Massachusetts Fund | |||||||
| Ordinary income (including any short-term capital gains) | $200,449 | $319,704 | $— | $95 | $201,080 | $19,840 | $— | |||||||
| Tax-exempt income | 3,374,521 | 6,505,641 | 17,647,476 | 2,563,816 | 2,401,875 | 4,862,616 | 9,262,635 | |||||||
| Long-term capital gain | 285,506 | 963,292 | — | 90,456 | 926,507 | 351,870 | 913,887 | |||||||
| Total distributions | $3,860,476 | $7,788,637 | $17,647,476 | $2,654,367 | $3,529,462 | $5,234,326 | $10,176,522 | |||||||
| Year Ended 3/31/08 | Alabama Fund | Arkansas Fund | California Fund | Florida Fund | Georgia Fund | Maryland Fund | Massachusetts Fund | |||||||
| Ordinary income (including any short-term capital gains) | $109,920 | $182,966 | $— | $— | $— | $21,004 | $455,311 | |||||||
| Tax-exempt income | 3,622,143 | 6,308,655 | 18,631,533 | 2,925,892 | 2,326,254 | 5,207,845 | 9,056,784 | |||||||
| Long-term capital gain | 78,154 | 74,946 | — | — | — | 199,581 | 554,073 | |||||||
| Total distributions | $3,810,217 | $6,566,567 | $18,631,533 | $2,925,892 | $2,326,254 | $5,428,430 | $10,066,168 | |||||||
The federal tax cost and the tax basis components of distributable earnings were as follows:
| As of 3/31/09 | Alabama Fund | Arkansas Fund | California Fund | Florida Fund | Georgia Fund | Maryland Fund | Massachusetts Fund | ||||||||||||||
| Cost of investments | $76,911,201 | $148,162,424 | $368,469,156 | $50,675,711 | $57,995,982 | $105,129,646 | $206,231,867 | ||||||||||||||
| Gross appreciation | 1,524,695 | 4,964,865 | 6,083,078 | 714,007 | 1,388,180 | 3,525,205 | 6,307,636 | ||||||||||||||
| Gross depreciation | (4,194,219 | ) | (7,238,441 | ) | (35,483,058 | ) | (4,431,827 | ) | (2,805,592 | ) | (8,572,993 | ) | (11,267,724 | ) | |||||||
| Net unrealized appreciation (depreciation) | $(2,669,524 | ) | $(2,273,576 | ) | $(29,399,980 | ) | $(3,717,820 | ) | $(1,417,412 | ) | $(5,047,788 | ) | $(4,960,088 | ) | |||||||
| Undistributed ordinary income | — | — | — | — | 1,027 | — | — | ||||||||||||||
| Undistributed tax-exempt income | 331,825 | 582,093 | 1,730,598 | 226,573 | 272,598 | 543,550 | 1,045,574 | ||||||||||||||
| Undistributed long-term capital gain | — | — | — | — | 167,706 | 5,690 | 744,776 | ||||||||||||||
| Capital loss carryforwards | (29,072 | ) | — | (3,821,717 | ) | (53,158 | ) | — | — | — | |||||||||||
| Post-October capital loss deferral | (74,504 | ) | (3,961 | ) | — | (205,312 | ) | (345,415 | ) | (389,928 | ) | — | |||||||||
| Other temporary differences | (285,085 | ) | (553,790 | ) | (1,439,163 | ) | (211,743 | ) | (219,617 | ) | (425,752 | ) | (820,323 | ) |
As of March 31, 2009, certain funds had capital loss carryforwards available to offset future realized gains. Such losses expire as follows:
| Expiration Date | Alabama Fund | California Fund | Florida Fund | ||||||
| 3/31/14 | $— | $(104,559 | ) | $— | |||||
| 3/31/16 | — | (2,654,117 | ) | — | |||||
| 3/31/17 | (29,072 | ) | (1,063,041 | ) | (53,158 | ) | |||
| Total | $(29,072 | ) | $(3,821,717 | ) | $(53,158 | ) |
Multiple Classes of Shares of Beneficial Interest – Each fund offers multiple classes of shares, which differ in their respective distribution and service fees. Each fund’s income and common expenses are allocated to shareholders based on the value of settled shares outstanding of each class. Each fund’s realized and unrealized gain (loss) are allocated to shareholders based on the daily net assets of each class. Dividends are declared separately for each class. Differences in per share dividend rates are generally due to differences in separate class expenses. Class B shares will convert to Class A shares approximately eight years after purchase.
| (3) | Transactions with Affiliates |
Investment Adviser – Each fund has an investment advisory agreement with Massachusetts Financial Services Company (MFS) to provide overall investment management and related administrative services and facilities to each fund. At the commencement of the period, the management fee was computed daily and paid monthly at an annual rate of 0.55% of each fund’s average daily net assets. Effective August 1, 2008, the management fee is computed daily and paid monthly at an annual rate of 0.45% of each fund’s average daily net assets.
As part of a settlement agreement with the New York Attorney General concerning market timing and related matters, MFS had agreed to reduce the management fee to 0.30% of each fund’s average daily net assets for the period March 1, 2004 through February 28, 2009. For the year ended March 31, 2009, this waiver amounted to the following for each fund and is reflected as a reduction of total expenses in the Statements of Operations:
Alabama Fund | Arkansas Fund | California Fund | Florida Fund | Georgia Fund | Maryland Fund | Massachusetts Fund | ||||||
| $131,700 | $248,237 | $639,357 | $94,869 | $97,522 | $188,847 | $353,696 |
71
Table of Contents
Notes to Financial Statements – continued
The management fee incurred for the year ended March 31, 2009 was equivalent to an annual effective rate of 0.31% of each fund’s average daily net assets.
Effective August 1, 2008, the investment adviser has agreed in writing to pay a portion of the following fund’s total annual operating expenses, exclusive of interest, taxes, extraordinary expenses, brokerage and transaction costs and investment-related expenses (including interest expenses and fees associated with investments in inverse floating rate instruments), such that total annual fund operating expenses do not exceed the following rates annually of each fund’s average daily net assets:
Alabama Fund | Georgia Fund | Maryland Fund | |||||
| Class A | 0.93% | 1.00% | 0.95% | (a) | |||
| Class B | 1.68% | 1.75% | 1.70% |
| (a) | Effective March 1, 2009, the annual rate changed to 0.95% from 1.05%. |
This written agreement will continue until modified by the fund’s Board of Trustees, but such agreement will continue at least until July 31, 2009. For the year ended March 31, 2009, these funds’ actual operating expenses did not exceed these limits and therefore, the investment adviser did not pay any portion of these funds’ expenses.
Distributor – MFS Fund Distributors, Inc. (MFD), a wholly-owned subsidiary of MFS, as distributor, received the following amounts for the year ended March 31, 2009, as its portion of the initial sales charge on sales of Class A shares of each fund:
Alabama Fund | Arkansas Fund | California Fund | Florida Fund | Georgia Fund | Maryland Fund | Massachusetts Fund | ||||||
| $22,489 | $65,182 | $81,185 | $14,346 | $21,228 | $16,521 | $53,606 |
The Board of Trustees has adopted a distribution plan for certain class shares pursuant to Rule 12b-1 of the Investment Company Act of 1940.
Each fund’s distribution plan provides that each fund will pay MFD for services provided by MFD and financial intermediaries in connection with the distribution and servicing of certain share classes. One component of the plan is a distribution fee paid to MFD and another component of the plan is a service fee paid to MFD. MFD may subsequently pay all, or a portion, of the distribution and/or service fees to financial intermediaries.
Distribution Plan Fee Table:
| CLASS A | ||||||||||
| Distribution Fee Rate | Service Fee Rate | Total Distribution Plan (d) | Annual Effective Rate (e) | Distribution and Service Fee | ||||||
| Alabama Fund | — | 0.25% | 0.25% | 0.25% | $171,411 | |||||
| Arkansas Fund | — | 0.25% | 0.25% | 0.10% | 138,524 | |||||
| California Fund | — | 0.25% | 0.25% | 0.10% | 312,079 | |||||
| Florida Fund | — | 0.25% | 0.25% | — | — | |||||
| Georgia Fund | — | 0.25% | 0.25% | 0.25% | 127,679 | |||||
| Maryland Fund | — | 0.25% | 0.25% | 0.34% | 336,264 | |||||
| Massachusetts Fund | — | 0.25% | 0.25% | 0.34% | 630,459 | |||||
| CLASS B | ||||||||||
| Distribution Fee Rate | Service Fee Rate | Total Distribution Plan(d) | Annual Effective Rate(e) | Distribution and Service | ||||||
| Alabama Fund | 0.75% | 0.25% | 1.00% | 1.00% | $77,236 | |||||
| Arkansas Fund | 0.75% | 0.25% | 1.00% | 0.86% | 55,329 | |||||
| California Fund | 0.75% | 0.25% | 1.00% | 0.86% | 218,447 | |||||
| Florida Fund | 0.75% | 0.25% | 1.00% | 0.77% | 46,046 | |||||
| Georgia Fund | 0.75% | 0.25% | 1.00% | 1.00% | 59,931 | |||||
| Maryland Fund | 0.75% | 0.25% | 1.00% | 1.00% | 104,436 | |||||
| Massachusetts Fund | 0.75% | 0.25% | 1.00% | 1.00% | 204,217 | |||||
72
Table of Contents
Notes to Financial Statements – continued
| CLASS C | ||||||||||
| Distribution Fee Rate | Service Fee Rate | Total Distribution Plan (d) | Annual Effective Rate (e) | Distribution and Service Fee | ||||||
| California Fund | 0.75% | 0.25% | 1.00% | 1.00% | $285,042 | |||||
| Alabama Fund | Arkansas Fund | California Fund | Florida Fund | Georgia Fund | Maryland Fund | Massachusetts Fund | ||||||||
| Total Distribution and Service Fees | $248,647 | $193,853 | $815,568 | $46,046 | $187,610 | $440,700 | $834,676 |
| (d) | In accordance with the distribution plan for certain classes, each fund pays distribution and/or service fees up to these annual percentage rates of each class’ average daily net assets. |
| (e) | The annual effective rates represent actual fees incurred under the distribution plan for the year ended March 31, 2009 based on each class’ average daily net assets. Effective March 1, 2009, the 0.10% Class A annual distribution fee was eliminated for all funds. Prior to March 1, 2009, payment of the Alabama Fund’s, Arkansas Fund’s, California Fund’s, Florida Fund’s, and Georgia Fund’s 0.10% annual Class A distribution fee was not in effect; the 0.10% Class A annual distribution fee for the Maryland Fund and the Massachusetts Fund was paid. Payment of Florida Fund’s 0.25% annual Class A service fee is not yet in effect and will be implemented on such date as the fund’s Board of Trustees may determine. 0.10% of the Class A service fee is currently being paid by the Arkansas Fund and California Fund. Payment of the remaining 0.15% of the Arkansas Fund and California Fund Class A service fee is not yet in effect and will be implemented on such date as each fund’s Board of Trustees may determine. For one year from the date of sale of Florida Fund’s Class B shares, assets attributable to such Class B shares are subject to the 0.25% annual Class B service fee. On assets attributable to all other Florida Fund’s Class B shares, the service fee is not currently in effect, but may be implemented on such date as the fund’s Board of Trustees may determine. For one year from the date of sale of Arkansas Fund’s and California Fund’s Class B shares, assets attributable to such Class B shares are subject to the 0.25% annual Class B service fee. On assets attributable to all other Arkansas Fund and California Fund Class B shares, 0.10% of the Class B service fee is currently in effect and the remaining portion of the Class B service fee is not in effect but may be implemented on such date as each fund’s Board of Trustees may determine. |
Certain Class A shares purchased prior to September 1, 2008 are subject to a contingent deferred sales charge (CDSC) in the event of a shareholder redemption within 12 months of purchase. Certain Class A shares purchased on or subsequent to September 1, 2008 are subject to a CDSC in the event of a shareholder redemption within 24 months of purchase. Class C shares are subject to a CDSC in the event of a shareholder redemption within 12 months of purchase. Class B shares are subject to a CDSC in the event of a shareholder redemption within six years of purchase. All contingent deferred sales charges are paid to MFD and during the year ended March 31, 2009, were as follows:
| CDSC imposed | Alabama Fund | Arkansas Fund | California Fund | Florida Fund | Georgia Fund | Maryland Fund | Massachusetts Fund | |||||||
| Class A | $4 | $9,313 | $9,101 | $683 | $— | $— | $22,793 | |||||||
| Class B | 9,667 | 8,911 | 34,457 | 9,167 | 3,460 | 7,120 | 18,482 | |||||||
| Class C | N/A | N/A | 3,954 | N/A | N/A | N/A | N/A |
Shareholder Servicing Agent – MFS Service Center, Inc. (MFSC), a wholly-owned subsidiary of MFS, receives a fee from the funds for its services as shareholder servicing agent calculated as a percentage of the average daily net assets of each fund as determined periodically under the supervision of each fund’s Board of Trustees. For the year ended March 31, 2009, each fund paid the following fee, which equated to the following annual percentage of each fund’s average daily net assets:
| Alabama Fund | Arkansas Fund | California Fund | Florida Fund | Georgia Fund | Maryland Fund | Massachusetts Fund | ||||||||
| Expenses paid | $21,564 | $49,442 | $125,140 | $19,569 | $18,768 | $54,753 | $88,763 | |||||||
| Percentage of average daily net assets | 0.0282% | 0.0340% | 0.0341% | 0.0359% | 0.0328% | 0.0502% | 0.0432% |
MFSC also receives payment from the funds for out-of-pocket expenses, sub-accounting and other shareholder servicing costs which may be paid to affiliated and unaffiliated service providers. For the year ended March 31, 2009, these out-of-pocket expenses, sub-accounting and other shareholder servicing costs amounted to the following:
Alabama Fund | Arkansas Fund | California Fund | Florida Fund | Georgia Fund | Maryland Fund | Massachusetts Fund | ||||||
| $25,312 | $33,651 | $99,908 | $18,383 | $19,650 | $36,677 | $56,455 |
Administrator – MFS provides certain financial, legal, shareholder communications, compliance, and other administrative services to the funds. Under an administrative services agreement, each fund partially reimburses MFS the costs incurred to provide these services. Each fund is charged an annual fixed amount of $17,500 plus a fee based on average daily net assets. The administrative services fee incurred for the year ended March 31, 2009 was equivalent to an annual effective rate of each fund’s average daily net assets as follows:
Alabama Fund | Arkansas Fund | California Fund | Florida Fund | Georgia Fund | Maryland Fund | Massachusetts Fund | ||||||
| 0.0285% | 0.0229% | 0.0189% | 0.0333% | 0.0326% | 0.0249% | 0.0210% |
Trustees’ and Officers’ Compensation – Each fund pays compensation to independent trustees in the form of a retainer, attendance fees, and additional compensation to Board and Committee chairpersons. The funds do not pay compensation
73
Table of Contents
Notes to Financial Statements – continued
directly to trustees or officers of each fund who are also officers of the investment adviser, all of whom receive remuneration for their services to the funds from MFS. Certain officers and trustees of the funds are officers or directors of MFS, MFD, and MFSC. For certain independent trustees who retired on or before December 31, 2001, each fund has an unfunded, defined benefit plan which resulted in a pension expense for the funds. These amounts are included in independent trustees’ compensation and were as follows:
Alabama Fund | Arkansas Fund | California Fund | Florida Fund | Georgia Fund | Maryland Fund | Massachusetts Fund | ||||||
| $635 | $696 | $1,207 | $696 | $560 | $1,157 | $1,174 |
The liability for deferred retirement benefits payable to certain retired independent trustees amounted to the following for each fund at March 31, 2009, and is included in payable for independent trustees’ compensation:
Alabama Fund | Arkansas Fund | California Fund | Florida Fund | Georgia Fund | Maryland Fund | Massachusetts Fund | ||||||
| $8,188 | $7,855 | $16,842 | $7,845 | $9,264 | $12,061 | $12,012 |
Other – These funds and certain other MFS funds (the funds) have entered into services agreements (the Agreements) which provide for payment of fees by the funds to Tarantino LLC and Griffin Compliance LLC in return for the provision of services of an Independent Chief Compliance Officer (ICCO) and Assistant ICCO, respectively, for the funds. The ICCO and Assistant ICCO are officers of the funds and the sole members of Tarantino LLC and Griffin Compliance LLC, respectively. The funds can terminate the Agreements with Tarantino LLC and Griffin Compliance LLC at any time under the terms of the Agreements. For the year ended March 31, 2009, the aggregate fees paid by each fund to Tarantino LLC and Griffin Compliance LLC amounted to the following and are included in miscellaneous expense on the Statements of Operations:
Alabama Fund | Arkansas Fund | California Fund | Florida Fund | Georgia Fund | Maryland Fund | Massachusetts Fund | ||||||
| $817 | $1,569 | $3,878 | $583 | $618 | $1,165 | $2,198 |
MFS has agreed to reimburse the funds for a portion of the payments made by each fund in the following amounts, which are shown as a reduction of total expenses in the Statements of Operations. Additionally, MFS has agreed to bear all expenses associated with office space, other administrative support, and supplies provided to the ICCO and Assistant ICCO:
Alabama Fund | Arkansas Fund | California Fund | Florida Fund | Georgia Fund | Maryland Fund | Massachusetts Fund | ||||||
| $423 | $806 | $2,043 | $303 | $316 | $606 | $1,140 |
The funds may invest in a money market fund managed by MFS which seeks a high level of current income consistent with preservation of capital and liquidity. Income earned on these investments are included in dividends from underlying funds on the Statements of Operations. This money market fund does not pay a management fee to MFS.
| (4) | Portfolio Securities |
Purchases and sales of investments, other than U.S. Government securities, purchased option transactions, and short-term obligations, were as follows:
Alabama Fund | Arkansas Fund | California Fund | Florida Fund | Georgia Fund | Maryland Fund | Massachusetts Fund | ||||||||
| Purchases | $26,516,941 | $40,490,221 | $96,834,014 | $18,176,176 | $17,121,173 | $25,736,025 | $81,959,751 | |||||||
| Sales | $28,839,890 | $32,836,462 | $147,844,234 | $25,492,848 | $14,489,071 | $35,524,473 | $87,831,095 |
| (5) | Shares of Beneficial Interest |
Each fund’s Declaration of Trust permits the Trustees to issue an unlimited number of full and fractional shares of beneficial interest. Transactions in fund shares were as follows:
| MFS Alabama Municipal Bond Fund | MFS Arkansas Municipal Bond Fund | |||||||||||||||
| Year ended 3/31/09 | Year ended 3/31/08 | Year ended 3/31/09 | Year ended 3/31/08 | |||||||||||||
| Shares | Amount | Shares | Amount | Shares | Amount | Shares | Amount | |||||||||
| Shares sold | ||||||||||||||||
Class A | 1,524,765 | $14,907,781 | 720,517 | $7,442,142 | 1,838,224 | $17,596,391 | 2,540,613 | $25,101,778 | ||||||||
Class B | 43,365 | 411,313 | 29,692 | 305,818 | 92,195 | 878,328 | 19,742 | 196,164 | ||||||||
| 1,568,130 | $15,319,094 | 750,209 | $7,747,960 | 1,930,419 | $18,474,719 | 2,560,355 | $25,297,942 | |||||||||
74
Table of Contents
Notes to Financial Statements – continued
| MFS Alabama Municipal Bond Fund | MFS Arkansas Municipal Bond Fund | |||||||||||||||||||||||
| Year ended 3/31/09 | Year ended 3/31/08 | Year ended 3/31/09 | Year ended 3/31/08 | |||||||||||||||||||||
| Shares | Amount | Shares | Amount | Shares | Amount | Shares | Amount | |||||||||||||||||
| Shares issued to shareholders in reinvestment of distributions | ||||||||||||||||||||||||
Class A | 242,516 | $2,368,152 | 199,746 | $2,061,403 | 522,341 | $4,922,940 | 357,912 | $3,558,911 | ||||||||||||||||
Class B | 26,442 | 257,896 | 22,941 | 236,789 | 19,579 | 184,515 | 18,115 | 180,427 | ||||||||||||||||
| 268,958 | $2,626,048 | 222,687 | $2,298,192 | 541,920 | $5,107,455 | 376,027 | $3,739,338 | |||||||||||||||||
| Shares reacquired | ||||||||||||||||||||||||
Class A | (1,665,282 | ) | $(16,211,535 | ) | (944,652 | ) | $(9,737,337 | ) | (1,573,532 | ) | $(14,742,954 | ) | (1,366,949 | ) | $(13,585,450 | ) | ||||||||
Class B | (194,172 | ) | (1,878,160 | ) | (208,336 | ) | (2,142,917 | ) | (150,020 | ) | (1,416,677 | ) | (243,187 | ) | (2,430,674 | ) | ||||||||
| (1,859,454 | ) | $(18,089,695 | ) | (1,152,988 | ) | $(11,880,254 | ) | (1,723,552 | ) | $(16,159,631 | ) | (1,610,136 | ) | $(16,016,124 | ) | |||||||||
| Net change | ||||||||||||||||||||||||
Class A | 101,999 | $1,064,398 | (24,389 | ) | $(233,792 | ) | 787,033 | $7,776,377 | 1,531,576 | $15,075,239 | ||||||||||||||
Class B | (124,365 | ) | (1,208,951 | ) | (155,703 | ) | (1,600,310 | ) | (38,246 | ) | (353,834 | ) | (205,330 | ) | (2,054,083 | ) | ||||||||
| (22,366 | ) | $(144,553 | ) | (180,092 | ) | $(1,834,102 | ) | 748,787 | $7,422,543 | 1,326,246 | $13,021,156 | |||||||||||||
| MFS California Municipal Bond Fund | ||||||||||||
| Year ended 3/31/09 | Year ended 3/31/08 | |||||||||||
| Shares | Amount | Shares | Amount | |||||||||
| Shares sold | ||||||||||||
Class A | 10,147,433 | $54,058,519 | 8,427,658 | $48,506,794 | ||||||||
Class B | 218,963 | 1,166,444 | 251,222 | 1,436,627 | ||||||||
Class C | 1,473,546 | 7,794,943 | 938,006 | 5,406,580 | ||||||||
| 11,839,942 | $63,019,906 | 9,616,886 | $55,350,001 | |||||||||
| Shares issued to shareholders in reinvestment of distributions | ||||||||||||
Class A | 1,736,958 | $9,217,000 | 1,563,939 | $8,988,442 | ||||||||
Class B | 136,182 | 725,241 | 156,996 | 902,995 | ||||||||
Class C | 132,464 | 704,542 | 104,801 | 604,267 | ||||||||
| 2,005,604 | $10,646,783 | 1,825,736 | $10,495,704 | |||||||||
| Shares reacquired | ||||||||||||
Class A | (16,223,876 | ) | $(85,636,027 | ) | (11,372,836 | ) | $(65,227,714 | ) | ||||
Class B | (2,189,165 | ) | (11,493,065 | ) | (2,801,462 | ) | (16,132,561 | ) | ||||
Class C | (890,232 | ) | (4,625,186 | ) | (1,215,145 | ) | (7,025,959 | ) | ||||
| (19,303,273 | ) | $(101,754,278 | ) | (15,389,443 | ) | $(88,386,234 | ) | |||||
| Net change | ||||||||||||
Class A | (4,339,485 | ) | $(22,360,508 | ) | (1,381,239 | ) | $(7,732,478 | ) | ||||
Class B | (1,834,020 | ) | (9,601,380 | ) | (2,393,244 | ) | (13,792,939 | ) | ||||
Class C | 715,778 | 3,874,299 | (172,338 | ) | (1,015,112 | ) | ||||||
| (5,457,727 | ) | $(28,087,589 | ) | (3,946,821 | ) | $(22,540,529 | ) | |||||
75
Table of Contents
Notes to Financial Statements – continued
| MFS Florida Municipal Bond Fund | MFS Georgia Municipal Bond Fund | |||||||||||||||||||||||
| Year ended 3/31/09 | Year ended 3/31/08 | Year ended 3/31/09 | Year ended 3/31/08 | |||||||||||||||||||||
| Shares | Amount | Shares | Amount | Shares | Amount | Shares | Amount | |||||||||||||||||
| Shares sold | ||||||||||||||||||||||||
Class A | 633,254 | $5,909,039 | 384,575 | $3,804,683 | 1,151,749 | $11,795,811 | 329,946 | $3,530,335 | ||||||||||||||||
Class B | 65,703 | 605,341 | 34,879 | 343,904 | 38,603 | 392,421 | 20,684 | 222,024 | ||||||||||||||||
| 698,957 | $6,514,380 | 419,454 | $4,148,587 | 1,190,352 | $12,188,232 | 350,630 | $3,752,359 | |||||||||||||||||
| Shares issued to shareholders in reinvestment of distributions | ||||||||||||||||||||||||
Class A | 131,375 | $1,198,662 | 129,770 | $1,285,028 | 211,245 | $2,097,556 | 121,134 | $1,297,447 | ||||||||||||||||
Class B | 12,192 | 111,395 | 15,409 | 152,671 | 18,295 | 182,384 | 14,650 | 157,497 | ||||||||||||||||
| 143,567 | $1,310,057 | 145,179 | $1,437,699 | 229,540 | $2,279,940 | 135,784 | $1,454,944 | |||||||||||||||||
| Shares reacquired | ||||||||||||||||||||||||
Class A | (1,235,993 | ) | $(11,241,799 | ) | (1,478,169 | ) | $(14,612,305 | ) | (688,605 | ) | $(6,853,876 | ) | (513,295 | ) | $(5,486,709 | ) | ||||||||
Class B | (296,490 | ) | (2,744,483 | ) | (354,133 | ) | (3,514,495 | ) | (258,244 | ) | (2,609,229 | ) | (152,709 | ) | (1,641,560 | ) | ||||||||
| (1,532,483 | ) | $(13,986,282 | ) | (1,832,302 | ) | $(18,126,800 | ) | (946,849 | ) | $(9,463,105 | ) | (666,004 | ) | $(7,128,269 | ) | |||||||||
| Net change | ||||||||||||||||||||||||
Class A | (471,364 | ) | $(4,134,098 | ) | (963,824 | ) | $(9,522,594 | ) | 674,389 | $7,039,491 | (62,215 | ) | $(658,927 | ) | ||||||||||
Class B | (218,595 | ) | (2,027,747 | ) | (303,845 | ) | (3,017,920 | ) | (201,346 | ) | (2,034,424 | ) | (117,375 | ) | (1,262,039 | ) | ||||||||
| (689,959 | ) | $(6,161,845 | ) | (1,267,669 | ) | $(12,540,514 | ) | 473,043 | $5,005,067 | (179,590 | ) | $(1,920,966 | ) | |||||||||||
| MFS Maryland Municipal Bond Fund | MFS Massachusetts Municipal Bond Fund | |||||||||||||||||||||||
| Year ended 3/31/09 | Year ended 3/31/08 | Year ended 3/31/09 | Year ended 3/31/08 | |||||||||||||||||||||
| Shares | Amount | Shares | Amount | Shares | Amount | Shares | Amount | |||||||||||||||||
| Shares sold | ||||||||||||||||||||||||
Class A | 817,136 | $8,505,319 | 735,024 | $8,138,965 | 2,897,514 | $29,859,717 | 2,277,879 | $25,272,437 | ||||||||||||||||
Class B | 20,930 | 215,761 | 25,216 | 279,696 | 114,114 | 1,187,294 | 74,745 | 829,213 | ||||||||||||||||
| 838,066 | $8,721,080 | 760,240 | $8,418,661 | 3,011,628 | $31,047,011 | 2,352,624 | $26,101,650 | |||||||||||||||||
| Shares issued to shareholders in reinvestment of distributions | ||||||||||||||||||||||||
Class A | 301,252 | $3,094,331 | 274,144 | $3,039,655 | 490,887 | $5,091,501 | 429,774 | $4,768,020 | ||||||||||||||||
Class B | 23,784 | 244,264 | 25,978 | 288,053 | 49,797 | 518,791 | 61,212 | 680,590 | ||||||||||||||||
| 325,036 | $3,338,595 | 300,122 | $3,327,708 | 540,684 | $5,610,292 | 490,986 | $5,448,610 | |||||||||||||||||
| Shares reacquired | ||||||||||||||||||||||||
Class A | (1,536,364 | ) | $(15,662,377 | ) | (1,826,013 | ) | $(20,251,193 | ) | (2,901,758 | ) | $(29,550,894 | ) | (2,121,192 | ) | $(23,539,832 | ) | ||||||||
Class B | (340,439 | ) | (3,477,387 | ) | (391,057 | ) | (4,333,232 | ) | (736,520 | ) | (7,722,780 | ) | (696,230 | ) | (7,733,519 | ) | ||||||||
| (1,876,803 | ) | $(19,139,764 | ) | (2,217,070 | ) | $(24,584,425 | ) | (3,638,278 | ) | $(37,273,674 | ) | (2,817,422 | ) | $(31,273,351 | ) | |||||||||
| Net change | ||||||||||||||||||||||||
Class A | (417,976 | ) | $(4,062,727 | ) | (816,845 | ) | $(9,072,573 | ) | 486,643 | $5,400,324 | 586,461 | $6,500,625 | ||||||||||||
Class B | (295,725 | ) | (3,017,362 | ) | (339,863 | ) | (3,765,483 | ) | (572,609 | ) | (6,016,695 | ) | (560,273 | ) | (6,223,716 | ) | ||||||||
| (713,701 | ) | $(7,080,089 | ) | (1,156,708 | ) | $(12,838,056 | ) | (85,966 | ) | $(616,371 | ) | 26,188 | $276,909 | |||||||||||
76
Table of Contents
Notes to Financial Statements – continued
| (6) | Line of Credit |
Each fund and other funds managed by MFS participate in a $1 billion unsecured committed line of credit provided by a syndication of banks under a credit agreement. In addition, these funds and other funds managed by MFS have established uncommitted borrowing arrangements with certain banks. Borrowings may be made for temporary financing needs. Interest is charged to each fund, based on its borrowings, generally at a rate equal to the Federal Reserve funds rate plus 0.30%. In addition, a commitment fee, based on the average daily, unused portion of the committed line of credit, is allocated among the participating funds at the end of each calendar quarter. For the year ended March 31, 2009, each fund’s commitment fee and interest expense were as follows, and are included in miscellaneous expense on the Statements of Operations:
| Alabama Fund | Arkansas Fund | California Fund | Florida Fund | Georgia Fund | Maryland Fund | Massachusetts Fund | ||||||||
| Commitment Fee | $436 | $862 | $1,987 | $285 | $329 | $592 | $1,177 | |||||||
| Interest Expense | — | — | — | — | — | — | — |
| (7) | Transactions in Underlying Funds-Affiliated Issuers |
An affiliated issuer may be considered one in which the fund owns 5% or more of the outstanding voting securities, or a company which is under common control. For the purposes of this report, the funds assume the MFS Institutional Money Market Portfolio to be an affiliated issuer. Each of the funds’ transactions in the MFS Institutional Money Market Portfolio for the year ended March 31, 2009, are as follows:
| Underlying Fund – MFS Institutional Money Market Portfolio | ||||||||
| Beginning Share/Par Amount | Acquisitions Share/Par Amount | Dispositions Share/Par Amount | Ending Share/Par Amount | |||||
Alabama Fund | — | 9,172,844 | (7,212,975) | 1,959,869 | ||||
Arkansas Fund | — | 7,345,699 | (3,079,750) | 4,265,949 | ||||
California Fund | — | 22,263,244 | (13,686,065) | 8,577,179 | ||||
Florida Fund | — | 4,593,396 | (3,608,592) | 984,804 | ||||
Georgia Fund | — | 3,430,266 | (2,655,698) | 774,568 | ||||
Maryland Fund | — | 4,780,160 | (4,585,354) | 194,806 | ||||
Massachusetts Fund | — | 13,110,966 | (7,530,101) | 5,580,865 | ||||
| Underlying Fund – MFS Institutional Money Market Portfolio | ||||||||
| Realized Gain (Loss) | Capital Gain Distributions | Dividend Income | Ending Value | |||||
Alabama Fund | $— | $— | $2,005 | $1,959,869 | ||||
Arkansas Fund | $— | $— | $2,618 | $4,265,949 | ||||
California Fund | $— | $— | $5,257 | $8,577,179 | ||||
Florida Fund | $— | $— | $332 | $984,804 | ||||
Georgia Fund | $— | $— | $492 | $774,568 | ||||
Maryland Fund | $— | $— | $665 | $194,806 | ||||
Massachusetts Fund | $— | $— | $2,060 | $5,580,865 | ||||
77
Table of Contents
REPORT OF INDEPENDENT REGISTERED PUBLIC ACCOUNTING FIRM
To the Board of Trustees and the Shareholders of MFS Municipal Series Trust:
We have audited the accompanying statements of assets and liabilities, including the portfolios of investments, of MFS Alabama Municipal Bond Fund, MFS Arkansas Municipal Bond Fund, MFS California Municipal Bond Fund, MFS Florida Municipal Bond Fund, MFS Georgia Municipal Bond Fund, MFS Maryland Municipal Bond Fund and MFS Massachusetts Municipal Bond Fund (the “Funds”) (each a fund comprising MFS Municipal Series Trust) as of March 31, 2009, and the related statements of operations for the year then ended, the statements of changes in net assets for each of the two years in the period then ended, and the financial highlights for each of the five years in the period then ended. These financial statements and financial highlights are the responsibility of the Funds’ management. Our responsibility is to express an opinion on these financial statements and financial highlights based on our audits.
We conducted our audits in accordance with the standards of the Public Company Accounting Oversight Board (United States). Those standards require that we plan and perform the audits to obtain reasonable assurance about whether the financial statements and financial highlights are free of material misstatement. The Funds are not required to have, nor were we engaged to perform, an audit of their internal control over financial reporting. Our audits included consideration of internal control over financial reporting as a basis for designing audit procedures that are appropriate in the circumstances, but not for the purpose of expressing an opinion on the effectiveness of the Funds’ internal control over financial reporting. Accordingly, we express no such opinion. An audit also includes examining, on a test basis, evidence supporting the amounts and disclosures in the financial statements, assessing the accounting principles used and significant estimates made by management, as well as evaluating the overall financial statement presentation. Our procedures included confirmation of securities owned as of March 31, 2009, by correspondence with the custodian and brokers; where replies were not received from brokers, we performed other auditing procedures. We believe that our audits provide a reasonable basis for our opinion.
In our opinion, the financial statements and financial highlights referred to above present fairly, in all material respects, the financial position of the funds constituting MFS Municipal Series Trust as of March 31, 2009, the results of their operations for the year then ended, the changes in their net assets for each of the two years in the period then ended, and the financial highlights for each of the five years in the period then ended, in conformity with accounting principles generally accepted in the United States of America.
DELOITTE & TOUCHE LLP
Boston, Massachusetts
May 14, 2009
78
Table of Contents
TRUSTEES AND OFFICERS — IDENTIFICATION AND BACKGROUND
The Trustees and officers of the Trust, as of May 1, 2009, are listed below, together with their principal occupations during the past five years. (Their titles may have varied during that period.) The address of each Trustee and officer is 500 Boylston Street, Boston, Massachusetts 02116.
Name, Date of Birth | Position(s) Held | Trustee/Officer Since (h) | Principal Occupations During the Past Five Years & | |||
| INTERESTED TRUSTEES | ||||||
| Robert J. Manning (k) (born 10/20/63) | Trustee | February 2004 | Massachusetts Financial Services Company, Chief Executive Officer, President, Chief Investment Officer and Director | |||
| Robert C. Pozen (k) (born 8/08/46) | Trustee | February 2004 | Massachusetts Financial Services Company, Chairman (since February 2004); Harvard Business School (education), Senior Lecturer (since 2008); Bell Canada Enterprises (telecommunications), Director (until February 2009); The Bank of New York, Director (finance), (March 2004 to May 2005); Telesat (satellite communications), Director (until November 2007) | |||
| INDEPENDENT TRUSTEES | ||||||
| David H. Gunning (born 5/30/42) | Trustee and Chair of Trustees | January 2004 | Retired; Cleveland-Cliffs Inc. (mining products and service provider), Vice Chairman/Director (until May 2007); Lincoln Electric Holdings, Inc. (welding equipment manufacturer), Director; Development Alternatives, Inc. (consulting), Director/Non Executive Chairman; Portman Limited (mining), Director (since 2005); Southwest Gas Corp. (natural gas distribution), Director (until May 2004) | |||
| Robert E. Butler (n) (born 11/29/41) | Trustee | January 2006 | Consultant – regulatory and compliance matters (since July 2002); PricewaterhouseCoopers LLP (professional services firm), Partner (until 2002) | |||
| Lawrence H. Cohn, M.D. (born 3/11/37) | Trustee | August 1993 | Brigham and Women’s Hospital, Senior Cardiac Surgeon (since 2005); Harvard Medical School, Professor of Cardiac Surgery; Partners HealthCare, Physician Director of Medical Device Technology (since 2006); Brigham and Women’s Hospital, Chief of Cardiac Surgery (until 2005) | |||
Maureen R. Goldfarb (born 4/06/55) | Trustee | January 2009 | Private investor; John Hancock Financial Services, Inc., Executive Vice President (until 2004); John Hancock Mutual Funds, Trustee and Chief Executive Officer (until 2004) | |||
| William R. Gutow (born 9/27/41) | Trustee | December 1993 | Private investor and real estate consultant; Capital Entertainment Management Company (video franchise), Vice Chairman; Texas Donuts (donut franchise), Vice Chairman (since 2007); Atlantic Coast Tan (tanning salons), Vice Chairman (until 2007) | |||
| Michael Hegarty (born 12/21/44) | Trustee | December 2004 | Retired; AXA Financial (financial services and insurance), Vice Chairman and Chief Operating Officer (until 2001); The Equitable Life Assurance Society (insurance), President and Chief Operating Officer (until 2001) | |||
| J. Atwood Ives (born 5/01/36) | Trustee | February 1992 | Private investor; KeySpan Corporation (energy related services), Director until 2004; Woodstock Corporation (investment advisory firm), Director until 2003 | |||
| John P. Kavanaugh (born 11/04/54) | Trustee | January 2009 | Private investor; The Hanover Insurance Group, Inc., Vice President and Chief Investment Officer (until 2006); Allmerica Investment Trust, Allmerica Securities Trust and Opus Investment Trust (investment companies), Chairman, President and Trustee (until 2006) | |||
| J. Dale Sherratt (born 9/23/38) | Trustee | August 1993 | Insight Resources, Inc. (acquisition planning specialists), President; Wellfleet Investments (investor in health care companies), Managing General Partner | |||
| Laurie J. Thomsen (born 8/05/57) | Trustee | March 2005 | New Profit, Inc. (venture philanthropy), Partner (since 2006); Private investor; Prism Venture Partners (venture capital), Co-founder and General Partner (until June 2004); The Travelers Companies (commercial property liability insurance), Director | |||
| Robert W. Uek (born 5/18/41) | Trustee | January 2006 | Consultant to investment company industry; PricewaterhouseCoopers LLP (professional services firm), Partner (until 1999); TT International Funds (mutual fund complex), Trustee (until 2005); Hillview Investment Trust II Funds (mutual fund complex), Trustee (until 2005) | |||
| OFFICERS | ||||||
| Maria F. Dwyer (k) (born 12/01/58) | President | November 2005 | Massachusetts Financial Services Company, Executive Vice President and Chief Regulatory Officer (since March 2004) Chief Compliance Officer (since December 2006); Fidelity Management & Research Company, Vice President (prior to March 2004); Fidelity Group of Funds, President and Treasurer (until March 2004) | |||
| Christopher R. Bohane (k) (born 1/18/74) | Assistant Secretary and Assistant Clerk | July 2005 | Massachusetts Financial Services Company, Vice President and Senior Counsel | |||
John M. Corcoran (k) (born 4/13/65) | Treasurer | October 2008 | Massachusetts Financial Services Company, Senior Vice President (since October 2008); State Street Bank and Trust (financial services provider), Senior Vice President, (until September 2008) | |||
79
Table of Contents
Trustees and Officers – continued
Name, Date of Birth | Position(s) Held | Trustee/Officer Since (h) | Principal Occupations During the Past Five Years & | |||
| Ethan D. Corey (k) (born 11/21/63) | Assistant Secretary and Assistant Clerk | July 2005 | Massachusetts Financial Services Company, Senior Vice President and Associate General Counsel (since 2004); Dechert LLP (law firm), Counsel (prior to December 2004) | |||
| David L. DiLorenzo (k) (born 8/10/68) | Assistant Treasurer | July 2005 | Massachusetts Financial Services Company, Vice President (since June 2005); JP Morgan Investor Services, Vice President (until June 2005) | |||
| Timothy M. Fagan (k) (born 7/10/68) | Assistant Secretary and Assistant Clerk | September 2005 | Massachusetts Financial Services Company, Vice President and Senior Counsel (since September 2005); John Hancock Advisers, LLC, Vice President, Senior Attorney and Chief Compliance Officer (until August 2005) | |||
| Mark D. Fischer (k) (born 10/27/70) | Assistant Treasurer | July 2005 | Massachusetts Financial Services Company, Vice President (since May 2005); JP Morgan Investment Management Company, Vice President (until May 2005) | |||
| Robyn L. Griffin (born 7/04/75) | Assistant Independent Chief Compliance Officer | August 2008 | Griffin Compliance LLC (provider of compliance services), Principal (since August 2008); State Street Corporation (financial services provider), Mutual Fund Administration Assistant Vice President (October 2006 – July 2008); Liberty Mutual Group (insurance), Personal Market Assistant Controller (April 2006 – October 2006); Deloitte & Touche LLP (professional services firm), Senior Manager (prior to April 2006) | |||
Brian E. Langenfeld (k) (born 3/07/73) | Assistant Secretary and Assistant Clerk | June 2006 | Massachusetts Financial Services Company, Vice President and Senior Counsel (since May 2006); John Hancock Advisers, LLC, Assistant Vice President and Counsel (until April 2006) | |||
| Ellen Moynihan (k) (born 11/13/57) | Assistant Treasurer | April 1997 | Massachusetts Financial Services Company, Senior Vice President | |||
Susan S. Newton (k) (born 3/07/50) | Assistant Secretary and Assistant Clerk | May 2005 | Massachusetts Financial Services Company, Senior Vice President and Associate General Counsel (since April 2005); John Hancock Advisers, LLC, Senior Vice President, Secretary and Chief Legal Officer (until April 2005) | |||
| Susan A. Pereira (k) (born 11/05/70) | Assistant Secretary and Assistant Clerk | July 2005 | Massachusetts Financial Services Company, Vice President and Senior Counsel (since June 2004); Bingham McCutchen LLP (law firm), Associate (until June 2004) | |||
| Mark N. Polebaum (k) (born 5/01/52) | Secretary and Clerk | January 2006 | Massachusetts Financial Services Company, Executive Vice President, General Counsel and Secretary (since January 2006); Wilmer Cutler Pickering Hale and Dorr LLP (law firm), Partner (until January 2006) | |||
| Frank L. Tarantino (born 3/07/44) | Independent Chief Compliance Officer | June 2004 | Tarantino LLC (provider of compliance services), Principal (since June 2004); CRA Business Strategies Group (consulting services), Executive Vice President (until June 2004) | |||
| Richard S. Weitzel (k) (born 7/16/70) | Assistant Secretary and Assistant Clerk | October 2007 | Massachusetts Financial Services Company, Vice President and Assistant General Counsel (since 2004); Massachusetts Department of Business and Technology, General Counsel (until April 2004) | |||
| James O. Yost (k) (born 6/12/60) | Assistant Treasurer | September 1990 | Massachusetts Financial Services Company, Senior Vice President | |||
| (h) | Date first appointed to serve as Trustee/officer of an MFS fund. Each Trustee has served continuously since appointment unless indicated otherwise. For the period from December 15, 2004 until February 22, 2005, Messrs. Pozen and Manning served as Advisory Trustees. For the period March 2008 until October 2008, Ms. Dwyer served as Treasurer of the Funds. |
| (j) | Directorships or trusteeships of companies required to report to the Securities and Exchange Commission (i.e., “public companies”). |
| (k) | “Interested person” of the Trust within the meaning of the Investment Company Act of 1940 (referred to as the 1940 Act), which is the principal federal law governing investment companies like the fund, as a result of position with MFS. The address of MFS is 500 Boylston Street, Boston, Massachusetts 02116. |
| (n) | In 2004 and 2005, Mr. Butler provided consulting services to the independent compliance consultant retained by MFS pursuant to its settlement with the SEC concerning market timing and related matters. The terms of that settlement required that compensation and expenses related to the independent compliance consultant be borne exclusively by MFS and, therefore, MFS paid Mr. Butler for the services he rendered to the independent compliance consultant. In 2004 and 2005, MFS paid Mr. Butler a total of $351,119.29. |
Each Trustee (except Messrs. Butler, Kavanaugh and Uek and Ms. Goldfarb) has been elected by shareholders and each Trustee and officer holds office until his or her successor is chosen and qualified or until his or her earlier death, resignation, retirement or removal. The Trust held a shareholders’ meeting in 2005 to elect Trustees, and will hold a shareholders’ meeting at least once every five years thereafter, to elect Trustees. Messrs. Butler, Kavanaugh, Sherratt, Uek and Ms. Thomsen are members of the Trust’s Audit Committee.
Each of the Fund’s Trustees and officers holds comparable positions with certain other funds of which MFS or a subsidiary is the investment adviser or distributor, and, in the case of the officers, with certain affiliates of MFS. As of January 1, 2009, the Trustees served as board members of 105 funds within the MFS Family of Funds.
80
Table of Contents
Trustees and Officers – continued
The Statement of Additional Information for the Fund and further information about the Trustees are available without charge upon request by calling 1-800-225-2606.
Investment Adviser Massachusetts Financial Services Company 500 Boylston Street, Boston, MA 02116-3741 Distributor MFS Fund Distributors, Inc. 500 Boylston Street, Boston, MA 02116-3741 Portfolio Manager Michael Dawson | Custodian JPMorgan Chase Bank One Chase Manhattan Plaza, New York, NY 10081
Independent Registered Public Accounting Firm Deloitte & Touche LLP 200 Berkeley Street, Boston, MA 02116 |
81
Table of Contents
BOARD REVIEW OF INVESTMENT ADVISORY AGREEMENT
A discussion regarding the Board’s most recent review and renewal of the fund’s Investment Advisory Agreement with MFS is available by clicking on the fund’s name under “Mutual Funds” in the “Products and Performance” section of the MFS Web site (mfs.com).
PROXY VOTING POLICIES AND INFORMATION
A general description of the MFS funds’ proxy voting policies and procedures is available without charge, upon request, by calling 1-800-225-2606, by visiting the Proxy Voting section of mfs.com or by visiting the SEC’s Web site at http://www.sec.gov.
Information regarding how the fund voted proxies relating to portfolio securities during the most recent twelve-month period ended June 30 is available without charge by visiting the Proxy Voting section of mfs.com or by visiting the SEC’s Web site at http://www.sec.gov.
QUARTERLY PORTFOLIO DISCLOSURE
The fund will file a complete schedule of portfolio holdings with the Securities and Exchange Commission (the Commission) for the first and third quarters of each fiscal year on Form N-Q. The fund’s Form N-Q may be reviewed and copied at the:
Public Reference Room
Securities and Exchange Commission
100 F Street, NE, Room 1580
Washington, D.C. 20549
Information on the operation of the Public Reference Room may be obtained by calling the Commission at 1-800-SEC-0330. The fund’s Form N-Q is available on the EDGAR database on the Commission’s Internet Web site at http://www.sec.gov, and copies of this information may be obtained, upon payment of a duplicating fee, by electronic request at the following e-mail address: publicinfo@sec.gov or by writing the Public Reference Section at the above address.
A shareholder can also obtain the quarterly portfolio holdings report at mfs.com.
FEDERAL TAX INFORMATION (unaudited)
The funds will notify shareholders of amounts for use in preparing 2009 income tax forms in January 2010. The following information is provided pursuant to provisions of the Internal Revenue Code.
The funds below designate the following amounts as capital gain dividends paid during the fiscal year.
| Capital Gains | ||
| Alabama Fund | $285,506 | |
| Arkansas Fund | 963,292 | |
| Florida Fund | 90,456 | |
| Georgia Fund | 952,667 | |
| Maryland Fund | 401,842 | |
| Massachusetts Fund | 1,167,705 |
Of the dividends paid from net investment income during the fiscal year, the following percentages were designated as exempt interest dividends for federal income tax purposes. If each fund has earned income on private activity bonds, a portion of the dividends paid may be considered a tax preference item for purposes of computing a shareholder’s alternative minimum tax.
| Exempt Interest Dividends | ||
| Alabama Fund | 100.00% | |
| Arkansas Fund | 100.00% | |
| California Fund | 100.00% | |
| Florida Fund | 100.00% | |
| Georgia Fund | 100.00% | |
| Maryland Fund | 100.00% | |
| Massachusetts Fund | 100.00% |
82
Table of Contents
Privacy is a concern for every investor today. At MFS Investment Management® and the MFS funds, we take this concern very seriously. We want you to understand our policies about the investment products and services that we offer, and how we protect the nonpublic personal information of investors who have a direct relationship with us and our wholly owned subsidiaries.
Throughout our business relationship, you provide us with personal information. We maintain information and records about you, your investments, and the services you use. Examples of the nonpublic personal information we maintain include
| Ÿ | data from investment applications and other forms |
| Ÿ | share balances and transactional history with us, our affiliates, or others |
| Ÿ | facts from a consumer reporting agency |
We do not disclose any nonpublic personal information about our customers or former customers to anyone, except as permitted by law. We may share nonpublic personal information with third parties or certain of our affiliates in connection with servicing your account or processing your transactions. We may share information with companies or financial institutions that perform marketing services on our behalf or with other financial institutions with which we have joint marketing arrangements, subject to any legal requirements.
Authorization to access your nonpublic personal information is limited to appropriate personnel who provide products, services, or information to you. We maintain physical, electronic, and procedural safeguards to help protect the personal information we collect about you.
If you have any questions about the MFS privacy policy, please call 1-800-225-2606 any business day between 8 a.m. and 8 p.m. Eastern time.
Note: If you own MFS products or receive MFS services in the name of a third party such as a bank or broker-dealer, their privacy policy may apply to you instead of ours.
83
Table of Contents
CONTACT US
Web site
mfs.com
MFS TALK
1-800-637-8255
24 hours a day
Account service and literature
Shareholders
1-800-225-2606
Investment professionals
1-800-343-2829
Retirement plan services
1-800-637-1255
Mailing address
MFS Service Center, Inc.
P.O. Box 55824
Boston, MA 02205-5824
Overnight mail
MFS Service Center, Inc.
c/o Boston Financial Data Services
30 Dan Road
Canton, MA 02021-2809

Save paper with eDelivery. MFS® will send you prospectuses, reports, and proxies directly via e-mail so you will get information faster with less mailbox clutter. To sign up: 1. go to mfs.com. 2. log in via MFS® Access. 3. select eDelivery. If you own your MFS fund shares through a financial institution or a retirement plan, MFS® TALK, MFS Access, and eDelivery may not be available to you.

Table of Contents

Table of Contents
Mississippi, New York, North Carolina, Pennsylvania,
South Carolina, Tennessee, Virginia, and West Virginia
| CONTACT INFORMATION | BACK COVER |
SIPC Contact Information: You may obtain information about the Securities Investor Protection Corporation (“SIPC”), including the SIPC Brochure, by contacting SIPC either by telephone (202-371-8300) or by accessing SIPC’s website address (www.sipc.org).
The report is prepared for the general information of shareholders. It is authorized for distribution to prospective investors only when preceded or accompanied by a current prospectus.
NOT FDIC INSURED • MAY LOSE VALUE •
NO BANK GUARANTEE
Table of Contents

Dear Shareholders:
The market downturns and economic setbacks of late probably rank among the worst financial declines most of us have experienced. Inevitably, people may be questioning their commitment to investing. Still, it is important to remember that downturns are an inescapable part of the business cycle. Such troughs have been seen before, and if we can use history as a guide, market recoveries typically have followed.
Recent events have clearly shown us the value of certain types of investments. In this environment, two of the hallmarks of mutual funds — transparency and liquidity — have become critically important. Unlike some other types of investments, the operations of mutual funds are relatively transparent to their shareholders. With their daily redemption feature, mutual funds also generally provide easy, convenient access to one’s money. Through these recent market upheavals, this level of liquidity enhanced the ability of mutual fund investors to respond and modify their investments as they and their advisors saw fit — a flexibility that those in less liquid investments simply did not have at their disposal.
At MFS® we take particular pride in how well mutual funds can serve investors because we invented the mutual fund in the United States. Established in 1924, Massachusetts Investors Trust was the nation’s first fund. Recent market events only reinforce what we have learned through 85 years — that mutual funds provide unique features that are important to investors in any type of market climate.
Respectfully,

Robert J. Manning
Chief Executive Officer and Chief Investment Officer
MFS Investment Management®
May 15, 2009
The opinions expressed in this letter are subject to change, may not be relied upon for investment advice, and no forecasts can be guaranteed.
Before investing, consider the fund’s investment objectives, risks, charges, and expenses. For a prospectus containing this and other information, contact your investment professional or view online. Read it carefully.
MFS Fund Distributors, Inc., 500 Boylston Street, Boston, MA 02116
1
Table of Contents
MFS® Mississippi Municipal Bond Fund
Portfolio structure (i)

| Top five industries (i) | ||
| State & Local Agencies | 19.3% | |
| Universities – Colleges | 15.1% | |
| Water & Sewer Utility Revenue | 13.7% | |
| Healthcare Revenue – Hospitals | 13.4% | |
| General Obligations – General Purpose | 8.2% | |
| Credit quality of bonds (r) | ||
| AAA | 10.4% | |
| AA | 39.2% | |
| A | 25.7% | |
| BBB | 22.3% | |
| B | 0.1% | |
| Not Rated | 2.3% | |
| Portfolio facts | ||
| Average Duration (d)(i) | 8.5 | |
| Average Life (i)(m) | 14.9 yrs. | |
| Average Maturity (i)(m) | 18.4 yrs. | |
| Average Credit Quality of Rated Securities (long-term) (a) | A+ | |
MFS® New York Municipal Bond Fund
Portfolio structure (i)

| Top five industries (i) | ||
| State & Local Agencies | 14.6% | |
| Universities – Colleges | 13.0% | |
| Water & Sewer Utility Revenue | 11.4% | |
| Transportation – Special Tax | 9.4% | |
| Healthcare Revenue – Hospitals | 7.8% | |
| Credit quality of bonds (r) | ||
| AAA | 9.2% | |
| AA | 46.9% | |
| A | 31.0% | |
| BBB | 9.4% | |
| BB | 0.9% | |
| B | 0.5% | |
| CCC (o) | 0.0% | |
| Not Rated | 2.1% | |
| Portfolio facts | ||
| Average Duration (d)(i) | 9.6 | |
| Average Life (i)(m) | 18.3 yrs. | |
| Average Maturity (i)(m) | 20.9 yrs. | |
| Average Credit Quality of Rated Securities (long-term) (a) | A+ | |
MFS® North Carolina Municipal Bond Fund
Portfolio structure (i)

| Top five industries (i) | ||
| Universities – Colleges | 22.4% | |
| Healthcare Revenue – Hospitals | 16.1% | |
| Utilities – Municipal owned | 14.6% | |
| Water & Sewer Utility Revenue | 9.7% | |
| State & Agency – Other | 5.8% | |
| Credit quality of bonds (r) | ||
| AAA | 14.4% | |
| AA | 54.9% | |
| A | 16.2% | |
| BBB | 11.9% | |
| BB | 0.5% | |
| Not Rated | 2.1% | |
| Portfolio facts | ||
| Average Duration (d)(i) | 8.7 | |
| Average Life (i)(m) | 16.0 yrs. | |
| Average Maturity (i)(m) | 18.7 yrs. | |
| Average Credit Quality of Rated Securities (long-term) (a) | AA- | |
| (a) | The average credit quality of rated securities is based upon a market weighted average of portfolio holdings that are rated by public rating agencies. |
| (d) | Duration is a measure of how much a bond’s price is likely to fluctuate with general changes in interest rates, e.g., if rates rise 1.00%, a bond with a 5-year duration is likely to lose about 5.00% of its value. |
| (i) | For purposes of this presentation, the bond component includes accrued interest amounts and may be positively or negatively impacted by the equivalent exposure from any derivative holdings, if applicable. |
| (m) | The average maturity shown is calculated using the final stated maturity on the portfolio’s holdings without taking into account any holdings which have been pre-refunded or pre-paid to an earlier date or which have a mandatory put date prior to the stated maturity. The average life shown takes into account these earlier dates. |
| (o) | Less than 0.1%. |
| (r) | Each security is assigned a rating from Moody’s Investors Service. If not rated by Moody’s, the rating will be that assigned by Standard & Poor’s. Likewise, if not assigned a rating by Standard & Poor’s, it will be based on the rating assigned by Fitch, Inc. For those portfolios that hold a security which is not rated by any of the three agencies, the security is considered Not Rated. Holdings in U.S. Treasuries and government agency mortgage-backed securities, if any, are included in the “AAA”-rating category. Percentages are based on the total market value of investments as of 3/31/09. |
Percentages are based on net assets as of 3/31/09, unless otherwise noted.
The portfolio is actively managed and current holdings may be different.
2
Table of Contents
Portfolio Composition – continued
MFS® Pennsylvania Municipal Bond Fund
Portfolio structure (i)

| Top five industries (i) | ||
| General Obligations – Schools | 20.4% | |
| Healthcare Revenue – Hospitals | 15.4% | |
| Universities – Colleges | 14.3% | |
| Water & Sewer Utility Revenue | 9.6% | |
General Obligations – General Purpose | 8.8% | |
| Credit quality of bonds (r) | ||
| AAA | 1.6% | |
| AA | 48.9% | |
| A | 19.6% | |
| BBB | 26.3% | |
| BB | 0.8% | |
| Not Rated | 2.8% | |
| Portfolio facts | ||
| Average Duration (d)(i) | 9.0 | |
| Average Life (i)(m) | 15.8 yrs. | |
| Average Maturity (i)(m) | 18.7 yrs. | |
| Average Credit Quality of Rated Securities (long-term) (a) | A+ | |
MFS® South Carolina Municipal Bond Fund
Portfolio structure (i)

| Top five industries (i) | ||
| Healthcare Revenue – Hospitals | 16.5% | |
| Universities – Colleges | 14.4% | |
| Water & Sewer Utility Revenue | 14.1% | |
| General Obligations – Schools | 8.7% | |
| Utilities – Municipal owned | 8.1% | |
| Credit quality of bonds (r) | ||
| AAA | 11.4% | |
| AA | 45.4% | |
| A | 26.6% | |
| BBB | 13.8% | |
| BB | 0.3% | |
| B | 0.5% | |
| Not Rated | 2.0% | |
| Portfolio facts | ||
| Average Duration (d)(i) | 8.8 | |
| Average Life (i)(m) | 16.7 yrs. | |
| Average Maturity (i)(m) | 19.0 yrs. | |
| Average Credit Quality of Rated Securities (long-term) (a) | AA- | |
MFS® Tennessee Municipal Bond Fund
Portfolio structure (i)

| Top five industries (i) | ||
| Water & Sewer Utility Revenue | 16.3% | |
| Healthcare Revenue – Hospitals | 14.7% | |
| Single Family Housing – State | 11.6% | |
| State & Local Agencies | 11.1% | |
| Utilities – Municipal owned | 10.3% | |
| Credit quality of bonds (r) | ||
| AAA | 8.2% | |
| AA | 65.8% | |
| A | 8.2% | |
| BBB | 14.7% | |
| BB | 1.2% | |
| B | 0.1% | |
| Not Rated | 1.8% | |
| Portfolio facts | ||
| Average Duration (d)(i) | 9.4 | |
| Average Life (i)(m) | 16.9 yrs. | |
| Average Maturity (i)(m) | 20.1 yrs. | |
| Average Credit Quality of Rated Securities (long-term) (a) | AA- | |
| (a) | The average credit quality of rated securities is based upon a market weighted average of portfolio holdings that are rated by public rating agencies. |
| (d) | Duration is a measure of how much a bond’s price is likely to fluctuate with general changes in interest rates, e.g., if rates rise 1.00%, a bond with a 5-year duration is likely to lose about 5.00% of its value. |
| (i) | For purposes of this presentation, the bond component includes accrued interest amounts and may be positively or negatively impacted by the equivalent exposure from any derivative holdings, if applicable. |
| (m) | The average maturity shown is calculated using the final stated maturity on the portfolio’s holdings without taking into account any holdings which have been pre-refunded or pre-paid to an earlier date or which have a mandatory put date prior to the stated maturity. The average life shown takes into account these earlier dates. |
| (r) | Each security is assigned a rating from Moody’s Investors Service. If not rated by Moody’s, the rating will be that assigned by Standard & Poor’s. Likewise, if not assigned a rating by Standard & Poor’s, it will be based on the rating assigned by Fitch, Inc. For those portfolios that hold a security which is not rated by any of the three agencies, the security is considered Not Rated. Holdings in U.S. Treasuries and government agency mortgage-backed securities, if any, are included in the “AAA”-rating category. Percentages are based on the total market value of investments as of 3/31/09. |
Percentages are based on net assets as of 3/31/09, unless otherwise noted.
The portfolio is actively managed and current holdings may be different.
3
Table of Contents
Portfolio Composition – continued
MFS® Virginia Municipal Bond Fund
Portfolio structure (i)

| Top five industries (i) | ||
| Water & Sewer Utility Revenue | 24.3% | |
| Healthcare Revenue – Hospitals | 12.7% | |
| State & Local Agencies | 12.0% | |
| Universities – Colleges | 6.5% | |
| Multi-Family Housing Revenue | 6.0% | |
| Credit quality of bonds (r) | ||
| AAA | 22.2% | |
| AA | 39.4% | |
| A | 16.5% | |
| BBB | 16.8% | |
| BB | 1.2% | |
| B | 0.3% | |
| D (o) | 0.0% | |
| Not Rated | 3.6% | |
| Portfolio facts | ||
| Average Duration (d)(i) | 9.1 | |
| Average Life (i)(m) | 16.9 yrs. | |
| Average Maturity (i)(m) | 19.6 yrs. | |
| Average Credit Quality of Rated Securities (long-term) (a) | AA- | |
MFS® West Virginia Municipal Bond Fund
Portfolio structure (i)

| Top five industries (i) | ||
| State & Local Agencies | 20.2% | |
| Universities – Colleges | 18.8% | |
| Water & Sewer Utility Revenue | 15.6% | |
| General Obligations – General Purpose | 15.5% | |
| Healthcare Revenue – Hospitals | 9.2% | |
| Credit quality of bonds (r) | ||
| AAA | 8.5% | |
| AA | 17.7% | |
| A | 39.9% | |
| BBB | 31.8% | |
| B | 0.6% | |
| Not Rated | 1.5% | |
| Portfolio facts | ||
| Average Duration (d)(i) | 8.5 | |
| Average Life (i)(m) | 15.4 yrs. | |
| Average Maturity (i)(m) | 17.5 yrs. | |
| Average Credit Quality of Rated Securities (long-term) (a) | A | |
| (a) | The average credit quality of rated securities is based upon a market weighted average of portfolio holdings that are rated by public rating agencies. |
| (d) | Duration is a measure of how much a bond’s price is likely to fluctuate with general changes in interest rates, e.g., if rates rise 1.00%, a bond with a 5-year duration is likely to lose about 5.00% of its value. |
| (i) | For purposes of this presentation, the bond component includes accrued interest amounts and may be positively or negatively impacted by the equivalent exposure from any derivative holdings, if applicable. |
| (m) | The average maturity shown is calculated using the final stated maturity on the portfolio’s holdings without taking into account any holdings which have been pre-refunded or pre-paid to an earlier date or which have a mandatory put date prior to the stated maturity. The average life shown takes into account these earlier dates. |
| (o) | Less than 0.1%. |
| (r) | Each security is assigned a rating from Moody’s Investors Service. If not rated by Moody’s, the rating will be that assigned by Standard & Poor’s. Likewise, if not assigned a rating by Standard & Poor’s, it will be based on the rating assigned by Fitch, Inc. For those portfolios that hold a security which is not rated by any of the three agencies, the security is considered Not Rated. Holdings in U.S. Treasuries and government agency mortgage-backed securities, if any, are included in the “AAA”-rating category. Percentages are based on the total market value of investments as of 3/31/09. |
Percentages are based on net assets as of 3/31/09, unless otherwise noted.
The portfolio is actively managed and current holdings may be different.
4
Table of Contents
Market environment
The global economy and financial markets experienced substantial deterioration and extraordinary volatility over the reporting period. Strong headwinds in the U.S. included accelerated deterioration in the housing market, anemic corporate investment, a rapidly declining job market, and a much tighter credit environment. During the period, a seemingly continuous series of tumultuous financial events hammered markets, including: the distressed sale of failing Bear Stearns to JPMorgan, the conservatorship of Government Sponsored Enterprises (GSEs) Fannie Mae and Freddie Mac, the bankruptcy of investment bank Lehman Brothers, the Federal Reserve Bank’s complex intervention of insurance company American International Group (AIG), the nationalization of several large European banks, the failure of Washington Mutual, the distressed sale of Wachovia, the virtual failure of Iceland’s banking sector, and the collapse of the global auto industry. As a result of this barrage of turbulent news, global equity markets pushed significantly lower and credit markets witnessed the worst dislocation since the beginning of the credit crisis. Though credit conditions and equity indices improved towards the end of the period, the state of financial and macroeconomic dislocation remained very severe.
While somewhat resilient during the first half of the period, the global economy and financial system increasingly experienced considerable negative spillovers from the U.S. slowdown. Not only did Europe and Japan show obvious signs of economic decline, the more powerful engine of global growth – emerging markets – also displayed weakening dynamics. The synchronized global downturn in economic activity experienced in the fourth quarter of 2008 and the first quarter of 2009 was among the most intense in the post-World War II period.
During the reporting period, the U.S. Federal Reserve Board cut interest rates aggressively and introduced a multitude of new lending facilities to alleviate ever-tightening credit markets, while the U.S. federal government designed and implemented fiscal stimulus packages. Although several other global central banks also cut rates during the early part of the reporting period, the dilemma of rising energy and food prices heightened concerns among central bankers that inflationary expectations might become unhinged despite weaker growth. Only later in the reporting period did rapidly slowing global growth result in a very precipitous decline in commodity prices, which significantly eased inflation and inflationary expectations. As inflationary concerns diminished in the face of global deleveraging, and equity and credit markets deteriorated more sharply, a coordinated rate cut marked the beginning of much more aggressive easing by the major global central banks. By the end of the period, several central banks had approached their lower bound on policy rates and were examining the implementation and ramifications of quantitative easing as a means to further loosen monetary policy to offset the continuing fall in global wealth.
The twelve months ended March 31, 2009 was a challenging period for the municipal bond market. During the first nine months of the fiscal year, the municipal bond market faced an unprecedented number of challenges which lead to a broad-based decline in bond prices, an increase in yields, and a significant increase in spreads between higher-rated securities and lower-rated or non-rated securities. Among the many factors leading to the decline in prices and the widening in credit spreads was the monoline bond insurers being downgraded from their AAA rating by at least one of the major credit rating services. This decline in credit rating led to an unwind in leverage by non-traditional participants in the municipal bond market which, when combined with a general deterioration in credit quality, led to a widening of credit spreads between higher-rated and lower-rated securities and, finally, significant redemptions by investors out of municipal bond mutual funds. However, after the turn of the calendar year, the supply-demand imbalance shifted. Mutual funds began to experience inflows and direct retail buying re-emerged. These factors, combined with a decline in the pace of leverage unwinds and expectations that the market provisions contained within the American Reinvestment and Recovery Act would provide support for the municipal market, led to a significant rebound in prices and a decline in yields.
Factors that affected performance
During the reporting period, duration (d) positioning relative to the Barclays Capital Municipal Bond Index had a negative effect on relative performance for all funds except the Mississippi, North Carolina, Tennessee, and Virginia funds where the effect was positive.
Yield curve (y) positioning had a negative impact on relative performance for all funds with the exception of the North Carolina Fund where the effect was neutral. In comparison to the benchmark, the negative impact on the funds noted above was mainly a result of the funds’ greater exposure to the middle part of the curve (represented by bonds with durations of 11- to 14- years). Credit quality also had a negative effect on the performance of all funds except the North Carolina Fund where the effect was neutral. This negative impact can be attributed to overweighted positions in “BBB” rated (s) bonds relative to the index.
Among the industry sectors, health care and industrials were notable detractors. The health care sector held back returns for the New York, Pennsylvania, South Carolina, Tennessee, and Virginia funds while the industrials sector hurt all funds except the Tennessee and West Virginia funds where the effect was neutral. The pre-refunded bond sector was another negative for all funds except for the Mississippi and South Carolina funds where the effect was neutral. Additionally, exposure to the general obligations sector had a negative impact on the Mississippi, Tennessee, Virginia, and West Virginia funds.
5
Table of Contents
Management Review – continued
On the positive side, a lesser exposure to the tobacco sector boosted relative performance for all the funds. The transportation sector aided performance for all funds with the exception of the New York Fund where the effect was negative and the Virginia Fund where the effect was neutral.
Respectfully,
Michael Dawson
Portfolio Manager
| (d) | Duration is a measure of how much a bond’s price is likely to fluctuate with general changes in interest rates, e.g., if rates rise 1.00%, a bond with a 5-year duration is likely to lose about 5.00% of its value. |
(s) | Bonds rated “BBB”, “Baa”, or higher are considered investment grade; bonds rated “BB”, “Ba”, or below are considered non-investment grade. The primary source for bond quality ratings is Moody’s Investors Service. If not available, ratings by Standard & Poor’s are used, else ratings by Fitch, Inc. For securities which are not rated by any of the three agencies, the security is considered Not Rated. |
(y) | A yield curve graphically depicts the yields of different maturity bonds of the same credit quality and type. A normal yield curve is upward-sloping, with short term-rates lower than long term rates. |
The views expressed in this report are those of the portfolio manager only through the end of the period of the report as stated on the cover and do not necessarily reflect the views of MFS or any other person in the MFS organization. These views are subject to change at any time based on market or other conditions, and MFS disclaims any responsibility to update such views. These views may not be relied upon as investment advice or an indication of trading intent on behalf of any MFS portfolio. References to specific securities are not recommendations of such securities, and may not be representative of any MFS portfolio’s current or future investments.
6
Table of Contents
PERFORMANCE SUMMARY THROUGH 3/31/09
The following charts illustrate a representative class of each fund’s historical performance in comparison to its benchmark(s). Performance results include the deduction of the maximum applicable sales charge and reflect the percentage change in net asset value, including reinvestment of dividends and capital gains distributions. Each fund’s results have been compared to the Barclays Capital Municipal Bond Index (formerly known as Lehman Brothers Municipal Bond Index), a market-value-weighted index representative of the tax-exempt bond market. However, while this index is considered the benchmark for the performance of municipal bond funds, it is comprised of municipal bonds issued nationwide, while each of the funds is limited to investing in the bonds of a particular state. The performance of other share classes will be greater than or less than that of the class depicted below. Benchmarks are unmanaged and may not be invested in directly. Benchmark returns do not reflect sales charges, commissions or expenses. (See Notes to Performance Summary.)
Performance data shown represents past performance and is no guarantee of future results. Investment return and principal value fluctuate so your shares, when sold, may be worth more or less than the original cost; current performance may be lower or higher than quoted. The performance shown does not reflect the deduction of taxes, if any, that a shareholder would pay on fund distributions or the redemption of fund shares.
MFS® Mississippi Municipal Bond Fund
Growth of a hypothetical $10,000 investment
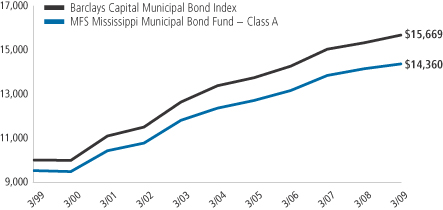
MFS® Mississippi Municipal Bond Fund
Average annual total returns through 3/31/09
Without sales charge
Share class | Class inception date | 1-yr | 5-yr | 10-yr | ||||||||
A | 8/06/92 | 1.47% | 3.04% | 4.19% | ||||||||
B | 9/07/93 | 0.80% | 2.28% | 3.38% |
Comparative benchmark
Barclays Capital Municipal Bond Index (f) | 2.27% | 3.21% | 4.59% | |||||||||
With sales charge
A With Initial Sales Charge (4.75%) | (3.35)% | 2.04% | 3.68% | |||||||||
B With CDSC (Declining over six years from 4% to 0%) (x) | (3.09)% | 1.94% | 3.38% | |||||||||
CDSC – Contingent Deferred Sales Charge.
| (f) | Source: FactSet Research Systems Inc. |
| (x) | Assuming redemption at the end of the applicable period. |
7
Table of Contents
Performance Summary – continued
MFS® New York Municipal Bond Fund
Growth of a hypothetical $10,000 investment
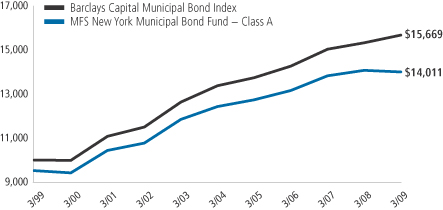
MFS® New York Municipal Bond Fund
Average annual total returns through 3/31/09
Without sales charge
Share class | Class inception date | 1-yr | 5-yr | 10-yr | ||||||||
A | 6/06/88 | (0.46)% | 2.42% | 3.93% | ||||||||
B | 9/07/93 | (1.23)% | 1.67% | 3.13% | ||||||||
C | 12/11/00 | (1.22)% | 1.67% | 3.14% |
Comparative benchmark
Barclays Capital Municipal Bond Index (f) | 2.27% | 3.21% | 4.59% | |||||||||
With sales charge
A With Initial Sales Charge (4.75%) | (5.19)% | 1.43% | 3.43% | |||||||||
B With CDSC (Declining over six years from 4% to 0%) (x) | (5.01)% | 1.33% | 3.13% | |||||||||
C With CDSC (1% for 12 months) (x) | (2.16)% | 1.67% | 3.14% | |||||||||
CDSC – Contingent Deferred Sales Charge.
| (f) | Source: FactSet Research Systems, Inc. |
| (x) | Assuming redemption at the end of the applicable period. |
8
Table of Contents
Performance Summary – continued
MFS® North Carolina Municipal Bond Fund
Growth of a hypothetical $10,000 investment

MFS® North Carolina Municipal Bond Fund
Average annual total returns through 3/31/09
Without sales charge
| Share class | Class inception date | 1-yr | 5-yr | 10-yr | ||||||||
| A | 10/31/84 | 2.22% | 2.65% | 3.90% | ||||||||
| B | 9/07/93 | 1.63% | 1.98% | 3.23% | ||||||||
| C | 1/03/94 | 1.63% | 2.00% | 3.24% |
Comparative benchmark
| Barclays Capital Municipal Bond Index (f) | 2.27% | 3.21% | 4.59% | |||||||||
With sales charge
A With Initial Sales Charge (4.75%) | (2.64)% | 1.66% | 3.40% | |||||||||
B With CDSC (Declining over six years from 4% to 0%) (x) | (2.27)% | 1.65% | 3.23% | |||||||||
C With CDSC (1% for 12 months) (x) | 0.66% | 2.00% | 3.24% | |||||||||
CDSC – Contingent Deferred Sales Charge.
| (f) | Source: FactSet Research Systems Inc. |
| (x) | Assuming redemption at the end of the applicable period. |
9
Table of Contents
Performance Summary – continued
MFS® Pennsylvania Municipal Bond Fund
Growth of a hypothetical $10,000 investment
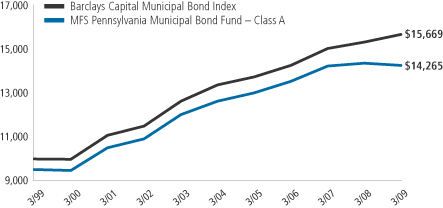
MFS® Pennsylvania Municipal Bond Fund
Average annual total returns through 3/31/09
Without sales charge
| Share class | Class inception date | 1-yr | 5-yr | 10-yr | ||||||||
| A | 2/01/93 | (0.69)% | 2.46% | 4.12% | ||||||||
| B | 9/07/93 | (1.42)% | 1.69% | 3.31% |
Comparative benchmark
| Barclays Capital Municipal Bond Index (f) | 2.27% | 3.21% | 4.59% | |||||||||
With sales charge
A With Initial Sales Charge (4.75%) | (5.40)% | 1.47% | 3.62% | |||||||||
B With CDSC (Declining over six years from 4% to 0%) (x) | (5.22)% | 1.35% | 3.31% | |||||||||
CDSC – Contingent Deferred Sales Charge.
| (f) | Source: FactSet Research Systems Inc. |
| (x) | Assuming redemption at the end of the applicable period. |
10
Table of Contents
Performance Summary – continued
MFS® South Carolina Municipal Bond Fund
Growth of a hypothetical $10,000 investment
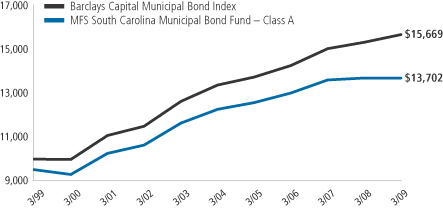
MFS® South Carolina Municipal Bond Fund
Average annual total returns through 3/31/09
Without sales charge
| Share class | Class inception date | 1-yr | 5-yr | 10-yr | ||||||||
| A | 10/31/84 | 0.03% | 2.23% | 3.70% | ||||||||
| B | 9/07/93 | (0.54)% | 1.58% | 3.04% |
Comparative benchmark
| Barclays Capital Municipal Bond Index (f) | 2.27% | 3.21% | 4.59% | |||||||||
With sales charge
A With Initial Sales Charge (4.75%) | (4.72)% | 1.24% | 3.20% | |||||||||
B With CDSC (Declining over six years from 4% to 0%) (x) | (4.37)% | 1.24% | 3.04% | |||||||||
CDSC – Contingent Deferred Sales Charge.
| (f) | Source: FactSet Research Systems, Inc. |
| (x) | Assuming redemption at the end of the applicable period. |
11
Table of Contents
Performance Summary – continued
MFS® Tennessee Municipal Bond Fund
Growth of a hypothetical $10,000 investment

MFS® Tennessee Municipal Bond Fund
Average annual total returns through 3/31/09
Without sales charge
| Share class | Class inception date | 1-yr | 5-yr | 10-yr | ||||||||
| A | 8/12/88 | 0.84% | 2.45% | 3.74% | ||||||||
| B | 9/07/93 | 0.17% | 1.79% | 3.07% |
Comparative benchmark
| Barclays Capital Municipal Bond Index (f) | 2.27% | 3.21% | 4.59% | |||||||||
With sales charge
A With Initial Sales Charge (4.75%) | (3.95)% | 1.46% | 3.23% | |||||||||
B With CDSC (Declining over six years from 4% to 0%) (x) | (3.67)% | 1.45% | 3.07% | |||||||||
CDSC – Contingent Deferred Sales Charge.
| (f) | Source: FactSet Research Systems Inc. |
| (x) | Assuming redemption at the end of the applicable period. |
12
Table of Contents
Performance Summary – continued
MFS® Virginia Municipal Bond Fund
Growth of a hypothetical $10,000 investment
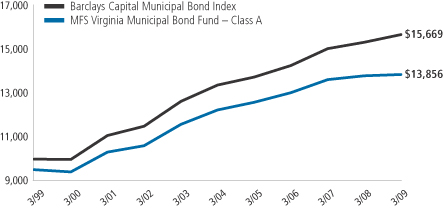
MFS® Virginia Municipal Bond Fund
Average annual total returns through 3/31/09
Without sales charge
| Share class | Class inception date | 1-yr | 5-yr | 10-yr | ||||||||
| A | 10/31/84 | 0.40% | 2.51% | 3.82% | ||||||||
| B | 9/07/93 | (0.26)% | 1.84% | 3.14% | ||||||||
| C | 1/03/94 | (0.17)% | 1.86% | 3.15% |
Comparative benchmark
| Barclays Capital Municipal Bond Index (f) | 2.27% | 3.21% | 4.59% | |||||||||
With sales charge
A With Initial Sales Charge (4.75%) | (4.37)% | 1.51% | 3.32% | |||||||||
B With CDSC (Declining over six years from 4% to 0%) (x) | (4.07)% | 1.50% | 3.14% | |||||||||
C With CDSC (1% for 12 months) (x) | (1.12)% | 1.86% | 3.15% | |||||||||
CDSC – Contingent Deferred Sales Charge.
| (f) | Source: FactSet Research Systems, Inc. |
| (x) | Assuming redemption at the end of the applicable period. |
13
Table of Contents
Performance Summary – continued
MFS® West Virginia Municipal Bond Fund
Growth of a hypothetical $10,000 investment
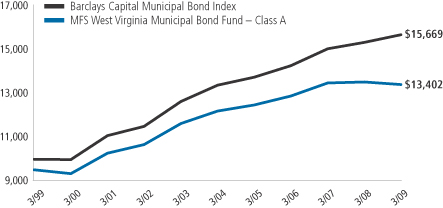
MFS® West Virginia Municipal Bond Fund
Average annual total returns through 3/31/09
Without sales charge
| Share class | Class inception date | 1-yr | 5-yr | 10-yr | ||||||||
| A | 10/31/84 | (0.87)% | 1.89% | 3.47% | ||||||||
| B | 9/07/93 | (1.52)% | 1.23% | 2.81% |
Comparative benchmark
| Barclays Capital Municipal Bond Index (f) | 2.27% | 3.21% | 4.59% | |||||||||
With sales charge
A With Initial Sales Charge (4.75%) | (5.58)% | 0.91% | 2.97% | |||||||||
B With CDSC (Declining over six years from 4% to 0%) (x) | (5.29)% | 0.90% | 2.81% | |||||||||
CDSC – Contingent Deferred Sales Charge.
| (f) | Source: FactSet Research Systems Inc. |
| (x) | Assuming redemption at the end of the applicable period. |
Notes to Performance Summary
Performance results reflect any applicable expense subsidies and waivers in effect during the periods shown. Without such subsidies and waivers each fund’s performance results would be less favorable. Please see the prospectus and financial statements for complete details.
A portion of income may be subject to state, federal, and/or alternative minimum tax. Capital gains, if any, are subject to a capital gains tax.
From time to time the funds may receive proceeds from litigation settlements, without which performance would be lower.
For the MFS New York Municipal Bond Fund only:
Performance for class C shares includes the performance of the fund’s class B shares for periods prior to their offering. This blended class performance has been adjusted to take into account differences in sales loads, if any, applicable to these share classes, but has not been adjusted to take into account differences in class specific operating expenses (such as Rule 12b-1 fees). Compared to performance these share classes would have experienced had they been offered for the entire period, the use of blended performance generally results in higher performance for share classes with higher operating expenses than the share class to which it is blended, and lower performance for share classes with lower operating expenses than the share class to which it is blended.
14
Table of Contents
Fund expenses borne by the shareholders during the period, October 1, 2008 through March 31, 2009
As a shareholder of the funds, you incur two types of costs: (1) transaction costs, including sales charges (loads) on certain purchase or redemption payments, and (2) ongoing costs, including management fees; distribution and service (12b-1) fees; and other fund expenses. These examples are intended to help you understand your ongoing costs (in dollars) of investing in the funds and to compare these costs with the ongoing costs of investing in other mutual funds.
These examples are based on an investment of $1,000 invested at the beginning of the period and held for the entire period October 1, 2008 through March 31, 2009.
Actual expenses
The first line for each share class in the following tables provides information about actual account values and actual expenses. You may use the information in this line, together with the amount you invested, to estimate the expenses that you paid over the period. Simply divide your account value by $1,000 (for example, an $8,600 account value divided by $1,000 = 8.6), then multiply the result by the number in the first line under the heading entitled “Expenses Paid During Period” to estimate the expenses you paid on your account during this period.
Hypothetical example for comparison purposes
The second line for each share class in the following tables provides information about hypothetical account values and hypothetical expenses based on each fund’s actual expense ratio and an assumed rate of return of 5% per year before expenses, which is not each fund’s actual return. The hypothetical account values and expenses may not be used to estimate the actual ending account balance or expenses you paid for the period. You may use this information to compare the ongoing costs of investing in each fund and other funds. To do so, compare this 5% hypothetical example with the 5% hypothetical examples that appear in the shareholder reports of the other funds.
Please note that the expenses shown in the tables are meant to highlight your ongoing costs only and do not reflect any transactional costs, such as sales charges (loads). Therefore, the second line for each share class in the tables is useful in comparing ongoing costs only, and will not help you determine the relative total costs of owning different funds. In addition, if these transactional costs were included, your costs would have been higher.
MFS® MISSISSIPPI MUNICIPAL BOND FUND
| Share Class | Annualized Expense Ratio | Beginning Account Value 10/01/08 | Ending Account Value 3/31/09 | Expenses Paid During Period (p) 10/01/08-3/31/09 | ||||||
| A | Actual | 0.58% | $1,000.00 | $1,044.19 | $2.96 | |||||
| Hypothetical (h) | 0.58% | $1,000.00 | $1,022.04 | $2.92 | ||||||
| B | Actual | 1.35% | $1,000.00 | $1,040.17 | $6.87 | |||||
| Hypothetical (h) | 1.35% | $1,000.00 | $1,018.20 | $6.79 |
Expense Changes Impacting the Table
Changes to the fund’s fee arrangements occurred during the six month period. Had these fee changes been in effect throughout the entire six month period, the annualized expense ratios would have been 0.71% for Class A and 1.48% for Class B shares; the actual expenses paid during the period would have been approximately $3.62 for Class A and $7.52 for Class B shares; and the hypothetical expenses paid during the period would have been approximately $3.58 for Class A and $7.44 for Class B shares. For further information about the fund’s fee arrangements and changes to those fee arrangements, please see Note 3 in the Notes to Financial Statements.
| (h) | 5% class return per year before expenses. |
| (p) | Expenses paid is equal to each class’ annualized expense ratio, as shown above, multiplied by the average account value over the period, multiplied by the number of days in the period, divided by the number of days in the year. Expenses paid do not include any applicable sales charges (loads). If these transaction costs had been included, your costs would have been higher. |
15
Table of Contents
Expense Tables – continued
MFS® NEW YORK MUNICIPAL BOND FUND
| Share Class | Annualized Expense Ratio | Beginning Account Value 10/01/08 | Ending Account Value 3/31/09 | Expenses Paid During Period (p) 10/01/08-3/31/09 | ||||||
| A | Actual | 0.78% | $1,000.00 | $1,035.26 | $3.96 | |||||
| Hypothetical (h) | 0.78% | $1,000.00 | $1,021.04 | $3.93 | ||||||
| B | Actual | 1.51% | $1,000.00 | $1,031.39 | $7.65 | |||||
| Hypothetical (h) | 1.51% | $1,000.00 | $1,017.40 | $7.59 | ||||||
| C | Actual | 1.52% | $1,000.00 | $1,031.37 | $7.70 | |||||
| Hypothetical (h) | 1.52% | $1,000.00 | $1,017.35 | $7.64 |
Expense Changes Impacting the Table
Changes to the fund’s fee arrangements occurred during the six month period. Had these fee changes been in effect throughout the entire six month period, the annualized expense ratios would have been 0.90% for Class A and 1.64% for Class B and Class C shares; the actual expenses paid during the period would have been approximately $4.56 for Class A and $8.30 for Class B and Class C shares; and the hypothetical expenses paid during the period would have been approximately $4.53 for Class A and $8.25 for Class B and Class C shares. For further information about the fund’s fee arrangements and changes to those fee arrangements, please see Note 3 in the Notes to Financial Statements.
MFS® NORTH CAROLINA MUNICIPAL BOND FUND
| Share Class | Annualized Expense Ratio | Beginning Account Value 10/01/08 | Ending Account Value 3/31/09 | Expenses Paid During Period (p) 10/01/08-3/31/09 | ||||||
| A | Actual | 0.89% | $1,000.00 | $1,047.63 | $4.54 | |||||
| Hypothetical (h) | 0.89% | $1,000.00 | $1,020.49 | $4.48 | ||||||
| B | Actual | 1.54% | $1,000.00 | $1,045.12 | $7.85 | |||||
| Hypothetical (h) | 1.54% | $1,000.00 | $1,017.25 | $7.75 | ||||||
| C | Actual | 1.56% | $1,000.00 | $1,045.09 | $7.95 | |||||
| Hypothetical (h) | 1.56% | $1,000.00 | $1,017.15 | $7.85 |
Expense Changes Impacting the Table
Changes to the fund’s fee arrangements occurred during the six month period. Had these fee changes been in effect throughout the entire six month period, the annualized expense ratios would have been 0.93% for Class A, 1.67% for Class B and 1.68% for Class C shares; the actual expenses paid during the period would have been approximately $4.75 for Class A, $8.51 for Class B and $8.56 for Class C shares; and the hypothetical expenses paid during the period would have been approximately $4.68 for Class A, $8.40 for Class B and $8.45 for Class C shares. For further information about the fund’s fee arrangements and changes to those fee arrangements, please see Note 3 in the Notes to Financial Statements.
| (h) | 5% class return per year before expenses. |
| (p) | Expenses paid is equal to each class’ annualized expense ratio, as shown above, multiplied by the average account value over the period, multiplied by the number of days in the period, divided by the number of days in the year. Expenses paid do not include any applicable sales charges (loads). If these transaction costs had been included, your costs would have been higher. |
16
Table of Contents
Expense Tables – continued
MFS® PENNSYLVANIA MUNICIPAL BOND FUND
| Share Class | Annualized Expense Ratio | Beginning Account Value 10/01/08 | Ending Account Value 3/31/09 | Expenses Paid During Period (p) 10/01/08-3/31/09 | ||||||
| A | Actual | 0.68% | $1,000.00 | $1,032.33 | $3.45 | |||||
| Hypothetical (h) | 0.68% | $1,000.00 | $1,021.54 | $3.43 | ||||||
| B | Actual | 1.42% | $1,000.00 | $1,028.45 | $7.18 | |||||
| Hypothetical (h) | 1.42% | $1,000.00 | $1,017.85 | $7.14 |
Expense Changes Impacting the Table
Changes to the fund’s fee arrangements occurred during the six month period. Had these fee changes been in effect throughout the entire six month period, the annualized expense ratios would have been 0.80% for Class A and 1.55% for Class B shares; the actual expenses paid during the period would have been approximately $4.05 for Class A and $7.83 for Class B shares; and the hypothetical expenses paid during the period would have been approximately $4.03 for Class A and $7.80 for Class B shares. For further information about the fund’s fee arrangements and changes to those fee arrangements, please see Note 3 in the Notes to Financial Statements.
MFS® SOUTH CAROLINA MUNICIPAL BOND FUND
| Share Class | Annualized Expense Ratio | Beginning Account Value 10/01/08 | Ending Account Value 3/31/09 | Expenses Paid During Period (p) 10/01/08-3/31/09 | ||||||
| A | Actual | 0.90% | $1,000.00 | $1,036.69 | $4.57 | |||||
| Hypothetical (h) | 0.90% | $1,000.00 | $1,020.44 | $4.53 | ||||||
| B | Actual | 1.56% | $1,000.00 | $1,034.18 | $7.91 | |||||
| Hypothetical (h) | 1.56% | $1,000.00 | $1,017.15 | $7.85 |
Expense Changes Impacting the Table
Changes to the fund’s fee arrangements occurred during the six month period. Had these fee changes been in effect throughout the entire six month period, the annualized expense ratios would have been 0.94% for Class A and 1.68% for Class B shares; the actual expenses paid during the period would have been approximately $4.77 for Class A and $8.52 for Class B shares; and the hypothetical expenses paid during the period would have been approximately $4.73 for Class A and $8.45 for Class B shares. For further information about the fund’s fee arrangements and changes to those fee arrangements, please see Note 3 in the Notes to Financial Statements.
MFS® TENNESSEE MUNICIPAL BOND FUND
| Share Class | Annualized Expense Ratio | Beginning Account Value 10/01/08 | Ending Account Value 3/31/09 | Expenses Paid During Period (p) 10/01/08-3/31/09 | ||||||
| A | Actual | 0.90% | $1,000.00 | $1,037.31 | $4.57 | |||||
| Hypothetical (h) | 0.90% | $1,000.00 | $1,020.44 | $4.53 | ||||||
| B | Actual | 1.56% | $1,000.00 | $1,033.86 | $7.91 | |||||
| Hypothetical (h) | 1.56% | $1,000.00 | $1,017.15 | $7.85 |
Expense Changes Impacting the Table
Changes to the fund’s fee arrangements occurred during the six month period. Had these fee changes been in effect throughout the entire six month period, the annualized expense ratios would have been 0.94% for Class A and 1.69% for Class B shares. The actual expenses paid during the period would have been approximately $4.77 for Class A and $8.56 for Class B shares; and the hypothetical expenses paid during the period would have been approximately $4.73 for Class A and $8.50 for Class B shares. For further information about the fund’s fee arrangements and changes to those fee arrangements, please see Note 3 in the Notes to Financial Statements.
| (h) | 5% class return per year before expenses. |
| (p) | Expenses paid is equal to each class’ annualized expense ratio, as shown above, multiplied by the average account value over the period, multiplied by the number of days in the period, divided by the number of days in the year. Expenses paid do not include any applicable sales charges (loads). If these transaction costs had been included, your costs would have been higher. |
17
Table of Contents
Expense Tables – continued
MFS® VIRGINIA MUNICIPAL BOND FUND
| Share Class | Annualized Expense Ratio | Beginning Account Value 10/01/08 | Ending Account Value 3/31/09 | Expenses Paid During Period (p) 10/01/08-3/31/09 | ||||||
| A | Actual | 0.89% | $1,000.00 | $1,034.28 | $4.51 | |||||
| Hypothetical (h) | 0.89% | $1,000.00 | $1,020.49 | $4.48 | ||||||
| B | Actual | 1.55% | $1,000.00 | $1,029.88 | $7.84 | |||||
| Hypothetical (h) | 1.55% | $1,000.00 | $1,017.20 | $7.80 | ||||||
| C | Actual | 1.56% | $1,000.00 | $1,030.84 | $7.90 | |||||
| Hypothetical (h) | 1.56% | $1,000.00 | $1,017.15 | $7.85 |
Expense Changes Impacting the Table
Changes to the fund’s fee arrangements occurred during the six month period. Had these fee changes been in effect throughout the entire six month period, the annualized expense ratios would have been 0.93% for Class A, 1.67% for Class B, and 1.68% for Class C shares . The actual expenses paid during the period would have been approximately $4.72 for Class A, $8.45 for Class B, and $8.50 for Class C shares; and the hypothetical expenses paid during the period would have been approximately $4.68 for Class A, $8.40 for Class B, and $8.45 for Class C shares. For further information about the fund’s fee arrangements and changes to those fee arrangements, please see Note 3 in the Notes to Financial Statements.
MFS® WEST VIRGINIA MUNICIPAL BOND FUND
| Share Class | Annualized Expense Ratio | Beginning Account Value 10/01/08 | Ending Account Value 3/31/09 | Expenses Paid During Period (p) 10/01/08-3/31/09 | ||||||
| A | Actual | 0.88% | $1,000.00 | $1,037.62 | $4.47 | |||||
| Hypothetical (h) | 0.88% | $1,000.00 | $1,020.54 | $4.43 | ||||||
| B | Actual | 1.54% | $1,000.00 | $1,034.20 | $7.81 | |||||
| Hypothetical (h) | 1.54% | $1,000.00 | $1,017.25 | $7.75 |
Expense Changes Impacting the Table
Changes to the fund’s fee arrangements occurred during the six month period. Had these fee changes been in effect throughout the entire six month period, the annualized expense ratios would have been 0.91% for Class A and 1.66% for Class B shares. The actual expenses paid during the period would have been approximately $4.62 for Class A and $8.41 for Class B shares; and the hypothetical expenses paid during the period would have been approximately $4.58 for Class A and $8.35 for Class B shares. For further information about the fund’s fee arrangements and changes to those fee arrangements, please see Note 3 in the Notes to Financial Statements.
| (h) | 5% class return per year before expenses. |
| (p) | Expenses paid is equal to each class’ annualized expense ratio, as shown above, multiplied by the average account value over the period, multiplied by the number of days in the period, divided by the number of days in the year. Expenses paid do not include any applicable sales charges (loads). If these transaction costs had been included, your costs would have been higher. |
18
Table of Contents
3/31/09
MFS® MISSISSIPPI MUNICIPAL BOND FUND
The Portfolio of Investments is a complete list of all securities owned by your fund. It is categorized by broad-based asset classes.
| Municipal Bonds - 96.2% | ||||||
| Issuer | Shares/Par | Value ($) | ||||
| Airport & Port Revenue - 1.5% | ||||||
| Jackson, MS, Municipal Airport Authority, Airport Rev., “A”, AMBAC, 5%, 2031 | $ | 1,510,000 | $ | 1,402,282 | ||
| General Obligations - General Purpose - 8.1% | ||||||
| Commonwealth of Puerto Rico, “A”, 5.25%, 2027 | $ | 455,000 | $ | 370,784 | ||
| Commonwealth of Puerto Rico, “A”, 5.375%, 2033 | 220,000 | 175,611 | ||||
| Commonwealth of Puerto Rico, “A”, 6%, 2038 | 365,000 | 316,320 | ||||
| Commonwealth of Puerto Rico, Public Improvement, FGIC, 5.5%, 2016 | 3,220,000 | 3,117,958 | ||||
| Hinds County, MS, MBIA, 6.25%, 2011 | 1,285,000 | 1,406,458 | ||||
| Mississippi Development Bank Special Obligations (Jackson, Mississippi), FSA, 5.25%, 2020 | 620,000 | 711,010 | ||||
| Mississippi Development Bank Special Obligations, Harrison County Mississippi Highway Construction, “N”, FGIC, 5%, 2026 | 1,000,000 | 970,130 | ||||
| Puerto Rico Public Buildings Authority Rev., Guaranteed, “M”, 6.25%, 2023 | 335,000 | 318,783 | ||||
| Puerto Rico Public Buildings Authority Rev., Guaranteed, “M”, 6.25%, 2031 | 370,000 | 337,200 | ||||
| $ | 7,724,254 | |||||
| General Obligations - Improvement - 1.4% | ||||||
| Guam Government, “A”, 5.25%, 2037 | $ | 155,000 | $ | 101,782 | ||
| Mississippi Capital Improvement, “I”, 6%, 2009 (c) | 1,000,000 | 1,031,870 | ||||
| Mississippi Development Bank Special Obligation (Greenville, MS Project), 5%, 2027 | 245,000 | 181,342 | ||||
| $ | 1,314,994 | |||||
| General Obligations - Schools - 5.3% | ||||||
| Biloxi, MS, Public School District, MBIA, 5%, 2021 | $ | 1,000,000 | $ | 1,015,150 | ||
| Jackson, MS, Public School District, “B”, AMBAC, 5.75%, 2010 (c) | 1,000,000 | 1,074,170 | ||||
| Jackson, MS, Public School District, “B”, AMBAC, 0%, 2022 | 2,000,000 | 981,720 | ||||
| Jackson, MS, Public School District, “B”, AMBAC, 0%, 2023 | 1,000,000 | 457,840 | ||||
| Madison County, MS, School District, “A”, MBIA, 5.875%, 2009 (c) | 1,500,000 | 1,533,570 | ||||
| $ | 5,062,450 | |||||
| Healthcare Revenue - Hospitals - 13.1% | ||||||
| Corinth & Alcorn County, MS, Hospital Rev. (Magnolia Regional Health Center), 5.5%, 2021 | $ | 400,000 | $ | 331,580 | ||
| Gulfport, MS, Hospital Facilities Rev. (Memorial Hospital), MBIA, 6.125%, 2015 | 2,250,000 | 2,249,483 | ||||
| Gulfport, MS, Hospital Facilities Rev. (Memorial Hospital), MBIA, 6.2%, 2018 | 1,000,000 | 996,820 | ||||
| Issuer | Shares/Par | Value ($) | ||||
| Healthcare Revenue - Hospitals - continued | ||||||
| Gulfport, MS, Hospital Facilities Rev. (Memorial Hospital), 5.75%, 2031 | $ | 500,000 | $ | 437,145 | ||
| Hinds County, MS, Rev. (Methodist Hospital & Rehabilitation), AMBAC, 5.6%, 2012 | 1,110,000 | 1,161,027 | ||||
| Indiana Finance Authority Rev. (Sisters of St. Francis Health Services), 5.375%, 2032 | 705,000 | 653,958 | ||||
| Louisville & Jefferson County, KY, Metropolitan Government Healthcare Systems Rev. (Norton Healthcare, Inc.), 5.25%, 2036 | 560,000 | 432,779 | ||||
| Maryland Health & Higher Educational Facilities Authority Rev. (Medstar Health), BHAC, 5.25%, 2046 | 1,000,000 | 974,440 | ||||
| Medical Center, Educational Building Corp. Rev. (University of Mississippi Medical Center), “B”, AMBAC, 5.5%, 2023 | 1,000,000 | 1,005,620 | ||||
| Mississippi Hospital Equipment & Facilities Authority Rev. (Baptist Memorial Healthcare), “B-1”, 5%, 2024 | 1,000,000 | 938,970 | ||||
| Mississippi Hospital Equipment & Facilities Authority Rev. (Delta Regional Medical Center), MBIA, 5%, 2035 | 1,000,000 | 884,340 | ||||
| Mississippi Hospital Equipment & Facilities Authority Rev. (Forrest County General Hospital), FSA, 5.625%, 2011 (c) | 1,000,000 | 1,088,490 | ||||
| Mississippi Hospital Equipment & Facilities Authority Rev. Refunding & Improvement, Hospital South Central, 5.25%, 2031 | 500,000 | 359,970 | ||||
| Mississippi Hospital Equipment & Facilities Authority Rev., Refunding & Improvement, Southwest Regional Medical Center, 5.5%, 2019 | 250,000 | 213,385 | ||||
| Mississippi Hospital Equipment & Facilities Authority, Refunding & Improvement, Southwest Regional Medical Center, 5.75%, 2023 | 250,000 | 206,628 | ||||
| South Broward, FL, Hospital District Rev., 5%, 2036 | 485,000 | 406,546 | ||||
| Tarrant County, TX, Cultural Education Facilities Finance Corp. (Scott & White Memorial Hospital), “A”, 5.5%, 2031 | 180,000 | 168,820 | ||||
| $ | 12,510,001 | |||||
| Industrial Revenue - Environmental Services - 0.3% | ||||||
| Mississippi Business Finance Corp. (Solid Waste Management, Inc.), 4.4%, 2027 (b) | $ | 250,000 | $ | 239,085 | ||
| Industrial Revenue - Other - 0.6% | ||||||
| Mississippi Business Finance Corp. (Northrop Grumman Ship Systems), 4.55%, 2028 | $ | 500,000 | $ | 391,210 | ||
| Virgin Islands Public Finance Authority, Refinery Facilities Rev. (Hovensa Coker Project), 5.875%, 2022 | 210,000 | 143,357 | ||||
| $ | 534,567 | |||||
19
Table of Contents
Portfolio of Investments – continued
| Municipal Bonds - continued | ||||||
| Issuer | Shares/Par | Value ($) | ||||
| Industrial Revenue - Paper - 1.2% | ||||||
| Lowndes County, MS, Solid Waste Disposal & Pollution Control Rev. (Weyerhaeuser Co.), 6.8%, 2022 | $ | 750,000 | $ | 615,630 | ||
| Warren County, MS, Environmental Improvement Rev. (International Paper Co.), “A”, 4.4%, 2015 | 750,000 | 552,090 | ||||
| $ | 1,167,720 | |||||
| Miscellaneous Revenue - Entertainment & Tourism - 0.9% | ||||||
| Mississippi Development Bank, Special Obligation (Diamond Lakes Utilities), 6.25%, 2017 | $ | 950,000 | $ | 809,771 | ||
| Multi-Family Housing Revenue - 0.1% | ||||||
| Mississippi Home Corp., Rev. (Kirkwood Apartments), 6.8%, 2037 | $ | 150,000 | $ | 111,351 | ||
| Sales & Excise Tax Revenue - 1.4% | ||||||
| Massachusetts Bay Transportation Authority, Sales Tax Rev., “A-1”, 5.25%, 2029 | $ | 750,000 | $ | 787,358 | ||
| Puerto Rico Sales Tax Financing Corp., Sales Tax Rev., 5.25%, 2057 | 720,000 | 585,634 | ||||
| $ | 1,372,992 | |||||
| Single Family Housing - State - 3.4% | ||||||
| Mississippi Home Corp. Rev., Single Family Rev., “A”, GNMA, 6.3%, 2031 | $ | 150,000 | $ | 152,609 | ||
| Mississippi Home Corp. Rev., Single Family Rev., “A-2 “, GNMA, 5.625%, 2039 | 485,000 | 479,694 | ||||
| Mississippi Home Corp. Rev., Single Family Rev., “A-2”, GNMA, 5.3%, 2023 | 450,000 | 447,440 | ||||
| Mississippi Home Corp. Rev., Single Family Rev., “A-2”, GNMA, 6.95%, 2031 | 185,000 | 191,048 | ||||
| Mississippi Home Corp. Rev., Single Family Rev., “A-2”, GNMA, 6.5%, 2032 | 185,000 | 190,176 | ||||
| Mississippi Home Corp. Rev., Single Family Rev., “B”, GNMA, 5.3%, 2035 | 530,000 | 526,984 | ||||
| Mississippi Home Corp. Rev., Single Family Rev., “B-2”, GNMA, 6.375%, 2032 | 300,000 | 306,042 | ||||
| Mississippi Home Corp. Rev., Single Family Rev., “B-2”, GNMA, 6.45%, 2033 | 320,000 | 326,157 | ||||
| Mississippi Home Corp. Rev., Single Family Rev., “C”, GNMA, 4.95%, 2025 | 670,000 | 635,676 | ||||
| $ | 3,255,826 | |||||
| State & Local Agencies - 19.0% | ||||||
| Lamar County, MS, (Jail Project), MBIA, 5.1%, 2021 | $ | 430,000 | $ | 443,966 | ||
| Mississippi Development Bank Special Obligation (Capital Project & Equipment Prepayment), FSA, 5%, 2028 | 1,320,000 | 1,310,232 | ||||
| Mississippi Development Bank Special Obligation (Forrest County Public Improvement Project), 5%, 2029 | 1,000,000 | 990,010 | ||||
| Mississippi Development Bank Special Obligation (Harrison County), “D”, ASSD GTY, 4.75%, 2028 | 1,120,000 | 1,105,978 | ||||
| Mississippi Development Bank Special Obligation (Hinds Community College), ASSD GTY, 5.375%, 2033 | 1,500,000 | 1,500,585 | ||||
| Issuer | Shares/Par | Value ($) | ||||
| State & Local Agencies - continued | ||||||
| Mississippi Development Bank Special Obligation (Jackson Public School District), FSA, 5.375%, 2028 | $ | 1,000,000 | $ | 1,022,530 | ||
| Mississippi Development Bank Special Obligation (Mississippi Highway Construction), AMBAC, 4.75%, 2035 | 1,000,000 | 909,480 | ||||
| Mississippi Development Bank Special Obligation (Southaven Water & Sewer System), ASSD GTY, 5%, 2029 | 750,000 | 757,560 | ||||
| Mississippi Development Bank Special Obligations (City of Jackson, MS), AMBAC, 4.375%, 2031 | 1,400,000 | 1,198,890 | ||||
| Mississippi Development Bank Special Obligations (Correctional Facilities), “A”, AMBAC, 5.125%, 2025 | 1,000,000 | 1,011,680 | ||||
| Mississippi Development Bank Special Obligations (DeSoto County Regional Utility Authority), 5.25%, 2031 | 905,000 | 822,690 | ||||
| Mississippi Development Bank Special Obligations (Mississippi, Ltd. Tax Hospital Rev.), 5.1%, 2020 | 1,000,000 | 1,019,010 | ||||
| Mississippi Development Bank Special Obligations (Natchez Mississippi Convention Center), AMBAC, 6%, 2013 (c) | 750,000 | 878,363 | ||||
| Mississippi Development Bank Special Obligations (Public Improvement Board), 5%, 2023 | 750,000 | 743,033 | ||||
| Mississippi Development Bank Special Obligations (Tunica County Building Project), AMBAC, 5%, 2026 | 1,695,000 | 1,708,187 | ||||
| Mississippi Development Bank Special Obligations (Tupelo Fairgrounds), “A”, AMBAC, 5%, 2017 | 785,000 | 811,023 | ||||
| Walnut Grove, MS, Correctional Authority, AMBAC, 6%, 2009 (c) | 1,750,000 | 1,840,668 | ||||
| $ | 18,073,885 | |||||
| Tax - Other - 0.1% | ||||||
| Virgin Islands Public Finance Authority Rev., “A”, 5.25%, 2024 | $ | 135,000 | $ | 110,839 | ||
| Tobacco - 0.4% | ||||||
| Guam Economic Development Authority Tobacco Settlement, “B”, 5.5%, 2011 (c) | $ | 350,000 | $ | 381,665 | ||
| Toll Roads - 0.9% | ||||||
| Bay Area Toll Authority, Toll Bridge Rev. (San Francisco Bay Area), “F1”, 5%, 2039 | $ | 885,000 | $ | 824,024 | ||
| Transportation - Special Tax - 3.9% | ||||||
| Commonwealth of Puerto Rico Highway & Transportation Authority Rev., FSA, 5.25%, 2033 | $ | 1,135,000 | $ | 1,095,684 | ||
| Indiana Finance Authority Highway Rev., “A”, MBIA, 4.5%, 2029 | 855,000 | 789,678 | ||||
| Mississippi Development Bank Special Obligations, Madison County (Highway Construction), FGIC, 5%, 2027 | 500,000 | 479,515 | ||||
20
Table of Contents
Portfolio of Investments – continued
| Municipal Bonds - continued | ||||||
| Issuer | Shares/Par | Value ($) | ||||
| Transportation - Special Tax - continued | ||||||
| Mississippi Development Bank Special Obligations, Madison County (Road & Bridge), AMBAC, 5.1%, 2013 (c) | 1,175,000 | 1,324,719 | ||||
| $ | 3,689,596 | |||||
| Universities - Colleges - 14.9% | ||||||
| Jackson State University, Educational Building Corp. Rev. (Campus Facilities), 5%, 2034 (b) | $ | 485,000 | $ | 507,480 | ||
| Jackson State University, Educational Building Corp. Rev., (Campus Facilities), “A”, FGIC, 5%, 2014 (c) | 3,100,000 | 3,526,684 | ||||
| Jackson State University, Educational Building Corp. Rev., (Student Recreation Center), AMBAC, 5.125%, 2012 (c) | 750,000 | 838,200 | ||||
| Massachusetts Health & Educational Facilities Authority Rev. (Massachusetts Institute of Technology), “I-1”, 5.2%, 2028 | 920,000 | 997,243 | ||||
| Mississippi State University Educational Building Corp. Rev., AMBAC, 5.5%, 2016 | 1,000,000 | 1,063,420 | ||||
| Mississippi State University Educational Building Corp. Rev., AMBAC, 5%, 2021 | 250,000 | 255,770 | ||||
| Mississippi Valley State University, Educational Building Corp. Rev., MBIA, 5.5%, 2010 (c) | 890,000 | 964,235 | ||||
| New York Dormitory Authority Rev., Non State Supported Debt (New York University), “A”, 5.25%, 2048 | 1,040,000 | 1,017,910 | ||||
| University of California Rev., “J”, FSA, 4.5%, 2035 | 985,000 | 849,947 | ||||
| University of Mississippi, Educational Building Corp. Rev. (Residential College Project), “A”, 5%, 2033 | 1,500,000 | 1,464,795 | ||||
| University of Southern Mississippi, Educational Building Corp. Rev. (Athletics Facilities Improvement Project), FSA, 5%, 2034 | 750,000 | 732,218 | ||||
| University of Southern Mississippi, Educational Building Corp. Rev. (Campus Facilities Project), 5.375%, 2036 | 1,000,000 | 1,005,100 | ||||
| University of Southern Mississippi, Educational Building Corp. Rev., “B”, FSA, 5%, 2032 | 1,000,000 | 989,200 | ||||
| $ | 14,212,202 | |||||
| Utilities - Municipal Owned - 6.2% | ||||||
| Guam Power Authority Rev., “A”, AMBAC, 5.25%, 2013 | $ | 1,000,000 | $ | 941,470 | ||
| Long Island Power Authority, Electric Systems Rev., “A”, BHAC, 5.5%, 2033 | 485,000 | 501,277 | ||||
| Long Island Power Authority, Electric Systems Rev., “A”, 6%, 2033 | 155,000 | 160,079 | ||||
| Mississippi Development Bank Special Obligations (Municipal Energy Agency Power Supply Project), “A”, XLCA, 5%, 2026 | 1,000,000 | 799,250 | ||||
| Mississippi Development Bank Special Obligations (Okolona Electric System), 5.2%, 2011 (c) | 1,010,000 | 1,097,769 | ||||
| Issuer | Shares/Par | Value ($) | ||||
| Utilities - Municipal Owned - continued | ||||||
| Puerto Rico Electric Power Authority Rev., “WW”, 5.25%, 2025 | $ | 1,000,000 | $ | 856,150 | ||
| Puerto Rico Electric Power Authority, Power Rev., “V”, FSA, 5.25%, 2027 | 570,000 | 562,710 | ||||
| South Carolina Public Service Authority Rev. “A”, 5.5%, 2038 | 1,000,000 | 1,021,090 | ||||
| $ | 5,939,795 | |||||
| Water & Sewer Utility Revenue - 13.5% | ||||||
| Commonwealth of Puerto Rico Aqueduct & Sewer Authority Rev., “A”, ASSD GTY, 5%, 2028 | $ | 400,000 | $ | 379,132 | ||
| Commonwealth of Puerto Rico Aqueduct & Sewer Authority Rev., “A”, 6%, 2044 | 2,000,000 | 1,679,420 | ||||
| Jackson, MS, Water & Sewer Systems Rev., FGIC, 5.25%, 2009 (c) | 420,000 | 428,320 | ||||
| Mississippi Development Bank Special Obligations (Combined Water Sewer & Solid Waste Management), FSA, 5.25%, 2021 | 1,270,000 | 1,350,696 | ||||
| Mississippi Development Bank Special Obligations (Combined Water Sewer & Solid Waste Management), FSA, 5.05%, 2027 | 1,610,000 | 1,651,039 | ||||
| Mississippi Development Bank Special Obligations (Gulfport Water & Sewer Project), FSA, 5.625%, 2012 (c) | 500,000 | 575,110 | ||||
| Mississippi Development Bank Special Obligations (Gulfport Water & Sewer Project), “A”, FGIC, 5.25%, 2012 (c) | 2,000,000 | 2,231,880 | ||||
| Mississippi Development Bank Special Obligations (Jackson Water & Sewer System Project), FSA, 5%, 2029 | 2,000,000 | 1,977,220 | ||||
| Mississippi Development Bank Special Obligations (Jackson Water & Sewer System Project), FGIC, 5%, 2032 | 250,000 | 224,898 | ||||
| Mississippi Development Bank Special Obligations, Grenada, MS, Water & Sewer Systems Project, “N”, FSA, 5%, 2030 | 1,000,000 | 988,300 | ||||
| New York Environmental Facilities Corp., Clean Water & Drinking Rev., “B”, 5%, 2033 | 1,000,000 | 969,890 | ||||
| New York, NY, City Municipal Water Finance Authority, Water & Sewer Systems Rev. “DD”, 4.75%, 2035 | 450,000 | 415,040 | ||||
| $ | 12,870,945 | |||||
| Total Municipal Bonds (Identified Cost, $93,036,883) | $ | 91,608,244 | ||||
| Money Market Funds (v) - 2.2% | ||||||
| MFS Institutional Money Market Portfolio, 0.23%, at Cost and Net Asset Value | 2,078,862 | $ | 2,078,862 | |||
| Total Investments (Identified Cost, $95,115,745) | $ | 93,687,106 | ||||
| Other Assets, Less Liabilities - 1.6% | 1,479,019 | |||||
| Net Assets - 100.0% | $ | 95,166,125 | ||||
See Portfolio Footnotes and Notes to Financial Statements
21
Table of Contents
PORTFOLIO OF INVESTMENTS
3/31/09
MFS® NEW YORK MUNICIPAL BOND FUND
The Portfolio of Investments is a complete list of all securities owned by your fund. It is categorized by broad-based asset classes.
| Municipal Bonds - 96.0% | ||||||
| Issuer | Shares/Par | Value ($) | ||||
| Airport & Port Revenue - 4.2% | ||||||
| New York, NY, City Industrial Development Agency, Special Facilities Rev. (Terminal One Group), 5.5%, 2024 | $ | 1,000,000 | $ | 849,050 | ||
| Port Authority NY & NJ (132nd Series), 5%, 2033 | 2,000,000 | 1,980,420 | ||||
| Port Authority NY & NJ (153rd Series), 5%, 2038 | 5,000,000 | 4,909,100 | ||||
| Port Authority NY & NJ, Special Obligation Rev. (JFK International), MBIA, 6.25%, 2015 | 1,000,000 | 990,260 | ||||
| $ | 8,728,830 | |||||
| General Obligations - General Purpose - 4.8% | ||||||
| Commonwealth of Puerto Rico, XLCA, 5.5%, 2017 | $ | 2,700,000 | $ | 2,597,670 | ||
| Commonwealth of Puerto Rico, “A”, 5.375%, 2033 | 495,000 | 395,124 | ||||
| Commonwealth of Puerto Rico, “A”, 6%, 2038 | 845,000 | 732,302 | ||||
| New York, NY, “A”, 6%, 2010 (c) | 990,000 | 1,060,973 | ||||
| New York, NY, “A”, 5%, 2039 | 1,500,000 | 1,483,845 | ||||
| New York, NY, “B”, 5.375%, 2010 (c) | 210,000 | 225,763 | ||||
| New York, NY, “C-1”, 5.25%, 2025 | 1,000,000 | 1,004,570 | ||||
| New York, NY, “D-1”, 5.125%, 2028 | 1,000,000 | 978,710 | ||||
| New York, NY, “E-1”, 6.25%, 2028 | 1,000,000 | 1,074,230 | ||||
| New York, NY, “J”, FGIC, 5.5%, 2026 | 5,000 | 5,000 | ||||
| New York, NY, Unrefunded, “A”, 6%, 2019 | 10,000 | 10,320 | ||||
| Puerto Rico Public Buildings Authority Rev., Guaranteed, “M”, 6.25%, 2023 | 340,000 | 323,541 | ||||
| $ | 9,892,048 | |||||
| General Obligations - Improvement - 0.8% | ||||||
| Erie County, NY, Public Improvement, “A”, FGIC, 5%, 2019 | $ | 140,000 | $ | 141,733 | ||
| Guam Government, “A”, 5.25%, 2037 | 290,000 | 190,431 | ||||
| Suffolk County, NY, Public Improvement, ASSD GTY, 4.125%, 2028 | 1,400,000 | 1,278,606 | ||||
| $ | 1,610,770 | |||||
| General Obligations - Schools - 3.5% | ||||||
| Genesee Valley, NY, Central School District (Angelica Belmont), FGIC, 5.25%, 2028 | $ | 1,720,000 | $ | 1,744,063 | ||
| North Babylon, NY, Union Free School District, “A”, FGIC, 5.5%, 2018 | 2,415,000 | 2,480,664 | ||||
| Port Byron, NY, Central School District, ETM, AMBAC, 7.4%, 2012 (c) | 500,000 | 597,545 | ||||
| Port Byron, NY, Central School District, ETM, AMBAC, 7.4%, 2013 (c) | 500,000 | 617,325 | ||||
| Port Byron, NY, Central School District, ETM, AMBAC, 7.4%, 2014 (c) | 500,000 | 632,980 | ||||
| Port Byron, NY, Central School District, ETM, AMBAC, 7.4%, 2015 (c) | 500,000 | 649,225 | ||||
| Issuer | Shares/Par | Value ($) | ||||
| General Obligations - Schools - continued | ||||||
| Washingtonville, NY, Central School Central District, FGIC, 7.35%, 2009 | $ | 550,000 | $ | 556,881 | ||
| $ | 7,278,683 | |||||
| Healthcare Revenue - Hospitals - 7.7% | ||||||
| Albany, NY, Industrial Development Agency, Civic Facilities Rev. (St. Peters), “D”, 5.75%, 2027 | $ | 1,000,000 | $ | 857,050 | ||
| Chautauqua County, NY, Industrial Development Agency, Civic Facilities Rev. (Women’s Christian Assn.), “A”, 6.35%, 2017 | 125,000 | 112,105 | ||||
| Chautauqua County, NY, Industrial Development Agency, Civic Facilities Rev. (Women’s Christian Assn.), “A”, 6.4%, 2029 | 460,000 | 350,088 | ||||
| Genesee County, NY, Industrial Development Agency, Civic Facilities Rev. (United Medical Center Project), 5%, 2032 | 500,000 | 322,095 | ||||
| Indiana Finance Authority Rev. (Sisters of St. Francis Health Services), 5.375%, 2032 | 1,565,000 | 1,451,694 | ||||
| Madison County, NY, Industrial Development Agency, Civic Facilities Rev. (Oneida), 5.25%, 2027 | 675,000 | 512,784 | ||||
| Monroe County, NY, Industrial Development Agency, Civic Facilities Rev. (Highland Hospital of Rochester), 5%, 2025 | 1,000,000 | 823,180 | ||||
| New York Dormitory Authority Rev. (NYU Hospital Center), “B”, 5.625%, 2037 | 750,000 | 499,710 | ||||
| New York Dormitory Authority Rev. (St. Vincent’s Hospital & Medical Center), BHAC, 5%, 2027 | 3,000,000 | 3,085,830 | ||||
| New York Dormitory Authority Rev. (White Plains Hospital), FHA, 5.375%, 2043 | 1,500,000 | 1,410,045 | ||||
| New York Dormitory Authority Rev., Non State Supported Debt, 6.25%, 2037 | 750,000 | 549,765 | ||||
| New York Dormitory Authority Rev., Non State Supported Debt (Kaleida Health), FHA, 4.6%, 2027 | 920,000 | 795,846 | ||||
| New York Dormitory Authority Rev., Non-State Supported Debt (Bronx-Lebanon Hospital Center), LOC, 6.25%, 2035 | 1,000,000 | 1,000,630 | ||||
| New York Dormitory Authority Rev., Non-State Supported Debt (Mt. Sinai NYU Health), 5.5%, 2026 | 250,000 | 215,998 | ||||
| New York Dormitory Authority Rev., Non-State Supported Debt (Mt. Sinai NYU Health), “C”, 5.5%, 2026 | 500,000 | 443,460 | ||||
| New York, NY, Health & Hospital Corp. Rev., “A”, 5.25%, 2017 | 760,000 | 765,518 | ||||
| New York, NY, Health & Hospital Corp. Rev., “A”, 5.5%, 2023 | 1,000,000 | 1,026,030 | ||||
| New York, NY, Industrial Development Agency, Civic Facilities Rev. (Staten Island University Hospital), “B”, 6.375%, 2031 | 485,000 | 367,906 | ||||
22
Table of Contents
Portfolio of Investments – continued
| Municipal Bonds - continued | ||||||
| Issuer | Shares/Par | Value ($) | ||||
| Healthcare Revenue - Hospitals - continued | ||||||
| Saratoga County, NY, Industrial Development Agency Civic Facilities Rev., 5.25%, 2032 | $ | 500,000 | $ | 381,615 | ||
| Suffolk County, NY, Industrial Development Agency, Civic Facilities Rev. (Huntington Hospital), “C”, 5.875%, 2032 | 1,000,000 | 854,630 | ||||
| Yonkers, NY, Industrial Development Agency, Civic Facilities Rev. (St. John’s Riverside Hospital), “A”, 7.125%, 2031 | 300,000 | 210,510 | ||||
| $ | 16,036,489 | |||||
| Healthcare Revenue - Long Term Care - 0.7% | ||||||
| East Rochester, NY, Housing Authority Rev. (Woodland Village Project), 5.5%, 2033 | $ | 400,000 | $ | 253,072 | ||
| Nassau County, NY, Industrial Development Agency Continuing Care, 6.7%, 2043 | 300,000 | 225,729 | ||||
| Suffolk County, NY, Industrial Development Agency, Civic Facilities Rev. (Gurwin Jewish Phase II), 6.7%, 2039 | 385,000 | 271,121 | ||||
| Ulster County, NY, Industrial Development Agency (Woodland Pond), “A”, 6%, 2037 | 500,000 | 328,210 | ||||
| Westchester County, NY, Industrial Development Agency, Civic Facilities Rev., Continuing Care Retirement (Kendal On Hudson), “A”, 6.5%, 2013 (c) | 300,000 | 352,017 | ||||
| $ | 1,430,149 | |||||
| Human Services - 0.6% | ||||||
| Nassau County, NY, Industrial Development Agency, Civic Facility Rev. (Special Needs Facility), “B-1”, 6.5%, 2017 | $ | 205,000 | $ | 176,433 | ||
| New York Dormitory Authority Rev. (Jewish Board of Families & Children), AMBAC, 5%, 2023 | 695,000 | 676,311 | ||||
| New York, NY, Industrial Development Agency (PSCH, Inc.), 6.375%, 2033 | 500,000 | 386,115 | ||||
| $ | 1,238,859 | |||||
| Industrial Revenue - Airlines - 0.3% | ||||||
| New York, NY, City Industrial Development Agencies Rev. (American Airlines, Inc.), 7.125%, 2011 | $ | 100,000 | $ | 91,993 | ||
| New York, NY, City Industrial Development Agencies Rev. (American Airlines, Inc.), 5.4%, 2020 | 100,000 | 39,956 | ||||
| New York, NY, City Industrial Development Agencies Rev. (American Airlines, Inc.), 7.625%, 2025 | 350,000 | 255,819 | ||||
| New York, NY, City Industrial Development Agencies Rev. (American Airlines, Inc.), 7.75%, 2031 | 250,000 | 178,763 | ||||
| $ | 566,531 | |||||
| Industrial Revenue - Other - 2.4% | ||||||
| Liberty, NY, Development Corp. Rev. (Goldman Sachs Headquarters), 5.25%, 2035 | $ | 4,180,000 | $ | 3,478,930 | ||
| Issuer | Shares/Par | Value ($) | ||||
| Industrial Revenue - Other - continued | ||||||
| New York, NY, City Industrial Development Agency Rev., Liberty Bonds (IAC/InterActiveCorp), 5%, 2035 | $ | 500,000 | $ | 333,290 | ||
| Onondaga County, NY, Industrial Development Agency, Sewer Facilities Rev. (Bristol-Meyers Squibb Co.), 5.75%, 2024 | 1,000,000 | 952,820 | ||||
| Virgin Islands Public Finance Authority, Refinery Facilities Rev. (Hovensa Coker Project), 5.875%, 2022 | 430,000 | 293,540 | ||||
| $ | 5,058,580 | |||||
| Industrial Revenue - Paper - 0.4% | ||||||
| Essex County, NY, Industrial Development Agency, Pollution Control Rev. (International Paper Corp.), 6.15%, 2021 | $ | 470,000 | $ | 345,229 | ||
| Essex County, NY, Industrial Development Agency, Pollution Control Rev. (International Paper Corp.), 6.45%, 2023 | 700,000 | 511,469 | ||||
| $ | 856,698 | |||||
| Miscellaneous Revenue - Entertainment & Tourism - 1.0% | ||||||
| New York Liberty Development Corp. Rev. (National Sports Museum), “A”, 6.125%, 2019 (d) | $ | 439,999 | $ | 1,760 | ||
| New York, NY, City Industrial Development Agency Rev. (Queens Baseball Stadium), ASSD GTY, 6.375%, 2039 | 2,000,000 | 2,127,340 | ||||
| $ | 2,129,100 | |||||
| Miscellaneous Revenue - Other - 0.5% | ||||||
| New York, NY, Industrial Development Agency, Civic Facilities Rev. (United Jewish Appeal), “A”, 5%, 2027 | $ | 1,000,000 | $ | 1,011,880 | ||
| Multi-Family Housing Revenue - 1.4% | ||||||
| New York Housing Finance Agency Rev., “A”, 5.1%, 2041 | $ | 815,000 | $ | 693,492 | ||
| New York, NY, City Housing Development Corp., 5.5%, 2034 | 2,000,000 | 1,854,400 | ||||
| New York, NY, City Housing Development Corp., “C”, 5%, 2026 | 500,000 | 467,750 | ||||
| $ | 3,015,642 | |||||
| Sales & Excise Tax Revenue - 0.8% | ||||||
| Puerto Rico Sales Tax Financing Corp., Sales Tax Rev., 0%, 2056 | $ | 11,315,000 | $ | 387,086 | ||
| Puerto Rico Sales Tax Financing Corp., Sales Tax Rev., 5.25%, 2057 | 1,000,000 | 813,380 | ||||
| Schenectady, NY, Metroplex Development Authority Rev., “A”, MBIA, 5.375%, 2021 | 475,000 | 497,392 | ||||
| $ | 1,697,858 | |||||
| Single Family Housing - State - 2.5% | ||||||
| New York Mortgage Agency Rev., 5.1%, 2024 | $ | 2,000,000 | $ | 1,931,440 | ||
23
Table of Contents
Portfolio of Investments – continued
| Municipal Bonds - continued | ||||||
| Issuer | Shares/Par | Value ($) | ||||
| Single Family Housing - State - continued | ||||||
| New York Mortgage Agency Rev., “130”, 4.75%, 2030 | $ | 500,000 | $ | 432,650 | ||
| New York Mortgage Agency Rev., “156”, 5.35%, 2033 | 1,500,000 | 1,456,170 | ||||
| New York Mortgage Agency Rev., “158”, 6.6%, 2038 | 1,290,000 | 1,358,757 | ||||
| $ | 5,179,017 | |||||
| Solid Waste Revenue - 0.4% | ||||||
| Niagara County, NY, Industrial Development Agency, Solid Waste Disposal Rev. (American Ref-fuel), “C”, 5.625%, 2024 (b) | $ | 850,000 | $ | 781,601 | ||
| State & Agency - Other - 2.1% | ||||||
| New York Dormitory Authority (City University), AMBAC, 5.75%, 2018 | $ | 800,000 | $ | 906,408 | ||
| New York Dormitory Authority (State University), 5.375%, 2010 (c) | 1,500,000 | 1,597,110 | ||||
| New York Dormitory Authority (Upstate Community Colleges), “A”, FSA, 6%, 2010 (c)(f) | 1,010,000 | 1,089,517 | ||||
| New York Municipal Bond Bank Agency, Special Program Rev., “A”, AMBAC, 5.25%, 2015 | 715,000 | 752,845 | ||||
| $ | 4,345,880 | |||||
| State & Local Agencies - 14.4% | ||||||
| New York Dorm Authority Rev., Non State Supported Debt, 5%, 2032 | $ | 2,000,000 | $ | 1,898,200 | ||
| New York Dorm Authority Rev., State Supported Debt, FSA, 5.25%, 2010 (c) | 10,000 | 10,653 | ||||
| New York Dorm Authority Rev., State Supported Debt, FSA, 5.25%, 2030 | 25,000 | 25,123 | ||||
| New York Dorm Authority Rev., State Supported Debt, 5%, 2035 | 2,000,000 | 1,768,580 | ||||
| New York Dorm Authority Rev., State Supported Debt, “A”, 5%, 2022 | 1,500,000 | 1,536,705 | ||||
| New York Dorm Authority Rev., State Supported Debt, “A”, 5%, 2033 | 2,000,000 | 1,913,220 | ||||
| New York Dorm Authority Rev., State Supported Debt, “B”, 5%, 2022 | 4,000,000 | 4,008,520 | ||||
| New York Dormitory Authority (City University), “A”, 5.625%, 2016 | 2,450,000 | 2,683,632 | ||||
| New York Dormitory Authority (School Program), 6.25%, 2020 | 1,690,000 | 1,767,909 | ||||
| New York Dormitory Authority (State University), 5.875%, 2017 | 1,130,000 | 1,254,718 | ||||
| New York Dormitory Authority Rev., Mental Health Services, “A”, MBIA, 5.75%, 2010 (c) | 5,000 | 5,229 | ||||
| New York Dormitory Authority Rev., Mental Health Services, “B”, FSA, 5.25%, 2010 (c) | 35,000 | 37,286 | ||||
| New York Dormitory Authority Rev., Mental Health Services, “D”, FSA, 5.25%, 2010 (c) | 35,000 | 37,286 | ||||
| New York Dormitory Authority Rev., Mental Health Services, “D”, MBIA, 5.25%, 2011 (c) | 105,000 | 115,645 | ||||
| New York Dormitory Authority Rev., Mental Health Services, Unrefunded, “B”, MBIA, 5.25%, 2031 | 725,000 | 684,871 | ||||
| Issuer | Shares/Par | Value ($) | ||||
| State & Local Agencies - continued | ||||||
| New York Dormitory Authority State Personal Income Tax Rev., 5%, 2038 | $ | 1,000,000 | $ | 967,310 | ||
| New York Municipal Bond Bank Agency, Special School Purpose Rev., 5.25%, 2022 | 1,000,000 | 1,010,340 | ||||
| New York Urban Development Corp. (State Facilities), AMBAC, 5.6%, 2015 | 2,750,000 | 3,112,395 | ||||
| New York Urban Development Corp. Rev., “B-1”, 5%, 2036 | 3,000,000 | 2,909,220 | ||||
| New York Urban Development Corp. Rev., “D”, 5.625%, 2028 | 2,000,000 | 2,026,000 | ||||
| Tobacco Settlement Financing Corp., NY, “A-1”, 5.5%, 2018 | 2,000,000 | 2,036,940 | ||||
| $ | 29,809,782 | |||||
| Tax - Other - 3.6% | ||||||
| Hudson Yards Infrastructure Corp. Rev., “A”, FSA, 5%, 2047 | $ | 2,500,000 | $ | 2,092,150 | ||
| Hudson Yards Infrastructure Corp. Rev., “A”, 5%, 2047 | 3,000,000 | 2,436,210 | ||||
| New York, NY, City Transitional Finance Authority Building Aid Rev., “S-3”, 5.25%, 2039 | 2,000,000 | 1,879,700 | ||||
| New York, NY, Transitional Finance Authority Rev., “A”, 5%, 2026 | 1,000,000 | 1,010,000 | ||||
| $ | 7,418,060 | |||||
| Tobacco - 0.6% | ||||||
| Guam Economic Development Authority Tobacco Settlement, “B”, 5.5%, 2011 (c) | $ | 400,000 | $ | 436,188 | ||
| New York County Tobacco Trust II, 5.625%, 2035 | 800,000 | 556,080 | ||||
| Westchester, NY, Tobacco Asset Securitization Corp., 5.125%, 2045 | 500,000 | 302,095 | ||||
| $ | 1,294,363 | |||||
| Toll Roads - 4.1% | ||||||
| Niagara Falls, NY, Bridge Commission Toll Rev., FGIC, 5.25%, 2015 | $ | 5,000,000 | $ | 5,396,550 | ||
| Triborough Bridge & Tunnel Authority Rev., NY, “C”, 5%, 2038 | 2,000,000 | 1,919,380 | ||||
| Triborough Bridge & Tunnel Authority Rev., NY, ETM, 6%, 2012 (c) | 780,000 | 845,590 | ||||
| Triborough Bridge & Tunnel Authority Rev., NY, Unrefunded, “A”, MBIA, 5%, 2032 | 310,000 | 304,603 | ||||
| $ | 8,466,123 | |||||
| Transportation - Special Tax - 9.2% | ||||||
| Commonwealth of Puerto Rico Highway & Transportation Authority Rev., “Y”, 5%, 2016 (c) | $ | 1,700,000 | $ | 1,987,317 | ||
| Metropolitan Transportation Authority Rev., NY, FGIC, 5.875%, 2010 (c) | 2,000,000 | 2,107,540 | ||||
| Metropolitan Transportation Authority Rev., NY, FGIC, 5%, 2025 | 2,500,000 | 2,461,575 | ||||
| Metropolitan Transportation Authority Rev., NY, “A”, 5%, 2026 | 1,500,000 | 1,421,760 | ||||
| Metropolitan Transportation Authority Rev., NY, “A”, 5%, 2035 | 2,000,000 | 1,793,260 | ||||
24
Table of Contents
Portfolio of Investments – continued
| Municipal Bonds - continued | ||||||
| Issuer | Shares/Par | Value ($) | ||||
| Transportation - Special Tax - continued | ||||||
| Metropolitan Transportation Authority Rev., NY, “A”, 5%, 2037 | $ | 2,910,000 | $ | 2,578,871 | ||
| Metropolitan Transportation Authority Rev., NY, “B”, FSA, 4.5%, 2032 | 1,900,000 | 1,650,891 | ||||
| Metropolitan Transportation Authority Rev., NY, “C”, 6.5%, 2028 | 2,000,000 | 2,155,420 | ||||
| Metropolitan Transportation Authority Rev., NY, ETM, AMBAC, 5.75%, 2013 (c) | 825,000 | 882,882 | ||||
| New York Thruway Authority, General Rev., Highway & Bridges, “A”, FSA, 5.8%, 2010 (c) | 20,000 | 21,270 | ||||
| New York Thruway Authority, General Rev., Highway & Bridges, “B-1”, FGIC, 5.4%, 2010 (c) | 2,000,000 | 2,118,040 | ||||
| $ | 19,178,826 | |||||
| Universities - Colleges - 12.8% | ||||||
| Albany, NY, Industrial Development Agency Rev. (Albany Law School), 5%, 2031 | $ | 1,000,000 | $ | 736,510 | ||
| Amherst, NY, Industrial Development Agency Rev. (Daemen College), “A”, 6%, 2011 (c) | 1,000,000 | 1,140,770 | ||||
| Cattaraugus County, NY, Industrial Development Agency Rev. (Jamestown Community College), “A”, 6.4%, 2010 (c) | 500,000 | 546,485 | ||||
| Madison County, NY, Industrial Development Agency Civic Facilities Rev. (Colgate University), “A”, AMBAC, 5%, 2035 | 1,585,000 | 1,537,545 | ||||
| New York Dormitory Authority Rev. (Cornell University), “A”, 5%, 2035 | 1,500,000 | 1,489,050 | ||||
| New York Dormitory Authority Rev. (Judicial Institute at Pace), AMBAC, 5.5%, 2010 (c) | 2,500,000 | 2,681,350 | ||||
| New York Dormitory Authority Rev. (New York University), “A”, FGIC, 5%, 2029 | 1,000,000 | 989,880 | ||||
| New York Dormitory Authority Rev. (New York University), “A”, 5%, 2038 | 3,000,000 | 2,901,330 | ||||
| New York Dormitory Authority Rev. (Pace University), MBIA, 6%, 2010 (c) | 1,700,000 | 1,833,841 | ||||
New York Dormitory Authority Rev. (St. John’s University), “A”, MBIA, 5%, 2017 | 300,000 | 315,387 | ||||
| New York Dormitory Authority Rev., Non State Supported Debt (Cornell University), “A”, 5%, 2031 | 2,000,000 | 2,005,880 | ||||
| New York Dormitory Authority Rev., Non State Supported Debt (New York University), “A”, 5.25%, 2048 | 3,300,000 | 3,229,908 | ||||
| New York Dormitory Authority Rev., Non State Supported Debt (Teachers College), 5.5%, 2039 | 1,000,000 | 975,590 | ||||
| New York, NY, City Trust Cultural Resource Rev. (Juilliard), “A”, 5%, 2034 | 1,850,000 | 1,839,455 | ||||
| Schenectady, NY, New York Dormitory Authority Rev. (Cornell University), “A”, AMBAC, 5%, 2032 | 2,000,000 | 1,962,120 | ||||
| Seneca County, NY, Industrial Development Agency, Civic Facilities Rev. (New York Chiropractic), 5%, 2027 | 500,000 | 344,300 | ||||
| St. Lawrence County, NY, Industrial Development Agency Rev. (Clarkson University), 5%, 2031 | 2,225,000 | 2,022,703 | ||||
| $ | 26,552,104 | |||||
| Issuer | Shares/Par | Value ($) | ||||
| Utilities - Investor Owned - 0.7% | ||||||
| New York Environmental Facilities Corp., Water Facilities Rev. (Spring Valley Water Co.), “B”, AMBAC, 6.15%, 2024 | $ | 1,500,000 | $ | 1,499,970 | ||
| Utilities - Municipal Owned - 5.3% | ||||||
| Guam Power Authority Rev., AMBAC, 5.25%, 2014 | $ | 1,000,000 | $ | 933,160 | ||
| Long Island Power Authority, Electric Systems Rev., “A”, 6.25%, 2033 | 1,000,000 | 1,059,440 | ||||
| Long Island Power Authority, Electric Systems Rev., “A”, 6%, 2033 | 2,000,000 | 2,065,540 | ||||
| Long Island Power Authority, Electrical Systems Rev., “C”, 5.5%, 2013 (c) | 400,000 | 465,252 | ||||
| Long Island Power Authority, Electrical Systems Rev., “C”, FSA, 5%, 2035 | 1,520,000 | 1,463,866 | ||||
| Long Island Power Authority, Electrical Systems Rev., “C”, 5%, 2035 | 2,000,000 | 1,821,080 | ||||
| New York Power Authority Rev., 5.25%, 2040 | 3,000,000 | 3,003,030 | ||||
| Virgin Islands Water & Power Authority Rev., 5.5%, 2017 | 200,000 | 192,318 | ||||
| $ | 11,003,686 | |||||
| Water & Sewer Utility Revenue - 11.2% | ||||||
| Commonwealth of Puerto Rico Aqueduct & Sewer Authority Rev., “A”, ASSD GTY, 5.125%, 2047 | $ | 1,200,000 | $ | 1,064,256 | ||
| Great Neck North, NY, Water Authority Rev., 5%, 2038 | 1,000,000 | 974,620 | ||||
| New York Environmental Facilities Corp., Clean Water & Drinking Rev., 5%, 2024 | 1,005,000 | 1,033,371 | ||||
| New York Environmental Facilities Corp., Clean Water & Drinking Rev., 5%, 2031 | 1,330,000 | 1,336,530 | ||||
| New York Environmental Facilities Corp., Clean Water & Drinking Rev., “B”, 5%, 2033 | 2,140,000 | 2,075,565 | ||||
| New York Environmental Facilities Corp., Pollution Control Rev., 5.75%, 2010 | 175,000 | 185,409 | ||||
| New York Environmental Facilities Corp., Pollution Control Rev., 6.875%, 2010 | 70,000 | 70,036 | ||||
| New York Environmental Facilities Corp., Pollution Control Rev., 7.25%, 2010 | 25,000 | 25,014 | ||||
| New York Environmental Facilities Corp., Pollution Control Rev., ETM, 5.75%, 2010 (c) | 945,000 | 1,005,461 | ||||
| New York Environmental Facilities Corp., Pollution Control Rev., ETM, 5.75%, 2010 (c) | 1,115,000 | 1,186,338 | ||||
| New York Environmental Facilities Corp., Water Facilities Rev., 6%, 2031 | 1,005,000 | 963,684 | ||||
| New York, NY, Municipal Water & Sewer Finance Authority Rev., 4.75%, 2030 | 1,245,000 | 1,165,806 | ||||
| New York, NY, Municipal Water & Sewer Finance Authority Rev., 5.125%, 2030 | 1,000,000 | 1,002,470 | ||||
| New York, NY, Municipal Water & Sewer Finance Authority Rev., 4.75%, 2036 | 2,270,000 | 2,088,105 | ||||
| New York, NY, Municipal Water & Sewer Finance Authority Rev., 5%, 2038 | 2,000,000 | 1,934,280 | ||||
| New York, NY, Municipal Water & Sewer Finance Authority Rev., 5%, 2038 | 2,000,000 | 1,934,280 | ||||
| New York, NY, Municipal Water & Sewer Finance Authority Rev., FGIC, 4.5%, 2039 | 970,000 | 847,732 | ||||
25
Table of Contents
Portfolio of Investments – continued
| Municipal Bonds - continued | ||||||
| Issuer | Shares/Par | Value ($) | ||||
| Water & Sewer Utility Revenue - continued | ||||||
| New York, NY, Municipal Water & Sewer Finance Authority Rev., “A”, 5%, 2027 | $ | 1,500,000 | $ | 1,508,910 | ||
| New York, NY, Municipal Water & Sewer Finance Authority Rev., “A”, ETM, 6%, 2010 (c) | 620,000 | 661,131 | ||||
| New York, NY, Municipal Water & Sewer Finance Authority Rev., ETM, AMBAC, 6.75%, 2014 (c) | 1,000,000 | 1,145,590 | ||||
| Suffolk County, NY, Water Authority Rev., MBIA, 5.1%, 2012 | 660,000 | 732,428 | ||||
| Suffolk County, NY, Water Authority Rev., ETM, MBIA, 5.1%, 2012 (c) | 235,000 | 262,795 | ||||
| $ | 23,203,811 | |||||
| Total Municipal Bonds (Identified Cost, $204,711,862) | $ | 199,285,340 | ||||
| Money Market Funds (v) - 3.3% | |||||
| Issuer | Shares/Par | Value ($) | |||
| MFS Institutional Money Market Portfolio, 0.23%, at Cost and Net Asset Value | 6,943,829 | $ | 6,943,829 | ||
| Total Investments (Identified Cost, $211,655,691) | $ | 206,229,169 | |||
| Other Assets, Less Liabilities - 0.7% | 1,455,391 | ||||
| Net Assets - 100.0% | $ | 207,684,560 | |||
Derivatives contracts at 3/31/09
Futures contracts outstanding at 3/31/09
| Description | Contracts | Value | Expiration Date | Unrealized Appreciation (Depreciation) | |||||
| U.S. Treasury Bond 30 yr (Short) | 37 | $4,799,016 | Jun-09 | $(110,840 | ) |
At March 31, 2009, the fund had sufficient cash and/or other liquid securities to cover any commitments under these derivative contracts.
See Portfolio Footnotes and Notes to Financial Statements
26
Table of Contents
PORTFOLIO OF INVESTMENTS
3/31/09
MFS® NORTH CAROLINA MUNICIPAL BOND FUND
The Portfolio of Investments is a complete list of all securities owned by your fund. It is categorized by broad-based asset classes.
| Municipal Bonds - 98.7% | ||||||
| Issuer | Shares/Par | Value ($) | ||||
| Airport & Port Revenue - 4.7% | ||||||
| Charlotte, NC, Airport Rev. (Charlotte/Douglas International Airport), AMBAC, 5%, 2023 | $ | 1,430,000 | $ | 1,459,916 | ||
| Charlotte, NC, Airport Rev., “A”, MBIA, 5%, 2029 | 2,000,000 | 1,921,100 | ||||
| Charlotte, NC, Airport Rev., “A”, MBIA, 5%, 2034 | 4,485,000 | 4,145,082 | ||||
| Charlotte, NC, Airport Rev., “B”, MBIA, 5.875%, 2019 | 1,000,000 | 1,009,820 | ||||
| Charlotte, NC, Airport Rev., “B”, MBIA, 5.875%, 2020 | 3,775,000 | 3,797,801 | ||||
| Raleigh Durham, NC, Airport Authority Rev., “A”, FGIC, 5.25%, 2018 | 2,700,000 | 2,793,069 | ||||
| $ | 15,126,788 | |||||
| General Obligations - General Purpose - 0.9% | ||||||
| Puerto Rico Public Buildings Authority Rev., Guaranteed, “M”, 6.25%, 2023 | $ | 905,000 | $ | 861,189 | ||
| Tuscaloosa, AL, “A”, 5.125%, 2039 | 2,195,000 | 2,140,849 | ||||
| $ | 3,002,038 | |||||
| General Obligations - Improvement - 1.4% | ||||||
| New Hanover County, NC, Public Improvement, 5.8%, 2010 (c) | $ | 4,200,000 | $ | 4,611,516 | ||
| General Obligations - Schools - 3.9% | ||||||
| Brunswick County, NC, FGIC, 5%, 2020 | $ | 2,800,000 | $ | 2,924,544 | ||
| Johnston County, NC, FGIC, 5.6%, 2010 (c) | 2,000,000 | 2,132,420 | ||||
| Los Angeles, CA, Unified School District, “D”, 5%, 2034 | 145,000 | 136,368 | ||||
| New Hanover County, NC, Public Improvement, 5%, 2021 | 1,435,000 | 1,498,814 | ||||
| New Hanover County, NC, School Improvement, 5%, 2019 | 1,255,000 | 1,338,570 | ||||
| San Diego, CA, Community College District, FSA, 5%, 2030 | 2,830,000 | 2,736,129 | ||||
| San Jacinto, TX, Community College District, 5.125%, 2038 | 2,000,000 | 1,957,100 | ||||
| $ | 12,723,945 | |||||
| Healthcare Revenue - Hospitals - 15.8% | ||||||
| Albemarle, NC, Hospital Authority Health Care Facilities Rev., 5.25%, 2038 | $ | 2,000,000 | $ | 1,405,940 | ||
| Catawba County, NC, Hospital Rev. (Catawba Memorial Hospital), AMBAC, 5%, 2017 | 1,200,000 | 1,191,804 | ||||
| Charlotte-Mecklenburg, NC, Hospital Authority Health Care System Rev. (Carolina Health Care System), “A”, 5%, 2011 (c) | 750,000 | 810,113 | ||||
| Charlotte-Mecklenburg, NC, Hospital Authority Health Care System Rev. (Carolina Health Care System), “A”, 5%, 2031 | 1,000,000 | 879,760 | ||||
| Charlotte-Mecklenburg, NC, Hospital Authority Health Care System Rev. (Carolina Health Care System), “A”, 5%, 2047 | 1,000,000 | 905,550 | ||||
| Issuer | Shares/Par | Value ($) | ||||
| Healthcare Revenue - Hospitals - continued | ||||||
| Charlotte-Mecklenburg, NC, Hospital Authority Health Care System Rev., Unrefunded (Carolina Health Care System), “A”, 5%, 2031 | $ | 2,695,000 | $ | 2,604,556 | ||
| Cumberland County, NC, Hospital Facilities Rev. (Cumberland Hospital), ETM, MBIA, 0%, 2009 (c) | 1,800,000 | 1,785,690 | ||||
| Louisville & Jefferson County, KY, Metropolitan Government Healthcare Systems Rev. (Norton Healthcare, Inc.), 5.25%, 2036 | 1,820,000 | 1,406,532 | ||||
| New Hanover County, NC, Hospital Rev. (New Hanover Regional Medical Center), MBIA, 5%, 2019 | 6,225,000 | 6,214,916 | ||||
| North Carolina Hospital Authority Mortgage Rev. (Johnston Memorial), FSA, 5.25%, 2036 | 1,500,000 | 1,376,535 | ||||
| North Carolina Medical Care Commission (Cleveland County Healthcare), “A”, AMBAC, 5%, 2035 | 1,305,000 | 989,647 | ||||
| North Carolina Medical Care Commission (Morehead Memorial Hospital), FSA, 5%, 2026 | 2,000,000 | 1,856,220 | ||||
| North Carolina Medical Care Commission, Health Care Facilities Rev. (Novant Health Obligation Group), 5%, 2039 | 1,945,000 | 1,721,617 | ||||
| North Carolina Medical Care Commission, Health Care Facilities Rev. (Wakemed), AMBAC, 5%, 2021 | 3,245,000 | 2,989,262 | ||||
| North Carolina Medical Care Commission, Health Care Facilities Rev. (Wakemed), “A”, ASSD GTY, 5.625%, 2038 | 500,000 | 502,925 | ||||
| North Carolina Medical Care Commission, Hospital Rev. (Betsy Johnson Health Care System), FSA, 5.125%, 2032 | 900,000 | 789,453 | ||||
| North Carolina Medical Care Commission, Hospital Rev. (Mission-St. Joseph Health Systems), 5.5%, 2011 (c) | 2,825,000 | 3,164,226 | ||||
| North Carolina Medical Care Commission, Hospital Rev. (Southeastern Regional Medical Center), 5.375%, 2032 | 3,330,000 | 2,772,158 | ||||
| North Carolina Medical Care Commission, Hospital Rev. (Wilson Memorial Hospital), AMBAC, 0%, 2013 | 1,000,000 | 833,810 | ||||
| North Carolina Medical Care Commission, Hospital Rev. (Wilson Memorial Hospital), AMBAC, 0%, 2015 | 1,140,000 | 843,623 | ||||
| North Carolina Medical Care Commission, Hospital Rev., Unrefunded (St. Joseph’s), MBIA, 5.1%, 2018 | 525,000 | 525,835 | ||||
| Northern Hospital District, Surry County, NC, Health Care Facilities Rev., RADIAN, 5.5%, 2019 | 1,055,000 | 930,141 | ||||
| Northern Hospital District, Surry County, NC, Health Care Facilities Rev., 6.25%, 2038 | 1,000,000 | 822,080 | ||||
27
Table of Contents
Portfolio of Investments – continued
| Municipal Bonds - continued | ||||||
| Issuer | Shares/Par | Value ($) | ||||
| Healthcare Revenue - Hospitals - continued | ||||||
| Onslow County, NC, Hospital Authority (Onslow Memorial Hospital Project), MBIA, 5%, 2026 | $ | 1,155,000 | $ | 1,122,210 | ||
| Pitt County, NC, Rev., Pitt County Memorial Hospital, ETM, 5.25%, 2021 (c) | 10,135,000 | 10,904,449 | ||||
| Royal Oak, MI, Hospital Finance Authority Rev. (William Beaumont Hospital), 8.25%, 2039 | 2,040,000 | 2,174,354 | ||||
| $ | 51,523,406 | |||||
| Healthcare Revenue - Long Term Care - 0.8% | ||||||
| North Carolina Medical Care Commission, Health Care Facilities Rev. (Arbor Acres Community), 6.375%, 2012 (c) | $ | 1,000,000 | $ | 1,141,120 | ||
| North Carolina Medical Care Commission, Health Care Facilities Rev. (Givens Estates), 6.5%, 2013 (c) | 800,000 | 947,720 | ||||
| North Carolina Medical Care Commission, Retirement Facilities Rev., (Brookwood), 5.25%, 2032 | 750,000 | 441,187 | ||||
| $ | 2,530,027 | |||||
| Human Services - 0.7% | ||||||
| Cumberland County, NC, Finance Corp., Installment Payment Rev. (Detention Center & Mental Health), AMBAC, 5.625%, 2019 | $ | 2,125,000 | $ | 2,154,219 | ||
| Industrial Revenue - Other - 0.2% | ||||||
| Virgin Islands Public Finance Authority, Refinery Facilities Rev. (Hovensa Coker Project), 5.875%, 2022 | $ | 860,000 | $ | 587,079 | ||
| Industrial Revenue - Paper - 0.5% | ||||||
| Columbus County, NC, Industrial Facilities & Pollution Control Financing Authority Rev. (International Paper Co.), “A”, 5.8%, 2016 | $ | 2,000,000 | $ | 1,570,160 | ||
| Multi-Family Housing Revenue - 2.6% | ||||||
| Charlotte, NC, Housing Authority Rev., GNMA, 4.8%, 2048 | $ | 2,000,000 | $ | 1,657,180 | ||
| Charlotte, NC, Housing Authority Rev., Mortgage Rocky Branch II, GNMA, 4.65%, 2035 | 2,000,000 | 1,662,020 | ||||
| Elizabeth City, NC, Multi-Family Housing Rev. (Walker Landing), “A”, GNMA, 5.125%, 2049 | 1,500,000 | 1,357,500 | ||||
| Mecklenburg County, NC (Little Rock Apartments), FNMA, 5.15%, 2022 | 1,000,000 | 999,920 | ||||
| North Carolina Housing Finance Agency, “H”, FHA, 6.05%, 2028 | 2,015,000 | 2,017,781 | ||||
| North Carolina Medical Care Commission, Health Care Facilities Rev., “A”, (ARC Projects), 5.8%, 2034 | 1,000,000 | 712,460 | ||||
| $ | 8,406,861 | |||||
| Single Family Housing - State - 5.2% | ||||||
| North Carolina Housing Finance Agency Rev., “15-A”, FSA, 4.95%, 2032 | $ | 395,000 | $ | 349,658 | ||
| North Carolina Housing Finance Agency Rev., “19-A”, 5.1%, 2030 | 2,330,000 | 2,105,807 | ||||
| Issuer | Shares/Par | Value ($) | ||||
| Single Family Housing - State - continued | ||||||
| North Carolina Housing Finance Agency Rev., “23-A”, 4.8%, 2037 | $ | 2,035,000 | $ | 1,718,802 | ||
| North Carolina Housing Finance Agency Rev., “24-A”, 4.75%, 2026 | 1,965,000 | 1,777,578 | ||||
| North Carolina Housing Finance Agency Rev., “25-A”, 5.75%, 2037 | 1,775,000 | 1,775,320 | ||||
| North Carolina Housing Finance Agency Rev., “29-A”, 4.85%, 2038 | 2,000,000 | 1,696,620 | ||||
| North Carolina Housing Finance Agency Rev., “31-A”, 5.25%, 2038 | 2,000,000 | 1,806,860 | ||||
| North Carolina Housing Finance Agency Rev., “5-A”, 5.55%, 2019 | 1,975,000 | 1,997,140 | ||||
| North Carolina Housing Finance Agency Rev., “7-A”, 6.15%, 2020 | 470,000 | 471,090 | ||||
| North Carolina Housing Finance Agency Rev., “A”, 5.25%, 2020 | 1,140,000 | 1,142,839 | ||||
| North Carolina Housing Finance Agency Rev., “A”, 5.375%, 2023 | 210,000 | 210,298 | ||||
| North Carolina Housing Finance Agency Rev., “PP”, FHA, 6.15%, 2017 | 695,000 | 698,260 | ||||
| North Carolina Housing Finance Agency Rev., “RR”, 5.85%, 2028 | 1,315,000 | 1,312,225 | ||||
| $ | 17,062,497 | |||||
| State & Agency - Other - 5.7% | ||||||
| Brunswick County, NC, COP, FSA, 5.5%, 2010 (c) | $ | 1,000,000 | $ | 1,068,360 | ||
| Cabarrus County, NC, Installment Financing Contract, 5%, 2021 | 5,500,000 | 5,658,235 | ||||
| Carteret County, NC, AMBAC, 5.625%, 2020 | 1,010,000 | 1,045,390 | ||||
| Charlotte, NC, COP (Public Safety Facilities), “D”, 5.5%, 2010 (c) | 3,000,000 | 3,203,250 | ||||
| Charlotte, NC, COP (Transit Projects), 5%, 2033 | 3,000,000 | 2,929,890 | ||||
| Charlotte, NC, COP (Transit Projects), “E”, 5%, 2035 | 1,990,000 | 1,933,305 | ||||
| Harnett County, NC, COP, FSA, 5.5%, 2010 (c) | 1,225,000 | 1,332,959 | ||||
| Harnett County, NC, COP, FSA, 5.25%, 2015 | 1,020,000 | 1,115,554 | ||||
| Rockingham, NC, COP, AMBAC, 5.125%, 2024 | 350,000 | 358,557 | ||||
| $ | 18,645,500 | |||||
| State & Local Agencies - 2.2% | ||||||
| Harnett County, NC, COP, ASSD GTY, 5%, 2029 | $ | 400,000 | $ | 397,960 | ||
| Iredell County, NC, Public Facilities (School Projects), AMBAC, 5.5%, 2010 (c) | 1,000,000 | 1,068,360 | ||||
| Mecklenburg County, NC, COP, “A”, 5%, 2028 | 350,000 | 349,976 | ||||
| Mooresville, NC, COP, 5%, 2032 | 2,000,000 | 1,912,220 | ||||
| Rutherford County, NC, COP (Rutherford County School), AMBAC, 5%, 2023 | 840,000 | 864,251 | ||||
| Wilmington, NC, COP, “A”, 5%, 2038 | 2,650,000 | 2,543,841 | ||||
| $ | 7,136,608 | |||||
| Tax - Other - 1.0% | ||||||
| New York, NY, City Transitional Finance Authority Building Aid Rev., “S-3”, 5.25%, 2039 | $ | 1,000,000 | $ | 939,850 | ||
| Virgin Islands Public Finance Authority Rev., RADIAN, 5.5%, 2018 | 1,000,000 | 914,220 | ||||
28
Table of Contents
Portfolio of Investments – continued
| Municipal Bonds - continued | ||||||
| Issuer | Shares/Par | Value ($) | ||||
| Tax - Other - continued | ||||||
| Virgin Islands Public Finance Authority Rev., “A”, 5.5%, 2022 | $ | 1,650,000 | $ | 1,426,029 | ||
| $ | 3,280,099 | |||||
| Toll Roads - 0.9% | ||||||
| Bay Area Toll Authority, Toll Bridge Rev. (San Francisco Bay Area), “F1”, 5%, 2039 | $ | 3,260,000 | $ | 3,035,386 | ||
| Transportation - Special Tax - 4.9% | ||||||
| Commonwealth of Puerto Rico Highway & Transportation Authority Rev., FSA, 6%, 2018 (f) | $ | 10,850,000 | $ | 11,528,776 | ||
| Commonwealth of Puerto Rico Highway & Transportation Authority Rev., “CC”, FSA, 5.5%, 2028 | 1,715,000 | 1,757,995 | ||||
| Indiana Finance Authority Highway Rev., “A”, MBIA, 4.5%, 2029 | 2,825,000 | 2,609,170 | ||||
| $ | 15,895,941 | |||||
| Universities - Colleges - 22.0% | ||||||
| Appalachian State University, NC, Rev., FSA, 5.6%, 2010 (c) | $ | 2,285,000 | $ | 2,458,112 | ||
| Appalachian State University, NC, Rev., “C”, MBIA, 5%, 2030 | 1,000,000 | 968,110 | ||||
| East Carolina University, NC, Rev., “A”, AMBAC, 5.25%, 2011 (c) | 1,375,000 | 1,511,029 | ||||
| Florida State University Board of Governors, System Improvement Rev., 6.25%, 2030 | 1,000,000 | 1,062,070 | ||||
| Massachusetts State College, Building Authority Project Rev., “A”, 5.5%, 2049 | 2,660,000 | 2,609,221 | ||||
| New York Dormitory Authority Rev., Non State Supported Debt (Columbia University), “A”, 5%, 2031 | 3,120,000 | 3,176,690 | ||||
| New York Dormitory Authority Rev., Non State Supported Debt (New York University), “A”, 5.25%, 2048 | 3,395,000 | 3,322,890 | ||||
| North Carolina Capital Facilities Finance Agency Rev. (Duke University), “A”, 5%, 2038 | 2,500,000 | 2,507,800 | ||||
| North Carolina Capital Facilities, Finance Agency Rev. (Duke University), “A”, 5.25%, 2012 (c) | 2,000,000 | 2,271,240 | ||||
| North Carolina Capital Facilities, Finance Agency Rev. (Duke University), “A”, 5%, 2039 | 3,500,000 | 3,508,680 | ||||
| North Carolina Capital Facilities, Finance Agency Rev. (Duke University), “B”, 4.25%, 2042 | 2,020,000 | 1,691,144 | ||||
| North Carolina Capital Facilities, Finance Agency Rev. (Duke University), “B”, 4.75%, 2042 | 3,000,000 | 2,791,740 | ||||
| North Carolina Capital Facilities, Finance Agency Rev. (High Point University), 5.125%, 2018 | 510,000 | 430,149 | ||||
| North Carolina Capital Facilities, Finance Agency Rev. (High Point University), 5.125%, 2021 | 300,000 | 237,303 | ||||
| North Carolina Capital Facilities, Finance Agency Rev. (Johnson & Wales University), “A”, XLCA, 5.25%, 2022 | 1,870,000 | 1,893,487 | ||||
| Issuer | Shares/Par | Value ($) | ||||
| Universities - Colleges - continued | ||||||
| North Carolina Capital Facilities, Finance Agency Rev. (Meredith College), 6%, 2031 | $ | 2,500,000 | $ | 2,301,875 | ||
| North Carolina Capital Facilities, Finance Prerefunded (Duke University), “A”, 5.125%, 2011 (c) | 4,050,000 | 4,464,801 | ||||
| North Carolina Capital Facilities, Finance Unrefunded (Duke University) “A”, 5.125%, 2041 | 950,000 | 954,294 | ||||
| Puerto Rico Industrial Tourist Authority (University Plaza), “A”, MBIA, 5%, 2020 | 2,180,000 | 1,892,240 | ||||
| University of California Rev., “J”, FSA, 4.5%, 2035 | 3,250,000 | 2,804,392 | ||||
| University of North Carolina, Chapel Hill, 5%, 2028 | 2,000,000 | 2,041,500 | ||||
| University of North Carolina, Chapel Hill, 5%, 2036 | 3,000,000 | 3,039,780 | ||||
| University of North Carolina, Charlotte Rev., “B”, FSA, 5%, 2036 | 1,750,000 | 1,752,275 | ||||
| University of North Carolina, Greensboro Rev., “A”, FSA, 5%, 2020 | 2,835,000 | 2,939,356 | ||||
| University of North Carolina, Systems Pool Rev., “B”, MBIA, 5%, 2033 | 1,180,000 | 1,138,016 | ||||
| University of North Carolina, Systems Pool Rev., “C”, AMBAC, 5%, 2029 | 2,000,000 | 2,021,100 | ||||
| University of North Carolina, University Rev., “A”, 4.75%, 2034 | 5,000,000 | 4,862,350 | ||||
| University of North Carolina, Wilmington Rev., “A”, AMBAC, 5%, 2019 | 1,375,000 | 1,428,116 | ||||
| University of North Carolina, Wilmington, COP (Student Housing Project), FGIC, 5%, 2028 | 1,825,000 | 1,757,365 | ||||
| University of North Carolina, Wilmington, COP (Student Housing Project), ASSD GTY, 5%, 2032 | 2,910,000 | 2,911,921 | ||||
| University of North Carolina, Wilmington, COP (Student Housing Project), ASSD GTY, 4.75%, 2038 | 3,400,000 | 3,235,032 | ||||
| University of Puerto Rico Rev., “Q”, 5%, 2036 | 2,370,000 | 1,689,383 | ||||
| $ | 71,673,461 | |||||
| Utilities - Investor Owned - 0.8% | ||||||
| Wake County, NC, Industrial Facilities & Pollution Control Rev. (Carolina Power & Light Co.), 5.375%, 2017 | $ | 2,500,000 | $ | 2,569,300 | ||
| Utilities - Municipal Owned - 14.4% | ||||||
| Chattanooga, TN, Electric Rev., “A”, 5%, 2033 | $ | 1,000,000 | $ | 983,340 | ||
| Long Island Power Authority, Electric Systems Rev., “A”, BHAC, 5.5%, 2033 | 1,525,000 | 1,576,179 | ||||
| Long Island Power Authority, Electric Systems Rev., “A”, 6%, 2033 | 520,000 | 537,040 | ||||
| North Carolina Eastern Municipal Power Agency, AMBAC, 6%, 2018 | 14,245,000 | 15,159,814 | ||||
| North Carolina Eastern Municipal Power Agency, “A”, ETM, 7.5%, 2010 (c) | 2,360,000 | 2,478,920 | ||||
| North Carolina Eastern Municipal Power Agency, “A”, ETM, MBIA, 7.5%, 2010 (c) | 2,735,000 | 2,793,119 | ||||
| North Carolina Municipal Power Agency, Catawba Electric Rev., MBIA, 6%, 2011 | 5,000,000 | 5,366,950 | ||||
29
Table of Contents
Portfolio of Investments – continued
| Municipal Bonds - continued | ||||||
| Issuer | Shares/Par | Value ($) | ||||
| Utilities - Municipal Owned - continued | ||||||
| North Carolina Municipal Power Agency, Catawba Electric Rev., 6.375%, 2013 | $ | 1,000,000 | $ | 1,033,030 | ||
| North Carolina Municipal Power Agency, Catawba Electric Rev., “A”, MBIA, 5.25%, 2019 (u) | 10,000,000 | 10,699,300 | ||||
| North Carolina Municipal Power Agency, Catawba Electric Rev., “A”, MBIA, 5.25%, 2020 (u) | 6,000,000 | 6,380,340 | ||||
| $ | 47,008,032 | |||||
| Utilities - Other - 0.5% | ||||||
| Tennessee Energy Acquisition Corp., Gas Rev., “A”, 5.25%, 2019 | $ | 1,055,000 | $ | 822,067 | ||
| Tennessee Energy Acquisition Corp., Gas Rev., “A”, 5.25%, 2026 | 1,290,000 | 903,464 | ||||
| $ | 1,725,531 | |||||
| Water & Sewer Utility Revenue - 9.6% | ||||||
| Asheville, NC, Water & Sewer Systems Rev., MBIA, 5%, 2032 | $ | 1,000,000 | $ | 991,770 | ||
| Charlotte, NC, Storm Water Fee Rev., 6%, 2010 (c) | 3,180,000 | 3,415,765 | ||||
| Charlotte, NC, Storm Water Fee Rev., 5%, 2034 | 3,675,000 | 3,684,702 | ||||
| Charlotte, NC, Water & Sewer Systems Rev., 5.5%, 2017 | 1,650,000 | 1,760,418 | ||||
| Durham County, NC, Enterprise Systems Rev., MBIA, 5%, 2023 | 1,675,000 | 1,725,585 | ||||
| Greenville, NC, Combined Enterprise Systems Rev., FSA, 5%, 2016 | 1,005,000 | 1,063,159 | ||||
| Greenville, NC, Combined Enterprise Systems Rev., FSA, 5.25%, 2019 | 1,170,000 | 1,224,066 | ||||
| Issuer | Shares/Par | Value ($) | ||||
| Water & Sewer Utility Revenue - continued | ||||||
| Greenville, NC, Utilities Commission, Combined Enterprise System Rev., “A”, FSA, 5%, 2033 | $ | 2,400,000 | $ | 2,333,736 | ||
| Harnett County, NC, Water & Sewer Systems Rev., AMBAC, 5%, 2028 | 700,000 | 708,519 | ||||
| High Point, NC, Combined Enterprise System Rev., FSA, 5%, 2033 | 2,000,000 | 1,994,300 | ||||
| Kannapolis, NC, Water & Sewer Rev., “B”, FSA, 5.25%, 2021 | 1,000,000 | 1,016,890 | ||||
| King County, WA, Sewer Rev., 5%, 2038 | 3,520,000 | 3,456,499 | ||||
| New York Environmental Facilities Corp., Clean Water & Drinking Rev., “B”, 5%, 2033 | 3,295,000 | 3,195,788 | ||||
| Oak Island, NC, Enterprise System Rev., ASSD GTY, 6%, 2034 | 1,000,000 | 1,012,040 | ||||
| Winston Salem, NC, Water & Sewer Systems Rev., 5%, 2033 | 1,600,000 | 1,606,624 | ||||
| Winston-Salem, NC, Water & Sewer Systems Rev., 5%, 2034 | 2,000,000 | 2,009,360 | ||||
| $ | 31,199,221 | |||||
| Total Municipal Bonds (Identified Cost, $321,598,209) | $ | 321,467,615 | ||||
| Money Market Funds (v) - 2.2% | ||||||
| MFS Institutional Money Market Portfolio, 0.23%, at Cost and Net Asset Value | 7,145,386 | $ | 7,145,386 | |||
| Total Investments (Identified Cost, $328,743,595) | $ | 328,613,001 | ||||
| Other Assets, Less Liabilities - (0.9)% | (2,805,700) | |||||
| Net Assets - 100.0% | $ | 325,807,301 | ||||
Derivative Contracts at 3/31/09
Futures contracts outstanding at 3/31/09
| Description | Contracts | Value | Expiration Date | Unrealized Appreciation (Depreciation) | |||||
| U.S. Treasury Bond 30 yr (Short) | 45 | $5,836,641 | Jun-09 | $(134,806 | ) |
At March 31, 2009, the fund had sufficient cash and/or other liquid securities to cover any commitments under these derivative contracts.
See Portfolio Footnotes and Notes to Financial Statements
30
Table of Contents
PORTFOLIO OF INVESTMENTS
3/31/09
MFS® PENNSYLVANIA MUNICIPAL BOND FUND
The Portfolio of Investments is a complete list of all securities owned by your fund. It is categorized by broad-based asset classes.
| Municipal Bonds - 96.9% | ||||||
| Issuer | Shares/Par | Value ($) | ||||
| Airport & Port Revenue - 1.4% | ||||||
| Allegheny County, PA, Airport Rev. (Pittsburgh International Airport), MBIA, 5.75%, 2014 | $ | 1,000,000 | $ | 1,013,970 | ||
| Allegheny County, PA, Airport Rev. (Pittsburgh International Airport), FGIC, 6.125%, 2017 | 500,000 | 501,210 | ||||
| $ | 1,515,180 | |||||
| General Obligations - General Purpose - 8.7% | ||||||
| Allegheny County, PA, Unrefunded Balance, “C53”, FGIC, 5.3%, 2018 | $ | 285,000 | $ | 297,691 | ||
| Allegheny County, PA, Unrefunded Balance, “C53”, FGIC, 5.4%, 2019 | 290,000 | 302,302 | ||||
| Bucks County, PA, Finance Department, 5.125%, 2022 | 255,000 | 282,986 | ||||
| Commonwealth of Puerto Rico, “A”, FGIC, 5.5%, 2015 | 280,000 | 273,736 | ||||
| Commonwealth of Puerto Rico, “A”, 5.375%, 2033 | 250,000 | 199,558 | ||||
| Commonwealth of Puerto Rico, “A”, 6%, 2038 | 425,000 | 368,318 | ||||
| Commonwealth of Puerto Rico, “A”, ETM, FGIC, 5.5%, 2015 (c)(u) | 1,860,000 | 2,201,924 | ||||
| Erie County, PA, Convention Center, FGIC, 5%, 2025 | 500,000 | 497,265 | ||||
| Erie County, PA, Convention Center, FGIC, 5%, 2026 | 500,000 | 492,155 | ||||
| Luzerne County, PA, MBIA, 5.25%, 2012 (c) | 500,000 | 565,380 | ||||
| Luzerne County, PA, “A”, FSA, 5%, 2027 | 1,000,000 | 1,015,440 | ||||
| North Huntingdon Township, PA, AMBAC, 5.25%, 2019 | 500,000 | 506,410 | ||||
| Pennsylvania Finance Authority Rev. (Penn Hills), “A”, FGIC, 5.45%, 2010 (c) | 85,000 | 91,361 | ||||
| Pennsylvania Finance Authority Rev. (Penn Hills), “A”, FGIC, 5.45%, 2019 | 415,000 | 420,619 | ||||
| Puerto Rico Public Buildings Authority Rev., Guaranteed, “M”, 6.25%, 2023 | 450,000 | 428,216 | ||||
| State of Pennsylvania, 6%, 2010 (c) | 1,000,000 | 1,052,900 | ||||
| State of Pennsylvania, 6.25%, 2010 | 300,000 | 320,007 | ||||
| $ | 9,316,268 | |||||
| General Obligations - Improvement - 0.5% | ||||||
| Pittsburgh, PA, FGIC, 5.75%, 2009 (c) | $ | 500,000 | $ | 510,825 | ||
| General Obligations - Schools - 20.2% | ||||||
| Allegheny Valley, PA, School District, “A”, MBIA, 5%, 2028 | $ | 1,000,000 | $ | 1,010,130 | ||
| Bucks County, PA, Centennial School District, “B”, FSA, 5.25%, 2037 | 1,000,000 | 979,590 | ||||
| Conneaut, PA, School District, “B”, FSA, 0%, 2031 | 1,150,000 | 324,806 | ||||
| Conneaut, PA, School District, “B”, FSA, 0%, 2033 | 760,000 | 188,100 | ||||
| Daniel Boone, PA, School District, 5%, 2032 | 500,000 | 491,845 | ||||
| Issuer | Shares/Par | Value ($) | ||||
| General Obligations - Schools - continued | ||||||
| Deer Lakes, PA, School District, ASSD GTY, 5.375%, 2034 | $ | 1,275,000 | $ | 1,290,236 | ||
| Garnet Valley, PA, School District, FGIC, 5.5%, 2015 | 750,000 | 804,203 | ||||
| Gateway, PA, Allegheny School District, FGIC, 5.2%, 2023 | 1,000,000 | 1,035,450 | ||||
| Gateway, PA, Allegheny School District, FGIC, 5%, 2032 | 740,000 | 717,097 | ||||
| North Allegheny, PA, School District, FGIC, 5.05%, 2022 | 590,000 | 599,517 | ||||
| North Schuylkill, PA, School District, FGIC, 5%, 2028 | 650,000 | 634,875 | ||||
| Palmyra, PA, School District, FGIC, 5.375%, 2016 | 820,000 | 871,119 | ||||
| Pennridge, PA, School District, MBIA, 5%, 2013 (c) | 50,000 | 56,149 | ||||
| Pennsylvania Public School Building (Garnet Valley School District), AMBAC, 5.5%, 2011 (c) | 1,005,000 | 1,083,641 | ||||
| Perkiomen Valley, PA, School District, FSA, 5%, 2011 (c) | 280,000 | 301,367 | ||||
| Perkiomen Valley, PA, School District, FSA, 5%, 2019 | 220,000 | 226,125 | ||||
| Philadelphia, PA, School District, MBIA, 6%, 2010 (c) | 500,000 | 524,730 | ||||
| Philadelphia, PA, School District, FSA, 5.75%, 2011 (c) | 500,000 | 542,805 | ||||
| Reading, PA, School District, FSA, 5%, 2035 | 2,240,000 | 2,185,859 | ||||
| Scranton, PA, School District, “A”, FSA, 5%, 2027 | 1,340,000 | 1,372,441 | ||||
| South Park, PA, School District, FGIC, 5%, 2019 | 750,000 | 767,310 | ||||
| State Public School Building Authority, PA School (Colonial Intermediate Unit 20), FGIC, 5%, 2030 | 500,000 | 457,995 | ||||
| State Public School Building Authority, PA School (Delaware County Community College), FSA, 5%, 2032 | 2,000,000 | 1,964,720 | ||||
| Upper Moreland, PA, School District, ASSD GTY, 5%, 2029 | 1,650,000 | 1,660,065 | ||||
| West Mifflin, PA, Area School District, FSA, 5.125%, 2031 | 500,000 | 502,425 | ||||
| Whitehall-Coplay, PA, School District, “A”, FSA, 5.375%, 2034 | 1,000,000 | 1,008,090 | ||||
| $ | 21,600,690 | |||||
| Healthcare Revenue - Hospitals - 15.1% | ||||||
| Allegheny County, PA, Hospital Development Authority Rev. (Jefferson Regional Medical Center), “A”, 4.75%, 2025 | $ | 850,000 | $ | 590,563 | ||
| Allegheny County, PA, Hospital Development Authority Rev. (South Hills Health Systems), “B”, 6.75%, 2010 (c) | 555,000 | 587,878 | ||||
31
Table of Contents
Portfolio of Investments – continued
| Municipal Bonds - continued | ||||||
| Issuer | Shares/Par | Value ($) | ||||
| Healthcare Revenue - Hospitals - continued | ||||||
| Allegheny County, PA, Hospital Development Authority Rev. (UPMC Health Systems), 5%, 2018 | $ | 500,000 | $ | 498,865 | ||
| Allegheny County, PA, Hospital Development Authority Rev. (UPMC Health Systems), MBIA, 5%, 2018 | 500,000 | 505,255 | ||||
| Allegheny County, PA, Hospital Development Authority Rev. (West Penn Allegheny Health), 9.25%, 2010 (c) | 150,000 | 172,215 | ||||
| Allegheny County, PA, Hospital Development Authority Rev. (West Penn Allegheny Health), “A”, 5%, 2028 | 500,000 | 289,080 | ||||
| Allegheny County, PA, Hospital Development Authority Rev. (West Penn Allegheny Health), “B”, 9.25%, 2010 (c) | 50,000 | 57,405 | ||||
| Centre County, PA, Hospital Authority Rev. (Mount Nittany Medical Center), ASSD GTY, 5.875%, 2029 | 500,000 | 503,405 | ||||
| Delaware County, PA, Authority Hospital Rev. (Crozer Keystone Obligations Group), “A”, 5%, 2031 | 500,000 | 331,405 | ||||
| Erie County, PA, Hospital Authority Rev. (Hamot Health Foundation), AMBAC, 5.25%, 2017 | 675,000 | 680,441 | ||||
| Lancaster County, PA, Hospital Authority Rev., 5.5%, 2013 (c) | 500,000 | 569,575 | ||||
| Lebanon County, PA, Health Facilities Authority Rev. (Good Samaritan Hospital), 5%, 2018 | 200,000 | 166,762 | ||||
| Lebanon County, PA, Health Facilities Authority Rev. (Good Samaritan Hospital), 6%, 2035 | 350,000 | 267,120 | ||||
| Lehigh County, PA, General Purpose Authority (Good Shepherd Group), “A”, 5.625%, 2034 | 350,000 | 309,043 | ||||
| Lehigh County, PA, General Purpose Authority (Lehigh Valley Health Network), “A”, FSA, 4.75%, 2038 | 1,000,000 | 846,650 | ||||
| Lehigh County, PA, General Purpose Authority (Lehigh Valley Hospital), MBIA, 7%, 2016 | 250,000 | 294,475 | ||||
| Lehigh County, PA, General Purpose Authority (Lehigh Valley Hospital), 5.25%, 2032 | 600,000 | 498,606 | ||||
| Lehigh County, PA, General Purpose Authority (St. Luke’s Bethlehem Hospital), 5.375%, 2013 (c) | 600,000 | 684,258 | ||||
| Lehigh County, PA, Hospital Rev. (Lehigh Valley Hospital), FSA, 5.25%, 2019 | 500,000 | 521,230 | ||||
| Lycoming County, PA, Authority Hospital Rev. (Williamsport Hospital Obligation Group), CONNIE LEE, 5.375%, 2010 | 395,000 | 395,000 | ||||
| Monroe County, PA, Hospital Authority Rev. (Pocono Medical Center), 6%, 2014 (c) | 750,000 | 879,923 | ||||
| Monroe County, PA, Hospital Authority Rev. (Pocono Medical Center), 5%, 2027 | 250,000 | 198,865 | ||||
| Monroe County, PA, Hospital Authority Rev. (Pocono Medical Center), 5.125%, 2037 | 250,000 | 189,875 | ||||
| Mount Lebanon, PA, Hospital Authority Rev. (St. Clair Memorial Hospital), 5.625%, 2032 | 400,000 | 340,692 | ||||
| Northampton County, PA, General Purpose Authority Hospital Rev. (St. Luke’s Hospital), “A”, 5.5%, 2040 | 500,000 | 403,065 | ||||
| Pennsylvania Higher Educational Facilities Authority Rev. (UPMC Health), 6.25%, 2018 | 100,000 | 104,443 | ||||
| Issuer | Shares/Par | Value ($) | ||||
| Healthcare Revenue - Hospitals - continued | ||||||
| Pennsylvania Higher Educational Facilities Authority Rev. (UPMC Health), 6%, 2031 | $ | 650,000 | $ | 657,716 | ||
| Philadelphia, PA, Health & Educational Facilities Rev. (Jeane Health), ETM, 6.6%, 2010 (c) | 60,000 | 62,423 | ||||
| Philadelphia, PA, Hospitals & Higher Education Facilities Authority (Children’s Hospital), MBIA, 4.5%, 2037 | 1,000,000 | 788,850 | ||||
| Philadelphia, PA, Hospitals & Higher Education Facilities Authority (Temple University Health System), 5.5%, 2026 | 1,000,000 | 756,710 | ||||
| Philadelphia, PA, Hospitals & Higher Education Facilities Authority (The Children’s Hospital Foundation), “A”, 4.5%, 2037 | 1,000,000 | 785,260 | ||||
| Sayre, PA, Health Care Facilities Authority Rev. (Guthrie Health), “A”, 5.875%, 2011 (c) | 385,000 | 435,616 | ||||
| Sayre, PA, Health Care Facilities Authority Rev. (Guthrie Health), “A”, 5.875%, 2031 | 115,000 | 103,763 | ||||
| South Central, PA, General Authority Rev., 5.625%, 2011 (c) | 490,000 | 540,392 | ||||
| South Central, PA, General Authority Rev. (Wellspan Health Properties, Inc.), “A”, 6%, 2025 | 750,000 | 775,065 | ||||
| South Central, PA, General Authority Rev. (Wellspan Health Properties, Inc.), ETM, 5.625%, 2026 (c) | 110,000 | 117,517 | ||||
| West Shore, PA, Hospital Authority Rev. (Holy Spirit Hospital), 6.25%, 2032 | 350,000 | 281,005 | ||||
| $ | 16,190,411 | |||||
| Healthcare Revenue - Long Term Care - 1.7% | ||||||
| Bucks County, PA, Industrial Development Authority Retirement Community Rev. (Ann’s Choice, Inc.), “A”, 6.125%, 2025 | $ | 250,000 | $ | 181,740 | ||
| Bucks County, PA, Industrial Development Authority Retirement Community Rev. (Ann’s Choice, Inc.), “A”, 6.25%, 2035 | 200,000 | 135,188 | ||||
| Bucks County, PA, Industrial Development Authority Rev. (Lutheran Community Telford Center), 5.75%, 2037 | 300,000 | 190,146 | ||||
| Chartiers Valley, PA, Industrial & Commercial Development Authority (Asbury Health Center Project), 5.75%, 2022 | 250,000 | 192,178 | ||||
| Cumberland County, PA, Municipal Authority Rev. (Presbyterian Homes), “A”, 5.45%, 2021 | 500,000 | 410,955 | ||||
| Cumberland County, PA, Municipal Authority, Retirement Community Rev. (Wesley), “A”, 7.25%, 2013 (c) | 110,000 | 131,089 | ||||
| Cumberland County, PA, Municipal Authority, Retirement Community Rev. (Wesley), “A”, 7.25%, 2013 (c) | 40,000 | 47,669 | ||||
| Lancaster County, PA, Hospital Authority Rev. (Willow Valley Retirement Project), 5.875%, 2031 | 500,000 | 413,800 | ||||
| Montgomery County, PA, Industrial Development Authority Rev. (Whitemarsh Continuing Care), 6.25%, 2035 | 250,000 | 147,835 | ||||
| $ | 1,850,600 | |||||
32
Table of Contents
Portfolio of Investments – continued
| Municipal Bonds - continued | ||||||
| Issuer | Shares/Par | Value ($) | ||||
| Human Services - 0.1% | ||||||
| Montgomery County, PA, Industrial Development Authority (Wordsworth Academy), 8%, 2024 | $ | 150,000 | $ | 126,134 | ||
| Industrial Revenue - Environmental Services - 0.9% | ||||||
| New Morgan, PA, Industrial Development Authority, Solid Waste Disposal Rev. (New Morgan Landfill Co., Inc./Browning Ferris, Inc.), 6.5%, 2019 | $ | 530,000 | $ | 497,781 | ||
| Westmoreland County, PA, Industrial Development Corp. (Waste Management), LOC, 5.1%, 2018 (b) | 500,000 | 499,685 | ||||
| $ | 997,466 | |||||
| Industrial Revenue - Other - 1.3% | ||||||
| Bucks County, PA, Industrial Development Authority Rev. (USX Corp.), 5.4%, 2017 (b) | $ | 300,000 | $ | 305,940 | ||
| Pennsylvania Economic Development Financing Authority Rev. (Amtrak), 6.125%, 2021 | 150,000 | 126,887 | ||||
| Pennsylvania Economic Development Financing Authority, Solid Waste Disposal Rev. (Procter & Gamble), 5.375%, 2031 | 1,000,000 | 837,460 | ||||
| Virgin Islands Public Finance Authority, Refinery Facilities Rev. (Hovensa Coker Project), 5.875%, 2022 | 270,000 | 184,316 | ||||
| $ | 1,454,603 | |||||
| Parking - 1.4% | ||||||
| Philadelphia, PA, Public Parking Authority Rev., FSA, 5.625%, 2015 | $ | 1,000,000 | $ | 1,016,290 | ||
| Pittsburgh, PA, Public Parking Authority Rev., AMBAC, 6%, 2010 (c) | 500,000 | 532,095 | ||||
| $ | 1,548,385 | |||||
| Sales & Excise Tax Revenue - 0.5% | ||||||
| Pittsburgh & Allegheny County, PA, Sales Tax Rev. (Public Auditorium Hotel Room), AMBAC, 5.25%, 2017 | $ | 500,000 | $ | 508,590 | ||
| Single Family Housing - Local - 1.1% | ||||||
| Allegheny County, PA, Residential Financing Authority, Single Family Mortgage Rev., “RR”, GNMA, 4.75%, 2025 | $ | 375,000 | $ | 346,448 | ||
| Allegheny County, PA, Residential Financing Authority, Single Family Mortgage Rev., “VV”, GNMA, 4.95%, 2037 | 880,000 | 805,341 | ||||
| $ | 1,151,789 | |||||
| Single Family Housing - State - 8.0% | ||||||
| Pennsylvania Housing Finance Agency Rev., “96 A”, 4.7%, 2037 | $ | 750,000 | $ | 597,038 | ||
| Pennsylvania Housing Finance Agency, Single Family Mortgage Rev., 5.1%, 2020 | 1,405,000 | 1,376,310 | ||||
| Pennsylvania Housing Finance Agency, Single Family Mortgage Rev., 5.25%, 2021 | 750,000 | 734,978 | ||||
| Issuer | Shares/Par | Value ($) | ||||
| Single Family Housing - State - continued | ||||||
| Pennsylvania Housing Finance Agency, Single Family Mortgage Rev., 5.25%, 2033 | $ | 295,000 | $ | 289,144 | ||
| Pennsylvania Housing Finance Agency, Single Family Mortgage Rev., 5%, 2034 | 355,000 | 350,541 | ||||
| Pennsylvania Housing Finance Agency, Single Family Mortgage Rev., “100-A”, 5.35%, 2033 | 995,000 | 895,172 | ||||
| Pennsylvania Housing Finance Agency, Single Family Mortgage Rev., “103-C”, 5.4%, 2033 | 1,000,000 | 983,980 | ||||
| Pennsylvania Housing Finance Agency, Single Family Mortgage Rev., “92-A”, 4.75%, 2031 | 1,165,000 | 997,275 | ||||
| Pennsylvania Housing Finance Agency, Single Family Mortgage Rev., “93-A”, 5.75%, 2037 | 575,000 | 577,645 | ||||
| Pennsylvania Housing Finance Agency, Single Family Mortgage Rev., “94-A”, 5.1%, 2031 | 500,000 | 453,880 | ||||
| Pennsylvania Housing Finance Agency, Single Family Mortgage Rev., “95-A”, 4.875%, 2031 | 1,000,000 | 869,860 | ||||
| Pennsylvania Housing Finance Agency, Single Family Mortgage Rev., “A”, 4.875%, 2026 | 500,000 | 461,095 | ||||
| $ | 8,586,918 | |||||
| Solid Waste Revenue - 0.3% | ||||||
| Delaware County, PA, Industrial Development Authority, Resource Recovery Facilities Rev. (American Ref-Fuel Co.), “A”, 6.2%, 2019 | $ | 300,000 | $ | 276,642 | ||
| State & Local Agencies - 3.5% | ||||||
| Delaware Valley, PA, Regional Finance Authority, AMBAC, 5.5%, 2018 | $ | 900,000 | $ | 1,001,223 | ||
| Delaware Valley, PA, Regional Finance Authority, RITES, AMBAC, 8.641%, 2018 (p) | 50,000 | 61,247 | ||||
| Northumberland County, PA (Country Careers & Arts Center), 6.65%, 2020 | 210,000 | 194,912 | ||||
| Philadelphia, PA, Industrial Development Authority, FSA, 5.125%, 2011 (c) | 1,000,000 | 1,108,240 | ||||
| Philadelphia, PA, Industrial Development Authority, FSA, 5.25%, 2011 (c) | 750,000 | 833,475 | ||||
| Philadelphia, PA, Industrial Development Authority, 5.5%, 2023 | 500,000 | 518,660 | ||||
| $ | 3,717,757 | |||||
| Student Loan Revenue - 1.4% | ||||||
| Pennsylvania Higher Education, Capital Acquisition Rev., MBIA, 5%, 2026 | $ | 1,500,000 | $ | 1,505,685 | ||
| Tax - Other - 0.6% | ||||||
| Pittsburgh & Allegheny County, PA, Sales Tax Rev. (Public Auditorium Hotel Room), AMBAC, 5.25%, 2013 | $ | 500,000 | $ | 508,360 | ||
| Virgin Islands Public Finance Authority Rev., “A”, 5.25%, 2024 | 135,000 | 110,839 | ||||
| $ | 619,199 | |||||
| Tax Assessment - 0.1% | ||||||
| Washington County, PA, Redevelopment Authority (Victory Centre Project), “A”, 5.45%, 2035 | $ | 250,000 | $ | 141,095 | ||
33
Table of Contents
Portfolio of Investments – continued
| Municipal Bonds - continued | ||||||
| Issuer | Shares/Par | Value ($) | ||||
| Tobacco - 0.1% | ||||||
| Virgin Islands Tobacco Settlement Financing Corp., 5%, 2021 | $ | 115,000 | $ | 93,588 | ||
| Toll Roads - 2.1% | ||||||
| Bay Area Toll Authority, Toll Bridge Rev. (San Francisco Bay Area), “F1”, 5%, 2039 | $ | 1,100,000 | $ | 1,024,210 | ||
| Pennsylvania Turnpike Commission, 5.5%, 2015 | 250,000 | 269,143 | ||||
| Pennsylvania Turnpike Commission, “A-1”, ASSD GTY, 5%, 2033 | 1,000,000 | 987,500 | ||||
| $ | 2,280,853 | |||||
| Transportation - Special Tax - 2.2% | ||||||
| Pennsylvania Turnpike Commission, MBIA, 5%, 2024 | $ | 1,775,000 | $ | 1,823,103 | ||
| Southeastern Pennsylvania Transportation Authority, Special Rev., FGIC, 5.25%, 2013 | 500,000 | 506,380 | ||||
| $ | 2,329,483 | |||||
| Universities - Colleges - 14.1% | ||||||
| Adams County, PA, Industrial Development Authority Rev. (Gettysburg College), “A”, 5.875%, 2021 | $ | 250,000 | $ | 254,448 | ||
| Allegheny County, PA, (Chatham College), 5.95%, 2032 | 335,000 | 262,486 | ||||
| Allegheny County, PA, Higher Education Building Authority Rev. (Duquesne University), 5%, 2033 | 500,000 | 452,750 | ||||
| Allegheny County, PA, Higher Education Building Authority Rev. (Duquesne University), “A”, XLCA, 5%, 2024 | 1,000,000 | 1,008,680 | ||||
| Allegheny County, PA, Higher Education Building Authority Rev. (Robert Morris University), “A”, 6%, 2038 | 250,000 | 176,500 | ||||
| Cumberland County, PA, Municipal Authority College Rev. (Dickinson College), AMBAC, 5.55%, 2010 (c) | 535,000 | 573,006 | ||||
| Cumberland County, PA, Municipal Authority College Rev. (Dickinson College), 5%, 2026 | 1,000,000 | 971,490 | ||||
| Delaware County, PA, Authority College Rev. (Neumann College), 6.125%, 2034 | 750,000 | 598,688 | ||||
| Erie, PA, Higher Educational Building Authority Rev. (Mercyhurst College), 5.5%, 2038 | 500,000 | 370,430 | ||||
| Erie, PA, Higher Educational Building Authority Rev. (Mercyhurst College), “B”, 5%, 2023 | 500,000 | 404,535 | ||||
| Harrisburg, PA, Harrisburg University of Science, “A”, 5.4%, 2016 | 125,000 | 118,270 | ||||
| Lancaster, PA, Higher Education Authority College Rev. (Franklin & Marshall College), 5%, 2037 | 500,000 | 447,140 | ||||
| Lycoming County, PA, (College of Technology), AMBAC, 5.25%, 2032 | 750,000 | 581,663 | ||||
| Northampton County, PA, General Purpose Authority Rev. (Lafayette College), 5%, 2034 | 250,000 | 248,560 | ||||
| Northampton County, PA, General Purpose Authority Rev. (Lehigh University), 5.5%, 2033 | 500,000 | 520,840 | ||||
| Issuer | Shares/Par | Value ($) | ||||
| Universities - Colleges - continued | ||||||
| Pennsylvania Higher Educational Facilities Authority Rev. (Allegheny College), 4.75%, 2031 | $ | 500,000 | $ | 436,300 | ||
| Pennsylvania Higher Educational Facilities Authority Rev. (Drexel University), 5.2%, 2032 | 500,000 | 466,285 | ||||
| Pennsylvania Higher Educational Facilities Authority Rev. (Drexel University), MBIA, 5%, 2037 | 630,000 | 594,626 | ||||
| Pennsylvania Higher Educational Facilities Authority Rev. (Marywood University), MBIA, 5.5%, 2010 (c) | 300,000 | 316,800 | ||||
| Pennsylvania Higher Educational Facilities Authority Rev. (Philadelphia University), 5.5%, 2020 | 500,000 | 431,355 | ||||
| Pennsylvania Higher Educational Facilities Authority Rev. (Widener University), 5.375%, 2029 | 300,000 | 252,714 | ||||
| Pennsylvania Higher Educational Facilities Authority Rev. (Widener University), 5%, 2031 | 300,000 | 235,866 | ||||
| Pennsylvania Public School Building Authority (Delaware County College), MBIA, 5.75%, 2010 (c) | 500,000 | 537,085 | ||||
| Pennsylvania State Higher Educational Facilities Authority Rev. (Lasalle University), 5.25%, 2027 | 500,000 | 404,850 | ||||
| Pennsylvania State University, “A”, 5%, 2029 | 1,000,000 | 1,010,340 | ||||
| Snyder County, PA, Higher Education Authority Rev. (Susquehanna University), 5%, 2038 | 1,000,000 | 912,020 | ||||
| State Public School Building Authority, PA, Jefferson County (Dubois Technical School), FGIC, 5%, 2026 | 1,000,000 | 984,290 | ||||
| Union County, PA, Higher Educational Facilities Financing Authority, University Rev. (Bucknell University), 5.25%, 2021 | 1,000,000 | 1,045,720 | ||||
| Wilkes-Barre, PA, Finance Authority Rev. (Wilkes University), 5%, 2037 | 750,000 | 490,080 | ||||
| $ | 15,107,817 | |||||
| Universities - Secondary Schools - 0.5% | ||||||
| Pennsylvania Economic Development Financing Authority (Germantown Friends School Project), 5.35%, 2031 | $ | 600,000 | $ | 575,790 | ||
| Utilities - Cogeneration - 0.1% | ||||||
| Carbon County, PA, Industrial Development Authority Rev. (Panther Creek Partners), 6.65%, 2010 | $ | 35,000 | $ | 35,051 | ||
| Pennsylvania Economic Development Financing Authority Rev., Resource Recovery Rev. (Colver), “G”, 5.125%, 2015 | 100,000 | 79,716 | ||||
| $ | 114,767 | |||||
| Utilities - Municipal Owned - 1.5% | ||||||
| Philadelphia, PA, Gas Works Rev., FSA, 5.5%, 2009 (c)(f) | $ | 1,000,000 | $ | 1,022,510 | ||
| Philadelphia, PA, Gas Works Rev., FSA, 5.5%, 2011 (c) | 500,000 | 552,735 | ||||
| $ | 1,575,245 | |||||
34
Table of Contents
Portfolio of Investments – continued
| Municipal Bonds - continued | ||||||
| Issuer | Shares/Par | Value ($) | ||||
| Water & Sewer Utility Revenue - 9.5% | ||||||
| Allegheny County, PA, Sewer Rev., MBIA, 5.75%, 2010 (c) | $ | 750,000 | $ | 809,400 | ||
| Bucks County, PA, (Suburban Water Co.), FGIC, 5.55%, 2032 | 1,000,000 | 883,940 | ||||
| Cambridge, PA, Area Joint Authority Guaranteed Sewer Rev., 6%, 2037 | 500,000 | 435,100 | ||||
| Commonwealth of Puerto Rico Aqueduct & Sewer Authority Rev., “A”, 6%, 2044 | 1,000,000 | 839,710 | ||||
| Commonwealth of Puerto Rico Aqueduct & Sewer Authority Rev., “A”, ASSD GTY, 5.125%, 2047 | 775,000 | 687,332 | ||||
| Erie, PA, Water Authority Rev., FSA, 5%, 2043 | 1,000,000 | 922,880 | ||||
| Fairview Township, PA, Sewer Rev., FGIC, 5.05%, 2018 | 750,000 | 772,238 | ||||
| Harrisburg, PA, Water Authority Rev., 5.25%, 2031 | 1,000,000 | 945,940 | ||||
| Lancaster County, PA, Water & Sewer Authority Rev., MBIA, 5%, 2028 | 440,000 | 429,977 | ||||
| Issuer | Shares/Par | Value ($) | ||||
| Water & Sewer Utility Revenue - continued | ||||||
| Unity Township, PA, Municipal Authority Sewer Rev., FSA, 5%, 2034 | $ | 1,660,000 | $ | 1,608,573 | ||
| University Area Joint Authority, Sewer Rev., MBIA, 5%, 2023 | 1,500,000 | 1,309,940 | ||||
| Virgin Islands Water & Power Authority Rev., RADIAN, 5.3%, 2018 | 500,000 | 500,640 | ||||
| $ | 10,145,670 | |||||
| Total Municipal Bonds (Identified Cost, $108,331,575) | $ | 103,841,450 | ||||
| Money Market Funds (v) - 2.2% | ||||||
| MFS Institutional Money Market Portfolio, 0.23%, at Cost and Net Asset Value | 2,386,723 | $ | 2,386,723 | |||
| Total Investments (Identified Cost, $110,718,298) | $ | 106,228,173 | ||||
| Other Assets, Less Liabilities - 0.9% | 914,980 | |||||
| Net Assets - 100.0% | $ | 107,143,153 | ||||
Derivative Contracts at 3/31/09
Futures contracts outstanding at 3/31/09
| Description | Contracts | Value | Expiration Date | Unrealized Appreciation (Depreciation) | |||||
| U.S. Treasury Bond 30 yr (Short) | 16 | $2,075,250 | Jun-09 | $(47,931 | ) |
At March 31, 2009, the fund had sufficient cash and/or other liquid securities to cover any commitments under these derivative contracts.
See Portfolio Footnotes and Notes to Financial Statements
35
Table of Contents
PORTFOLIO OF INVESTMENTS
3/31/09
MFS® SOUTH CAROLINA MUNICIPAL BOND FUND
The Portfolio of Investments is a complete list of all securities owned by your fund. It is categorized by broad-based asset classes.
| Municipal Bonds - 97.0% | ||||||
| Issuer | Shares/Par | Value ($) | ||||
| Airport & Port Revenue - 2.1% | ||||||
| Horry County, SC, “A”, FSA, 5.7%, 2027 | $ | 635,000 | $ | 620,858 | ||
| Richland Lexington, SC, Airport Rev. (Columbia Airport), FSA, 5.125%, 2025 | 1,500,000 | 1,384,334 | ||||
| Richland Lexington, SC, Airport Rev. (Columbia Airport), “A”, FSA, 5%, 2026 | 1,000,000 | 1,001,449 | ||||
| $ | 3,006,641 | |||||
| General Obligations - General Purpose - 7.0% | ||||||
| Clinton, SC, Laurens County School District, ASSD GTY, 6.125%, 2033 | $ | 1,000,000 | $ | 1,066,089 | ||
| Commonwealth of Puerto Rico, “A”, 5.375%, 2033 | 345,000 | 275,389 | ||||
| Commonwealth of Puerto Rico, “A”, 6%, 2038 | 560,000 | 485,313 | ||||
| Commonwealth of Puerto Rico, Public Improvement, MBIA, 5.75%, 2010 (c) | 4,000,000 | 4,234,319 | ||||
| Hilton Head Island, SC, Rev., MBIA, 5.125%, 2022 | 1,000,000 | 1,034,119 | ||||
| Horry County, SC, 4.5%, 2028 | 850,000 | 837,199 | ||||
| Horry County, SC, Hospital Fee Special Obligation, 6%, 2015 | 915,000 | 953,522 | ||||
| Tuscaloosa, AL, “A”, 5.125%, 2039 | 980,000 | 955,823 | ||||
| $ | 9,841,773 | |||||
| General Obligations - Improvement - 0.1% | ||||||
| Guam Government, “A”, 5.25%, 2037 | $ | 280,000 | $ | 183,865 | ||
| General Obligations - Schools - 8.6% | ||||||
| Anderson County, SC, School District, “B”, 5.5%, 2010 (c) | $ | 1,465,000 | $ | 1,546,073 | ||
| Beaufort County, SC, School District, “A”, FSA, 4.25%, 2032 | 1,000,000 | 890,370 | ||||
| Chesterfield County, SC, School District, FSA, 5%, 2023 | 3,000,000 | 3,070,800 | ||||
| Orangeburg County, SC, Consolidated School District, FSA, 5.25%, 2020 | 1,065,000 | 1,114,022 | ||||
| Orangeburg County, SC, Consolidated School District, FSA, 5.375%, 2022 | 2,050,000 | 2,160,147 | ||||
| Richland County, SC, School District, 5.1%, 2021 | 1,750,000 | 1,803,568 | ||||
| York County, SC, School District, 5%, 2030 | 1,570,000 | 1,582,843 | ||||
| $ | 12,167,823 | |||||
| Healthcare Revenue - Hospitals - 16.1% | ||||||
| Charleston County, SC, Hospital Facilities Rev. (Medical Society Health), ETM, MBIA, 5%, 2022 (c) | $ | 2,450,000 | $ | 2,473,961 | ||
| Florence County, SC, Hospital Rev. (McLeod Regional Medical Center), “A”, FSA, 5.25%, 2034 | 1,050,000 | 956,981 | ||||
| Greenville, SC, Hospital Systems, Hospital Facilities Rev., 6%, 2020 | 3,400,000 | 3,655,952 | ||||
| Greenwood County, SC, Hospital Facilities Rev. (Self Memorial Hospital), 5.5%, 2021 | 1,000,000 | 988,440 | ||||
| Issuer | Shares/Par | Value ($) | ||||
| Healthcare Revenue - Hospitals - continued | ||||||
| Lexington County, SC, Health Services District, Inc., Hospital Rev., 5.5%, 2014 (c) | $ | 250,000 | $ | 288,908 | ||
| Lexington County, SC, Health Services District, Inc., Hospital Rev., 5.5%, 2014 (c) | 250,000 | 288,908 | ||||
| Lexington County, SC, Health Services District, Inc., Hospital Rev., 5%, 2032 | 1,500,000 | 1,203,315 | ||||
| Lexington County, SC, Health Services District, Inc., Hospital Rev., Refunding & Improvement, 5.5%, 2013 (c) | 1,000,000 | 1,157,110 | ||||
| Louisville & Jefferson County, KY, Metropolitan Government Healthcare Systems Rev. (Norton Healthcare, Inc.), 5.25%, 2036 | 820,000 | 633,712 | ||||
| Royal Oak, MI, Hospital Finance Authority Rev. (William Beaumont Hospital), 8.25%, 2039 | 915,000 | 975,262 | ||||
| South Carolina Jobs & Economic Development Authority (Bon Secours-St. Francis Medical Center, Inc.), 5.625%, 2012 (c) | 260,000 | 297,417 | ||||
| South Carolina Jobs & Economic Development Authority (Bon Secours-St. Francis Medical Center, Inc.), 5.625%, 2030 | 990,000 | 861,765 | ||||
| South Carolina Jobs & Economic Development Authority, Hospital Facilities Rev. (Georgetown Memorial Hospital), AMBAC, 6%, 2014 | 1,000,000 | 1,016,610 | ||||
| South Carolina Jobs & Economic Development Authority, Hospital Facilities Rev. (Georgetown Memorial Hospital), RADIAN, 5.25%, 2021 | 1,500,000 | 1,318,530 | ||||
| South Carolina Jobs & Economic Development Authority, Hospital Facilities Rev. (Georgetown Memorial Hospital), AMBAC, 5%, 2023 | 1,000,000 | 889,440 | ||||
| South Carolina Jobs & Economic Development Authority, Hospital Facilities Rev. (Kershaw Country Medical Center), 6%, 2038 | 750,000 | 607,620 | ||||
| South Carolina Jobs & Economic Development Authority, Hospital Facilities Rev. (Palmetto Health Alliance), 6.25%, 2031 | 750,000 | 651,233 | ||||
| South Carolina Jobs & Economic Development Authority, Hospital Facilities Rev. (Palmetto Health), FSA, 5%, 2035 | 650,000 | 531,876 | ||||
| South Carolina Jobs & Economic Development Authority, Hospital Facilities Rev. (Tuomey Health), CIFG, 5%, 2030 | 1,000,000 | 783,640 | ||||
| Spartanburg County, SC, Health Service Rev., “A”, ASSD GTY, 4.5%, 2027 | 1,000,000 | 816,630 | ||||
| Spartanburg County, SC, Health Services District, Inc., Hospital Rev., FSA, 5.25%, 2012 (c) | 1,425,000 | 1,584,215 | ||||
| Spartanburg County, SC, Health Services District, Inc., Hospital Rev., FSA, 5.25%, 2032 | 825,000 | 754,982 | ||||
| $ | 22,736,507 | |||||
| Healthcare Revenue - Long Term Care - 0.8% | ||||||
| South Carolina Jobs & Economic Development Authority Rev. (Woodlands at Furman), “A”, 6%, 2042 | $ | 500,000 | $ | 292,515 | ||
36
Table of Contents
Portfolio of Investments – continued
| Municipal Bonds - continued | ||||||
| Issuer | Shares/Par | Value ($) | ||||
| Healthcare Revenue - Long Term Care - continued | ||||||
| South Carolina Jobs & Economic Development Authority Rev., (Lutheran Homes of South Carolina), 5.625%, 2042 | $ | 400,000 | $ | 252,188 | ||
| South Carolina Jobs & Economic Development Authority, Health & Facilities Rev., First Mortgage (Wesley Commons), 5.125%, 2026 | 400,000 | 255,296 | ||||
| South Carolina Jobs & Economic Development Authority, Residential Care Facilities Rev. (Episcopal Home), “A”, 6.375%, 2032 | 400,000 | 296,084 | ||||
| $ | 1,096,083 | |||||
| Human Services - 0.7% | ||||||
| Greenville County, SC, Hospital Rev. (Chestnut Hill), “A”, 8%, 2015 | $ | 1,115,000 | $ | 1,008,718 | ||
| Industrial Revenue - Chemicals - 0.4% | ||||||
| York County, SC, Industrial Rev. (Hoechst Celanese), 5.7%, 2024 | $ | 1,000,000 | $ | 555,520 | ||
| Industrial Revenue - Other - 1.1% | ||||||
| Calhoun County, SC, Solid Waste Disposal Facilities Rev. (Carolina Eastman Co.), ETM, 6.75%, 2017 (c) | $ | 1,000,000 | $ | 1,225,350 | ||
| Virgin Islands Public Finance Authority, Refinery Facilities Rev. (Hovensa Coker Project), 5.875%, 2022 | 385,000 | 262,820 | ||||
| $ | 1,488,170 | |||||
| Industrial Revenue - Paper - 0.5% | ||||||
| Richland County, SC, Environmental Improvement Rev. (International Paper), “A”, 6.1%, 2023 | $ | 1,000,000 | $ | 702,200 | ||
| Miscellaneous Revenue - Entertainment & Tourism - 1.2% | ||||||
| South Carolina Jobs & Economic Development Authority Rev. (Myrtle Beach Convention), “B”, MBIA, 5.125%, 2018 | $ | 570,000 | $ | 569,390 | ||
| South Carolina Jobs & Economic Development Authority Rev. (Myrtle Beach Convention), “B”, MBIA, 5.125%, 2019 | 595,000 | 586,997 | ||||
| South Carolina Jobs & Economic Development Authority Rev. (Myrtle Beach Convention), “B”, MBIA, 5.125%, 2020 | 630,000 | 610,193 | ||||
| $ | 1,766,580 | |||||
| Multi-Family Housing Revenue - 1.4% | ||||||
| North Charleston SC, Housing Authority Rev. (Horizon Village), “A”, GNMA, 5%, 2038 | $ | 1,000,000 | $ | 854,460 | ||
| North Charleston SC, Housing Authority Rev. (Horizon Village), “A”, GNMA, 5.1%, 2041 | 1,210,000 | 1,075,569 | ||||
| $ | 1,930,029 | |||||
| Sales & Excise Tax Revenue - 0.4% | ||||||
| Puerto Rico Sales Tax Financing Corp., Sales Tax Rev., 5.25%, 2057 | $ | 735,000 | $ | 597,834 | ||
| Issuer | Shares/Par | Value ($) | ||||
| Single Family Housing - State - 4.6% | ||||||
| South Carolina Housing, Finance & Development Authority Mortgage Rev., “A-2”, FSA, 5.5%, 2034 | $ | 600,000 | $ | 589,374 | ||
| South Carolina Housing, Finance & Development Authority Mortgage Rev., “A-2”, FSA, 5.2%, 2035 | 940,000 | 848,745 | ||||
| South Carolina Housing, Finance & Development Authority Rev., 5.55%, 2038 | 1,000,000 | 944,770 | ||||
| South Carolina Housing, Finance & Development Authority Rev., “A-2”, FSA, 6%, 2020 | 370,000 | 376,342 | ||||
| South Carolina Housing, Finance & Development Authority Rev., “A-2”, FSA, 5.35%, 2024 | 1,635,000 | 1,624,749 | ||||
| South Carolina Housing, Finance & Development Authority Rev., “A-2”, AMBAC, 5.15%, 2037 | 995,000 | 884,177 | ||||
| South Carolina Housing, Finance & Development Authority Rev., “C-2”, FSA, 4.6%, 2032 | 1,500,000 | 1,230,285 | ||||
| $ | 6,498,442 | |||||
| Solid Waste Revenue - 0.7% | ||||||
| Three Rivers, SC, Solid Waste Authority Rev., 5%, 2028 | $ | 1,000,000 | $ | 942,910 | ||
| State & Local Agencies - 3.4% | ||||||
| North Charleston, SC, Municipal Golf Course Mortgage Rev., 5.5%, 2009 (c) | $ | 1,000,000 | $ | 1,013,980 | ||
| Puerto Rico Public Finance Corp., “A”, AMBAC, 5.375%, 2013 | 2,750,000 | 3,106,978 | ||||
| Spartanburg, SC, Public Facilities Corp. (Renaissance Park), AMBAC, 5.125%, 2025 | 685,000 | 699,364 | ||||
| $ | 4,820,322 | |||||
| Tax - Other - 3.7% | ||||||
Commonwealth of Puerto Rico, 5.5%, 2010 (c) | $ | 4,000,000 | $ | 4,205,600 | ||
| New York, NY, City Transitional Finance Authority Building Aid Rev., “S-3”, 5.25%, 2039 | 1,000,000 | 939,850 | ||||
| Virgin Islands Public Finance Authority Rev., “A”, 5.25%, 2024 | 180,000 | 147,785 | ||||
| $ | 5,293,235 | |||||
| Tax Assessment - 0.2% | ||||||
| Lancaster County, SC, Assessment Rev. (Sun City Carolina Lakes), 5.45%, 2037 | $ | 495,000 | $ | 279,992 | ||
| Tobacco - 0.8% | ||||||
| South Carolina Tobacco Settlement Authority Rev., “B”, 6.375%, 2011 (c) | $ | 1,000,000 | $ | 1,094,500 | ||
| Toll Roads - 1.0% | ||||||
| Bay Area Toll Authority, Toll Bridge Rev. (San Francisco Bay Area), “F1”, 5%, 2039 | $ | 1,480,000 | $ | 1,378,028 | ||
| Transportation - Special Tax - 4.6% | ||||||
| South Carolina Transportation Infrastructure Rev., “A”, AMBAC, 5%, 2023 | $ | 500,000 | $ | 507,365 | ||
| South Carolina Transportation Infrastructure Rev., “A”, AMBAC, 5%, 2027 | 2,000,000 | 1,985,680 | ||||
37
Table of Contents
Portfolio of Investments – continued
| Municipal Bonds - continued | ||||||
| Issuer | Shares/Par | Value ($) | ||||
| Transportation - Special Tax - continued | ||||||
| South Carolina Transportation Infrastructure Rev., “A”, AMBAC, 5%, 2033 | $ | 2,500,000 | $ | 2,411,050 | ||
| South Carolina Transportation Infrastructure Rev., “A”, AMBAC, 5%, 2033 | 1,645,000 | 1,586,471 | ||||
| $ | 6,490,566 | |||||
| Universities - Colleges - 14.1% | ||||||
| College of Charleston, SC, Academic & Administrative Facilities Rev., “B”, XLCA, 5%, 2024 | $ | 800,000 | $ | 800,000 | ||
| College of Charleston, SC, Academic & Administrative Facilities Rev., “B”, XLCA, 5.125%, 2034 | 1,510,000 | 1,372,197 | ||||
| College of Charleston, SC, Higher Education Facility Rev., “A”, FGIC, 5.25%, 2028 | 2,435,000 | 2,403,321 | ||||
| Educational Facilities Authority Private Non-Profit Institutions of Higher Learning (Wofford College), “A”, 5%, 2036 | 1,000,000 | 849,550 | ||||
| South Carolina Educational Facilities Authority (Furman University), AMBAC, 5.375%, 2020 | 1,245,000 | 1,271,606 | ||||
| South Carolina Educational Facilities Authority (Furman University), AMBAC, 5.5%, 2030 | 2,000,000 | 2,001,840 | ||||
| South Carolina Educational Facilities Authority (Furman University), 5%, 2038 | 2,000,000 | 1,891,060 | ||||
| South Carolina Educational Facilities Authority (Wofford College), 5.25%, 2032 | 1,000,000 | 963,810 | ||||
| South Carolina Jobs & Economic Development Authority, Student Housing Rev. (Francis Marion University), “A”, MBIA, 5%, 2034 | 1,345,000 | 1,250,514 | ||||
| University of South Carolina Athletic Facilities Rev., “A”, 5.5%, 2038 | 1,000,000 | 1,027,270 | ||||
| University of South Carolina, Higher Education Rev., “A”, 5%, 2039 | 1,000,000 | 981,590 | ||||
| University of South Carolina, University Rev., “A”, FGIC, 5.625%, 2010 (c) | 1,555,000 | 1,648,082 | ||||
| University of South Carolina, University Rev., “A”, AMBAC, 5%, 2034 | 1,815,000 | 1,809,773 | ||||
| University of South Carolina, University Rev., “A”, FSA, 5.25%, 2038 | 1,625,000 | 1,637,805 | ||||
| $ | 19,908,418 | |||||
| Utilities - Investor Owned - 1.3% | ||||||
| Orangeburg County, SC, Solid Waste Disposal Facilities Rev., Electric & Gas, AMBAC, 5.7%, 2024 | $ | 2,000,000 | $ | 1,819,080 | ||
| Utilities - Municipal Owned - 8.0% | ||||||
| Camden, SC, Public Utilities Rev., MBIA, 5.5%, 2017 | $ | 75,000 | $ | 75,018 | ||
| Easley, SC, Utility Rev., FSA, 5%, 2012 (c)(f) | 1,000,000 | 1,127,260 | ||||
| Greenwood, SC, Combined Public Utility, Refunding & Improvement Systems, MBIA, 5%, 2021 | 175,000 | 180,562 | ||||
| Piedmont, SC, Municipal Power Agency, FGIC, 6.25%, 2021 | 2,700,000 | 2,778,948 | ||||
| Issuer | Shares/Par | Value ($) | ||||
| Utilities - Municipal Owned - continued | ||||||
| Puerto Rico Electric Power Authority, “TT”, 5%, 2027 | $ | 530,000 | $ | 433,307 | ||
| South Carolina Public Service Authority Rev. “A”, 5.5%, 2038 | 2,500,000 | 2,552,725 | ||||
| South Carolina Public Service Authority, “A”, MBIA, 5.5%, 2010 (c) | 200,000 | 209,412 | ||||
| South Carolina Public Service Authority, “A”, AMBAC, 5%, 2034 | 2,000,000 | 1,922,980 | ||||
| South Carolina Public Service Authority, “A”, AMBAC, 5%, 2037 | 510,000 | 503,926 | ||||
| South Carolina Public Service Authority, “B”, FSA, 5.125%, 2037 | 1,500,000 | 1,503,495 | ||||
| $ | 11,287,633 | |||||
| Utilities - Other - 0.3% | ||||||
| Tennessee Energy Acquisition Corp., Gas Rev., “A”, 5.25%, 2026 | $ | 570,000 | $ | 399,205 | ||
| Water & Sewer Utility Revenue - 13.9% | ||||||
| Anderson County, SC, Joint Municipal Water, FSA, 5%, 2032 | $ | 1,000,000 | $ | 1,002,020 | ||
| Anderson County, SC, Water & Sewer Systems Rev., FGIC, 5.125%, 2032 | 2,000,000 | 1,945,560 | ||||
| Anderson County, SC, Water & Sewer Systems Rev., ASSD GTY, 5%, 2034 | 1,000,000 | 983,020 | ||||
| Beaufort-Jasper, SC, Waterworks & Sewer Systems Rev., FSA, 4.5%, 2031 | 1,000,000 | 927,940 | ||||
| Charleston, SC, Waterworks & Sewer Rev., Capital Improvement, “B”, 5%, 2013 (c) | 1,000,000 | 1,121,130 | ||||
| Columbia, SC, Waterworks & Sewer Systems Rev., 6%, 2010 (c) | 2,000,000 | 2,090,740 | ||||
| Columbia, SC, Waterworks & Sewer Systems Rev., FSA, 5%, 2029 | 1,020,000 | 1,035,892 | ||||
| Commonwealth of Puerto Rico Aqueduct & Sewer Authority Rev., “A”, 6%, 2044 | 2,000,000 | 1,679,420 | ||||
| Greenville, SC, Stormwater Systems, FSA, 5%, 2022 | 595,000 | 614,689 | ||||
| Greenwood, SC, Sewer Systems Rev., FSA, 5%, 2030 | 1,000,000 | 988,320 | ||||
| Lugoff-Elgin, SC, Water Authority Waterworks Systems Rev., MBIA, 5.125%, 2032 | 920,000 | 892,575 | ||||
| Myrtle Beach, SC, Water & Sewer Authority Rev., FSA, 4.5%, 2028 | 2,000,000 | 1,866,560 | ||||
| Rock Hill, SC, Utility Systems Rev., Refunding & Improvement, “A”, FSA, 5.375%, 2023 | 500,000 | 529,720 | ||||
| Spartanburg, SC, Water & Sewer Authority Rev., “B”, MBIA, 5.25%, 2030 | 1,250,000 | 1,258,538 | ||||
| Spartanburg, SC, Waterworks Rev., “A”, FSA, 4.375%, 2028 | 750,000 | 682,718 | ||||
| Sumter, SC, Waterworks & Sewer Systems Rev., XLCA, 5%, 2025 | 540,000 | 539,962 | ||||
| York County, SC, Water & Sewer Rev., Refunding & Capital Improvement, MBIA, 5%, 2027 | 1,490,000 | 1,501,592 | ||||
| $ | 19,660,396 | |||||
| Total Municipal Bonds (Identified Cost, $139,900,575) | $ | 136,954,470 | ||||
38
Table of Contents
Portfolio of Investments – continued
| Money Market Funds (v) - 1.2% | |||||
| Issuer | Shares/Par | Value ($) | |||
| MFS Institutional Money Market Portfolio, 0.23%, at Cost and Net Asset Value | 1,723,307 | $ | 1,723,307 | ||
| Total Investments (Identified Cost, $141,623,882) | $ | 138,677,777 | |||
| Other Assets, Less Liabilities - 1.8% | 2,472,252 | ||||
| Net Assets - 100.0% | $ | 141,150,029 | |||
Derivative Contracts at 3/31/09
Futures contracts outstanding at 3/31/09
| Description | Contracts | Value | Expiration Date | Unrealized Appreciation (Depreciation) | |||||
| U.S. Treasury Bond 30 yr (Short) | 13 | $1,686,141 | Jun-09 | $(38,944 | ) |
At March 31, 2009, the fund had sufficient cash and/or other liquid securities to cover any commitments under these derivative contracts.
See Portfolio Footnotes and Notes to Financial Statements
39
Table of Contents
PORTFOLIO OF INVESTMENTS
3/31/09
MFS® TENNESSEE MUNICIPAL BOND FUND
The Portfolio of Investments is a complete list of all securities owned by your fund. It is categorized by broad-based asset classes.
| Municipal Bonds - 98.0% | ||||||
| Issuer | Shares/Par | Value ($) | ||||
| Airport & Port Revenue - 1.3% | ||||||
| Memphis-Shelby County, TN, Airport Authority Facilities Rev., FSA, 5.125%, 2021 | $ | 1,500,000 | $ | 1,499,265 | ||
| General Obligations - General Purpose - 5.7% | ||||||
| Blount County, TN, Public Building Authority, “B”, ASSD GTY, 4.75%, 2037 | $ | 1,500,000 | $ | 1,386,090 | ||
| Commonwealth of Puerto Rico, “A”, 5.375%, 2033 | 270,000 | 215,522 | ||||
| Commonwealth of Puerto Rico, “A”, 6%, 2038 | 455,000 | 394,317 | ||||
| Commonwealth of Puerto Rico, Unrefunded Public Improvement, FSA, 5%, 2024 | 770,000 | 741,310 | ||||
| Metropolitan Government of Nashville & Davidson County, TN, 5%, 2028 | 2,000,000 | 2,052,580 | ||||
| Puerto Rico Public Buildings Authority Rev., Guaranteed, “L”, 5.5%, 2021 | 1,000,000 | 895,980 | ||||
| Puerto Rico Public Buildings Authority Rev., Guaranteed, “M”, 6.25%, 2023 | 480,000 | 456,763 | ||||
| Puerto Rico Public Buildings Authority Rev., Guaranteed, “M”, 6.25%, 2031 | 525,000 | 478,459 | ||||
| $ | 6,621,021 | |||||
| General Obligations - Improvement - 0.6% | ||||||
| Guam Government, “A”, 5.25%, 2037 | $ | 215,000 | $ | 141,182 | ||
| Sevier County, TN, Public Building Authority, ASSD GTY, 4.75%, 2025 | 550,000 | 553,003 | ||||
| $ | 694,185 | |||||
| General Obligations - Schools - 5.7% | ||||||
| Gibson County, TN, School District, MBIA, 5.75%, 2016 | $ | 190,000 | $ | 190,165 | ||
| Rutherford County, TN, School & Public Improvement, 5%, 2022 | 1,510,000 | 1,563,001 | ||||
| Rutherford County, TN, School District, 5.875%, 2010 (c) | 2,000,000 | 2,107,540 | ||||
| Rutherford County, TN, School District, 5.875%, 2010 (c) | 1,100,000 | 1,159,147 | ||||
| Williamson County, TN, Rural School, 6.125%, 2010 (c) | 1,575,000 | 1,656,175 | ||||
| $ | 6,676,028 | |||||
| Healthcare Revenue - Hospitals - 14.5% | ||||||
| Chattanooga, TN, Health Educational & Housing Facility Board Rev. (Catholic Health Initiatives), “D”, 6.25%, 2033 | $ | 1,000,000 | $ | 1,045,880 | ||
| Indiana Finance Authority Rev. (Sisters of St. Francis Health Services), 5.375%, 2032 | 860,000 | 797,736 | ||||
| Johnson City, TN, Health & Education Financing Authority Rev. (Johnson City Medical Center Hospital), ETM, MBIA, 5%, 2018 (c) | 1,500,000 | 1,528,560 | ||||
| Johnson City, TN, Health & Educational Facilities Board Hospital Rev., 5.5%, 2031 | 400,000 | 303,844 | ||||
| Issuer | Shares/Par | Value ($) | ||||
| Healthcare Revenue - Hospitals - continued | ||||||
| Johnson City, TN, Health & Educational Facilities Board Hospital Rev. (Mountain States Health), “A”, 5.5%, 2036 | $ | 600,000 | $ | 442,878 | ||
| Knox County, TN, Health, Educational, Hospital & Housing Facilities Board Rev. (Baptist Health Systems), 6.5%, 2031 | 300,000 | 299,985 | ||||
| Knox County, TN, Health, Educational, Hospital & Housing Facilities Board Rev. (Catholic Healthcare Partners), 5.25%, 2030 | 1,000,000 | 890,030 | ||||
| Knox County, TN, Health, Educational, Hospital & Housing Facilities Board Rev. (Covenant Health), “A”, 0%, 2036 | 4,000,000 | 461,920 | ||||
| Knox County, TN, Health, Educational, Hospital & Housing Facilities Board Rev. (Fort Sanders), MBIA, 5.75%, 2014 | 3,250,000 | 3,441,490 | ||||
| Knox County, TN, Health, Educational, Hospital & Housing Facilities Board Rev. (University Health Systems, Inc.), 5.25%, 2036 | 1,000,000 | 740,190 | ||||
| Knox County, TN, Health, Educational, Hospital & Housing Facilities Board Rev., “A”, FSA, 5%, 2013 (c)(f) | 545,000 | 608,912 | ||||
| Knox County, TN, Health, Educational, Hospital & Housing Facilities Board Rev., “A”, FSA, 5%, 2022 | 455,000 | 411,875 | ||||
| Louisville & Jefferson County, KY, Metropolitan Government Healthcare Systems Rev. (Norton Healthcare, Inc.), 5.25%, 2036 | 675,000 | 521,653 | ||||
| Shelby County, TN, Health, Educational & Housing Facilities Board Rev. (Methodist Healthcare), 6.5%, 2012 (c) | 625,000 | 722,425 | ||||
| Shelby County, TN, Health, Educational & Housing Facilities Board Rev. (Methodist Healthcare), 6.5%, 2012 (c) | 375,000 | 433,455 | ||||
| Shelby County, TN, Health, Educational & Housing Facilities Board Rev. (Methodist Healthcare), 5%, 2031 | 500,000 | 483,845 | ||||
| Shelby County, TN, Health, Educational & Housing Facilities Board Rev. (Methodist Healthcare), 5%, 2036 | 1,250,000 | 1,196,275 | ||||
| Shelby County, TN, Health, Educational & Housing Facilities Board Rev. (Methodist Healthcare), “B”, FSA, 5.25%, 2027 | 1,500,000 | 1,505,220 | ||||
| Sullivan County, TN, Health, Educational & Housing Facilities Board Hospital Rev. (Wellmont Health Systems Project), “C”, 5.25%, 2036 | 635,000 | 351,206 | ||||
| Sumner County, TN, Health, Educational & Housing Facilities Board Rev. (Sumner Regional Health), “A”, 5.5%, 2046 | 1,000,000 | 482,490 | ||||
| Tarrant County, TX, Cultural Education Facilities Finance Corp. (Scott & White Memorial Hospital), “A”, 5.5%, 2031 | 225,000 | 211,025 | ||||
| $ | 16,880,894 | |||||
40
Table of Contents
Portfolio of Investments – continued
| Municipal Bonds - continued | ||||||
| Issuer | Shares/Par | Value ($) | ||||
| Healthcare Revenue - Long Term Care - 0.4% | ||||||
| Blount County, TN, Health & Educational Facilities Board Rev. (Asbury, Inc.), “A”, 5.125%, 2023 | $ | 500,000 | $ | 346,595 | ||
| Shelby County, TN, Health, Educational & Housing Facilities Board Rev. (Germantown Village), “A”, 7.25%, 2034 | 250,000 | 187,910 | ||||
| $ | 534,505 | |||||
| Industrial Revenue - Other - 0.2% | ||||||
| Virgin Islands Public Finance Authority, Refinery Facilities Rev. (Hovensa Coker Project), 5.875%, 2022 | $ | 320,000 | $ | 218,448 | ||
| Miscellaneous Revenue - Entertainment & Tourism - 3.5% | ||||||
| Memphis-Shelby County, TN (Memphis Sports Arena), AMBAC, 5.125%, 2012 (c) | $ | 2,000,000 | $ | 2,253,840 | ||
| Memphis-Shelby County, TN (Memphis Sports Arena), AMBAC, 5.35%, 2012 (c) | 1,665,000 | 1,889,342 | ||||
| $ | 4,143,182 | |||||
| Miscellaneous Revenue - Other - 0.7% | ||||||
| Hardeman County, TN, Correctional Facilities Rev., 7.75%, 2017 | $ | 825,000 | $ | 793,188 | ||
| Multi-Family Housing Revenue - 2.9% | ||||||
| Chattanooga, TN, Health, Educational & Housing Facilities (Rainbow Creek), GNMA, 6.125%, 2019 | $ | 375,000 | $ | 379,268 | ||
| Knoxville, TN, Community Development Corp., 5%, 2024 | 1,000,000 | 1,023,060 | ||||
| Memphis, TN, Health, Educational & Housing Facilities Board Rev. (Prescott Place Apartments Project), FNMA, 5.125%, 2038 (b) | 1,000,000 | 1,000,220 | ||||
| Metropolitan Government of Nashville & Davidson County, TN, Health, Educational & Housing Facilities Board Rev. (Berkshire Place), GNMA, 6%, 2023 | 500,000 | 506,875 | ||||
| Metropolitan Government of Nashville & Davidson County, TN, Health, Educational & Housing Facilities Board Rev. (Herman Street), FHA, 7.25%, 2032 | 485,000 | 486,082 | ||||
| $ | 3,395,505 | |||||
| Sales & Excise Tax Revenue - 1.5% | ||||||
| Massachusetts Bay Transportation Authority, Sales Tax Rev., “A-1”, 5.25%, 2029 | $ | 1,000,000 | $ | 1,049,810 | ||
| Puerto Rico Sales Tax Financing Corp., Sales Tax Rev., 0%, 2056 | 7,755,000 | 265,299 | ||||
| Puerto Rico Sales Tax Financing Corp., Sales Tax Rev., 5.25%, 2057 | 525,000 | 427,024 | ||||
| $ | 1,742,133 | |||||
| Single Family Housing - State - 11.4% | ||||||
| Tennessee Housing Development Agency Rev., Homeownership Program, 5.45%, 2014 | $ | 2,155,000 | $ | 2,179,351 | ||
| Tennessee Housing Development Agency Rev., Homeownership Program, 4.45%, 2017 | 645,000 | 617,787 | ||||
| Issuer | Shares/Par | Value ($) | ||||
| Single Family Housing - State - continued | ||||||
| Tennessee Housing Development Agency Rev., Homeownership Program, 4.45%, 2017 | $ | 660,000 | $ | 630,907 | ||
| Tennessee Housing Development Agency Rev., Homeownership Program, 4.55%, 2018 | 575,000 | 548,780 | ||||
| Tennessee Housing Development Agency Rev., Homeownership Program, 4.55%, 2018 | 690,000 | 657,349 | ||||
| Tennessee Housing Development Agency Rev., Homeownership Program, 6%, 2020 | 775,000 | 779,394 | ||||
| Tennessee Housing Development Agency Rev., Homeownership Program, 5%, 2026 | 1,915,000 | 1,790,793 | ||||
| Tennessee Housing Development Agency Rev., Homeownership Program, 5.05%, 2027 | 720,000 | 663,048 | ||||
| Tennessee Housing Development Agency Rev., Homeownership Program, FSA, 5.4%, 2032 | 670,000 | 627,046 | ||||
| Tennessee Housing Development Agency Rev., Homeownership Program, 5.25%, 2034 | 785,000 | 766,168 | ||||
| Tennessee Housing Development Agency Rev., Homeownership Program, 5.45%, 2038 | 2,000,000 | 1,965,360 | ||||
| Tennessee Housing Development Agency Rev., Homeownership Program, “1-A”, 5.7%, 2039 | 980,000 | 945,916 | ||||
| Tennessee Housing Development Agency Rev., Mortgage Finance, 5.2%, 2023 | 1,115,000 | 1,128,871 | ||||
| $ | 13,300,770 | |||||
| State & Agency - Other - 0.8% | ||||||
| Hardeman County, TN, Industrial Development Board Rev., “B”, ASSD GTY, 5%, 2040 | $ | 1,000,000 | $ | 995,240 | ||
| State & Local Agencies - 10.9% | ||||||
| Chattanooga, TN, Industrial Development Board, AMBAC, 5.75%, 2018 | $ | 1,000,000 | $ | 1,040,940 | ||
| Metropolitan Government of Nashville & Davidson County, TN, Health, Educational & Housing Facilities Board Rev. (Meharry Medical College), AMBAC, 5%, 2024 | 3,450,000 | 3,102,550 | ||||
| Metropolitan Government of Nashville & Davidson County, TN, Water & Sewer Rev., “A”, FSA, 5.25%, 2022 | 1,000,000 | 1,144,250 | ||||
| Tennessee School Bond Authority (Higher Education Facilities), “A”, FSA, 5.25%, 2012 (c) | 3,000,000 | 3,364,080 | ||||
| Tennessee School Bond Authority, “B”, 5.125%, 2033 | 2,000,000 | 2,015,080 | ||||
| Tennessee School Bond Authority, “C”, FSA, 5%, 2032 | 2,000,000 | 2,015,780 | ||||
| $ | 12,682,680 | |||||
| Tax - Other - 0.6% | ||||||
| Virgin Islands Public Finance Authority Rev., “E”, 5.875%, 2018 | $ | 730,000 | $ | 684,295 | ||
| Tobacco - 0.8% | ||||||
| Guam Economic Development Authority Tobacco Settlement, “B”, 5.5%, 2011 (c) | $ | 350,000 | $ | 381,665 | ||
| Tobacco Settlement Financing Corp., 5%, 2031 | 750,000 | 505,927 | ||||
| $ | 887,592 | |||||
41
Table of Contents
Portfolio of Investments – continued
| Municipal Bonds - continued | ||||||
| Issuer | Shares/Par | Value ($) | ||||
| Toll Roads - 0.9% | ||||||
| Bay Area Toll Authority, Toll Bridge Rev. (San Francisco Bay Area), “F1”, 5%, 2039 | $ | 1,140,000 | $ | 1,061,454 | ||
| Transportation - Special Tax - 1.1% | ||||||
| Commonwealth of Puerto Rico Highway & Transportation Authority Rev., FSA, 5.25%, 2036 | $ | 650,000 | $ | 622,713 | ||
| Commonwealth of Puerto Rico Highway & Transportation Authority Rev., “CC”, FSA, 5.5%, 2028 | 600,000 | 615,042 | ||||
| $ | 1,237,755 | |||||
| Universities - Colleges - 7.6% | ||||||
| Madison County, NY, Industrial Development Agency Civic Facilities Rev. (Colgate University), “A”, AMBAC, 5%, 2035 | $ | 415,000 | $ | 402,575 | ||
| Massachusetts Health & Educational Facilities Authority Rev. (Massachusetts Institute of Technology), “I-1”, 5.2%, 2028 | 1,105,000 | 1,197,776 | ||||
| Metropolitan Government of Nashville & Davidson County, TN, Health, Educational & Housing Facilities Board Rev. (McKendree Village, Inc.), 5.125%, 2020 | 1,000,000 | 999,910 | ||||
| Nashville & Davidson County, TN, Metropolitan Government Health & Educational Facilites Board, 5%, 2034 | 2,500,000 | 2,468,050 | ||||
| New York Dormitory Authority Rev., Non State Supported Debt (Columbia University), “A”, 5%, 2031 | 1,145,000 | 1,165,805 | ||||
| New York Dormitory Authority Rev., Non State Supported Debt (New York University), “A”, 5.25%, 2048 | 1,260,000 | 1,233,238 | ||||
| University of Puerto Rico Rev., “Q”, 5%, 2036 | 1,985,000 | 1,414,948 | ||||
| $ | 8,882,302 | |||||
| Utilities - Municipal Owned - 10.1% | ||||||
| Chattanooga, TN, Electric Rev., “A”, 5%, 2033 | $ | 3,000,000 | $ | 2,950,020 | ||
| Elizabethton, TN, Electric System Rev., MBIA, 4.5%, 2027 | 1,000,000 | 928,080 | ||||
| Johnson City, TN, Electric Rev., FSA, 5%, 2029 | 1,000,000 | 1,002,860 | ||||
| Long Island Power Authority, Electric Systems Rev., “A”, BHAC, 5.5%, 2033 | 595,000 | 614,968 | ||||
| Long Island Power Authority, Electric Systems Rev., “A”, 6%, 2033 | 195,000 | 201,390 | ||||
| Metropolitan Government of Nashville & Davidson County, TN, Electrical Rev., MBIA, 0%, 2012 | 3,305,000 | 3,094,769 | ||||
| Metropolitan Government of Nashville & Davidson County, TN, Electrical Rev., 5.125%, 2021 | 1,500,000 | 1,542,765 | ||||
| Metropolitan Government of Nashville & Davidson County, TN, Electrical Rev., “A”, AMBAC, 5%, 2029 | 1,500,000 | 1,516,095 | ||||
| $ | 11,850,947 | |||||
| Issuer | Shares/Par | Value ($) | ||||
| Utilities - Other - 0.8% | ||||||
| Tennessee Energy Acquisition Corp., Gas Rev., “A”, 5.25%, 2023 | $ | 85,000 | $ | 61,934 | ||
| Tennessee Energy Acquisition Corp., Gas Rev., “A”, 5.25%, 2026 | 1,200,000 | 840,432 | ||||
| $ | 902,366 | |||||
| Water & Sewer Utility Revenue - 16.0% | ||||||
| Commonwealth of Puerto Rico Aqueduct & Sewer Authority Rev., “A”, ASSD GTY, 5%, 2028 | $ | 400,000 | $ | 379,132 | ||
| Commonwealth of Puerto Rico Aqueduct & Sewer Authority Rev., “A”, 6%, 2044 | 1,000,000 | 839,710 | ||||
| Commonwealth of Puerto Rico Aqueduct & Sewer Authority Rev., “A”, ASSD GTY, 5.125%, 2047 | 810,000 | 718,373 | ||||
| Hallsdale-Powell Utility District, TN, Water & Sewer Rev., “A”, FGIC, 5%, 2024 | 1,500,000 | 1,530,435 | ||||
| Hallsdale-Powell Utility District, TN, Water & Sewer Rev., “A”, FGIC, 5%, 2027 | 3,000,000 | 3,030,240 | ||||
| Harpeth Valley Utility District, TN, Davidson & Williamson Counties Rev., FGIC, 5.25%, 2037 | 1,000,000 | 1,001,900 | ||||
| Hendersonville, TN, Utility District Waterworks & Sewer Rev., FSA, 5%, 2031 | 1,000,000 | 989,450 | ||||
| King County, WA, Sewer Rev., 5%, 2038 | 1,225,000 | 1,202,901 | ||||
| Knoxville, TN, Waste Water System Rev., FSA, 4.5%, 2032 | 1,000,000 | 934,710 | ||||
| Knoxville, TN, Waste Water System Rev., “A”, MBIA, 5%, 2037 | 2,620,000 | 2,624,035 | ||||
| New York Environmental Facilities Corp., Clean Water & Drinking Rev., “B”, 5%, 2033 | 1,205,000 | 1,168,717 | ||||
| Rutherford County, TN, Water Rev., MBIA, 5%, 2027 | 770,000 | 777,931 | ||||
| South Blount County, TN, Utility District Waterworks Rev., FSA, 5%, 2033 | 2,140,000 | 2,037,922 | ||||
| White House Utility District, TN, Unrefunded, FSA, 5%, 2021 | 420,000 | 428,547 | ||||
| White House Utility District, TN, Water & Sewer Rev. (Robertson & Sumner Counties Waterworks), FSA, 6%, 2010 (c) | 1,000,000 | 1,041,190 | ||||
| $ | 18,705,193 | |||||
| Total Municipal Bonds (Identified Cost, $117,570,351) | $ | 114,388,948 | ||||
| Money Market Funds (v) - 2.6% | ||||||
| MFS Institutional Money Market Portfolio, 0.23%, at Cost and Net Asset Value | 2,986,324 | $ | 2,986,324 | |||
| Total Investments (Identified Cost, $120,556,675) | $ | 117,375,272 | ||||
| Other Assets, Less Liabilities - (0.6)% | (656,336) | |||||
| Net Assets - 100.0% | $ | 116,718,936 | ||||
42
Table of Contents
Portfolio of Investments – continued
Derivative Contracts at 3/31/09
Futures contracts outstanding at 3/31/09
| Description | Contracts | Value | Expiration Date | Unrealized Appreciation (Depreciation) | |||||
| U.S. Treasury Bond 30 yr (Short) | 12 | $1,556,438 | Jun-09 | $(35,948 | ) |
At March 31, 2009, the fund had sufficient cash and/or other liquid securities to cover any commitments under these derivative contracts.
See Portfolio Footnotes and Notes to Financial Statements
43
Table of Contents
PORTFOLIO OF INVESTMENTS
3/31/09
MFS® VIRGINIA MUNICIPAL BOND FUND
The Portfolio of Investments is a complete list of all securities owned by your fund. It is categorized by broad-based asset classes.
| Municipal Bonds - 99.1% | ||||||
| Issuer | Shares/Par | Value ($) | ||||
| Airport & Port Revenue - 5.1% | ||||||
| Metropolitan Washington, DC, Airport Authority Rev., “A”, FGIC, 5.125%, 2024 | $ | 1,000,000 | $ | 929,989 | ||
| Metropolitan Washington, DC, Airport Authority Rev., “A”, FGIC, 5%, 2025 | 705,000 | 637,093 | ||||
| Metropolitan Washington, DC, Airport Authority Rev., “A”, FSA, 5%, 2032 | 1,455,000 | 1,231,293 | ||||
| Metropolitan Washington, DC, Airport Authority Rev., “A”, MBIA, 5%, 2035 | 3,000,000 | 2,468,099 | ||||
| Metropolitan Washington, DC, Airports Authority Rev., 5.375%, 2028 | 1,500,000 | 1,375,139 | ||||
| Norfolk, VA, Airport Authority Rev., “A”, FGIC, 5.375%, 2017 | 1,755,000 | 1,824,567 | ||||
| Norfolk, VA, Airport Authority Rev., “A”, FGIC, 5%, 2022 | 3,000,000 | 3,036,599 | ||||
| Virginia Port Authority Facilities Rev., FGIC, 5%, 2036 | 3,000,000 | 2,300,459 | ||||
| Virginia Resources Authority, Airport Rev., “B”, 5.125%, 2027 | 720,000 | 659,368 | ||||
| $ | 14,462,606 | |||||
| General Obligations - General Purpose - 2.7% | ||||||
| Commonwealth of Puerto Rico, “A”, 5.375%, 2033 | $ | 645,000 | $ | 514,857 | ||
| Commonwealth of Puerto Rico, “A”, 6%, 2038 | 1,070,000 | 927,294 | ||||
| Newport News, VA, Economic Development, “A”, 5%, 2031 | 1,595,000 | 1,602,161 | ||||
| Puerto Rico Public Buildings Authority Rev., Guaranteed, “M”, 6.25%, 2023 | 840,000 | 799,336 | ||||
| Puerto Rico Public Buildings Authority Rev., Guaranteed, “M”, 6.25%, 2031 | 920,000 | 838,442 | ||||
| Stafford County, VA, Industrial Development Authority Rev., “B”, MBIA, 5%, 2034 | 3,060,000 | 2,965,783 | ||||
| $ | 7,647,873 | |||||
| General Obligations - Improvement - 5.6% | ||||||
| Arlington County, VA, 4.5%, 2028 | $ | 255,000 | $ | 250,854 | ||
| Chesterfield County, VA, 6%, 2010 (c) | 1,900,000 | 1,982,346 | ||||
| Chesterfield County, VA, 5%, 2011 (c)(f) | 2,015,000 | 2,160,423 | ||||
| Guam Government, “A”, 5.25%, 2037 | 540,000 | 354,596 | ||||
| Hampton, VA, Public Improvement, 6%, 2010 (c) | 3,280,000 | 3,494,151 | ||||
| Hampton, VA, Public Improvement, 6%, 2010 (c) | 3,480,000 | 3,707,209 | ||||
| Lynchburg, VA, Public Improvement, 5.6%, 2010 (c) | 1,765,000 | 1,887,703 | ||||
| Suffolk, VA, Public Improvement, 5.5%, 2010 (c) | 1,880,000 | 1,992,819 | ||||
| $ | 15,830,101 | |||||
| Issuer | Shares/Par | Value ($) | ||||
| General Obligations - Schools - 0.9% | ||||||
| Los Angeles, CA, Unified School District, “D”, 5%, 2034 | $ | 125,000 | $ | 117,559 | ||
| San Diego, CA, Community College District, FSA, 5%, 2030 | 2,570,000 | 2,484,753 | ||||
| $ | 2,602,312 | |||||
| Healthcare Revenue - Hospitals - 12.5% | ||||||
| Albemarle County, VA, Industrial Development Authority, Hospital Rev. (Martha Jefferson Hospital), 5.25%, 2035 | $ | 3,000,000 | $ | 2,511,000 | ||
| Arlington County, VA, Industrial Development Authority Rev. (Virginia Hospital Center Arlington Health Systems), 5.25%, 2011 (c) | 2,600,000 | 2,854,098 | ||||
| Charlotte County, VA, Industrial Development Authority Rev. (Halifax Hospital), 5%, 2037 | 1,000,000 | 761,720 | ||||
| Fauquier County, VA, Industrial Development Authority, Hospital Rev., 5.25%, 2037 | 2,000,000 | 1,439,300 | ||||
| Fredericksburg, VA, Industrial Development Rev. (Medicorp Health Systems), “B”, 5.125%, 2033 | 750,000 | 622,965 | ||||
| Henrico County, VA, Economic Development Authority Rev., 5.6%, 2012 (c) | 85,000 | 97,806 | ||||
| Henrico County, VA, Economic Development Authority Rev., 5.6%, 2030 | 1,915,000 | 1,684,262 | ||||
| Henrico County, VA, Industrial Development Authority Rev. (Bon Secours Health Systems, Inc.), MBIA, 6.25%, 2020 | 1,500,000 | 1,605,915 | ||||
| Indiana Finance Authority Rev. (Sisters of St. Francis Health Services), 5.375%, 2032 | 2,075,000 | 1,924,770 | ||||
| Loudoun County, VA, Industrial Development Authority, Hospital Rev. (Loudoun Hospital Center), “A”, 6.1%, 2012 (c) | 1,000,000 | 1,143,640 | ||||
| Louisville & Jefferson County, KY, Metropolitan Government Healthcare Systems Rev. (Norton Healthcare, Inc.), 5.25%, 2036 | 1,635,000 | 1,263,561 | ||||
| Lynchburg, VA, Industrial Development Authority, Healthcare Facilities Rev., Unrefunded Balance (Central Health), 5.2%, 2018 | 145,000 | 145,171 | ||||
| Medical College of Virginia, Hospital Authority Rev., MBIA, 5.125%, 2018 | 3,000,000 | 2,982,060 | ||||
| Ohio State Higher Educational Facility Commission Rev. (University Hospital Health System), 6.75%, 2039 | 1,315,000 | 1,298,694 | ||||
| Peninsula Ports Authority, VA, Health System Rev. (Riverside Health System), 5%, 2018 | 3,580,000 | 3,595,752 | ||||
| Peninsula Ports Authority, VA, Hospital Facility Rev. (Whittaker Memorial), FHA, 8.7%, 2023 | 1,950,000 | 2,039,115 | ||||
| Prince William County, VA, Industrial Development Authority, Hospital Rev. (Potomac Hospital Corp.), 5.2%, 2026 | 1,000,000 | 807,060 | ||||
44
Table of Contents
Portfolio of Investments – continued
| Municipal Bonds - continued | ||||||
| Issuer | Shares/Par | Value ($) | ||||
| Healthcare Revenue - Hospitals - continued | ||||||
| Roanoke, VA, Industrial Development Authority, Hospital Rev. (Roanoke Memorial Hospital), “B”, ETM, MBIA, 6.125%, 2017 (c) | $ | 3,000,000 | $ | 3,541,770 | ||
| Royal Oak, MI, Hospital Finance Authority Rev. (William Beaumont Hospital), 8.25%, 2039 | 1,805,000 | 1,923,877 | ||||
| Tarrant County, TX, Cultural Education Facilities Finance Corp. (Scott & White Memorial Hospital), “A”, 5.5%, 2031 | 515,000 | 483,013 | ||||
| Virginia Small Business Financing Authority Hospital Rev., (Wellmont Health Project), “A”, 5.25%, 2037 | 2,000,000 | 1,116,120 | ||||
| Washington County, VA, Industrial Development Authority Hospital Facilities Rev. (Mountain States Health Alliance), “C”, 7.5%, 2029 | 1,400,000 | 1,383,984 | ||||
| $ | 35,225,653 | |||||
| Healthcare Revenue - Long Term Care - 1.2% | ||||||
| Chesterfield County, VA, Health Center Commission Residential Care Facility, 6.25%, 2038 | $ | 750,000 | $ | 521,618 | ||
| Henrico County, VA, Economic Development Authority Residential Care, 6.7%, 2012 (c) | 200,000 | 230,510 | ||||
| Henrico County, VA, Economic Development Authority Residential Care, 6.7%, 2027 | 550,000 | 455,609 | ||||
| James City County, VA, Economic Development (WindsorMeade Project), “A”, 5.5%, 2037 | 1,000,000 | 552,810 | ||||
| Lexington, VA, Industrial Development Authority Residential Care Facilities (Kendal at Lexington), “A”, 5.5%, 2037 | 1,000,000 | 643,360 | ||||
| Norfolk, VA, Redevelopment & Housing Authority Rev. (Fort Norfolk Retirement Community), “A”, 6.125%, 2035 | 750,000 | 533,993 | ||||
| Suffolk, VA, Industrial Development Authority, Retirement Facilities Rev. (Lake Prince Center, Inc.), 5.3%, 2031 | 750,000 | 500,303 | ||||
| $ | 3,438,203 | |||||
| Industrial Revenue - Environmental Services - 1.1% | ||||||
| Charles City County, VA, Industrial Development Authority, Solid Waste Disposal Facility Rev. (Waste Management, Inc.), 6.25%, 2027 (b) | $ | 1,500,000 | $ | 1,505,655 | ||
| Henrico County, VA, Industrial Development Authority Rev. (Browning Ferris, Inc.), 5.45%, 2014 | 1,750,000 | 1,671,005 | ||||
| $ | 3,176,660 | |||||
| Industrial Revenue - Other - 1.1% | ||||||
| Loudoun County, VA, Industrial Development Authority Rev. (Dulles Airport Marriott Hotel), 7.125%, 2015 | $ | 2,000,000 | $ | 1,766,780 | ||
| Peninsula Ports Authority, VA, Coal Terminal Rev. (Dominion Terminal Associates), 6%, 2033 | 1,000,000 | 839,010 | ||||
| Virgin Islands Public Finance Authority, Refinery Facilities Rev. (Hovensa Coker Project), 5.875%, 2022 | 750,000 | 511,988 | ||||
| $ | 3,117,778 | |||||
| Issuer | Shares/Par | Value ($) | ||||
| Industrial Revenue - Paper - 0.2% | ||||||
| Bedford County, VA, Industrial Development Authority Rev. (Nekooska Packaging Corp.), 5.6%, 2025 | $ | 1,000,000 | $ | 560,180 | ||
| Hodge, LA, Utility Rev. (Stone Container Corp.), 7.45%, 2024 (d) | 740,000 | 79,550 | ||||
| West Point, VA, Industrial Development Authority, Solid Waste Disposal Rev. (Chesapeake Corp.), “A”, 6.375%, 2019 (d) | 1,750,000 | 17,500 | ||||
| $ | 657,230 | |||||
| Miscellaneous Revenue - Other - 1.0% | ||||||
| Stafford County, VA, Economic Development Authority Lease Rev., ASSD GTY, 5%, 2033 | $ | 3,000,000 | $ | 2,914,260 | ||
| Multi-Family Housing Revenue - 5.8% | ||||||
| Alexandria, VA, Redevelopment & Housing Finance Authority Rev. (Jefferson Village Apartments), “B”, 9%, 2018 | $ | 3,415,000 | $ | 3,416,264 | ||
| Arlington County, VA, Industrial Development Authority Rev. (Colonial Village), FNMA, 5.15%, 2031 | 3,000,000 | 3,049,770 | ||||
| Virginia Housing Development Authority Rev., “B”, 5.95%, 2016 | 1,345,000 | 1,346,264 | ||||
| Virginia Housing Development Authority Rev., “C”, 5.625%, 2038 | 1,355,000 | 1,306,735 | ||||
| Virginia Housing Development Authority Rev., “D”, 4.6%, 2033 | 1,000,000 | 805,150 | ||||
| Virginia Housing Development Authority Rev., “G”, 5.625%, 2020 | 2,000,000 | 2,018,800 | ||||
| Virginia Housing Development Authority Rev., “I”, 5.15%, 2017 | 3,000,000 | 3,009,180 | ||||
| Virginia Housing Development Authority Rev., Rental Housing, “B”, 5.5%, 2030 | 1,450,000 | 1,457,729 | ||||
| $ | 16,409,892 | |||||
| Parking - 0.6% | ||||||
| Norfolk, VA, Parking Systems Rev., MBIA, 5%, 2020 | $ | 1,630,000 | $ | 1,636,357 | ||
| Sales & Excise Tax Revenue - 1.5% | ||||||
| Massachusetts Bay Transportation Authority, Sales Tax Rev., “A-1”, 5.25%, 2029 | $ | 2,250,000 | $ | 2,362,073 | ||
| Puerto Rico Sales Tax Financing Corp., Sales Tax Rev., 5.25%, 2057 | 2,135,000 | 1,736,566 | ||||
| $ | 4,098,639 | |||||
| Single Family Housing - State - 4.7% | ||||||
| Virginia Housing Development Authority Commonwealth, 5.1%, 2035 | $ | 3,000,000 | $ | 2,743,980 | ||
| Virginia Housing Development Authority Commonwealth, “A”, 5%, 2031 | 2,000,000 | 1,801,220 | ||||
| Virginia Housing Development Authority Commonwealth, “B”, 4.75%, 2032 | 2,000,000 | 1,743,940 | ||||
| Virginia Housing Development Authority Commonwealth, “C”, 4.4%, 2022 | 1,270,000 | 1,144,842 | ||||
| Virginia Housing Development Authority Commonwealth, “C”, 4.66%, 2027 | 1,285,000 | 1,118,965 | ||||
45
Table of Contents
Portfolio of Investments – continued
| Municipal Bonds - continued | ||||||
| Issuer | Shares/Par | Value ($) | ||||
| Single Family Housing - State - continued | ||||||
| Virginia Housing Development Authority Commonwealth, “C”, 4.625%, 2027 | $ | 2,630,000 | $ | 2,255,488 | ||
| Virginia Housing Development Authority Commonwealth, “C”, 4.75%, 2032 | 1,795,000 | 1,545,154 | ||||
| Virginia Housing Development Authority, Commonwealth Mortgage, “A-5”, 4.4%, 2015 | 1,000,000 | 989,440 | ||||
| $ | 13,343,029 | |||||
| State & Agency - Other - 1.8% | ||||||
| Fairfax County, VA, COP, 6.1%, 2017 | $ | 3,090,000 | $ | 3,462,530 | ||
| Virginia Biotechnology Research Park Lease Rev. (Consolidated Laboratories), 5%, 2021 | 1,500,000 | 1,545,930 | ||||
| $ | 5,008,460 | |||||
| State & Local Agencies - 11.9% | ||||||
| Blue Ridge, VA, Regional Jail Authority, MBIA, 5.2%, 2021 | $ | 1,830,000 | $ | 1,830,018 | ||
| Caroline County, VA, Industrial Development Authority Lease Rev., AMBAC, 5.125%, 2034 | 1,000,000 | 959,630 | ||||
| Chesapeake, VA, Industrial Development Authority (Chesapeake Court House), MBIA, 6.25%, 2011 | 3,985,000 | 4,003,650 | ||||
| Chesapeake, VA, Industrial Development Authority (Chesapeake Court House), MBIA, 5.25%, 2017 | 2,000,000 | 2,006,940 | ||||
| Dinwiddie County, VA, Industrial Development Authority Lease Rev., “B”, MBIA, 5%, 2030 | 2,500,000 | 2,487,025 | ||||
| Fairfax County, VA, Economic Development Authority Rev. (U.S. Route 28), MBIA, 5%, 2029 | 1,000,000 | 1,012,770 | ||||
| Fairfax County, VA, Economic Development Authority, Fairfax Public Improvement Project, 5%, 2030 | 1,000,000 | 1,006,410 | ||||
| Front Royal & Warren County, VA, Industrial Development Authority Lease Rev., School & Capital Improvement, “B”, FSA, 5%, 2035 | 2,875,000 | 2,805,540 | ||||
| King George County, VA, Industrial Development Authority Lease Rev., FSA, 5%, 2036 | 2,000,000 | 1,965,060 | ||||
| Middlesex County, VA, Industrial Development Authority Rev., AMBAC, 5.125%, 2012 (c) | 1,000,000 | 1,134,790 | ||||
| Middlesex County, VA, Industrial Development Authority Rev., AMBAC, 5.25%, 2012 (c) | 2,000,000 | 2,277,700 | ||||
| Montgomery County, VA, Industrial Development Authority (Public Facilities Project), 5%, 2029 | 500,000 | 449,395 | ||||
| Montgomery County, VA, Industrial Development, “B”, AMBAC, 6%, 2011 (c) | 1,000,000 | 1,096,830 | ||||
| Montgomery County, VA, Industrial Development, “C”, AMBAC, 6%, 2011 (c) | 1,120,000 | 1,228,450 | ||||
| Orange County, VA, Industrial Development Authority (Orange County Project), AMBAC, 5%, 2012 (c) | 1,000,000 | 1,111,430 | ||||
| Powhatan County, VA, Economic Development Authority Lease Rev. (Virginia Capital Projects), AMBAC, 5.25%, 2033 | 1,000,000 | 977,110 | ||||
| Issuer | Shares/Par | Value ($) | ||||
| State & Local Agencies - continued | ||||||
| Prince William County, VA, Lease Partnerships, 5%, 2021 | $ | 1,500,000 | $ | 1,554,870 | ||
| Richmond, VA, Public Facilities, COP (Megahertz Project), “A”, AMBAC, 5%, 2022 | 1,600,000 | 1,630,144 | ||||
| Southwest Virginia Regional Jail Authority Rev., MBIA, 5%, 2035 | 1,720,000 | 1,271,699 | ||||
| Virginia College Building Authority, Educational Facilities Rev., 4.5%, 2032 | 1,550,000 | 1,457,977 | ||||
| Virginia Public Building Authority, Public Facilities Rev., “B”, 5.25%, 2028 | 1,000,000 | 1,056,550 | ||||
| $ | 33,323,988 | |||||
| Tax - Other - 2.0% | ||||||
| Greater Richmond Convention Center Authority, Hotel Tax Rev. (Convention Center Expansion), 6.125%, 2010 (c) | $ | 3,500,000 | $ | 3,770,025 | ||
| New York, NY, City Transitional Finance Authority Building Aid Rev., “S-3”, 5.25%, 2039 | 1,000,000 | 939,850 | ||||
| Virgin Islands, Public Finance Authority Rev., “A”, 5.625%, 2025 | 1,000,000 | 858,280 | ||||
| $ | 5,568,155 | |||||
| Tobacco - 1.3% | ||||||
| Virgin Islands Tobacco Settlement Financing Corp., 5%, 2021 | $ | 460,000 | $ | 374,353 | ||
| Virginia Tobacco Settlement Financing Corp., 5.625%, 2015 (c) | 1,000,000 | 1,154,520 | ||||
| Virginia Tobacco Settlement Financing Corp., “B-1”, 5%, 2047 | 4,350,000 | 2,204,189 | ||||
| $ | 3,733,062 | |||||
| Toll Roads - 1.0% | ||||||
| Bay Area Toll Authority, Toll Bridge Rev. (San Francisco Bay Area), “F1”, 5%, 2039 | $ | 2,935,000 | $ | 2,732,779 | ||
| Transportation - Special Tax - 1.2% | ||||||
| Commonwealth of Puerto Rico Highway & Transportation Authority Rev., “J”, MBIA, 5%, 2029 | $ | 1,210,000 | $ | 935,778 | ||
| Indiana Finance Authority Highway Rev., “A”, MBIA, 4.5%, 2029 | 2,515,000 | 2,322,854 | ||||
| $ | 3,258,632 | |||||
| Universities - Colleges - 6.4% | ||||||
| Amherst, VA, Industrial Development Authority Rev. (Educational Facilities Sweet Briar), 5%, 2026 | $ | 1,770,000 | $ | 1,367,909 | ||
| Florida State University Board of Governors, System Improvement Rev., 6.25%, 2030 | 1,000,000 | 1,062,070 | ||||
| Massachusetts State College, Building Authority Project Rev., “A”, 5.5%, 2049 | 2,335,000 | 2,290,425 | ||||
| New York Dormitory Authority Rev., Non State Supported Debt (Columbia University), “A”, 5%, 2031 | 2,845,000 | 2,896,694 | ||||
| New York Dormitory Authority Rev., Non State Supported Debt (New York University), “A”, 5.25%, 2048 | 3,085,000 | 3,019,475 | ||||
46
Table of Contents
Portfolio of Investments – continued
| Municipal Bonds - continued | ||||||
| Issuer | Shares/Par | Value ($) | ||||
| Universities - Colleges - continued | ||||||
| University of Virginia (University Rev.), “B”, 5%, 2027 | $ | 2,690,000 | $ | 2,750,606 | ||
| Virginia College Building Authority, Educational Facilities Rev. (Hampton University), 6%, 2010 (c) | 1,000,000 | 1,064,440 | ||||
| Virginia College Building Authority, Educational Facilities Rev. (Regent University), 5%, 2026 | 2,000,000 | 1,573,540 | ||||
| Virginia College Building Authority, Educational Facilities Rev. (Roanoke College), 4.5%, 2037 | 2,300,000 | 1,872,752 | ||||
| $ | 17,897,911 | |||||
| Utilities - Investor Owned - 1.3% | ||||||
| Halifax County, VA, Industrial Development Authority (Old Dominion Electric Cooperative), AMBAC, 5.625%, 2028 | $ | 3,000,000 | $ | 2,922,570 | ||
| Mecklenburg County, VA, Industrial Development Authority Rev. (UAE Mecklenburg LP), 6.5%, 2017 | 700,000 | 701,505 | ||||
| $ | 3,624,075 | |||||
| Utilities - Municipal Owned - 3.8% | ||||||
| Bristol, VA, Utility Systems Rev., ETM, FSA, 5.75%, 2016 (c) | $ | 240,000 | $ | 290,921 | ||
| Guam Power Authority Rev., AMBAC, 5.25%, 2015 | 2,020,000 | 1,875,893 | ||||
| Long Island Power Authority, Electric Systems Rev., “A”, BHAC, 5.5%, 2033 | 1,435,000 | 1,483,159 | ||||
| Long Island Power Authority, Electric Systems Rev., “A”, 6%, 2033 | 470,000 | 485,402 | ||||
| Richmond, VA, Public Utilities Rev., FSA, 5%, 2012 (c) | 5,000,000 | 5,515,600 | ||||
| Richmond, VA, Public Utilities Rev., FSA, 5%, 2035 | 1,000,000 | 997,050 | ||||
| $ | 10,648,025 | |||||
| Utilities - Other - 0.6% | ||||||
| Tennessee Energy Acquisition Corp., Gas Rev., “A”, 5.25%, 2019 | $ | 945,000 | $ | 736,353 | ||
| Tennessee Energy Acquisition Corp., Gas Rev., “A”, 5.25%, 2026 | 1,140,000 | 798,410 | ||||
| $ | 1,534,763 | |||||
| Water & Sewer Utility Revenue - 23.8% | ||||||
| Commonwealth of Puerto Rico Aqueduct & Sewer Authority Rev., “A”, ASSD GTY, 5%, 2028 | $ | 400,000 | $ | 379,132 | ||
| Commonwealth of Puerto Rico Aqueduct & Sewer Authority Rev., “A”, 6%, 2044 | 3,000,000 | 2,519,130 | ||||
| Commonwealth of Puerto Rico Aqueduct & Sewer Authority Rev., ETM, 10.25%, 2009 (c) | 30,000 | 30,719 | ||||
| Fairfax County, VA, Water Authority Rev., 5%, 2032 | 2,000,000 | 2,012,140 | ||||
| Fairfax County, VA, Water Authority Rev., Unrefunded, 5%, 2027 | 3,210,000 | 3,263,479 | ||||
| Hampton Roads Sanitation District Wastewater Rev., VA, 5%, 2038 | 3,750,000 | 3,758,063 | ||||
| Issuer | Shares/Par | Value ($) | ||||
| Water & Sewer Utility Revenue - continued | ||||||
| Hampton Roads, VA, Sanitation District Wastewater Rev., 5%, 2033 | $ | 2,000,000 | $ | 2,011,520 | ||
| James City, VA, Water & Sewer Rev., 5%, 2040 | 1,290,000 | 1,275,900 | ||||
| Loudoun County, VA, Water & Sewer Rev., 4.375%, 2037 | 3,600,000 | 3,131,028 | ||||
| New York Environmental Facilities Corp., Clean Water & Drinking Rev., “B”, 5%, 2033 | 2,985,000 | 2,895,122 | ||||
| Norfolk, VA, Water Rev., 4.75%, 2038 | 4,000,000 | 3,834,360 | ||||
| Spotsylvania County, VA, Water & Sewer Rev., FSA, 5%, 2022 | 1,450,000 | 1,480,871 | ||||
| Spotsylvania County, VA, Water & Sewer Rev., FSA, 4.5%, 2032 | 1,500,000 | 1,365,495 | ||||
| Spotsylvania County, VA, Water & Sewer Rev., FSA, 4.75%, 2035 | 1,500,000 | 1,410,105 | ||||
| Upper Occoquan, VA, Sewage Authority Regional Sewage Rev., 4.75%, 2031 | 1,370,000 | 1,329,599 | ||||
| Upper Occoquan, VA, Sewage Authority Regional Sewage Rev., 5%, 2041 | 2,000,000 | 1,987,160 | ||||
| Virginia Beach, VA, Storm Water Utilities Rev., 6%, 2020 | 1,000,000 | 1,047,430 | ||||
| Virginia Resources Authority Rev., 5%, 2021 (u) | 2,780,000 | 2,935,624 | ||||
| Virginia Resources Authority Rev., 5%, 2023 (u) | 3,040,000 | 3,173,669 | ||||
| Virginia Resources Authority Rev., 5%, 2033 (u) | 5,020,000 | 5,056,546 | ||||
| Virginia Resources Authority Sewer Systems Rev. (Hopewell Regional Wastewater), 5.75%, 2021 | 1,335,000 | 1,353,209 | ||||
| Virginia Resources Authority, Clean Water Rev., 5.4%, 2010 (c) | 1,135,000 | 1,213,281 | ||||
| Virginia Resources Authority, Clean Water Rev., 6%, 2010 (c) | 2,750,000 | 2,964,143 | ||||
| Virginia Resources Authority, Clean Water Rev., 4.75%, 2027 | 3,000,000 | 3,031,350 | ||||
| Virginia Resources Authority, Clean Water Rev., 5%, 2037 | 2,750,000 | 2,776,648 | ||||
| Virginia Resources Authority, Infrastructure Rev., FSA, 5.5%, 2010 (c) | 630,000 | 670,433 | ||||
| Virginia Resources Authority, Infrastructure Rev., FSA, 5.5%, 2010 (c) | 350,000 | 372,463 | ||||
| Virginia Resources Authority, Infrastructure Rev., MBIA, 5.5%, 2011 (c) | 710,000 | 783,109 | ||||
| Virginia Resources Authority, Infrastructure Rev., MBIA, 5.5%, 2011 (c) | 660,000 | 727,960 | ||||
| Virginia Resources Authority, Infrastructure Rev., MBIA, 5.5%, 2011 (c) | 750,000 | 827,228 | ||||
| Virginia Resources Authority, Infrastructure Rev., MBIA, 5.5%, 2011 (c) | 700,000 | 772,079 | ||||
| Virginia Resources Authority, Infrastructure Rev., MBIA, 5.5%, 2019 | 230,000 | 242,938 | ||||
| Virginia Resources Authority, Infrastructure Rev., FSA, 5.5%, 2019 | 90,000 | 93,150 | ||||
| Virginia Resources Authority, Infrastructure Rev., MBIA, 5.5%, 2020 | 240,000 | 252,605 | ||||
| Virginia Resources Authority, Infrastructure Rev., “A”, 5%, 2017 | 1,360,000 | 1,408,402 | ||||
| Virginia Resources Authority, Infrastructure Rev., “B”, 5%, 2038 | 2,600,000 | 2,625,533 | ||||
47
Table of Contents
Portfolio of Investments – continued
| Municipal Bonds - continued | ||||||
| Issuer | Shares/Par | Value ($) | ||||
| Water & Sewer Utility Revenue - continued | ||||||
| Virginia Resources Authority, Water & Sewer Systems Rev. (Tuckahoe Creek Project), 5%, 2035 | $ | 2,015,000 | $ | 2,019,775 | ||
| $ | 67,031,398 | |||||
| Total Municipal Bonds (Identified Cost, $288,735,412) | $ | 278,921,841 | ||||
| Money Market Funds (v) - 1.2% | |||||
| Issuer | Shares/Par | Value ($) | |||
| MFS Institutional Money Market Portfolio, 0.23%, at Cost and Net Asset Value | 3,256,944 | $ | 3,256,944 | ||
| Total Investments (Identified Cost, $291,992,356) | $ | 282,178,785 | |||
| Other Assets, Less Liabilities - (0.3)% | (799,149) | ||||
| Net Assets - 100.0% | $ | 281,379,636 | |||
Derivative Contracts at 3/31/09
Futures contracts outstanding at 3/31/09
| Description | Contracts | Value | Expiration Date | Unrealized Appreciation (Depreciation) | |||||
| U.S. Treasury Bond 30 yr (Short) | 37 | $4,799,016 | Jun-09 | $(110,840 | ) |
At March 31, 2009, the fund had sufficient cash and/or other liquid securities to cover any commitments under these derivative contracts.
See Portfolio Footnotes and Notes to Financial Statements
48
Table of Contents
PORTFOLIO OF INVESTMENTS
3/31/09
MFS® WEST VIRGINIA MUNICIPAL BOND FUND
The Portfolio of Investments is a complete list of all securities owned by your fund. It is categorized by broad-based asset classes.
| Municipal Bonds - 96.1% | ||||||
| Issuer | Shares/Par | Value ($) | ||||
| General Obligations - General Purpose - 15.2% | ||||||
| Charleston, WV, Public Improvements, 7.2%, 2009 | $ | 1,140,000 | $ | 1,175,758 | ||
| Commonwealth of Puerto Rico, Public Improvement, MBIA, 5.75%, 2010 (c) | 6,000,000 | 6,351,480 | ||||
| Commonwealth of Puerto Rico, Public Improvement, 5.25%, 2023 | 1,500,000 | 1,276,575 | ||||
| Commonwealth of Puerto Rico, Public Improvement, “A”, CIFG, 5%, 2034 | 780,000 | 586,591 | ||||
| Puerto Rico Municipal Finance Agency, FSA, 5.5%, 2009 (c) | 1,800,000 | 1,848,492 | ||||
| Puerto Rico Public Buildings Authority Rev. (State Office Building), “F”, XLCA, 5.25%, 2025 | 2,000,000 | 1,629,220 | ||||
| Puerto Rico Public Buildings Authority Rev., Guaranteed, “M”, 6.25%, 2023 | 660,000 | 628,049 | ||||
| Puerto Rico Public Buildings Authority Rev., Guaranteed, “M”, 6.25%, 2031 | 725,000 | 660,729 | ||||
| Tuscaloosa, AL, “A”, 5.125%, 2039 | 855,000 | 833,907 | ||||
| West Virginia Highway Improvements, FGIC, 5.625%, 2010 (c) | 1,000,000 | 1,069,200 | ||||
| West Virginia Sewer Improvements, FGIC, 5.5%, 2017 | 2,565,000 | 2,593,138 | ||||
| $ | 18,653,139 | |||||
| General Obligations - Improvement - 0.1% | ||||||
| Guam Government, “A”, 5.25%, 2037 | $ | 250,000 | $ | 164,165 | ||
| General Obligations - Schools - 3.3% | ||||||
| Jefferson County, WV, Board of Education, ETM, FGIC, 6.85%, 2009 (c) | $ | 1,680,000 | $ | 1,705,922 | ||
| Monongalia County, WV, Board of Education, MBIA, 5%, 2027 | 2,350,000 | 2,383,088 | ||||
| $ | 4,089,010 | |||||
| Healthcare Revenue - Hospitals - 9.0% | ||||||
| Louisville & Jefferson County, KY, Metropolitan Government Healthcare Systems Rev. (Norton Healthcare, Inc.), 5.25%, 2036 | $ | 725,000 | $ | 560,295 | ||
| Ohio County, WV, County Commission Health System Rev. (Ohio Valley Medical Center), 5.75%, 2013 | 615,000 | 571,452 | ||||
| Randolph County, WV, Community Health Systems Rev. (Davis Health Systems, Inc.), FSA, 5.2%, 2021 | 1,000,000 | 1,007,640 | ||||
| Weirton, WV, Municipal Hospital Building, Commission Rev. (Weirton Hospital Medical Center), 6.375%, 2031 | 600,000 | 497,022 | ||||
| West Virginia Hospital Finance Authority, Hospital Rev. (Charleston Area Medical Center), “A”, ETM, 6.5%, 2023 (c) | 2,000,000 | 2,510,880 | ||||
| West Virginia Hospital Finance Authority, Hospital Rev. (General Division Medical Office Building), 7.25%, 2014 | 1,210,000 | 1,210,835 | ||||
| Issuer | Shares/Par | Value ($) | ||||
| Healthcare Revenue - Hospitals - continued | ||||||
| West Virginia Hospital Finance Authority, Hospital Rev. (Thomas Health System), 6.5%, 2038 | $ | 500,000 | $ | 364,365 | ||
| West Virginia Hospital Finance Authority, Hospital Rev. (United Hospital Center, Inc.), “A”, AMBAC, 5%, 2022 | 2,500,000 | 2,483,175 | ||||
| West Virginia Hospital Finance Authority, Hospital Rev. (West Virginia United Health Systems), “E”, 5.625%, 2035 | 1,000,000 | 841,150 | ||||
| West Virginia Hospital Finance Authority, Hospital Rev. (West Virginia University Hospital), AMBAC, 5%, 2018 | 1,000,000 | 1,000,170 | ||||
| $ | 11,046,984 | |||||
| Industrial Revenue - Other - 0.2% | ||||||
| Virgin Islands Public Finance Authority, Refinery Facilities Rev. (Hovensa Coker Project), 5.875%, 2022 | $ | 350,000 | $ | 238,928 | ||
| Parking - 1.1% | ||||||
| West Virginia Economic Development Authority, Auto Lease Rev. (Capitol Parking Garage), AMBAC, 5.8%, 2020 | $ | 1,260,000 | $ | 1,289,736 | ||
| Sales & Excise Tax Revenue - 0.7% | ||||||
| Puerto Rico Sales Tax Financing Corp., Sales Tax Rev., 5.25%, 2057 | $ | 1,015,000 | $ | 825,581 | ||
| Single Family Housing Revenue - Local - 0.0% | ||||||
| Charlestown, WV, Residential Mortgage Rev., 6.2%, 2011 | $ | 20,000 | $ | 20,019 | ||
| Single Family Housing - State - 4.3% | ||||||
| West Virginia Housing Development Fund Rev., 5.25%, 2018 | $ | 885,000 | $ | 886,708 | ||
| West Virginia Housing Development Fund Rev., 5.3%, 2023 | 455,000 | 447,279 | ||||
| West Virginia Housing Development Fund Rev., “A”, 4.625%, 2032 | 1,000,000 | 826,530 | ||||
| West Virginia Housing Development Fund Rev., “B”, 5.15%, 2032 | 3,410,000 | 3,082,333 | ||||
| $ | 5,242,850 | |||||
| State & Local Agencies - 19.8% | ||||||
| Huntington, WV, Municipal Development Authority Rev., MBIA, 5.1%, 2018 | $ | 1,740,000 | $ | 1,759,627 | ||
| Mississippi Development Bank Special Obligation (Hinds Community College), ASSD GTY, 5.375%, 2033 | 30,000 | 30,012 | ||||
| West Virginia Building Commission, Lease Rev. “B”, AMBAC, 5.375%, 2018 | 2,500,000 | 2,782,225 | ||||
49
Table of Contents
Portfolio of Investments – continued
| Municipal Bonds - continued | ||||||
| Issuer | Shares/Par | Value ($) | ||||
| State & Local Agencies - continued | ||||||
| West Virginia Building Commission, Lease Rev. (WV Regional Jail), “A”, AMBAC, 5.375%, 2018 | $ | 8,040,000 | $ | 8,560,429 | ||
| West Virginia Building Commission, Lease Rev., ETM, MBIA, 0%, 2009 (c) | 1,000,000 | 998,000 | ||||
| West Virginia Economic Development Authority (Correctional Juvenile & Public), MBIA, 5%, 2026 | 2,100,000 | 2,057,223 | ||||
| West Virginia Economic Development Authority (Correctional Juvenile Safety), “A”, MBIA, 5%, 2029 | 1,530,000 | 1,486,364 | ||||
| West Virginia Economic Development Authority, Auto Lease Rev., 5.2%, 2033 | 1,000,000 | 990,470 | ||||
| West Virginia Economic Development Authority, Department of Environmental Protection, 5.5%, 2022 | 2,000,000 | 2,115,140 | ||||
| West Virginia Economic Development Authority, Lease Rev. (State Office Building), 5%, 2020 | 1,000,000 | 1,020,860 | ||||
| West Virginia Economic Development Authority, Lease Rev. (State Office Building), “B”, MBIA, 5.25%, 2025 | 645,000 | 654,404 | ||||
| West Virginia Economic Development Authority, Lease Rev. (State Office Building), “B”, MBIA, 5.25%, 2030 | 1,355,000 | 1,339,702 | ||||
| West Virginia Hospital Finance Authority, Hospital Rev. (Veterans Nursing Home), 5.5%, 2034 | 1,000,000 | 605,940 | ||||
| $ | 24,400,396 | |||||
| Tax - Other - 3.5% | ||||||
| Virgin Islands, Public Finance Authority Rev., “A”, 5.625%, 2025 | $ | 500,000 | $ | 429,140 | ||
| West Virginia School Building Authority Excess Lottery Rev., 5%, 2026 | 1,000,000 | 1,018,460 | ||||
| West Virginia School Building Authority Excess Lottery Rev., 5%, 2028 | 750,000 | 752,700 | ||||
| West Virginia School Building Authority, Rev., “A”, FGIC, 5%, 2020 | 2,000,000 | 2,103,280 | ||||
| $ | 4,303,580 | |||||
| Tax Assessment - 0.4% | ||||||
| Morgantown, WV, Tax Increment Rev., Parking Garage Project, “A”, 5%, 2033 | $ | 500,000 | $ | 278,725 | ||
| Ohio County, WV, Commission Tax Increment Rev. (Fort Henry Centre), “A”, 5.85%, 2034 | 300,000 | 205,977 | ||||
| $ | 484,702 | |||||
| Transportation - Special Tax - 1.1% | ||||||
| Commonwealth of Puerto Rico Highway & Transportation Authority Rev., “J”, MBIA, 5%, 2029 | $ | 1,820,000 | $ | 1,407,533 | ||
| Universities - Colleges - 18.3% | ||||||
| Fairmont State College, WV, College Rev., “A”, FGIC, 5.375%, 2027 | $ | 1,500,000 | $ | 1,509,615 | ||
| Fairmont State College, WV, College Rev., “A”, FGIC, 5%, 2032 | 1,210,000 | 1,183,925 | ||||
| Issuer | Shares/Par | Value ($) | ||||
| Universities - Colleges - continued | ||||||
| Fairmont State College, WV, College Rev., “B”, FGIC, 5%, 2032 | $ | 2,250,000 | $ | 2,078,438 | ||
| Massachusetts Health & Educational Facilities Authority Rev. (Massachusetts Institute of Technology), “I-1”, 5.2%, 2028 | 1,180,000 | 1,279,073 | ||||
| New York Dormitory Authority Rev., Non State Supported Debt (Columbia University), “A”, 5%, 2031 | 820,000 | 834,899 | ||||
| Puerto Rico Industrial Tourist Education (University Plaza), MBIA, 5%, 2021 | 1,270,000 | 1,094,931 | ||||
| Shepherd University Board of Governors, WV Rev. (Residence Facilities Projects), MBIA, 5%, 2035 | 1,675,000 | 1,520,950 | ||||
| University of California Rev., “J”, FSA, 4.5%, 2035 | 1,255,000 | 1,082,927 | ||||
| West Virginia Department of Higher Education (Marshall University), FGIC, 5.25%, 2019 | 1,680,000 | 1,725,797 | ||||
| West Virginia Department of Higher Education (Student Union James C. Wilson College), 5.125%, 2022 | 1,500,000 | 1,524,015 | ||||
| West Virginia Department of Higher Education, “B”, FGIC, 5%, 2029 | 2,000,000 | 1,943,360 | ||||
| West Virginia University, University Systems Rev. (Marshall University), FGIC, 6%, 2010 (c) | 2,705,000 | 2,876,497 | ||||
| West Virginia University, University Systems Rev. (West Virginia University), MBIA, 5.5%, 2020 | 1,700,000 | 1,899,359 | ||||
| West Virginia University, University Systems Rev. (West Virginia University), “A”, MBIA, 5.25%, 2028 | 2,000,000 | 2,002,380 | ||||
| $ | 22,556,166 | |||||
| Utilities - Investor Owned - 3.8% | ||||||
| Mason County, WV, Pollution Control Rev. (Appalachian Power Co.), 5.5%, 2022 | $ | 750,000 | $ | 703,118 | ||
| Pleasants County, WV, Pollution Control Rev. (Allegheny Community), “F”, 5.25%, 2037 | 300,000 | 221,280 | ||||
| West Virginia Economic Development Authority Solid Waste Disposal Facilities Rev., AMBAC, 4.9%, 2037 | 5,000,000 | 3,785,050 | ||||
| $ | 4,709,448 | |||||
| Water & Sewer Utility Revenue - 15.3% | ||||||
| Berkeley County, WV, Public Service Sewer District, “A”, 5%, 2047 | $ | 1,000,000 | $ | 684,330 | ||
| Berkeley County, WV, Public Service Sewer District, Sewer Capacity Impact Fee, 5%, 2022 | 300,000 | 255,159 | ||||
| Commonwealth of Puerto Rico Aqueduct & Sewer Authority Rev., “A”, ASSD GTY, 5%, 2028 | 400,000 | 379,132 | ||||
| Commonwealth of Puerto Rico Aqueduct & Sewer Authority Rev., “A”, 6%, 2044 | 2,005,000 | 1,683,619 | ||||
| Fairmont, WV, Waterworks Rev., AMBAC, 5.25%, 2022 | 200,000 | 225,938 | ||||
| King County, WA, Sewer Rev., 5%, 2038 | 1,360,000 | 1,335,466 | ||||
| South Blount County, TN, Utility District Waterworks Rev., FSA, 5.25%, 2039 | 775,000 | 757,617 | ||||
50
Table of Contents
Portfolio of Investments – continued
| Municipal Bonds - continued | ||||||
| Issuer | Shares/Par | Value ($) | ||||
| Water & Sewer Utility Revenue - continued | ||||||
| West Virginia Water Development Authority Loan Program, “A”, FSA, 5%, 2044 | $ | 2,000,000 | $ | 1,898,200 | ||
| West Virginia Water Development Authority Loan Program, “B”, AMBAC, 5.125%, 2024 | 2,140,000 | 2,183,592 | ||||
| West Virginia Water Development Authority Rev., AMBAC, 6.25%, 2020 | 1,000,000 | 1,018,390 | ||||
| West Virginia Water Development Authority Rev., AMBAC, 5.25%, 2023 | 1,000,000 | 1,019,790 | ||||
| West Virginia Water Development Authority Rev., AMBAC, 5%, 2026 | 2,850,000 | 2,768,747 | ||||
| West Virginia Water Development Authority Rev., ETM, 7.1%, 2009 (c) | 30,000 | 30,153 | ||||
| West Virginia Water Development Authority, Infrastructure Rev., FSA, 5.5%, 2010 (c) | 895,000 | 958,062 | ||||
| Issuer | Shares/Par | Value ($) | ||||
| Water & Sewer Utility Revenue - continued | ||||||
| West Virginia Water Development Authority, Infrastructure Rev., “A”, AMBAC, 5%, 2033 | $ | 1,950,000 | $ | 1,842,185 | ||
| West Virginia Water Development Authority, Infrastructure Rev., “A”, FSA, 4.75%, 2045 | 2,000,000 | 1,776,920 | ||||
| $ | 18,817,300 | |||||
| Total Municipal Bonds (Identified Cost, $122,274,447) | $ | 118,249,537 | ||||
| Money Market Funds (v) - 2.3% | ||||||
| MFS Institutional Money Market Portfolio, 0.23%, at Cost and Net Asset Value | 2,773,553 | $ | 2,773,553 | |||
| Total Investments (Identified Cost, $125,048,000) | $ | 121,023,090 | ||||
| Other Assets, Less Liabilities - 1.6% | 1,995,437 | |||||
| Net Assets - 100.0% | $ | 123,018,527 | ||||
Portfolio Footnotes:
| (b) | Mandatory tender date is earlier than stated maturity date. |
| (c) | Refunded bond. |
| (d) | Non-income producing security – in default. |
| (f) | All or a portion of the security has been segregated as collateral for open futures contracts. |
| (p) | Primary inverse floater. |
| (u) | Underlying security deposited into special purpose trust (“the trust”) by investment banker upon creation of self-deposited inverse floaters. |
| (v) | Underlying fund that is available only to investment companies managed by MFS. The rate quoted is the annualized seven-day yield of the fund at period end. |
The following abbreviations are used in this report and are defined:
| COP | Certificate of Participation | |||||
| ETM | Escrowed to Maturity | |||||
| LOC | Letter of Credit | |||||
| Insurers | Inverse Floaters | |||||
| AMBAC | AMBAC Indemnity Corp. | RITES | Residual Interest Tax-Exempt Security | |||
| ASSD GTY | Assured Guaranty Insurance Co. | |||||
| BHAC | Berkshire Hathaway Assurance Corp. | |||||
| CIFG | CDC IXIS Financial Guaranty | |||||
| CONNIE LEE | Connie Lee Insurance Co. | |||||
| FGIC | Financial Guaranty Insurance Co. | |||||
| FHA | Federal Housing Administration | |||||
| FNMA | Federal National Mortgage Assn. | |||||
| FSA | Financial Security Assurance Inc. | |||||
| GNMA | Government National Mortgage Assn. | |||||
| MBIA | MBIA Insurance Corp. | |||||
| RADIAN | Radian Asset Assurance, Inc. | |||||
| XLCA | XL Capital Insurance Co. | |||||
See Notes to Financial Statements
51
Table of Contents
Financial Statements
STATEMENTS OF ASSETS AND LIABILITIES
At 3/31/09
These statements represent each fund’s balance sheet, which details the assets and liabilities comprising the total value of each fund.
| Mississippi Fund | New York Fund | North Carolina Fund | Pennsylvania Fund | |||||||||
| Assets | ||||||||||||
| Investments – | ||||||||||||
Non-affiliated issuers, at identified cost | $93,036,883 | $204,711,862 | $321,598,209 | $108,331,575 | ||||||||
Underlying funds, at cost and net asset value | 2,078,862 | 6,943,829 | 7,145,386 | 2,386,723 | ||||||||
| Total investments, at identified cost | $95,115,745 | $211,655,691 | $328,743,595 | $110,718,298 | ||||||||
Unrealized appreciation (depreciation) | (1,428,639 | ) | (5,426,522 | ) | (130,594 | ) | (4,490,125 | ) | ||||
| Total investments, at value | $93,687,106 | $206,229,169 | $328,613,001 | $106,228,173 | ||||||||
Receivable for investments sold | 360,000 | 537,354 | 148,500 | 205,000 | ||||||||
Receivable for fund shares sold | 68,174 | 208,716 | 1,267,067 | 388,260 | ||||||||
Interest and dividends receivable | 1,299,598 | 3,148,767 | 5,321,129 | 1,692,742 | ||||||||
Receivable from investment adviser | — | — | — | 7,319 | ||||||||
Other assets | 1,786 | 3,389 | 4,668 | 2,020 | ||||||||
Total assets | $95,416,664 | $210,127,395 | $335,354,365 | $108,523,514 | ||||||||
| Liabilities | ||||||||||||
Distributions payable | $158,817 | $233,266 | $406,778 | $147,382 | ||||||||
Payable for daily variation margin on open futures contracts | — | 27,750 | 33,750 | 12,000 | ||||||||
Payable for investments purchased | — | 1,826,561 | — | — | ||||||||
Payable to the holder of the floating rate certificate from trust assets | — | — | 8,014,290 | 960,550 | ||||||||
Payable for fund shares reacquired | 22,869 | 255,449 | 944,766 | 172,435 | ||||||||
Payable to affiliates | ||||||||||||
Management fee | 2,334 | 5,099 | 8,001 | 2,631 | ||||||||
Shareholder servicing costs | 11,010 | 22,188 | 33,681 | 15,065 | ||||||||
Distribution and service fees | 584 | 4,395 | 6,548 | 7,858 | ||||||||
Administrative services fee | 144 | 264 | 391 | 157 | ||||||||
Payable for independent trustees’ compensation | 7,236 | 9,293 | 12,111 | 7,315 | ||||||||
Payable for interest expense and fees | — | — | 23,165 | 3,201 | ||||||||
Accrued expenses and other liabilities | 47,545 | 58,570 | 63,583 | 51,767 | ||||||||
Total liabilities | $250,539 | $2,442,835 | $9,547,064 | $1,380,361 | ||||||||
Net assets | $95,166,125 | $207,684,560 | $325,807,301 | $107,143,153 | ||||||||
| Net assets consist of | ||||||||||||
Paid-in capital | $96,519,571 | $214,601,160 | $326,951,754 | $112,218,516 | ||||||||
Unrealized appreciation (depreciation) on investments | (1,428,639 | ) | (5,537,362 | ) | (265,400 | ) | (4,538,056 | ) | ||||
Accumulated net realized gain (loss) on investments | (6,563 | ) | (1,430,856 | ) | (1,191,176 | ) | (599,494 | ) | ||||
Undistributed net investment income | 81,756 | 51,618 | 312,123 | 62,187 | ||||||||
Net assets | $95,166,125 | $207,684,560 | $325,807,301 | $107,143,153 | ||||||||
52
Table of Contents
Statements of Assets and Liabilities – continued
| Mississippi Fund | New York Fund | North Carolina Fund | Pennsylvania Fund | |||||
Net assets | ||||||||
Class A | $89,792,539 | $169,524,676 | $274,487,205 | $84,422,096 | ||||
Class B | 5,373,586 | 16,285,390 | 13,651,934 | 22,721,057 | ||||
Class C | — | 21,874,494 | 37,668,162 | — | ||||
Total net assets | $95,166,125 | $207,684,560 | $325,807,301 | $107,143,153 | ||||
Shares of beneficial interest outstanding | ||||||||
Class A | 9,651,499 | 16,571,762 | 24,613,290 | 8,977,616 | ||||
Class B | 576,864 | 1,596,214 | 1,225,691 | 2,409,773 | ||||
Class C | — | 2,140,898 | 3,379,818 | — | ||||
Total shares of beneficial interest outstanding | 10,228,363 | 20,308,874 | 29,218,799 | 11,387,389 | ||||
Class A shares | ||||||||
Net asset value per share | ||||||||
(net assets/shares of beneficial interest outstanding) | $9.30 | $10.23 | $11.15 | $9.40 | ||||
Offering price per share (100/95.25 × net asset value per share) | $9.76 | $10.74 | $11.71 | $9.87 | ||||
Class B shares | ||||||||
Net asset value and offering price per share | ||||||||
(net assets/shares of beneficial interest outstanding) | $9.32 | �� | $10.20 | $11.14 | $9.43 | |||
Class C shares | ||||||||
Net asset value and offering price per share | ||||||||
(net assets/shares of beneficial interest outstanding) | $— | $10.22 | $11.15 | $— | ||||
On sales of $50,000 or more, the offering price of Class A shares is reduced. A contingent deferred sales charge may be imposed on redemptions of Class A, Class B, and Class C shares.
See Notes to Financial Statements
53
Table of Contents
Statements of Assets and Liabilities – continued
| At 3/31/09 | South Carolina Fund | Tennessee Fund | Virginia Fund | West Virginia Fund | ||||||||
| Assets | ||||||||||||
| Investments – | ||||||||||||
Non-affiliated issuers, at identified cost | $139,900,575 | $117,570,351 | $288,735,412 | $122,274,447 | ||||||||
Underlying funds, at cost and net asset value | 1,723,307 | 2,986,324 | 3,256,944 | 2,773,553 | ||||||||
| Total investments, at identified cost | $141,623,882 | $120,556,675 | $291,992,356 | $125,048,000 | ||||||||
Unrealized appreciation (depreciation) | (2,946,105 | ) | (3,181,403 | ) | (9,813,571 | ) | (4,024,910 | ) | ||||
| Total investments, at value | $138,677,777 | $117,375,272 | $282,178,785 | $121,023,090 | ||||||||
Receivable for investments sold | — | 102,847 | — | 10,000 | ||||||||
Receivable for fund shares sold | 466,360 | 202,323 | 633,853 | 125,000 | ||||||||
Interest and dividends receivable | 2,376,006 | 1,759,284 | 4,896,147 | 2,173,678 | ||||||||
Other assets | 2,400 | 2,128 | 4,345 | 2,168 | ||||||||
Total assets | $141,522,543 | $119,441,854 | $287,713,130 | $123,333,936 | ||||||||
| Liabilities | ||||||||||||
| Distributions payable | $166,600 | $191,903 | $421,649 | $143,957 | ||||||||
Payable for daily variation margin on open futures contracts | 9,750 | 9,000 | 27,750 | — | ||||||||
Payable for investments purchased | — | 2,412,700 | — | — | ||||||||
Payable to the holder of the floating rate certificate from trust assets | — | — | 5,424,435 | — | ||||||||
Payable for fund shares reacquired | 111,882 | 30,914 | 307,096 | 93,207 | ||||||||
Payable to affiliates | ||||||||||||
Management fee | 3,467 | 2,866 | 6,913 | 3,019 | ||||||||
Shareholder servicing costs | 16,096 | 11,736 | 33,151 | 13,262 | ||||||||
Distribution and service fees | 2,403 | 1,918 | 4,953 | 1,941 | ||||||||
Administrative services fee | 193 | 167 | 343 | 174 | ||||||||
Payable for independent trustees’ compensation | 12,078 | 9,251 | 12,128 | 12,077 | ||||||||
| Payable for interest expense and fees | — | — | 34,051 | — | ||||||||
Accrued expenses and other liabilities | 50,045 | 52,463 | 61,025 | 47,772 | ||||||||
Total liabilities | $372,514 | $2,722,918 | $6,333,494 | $315,409 | ||||||||
Net assets | $141,150,029 | $116,718,936 | $281,379,636 | $123,018,527 | ||||||||
| Net assets consist of | ||||||||||||
Paid-in capital | $145,160,672 | $119,685,742 | $291,346,543 | $129,830,241 | ||||||||
Unrealized appreciation (depreciation) on investments | (2,985,049 | ) | (3,217,351 | ) | (9,924,411 | ) | (4,024,910 | ) | ||||
Accumulated net realized gain (loss) on investments | (1,046,992 | ) | (17,204 | ) | 17,779 | (2,777,408 | ) | |||||
Accumulated undistributed (distributions in excess of) net investment income | 21,398 | 267,749 | (60,275 | ) | (9,396 | ) | ||||||
Net assets | $141,150,029 | $116,718,936 | $281,379,636 | $123,018,527 | ||||||||
54
Table of Contents
Statements of Assets and Liabilities – continued
| South Carolina Fund | Tennessee Fund | Virginia Fund | West Virginia Fund | |||||
Net assets | ||||||||
Class A | $129,510,225 | $108,762,833 | $254,233,870 | $116,564,069 | ||||
Class B | 11,639,804 | 7,956,103 | 7,400,954 | 6,454,458 | ||||
Class C | — | — | 19,744,812 | — | ||||
Total net assets | $141,150,029 | $116,718,936 | $281,379,636 | $123,018,527 | ||||
Shares of beneficial interest outstanding | ||||||||
Class A | 11,428,346 | 11,052,080 | 24,119,471 | 11,252,113 | ||||
Class B | 1,027,655 | 808,974 | 702,591 | 623,298 | ||||
Class C | — | — | 1,873,674 | — | ||||
Total shares of beneficial interest outstanding | 12,456,001 | 11,861,054 | 26,695,736 | 11,875,411 | ||||
Class A shares | ||||||||
Net asset value per share | ||||||||
(net assets/shares of beneficial interest outstanding) | $11.33 | $9.84 | $10.54 | $10.36 | ||||
Offering price per share (100/95.25 × net asset value per share) | $11.90 | $10.33 | $11.07 | $10.88 | ||||
Class B shares | ||||||||
Net asset value and offering price per share | ||||||||
(net assets/shares of beneficial interest outstanding) | $11.33 | $9.83 | $10.53 | $10.36 | ||||
Class C shares | ||||||||
Net asset value and offering price per share | ||||||||
(net assets/shares of beneficial interest outstanding) | $— | $— | $10.54 | $— | ||||
On sales of $50,000 or more, the offering price of Class A shares is reduced. A contingent deferred sales charge may be imposed on redemptions of Class A, Class B, and Class C shares.
See Notes to Financial Statements
55
Table of Contents
Financial Statements
Year ended 3/31/09
These statements describe how much each fund earned in investment income and accrued in expenses. They also describe any gains or losses generated by each fund’s operations.
| Mississippi Fund | New York Fund | North Carolina Fund | Pennsylvania Fund | |||||||||
| Net investment income | ||||||||||||
| Interest | $4,760,129 | $9,772,861 | $15,441,516 | $5,692,625 | ||||||||
Dividends from underlying funds | 1,159 | 4,619 | 3,221 | 1,835 | ||||||||
Total investment income | $4,761,288 | $9,777,480 | $15,444,737 | $5,694,460 | ||||||||
| Expenses | ||||||||||||
Management fee | $449,925 | $925,231 | $1,509,249 | $517,565 | ||||||||
Distribution and service fees | 54,883 | 780,879 | 1,410,896 | 300,441 | ||||||||
Shareholder servicing costs | 58,099 | 139,541 | 201,667 | 90,573 | ||||||||
Administrative services fee | 24,651 | 41,751 | 61,002 | 26,865 | ||||||||
Independent trustees’ compensation | 4,378 | 6,948 | 13,406 | 6,447 | ||||||||
Custodian fee | 24,954 | 37,546 | 52,265 | 34,493 | ||||||||
Shareholder communications | 9,750 | 12,968 | 12,030 | 10,223 | ||||||||
Auditing fees | 41,977 | 41,977 | 41,977 | 41,977 | ||||||||
Legal fees | 6,206 | 9,130 | 11,214 | 7,377 | ||||||||
Interest expense and fees | 21,243 | 54,303 | 304,674 | 51,384 | ||||||||
Miscellaneous | 45,744 | 72,213 | 90,437 | 48,876 | ||||||||
Total expenses | $741,810 | $2,122,487 | $3,708,817 | $1,136,221 | ||||||||
Fees paid indirectly | (8,972 | ) | (20,044 | ) | (25,910 | ) | (9,370 | ) | ||||
Reduction of expenses by investment adviser | (159,088 | ) | (321,389 | ) | (534,719 | ) | (235,183 | ) | ||||
Net expenses | $573,750 | $1,781,054 | $3,148,188 | $891,668 | ||||||||
Net investment income | $4,187,538 | $7,996,426 | $12,296,549 | $4,802,792 | ||||||||
| Realized and unrealized gain (loss) on investments | ||||||||||||
Realized gain (loss) (identified cost basis) | ||||||||||||
Investment transactions | $97,818 | $1,446,828 | $452,756 | $(144,851 | ) | |||||||
Futures contracts | (155,839 | ) | (727,253 | ) | (440,786 | ) | (312,538 | ) | ||||
Swap transactions | 75,981 | 15,895 | 29,799 | — | ||||||||
Net realized gain (loss) on investments | $17,960 | $735,470 | $41,769 | $(457,389 | ) | |||||||
Change in unrealized appreciation (depreciation) | ||||||||||||
Investments | $(2,837,849 | ) | $(11,132,765 | ) | $(5,689,606 | ) | $(5,703,865 | ) | ||||
Futures contracts | (8,056 | ) | (126,952 | ) | (165,419 | ) | (57,598 | ) | ||||
Swap transactions | (25,654 | ) | — | — | — | |||||||
Net unrealized gain (loss) on investments | $(2,871,559 | ) | $(11,259,717 | ) | $(5,855,025 | ) | $(5,761,463 | ) | ||||
Net realized and unrealized gain (loss) on investments | $(2,853,599 | ) | $(10,524,247 | ) | $(5,813,256 | ) | $(6,218,852 | ) | ||||
Change in net assets from operations | $1,333,939 | $(2,527,821 | ) | $6,483,293 | $(1,416,060 | ) | ||||||
See Notes to Financial Statements
56
Table of Contents
Statements of Operations – continued
| Year ended 3/31/09 | South Carolina Fund | Tennessee Fund | Virginia Fund | West Virginia Fund | ||||||||
| Net investment income | ||||||||||||
| Interest | $7,663,022 | $5,986,338 | $15,639,775 | $5,302,256 | ||||||||
Dividends from underlying funds | 1,494 | 1,706 | 3,258 | 1,794 | ||||||||
Total investment income | $7,664,516 | $5,988,044 | $15,643,033 | $5,304,050 | ||||||||
| Expenses | ||||||||||||
Management fee | $700,746 | $549,839 | $1,352,913 | $608,248 | ||||||||
Distribution and service fees | 584,137 | 446,272 | 1,130,358 | 476,625 | ||||||||
Shareholder servicing costs | 93,512 | 68,282 | 188,298 | 77,326 | ||||||||
Administrative services fee | 33,022 | 28,057 | 55,568 | 29,846 | ||||||||
Independent trustees’ compensation | 7,257 | 6,482 | 13,208 | 7,140 | ||||||||
Custodian fee | 31,575 | 30,177 | 52,273 | 25,004 | ||||||||
Shareholder communications | 10,612 | 9,896 | 15,877 | 10,261 | ||||||||
Auditing fees | 41,977 | 31,544 | 41,977 | 41,977 | ||||||||
Legal fees | 7,964 | 6,247 | 10,528 | 6,243 | ||||||||
Interest expense and fees | 118,399 | — | 248,487 | 14,857 | ||||||||
Miscellaneous | 53,933 | 48,787 | 84,562 | 49,785 | ||||||||
Total expenses | �� | $1,683,134 | $1,225,583 | $3,194,049 | $1,347,312 | |||||||
Fees paid indirectly | (12,420 | ) | (15,674 | ) | (28,268 | ) | (11,379 | ) | ||||
Reduction of expenses by investment adviser | (250,440 | ) | (194,884 | ) | (480,838 | ) | (217,525 | ) | ||||
Net expenses | $1,420,274 | $1,015,025 | $2,684,943 | $1,118,408 | ||||||||
Net investment income | $6,244,242 | $4,973,019 | $12,958,090 | $4,185,642 | ||||||||
| Realized and unrealized gain (loss) on investments | ||||||||||||
Realized gain (loss) (identified cost basis) | ||||||||||||
Investment transactions | $(934,536 | ) | $(173,440 | ) | $957,471 | $(627,321 | ) | |||||
Futures contracts | (444,367 | ) | (154,049 | ) | (525,851 | ) | (321,609 | ) | ||||
Swap transactions | 10,200 | 85,341 | 75,507 | 600 | ||||||||
Net realized gain (loss) on investments | $(1,368,703 | ) | $(242,148 | ) | $507,127 | $(948,330 | ) | |||||
Change in unrealized appreciation (depreciation) | ||||||||||||
Investments | $(5,258,401 | ) | $(4,037,015 | ) | $(12,686,709 | ) | $(4,606,457 | ) | ||||
Futures contracts | (52,553 | ) | (35,948 | ) | (138,230 | ) | (12,889 | ) | ||||
Swap transactions | (3,515 | ) | (54,517 | ) | (76,962 | ) | (4,967 | ) | ||||
Net unrealized gain (loss) on investments | $(5,314,469 | ) | $(4,127,480 | ) | $(12,901,901 | ) | $(4,624,313 | ) | ||||
Net realized and unrealized gain (loss) on investments | $(6,683,172 | ) | $(4,369,628 | ) | $(12,394,774 | ) | $(5,572,643 | ) | ||||
Change in net assets from operations | $(438,930 | ) | $603,391 | $563,316 | $(1,387,001 | ) | ||||||
See Notes to Financial Statements
57
Table of Contents
Financial Statements
STATEMENTS OF CHANGES IN NET ASSETS
These statements describe the increases and/or decreases in net assets resulting from operations, any distributions, and any shareholder transactions.
| Year ended 3/31/09 | Mississippi Fund | New York Fund | North Carolina Fund | Pennsylvania Fund | ||||||||
| Change in net assets | ||||||||||||
| From operations | ||||||||||||
| Net investment income | $4,187,538 | $7,996,426 | $12,296,549 | $4,802,792 | ||||||||
Net realized gain (loss) on investments | 17,960 | 735,470 | 41,769 | (457,389 | ) | |||||||
Net unrealized gain (loss) on investments | (2,871,559 | ) | (11,259,717 | ) | (5,855,025 | ) | (5,761,463 | ) | ||||
Change in net assets from operations | $1,333,939 | $(2,527,821 | ) | $6,483,293 | $(1,416,060 | ) | ||||||
| Distributions declared to shareholders | ||||||||||||
| From net investment income | ||||||||||||
Class A | $(3,799,592 | ) | $(6,767,287 | ) | $(11,214,241 | ) | $(3,643,041 | ) | ||||
Class B | (260,080 | ) | (660,968 | ) | (696,228 | ) | (954,712 | ) | ||||
Class C | — | (791,251 | ) | (1,234,042 | ) | — | ||||||
| From net realized gain on investments | ||||||||||||
Class A | — | (1,168,392 | ) | (1,077,983 | ) | — | ||||||
Class B | — | (120,331 | ) | (78,686 | ) | — | ||||||
Class C | — | (155,659 | ) | (140,400 | ) | — | ||||||
Total distributions declared to shareholders | $(4,059,672 | ) | $(9,663,888 | ) | $(14,441,580 | ) | $(4,597,753 | ) | ||||
Change in net assets from fund share transactions | $8,830,416 | $53,842,919 | $23,398,771 | $6,442,178 | ||||||||
Total change in net assets | $6,104,683 | $41,651,210 | $15,440,484 | $428,365 | ||||||||
| Net assets | ||||||||||||
| At beginning of period | 89,061,442 | 166,033,350 | 310,366,817 | 106,714,788 | ||||||||
At end of period | $95,166,125 | $207,684,560 | $325,807,301 | $107,143,153 | ||||||||
Undistributed net investment income included in net assets at end of period | $81,756 | $51,618 | $312,123 | $62,187 | ||||||||
| Year ended 3/31/09 | South Carolina Fund | Tennessee Fund | Virginia Fund | West Virginia Fund | ||||||||
| Change in net assets | ||||||||||||
| From operations | ||||||||||||
| Net investment income | $6,244,242 | $4,973,019 | $12,958,090 | $4,185,642 | ||||||||
| Net realized gain (loss) on investments | (1,368,703 | ) | (242,148 | ) | 507,127 | (948,330 | ) | |||||
| Net unrealized gain (loss) on investments | (5,314,469 | ) | (4,127,480 | ) | (12,901,901 | ) | (4,624,313 | ) | ||||
| Change in net assets from operations | $(438,930 | ) | $603,391 | $563,316 | $(1,387,001 | ) | ||||||
| Distributions declared to shareholders | ||||||||||||
| From net investment income | ||||||||||||
Class A | $(5,685,164 | ) | $(4,697,979 | ) | $(11,232,593 | ) | $(4,821,294 | ) | ||||
Class B | (508,048 | ) | (337,610 | ) | (333,402 | ) | (252,757 | ) | ||||
Class C | — | — | (678,404 | ) | — | |||||||
| From net realized gain on investments | ||||||||||||
Class A | (213,444 | ) | (441,456 | ) | (2,090,779 | ) | (1,224,513 | ) | ||||
Class B | (21,914 | ) | (34,994 | ) | (68,587 | ) | (76,120 | ) | ||||
Class C | — | — | (152,943 | ) | — | |||||||
| Total distributions declared to shareholders | $(6,428,570 | ) | $(5,512,039 | ) | $(14,556,708 | ) | $(6,374,684 | ) | ||||
| Change in net assets from fund share transactions | $(1,900,667 | ) | $10,616,051 | $13,194,233 | $(2,264,088 | ) | ||||||
| Total change in net assets | $(8,768,167 | ) | $5,707,403 | $(799,159 | ) | $(10,025,773 | ) | |||||
| Net assets | ||||||||||||
| At beginning of period | 149,918,196 | 111,011,533 | 282,178,795 | 133,044,300 | ||||||||
| At end of period | $141,150,029 | $116,718,936 | $281,379,636 | $123,018,527 | ||||||||
Accumulated undistributed (distributions in excess of) net investment income included in net assets at end of period | $21,398 | $267,749 | $(60,275 | ) | $(9,396 | ) | ||||||
See Notes to Financial Statements
58
Table of Contents
Statements of Changes in Net Assets – continued
| Year ended 3/31/08 | Mississippi Fund | New York Fund | North Carolina Fund | Pennsylvania Fund | ||||||||
| Change in net assets | ||||||||||||
| From operations | ||||||||||||
| Net investment income | $3,786,430 | $6,360,559 | $13,832,844 | $4,396,176 | ||||||||
| Net realized gain (loss) on investments | 69,757 | 800,004 | 611,761 | (463,622 | ) | |||||||
| Net unrealized gain (loss) on investments | (2,125,759 | ) | (4,596,999 | ) | (12,181,788 | ) | (3,234,845 | ) | ||||
| Change in net assets from operations | $1,730,428 | $2,563,564 | $2,262,817 | $697,709 | ||||||||
| Distributions declared to shareholders | ||||||||||||
| From net investment income | ||||||||||||
Class A | $(3,419,568 | ) | $(5,237,179 | ) | $(10,767,677 | ) | $(3,196,032 | ) | ||||
Class B | (316,378 | ) | (809,779 | ) | (818,296 | ) | (1,079,665 | ) | ||||
Class C | — | (603,784 | ) | (1,081,750 | ) | — | ||||||
| From net realized gain on investments | ||||||||||||
Class A | — | (571,156 | ) | (810,574 | ) | (19,950 | ) | |||||
Class B | — | (102,339 | ) | (71,914 | ) | (7,921 | ) | |||||
Class C | — | (80,011 | ) | (95,301 | ) | — | ||||||
| Total distributions declared to shareholders | $(3,735,946 | ) | $(7,404,248 | ) | $(13,645,512 | ) | $(4,303,568 | ) | ||||
| Change in net assets from fund share transactions | $6,188,450 | $10,475,057 | $(6,030,520 | ) | $2,658,614 | |||||||
| Total change in net assets | $4,182,932 | $5,634,373 | $(17,413,215 | ) | $(947,245 | ) | ||||||
| Net assets | ||||||||||||
| At beginning of period | 84,878,510 | 160,398,977 | 327,780,032 | 107,662,033 | ||||||||
| At end of period | $89,061,442 | $166,033,350 | $310,366,817 | $106,714,788 | ||||||||
Accumulated undistributed (distributions in excess of) net investment income included in net assets at end of period | $(17,639 | ) | $(117,252 | ) | $236,925 | $10,853 | ||||||
| Year ended 3/31/08 | South Carolina Fund | Tennessee Fund | Virginia Fund | West Virginia Fund | ||||||||
| Change in net assets | ||||||||||||
| From operations | ||||||||||||
| Net investment income | $6,478,377 | $4,941,601 | $13,309,215 | $5,821,434 | ||||||||
| Net realized gain (loss) on investments | 250,879 | 410,760 | 1,912 | (144,530 | ) | |||||||
| Net unrealized gain (loss) on investments | (5,922,803 | ) | (4,006,453 | ) | (9,834,867 | ) | (5,195,238 | ) | ||||
| Change in net assets from operations | $806,453 | $1,345,908 | $3,476,260 | $481,666 | ||||||||
| Distributions declared to shareholders | ||||||||||||
| From net investment income | ||||||||||||
Class A | $(5,671,411 | ) | $(4,136,804 | ) | $(11,139,204 | ) | $(5,249,476 | ) | ||||
Class B | (649,595 | ) | (393,512 | ) | (391,875 | ) | (319,990 | ) | ||||
Class C | — | — | (467,129 | ) | — | |||||||
| From net realized gain on investments | ||||||||||||
Class A | — | (298,704 | ) | (704,401 | ) | (154,048 | ) | |||||
Class B | — | (31,748 | ) | (28,072 | ) | (11,065 | ) | |||||
Class C | — | — | (34,732 | ) | — | |||||||
| Total distributions declared to shareholders | $(6,321,006 | ) | $(4,860,768 | ) | $(12,765,413 | ) | $(5,734,579 | ) | ||||
| Change in net assets from fund share transactions | $(1,012,407 | ) | $2,300,640 | $(2,522,224 | ) | $(1,763,894 | ) | |||||
| Total change in net assets | $(6,526,960 | ) | $(1,214,220 | ) | $(11,811,377 | ) | $(7,016,807 | ) | ||||
| Net assets | ||||||||||||
| At beginning of period | 156,445,156 | 112,225,753 | 293,990,172 | 140,061,107 | ||||||||
| At end of period | $149,918,196 | $111,011,533 | $282,178,795 | $133,044,300 | ||||||||
Accumulated undistributed (distributions in excess of) net investment income included in net assets at end of period | $35,389 | $414,422 | $(360,326 | ) | $(45,034 | ) | ||||||
See Notes to Financial Statements
59
Table of Contents
Financial Statements
MFS® MISSISSIPPI MUNICIPAL BOND FUND
The financial highlights table is intended to help you understand the fund financial performance for the past 5 years. Certain information reflects financial results for a single fund share. The total returns in the table represent the rate by which an investor would have earned (or lost) on an investment in the fund share class (assuming reinvestment of all distributions) held for the entire period.
| Years ended 3/31 | |||||||||||||||
| Class A | 2009 | 2008 | 2007 | 2006 | 2005 | ||||||||||
Net asset value, beginning of period | $9.58 | $9.80 | $9.73 | $9.82 | $10.02 | ||||||||||
| Income (loss) from investment operations | |||||||||||||||
| Net investment income (d) | $0.43 | $0.44 | $0.45 | (z) | $0.44 | $0.46 | |||||||||
Net realized and unrealized gain (loss) on investments | (0.30 | ) | (0.23 | ) | 0.05 | (z) | (0.09 | ) | (0.19 | ) | |||||
Total from investment operations | $0.13 | $0.21 | $0.50 | $0.35 | $0.27 | ||||||||||
| Less distributions declared to shareholders | |||||||||||||||
From net investment income | $(0.41 | ) | $(0.43 | ) | $(0.43 | ) | $(0.44 | ) | $(0.47 | ) | |||||
Net asset value, end of period | $9.30 | $9.58 | $9.80 | $9.73 | $9.82 | ||||||||||
Total return (%) (r)(s)(t) | 1.47 | 2.21 | 5.20 | 3.59 | 2.76 | ||||||||||
| Ratios (%) (to average net assets) and Supplemental data: | |||||||||||||||
| Expenses before expense reductions (f) | 0.74 | 1.03 | 1.11 | 1.07 | 0.93 | ||||||||||
| Expenses after expense reductions (f) | 0.57 | 0.78 | 0.86 | 0.82 | 0.68 | ||||||||||
Expenses after expense reductions and excluding interest expense and fees (f)(l) | 0.54 | 0.56 | 0.62 | 0.64 | 0.58 | ||||||||||
Net investment income | 4.55 | 4.51 | 4.59 | (z) | 4.48 | 4.70 | |||||||||
Portfolio turnover | 24 | 13 | 12 | 9 | 19 | ||||||||||
Net assets at end of period (000 Omitted) | $89,793 | $80,893 | $75,470 | $75,597 | $79,574 | ||||||||||
See Notes to Financial Statements
60
Table of Contents
Financial Highlights – continued
MFS® MISSISSIPPI MUNICIPAL BOND FUND – continued
| Years ended 3/31 | |||||||||||||||
| Class B | 2009 | 2008 | 2007 | 2006 | 2005 | ||||||||||
Net asset value, beginning of period | $9.59 | $9.81 | $9.74 | $9.84 | $10.03 | ||||||||||
| Income (loss) from investment operations | |||||||||||||||
| Net investment income (d) | $0.36 | $0.36 | $0.38 | (z) | $0.37 | $0.39 | |||||||||
Net realized and unrealized gain (loss) on investments | (0.29 | ) | (0.22 | ) | 0.04 | (z) | (0.10 | ) | (0.19 | ) | |||||
Total from investment operations | $0.07 | $0.14 | $0.42 | $0.27 | $0.20 | ||||||||||
| Less distributions declared to shareholders | |||||||||||||||
From net investment income | $(0.34 | ) | $(0.36 | ) | $(0.35 | ) | $(0.37 | ) | $(0.39 | ) | |||||
Net asset value, end of period | $9.32 | $9.59 | $9.81 | $9.74 | $9.84 | ||||||||||
Total return (%) (r)(s)(t) | 0.80 | 1.43 | 4.41 | 2.71 | 2.08 | ||||||||||
| Ratios (%) (to average net assets) and Supplemental data: | |||||||||||||||
| Expenses before expense reductions (f) | 1.51 | 1.80 | 1.87 | 1.83 | 1.70 | ||||||||||
| Expenses after expense reductions (f) | 1.33 | 1.55 | 1.62 | 1.58 | 1.45 | ||||||||||
Expenses after expense reductions and excluding interest expense and fees (f)(l) | 1.31 | 1.33 | 1.38 | 1.40 | 1.35 | ||||||||||
Net investment income | 3.79 | 3.75 | 3.83 | (z) | 3.72 | 3.93 | |||||||||
Portfolio turnover | 24 | 13 | 12 | 9 | 19 | ||||||||||
Net assets at end of period (000 Omitted) | $5,374 | $8,169 | $9,408 | $10,465 | $11,544 | ||||||||||
Any redemption fees charged by the fund during the 2005 fiscal year resulted in a per share impact of less than $0.01.
| (d) | Per share data is based on average shares outstanding. |
| (f) | Ratios do not reflect reductions from fees paid indirectly, if applicable. |
| (l) | Interest expense and fees relate to payments made to the holder of the floating rate certificate from trust assets. |
| (r) | Certain expenses have been reduced without which performance would have been lower. |
| (s) | From time to time the fund may receive proceeds from litigation settlements, without which performance would be lower. |
| (t) | Total returns do not include any applicable sales charges. |
| (z) | The fund applied a change in estimate for amortization of premium on certain debt securities that resulted in an increase of $0.01 per share to net investment income, a decrease of $0.01 per share to net realized and unrealized gain (loss) on investments, and an increase of 0.07% to the net investment income ratio for each class for the year ended March 31, 2007. The change in estimate had no impact on net assets, net asset value per share or total return of each class. |
See Notes to Financial Statements
61
Table of Contents
Financial Highlights – continued
MFS® NEW YORK MUNICIPAL BOND FUND
The financial highlights table is intended to help you understand the fund financial performance for the past 5 years. Certain information reflects financial results for a single fund share. The total returns in the table represent the rate by which an investor would have earned (or lost) on an investment in the fund share class (assuming reinvestment of all distributions) held for the entire period.
| Years ended 3/31 | |||||||||||||||
| Class A | 2009 | 2008 | 2007 | 2006 | 2005 | ||||||||||
Net asset value, beginning of period | $10.82 | $11.15 | $11.13 | $11.30 | $11.53 | ||||||||||
| Income (loss) from investment operations | |||||||||||||||
| Net investment income (d) | $0.44 | $0.46 | $ 0.52 | (z) | $0.49 | $0.51 | |||||||||
Net realized and unrealized gain (loss) on investments | (0.50 | ) | (0.26 | ) | 0.03 | (z) | (0.12 | ) | (0.24 | ) | |||||
Total from investment operations | $(0.06 | ) | $0.20 | $0.55 | $0.37 | $0.27 | |||||||||
| Less distributions declared to shareholders | |||||||||||||||
| From net investment income | $(0.46 | ) | $(0.48 | ) | $(0.48 | ) | $(0.49 | ) | $(0.50 | ) | |||||
From net realized gain on investments | (0.07 | ) | (0.05 | ) | (0.05 | ) | (0.05 | ) | — | ||||||
Total distributions declared to shareholders | $(0.53 | ) | $(0.53 | ) | $(0.53 | ) | $(0.54 | ) | $(0.50 | ) | |||||
Net asset value, end of period | $10.23 | $10.82 | $11.15 | $11.13 | $11.30 | ||||||||||
Total return (%) (r)(s)(t) | (0.46 | ) | 1.84 | 5.07 | 3.30 | 2.45 | |||||||||
| Ratios (%) (to average net assets) and Supplemental data: | |||||||||||||||
Expenses before expense reductions (f) | 0.94 | 1.25 | 1.32 | 1.28 | 1.14 | ||||||||||
Expenses after expense reductions (f) | 0.78 | 1.00 | 1.06 | 1.03 | 0.89 | ||||||||||
Expenses after expense reductions and excluding interest expense and fees (f)(l) | 0.75 | 0.77 | 0.82 | 0.85 | 0.79 | ||||||||||
Net investment income | 4.29 | 4.16 | 4.66 | (z) | 4.36 | 4.47 | |||||||||
Portfolio turnover | 29 | 22 | 8 | 12 | 20 | ||||||||||
Net assets at end of period (000 Omitted) | $169,525 | $126,126 | $118,924 | $118,476 | $125,861 | ||||||||||
| Years ended 3/31 | |||||||||||||||
| Class B | 2009 | 2008 | 2007 | 2006 | 2005 | ||||||||||
Net asset value, beginning of period | $10.79 | $11.11 | $11.09 | $11.27 | $11.49 | ||||||||||
| Income (loss) from investment operations | |||||||||||||||
| Net investment income (d) | $0.37 | $0.38 | $0.43 | (z) | $0.41 | $0.42 | |||||||||
Net realized and unrealized gain (loss) on investments | (0.51 | ) | (0.25 | ) | 0.04 | (z) | (0.14 | ) | (0.22 | ) | |||||
Total from investment operations | $(0.14 | ) | $0.13 | $0.47 | $0.27 | $0.20 | |||||||||
| Less distributions declared to shareholders | |||||||||||||||
| From net investment income | $(0.38 | ) | $(0.40 | ) | $(0.40 | ) | $(0.40 | ) | $(0.42 | ) | |||||
From net realized gain on investments | (0.07 | ) | (0.05 | ) | (0.05 | ) | (0.05 | ) | — | ||||||
Total distributions declared to shareholders | $(0.45 | ) | $(0.45 | ) | $(0.45 | ) | $(0.45 | ) | $(0.42 | ) | |||||
Net asset value, end of period | $10.20 | $10.79 | $11.11 | $11.09 | $11.27 | ||||||||||
Total return (%) (r)(s)(t) | (1.23 | ) | 1.15 | 4.29 | 2.43 | 1.77 | |||||||||
| Ratios (%) (to average net assets) and Supplemental data: | |||||||||||||||
Expenses before expense reductions (f) | 1.70 | 2.00 | 2.07 | 2.03 | 1.89 | ||||||||||
Expenses after expense reductions (f) | 1.52 | 1.75 | 1.82 | 1.78 | 1.64 | ||||||||||
Expenses after expense reductions and excluding interest expense and fees (f)(l) | 1.50 | 1.52 | 1.57 | 1.60 | 1.54 | ||||||||||
Net investment income | 3.55 | 3.43 | 3.91 | (z) | 3.61 | 3.70 | |||||||||
Portfolio turnover | 29 | 22 | 8 | 12 | 20 | ||||||||||
Net assets at end of period (000 Omitted) | $16,285 | $20,053 | $25,654 | $30,046 | $35,328 | ||||||||||
See Notes to Financial Statements
62
Table of Contents
Financial Highlights – continued
MFS® NEW YORK MUNICIPAL BOND FUND – continued
| Years ended 3/31 | |||||||||||||||
| Class C | 2009 | 2008 | 2007 | 2006 | 2005 | ||||||||||
Net asset value, beginning of period | $10.81 | $11.13 | $11.11 | $11.29 | $11.51 | ||||||||||
| Income (loss) from investment operations | |||||||||||||||
| Net investment income (d) | $0.37 | $0.37 | $0.43 | (z) | $0.41 | $0.42 | |||||||||
Net realized and unrealized gain (loss) on investments | (0.51 | ) | (0.24 | ) | 0.04 | (z) | (0.14 | ) | (0.22 | ) | |||||
Total from investment operations | $(0.14 | ) | $0.13 | $0.47 | $0.27 | $0.20 | |||||||||
| Less distributions declared to shareholders | |||||||||||||||
| From net investment income | $(0.38 | ) | $(0.40 | ) | $(0.40 | ) | $(0.40 | ) | $(0.42 | ) | |||||
From net realized gain on investments | (0.07 | ) | (0.05 | ) | (0.05 | ) | (0.05 | ) | — | ||||||
Total distributions declared to shareholders | $(0.45 | ) | $(0.45 | ) | $(0.45 | ) | $(0.45 | ) | $(0.42 | ) | |||||
Net asset value, end of period | $10.22 | $10.81 | $11.13 | $11.11 | $11.29 | ||||||||||
Total return (%) (r)(s)(t) | (1.22 | ) | 1.16 | 4.29 | 2.43 | 1.78 | |||||||||
| Ratios (%) (to average net assets) and Supplemental data: | |||||||||||||||
Expenses before expense reductions (f) | 1.70 | 2.00 | 2.07 | 2.03 | 1.89 | ||||||||||
Expenses after expense reductions (f) | 1.53 | 1.75 | 1.82 | 1.78 | 1.64 | ||||||||||
Expenses after expense reductions and excluding interest expense and fees (f)(l) | 1.50 | 1.52 | 1.57 | 1.60 | 1.54 | ||||||||||
Net investment income | 3.54 | 3.40 | 3.92 | (z) | 3.61 | 3.72 | |||||||||
Portfolio turnover | 29 | 22 | 8 | 12 | 20 | ||||||||||
Net assets at end of period (000 Omitted) | $21,874 | $19,855 | $15,822 | $17,064 | $19,730 | ||||||||||
Any redemption fees charged by the fund during the 2005 fiscal year resulted in a per share impact of less than $0.01.
| (d) | Per share data is based on average shares outstanding. |
| (f) | Ratios do not reflect reductions from fees paid indirectly, if applicable. |
| (l) | Interest expense and fees relate to payments made to the holder of the floating rate certificate from trust assets. |
| (r) | Certain expenses have been reduced without which performance would have been lower. |
| (s) | From time to time the fund may receive proceeds from litigation settlements, without which performance would be lower. |
| (t) | Total returns do not include any applicable sales charges. |
| (z) | The fund applied a change in estimate for amortization of premium on certain debt securities that resulted in an increase of $0.02 per share to net investment income, a decrease of $0.02 per share to net realized and unrealized gain (loss) on investments, and an increase of 0.22% to the net investment income ratio for each class for the year ended March 31, 2007. The change in estimate had no impact on net assets, net asset value per share or total return of each class. |
See Notes to Financial Statements
63
Table of Contents
Financial Highlights – continued
MFS® NORTH CAROLINA MUNICIPAL BOND FUND
The financial highlights table is intended to help you understand the fund financial performance for the past 5 years. Certain information reflects financial results for a single fund share. The total returns in the table represent the rate by which an investor would have earned (or lost) on an investment in the fund share class (assuming reinvestment of all distributions) held for the entire period.
| Years ended 3/31 | |||||||||||||||
| Class A | 2009 | 2008 | 2007 | 2006 | 2005 | ||||||||||
Net asset value, beginning of period | $11.44 | $11.86 | $11.85 | $11.99 | $12.30 | ||||||||||
| Income (loss) from investment operations | |||||||||||||||
| Net investment income (d) | $0.45 | $0.52 | $0.51 | (z) | $0.51 | $0.53 | |||||||||
Net realized and unrealized gain (loss) on investments | (0.21 | ) | (0.42 | ) | 0.03 | (z) | (0.09 | ) | (0.27 | ) | |||||
Total from investment operations | $0.24 | $0.10 | $0.54 | $0.42 | $0.26 | ||||||||||
| Less distributions declared to shareholders | |||||||||||||||
| From net investment income | $(0.48 | ) | $(0.48 | ) | $(0.50 | ) | $(0.51 | ) | $(0.53 | ) | |||||
From net realized gain on investments | (0.05 | ) | (0.04 | ) | (0.03 | ) | (0.05 | ) | (0.04 | ) | |||||
Total distributions declared to shareholders | $(0.53 | ) | $(0.52 | ) | $(0.53 | ) | $(0.56 | ) | $(0.57 | ) | |||||
Net asset value, end of period | $11.15 | $11.44 | $11.86 | $11.85 | $11.99 | ||||||||||
Total return (%) (r)(s)(t) | 2.22 | 0.83 | 4.60 | 3.49 | 2.15 | ||||||||||
| Ratios (%) (to average net assets) and Supplemental data: | |||||||||||||||
Expenses before expense reductions (f) | 1.08 | 1.32 | 1.36 | 1.32 | 1.10 | ||||||||||
Expenses after expense reductions (f) | 0.91 | 1.07 | 1.11 | 1.08 | 0.85 | ||||||||||
Expenses after expense reductions and excluding interest expense and fees (f)(l) | 0.81 | 0.81 | 0.86 | 0.89 | 0.85 | ||||||||||
Net investment income | 4.05 | 4.48 | 4.34 | (z) | 4.24 | 4.38 | |||||||||
Portfolio turnover | 20 | 17 | 12 | 8 | 9 | ||||||||||
Net assets at end of period (000 Omitted) | $274,487 | $257,884 | $268,108 | $270,124 | $279,875 | ||||||||||
| Years ended 3/31 | |||||||||||||||
| Class B | 2009 | 2008 | 2007 | 2006 | 2005 | ||||||||||
Net asset value, beginning of period | $11.42 | $11.84 | $11.83 | $11.98 | $12.29 | ||||||||||
| Income (loss) from investment operations | |||||||||||||||
| Net investment income (d) | $0.38 | $0.45 | $0.44 | (z) | $0.43 | $0.45 | |||||||||
Net realized and unrealized gain (loss) on investments | (0.20 | ) | (0.43 | ) | 0.02 | (z) | (0.10 | ) | (0.27 | ) | |||||
Total from investment operations | $0.18 | $0.02 | $0.46 | $0.33 | $0.18 | ||||||||||
| Less distributions declared to shareholders | |||||||||||||||
| From net investment income | $(0.41 | ) | $(0.40 | ) | $(0.42 | ) | $(0.43 | ) | $(0.45 | ) | |||||
From net realized gain on investments | (0.05 | ) | (0.04 | ) | (0.03 | ) | (0.05 | ) | (0.04 | ) | |||||
Total distributions declared to shareholders | $(0.46 | ) | $(0.44 | ) | $(0.45 | ) | $(0.48 | ) | $(0.49 | ) | |||||
Net asset value, end of period | $11.14 | $11.42 | $11.84 | $11.83 | $11.98 | ||||||||||
Total return (%) (r)(s)(t) | 1.63 | 0.17 | 3.93 | 2.73 | 1.49 | ||||||||||
| Ratios (%) (to average net assets) and Supplemental data: | |||||||||||||||
Expenses before expense reductions (f) | 1.74 | 1.97 | 2.01 | 1.98 | 1.75 | ||||||||||
Expenses after expense reductions (f) | 1.56 | 1.72 | 1.76 | 1.73 | 1.50 | ||||||||||
Expenses after expense reductions and excluding interest expense and fees (f)(l) | 1.46 | 1.47 | 1.51 | 1.54 | 1.50 | ||||||||||
Net investment income | 3.39 | 3.83 | 3.70 | (z) | 3.59 | 3.72 | |||||||||
Portfolio turnover | 20 | 17 | 12 | 8 | 9 | ||||||||||
Net assets at end of period (000 Omitted) | $13,652 | $21,537 | $26,520 | $32,610 | $40,251 | ||||||||||
See Notes to Financial Statements
64
Table of Contents
Financial Highlights – continued
MFS® NORTH CAROLINA MUNICIPAL BOND FUND – continued
| Years ended 3/31 | |||||||||||||||
| Class C | 2009 | 2008 | 2007 | 2006 | 2005 | ||||||||||
Net asset value, beginning of period | $11.43 | $11.85 | $11.84 | $11.98 | $12.29 | ||||||||||
| Income (loss) from investment operations | |||||||||||||||
| Net investment income (d) | $0.38 | $0.45 | $0.44 | (z) | $0.43 | $0.45 | |||||||||
Net realized and unrealized gain (loss) on investments | (0.20 | ) | (0.43 | ) | 0.02 | (z) | (0.09 | ) | (0.27 | ) | |||||
Total from investment operations | $0.18 | $0.02 | $0.46 | $0.34 | $0.18 | ||||||||||
| Less distributions declared to shareholders | |||||||||||||||
| From net investment income | $(0.41 | ) | $(0.40 | ) | $(0.42 | ) | $(0.43 | ) | $(0.45 | ) | |||||
From net realized gain on investments | (0.05 | ) | (0.04 | ) | (0.03 | ) | (0.05 | ) | (0.04 | ) | |||||
Total distributions declared to shareholders | $(0.46 | ) | $(0.44 | ) | $(0.45 | ) | $(0.48 | ) | $(0.49 | ) | |||||
Net asset value, end of period | $11.15 | $11.43 | $11.85 | $11.84 | $11.98 | ||||||||||
Total return (%) (r)(s)(t) | 1.63 | 0.17 | 3.93 | 2.82 | 1.49 | ||||||||||
| Ratios (%) (to average net assets) and Supplemental data: | |||||||||||||||
Expenses before expense reductions (f) | 1.73 | 1.97 | 2.01 | 1.98 | 1.76 | ||||||||||
Expenses after expense reductions (f) | 1.56 | 1.72 | 1.76 | 1.73 | 1.51 | ||||||||||
Expenses after expense reductions and excluding interest expense and fees (f)(l) | 1.47 | 1.47 | 1.51 | 1.54 | 1.51 | ||||||||||
Net investment income | 3.39 | 3.83 | 3.69 | (z) | 3.61 | 3.76 | |||||||||
Portfolio turnover | 20 | 17 | 12 | 8 | 9 | ||||||||||
Net assets at end of period (000 Omitted) | $37,668 | $30,946 | $33,152 | $32,223 | $32,897 | ||||||||||
Any redemption fees charged by the fund during the 2005 fiscal year resulted in a per share impact of less than $0.01.
| (d) | Per share data is based on average shares outstanding. |
| (f) | Ratios do not reflect reductions from fees paid indirectly, if applicable. |
| (l) | Interest expense and fees relate to payments made to the holder of the floating rate certificate from trust assets. |
| (r) | Certain expenses have been reduced without which performance would have been lower. |
| (s) | From time to time the fund may receive proceeds from litigation settlements, without which performance would be lower. |
| (t) | Total returns do not include any applicable sales charges. |
| (z) | The fund applied a change in estimate for amortization of premium on certain debt securities that resulted in an increase of $0.02 per share to net investment income, a decrease of $0.02 per share to net realized and unrealized gain (loss) on investments, and an increase of 0.16% to the net investment income ratio for each class for the year ended March 31, 2007. The change in estimate had no impact on net assets, net asset value per share or total return of each class. |
See Notes to Financial Statements
65
Table of Contents
Financial Highlights – continued
MFS® PENNSYLVANIA MUNICIPAL BOND FUND
The financial highlights table is intended to help you understand the fund financial performance for the past 5 years. Certain information reflects financial results for a single fund share. The total returns in the table represent the rate by which an investor would have earned (or lost) on an investment in the fund share class (assuming reinvestment of all distributions) held for the entire period.
| Years ended 3/31 | |||||||||||||||
| Class A | 2009 | 2008 | 2007 | 2006 | 2005 | ||||||||||
Net asset value, beginning of period | $9.90 | $10.24 | $10.15 | $10.17 | $10.31 | ||||||||||
| Income (loss) from investment operations | |||||||||||||||
| Net investment income (d) | $0.45 | $0.44 | $0.45 | (z) | $0.43 | $0.44 | |||||||||
Net realized and unrealized gain (loss) on investments | (0.52 | ) | (0.36 | ) | 0.06 | (z) | (0.02 | ) | (0.14 | ) | |||||
Total from investment operations | $(0.07 | ) | $0.08 | $0.51 | $0.41 | $0.30 | |||||||||
| Less distributions declared to shareholders | |||||||||||||||
| From net investment income | $(0.43 | ) | $(0.42 | ) | $(0.42 | ) | $(0.43 | ) | $(0.44 | ) | |||||
From net realized gain on investments | — | (0.00 | )(w) | — | — | — | |||||||||
Total distributions declared to shareholders | $(0.43 | ) | $(0.42 | ) | $(0.42 | ) | $(0.43 | ) | $(0.44 | ) | |||||
Net asset value, end of period | $9.40 | $9.90 | $10.24 | $10.15 | $10.17 | ||||||||||
Total return (%) (r)(s)(t) | (0.69 | ) | 0.87 | 5.17 | 4.08 | 2.97 | |||||||||
| Ratios (%) (to average net assets) and Supplemental data: | |||||||||||||||
| Expenses before expense reductions (f) | 0.88 | 1.11 | 1.18 | 1.13 | 1.03 | ||||||||||
Expenses after expense reductions (f) | 0.66 | 0.80 | 0.82 | 0.77 | 0.69 | ||||||||||
Expenses after expense reductions and excluding interest expense and fees (f)(l) | 0.61 | 0.60 | 0.60 | 0.60 | 0.60 | ||||||||||
Net investment income | 4.67 | 4.32 | 4.45 | (z) | 4.24 | 4.33 | |||||||||
Portfolio turnover | 28 | 17 | 9 | 9 | 20 | ||||||||||
Net assets at end of period (000 Omitted) | $84,422 | $77,866 | $73,813 | $74,429 | $67,942 | ||||||||||
See Notes to Financial Statements
66
Table of Contents
Financial Highlights – continued
MFS® PENNSYLVANIA MUNICIPAL BOND FUND – continued
| Years ended 3/31 | |||||||||||||||
| Class B | 2009 | 2008 | 2007 | 2006 | 2005 | ||||||||||
Net asset value, beginning of period | $9.93 | $10.27 | $10.18 | $10.20 | $10.34 | ||||||||||
| Income (loss) from investment operations | |||||||||||||||
| Net investment income (d) | $0.37 | $0.36 | $0.38 | (z) | $0.36 | $0.36 | |||||||||
Net realized and unrealized gain (loss) on investments | (0.51 | ) | (0.35 | ) | 0.06 | (z) | (0.03 | ) | (0.14 | ) | |||||
Total from investment operations | $(0.14 | ) | $0.01 | $0.44 | $0.33 | $0.22 | |||||||||
| Less distributions declared to shareholders | |||||||||||||||
| From net investment income | $(0.36 | ) | $(0.35 | ) | $(0.35 | ) | $(0.35 | ) | $(0.36 | ) | |||||
From net realized gain on investments | — | (0.00 | )(w) | — | — | — | |||||||||
Total distributions declared to shareholders | $(0.36 | ) | $(0.35 | ) | $(0.35 | ) | $(0.35 | ) | $(0.36 | ) | |||||
Net asset value, end of period | $9.43 | $9.93 | $10.27 | $10.18 | $10.20 | ||||||||||
Total return (%) (r)(s)(t) | (1.42 | ) | 0.11 | 4.37 | 3.30 | 2.19 | |||||||||
| Ratios (%) (to average net assets) and Supplemental data: | |||||||||||||||
| Expenses before expense reductions (f) | 1.64 | 1.86 | 1.94 | 1.89 | 1.80 | ||||||||||
Expenses after expense reductions (f) | 1.41 | 1.56 | 1.58 | 1.53 | 1.46 | ||||||||||
Expenses after expense reductions and excluding interest expense and fees (f)(l) | 1.37 | 1.36 | 1.36 | 1.36 | 1.37 | ||||||||||
Net investment income | 3.91 | 3.56 | 3.69 | (z) | 3.49 | 3.56 | |||||||||
Portfolio turnover | 28 | 17 | 9 | 9 | 20 | ||||||||||
Net assets at end of period (000 Omitted) | $22,721 | $28,848 | $33,849 | $38,642 | $41,455 | ||||||||||
Any redemption fees charged by the fund during the 2005 fiscal years resulted in a per share impact of less than $0.01.
| (d) | Per share data is based on average shares outstanding. |
| (f) | Ratios do not reflect reductions from fees paid indirectly, if applicable. |
| (l) | Interest expense and fees relate to payments made to the holder of the floating rate certificate from trust assets. |
| (r) | Certain expenses have been reduced without which performance would have been lower. |
| (s) | From time to time the fund may receive proceeds from litigation settlements, without which performance would be lower. |
| (t) | Total returns do not include any applicable sales charges. |
| (w) | Per share amount was less than $0.01. |
| (z) | The fund applied a change in estimate for amortization of premium on certain debt securities that resulted in an increase of $0.02 per share to net investment income, a decrease of $0.02 per share to net realized and unrealized gain (loss) on investments, and an increase of 0.15% to the net investment income ratio for each class for the year ended March 31, 2007. The change in estimate had no impact on net assets, net asset value per share or total return of each class. |
See Notes to Financial Statements
67
Table of Contents
Financial Highlights – continued
MFS® SOUTH CAROLINA MUNICIPAL BOND FUND
The financial highlights table is intended to help you understand the fund financial performance for the past 5 years. Certain information reflects financial results for a single fund share. The total returns in the table represent the rate by which an investor would have earned (or lost) on an investment in the fund share class (assuming reinvestment of all distributions) held for the entire period.
| Years ended 3/31 | |||||||||||||||
| Class A | 2009 | 2008 | 2007 | 2006 | 2005 | ||||||||||
Net asset value, beginning of period | $11.85 | $12.29 | $12.25 | $12.36 | $12.61 | ||||||||||
| Income (loss) from investment operations | |||||||||||||||
| Net investment income (d) | $0.50 | $0.53 | $ 0.55 | (z) | $0.54 | $0.56 | |||||||||
Net realized and unrealized gain (loss) on investments | (0.50 | ) | (0.45 | ) | 0.00 | (w)(z) | (0.11 | ) | (0.25 | ) | |||||
Total from investment operations | $(0.00 | )(w) | $0.08 | $0.55 | $0.43 | $0.31 | |||||||||
| Less distributions declared to shareholders | |||||||||||||||
| From net investment income | $(0.50 | ) | $(0.52 | ) | $(0.51 | ) | $(0.54 | ) | $(0.56 | ) | |||||
From net realized gain on investments | (0.02 | ) | — | — | — | — | |||||||||
Total distributions declared to shareholders | $(0.52 | ) | $(0.52 | ) | $(0.51 | ) | $(0.54 | ) | $(0.56 | ) | |||||
Net asset value, end of period | $11.33 | $11.85 | $12.29 | $12.25 | $12.36 | ||||||||||
Total return (%) (r)(s)(t) | 0.03 | 0.62 | 4.57 | 3.48 | 2.52 | ||||||||||
| Ratios (%) (to average net assets) and Supplemental data: | |||||||||||||||
| Expenses before expense reductions (f) | 1.10 | 1.31 | 1.37 | 1.34 | 1.23 | ||||||||||
Expenses after expense reductions (f) | 0.93 | 1.06 | 1.12 | 1.09 | 0.98 | ||||||||||
Expenses after expense reductions and excluding interest expense and fees (f)(l) | 0.85 | 0.85 | 0.89 | 0.92 | 0.89 | ||||||||||
Net investment income | 4.38 | 4.36 | 4.45 | (z) | 4.35 | 4.50 | |||||||||
Portfolio turnover | 19 | 13 | 10 | 13 | 15 | ||||||||||
Net assets at end of period (000 Omitted) | $129,510 | $134,422 | $135,766 | $131,167 | $130,342 | ||||||||||
See Notes to Financial Statements
68
Table of Contents
Financial Highlights – continued
MFS® SOUTH CAROLINA MUNICIPAL BOND FUND – continued
| Years ended 3/31 | |||||||||||||||
| Class B | 2009 | 2008 | 2007 | 2006 | 2005 | ||||||||||
Net asset value, beginning of period | $11.84 | $12.29 | $12.24 | $12.36 | $12.60 | ||||||||||
| Income (loss) from investment operations | |||||||||||||||
| Net investment income (d) | $0.43 | $0.45 | $0.47 | (z) | $0.46 | $0.48 | |||||||||
Net realized and unrealized gain (loss) on investments | (0.50 | ) | (0.46 | ) | 0.01 | (z) | (0.12 | ) | (0.24 | ) | |||||
Total from investment operations | $(0.07 | ) | $(0.01 | ) | $0.48 | $0.34 | $0.24 | ||||||||
| Less distributions declared to shareholders | |||||||||||||||
| From net investment income | $(0.42 | ) | $(0.44 | ) | $(0.43 | ) | $(0.46 | ) | $(0.48 | ) | |||||
From net realized gain on investments | (0.02 | ) | — | — | — | — | |||||||||
Total distributions declared to shareholders | $(0.44 | ) | $(0.44 | ) | $(0.43 | ) | $(0.46 | ) | $(0.48 | ) | |||||
Net asset value, end of period | $11.33 | $11.84 | $12.29 | $12.24 | $12.36 | ||||||||||
Total return (%) (r)(s)(t) | (0.54 | ) | (0.12 | ) | 3.98 | 2.73 | 1.94 | ||||||||
| Ratios (%) (to average net assets) and Supplemental data: | |||||||||||||||
| Expenses before expense reductions (f) | 1.76 | 1.96 | 2.02 | 1.99 | 1.88 | ||||||||||
Expenses after expense reductions (f) | 1.58 | 1.71 | 1.77 | 1.74 | 1.63 | ||||||||||
Expenses after expense reductions and excluding interest expense and fees (f)(l) | 1.50 | 1.50 | 1.54 | 1.57 | 1.54 | ||||||||||
Net investment income | 3.72 | 3.71 | 3.80 | (z) | 3.70 | 3.85 | |||||||||
Portfolio turnover | 19 | 13 | 10 | 13 | 15 | ||||||||||
Net assets at end of period (000 Omitted) | $11,640 | $15,496 | $20,679 | $26,214 | $31,032 | ||||||||||
Any redemption fee charged by the fund during the 2005 fiscal year resulted in a per share impact of less than $0.01.
| (d) | Per share data is based on average shares outstanding. |
| (f) | Ratios do not reflect reductions from fees paid indirectly, if applicable. |
| (l) | Interest expense and fees relate to payments made to the holder of the floating rate certificate from trust assets. |
| (r) | Certain expenses have been reduced without which performance would have been lower. |
| (s) | From time to time the fund may receive proceeds from litigation settlements, without which performance would be lower. |
| (t) | Total returns do not include any applicable sales charges. |
| (w) | Per share amount was less than $0.01. |
| (z) | The fund applied a change in estimate for amortization of premium on certain debt securities that resulted in an increase of $0.04 per share to net investment income, a decrease of $0.04 per share to net realized and unrealized gain (loss) on investments, and an increase of 0.29% to the net investment income ratio for each class for the year ended March 31, 2007. The change in estimate had no impact on net assets, net asset value per share or total return of each class. |
See Notes to Financial Statements
69
Table of Contents
Financial Highlights – continued
MFS® TENNESSEE MUNICIPAL BOND FUND
The financial highlights table is intended to help you understand the fund financial performance for the past 5 years. Certain information reflects financial results for a single fund share. The total returns in the table represent the rate by which an investor would have earned (or lost) on an investment in the fund share class (assuming reinvestment of all distributions) held for the entire period.
| Years ended 3/31 | |||||||||||||||
| Class A | 2009 | 2008 | 2007 | 2006 | 2005 | ||||||||||
Net asset value, beginning of period | $10.25 | $10.58 | $10.56 | $10.71 | $10.96 | ||||||||||
| Income (loss) from investment operations | |||||||||||||||
| Net investment income (d) | $0.44 | $0.48 | $0.47 | (z) | $0.45 | $0.45 | |||||||||
Net realized and unrealized gain (loss) on investments | (0.37 | ) | (0.34 | ) | (0.01 | )(z) | (0.12 | ) | (0.18 | ) | |||||
Total from investment operations | $0.07 | $0.14 | $0.46 | $0.33 | $0.27 | ||||||||||
| Less distributions declared to shareholders | |||||||||||||||
| From net investment income | $(0.44 | ) | $(0.44 | ) | $(0.44 | ) | $(0.44 | ) | $(0.44 | ) | |||||
From net realized gain on investments | (0.04 | ) | (0.03 | ) | (0.00 | )(w) | (0.04 | ) | (0.08 | ) | |||||
Total distributions declared to shareholders | $(0.48 | ) | $(0.47 | ) | $(0.44 | ) | $(0.48 | ) | $(0.52 | ) | |||||
Net asset value, end of period | $9.84 | $10.25 | $10.58 | $10.56 | $10.71 | ||||||||||
Total return (%) (r)(s)(t) | 0.84 | 1.38 | 4.43 | 3.13 | 2.53 | ||||||||||
| Ratios (%) (to average net assets) and Supplemental data: | |||||||||||||||
| Expenses before expense reductions (f) | 1.02 | 1.13 | 1.17 | 1.19 | 1.16 | ||||||||||
Expenses after expense reductions (f) | 0.85 | 0.88 | 0.92 | 0.94 | 0.91 | ||||||||||
Net investment income | 4.42 | 4.61 | 4.44 | (z) | 4.17 | 4.16 | |||||||||
Portfolio turnover | 23 | 26 | 15 | 5 | 11 | ||||||||||
Net assets at end of period (000 Omitted) | $108,763 | $101,028 | $99,302 | $98,825 | $104,837 | ||||||||||
See Notes to Financial Statements
70
Table of Contents
Financial Highlights – continued
MFS® TENNESSEE MUNICIPAL BOND FUND – continued
| Years ended 3/31 | |||||||||||||||
| Class B | 2009 | 2008 | 2007 | 2006 | 2005 | ||||||||||
Net asset value, beginning of period | $10.24 | $10.57 | $10.56 | $10.70 | $10.95 | ||||||||||
| Income (loss) from investment operations | |||||||||||||||
| Net investment income (d) | $0.37 | $0.41 | $0.40 | (z) | $0.38 | $0.38 | |||||||||
Net realized and unrealized gain (loss) on investments | (0.36 | ) | (0.34 | ) | (0.02 | )(z) | (0.11 | ) | (0.18 | ) | |||||
Total from investment operations | $0.01 | $0.07 | $0.38 | $0.27 | $0.20 | ||||||||||
| Less distributions declared to shareholders | |||||||||||||||
| From net investment income | $(0.38 | ) | $(0.37 | ) | $(0.37 | ) | $(0.37 | ) | $(0.37 | ) | |||||
From net realized gain on investments | (0.04 | ) | (0.03 | ) | (0.00 | )(w) | (0.04 | ) | (0.08 | ) | |||||
Total distributions declared to shareholders | $(0.42 | ) | $(0.40 | ) | $(0.37 | ) | $(0.41 | ) | $(0.45 | ) | |||||
Net asset value, end of period | $9.83 | $10.24 | $10.57 | $10.56 | $10.70 | ||||||||||
Total return (%) (r)(s)(t) | 0.17 | 0.72 | 3.66 | 2.56 | 1.87 | ||||||||||
| Ratios (%) (to average net assets) and Supplemental data: | |||||||||||||||
| Expenses before expense reductions (f) | 1.69 | 1.78 | 1.82 | 1.84 | 1.81 | ||||||||||
Expenses after expense reductions (f) | 1.51 | 1.53 | 1.57 | 1.59 | 1.56 | ||||||||||
Net investment income | 3.76 | 3.93 | 3.78 | (z) | 3.52 | 3.51 | |||||||||
Portfolio turnover | 23 | 26 | 15 | 5 | 11 | ||||||||||
Net assets at end of period (000 Omitted) | $7,956 | $9,983 | $12,924 | $17,217 | $20,689 | ||||||||||
| (d) | Per share data is based on average shares outstanding. |
| (f) | Ratios do not reflect reductions from fees paid indirectly, if applicable. |
| (r) | Certain expenses have been reduced without which performance would have been lower. |
| (s) | From time to time the fund may receive proceeds from litigation settlements, without which performance would be lower. |
| (t) | Total returns do not include any applicable sales charges. |
| (w) | Per share amount was less than $0.01. |
| (z) | The fund applied a change in estimate for amortization of premium on certain debt securities in the current year that resulted in an increase of $0.03 per share to net investment income, a decrease of $0.03 per share to net realized and unrealized gain (loss) on investments, and an increase of 0.27% to the net investment income ratio for each class for the year ended March 31, 2007. The change in estimate had no impact on net assets, net asset value per share or total return of each class. |
See Notes to Financial Statements
71
Table of Contents
Financial Highlights – continued
MFS® VIRGINIA MUNICIPAL BOND FUND
The financial highlights table is intended to help you understand the fund financial performance for the past 5 years. Certain information reflects financial results for a single fund share. The total returns in the table represent the rate by which an investor would have earned (or lost) on an investment in the fund share class (assuming reinvestment of all distributions) held for the entire period.
| Years ended 3/31 | |||||||||||||||
| Class A | 2009 | 2008 | 2007 | 2006 | 2005 | ||||||||||
Net asset value, beginning of period | $11.07 | $11.43 | $11.41 | $11.52 | $11.73 | ||||||||||
| Income (loss) from investment operations | |||||||||||||||
| Net investment income (d) | $0.50 | $0.53 | $ 0.51 | (z) | $0.51 | $0.53 | |||||||||
Net realized and unrealized gain (loss) on investments | (0.47 | ) | (0.38 | ) | (0.00 | )(w)(z) | (0.12 | ) | (0.21 | ) | |||||
Total from investment operations | $0.03 | $0.15 | $0.51 | $0.39 | $0.32 | ||||||||||
| Less distributions declared to shareholders | |||||||||||||||
| From net investment income | $(0.47 | ) | $(0.48 | ) | $(0.49 | ) | $(0.50 | ) | $(0.53 | ) | |||||
From net realized gain on investments | (0.09 | ) | (0.03 | ) | (0.00 | )(w) | — | — | |||||||
Total distributions declared to shareholders | $(0.56 | ) | $(0.51 | ) | $(0.49 | ) | $(0.50 | ) | $(0.53 | ) | |||||
Net asset value, end of period | $10.54 | $11.07 | $11.43 | $11.41 | $11.52 | ||||||||||
Total return (%) (r)(s)(t) | 0.40 | 1.34 | 4.57 | 3.45 | 2.83 | ||||||||||
| Ratios (%) (to average net assets) and Supplemental data: | |||||||||||||||
| Expenses before expense reductions (f) | 1.08 | 1.27 | 1.32 | 1.30 | 1.10 | ||||||||||
| Expenses after expense reductions (f) | 0.91 | 1.02 | 1.07 | 1.05 | 0.85 | ||||||||||
Expenses after expense reductions and excluding interest expense and fees (f)(l) | 0.82 | 0.82 | 0.87 | 0.90 | 0.85 | ||||||||||
Net investment income | 4.69 | 4.72 | 4.51 | (z) | 4.38 | 4.63 | |||||||||
Portfolio turnover | 22 | 27 | 8 | 13 | 11 | ||||||||||
Net assets at end of period (000 Omitted) | $254,234 | $257,133 | $269,068 | $277,633 | $285,185 | ||||||||||
| Years ended 3/31 | |||||||||||||||
| Class B | 2009 | 2008 | 2007 | 2006 | 2005 | ||||||||||
Net asset value, beginning of period | $11.06 | $11.42 | $11.40 | $11.51 | $11.72 | ||||||||||
| Income (loss) from investment operations | |||||||||||||||
| Net investment income (d) | $0.43 | $0.46 | $0.44(z | ) | $0.43 | $0.46 | |||||||||
Net realized and unrealized gain (loss) on investments | (0.47 | ) | (0.38 | ) | (0.00 | )(w)(z) | (0.11 | ) | (0.21 | ) | |||||
Total from investment operations | $(0.04 | ) | $0.08 | $0.44 | $0.32 | $0.25 | |||||||||
| Less distributions declared to shareholders | |||||||||||||||
| From net investment income | $(0.40 | ) | $(0.41 | ) | $(0.42 | ) | $(0.43 | ) | $(0.46 | ) | |||||
From net realized gain on investments | (0.09 | ) | (0.03 | ) | (0.00 | )(w) | — | — | |||||||
Total distributions declared to shareholders | $(0.49 | ) | $(0.44 | ) | $(0.42 | ) | $(0.43 | ) | $(0.46 | ) | |||||
Net asset value, end of period | $10.53 | $11.06 | $11.42 | $11.40 | $11.51 | ||||||||||
Total return (%) (r)(s)(t) | (0.26 | ) | 0.68 | 3.89 | 2.78 | 2.16 | |||||||||
| Ratios (%) (to average net assets) and Supplemental data: | |||||||||||||||
| Expenses before expense reductions (f) | 1.74 | 1.92 | 1.97 | 1.95 | 1.75 | ||||||||||
| Expenses after expense reductions (f) | 1.56 | 1.67 | 1.72 | 1.70 | 1.50 | ||||||||||
Expenses after expense reductions and excluding interest expense and fees (f)(l) | 1.47 | 1.47 | 1.52 | 1.55 | 1.50 | ||||||||||
Net investment income | 4.04 | 4.07 | 3.87 | (z) | 3.73 | 3.98 | |||||||||
Portfolio turnover | 22 | 27 | 8 | 13 | 11 | ||||||||||
Net assets at end of period (000 Omitted) | $7,401 | $9,941 | $12,545 | $16,885 | $19,637 | ||||||||||
See Notes to Financial Statements
72
Table of Contents
Financial Highlights – continued
MFS® VIRGINIA MUNICIPAL BOND FUND – continued
| Years ended 3/31 | |||||||||||||||
| Class C | 2009 | 2008 | 2007 | 2006 | 2005 | ||||||||||
Net asset value, beginning of period | $11.06 | $11.43 | $11.41 | $11.52 | $11.72 | ||||||||||
| Income (loss) from investment operations | |||||||||||||||
| Net investment income (d) | $0.43 | $0.46 | $0.44 | (z) | $0.43 | $0.46 | |||||||||
Net realized and unrealized gain (loss) on investments | (0.46 | ) | (0.39 | ) | (0.00 | )(w)(z) | (0.11 | ) | (0.20 | ) | |||||
Total from investment operations | $(0.03 | ) | $0.07 | $0.44 | $0.32 | $0.26 | |||||||||
| Less distributions declared to shareholders | |||||||||||||||
| From net investment income | $(0.40 | ) | $(0.41 | ) | $(0.42 | ) | $(0.43 | ) | $(0.46 | ) | |||||
From net realized gain on investments | (0.09 | ) | (0.03 | ) | (0.00 | )(w) | — | — | |||||||
Total distributions declared to shareholders | $(0.49 | ) | $(0.44 | ) | $(0.42 | ) | $(0.43 | ) | $(0.46 | ) | |||||
Net asset value, end of period | $10.54 | $11.06 | $11.43 | $11.41 | $11.52 | ||||||||||
Total return (%) (r)(s)(t) | (0.17 | ) | 0.59 | 3.89 | 2.78 | 2.25 | |||||||||
| Ratios (%) (to average net assets) and Supplemental data: | |||||||||||||||
| Expenses before expense reductions (f) | 1.73 | 1.93 | 1.97 | 1.95 | 1.75 | ||||||||||
| Expenses after expense reductions (f) | 1.56 | 1.67 | 1.72 | 1.70 | 1.50 | ||||||||||
Expenses after expense reductions and excluding interest expense and fees (f)(l) | 1.48 | 1.47 | 1.52 | 1.55 | 1.50 | ||||||||||
Net investment income | 4.02 | 4.06 | 3.86 | (z) | 3.72 | 3.98 | |||||||||
Portfolio turnover | 22 | 27 | 8 | 13 | 11 | ||||||||||
Net assets at end of period (000 Omitted) | $19,745 | $15,105 | $12,377 | $12,995 | $12,208 | ||||||||||
Any redemption fee charged by the fund during the 2005 fiscal year resulted in a per share impact of less than $0.01
| (d) | Per share data is based on average shares outstanding. |
| (f) | Ratios do not reflect reductions from fees paid indirectly, if applicable. |
| (l) | Interest expense and fees relate to payments made to the holder of the floating rate certificate from trust assets. |
| (r) | Certain expenses have been reduced without which performance would have been lower. |
| (s) | From time to time the fund may receive proceeds from litigation settlements, without which performance would be lower. |
| (t) | Total returns do not include any applicable sales charges. |
| (w) | Per share amount was less than $0.01. |
| (z) | The fund applied a change in estimate for amortization of premium on certain debt securities that resulted in an increase of $0.04 per share to net investment income, a decrease of $0.04 per share to net realized and unrealized gain (loss) on investments, and an increase of 0.29% to the net investment income ratio for each class for the year ended March 31, 2007. The change in estimate had no impact on net assets, net asset value per share or total return of each class. |
See Notes to Financial Statements
73
Table of Contents
Financial Highlights – continued
MFS® WEST VIRGINIA MUNICIPAL BOND FUND
The financial highlights table is intended to help you understand the fund financial performance for the past 5 years. Certain information reflects financial results for a single fund share. The total returns in the table represent the rate by which an investor would have earned (or lost) on an investment in the fund share class (assuming reinvestment of all distributions) held for the entire period.
| Years ended 3/31 | |||||||||||||||
| Class A | 2009 | 2008 | 2007 | 2006 | 2005 | ||||||||||
Net asset value, beginning of period | $11.01 | $11.45 | $11.47 | $11.58 | $11.82 | ||||||||||
| Income (loss) from investment operations | |||||||||||||||
| Net investment income (d) | $0.36 | $0.49 | $ 0.51 | (z) | $0.48 | $0.51 | |||||||||
Net realized and unrealized gain (loss) on investments | (0.47 | ) | (0.45 | ) | 0.01 | (z) | (0.11 | ) | (0.25 | ) | |||||
Total from investment operations | $(0.11 | ) | $0.04 | $0.52 | $0.37 | $0.26 | |||||||||
| Less distributions declared to shareholders | |||||||||||||||
| From net investment income | $(0.43 | ) | $(0.47 | ) | $(0.47 | ) | $(0.48 | ) | $(0.50 | ) | |||||
From net realized gain on investments | (0.11 | ) | (0.01 | ) | (0.07 | ) | — | — | |||||||
Total distributions declared to shareholders | $(0.54 | ) | $(0.48 | ) | $(0.54 | ) | $(0.48 | ) | $(0.50 | ) | |||||
Net asset value, end of period | $10.36 | $11.01 | $11.45 | $11.47 | $11.58 | ||||||||||
Total return (%) (r)(s)(t) | (0.87 | ) | 0.35 | 4.59 | 3.21 | 2.28 | |||||||||
| Ratios (%) (to average net assets) and Supplemental data: | |||||||||||||||
| Expenses before expense reductions (f) | 1.03 | 1.35 | 1.40 | 1.34 | 1.25 | ||||||||||
| Expenses after expense reductions (f) | 0.86 | 1.10 | 1.15 | 1.09 | 1.00 | ||||||||||
Expenses after expense reductions and excluding interest expense and fees (f)(l) | 0.85 | 0.85 | 0.89 | 0.92 | 0.89 | ||||||||||
Net investment income | 3.37 | 4.33 | 4.41 | (z) | 4.16 | 4.35 | |||||||||
Portfolio turnover | 14 | 14 | 13 | 7 | 14 | ||||||||||
Net assets at end of period (000 Omitted) | $116,564 | $124,948 | $129,974 | $134,416 | $134,459 | ||||||||||
See Notes to Financial Statements
74
Table of Contents
Financial Highlights – continued
MFS® WEST VIRGINIA MUNICIPAL BOND FUND – continued
| Years ended 3/31 | |||||||||||||||
| Class B | 2009 | 2008 | 2007 | 2006 | 2005 | ||||||||||
Net asset value, beginning of period | $11.01 | $11.44 | $11.46 | $11.58 | $11.82 | ||||||||||
| Income (loss) from investment operations | |||||||||||||||
| Net investment income (d) | $0.29 | $0.42 | $0.43 | (z) | $0.41 | $0.43 | |||||||||
Net realized and unrealized gain (loss) on investments | (0.47 | ) | (0.44 | ) | 0.01 | (z) | (0.13 | ) | (0.24 | ) | |||||
Total from investment operations | $(0.18 | ) | $(0.02 | ) | $0.44 | $0.28 | $0.19 | ||||||||
| Less distributions declared to shareholders | |||||||||||||||
| From net investment income | $(0.36 | ) | $(0.40 | ) | $(0.39 | ) | $(0.40 | ) | $(0.43 | ) | |||||
From net realized gain on investments | (0.11 | ) | (0.01 | ) | (0.07 | ) | — | — | |||||||
Total distributions declared to shareholders | $(0.47 | ) | $(0.41 | ) | $(0.46 | ) | $(0.40 | ) | $(0.43 | ) | |||||
Net asset value, end of period | $10.36 | $11.01 | $11.44 | $11.46 | $11.58 | ||||||||||
Total return (%) (r)(s)(t) | (1.52 | ) | (0.21 | ) | 3.92 | 2.45 | 1.62 | ||||||||
| Ratios (%) (to average net assets) and Supplemental data: | |||||||||||||||
| Expenses before expense reductions (f) | 1.69 | 2.00 | 2.06 | 1.99 | 1.90 | ||||||||||
| Expenses after expense reductions (f) | 1.52 | 1.75 | 1.80 | 1.74 | 1.65 | ||||||||||
Expenses after expense reductions and excluding interest expense and fees (f)(l) | 1.51 | 1.50 | 1.55 | 1.57 | 1.54 | ||||||||||
Net investment income | 2.73 | 3.69 | 3.76 | (z) | 3.51 | 3.71 | |||||||||
Portfolio turnover | 14 | 14 | 13 | 7 | 14 | ||||||||||
Net assets at end of period (000 Omitted) | $6,454 | $8,096 | $10,087 | $12,388 | $14,334 | ||||||||||
Any redemption fees charged by the fund during the 2005 fiscal year resulted in a per share impact of less than $0.01.
| (d) | Per share data is based on average shares outstanding. |
| (f) | Ratios do not reflect reductions from fees paid indirectly, if applicable. |
| (l) | Interest expense and fees relate to payments made to the holder of the floating rate certificate from trust assets. |
| (r) | Certain expenses have been reduced without which performance would have been lower. |
| (s) | From time to time the fund may receive proceeds from litigation settlements, without which performance would be lower. |
| (t) | Total returns do not include any applicable sales charges. |
| (z) | The fund applied a change in estimate for amortization of premium on certain debt securities that resulted in an increase of $0.03 per share to net investment income, a decrease of $0.03 per share to net realized and unrealized gain (loss) on investments, and an increase of 0.25% to the net investment income ratio of each class for the year ended March 31, 2007. The change in estimate had no impact on net assets, net asset value per share or total return of each class. |
See Notes to Financial Statements
75
Table of Contents
| (1) | Business and Organization |
MFS Mississippi Municipal Bond Fund (Mississippi Fund), MFS New York Municipal Bond Fund (New York Fund), MFS North Carolina Municipal Bond Fund (North Carolina Fund), MFS Pennsylvania Municipal Bond Fund (Pennsylvania Fund), MFS South Carolina Municipal Bond Fund (South Carolina Fund), MFS Tennessee Municipal Bond Fund (Tennessee Fund), MFS Virginia Municipal Bond Fund (Virginia Fund), and MFS West Virginia Municipal Bond Fund (West Virginia Fund) are each a series of MFS Municipal Series Trust, which is organized as a Massachusetts business trust and is registered under the Investment Company Act of 1940, as amended, as an open-end management investment company.
| (2) | Significant Accounting Policies |
General – The preparation of financial statements in conformity with U.S. generally accepted accounting principles requires management to make estimates and assumptions that affect the reported amounts of assets and liabilities, and disclosure of contingent assets and liabilities at the date of the financial statements and the reported amounts of revenues and expenses during the reporting period. Actual results could differ from those estimates. The value of municipal instruments can be affected by changes in their actual or perceived credit quality. The credit quality of municipal instruments can be affected by, among other things, the financial condition of the issuer or guarantor, the issuer’s future borrowing plans and sources of revenue, the economic feasibility of the revenue bond project or general borrowing purpose, political or economic developments in the region or state where the instrument is issued and the liquidity of the security. Municipal instruments generally trade in the over-the-counter market. Municipal instruments backed by current and anticipated revenues from a specific project or specific assets can be negatively affected by the discontinuance of the taxation supporting the projects or assets or the inability to collect revenues for the project or from the assets. If the Internal Revenue Service determines an issuer of a municipal instrument has not complied with the applicable tax requirements, the security could decline in value, interest from the security could become taxable and the funds may be required to issue Forms 1099-DIV.
Investment Valuations – Debt instruments and floating rate loans (other than short-term instruments), including restricted debt instruments, are generally valued at an evaluated or composite bid as provided by a third-party pricing service. Short-term instruments with a maturity at issuance of 60 days or less generally are valued at amortized cost, which approximates market value. Futures contracts are generally valued at last posted settlement price as provided by a third-party pricing service on the market on which they are primarily traded. Futures contracts for which there were no trades that day for a particular position are generally valued at the closing bid quotation as provided by a third-party pricing service on the market on which such futures contracts are primarily traded. Swaps are generally valued at valuations provided by a third-party pricing service. Open-end investment companies are generally valued at net asset value per share. Securities and other assets generally valued on the basis of information from a third-party pricing service may also be valued at a broker/dealer bid quotation. Values obtained from pricing services can utilize both dealer-supplied valuations and electronic data processing techniques, which take into account factors such as institutional-size trading in similar groups of securities, yield, quality, coupon rate, maturity, type of issue, trading characteristics, and other market data.
The Board of Trustees has delegated primary responsibility for determining or causing to be determined the value of each fund’s investments (including any fair valuation) to the adviser pursuant to valuation policies and procedures approved by the Board. If the adviser determines that reliable market quotations are not readily available, investments are valued at fair value as determined in good faith by the adviser in accordance with such procedures under the oversight of the Board of Trustees. Under each fund’s valuation policies and procedures, market quotations are not considered to be readily available for most types of debt instruments and floating rate loans and many types of derivatives. These investments are generally valued at fair value based on information from third-party pricing services. In addition, investments may be valued at fair value if the adviser determines that an investment’s value has been materially affected by events occurring after the close of the exchange or market on which the investment is principally traded (such as foreign exchange or market) and prior to the determination of each fund’s net asset value, or after the halting of trading of a specific security where trading does not resume prior to the close of the exchange or market on which the security is principally traded. The adviser generally relies on third-party pricing services or other information (such as the correlation with price movements of similar securities in the same or other markets; the type, cost and investment characteristics of the security; the business and financial condition of the issuer; and trading and other market data) to assist in determining whether to fair value and at what value to fair value an investment. The value of an investment for purposes of calculating each fund’s net asset value can differ depending on the source and method used to determine value. When fair valuation is used, the value of investments used to determine each fund’s net asset value may differ from quoted or published prices for the same investments.
The funds adopted FASB Statement No. 157, Fair Value Measurements (the “Statement”). This Statement provides a single definition of fair value, a hierarchy for measuring fair value and expanded disclosures about fair value measurements.
76
Table of Contents
Notes to Financial Statements – continued
Various inputs are used in determining the value of each fund’s assets or liabilities carried at market value. These inputs are categorized into three broad levels. Level 1 includes quoted prices in active markets for identical assets or liabilities. Level 2 includes other significant observable market-based inputs (including quoted prices for similar securities, interest rates, prepayment speed, and credit risk). Level 3 includes unobservable inputs, which may include the adviser’s own assumptions in determining the fair value of investments. Other financial instruments are derivative instruments not reflected in total investments, such as futures, forwards, swap contracts and written options. The following is a summary of the levels used as of March 31, 2009 in valuing each fund’s assets or liabilities carried at market value:
| Level 1 | Level 2 | Level 3 | Total | |||||||
| Mississippi Fund | ||||||||||
| Investments in Securities | $2,078,862 | $91,608,244 | $— | $93,687,106 | ||||||
| Other Financial Instruments | $— | $— | $— | $— | ||||||
| New York Fund | ||||||||||
| Investments in Securities | $6,943,829 | $199,285,340 | $— | $206,229,169 | ||||||
| Other Financial Instruments | $(110,840 | ) | $— | $— | $(110,840 | ) | ||||
| North Carolina Fund | ||||||||||
| Investments in Securities | $7,145,386 | $321,467,615 | $— | $328,613,001 | ||||||
| Other Financial Instruments | $(134,806 | ) | $— | $— | $(134,806 | ) | ||||
| Pennsylvania Fund | ||||||||||
| Investments in Securities | $2,386,723 | $103,841,450 | $— | $106,228,173 | ||||||
| Other Financial Instruments | $(47,931 | ) | $— | $— | $(47,931 | ) | ||||
| South Carolina Fund | ||||||||||
| Investments in Securities | $1,723,307 | $136,954,470 | $— | $138,677,777 | ||||||
| Other Financial Instruments | $(38,944 | ) | $— | $— | $(38,944 | ) | ||||
| Tennessee Fund | ||||||||||
| Investments in Securities | $2,986,324 | $114,388,948 | $— | $117,375,272 | ||||||
| Other Financial Instruments | $(35,948 | ) | $— | $— | $(35,948 | ) | ||||
| Virginia Fund | ||||||||||
| Investments in Securities | $3,256,944 | $278,921,841 | $— | $282,178,785 | ||||||
| Other Financial Instruments | $(110,840 | ) | $— | $— | $(110,840 | ) | ||||
| West Virginia Fund | ||||||||||
| Investments in Securities | $2,773,553 | $118,249,537 | $— | $121,023,090 | ||||||
| Other Financial Instruments | $— | $— | $— | $— | ||||||
Derivative Risk – Each fund may invest in derivatives for hedging or non-hedging purposes. While hedging can reduce or eliminate losses, it can also reduce or eliminate gains. When the funds use derivatives as an investment to gain market exposure, or for hedging purposes, gains and losses from derivative instruments may be substantially greater than the derivative’s original cost. Cash that has been segregated on behalf of certain derivative contracts will be reported separately on the Statements of Assets and Liabilities as restricted cash. On some over-the-counter derivatives, the funds attempt to reduce their exposure to counterparty credit risk by entering into an ISDA Master Agreement on a bilateral basis with each of the counterparties with whom it undertakes a significant volume of transactions. The ISDA Master Agreement gives the funds the right, upon an event of default by the applicable counterparty, to close out all transactions traded under such agreement and to net amounts owed under each transaction to one net amount payable by one party to the other. This right to close out and net payments across all transactions traded under the ISDA Master Agreement could result in a reduction of the funds’ credit risk to such counterparty equal to any amounts payable by the funds under the applicable transactions, if any. However, absent an event of default by the counterparty, the ISDA Master Agreement does not result in an offset of reported balance sheet assets and liabilities across transactions between the funds and the applicable counterparty. Derivative instruments include futures contracts and swap agreements.
In March 2008, FASB Statement No. 161, Disclosures about Derivative Instruments and Hedging Activities (the “Standard”) was issued, and is effective for financial statements issued for fiscal years and interim periods beginning after November 15, 2008. This Standard provides enhanced disclosures about the funds’ use of and accounting for derivative instruments and the effect of derivative instruments on the funds’ results of operations and financial position. Management is evaluating the application of the Standard on the funds’, and believes the impact resulting from the adoption of this Standard will be limited to expanded disclosure in the funds’ financial statements.
77
Table of Contents
Notes to Financial Statements – continued
FASB Staff Position (FSP) 133-1 was implemented during the period. FSP 133-1 amends FAS 133 to require sellers of credit derivatives to make disclosures that will enable financial statement users to assess the potential effects of those credit derivatives on an entity’s financial position, financial performance and cash flows. There was no impact from implementing FSP 133-1 as the funds did not hold any of these credit derivatives at period end.
Futures Contracts – Each fund may enter into futures contracts for the delayed delivery of securities or currency, or contracts based on financial indices at a fixed price on a future date. In entering such contracts, the funds are required to deposit with the broker either in cash or securities an amount equal to a certain percentage of the contract amount. Subsequent payments are made or received by the funds each day, depending on the daily fluctuations in the value of the contract, and are recorded for financial statement purposes as unrealized gains or losses by the funds. Upon entering into such contracts, the funds bear the risk of interest or exchange rates or securities prices moving unexpectedly, in which case, the funds may not achieve the anticipated benefits of the futures contracts and may realize a loss.
Swap Agreements – Each fund may enter into swap agreements. A swap is generally an exchange of cash payments, at specified intervals or upon the occurrence of specified events, between each fund and a counterparty. The net cash payments exchanged are recorded as a realized gain or loss on swap transactions in the Statements of Operations. The value of the swap, which is adjusted daily and includes any related interest accruals to be paid or received by each fund, is recorded on the Statements of Assets and Liabilities. The daily change in value, including any related interest accruals to be paid or received, is recorded as unrealized appreciation or depreciation on swap transactions in the Statements of Operations. Amounts paid or received at the inception of the swap are reflected as premiums paid or received on the Statements of Assets and Liabilities and are amortized using the effective interest method over the term of the agreement. A liquidation payment received or made upon early termination is recorded as a realized gain or loss on swap transactions in the Statements of Operations.
Risks related to swap agreements include the possible lack of a liquid market, unfavorable market and interest rate movements of the underlying instrument and the failure of the counterparty to perform under the terms of the agreements. To address counterparty risk, swap transactions are limited to only highly-rated counterparties and collateral, in the form of cash or securities, may be required to be posted by the counterparty to each fund and held in segregated accounts with each fund’s custodian. Counterparty risk is further mitigated by having ISDA Master Agreements between each fund and its counterparties providing for netting as described above.
The funds may enter into an interest rate swap in order to manage its exposure to interest rate fluctuations. Interest rate swap agreements involve the periodic exchange of cash flows, between each fund and a counterparty, based on the difference between two interest rates applied to a notional principal amount. The two interest rates exchanged may either be a fixed rate and a floating rate or two floating rates based on different indices.
Inverse Floaters – The funds may invest in municipal inverse floating rate securities which are structured by the issuer (known as primary market inverse floating rate securities) or by an investment banker utilizing municipal bonds which have already been issued (known as secondary market inverse floating rate securities) to have variable rates of interest which typically move in the opposite direction of short term interest rates. A secondary market inverse floating rate security is created when an investment banker transfers a fixed rate municipal bond to a special purpose trust, and causes the trust to (a) issue floating rate certificates to third-parties, in an amount equal to a fraction of the par amount of the deposited bonds (these certificates usually pay tax-exempt interest at short-term interest rates that typically reset weekly; and the certificate holders typically, on seven days notice, have the option to tender their certificates to the investment banker or another party for redemption at par plus accrued interest), and (b) issue inverse floating rate certificates (sometimes referred to as “inverse floaters”). If the holder of the inverse floater transfers the municipal bonds to an investment banker for the purpose of depositing the municipal bonds into the special purpose trust, the inverse floating rate certificates that are issued by the trust are referred to as “self-deposited inverse floaters.” If the bonds held by the trust are purchased by the investment banker for deposit into the trust from someone other than the purchasers of the inverse floaters, the inverse floating rate certificates that are issued by the trust are referred to as “externally deposited inverse floaters.” Such self-deposited inverse floaters held by certain funds are accounted for as secured borrowings, with the municipal bonds reflected in the investments of certain funds and amounts owed to the holder of the floating rate certificate under the provisions of the trust, which amounts are paid solely from the assets of the trust, reflected as liabilities of certain funds in the Statements of Assets and Liabilities under the caption, “Payable to the holder of the floating rate certificate from trust assets”. At March 31, 2009, certain funds’ payable to the holder of the floating rate certificate from trust assets and the interest rate on these floating rate certificates issued by the trust were as follows:
| Payable to the holder of the floating rate certificate from trust assets at March 31, 2009 | Weighted average interest rate at March 31, 2009 on floating rate certificates issued by the trust | |||
| Fund | ||||
| North Carolina Fund | $8,014,290 | 2.52% | ||
| Pennsylvania Fund | 960,550 | 2.60% | ||
| Virginia Fund | 5,424,435 | 2.21% |
78
Table of Contents
Notes to Financial Statements – continued
For the year ended March 31, 2009, the average daily payable to the holder of the floating rate certificate from trust assets; the weighted average interest rate related to this payable; and the interest expense and fees related to interest payments made to the holder of certain floating rate certificates and associated fees, both of which are made from trust assets were as follows:
| Average payable to the holder of the floating rate certificate from trust assets for the year ended March 31, 2009 | Weighted average interest March 31, 2009, on | Interest expense and fees in connection with self- deposited inverse floaters for the year ended March 31, 2009 | ||||
| Fund | ||||||
| Mississippi Fund | $647,945 | 3.28% | $21,243 | |||
| New York Fund | 2,315,068 | 2.35% | 54,303 | |||
| North Carolina Fund | 11,700,959 | 2.60% | 304,674 | |||
| Pennsylvania Fund | 1,162,877 | 4.42% | 51,384 | |||
| South Carolina Fund | 3,791,644 | 3.12% | 118,399 | |||
| Virginia Fund | 9,860,603 | 2.52% | 248,487 | |||
| West Virginia Fund | 498,082 | 2.98% | 14,857 |
Primary and externally deposited inverse floaters held by certain funds are not accounted for as secured borrowings.
Indemnifications – Under each fund’s organizational documents, its officers and trustees may be indemnified against certain liabilities and expenses arising out of the performance of their duties to each fund. Additionally, in the normal course of business, each fund enters into agreements with service providers that may contain indemnification clauses. Each fund’s maximum exposure under these agreements is unknown as this would involve future claims that may be made against each fund that have not yet occurred.
Investment Transactions and Income – Investment transactions are recorded on the trade date. Interest income is recorded on the accrual basis. All premium and discount is amortized or accreted for financial statement purposes in accordance with U.S. generally accepted accounting principles. Dividends received in cash are recorded on the ex-dividend date. Dividend and interest payments received in additional securities are recorded on the ex-dividend or ex-interest date in an amount equal to the value of the security on such date.
Each fund may receive proceeds from litigation settlements. Any proceeds received from litigation involving portfolio holdings are reflected in the Statements of Operations in realized gain/loss if the security has been disposed of by certain funds or in unrealized gain/loss if the security is still held by certain funds. Any other proceeds from litigation not related to portfolio holdings are reflected as other income in the Statements of Operations.
Legal fees and other related expenses incurred to preserve and protect the value of a security owned are added to the cost of the security; other legal fees are expensed. Capital infusions made directly to the security issuer, which are generally non-recurring, incurred to protect or enhance the value of high-yield debt securities, are reported as additions to the cost basis of the security. Costs that are incurred to negotiate the terms or conditions of capital infusions or that are expected to result in a plan of reorganization are reported as realized losses. Ongoing costs incurred to protect or enhance an investment, or costs incurred to pursue other claims or legal actions, are expensed.
Fees Paid Indirectly – Each fund’s custody fee may be reduced according to an arrangement that measures the value of cash deposited with the custodian by each fund. This amount, for the year ended March 31, 2009, is shown as a reduction of total expenses on the Statements of Operations.
Tax Matters and Distributions – Each fund intends to qualify as a regulated investment company, as defined under Subchapter M of the Internal Revenue Code, and to distribute all of its taxable and tax-exempt income, including realized capital gains. As a result, no provision for federal income tax is required. Each of the fund’s federal tax returns for the prior three fiscal years remain subject to examination by the Internal Revenue Service.
Distributions to shareholders are recorded on the ex-dividend date. Income and capital gain distributions are determined in accordance with income tax regulations, which may differ from U.S. generally accepted accounting principles. Certain capital accounts in the financial statements are periodically adjusted for permanent differences in order to reflect their tax character. These adjustments have no impact on net assets or net asset value per share. Temporary differences which arise from recognizing certain items of income, expense, gain or loss in different periods for financial statement and tax purposes will reverse at some time in the future. Distributions in excess of net investment income or net realized gains are temporary overdistributions for financial statement purposes resulting from differences in the recognition or classification of income or distributions for financial statement and tax purposes.
Book/tax differences primarily relate to amortization and accretion of debt securities, derivative transactions, and secured borrowings.
79
Table of Contents
Notes to Financial Statements – continued
The tax character of distributions declared to shareholders for the last two fiscal years is as follows:
| Year ended 3/31/09 | Mississippi Fund | New York Fund | North Carolina Fund | Pennsylvania Fund | South Carolina Fund | Tennessee Fund | Virginia Fund | West Virginia Fund | ||||||||
| Ordinary income (including any short-term capital gains) | $— | $381,554 | $150,098 | $— | $— | $338,369 | $732,996 | $20,485 | ||||||||
| Tax-exempt income | 4,059,672 | 8,219,506 | 13,144,511 | 4,597,753 | 6,193,212 | 5,035,589 | 12,244,399 | 5,074,051 | ||||||||
| Long-term capital gain | — | 1,062,828 | 1,146,971 | — | 235,358 | 138,081 | 1,579,313 | 1,280,148 | ||||||||
| Total distributions | $4,059,672 | $9,663,888 | $14,441,580 | $4,597,753 | $6,428,570 | $5,512,039 | $14,556,708 | $6,374,684 | ||||||||
| Year ended 3/31/08 | Mississippi Fund | New York Fund | North Carolina Fund | Pennsylvania Fund | South Carolina Fund | Tennessee Fund | Virginia Fund | West Virginia Fund | ||||||||
| Ordinary income (including any short-term capital gains) | $— | $428,910 | $125,085 | $384 | $— | $424,230 | $299,592 | $70,146 | ||||||||
| Tax-exempt income | 3,735,946 | 6,650,742 | 12,667,723 | 4,275,697 | 6,321,006 | 4,350,633 | 11,998,208 | 5,569,466 | ||||||||
| Long-term capital gain | — | 324,596 | 852,704 | 27,487 | — | 85,905 | 467,613 | 94,967 | ||||||||
| Total distributions | $3,735,946 | $7,404,248 | $13,645,512 | $4,303,568 | $6,321,006 | $4,860,768 | $12,765,413 | $5,734,579 | ||||||||
The federal tax cost and the tax basis components of distributable earnings were as follows:
| As of 3/31/09 | Mississippi Fund | New York Fund | North Carolina Fund | Pennsylvania Fund | ||||||||
| Cost of investments | $95,030,143 | $212,112,154 | $321,574,029 | $109,491,426 | ||||||||
| Gross appreciation | 2,879,437 | 5,926,797 | 9,541,378 | 2,322,582 | ||||||||
| Gross depreciation | (4,222,474 | ) | (11,809,782 | ) | (10,516,696 | ) | (6,546,385 | ) | ||||
| Net unrealized appreciation (depreciation) | $(1,343,037 | ) | $(5,882,985 | ) | $(975,318 | ) | $(4,223,803 | ) | ||||
| Undistributed tax-exempt income | 453,840 | 812,046 | 1,502,858 | 470,649 | ||||||||
| Undistributed long-term capital gain | — | 177,045 | — | — | ||||||||
| Capital loss carryforwards | (92,165 | ) | — | (481,258 | ) | (345,011 | ) | |||||
| Post-October capital loss deferral | — | (1,262,278 | ) | — | (568,736 | ) | ||||||
| Other temporary differences | (372,084 | ) | (760,428 | ) | (1,190,735 | ) | (408,462 | ) | ||||
| As of 3/31/09 | South Carolina Fund | Tennessee Fund | Virginia Fund | West Virginia Fund | ||||||||
| Cost of investments | $141,552,711 | $120,341,404 | $285,435,003 | $126,793,654 | ||||||||
| Gross appreciation | 4,119,293 | 3,235,228 | 8,655,251 | 1,981,021 | ||||||||
| Gross depreciation | (6,994,227 | ) | (6,201,360 | ) | (17,335,904 | ) | (7,751,585 | ) | ||||
| Net unrealized appreciation (depreciation) | $(2,874,934 | ) | $(2,966,132 | ) | $(8,680,653 | ) | $(5,770,564 | ) | ||||
| Undistributed ordinary income | — | — | 89,104 | 50,474 | ||||||||
| Undistributed tax-exempt income | 543,250 | 706,988 | 1,033,035 | 432,926 | ||||||||
| Undistributed long-term capital gain | 101,542 | — | — | 35,654 | ||||||||
| Capital loss carryforwards | — | (26,512 | ) | — | — | |||||||
| Post-October capital loss deferral | (1,258,649 | ) | (241,911 | ) | (1,315,083 | ) | (1,117,882 | ) | ||||
| Other temporary differences | (521,852 | ) | (439,239 | ) | (1,093,310 | ) | (442,322 | ) | ||||
As of March 31, 2009, certain funds had capital loss carryforwards available to offset future realized gains. Such losses expire as follows:
| Expiration Date | Mississippi Fund | North Carolina Fund | Pennsylvania Fund | Tennessee Fund | ||||||||
| 3/31/13 | $(62,488 | ) | $— | $— | $— | |||||||
| 3/31/14 | (29,677 | ) | — | — | — | |||||||
| 3/31/16 | — | — | (17,684 | ) | — | |||||||
| 3/31/17 | — | (481,258 | ) | (327,327 | ) | (26,512 | ) | |||||
| Total | $(92,165 | ) | $(481,258 | ) | $(345,011 | ) | $(26,512 | ) |
Multiple Classes of Shares of Beneficial Interest – Each fund offers multiple classes of shares, which differ in their respective distribution and service fees. Each fund’s income and common expenses are allocated to shareholders based on the value of settled shares outstanding of each class. Each fund’s realized and unrealized gain (loss) are allocated to shareholders based on the daily net assets of each class. Dividends are declared separately for each class. Differences in per share dividend rates are generally due to differences in separate class expenses. Class B shares will convert to Class A shares approximately eight years after purchase.
80
Table of Contents
Notes to Financial Statements – continued
| (3) | Transactions with Affiliates |
Investment Adviser – Each fund has an investment advisory agreement with Massachusetts Financial Services Company (MFS) to provide overall investment management and related administrative services and facilities to each fund. At the commencement of the period, the management fee was computed daily and paid monthly at an annual rate of 0.55% of each fund’s average daily net assets. Effective August 1, 2008, the management fee is computed daily and paid monthly at an annual rate of 0.45% of each fund’s average daily net assets.
As part of a settlement agreement with the New York Attorney General concerning market timing and related matters, MFS had agreed to reduce the management fee to 0.30% of each fund’s average daily net assets for the period March 1, 2004 through February 28, 2009. For the year ended March 31, 2009, this waiver amounted to the following for each fund and is reflected as a reduction of total expenses in the Statements of Operations:
| Mississippi Fund | New York Fund | North Carolina Fund | Pennsylvania Fund | South Carolina Fund | Tennessee Fund | Virginia Fund | West Virginia Fund | |||||||
| $158,572 | $320,335 | $532,981 | $183,247 | $249,637 | $194,253 | $479,285 | $216,826 |
The management fee incurred for the year ended March 31, 2009 was equivalent to an annual effective rate of 0.31% of each fund’s average daily net assets.
For the Pennsylvania Fund, the investment adviser has agreed in writing to pay a portion of the fund’s operating expenses, exclusive of management fee, distribution and service fees, interest, taxes, extraordinary expenses, brokerage and transaction costs and investment-related expenses (including interest expense and fees associated with investments in inverse floating rate instruments), such that operating expenses do not exceed 0.20% annually of the fund’s average daily net assets. This written agreement will continue until modified by the fund’s Board of Trustees, but such agreement will continue at least until July 31, 2009. For the year ended March 31, 2009, this reduction amounted to $51,344 and is reflected as a reduction of total expenses in the Statements of Operations.
Effective August 1, 2008, the investment adviser has agreed in writing to pay a portion of the following funds’ total annual operating expenses, exclusive of interest, taxes, extraordinary expenses, brokerage and transaction costs and investment-related expenses (including interest expense and fees associated with investments in inverse floating rate instruments), such that total annual fund operating expenses did not exceed the following rates annually of certain funds’ average daily net assets:
| New York Fund | North Carolina Fund | South Carolina Fund | Tennessee Fund | Virginia Fund | West Virginia Fund | |||||||
| Class A | 0.90% | 1.03% | 1.01% | 1.04% | 0.99% | 1.00% | ||||||
| Class B | 1.65% | 1.68% | 1.66% | 1.69% | 1.64% | 1.65% | ||||||
| Class C | 1.65% | 1.68% | N/A | N/A | 1.64% | N/A |
Effective March 1, 2009, the agreement for certain funds has been amended such that the investment adviser has agreed in writing to pay a portion of the following funds’ total annual operating expenses, exclusive of interest, taxes, extraordinary expenses, brokerage and transaction costs and investment-related expenses (including interest expense and fees associated with investments in inverse floating rate instruments), such that total annual fund operating expenses do not exceed the following rates annually of certain funds’ average daily net assets:
| North Carolina Fund | South Carolina Fund | Tennessee Fund | Virginia Fund | West Virginia Fund | ||||||
| Class A | 0.93% | 0.91% | 0.94% | 0.89% | 0.90% | |||||
| Class B | 1.68% | 1.66% | 1.69% | 1.64% | 1.65% | |||||
| Class C | 1.68% | N/A | N/A | 1.64% | N/A |
These written agreements will continue until modified by the funds’ Board of Trustees, but such agreements will continue at least until July 31, 2009. For the year ended March 31, 2009, these funds’ actual operating expenses did not exceed these limits and therefore, the investment adviser did not pay any portion of these funds’ expenses.
Distributor – MFS Fund Distributors, Inc. (MFD), a wholly-owned subsidiary of MFS, as distributor, received the following for the year ended March 31, 2009, as its portion of the initial sales charge on sales of Class A shares of each fund:
| Mississippi Fund | New York Fund | North Carolina Fund | Pennsylvania Fund | South Carolina Fund | Tennessee Fund | Virginia Fund | West Virginia Fund | |||||||
| $31,473 | $54,847 | $88,205 | $68,659 | $41,211 | $27,517 | $66,098 | $22,548 |
The Board of Trustees has adopted a distribution plan for certain class shares pursuant to Rule 12b-1 of the Investment Company Act of 1940.
Each fund’s distribution plan provides that each fund will pay MFD for services provided by MFD and financial intermediaries in connection with the distribution and servicing of certain share classes. One component of the plan is a distribution fee paid to MFD and another component of the plan is a service fee paid to MFD. MFD may subsequently pay all, or a portion, of the distribution and/or service fees to financial intermediaries.
81
Table of Contents
Notes to Financial Statements – continued
Distribution Plan Fee Table:
| CLASS A | ||||||||||
Distribution Fee Rate | Service Fee Rate | Total Distribution Plan (d) | Annual Effective Rate (e) | Distribution and Service Fee | ||||||
| Mississippi Fund | — | 0.25% | 0.25% | — | $— | |||||
| New York Fund | — | 0.25% | 0.25% | 0.25% | 382,654 | |||||
| North Carolina Fund | — | 0.25% | 0.25% | 0.34% | 883,813 | |||||
| Pennsylvania Fund | — | 0.25% | 0.25% | 0.10% | 81,104 | |||||
| South Carolina Fund | — | 0.25% | 0.25% | 0.34% | 446,468 | |||||
| Tennessee Fund | — | 0.25% | 0.25% | 0.34% | 357,691 | |||||
| Virginia Fund | — | 0.25% | 0.25% | 0.34% | 862,723 | |||||
| West Virginia Fund | — | 0.25% | 0.25% | 0.34% | 402,866 | |||||
| CLASS B | ||||||||||
Distribution Fee Rate | Service Fee Rate | Total Distribution Plan (d) | Annual Effective Rate (e) | Distribution and Service Fee | ||||||
| Mississippi Fund | 0.75% | 0.25% | 1.00% | 0.77% | $54,883 | |||||
| New York Fund | 0.75% | 0.25% | 1.00% | 1.00% | 181,353 | |||||
| North Carolina Fund | 0.75% | 0.25% | 1.00% | 1.00% | 190,444 | |||||
| Pennsylvania Fund | 0.75% | 0.25% | 1.00% | 0.85% | 219,337 | |||||
| South Carolina Fund | 0.75% | 0.25% | 1.00% | 1.00% | 137,669 | |||||
| Tennessee Fund | 0.75% | 0.25% | 1.00% | 1.00% | 88,581 | |||||
| Virginia Fund | 0.75% | 0.25% | 1.00% | 1.00% | 88,410 | |||||
| West Virginia Fund | 0.75% | 0.25% | 1.00% | 1.00% | 73,759 | |||||
| CLASS C | ||||||||||
Distribution Fee Rate | Service Fee Rate | Total Distribution Plan (d) | Annual Effective Rate (e) | Distribution and Service Fee | ||||||
| New York Fund | 0.75% | 0.25% | 1.00% | 1.00% | $216,872 | |||||
| North Carolina Fund | 0.75% | 0.25% | 1.00% | 1.00% | 336,639 | |||||
| Virginia Fund | 0.75% | 0.25% | 1.00% | 1.00% | 179,225 | |||||
Mississippi Fund | New York Fund | North Carolina Fund | Pennsylvania Fund | South Carolina Fund | Tennessee Fund | Virginia Fund | West Virginia Fund | |||||||||
| Total Distribution and Service Fees | $54,883 | $780,879 | $1,410,896 | $300,441 | $584,137 | $446,272 | $1,130,358 | $476,625 |
| (d) | In accordance with the distribution plan for certain classes, each fund pays distribution and/or service fees up to these annual percentage rates of each class’ average daily net assets. |
| (e) | The annual effective rates represent actual fees incurred under the distribution plan for the year ended March 31, 2009, based on each class’ average daily net assets. Prior to March 1, 2009, payment of the Mississippi Fund’s, New York Fund’s, and Pennsylvania Fund’s 0.10% annual Class A distribution fee was not in effect; the 0.10% Class A distribution fee for the North Carolina Fund, South Carolina Fund, Tennessee Fund, Virginia Fund, and West Virginia Fund was paid. Effective March 1, 2009, the 0.10% annual Class A distribution fee was eliminated for all funds. Payment of the Mississippi Fund’s 0.25% annual Class A service fee is not yet in effect and will be implemented on such date as the fund’s Board of Trustees may determine. For one year from the date of sale of Class B shares of the Mississippi Fund, assets attributable to such Class B shares are subject to the 0.25% annual Class B service fee. On assets attributable to all other Class B shares of the Mississippi Fund, the service fee is not currently in effect, but may be implemented on such date as the fund’s Board of Trustees may determine. 0.10% of the Class A service fee is currently being paid by the Pennsylvania Fund. Payment of the remaining 0.15% of the Pennsylvania Fund’s Class A service fee is not yet in effect and will be implemented on such date as the fund’s Board of Trustees may determine. For one year from the date of sale of Class B shares of the Pennsylvania Fund, assets attributable to such Class B shares are subject to the 0.25% annual Class B service fee. On assets attributable to all other Class B shares of the Pennsylvania Fund, 0.10% of the Class B service fee is currently in effect and the remaining portion of the Class B service fee is not in effect but may be implemented on such date as the fund’s Board of Trustees may determine. |
Certain Class A shares purchased prior to September 1, 2008 are subject to a contingent deferred sales charge (CDSC) in the event of a shareholder redemption within 12 months of purchase. Certain Class A shares purchased on or subsequent to September 1, 2008 are subject to a CDSC in the event of a shareholder redemption within 24 months of purchase. Class C shares are subject to a CDSC in the event of a shareholder redemption within 12 months of purchase. Class B shares are subject to a CDSC in the event of a shareholder redemption within six years of purchase. All contingent deferred sales charges are paid to MFD and during the year ended March 31, 2009, were as follows:
| CDSC imposed | Mississippi Fund | New York Fund | North Carolina Fund | Pennsylvania Fund | South Carolina Fund | Tennessee Fund | Virginia Fund | West Virginia Fund | ||||||||
| Class A | $16,540 | $6,965 | $17,204 | $323 | $3,782 | $535 | $21 | $— | ||||||||
| Class B | 14,430 | 24,860 | 14,294 | 30,924 | 7,757 | 3,333 | 14,315 | 5,270 | ||||||||
| Class C | N/A | 9,288 | 9,880 | N/A | N/A | N/A | 1,646 | N/A |
Shareholder Servicing Agent – MFS Service Center, Inc. (MFSC), a wholly-owned subsidiary of MFS, receives a fee from the funds for its services as shareholder servicing agent calculated as a percentage of the average daily net assets of each fund as
82
Table of Contents
Notes to Financial Statements – continued
determined periodically under the supervision of the funds’ Board of Trustees. For the year ended March 31, 2009, each fund paid MFSC the following fee, which equated to the following annual percentage of each fund’s average daily net assets for shareholder services:
| Mississippi Fund | New York Fund | North Carolina Fund | Pennsylvania Fund | South Carolina Fund | Tennessee Fund | Virginia Fund | West Virginia Fund | |||||||||
| Expenses paid | $29,690 | $79,337 | $117,031 | $53,260 | $50,962 | $38,357 | $105,757 | $42,034 | ||||||||
| Percentage of average daily net assets | 0.0319% | 0.0411% | 0.0375% | 0.0498% | 0.0352% | 0.0337% | 0.0378% | 0.0335% |
MFSC also receives payment from the funds for out-of-pocket expenses, sub-accounting and other shareholder servicing costs which may be paid to affiliated and unaffiliated service providers. For the year ended March 31, 2009, these out-of-pocket expenses, sub-accounting and other shareholder servicing costs amounted to the following:
| Mississippi Fund | New York Fund | North Carolina Fund | Pennsylvania Fund | South Carolina Fund | Tennessee Fund | Virginia Fund | West Virginia Fund | |||||||
| $28,409 | $60,204 | $84,636 | $37,313 | $42,550 | $29,925 | $82,541 | $35,292 |
Administrator – MFS provides certain financial, legal, shareholder communications, compliance, and other administrative services to the funds. Under an administrative services agreement, each fund partially reimburses MFS the costs incurred to provide these services. Each fund is charged an annual fixed amount of $17,500 plus a fee based on average daily net assets.
The administrative services fee incurred for the year ended March 31, 2009 was equivalent to an annual effective rate of each fund’s average daily net assets as follows:
| Mississippi Fund | New York Fund | North Carolina Fund | Pennsylvania Fund | South Carolina Fund | Tennessee Fund | Virginia Fund | West Virginia Fund | |||||||||
| Percentage of average daily net assets | 0.0265% | 0.0216% | 0.0195% | 0.0251% | 0.0228% | 0.0246% | 0.0199% | 0.0238% |
Trustees’ and Officers’ Compensation – Each fund pays compensation to independent trustees in the form of a retainer, attendance fees, and additional compensation to Board and Committee chairpersons. The funds do not pay compensation directly to trustees or officers of each fund who are also officers of the investment adviser, all of whom receive remuneration for their services to the funds from MFS. Certain officers and trustees of the funds are officers or directors of MFS, MFD, and MFSC. For certain independent trustees who retired on or before December 31, 2001, each fund has an unfunded, defined benefit plan which resulted in a pension expense for the funds. These amounts are included in independent trustees’ compensation and were as follows:
| Mississippi Fund | New York Fund | North Carolina Fund | Pennsylvania Fund | South Carolina Fund | Tennessee Fund | Virginia Fund | West Virginia Fund | |||||||
| $692 | $561 | $1,183 | $702 | $1,160 | $566 | $1,178 | $1,156 |
The liability for deferred retirement benefits payable to certain retired independent trustees amounted to the following for each fund at March 31, 2009, and is included in payable for independent trustees’ compensation:
| Mississippi Fund | New York Fund | North Carolina Fund | Pennsylvania Fund | South Carolina Fund | Tennessee Fund | Virginia Fund | West Virginia Fund | |||||||
| $7,220 | $9,282 | $12,098 | $7,145 | $12,067 | $9,237 | $12,117 | $12,062 |
Other – These funds and certain other MFS funds (the funds) have entered into services agreements (the Agreements) which provide for payment of fees by the funds to Tarantino LLC and Griffin Compliance LLC in return for the provision of services of an Independent Chief Compliance Officer (ICCO) and Assistant ICCO, respectively, for the funds. The ICCO and Assistant ICCO are officers of the funds and the sole members of Tarantino LLC and Griffin Compliance LLC, respectively. The funds can terminate the Agreements with Tarantino LLC and Griffin Compliance LLC at any time under the terms of the Agreements. For the year ended March 31, 2009, the aggregate fees paid by each fund to Tarantino LLC and Griffin Compliance LLC amounted to the following and are included in miscellaneous expense on the Statements of Operations:
| Mississippi Fund | New York Fund | North Carolina Fund | Pennsylvania Fund | South Carolina Fund | Tennessee Fund | Virginia Fund | West Virginia Fund | |||||||
| $1,015 | $2,126 | $3,377 | $1,150 | $1,554 | $1,230 | $3,025 | $1,343 |
MFS has agreed to reimburse the funds for a portion of the payments made by each fund in the following amounts, which are shown as a reduction of total expenses in the Statements of Operations. Additionally, MFS has agreed to bear all expenses associated with office space, other administrative support, and supplies provided to the ICCO and Assistant ICCO:
| Mississippi Fund | New York Fund | North Carolina Fund | Pennsylvania Fund | South Carolina Fund | Tennessee Fund | Virginia Fund | West Virginia Fund | |||||||
| $516 | $1,054 | $1,738 | $592 | $803 | $631 | $1,553 | $699 |
83
Table of Contents
Notes to Financial Statements – continued
The funds may invest in a money market fund managed by MFS which seeks a high level of current income consistent with preservation of capital and liquidity. Income earned on these investments are included in dividends from underlying funds on the Statements of Operations. This money market fund does not pay a management fee to MFS.
| (4) | Portfolio Securities |
Purchases and sales of investments, other than U.S. Government securities, purchased option transactions, and short-term obligations, were as follows:
| Mississippi Fund | New York Fund | North Carolina Fund | Pennsylvania Fund | South Carolina Fund | Tennessee Fund | Virginia Fund | West Virginia Fund | |||||||||
| Purchases | $27,719,752 | $96,137,831 | $76,831,640 | $33,566,529 | $27,465,682 | $38,647,327 | $64,160,890 | $17,642,672 | ||||||||
| Sales | $21,351,177 | $54,510,591 | $63,853,329 | $29,897,588 | $34,027,994 | $25,302,508 | $61,428,432 | $21,461,033 |
| (5) | Shares of Beneficial Interest |
Each fund’s Declaration of Trust permits the Trustees to issue an unlimited number of full and fractional shares of beneficial interest. Transactions in fund shares were as follows:
| MFS Mississippi Municipal Bond Fund | ||||||||||||
| Year ended 3/31/09 | Year ended 3/31/08 | |||||||||||
| Shares | Amount | Shares | Amount | |||||||||
| Shares sold | ||||||||||||
Class A | 2,060,823 | $19,340,627 | 1,428,055 | $13,861,790 | ||||||||
Class B | 44,301 | 414,376 | 50,077 | 485,249 | ||||||||
| 2,105,124 | $19,755,003 | 1,478,132 | $14,347,039 | |||||||||
| Shares issued to shareholders in reinvestment of distributions | ||||||||||||
Class A | 247,782 | $2,315,315 | 207,805 | $2,009,167 | ||||||||
Class B | 15,068 | 141,132 | 16,964 | 164,330 | ||||||||
| 262,850 | $2,456,447 | 224,769 | $2,173,497 | |||||||||
| Shares reacquired | ||||||||||||
Class A | (1,103,423 | ) | $(10,230,051 | ) | (894,424 | ) | $(8,640,172 | ) | ||||
Class B | (334,343 | ) | (3,150,983 | ) | (174,463 | ) | (1,691,914 | ) | ||||
| (1,437,766 | ) | $(13,381,034 | ) | (1,068,887 | ) | $(10,332,086 | ) | |||||
| Net change | ||||||||||||
Class A | 1,205,182 | $11,425,891 | 741,436 | $7,230,785 | ||||||||
Class B | (274,974 | ) | (2,595,475 | ) | (107,422 | ) | (1,042,335 | ) | ||||
| 930,208 | $8,830,416 | 634,014 | $6,188,450 | |||||||||
84
Table of Contents
Notes to Financial Statements – continued
| MFS New York Municipal Bond Fund | MFS North Carolina Municipal Bond Fund | |||||||||||||||||||||||
| Year ended 3/31/09 | Year ended 3/31/08 | Year ended 3/31/09 | Year ended 3/31/08 | |||||||||||||||||||||
| Shares | Amount | Shares | Amount | Shares | Amount | Shares | Amount | |||||||||||||||||
| Shares sold | ||||||||||||||||||||||||
Class A | 6,427,116 | $68,313,434 | 1,938,189 | $21,279,035 | 4,672,312 | $51,876,066 | 1,721,939 | $19,991,964 | ||||||||||||||||
Class B | 188,171 | 1,957,607 | 74,565 | 819,051 | 179,425 | 1,997,256 | 110,894 | 1,291,414 | ||||||||||||||||
Class C | 723,936 | 7,614,646 | 549,644 | 6,060,788 | 1,084,956 | 12,102,526 | 447,711 | 5,228,711 | ||||||||||||||||
| 7,339,223 | $77,885,687 | 2,562,398 | $28,158,874 | 5,936,693 | $65,975,848 | 2,280,544 | $26,512,089 | |||||||||||||||||
| Shares issued to shareholders in reinvestment of distributions | ||||||||||||||||||||||||
Class A | 530,046 | $5,397,306 | 307,996 | $3,391,111 | 737,578 | $8,166,327 | 663,271 | $7,754,321 | ||||||||||||||||
Class B | 53,460 | 546,184 | 55,486 | 609,255 | 40,071 | 442,898 | 42,489 | 496,167 | ||||||||||||||||
Class C | 56,460 | 576,753 | 39,785 | 437,289 | 89,337 | 987,416 | 72,882 | 851,681 | ||||||||||||||||
| 639,966 | $6,520,243 | 403,267 | $4,437,655 | 866,986 | $9,596,641 | 778,642 | $9,102,169 | |||||||||||||||||
| Shares reacquired | ||||||||||||||||||||||||
Class A | (2,040,631 | ) | $(20,686,206 | ) | (1,258,346 | ) | $(13,855,672 | ) | (3,344,672 | ) | $(36,942,123 | ) | (2,446,335 | ) | $(28,572,804 | ) | ||||||||
Class B | (504,397 | ) | (5,118,406 | ) | (579,561 | ) | (6,360,968 | ) | (879,416 | ) | (9,675,659 | ) | (507,261 | ) | (5,929,036 | ) | ||||||||
Class C | (476,809 | ) | (4,758,399 | ) | (173,379 | ) | (1,904,832 | ) | (501,935 | ) | (5,555,936 | ) | (610,694 | ) | (7,142,938 | ) | ||||||||
| (3,021,837 | ) | $(30,563,011 | ) | (2,011,286 | ) | $(22,121,472 | ) | (4,726,023 | ) | $(52,173,718 | ) | (3,564,290 | ) | $(41,644,778 | ) | |||||||||
| Net change | ||||||||||||||||||||||||
Class A | 4,916,531 | $53,024,534 | 987,839 | $10,814,474 | 2,065,218 | $23,100,270 | (61,125 | ) | $(826,519 | ) | ||||||||||||||
Class B | (262,766 | ) | (2,614,615 | ) | (449,510 | ) | (4,932,662 | ) | (659,920 | ) | (7,235,505 | ) | (353,878 | ) | (4,141,455 | ) | ||||||||
Class C | 303,587 | 3,433,000 | 416,050 | 4,593,245 | 672,358 | 7,534,006 | (90,101 | ) | (1,062,546 | ) | ||||||||||||||
| 4,957,352 | $53,842,919 | 954,379 | $10,475,057 | 2,077,656 | $23,398,771 | (505,104 | ) | $(6,030,520 | ) | |||||||||||||||
| MFS Pennsylvania Municipal Bond Fund | MFS South Carolina Municipal Bond Fund | |||||||||||||||||||||||
| Year ended 3/31/09 | Year ended 3/31/08 | Year ended 3/31/09 | Year ended 3/31/08 | |||||||||||||||||||||
| Shares | Amount | Shares | Amount | Shares | Amount | Shares | Amount | |||||||||||||||||
| Shares sold | ||||||||||||||||||||||||
Class A | 2,637,295 | $25,344,354 | 1,624,697 | $16,384,665 | 1,709,495 | $19,609,452 | 1,312,186 | $15,766,440 | ||||||||||||||||
Class B | 107,471 | 1,033,326 | 129,987 | 1,316,228 | 79,956 | 914,714 | 36,660 | 442,057 | ||||||||||||||||
| 2,744,766 | $26,377,680 | 1,754,684 | $17,700,893 | 1,789,451 | $20,524,166 | 1,348,846 | $16,208,497 | |||||||||||||||||
| Shares issued to shareholders in reinvestment of distributions | ||||||||||||||||||||||||
Class A | 244,851 | $2,323,850 | 202,392 | $2,041,995 | 343,942 | $3,921,434 | 308,088 | $3,728,124 | ||||||||||||||||
Class B | 63,568 | 605,969 | 69,367 | 701,914 | 32,441 | 370,528 | 36,730 | 444,432 | ||||||||||||||||
| 308,419 | $2,929,819 | 271,759 | $2,743,909 | 376,383 | $4,291,962 | 344,818 | $4,172,556 | |||||||||||||||||
| Shares reacquired | ||||||||||||||||||||||||
Class A | (1,766,315 | ) | $(16,571,439 | ) | (1,172,694 | ) | $(11,822,576 | ) | (1,969,700 | ) | $(22,257,054 | ) | (1,318,977 | ) | $(15,981,425 | ) | ||||||||
Class B | (666,263 | ) | (6,293,882 | ) | (590,904 | ) | (5,963,612 | ) | (393,238 | ) | (4,459,741 | ) | (447,922 | ) | (5,412,035 | ) | ||||||||
| (2,432,578 | ) | $(22,865,321 | ) | (1,763,598 | ) | $(17,786,188 | ) | (2,362,938 | ) | $(26,716,795 | ) | (1,766,899 | ) | $(21,393,460 | ) | |||||||||
| Net change | ||||||||||||||||||||||||
Class A | 1,115,831 | $11,096,765 | 654,395 | $6,604,084 | 83,737 | $1,273,832 | 301,297 | $3,513,139 | ||||||||||||||||
Class B | (495,224 | ) | (4,654,587 | ) | (391,550 | ) | (3,945,470 | ) | (280,841 | ) | (3,174,499 | ) | (374,532 | ) | (4,525,546 | ) | ||||||||
| 620,607 | $6,442,178 | 262,845 | $2,658,614 | (197,104 | ) | $(1,900,667 | ) | (73,235 | ) | $(1,012,407 | ) | |||||||||||||
85
Table of Contents
Notes to Financial Statements – continued
| MFS Tennessee Municipal Bond Fund | ||||||||||||
| Year ended 3/31/09 | Year ended 3/31/08 | |||||||||||
| Shares | Amount | Shares | Amount | |||||||||
| Shares sold | ||||||||||||
Class A | 2,025,258 | $20,398,645 | 1,314,620 | $13,696,524 | ||||||||
Class B | 35,001 | 352,101 | 45,319 | 469,407 | ||||||||
| 2,060,259 | $20,750,746 | 1,359,939 | $14,165,931 | |||||||||
| Shares issued to shareholders in reinvestment of distributions | ||||||||||||
Class A | 294,698 | $2,895,444 | 220,085 | $2,299,836 | ||||||||
Class B | 24,067 | 236,695 | 24,854 | 259,625 | ||||||||
| 318,765 | $3,132,139 | 244,939 | $2,559,461 | |||||||||
| Shares reacquired | ||||||||||||
Class A | (1,124,237 | ) | $(11,044,208 | ) | (1,062,121 | ) | $(11,100,219 | ) | ||||
Class B | (224,756 | ) | (2,222,626 | ) | (317,669 | ) | (3,324,533 | ) | ||||
| (1,348,993 | ) | $(13,266,834 | ) | (1,379,790 | ) | $(14,424,752 | ) | |||||
| Net change | ||||||||||||
Class A | 1,195,719 | $12,249,881 | 472,584 | $4,896,141 | ||||||||
Class B | (165,688 | ) | (1,633,830 | ) | (247,496 | ) | (2,595,501 | ) | ||||
| 1,030,031 | $10,616,051 | 225,088 | $2,300,640 | |||||||||
| MFS Virginia Municipal Bond Fund | ||||||||||||
| Year ended 3/31/09 | Year ended 3/31/08 | |||||||||||
| Shares | Amount | Shares | Amount | |||||||||
| Shares sold | ||||||||||||
Class A | 3,378,129 | $36,115,112 | 1,688,156 | $19,000,975 | ||||||||
Class B | 70,738 | 749,818 | 69,039 | 778,407 | ||||||||
Class C | 703,885 | 7,568,008 | 386,974 | 4,362,861 | ||||||||
| 4,152,752 | $44,432,938 | 2,144,169 | $24,142,243 | |||||||||
| Shares issued to shareholders in reinvestment of distributions | ||||||||||||
Class A | 795,995 | $8,385,410 | 637,562 | $7,188,256 | ||||||||
Class B | 22,722 | 239,503 | 22,710 | 256,018 | ||||||||
Class C | 53,132 | 557,656 | 28,221 | 318,006 | ||||||||
| 871,849 | $9,182,569 | 688,493 | $7,762,280 | |||||||||
| Shares reacquired | ||||||||||||
Class A | (3,291,991 | ) | $(34,813,504 | ) | (2,627,933 | ) | $(29,642,471 | ) | ||||
Class B | (289,865 | ) | (3,017,909 | ) | (291,100 | ) | (3,282,430 | ) | ||||
Class C | (248,731 | ) | (2,589,861 | ) | (132,842 | ) | (1,501,846 | ) | ||||
| (3,830,587 | ) | $(40,421,274 | ) | (3,051,875 | ) | $(34,426,747 | ) | |||||
| Net change | ||||||||||||
Class A | 882,133 | $9,687,018 | (302,215 | ) | $(3,453,240 | ) | ||||||
Class B | (196,405 | ) | (2,028,588 | ) | (199,351 | ) | (2,248,005 | ) | ||||
Class C | 508,286 | 5,535,803 | 282,353 | 3,179,021 | ||||||||
| 1,194,014 | $13,194,233 | (219,213 | ) | $(2,522,224 | ) | |||||||
86
Table of Contents
Notes to Financial Statements – continued
| MFS West Virginia Municipal Bond Fund | ||||||||||||
| Year ended 3/31/09 | Year ended 3/31/08 | |||||||||||
| Shares | Amount | Shares | Amount | |||||||||
| Shares sold | ||||||||||||
Class A | 1,046,303 | $10,977,407 | 673,711 | $7,556,954 | ||||||||
Class B | 53,442 | 572,144 | 39,137 | 441,404 | ||||||||
| 1,099,745 | $11,549,551 | 712,848 | $7,998,358 | |||||||||
| Shares issued to shareholders in reinvestment of distributions | ||||||||||||
Class A | 394,443 | $4,115,384 | 319,968 | $3,605,557 | ||||||||
Class B | 20,322 | 211,684 | 17,364 | 195,621 | ||||||||
| 414,765 | $4,327,068 | 337,332 | $3,801,178 | |||||||||
| Shares reacquired | ||||||||||||
Class A | (1,533,750 | ) | $(16,196,226 | ) | (1,000,725 | ) | $(11,286,514 | ) | ||||
Class B | (185,918 | ) | (1,944,481 | ) | (202,518 | ) | (2,276,916 | ) | ||||
| (1,719,668 | ) | $(18,140,707 | ) | (1,203,243 | ) | $(13,563,430 | ) | |||||
| Net change | ||||||||||||
Class A | (93,004 | ) | $(1,103,435 | ) | (7,046 | ) | $(124,003 | ) | ||||
Class B | (112,154 | ) | (1,160,653 | ) | (146,017 | ) | (1,639,891 | ) | ||||
| (205,158 | ) | $(2,264,088 | ) | (153,063 | ) | $(1,763,894 | ) | |||||
| (6) | Line of Credit |
Each fund and other funds managed by MFS participate in a $1 billion unsecured committed line of credit provided by a syndication of banks under a credit agreement. In addition, these funds and other funds managed by MFS have established uncommitted borrowing arrangements with certain banks. Borrowings may be made for temporary financing needs. Interest is charged to each fund, based on its borrowings, generally at a rate equal to the Federal Reserve funds rate plus 0.30%. In addition, a commitment fee, based on the average daily, unused portion of the committed line of credit, is allocated among the participating funds at the end of each calendar quarter. For the year ended March 31, 2009, each fund’s commitment fee and interest expense were as follows, and are included in miscellaneous expense on the Statements of Operations:
| Mississippi Fund | New York Fund | North Carolina Fund | Pennsylvania Fund | South Carolina Fund | Tennessee Fund | Virginia Fund | West Virginia Fund | |||||||||
| Commitment Fee | $560 | $1,160 | $1,798 | $624 | $824 | $664 | $1,620 | $713 | ||||||||
| Interest Expense | — | — | — | — | — | — | — | — |
| (7) | Transactions in Underlying Funds-Affiliated Issuers |
An affiliated issuer may be considered one in which the fund owns 5% or more of the outstanding voting securities, or a company which is under common control. For the purposes of this report, the funds assume the MFS Institutional Money Market Portfolio to be an affiliated issuer. Each of the funds’ transactions in the MFS Institutional Money Market Portfolio for the year ended March 31, 2009, are as follows:
| Underlying Funds – MFS Institutional Money Market Portfolio | ||||||||
| Beginning Share/Par Amount | Acquisitions Share/Par Amount | Dispositions Share/Par Amount | Ending Share/Par Amount | |||||
Mississippi Fund | — | 7,664,820 | (5,585,958) | 2,078,862 | ||||
New York Fund | — | 16,402,585 | (9,458,756) | 6,943,829 | ||||
North Carolina Fund | — | 22,736,592 | (15,591,206) | 7,145,386 | ||||
Pennsylvania Fund | — | 7,747,887 | (5,361,164) | 2,386,723 | ||||
South Carolina Fund | — | 7,038,807 | (5,315,500) | 1,723,307 | ||||
Tennessee Fund | — | 6,410,253 | (3,423,929) | 2,986,324 | ||||
Virginia Fund | — | 15,193,486 | (11,936,542) | 3,256,944 | ||||
West Virginia Fund | — | 6,753,974 | (3,980,421) | 2,773,553 | ||||
87
Table of Contents
Notes to Financial Statements – continued
| Underlying Funds – MFS Institutional Money Market Portfolio | ||||||||
| Realized Gain (Loss) | Capital Gain Distributions | Dividend Income | Ending Value | |||||
Mississippi Fund | $— | $— | $1,159 | $2,078,862 | ||||
New York Fund | $— | $— | $4,619 | $6,943,829 | ||||
North Carolina Fund | $— | $— | $3,221 | $7,145,386 | ||||
Pennsylvania Fund | $— | $— | $1,835 | $2,386,723 | ||||
South Carolina Fund | $— | $— | $1,494 | $1,723,307 | ||||
Tennessee Fund | $— | $— | $1,706 | $2,986,324 | ||||
Virginia Fund | $— | $— | $3,258 | $3,256,944 | ||||
West Virginia Fund | $— | $— | $1,794 | $2,773,553 | ||||
88
Table of Contents
REPORT OF INDEPENDENT REGISTERED PUBLIC ACCOUNTING FIRM
To the Board of Trustees and the Shareholders of MFS Municipal Series Trust:
We have audited the accompanying statements of assets and liabilities, including the portfolios of investments, of MFS Mississippi Municipal Bond Fund, MFS New York Municipal Bond Fund, MFS North Carolina Municipal Bond Fund, MFS Pennsylvania Municipal Bond Fund, MFS South Carolina Municipal Bond Fund, MFS Tennessee Municipal Bond Fund, MFS Virginia Municipal Bond Fund and MFS West Virginia Municipal Bond Fund (the “Funds”) (each a fund comprising MFS Municipal Series Trust) as of March 31, 2009, and the related statements of operations for the year then ended, the statements of changes in net assets for each of the two years in the period then ended, and the financial highlights for each of the five years in the period then ended. These financial statements and financial highlights are the responsibility of the Funds’ management. Our responsibility is to express an opinion on these financial statements and financial highlights based on our audits.
We conducted our audits in accordance with the standards of the Public Company Accounting Oversight Board (United States). Those standards require that we plan and perform the audits to obtain reasonable assurance about whether the financial statements and financial highlights are free of material misstatement. The Funds are not required to have, nor were we engaged to perform, an audit of their internal control over financial reporting. Our audits included consideration of internal control over financial reporting as a basis for designing audit procedures that are appropriate in the circumstances, but not for the purpose of expressing an opinion on the effectiveness of the Funds’ internal control over financial reporting. Accordingly, we express no such opinion. An audit also includes examining, on a test basis, evidence supporting the amounts and disclosures in the financial statements, assessing the accounting principles used and significant estimates made by management, as well as evaluating the overall financial statement presentation. Our procedures included confirmation of securities owned as of March 31, 2009, by correspondence with the custodian and brokers; where replies were not received from brokers, we performed other auditing procedures. We believe that our audits provide a reasonable basis for our opinion.
In our opinion, the financial statements and financial highlights referred to above present fairly, in all material respects, the financial position of the funds constituting MFS Municipal Series Trust as of March 31, 2009, the results of their operations for the year then ended, the changes in their net assets for each of the two years in the period then ended, and the financial highlights for each of the five years in the period then ended, in conformity with accounting principles generally accepted in the United States of America.
DELOITTE & TOUCHE LLP
Boston, Massachusetts
May 14, 2009
89
Table of Contents
TRUSTEES AND OFFICERS — IDENTIFICATION AND BACKGROUND
The Trustees and officers of the Trust, as of May 1, 2009, are listed below, together with their principal occupations during the past five years. (Their titles may have varied during that period.) The address of each Trustee and officer is 500 Boylston Street, Boston, Massachusetts 02116.
Name, Date of Birth | Position(s) Held | Trustee/Officer Since (h) | Principal Occupations During the Past Five Years & | |||
| INTERESTED TRUSTEES | ||||||
| Robert J. Manning (k) (born 10/20/63) | Trustee | February 2004 | Massachusetts Financial Services Company, Chief Executive Officer, President, Chief Investment Officer and Director | |||
| Robert C. Pozen (k) (born 8/08/46) | Trustee | February 2004 | Massachusetts Financial Services Company, Chairman (since February 2004); Harvard Business School (education), Senior Lecturer (since 2008); Bell Canada Enterprises (telecommunications), Director (until February 2009); The Bank of New York, Director (finance), (March 2004 to May 2005); Telesat (satellite communications), Director (until November 2007) | |||
| INDEPENDENT TRUSTEES | ||||||
| David H. Gunning (born 5/30/42) | Trustee and Chair of Trustees | January 2004 | Retired; Cleveland-Cliffs Inc. (mining products and service provider), Vice Chairman/Director (until May 2007); Lincoln Electric Holdings, Inc. (welding equipment manufacturer), Director; Development Alternatives, Inc. (consulting), Director/Non Executive Chairman; Portman Limited (mining), Director (since 2005); Southwest Gas Corp. (natural gas distribution), Director (until May 2004) | |||
| Robert E. Butler (n) (born 11/29/41) | Trustee | January 2006 | Consultant – regulatory and compliance matters (since July 2002); PricewaterhouseCoopers LLP (professional services firm), Partner (until 2002) | |||
| Lawrence H. Cohn, M.D. (born 3/11/37) | Trustee | August 1993 | Brigham and Women’s Hospital, Senior Cardiac Surgeon (since 2005); Harvard Medical School, Professor of Cardiac Surgery; Partners HealthCare, Physician Director of Medical Device Technology (since 2006); Brigham and Women’s Hospital, Chief of Cardiac Surgery (until 2005) | |||
Maureen R. Goldfarb (born 4/06/55) | Trustee | January 2009 | Private investor; John Hancock Financial Services, Inc., Executive Vice President (until 2004); John Hancock Mutual Funds, Trustee and Chief Executive Officer (until 2004) | |||
| William R. Gutow (born 9/27/41) | Trustee | December 1993 | Private investor and real estate consultant; Capital Entertainment Management Company (video franchise), Vice Chairman; Texas Donuts (donut franchise), Vice Chairman (since 2007); Atlantic Coast Tan (tanning salons), Vice Chairman (until 2007) | |||
| Michael Hegarty (born 12/21/44) | Trustee | December 2004 | Retired; AXA Financial (financial services and insurance), Vice Chairman and Chief Operating Officer (until 2001); The Equitable Life Assurance Society (insurance), President and Chief Operating Officer (until 2001) | |||
| J. Atwood Ives (born 5/01/36) | Trustee | February 1992 | Private investor; KeySpan Corporation (energy related services), Director until 2004; Woodstock Corporation (investment advisory firm), Director until 2003 | |||
| John P. Kavanaugh (born 11/04/54) | Trustee | January 2009 | Private investor; The Hanover Insurance Group, Inc., Vice President and Chief Investment Officer (until 2006); Allmerica Investment Trust, Allmerica Securities Trust and Opus Investment Trust (investment companies), Chairman, President and Trustee (until 2006) | |||
| J. Dale Sherratt (born 9/23/38) | Trustee | August 1993 | Insight Resources, Inc. (acquisition planning specialists), President; Wellfleet Investments (investor in health care companies), Managing General Partner | |||
| Laurie J. Thomsen (born 8/05/57) | Trustee | March 2005 | New Profit, Inc. (venture philanthropy), Partner (since 2006); Private investor; Prism Venture Partners (venture capital), Co-founder and General Partner (until June 2004); The Travelers Companies (commercial property liability insurance), Director | |||
| Robert W. Uek (born 5/18/41) | Trustee | January 2006 | Consultant to investment company industry; PricewaterhouseCoopers LLP (professional services firm), Partner (until 1999); TT International Funds (mutual fund complex), Trustee (until 2005); Hillview Investment Trust II Funds (mutual fund complex), Trustee (until 2005) | |||
| OFFICERS | ||||||
| Maria F. Dwyer (k) (born 12/01/58) | President | November 2005 | Massachusetts Financial Services Company, Executive Vice President and Chief Regulatory Officer (since March 2004) Chief Compliance Officer (since December 2006); Fidelity Management & Research Company, Vice President (prior to March 2004); Fidelity Group of Funds, President and Treasurer (until March 2004) | |||
| Christopher R. Bohane (k) (born 1/18/74) | Assistant Secretary and Assistant Clerk | July 2005 | Massachusetts Financial Services Company, Vice President and Senior Counsel | |||
John M. Corcoran (k) (born 4/13/65) | Treasurer | October 2008 | Massachusetts Financial Services Company, Senior Vice President (since October 2008); State Street Bank and Trust (financial services provider), Senior Vice President, (until September 2008) | |||
90
Table of Contents
Trustees and Officers – continued
Name, Date of Birth | Position(s) Held | Trustee/Officer Since (h) | Principal Occupations During the Past Five Years & | |||
| Ethan D. Corey (k) (born 11/21/63) | Assistant Secretary and Assistant Clerk | July 2005 | Massachusetts Financial Services Company, Senior Vice President and Associate General Counsel (since 2004); Dechert LLP (law firm), Counsel (prior to December 2004) | |||
| David L. DiLorenzo (k) (born 8/10/68) | Assistant Treasurer | July 2005 | Massachusetts Financial Services Company, Vice President (since June 2005); JP Morgan Investor Services, Vice President (until June 2005) | |||
| Timothy M. Fagan (k) (born 7/10/68) | Assistant Secretary and Assistant Clerk | September 2005 | Massachusetts Financial Services Company, Vice President and Senior Counsel (since September 2005); John Hancock Advisers, LLC, Vice President, Senior Attorney and Chief Compliance Officer (until August 2005) | |||
| Mark D. Fischer (k) (born 10/27/70) | Assistant Treasurer | July 2005 | Massachusetts Financial Services Company, Vice President (since May 2005); JP Morgan Investment Management Company, Vice President (until May 2005) | |||
| Robyn L. Griffin (born 7/04/75) | Assistant Independent Chief Compliance Officer | August 2008 | Griffin Compliance LLC (provider of compliance services), Principal (since August 2008); State Street Corporation (financial services provider), Mutual Fund Administration Assistant Vice President (October 2006 – July 2008); Liberty Mutual Group (insurance), Personal Market Assistant Controller (April 2006 – October 2006); Deloitte & Touche LLP (professional services firm), Senior Manager (prior to April 2006) | |||
Brian E. Langenfeld (k) (born 3/07/73) | Assistant Secretary and Assistant Clerk | June 2006 | Massachusetts Financial Services Company, Vice President and Senior Counsel (since May 2006); John Hancock Advisers, LLC, Assistant Vice President and Counsel (until April 2006) | |||
| Ellen Moynihan (k) (born 11/13/57) | Assistant Treasurer | April 1997 | Massachusetts Financial Services Company, Senior Vice President | |||
Susan S. Newton (k) (born 3/07/50) | Assistant Secretary and Assistant Clerk | May 2005 | Massachusetts Financial Services Company, Senior Vice President and Associate General Counsel (since April 2005); John Hancock Advisers, LLC, Senior Vice President, Secretary and Chief Legal Officer (until April 2005) | |||
| Susan A. Pereira (k) (born 11/05/70) | Assistant Secretary and Assistant Clerk | July 2005 | Massachusetts Financial Services Company, Vice President and Senior Counsel (since June 2004); Bingham McCutchen LLP (law firm), Associate (until June 2004) | |||
| Mark N. Polebaum (k) (born 5/01/52) | Secretary and Clerk | January 2006 | Massachusetts Financial Services Company, Executive Vice President, General Counsel and Secretary (since January 2006); Wilmer Cutler Pickering Hale and Dorr LLP (law firm), Partner (until January 2006) | |||
| Frank L. Tarantino (born 3/07/44) | Independent Chief Compliance Officer | June 2004 | Tarantino LLC (provider of compliance services), Principal (since June 2004); CRA Business Strategies Group (consulting services), Executive Vice President (until June 2004) | |||
| Richard S. Weitzel (k) (born 7/16/70) | Assistant Secretary and Assistant Clerk | October 2007 | Massachusetts Financial Services Company, Vice President and Assistant General Counsel (since 2004); Massachusetts Department of Business and Technology, General Counsel (until April 2004) | |||
| James O. Yost (k) (born 6/12/60) | Assistant Treasurer | September 1990 | Massachusetts Financial Services Company, Senior Vice President | |||
| (h) | Date first appointed to serve as Trustee/officer of an MFS fund. Each Trustee has served continuously since appointment unless indicated otherwise. For the period from December 15, 2004 until February 22, 2005, Messrs. Pozen and Manning served as Advisory Trustees. For the period March 2008 until October 2008, Ms. Dwyer served as Treasurer of the Funds. |
| (j) | Directorships or trusteeships of companies required to report to the Securities and Exchange Commission (i.e., “public companies”). |
| (k) | “Interested person” of the Trust within the meaning of the Investment Company Act of 1940 (referred to as the 1940 Act), which is the principal federal law governing investment companies like the fund, as a result of position with MFS. The address of MFS is 500 Boylston Street, Boston, Massachusetts 02116. |
| (n) | In 2004 and 2005, Mr. Butler provided consulting services to the independent compliance consultant retained by MFS pursuant to its settlement with the SEC concerning market timing and related matters. The terms of that settlement required that compensation and expenses related to the independent compliance consultant be borne exclusively by MFS and, therefore, MFS paid Mr. Butler for the services he rendered to the independent compliance consultant. In 2004 and 2005, MFS paid Mr. Butler a total of $351,119.29. |
Each Trustee (except Messrs. Butler, Kavanaugh and Uek and Ms. Goldfarb) has been elected by shareholders and each Trustee and officer holds office until his or her successor is chosen and qualified or until his or her earlier death, resignation, retirement or removal. The Trust held a shareholders’ meeting in 2005 to elect Trustees, and will hold a shareholders’ meeting at least once every five years thereafter, to elect Trustees. Messrs. Butler, Kavanaugh, Sherratt, Uek and Ms. Thomsen are members of the Trust’s Audit Committee.
Each of the Fund’s Trustees and officers holds comparable positions with certain other funds of which MFS or a subsidiary is the investment adviser or distributor, and, in the case of the officers, with certain affiliates of MFS. As of January 1, 2009, the Trustees served as board members of 105 funds within the MFS Family of Funds.
91
Table of Contents
Trustees and Officers – continued
The Statement of Additional Information for the Fund and further information about the Trustees are available without charge upon request by calling 1-800-225-2606.
Investment Adviser Massachusetts Financial Services Company 500 Boylston Street, Boston, MA 02116-3741 Distributor MFS Fund Distributors, Inc. 500 Boylston Street, Boston, MA 02116-3741 Portfolio Manager Michael Dawson | Custodian JPMorgan Chase Bank One Chase Manhattan Plaza, New York, NY 10081
Independent Registered Public Deloitte & Touche LLP 200 Berkeley Street, Boston, MA 02116 |
92
Table of Contents
BOARD REVIEW OF INVESTMENT ADVISORY AGREEMENT
A discussion regarding the Board’s most recent review and renewal of the fund’s Investment Advisory Agreement with MFS is available by clicking on the fund’s name under “Mutual Funds” in the “Products and Performance” section of the MFS Web site (mfs.com).
PROXY VOTING POLICIES AND INFORMATION
A general description of the MFS funds’ proxy voting policies and procedures is available without charge, upon request, by calling 1-800-225-2606, by visiting the Proxy Voting section of mfs.com or by visiting the SEC’s Web site at http://www.sec.gov.
Information regarding how the fund voted proxies relating to portfolio securities during the most recent twelve-month period ended June 30 is available without charge by visiting the Proxy Voting section of mfs.com or by visiting the SEC’s Web site at http://www.sec.gov.
QUARTERLY PORTFOLIO DISCLOSURE
The fund will file a complete schedule of portfolio holdings with the Securities and Exchange Commission (the Commission) for the first and third quarters of each fiscal year on Form N-Q. The fund’s Form N-Q may be reviewed and copied at the:
Public Reference Room
Securities and Exchange Commission
100 F Street, NE, Room 1580
Washington, D.C. 20549
Information on the operation of the Public Reference Room may be obtained by calling the Commission at 1-800-SEC-0330. The fund’s Form N-Q is available on the EDGAR database on the Commission’s Internet Web site at http://www.sec.gov, and copies of this information may be obtained, upon payment of a duplicating fee, by electronic request at the following e-mail address: publicinfo@sec.gov or by writing the Public Reference Section at the above address.
A shareholder can also obtain the quarterly portfolio holdings report at mfs.com.
FEDERAL TAX INFORMATION (unaudited)
The funds will notify shareholders of amounts for use in preparing 2009 income tax forms in January 2010. The following information is provided pursuant to provisions of the Internal Revenue Code.
The funds below designate the following amounts as capital gain dividends paid during the fiscal year.
| Capital Gains | ||
| New York Fund | $1,140,167 | |
| North Carolina Fund | 1,146,971 | |
| South Carolina Fund | 281,499 | |
| Tennessee Fund | 138,081 | |
| Viginia Fund | 1,661,539 | |
| West Virginia Fund | 1,308,133 |
Of the dividends paid from net investment income during the fiscal year, the following percentages were designated as exempt interest dividends for federal income tax purposes. If each fund has earned income on private activity bonds, a portion of the dividends paid may be considered a tax preference item for purposes of computing a shareholder’s alternative minimum tax.
| Exempt Interest Dividends | ||
| Mississippi Fund | 100.00% | |
| New York Fund | 100.00% | |
| North Carolina Fund | 100.00% | |
| Pennsylvania Fund | 100.00% | |
| South Carolina Fund | 100.00% | |
| Tennessee Fund | 100.00% | |
| Viginia Fund | 100.00% | |
| West Virginia Fund | 100.00% |
93
Table of Contents
Privacy is a concern for every investor today. At MFS Investment Management® and the MFS funds, we take this concern very seriously. We want you to understand our policies about the investment products and services that we offer, and how we protect the nonpublic personal information of investors who have a direct relationship with us and our wholly owned subsidiaries.
Throughout our business relationship, you provide us with personal information. We maintain information and records about you, your investments, and the services you use. Examples of the nonpublic personal information we maintain include
| Ÿ | data from investment applications and other forms |
| Ÿ | share balances and transactional history with us, our affiliates, or others |
| Ÿ | facts from a consumer reporting agency |
We do not disclose any nonpublic personal information about our customers or former customers to anyone, except as permitted by law. We may share nonpublic personal information with third parties or certain of our affiliates in connection with servicing your account or processing your transactions. We may share information with companies or financial institutions that perform marketing services on our behalf or with other financial institutions with which we have joint marketing arrangements, subject to any legal requirements.
Authorization to access your nonpublic personal information is limited to appropriate personnel who provide products, services, or information to you. We maintain physical, electronic, and procedural safeguards to help protect the personal information we collect about you.
If you have any questions about the MFS privacy policy, please call 1-800-225-2606 any business day between 8 a.m. and 8 p.m. Eastern time.
Note: If you own MFS products or receive MFS services in the name of a third party such as a bank or broker-dealer, their privacy policy may apply to you instead of ours.
94
Table of Contents
CONTACT US
Web site
mfs.com
MFS TALK
1-800-637-8255
24 hours a day
Account service and literature
Shareholders
1-800-225-2606
Investment professionals
1-800-343-2829
Retirement plan services
1-800-637-1255
Mailing address
MFS Service Center, Inc.
P.O. Box 55824
Boston, MA 02205-5824
Overnight mail
MFS Service Center, Inc.
c/o Boston Financial Data Services
30 Dan Road
Canton, MA 02021-2809

Save paper with eDelivery. MFS® will send you prospectuses, reports, and proxies directly via e-mail so you will get information faster with less mailbox clutter. To sign up: 1. go to mfs.com. 2. log in via MFS® Access. 3. select eDelivery. If you own your MFS fund shares through a financial institution or a retirement plan, MFS® TALK, MFS Access, and eDelivery may not be available to you.

Table of Contents

Table of Contents
MFS® Municipal Income Fund
| CONTACT INFORMATION BACK COVER | ||
SIPC Contact Information:
You may obtain information about the Securities Investor Protection Corporation (“SIPC”), including the SIPC Brochure, by contacting SIPC either by telephone (202-371-8300) or by accessing SIPC’s website address (www.sipc.org).
The report is prepared for the general information of shareholders. It is authorized for distribution to prospective investors only when preceded or accompanied by a current prospectus.
NOT FDIC INSURED Ÿ MAY LOSE VALUE Ÿ NO BANK GUARANTEE
3/31/09
LMB-ANN
Table of Contents

Dear Shareholders:
The market downturns and economic setbacks of late probably rank among the worst financial declines most of us have experienced. Inevitably, people may be questioning their commitment to investing. Still, it is important to remember that downturns are an inescapable part of the business cycle. Such troughs have been seen before, and if we can use history as a guide, market recoveries typically have followed.
Recent events have clearly shown us the value of certain types of investments. In this environment, two of the hallmarks of mutual funds — transparency and liquidity — have become critically important. Unlike some other types of investments, the operations of mutual funds are relatively transparent to their shareholders. With their daily redemption feature, mutual funds also generally provide easy, convenient access to one’s money. Through these recent market upheavals, this level of liquidity enhanced the ability of mutual fund investors to respond and modify their investments as they and their advisors saw fit — a flexibility that those in less liquid investments simply did not have at their disposal.
At MFS® we take particular pride in how well mutual funds can serve investors because we invented the mutual fund in the United States. Established in 1924, Massachusetts Investors Trust was the nation’s first fund. Recent market events only reinforce what we have learned through 85 years — that mutual funds provide unique features that are important to investors in any type of market climate.
Respectfully,

Robert J. Manning
Chief Executive Officer and Chief Investment Officer
MFS Investment Management®
May 15, 2009
The opinions expressed in this letter are subject to change, may not be relied upon for investment advice, and no forecasts can be guaranteed.
Before investing, consider the fund’s investment objectives, risks, charges, and expenses. For a prospectus containing this and other information, contact your investment professional or view online. Read it carefully.
MFS Fund Distributors, Inc., 500 Boylston Street, Boston, MA 02116
1
Table of Contents
Portfolio structure (i)

| Top five industries (i) | ||
| Healthcare Revenue – Hospitals | 23.6% | |
| General Obligations – Schools | 10.1% | |
| Universities – Colleges | 8.7% | |
| Utilities – Municipal Owned | 8.5% | |
| State & Local Agencies | 7.5% |
| Credit quality of bonds (r) | ||
| AAA | 19.2% | |
| AA | 31.0% | |
| A | 23.5% | |
| BBB | 19.3% | |
| BB | 1.7% | |
| B | 0.6% | |
| CCC | 0.3% | |
| CC (o) | 0.0% | |
| D (o) | 0.0% | |
| Not Rated | 4.4% | |
| Portfolio facts | ||
| Average Duration (d)(i) | 8.7 | |
| Average Life (i)(m) | 16.4 yrs. | |
| Average Maturity (i)(m) | 17.9 yrs. | |
| Average Credit Quality of Rated Securities (long-term) (a) | A+ | |
| Average Credit Quality of Rated Securities (short-term) (a) | A-1 | |
| (a) | The average credit quality of rated securities is based upon a market weighted average of portfolio holdings that are rated by public rating agencies. |
| (d) | Duration is a measure of how much a bond’s price is likely to fluctuate with general changes in interest rates, e.g., if rates rise 1.00%, a bond with a 5-year duration is likely to lose about 5.00% of its value. |
| (i) | For purposes of this presentation, the bond component includes accrued interest amounts and may be positively or negatively impacted by the equivalent exposure from any derivative holdings, if applicable. |
| (m) | The average maturity shown is calculated using the final stated maturity on the portfolio’s holdings without taking into account any holdings which have been pre-refunded or pre-paid to an earlier date or which have a mandatory put date prior to the stated maturity. The average life shown takes into account these earlier dates. |
| (o) | Less than 0.1%. |
| (r) | Each security is assigned a rating from Moody’s Investors Service. If not rated by Moody’s, the rating will be that assigned by Standard & Poor’s. Likewise, if not assigned a rating by Standard & Poor’s, it will be based on the rating assigned by Fitch, Inc. For those portfolios that hold a security which is not rated by any of the three agencies, the security is considered Not Rated. Holdings in U.S. Treasuries and government agency mortgage-backed securities, if any, are included in the “AAA”-rating category. Percentages are based on the total market value of investments as of 3/31/09. |
Percentages are based on net assets as of 3/31/09, unless otherwise noted.
The portfolio is actively managed and current holdings may be different.
2
Table of Contents
Summary of Results
For the twelve months ended March 31, 2009, Class A shares of the MFS Municipal Income Fund (the “fund”) provided a total return of –1.53%, at net asset value. This compares with a return of 2.27% for the fund’s benchmark, the Barclays Capital Municipal Bond Index.
Market Environment
The global economy and financial markets experienced substantial deterioration and extraordinary volatility over the reporting period. Strong headwinds in the U.S. included accelerated deterioration in the housing market, anemic corporate investment, a rapidly declining job market, and a much tighter credit environment. During the period, a seemingly continuous series of tumultuous financial events hammered markets, including: the distressed sale of failing Bear Stearns to JPMorgan, the conservatorship of Government Sponsored Enterprises (GSEs) Fannie Mae and Freddie Mac, the bankruptcy of investment bank Lehman Brothers, the Federal Reserve Bank’s complex intervention of insurance company American International Group (AIG), the nationalization of several large European banks, the failure of Washington Mutual, the distressed sale of Wachovia, the virtual failure of Iceland’s banking sector, and the collapse of the global auto industry. As a result of this barrage of turbulent news, global equity markets pushed significantly lower and credit markets witnessed the worst dislocation since the beginning of the credit crisis. Though credit conditions and equity indices improved towards the end of the period, the state of financial and macroeconomic dislocation remained very severe.
While somewhat resilient during the first half of the period, the global economy and financial system increasingly experienced considerable negative spillovers from the U.S. slowdown. Not only did Europe and Japan show obvious signs of economic decline, the more powerful engine of global growth – emerging markets – also displayed weakening dynamics. The synchronized global downturn in economic activity experienced in the fourth quarter of 2008 and the first quarter of 2009 was among the most intense in the post-World War II period.
During the reporting period, the U.S. Federal Reserve Board cut interest rates aggressively and introduced a multitude of new lending facilities to alleviate ever-tightening credit markets, while the U.S. federal government designed and implemented fiscal stimulus packages. Although several other global central banks also cut rates during the early part of the reporting period, the dilemma of rising energy and food prices heightened concerns among central bankers that inflationary expectations might become unhinged despite weaker growth.
3
Table of Contents
Management Review – continued
Only later in the reporting period did rapidly slowing global growth result in a very precipitous decline in commodity prices, which significantly eased inflation and inflationary expectations. As inflationary concerns diminished in the face of global deleveraging, and equity and credit markets deteriorated more sharply, a coordinated rate cut marked the beginning of much more aggressive easing by the major global central banks. By the end of the period, several central banks had approached their lower bound on policy rates and were examining the implementation and ramifications of quantitative easing as a means to further loosen monetary policy to offset the continuing fall in global wealth.
The twelve months ended March 31, 2009 was a challenging period for the municipal bond market. During the first nine months of the fiscal year, the municipal bond market faced an unprecedented number of challenges which lead to a broad-based decline in bond prices, an increase in yields, and a significant increase in spreads between higher-rated securities and lower-rated or non-rated securities. Among the many factors leading to the decline in prices and the widening in credit spreads was the monoline bond insurers being downgraded from their AAA rating by at least one of the major credit rating services. This decline in credit rating led to an unwind in leverage by non-traditional participants in the municipal bond market which, when combined with a general deterioration in credit quality, led to a widening of credit spreads between higher-rated and lower-rated securities and, finally, significant redemptions by investors out of municipal bond mutual funds. However, after the turn of the calendar year, the supply-demand imbalance shifted. Mutual funds began to experience inflows and direct retail buying re-emerged. These factors, combined with a decline in the pace of leverage unwinds and expectations that the market provisions contained within the American Reinvestment and Recovery Act would provide support for the municipal market, led to a significant rebound in prices and a decline in yields.
Detractors from Performance
Over the reporting period, a combination of security selection and an overweighted position in healthcare-related and industrial bonds detracted from relative performance. Security selection in educational-related and utilities securities also held back the fund’s relative results. An overweighted relative exposure to “BBB” rated (s) securities had a negative impact on results as these securities underperformed the Barclays Capital Municipal Bond Index. Over the course of the twelve months ended March 31, 2009, spreads between higher quality “AAA” rated and lower quality “BBB” rated municipal securities widened dramatically. The widening was due to a combination of the broad-based decline in credit quality, and more specifically, the impact of the significant credit downgrades of a majority of the bond insurers.
4
Table of Contents
Management Review – continued
Contributors to Performance
The fund’s relative results were bolstered by an overweighted position in the short end of the yield curve (y) (represented by bonds with durations (d) of 0- to 8-years) as interest rates, at this end of the curve, declined considerably in the second half of the period. Underweighting bonds with intermediate-term maturities (represented by bonds with durations between 8- to 11- years) in the latter part of the reporting period also helped relative returns.
Respectfully,
Geoffrey Schechter
Portfolio Manager
| (d) | Duration is a measure of how much a bond’s price is likely to fluctuate with general changes in interest rates, e.g., if rates rise 1.00%, a bond with a 5-year duration is likely to lose about 5.00% of its value. |
| (s) | Bonds rated “BBB”, “Baa”, or higher are considered investment grade; bonds rated “BB”, “Ba”, or below are considered non-investment grade. The primary source for bond quality ratings is Moody’s Investors Service. If not available, ratings by Standard & Poor’s are used, else ratings by Fitch, Inc. For securities which are not rated by any of the three agencies, the security is considered Not Rated. |
| (y) | A yield curve graphically depicts the yields of different maturity bonds of the same credit quality and type. A normal yield curve is upward-sloping, with short term-rates lower than long term rates. |
The views expressed in this report are those of the portfolio manager only through the end of the period of the report as stated on the cover and do not necessarily reflect the views of MFS or any other person in the MFS organization. These views are subject to change at any time based on market or other conditions, and MFS disclaims any responsibility to update such views. These views may not be relied upon as investment advice or an indication of trading intent on behalf of any MFS portfolio. References to specific securities are not recommendations of such securities, and may not be representative of any MFS portfolio’s current or future investments.
5
Table of Contents
PERFORMANCE SUMMARY THROUGH 3/31/09
The following chart illustrates a representative class of the fund’s historical performance in comparison to its benchmark(s). Performance results include the deduction of the maximum applicable sales charge and reflect the percentage change in net asset value, including reinvestment of dividends and capital gains distributions. The performance of other share classes will be greater than or less than that of the class depicted below. Benchmark comparisons are unmanaged; do not reflect sales charges, commissions or expenses; and cannot be invested in directly. (See Notes to Performance Summary.)
Performance data shown represents past performance and is no guarantee of future results. Investment return and principal value fluctuate so your shares, when sold, may be worth more or less than the original cost; current performance may be lower or higher than quoted. The performance shown does not reflect the deduction of taxes, if any, that a shareholder would pay on fund distributions or the redemption of fund shares.
Growth of a Hypothetical $10,000 Investment
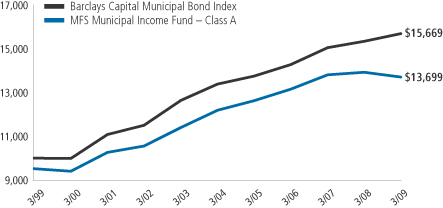
6
Table of Contents
Performance Summary – continued
Total Returns through 3/31/09
Average annual without sales charge
| Share class | Class inception date | 1-yr | 5-yr | 10-yr | ||||||||
| A | 9/07/93 | (1.53)% | 2.36% | 3.70% | ||||||||
| B | 12/29/86 | (2.13)% | 1.60% | 2.94% | ||||||||
| C | 1/03/94 | (2.25)% | 1.61% | 2.94% | ||||||||
| A1 | 6/25/07 | (1.15)% | 2.11% | 3.82% | ||||||||
| B1 | 6/25/07 | (2.02)% | 1.33% | 3.01% | ||||||||
| Comparative benchmark | ||||||||||||
| Barclays Capital Municipal Bond Index (f) | 2.27% | 3.21% | 4.59% | |||||||||
| Average annual with sales charge | ||||||||||||
| A With Initial Sales Charge (4.75%) | (6.20)% | 1.37% | 3.20% | |||||||||
| B With CDSC (Declining over six years from 4% to 0%) (x) | (5.87)% | 1.27% | 2.94% | |||||||||
| C With CDSC (1% for 12 months) (x) | (3.18)% | 1.61% | 2.94% | |||||||||
| A1 With Initial Sales Charge (4.75%) | (5.85)% | 1.12% | 3.32% | |||||||||
| B1 With CDSC (Declining over six years from 4% to 0%) (x) | (5.76)% | 1.00% | 3.01% | |||||||||
CDSC – Contingent Deferred Sales Charge.
| (f) | Source: FactSet Research Systems Inc. |
| (x) | Assuming redemption at the end of the applicable period. |
Benchmark Definition
Barclays Capital Municipal Bond Index (formerly known as Lehman Brothers Municipal Bond Index) – a market capitalization-weighted index that measures the performance of the tax-exempt bond market.
It is not possible to invest directly in an index.
Notes to Performance Summary
Performance for Class A1 shares includes the performance of the MFS Municipal Bond Fund’s Class A shares for the period prior to the merger of the MFS Municipal Bond Fund into the MFS Municipal Income Fund. Performance for Class B1 shares includes the performance of the MFS Municipal Bond Fund’s Class B shares for the period prior to the merger of the MFS Municipal Bond Fund into the MFS Municipal Income Fund. The merger occurred at the close of business on June 22, 2007.
This blended class performance has been adjusted to take into account differences in sales loads, if any, applicable to these share classes, but has not
7
Table of Contents
Performance Summary – continued
been adjusted to take into account differences in class specific operating expenses (such as Rule 12b-1 fees). Compared to performance these share classes would have experienced had they been offered for the entire period, the use of blended performance generally results in higher performance for share classes with higher operating expenses than the share class to which it is blended, and lower performance for share classes with lower operating expenses than the share class to which it is blended.
Performance results reflect any applicable expense subsidies and waivers in effect during the periods shown. Without such subsidies and waivers the fund’s performance results would be less favorable. Please see the prospectus and financial statements for complete details.
A portion of income may be subject to state, federal, and/or alternative minimum tax. Capital gains, if any, are subject to a capital gains tax.
From time to time the fund may receive proceeds from litigation settlements, without which performance would be lower.
8
Table of Contents
Fund expenses borne by the shareholders during the period,
October 1, 2008 through March 31, 2009
As a shareholder of the fund, you incur two types of costs: (1) transaction costs, including sales charges (loads) on certain purchase or redemption payments, and (2) ongoing costs, including management fees; distribution and service (12b-1) fees; and other fund expenses. This example is intended to help you understand your ongoing costs (in dollars) of investing in the fund and to compare these costs with the ongoing costs of investing in other mutual funds.
The example is based on an investment of $1,000 invested at the beginning of the period and held for the entire period October 1, 2008 through March 31, 2009.
Actual Expenses
The first line for each share class in the following table provides information about actual account values and actual expenses. You may use the information in this line, together with the amount you invested, to estimate the expenses that you paid over the period. Simply divide your account value by $1,000 (for example, an $8,600 account value divided by $1,000 = 8.6), then multiply the result by the number in the first line under the heading entitled “Expenses Paid During Period” to estimate the expenses you paid on your account during this period.
Hypothetical Example for Comparison Purposes
The second line for each share class in the following table provides information about hypothetical account values and hypothetical expenses based on the fund’s actual expense ratio and an assumed rate of return of 5% per year before expenses, which is not the fund’s actual return. The hypothetical account values and expenses may not be used to estimate the actual ending account balance or expenses you paid for the period. You may use this information to compare the ongoing costs of investing in the fund and other funds. To do so, compare this 5% hypothetical example with the 5% hypothetical examples that appear in the shareholder reports of the other funds.
Please note that the expenses shown in the table are meant to highlight your ongoing costs only and do not reflect any transactional costs, such as sales charges (loads). Therefore, the second line for each share class in the table is useful in comparing ongoing costs only, and will not help you determine the relative total costs of owning different funds. In addition, if these transactional costs were included, your costs would have been higher.
9
Table of Contents
Expense Table – continued
| Share Class | Annualized Ratio | Beginning Account Value 10/01/08 | Ending Account Value 3/31/09 | Expenses Paid During Period (p) 10/01/08-3/31/09 | ||||||
| A | Actual | 0.71% | $1,000.00 | $1,013.45 | $3.56 | |||||
| Hypothetical (h) | 0.71% | $1,000.00 | $1,021.39 | $3.58 | ||||||
| B | Actual | 1.45% | $1,000.00 | $1,010.96 | $7.27 | |||||
| Hypothetical (h) | 1.45% | $1,000.00 | $1,017.70 | $7.29 | ||||||
| C | Actual | 1.46% | $1,000.00 | $1,009.68 | $7.32 | |||||
| Hypothetical (h) | 1.46% | $1,000.00 | $1,017.65 | $7.34 | ||||||
| A1 | Actual | 0.45% | $1,000.00 | $1,016.04 | $2.26 | |||||
| Hypothetical (h) | 0.45% | $1,000.00 | $1,022.69 | $2.27 | ||||||
| B1 | Actual | 1.19% | $1,000.00 | $1,010.90 | $5.97 | |||||
| Hypothetical (h) | 1.19% | $1,000.00 | $1,019.00 | $5.99 |
| (h) | 5% class return per year before expenses. |
| (p) | Expenses paid is equal to each class’ annualized expense ratio, as shown above, multiplied by the average account value over the period, multiplied by the number of days in the period, divided by the number of days in the year. Expenses paid do not include any applicable sales charges (loads). If these transaction costs had been included, your costs would have been higher. |
Expense Changes Impacting the Table
Changes to the fund’s fee arrangements occurred during the six month period. Had these fee changes been in effect throughout the entire six month period, the annualized expense ratios would have been 0.79% for Class A shares, 1.53% for Class B shares, 1.54% for Class C shares, 0.53% for Class A1 shares and 1.28% for Class B1 shares; the actual expenses paid during the period would have been approximately $3.96 for Class A shares, $7.67 for Class B shares, $7.71 for Class C shares, $2.66 for Class A1 shares and $6.41 for Class B1 shares; and the hypothetical expenses paid during the period would have been approximately $3.98 for Class A shares, $7.70 for Class B shares, $7.75 for Class C shares, $2.67 for Class A1 shares and $6.44 for Class B1 shares. For further information about the fund’s fee arrangements and changes to those fee arrangements, please see Note 3 in the Notes to Financial Statements.
10
Table of Contents
3/31/09
The Portfolio of Investments is a complete list of all securities owned by your fund. It is categorized by broad-based asset classes.
| Municipal Bonds - 100.0% | ||||||
| Issuer | Shares/Par | Value ($) | ||||
| Airport & Port Revenue - 0.6% | ||||||
| Branson, MO, Regional Airport Transportation Development District Airport Rev., “B”, 6%, 2025 | $ | 205,000 | $ | 133,537 | ||
| Branson, MO, Regional Airport Transportation Development District Airport Rev., “B”, 6%, 2037 | 100,000 | 59,389 | ||||
| Branson, MO, Regional Airport Transportation Development District Airport Rev., “B”, 6%, 2037 | 1,075,000 | 608,751 | ||||
| Chicago, IL, O’Hare International Airport Rev. (Second Lien Passenger Facility), “D”, AMBAC, 5.5%, 2019 | 2,195,000 | 2,254,924 | ||||
| Massachusetts Port Authority Rev., ETM, 13%, 2013 (c) | 2,170,000 | 2,750,996 | ||||
| Niagara, NY, Frontier Transportation Authority Rev. (Buffalo-Niagara International Airport), MBIA, 5.875%, 2013 | 1,485,000 | 1,504,498 | ||||
| Oklahoma City, OK, Airport Trust, “B”, FSA, 5.75%, 2017 | 1,080,000 | 1,088,003 | ||||
| $ | 8,400,098 | |||||
| General Obligations - General Purpose - 4.6% | ||||||
| Chicago, IL, FGIC, 6.125%, 2010 (c) | $ | 3,785,000 | $ | 4,083,880 | ||
| Chicago, IL, AMBAC, 5.5%, 2018 | 11,800,000 | 13,457,900 | ||||
| Commonwealth of Massachusetts, 5.375%, 2011 (c)(u) | 5,740,000 | 6,324,332 | ||||
| Commonwealth of Puerto Rico, “A”, ETM, FGIC, 5.5%, 2015 (c) | 5,000 | 5,919 | ||||
| Commonwealth of Puerto Rico, “A”, ETM, FGIC, 5.5%, 2015 (c)(u) | 5,580,000 | 6,605,771 | ||||
| Country Club Hills, IL, MBIA, 5%, 2031 | 3,170,000 | 3,106,632 | ||||
| Cranston, RI, FGIC, 6.375%, 2009 (c) | 830,000 | 867,350 | ||||
| Delaware County, OH, 6.25%, 2010 (c) | 1,000,000 | 1,099,610 | ||||
| New York, NY, “J”, MBIA, 5%, 2017 | 2,000,000 | 2,021,780 | ||||
| Schaumburg, IL, “B”, FGIC, 5.25%, 2034 | 2,000,000 | 2,007,620 | ||||
| State of California, 6.5%, 2033 | 4,000,000 | 4,203,920 | ||||
| State of Illinois, MBIA, 5.5%, 2025 | 500,000 | 505,245 | ||||
| State of Washington, 6.75%, 2010 | 3,880,000 | 4,075,707 | ||||
| State of Washington, 6%, 2012 | 4,360,000 | 4,961,985 | ||||
| State of Washington, “A”, 5%, 2033 | 5,000,000 | 4,930,500 | ||||
| State of Wisconsin, “C”, 6%, 2010 (c) | 1,200,000 | 1,270,848 | ||||
| $ | 59,528,999 | |||||
| General Obligations - Improvement - 2.5% | ||||||
| Birmingham, AL, “A”, 5.75%, 2017 | $ | 1,000,000 | $ | 1,048,590 | ||
| District of Columbia, MBIA, 6.5%, 2010 | 3,095,000 | 3,249,564 | ||||
| District of Columbia, ETM, MBIA, 6.5%, 2010 (c) | 2,905,000 | 3,106,520 | ||||
11
Table of Contents
Portfolio of Investments – continued
| Issuer | Shares/Par | Value ($) | ||||
| Municipal Bonds - continued | ||||||
| General Obligations - Improvement - continued | ||||||
| Massachusetts Bay Transportation Authority, General Transportation Systems, “A”, XLCA, 7%, 2021 | $ | 10,185,000 | $ | 12,679,205 | ||
| Massachusetts Bay Transportation Authority, General Transportation Systems, “C”, XLCA, 6.1%, 2013 | 10,200,000 | 11,473,266 | ||||
| $ | 31,557,145 | |||||
| General Obligations - Schools - 10.0% | ||||||
| Beverly Hills, CA, Unified School District (Election of 2008), 0%, 2031 | $ | 2,010,000 | $ | 538,117 | ||
| Beverly Hills, CA, Unified School District (Election of 2008), 0%, 2032 | 2,035,000 | 507,814 | ||||
| Beverly Hills, CA, Unified School District (Election of 2008), 0%, 2033 | 4,070,000 | 947,944 | ||||
| Chicago, IL, Board of Education, MBIA, 6.25%, 2015 | 20,295,000 | 23,355,689 | ||||
| Clark County, NV, School District, “A”, MBIA, 7%, 2010 | 4,000,000 | 4,257,480 | ||||
| Colorado State Board of Governors, University Enterprise System Rev., “A”, 5%, 2034 | 1,000,000 | 992,910 | ||||
| DeSoto, TX, Independent School District, School Building, PSF, 0%, 2031 | 1,725,000 | 486,485 | ||||
| DeSoto, TX, Independent School District, School Building, PSF, 0%, 2034 | 1,300,000 | 301,847 | ||||
| DeSoto, TX, Independent School District, School Building, PSF, 0%, 2036 | 1,630,000 | 335,519 | ||||
| Ferris, TX, Independent School District, PSF, 5.5%, 2034 (f) | 3,000,000 | 3,055,980 | ||||
| Florida Board of Education, Capital Outlay, 9.125%, 2014 | 1,735,000 | 1,997,939 | ||||
| Florida Board of Education, Capital Outlay, ETM, 9.125%, 2014 (c) | 265,000 | 344,561 | ||||
| Fresno, CA, Unified School District, MBIA, 6.55%, 2020 | 1,225,000 | 1,354,299 | ||||
| Gilroy, CA, Unified School District, FGIC, 5%, 2027 | 1,000,000 | 965,020 | ||||
| Grand Blanc, MI, Community Schools (School Building & Site), FSA, 5%, 2028 | 1,000,000 | 1,014,280 | ||||
| Kane Kendall County, IL, Capital Appreciation, “E”, FGIC, 0%, 2023 | 1,360,000 | 634,889 | ||||
| Kane Kendall County, IL, Capital Appreciation, “E”, FGIC, 0%, 2025 | 1,335,000 | 534,240 | ||||
| Kane, Cook & DuPage Counties, IL, FSA, 6.375%, 2011 (c) | 1,245,000 | 1,361,320 | ||||
| Kane, Cook & DuPage Counties, IL, FSA, 6.5%, 2011 (c) | 1,345,000 | 1,473,569 | ||||
| Knox County, KY, XLCA, 5.5%, 2014 (c) | 640,000 | 750,330 | ||||
| Knox County, KY, XLCA, 5.625%, 2014 (c) | 1,150,000 | 1,355,850 | ||||
| Lancaster, TX, Independent School District, Capital Appreciation, FSA, 0%, 2014 (c) | 2,000,000 | 799,140 | ||||
| Lancaster, TX, Independent School District, Capital Appreciation, FSA, 0%, 2014 (c) | 2,250,000 | 956,093 | ||||
| Lancaster, TX, Independent School District, Capital Appreciation, FSA, 5%, 2034 | 12,000,000 | 11,682,840 | ||||
12
Table of Contents
Portfolio of Investments – continued
| Issuer | Shares/Par | Value ($) | ||||
| Municipal Bonds - continued | ||||||
| General Obligations - Schools - continued | ||||||
| Lane County, OR, School District, 6.25%, 2010 (c) | $ | 1,000,000 | $ | 1,063,070 | ||
| Lane County, OR, School District, 6.25%, 2010 (c) | 1,150,000 | 1,222,531 | ||||
| Leander, TX, Independent School District, PSF, 0%, 2018 | 7,385,000 | 4,147,785 | ||||
| Long Beach, CA, Community College District, Election of 2008, “A”, FSA, 0%, 2028 | 5,025,000 | 1,702,219 | ||||
| Los Angeles, CA, Unified School District, “D”, 5%, 2034 | 1,280,000 | 1,203,802 | ||||
| Oceanside, CA, Unified School District, Capital Appreciation, ASSD GTY, 0%, 2024 | 2,900,000 | 1,212,664 | ||||
| Oceanside, CA, Unified School District, Capital Appreciation, ASSD GTY, 0%, 2027 | 1,930,000 | 639,332 | ||||
| Oceanside, CA, Unified School District, Capital Appreciation, ASSD GTY, 0%, 2029 | 3,915,000 | 1,102,973 | ||||
| Oceanside, CA, Unified School District, Capital Appreciation, ASSD GTY, 0%, 2030 | 4,335,000 | 1,124,022 | ||||
| Phenix City, AL, AMBAC, 5.65%, 2010 (c) | 1,500,000 | 1,627,665 | ||||
| Philadelphia, PA, School District, MBIA, 6%, 2010 (c) | 750,000 | 787,095 | ||||
| Prosper, TX, Independent School District, Capital Appreciation, School Building, PSF, 0%, 2031 | 2,275,000 | 634,657 | ||||
| Roma, TX, Independent School District, PSF, 5.875%, 2010 (c) | 1,705,000 | 1,829,653 | ||||
| San Lorenzo, CA, Unified School District, Alameda County, Election 2004, “B”, FGIC, 4.75%, 2037 | 4,535,000 | 4,100,366 | ||||
| San Marcos, TX, Independent School District, PSF, 5.625%, 2014 (c) | 2,000,000 | 2,354,640 | ||||
| San Marcos, TX, Independent School District, PSF, 5.625%, 2014 (c) | 2,000,000 | 2,354,640 | ||||
| San Mateo County, CA (Community College District, 2005 Election), “A”, MBIA, 0%, 2026 | 5,100,000 | 1,880,013 | ||||
| San Rafael, CA, Elementary School District, Election of 1999, MBIA, 5%, 2028 | 2,500,000 | 2,484,500 | ||||
| Santa Clarita Community College District, CA, Election 2006, MBIA, 0%, 2030 | 1,610,000 | 406,026 | ||||
| Schertz-Cibolo-Universal City, TX, Independent School District, PSF, 5%, 2036 | 15,000,000 | 15,033,300 | ||||
| Scranton, PA, School District, “B”, FSA, 5%, 2038 | 8,370,000 | 8,242,776 | ||||
| Sunnyvale, TX, Independent School District, PSF, 5.25%, 2028 | 1,900,000 | 1,964,068 | ||||
| Sunnyvale, TX, Independent School District, PSF, 5.25%, 2031 | 2,000,000 | 2,043,760 | ||||
| Wattsburg, PA, Public School Building Authority Rev., Capital Appreciation, MBIA, 0%, 2029 | 2,150,000 | 674,025 | ||||
| Williamson County, TN, Rural School, 6.125%, 2010 (c) | 1,765,000 | 1,855,968 | ||||
| Williamson County, TN, Rural School, 6.125%, 2010 (c) | 1,665,000 | 1,750,814 | ||||
| Wylie, TX, Independent School District, PSF, 5.25%, 2029 | 5,035,000 | 5,127,845 | ||||
| $ | 128,574,364 | |||||
13
Table of Contents
Portfolio of Investments – continued
| Issuer | Shares/Par | Value ($) | ||||
| Municipal Bonds - continued | ||||||
| Healthcare Revenue - Hospitals - 23.2% | ||||||
| Allegheny County, PA, Hospital Development Authority Rev. (West Penn Allegheny Health), 9.25%, 2010 (c) | $ | 650,000 | $ | 746,265 | ||
| Allegheny County, PA, Hospital Development Authority Rev. (West Penn Allegheny Health), “A”, 5%, 2028 | 255,000 | 147,431 | ||||
| Allegheny County, PA, Hospital Development Authority Rev. (West Penn Allegheny Health), “A”, 5.375%, 2040 | 3,995,000 | 2,199,487 | ||||
| Allegheny County, PA, Hospital Development Authority Rev. (West Penn Allegheny Health), “B”, 9.25%, 2010 (c) | 350,000 | 401,835 | ||||
| Baxter County, AR, Hospital Rev., 5.375%, 2014 | 2,000,000 | 1,911,740 | ||||
| Baxter County, AR, Hospital Rev., 5.6%, 2021 | 1,750,000 | 1,503,320 | ||||
| Birmingham, AL, Baptist Medical Center, Special Care Facilities Rev. (Baptist Health Systems, Inc.), “A”, 5%, 2030 | 8,525,000 | 5,156,517 | ||||
| Boone County, MO, Hospital Rev., (Boone Hospital Center), 5.375%, 2038 | 770,000 | 623,585 | ||||
| Boone County, MO, Hospital Rev., (Boone Hospital Center), 5.625%, 2038 | 840,000 | 707,792 | ||||
| Brunswick, GA, Hospital Authority Rev. (Glynn-Brunswick Memorial Hospital), 5.625%, 2034 | 1,320,000 | 1,164,979 | ||||
| California Statewide Communities Development Authority Rev. (Catholic Healthcare West) “K”, ASSD GTY, 5.5%, 2041 | 2,275,000 | 1,995,084 | ||||
| California Statewide Communities Development Authority Rev. (Children’s Hospital), 5%, 2047 | 4,090,000 | 2,451,014 | ||||
| California Statewide Communities Development Authority Rev. (Enloe Medical Center), CHCLI, 5.75%, 2038 | 2,640,000 | 2,313,062 | ||||
| California Statewide Communities Development Authority Rev. (St. Joseph Health System), FGIC, 5.75%, 2047 | 2,420,000 | 2,253,988 | ||||
| California Statewide Communities Development Authority Rev. (Valleycare Health Systems), “A”, 5%, 2022 | 195,000 | 139,043 | ||||
| California Statewide Communities Development Authority Rev. (Valleycare Health Systems), “A”, 5.125%, 2031 | 100,000 | 60,951 | ||||
| Chemung County, NY, Civic Facilities Rev. (St. Joseph’s Hospital-Elmira), “A”, 6%, 2013 | 360,000 | 290,369 | ||||
| Colorado Health Facilities Authority Rev. (Portercare Adventist Health Systems), 6.625%, 2011 (c) | 1,750,000 | 2,012,745 | ||||
| Colorado Health Facilities Authority Rev. (Poudre Valley Health Care, Inc.), “B”, FSA, 5.25%, 2036 | 3,050,000 | 2,653,927 | ||||
| Colorado Health Facilities Authority Rev. (Poudre Valley Health Care, Inc.), “C”, FSA, 5.25%, 2040 | 465,000 | 400,802 | ||||
| Cuyahoga County, OH, Hospital Facilities Rev. (Canton, Inc.), 7.5%, 2030 | 900,000 | 804,780 | ||||
| Denver, CO, Health & Hospital Authority Rev., “A”, 6%, 2011 (c) | 500,000 | 559,025 | ||||
14
Table of Contents
Portfolio of Investments – continued
| Issuer | Shares/Par | Value ($) | ||||
| Municipal Bonds - continued | ||||||
| Healthcare Revenue - Hospitals - continued | ||||||
| District of Columbia Hospital Rev. (Children’s Hospital Obligated Group), FSA, 5.25%, 2045 | $ | 2,630,000 | $ | 2,311,586 | ||
| Douglas County, NE, Hospital Authority Rev. (Methodist Health Partners), 5.75%, 2048 | 1,965,000 | 1,615,309 | ||||
| Florence County, SC, Hospital Rev. (McLeod Regional Medical Center), “A”, FSA, 5.25%, 2034 | 5,000,000 | 4,557,050 | ||||
| Glendale, AZ, Industrial Development Authority (John C. Lincoln Health), 5%, 2042 | 2,820,000 | 1,930,826 | ||||
| Gulfport, MS, Hospital Facilities Rev. (Memorial Hospital), 5.75%, 2031 | 1,505,000 | 1,315,806 | ||||
| Harris County, TX, Health Facilities Development Corp., “A” (Texas Children’s Hospital), ETM, 5.375%, 2015 (c) | 4,300,000 | 4,419,669 | ||||
| Harris County, TX, Health Facilities Development Corp. Hospital Rev. (Memorial Hermann Healthcare Systems), 6.375%, 2011 (c) | 2,000,000 | 2,241,440 | ||||
| Harris County, TX, Health Facilities Development Corp., Hospital Rev. (Memorial Hermann Healthcare Systems), “B”, 7%, 2027 | 1,795,000 | 1,870,193 | ||||
| Harris County, TX, Health Facilities Development Corp., Hospital Rev. (Memorial Hermann Healthcare Systems), “B”, 7.25%, 2035 | 2,050,000 | 2,142,332 | ||||
| Henrico County, VA, Industrial Development Authority Rev. (Bon Secours), RIBS, FSA, 10.727%, 2027 (p) | 5,000,000 | 5,218,600 | ||||
| Houston County, GA, Hospital Authority Rev. Anticipation Certificates (Houston Healthcare Project), 5.25%, 2042 | 2,220,000 | 1,733,975 | ||||
| Huntsville, AL, Health Care Authority Rev., 5.625%, 2011 (c) | 2,595,000 | 2,852,139 | ||||
| Illinois Finance Authority Rev. (Children’s Memorial Hospital), “A”, ASSD GTY, 5.25%, 2047 | 3,630,000 | 3,046,441 | ||||
| Illinois Finance Authority Rev. (Edward Hospital), “A”, AMBAC, 5.5%, 2040 | 3,250,000 | 2,607,670 | ||||
| Illinois Finance Authority Rev. (KishHealth Systems Obligated Group), 5.75%, 2028 | 2,990,000 | 2,693,482 | ||||
| Illinois Finance Authority Rev. (O.S.F. Healthcare Systems) “A”, 7%, 2029 | 2,490,000 | 2,473,641 | ||||
| Illinois Finance Authority Rev. (O.S.F. Healthcare Systems) “A”, 7.125%, 2037 | 2,445,000 | 2,434,364 | ||||
| Illinois Finance Authority Rev. (Silver Cross Hospital), “A”, 5.5%, 2030 | 2,500,000 | 2,052,125 | ||||
| Illinois Health Facilities Authority Rev. (Advocate Health Care Network), 6.375%, 2010 (c) | 1,800,000 | 1,956,276 | ||||
| Illinois Health Facilities Authority Rev. (Condell Medical Center), 6.35%, 2010 (c) | 7,500,000 | 8,027,325 | ||||
| Illinois Health Facilities Authority Rev. (Decatur Memorial Hospital), 5.75%, 2024 | 3,000,000 | 2,784,840 | ||||
| Illinois Health Facilities Authority Rev. (Passavant Memorial Area Hospital Associates), 6%, 2010 (c) | 1,500,000 | 1,629,285 | ||||
15
Table of Contents
Portfolio of Investments – continued
| Issuer | Shares/Par | Value ($) | ||||
| Municipal Bonds - continued | ||||||
| Healthcare Revenue - Hospitals - continued | ||||||
| Illinois Health Facilities Authority Rev. (Riverside Health Systems), 5.75%, 2012 (c) | $ | 2,625,000 | $ | 2,999,299 | ||
| Indiana Finance Authority Rev. (Sisters of St. Francis Health Services), 5.375%, 2032 | 1,765,000 | 1,637,214 | ||||
| Indiana Finance Authority, Hospital Rev. (Deaconess Hospital, Inc.), “A”, 6.75%, 2039 | 3,000,000 | 2,958,930 | ||||
| Indiana Health & Educational Facilities Authority, Hospital Rev. (Community Foundation of Northwest Indiana), 5.5%, 2037 | 6,215,000 | 4,643,102 | ||||
| Indiana Health & Educational Facilities Authority, Hospital Rev. (Community Foundation of Northwest Indiana), “A”, 6.375%, 2011 (c) | 380,000 | 423,928 | ||||
| Indiana Health & Educational Facilities Authority, Hospital Rev. (Community Foundation of Northwest Indiana), “A”, 6.375%, 2011 (c) | 185,000 | 206,386 | ||||
| Indiana Health & Educational Facilities Authority, Hospital Rev. (Community Foundation of Northwest Indiana), “A”, 6.375%, 2021 | 1,515,000 | 1,431,493 | ||||
| Indiana Health & Educational Facilities Authority, Hospital Rev. (Community Foundation of Northwest Indiana), “A”, 6.375%, 2031 | 120,000 | 103,270 | ||||
| Indiana Health & Educational Facilities Authority, Hospital Rev. (Deaconess Hospital), “A”, AMBAC, 5.375%, 2034 | 2,640,000 | 2,176,786 | ||||
| Indiana Health & Educational Facilities Authority, Hospital Rev. (Riverview Hospital), 5.25%, 2014 | 400,000 | 371,452 | ||||
| Indiana Health & Educational Facilities Authority, Hospital Rev. (Riverview Hospital), 6.125%, 2031 | 250,000 | 205,328 | ||||
| Indiana Health & Educational Facilities Finance Authority, Hospital Rev. (Clarian Health), “A”, 5%, 2039 | 1,610,000 | 1,166,670 | ||||
| Indiana Health & Educational Facilities Financing Authority Rev. (Sisters of St. Francis Health Services, Inc.), “E”, FSA, 5.25%, 2041 | 3,655,000 | 3,330,911 | ||||
| Iowa Finance Authority, Health Care Facilities Rev. (Genesis Medical Center), 6.125%, 2016 | 2,195,000 | 2,228,737 | ||||
| Jacksonville, FL, Health Facilities Rev. (Brooks Health Systems), 5.25%, 2038 | 630,000 | 489,031 | ||||
| Johnson City, TN, Health & Educational Facilities Board Hospital Rev. (Mountain States Health), “A”, 5.5%, 2036 | 3,180,000 | 2,347,253 | ||||
| Kentucky Economic Development Finance Authority (Norton Healthcare), “A”, 6.5%, 2010 (c) | 2,355,000 | 2,564,289 | ||||
| Kentucky Economic Development Finance Authority (Norton Healthcare), “A”, 6.625%, 2010 (c) | 195,000 | 212,690 | ||||
| Kentucky Economic Development Finance Authority (Norton Healthcare), “A”, 6.5%, 2020 | 3,645,000 | 3,649,957 | ||||
| Kentucky Economic Development Finance Authority (Norton Healthcare), “A”, 6.625%, 2028 | 55,000 | 52,487 | ||||
16
Table of Contents
Portfolio of Investments – continued
| Issuer | Shares/Par | Value ($) | ||||
| Municipal Bonds - continued | ||||||
| Healthcare Revenue - Hospitals - continued | ||||||
| Kentucky Economic Development Finance Authority, Hospital Facilities Rev. (Baptist Healthcare System), “A”, 5.375%, 2024 | $ | 2,305,000 | $ | 2,342,410 | ||
| Kentucky Economic Development Finance Authority, Hospital Facilities Rev. (Baptist Healthcare System), “A”, 5.625%, 2027 | 770,000 | 771,440 | ||||
| Knox County, TN, Health, Educational, Hospital & Housing Facilities Board Rev. (Baptist Health Systems, East Tennessee), 6.375%, 2022 | 1,000,000 | 1,011,450 | ||||
| Knox County, TN, Health, Educational, Hospital & Housing Facilities Board Rev. (Covenant Health), “A”, 0%, 2035 | 3,205,000 | 400,689 | ||||
| Knox County, TN, Health, Educational, Hospital & Housing Facilities Board Rev. (Covenant Health), “A”, 0%, 2036 | 2,010,000 | 232,115 | ||||
| Knox County, TN, Health, Educational, Hospital & Housing Facilities Board Rev. (University Health Systems, Inc.), 5.25%, 2036 | 2,670,000 | 1,976,307 | ||||
| Lake County, OH, Hospital Facilities Rev. (Lake Hospital), “C”, 6%, 2043 | 1,865,000 | 1,534,224 | ||||
| Lauderdale County & Florence, AL (Coffee Health Group), “A”, MBIA, 5.25%, 2019 | 950,000 | 875,473 | ||||
| Louisiana Public Facilities Authority Hospital Rev. (Lake Charles Memorial Hospital), 6.375%, 2034 | 2,620,000 | 1,953,786 | ||||
| Louisville & Jefferson County, KY, Metro Government Health Facilities Rev. (Jewish Hospital & St. Mary’s Healthcare), 6.125%, 2037 | 2,290,000 | 2,262,909 | ||||
| Louisville & Jefferson County, KY, Metropolitan Government Healthcare Systems Rev. (Norton Healthcare, Inc.), 5.25%, 2036 | 6,405,000 | 4,949,912 | ||||
| Lufkin, TX, Health Facilities Development Corp. Rev. (Memorial Health System), 5.5%, 2032 | 295,000 | 205,695 | ||||
| Lufkin, TX, Health Facilities Development Corp. Rev. (Memorial Health System), 5.5%, 2037 | 310,000 | 209,390 | ||||
| Macomb County, MI, Hospital Finance Authority Rev. (Mount Clemens General Hospital), 5.75%, 2013 (c) | 1,000,000 | 1,169,380 | ||||
| Marshall County, AL, Health Care Authority Rev., “A”, 5.75%, 2015 | 1,000,000 | 1,021,470 | ||||
| Marshall County, AL, Health Care Authority Rev., “A”, 6.25%, 2022 | 500,000 | 501,260 | ||||
| Martin County, FL, Health Facilities Authority Rev. (Martin Memorial Medical Center), “A”, 5.75%, 2012 (c) | 850,000 | 967,929 | ||||
| Martin County, FL, Health Facilities Authority Rev. (Martin Memorial Medical Center), “B”, 5.875%, 2012 (c) | 2,200,000 | 2,514,754 | ||||
| Maryland Health & Higher Educational Facilities Authority Rev. (Anne Arundel Health System), “A”, 6.75%, 2039 | 1,510,000 | 1,539,974 | ||||
| Maryland Health & Higher Educational Facilities Authority Rev. (Medstar Health), 5.5%, 2033 | 1,420,000 | 1,251,886 | ||||
| Maryland Health & Higher Educational Facilities Authority Rev. (Medstar Health), 5.25%, 2046 | 2,250,000 | 1,796,400 | ||||
| Maryland Health & Higher Educational Facilities Authority Rev. (Medstar Health), BHAC, 5.25%, 2046 | 2,000,000 | 1,948,880 | ||||
17
Table of Contents
Portfolio of Investments – continued
| Issuer | Shares/Par | Value ($) | ||||
| Municipal Bonds - continued | ||||||
| Healthcare Revenue - Hospitals - continued | ||||||
| Maryland Health & Higher Educational Facilities Authority Rev. (Mercy Medical Center), “A”, 5.5%, 2042 | $ | 1,950,000 | $ | 1,519,206 | ||
| Maryland Health & Higher Educational Facilities Authority Rev. (University of Maryland Medical System), 6.75%, 2010 (c) | 2,000,000 | 2,168,140 | ||||
| Maryland Health & Higher Educational Facilities Authority Rev. (Washington County Hospital), 6%, 2043 | 615,000 | 485,512 | ||||
| Massachusetts Health & Educational Facilities Authority Rev. (Boston Medical Center), 5.25%, 2038 | 2,890,000 | 2,175,563 | ||||
| Massachusetts Health & Educational Facilities Authority Rev. (Caritas Christi), “A”, 5.7%, 2015 | 3,550,000 | 3,360,466 | ||||
| Massachusetts Health & Educational Facilities Authority Rev. (Partners Healthcare Systems), “C”, 5.75%, 2021 | 1,900,000 | 1,947,177 | ||||
| Massachusetts Health & Educational Facilities Authority Rev. (Quincy Medical Center), “A”, 6.5%, 2038 | 1,130,000 | 763,451 | ||||
| Mecosta County, MI, General Hospital Rev., 6%, 2018 | 300,000 | 262,887 | ||||
| Miami Beach, FL, Health Facilities Authority Rev. (Mount Sinai Medical Center), “A”, 6.7%, 2019 | 750,000 | 570,825 | ||||
| Michigan Hospital Finance Authority Rev. (Crittenton) “A”, 5.625%, 2027 | 900,000 | 813,933 | ||||
| Michigan Hospital Finance Authority Rev. (Memorial Healthcare Center), 5.75%, 2015 | 800,000 | 766,840 | ||||
| Monroe County, MI, Hospital Finance Authority, Hospital Rev. (Mercy Memorial Hospital Corp.), 5.5%, 2035 | 2,995,000 | 1,908,714 | ||||
| Monroe County, PA, Hospital Authority Rev. (Pocono Medical Center), 6%, 2014 (c) | 750,000 | 879,923 | ||||
| Montgomery, AL, Medical Clinic Board Health Care Facility Rev. (Jackson Hospital & Clinic), 5.25%, 2031 | 585,000 | 416,649 | ||||
| Mount Lebanon, PA, Hospital Authority Rev. (St. Clair Memorial Hospital), 5.625%, 2032 | 1,710,000 | 1,456,458 | ||||
| Nassau County, NY, Industrial Development Agency, Civic Facilities Rev. (North Shore Health System), 5.875%, 2011 | 180,000 | 186,845 | ||||
| New Hampshire Health & Education Facilities Authority Rev. (Covenant Health System), 6.5%, 2012 (c) | 445,000 | 506,014 | ||||
| New Hampshire Health & Education Facilities Authority Rev. (Covenant Health System), 6.5%, 2017 | 265,000 | 275,428 | ||||
| New Hampshire Health & Education Facilities Authority Rev. (Exeter Hospital), 6%, 2016 | 1,000,000 | 1,028,700 | ||||
| New Hampshire Health & Education Facilities Authority Rev. (Exeter Hospital), 6%, 2024 | 500,000 | 501,165 | ||||
| New Jersey Health Care Facilities Financing Authority Rev. (St. Joseph’s Healthcare System), 6.625%, 2038 | 3,000,000 | 2,220,270 | ||||
| New Jersey Health Care Facilities, Financing Authority Rev. (Palisades Medical Center), 6.5%, 2021 | 500,000 | 427,095 | ||||
18
Table of Contents
Portfolio of Investments – continued
| Issuer | Shares/Par | Value ($) | ||||
| Municipal Bonds - continued | ||||||
| Healthcare Revenue - Hospitals - continued | ||||||
| New Jersey Health Care Facilities, Financing Authority Rev. (St. Barnabas Health) Capital Appreciation, “B”, 0%, 2036 | $ | 4,695,000 | $ | 341,937 | ||
| New Jersey Health Care Facilities, Financing Authority Rev. (St. Barnabas Health) Capital Appreciation, “B”, 0%, 2038 | 18,145,000 | 1,084,345 | ||||
| New Jersey Health Care Facilities, Financing Authority Rev. (St. Peter’s University Hospital), 5.75%, 2037 | 2,830,000 | 2,118,000 | ||||
| New York Dormitory Authority Rev., Non-State Supported Debt (Bronx-Lebanon Hospital Center), LOC, 6.5%, 2030 | 1,475,000 | 1,504,972 | ||||
| New York Dormitory Authority Rev., Non-State Supported Debt (Bronx-Lebanon Hospital Center), LOC, 6.25%, 2035 | 915,000 | 915,576 | ||||
| Norman, OK, Regional Hospital Authority Rev., 5.375%, 2029 | 940,000 | 642,490 | ||||
| North Texas Health Facilities Development Corp. Rev. (United Regional Health Care System, Inc.), 6%, 2013 (c) | 5,000,000 | 5,817,350 | ||||
| Northampton County, PA, General Purpose Authority Hospital Rev. (St. Luke’s Hospital), “A”, 5.5%, 2035 | 740,000 | 607,969 | ||||
| Northampton County, PA, General Purpose Authority Hospital Rev. (St. Luke’s Hospital), “A”, 5.5%, 2040 | 810,000 | 652,965 | ||||
| Ohio County, WV, County Commission Health System Rev. (Ohio Valley Medical Center), 5.75%, 2013 | 745,000 | 692,247 | ||||
| Ohio State Higher Educational Facility Commission Rev. (University Hospital Health System), 6.75%, 2039 | 6,000,000 | 5,925,600 | ||||
| Oklahoma Development Finance Authority Rev. (Comanche County Hospital), “B”, 6.6%, 2031 | 255,000 | 205,831 | ||||
| Orange County, FL, Health Facilities Authority Hospital Rev. (Adventist Health Systems), 5.625%, 2012 (c) | 1,490,000 | 1,701,491 | ||||
| Orange County, FL, Health Facilities Authority Hospital Rev. (Orlando Regional Healthcare), 5.75%, 2012 (c) | 2,230,000 | 2,573,242 | ||||
| Peninsula Ports Authority, VA, Hospital Facility Rev. (Whittaker Memorial), FHA, 8.7%, 2023 | 1,475,000 | 1,542,408 | ||||
| Philadelphia, PA, Hospitals & Higher Education Facilities Authority Rev. (Temple University Hospital), “A”, 5.5%, 2030 | 2,710,000 | 1,947,352 | ||||
| Philadelphia, PA, Hospitals & Higher Educational Facilities Rev. (Temple University), “A”, 6.625%, 2023 | 2,665,000 | 2,352,182 | ||||
| Reno, NV, Hospital Rev. (Washoe Medical Center) “N”, FSA, 5.5%, 2039 | 2,000,000 | 1,670,560 | ||||
| Rhode Island Health & Educational Building Corp. Rev. (Rhode Island Hospital Foundation), “A”, ASSD GTY, 7%, 2039 | 7,645,000 | 8,045,980 | ||||
| Rhode Island Health & Educational Building Corp., Hospital Financing (Lifespan Obligated Group), 6.375%, 2012 (c) | 1,730,000 | 1,960,678 | ||||
| Rhode Island Health & Educational Building Corp., Hospital Financing (Lifespan Obligated Group), 6.5%, 2012 (c) | 1,500,000 | 1,738,860 | ||||
| Richland County, OH, Hospital Facilities Rev. (Medcentral Health), “B”, 6.375%, 2010 (c) | 665,000 | 729,279 | ||||
19
Table of Contents
Portfolio of Investments – continued
| Issuer | Shares/Par | Value ($) | ||||
| Municipal Bonds - continued | ||||||
| Healthcare Revenue - Hospitals - continued | ||||||
| Richland County, OH, Hospital Facilities Rev. (Medcentral Health), “B”, 6.375%, 2022 | $ | 335,000 | $ | 338,136 | ||
| Richmond, IN, Hospital Authority Rev. (Reid Hospital & Health Center Services) “A”, 6.625%, 2039 | 4,715,000 | 4,539,885 | ||||
| Royal Oak, MI, Hospital Finance Authority Rev. (William Beaumont Hospital), 8.25%, 2039 | 2,325,000 | 2,478,125 | ||||
| Royston, GA, Hospital Authority Rev. (Ty Cobb Healthcare Systems, Inc.), 6.7%, 2016 | 770,000 | 716,031 | ||||
| Royston, GA, Hospital Authority Rev. (Ty Cobb Healthcare Systems, Inc.), 6.5%, 2027 | 290,000 | 228,152 | ||||
| Scioto County, OH, Hospital Facilities Rev. (Southern Ohio Medical Center), 5.625%, 2031 | 1,095,000 | 963,009 | ||||
| Scioto County, OH, Hospital Facilities Rev. (Southern Ohio Medical Center), 5.75%, 2038 | 4,195,000 | 3,649,063 | ||||
| Shelby County, TN, Educational & Hospital Facilities Board Hospital Rev. (Methodist Healthcare), 6.375%, 2012 (c) | 1,255,000 | 1,445,459 | ||||
| Shelby County, TN, Educational & Housing Facilities Board Hospital Rev. (Methodist Healthcare), 6%, 2012 (c) | 500,000 | 569,700 | ||||
| Shelby County, TN, Educational & Housing Facilities Board Hospital Rev. (Methodist Healthcare), 6%, 2012 (c) | 300,000 | 341,820 | ||||
| Shelby County, TN, Educational & Housing Facilities Board Hospital Rev. (Methodist Healthcare), 6.375%, 2012 (c) | 745,000 | 858,061 | ||||
| Skagit County, WA, Public Hospital District No. 001 Rev. (Skagit Valley Hospital), 5.75%, 2032 | 4,925,000 | 3,701,384 | ||||
| Skagit County, WA, Public Hospital District No. 001 Rev. (Skagit Valley Hospital), 5.625%, 2025 | 1,000,000 | 802,140 | ||||
| South Carolina Jobs & Economic Development Authority (Bon Secours - St. Francis Medical Center, Inc.), 5.625%, 2012 (c) | 430,000 | 491,881 | ||||
| South Carolina Jobs & Economic Development Authority (Bon Secours - St. Francis Medical Center, Inc.), 5.625%, 2030 | 1,625,000 | 1,414,514 | ||||
| South Carolina Jobs & Economic Development Authority, Hospital Facilities Rev. (Palmetto Health Alliance), 6.25%, 2031 | 500,000 | 434,155 | ||||
| Southwestern, IL, Development Authority Rev. (Anderson Hospital), 5.125%, 2036 | 645,000 | 447,172 | ||||
| St. Paul, MN, Housing & Redevelopment Hospital (Healthpartners Obligations Group), 5.25%, 2036 | 4,385,000 | 3,337,774 | ||||
| Steubenville, OH, Hospital Rev. (Trinity Hospital), 6.375%, 2010 (c) | 1,500,000 | 1,623,975 | ||||
| Suffolk County, NY, Industrial Development Agency, Civic Facilities Rev. (Huntington Hospital), “C”, 5.875%, 2032 | 1,000,000 | 854,630 | ||||
| Sullivan County, TN, Health, Educational & Housing Facilities Board Hospital Rev. (Wellmont Health Systems Project), “C”, 5.25%, 2026 | 3,135,000 | 1,965,457 | ||||
| Sullivan County, TN, Health, Educational & Housing Facilities Board Hospital Rev. (Wellmont Health Systems Project), “C”, 5.25%, 2036 | 960,000 | 530,957 | ||||
20
Table of Contents
Portfolio of Investments – continued
| Issuer | Shares/Par | Value ($) | ||||
| Municipal Bonds - continued | ||||||
| Healthcare Revenue - Hospitals - continued | ||||||
| Sumner County, TN, Health, Educational & Housing Facilities Board Rev. (Sumner Regional Health), “A”, 5.5%, 2046 | $ | 2,000,000 | $ | 964,980 | ||
| Tallahassee, FL, Health Facilities Rev. (Tallahassee Memorial Healthcare), 6.25%, 2020 | 3,000,000 | 2,685,750 | ||||
| Tarrant County, TX, Cultural Education Facilities Finance Corp. (Scott & White Memorial Hospital), “A”, 5.5%, 2031 | 685,000 | 642,455 | ||||
| Tom Green County, TX, Health Facilities Rev. (Shannon Health System), 6.75%, 2021 | 400,000 | 362,476 | ||||
| Tyler, TX, Health Facilities Development Corp. (East Texas Medical Center), “A”, 5.25%, 2032 | 1,715,000 | 1,185,288 | ||||
| Tyler, TX, Health Facilities Development Corp. (East Texas Medical Center), “A”, 5.375%, 2037 | 1,410,000 | 962,762 | ||||
| Upper Illinois River Valley Development, Health Facilities Rev. (Morris Hospital), 6.625%, 2031 | 500,000 | 436,480 | ||||
| Vigo County, IN, Hospital Authority Rev. (Union Hospital), 5.8%, 2047 | 2,715,000 | 1,709,174 | ||||
| Wapello County, IA, Hospital Authority Rev. (Ottumwa Regional Health Center), 6.375%, 2012 (c) | 750,000 | 866,535 | ||||
| Washington Health Care Facilities Authority Rev. (Highline Medical Center), FHA, 6.25%, 2036 | 5,305,000 | 5,311,843 | ||||
| Washington Health Care Facilities Authority Rev. (Mason Medical), “A”, 6.25%, 2042 | 3,955,000 | 3,067,538 | ||||
| Weirton, WV, Municipal Hospital Building, Commission Rev. (Weirton Hospital Medical Center), 6.375%, 2031 | 500,000 | 414,185 | ||||
| West Plains, MO, Industrial Development Authority Rev. (Ozarks Medical Center), 6.75%, 2024 | 195,000 | 161,959 | ||||
| West Shore, PA, Hospital Authority Rev. (Holy Spirit Hospital), 6.2%, 2026 | 1,250,000 | 1,049,238 | ||||
| West Shore, PA, Hospital Authority Rev. (Holy Spirit Hospital), 6.25%, 2032 | 1,000,000 | 802,870 | ||||
| West Virginia Hospital Finance Authority, Hospital Rev. (Thomas Health System), 6.5%, 2038 | 1,990,000 | 1,450,173 | ||||
| Wichita, KS, Hospital Authority Rev. (Via Christi Health System), 6.25%, 2019 | 3,095,000 | 3,193,483 | ||||
| Wichita, KS, Hospital Authority Rev. (Via Christi Health System), 6.25%, 2020 | 2,465,000 | 2,548,317 | ||||
| Wisconsin Health & Educational Facilities Authority Rev. (Agnesian Healthcare, Inc.), 6%, 2017 | 845,000 | 854,785 | ||||
| Wisconsin Health & Educational Facilities Authority Rev. (Agnesian Healthcare, Inc.), 6%, 2021 | 650,000 | 649,370 | ||||
| Wisconsin Health & Educational Facilities Authority Rev. (Aurora Health Care, Inc.), 6.875%, 2030 | 2,750,000 | 2,510,063 | ||||
21
Table of Contents
Portfolio of Investments – continued
| Issuer | Shares/Par | Value ($) | ||||
| Municipal Bonds - continued | ||||||
| Healthcare Revenue - Hospitals - continued | ||||||
| Wisconsin Health & Educational Facilities Authority Rev. (Wheaton Franciscan Healthcare), 5.25%, 2031 | $ | 3,165,000 | $ | 2,025,663 | ||
| Wisconsin Health & Educational Facilities Authority Rev. (Wheaton Franciscan Healthcare), 5.25%, 2034 | 1,360,000 | 849,266 | ||||
| Wisconsin Health & Educational Facilities Authority Rev. (Wheaton Franciscan Services), 5.75%, 2012 (c) | 3,000,000 | 3,406,050 | ||||
| Wisconsin Health & Educational Facilities Authority Rev. (Wheaton Franciscan Services), 6.25%, 2012 (c) | 1,000,000 | 1,149,380 | ||||
| Yonkers, NY, Industrial Development Agency, Civic Facilities Rev. (St. John’s Riverside Hospital), 6.8%, 2016 | 325,000 | 279,113 | ||||
| $ | 297,732,312 | |||||
| Healthcare Revenue - Long Term Care - 0.4% | ||||||
| Bell County, TX, Health Facility Development Corp. (Advanced Living Technologies, Inc.), 4% to 2009, FRN to 2036 | $ | 1,635,000 | $ | 1,069,339 | ||
| Bucks County, PA, Industrial Development Authority Retirement Community Rev. (Ann’s Choice, Inc.), “A”, 6.25%, 2035 | 1,120,000 | 757,053 | ||||
| Colorado Health Facilities Authority Rev. (Evangelical), 6.9%, 2010 (c) | 305,000 | 340,295 | ||||
| Colorado Health Facilities Authority Rev. (Evangelical), 6.9%, 2025 | 195,000 | 195,162 | ||||
| Cumberland County, PA, Municipal Authority, Retirement Community Rev. (Wesley), “A”, 7.25%, 2013 (c) | 270,000 | 321,764 | ||||
| Cumberland County, PA, Municipal Authority, Retirement Community Rev. (Wesley), “A”, 7.25%, 2013 (c) | 105,000 | 125,131 | ||||
| Indiana Health Facilities Financing Authority Rev. (Hoosier Care, Inc.), 7.125%, 2034 | 775,000 | 561,929 | ||||
| Iowa Finance Authority, Health Care Facilities Rev. (Care Initiatives), 9.25%, 2011 (c) | 455,000 | 541,910 | ||||
| Iowa Finance Authority, Health Care Facilities Rev. (Care Initiatives), “A”, 5.5%, 2025 | 1,205,000 | 842,006 | ||||
| Millbrae, CA, Residential Facilities Rev. (Magnolia of Millbrae), “A”, 7.375%, 2027 | 835,000 | 708,681 | ||||
| Shelby County, TN, Health, Educational & Housing Facilities Board Rev. (Germantown Village), “A”, 7.25%, 2034 | 385,000 | 289,381 | ||||
| $ | 5,752,651 | |||||
| Human Services - 0.1% | ||||||
| Louisiana Local Government, Environmental Facilities & Community Development Authority Rev. (Westside Rehab Center Project), “B”, 6.5%, 2013 | $ | 120,000 | $ | 118,956 | ||
| Nassau County, NY, Industrial Development Civic (Special Needs Facilities), 6.1%, 2012 | 125,000 | 116,569 | ||||
| Orange County, FL, Health Facilities Authority Rev. (GF/Orlando Healthcare Facilities), 9%, 2031 | 1,000,000 | 921,090 | ||||
| $ | 1,156,615 | |||||
22
Table of Contents
Portfolio of Investments – continued
| Issuer | Shares/Par | Value ($) | ||||
| Municipal Bonds - continued | ||||||
| Industrial Revenue - Airlines - 0.4% | ||||||
| Chicago, IL, O’Hare International Airport Special Facilities Rev. (American Airlines, Inc.), 5.5%, 2030 | $ | 740,000 | $ | 302,238 | ||
| Dallas Fort Worth, TX, International Airport Facility Improvement Corp. (American Airlines, Inc.), 5.5%, 2030 | 740,000 | 280,208 | ||||
| Denver, CO, City & County Airport Rev. (United Airlines), 5.25%, 2032 | 720,000 | 323,237 | ||||
| Denver, CO, City & County Airport Rev. (United Airlines), 5.75%, 2032 | 615,000 | 275,514 | ||||
| Los Angeles, CA, Regional Airport Lease Rev. (American Airlines, Inc.), “C”, 7%, 2012 | 300,000 | 255,126 | ||||
| New Jersey Economic Development Authority, Special Facilities Rev. (Continental Airlines, Inc.), 6.25%, 2029 | 1,500,000 | 903,510 | ||||
| New York, NY, City Industrial Development Agencies Rev. (American Airlines, Inc.), 7.625%, 2025 | 1,970,000 | 1,439,893 | ||||
| New York, NY, City Industrial Development Agencies Rev. (American Airlines, Inc.), 7.75%, 2031 | 2,000,000 | 1,430,100 | ||||
| $ | 5,209,826 | |||||
| Industrial Revenue - Chemicals – 0.5% | ||||||
| Brazos River, TX, Harbor Navigation District (Dow Chemical Co.), 5.7%, 2033 (b) | $ | 4,500,000 | $ | 4,308,075 | ||
| Brazos River, TX, Harbor Navigation District (Dow Chemical Co.), “B-2”, 4.95%, 2033 | 885,000 | 566,232 | ||||
| Louisiana, Environmental Facilities & Community Development Authority Rev. (Westlake Chemical), 6.75%, 2032 | 900,000 | 581,589 | ||||
| Red River Authority, TX, Pollution Control Rev. (Celanese Project) “B”, 6.7%, 2030 | 1,000,000 | 570,240 | ||||
| $ | 6,026,136 | |||||
| Industrial Revenue - Environmental Services - 0.9% | ||||||
| California Pollution Control Financing Authority, Solid Waste Disposal Rev. (Waste Management, Inc.), “A-2”, 5.4%, 2025 | $ | 1,750,000 | $ | 1,343,440 | ||
| California Pollution Control Financing Authority, Solid Waste Disposal Rev. (Waste Management, Inc.), “C”, 5.125%, 2023 | 1,665,000 | 1,273,842 | ||||
| California Pollution Control Financing Authority, Solid Waste Disposal Rev., “B”, 5.25%, 2023 (b) | 1,200,000 | 1,053,120 | ||||
| Carbon County, UT, Solid Waste Disposal Rev. (Laidlaw Environmental), “A”, 7.45%, 2017 | 2,500,000 | 2,455,375 | ||||
| Charles City County, VA, Industrial Development Authority, Solid Waste Disposal Facility Rev. (Waste Management, Inc.), 6.25%, 2027 (b) | 500,000 | 501,885 | ||||
| Colorado Housing & Finance Authority, Solid Waste Rev. (Waste Management, Inc.), 5.7%, 2018 | 1,960,000 | 1,807,257 | ||||
23
Table of Contents
Portfolio of Investments – continued
| Issuer | Shares/Par | Value ($) | ||||
| Municipal Bonds - continued | ||||||
| Industrial Revenue - Environmental Services - continued | ||||||
| Director of the State of Nevada Department of Business & Industry Rev. (Republic Services, Inc.), 5.625%, 2026 (b) | $ | 1,950,000 | $ | 1,737,938 | ||
| Gloucester County, NJ, Solid Waste Resource Recovery Rev. (Waste Management, Inc.), 6.85%, 2029 (b) | 150,000 | 152,072 | ||||
| Gulf Coast Waste Disposal Authority (Waste Management, Inc.), 5.2%, 2028 | 300,000 | 230,313 | ||||
| Mission, TX, Economic Development Corp., Solid Waste Disposal Rev. (Allied Waste N.A., Inc.), “A”, 5.2%, 2018 | 1,250,000 | 1,081,325 | ||||
| New Hampshire Business Finance Authority, Solid Waste Disposal Rev. (Waste Management, Inc.), 5.2%, 2027 | 665,000 | 509,483 | ||||
| $ | 12,146,050 | |||||
| Industrial Revenue - Metals - 0.0% | ||||||
| Burns Harbor, IN, Solid Waste Disposal Facilities Rev. (Bethlehem Steel), 8%, 2024 (d) | $ | 3,000,000 | $ | 300 | ||
| Industrial Revenue - Other - 2.0% | ||||||
| California Statewide Communities Development Authority Facilities (Microgy Holdings Project), 9%, 2038 | $ | 1,000,000 | $ | 838,920 | ||
| Gulf Coast, TX, Industrial Development Authority Rev. (Microgy Holdings LLC Project), 7%, 2036 | 320,000 | 128,006 | ||||
| Gulf Coast, TX, Industrial Development Authority Rev. (Valero Energy Corp.), 5.6%, 2031 | 500,000 | 364,240 | ||||
| Hardeman County, TN, Correctional Facilities Corp. (Corrections Corp. of America), 7.375%, 2017 | 500,000 | 469,650 | ||||
| Liberty, NY, Development Corp. Rev. (Goldman Sachs Headquarters), 5.25%, 2035 | 4,360,000 | 3,628,741 | ||||
| Massachusetts Development Finance Agency Rev., Resource Recovery (Fluor Corp.), 5.625%, 2019 | 11,545,000 | 11,671,418 | ||||
| Massachusetts Industrial Finance Agency Rev. (Welch Foods, Inc.), 5.6%, 2017 | 1,300,000 | 1,307,280 | ||||
| Park Creek Metropolitan District, CO, Rev. (Custodial Receipts), “CR-2”, 7.875%, 2032 (b)(n) | 400,000 | 359,136 | ||||
| Pennsylvania Economic Development Financing Authority Rev. (Amtrak), 6.125%, 2021 | 550,000 | 465,251 | ||||
| Port Corpus Christi, TX, Nueces County General Rev. (Union Pacific Corp.), 5.35%, 2010 | 670,000 | 670,281 | ||||
| St. John the Baptist Parish, LA (Marathon Oil Corp.), “A”, 5.125%, 2037 | 2,000,000 | 1,408,880 | ||||
| Tooele County, UT, Hazardous Waste Treatment Rev. (Union Pacific Corp.), 5.7%, 2026 | 4,620,000 | 3,936,009 | ||||
| $ | 25,247,812 | |||||
24
Table of Contents
Portfolio of Investments – continued
| Issuer | Shares/Par | Value ($) | ||||
| Municipal Bonds - continued | ||||||
| Industrial Revenue - Paper - 0.8% | ||||||
| Butler, AL, Industrial Development Board, Solid Waste Disposal Rev. (Georgia Pacific Corp.), 5.75%, 2028 | $ | 1,760,000 | $ | 951,579 | ||
| Delta County, MI, Economic Development Corp., Environmental Improvement Rev. (Mead Westvaco Escanaba), “A”, 6.25%, 2012 (c) | 2,400,000 | 2,716,152 | ||||
| Georgetown County, SC, Environmental Improvement Rev. (International Paper Co.), 5.7%, 2014 | 1,400,000 | 1,257,074 | ||||
| Hodge, LA, Utility Rev. (Stone Container Corp.), 7.45%, 2024 (d) | 2,180,000 | 234,350 | ||||
| Jay, ME, Solid Waste Disposal Rev., (International Paper Co.) “A”, 5.125%, 2018 | 1,500,000 | 1,051,260 | ||||
| Mobile, AL, Industrial Development Board Improvement Rev. (International Paper Co.) “B”, 6.45%, 2019 | 2,000,000 | 1,547,160 | ||||
| Rockdale County, GA, Development Authority Project Rev. (Visy Paper Project), “A”, 6.125%, 2034 | 2,055,000 | 1,291,033 | ||||
| Sabine River Authority Rev., Louisiana Water Facilities (International Paper Co.), 6.2%, 2025 | 1,250,000 | 934,363 | ||||
| West Point, VA, Industrial Development Authority, Solid Waste Disposal Rev. (Chesapeake Corp.), “A”, 6.375%, 2019 (d) | 550,000 | 5,500 | ||||
| $ | 9,988,471 | |||||
| Miscellaneous Revenue - Entertainment & Tourism - 0.2% | ||||||
| New York Liberty Development Corp. Rev. (National Sports Museum), “A”, 6.125%, 2019 (d) | $ | 233,199 | $ | 933 | ||
| New York, NY, City Industrial Development Agency Rev. (Queens Baseball Stadium), ASSD GTY, 6.125%, 2029 | 585,000 | 624,517 | ||||
| New York, NY, City Industrial Development Agency Rev. (Queens Baseball Stadium), ASSD GTY, 6.375%, 2039 | 440,000 | 468,015 | ||||
| New York, NY, City Industrial Development Agency Rev. (Queens Baseball Stadium), ASSD GTY, 6.5%, 2046 | 1,750,000 | 1,864,153 | ||||
| Seneca Nation Indians, NY, Capital Improvements Authority, Special Obligation, 5%, 2023 (n) | 185,000 | 118,644 | ||||
| $ | 3,076,262 | |||||
| Miscellaneous Revenue - Other - 0.9% | ||||||
| Austin, TX, Convention Center (Convention Enterprises, Inc.), “A”, 6.6%, 2011 (c) | $ | 300,000 | $ | 328,644 | ||
| Austin, TX, Convention Center (Convention Enterprises, Inc.), “A”, 6.7%, 2011 (c) | 400,000 | 438,884 | ||||
| Austin, TX, Convention Center (Convention Enterprises, Inc.), “A”, XLCA, 5.25%, 2019 | 1,375,000 | 1,119,828 | ||||
| Austin, TX, Convention Center (Convention Enterprises, Inc.), “A”, XLCA, 5.25%, 2020 | 1,120,000 | 885,483 | ||||
25
Table of Contents
Portfolio of Investments – continued
| Issuer | Shares/Par | Value ($) | ||||
| Municipal Bonds - continued | ||||||
| Miscellaneous Revenue - Other - continued | ||||||
| Austin, TX, Convention Center (Convention Enterprises, Inc.), “A”, XLCA, 5.25%, 2024 | $ | 760,000 | $ | 545,376 | ||
| Austin, TX, Convention Center (Convention Enterprises, Inc.), “B”, 5.75%, 2034 | 520,000 | 292,542 | ||||
| Dallas, TX, Civic Center Convention Complex Rev., ASSD GTY, 5.25%, 2034 | 4,180,000 | 4,110,654 | ||||
| Oklahoma Industries Authority Rev. (Oklahoma Medical Research Foundation Project), 5.5%, 2029 | 4,400,000 | 4,105,508 | ||||
| Toledo Lucas County, OH, Port Authority Development Rev. (Northwest Ohio Bond Fund), “C”, 5.125%, 2025 | 55,000 | 38,462 | ||||
| $ | 11,865,381 | |||||
| Multi-Family Housing Revenue - 0.8% | ||||||
| Bay County, FL, Housing Finance Authority, Multi-Family Rev. (Andrews Place II Apartments), FSA, 5%, 2035 | $ | 545,000 | $ | 477,039 | ||
| Bay County, FL, Housing Finance Authority, Multi-Family Rev. (Andrews Place II Apartments), FSA, 5.1%, 2046 | 1,270,000 | 1,096,569 | ||||
| Charter Mac Equity Issuer Trust, FHLMC, 6.625%, 2009 (b)(n) | 2,000,000 | 2,002,340 | ||||
| Eden Prairie, MN, Multi-Family Rev. (Coll-Rolling Hills), “A”, GNMA, 6%, 2021 | 200,000 | 213,596 | ||||
| Indianapolis, IN, Multi-Family Rev. (Cambridge Station Apartments II), FNMA, 5.25%, 2039 (b) | 1,375,000 | 1,296,089 | ||||
| Michigan Housing Development Authority, GNMA, 5.2%, 2038 | 1,200,000 | 1,080,624 | ||||
| MuniMae TE Bond Subsidiary LLC, “A-2”, 4.9%, 2049 (z) | 2,000,000 | 1,330,300 | ||||
| North Charleston, SC, Housing Authority Rev. (Horizon Village), “A”, GNMA, 5.15%, 2048 | 305,000 | 269,123 | ||||
| Seattle, WA, Housing Authority Rev., Capped Fund Program (High Rise Rehab), “I”, FSA, 5%, 2025 | 2,085,000 | 1,968,115 | ||||
| $ | 9,733,795 | |||||
| Sales & Excise Tax Revenue - 2.9% | ||||||
| Austin, TX, Town Community Events Center Venue, FGIC, 6%, 2009 (c) | $ | 1,015,000 | $ | 1,047,582 | ||
| Central, WA, Puget Sound Regional Transportation Authority, “A”, 5%, 2036 | 10,000,000 | 9,837,900 | ||||
| Illinois Sales Tax Rev., “P”, 6.5%, 2022 | 5,000,000 | 6,186,800 | ||||
| Massachusetts Bay Transportation Authority Sales Tax Rev., “A-2”, 0%, 2028 | 6,930,000 | 2,380,039 | ||||
| Massachusetts Bay Transportation Authority, Sales Tax Rev., “A-1”, 5.25%, 2029 | 2,795,000 | 2,934,219 | ||||
| Massachusetts School Building Authority, Dedicated Sales Tax Rev., AMBAC, 4.75%, 2032 | 6,175,000 | 5,777,515 | ||||
| Metropolitan Atlanta, GA, Rapid Transit Authority Rev., 6.25%, 2018 | 4,580,000 | 5,271,259 | ||||
26
Table of Contents
Portfolio of Investments – continued
| Issuer | Shares/Par | Value ($) | ||||
| Municipal Bonds - continued | ||||||
| Sales & Excise Tax Revenue - continued | ||||||
| Metropolitan Pier & Expo, IL, McCormick Place Expansion, MBIA, 5.25%, 2042 | $ | 3,340,000 | $ | 3,318,925 | ||
| Utah Transit Authority Sales Tax Rev., “A”, MBIA, 0%, 2028 | 2,225,000 | 696,781 | ||||
| $ | 37,451,020 | |||||
| Single Family Housing - Local - 3.0% | ||||||
| Adams County, CO, Single Family Mortgage Rev., ETM, 8.875%, 2011 (c) | $ | 2,510,000 | $ | 2,966,193 | ||
| Brevard County, FL, Housing Finance Authority Rev., “B”, GNMA, 6.5%, 2022 | 111,000 | 118,147 | ||||
| Calcasieu Parish, LA, Public Trust Authority, Single Family Mortgage Rev., “A”, GNMA, 6.05%, 2032 | 1,765,000 | 1,786,392 | ||||
| California Rural Home Mortgage Finance Authority Rev., GNMA, 6.55%, 2030 | 290,000 | 293,555 | ||||
| California Rural Home Mortgage Finance Authority Rev., GNMA, 7.3%, 2031 | 25,000 | 26,117 | ||||
| Chicago, IL, Single Family Mortgage Rev., “A”, GNMA, 5.5%, 2043 | 2,375,000 | 2,275,155 | ||||
| Chicago, IL, Single Family Mortgage Rev., “B”, GNMA, 6%, 2033 | 400,000 | 399,500 | ||||
| Chicago, IL, Single Family Mortgage Rev., “C”, GNMA, 7.05%, 2030 | 15,000 | 15,121 | ||||
| Chicago, IL, Single Family Mortgage Rev., “C”, GNMA, 7%, 2032 | 70,000 | 72,043 | ||||
| Chicago, IL, Single Family Mortgage Rev., “C”, GNMA, 5.5%, 2038 | 1,475,000 | 1,462,625 | ||||
| Chicago, IL, Single Family Mortgage Rev., “C”, GNMA, 5.75%, 2042 | 3,275,000 | 3,199,642 | ||||
| Cook County, IL, Single Family Mortgage Rev., “A”, 0%, 2015 | 230,000 | 65,562 | ||||
| Denver, CO, Single Family Mortgage Rev., GNMA, 7.3%, 2031 | 70,000 | 69,611 | ||||
| Escambia County, FL, Single Family Mortgage Rev., GNMA, 6.95%, 2024 | 140,000 | 144,092 | ||||
| Jefferson Parish, LA, Single Family Mortgage Rev., “B-1”, GNMA, 6.625%, 2023 | 480,000 | 491,842 | ||||
| Jefferson Parish, LA, Single Family Mortgage Rev., “B-1”, GNMA, 6.75%, 2030 | 565,000 | 587,888 | ||||
| Jefferson Parish, LA, Single Family Mortgage Rev., “D-1”, GNMA, 7.5%, 2026 | 75,000 | 78,640 | ||||
| Lubbock, TX, Housing Finance Corp. Rev., GNMA, 6.1%, 2030 | 960,000 | 977,779 | ||||
| Manatee County, FL, Housing Finance Mortgage Rev., Single Family, Sub-Series 2, GNMA, 6.5%, 2023 | 60,000 | 61,504 | ||||
| Manatee County, FL, Housing Finance Mortgage Rev., Single Family, Sub-Series 3, GNMA, 5.3%, 2028 | 550,000 | 539,682 | ||||
| Manatee County, FL, Housing Finance Mortgage Rev., Single Family, Sub-Series 3, GNMA, 5.4%, 2029 | 185,000 | 182,016 | ||||
| Nortex Housing Financing Corp., TX, Single Family Mortgage Rev., “A”, GNMA, 5.5%, 2038 | 3,155,000 | 3,031,955 | ||||
27
Table of Contents
Portfolio of Investments – continued
| Issuer | Shares/Par | Value ($) | ||||
| Municipal Bonds - continued | ||||||
| Single Family Housing - Local - continued | ||||||
| Oklahoma County, OK, Home Finance Authority, Single Family Mortgage Rev., “A”, GNMA, 5.4%, 2038 | $ | 2,310,000 | $ | 2,264,609 | ||
| Permian Basin Housing Finance Corp., TX, Single Family Mortgage Backed Securities (Mortgage Backed Project) “A”, GNMA, 5.65%, 2038 | 1,430,000 | 1,402,086 | ||||
| Pima County, AZ, Industrial Development Authority Rev., “B-1”, GNMA, 7.05%, 2030 | 250,000 | 262,193 | ||||
| Sedgwick & Shawnee Counties, KS, Single Family Housing Rev., “A”, GNMA, 6.45%, 2029 | 500,000 | 510,820 | ||||
| Sedgwick & Shawnee Counties, KS, Single Family Housing Rev., “A”, GNMA, 5.9%, 2035 | 815,000 | 804,055 | ||||
| Sedgwick & Shawnee Counties, KS, Single Family Housing Rev., “A”, GNMA, 6.25%, 2035 | 325,000 | 342,199 | ||||
| Sedgwick & Shawnee Counties, KS, Single Family Housing Rev., “A”, GNMA, 5.8%, 2036 | 2,525,000 | 2,404,406 | ||||
| Sedgwick & Shawnee Counties, KS, Single Family Housing Rev., “A”, GNMA, 5.45%, 2038 | 4,060,000 | 4,062,923 | ||||
| Sedgwick & Shawnee Counties, KS, Single Family Housing Rev., “A-1”, GNMA, 5.75%, 2037 | 315,000 | 321,514 | ||||
| Sedgwick & Shawnee Counties, KS, Single Family Housing Rev., “A-3”, GNMA, 6%, 2035 | 820,000 | 825,576 | ||||
| Sedgwick & Shawnee Counties, KS, Single Family Housing Rev., “A-3”, GNMA, 5.5%, 2037 | 1,305,000 | 1,284,838 | ||||
| Sedgwick & Shawnee Counties, KS, Single Family Housing Rev., “A-4”, GNMA, 5.85%, 2037 | 315,000 | 321,728 | ||||
| Sedgwick & Shawnee Counties, KS, Single Family Housing Rev., “A-5”, GNMA, 5.8%, 2027 | 880,000 | 892,258 | ||||
| Sedgwick & Shawnee Counties, KS, Single Family Housing Rev., “A-5”, GNMA, 5.7%, 2036 | 2,035,000 | 2,057,263 | ||||
| Sedgwick & Shawnee Counties, KS, Single Family Housing Rev., “A-5”, GNMA, 5.9%, 2037 | 550,000 | 548,867 | ||||
| Sedgwick & Shawnee Counties, KS, Single Family Housing Rev., “B-2”, GNMA, 6.45%, 2033 | 780,000 | 813,407 | ||||
| $ | 37,963,803 | |||||
| Single Family Housing - State - 1.8% | ||||||
| California Housing Finance Agency Rev., Home Mortgage, FSA, 0%, 2019 | $ | 3,480,000 | $ | 1,874,746 | ||
| California Housing Finance Agency Rev., Home Mortgage, MBIA, 0%, 2028 | 2,250,000 | 734,468 | ||||
| Colorado Housing & Finance Authority Rev., 6.05%, 2016 | 120,000 | 120,301 | ||||
| Colorado Housing & Finance Authority Rev., 7.45%, 2016 | 110,000 | 113,678 | ||||
| Colorado Housing & Finance Authority Rev., 6.875%, 2028 | 25,000 | 25,400 | ||||
28
Table of Contents
Portfolio of Investments – continued
| Issuer | Shares/Par | Value ($) | ||||
| Municipal Bonds - continued | ||||||
| Single Family Housing - State - continued | ||||||
| Colorado Housing & Finance Authority Rev., 6.8%, 2030 | $ | 175,000 | $ | 176,867 | ||
| Colorado Housing & Finance Authority Rev. (Single Family Project), “B-2”, 7.25%, 2031 | 160,000 | 165,230 | ||||
| Colorado Housing & Finance Authority Rev., “B-2”, 6.1%, 2023 | 70,000 | 70,264 | ||||
| Colorado Housing & Finance Authority Rev., “B-3”, 6.55%, 2025 | 29,000 | 29,081 | ||||
| Colorado Housing & Finance Authority Rev., “B-3”, 6.55%, 2033 | 80,000 | 84,035 | ||||
| Colorado Housing & Finance Authority Rev., “C-2”, 5.9%, 2023 | 495,000 | 493,782 | ||||
| Colorado Housing & Finance Authority Rev., “C-2”, FHA, 6.6%, 2032 | 465,000 | 481,410 | ||||
| Colorado Housing & Finance Authority Rev., “C-3”, 6.75%, 2021 | 130,000 | 136,365 | ||||
| Colorado Housing & Finance Authority Rev., “C-3”, FHA, 6.375%, 2033 | 50,000 | 52,573 | ||||
| Colorado Housing & Finance Authority Rev., Single Family Program, “C-2”, 8.4%, 2021 | 70,000 | 76,873 | ||||
| Delaware Housing Authority Rev. (Single Family), “C”, 6.25%, 2037 | 1,685,000 | 1,730,866 | ||||
| Louisiana Housing Finance Agency, Single Family Mortgage Rev., GNMA, 6.375%, 2033 | 440,000 | 450,512 | ||||
| Louisiana Housing Finance Agency, Single Family Mortgage Rev., “B-2”, GNMA, 7.55%, 2031 | 110,000 | 112,451 | ||||
| Mississippi Home Corp., Single Family Rev., “A”, GNMA, 6.1%, 2034 | 1,620,000 | 1,635,876 | ||||
| Missouri Housing Development Commission, Single Family Mortgage Rev. (Home Loan Program), GNMA, 7.45%, 2031 | 70,000 | 72,401 | ||||
| Missouri Housing Development Commission, Single Family Mortgage Rev. (Home Loan Program), GNMA, 6.35%, 2032 | 115,000 | 115,406 | ||||
| Missouri Housing Development Commission, Single Family Mortgage Rev. (Home Loan Program), GNMA, 6.85%, 2032 | 285,000 | 290,455 | ||||
| Missouri Housing Development Commission, Single Family Mortgage Rev. (Home Loan Program), GNMA, 6.75%, 2034 | 270,000 | 270,367 | ||||
| Missouri Housing Development Commission, Single Family Mortgage Rev. (Home Loan Program), “B”, GNMA, 6.7%, 2030 | 565,000 | 568,644 | ||||
| New Hampshire Housing Finance Authority Rev., 6.85%, 2030 | 425,000 | 445,999 | ||||
| New Hampshire Housing Finance Authority Rev., “B”, 5.875%, 2030 | 300,000 | 299,241 | ||||
| New Hampshire Housing Finance Authority Rev., “B”, 6.3%, 2031 | 215,000 | 216,941 | ||||
| New Hampshire Housing Finance Authority Rev., “B”, 6.5%, 2035 | 355,000 | 356,764 | ||||
| New Mexico Mortgage Finance Authority Rev., GNMA, 7.1%, 2030 | 195,000 | 207,997 | ||||
| New Mexico Mortgage Finance Authority Rev., GNMA, 6.8%, 2031 | 365,000 | 373,275 | ||||
| New Mexico Mortgage Finance Authority Rev., GNMA, 6.25%, 2032 | 930,000 | 947,196 | ||||
| New Mexico Mortgage Finance Authority Rev., GNMA, 5.95%, 2037 | 1,525,000 | 1,521,249 | ||||
29
Table of Contents
Portfolio of Investments – continued
| Issuer | Shares/Par | Value ($) | ||||
| Municipal Bonds - continued | ||||||
| Single Family Housing - State - continued | ||||||
| New Mexico Mortgage Finance Authority Rev., “B-2”, GNMA, 6.35%, 2033 | $ | 480,000 | $ | 480,677 | ||
| New Mexico Mortgage Finance Authority Rev., “I”, GNMA, 5.75%, 2038 | 1,830,000 | 1,805,460 | ||||
| Ohio Housing Finance Agency Mortgage Rev., Residential Mortgage Backed, “C”, GNMA, 5.9%, 2035 | 925,000 | 924,445 | ||||
| Oklahoma Housing Finance Agency Rev., 6.8%, 2016 | 20,000 | 20,233 | ||||
| Oregon Health & Community Services (Single Family Mortgage), “B”, 6.25%, 2031 | 1,925,000 | 1,977,399 | ||||
| Texas Affordable Housing Corp. (Single Family Mortgage), “B”, GNMA, 5.25%, 2039 | 520,000 | 452,941 | ||||
| Texas Housing & Community Affairs, Residential Mortgage Rev., GNMA, 7.1%, 2021 | 2,980,000 | 3,169,856 | ||||
| Washington Housing Finance Commission Rev., Single Family Housing, GNMA, 5%, 2023 | 320,000 | 312,669 | ||||
| $ | 23,394,393 | |||||
| Solid Waste Revenue - 0.4% | ||||||
| Delaware County, PA, Industrial Development Authority, Resource Recovery Facilities Rev. (American Ref-Fuel Co.), “A”, 6.2%, 2019 | $ | 1,750,000 | $ | 1,613,745 | ||
| Hudson County, NJ, Solid Waste System Rev., 5.9%, 2015 | 760,000 | 696,350 | ||||
| Massachusetts Development Finance Agency, Resource Recovery Rev. (Ogden Haverhill Associates), “A”, 6.7%, 2014 | 2,100,000 | 2,046,870 | ||||
| Massachusetts Industrial Finance Agency, Resource Recovery Rev. (Ogden Haverhill Associates), “A”, 5.6%, 2019 | 1,000,000 | 817,410 | ||||
| $ | 5,174,375 | |||||
| State & Agency - Other - 0.2% | ||||||
| Commonwealth of Puerto Rico (Mepsi Campus), “A”, 6.25%, 2024 | $ | 600,000 | $ | 497,016 | ||
| Commonwealth of Puerto Rico (Mepsi Campus), “A”, 6.5%, 2037 | 1,200,000 | 928,440 | ||||
| Massachusetts Development Finance Agency (Visual & Performing Arts), 6%, 2021 | 1,000,000 | 1,109,400 | ||||
| $ | 2,534,856 | |||||
| State & Local Agencies - 7.4% | ||||||
| Alabama Building Renovation Authority, AMBAC, 6%, 2015 | $ | 1,610,000 | $ | 1,662,953 | ||
| Alabama Building Renovation Authority, AMBAC, 6%, 2016 | 1,705,000 | 1,759,338 | ||||
| Alabama Public School & College, Capital Improvement, “D”, 6%, 2015 | 2,850,000 | 2,928,546 | ||||
| Allen County, IN, Jail Building Corp., First Mortgage, 5.75%, 2011 (c) | 2,750,000 | 3,033,690 | ||||
| Delaware Valley, PA, Regional Finance Authority, AMBAC, 5.5%, 2018 | 7,600,000 | 8,454,772 | ||||
30
Table of Contents
Portfolio of Investments – continued
| Issuer | Shares/Par | Value ($) | ||||
| Municipal Bonds - continued | ||||||
| State & Local Agencies - continued | ||||||
| Delaware Valley, PA, Regional Finance Authority, “B”, FRN, AMBAC, 0.217%, 2018 | $ | 200,000 | $ | 200,000 | ||
| Delaware Valley, PA, Regional Finance Authority, RITES, AMBAC, 8.641%, 2018 (p) | 900,000 | 1,102,446 | ||||
| Delaware Valley, PA, Regional Financial Authority, AMBAC, 5.5%, 2018 | 1,900,000 | 2,113,693 | ||||
| Fayette County, GA (Criminal Justice Center), 6.25%, 2010 (c) | 1,000,000 | 1,076,420 | ||||
| Golden State, CA, Tobacco Securitization Corp., Tobacco Settlement Rev., “A”, FSA, 0% to 2010, 4.55% to 2022 | 3,415,000 | 2,848,008 | ||||
| Golden State, CA, Tobacco Securitization Corp., Tobacco Settlement Rev., “A-1”, AMBAC, 0% to 2010, 4.6% to 2023 | 995,000 | 730,161 | ||||
| Golden State, CA, Tobacco Securitization Corp., Tobacco Settlement Rev., Enhanced, “A”, 5%, 2045 | 2,475,000 | 1,803,854 | ||||
| Golden State, CA, Tobacco Securitization Corp., Tobacco Settlement Rev., Enhanced, “B”, 5.5%, 2013 (c) | 5,000,000 | 5,641,900 | ||||
| Mississippi Development Bank Special Obligation (Hinds Community College), ASSD GTY, 5.375%, 2033 | 360,000 | 360,140 | ||||
| New York Dormitory Authority Rev. (City University), 5.75%, 2013 | 5,000,000 | 5,380,750 | ||||
| New York Metropolitan Transportation Authority, “A”, 5.125%, 2029 | 5,195,000 | 4,943,666 | ||||
| Palm Springs, CA, Finance Lease Rev. (Convention Center), “A”, MBIA, 5.5%, 2035 | 7,000,000 | 6,409,200 | ||||
| Pennsylvania Convention Center Authority Rev., ETM, FGIC, 6.7%, 2016 (c) | 26,195,000 | 30,681,680 | ||||
| San Bernardino, CA, Joint Powers Financing Authority Lease Rev. (California Department of Transportation), 5.5%, 2014 | 10,000,000 | 10,017,400 | ||||
| Tennessee School Bond Authority, “B”, 5.125%, 2033 | 1,500,000 | 1,511,310 | ||||
| West Valley City, Utah Municipal Building Lease Rev., “A”, AMBAC, 5.5%, 2012 (c) | 2,000,000 | 2,274,780 | ||||
| $ | 94,934,707 | |||||
| Student Loan Revenue - 0.9% | ||||||
| Access to Loans for Learning, CA Student Loan Rev., 7.95%, 2030 | $ | 650,000 | $ | 567,125 | ||
| Arizona Student Loan Acquisition Authority Rev., 5.8%, 2016 | 3,175,000 | 3,200,464 | ||||
| Arizona Student Loan Acquisition Authority Rev., 5.85%, 2017 | 3,500,000 | 3,516,380 | ||||
| Massachusetts Educational Financing Authority, Education Loan Rev., “H”, ASSD GTY, 6.35%, 2030 | 4,325,000 | 4,075,621 | ||||
| Massachusetts Educational Financing Authority, Refunding Issue G, “A”, MBIA, 6.1%, 2018 | 415,000 | 391,810 | ||||
| $ | 11,751,400 | |||||
31
Table of Contents
Portfolio of Investments – continued
| Issuer | Shares/Par | Value ($) | ||||
| Municipal Bonds - continued | ||||||
| Tax - Other - 0.5% | ||||||
| Illinois Dedicated Tax Rev. (Civic Center), AMBAC, 6.25%, 2011 | $ | 2,810,000 | $ | 2,943,025 | ||
| New Jersey Economic Development Authority Rev. (Cigarette Tax), 5.75%, 2029 | 1,605,000 | 1,192,547 | ||||
| Virgin Islands Public Finance Authority Rev., “A”, 5.5%, 2022 | 2,000,000 | 1,728,520 | ||||
| $ | 5,864,092 | |||||
| Tax Assessment - 1.2% | ||||||
| Baltimore, MD, Special Obligation, “A”, 7%, 2038 | $ | 1,285,000 | $ | 1,014,251 | ||
| Capital Region Community Development District Rev., FL, “A”, 7%, 2039 | 925,000 | 648,629 | ||||
| Fishhawk Community Development District, FL, 5.125%, 2009 | 140,000 | 114,618 | ||||
| Grand Bay at Doral Community Development District, FL, “B”, 6%, 2017 | 2,800,000 | 2,039,968 | ||||
| Greyhawk Landing Community Development District, FL, Special Assessment, “B”, 6.25%, 2009 | 35,000 | 34,936 | ||||
| Heritage Harbour North Community Development District, FL, Capital Improvement Rev., 6.375%, 2038 | 895,000 | 555,867 | ||||
| Homestead 50 Community Development District, FL, “A”, 6%, 2037 | 1,820,000 | 1,078,659 | ||||
| Homestead 50 Community Development District, FL, “B”, 5.9%, 2013 | 815,000 | 689,751 | ||||
| Katy, TX, Development Authority Rev., “B”, 6%, 2018 | 1,200,000 | 964,884 | ||||
| Killarney Community Development District, FL, Special Assessment, “B”, 5.125%, 2009 | 105,000 | 83,988 | ||||
| Lakes by the Bay South Community Development District, FL, Rev., “B”, 5.3%, 2009 | 145,000 | 82,649 | ||||
| Lancaster County, SC, Assessment Rev. (Sun City Carolina Lakes), 5.45%, 2037 | 50,000 | 28,282 | ||||
| Magnolia Park Community Development District, FL, Special Assessment, “A”, 6.15%, 2039 | 1,270,000 | 760,565 | ||||
| Main Street Community Development District, FL, “A”, 6.8%, 2038 | 585,000 | 372,861 | ||||
| Main Street Community Development District, FL, “B”, 6.9%, 2017 | 1,210,000 | 911,408 | ||||
| Massachusetts Bay Transportation Authority Rev., “A”, 5.25%, 2034 | 2,000,000 | 2,014,400 | ||||
| Noblesville, IN, Redevelopment Authority Lease Rental, 5.25%, 2025 | 2,000,000 | 2,073,660 | ||||
| Panther Trace II, Community Development District, FL, Special Assessment, “B”, 5%, 2010 | 230,000 | 205,898 | ||||
| Parkway Center Community Development District, FL, Special Assessment, “B”, 5.625%, 2014 | 760,000 | 626,316 | ||||
| Preserve at Wilderness Lake, FL, Community Development District, Capital Improvement, “B”, 5%, 2009 | 20,000 | 19,940 | ||||
| Tolomato Community Development District, FL, Special Assessment, 6.65%, 2040 | 660,000 | 423,502 | ||||
32
Table of Contents
Portfolio of Investments – continued
| Issuer | Shares/Par | Value ($) | ||||
| Municipal Bonds - continued | ||||||
| Tax Assessment - continued | ||||||
| Tuscany Reserve Community Development District, FL, Special Assessment, “B”, 5.25%, 2016 | $ | 155,000 | $ | 84,072 | ||
| Washington County, PA, Redevelopment Authority (Victory Centre Project), “A”, 5.45%, 2035 | 120,000 | 67,726 | ||||
| $ | 14,896,830 | |||||
| Tobacco - 2.1% | ||||||
| Badger, WI, Tobacco Asset Securitization Corp., 6.125%, 2027 | $ | 2,615,000 | $ | 2,805,607 | ||
| Buckeye, OH, Tobacco Settlement Rev., Asset Backed, “A-2”, 5.875%, 2030 | 3,100,000 | 1,938,058 | ||||
| Buckeye, OH, Tobacco Settlement Rev., Asset Backed, “A-2”, 5.875%, 2047 | 1,500,000 | 822,210 | ||||
| Buckeye, OH, Tobacco Settlement Rev., Asset Backed, “A-2”, 6.5%, 2047 | 3,625,000 | 2,173,151 | ||||
| District of Columbia, Tobacco Settlement Rev., 6.25%, 2024 | 1,155,000 | 952,794 | ||||
| Golden State, CA, Tobacco Securitization Corp., Tobacco Settlement Rev., “A-1”, 6.25%, 2013 (c) | 2,610,000 | 2,884,207 | ||||
| Inland Empire, CA, Tobacco Securitization Corp., Tobacco Settlement Rev., Asset Backed, “C-1”, 0%, 2036 | 1,580,000 | 93,726 | ||||
| Iowa Tobacco Settlement Authority, Tobacco Settlement Rev., Asset Backed, “B”, 5.6%, 2034 | 3,070,000 | 1,831,501 | ||||
| Louisiana Tobacco Settlement Authority Rev., 5.5%, 2030 | 1,650,000 | 1,231,065 | ||||
| Louisiana Tobacco Settlement Authority Rev., “2001-B”, 5.875%, 2039 | 2,585,000 | 1,618,908 | ||||
| Michigan Tobacco Settlement Finance Authority Rev., Asset Backed, “A”, 6%, 2048 | 2,940,000 | 1,628,290 | ||||
| New Jersey Tobacco Settlement Financing Corp., 5.75%, 2012 (c) | 2,480,000 | 2,688,047 | ||||
| New Jersey Tobacco Settlement Financing Corp., “1-A”, 5%, 2041 | 3,425,000 | 1,775,212 | ||||
| Silicon Valley Tobacco Securitization Authority, CA, Tobacco Settlement Rev. (Turbo-Santa Clara), “A”, 0%, 2036 | 4,405,000 | 268,000 | ||||
| Silicon Valley Tobacco Securitization Authority, CA, Tobacco Settlement Rev. (Turbo-Santa Clara), “A”, 0%, 2041 | 3,600,000 | 129,636 | ||||
| South Carolina Tobacco Settlement Authority Rev., “B”, 6.375%, 2011 (c) | 2,000,000 | 2,189,000 | ||||
| Virginia Tobacco Settlement Financing Corp., “B-1”, 5%, 2047 | 3,460,000 | 1,753,217 | ||||
| Washington Tobacco Settlement Authority, 6.5%, 2026 | 210,000 | 190,873 | ||||
| $ | 26,973,502 | |||||
| Toll Roads - 1.5% | ||||||
| Bay Area Toll Authority, CA, Toll Bridge Rev. (San Francisco Bay Area), “F1”, 5%, 2034 | $ | 7,500,000 | $ | 7,051,950 | ||
| E-470 Public Highway Authority Rev., CO, Capital Appreciation “B”, MBIA, 0%, 2010 (c) | 5,000,000 | 3,206,150 | ||||
| Illinois State Toll Highway Authority Rev., “B”, 5.5%, 2033 | 7,905,000 | 8,080,412 | ||||
| Northwest Parkway Public Highway Authority Rev., CO, “C”, ETM, FSA, 0%, 2016 (c) | 1,000,000 | 998,590 | ||||
| $ | 19,337,102 | |||||
33
Table of Contents
Portfolio of Investments – continued
| Issuer | Shares/Par | Value ($) | ||||
| Municipal Bonds - continued | ||||||
| Transportation - Special Tax - 3.0% | ||||||
| Indiana Finance Authority Highway Rev., “A”, FGIC, 4.5%, 2024 | $ | 5,000,000 | $ | 4,983,050 | ||
| Jacksonville, FL, Transportation Authority Rev., ETM, 9.2%, 2015 (c) | 2,000,000 | 2,474,040 | ||||
| Metropolitan, NY, Transportation Authority Rev., AMBAC, 5%, 2030 | 5,000,000 | 4,797,400 | ||||
| Metropolitan, NY, Transportation Authority Rev., “A”, FSA, 5%, 2030 | 2,750,000 | 2,654,713 | ||||
| Metropolitan, NY, Transportation Authority Rev., ETM, 5.75%, 2013 (c) | 5,600,000 | 5,998,160 | ||||
| New Jersey Transportation Trust Fund Authority Rev., FSA, 5.5%, 2011 (u) | 15,000,000 | 16,281,900 | ||||
| Pennsylvania Turnpike Commission Oil, Franchise Tax Rev., “A”, AMBAC, 5.25%, 2018 | 180,000 | 180,236 | ||||
| Pennsylvania Turnpike Commission Oil, Franchise Tax Rev., “A”, ETM, AMBAC, 5.25%, 2018 (c) | 1,150,000 | 1,168,757 | ||||
| $ | 38,538,256 | |||||
| Universities - Colleges - 8.6% | ||||||
| Allegheny County, PA, Higher Education Building Authority Rev. (Robert Morris University) “A”, 5.9%, 2028 | $ | 1,195,000 | $ | 893,119 | ||
| Allegheny County, PA, Higher Education Building Authority Rev. (Robert Morris University), “A”, 6%, 2038 | 1,725,000 | 1,217,850 | ||||
| Amherst, NY, Industrial Development Agency Rev. (Daemen College), “A”, 6%, 2011 (c) | 1,000,000 | 1,140,770 | ||||
| Anderson, IN, Economic Development Rev. (Anderson University Project), 5%, 2028 | 2,415,000 | 1,569,992 | ||||
| Anderson, IN, Economic Development Rev. (Anderson University Project), 5%, 2032 | 400,000 | 248,464 | ||||
| California Educational Facilities Authority Rev. (California Lutheran University), 5.75%, 2038 | 2,640,000 | 2,089,032 | ||||
| California Educational Facilities Authority Rev. (University Financing Project), 5%, 2026 | 1,620,000 | 1,153,440 | ||||
| California Educational Facilities Authority Rev. (University of Southern California), “A”, 5.25%, 2038 | 4,610,000 | 4,620,234 | ||||
| California Educational Facilities Authority Rev., “A”, 4.5%, 2033 | 3,925,000 | 3,468,837 | ||||
| California Municipal Finance Authority Rev. (Biola University), 5.8%, 2028 | 1,785,000 | 1,494,259 | ||||
| California State University Rev., “A”, AMBAC, 5%, 2026 | 6,795,000 | 6,601,275 | ||||
| California Statewide Communities Development Authority Rev. (California Baptist University), “A”, 5.4%, 2027 | 245,000 | �� | 156,871 | |||
| California Statewide Communities Development Authority Rev. (California Baptist University), “A”, 5.5%, 2038 | 280,000 | 167,328 | ||||
| College of Charleston, SC, Academic & Administrative Facilities Rev., “B”, XLCA, 5.125%, 2034 | 2,400,000 | 2,180,976 | ||||
34
Table of Contents
Portfolio of Investments – continued
| Issuer | Shares/Par | Value ($) | ||||
| Municipal Bonds - continued | ||||||
| Universities - Colleges - continued | ||||||
| District of Columbia Rev. (Georgetown University), BHAC, 0% to 2018, 5% to 2040 | $ | 11,570,000 | $ | 5,408,049 | ||
| Florida State University Board of Governors, System Improvement Rev., 6.25%, 2030 | 2,185,000 | 2,320,623 | ||||
| Grand Valley, MI, State University Rev., 5.5%, 2027 | 985,000 | 979,238 | ||||
| Grand Valley, MI, State University Rev., 5.625%, 2029 | 480,000 | 476,770 | ||||
| Harris County, TX, Cultural Education Facilities Rev. (Baylor College of Medicine), “D”, 5.625%, 2032 | 2,200,000 | 2,115,146 | ||||
| Harrisburg, PA, University Authority Rev. (Harrisburg University of Science), “A”, 5.4%, 2016 | 850,000 | 804,236 | ||||
| Houston, TX, Community College Systems, MBIA, 7.875%, 2025 | 1,650,000 | 1,840,641 | ||||
| Illinois Finance Authority Rev. (Illinois Institute of Technology), “A”, 5%, 2031 | 2,745,000 | 2,080,765 | ||||
| Illinois Finance Authority Rev. (Illinois Institute of Technology), “A”, 5%, 2036 | 2,790,000 | 2,053,356 | ||||
| Los Angeles, CA, Community College, “B”, FSA, 5%, 2027 | 5,000,000 | 4,940,550 | ||||
| Lubbock, TX, Educational Facilities Authority Rev. (Lubbock Christian University), 5.125%, 2027 | 1,930,000 | 1,420,152 | ||||
| Lubbock, TX, Educational Facilities Authority Rev. (Lubbock Christian University), 5.25%, 2037 | 1,745,000 | 1,208,796 | ||||
| Marietta, GA, Development Facilities Authority Rev. (Life University), 7%, 2030 | 540,000 | 414,866 | ||||
| Marietta, GA, Development Facilities Authority Rev. (Life University), 7%, 2039 | 645,000 | 479,493 | ||||
| Maryland Health & Higher Educational Facilities Authority Rev. (Loyola College), “A”, 5.125%, 2045 | 1,205,000 | 1,025,383 | ||||
| Massachusetts Development Finance Agency Rev. (Boston University), XLCA, 6%, 2059 | 6,225,000 | 6,438,455 | ||||
| Massachusetts Development Finance Agency Rev. (Massachusetts College of Pharmacy), “B”, 6.625%, 2010 (c) | 450,000 | 475,110 | ||||
| Massachusetts Development Finance Agency Rev. (Olin College), “B”, XLCA, 5.25%, 2033 | 2,000,000 | 1,818,840 | ||||
| Massachusetts Development Finance Agency Rev. (Simmons College), “H”, XLCA, 5.25%, 2033 | 420,000 | 312,136 | ||||
| Massachusetts Development Finance Agency Rev. (Smith College), 5%, 2035 | 2,245,000 | 2,202,996 | ||||
| Massachusetts Health & Educational Facilities Authority Rev. (Simmons College), “I”, 8%, 2029 | 2,030,000 | 2,089,804 | ||||
| Miami-Dade County, FL, Educational Facilities Authority Rev. (University of Miami), “A”, 5.75%, 2028 | 875,000 | 869,006 | ||||
| Michigan Higher Education Facilities Authority Rev. (College for Creative Studies), 6.125%, 2037 | 3,465,000 | 2,562,298 | ||||
| New York Dormitory Authority Rev. Non State Supported Debt (Cornell University), “A”, 5%, 2031 | 8,000,000 | 8,023,520 | ||||
35
Table of Contents
Portfolio of Investments – continued
| Issuer | Shares/Par | Value ($) | ||||
| Municipal Bonds - continued | ||||||
| Universities - Colleges - continued | ||||||
| Northern Illinois University Rev., Auxiliary Facilities Systems, AMBAC, 5.875%, 2018 | $ | 90,000 | $ | 90,052 | ||
| Pennsylvania State Higher Educational Facilities Authority Rev. (Lasalle University), 5.25%, 2027 | 790,000 | 639,663 | ||||
| Rhode Island, Health & Educational Building Corp. (Rhode Island School of Design), “D”, XLCA, 5.5%, 2035 | 9,140,000 | 9,139,360 | ||||
| San Leanna, TX, Educational Facilities Corp., Higher Education Rev. (St. Edwards University), 5.125%, 2036 | 930,000 | 621,928 | ||||
| St. Joseph County, IN, Educational Facilities Rev. (University of Notre Dame), 6.5%, 2026 | 1,000,000 | 1,214,940 | ||||
| Tulsa, OK, Tulsa Industrial Authority Rev. (University of Tulsa), 6%, 2027 | 4,670,000 | 4,798,051 | ||||
| University of California, “A”, MBIA, 4.5%, 2037 | 8,545,000 | 7,091,239 | ||||
| University of Southern Indiana Rev., Student Fee, “J”, ASSD GTY, 5.75%, 2028 | 1,875,000 | 1,963,781 | ||||
| University of Southern Mississippi Educational Building Corp. (Campus Facilities Project), 5.25%, 2032 | 2,030,000 | 2,033,126 | ||||
| University of Southern Mississippi, Educational Building Corp. Rev. (Campus Facilities Project), 5.375%, 2036 | 610,000 | 613,111 | ||||
| Upland, IN, Economic Development Rev. (Taylor University), 6%, 2018 | 435,000 | 398,060 | ||||
| Upland, IN, Economic Development Rev. (Taylor University), 6.25%, 2023 | 520,000 | 458,286 | ||||
| Virginia College Building Authority, Educational Facilities Rev. (Regent University), 5%, 2026 | 2,000,000 | 1,573,540 | ||||
| $ | 109,997,813 | |||||
| Universities - Dormitories - 0.3% | ||||||
| California Statewide Communities Development Authority Rev. (Lancer Educational Student Housing Project), 5.625%, 2033 | $ | 1,025,000 | $ | 615,759 | ||
| California Statewide Communities Development Authority Rev. (Student Housing, SUCI East Campus), 6%, 2040 | 1,655,000 | 1,321,021 | ||||
| Georgia Private College & University Authority Rev. (Mercer Housing Corp.), “A”, 6%, 2021 | 1,000,000 | 831,870 | ||||
| Maryland Economic Development Corp. Student Housing (University of Maryland - College Park), 5.875%, 2043 | 1,035,000 | 719,573 | ||||
| $ | 3,488,223 | |||||
| Universities - Secondary Schools - 0.7% | ||||||
| California Statewide Communities Development Authority Rev. (Escondido Charter High School), 7.5%, 2011 (c) | $ | 500,000 | $ | 585,505 | ||
| Colorado Educational & Cultural Facilities Authority Rev. (Charter School), 5.625%, 2040 | 1,815,000 | 1,319,922 | ||||
36
Table of Contents
Portfolio of Investments – continued
| Issuer | Shares/Par | Value ($) | ||||
| Municipal Bonds - continued | ||||||
| Universities - Secondary Schools - continued | ||||||
| Colorado Educational & Cultural Facilities Authority Rev. (Twin Peaks Charter Academy), 7%, 2038 | $ | 4,330,000 | $ | 3,987,237 | ||
| District of Columbia Rev. (Gonzaga College High School), FSA, 5.25%, 2032 | 3,350,000 | 2,590,019 | ||||
| Maryland Health & Higher Educational Facilities Authority Rev. (Washington Christian Academy), 5.5%, 2038 | 100,000 | 59,900 | ||||
| Michigan Municipal Bond Authority Rev. (YMCA Service Learning Academy), 7.625%, 2021 | 400,000 | 353,236 | ||||
| Pima County, AZ, Industrial Development Authority Education Rev. (Arizona Charter Schools), “C”, 6.75%, 2031 | 250,000 | 178,820 | ||||
| $ | 9,074,639 | |||||
| Utilities - Investor Owned - 1.8% | ||||||
| Apache County, AZ, Industrial Development Authority, Pollution Control Rev. (Tucson Electric Power Co.), 5.875%, 2033 | $ | 1,000,000 | $ | 816,720 | ||
| Brazos River Authority, TX, Pollution Control Rev. (TXU Electric Co. LLC), “C”, 5.75%, 2036 (b) | 1,265,000 | 815,419 | ||||
| Brazos River Authority, TX, Pollution Control Rev. (TXU Energy Co. LLC), 5%, 2041 | 2,460,000 | 947,075 | ||||
| California Pollution Control Financing Authority, Pollution Control Rev. (Pacific Gas & Electric Co.), MBIA, 5.35%, 2016 | 1,600,000 | 1,540,528 | ||||
| Farmington, NM, Pollution Control Rev. (Public Service New Mexico), 6.375%, 2022 | 1,000,000 | 860,050 | ||||
| Farmington, NM, Pollution Control Rev. (Public Service New Mexico), “A”, 6.3%, 2016 | 565,000 | 522,857 | ||||
| Farmington, NM, Pollution Control Rev. (Public Service New Mexico), “A”, 5.8%, 2022 | 500,000 | 407,230 | ||||
| Farmington, NM, Pollution Control Rev. (Public Service New Mexico), “C”, 5.8%, 2022 | 4,880,000 | 3,974,565 | ||||
| Maricopa County, AZ, Pollution Control Rev. (El Paso Electric), “B”, 7.25%, 2040 | 1,710,000 | 1,724,484 | ||||
| Maryland Economic Development Corp., Pollution Control Rev. (Potomac Electric Power Co.), 6.2%, 2022 | 1,455,000 | 1,490,604 | ||||
| Matagorda County, TX, Pollution Control Rev. (Reliant Energy), 5.95%, 2030 | 750,000 | 536,603 | ||||
| Mecklenburg County, VA, Industrial Development Authority Rev. (UAE Mecklenburg LP), 6.5%, 2017 | 700,000 | 701,505 | ||||
| New Hampshire Industrial Development Authority, Pollution Control Rev. (Connecticut Light & Power), 5.9%, 2016 | 4,000,000 | 3,796,080 | ||||
| New Hampshire Industrial Development Authority, Pollution Control Rev. (Connecticut Light & Power), 5.9%, 2018 | 1,000,000 | 927,390 | ||||
| Red River Authority, TX, Pollution Control Rev. (AEP Texas Central Co.), MBIA, 4.45%, 2020 | 2,185,000 | 1,752,326 | ||||
37
Table of Contents
Portfolio of Investments – continued
| Issuer | Shares/Par | Value ($) | ||||
| Municipal Bonds - continued | ||||||
| Utilities - Investor Owned - continued | ||||||
| Sabine River Authority, TX, Pollution Control Rev. (TXU Electric Co. LLC), 5.75%, 2030 (b) | $ | 1,500,000 | $ | 966,900 | ||
| Sabine River Authority, TX, Pollution Control Rev. (TXU Electric Co. LLC) “A”, 5.5%, 2022 (b) | 500,000 | 324,795 | ||||
| West Feliciana Parish, LA, Pollution Control Rev. (Entergy Gulf States), 6.6%, 2028 | 905,000 | 864,049 | ||||
| $ | 22,969,180 | |||||
| Utilities - Municipal Owned - 8.4% | ||||||
| Austin, TX, Utility Systems Rev., AMBAC, 6.75%, 2011 | $ | 1,500,000 | $ | 1,651,230 | ||
| Austin, TX, Utility Systems Rev., AMBAC, 6.75%, 2012 | 2,500,000 | 2,818,025 | ||||
| Georgia Municipal Electric Authority Power Rev., AMBAC, 6.5%, 2014 (c) | 145,000 | 172,749 | ||||
| Georgia Municipal Electric Authority Power Rev., MBIA, 6.375%, 2016 | 2,000,000 | 2,375,680 | ||||
| Georgia Municipal Electric Authority Power Rev., AMBAC, 6.5%, 2017 | 8,000,000 | 9,010,880 | ||||
| Georgia Municipal Electric Authority Power Rev., MBIA, 6.5%, 2020 | 7,350,000 | 8,371,430 | ||||
| Georgia Municipal Electric Authority Power Rev., AMBAC, 6.5%, 2016 (c) | 365,000 | 434,908 | ||||
| Hawaii Department of Budget & Finance Rev. (Hawaiian Electric Co. & Subsidiary), “B”, XLCA, 5%, 2022 | 4,000,000 | 3,594,840 | ||||
| Intermountain Power Agency, UT, “A”, ETM, 6.15%, 2014 (c) | 27,825,000 | 27,829,452 | ||||
| Mercer County, ND, Pollution Control Rev. (Antelope Valley Station), AMBAC, 7.2%, 2013 | 4,000,000 | 4,418,760 | ||||
| North Carolina Eastern Municipal Power Agency, “A”, MBIA, 6.5%, 2018 | 9,250,000 | 10,354,358 | ||||
| North Carolina Municipal Power Agency, Catawba Electric Rev., 6.375%, 2013 | 2,250,000 | 2,324,318 | ||||
| North Carolina Municipal Power Agency, Catawba Electric Rev., “A”, MBIA, 5.25%, 2019 (u) | 10,000,000 | 10,699,300 | ||||
| Northern California Transmission Agency, MBIA, 7%, 2013 | 4,000,000 | 4,371,800 | ||||
| Piedmont, SC, Municipal Power Agency, FGIC, 6.25%, 2021 | 4,150,000 | 4,271,346 | ||||
| South Carolina Public Service Authority, “B”, FSA, 5.125%, 2037 | 8,500,000 | 8,519,805 | ||||
| Washington Public Power Supply System Rev. (Nuclear Project #3), 7.125%, 2016 | 5,145,000 | 6,362,410 | ||||
| $ | 107,581,291 | |||||
| Utilities - Other - 1.4% | ||||||
| Main Street Natural Gas, Inc., GA, Gas Project Rev., “A”, 5%, 2022 | $ | 1,000,000 | $ | 790,960 | ||
| Main Street Natural Gas, Inc., GA, Gas Project Rev., “A”, 5.5%, 2026 | 845,000 | 533,618 | ||||
38
Table of Contents
Portfolio of Investments – continued
| Issuer | Shares/Par | Value ($) | ||||
| Municipal Bonds - continued | ||||||
| Utilities - Other - continued | ||||||
| Main Street Natural Gas, Inc., GA, Gas Project Rev., “A”, 5.5%, 2028 | $ | 1,740,000 | $ | 1,069,752 | ||
| Public Authority for Colorado Energy Natural Gas Purchase Rev., 6.5%, 2038 | 1,485,000 | 1,109,934 | ||||
| Salt Verde Financial Corp., AZ, Senior Gas Rev., 5%, 2032 | 5,645,000 | 3,437,015 | ||||
| Salt Verde Financial Corp., AZ, Senior Gas Rev., 5%, 2037 | 5,425,000 | 3,173,571 | ||||
| Tennessee Energy Acquisition Corp., Gas Rev., “A”, 5.25%, 2017 | 1,575,000 | 1,278,632 | ||||
| Tennessee Energy Acquisition Corp., Gas Rev., “A”, 5.25%, 2022 | 1,665,000 | 1,230,901 | ||||
| Tennessee Energy Acquisition Corp., Gas Rev., “A”, 5.25%, 2023 | 2,385,000 | 1,737,783 | ||||
| Tennessee Energy Acquisition Corp., Gas Rev., “A”, 5.25%, 2026 | 4,390,000 | 3,074,580 | ||||
| Tennessee Energy Acquisition Corp., Gas Rev., “C”, 5%, 2025 | 1,350,000 | 933,444 | ||||
| $ | 18,370,190 | |||||
| Water & Sewer Utility Revenue - 6.0% | ||||||
| California State Department of Water Resources Center (Valley Project Rev.), “AF”, 5%, 2028 (u) | $ | 23,825,000 | $ | 24,096,605 | ||
| Commonwealth of Puerto Rico Aqueduct & Sewer Authority Rev., “A”, 6%, 2038 | 3,580,000 | 3,064,373 | ||||
| Commonwealth of Puerto Rico Aqueduct & Sewer Authority Rev., “A”, 6%, 2044 | 1,290,000 | 1,083,226 | ||||
| Forsyth County, GA, Water & Sewer Authority Rev., 6.25%, 2010 (c) | 1,055,000 | 1,125,601 | ||||
| Forsyth County, GA, Water & Sewer Authority Rev., 6.25%, 2010 (c) | 1,170,000 | 1,248,296 | ||||
| Hampton Roads, VA, Sanitation District Wastewater Rev., 5%, 2033 | 910,000 | 915,242 | ||||
| Los Angeles County, CA, Sanitation Districts Financing Authority Rev., AMBAC, 4.5%, 2038 | 7,840,000 | 6,241,267 | ||||
| Massachusetts Water Pollution Abatement, 5.25%, 2028 | 5,985,000 | 6,368,160 | ||||
| Massachusetts Water Resources Authority, “A”, FSA, 4.375%, 2032 | 6,060,000 | 5,337,284 | ||||
| Massachusetts Water Resources Authority, “B”, FSA, 5.25%, 2029 | 4,215,000 | 4,381,113 | ||||
| Massachusetts Water Resources Authority, ETM, 6.5%, 2019 (c) | 5,965,000 | 7,311,658 | ||||
| New York Environmental Facilities, ETM, 5%, 2016 (c) | 570,000 | 576,737 | ||||
| New York, NY, City Municipal Water Finance Authority, Water & Sewer Systems Rev. “DD”, 4.75%, 2035 | 4,000,000 | 3,689,240 | ||||
| New York, NY, Municipal Water & Sewer Finance Authority Rev., AMBAC, 5%, 2039 | 2,000,000 | 1,898,420 | ||||
| New York, NY, Municipal Water & Sewer Finance Authority Rev., “A”, 5%, 2035 | 4,480,000 | 4,352,230 | ||||
| San Luis Obispo County, CA, Financing Authority Rev. (Nacimiento Water Project), “A”, SBHAC, 5%, 2032 | 3,405,000 | 3,390,869 | ||||
| Spartanburg, SC, Water & Sewer Authority Rev., “B”, MBIA, 5.25%, 2030 | 1,175,000 | 1,183,025 | ||||
| West Virginia Water Development Authority Loan Program, “B”, AMBAC, 4.75%, 2035 | 500,000 | 452,690 | ||||
| $ | 76,716,036 | |||||
| Total Municipal Bonds (Identified Cost, $1,327,390,441) | $ | 1,283,007,925 | ||||
39
Table of Contents
Portfolio of Investments – continued
| Floating Rate Demand Notes - 1.1% | |||||||
| Issuer | Shares/Par | Value ($) | |||||
| Jacksonville, FL, Pollution Control Rev. (Florida Power & Light Co.), 1.00%, due 4/01/09 | $ | 100,000 | $ | 100,000 | |||
| Lincoln County, WY, Pollution Control Rev. (Exxon Mobil Corp.), “A”, 0.20%, due 4/01/09 | 2,600,000 | 2,600,000 | |||||
| Lincoln County, WY, Pollution Control Rev. (Exxon Mobil Corp.), “B”, 0.20%, due 4/01/09 | 12,100,000 | 12,100,000 | |||||
| Total Floating Rate Demand Notes, at Identified Cost and Value | $ | 14,800,000 | |||||
| Money Market Funds (v) - 0.0% | |||||||
| MFS Institutional Money Market Portfolio, 0.23%, at Cost and Net Asset Value | 55,180 | $ | 55,180 | ||||
| Total Investments (Identified Cost, $1,342,245,621) | $ | 1,297,863,105 | |||||
| Other Assets, Less Liabilities - (1.1)% | (14,502,574 | ) | |||||
| Net Assets - 100.0% | $ | 1,283,360,531 | |||||
| (b) | Mandatory tender date is earlier than stated maturity date. |
| (c) | Refunded bond. |
| (d) | Non-income producing security-in default. |
| (f) | All or a portion of the security has been segregated as collateral for open futures contracts. |
| (n) | Securities exempt from registration under Rule 144A of the Securities Act of 1933. These securities may be sold in the ordinary course of business in transactions exempt from registration, normally to qualified institutional buyers. At period end, the aggregate value of these securities was $2,480,120 representing 0.2% of net assets. |
| (p) | Primary inverse floater. |
| (u) | Underlying security deposited into special purpose trust (“the trust”) by investment banker upon creation of self-deposited inverse floaters. |
| (v) | Underlying fund that is available only to investment companies managed by MFS. The rate quoted is the annualized seven-day yield of the fund at period end. |
| (z) | Restricted securities are not registered under the Securities Act of 1933 and are subject to legal restrictions on resale. These securities generally may be resold in transactions exempt from registration or to the public if the securities are subsequently registered. Disposal of these securities may involve time-consuming negotiations and prompt sale at an acceptable price may be difficult. The fund holds the following restricted securities: |
| Restricted Securities | Acquisition Date | Cost | Current Market Value | ||||
| MuniMae TE Bond Subsidiary LLC, “A-2”, 4.9%, 2049 | 10/14/04 | $2,000,000 | $1,330,300 | ||||
| % of Net Assets | 0.1 | % |
40
Table of Contents
Portfolio of Investments – continued
Derivative Contracts at 3/31/09
Futures contracts outstanding at 3/31/09
| Description | Contracts | Value | Expiration Date | Unrealized Appreciation (Depreciation) | |||||
| U.S. Treasury Bond 30 yr (Short) | 181 | $23,476,266 | Jun-09 | $(542,219 | ) |
At March 31, 2009, the fund had sufficient cash and/or other liquid securities to cover any commitments under these derivative contracts.
The following abbreviations are used in this report and are defined:
| ETM | Escrowed to Maturity |
| FRN | Floating Rate Note. Interest rate resets periodically and may not be the rate reported at period end. |
| LOC | Letter of Credit |
| Insurers | Inverse Floaters | |||||
| AMBAC | AMBAC Indemnity Corp. | RIBS | Residual Interest Bonds | |||
| ASSD GTY | Assured Guaranty Insurance Co. | RITES | Residual Interest Tax-Exempt Security | |||
| BHAC | Berkshire Hathaway Assurance Corp. | |||||
| CHCLI | California Health Construction Loan Insurance | |||||
| FGIC | Financial Guaranty Insurance Co. | |||||
| FHA | Federal Housing Administration | |||||
| FHLMC | Federal Home Loan Mortgage Corp. | |||||
| FNMA | Federal National Mortgage Assn. | |||||
| FSA | Financial Security Assurance Inc. | |||||
| GNMA | Government National Mortgage Assn. | |||||
| MBIA | MBIA Insurance Corp. | |||||
| PSF | Permanent School Fund | |||||
| SBHAC | Secondary Berkshire Hathaway Assurance Corp. | |||||
| XLCA | XL Capital Insurance Co. | |||||
See Notes to Financial Statements
41
Table of Contents
Financial Statements
STATEMENT OF ASSETS AND LIABILITIES
At 3/31/09
This statement represents your fund’s balance sheet, which details the assets and liabilities comprising the total value of the fund.
| Assets | |||||
Investments- | |||||
Non-affiliated issuers, at value (identified cost, $1,342,190,441) | $1,297,807,925 | ||||
Underlying funds, at cost and value | 55,180 | ||||
Total investments, at value (identified cost, $1,342,245,621) | $1,297,863,105 | ||||
Cash | 11,042 | ||||
Receivable for investments sold | 2,223,596 | ||||
Receivable for fund shares sold | 2,639,206 | ||||
Interest and dividends receivable | 19,820,129 | ||||
Receivable from investment adviser | 86,679 | ||||
Other assets | 15,137 | ||||
Total assets | $1,322,658,894 | ||||
| Liabilities | |||||
Distributions payable | $1,985,568 | ||||
Payable for daily variation margin on open futures contracts | 135,750 | ||||
Payable for investments purchased | 5,043,135 | ||||
Payable to the holder of the floating rate certificate from trust assets | 30,202,857 | ||||
Payable for fund shares reacquired | 1,469,434 | ||||
Payable to affiliates | |||||
Management fee | 28,033 | ||||
Shareholder servicing costs | 152,574 | ||||
Distribution and service fees | 12,333 | ||||
Administrative services fee | 1,416 | ||||
Payable for independent trustees’ compensation | 67,299 | ||||
Payable for interest expense and fees | 84,411 | ||||
Accrued expenses and other liabilities | 115,553 | ||||
Total liabilities | $39,298,363 | ||||
Net assets | $1,283,360,531 | ||||
| Net assets consist of | |||||
Paid-in capital | $1,336,822,413 | ||||
Unrealized appreciation (depreciation) on investments | (44,924,735 | ) | |||
Accumulated net realized gain (loss) on investments | (9,819,212 | ) | |||
Undistributed net investment income | 1,282,065 | ||||
Net assets | $1,283,360,531 | ||||
Shares of beneficial interest outstanding | 167,390,312 |
42
Table of Contents
Statement of Assets and Liabilities – continued
Class A shares | ||||
Net assets | $420,233,941 | |||
Shares outstanding | 54,839,437 | |||
Net asset value per share | $7.66 | |||
Offering price per share (100/95.25 × net asset value per share) | $8.04 | |||
Class B shares | ||||
Net assets | $20,978,357 | |||
Shares outstanding | 2,733,226 | |||
Net asset value and offering price per share | $7.68 | |||
Class C shares | ||||
Net assets | $77,937,347 | |||
Shares outstanding | 10,131,462 | |||
Net asset value and offering price per share | $7.69 | |||
Class A1 shares | ||||
Net assets | $746,020,484 | |||
Shares outstanding | 97,315,469 | |||
Net asset value and redemption price per share | $7.67 | |||
Offering price per share (100/95.25 × net asset value per share) | $8.05 | |||
Class B1 shares | ||||
Net assets | $18,190,402 | |||
Shares outstanding | 2,370,718 | |||
Net asset value and offering price per share | $7.67 |
On sales of $50,000 or more, the offering price of Class A and Class A1 shares are reduced. A contingent deferred sales charge may be imposed on redemptions of Class A, Class B, Class C, Class A1, and Class B1 shares.
See Notes to Financial Statements
43
Table of Contents
Financial Statements
Year ended 3/31/09
This statement describes how much your fund earned in investment income and accrued in expenses. It also describes any gains and/or losses generated by fund operations.
| Net investment income | ||||||
Income | ||||||
Interest | $69,378,925 | |||||
Dividends from underlying funds | 9,461 | |||||
Total investment income | $69,388,386 | |||||
Expenses | ||||||
Management fee | $5,572,876 | |||||
Distribution and service fees | 1,800,981 | |||||
Shareholder servicing costs | 1,089,318 | |||||
Administrative services fee | 214,489 | |||||
Independent trustees’ compensation | 40,699 | |||||
Custodian fee | 188,363 | |||||
Shareholder communications | 49,964 | |||||
Auditing fees | 47,046 | |||||
Legal fees | 39,301 | |||||
Interest expense and fees | 845,407 | |||||
Miscellaneous | 292,244 | |||||
Total expenses | $10,180,688 | |||||
Fees paid indirectly | (79,293 | ) | ||||
Reduction of expenses by investment adviser | (2,348,548 | ) | ||||
Net expenses | $7,752,847 | |||||
Net investment income | $61,635,539 | |||||
| Realized and unrealized gain (loss) on investments | ||||||
Realized gain (loss) (identified cost basis) | ||||||
Investment transactions | $(7,206,244 | ) | ||||
Futures contracts | (2,435,957 | ) | ||||
Net realized gain (loss) on investments | $(9,642,201 | ) | ||||
Change in unrealized appreciation (depreciation) | ||||||
Investments | $(68,559,062 | ) | ||||
Futures contracts | (666,280 | ) | ||||
Net unrealized gain (loss) on investments | $(69,225,342 | ) | ||||
Net realized and unrealized gain (loss) on investments | $(78,867,543 | ) | ||||
Change in net assets from operations | $(17,232,004 | ) |
See Notes to Financial Statements
44
Table of Contents
Financial Statements
STATEMENTS OF CHANGES IN NET ASSETS
These statements describe the increases and/or decreases in net assets resulting from operations, any distributions, and any shareholder transactions.
| Years ended 3/31 | ||||||
| 2009 | 2008 | |||||
| Change in net assets | ||||||
| From operations | ||||||
Net investment income | $61,635,539 | $53,556,368 | ||||
Net realized gain (loss) on investments | (9,642,201 | ) | 5,184,545 | |||
Net unrealized gain (loss) on investments | (69,225,342 | ) | (38,955,725 | ) | ||
Change in net assets from operations | $(17,232,004 | ) | $19,785,188 | |||
| Distributions declared to shareholders | ||||||
From net investment income | ||||||
Class A | $(16,567,350 | ) | $(12,232,669 | ) | ||
Class B | (884,245 | ) | (946,157 | ) | ||
Class C | (2,444,944 | ) | (1,451,193 | ) | ||
Class A1 | (41,392,013 | ) | (35,551,163 | ) | ||
Class B1 | (984,487 | ) | (1,003,290 | ) | ||
From net realized gain on investments | ||||||
Class A | (1,527,122 | ) | (275,822 | ) | ||
Class B | (88,206 | ) | (23,678 | ) | ||
Class C | (261,836 | ) | (39,170 | ) | ||
Class A1 | (3,340,130 | ) | (979,811 | ) | ||
Class B1 | (89,692 | ) | (32,472 | ) | ||
Total distributions declared to shareholders | $(67,580,025 | ) | $(52,535,425 | ) | ||
Change in net assets from fund share transactions | $132,468,632 | $958,239,656 | ||||
Total change in net assets | $47,656,603 | $925,489,419 | ||||
| Net assets | ||||||
At beginning of period | 1,235,703,928 | 310,214,509 | ||||
At end of period (including undistributed net investment income of $1,282,065 and $288,114, respectively) | $1,283,360,531 | $1,235,703,928 | ||||
See Notes to Financial Statements
45
Table of Contents
Financial Statements
The financial highlights table is intended to help you understand the fund’s financial performance for the past 5 years (or life of a particular share class, if shorter). Certain information reflects financial results for a single fund share. The total returns in the table represent the rate by which an investor would have earned (or lost) on an investment in the fund share class (assuming reinvestment of all distributions) held for the entire period.
| Class A | Years ended 3/31 | ||||||||||||||
| 2009 | 2008 | 2007 | 2006 | 2005 | |||||||||||
Net asset value, beginning of period | $8.21 | $8.55 | $8.53 | $8.58 | $8.70 | ||||||||||
| Income (loss) from investment operations | |||||||||||||||
Net investment income (d) | $0.38 | $0.42 | $0.42 | (z) | $0.41 | $0.42 | |||||||||
Net realized and unrealized gain (loss) | (0.51 | ) | (0.35 | ) | 0.00 | (w)(z) | (0.06 | ) | (0.13 | ) | |||||
Total from investment operations | $(0.13 | ) | $0.07 | $0.42 | $0.35 | $0.29 | |||||||||
| Less distributions declared to shareholders | |||||||||||||||
From net investment income | $(0.39 | ) | $(0.40 | ) | $(0.40 | ) | $(0.40 | ) | $(0.41 | ) | |||||
From net realized gain on investments | (0.03 | ) | (0.01 | ) | — | — | — | ||||||||
Total distributions declared | $(0.42 | ) | $(0.41 | ) | $(0.40 | ) | $(0.40 | ) | $(0.41 | ) | |||||
Net asset value, end of period | $7.66 | $8.21 | $8.55 | $8.53 | $8.58 | ||||||||||
Total return (%) (r)(s)(t) | (1.53 | ) | 0.81 | 5.00 | 4.18 | 3.49 | |||||||||
| Ratios (%) (to average net assets) and Supplemental data: | |||||||||||||||
Expenses before expense reductions (f) | 0.92 | 1.05 | 1.19 | 1.17 | 1.04 | ||||||||||
Expenses after expense reductions (f) | 0.74 | 0.80 | 0.94 | 0.92 | 0.79 | ||||||||||
Expenses after expense reductions and excluding interest expense and fees (f)(l) | 0.67 | 0.70 | 0.79 | 0.81 | 0.79 | ||||||||||
Net investment income | 4.88 | 4.99 | 4.91 | (z) | 4.71 | 4.90 | |||||||||
Portfolio turnover | 25 | 32 | 10 | 9 | 8 | ||||||||||
Net assets at end of period (000 Omitted) | $420,234 | $279,614 | $248,226 | $240,212 | $241,850 | ||||||||||
See Notes to Financial Statements
46
Table of Contents
Financial Highlights – continued
| Class B | Years ended 3/31 | ||||||||||||||
| 2009 | 2008 | 2007 | 2006 | 2005 | |||||||||||
Net asset value, beginning of period | $8.22 | $8.57 | $8.54 | $8.59 | $8.72 | ||||||||||
| Income (loss) from investment operations | |||||||||||||||
Net investment income (d) | $0.33 | $0.36 | $0.36 | (z) | $0.34 | $0.36 | |||||||||
Net realized and unrealized gain (loss) | (0.51 | ) | (0.36 | ) | 0.00 | (w)(z) | (0.05 | ) | (0.14 | ) | |||||
Total from investment operations | $(0.18 | ) | $0.00 | (w) | $0.36 | $0.29 | $0.22 | ||||||||
| Less distributions declared to shareholders | |||||||||||||||
From net investment income | $(0.33 | ) | $(0.34 | ) | $(0.33 | ) | $(0.34 | ) | $(0.35 | ) | |||||
From net realized gain on investments | (0.03 | ) | (0.01 | ) | — | — | — | ||||||||
Total distributions declared | $(0.36 | ) | $(0.35 | ) | $(0.33 | ) | $(0.34 | ) | $(0.35 | ) | |||||
Net asset value, end of period | $7.68 | $8.22 | $8.57 | $8.54 | $8.59 | ||||||||||
Total return (%) (r)(s)(t) | (2.13 | ) | (0.06 | ) | 4.34 | 3.40 | 2.60 | ||||||||
| Ratios (%) (to average net assets) and Supplemental data: | |||||||||||||||
Expenses before expense reductions (f) | 1.68 | 1.80 | 1.95 | 1.92 | 1.79 | ||||||||||
Expenses after expense reductions (f) | 1.49 | 1.55 | 1.70 | 1.67 | 1.54 | ||||||||||
Expenses after expense reductions and | 1.42 | 1.45 | 1.55 | 1.56 | 1.54 | ||||||||||
Net investment income | 4.12 | 4.24 | 4.16 | (z) | 3.96 | 4.15 | |||||||||
Portfolio turnover | 25 | 32 | 10 | 9 | 8 | ||||||||||
Net assets at end of period (000 Omitted) | $20,978 | $22,372 | $26,919 | $36,752 | $43,930 | ||||||||||
See Notes to Financial Statements
47
Table of Contents
Financial Highlights – continued
| Class C | Years ended 3/31 | ||||||||||||||
| 2009 | 2008 | 2007 | 2006 | 2005 | |||||||||||
Net asset value, beginning of period | $8.24 | $8.59 | $8.56 | $8.61 | $8.73 | ||||||||||
| Income (loss) from investment operations | |||||||||||||||
Net investment income (d) | $0.32 | $0.35 | $0.36 | (z) | $0.35 | $0.36 | |||||||||
Net realized and unrealized gain (loss) on investments | (0.51 | ) | (0.35 | ) | 0.01 | (z) | (0.06 | ) | (0.13 | ) | |||||
Total from investment operations | $(0.19 | ) | $0.00 | (w) | $0.37 | $0.29 | $0.23 | ||||||||
| Less distributions declared to shareholders | |||||||||||||||
From net investment income | $(0.33 | ) | $(0.34 | ) | $(0.34 | ) | $(0.34 | ) | $(0.35 | ) | |||||
From net realized gain on investments | (0.03 | ) | (0.01 | ) | — | — | — | ||||||||
Total distributions declared | $(0.36 | ) | $(0.35 | ) | $(0.34 | ) | $(0.34 | ) | $(0.35 | ) | |||||
Net asset value, end of period | $7.69 | $8.24 | $8.59 | $8.56 | $8.61 | ||||||||||
Total return (%) (r)(s)(t) | (2.25 | ) | (0.05 | ) | 4.34 | 3.41 | 2.72 | ||||||||
| Ratios (%) (to average net assets) and Supplemental data: | |||||||||||||||
Expenses before expense reductions (f) | 1.67 | 1.80 | 1.94 | 1.92 | 1.79 | ||||||||||
Expenses after expense reductions (f) | 1.48 | 1.55 | 1.69 | 1.67 | 1.54 | ||||||||||
Expenses after expense reductions and | 1.41 | 1.45 | 1.54 | 1.56 | 1.54 | ||||||||||
Net investment income | 4.10 | 4.23 | 4.16 | (z) | 4.09 | 4.15 | |||||||||
Portfolio turnover | 25 | 32 | 10 | 9 | 8 | ||||||||||
Net assets at end of period (000 Omitted) | $77,937 | $42,759 | $35,070 | $34,618 | $33,911 | ||||||||||
See Notes to Financial Statements
48
Table of Contents
Financial Highlights – continued
| Class A1 | Years ended 3/31 | |||||
| 2009 | 2008 (i) | |||||
Net asset value, beginning of period | $8.21 | $8.39 | ||||
| Income (loss) from investment operations | ||||||
Net investment income (d) | $0.40 | $0.34 | ||||
Net realized and unrealized gain (loss) on investments | (0.50 | ) | (0.18 | )(g) | ||
Total from investment operations | $(0.10 | ) | $0.16 | |||
| Less distributions declared to shareholders | ||||||
From net investment income | $(0.41 | ) | $(0.33 | ) | ||
From net realized gain on investments | (0.03 | ) | (0.01 | ) | ||
Total distributions declared to shareholders | $(0.44 | ) | $(0.34 | ) | ||
Net asset value, end of period | $7.67 | $8.21 | ||||
Total return (%) (r)(s)(t) | (1.15 | ) | 1.84 | (n) | ||
| Ratios (%) (to average net assets) and Supplemental data: | ||||||
Expenses before expense reductions (f) | 0.68 | 0.79 | (a) | |||
Expenses after expense reductions (f) | 0.49 | 0.54 | (a) | |||
Expenses after expense reductions and excluding interest expense | 0.42 | 0.44 | (a) | |||
Net investment income | 5.13 | 5.26 | (a) | |||
Portfolio turnover | 25 | 32 | ||||
Net assets at end of period (000 Omitted) | $746,020 | $864,341 | ||||
See Notes to Financial Statements
49
Table of Contents
Financial Highlights – continued
| Class B1 | Years ended 3/31 | |||||
| 2009 | 2008 (i) | |||||
Net asset value, beginning of period | $8.22 | $8.40 | ||||
| Income (loss) from investment operations | ||||||
Net investment income (d) | $0.35 | $0.29 | ||||
Net realized and unrealized gain (loss) on investments | (0.52 | ) | (0.18 | )(g) | ||
Total from investment operations | $(0.17 | ) | $0.11 | |||
| Less distributions declared to shareholders | ||||||
From net investment income | $(0.35 | ) | $(0.28 | ) | ||
From net realized gain on investments | (0.03 | ) | (0.01 | ) | ||
Total distributions declared to shareholders | $(0.38 | ) | $(0.29 | ) | ||
Net asset value, end of period | $7.67 | $8.22 | ||||
Total return (%) (r)(s)(t) | (2.02 | ) | 1.24 | (n) | ||
| Ratios (%) (to average net assets) and Supplemental data: | ||||||
Expenses before expense reductions (f) | 1.44 | 1.55 | (a) | |||
Expenses after expense reductions (f) | 1.24 | 1.30 | (a) | |||
Expenses after expense reductions and excluding interest expense | 1.17 | 1.21 | (a) | |||
Net investment income | 4.36 | 4.50 | (a) | |||
Portfolio turnover | 25 | 32 | ||||
Net assets at end of period (000 Omitted) | $18,190 | $26,618 | ||||
Any redemption fees charged by the fund during the 2005 fiscal year resulted in a per share impact of less than $0.01.
| (a) | Annualized |
| (d) | Per share data are based on average shares outstanding. |
| (f) | Ratios do not reflect reductions from fees paid indirectly, if applicable. |
| (g) | The per share amount is not in accordance with the net realized and unrealized gain/loss for the period because of the timing of sales of fund shares and the per share amount of realized and unrealized gains and losses at such time. |
| (i) | For the period from the class’ inception, June 25, 2007 (Classes A1 and B1) through the stated period end. |
| (l) | Interest expense and fees relate to payments made to the holder of the floating rate certificate from trust assets. |
| (n) | Not annualized |
| (r) | Certain expenses have been reduced without which performance would have been lower. |
| (s) | From time to time the fund may receive proceeds from litigation settlements, without which performance would be lower. |
| (t) | Total returns do not include any applicable sales charges. |
| (w) | Per share amount was less than $0.01. |
| (z) | The fund applied a change in estimate for amortization of premium on certain debt securities in the year ended March 31, 2007 that resulted in an increase of $0.03 per share to net investment income, a decrease of $0.03 per share to net realized and unrealized gain (loss) on investments, and an increase of 0.30% to the net investment income ratio for Class A, Class B, and Class C. The change in estimate had no impact on net assets, net asset value per share or total return of the class. |
See Notes to Financial Statements
50
Table of Contents
| (1) | Business and Organization |
MFS Municipal Income Fund (the fund) is a series of MFS Municipal Series Trust which is organized as a Massachusetts business trust and is registered under the Investment Company Act of 1940, as amended, as an open-end management investment company.
| (2) | Significant Accounting Policies |
General – The preparation of financial statements in conformity with U.S. generally accepted accounting principles requires management to make estimates and assumptions that affect the reported amounts of assets and liabilities, and disclosure of contingent assets and liabilities at the date of the financial statements and the reported amounts of revenues and expenses during the reporting period. Actual results could differ from those estimates. The value of municipal instruments can be affected by changes in their actual or perceived credit quality. The credit quality of municipal instruments can be affected by, among other things, the financial condition of the issuer or guarantor, the issuer’s future borrowing plans and sources of revenue, the economic feasibility of the revenue bond project or general borrowing purpose, political or economic developments in the region where the instrument is issued and the liquidity of the security. Municipal instruments generally trade in the over-the-counter market. Municipal instruments backed by current or anticipated revenues from a specific project or specific assets can be negatively affected by the discontinuance of the taxation supporting the projects or assets or the inability to collect revenues for the project or from the assets. If the Internal Revenue Service determines an issuer of a municipal instrument has not complied with applicable tax requirements, the security could decline in value, interest from the security could become taxable and the fund may be required to issue Forms 1099-DIV.
Investment Valuations – Debt instruments and floating rate loans (other than short-term instruments), including restricted debt instruments, are generally valued at an evaluated or composite bid as provided by a third-party pricing service. Short-term instruments with a maturity at issuance of 60 days or less generally are valued at amortized cost, which approximates market value. Futures contracts are generally valued at last posted settlement price as provided by a third-party pricing service on the market on which they are primarily traded. Futures contracts for which there were no trades that day for a particular position are generally valued at the closing bid quotation as provided by a third-party pricing service on the market on which such futures contracts are primarily traded. Open-end investment companies are generally valued at their net asset value per share. Securities and other assets generally valued on the basis of information from a third-party pricing service may also
51
Table of Contents
Notes to Financial Statements – continued
be valued at a broker/dealer bid quotation. Values obtained from pricing services can utilize both dealer-supplied valuations and electronic data processing techniques, which take into account factors such as institutional-size trading in similar groups of securities, yield, quality, coupon rate, maturity, type of issue, trading characteristics, and other market data.
The Board of Trustees has delegated primary responsibility for determining or causing to be determined the value of the fund’s investments (including any fair valuation) to the adviser pursuant to valuation policies and procedures approved by the Board. If the adviser determines that reliable market quotations are not readily available, investments are valued at fair value as determined in good faith by the adviser in accordance with such procedures under the oversight of the Board of Trustees. Under the fund’s valuation policies and procedures, market quotations are not considered to be readily available for most types of debt instruments and floating rate loans and many types of derivatives. These investments are generally valued at fair value based on information from third party pricing services. In addition, investments may be valued at fair value if the adviser determines that an investment’s value has been materially affected by events occurring after the close of the exchange or market on which the investment is principally traded (such as foreign exchange or market) and prior to the determination of the fund’s net asset value, or after the halting of trading of a specific security where trading does not resume prior to the close of the exchange or market on which the security is principally traded. The adviser may rely on third party pricing services or other information (such as the correlation with price movements of similar securities in the same or other markets; the type, cost and investment characteristics of the security; the business and financial condition of the issuer; and trading and other market data) to assist in determining whether to fair value and at what value to fair value an investment. The value of an investment for purposes of calculating the fund’s net asset value can differ depending on the source and method used to determine value. When fair valuation is used, the value of investments used to determine the fund’s net asset value may differ from quoted or published prices for the same investment. There can be no assurance that the fund could obtain the fair value assigned to an investment if it were to sell the investment at the same time at which the fund determines its net asset value per share.
The fund adopted FASB Statement No. 157, Fair Value Measurements (the “Statement”). This Statement provides a single definition of fair value, a hierarchy for measuring fair value and expanded disclosures about fair value measurements.
Various inputs are used in determining the value of the fund’s assets or liabilities carried at market value. These inputs are categorized into three broad levels. Level 1 includes quoted prices in active markets for identical assets or
52
Table of Contents
Notes to Financial Statements – continued
liabilities. Level 2 includes other significant observable market-based inputs (including quoted prices for similar securities, interest rates, prepayment speed, and credit risk). Level 3 includes unobservable inputs, which may include the adviser’s own assumptions in determining the fair value of investments. Other financial instruments are derivative instruments not reflected in total investments, such as futures, forwards, swap contracts and written options. The following is a summary of the levels used as of March 31, 2009 in valuing the fund’s assets or liabilities carried at market value:
| Level 1 | Level 2 | Level 3 | Total | |||||||
| Investments in Securities | $55,180 | $1,297,807,925 | $— | $1,297,863,105 | ||||||
| Other Financial Instruments | $(542,219 | ) | $— | $— | $(542,219 | ) |
Derivative Risk – The fund may invest in derivatives for hedging or non-hedging purposes. While hedging can reduce or eliminate losses, it can also reduce or eliminate gains. When the fund uses derivatives as an investment to gain market exposure, or for hedging purposes, gains and losses from derivative instruments may be substantially greater than the derivative’s original cost. Cash that has been segregated on behalf of certain derivative contracts will be reported separately on the Statement of Assets and Liabilities as restricted cash. On some over-the-counter derivatives, the fund attempts to reduce its exposure to counterparty credit risk by entering into an ISDA Master Agreement on a bilateral basis with each of the counterparties with whom it undertakes a significant volume of transactions. The ISDA Master Agreement gives the fund the right, upon an event of default by the applicable counterparty, to close out all transactions traded under such agreement and to net amounts owed under each transaction to one net amount payable by one party to the other. This right to close out and net payments across all transactions traded under the ISDA Master Agreement could result in a reduction of the fund’s credit risk to such counterparty equal to any amounts payable by the fund under the applicable transactions, if any. However, absent an event of default by the counterparty, the ISDA Master Agreement does not result in an offset of reported balance sheet assets and liabilities across transactions between the fund and the applicable counterparty. Derivative instruments include futures contracts.
In March 2008, FASB Statement No. 161, Disclosures about Derivative Instruments and Hedging Activities (the “Standard”) was issued, and is effective for financial statements issued for fiscal years and interim periods beginning after November 15, 2008. This Standard provides enhanced disclosures about the fund’s use of and accounting for derivative instruments and the effect of derivative instruments on the fund’s results of operations and financial position. Management is evaluating the application of the Standard to the fund, and believes the impact resulting from the adoption of this Standard will be limited to expanded disclosure in the fund’s financial statements.
53
Table of Contents
Notes to Financial Statements – continued
FASB Staff Position (FSP) 133-1 was implemented during the period. FSP 133-1 amends FAS 133 to require sellers of credit derivatives to make disclosures that will enable financial statement users to assess the potential effects of those credit derivatives on an entity’s financial position, financial performance and cash flows. There was no impact from implementing FSP 133-1 as the fund did not hold any of these credit derivatives at period end.
Futures Contracts – The fund may enter into futures contracts for the delayed delivery of securities or currency, or contracts based on financial indices at a fixed price on a future date. In entering such contracts, the fund is required to deposit with the broker either in cash or securities an amount equal to a certain percentage of the contract amount. Subsequent payments are made or received by the fund each day, depending on the daily fluctuations in the value of the contract, and are recorded for financial statement purposes as unrealized gains or losses by the fund. Upon entering into such contracts, the fund bears the risk of interest or exchange rates or securities prices moving unexpectedly, in which case, the fund may not achieve the anticipated benefits of the futures contracts and may realize a loss.
Inverse Floaters – The fund invests in municipal inverse floating rate securities which are structured by the issuer (known as primary market inverse floating rate securities) or by an investment banker utilizing municipal bonds which have already been issued (known as secondary market inverse floating rate securities) to have variable rates of interest which typically move in the opposite direction of short term interest rates. A secondary market inverse floating rate security is created when an investment banker transfers a fixed rate municipal bond to a special purpose trust, and causes the trust to (a) issue floating rate certificates to third parties, in an amount equal to a fraction of the par amount of the deposited bonds (these certificates usually pay tax-exempt interest at short-term interest rates that typically reset weekly; and the certificate holders typically, on seven days notice, have the option to tender their certificates to the investment banker or another party for redemption at par plus accrued interest), and (b) issue inverse floating rate certificates (sometimes referred to as “inverse floaters”). If the holder of the inverse floater transfers the municipal bonds to an investment banker for the purpose of depositing the municipal bonds into the special purpose trust, the inverse floating rate certificates that are issued by the trust are referred to as “self-deposited inverse floaters.” If the bonds held by the trust are purchased by the investment banker for deposit into the trust from someone other than the purchasers of the inverse floaters, the inverse floating rate certificates that are issued by the trust are referred to as “externally deposited inverse floaters.” Such self-deposited inverse floaters held by the fund are accounted for as secured borrowings, with the municipal bonds reflected in the investments of the fund and amounts owed to the holder of the floating rate certificate under
54
Table of Contents
Notes to Financial Statements – continued
the provisions of the trust, which amounts are paid solely from the assets of the trust, reflected as liabilities of the fund in the Statement of Assets and Liabilities under the caption, “Payable to the holder of the floating rate certificate from trust assets”. At March 31, 2009, the fund’s payable to the holder of the floating rate certificate from trust assets was $30,202,857 and the interest rate on these floating rate certificates issued by the trust was 1.93%. For the year ended March 31, 2009, the average daily payable to the holder of the floating rate certificate from trust assets was $29,296,110 at a weighted average interest rate of 2.89%. Interest expense and fees relate to interest payments made to the holder of certain floating rate certificates and associated fees, both of which are made from trust assets. Interest expense and fees are recorded as incurred. For the year ended March 31, 2009, interest expense and fees in connection with self-deposited inverse floaters was $845,407. Primary and externally deposited inverse floaters held by the fund are not accounted for as secured borrowings.
Indemnifications – Under the fund’s organizational documents, its officers and trustees may be indemnified against certain liabilities and expenses arising out of the performance of their duties to the fund. Additionally, in the normal course of business, the fund enters into agreements with service providers that may contain indemnification clauses. The fund’s maximum exposure under these agreements is unknown as this would involve future claims that may be made against the fund that have not yet occurred.
Investment Transactions and Income – Investment transactions are recorded on the trade date. Interest income is recorded on the accrual basis. All premium and discount is amortized or accreted for financial statement purposes in accordance with U.S. generally accepted accounting principles. Dividends received in cash are recorded on the ex-dividend date. Dividend and interest payments received in additional securities are recorded on the ex-dividend or ex-interest date in an amount equal to the value of the security on such date. The fund may receive proceeds from litigation settlements. Any proceeds received from litigation involving portfolio holdings are reflected in the Statement of Operations in realized gain/loss if the security has been disposed of by the fund or in unrealized gain/loss if the security is still held by the fund. Any other proceeds from litigation not related to portfolio holdings are reflected as other income in the Statement of Operations.
Legal fees and other related expenses incurred to preserve and protect the value of a security owned are added to the cost of the security; other legal fees are expensed. Capital infusions made directly to the security issuer, which are generally non-recurring, incurred to protect or enhance the value of high-yield debt securities, are reported as additions to the cost basis of the security. Costs that are incurred to negotiate the terms or conditions of capital infusions or
55
Table of Contents
Notes to Financial Statements – continued
that are expected to result in a plan of reorganization are reported as realized losses. Ongoing costs incurred to protect or enhance an investment, or costs incurred to pursue other claims or legal actions, are expensed.
Fees Paid Indirectly – The fund’s custody fee may be reduced according to an arrangement that measures the value of cash deposited with the custodian by the fund. This amount, for the year ended March 31, 2009, is shown as a reduction of total expenses on the Statement of Operations.
Tax Matters and Distributions – The fund intends to qualify as a regulated investment company, as defined under Subchapter M of the Internal Revenue Code, and to distribute all of its taxable and tax-exempt income, including realized capital gains. As a result, no provision for federal income tax is required. The fund’s federal tax return for the prior three fiscal years remains subject to examination by the Internal Revenue Service.
Distributions to shareholders are recorded on the ex-dividend date. Income and capital gain distributions are determined in accordance with income tax regulations, which may differ from U.S. generally accepted accounting principles. Certain capital accounts in the financial statements are periodically adjusted for permanent differences in order to reflect their tax character. These adjustments have no impact on net assets or net asset value per share. Temporary differences which arise from recognizing certain items of income, expense, gain or loss in different periods for financial statement and tax purposes will reverse at some time in the future. Distributions in excess of net investment income or net realized gains are temporary overdistributions for financial statement purposes resulting from differences in the recognition or classification of income or distributions for financial statement and tax purposes.
Book/tax differences primarily relate to amortization and accretion of debt securities and secured borrowings.
The tax character of distributions declared to shareholders for the last two fiscal years is as follows:
| 3/31/09 | 3/31/08 | |||
| Ordinary income (including any short-term capital gains) | $321,955 | $— | ||
| Tax-exempt income | 61,951,084 | 51,184,472 | ||
| Long-term capital gain | 5,306,986 | 1,350,953 | ||
| $67,580,025 | $52,535,425 |
56
Table of Contents
Notes to Financial Statements – continued
The federal tax cost and the tax basis components of distributable earnings were as follows:
| As of 3/31/09 | |||
| Cost of investments | $1,309,723,500 | ||
| Gross appreciation | 51,683,810 | ||
| Gross depreciation | (93,747,062 | ) | |
| Net unrealized appreciation (depreciation) | $(42,063,252 | ) | |
| Undistributed tax-exempt income | 6,904,843 | ||
| Post-October capital loss deferral | (12,680,696 | ) | |
| Other temporary differences | (5,622,777 | ) |
Multiple Classes of Shares of Beneficial Interest – The fund offers multiple classes of shares, which differ in their respective distribution and service fees. The fund’s income and common expenses are allocated to shareholders based on the value of settled shares outstanding of each class. The fund’s realized and unrealized gain (loss) are allocated to shareholders based on the daily net assets of each class. Dividends are declared separately for each class. Differences in per share dividend rates are generally due to differences in separate class expenses. Class B and Class B1 shares will convert to Class A and Class A1 shares, respectively approximately eight years after purchase.
| (3) | Transactions with Affiliates |
Investment Adviser – The fund has an investment advisory agreement with Massachusetts Financial Services Company (MFS) to provide overall investment management and related administrative services and facilities to the fund. At the commencement of the period, the management fee was computed daily and paid monthly at an annual rate of 0.55% of the fund’s average daily net assets. Effective August 1, 2008, the management fee is computed daily and paid monthly at an annual rate of 0.40% of the fund’s average daily net assets.
As part of a settlement agreement with the New York Attorney General concerning market timing and related matters, MFS had agreed to reduce the management fee to 0.30% of the fund’s average daily net assets for the period March 1, 2004 through February 28, 2009. Effective March 1, 2009 MFS has agreed to reduce the management fee to 0.37% of the fund’s average daily net assets in excess of $1.3 billion up to $2.0 billion and 0.35% of average daily net assets in excess of $2.0 billion. This written agreement will continue until modified by the fund’s Board of Trustees, but will continue until at least July 31, 2009. For the year ended March 31, 2009, this waiver amounted to $1,759,717 and is reflected as a reduction of total expenses in the Statement of Operations.
The management fee incurred for the year ended March 31, 2009. was equivalent to an annual effective rate of 0.31% of the fund’s average daily net assets.
57
Table of Contents
Notes to Financial Statements – continued
The investment adviser had agreed in writing to pay a portion of the fund’s operating expenses, exclusive of interest, taxes, extraordinary expenses, brokerage and transaction costs and investment-related expenses (including interest expense and fees associated with investments in inverse floating rate instruments), such that total annual fund operating expenses did not exceed the following rates annually of the fund’s average daily net assets with respect to each class:
| Class A | Class B | Class C | Class A1 | Class B1 | ||||
| 0.74% | 1.49% | 1.49% | 0.49% | 1.25% |
This written agreement was terminated on July 31, 2008. Effective August 1, 2008 the investment adviser has agreed in writing to pay a portion of the fund’s operating expenses, exclusive of management fee, distribution and service fees, interest, taxes, extraordinary expenses, brokerage and transaction costs, and investment-related expenses (including interest expenses and fees associated with investments in inverse floating rate instruments) such that operating expenses do not exceed 0.10% annually of the fund’s average daily net assets. This written agreement will continue until modified by the fund’s Board of Trustees, but such agreement will continue at least until July 31, 2009. For the year ended March 31, 2009, the reduction under these agreements Amounted to $581,959 and is reflected as a reduction of total expenses in the Statement of Operations.
Distributor – MFS Fund Distributors, Inc. (MFD), a wholly-owned subsidiary of MFS, as distributor, received $209,337 and $33,750 for the year ended March 31, 2009, as its portion of the initial sales charge on sales of Class A and Class A1 shares of the fund, respectively.
The Board of Trustees has adopted a distribution plan for certain class shares pursuant to Rule 12b-1 of the Investment Company Act of 1940.
The fund’s distribution plan provides that the fund will pay MFD for services provided by MFD and financial intermediaries in connection with the distribution and servicing of certain share classes. One component of the plan is a distribution fee paid to MFD and another component of the plan is a service fee paid to MFD. MFD may subsequently pay all, or a portion, of the distribution and/or service fees to financial intermediaries.
58
Table of Contents
Notes to Financial Statements – continued
Distribution Plan Fee Table:
| Distribution Fee Rate | Service Fee Rate | Total Distribution Plan (d) | Annual Effective Rate (e) | Distribution and Service Fee | ||||||
| Class A | — | 0.25% | 0.25% | 0.25% | $836,104 | |||||
| Class B | 0.75% | 0.25% | 1.00% | 1.00% | 211,844 | |||||
| Class C | 0.75% | 0.25% | 1.00% | 1.00% | 583,498 | |||||
| Class B1 | 0.75% | 0.25% | 1.00% | 0.76% | 169,535 | |||||
| Total Distribution and Service Fees | $1,800,981 | |||||||||
| (d) | In accordance with the distribution plan for certain classes, the fund pays distribution and/or service fees up to these annual percentage rates of each class’ average daily net assets. |
| (e) | The annual effective rates represent actual fees incurred under the distribution plan for the year ended March 31, 2009 based on each class’ average daily net assets. Prior to March 1, 2009, payment of the 0.10% annual Class A distribution fee was not in effect. Effective March 1, 2009, the 0.10% Class A annual distribution fee was eliminated. For one year from the date of sale of Class B1 shares, assets attributable to such Class B1 shares are subject to the 0.25% annual Class B1 service fee. On assets attributable to all other Class B1 shares, the service fee is not currently in effect, but may be implemented on such date as the fund’s Board of Trustees may determine. |
Certain Class A and Class A1 shares purchased prior to September 1, 2008 are subject to a contingent deferred sales charge (CDSC) in the event of a shareholder redemption within 12 months of purchase. Certain Class A and Class A1 shares purchased on or subsequent to September 1, 2008 are subject to a CDSC in the event of a shareholder redemption within 24 months of purchase. Class C shares are subject to a CDSC in the event of a shareholder redemption within 12 months of purchase. Class B and Class B1 shares are subject to a CDSC in the event of a shareholder redemption within six years of purchase. All contingent deferred sales charges are paid to MFD and during the year ended March 31, 2009, were as follows:
| Amount | ||
| Class A | $2,047 | |
| Class B | 28,831 | |
| Class C | 23,590 | |
| Class A1 | — | |
| Class B1 | 21,812 |
Shareholder Servicing Agent – MFS Service Center, Inc. (MFSC), a wholly-owned subsidiary of MFS, receives a fee from the fund for its services as shareholder servicing agent calculated as a percentage of the average daily net assets of the fund as determined periodically under the supervision of the fund’s Board of Trustees. For the year ended March 31, 2009, the fee was $666,925, which equated to 0.0539% annually of the fund’s average daily net assets. MFSC also receives payment from the fund for out-of-pocket expenses, sub-accounting and other shareholder servicing costs which may be paid to affiliated and unaffiliated service providers. For the year ended March 31, 2009, these out-of-pocket expenses, sub-accounting and other shareholder servicing costs amounted to $422,393.
59
Table of Contents
Notes to Financial Statements – continued
Administrator – MFS provides certain financial, legal, shareholder communications, compliance, and other administrative services to the fund. Under an administrative services agreement, the fund partially reimburses MFS the costs incurred to provide these services. The fund is charged an annual fixed amount of $17,500 plus a fee based on average daily net assets.
The administrative services fee incurred for the year ended March 31, 2009 was equivalent to an annual effective rate of 0.0173% of the fund’s average daily net assets.
Trustees’ and Officers’ Compensation – The fund pays compensation to independent trustees in the form of a retainer, attendance fees, and additional compensation to Board and Committee chairpersons. The fund does not pay compensation directly to trustees or officers of the fund who are also officers of the investment adviser, all of whom receive remuneration for their services to the fund from MFS. Certain officers and trustees of the fund are officers or directors of MFS, MFD, and MFSC.
For certain independent Trustees who retired on or before December 31, 2001, the fund has an unfunded, defined benefit plan which resulted in a pension expense of $6,490. This amount is included in independent trustees’ compensation for the year ended March 31, 2009. The liability for deferred retirement benefits payable to certain retired independent trustees amounted to $67,288 at March 31, 2009, and is included in payable for independent trustees’ compensation.
Other – This fund and certain other MFS funds (the funds) have entered into services agreements (the Agreements) which provide for payment of fees by the funds to Tarantino LLC and Griffin Compliance LLC in return for the provision of services of an Independent Chief Compliance Officer (ICCO) and Assistant ICCO, respectively, for the funds. The ICCO and Assistant ICCO are officers of the funds and the sole members of Tarantino LLC and Griffin Compliance LLC, respectively. The funds can terminate the Agreements with Tarantino LLC and Griffin Compliance LLC at any time under the terms of the Agreements. For the year ended March 31, 2009, the aggregate fees paid by the fund to Tarantino LLC and Griffin Compliance LLC were $13,339 and are included in miscellaneous expense on the Statement of Operations. MFS has agreed to reimburse the fund for a portion of the payments made by the fund in the amount of $6,872, which is shown as a reduction of total expenses in the Statement of Operations. Additionally, MFS has agreed to bear all expenses associated with office space, other administrative support, and supplies provided to the ICCO and Assistant ICCO.
The fund may invest in a money market fund managed by MFS which seeks a high level of current income consistent with preservation of capital and liquidity. Income earned on this investment is included in dividends from
60
Table of Contents
Notes to Financial Statements – continued
underlying funds on the Statement of Operations. This money market fund does not pay a management fee to MFS.
| (4) | Portfolio Securities |
Purchases and sales of investments, other than U.S. Government securities, purchased option transactions, and short-term obligations, aggregated $420,643,922 and $309,578,102, respectively.
| (5) | Shares of Beneficial Interest |
The fund’s Declaration of Trust permits the Trustees to issue an unlimited number of full and fractional shares of beneficial interest. Transactions in fund shares were as follows:
| Year ended 3/31/09 | Year ended 3/31/08 (i) | |||||||||||
| Shares | Amount | Shares | Amount | |||||||||
| Shares sold | ||||||||||||
Class A | 30,477,062 | $235,731,134 | 12,188,966 | $102,379,470 | ||||||||
Class B | 1,065,817 | 8,298,997 | 676,593 | 5,683,358 | ||||||||
Class C | 6,261,269 | 49,133,686 | 1,967,955 | 16,577,633 | ||||||||
Class A1 | 1,231,564 | 9,680,409 | 1,362,877 | 11,483,711 | ||||||||
Class B1 | 17,477 | 137,069 | 32,015 | 267,404 | ||||||||
| 39,053,189 | $302,981,295 | 16,228,406 | $136,391,576 | |||||||||
| Shares issued in connection with acquisition of MFS Municipal Bond Fund | ||||||||||||
Class A1 | — | $— | 113,972,241 | $956,544,151 | ||||||||
Class B1 | — | — | 3,971,203 | 33,357,434 | ||||||||
| — | $— | 117,943,444 | $989,901,585 | |||||||||
| Shares issued to shareholders in reinvestment of distributions | ||||||||||||
Class A | 1,503,637 | $11,656,804 | 831,082 | $6,992,514 | ||||||||
Class B | 75,052 | 584,808 | 63,839 | 538,422 | ||||||||
Class C | 202,270 | 1,573,379 | 113,902 | 962,766 | ||||||||
Class A1 | 3,692,773 | 28,797,296 | 2,453,772 | 20,578,947 | ||||||||
Class B1 | 82,684 | 645,544 | 65,102 | 546,737 | ||||||||
| 5,556,416 | $43,257,831 | 3,527,697 | $29,619,386 | |||||||||
| Shares reacquired | ||||||||||||
Class A | (11,196,340 | ) | $(85,679,727 | ) | (7,981,503 | ) | $(67,115,365 | ) | ||||
Class B | (1,128,487 | ) | (8,849,702 | ) | (1,161,506 | ) | (9,804,901 | ) | ||||
Class C | (1,518,837 | ) | (11,683,777 | ) | (977,878 | ) | (8,264,793 | ) | ||||
Class A1 | (12,850,834 | ) | (99,993,853 | ) | (12,546,924 | ) | (105,513,431 | ) | ||||
Class B1 | (967,683 | ) | (7,563,435 | ) | (830,080 | ) | (6,974,401 | ) | ||||
| (27,662,181 | ) | $(213,770,494 | ) | (23,497,891 | ) | $(197,672,891 | ) | |||||
61
Table of Contents
Notes to Financial Statements – continued
| Year ended 3/31/09 | Year ended 3/31/08 (i) | |||||||||||
| Shares | Amount | Shares | Amount | |||||||||
| Net change | ||||||||||||
Class A | 20,784,359 | $161,708,211 | 5,038,545 | $42,256,619 | ||||||||
Class B | 12,382 | 34,103 | (421,074 | ) | (3,583,121 | ) | ||||||
Class C | 4,944,702 | 39,023,288 | 1,103,979 | 9,275,606 | ||||||||
Class A1 | (7,926,497 | ) | (61,516,148 | ) | 105,241,966 | 883,093,378 | ||||||
Class B1 | (867,522 | ) | (6,780,822 | ) | 3,238,240 | 27,197,174 | ||||||
| 16,947,424 | $132,468,632 | 114,201,656 | $958,239,656 | |||||||||
| (i) | For the period from the class’ inception, June 25, 2007 (Classes A1 and B1), through the stated period end. |
| (6) | Line of Credit |
The fund and other funds managed by MFS participate in a $1 billion unsecured committed line of credit provided by a syndication of banks under a credit agreement. In addition, the fund and other funds managed by MFS have established uncommitted borrowing arrangements with certain banks. Borrowings may be made for temporary financing needs. Interest is charged to the fund, based on its borrowings, generally at a rate equal to the Federal Reserve funds rate plus 0.30%. In addition, a commitment fee, based on the average daily, unused portion of the committed line of credit, is allocated among the participating funds at the end of each calendar quarter. For the year ended March 31, 2009, the fund’s commitment fee and interest expense were $7,199 and $0, respectively, and are included in miscellaneous expense on the Statement of Operations.
| (7) | Transactions in Underlying Funds-Affiliated Issuers |
An affiliated issuer may be considered one in which the fund owns 5% or more of the outstanding voting securities, or a company which is under common control. For the purposes of this report, the fund assumes the following to be affiliated issuers:
| Underlying Funds | Beginning Shares/Par Amount | Acquisitions Shares/Par Amount | Dispositions Shares/Par Amount | Ending Shares/Par Amount | |||||
MFS Institutional Money Market Portfolio | — | 70,946,059 | (70,890,879 | ) | 55,180 | ||||
| Underlying Funds | Realized Gain (Loss) | Capital Gain Distributions | Dividend Income | Ending Value | |||||
MFS Institutional Money Market Portfolio | $— | $— | $9,461 | $55,180 | |||||
62
Table of Contents
Notes to Financial Statements – continued
| (8) | Acquisitions |
At close of business on June 22, 2007, the fund acquired all of the assets and liabilities of MFS Municipal Bond Fund. In connection with the acquisition, the fund also issued new share Classes A1 and B1 to the acquired fund shareholders, that differ from existing share Classes A and B in respect to class level expenses. The acquisition was accomplished by a tax-free exchange of 117,943,444 shares of the fund (valued at $989,901,585) for all of the assets and liabilities of MFS Municipal Bond Fund. MFS Municipal Bond Fund then converted all of its outstanding shares for the shares of the fund and distributed those shares to its shareholders. MFS Municipal Bond Fund’s net assets on that date were $989,901,585, including $45,804,567 of unrealized appreciation, $114,563 of accumulated net investment loss, and $380,444 of accumulated net realized loss on investments. These assets were combined with those of the fund. The aggregate net assets of the fund after the acquisition were $1,291,597,453.
63
Table of Contents
REPORT OF INDEPENDENT REGISTERED
PUBLIC ACCOUNTING FIRM
To the Board of Trustees of MFS Municipal Series Trust and the Shareholders of
MFS Municipal Income Fund:
We have audited the accompanying statement of assets and liabilities, including the portfolio of investments, of MFS Municipal Income Fund (the “Fund”) (one of the portfolios comprising MFS Municipal Series Trust) as of March 31, 2009, and the related statement of operations for the year then ended, the statements of changes in net assets for each of the two years in the period then ended, and the financial highlights for each of the five years in the period then ended. These financial statements and financial highlights are the responsibility of the Fund’s management. Our responsibility is to express an opinion on these financial statements and financial highlights based on our audits.
We conducted our audits in accordance with the standards of the Public Company Accounting Oversight Board (United States). Those standards require that we plan and perform the audit to obtain reasonable assurance about whether the financial statements and financial highlights are free of material misstatement. The Fund is not required to have, nor were we engaged to perform, an audit of its internal control over financial reporting. Our audits included consideration of internal control over financial reporting as a basis for designing audit procedures that are appropriate in the circumstances, but not for the purpose of expressing an opinion on the effectiveness of the Fund’s internal control over financial reporting. Accordingly, we express no such opinion. An audit also includes examining, on a test basis, evidence supporting the amounts and disclosures in the financial statements, assessing the accounting principles used and significant estimates made by management, as well as evaluating the overall financial statement presentation. Our procedures included confirmation of securities owned as of March 31, 2009, by correspondence with the custodian and brokers; where replies were not received from brokers, we performed other auditing procedures. We believe that our audits provide a reasonable basis for our opinion.
In our opinion, the financial statements and financial highlights referred to above present fairly, in all material respects, the financial position of MFS Municipal Income Fund as of March 31, 2009, the results of its operations for the year then ended, the changes in its net assets for each of the two years in the period then ended, and the financial highlights for each of the five years in the period then ended, in conformity with accounting principles generally accepted in the United States of America.
DELOITTE & TOUCHE LLP
Boston, Massachusetts
May 14, 2009
64
Table of Contents
TRUSTEES AND OFFICERS — IDENTIFICATION AND BACKGROUND
The Trustees and officers of the Trust, as of May 1, 2009, are listed below, together with their principal occupations during the past five years. (Their titles may have varied during that period.) The address of each Trustee and officer is 500 Boylston Street, Boston, Massachusetts 02116.
Name, Date of Birth | Position(s) Held | Trustee/Officer Since (h) | Principal Occupations During | |||
| INTERESTED TRUSTEES | ||||||
| Robert J. Manning (k) (born 10/20/63) | Trustee | February 2004 | Massachusetts Financial Services Company, Chief Executive Officer, President, Chief Investment Officer and Director | |||
| Robert C. Pozen (k) (born 8/08/46) | Trustee | February 2004 | Massachusetts Financial Services Company, Chairman (since February 2004); Harvard Business School (education), Senior Lecturer (since 2008); Bell Canada Enterprises (telecommunications), Director (until February 2009); The Bank of New York, Director (finance), (March 2004 to May 2005); Telesat (satellite communications), Director (until November 2007) | |||
| INDEPENDENT TRUSTEES | ||||||
| David H. Gunning (born 5/30/42) | Trustee and Chair of Trustees | January 2004 | Retired; Cleveland-Cliffs Inc. (mining products and service provider), Vice Chairman/Director (until May 2007); Lincoln Electric Holdings, Inc. (welding equipment manufacturer), Director; Development Alternatives, Inc. (consulting), Director/Non Executive Chairman; Portman Limited (mining), Director (since 2005); Southwest Gas Corp. (natural gas distribution), Director (until May 2004) | |||
| Robert E. Butler (n) (born 11/29/41) | Trustee | January 2006 | Consultant – regulatory and compliance matters (since July 2002); PricewaterhouseCoopers LLP (professional services firm), Partner (until 2002) | |||
65
Table of Contents
Trustees and Officers – continued
Name, Date of Birth | Position(s) Held | Trustee/Officer Since (h) | Principal Occupations During | |||
| Lawrence H. Cohn, M.D. (born 3/11/37) | Trustee | August 1993 | Brigham and Women’s Hospital, Senior Cardiac Surgeon (since 2005); Harvard Medical School, Professor of Cardiac Surgery; Partners HealthCare, Physician Director of Medical Device Technology (since 2006); Brigham and Women’s Hospital, Chief of Cardiac Surgery (until 2005) | |||
| Maureen R. Goldfarb (born 4/06/55) | Trustee | January 2009 | Private investor; John Hancock Financial Services, Inc., Executive Vice President (until 2004); John Hancock Mutual Funds, Trustee and Chief Executive Officer (until 2004) | |||
| William R. Gutow (born 9/27/41) | Trustee | December 1993 | Private investor and real estate consultant; Capital Entertainment Management Company (video franchise), Vice Chairman; Texas Donuts (donut franchise), Vice Chairman (since 2007); Atlantic Coast Tan (tanning salons), Vice Chairman (until 2007) | |||
| Michael Hegarty (born 12/21/44) | Trustee | December 2004 | Retired; AXA Financial (financial services and insurance), Vice Chairman and Chief Operating Officer (until 2001); The Equitable Life Assurance Society (insurance), President and Chief Operating Officer (until 2001) | |||
| J. Atwood Ives (born 5/01/36) | Trustee | February 1992 | Private investor; KeySpan Corporation (energy related services), Director until 2004; Woodstock Corporation (investment advisory firm), Director until 2003 | |||
John P. Kavanaugh (born 11/04/54) | Trustee | January 2009 | Private investor; The Hanover Insurance Group, Inc., Vice President and Chief Investment Officer (until 2006); Allmerica Investment Trust, Allmerica Securities Trust and Opus Investment Trust (investment companies), Chairman, President and Trustee (until 2006) |
66
Table of Contents
Trustees and Officers – continued
Name, Date of Birth | Position(s) Held | Trustee/Officer Since (h) | Principal Occupations During | |||
| J. Dale Sherratt (born 9/23/38) | Trustee | August 1993 | Insight Resources, Inc. (acquisition planning specialists), President; Wellfleet Investments (investor in health care companies), Managing General Partner | |||
| Laurie J. Thomsen (born 8/05/57) | Trustee | March 2005 | New Profit, Inc. (venture philanthropy), Partner (since 2006); Private investor; Prism Venture Partners (venture capital), Co-founder and General Partner (until June 2004); The Travelers Companies (commercial property liability insurance), Director | |||
| Robert W. Uek (born 5/18/41) | Trustee | January 2006 | Consultant to investment company industry; PricewaterhouseCoopers LLP (professional services firm), Partner (until 1999); TT International Funds (mutual fund complex), Trustee (until 2005); Hillview Investment Trust II Funds (mutual fund complex), Trustee (until 2005) | |||
| OFFICERS | ||||||
| Maria F. Dwyer (k) (born 12/01/58) | President | November 2005 | Massachusetts Financial Services Company, Executive Vice President and Chief Regulatory Officer (since March 2004) Chief Compliance Officer (since December 2006); Fidelity Management & Research Company, Vice President (prior to March 2004); Fidelity Group of Funds, President and Treasurer (until March 2004) | |||
| Christopher R. Bohane (k) (born 1/18/74) | Assistant Secretary and Assistant Clerk | July 2005 | Massachusetts Financial Services Company, Vice President and Senior Counsel | |||
John M. Corcoran (k) (born 4/13/65) | Treasurer | October 2008 | Massachusetts Financial Services Company, Senior Vice President (since October 2008); State Street Bank and Trust (financial services provider), Senior Vice President, (until September 2008) | |||
67
Table of Contents
Trustees and Officers – continued
Name, Date of Birth | Position(s) Held | Trustee/Officer Since (h) | Principal Occupations During | |||
| Ethan D. Corey (k) (born 11/21/63) | Assistant Secretary and Assistant Clerk | July 2005 | Massachusetts Financial Services Company, Senior Vice President and Associate General Counsel (since 2004); Dechert LLP (law firm), Counsel (prior to December 2004) | |||
| David L. DiLorenzo (k) (born 8/10/68) | Assistant Treasurer | July 2005 | Massachusetts Financial Services Company, Vice President (since June 2005); JP Morgan Investor Services, Vice President (until June 2005) | |||
| Timothy M. Fagan (k) (born 7/10/68) | Assistant Secretary and Assistant Clerk | September 2005 | Massachusetts Financial Services Company, Vice President and Senior Counsel (since September 2005); John Hancock Advisers, LLC, Vice President, Senior Attorney and Chief Compliance Officer (until August 2005) | |||
| Mark D. Fischer (k) (born 10/27/70) | Assistant Treasurer | July 2005 | Massachusetts Financial Services Company, Vice President (since May 2005); JP Morgan Investment Management Company, Vice President (until May 2005) | |||
| Robyn L. Griffin (born 7/04/75) | Assistant Independent Chief Compliance Officer | August 2008 | Griffin Compliance LLC (provider of compliance services), Principal (since August 2008); State Street Corporation (financial services provider), Mutual Fund Administration Assistant Vice President (October 2006 – July 2008); Liberty Mutual Group (insurance), Personal Market Assistant Controller (April 2006 – October 2006); Deloitte & Touche LLP (professional services firm), Senior Manager (prior to April 2006) | |||
Brian E. Langenfeld (k) (born 3/07/73) | Assistant Secretary and Assistant Clerk | June 2006 | Massachusetts Financial Services Company, Vice President and Senior Counsel (since May 2006); John Hancock Advisers, LLC, Assistant Vice President and Counsel (until April 2006) | |||
| Ellen Moynihan (k) (born 11/13/57) | Assistant Treasurer | April 1997 | Massachusetts Financial Services Company, Senior Vice President |
68
Table of Contents
Trustees and Officers – continued
Name, Date of Birth | Position(s) Held | Trustee/Officer Since (h) | Principal Occupations During | |||
Susan S. Newton (k) (born 3/07/50) | Assistant Secretary and Assistant Clerk | May 2005 | Massachusetts Financial Services Company, Senior Vice President and Associate General Counsel (since April 2005); John Hancock Advisers, LLC, Senior Vice President, Secretary and Chief Legal Officer (until April 2005) | |||
| Susan A. Pereira (k) (born 11/05/70) | Assistant Secretary and Assistant Clerk | July 2005 | Massachusetts Financial Services Company, Vice President and Senior Counsel (since June 2004); Bingham McCutchen LLP (law firm), Associate (until June 2004) | |||
| Mark N. Polebaum (k) (born 5/01/52) | Secretary and Clerk | January 2006 | Massachusetts Financial Services Company, Executive Vice President, General Counsel and Secretary (since January 2006); Wilmer Cutler Pickering Hale and Dorr LLP (law firm), Partner (until January 2006) | |||
| Frank L. Tarantino (born 3/07/44) | Independent Chief Compliance Officer | June 2004 | Tarantino LLC (provider of compliance services), Principal (since June 2004); CRA Business Strategies Group (consulting services), Executive Vice President (until June 2004) | |||
| Richard S. Weitzel (k) (born 7/16/70) | Assistant Secretary and Assistant Clerk | October 2007 | Massachusetts Financial Services Company, Vice President and Assistant General Counsel (since 2004); Massachusetts Department of Business and Technology, General Counsel (until April 2004) | |||
| James O. Yost (k) (born 6/12/60) | Assistant Treasurer | September 1990 | Massachusetts Financial Services Company, Senior Vice President |
| (h) | Date first appointed to serve as Trustee/officer of an MFS fund. Each Trustee has served continuously since appointment unless indicated otherwise. For the period from December 15, 2004 until February 22, 2005, Messrs. Pozen and Manning served as Advisory Trustees. For the period March 2008 until October 2008, Ms. Dwyer served as Treasurer of the Funds. |
| (j) | Directorships or trusteeships of companies required to report to the Securities and Exchange Commission (i.e., “public companies”). |
| (k) | “Interested person” of the Trust within the meaning of the Investment Company Act of 1940 (referred to as the 1940 Act), which is the principal federal law governing investment companies like the fund, as a result of position with MFS. The address of MFS is 500 Boylston Street, Boston, Massachusetts 02116. |
| (n) | In 2004 and 2005, Mr. Butler provided consulting services to the independent compliance consultant retained by MFS pursuant to its settlement with the SEC concerning market timing and related matters. The terms of that settlement required that compensation and expenses related to the independent |
69
Table of Contents
Trustees and Officers – continued
compliance consultant be borne exclusively by MFS and, therefore, MFS paid Mr. Butler for the services he rendered to the independent compliance consultant. In 2004 and 2005, MFS paid Mr. Butler a total of $351,119.29. |
Each Trustee (except Messrs. Butler, Kavanaugh and Uek and Ms. Goldfarb) has been elected by shareholders and each Trustee and officer holds office until his or her successor is chosen and qualified or until his or her earlier death, resignation, retirement or removal. The Trust held a shareholders’ meeting in 2005 to elect Trustees, and will hold a shareholders’ meeting at least once every five years thereafter, to elect Trustees. Messrs. Butler, Kavanaugh, Sherratt, Uek and Ms. Thomsen are members of the Trust’s Audit Committee.
Each of the Fund’s Trustees and officers holds comparable positions with certain other funds of which MFS or a subsidiary is the investment adviser or distributor, and, in the case of the officers, with certain affiliates of MFS. As of January 1, 2009, the Trustees served as board members of 105 funds within the MFS Family of Funds.
The Statement of Additional Information for the Fund and further information about the Trustees are available without charge upon request by calling 1-800-225-2606.
| Investment Adviser | Custodian | |
| Massachusetts Financial Services Company 500 Boylston Street, Boston, MA 02116-3741 | JPMorgan Chase Bank One Chase Manhattan Plaza New York, NY 10081 | |
| Distributor | Independent Registered Public Accounting Firm | |
| MFS Fund Distributors, Inc. 500 Boylston Street, Boston, MA 02116-3741 | Deloitte & Touche LLP 200 Berkeley Street, Boston, MA 02116 | |
| Portfolio Manager | ||
| Geoffrey Schechter |
70
Table of Contents
BOARD REVIEW OF INVESTMENT ADVISORY AGREEMENT
A discussion regarding the Board’s most recent review and renewal of the fund’s Investment Advisory Agreement with MFS is available by clicking on the fund’s name under “Mutual Funds” in the “Products and Performance” section of the MFS Web site (mfs.com).
PROXY VOTING POLICIES AND INFORMATION
A general description of the MFS funds’ proxy voting policies and procedures is available without charge, upon request, by calling
1-800-225-2606, by visiting the Proxy Voting section of mfs.com or by visiting the SEC’s Web site at http://www.sec.gov.
Information regarding how the fund voted proxies relating to portfolio securities during the most recent twelve-month period ended June 30 is available without charge by visiting the Proxy Voting section of mfs.com or by visiting the SEC’s Web site at http://www.sec.gov.
QUARTERLY PORTFOLIO DISCLOSURE
The fund will file a complete schedule of portfolio holdings with the Securities and Exchange Commission (the Commission) for the first and third quarters of each fiscal year on Form N-Q. The fund’s Form N-Q may be reviewed and copied at the:
Public Reference Room
Securities and Exchange Commission
100 F Street, NE, Room 1580
Washington, D.C. 20549
Information on the operation of the Public Reference Room may be obtained by calling the Commission at 1-800-SEC-0330. The fund’s Form N-Q is available on the EDGAR database on the Commission’s Internet Web site at http://www.sec.gov, and copies of this information may be obtained, upon payment of a duplicating fee, by electronic request at the following e-mail address: publicinfo@sec.gov or by writing the Public Reference Section at the above address.
A shareholder can also obtain the quarterly portfolio holdings report at mfs.com.
FEDERAL TAX INFORMATION (unaudited)
The fund will notify shareholders of amounts for use in preparing 2009 income tax forms in January 2010.
The fund designates $5,319,291 as capital gain dividends paid during the fiscal year.
Of the dividends paid from net investment income during the fiscal year, 99.48% is designated as exempt interest dividends for federal income tax purposes. If the fund has earned income on private activity bonds, a portion of the dividends paid may be considered a tax preference item for purposes of computing a shareholder’s alternative minimum tax.
71
Table of Contents
Privacy is a concern for every investor today. At MFS Investment Management® and the MFS funds, we take this concern very seriously. We want you to understand our policies about the investment products and services that we offer, and how we protect the nonpublic personal information of investors who have a direct relationship with us and our wholly owned subsidiaries.
Throughout our business relationship, you provide us with personal information. We maintain information and records about you, your investments, and the services you use. Examples of the nonpublic personal information we maintain include
| Ÿ | data from investment applications and other forms |
| Ÿ | share balances and transactional history with us, our affiliates, or others |
| Ÿ | facts from a consumer reporting agency |
We do not disclose any nonpublic personal information about our customers or former customers to anyone, except as permitted by law. We may share nonpublic personal information with third parties or certain of our affiliates in connection with servicing your account or processing your transactions. We may share information with companies or financial institutions that perform marketing services on our behalf or with other financial institutions with which we have joint marketing arrangements, subject to any legal requirements.
Authorization to access your nonpublic personal information is limited to appropriate personnel who provide products, services, or information to you. We maintain physical, electronic, and procedural safeguards to help protect the personal information we collect about you.
If you have any questions about the MFS privacy policy, please call 1-800-225-2606 any business day between 8 a.m. and 8 p.m. Eastern time.
Note: If you own MFS products or receive MFS services in the name of a third party such as a bank or broker-dealer, their privacy policy may apply to you instead of ours.
72
Table of Contents
CONTACT US
Web site | Mailing address | |
mfs.com | MFS Service Center, Inc. | |
| P.O. Box 55824 | ||
MFS TALK | Boston, MA | |
1-800-637-8255 | 02205-5824 | |
24 hours a day | ||
| Overnight mail | ||
Account service and | MFS Service Center, Inc. | |
literature | c/o Boston Financial Data Services | |
Shareholders | 30 Dan Road | |
1-800-225-2606 | Canton, MA 02021-2809 | |
8 a.m. to 8 p.m. Eastern time | ||
Investment professionals | ||
1-800-343-2829 | ||
8 a.m. to 8 p.m. Eastern time | ||
Retirement plan services | ||
1-800-637-1255 | ||
8 a.m. to 8 p.m. Eastern time | ||
Go paperless with eDelivery: Arrange to have MFS® send prospectuses, reports, and proxies directly to your e-mail inbox. You’ll get timely information and less clutter in your mailbox (not to mention help your fund save printing and postage costs).
Sign up: If your account is registered with us, simply go to mfs.com, log in to your account via MFS® Access, and select the eDelivery sign-up options.
If you own your MFS fund shares through a financial institution or a retirement plan, MFS® TALK, MFS Access, and eDelivery may not be available to you.
| ||

Table of Contents
| ITEM 2. | CODE OF ETHICS. |
The Registrant has adopted a Code of Ethics pursuant to Section 406 of the Sarbanes-Oxley Act and as defined in Form N-CSR that applies to the Registrant’s principal executive officer and principal financial and accounting officer. The Registrant has not amended any provision in its Code of Ethics (the “Code”) that relates to an element of the Code’s definitions enumerated in paragraph (b) of Item 2 of this Form N-CSR.
A copy of the Code of Ethics is filed as an exhibit to this Form N-CSR.
| ITEM 3. | AUDIT COMMITTEE FINANCIAL EXPERT. |
Messrs. Robert E. Butler, John P. Kavanaugh and Robert W. Uek and Ms. Laurie J. Thomsen, members of the Audit Committee, have been determined by the Board of Trustees in their reasonable business judgment to meet the definition of “audit committee financial expert” as such term is defined in Form N-CSR. In addition, Messrs. Butler and Uek and Ms. Thomsen are “independent” members of the Audit Committee (as such term has been defined by the Securities and Exchange Commission in regulations implementing Section 407 of the Sarbanes-Oxley Act of 2002). The Securities and Exchange Commission has stated that the designation of a person as an audit committee financial expert pursuant to this Item 3 on the Form N-CSR does not impose on such a person any duties, obligations or liability that are greater than the duties, obligations or liability imposed on such person as a member of the Audit Committee and the Board of Trustees in the absence of such designation or identification.
| ITEM 4. | PRINCIPAL ACCOUNTANT FEES AND SERVICES. |
Items 4(a) through 4(d) and 4(g):
The Board of Trustees has appointed Deloitte & Touche LLP (“Deloitte”) to serve as independent accountants to each series of the Registrant (collectively, the “Funds”). The tables below set forth the audit fees billed to the Funds as well as fees for non-audit services provided to the Funds and/or to the Funds’ investment adviser, Massachusetts Financial Services Company (“MFS”) and to various entities either controlling, controlled by, or under common control with MFS that provide ongoing services to the Funds (“MFS Related Entities”).
Table of Contents
For the fiscal years ended March 31, 2009 and 2008, audit fees billed to the Funds by Deloitte were as follows:
| Audit Fees | ||||
| 2009 | 2008 | |||
Fees billed by Deloitte: | ||||
MFS Alabama Municipal Bond Fund | 37,446 | 37,446 | ||
MFS Arkansas Municipal Bond Fund | 37,446 | 37,446 | ||
MFS California Municipal Bond Fund | 37,446 | 37,446 | ||
MFS Florida Municipal Bond Fund | 37,446 | 37,446 | ||
MFS Georgia Municipal Bond Fund | 37,446 | 37,446 | ||
MFS Maryland Municipal Bond Fund | 37,446 | 37,446 | ||
MFS Massachusetts Municipal Bond Fund | 37,446 | 37,446 | ||
MFS Mississippi Municipal Bond Fund | 37,446 | 37,446 | ||
MFS Municipal Income Fund | 42,461 | 42,461 | ||
MFS New York Municipal Bond Fund | 37,446 | 37,446 | ||
MFS North Carolina Municipal Bond Fund | 37,446 | 37,446 | ||
MFS Pennsylvania Municipal Bond Fund | 37,446 | 37,446 | ||
MFS South Carolina Municipal Bond Fund | 37,446 | 37,446 | ||
MFS Tennessee Municipal Bond Fund | 37,446 | 37,446 | ||
MFS Virginia Municipal Bond Fund | 37,446 | 37,446 | ||
MFS West Virginia Municipal Bond Fund | 37,446 | 37,446 | ||
Total | 604,151 | 604,151 | ||
For the fiscal years ended March 31, 2009 and 2008, fees billed by Deloitte for audit-related, tax and other services provided to the Funds and for audit-related, tax and other services provided to MFS and MFS Related Entities were as follows:
| Audit-Related Fees1 | Tax Fees2 | All Other Fees3 | ||||||||||
| 2009 | 2008 | 2009 | 2008 | 2009 | 2008 | |||||||
Fees billed by Deloitte: | ||||||||||||
To MFS Alabama Municipal Bond Fund | 0 | 0 | 5,137 | 4,974 | 1,232 | 1,022 | ||||||
To MFS Arkansas Municipal Bond Fund | 0 | 0 | 5,137 | 4,974 | 1,232 | 1,022 | ||||||
To MFS California Municipal Bond Fund | 0 | 0 | 5,137 | 4,974 | 1,232 | 1,022 | ||||||
To MFS Florida Municipal Bond Fund | 0 | 0 | 5,137 | 4,974 | 1,232 | 1,022 | ||||||
To MFS Georgia Municipal Bond Fund | 0 | 0 | 5,137 | 4,974 | 1,232 | 1,022 | ||||||
To MFS Maryland Municipal Bond Fund | 0 | 0 | 5,137 | 4,974 | 1,232 | 1,022 | ||||||
To MFS Massachusetts Municipal Bond Fund | 0 | 0 | 5,137 | 4,974 | 1,232 | 1,022 | ||||||
Table of Contents
To MFS Mississippi Municipal Bond Fund | 0 | 0 | 5,137 | 4,974 | 1,232 | 1,022 | ||||||
To MFS Municipal Income Fund | 0 | 2,500 | 5,192 | 5,028 | 1,232 | 1,022 | ||||||
To MFS New York Municipal Bond Fund | 0 | 0 | 5,137 | 4,974 | 1,232 | 1,022 | ||||||
To MFS North Carolina Municipal Bond Fund | 0 | 0 | 5,137 | 4,974 | 1,232 | 1,022 | ||||||
To MFS Pennsylvania Municipal Bond Fund | 0 | 0 | 5,137 | 4,974 | 1,232 | 1,022 | ||||||
To MFS South Carolina Municipal Bond Fund | 0 | 0 | 5,137 | 4,974 | 1,232 | 1,022 | ||||||
To MFS Tennessee Municipal Bond Fund | 0 | 0 | 5,137 | 4,974 | 1,232 | 1,022 | ||||||
To MFS Virginia Municipal Bond Fund | 0 | 0 | 5,137 | 4,974 | 1,232 | 1,022 | ||||||
To MFS West Virginia Municipal Bond Fund | 0 | 0 | 5,137 | 4,974 | 1,232 | 1,022 | ||||||
Total fees billed by Deloitte | 0 | 2,500 | 82,247 | 79,638 | 19,712 | 16,352 | ||||||
To above Funds: | ||||||||||||
To MFS and MFS Related Entities of MFS Alabama Municipal Bond Fund* | 1,157,363 | 1,461,440 | 0 | 0 | 223,140 | 244,799 | ||||||
To MFS and MFS Related Entities of MFS Arkansas Municipal Bond Fund* | 1,157,363 | 1,461,440 | 0 | 0 | 223,140 | 244,799 | ||||||
To MFS and MFS Related Entities of MFS California Municipal Bond Fund* | 1,157,363 | 1,461,440 | 0 | 0 | 223,140 | 244,799 | ||||||
To MFS and MFS Related Entities of MFS Florida Municipal Bond Fund* | 1,157,363 | 1,461,440 | 0 | 0 | 223,140 | 244,799 | ||||||
To MFS and MFS Related Entities of MFS Georgia Municipal Bond Fund* | 1,157,363 | 1,461,440 | 0 | 0 | 223,140 | 244,799 | ||||||
To MFS and MFS Related Entities of MFS Maryland Municipal Bond Fund* | 1,157,363 | 1,461,440 | 0 | 0 | 223,140 | 244,799 | ||||||
To MFS and MFS Related Entities of MFS Massachusetts Municipal Bond Fund* | 1,157,363 | 1,461,440 | 0 | 0 | 223,140 | 244,799 | ||||||
To MFS and MFS Related Entities of MFS Mississippi Municipal Bond Fund* | 1,157,363 | 1,461,440 | 0 | 0 | 223,140 | 244,799 | ||||||
To MFS and MFS Related Entities of MFS Municipal Income Fund* | 1,157,363 | 1,461,440 | 0 | 0 | 223,140 | 244,799 | ||||||
To MFS and MFS Related Entities of MFS New York Municipal Bond Fund* | 1,157,363 | 1,461,440 | 0 | 0 | 223,140 | 244,799 |
Table of Contents
To MFS and MFS Related Entities of MFS North Carolina Municipal Bond Fund* | 1,157,363 | 1,461,440 | 0 | 0 | 223,140 | 244,799 | ||||||
To MFS and MFS Related Entities of MFS Pennsylvania Municipal Bond Fund* | 1,157,363 | 1,461,440 | 0 | 0 | 223,140 | 244,799 | ||||||
To MFS and MFS Related Entities of MFS South Carolina Municipal Bond Fund* | 1,157,363 | 1,461,440 | 0 | 0 | 223,140 | 244,799 | ||||||
To MFS and MFS Related Entities of MFS Tennessee Municipal Bond Fund* | 1,157,363 | 1,461,440 | 0 | 0 | 223,140 | 244,799 | ||||||
To MFS and MFS Related Entities of MFS Virginia Municipal Bond Fund* | 1,157,363 | 1,461,440 | 0 | 0 | 223,140 | 244,799 | ||||||
To MFS and MFS Related Entities of MFS West Virginia Municipal Bond Fund* | 1,157,363 | 1,461,440 | 0 | 0 | 223,140 | 244,799 |
Aggregate fees for non-audit services:
| 2009 | 2008 | |||
To MFS Alabama Municipal Bond Fund, MFS and MFS Related Entities# | 1,436,486 | 1,823,127 | ||
To MFS Arkansas Municipal Bond Fund, MFS and MFS Related Entities# | 1,436,486 | 1,823,127 | ||
To MFS California Municipal Bond Fund, MFS and MFS Related Entities# | 1,436,486 | 1,823,127 | ||
To MFS Florida Municipal Bond Fund, MFS and MFS Related Entities# | 1,436,486 | 1,823,127 | ||
To MFS Georgia Municipal Bond Fund, MFS and MFS Related Entities# | 1,436,486 | 1,823,127 | ||
To MFS Maryland Municipal Bond Fund, MFS and MFS Related Entities# | 1,436,486 | 1,823,127 |
Table of Contents
To MFS Massachusetts Municipal Bond Fund, MFS and MFS Related Entities# | 1,436,486 | 1,823,127 | ||
To MFS Mississippi Municipal Bond Fund, MFS and MFS Related Entities# | 1,436,486 | 1,823,127 | ||
To MFS Municipal Income Fund, MFS and MFS Related Entities# | 1,436,541 | 1,825,681 | ||
To MFS New York Municipal Bond Fund, MFS and MFS Related Entities# | 1,436,486 | 1,823,127 | ||
To MFS North Carolina Municipal Bond Fund, MFS and MFS Related Entities# | 1,436,486 | 1,823,127 | ||
To MFS Pennsylvania Municipal Bond Fund, MFS and MFS Related Entities# | 1,436,486 | 1,823,127 | ||
To MFS South Carolina Municipal Bond Fund, MFS and MFS Related Entities# | 1,436,486 | 1,823,127 | ||
To MFS Tennessee Municipal Bond Fund, MFS and MFS Related Entities# | 1,436,486 | 1,823,127 | ||
To MFS Virginia Municipal Bond Fund, MFS and MFS Related Entities# | 1,436,486 | 1,823,127 | ||
To MFS West Virginia Municipal Bond Fund, MFS and MFS Related Entities# | 1,436,486 | 1,823,127 |
| * | This amount reflects the fees billed to MFS and MFS Related Entities for non-audit services relating directly to the operations and financial reporting of the Funds (portions of which services also related to the operations and financial reporting of other funds within the MFS Funds complex). |
| # | This amount reflects the aggregate fees billed by Deloitte or E&Y, as the case may be, for non-audit services rendered to the Funds and for non-audit services rendered to MFS and the MFS Related Entities. |
1 | The fees included under “Audit-Related Fees” are fees related to assurance and related services that are reasonably related to the performance of the audit or review of financial statements, but not reported under “Audit Fees,” including accounting consultations, agreed-upon procedure reports, attestation reports, comfort letters and internal control reviews. |
Table of Contents
2 | The fees included under “Tax Fees” are fees associated with tax compliance, tax advice and tax planning, including services relating to the filing or amendment of federal, state or local income tax returns, regulated investment company qualification reviews and tax distribution and analysis. |
3 | The fees included under “All Other Fees” are fees for products and services provided by Deloitte other than those reported under “Audit Fees,” “Audit-Related Fees” and “Tax Fees,” including fees for services related to analysis of certain portfolio holdings, and review of internal controls and review of Rule 38a-1 compliance program. |
Item 4(e)(1):
Set forth below are the policies and procedures established by the Audit Committee of the Board of Trustees relating to the pre-approval of audit and non-audit related services:
To the extent required by applicable law, pre-approval by the Audit Committee of the Board is needed for all audit and permissible non-audit services rendered to the Funds and all permissible non-audit services rendered to MFS or MFS Related Entities if the services relate directly to the operations and financial reporting of the Registrant. Pre-approval is currently on an engagement-by-engagement basis. In the event pre-approval of such services is necessary between regular meetings of the Audit Committee and it is not practical to wait to seek pre-approval at the next regular meeting of the Audit Committee, pre-approval of such services may be referred to the Chair of the Audit Committee for approval; provided that the Chair may not pre-approve any individual engagement for such services exceeding $50,000 or multiple engagements for such services in the aggregate exceeding $100,000 in each period between regular meetings of the Audit Committee. Any engagement pre-approved by the Chair between regular meetings of the Audit Committee shall be presented for ratification by the entire Audit Committee at its next regularly scheduled meeting.
Item 4(e)(2):
None, or 0%, of the services relating to the Audit-Related Fees, Tax Fees and All Other Fees paid by the Fund and MFS and MFS Related Entities relating directly to the operations and financial reporting of the Registrant disclosed above were approved by the audit committee pursuant to paragraphs (c)(7)(i)(C) of Rule 2-01 of Regulation S-X (which permits audit committee approval after the start of the engagement with respect to services other than audit, review or attest services, if certain conditions are satisfied).
Item 4(f): Not applicable.
Item 4(h): The Registrant’s Audit Committee has considered whether the provision by a Registrant’s independent registered public accounting firm of non-audit services to MFS and MFS Related Entities that were not pre-approved by the Committee (because such services did not relate directly to the operations and financial reporting of the Registrant) was compatible with maintaining the independence of the independent registered public accounting firm as the Registrant’s principal auditors.
Table of Contents
| ITEM 5. | AUDIT COMMITTEE OF LISTED REGISTRANTS. |
Not applicable to the Registrant.
| ITEM 6. | INVESTMENTS |
A schedule of investments of the Registrant is included as part of the report to shareholders of such series under Item 1 of this Form N-CSR.
| ITEM 7. | DISCLOSURE OF PROXY VOTING POLICIES AND PROCEDURES FOR CLOSED-END MANAGEMENT INVESTMENT COMPANIES. |
Not applicable to the Registrant.
| ITEM 8. | PORTFOLIO MANAGERS OF CLOSED-END MANAGEMENT INVESTMENT COMPANIES. |
Not applicable to the Registrant.
| ITEM 9. | PURCHASES OF EQUITY SECURITIES BY CLOSED-END MANAGEMENT INVESTMENT COMPANY AND AFFILIATED PURCHASERS. |
Not applicable to the Registrant.
| ITEM 10. | SUBMISSION OF MATTERS TO A VOTE OF SECURITY HOLDERS. |
There were no material changes to the procedures by which shareholders may send recommendations to the Board for nominees to the Registrant’s Board since the Registrant last provided disclosure as to such procedures in response to the requirements of Item 407 (c)(2)(iv) of Regulation S-K or this Item.
| ITEM 11. | CONTROLS AND PROCEDURES. |
| (a) | Based upon their evaluation of the effectiveness of the registrant’s disclosure controls and procedures (as defined in Rule 30a-3(c) under the Investment Company Act of 1940 (the “Act”)) as conducted within 90 days of the filing date of this report on Form N-CSR, the registrant’s principal financial officer and principal executive officer have concluded that those disclosure controls and procedures provide reasonable assurance that the material information required to be disclosed by the registrant on this report is recorded, processed, summarized and reported within the time periods specified in the Securities and Exchange Commission’s rules and forms. |
| (b) | There were no changes in the registrant’s internal controls over financial reporting (as defined in Rule 30a-3(d) under the Act) that occurred during the second fiscal quarter of the period covered by the report that have materially affected, or are reasonably likely to materially affect, the registrant’s internal control over financial reporting. |
Table of Contents
| ITEM 12. | EXHIBITS. |
| (a) | File the exhibits listed below as part of this form. Letter or number the exhibits in the sequence indicated. |
| (1) | Any code of ethics, or amendment thereto, that is the subject of the disclosure required by Item 2, to the extent that the registrant intends to satisfy the Item 2 requirements through filing of an exhibit: Code of Ethics attached hereto. |
| (2) | A separate certification for each principal executive officer and principal financial officer of the registrant as required by Rule 30a-2 under the Act (17 CFR 270.30a-2): Attached hereto. |
| (b) | If the report is filed under Section 13(a) or 15(d) of the Exchange Act, provide the certifications required by Rule 30a-2(b) under the Act (17 CFR 270.30a-2(b)), Rule 13a-14(b) or Rule 15d-14(b) under the Exchange Act (17 CFR 240.13a-14(b) or 240.15d-14(b)) and Section 1350 of Chapter 63 of Title 18 of the United States Code (18 U.S.C. 1350) as an exhibit. A certification furnished pursuant to this paragraph will not be deemed “filed” for the purposes of Section 18 of the Exchange Act (15 U.S.C. 78r), or otherwise subject to the liability of that section. Such certification will not be deemed to be incorporated by reference into any filing under the Securities Act of 1933 or the Exchange Act, except to the extent that the registrant specifically incorporates it by reference: Attached hereto. |
Table of Contents
Notice
A copy of the Amended and Restated Declaration of Trust, as amended, of the Registrant is on file with the Secretary of State of The Commonwealth of Massachusetts and notice is hereby given that this instrument is executed on behalf of the Registrant by an officer of the Registrant as an officer and not individually and the obligations of or arising out of this instrument are not binding upon any of the Trustees or shareholders individually, but are binding only upon the assets and property of the respective constituent series of the Registrant.
Table of Contents
SIGNATURES
Pursuant to the requirements of the Securities Exchange Act of 1934 and the Investment Company Act of 1940, the registrant has duly caused this report to be signed on its behalf by the undersigned, thereunto duly authorized.
(Registrant) MFS MUNICIPAL SERIES TRUST
| By (Signature and Title)* | MARIA F. DWYER | |
| Maria F. Dwyer, President |
Date: May 14, 2009
Pursuant to the requirements of the Securities Exchange Act of 1934 and the Investment Company Act of 1940, this report has been signed below by the following persons on behalf of the registrant and in the capacities and on the dates indicated.
| By (Signature and Title)* | MARIA F. DWYER | |
| Maria F. Dwyer, President | ||
| (Principal Executive Officer) |
Date: May 14, 2009
| By (Signature and Title)* | JOHN M. CORCORAN | |
| John M. Corcoran, Treasurer | ||
| (Principal Financial Officer and Accounting Officer) |
Date: May 14, 2009
| * | Print name and title of each signing officer under his or her signature. |