UNITED STATES SECURITIES AND EXCHANGE COMMISSION
Washington, D.C. 20549
Form 10-K
| |
| ANNUAL REPORT PURSUANT TO SECTION 13 OR 15(d) OF THE SECURITIES EXCHANGE ACT OF 1934 |
| For the fiscal year ended December 31, 2024 |
| |
| TRANSITION REPORT PURSUANT TO SECTION 13 OR 15(d) OF THE SECURITIES EXCHANGE ACT OF 1934 |
| For the transition period from to |
Commission file number 0-18277
VICOR CORPORATION
(Exact name of registrant as specified in its charter)
| |
Delaware | 04-2742817 |
(State or other jurisdiction of incorporation or organization) | (IRS employer identification no.) |
25 Frontage Road, Andover, Massachusetts | 01810 |
(Address of principal executive offices) | (Zip code) |
Registrant’s telephone number, including area code:
(978) 470-2900
Securities registered pursuant to Section 12(b) of the Act:
| | |
Title of each class | Trading Symbol(s) | Name of each exchange on which registered |
Common Stock, par value $0.01 per share | VICR | The NASDAQ Stock Market LLC |
Securities registered pursuant to Section 12(g) of the Act:
None
Indicate by check mark if the registrant is a well-known seasoned issuer, as defined in Rule 405 of the Securities Act. Yes No
Indicate by check mark if the registrant is not required to file reports pursuant to Section 13 or Section 15(d) of the Act. Yes No
Indicate by check mark whether the registrant (1) has filed all reports required to be filed by Section 13 or 15(d) of the Securities Exchange Act of 1934 during the preceding 12 months (or for such shorter period that the registrant was required to file such reports), and (2) has been subject to such filing requirements for the past 90 days. Yes No
Indicate by check mark whether the registrant has submitted electronically every Interactive Data File required to be submitted pursuant to Rule 405 of Regulation S-T during the preceding 12 months (or for such shorter period that the registrant was required to submit such files). Yes No
Indicate by check mark whether the registrant is a large accelerated filer, an accelerated filer, a non-accelerated filer, a smaller reporting company, or an emerging growth company. See the definitions of “large accelerated filer,” “accelerated filer,” “smaller reporting company,” and “emerging growth company” in Rule 12b-2 of the Exchange Act.
| | | |
Large Accelerated Filer ☑ | Accelerated Filer ☐ | Non-accelerated Filer ☐ | Smaller Reporting Company ☐ |
| | | |
Emerging growth company ☐ | |
If an emerging growth company, indicate by check mark if the registrant has elected not to use the extended transition period for complying with any new or revised financial accounting standards provided pursuant to Section 13(a) of the Exchange Act. ☐
Indicate by check mark whether the registrant has filed a report on and attestation to its management’s assessment of the effectiveness of its internal control over financial reporting under Section 404(b) of the Sarbanes-Oxley Act (15 U.S.C. 7262(b)) by the registered public accounting firm that prepared or issued its audit report. ☑
If securities are registered pursuant to Section 12(b) of the Act, indicate by check mark whether the financial statements of the registrant included in the filing reflect the correction of an error to previously issued financial statements. ☐
Indicate by check mark whether any of those error corrections are restatements that required a recovery analysis of incentive-based compensation received by any of the registrant’s executive officers during the relevant recovery period pursuant to §240.10D-1(b). ☐
Indicate by check mark whether the registrant is a shell company (as defined in Rule 12b-2 of the Exchange Act). Yes ☐ No ☑
The aggregate market value of the voting and non-voting common equity of the registrant held by non-affiliates (for this purpose, persons and entities other than executive officers and directors) of the registrant, as of the last trading day of the registrant's most recently completed second fiscal quarter (June 28, 2024) was approximately $752,864,109.
| | |
Title of Each Class |
| Number of Shares of Common Stock Outstanding as of February 18, 2025 |
Common Stock |
| 33,443,745 |
Class B Common Stock |
| 11,738,718 |
DOCUMENTS INCORPORATED BY REFERENCE
Portions of the Company’s definitive proxy statement (the “Definitive Proxy Statement”) to be filed with the Securities and Exchange Commission pursuant to Regulation 14A and relating to the Company’s 2025 annual meeting of stockholders are incorporated by reference into Part III.
Auditor Id: 185 Auditor Name: KPMG LLP Auditor Location: Boston, MA
PART I
In this Annual Report on Form 10-K, unless the context indicates otherwise, references to “Vicor®,” “the Company,” “our company,” “we,” “us,” “our,” and similar references, refer to Vicor Corporation and its subsidiaries, unless otherwise specified.
Our consolidated operating results are affected by a wide variety of factors that could materially and adversely affect revenues and profitability, including the risk factors described in Item 1A of this Annual Report on Form 10-K. As a result of these and other factors, we may experience material fluctuations in future operating results on a quarterly or annual basis, which could materially and adversely affect our business, consolidated financial condition, operating results, and the share price of our Common Stock. This document and other documents filed by us with the Securities and Exchange Commission ("SEC") include forward-looking statements regarding future events and our future results that are subject to the safe harbor afforded under the Private Securities Litigation Reform Act of 1995 and other safe harbors afforded under the Securities Act of 1933 and the Securities Exchange Act of 1934. All statements other than statements of historical fact are statements that could be deemed forward-looking statements. Forward-looking statements are based on our current beliefs, expectations, estimates, forecasts, and projections for our future performance and are subject to risks and uncertainties. Forward-looking statements are identified by the use of words denoting uncertain, future events, such as “anticipate,” “assume,” “believe,” “continue,” “could,” “estimate,” “expect,” “future,” “goal,” “if,” “intend,” “may,” “plan,” “potential,” “project,” “prospective,” “seek,” “should,” “target,” “will,” or “would,” as well as similar words and phrases, including the negatives of these terms, or other variations thereof. Forward-looking statements also include, but are not limited to, statements regarding: our ability to address certain supply chain risks; our ongoing development of power conversion architectures, switching topologies, materials, packaging, and products; the ongoing transition of our business strategically, organizationally, and operationally from serving a large number of relatively low volume customers across diversified markets and geographies to serving a small number of relatively large volume customers; our intent to enter new market segments; the levels of customer orders overall and, in particular, from large customers and the delivery lead times associated therewith; anticipated new and existing customer wins; the financial and operational impact of customer changes to shipping schedules; the derivation of a portion of our sales in each quarter from orders booked in the same quarter; our intent to expand the percentage of revenue associated with licensing our intellectual property to third parties; our plans to invest in expanded manufacturing capacity, including the implementation of new manufacturing processes; our belief that cash generated from operations together with our available cash and cash equivalents will be sufficient to fund planned operational needs and capital equipment purchases, for the foreseeable future; our outlook regarding tariffs and the impact thereof on our business; our belief that we have limited exposure to currency risks; our intentions regarding the declaration and payment of cash dividends; our intentions regarding protecting our rights under our patents; and our expectation that no current litigation or claims will have a material adverse impact on our financial position or results of operations. These forward-looking statements are based upon our current expectations and estimates associated with prospective events and circumstances that may or may not be within our control and as to which there can be no assurance. Actual results could differ materially from those implied by forward-looking statements as a result of various factors, including but not limited to those described under Part I, Item 1 — “Business,” under Part I, Item 1A — “Risk Factors,” under Part I, Item 3 — “Legal Proceedings,” and under Part II, Item 7 — “Management’s Discussion and Analysis of Financial Condition and Results of Operations.” The discussion of our business contained herein, including the identification and assessment of factors that may influence actual results, may not be exhaustive. Therefore, the information presented should be read together with other documents we file with the SEC from time to time, including our Quarterly Reports on Form 10-Q and our Current Reports on Form 8-K, which may supplement, modify, supersede, or update the factors discussed in this Annual Report on Form 10-K. Any forward-looking statement made in this Annual Report on Form 10-K is based on information currently available to us and speaks only as of the date on which it is made. We do not undertake any obligation to update any forward-looking statements as a result of future events or developments, except as required by law.
ITEM 1. BUSINESS
Overview
We design, develop, manufacture, and market modular power components and power systems for converting electrical power (expressed as “watts,” and represented by the symbol “W”, with wattage being the product of voltage, expressed as “volts,” and represented by the symbol “V,” and current, expressed as “amperes,” and represented by the symbol “I”). In electrically-powered devices utilizing alternating current (“AC”) voltage from a primary AC source (for example, a wall outlet), a power system converts AC voltage into the stable direct current (“DC”) voltage necessary to power subsystems and/or individual applications and devices (known as “loads”). In many electronic devices, this DC voltage may be further converted to one or more voltages and currents required by a range of loads. In equipment utilizing DC voltage from a primary DC source (for example, a battery) or a secondary source (such as an AC-DC converter), the initial DC voltage similarly may require further conversion. A power system most commonly incorporates four voltage conversion functions: transformation, isolation, rectification, and regulation.
Transformation refers to the process of increasing or decreasing an AC voltage; isolation refers to the electrical separation, for safety, of primary and secondary voltages in a transformer; rectification refers to the process of converting a voltage from AC to DC and/or from DC to AC; and regulation refers to the process of providing a near constant voltage under a range of line and load conditions. Because numerous applications requiring different voltages, currents, and varied power ratings may exist within an electronically-powered device, and system power architectures themselves vary, we offer an extensive range of products and accessories in numerous application-specific configurations. We believe our product offering is among the most comprehensive in the market segments we serve. In addition to offering competitively differentiated products for sale, we also offer and engage in licensing arrangements with customers, resulting in royalty revenue.
Our strategy, competitive positioning, and product offerings are all based on highly differentiated product performance, reflecting our anticipation of the evolution of system power architectures and customer performance requirements. Since the Company was founded, we have pursued continuous innovations in product design and achievements in product performance, largely enabled by our focus on the research and development of advanced technologies and processes, often implemented in proprietary semiconductor circuitry, materials, and packaging. Reflecting this strategy, we categorize our offerings as either “Advanced Products” or “Brick Products,” generally based on design, performance, and form factor considerations, as well as the range of evolving applications for which the products are appropriate.
Our competition varies, depending on the market segment and application. Generally, we compete with developers and manufacturers of integrated circuits and semiconductor-based modules when addressing the needs of customers in enterprise computing and other market segments with implementations of our proprietary Factorized Power ArchitectureTM (“FPA”) using Advanced Products. In contrast, we generally compete with manufacturers of integrated power supplies when addressing the needs of customers, across a wide range of market segments, implementing conventional power systems architectures (e.g., Centralized Power Architecture (“CPA”), Distributed Power Architecture (“DPA”), and Intermediate Bus Architecture (“IBA”)) using Brick Products.
Our website, www.vicorpower.com, sets forth detailed information describing our products, the applications for which they may be used, and our suite of design tools. The information contained on our website is not a part of, nor incorporated by reference into, this Annual Report on Form 10-K and shall not be deemed “filed” under the Securities Exchange Act of 1934, as amended (the “Exchange Act”).
We are headquartered in Andover, Massachusetts, where our manufacturing facility is located. Our wholly-owned subsidiary, VICR Securities Corporation, also is located in Andover, Massachusetts. Our other domestic offices are located in Santa Clara, California, Lombard, Illinois, and Lincoln, Rhode Island. Our two Vicor Custom Powertm subsidiaries, Freedom Power Systems, Inc. and Northwest Power, Inc., are located in Cedar Park, Texas, and Milwaukie, Oregon, respectively.
We have established individual subsidiaries or unincorporated branch offices outside of the United States, which we call Technical Support Centers (“TSCs”), to conduct preparatory and auxiliary services in support of the Company. Vicor Japan Company, Ltd. (“VJCL”), our 92.5%-owned Japanese subsidiary, which is engaged in sales and customer support activities exclusively for the sale of certain products customized by VJCL for the Japanese market, is headquartered in Tokyo, Japan.
Our remaining subsidiaries and their legal domicile are set forth in Exhibit 21.1 to this Annual Report on Form 10-K. The activities of all of the entities referred to above are consolidated in the financial statements presented herein.
Vicor was incorporated in Delaware in 1981, and we completed an initial public offering in May 1991. The Company has two classes of common stock outstanding: shares of our “Common Stock,” listed on The NASDAQ Stock Market under the ticker symbol VICR, and shares of our Class B common stock, which are not subject to registration pursuant to the Exchange Act and are not listed on any exchange.
Our Strategy
Our strategy emphasizes demonstrable product differentiation and a value proposition based on competitively superior solution performance, advantageous design flexibility, and a compelling total cost of ownership (“TCO”). Since the Company was founded, our competitive position has been maintained by continuous innovations in product design and achievements in product performance, largely enabled by our focus on the research and development of advanced technologies and processes, often implemented in proprietary semiconductor circuitry, materials, and packaging. Many of
our products incorporate patented or proprietary implementations of high-frequency switching topologies, which enable the design of power system solutions more efficient and much smaller than conventional alternatives. This efficiency and small size is enabled by our proprietary switching circuitry and magnetic structures, as well as our use of highly differentiated packaging.
Power system performance is based primarily on conversion efficiency (i.e., the ratio of output power (i.e., watts) to input power) and power density (i.e., the amount of output power divided by the volume of the power system). Higher efficiency and density contribute to superior thermal performance, as the by-product of power conversion and distribution is heat, which must be dissipated in order to assure the performance of the power system solution itself and the overall system to which it is delivering power. Power system performance also is based on the electrical characteristics of the power system (and their effect on and compatibility with the customer’s application). Important electrical characteristics include transient responsiveness (i.e., the reaction of a power system to a sudden change in voltage or current levels) and noise profile (i.e., the level of electromagnetic interference created by power conversion). We believe the superior performance of our power systems is the most important element of our differentiation strategy.
Our strategy complements performance superiority with design flexibility (i.e., ease of use), as our products can be utilized individually or combined, given their level of integration, to create power system solutions specific to a customer’s precise needs. We articulate this positioning through our “Power Component Design Methodology,” an element of our differentiation strategy, which is our approach to providing our customers the modular products, design tools, and engineering support to enable the rapid design of advanced power system solutions by customers and, thereby, accelerate their own product development cycles. Our value proposition is supported by a compelling TCO, representing the cost of acquiring and operating a power system over its useful life, driven by competitive product pricing, high reliability, and demonstrably lower electricity costs.
Our earliest market focus was on telecommunications infrastructure, which uses a standard DC distribution voltage of 48V (nominally 48V to 54V), the highest distribution voltage that meets Safety Extra-Low Voltage (“SELV”) standard requirements, while leaving sufficient margin for over-voltage protection circuits. While we offer products addressing other DC voltage standards (e.g., 380V for power distribution in data centers, 110V for rail applications, 28V for military and avionics applications, and 24V for industrial automation) and a broad range of customer requirements, we consider our core competencies to be associated with 48V distribution, which offers numerous inherent cost and performance advantages over lower distribution voltages, while remaining within the 60V SELV safety limit.
Our product portfolio also includes families of “front-end” devices, which address applications requiring the transformation of AC voltages to regulated DC voltages. Examples of such applications include powering data center server racks, large-scale LED lighting, specialized laboratory, diagnostic, and test equipment, small-cell wireless base stations, and higher power equipment for defense and industrial use.
Reflecting our strategy, we categorize our offerings as either Advanced Products or Brick Products, generally based on design, performance, and form factor considerations, as well as the range of evolving applications for which the respective categories are appropriate. The Advanced Products category consists of our most innovative products, which are used to implement our proprietary distribution architecture, FPA, a highly differentiated approach to power distribution that enables flexible, rapid power system design using individual components optimized to perform a specific function. The Brick Products category largely consists of integrated power converters (i.e., “bricks”), incorporating multiple conversion stages, used in conventional power systems architectures including CPA, DPA, and IBA.
Given the growth profiles and performance requirements of the market segments served with Advanced Products and Brick Products, our strategy involves a continuing transition in organizational focus, emphasizing investment in Advanced Products design and manufacturing, targeting high growth market segments with a low-mix, high-volume operational model, while maintaining a profitable business in mature market segments we serve with Brick Products with a high-mix, low-volume operational model.
Our Products
Reflecting our Power Component Design Methodology, we offer a comprehensive range of modular building blocks enabling rapid design of a power system specific to a customer’s precise needs. Based on design, performance, and form factor considerations, as well as the range of evolving applications for which the products are appropriate, we categorize our product portfolios as either Advanced Products or Brick Products. We also sell a range of electrical and mechanical accessories for use with our products.
Advanced Products
We continue to invest in the research and development of power system technologies and product concepts addressing two accelerating trends, the first toward higher required conversion efficiencies, and the second toward more and diverse on-board voltages, higher performance demands of complex loads, and, in particular, higher current requirements of those loads. These trends are most visible in the microprocessor-based applications we target with Advanced Products, for which energy consumption, energy efficiency, processor performance, and computing density are critical priorities. Recognizing the performance and scale limitations of conventional power distribution architectures and products, we introduced FPA and a range of enabling products incorporating our latest advances in power distribution concepts, switching topologies, materials, and packaging.
FPA, which is focused on, but not limited to, 48V DC distribution solutions, increases power system conversion efficiency, density, and power delivery performance by “factorizing” (i.e., separating) the power conversion process into individual components, reducing the design limitations and thermal management challenges, and scaling trade-offs associated with conventional architectures for DC voltage distribution. All such architectures follow a sequence whereby a DC voltage is first transformed, or reduced, and that lower voltage subsequently conducted (i.e., “bussed”) across the circuit to the “load” (i.e., the point of use), where the voltage is regulated and lowered once more, to the required operating voltage of the load. In a FPA implementation, the sequence is reversed. Regulation occurs first, and the regulation module can be placed in the optimal position for space utilization and thermal management. A regulated voltage approaching 48V is bussed across the circuit to the transformation module, which performs what we refer to as current multiplication, adjacent to the load. Bussing high voltage minimizes the current levels across the circuit, thereby minimizing the potential for distribution losses and reducing the volume of the conduit (e.g., the copper wire). Placing the relatively low noise, low heat current multiplication module adjacent to the load further minimizes the potential for distribution losses associated with bussing a low operating voltage to the load and reduces the potential influence of the power system on the performance of the load.
A typical FPA implementation for delivering 48V DC from a server backplane to a 1.0V microprocessor would consist of three modules: a PRM™ (Pre-Regulator Module) regulator, a VTM™ (Voltage Transformation Module) current multiplier, and a proprietary communications controller. In contrast, a commodity IBA design for delivering 48V DC from a server backplane to a 1.0V microprocessor requires an additional conversion stage, to reduce 48V to 12V, and, at the point of load, a voltage regulation module (i.e., a “VRM” consisting of multiple switching regulators, each representing a phase and consisting of two switching transistors, one or more capacitors, and an inductor, with the transistors switched by pulse width modulation controller). For a 200W two stage, multiphase application, a 12V commodity IBA implementation would require an intermediate bus converter, to reduce 48V to 12V, and a VRM solution consisting of parallel phases (i.e., multiple switching regulators) to reduce and regulate the current for use at 1.0V by the microprocessor. Such a commodity IBA implementation requires a significantly higher component count, consumes more motherboard area, requires more copper conduit, generates more heat due to switching and distribution losses, offers inferior dynamic response, and can be meaningfully less efficient than a 48V FPA implementation.
The advantages of FPA over legacy power distribution architectures are most evident in high performance computing applications. Our “Power-on-Package” power system solutions meet the computational performance requirements of artificial intelligence (“AI”). The microprocessors typically used in AI, particularly in more computationally demanding “machine learning” or “training” applications, are graphics processing units (“GPUs”) and custom application-specific integrated circuits (“ASICs”). Unlike central processing units (“CPUs”), which are designed for serial execution of complex and broad instruction sets, GPUs and AI ASICs are designed for massively parallel (i.e., concurrent) processing of repetitive transactions or calculations. As such, GPUs and AI ASICs generally operate at processing frequencies requiring the higher levels of average and peak current delivered by our FPA-based solutions. Our most popular Power-on-Package solution, consists of one MCD© (Modular Current Driver) unit, providing high-bandwidth, low-noise regulation, and two MCM© (Modular Current Multiplier) units, providing high performance current multiplication. Power-on-Package delivers unprecedented current levels to GPUs and AI ASICs, in part due to the placement of the MCMs directly on the substrate onto which the processor is mounted, thereby minimizing distribution losses associated with high current levels. Placement of MCM units on the substrate also reduces the number of GPU or ASIC processor substrate pins required for power, allowing for their use by other functions (e.g., memory input/output (“I/O”)). This three-module laterally-mounted Power-on-Package configuration, powering an AI accelerator card requiring 350W, delivers 0.7V, 650A average current, and up to 1,200A peak current to the GPU or AI ASIC.
Our latest innovation for powering processors is vertical power delivery, which involves mounting our highest-performance solutions on the underside of the motherboard, opposite the GPU or AI ASIC, thereby enabling a further reduction in distribution losses at the load, yielding higher efficiency and unprecedented power density. Vertically-mounting the solution allows unrestricted access to microprocessor input/output I/O pins on the top side of the motherboard, thereby
improving I/O speed and memory access, which are a priority for GPUs and AI ASICs in AI applications. We continue the development of our vertical power delivery solutions and shipped prototype products to a certain customer in 2022.
Our proprietary technologies enable us to offer a range of Advanced Products, in various package formats across functional families, applicable to other market segments and power distribution architectures other than FPA. Within computing, these market segments include AC to DC voltage conversion and DC voltage distribution in server racks and high voltage conversion across datacenter infrastructure. We also offer Advanced Product power system solutions for aerospace and aviation (e.g., for use in satellites, unmanned aerial vehicles, and various airframes, including battery-powered aircraft, for which small size, light weight, and design flexibility are advantageous); defense electronics (e.g., for use in airborne, seaborne, or field communications and radar, for which reliability in harsh environments is a priority); factory automation, instrumentation, and test equipment (e.g., for use in robotics and semiconductor testing, for which high power levels and precision performance are required); telecommunications and networking infrastructure (e.g., for use in high-throughput data distribution and pole-mounted small-cell base stations); and vehicles (e.g., in autonomous driving applications, electric vehicles, and hybrid electric vehicles).
Annual revenue associated with the sale of Advanced Products which includes royalty revenue, was approximately 55.0%, 55.3%, and 61.0% of the Company’s consolidated revenue for the years ended December 31, 2024, 2023, and 2022, respectively.
We anticipate the percentage of periodic revenue associated with the sale of Advanced Products will increase in the future, given our strategic and organizational focus and the relatively higher expected growth of the market segments we serve.
Brick Products
Brick-format converters provide the integrated transformation, rectification, isolation, regulation, filtering, and/or input protection necessary to power and protect loads, across a range of conventional power architectures. We offer a wide range of brick-format DC-DC converters, as well as complementary components providing AC line rectification, input filtering, power factor correction, and transient protection. Wide ranges of input voltages, output voltages, and output power are offered, allowing end users to select components appropriate to their individual applications. The products differ in dimensions, temperature grades, maximum power ratings, performance characteristics, pin configuration, and, in certain cases, characteristics specific to the targeted market.
We also integrate these converters and components into complete power systems representing standard or custom AC-DC and DC-DC solutions for our customers' power needs. We refer to such standard products as our “Configurable” product line, while our two Vicor Custom Power subsidiaries design, sell, and service custom power system solutions.
We market our standard Brick Products emphasizing “mass customization,” using highly automated, efficient, domestic manufacturing to serve customers with product design and performance requirements, across a wide range of worldwide market segments, which could not be met by high-volume oriented competitors. We focus on distributed power implementations, for which our brick-format products are well-suited, in market segments such as aerospace and defense electronics, industrial equipment, instrumentation and test equipment, and transportation (e.g., rail and heavy equipment applications). Our customers range from independent manufacturers of highly specialized electronic devices to larger original equipment manufacturers (“OEMs”) and their contract manufacturers. Some of our Brick Product lines have been in production for over a decade, reflecting the maturity of the markets we serve, the long-established relationships we have with many customers, and the long-standing suitability of our products to demanding applications.
Annual revenue associated with the sale of Brick Products, inclusive of such sales of our Vicor Custom Power and VJCL subsidiaries, was approximately 45.0%, 44.7%, and 39.0% of the Company’s consolidated revenue for the years ended December 31, 2024, 2023, and 2022, respectively.
Customers and Backlog
The applications in which our Advanced Products and Brick Products are used are typically in the higher-performance, higher-power segments of the market segments we serve. With our Advanced Product lines, our customers are concentrated in the data center and hyperscaler segments of enterprise computing, in which our products are used for power delivery on server motherboards, in server racks, and across datacenter infrastructure, although we also serve applications in aerospace and aviation, defense electronics, satellites, factory automation, instrumentation, test equipment, transportation,
telecommunications and networking infrastructure, and vehicles (notably in the autonomous driving, electric vehicle, and hybrid vehicle niches of the vehicle segment). With our Brick Product lines, we serve customers concentrated in aerospace and defense electronics, industrial equipment, instrumentation and test equipment, and transportation (notably in rail and heavy equipment applications). With our strategic emphasis on larger, high-volume customers, we expect to experience a greater concentration of sales among relatively fewer customers.
As of December 31, 2024, the Company’s order backlog was approximately $155,505,000, compared to $160,805,000 as of December 31, 2023. Backlog, as presented here, consists of orders for products for which shipment is scheduled within the following 12 months, subject to our scheduling and cancellation policies.
Over the course of recent years the supply picture for the semiconductor industry generally improved and we have reduced quoted lead time to 22 – 28 weeks, depending on product family. In the final quarter of 2024, we increased prices for most products as part of our portfolio management process.
A portion of our revenue in any quarter is, and will continue to be, derived from “turns” volume, representing either orders booked and shipped in the same quarter or orders for which customers have requested accelerated delivery from a later quarter to the current quarter. This volume generally has been associated with orders for Brick Products. In 2024, our order backlog remained approximately flat, and consequently our book-to-bill ratio was approximately 1.0 during the year. An influence on turns volume has been our transition to larger OEM customers, which typically schedule large volumes for delivery over multiple quarters and frequently reschedule deliveries for either earlier or later shipment. Average quarterly turns volume was approximately 30% of 2024 revenue, approximately 18% of 2023 revenue, and approximately 11% of 2022 revenue.
Competition and Market Characteristics
The competitive characteristics of the markets we serve with Advanced Products and Brick Products can differ significantly. For example, in the higher-performance segments of computing we serve, our Advanced Products most often compete with solutions offered by large integrated device manufacturers (“IDMs”), which offer integrated circuits (“ICs”) and semiconductor-based modules. These IDMs generally offer far broader product portfolios, possess far greater global manufacturing and support resources, and have the ability to aggressively price their products to defend market share. Accordingly, Advanced Products are positioned as highly differentiated alternatives to commodity solutions for customers seeking high levels of performance. The customers we serve with Advanced Products are in market segments generally characterized by an emphasis on product performance differentiation, a compelling TCO, relatively extended and highly competitive design cycles, and product life cycles of generally less than three years. In contrast, the Brick Products competitive landscape is relatively fragmented, with large-scale, low-cost global suppliers of commodity solutions and many smaller manufacturers focused on specialized products or narrowly defined market segments or geographies. The market segments we serve with Brick Products, typically through sales representatives and distribution partners, generally are characterized by relatively short design cycles, relatively long (i.e., greater than three years) product life cycles, and, given the maturity of many market segments and applications, degrees of commoditization and price competition. As such, Brick Products are positioned with an emphasis on mass customization, through which we offer products with specific features and performance profiles typically not available from catalog-oriented competitors.
The size and growth characteristics of the markets we serve with Advanced Products and Brick Products also can differ significantly, and the range and quality of market data is problematic, making summary statements about these markets challenging. We believe our Advanced Products generally compete with power modules and power ICs developed and manufactured by IDMs and other fabless vendors of power semiconductors. We believe our Brick Products generally compete with similarly integrated switching power supply products developed and manufactured by large global competitors and a fragmented group of small regional competitors. The switching power supply market can be segmented by product type (i.e., DC-DC converters, AC-DC converters, and DC-AC inverters), by output power levels, and by numerous vertical markets (i.e., industry-specific applications).
For 2024, exports to China and Hong Kong were approximately $45,199,000, representing approximately 12.6% of total revenue and an approximately 36.8% decrease compared to the 2023 total of approximately $71,554,000. We believe this decreased volume was primarily associated with a softer market in this region driving lower demand for our products. Current exports to China and Hong Kong are heavily oriented toward Brick Products for industrial and rail applications, as well as certain aerospace and defense electronics applications permitted under U.S. export control regulations (our products are designated EAR99 commodities under the Export Administration Regulations of the U.S. Department of Commerce and are not subject to export licenses).
Despite our minor share in the overall merchant market and the competitive presence of numerous, far larger vendors in the market segments we serve with both Advanced Products and Brick Products, we believe we maintain an advantageous competitive position in those market segments based on our differentiated technology. However, there are numerous competitors across these market segments that have significantly greater engineering, financial, manufacturing, and marketing and sales resources, as well as longer operating histories and longer customer relationships than we do.
Marketing and Sales
We reach and serve customers through several sales channels: a direct sales force; independent, authorized non-stocking distributors in Europe and Asia; and four authorized stocking distributors world-wide: Arrow Electronics, Inc., Digi-Key Corporation, Avnet Electronics, and Mouser Electronics, Inc. All sales channels are supported by regional TSCs, each offering application engineering and sales support for our channel partners. Domestic TSCs are located in: Andover, Massachusetts; Lombard, Illinois; and Santa Clara, California. International TSCs are located in: Beijing, China; Hong Kong, China; Shanghai, China; Shenzhen, China; Munich, Germany; Bangalore, India; Milan, Italy; Tokyo, Japan; Seoul, South Korea; Taipei, Taiwan (Republic of China); and Camberley, United Kingdom. Customers do not place purchase orders with TSCs, but do so directly with the Company or with our channel partners. In Japan, customers place purchase orders with authorized distributors or, for certain custom products, VJCL.
We generally sell our products on the basis of our standard terms and conditions, and we most commonly warrant our products for a period of two years. The warranty period is three years for a range of H Grade, M Grade, and MI Family DC-DC products.
Because of the technically complex nature of our products and the applications they address, we maintain an extensive staff of Field Applications Engineers to support our own sales and customer support activities, as well as those of our channel partners. Field Application Engineers, based in our TSCs, provide direct technical support worldwide by reviewing new applications and technical matters with our channel partners in support of existing and potential customers. Product Development Engineering is located in our Andover headquarters, where our Product Development Engineers support the Field Application Engineers assigned to all of our TSCs.
Our direct sales force focuses on higher-volume opportunities involving Advanced Products with global OEMs (and the Original Design Manufacturers (“ODMs”) and contract manufacturers serving these OEMs). Because of the high level of product differentiation and the increasing complexity and challenges of customer requirements, we have experienced, and may continue to experience, extended design cycles before production orders are received.
Our web-based resources are an important element of our efforts to interact with and support customers. Within our website, the Power System Designer workspace of tools and references allow engineers to select, architect, and implement power systems using our products. Our highly differentiated WhiteboardTM tool allows users to configure and analyze their own power system designs or those from an extensive library of designs addressing a wide range of applications. Users can modify the operating condition for each component of their design to match the intended application and perform efficiency and loss analysis of individual components and the full power system. We continue to enhance and expand the range and capabilities of engineering tools we make available online to customers and prospective customers.
As stated, our strategy involves maintaining high levels of customer engagement and support for design and engineering. We incurred approximately $49,827,000, $52,938,000, and $49,708,000 in marketing and sales expenses in 2024, 2023, and 2022, respectively, representing approximately 13.9%, 13.1%, and 12.5% of revenues in 2024, 2023, and 2022, respectively.
Manufacturing, Quality Assurance, and Supply Chain Management
Our manufacturing facility, consisting of approximately 320,000 square feet, is located in Andover, Massachusetts, where we are headquartered. In this facility, we manufacture Brick Products, with the exception of custom products produced by our Vicor Custom Power and VJCL subsidiaries, and Advanced Products, with the exception of certain products manufactured, packaged, and tested by third party wafer foundries and packaging contractors in the United States and Asia.
Our primary manufacturing processes involve steps common to automated assembly of electronics devices. We also have developed and employ proprietary manufacturing processes that contribute to the differentiated performance of our devices, including the innovative electroplating of our SM-ChiP© modules.
Product quality and reliability are critical to our success and, as such, we emphasize quality and reliability in our design and manufacturing activities. We follow industry best practices in manufacturing and are compliant with ISO 9001 certification standards (as set forth by the International Organization for Standardization). Our quality assurance practices include rigorous testing and, as necessary, burn-in and temperature cycling (i.e., extended operation of a product to confirm performance) of our products using automated equipment. Incoming components, assemblies, and other parts are subjected to several levels of inspection procedures, and we maintain robust data on our raw material inventories in order to support our quality assurance procedures.
Components and materials used in our products are purchased from a variety of domestic and international vendors. Certain Advanced Products and semiconductor devices used in our production are manufactured by a limited number of wafer foundries, with packaging and test services provided by a limited number of third parties. We rely on these wafer foundries and packaging and test providers for supply continuity of these critical semiconductor devices.
To date, we have not experienced material delays or reduced raw material availability as a result of trade disputes between the U.S. and China, including the imposition in 2018 of import tariffs under the provisions of Section 301 of the Trade Act of 1974 (19 U.S.C. § 2411) (“Section 301 Tariffs”) on certain Chinese goods imported into the United States. For the year ended December 31, 2024, costs associated with tariffs totaled approximately $4,189,000, a decrease of 47.5% compared to $7,985,000 in costs incurred for the year ended December 31, 2023. For the year ended December 31, 2022, costs associated with tariffs totaled approximately $10,201,000. We continue to assess the impact of these costs and are actively evaluating alternative sources of raw materials. We also have filed “duty drawback” applications with U.S. Customs and Border Protection for the recovery of tariffs paid on raw materials used to produce products we subsequently exported. We recovered $1,669,000, $6,954,000 and $229,000 for the years ended December 31, 2024, 2023 and 2022, respectively, however, we are not able to estimate the amount or timing of any additional recoveries, and there can be no assurance that there will be any additional recoveries.
Intellectual Property
Our competitive positioning has been, and will continue to be, supported by our long-standing commitment to research and development of power distribution architectures, power conversion technologies, advanced packaging and manufacturing, and innovative approaches to solving customer problems. Our research and development activities have resulted in important patents protecting our products and enabling technologies, as well as proprietary trade secrets associated with our use of certain components and materials of our own design and proprietary manufacturing, packaging, and testing processes. We incurred approximately $68,922,000, $67,857,000, and $60,594,000 in research and development expenses in 2024, 2023, and 2022, respectively, representing approximately 19.2%, 16.8%, and 15.2% of revenues in 2024, 2023, and 2022, respectively.
We believe our intellectual property affords advantages by building fundamental and multilayered barriers to competitive encroachment upon key features and performance benefits of our principal product families. Our patents cover the fundamental switching topologies used to achieve the performance attributes of our converter product lines; converter array architectures; product packaging design; product construction; high frequency magnetic structures; and automated equipment and methods for circuit and product assembly.
As of December 31, 2024, in the United States, we have been issued 121 patents having expirations scheduled between 2025 and 2040 and have filed a number of patent applications which are still pending, many of which are expected to issue as patents in 2025. We have vigorously protected our rights under these patents and will continue to do so. Although we believe patents are an effective way of protecting our technology, there can be no assurances our patents will prove to be enforceable in any given jurisdiction.
In addition to generating revenue from product sales, we seek to license our intellectual property. In granting licenses, we generally retain the right to use our patented technologies and manufacture and sell our products in all licensed geographic areas and fields of use. Revenues from licensing arrangements were approximately $46,595,000, $15,872,000, and $2,801,000 in 2024, 2023, and 2022, respectively, representing approximately 13.0%, 3.9%, and 0.7% of revenues in 2024, 2023, and 2022, respectively.
Human Capital Management
High-caliber employees are important to achieving Vicor’s mission of providing the highest performance power solutions to meet the requirements of the most demanding applications. In order to maintain leadership in power systems design in a highly competitive employment market, attracting and retaining the best team worldwide is critical. Accordingly,
we offer compelling compensation and benefits, foster a culture of innovation in which employees are empowered to do (and are rewarded for) their best work, and seek to establish Vicor as a meaningful contributor to the communities in which we operate, further strengthening the bonds between employees and the Company.
As of December 31, 2024, we had 1,074 full-time employees, of which 984 were in the U.S. and 90 were in our international locations. As of December 31, 2024, we also had 26 part-time temporary employees. None of our employees are represented by a labor union or covered by a collective bargaining agreement.
We recruit from colleges and universities, with a focus on specific engineering disciplines. In collaboration with certain universities, we maintain a student “Co-Op” program, whereby qualifying undergraduate and graduate students work at our Andover facilities for one or two semesters, receiving course credit towards their graduation. In recent years, we have had as many as approximately two dozen participants per semester, with a number of participants receiving offers of full-time employment.
Our compensation program is designed to attract and reward talented individuals who possess the skills necessary to support our business objectives, assist in the achievement of our strategic goals, and create long-term value for our stockholders. We provide employees with compensation packages that include a competitive base salary or wage rate and benefits such as life and health (medical, dental, and vision) insurance, supplemental insurance, paid time off, paid parental leave, and a 401(k) plan (with Company match). Generally (and subject to local laws), new employees are awarded non-qualified options for the purchase of the Company’s common stock. Depending on an employee’s role, he or she may be eligible for annual incentive bonuses and periodic awards of non-qualified options based on the performance of the Company and that of the employee. We believe a compensation program with appropriate long-term incentives aligns employee and stockholder interests in increasing the value of the Company.
We emphasize and encourage employee development and training. To empower employees to reach their potential, we provide a range of development programs and opportunities, including in-house training programs and tuition reimbursement for those pursuing outside certification or degrees.
We seek to support the communities in which we operate and believe this commitment contributes to our efforts to attract and retain employees. We also partner with a range of non-profit organizations and have had notable success in our collaboration for over two decades with the Crest Collaborative of Andover, MA, a local advocacy agency, in providing enriching employment opportunities for individuals with disabilities.
Available Information
We maintain a website with the address www.vicorpower.com and make available free of charge through this website our Annual Reports on Form 10-K, Quarterly Reports on Form 10-Q, Current Reports on Form 8-K, and amendments to these reports filed or furnished pursuant to Section 13(a) or 15(d) of the Exchange Act, as soon as reasonably practicable after we electronically file such material with, or furnish such material to, the SEC. We also make available on our website our Code of Business Conduct, as well as the charters for the Audit and Compensation Committees of our Board of Directors.
While our website sets forth extensive information, including information regarding our products and the applications in which they may be used, such information is not a part of, nor incorporated by reference into, this Annual Report on Form 10-K and shall not be deemed “filed” under the Exchange Act.
ITEM 1A. RISK FACTORS
This Annual Report on Form 10-K contains forward-looking statements within the meaning of Section 27A of the Securities Act of 1933, as amended, and Section 21E of the Exchange Act. Actual results could differ materially from those projected in the forward-looking statements as a result of, among other factors, the risk factors set forth below.
Operational Risks
Our future operating results are difficult to predict and are subject to fluctuations.
Our operating results, including revenues, gross margins, operating expenses, and net income (loss), have fluctuated on a quarterly and annual basis. Our strategic focus on higher volume opportunities with OEMs, ODMs, and contract manufacturers has caused the actions of a relative few such customers to disproportionately influence our operating results.
Unanticipated delays in purchase orders from, and shipments to, certain large customers have resulted in lower than expected revenue. Similarly, our strategic focus on the development of market-leading technologies and manufacturing processes, often implemented in proprietary semiconductor circuitry, materials, and packaging, has exposed the Company to the risks and costs of delays in such development and the use of a relatively few number of suppliers of proprietary circuits and materials or providers of proprietary services.
Despite recent profitability trends, we cannot predict if we will maintain sustained profitability. Our future operating results may be materially influenced by a number of factors, many of which are beyond our control, including:
•changes in demand for our products and for our customers’ end-products incorporating our products, as well as our ability to respond efficiently to such changes in demand, including changes in delivery lead times and the volume of product for which orders are accepted and the product shipped within an individual quarter;
•our ability to manage our supply chain, inventory levels, and our own manufacturing capacity or that of third-party partners, particularly in the event of delays or cancellation of significant customer orders or in the event of delays or cost increases associated with our supply chain;
•our ability to effectively coordinate changes in the mix of products we manufacture and sell, while managing our ongoing transition in organizational focus and manufacturing infrastructure to Advanced Products from Brick Products;
•our ability to provide and maintain a high level of sales and engineering support to an increasing number of demanding, high volume customers;
•the ability of our third party suppliers and service subcontractors to provide us sufficient quantities of high quality products, components, and/or services on a timely and cost-effective basis;
•the effectiveness of our ongoing efforts to continuously reduce manufacturing costs per unit and manage operating expenses;
•our ability to absorb and mitigate the impact of inflation on our operating results;
•our ability to utilize our manufacturing facilities and personnel at efficient levels, maintaining sufficient production capacity and necessary manufacturing yields;
•the timing of our new product introductions and our ability to meet customer expectations for timely delivery of fully qualified products;
•the timing of new product introductions or other competitive actions (e.g., product price reductions) by our competitors;
•the ability to hire, retain, and motivate qualified employees to meet the demands of our customers;
•intellectual property disputes including disputes relating to the licensing of our intellectual property;
•our ability to license our intellectual property;
•litigation-related costs, which may be significant;
•adverse economic conditions in the U.S. and those foreign countries in which we operate, as well as our ability to respond to unanticipated developments, such as the imposition of tariffs or trade restrictions;
•adverse budgetary conditions within the U.S. government, particularly the Department of Defense, which continue to influence spending on current and anticipated programs into which we sell or anticipate to sell our products;
•costs related to compliance with increasing worldwide governance, quality, environmental, and other regulations;
•costs and consequences of disruption by third-parties of our global computer network and related resources; and
•the effects of events outside of our control, including public health emergencies, natural disasters, terrorist activities, political risks, international conflicts, information security breaches, communication interruptions, and other force majeure.
As a result of these and other factors, we cannot assure you we will not experience significant fluctuations in future operating results on a quarterly or annual basis. In addition, if our operating results do not meet the expectations of investors, the market price of our Common Stock may decline.
Global economic and political uncertainties, notably those associated with trade policy, could materially and adversely affect our business and consolidated operating results.
For the years ended December 31, 2024, 2023, and 2022, revenues from sales outside the United States were 48.2%, 63.1%, and 67.6%, respectively, of our total revenues. Net revenues from customers in China and Hong Kong, accounted for approximately 12.6% in 2024, approximately 17.7% in 2023, and approximately 18.8% in 2022 of total net revenues. We expect international sales, notably in Asia, will continue to be a significant component of total sales, since many of the OEMs and ODMs we target as customers are domiciled offshore, and such customers increasingly utilize offshore contract manufacturers, and rely upon those contract manufacturers to place orders directly with us.
To date, we have not experienced material delays or reduced raw material availability as a result of trade disputes between the U.S. and China, including the imposition in 2018 of import tariffs under the provisions of Section 301 of the Trade Act of 1974 (19 U.S.C. § 2411) (“Section 301 Tariffs”) on certain Chinese goods imported into the United States. However, the costs of Section 301 Tariffs have had a material impact on our profitability. For the year ended December 31, 2024, Section 301 Tariffs totaled approximately $4,189,000, a decrease of 47.5% compared to $7,985,000 incurred for 2023. For the year ended December 31, 2022, costs associated with tariffs totaled approximately $10,201,000. For 2024, 2023 and 2022, Section 301 Tariffs totaled approximately 1.2%, 2.0% and 2.6%, respectively, of annual revenue, representing a reduction in our gross profit margin as a percentage of annual revenue.
We have filed “duty drawback” applications with U.S. Customs and Border Protection for the recovery of Section 301 Tariffs paid on raw materials and components used to produce products we subsequently exported. We recovered $1,669,000 for the year ended December 31, 2024, however, we are not able to estimate the amount or timing of any additional recoveries, and there can be no assurance that there will be any additional recoveries.
Uncertain macroeconomic conditions, extended trade disputes, an evolving and unpredictable tariff environment, export controls, and the relative strength of the U.S. Dollar may reduce end-demand for our customers’ products and, in turn, their purchases of our products, thereby reducing our revenues and earnings. In addition, such adverse conditions may, among other things, result in increased price competition for our products, notably in Brick Product categories, increased risk of excess and obsolete inventories, increased risk in the collectability of our accounts receivable from our customers, increased risk in potential reserves for doubtful accounts and write-offs of accounts receivable, and higher operating costs as a percentage of revenues. We cannot predict the extent and/or impact of the current trade and tariff disputes between the United States and other countries, which adds to the uncertainty and risks associated with our business.
Our operating results recently have been influenced by a limited number of customers, and our future results may be similarly influenced.
Since the introduction of our Advanced Products, the Company has derived the majority of its revenue from Advanced Products in any given year from either one customer or a limited number of customers, whether through sales directly to the customer(s), indirectly to the customers’ contract manufacturers, or through royalties. This concentration of revenue is a reflection of the relatively early stage of adoption of the Advanced Products and the associated technologies and power system architectures, and our targeting of market leading innovators as initial customers.
Our current sales and marketing efforts are focused primarily on accelerating the adoption of Advanced Products by a diversified customer base, across a number of identified market segments. While we believe we have been successful to date in diversifying our Advanced Products customer base beyond early adopters, we cannot assure you our strategy will be successful and further diversification of customers will be achieved, nor can we assure you that customers using one generation of our Advanced Products will adopt the next generation.
We may not be able to procure necessary key components or raw materials, or we may purchase excess raw material inventory or unusable inventory, which increases the risk of reserve charges to reduce the value of any inventory deemed excess or obsolete, thereby reducing our profitability.
The power systems industry, and the electronics industry as a whole, can be subject to pronounced, lengthy business cycles and otherwise subject to sudden and sharp changes in demand. Our success, in part, is dependent on our ability to forecast and procure inventories of components and materials to match production schedules and customer delivery
requirements. Many of our products require raw materials supplied by a limited number of vendors and, in some instances, a single vendor. During certain periods, key components or materials required to build our products may become unavailable in the timeframe required for us to meet our customers’ needs. Our inability to secure sufficient raw materials to manufacture products for our customers has reduced, in the past, our revenue and profitability and could do so again. Over the course of the last few years, there have been circumstances where supply disruptions have impacted our results.
We may choose, and have chosen, to mitigate our inventory risks by increasing the levels of inventory for certain components and materials. Such increased inventory levels may increase the potential risk for excess or obsolete inventories, should our forecasts fail to materialize or if there are negative factors impacting our customers’ end markets, leading to order cancellation. If we identify excess inventory or determine certain inventory is obsolete (i.e., unusable), we likely will record additional inventory reserves (i.e., expenses representing the write-off of the excess or obsolete inventory), which could have an adverse effect on our gross margins and on our operating results.
We rely on third-party vendors and subcontractors for supply of components, assemblies, and services and, therefore, cannot control the availability or quality of such components, assemblies, and services.
We depend on third-party vendors and subcontractors to supply components, assemblies, and services used to manufacture our products, some of which are supplied by a single vendor. In the past, we have experienced shortages of certain semiconductor components and delays in service delivery, have incurred additional and unexpected costs to address the shortages and delays, and have experienced our own delays in production and shipping. While these supply challenges have recently abated, as supply chains loosened up following the pandemic-related shortages and delays, they nonetheless remain risks to our business going forward as the global environment and supply chains are buffeted by changing geopolitical forces.
If suppliers or subcontractors cannot provide their products or services on time or to our specifications, we may not be able to meet the demand for our products and our delivery times may be negatively affected. In addition, we cannot directly control the quality of the products and services provided by third parties. In order to expand revenue, we likely will need to identify and qualify new suppliers and subcontractors to supplant or replace existing suppliers and subcontractors, which may be a time-consuming and expensive process. In addition, any qualification of new suppliers may require customers of our products utilizing products and services from new suppliers and service providers to undergo a re-qualification process. Such circumstances likely would lead to disruptions in our production, increased manufacturing costs, delays in shipping to our customers, and/or increases in prices paid to third parties for products and services.
Extended interruption of production at our manufacturing facility in Andover, Massachusetts, or a failure to achieve anticipated efficiencies could materially reduce our revenue, increase our costs, and, potentially, negatively impact our customers.
The majority of our power components and power systems, whether for direct sale to customers or for sale to our subsidiaries for incorporation into their respective products, are manufactured in our Andover facility.
Substantial damage to our manufacturing facility due to fire, natural disaster, power loss, or other events, could interrupt manufacturing, contributing to lengthy shipment delays that could have a negative impact on customers and, in turn, our customer relationships. While we have never experienced any meaningful interruption of manufacturing in our history, any prolonged inability to utilize all or a significant portion of our Andover facility could have a material adverse effect on our results of operations.
We have been making and will continue to make capital investments for the expansion of manufacturing capacity for the production of Advanced Products at our Andover facility. Over the last few years, as part of the expansion of our Andover facility, we brought in-house the complex electroplating operation previously outsourced to a third-party partner. In addition, work is underway to bring in-house an additional final step associated with the manufacture of power modules, which step is now conducted by a subcontractor at the subcontractor’s facilities. Once this additional manufacturing step has been completed, we may not achieve the anticipated production volumes and operating efficiencies. As we qualify equipment and bring production online, any delay in achieving anticipated operating efficiencies associated with added capacity may cause manufacturing costs to be higher than expected for some period of time, thereby potentially negatively influencing our operating and financial results.
Disruption of our information technology infrastructure could adversely affect our business.
We depend heavily on our computing and communications infrastructure to achieve our business objectives, particularly for our financial and operational record keeping, our computer-integrated manufacturing processes controlling all aspects of our operations in our manufacturing facility in Andover, Massachusetts, our public website, and our email communications. We also rely on trusted third parties to provide certain infrastructure support services to us. If we or a third party service provider encounter a problem that impairs this infrastructure, the resulting disruption could impede the accuracy and timeliness of our financial reporting processes, and our ability to record or process customer orders, manufacture, and ship in a timely manner, or otherwise carry on business in the normal course. Our image and reputation also could be negatively affected by such circumstances. Additionally, we could incur material liabilities associated with the harm such impairment and disruption of our infrastructure may have on third parties including those associated with the unintentional release of confidential information and or sensitive data. While we carry business interruption insurance to offset financial losses from such an interruption, and cyber-risk insurance to address potential liabilities from such circumstances, such insurance may be insufficient to compensate us for the potentially significant costs or liabilities incurred. Any such events, if prolonged, could have a material and adverse effect on our operating results and financial condition.
On January 1, 2025, Vicor converted from a legacy enterprise resource planning (“ERP”) system to a modern ERP system. While this system change is a technology upgrade, we may not be able to successfully implement the ERP system without delays related to resource constraints or challenges with the design or testing phases of the implementation. Inefficiencies in our financial reporting processes due to the conversion to a new ERP system could adversely affect our ability to produce accurate financial statements on a timely basis until the new ERP system and processes have matured. Additionally, the effectiveness of our internal control over financial reporting could be adversely affected if the new ERP system is not successfully implemented. If we are not able to effectively integrate the new ERP system, on the anticipated timeline or at all, our operating results and financial condition could be materially and adversely affected.
Our systems are designed to protect us from network security incidents and associated disruptions. However, we remain vulnerable to computer viruses and related software-based challenges to the integrity of our systems, unauthorized or illegal break-ins, or malicious network hacking, equipment or software sabotage, acts of vandalism to our systems by third parties, and, in the extreme, forms of cyber-terrorism.
The Company provides confidential information to third party business partners and/or receives confidential information from third party business partners in certain circumstances, when doing so is necessary to conduct business, particularly with departments of agencies of the U.S. Government. While we employ confidentiality agreements to protect other sensitive information (i.e., information not considered controlled unclassified information), our own security measures or those of our third party service providers may not be sufficient to protect such information in the event the computing infrastructure of these third party business partners is compromised. Security incidents involving our computing and communications infrastructure or that of a third party business partner or service provider could result in the misappropriation or unauthorized release of confidential information belonging to us or to our employees, partners, customers or suppliers, which could result in an interruption to our operations, result in a violation of privacy or other laws, expose us to a risk of litigation, or damage our reputation, any of which could have a material and adverse effect on our operating results and financial condition.
We may face legal claims and litigation from product warranty or other claims that could be costly to resolve and could impact our business.
We have in the past and may in the future encounter legal action from customers, vendors, or others concerning product warranty or other claims. We generally offer a two-year warranty from the date title passes from us for all of our standard products. The warranty period is three years for a range of H Grade, M Grade and MI Family DC-DC legacy products.
We invest significant resources in the testing of our products; however, if any of our products contain defects, we may be required to incur additional development and remediation costs, pursuant to our warranty policies. These issues may divert our technical and other resources from other product development efforts and could result in claims against us by our customers or others, including liability for costs associated with product returns, which may adversely influence our operating results. If any of our products contain defects, or have reliability, quality, or compatibility problems, the Company’s reputation may be damaged, which could make it more difficult for us to sell our products to existing and prospective customers and could adversely affect our operating results.
Our ability to successfully implement our business strategy may be limited if we do not retain our key personnel and attract and retain skilled and experienced personnel.
Our success depends on our ability to retain the services of our executive officers. The loss of one or more members of senior management could materially adversely influence our business and financial results. In particular, we are dependent on the services of Dr. Vinciarelli, our founder, Chairman of the Board, Chief Executive Officer, and President. The loss of the services of Dr. Vinciarelli could have a material adverse effect on our development of new products and on our business and results of operations. In addition, our research and development and marketing and sales activities depend on highly skilled engineers and other personnel with technical skills, who are in high demand and are difficult to replace. Our continued operations and growth depend on our ability to attract and retain skilled and experienced personnel in a very competitive employment market. If we are unable to attract and retain such employees, our ability to successfully implement our business strategy may be harmed.
Our operations could be affected by the complex laws, rules and regulations to which our business is subject, and political and other actions may adversely impact our business.
We are subject to laws and regulations domestically and worldwide, affecting our operations in areas including, but not limited to, intellectual property ownership and infringement; taxes; import and export requirements and tariffs; anti-corruption; business acquisitions; foreign exchange controls and cash repatriation restrictions; data privacy requirements; employment; product regulations; cybersecurity; environmental, health, and safety requirements; and climate change. Compliance with such requirements can be onerous and expensive and may impact our business operations negatively. Should any of these laws, rules and regulations be amended or expanded, or new ones enacted, we could incur materially greater compliance costs and/or restrictions on our ability to manufacture our products and operate our business.
Government actions, including trade protection and national security policies of U.S. and foreign government bodies, such as tariffs, import or export regulations, including deemed export restrictions, trade and economic sanctions, decrees, quotas or other trade barriers and restrictions could affect our ability or the ability of our customers and end users to sell products in certain countries and thereby have a material adverse effect on our business, revenue and results of operations. In recent years, the U.S. government has continued to expand the number of foreign entities on the Entity List (a restricted party list that imposes additional licensing requirements on shipments to listed parties). These export controls are, in part, intended to restrict the ability of the People’s Republic of China to obtain advanced computing chips, develop and maintain supercomputers, and manufacture advanced semiconductors. The implementation, interpretation and impact on our business of these rules and other regulatory actions taken by the U.S. government is uncertain and evolving, and these rules, other regulatory actions or changes, and other actions taken by the governments of either the U.S. or China, or both, that have occurred and may occur in the future could materially and adversely affect our business, revenue and results of operations.
While we have policies and procedures in place to ensure compliance with sanctions and trade restrictions and other applicable laws, our employees, contractors, partners, and agents may take actions in violation of such policies and applicable law, for which we may be ultimately held responsible. Intentional and unintentional violations of these laws can result in fines and penalties; criminal sanctions against us, our officers, or our employees; prohibitions on the conduct of our business; and damage to our reputation, any of which could have a material and adverse impact on our business, operating results and financial condition.
Competitive Risks
We compete with many companies possessing far greater resources.
Some of our competitors have far greater financial, manufacturing, technical, and sales and marketing resources than we possess or have access to. Our Brick Products compete with those products offered by domestic and foreign manufacturers of integrated power supplies and related power conversion components. With our Advanced Product lines, we compete with global IDMs and fabless developers of semiconductor-based power management modules and power management ICs. These competitors have far larger organizations and broader semiconductor-based product lines. Competition is generally based on product performance, design flexibility (i.e., ease of use), product price, and product availability, but with the relative importance of these factors varying among products, markets, and customers.
Existing or new competitors may develop products or technologies that more effectively address the demands of our customers and markets with enhanced performance, features and functionality, or lower cost. Larger competitors frequently seek to maintain market share and protect customer relationships through heavily-discounted pricing, which we may not be able to match. If we fail to develop and commercialize leading-edge technologies and products that are cost effective and maintain high standards of quality, and introduce them to the market on a timely basis, our competitive position and results of operations could be materially adversely affected.
Our future success depends upon our ability to develop and market differentiated, leading-edge power conversion products for larger customers, potentially contributing to lengthy product development and sales cycles that may result in significant expenditures before revenues are generated. Our future operating results are dependent on the growth in such customers’ businesses and on our ability to profitably develop and deliver products meeting customer requirements.
The power system industry and the industries in which many of our customers operate are characterized by intense competition, rapid technological change, quickened product obsolescence, and price erosion for mature products, each of which could have an adverse effect on our results of operations. We are following a strategy based on the development of differentiated Advanced Products addressing what we believe to be the long-term limitations of traditional power architectures, while at the same time sustaining sales and profitability of our well-established Brick Products. The development of new, innovative products is often a complex, time-consuming, and costly process involving significant investment in research and development, with no assurance of return on investment. Although we have introduced many Advanced Products over recent years, there can be no assurance we will be able to continue to develop and introduce new and improved products and power system concepts in a timely or efficient manner. Similarly, there can be no assurance recently introduced or to be developed products will achieve customer acceptance.
Our future success depends substantially upon further customer acceptance of our innovative Advanced Products including our Power-on-Package concept for the computing market and Advanced Products supporting the electrification of automobiles. As we have been in the early stages of market penetration for these and other Advanced Products, we have experienced lengthy periods during which we have focused our product development efforts on the specific requirements of a limited number of large customers, followed by further periods of delay before meaningful purchase orders are received. These lengthy development and sales cycle times increase the possibility a customer may decide to cancel or change product plans, which could reduce or eliminate our sales to that customer. As a result, we may incur significant product development expenses, as well as significant sales and marketing expenses, before we generate the related revenues for these products. Furthermore, we may never generate the anticipated revenues from a product after incurring such expenses if our customer cancels or changes its product plans.
We have continued our expansion of a dedicated sales effort to penetrate the automotive market with our Advanced Products, notably in the electrification of passenger automobiles. Our Power Component Design Methodology provides conversion solutions for 800V, 400V, and 48V within advanced electric vehicles. The automotive market is dominated by relatively few global OEMs and “tiers” of well-established suppliers. Penetrating this market will be challenging and we may not be successful in doing so.
We continue to focus our go-to-market strategy on larger opportunities with global OEMs, ODMs, and contract manufacturers. Our growth is therefore dependent on: the pace at which these OEMs and ODMs develop their own new products; the acceptance of our Advanced Products by these OEMs and ODMs; and the success of the customers’ products incorporating our Advanced Products. If we fail to anticipate changes in our customers’ businesses and their changing product needs or do not successfully identify and enter new markets, our results of operations and financial position could be negatively impacted.
We cannot offer any assurance the markets we currently serve will grow in the future, our Advanced Products or Brick Products will meet respective market requirements, or we can maintain adequate gross margins or operating profits in these markets.
Intellectual Property Risks
We may be unable to adequately protect our proprietary rights, which may limit our ability to compete effectively.
We operate in an industry in which the ability to compete depends on the development or acquisition of proprietary technologies that must be protected to preserve the exclusive use of such technologies. We devote substantial resources to establish and protect our patents and proprietary rights, and we rely on patent and intellectual property law to protect such rights. This protection, however, may not prevent competitors from independently developing products similar or superior to our products. We may be unable to protect or enforce current patents, may rely on unpatented technology that competitors could restrict or replicate, or may be unable to acquire patents in the future, all of which may have a material adverse effect on our competitive position. In addition, the intellectual property laws of foreign countries may not protect our rights to the same extent as those of the United States. We have been defending and may need to continue to defend or challenge patents. We have incurred and expect to incur significant financial costs in the defense of our patented technologies and have devoted
and expect to devote significant resources to these efforts which, if unsuccessful, may have a material adverse effect on our operating results and financial position.
We face intellectual property infringement claims that could be disruptive to operations and costly to resolve and may encounter similar infringement claims in the future.
The power supply industry is characterized by vigorous protection and pursuit of intellectual property rights. We have in the past received and may in the future receive communications from third parties asserting that our products or manufacturing processes infringe on a third party’s patent or other intellectual property rights. Such assertions, if publicly disclosed, have in the past inhibited and may in the future inhibit the willingness of potential customers to purchase certain of our products. In the event a third party makes a valid intellectual property claim against us and a license is not available to us on commercially reasonable terms, or at all, we could be forced to either redesign or stop production of products incorporating that technology, and our business, financial condition and operating results could be materially and adversely affected. In addition, litigation may be necessary to defend us against claims of infringement, and this litigation could be costly, extend over a lengthy period of time, and divert the attention of key personnel. An adverse outcome in these types of matters could have a material adverse impact on our business, operating results and financial condition.
Please see Note 16 – Commitments and Contingencies, to the Consolidated Financial Statements for information regarding current litigation related to our intellectual property.
Any expenses or liability resulting from the outcome of litigation could adversely influence our operating results and financial condition.
From time to time, we may be subject to claims or litigation, including intellectual property litigation as described elsewhere in this Annual Report on Form 10-K. Any such claims or litigation may be time-consuming and costly, divert management resources, require us to change our products, or have other adverse effects on our business. Any of the foregoing could have a material adverse effect on our operating results and could require us to pay significant monetary damages.
The outcomes of legal proceedings and claims brought against us are subject to significant uncertainty. An estimated loss from a loss contingency such as a legal proceeding or claim is accrued by a charge to income if it is considered probable an asset has been impaired or a liability has been incurred and the amount of the loss can be reasonably estimated. Disclosure of a contingency is required if there is at least a reasonable possibility that a loss has been incurred. In determining whether a loss should be accrued, we evaluate, among other factors, the degree of probability of an unfavorable outcome and the ability to make a reasonable estimate of the amount of loss. Changes in these factors could materially impact our financial statements.
Please see Note 16 – Commitments and Contingencies, to the Consolidated Financial Statements for information regarding current litigation related to our intellectual property.
Regulatory Risks
If we fail to maintain an effective system of internal controls over financial reporting or discover material weaknesses in our internal controls over financial reporting, we may not be able to report our financial results accurately or timely or detect fraud, which could have a material adverse effect on our business.
An effective internal control environment is necessary for us to produce reliable financial reports and is an important part of our effort to prevent financial fraud. Section 404 of the Sarbanes-Oxley Act of 2002 (“SOX”) requires our management to report on, and our independent registered public accounting firm to attest to, the effectiveness of our internal control over financial reporting.
We have an ongoing program to perform the system and process evaluation and testing necessary to comply with the requirements of SOX and to continuously improve and, when necessary, remediate internal controls over financial reporting.
While management evaluates the effectiveness of our internal controls on a regular basis, these controls may not always be effective. There are inherent limitations on the effectiveness of internal controls, including collusion, management override, and failure in human judgment. In addition, control procedures are designed to reduce rather than eliminate business risks. In the event our Chief Executive Officer or Chief Financial Officer, our certifying officers under SOX, or our independent registered public accounting firm determines our internal controls over financial reporting are not effective as defined under Section 404, we may be unable to produce reliable financial reports or prevent fraud, which could materially
harm our business. In addition, we may be subject to sanctions or investigation by government authorities or self-regulatory organizations, such as the SEC, the Financial Industry Regulatory Authority, or The NASDAQ Stock Market LLC. Any such actions could affect investor perceptions of the Company and result in an adverse reaction in the financial markets due to a loss of confidence in the reliability of our financial statements, which could cause the market price of our Common Stock to decline or limit our access to capital.
We cannot be certain what changes to the regulatory environment might occur under the new administration. However, if the regulatory environment changes in ways that disrupt our business there could be a material and adverse effect on our operations and financial performance.
Risks Related to Share Value
The price of our Common Stock has been volatile and may fluctuate in the future.
Because of the factors set forth above and below, among others, the trading price of our Common Stock has fluctuated and may continue to fluctuate significantly:
•volatility of the financial markets, notably the equity markets in the U.S.;
•uncertainty regarding the prospects of domestic and foreign economies, including the impact of volatile currency exchange rates;
•uncertainty regarding domestic and international political conditions, including tax, trade, and tariff policies;
•actual or anticipated fluctuations in our operating performance or that of our competitors;
•the performance and prospects of our major customers, including their adoption of technologies or standards other than those in which we specialize;
•announcements by us or our competitors of significant new products, technical innovations, or litigation;
•investor perception of the Company and the industry in which we operate;
•the liquidity of the market for our Common Stock, reflecting a relatively low trading float and relatively low average trading volumes;
•the uncertainty of the declaration and payment of future cash dividends on our Common Stock; and
•the concentration of ownership of our Common Stock by Dr. Vinciarelli, our Chairman of the Board, Chief Executive Officer, and President.
In the past, we have declared and paid cash dividends on our Common Stock. The payment of dividends is based on the periodic determination by our Board of Directors that we have adequate capital to fund anticipated operating requirements and that excess cash is available for distribution to stockholders via a dividend. We have no formal policy regarding dividends and, as such, investors cannot make assumptions regarding the possibility of future dividend payments nor the amounts and timing thereof. As of December 31, 2024, we have no plans to declare or pay a cash dividend.
The ownership of our Common Stock is concentrated between Dr. Vinciarelli and a limited number of institutional investors. As of December 31, 2024, Dr. Vinciarelli was the beneficial owner of 10,021,388 shares of our Common Stock, plus 6,199 shares which Dr. Vinciarelli has the right to acquire upon exercise of options to purchase Common Stock within 60 days of December 31, 2024. He also holds 11,023,648 shares of our unregistered Class B Common Stock (which may only be sold or transferred after required conversion, on a one-for-one basis, into registered shares of Common Stock), which together with his ownership of Common Stock, represents 47.3% of our total issued and outstanding shares of capital stock. Accordingly, the market float for our Common Stock and average daily trading volumes are relatively small, which may negatively impact investors’ ability to buy or sell shares of our Common Stock in a timely manner.
Dr. Vinciarelli owns 93.9% of the issued and outstanding shares of our Class B Common Stock, which possess 10 votes per share. Dr. Estia J. Eichten, a member of our Board of Directors, owns the majority of the balance of the Class B Common Stock issued and outstanding. As such, Dr. Vinciarelli, controlling in aggregate 79.6% of our outstanding voting securities, has effective control of our governance.
ITEM 1B. UNRESOLVED STAFF COMMENTS
None.
ITEM 1C. CYBERSECURITY
Our Company has a dedicated team of technology professionals who consistently monitor risks related to cybersecurity. Our Corporate Vice President and Chief Information Officer, as well as our Chief Information Security Officer (“CISO”) are responsible for managing our information technology (“IT”) security program. Our CISO is a Certified Information Systems Security Professional (CISSP), holds a Masters Degree in Computer Information Systems, and has over 20 years of relevant expertise in assessing and managing cybersecurity risks. Their teams are responsible for leading an enterprise-wide cyber resilience strategy, policy, standards, architecture, and processes. To identify and address potential information security risks, we use a defense-in-depth methodology that employs multiple, redundant defensive measures and outlines actions to take in the event of a security control failure or vulnerability exploitation. To protect the Company from cybersecurity threats, we utilize a combination of internal resources and external consultants and providers. These consultants and providers provide services such as penetration testing, incident response, and third-party assessments. In addition, we use a combination of both proprietary and commercial solutions to proactively manage and mitigate threats to our IT environment and these processes have been integrated into the Company’s overall risk management system.
Our CISO oversees security, including the corporate IT environment, our public cloud presence, and security standards that are used as a framework for managing security across our Company. Our CISO is also responsible for security awareness, administering our corporate security training, and sponsoring our cybersecurity policy and standards. Our cybersecurity plan is reviewed annually, and our Audit Committee has delegated to the Executive Security Incident Response Team which is made up of our Chief Financial Officer, a Board member and senior management representatives in the legal, IT and finance functions, oversight of our cybersecurity program. The Executive Security Incident Response Team receives regular updates directly from our CISO and Vicor product security experts from various business and operational areas. We maintain various security certifications across the Company, and part of our compliance program includes processes to oversee and identify material risks from cybersecurity threats and include the use of third-party service providers to perform regular audits to ensure our security management program remains current.
Our objective for managing information security and cybersecurity risk is to avoid or minimize the impacts of both internal and external threat events and other efforts to penetrate or otherwise compromise the confidentiality, integrity, or availability of our systems. We work to achieve this objective by hardening networks and systems against attack, and by diligently managing visibility and monitoring controls within our data and communications environment to recognize events and respond appropriately.
To keep the Executive Security Incident Response Team apprised of the continually shifting landscape, the CISO typically provides quarterly updates to the Executive Security Incident Response Team on information security and cybersecurity matters. The Executive Security Incident Response Team maintains oversight of the efforts made to maximize information security and cybersecurity efforts. Potential concerns related to information security and cybersecurity will be escalated to the Board of Directors and Audit Committee, as appropriate.
Our cybersecurity infrastructure undergoes external audits. These efforts demonstrate our commitment to maintaining the highest level of cybersecurity protection. Our external third-party providers also evaluate and rank our cybersecurity maturity and coverage as part of their services. To stay informed about emerging threats, we regularly consult with external providers and other sources such as government publications and notices.
Cybersecurity threats, including as a result of any previous cybersecurity incidents, have not materially affected and are not reasonably likely to materially affect the Company, including its business strategy, results of operations or financial condition. Notwithstanding the extensive approach we take to cybersecurity, we may not be successful in preventing or mitigating a cybersecurity incident that could have a material adverse effect on us. While Vicor Corporation maintains cybersecurity insurance, the costs related to cybersecurity threats or disruptions may not be fully insured. See Item 1A. “Risk Factors” for a discussion of cybersecurity risks.
ITEM 2. PROPERTIES
Our corporate headquarters building in Andover, Massachusetts, which we own, provides approximately 90,000 square feet of office space for our sales, marketing, engineering, and administrative personnel. We also own a building of approximately 320,000 square feet in Andover, Massachusetts, which houses all Massachusetts manufacturing activities.
We own a single-story industrial building of approximately 31,000 square feet in Sunnyvale, California, which we have leased on a long-term basis to a corporate tenant, which has occupied the building since June 2016. The initial term of the lease agreement expired on May 31, 2024 and was extended for an additional eighty-four months, commencing June 1, 2024 and ending May 31, 2031.
All other domestic and foreign facilities are leased from third-party lessors on arms’ length terms. We believe our owned and leased facilities are adequate for our foreseeable needs.
ITEM 3. LEGAL PROCEEDINGS
See Note 16 – Commitments and Contingencies, to the Consolidated Financial Statements for a complete description of the Company’s legal proceedings.
ITEM 4. MINE SAFETY DISCLOSURES
Not Applicable.
PART II
ITEM 5. MARKET FOR REGISTRANT’S COMMON EQUITY, RELATED STOCKHOLDER MATTERS AND ISSUER PURCHASES OF EQUITY SECURITIES
Our Common Stock is listed on The NASDAQ Stock Market LLC, under the trading symbol “VICR.” Shares of our Class B Common Stock are not registered with the Securities and Exchange Commission, are not listed on any exchange nor traded on any market, and are subject to transfer restrictions under our Restated Certificate of Incorporation, as amended.
As of February 18, 2025, there were 92 holders of record of our Common Stock and 11 holders of record of our Class B Common Stock. These numbers do not reflect persons or entities that hold their shares in nominee or “street name” through various brokerage firms.
We have no formal policy regarding dividends and, as such, investors cannot make assumptions regarding the possibility of future dividend payments nor the amounts and timing thereof. As of December 31, 2024, we have no plans to declare or pay a cash dividend in the foreseeable future.
Issuer Purchases of Equity Securities
In November 2000, our Board of Directors authorized the repurchase of up to $30,000,000 of our Common Stock (the “November 2000 Plan”). In July 2024, our Board of Directors authorized the repurchase of up to $100,000,000 of our Common Stock (the “New Repurchase Authorization”). The New Repurchase Authorization replaces the November 2000 Plan in its entirety and no further repurchases will be made pursuant to the November 2000 Plan. The timing and amounts of Common Stock repurchases pursuant to the New Repurchase Authorization are at the discretion of the Company’s President and Chief Executive Officer based upon economic and financial market conditions. The New Repurchase Authorization does not expire.
| | | | | | | | | | | | | | | | |
Month of
Fourth Quarter 2024 | | Total
Number of
Shares
Purchased | | | Average Price
Paid per Share | | | Total Number of
Shares Purchased
as Part of Publicly
Announced Plans
or Programs | | | Approximate Dollar
Value of Shares That
May Yet Be Purchased
Under the Plans or
Programs | |
October 1 - 31, 2024 | | | — | | | $ | — | | | | — | | | $ | 99,502,521 | |
November 1 - 30, 2024 | | | — | | | $ | — | | | | — | | | $ | 99,502,521 | |
December 1 - 31, 2024 | | | — | | | $ | — | | | | — | | | $ | 99,502,521 | |
Total | | | — | | | $ | — | | | | — | | | $ | 99,502,521 | |
Stockholder Return Performance Graph
The graph set forth below presents the cumulative, five-year stockholder return for each of (i) the Company’s Common Stock, (ii) the Standard & Poor’s 500 Index (“S&P 500 Index”), a value-weighted index made up of 500 of the largest, by market capitalization, listed companies, and (iii) the Standard & Poor’s SmallCap 600 Index (“S&P SmallCap 600 Index”), a value-weighted index of 600 listed companies with market capitalizations between $750,000,000 and $4,600,000,000.
The graph assumes an investment of $100 on December 31, 2019, in each of our Common Stock, the S&P 500 Index, and the S&P SmallCap 600 Index, and assumes reinvestment of all dividends. The historical information set forth below is not necessarily indicative of future performance.
Comparison of Five Year Cumulative Return
Among Vicor Corporation, S&P 500 Index, and
S&P SmallCap 600 Index
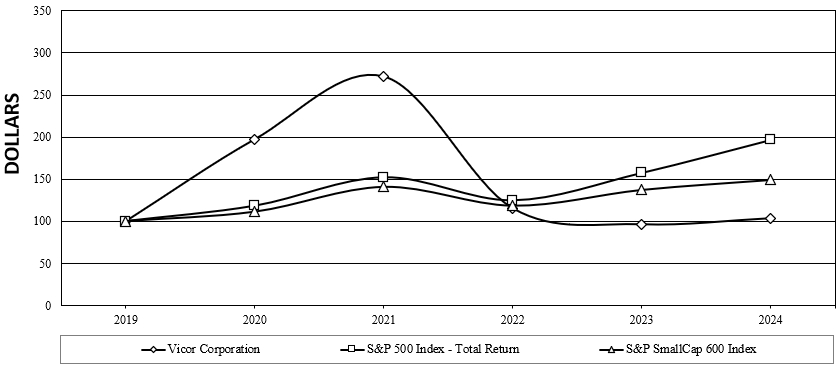
| | | | | | | | | | | | | | | | | | | | | | | | |
| | 2019 | | | 2020 | | | 2021 | | | 2022 | | | 2023 | | | 2024 | |
Vicor Corporation | | $ | 100.00 | | | $ | 197.39 | | | $ | 271.79 | | | $ | 115.03 | | | $ | 96.17 | | | $ | 103.39 | |
S&P 500 Index | | $ | 100.00 | | | $ | 118.40 | | | $ | 152.39 | | | $ | 124.79 | | | $ | 157.59 | | | $ | 197.02 | |
S&P SmallCap 600 Index | | $ | 100.00 | | | $ | 111.29 | | | $ | 141.13 | | | $ | 118.41 | | | $ | 137.42 | | | $ | 149.37 | |
Equity Compensation Plan Information
Our equity plan information required by this item is incorporated by reference to the information in Part III, Item 12 of this Annual Report on Form 10-K.
ITEM 6. [RESERVED]
ITEM 7. MANAGEMENT’S DISCUSSION AND ANALYSIS OF FINANCIAL CONDITION AND RESULTS OF OPERATIONS
Overview
A discussion regarding our results of operations for the year ended December 31, 2023, compared to the year ended December 31, 2022, was included in the Company’s Annual Report on Form 10-K for the year ended December 31, 2023, on pages 27-29 under Part II, Item 7, “Management’s Discussion and Analysis of Financial Condition and Results of Operations”, which was filed with the SEC on February 28, 2024.
We design, develop, manufacture, and market modular power components and power systems for converting electrical power for use in electrically-powered devices. Our competitive position is supported by innovations in product design and achievements in product performance, largely enabled by our focus on the research and development of advanced technologies and processes, often implemented in proprietary semiconductor circuitry, materials, and packaging. Many of our products incorporate patented or proprietary implementations of high-frequency switching topologies enabling power system solutions that are more efficient and much smaller than conventional alternatives. Our strategy emphasizes demonstrable product differentiation and a value proposition based on competitively superior solution performance, advantageous design flexibility, and a compelling total cost of ownership. While we offer a wide range of alternating current (“AC”) and direct current (“DC”) power conversion products, we consider our core competencies to be associated with 48V DC distribution, which offers numerous inherent cost and performance advantages over lower distribution voltages. However, we also offer products addressing other DC voltage standards (e.g., 380V for power distribution in data centers, 110V for rail applications, 28V for military and avionics applications, and 24V for industrial automation).
Based on design, performance, and form factor considerations, as well as the range of evolving applications for which our products are appropriate, we categorize our product portfolios as either “Advanced Products” or “Brick Products.” The Advanced Products category consists of our more recently introduced products, which are largely used to implement our proprietary Factorized Power Architecture™ (“FPA”), an innovative power distribution architecture enabling flexible, rapid power system design using individual components optimized to perform a specific conversion function.
The Brick Products category largely consists of our broad and well-established families of integrated power converters, incorporating multiple conversion stages, used in conventional power systems architectures. Given the growth profiles of the markets we serve with our Advanced Products line and our Brick Products line, our strategy involves a continuing transition in organizational focus, emphasizing investment in our Advanced Products line and targeting high growth market segments with a low-mix, high-volume operational model, while maintaining a profitable business in the mature market segments we serve with our Brick Products line with a high-mix, low-volume operational model.
The applications in which our Advanced Products and Brick Products are used are typically in the higher-performance, higher-power segments of the market segments we serve. With our Advanced Products, we generally serve large Original Equipment Manufacturers (“OEMs”), Original Design Manufacturers (“ODMs”), and their contract manufacturers, with sales currently concentrated in the data center and hyperscaler segments of enterprise computing, in which our products are used for power delivery on server motherboards, in server racks, and across datacenter infrastructure. We have established a leadership position in the emerging market segment for powering high-performance processors used for acceleration of applications associated with artificial intelligence (“AI”). Our customers in the AI market segment include the leading innovators in processor and accelerator design, as well as early adopters in cloud computing and high performance computing. We also serve applications in aerospace and aviation, defense electronics, satellites, factory automation, instrumentation, test equipment, transportation, telecommunications and networking infrastructure, and vehicles (notably in the autonomous driving, electric vehicle, and hybrid vehicle niches of the vehicle segment). With our Brick Products, we generally serve a fragmented base of large and small customers, concentrated in aerospace and defense electronics, industrial equipment, instrumentation and test equipment, and transportation (notably in rail and heavy equipment applications). With our strategic emphasis on larger, high-volume customers, we expect to experience over time a greater concentration of sales, including from intellectual property licensing among relatively fewer customers.
Our quarterly consolidated operating results can be difficult to forecast and have been subject to significant fluctuations. We plan our production and inventory levels based on management’s estimates of customer demand, customer forecasts, and other information sources. Customer forecasts, particularly those of OEM, ODM, and contract manufacturing customers to which we supply Advanced Products in high volumes, are subject to scheduling changes on short notice, contributing to operating inefficiencies and excess costs. In addition, external factors such as supply chain uncertainties, which are often associated with the cyclicality of the electronics industry, regional macroeconomic and trade-related circumstances, and force majeure events (most recently evidenced by the COVID-19 pandemic), have caused our operating results to vary meaningfully. Supply chain disruptions, including those associated with our reliance on outsourced package
process steps that are essential in the production of some of our Advanced Products, and those relating, for example, to the procurement of raw material, have in the past negatively impacted and may in the future negatively impact our operating results. We have taken steps to mitigate the impact of supply chain disruptions by, among other things and in varying degrees, moving outsourced manufacturing steps in-house to the Company, ordering supplies with extended lead times, paying higher prices for certain supplies or outsourced production, and expediting deliveries at a cost premium. The resulting impact of the steps taken to mitigate supply chain disruptions have, to varying degrees and at different times, reduced our revenue, gross margin, operating profit and cash flow and may continue to do so in the future. Our quarterly gross margin as a percentage of net revenues may vary, depending on production volumes, licensing income, average selling prices, average unit costs, the mix of products sold during that quarter, and the level of importation of raw materials subject to tariffs. Our quarterly operating margin as a percentage of net revenues also may vary with changes in revenue and product level profitability, but our operating costs are largely associated with compensation and related employee costs, which are not subject to sudden or significant changes.
2024 Financial Highlights
•Net revenues decreased 11.4% to $359,058,000 for 2024, from $405,059,000 for 2023. Net revenues for Advanced Products for 2024 decreased compared to 2023, primarily due to continued softness in underpenetrated markets, partially offset by increased royalty revenue associated with intellectual property licensing. The decrease in net revenues for Brick Products was primarily due to reduced market demand.
•Export sales, as a percentage of total revenues, represented approximately 48.2% in 2024 and 63.1% in 2023.
•Gross margin decreased to $183,998,000 for 2024, from $204,929,000 for 2023. Gross margin, as a percentage of net revenues increased to 51.2% for 2024 from 50.6% for 2023. The decrease in gross margin dollars was primarily the result of lower sales volume in 2024, with the increase in gross margin percentage primarily attributable to higher royalty revenue and improved production efficiencies compared to 2023 along with certain reductions in supply chain costs.
•Backlog, representing the total of orders received for products for which shipment is scheduled within the next 12 months, was approximately $155,505,000 at the end of 2024, as compared to $160,805,000 at the end of 2023.
•Operating expenses for 2024 increased $31,737,000, or 20.7%, to $185,308,000 from $153,571,000 for 2023. Litigation-contingency expense was $19,500,000 for 2024, which related to the litigation with SynQor, Inc. ("SynQor"), as compared to $0 for 2023. See Note 16 to the Consolidated Financial Statements for additional information regarding the SynQor litigation-contingency expense.
•We reported net income for 2024 of $6,129,000, or $0.14 per diluted share, compared to net income of $53,595,000, or $1.19 per diluted share, for 2023.
•In 2024, as a result of a full year of activities in our expanded manufacturing facility and the related capital equipment being placed in service during the year, depreciation and amortization totaled $18,626,000, and capital expenditures were $23,602,000, compared to $17,240,000 and $33,452,000, respectively, for 2023.
•Inventories decreased by approximately $547,000, or 0.5%, to $106,032,000 at the end of 2024, as compared to $106,579,000 at the end of 2023.
The following table sets forth certain items of selected consolidated financial information as a percentage of net revenues for the years ended December 31, 2024, 2023, and 2022. This table and the subsequent discussion should be read in conjunction with the Consolidated Financial Statements and related notes contained elsewhere in this report.
| | | | | | | | | | | | |
| | Year Ended December 31, | |
| | 2024 | | | 2023 | | | 2022 | |
Net revenues | | | 100.0 | % | | | 100.0 | % | | | 100.0 | % |
Gross margin | | | 51.2 | % | | | 50.6 | % | | | 45.2 | % |
Selling, general and administrative expenses | | | 27.0 | % | | | 21.2 | % | | | 21.6 | % |
Research and development expenses | | | 19.2 | % | | | 16.8 | % | | | 15.2 | % |
Income before income taxes | | | 2.9 | % | | | 14.9 | % | | | 7.2 | % |
Critical Accounting Policies and Estimates
Management’s Discussion and Analysis of Financial Condition and Results of Operations is based upon our Consolidated Financial Statements, which have been prepared in accordance with accounting principles generally accepted in the United States (“U.S. GAAP”). The preparation of these financial statements requires management to make estimates and assumptions that affect the reported amounts of assets, liabilities, revenues, expenses, and related disclosures of contingent assets and liabilities. On an ongoing basis, we evaluate our estimates and assumptions, and our associated judgments, including those related to inventories, income taxes, contingencies, and litigation. We base our estimates, assumptions, and judgments on historical experience, knowledge of current conditions, and on various other factors we believe to be reasonable under the circumstances, the results of which form the basis for making judgments about the carrying value of assets and liabilities that are not readily apparent from other sources. Actual results may differ from these estimates under different assumptions or conditions. We also have other policies we consider key accounting policies (See Note 2 to the Consolidated Financial Statements – Significant Accounting Policies –Impact of recently issued accounting standards). However, the application of these other policies does not require us to make significant estimates and assumptions difficult to support quantitatively.
Inventories
We employ a variety of methodologies to evaluate inventory that is estimated to be excess, obsolete or unmarketable, in order to write down that inventory to net realizable value. Our estimation process for assessing net realizable value is based upon forecasted future usage which we derive based on backlog, historical consumption, and expected market conditions. For both our Brick and Advanced Product lines, the methodology used compares on-hand quantities to forecasted usage and historical consumption, such that amounts of inventory on hand in excess of management’s estimate of expected future utility, are fully reserved. While we have used our best efforts and believe we have used the best available information to estimate future demand, due to uncertainty in the economy and our business and the inherent difficulty in forecasting future usage, it is possible actual demand for our products will differ from our estimates. If actual future demand or market conditions are less favorable than those projected by management, additional inventory reserves for existing inventories may need to be recorded in future periods.
Evaluation of the Realizability of Deferred Tax Assets
Significant management judgment is required in determining whether deferred tax assets will be realized in full or in part. We assess the need for a valuation allowance on a quarterly basis. We record a valuation allowance to reduce our deferred tax assets to the amount we believe is more likely than not to be realized. In assessing the need for a valuation allowance, we consider all positive and negative evidence, including scheduled reversals of deferred tax liabilities, projected future taxable income, tax planning strategies, and past financial performance. Despite recent positive operating results, we face uncertainties in forecasting our operating results due to the unpredictability of customer orders in certain markets, product transitions, new program introductions and adoption times of new technology offerings. This operating uncertainty also makes it difficult to predict the availability and utilization of tax benefits over the next several years. As a result, management has concluded, as of December 31, 2024, it is more likely than not our net domestic deferred tax assets will not be realized, and a full valuation allowance against all net domestic deferred tax assets is still warranted as of December 31, 2024. The valuation allowance against these deferred tax assets may require adjustment in the future based on changes in the mix of temporary differences, changes in tax laws, and operating performance. If the positive operating results continue, and our concerns about the unpredictability of customer orders in certain markets, product transitions, new program introductions and adoption times of new technology offerings are resolved, and we believe future taxable income can be more reliably forecasted, we may release all or a portion of the valuation allowance in the near-term. Certain state tax credits, though, will likely never be released by the valuation allowance. If and when we determine the valuation allowance should be released (i.e., reduced), the adjustment would result in a tax benefit reported in that period’s Consolidated Statements of Operations, the effect of which would be an increase in reported net income.
The amount of any such tax benefit associated with release of our valuation allowance in a particular quarter may be material.
New Accounting Pronouncements
From time to time, new accounting pronouncements are issued by the Financial Accounting Standards Board (“FASB”) that we adopt as of the specified effective date. Unless otherwise discussed, we believe the impact of recently issued accounting standards will not have a material impact on our future financial condition and results of operations. See Note 2 – Significant Accounting Policies – Impact of recently issued accounting standards, to the Consolidated Financial Statements for a description of recently issued and adopted accounting pronouncements, including the dates of adoption and expected impact on our financial position and results of operations.
Other new pronouncements issued but not effective until after December 31, 2024 are not expected to have a material impact on our consolidated financial statements.
Year ended December 31, 2024 compared to Year ended December 31, 2023
Consolidated net revenues for 2024 were $359,058,000, a decrease of $46,001,000, or 11.4%, as compared to $405,059,000 for 2023.
Net revenues, by product line, for the years ended December 31 were as follows (dollars in thousands):
| | | | | | | | | | | | | | | | |
| | | | | | | | Decrease | |
| | 2024 | | | 2023 | | | $ | | | % | |
Advanced Products including Royalty Revenue | | $ | 197,329 | | | $ | 223,893 | | | $ | (26,564 | ) | | | (11.9 | )% |
Brick Products | | | 161,729 | | | | 181,166 | | | | (19,437 | ) | | | (10.7 | )% |
Total | | $ | 359,058 | | | $ | 405,059 | | | $ | (46,001 | ) | | | (11.4 | )% |
The decrease in net revenues for Advanced Products was primarily due to continued softness in underpenetrated markets, partially offset by increased royalty revenue. The decrease in net revenues for Brick Products was primarily due to reduced market demand.
Gross margin for the twelve months ended December 31, 2024 decreased $20,931,000, or 10.2%, to $183,998,000 from $204,929,000 for the twelve months ended December 31, 2023. Gross margin, as a percentage of net revenues, increased to 51.2% for the twelve-month period ended December 31, 2024, as compared to 50.6% for the twelve-month period ended December 31, 2023. The decrease in gross margin dollars was primarily the result of lower sales volume in 2024, with the increase in gross margin percentage primarily attributable to higher royalty revenue and improved production efficiencies compared to 2023 along with certain reductions in supply chain costs, including a reduction of $1,958,000 in outsourced manufacturing costs partially offset by incremental costs of bringing production in-house for certain Advanced Products, offset by slightly unfavorable sales mix and an increase in freight-in and tariff spending of $953,000 (net of approximately $1,669,000 in duty drawback recovery in 2024 and $6,954,000 in duty drawback recovery in 2023 of previously paid tariffs).
Selling, general, and administrative expenses were $96,886,000 for 2024, an increase of $11,172,000, or 13.0%, as compared to $85,714,000 for 2023. As a percentage of net revenues, selling, general, and administrative expenses increased to 27.0% in 2024 from 21.2% in 2023.
The components of the $11,172,000 increase in selling, general, and administrative expenses were as follows (dollars in thousands):
| | | | | | | | | | | |
| | Increase (decrease) | |
Legal fees | | $ | 10,854 | | | | 130.3 | % | | (1 | ) |
Compensation | | | 1,575 | | | | 3.2 | % | | (2 | ) |
Litigation, other | | | 992 | | | | 100.0 | % | | (3 | ) |
Information technology expense | | | 289 | | | | 11.3 | % | | (4 | ) |
Professional services fees | | | 285 | | | | 10.7 | % | | (5 | ) |
Consultants | | | 220 | | | | 5.5 | % | | (6 | ) |
Commissions | | | (3,483 | ) | | | (94.5 | )% | | (7 | ) |
Other, net | | | 440 | | | | 2.9 | % | | |
| | $ | 11,172 | | | | 13.0 | % | | |
(1)Increase primarily attributable to an increase in activity related to corporate legal matters, including the assertion of our intellectual property rights.
(2)Increase primarily attributable to annual compensation adjustments in May 2024 and higher stock-based compensation expense associated with stock options awarded in May 2024.
(3)Increase primarily attributable to an increase in post-judgment interest relating to the SynQor litigation-contingency accrual.
(4)Increase primarily attributable to an increase in computer software services relating to new internal-use software implementation.
(5)Increase primarily attributable to an increase in audit and tax fees.
(6)Increase primarily attributable to an increase in the use of consultants and outside services relating to new internal-use software implementation.
(7)Decrease primarily attributable to the fact that the Company no longer uses outside sales representatives.
Research and development expenses increased $1,065,000, or 1.6%, to $68,922,000 in 2024 from $67,857,000 in 2023. As a percentage of net revenues, research and development expenses increased to 19.2% in 2024 from 16.8% in 2023.
The components of the $1,065,000 increase in research and development expenses were as follows (dollars in thousands):
| | | | | | | | | | | |
| | Increase (decrease) | |
Compensation | | $ | 1,417 | | | | 3.3 | % | | (1 | ) |
Overhead absorption | | | 1,194 | | | | 56.2 | % | | (2 | ) |
Waste disposal | | | 871 | | | | 100.0 | % | | (3 | ) |
Facilities allocations | | | 366 | | | | 11.9 | % | | (4 | ) |
Depreciation and amortization | | | 366 | | | | 13.1 | % | | (5 | ) |
Supplies | | | (1,091 | ) | | | (41.9 | )% | | (6 | ) |
Project and pre-production materials | | | (2,175 | ) | | | (17.8 | )% | | (7 | ) |
Other, net | | | 117 | | | | 2.0 | % | | |
| | $ | 1,065 | | | | 1.6 | % | | |
(1)Increase primarily attributable to annual compensation adjustments in May 2024 and higher stock-based compensation expense associated with stock options awarded in May 2024.
(2)Increase primarily attributable to a decrease in research and development personnel incurring time on production activities, compared to research and development activities.
(3)Increase primarily attributable to an increase in waste disposal activities of Advanced Products related to improving production process capabilities.
(4)Increase primarily attributable to an increase in utilities and building maintenance expenses.
(5)Increase attributable to net additions of furniture and fixtures and capitalization of building improvements.
(6)Decrease in engineering supplies.
(7)Decrease primarily attributable to decreased prototype development costs for Advanced Products.
Litigation-contingency expense was $19,500,000 for 2024, which related to the SynQor litigation, as compared to $0 for 2023. See Note 16 to the Consolidated Financial Statements for additional information regarding the SynQor litigation-contingency expense.
The significant changes in the components of "Other income (expense), net" for the years ended December 31 were as follows (in thousands):
| | | | | | | | | | | | |
| | | | | | | | Increase | |
| | 2024 | | | 2023 | | | (decrease) | |
Interest income, net | | $ | 11,468 | | | $ | 8,217 | | | $ | 3,251 | |
Rental income, net | | | 992 | | | | 792 | | | | 200 | |
Foreign currency losses, net | | | (622 | ) | | | (161 | ) | | | (461 | ) |
Other, net | | | (41 | ) | | | 38 | | | | (79 | ) |
| | $ | 11,797 | | | $ | 8,886 | | | $ | 2,911 | |
Our exposure to market risk fluctuations in foreign currency exchange rates relates to the operations of Vicor Japan Company, Ltd. ("VJCL"), for which the functional currency is the Japanese Yen, and all other subsidiaries in Europe and Asia, for which the functional currency is the U.S. Dollar. These subsidiaries in Europe and Asia experienced more unfavorable foreign currency exchange rate fluctuations in 2024 compared to 2023. In 2024, interest income increased due to higher balances of cash and cash equivalents held by the Company.
Income before income taxes was $10,487,000 in 2024, as compared to $60,244,000 in 2023.
The provision for income taxes and the effective income tax rate for the years ended December 31 were as follows (dollars in thousands):
| | | | | | | | |
| | 2024 | | | 2023 | |
Provision for income taxes | | $ | 4,348 | | | $ | 6,644 | |
Effective income tax rate | | | 41.5 | % | | | 11.0 | % |
The effective tax rates differ from the statutory tax rates for the years ended December 31, 2024 and 2023 primarily due to the Company’s full valuation allowance position against net domestic deferred tax assets. The provision for income taxes for the years ended December 31, 2024 and 2023 included estimated federal, state, and foreign income taxes in jurisdictions in which the Company does not have sufficient tax attributes.
The Company's tax expense and the rate for the year ended December 31, 2024 continues to be negatively impacted by the capitalization of research and development expenses under Section 174 in the U.S., which given the Company's performance, is having an outsized impact on the rate by increasing the taxable income position, which causes a significant tax expense. This is further compounded by the Company not getting a deferred tax benefit from temporary differences due to the full valuation allowance on net domestic deferred tax assets.
See Note 15 to the Consolidated Financial Statements for disclosure regarding our current assessment of the valuation allowance against all net domestic deferred tax assets, and the possible release (i.e., reduction) of the allowance in the future.
We reported net income for the year ended December 31, 2024 of $6,129,000, or $0.14 per diluted share, as compared to $53,595,000, or $1.19 per diluted share, for the year ended December 31, 2023.
Liquidity and Capital Resources
At December 31, 2024, we had $277,273,000 in cash and cash equivalents. The ratio of current assets to current liabilities was 7.5:1 at December 31, 2024, as compared to 9.5:1 at December 31, 2023. Net working capital increased $25,017,000 to $401,214,000 at December 31, 2024 from $376,197,000 at December 31, 2023.
The primary working capital changes were due to the following (in thousands):
| | | | |
| | Increase
(decrease) | |
Cash and cash equivalents | | $ | 35,054 | |
Accounts receivable | | | 317 | |
Inventories | | | (547 | ) |
Other current assets | | | 7,844 | |
Accounts payable | | | 3,363 | |
Accrued compensation and benefits | | | 366 | |
Accrued litigation | | | (20,388 | ) |
Accrued expenses | | | (1,487 | ) |
Sales allowances | | | 1,815 | |
Short-term lease liabilities | | | 148 | |
Income taxes payable | | | 687 | |
Short-term deferred revenue and customer prepayments | | | (2,155 | ) |
| | $ | 25,017 | |
The primary sources of cash for the year ended December 31, 2024 were $50,842,000 of cash generated from operations and $8,490,000 of cash received in connection with the exercise of options to purchase our Common Stock awarded under our stock option plans and the issuance of Common Stock under our 2017 Employee Stock Purchase Plan. The primary use of cash during the year ended December 31, 2024 was $23,602,000 for the purchase of machinery and equipment and internal-use software.
In November 2000, our Board of Directors authorized the repurchase of up to $30,000,000 of our Common Stock (the “November 2000 Plan”). In July 2024, our Board of Directors authorized the repurchase of up to $100,000,000 of our Common Stock (the “New Repurchase Authorization”). The New Repurchase Authorization replaces the November 2000 Plan in its entirety and no further repurchases will be made pursuant to the November 2000 Plan. As of December 31, 2024, we had approximately $99,503,000 remaining available for repurchases of our Common Stock under the New Repurchase Authorization. The timing and amounts of Common Stock repurchases under the New Repurchase Authorization are at the discretion of the Company's President and Chief Executive Officer based upon economic and financial market conditions.
As of December 31, 2024, we had a total of approximately $12,669,000 of cancelable and non-cancelable capital expenditure commitments, principally for manufacturing and production equipment, which we intend to fund with existing cash, and approximately $1,946,000 of capital expenditure items and internal-use software which had been received and included in Property, plant and equipment in the accompanying Consolidated Balance Sheets, but not yet paid for. Our primary needs for liquidity are for making continuing investments in manufacturing and production equipment. We believe cash generated from operations together with our available cash and cash equivalents will be sufficient to fund planned operational needs and capital equipment purchases for the foreseeable future.
We do not consider the impact of inflation and changing prices on our business activities or fluctuations in the exchange rates for foreign currency transactions to have been significant during the last three fiscal years.
Item 7A. Quantitative and Qualitative Disclosures About Market Risk
We are exposed to a variety of market risks, including changes in interest rates affecting the return on our cash and cash equivalents, short-term investments and fluctuations in foreign currency exchange rates. As our cash and cash equivalents and short-term investments consist principally of cash accounts, money market securities and U.S. Treasury securities, which are short-term in nature, we believe our exposure to market risk on interest rate fluctuations for these investments is not significant. As of December 31, 2024, our long-term investment portfolio, recorded on our Consolidated Balance Sheet as “Long-term investment, net”, consisted of a single auction rate security with a par value of $3,000,000, purchased through and held in custody by a broker-dealer affiliate of Bank of America, N.A., that has experienced failed auctions (the “Failed Auction Security”) since February 2008. While the Failed Auction Security is Aaa/AA+ rated by major credit rating agencies, collateralized by student loans and guaranteed by the U.S. Department of Education under the Federal Family Education Loan Program, continued failure to sell at its periodic auction dates (i.e., reset dates) could negatively impact the carrying value of the investment, in turn leading to impairment charges in future periods. Periodic changes in the fair value of the Failed Auction Security attributable to credit loss (i.e., risk of the issuer’s default) are recorded through earnings as a component of “Other income (expense), net”, with the remainder of any periodic change in fair value not related to credit loss (i.e., temporary “mark-to-market” carrying value adjustments) recorded in “Accumulated other comprehensive income (loss)”, a component of Vicor Corporation Stockholders’ Equity. Should we conclude a decline in
the fair value of the Failed Auction Security is other than temporary, such losses would be recorded through earnings as a component of “Other income (expense), net”. We do not believe there was an “other-than-temporary” decline in value in this security as of December 31, 2024.
We estimate our annual interest income would change by approximately $30,000 in 2024 for each 100 basis point increase or decrease in interest rates.
Our exposure to market risk for fluctuations in foreign currency exchange rates relates primarily to the operations of VJCL, for which the functional currency is the Japanese Yen, and changes in the relative value of the Yen to the U.S. Dollar. Relative to our Yen exposure as of December 31, 2024, we estimate a 10% unfavorable movement in the value of the Yen relative to the U.S. Dollar would increase our foreign currency loss by approximately $49,000. The functional currency of all other subsidiaries in Europe and other subsidiaries in Asia is the U.S. Dollar. While we believe risk to fluctuations in foreign currency rates for these subsidiaries is generally not significant, they can be subject to substantial currency changes, and therefore foreign exchange exposures.
ITEM 8. FINANCIAL STATEMENTS AND SUPPLEMENTARY DATA
INDEX
| |
| Page |
FINANCIAL STATEMENTS | |
Report of Independent Registered Public Accounting Firm | 32 |
Consolidated Balance Sheets as of December 31, 2024 and December 31, 2023 | 34 |
Consolidated Statements of Operations For The Years Ended December 31, 2024, 2023, and 2022 | 35 |
Consolidated Statements of Comprehensive Income For The Years Ended December 31, 2024, 2023, and 2022 | 36 |
Consolidated Statements of Cash Flows For The Years Ended December 31, 2024, 2023, and 2022 | 37 |
Consolidated Statements of Equity For The Years Ended December 31, 2024, 2023, and 2022 | 38 |
Notes to the Consolidated Financial Statements | 39 |
Schedule (Refer to Item 15) | 65 |
Report of Independent Registered Public Accounting Firm
To the Stockholders and Board of Directors
Vicor Corporation:
Opinion on the Consolidated Financial Statements
We have audited the accompanying consolidated balance sheets of Vicor Corporation and subsidiaries (the Company) as of December 31, 2024 and 2023, the related consolidated statements of operations, comprehensive income, equity, and cash flows for each of the years in the three-year period ended December 31, 2024, and the related notes and financial statement schedules listed in Item 15(a)(2) (collectively, the consolidated financial statements). In our opinion, the consolidated financial statements present fairly, in all material respects, the financial position of the Company as of December 31, 2024 and 2023, and the results of its operations and its cash flows for each of the years in the three-year period ended December 31, 2024, in conformity with U.S. generally accepted accounting principles.
We also have audited, in accordance with the standards of the Public Company Accounting Oversight Board (United States) (PCAOB), the Company’s internal control over financial reporting as of December 31, 2024, based on criteria established in Internal Control – Integrated Framework (2013) issued by the Committee of Sponsoring Organizations of the Treadway Commission, and our report dated March 3, 2025 expressed an unqualified opinion on the effectiveness of the Company’s internal control over financial reporting.
Basis for Opinion
These consolidated financial statements are the responsibility of the Company’s management. Our responsibility is to express an opinion on these consolidated financial statements based on our audits. We are a public accounting firm registered with the PCAOB and are required to be independent with respect to the Company in accordance with the U.S. federal securities laws and the applicable rules and regulations of the Securities and Exchange Commission and the PCAOB.
We conducted our audits in accordance with the standards of the PCAOB. Those standards require that we plan and perform the audit to obtain reasonable assurance about whether the consolidated financial statements are free of material misstatement, whether due to error or fraud. Our audits included performing procedures to assess the risks of material misstatement of the consolidated financial statements, whether due to error or fraud, and performing procedures that respond to those risks. Such procedures included examining, on a test basis, evidence regarding the amounts and disclosures in the consolidated financial statements. Our audits also included evaluating the accounting principles used and significant estimates made by management, as well as evaluating the overall presentation of the consolidated financial statements. We believe that our audits provide a reasonable basis for our opinion.
Critical Audit Matters
The critical audit matters communicated below are matters arising from the current period audit of the consolidated financial statements that were communicated or required to be communicated to the audit committee and that: (1) relate to accounts or disclosures that are material to the consolidated financial statements and (2) involved our especially challenging, subjective, or complex judgments. The communication of critical audit matters does not alter in any way our opinion on the consolidated financial statements, taken as a whole, and we are not, by communicating the critical audit matters below, providing separate opinions on the critical audit matters or on the accounts or disclosures to which they relate.
Realizability of raw materials inventory
As discussed in Note 2 to the consolidated financial statements, the Company values inventories at the lower of cost, determined using the first-in, first-out method, or net realizable value. The Company’s estimation process for assessing net realizable value is based upon expected future utility, which was derived based on backlog, historical consumption and expected market conditions. As disclosed in Note 3 to the consolidated financial statements approximately 74% or $78.9 million, of the Company’s total inventory balance is comprised of raw materials.
We identified the evaluation of the realizability of certain raw materials inventory to be a critical audit matter. Subjective auditor judgment was required as a result of uncertainty in market conditions used to estimate forecasted future usage and
the long lead times to acquire raw materials within the global electronics supply chain. Changes in forecasted future usage could have a significant impact on the realizability of raw materials inventory.
The following are the primary procedures we performed to address this critical audit matter. We evaluated the design and tested the operating effectiveness of certain internal controls related to the critical audit matter. This included controls related to the Company’s process to develop its forecast of usage, including estimates of the projected demand based on historical usage and the potential impact of market conditions. We evaluated the Company’s estimate of the realizability of raw materials by:
•assessing historical consumption as a predictor of future product demand by comparing it to trends in industry publications
•examining the historical accuracy of the Company’s prior estimates by considering subsequent usage and write off activity
•evaluating the adjustments made to forecast future demand based on historical usage data
•interviewing operational personnel of the Company involved in purchasing and manufacturing to evaluate product innovations, changes in customer mix, and other factors that may impact expected future sales and usage of raw material inventory.
Realizability of domestic deferred tax assets
As discussed in Note 15 to the consolidated financial statements, the Company had a valuation allowance of $61.5 million against domestic deferred tax assets, net of deferred tax liabilities, for which realization cannot be considered more likely than not. In assessing the need for a valuation allowance, the Company considers all positive and negative evidence, including scheduled reversals of deferred tax liabilities, projected future taxable income, tax planning strategies, and past financial performance.
We identified the evaluation of the realizability of the domestic deferred tax assets as a critical audit matter due to subjectivity involved in assessing the recoverability of those deferred tax assets. Subjective auditor judgment was required to evaluate the uncertainty inherent in estimating the Company’s ability to generate sufficient domestic taxable income exclusive of reversing temporary differences of the appropriate character in the future.
The following are the primary procedures we performed to address this critical audit matter. We evaluated the design and tested the operating effectiveness of certain internal controls related to the Company’s income tax process, including a control related to the assessment of the realizability of deferred tax assets and the application of relevant tax regulations. To assess the Company’s ability to forecast its financial performance used to determine future domestic taxable income, we compared the Company’s previous forecasts to actual results, and evaluated the Company’s consideration of the customer orders as well as the impact of industry and global economic conditions through inquiry with operational personnel and inspection of third-party publications. We involved federal income tax professionals with specialized skills and knowledge, who assisted in assessing the Company’s application of relevant tax regulations and evaluating the realizability of deferred tax assets.
/s/ KPMG LLP
We have served as the Company’s auditor since 2013.
Boston, Massachusetts
March 3, 2025
VICOR CORPORATION
Consolidated Balance Sheets
December 31, 2024 and 2023
(In thousands, except share data)
| | | | | | | | |
| | 2024 | | | 2023 | |
ASSETS | | | | | | |
Current assets: | | | | | | |
Cash and cash equivalents | | $ | 277,273 | | | $ | 242,219 | |
Accounts receivable, less allowance of $130 in 2024 and 2023 | | | 52,948 | | | | 52,631 | |
Inventories | | | 106,032 | | | | 106,579 | |
Other current assets | | | 26,781 | | | | 18,937 | |
Total current assets | | | 463,034 | | | | 420,366 | |
Deferred tax assets | | | 261 | | | | 296 | |
Long-term investment, net | | | 2,641 | | | | 2,530 | |
Property, plant and equipment, net | | | 152,705 | | | | 157,689 | |
Other assets | | | 22,477 | | | | 14,006 | |
Total assets | | $ | 641,118 | | | $ | 594,887 | |
LIABILITIES AND EQUITY | | | | | | |
Current liabilities: | | | | | | |
Accounts payable | | $ | 8,737 | | | $ | 12,100 | |
Accrued compensation and benefits | | | 10,852 | | | | 11,227 | |
Accrued litigation | | | 26,888 | | | | 6,500 | |
Accrued expenses | | | 6,589 | | | | 5,093 | |
Sales allowances | | | 1,667 | | | | 3,482 | |
Short-term lease liabilities | | | 1,716 | | | | 1,864 | |
Income taxes payable | | | 59 | | | | 746 | |
Short-term deferred revenue and customer prepayments | | | 5,312 | | | | 3,157 | |
Total current liabilities | | | 61,820 | | | | 44,169 | |
Long-term deferred revenue | | | — | | | | 1,020 | |
Long-term income taxes payable | | | 3,387 | | | | 2,228 | |
Long-term lease liabilities | | | 5,620 | | | | 6,364 | |
Total liabilities | | | 70,827 | | | | 53,781 | |
Commitments and contingencies (Note 16) | | | | | | |
Equity: | | | | | | |
Vicor Corporation stockholders’ equity: | | | | | | |
Class B Common Stock: 10 votes per share, $.01 par value, 14,000,000 shares
authorized, 11,738,718 shares issued and outstanding in 2024; 11,743,218
shares issued and outstanding in 2023 | | | 118 | | | | 118 | |
Common Stock: 1 vote per share, $.01 par value, 62,000,000 shares
authorized, 45,082,156 shares issued and 33,433,046 shares
outstanding in 2024; 44,354,394 shares issued and 32,719,588
shares outstanding in 2023 | | | 452 | | | | 445 | |
Additional paid-in capital | | | 407,617 | | | | 383,832 | |
Retained earnings | | | 302,803 | | | | 296,674 | |
Accumulated other comprehensive loss | | | (1,495 | ) | | | (1,273 | ) |
Treasury stock at cost: 11,649,110 shares in 2024 and 11,634,806 shares in 2023 | | | (139,424 | ) | | | (138,927 | ) |
Total Vicor Corporation stockholders’ equity | | | 570,071 | | | | 540,869 | |
Noncontrolling interest | | | 220 | | | | 237 | |
Total equity | | | 570,291 | | | | 541,106 | |
Total liabilities and equity | | $ | 641,118 | | | $ | 594,887 | |
See accompanying notes.
VICOR CORPORATION
Consolidated Statements of OPERATIONS
Years Ended December 31, 2024, 2023 and 2022
(In thousands, except share data)
| | | | | | | | | | | | |
| | 2024 | | | 2023 | | | 2022 | |
Product revenue | | $ | 312,463 | | | $ | 389,187 | | | $ | 396,278 | |
Royalty revenue | | | 46,595 | | | | 15,872 | | | | 2,801 | |
Net revenues | | | 359,058 | | | | 405,059 | | | | 399,079 | |
Cost of product revenues | | | 175,060 | | | | 200,130 | | | | 218,520 | |
Gross margin | | | 183,998 | | | | 204,929 | | | | 180,559 | |
Operating expenses: | | | | | | | | | |
Selling, general and administrative | | | 96,886 | | | | 85,714 | | | | 86,264 | |
Research and development | | | 68,922 | | | | 67,857 | | | | 60,594 | |
Litigation-contingency expense | | | 19,500 | | | | — | | | | 6,500 | |
Total operating expenses | | | 185,308 | | | | 153,571 | | | | 153,358 | |
(Loss) income from operations | | | (1,310 | ) | | | 51,358 | | | | 27,201 | |
Other income (expense), net: | | | | | | | | | |
Total unrealized gains (losses) on available-for-sale | | | | | | | | | |
securities, net | | | 111 | | | | (92 | ) | | | (17 | ) |
Portion of (gains) losses recognized in other | | | | | | | | | |
comprehensive income | | | (111 | ) | | | 92 | | | | 20 | |
Net credit gains recognized in earnings | | | — | | | | — | | | | 3 | |
Other income (expense), net | | | 11,797 | | | | 8,886 | | | | 1,483 | |
Total other income (expense), net | | | 11,797 | | | | 8,886 | | | | 1,486 | |
Income before income taxes | | | 10,487 | | | | 60,244 | | | | 28,687 | |
Less: Provision for income taxes | | | 4,348 | | | | 6,644 | | | | 3,261 | |
Consolidated net income | | | 6,139 | | | | 53,600 | | | | 25,426 | |
Less: Net income (loss) attributable to | | | | | | | | | |
noncontrolling interest | | | 10 | | | | 5 | | | | (20 | ) |
Net income attributable to Vicor Corporation | | $ | 6,129 | | | $ | 53,595 | | | $ | 25,446 | |
| | | | | | | | | |
Net income per common share attributable to | | | | | | | | | |
Vicor Corporation: | | | | | | | | | |
Basic | | $ | 0.14 | | | $ | 1.21 | | | $ | 0.58 | |
Diluted | | $ | 0.14 | | | $ | 1.19 | | | $ | 0.57 | |
Shares used to compute net income per common share | | | | | | | | | |
attributable to Vicor Corporation: | | | | | | | | | |
Basic | | | 44,912 | | | | 44,320 | | | | 44,005 | |
Diluted | | | 45,168 | | | | 45,004 | | | | 44,894 | |
See accompanying notes.
VICOR CORPORATION
Consolidated Statements of COMPREHENSIVE INCOME
Years Ended December 31, 2024, 2023 and 2022
(In thousands)
| | | | | | | | | | | | |
| | 2024 | | | 2023 | | | 2022 | |
Consolidated net income | | $ | 6,139 | | | $ | 53,600 | | | $ | 25,426 | |
Foreign currency translation losses, net of | |
| | |
| | | | |
tax benefit (1) | | | (360 | ) | | | (209 | ) | | | (519 | ) |
Unrealized gains (losses) on available-for-sale | | | | | | | | | |
securities, net of tax (1) | | | 111 | | | | (92 | ) | | | 821 | |
Other comprehensive (loss) income | | | (249 | ) | | | (301 | ) | | | 302 | |
Consolidated comprehensive income | | | 5,890 | | | | 53,299 | | | | 25,728 | |
Less: Comprehensive loss attributable to | | | | | | | | | |
noncontrolling interest | | | (17 | ) | | | (11 | ) | | | (58 | ) |
Comprehensive income attributable to | | | | | | | | | |
Vicor Corporation | | $ | 5,907 | | | $ | 53,310 | | | $ | 25,786 | |
(1)The deferred tax assets associated with cumulative foreign currency translation losses and cumulative unrealized gains (losses) on available-for-sale securities are completely offset by a tax valuation allowance as of December 31, 2024, 2023, and 2022. Therefore, there is no income tax benefit (provision) recognized in any of the three years ended December 31, 2024.
See accompanying notes.
VICOR CORPORATION
Consolidated Statements of Cash Flows
Years Ended December 31, 2024, 2023 and 2022
(In thousands)
| | | | | | | | | | | | |
| | 2024 | | | 2023 | | | 2022 | |
Operating activities: | | | | | | | | | |
Consolidated net income | | $ | 6,139 | | | $ | 53,600 | | | $ | 25,426 | |
Adjustments to reconcile consolidated net income
to net cash provided by operating activities: | | | | | | | | | |
Depreciation and amortization | | | 18,626 | | | | 17,240 | | | | 13,776 | |
Stock-based compensation expense | | | 15,302 | | | | 12,869 | | | | 10,264 | |
Provision for doubtful accounts | | | — | | | | 43 | | | | 5 | |
Deferred income taxes | | | 6 | | | | (34 | ) | | | (72 | ) |
Litigation-contingency expense | | | 19,500 | | | | — | | | | 6,500 | |
Amortization of bond premium | | | — | | | | — | | | | 1,056 | |
Credit gain on available-for-sale securities | | | — | | | | — | | | | (3 | ) |
(Decrease) increase in long-term deferred revenue | | | (1,020 | ) | | | 875 | | | | (268 | ) |
Decrease (increase) in other assets | | | 1,109 | | | | (192 | ) | | | (692 | ) |
Increase in long-term income taxes payable | | | 1,159 | | | | 1,366 | | | | 293 | |
Change in current assets and liabilities, net | | | (9,979 | ) | | | (11,239 | ) | | | (33,346 | ) |
Net cash provided by operating activities | | | 50,842 | | | | 74,528 | | | | 22,939 | |
Investing activities: | | | | | | | | | |
Additions to property, plant and equipment and internal-use
software | | | (23,602 | ) | | | (33,452 | ) | | | (63,966 | ) |
Sales and maturities of short-term investments | | | — | | | | — | | | | 45,000 | |
Net cash used for investing activities | | | (23,602 | ) | | | (33,452 | ) | | | (18,966 | ) |
Financing activities: | | | | | | | | | |
Proceeds from employee stock plans | | | 8,490 | | | | 10,602 | | | | 4,439 | |
Repurchases of Common Stock | | | (497 | ) | | | — | | | | — | |
Net cash provided by financing activities | | | 7,993 | | | | 10,602 | | | | 4,439 | |
Effect of foreign exchange rates on cash | | | (179 | ) | | | (70 | ) | | | (219 | ) |
Net increase in cash and cash equivalents | | | 35,054 | | | | 51,608 | | | | 8,193 | |
Cash and cash equivalents at beginning of year | | | 242,219 | | | | 190,611 | | | | 182,418 | |
Cash and cash equivalents at end of year | | $ | 277,273 | | | $ | 242,219 | | | $ | 190,611 | |
Change in current assets and liabilities: | | | | | | | | | |
Accounts receivable | | $ | (483 | ) | | $ | 12,640 | | | $ | (10,586 | ) |
Inventories | | | 457 | | | | (5,236 | ) | | | (34,204 | ) |
Other current assets | | | (7,886 | ) | | | (539 | ) | | | 1,547 | |
Accounts payable and accrued liabilities | | | (1,845 | ) | | | (11,151 | ) | | | 4,399 | |
Accrued severance and other charges | | | (9 | ) | | | 9 | | | | (93 | ) |
Short-term lease liabilities | | | 131 | | | | 583 | | | | 103 | |
Income taxes payable | | | (684 | ) | | | 674 | | | | 6 | |
Deferred revenue and customer prepayments | | | 340 | | | | (8,219 | ) | | | 5,482 | |
Change in current assets and liabilities, net | | $ | (9,979 | ) | | $ | (11,239 | ) | | $ | (33,346 | ) |
Supplemental disclosures: | | | | | | | | | |
Cash paid during the year for income taxes, net of refunds | | $ | 4,302 | | | $ | 4,151 | | | $ | 1,263 | |
Purchases of property, plant and equipment and internal-use software incurred but not yet paid | | $ | 1,946 | | | $ | 2,168 | | | $ | 4,194 | |
See accompanying notes.
VICOR CORPORATION
CONSOLIDATED STATEMENTS OF EQUITY
Years Ended December 31, 2024, 2023 and 2022
(In thousands)
| | | | | | | | | | | | | | | | | | | | | | | | | | | | | | | | | | | | |
| | | | | | | | | | | | | | | | | | | | Total | | | | | | | |
| | | | | | | | | | | | | | Accumulated | | | | | | Vicor | | | | | | | |
| | Class B | | | | | | Additional | | | | | | Other | | | | | | Corporation | | | | | | | |
| | Common | | | Common | | | Paid-In | | | Retained | | | Comprehensive | | | Treasury | | | Stockholders’ | | | Noncontrolling | | | Total | |
| | Stock | | | Stock | | | Capital | | | Earnings | | | (Loss) Income | | | Stock | | | Equity | | | Interest | | | Equity | |
Balance on December 31, 2021 | | $ | 118 | | | $ | 439 | | | $ | 345,664 | | | $ | 217,633 | | | $ | (1,328 | ) | | $ | (138,927 | ) | | $ | 423,599 | | | $ | 306 | | | $ | 423,905 | |
Issuance of Common Stock under employee stock plans | | | | | | 2 | | | | 4,437 | | | | | | | | | | | | | 4,439 | | | | | | | 4,439 | |
Stock-based compensation expense | | | | | | | | | 10,264 | | | | | | | | | | | | | 10,264 | | | | | | | 10,264 | |
Components of comprehensive income, net of tax | | | | | | | | | | | | | | | | | | | | | | | | | | | |
Net income (loss) | | | | | | | | | | | | 25,446 | | | | | | | | | | 25,446 | | | | (20 | ) | | | 25,426 | |
Other comprehensive income (loss) | | | | | | | | | | | | | | | 340 | | | | | | | 340 | | | | (38 | ) | | | 302 | |
Total comprehensive income (loss) | | | | | | | | | | | | | | | | | | | | | 25,786 | | | | (58 | ) | | | 25,728 | |
Balance on December 31, 2022 | | | 118 | | | | 441 | | | | 360,365 | | | | 243,079 | | | | (988 | ) | | | (138,927 | ) | | | 464,088 | | | | 248 | | | | 464,336 | |
Issuance of Common Stock under employee stock plans | | | | | | 4 | | | | 10,598 | | | | | | | | | | | | | 10,602 | | | | | | | 10,602 | |
Stock-based compensation expense | | | | | | | | | 12,869 | | | | | | | | | | | | | 12,869 | | | | | | | 12,869 | |
Components of comprehensive income, net of tax | | | | | | | | | | | | | | | | | | | | | | | | | | | |
Net income | | | | | | | | | | | | 53,595 | | | | | | | | | | 53,595 | | | | 5 | | | | 53,600 | |
Other comprehensive loss | | | | | | | | | | | | | | | (285 | ) | | | | | | (285 | ) | | | (16 | ) | | | (301 | ) |
Total comprehensive income (loss) | | | | | | | | | | | | | | | | | | | | | 53,310 | | | | (11 | ) | | | 53,299 | |
Balance on December 31, 2023 | | | 118 | | | | 445 | | | | 383,832 | | | | 296,674 | | | | (1,273 | ) | | | (138,927 | ) | | | 540,869 | | | | 237 | | | | 541,106 | |
Issuance of Common Stock under employee stock plans | | | | | | 7 | | | | 8,483 | | | | | | | | | | | | | 8,490 | | | | | | | 8,490 | |
Stock-based compensation expense | | | | | | | | | 15,302 | | | | | | | | | | | | | 15,302 | | | | | | | 15,302 | |
Repurchases of Common Stock | | | | | | | | | | | | | | | | | | (497 | ) | | | (497 | ) | | | | | | (497 | ) |
Components of comprehensive income (loss), net of tax | | | | | | | | | | | | | | | | | | | | | | | | | | | |
Net income | | | | | | | | | | | | 6,129 | | | | | | | | | | 6,129 | | | | 10 | | | | 6,139 | |
Other comprehensive loss | | | | | | | | | | | | | | | (222 | ) | | | | | | (222 | ) | | | (27 | ) | | | (249 | ) |
Total comprehensive income (loss) | | | | | | | | | | | | | | | | | | | | | 5,907 | | | | (17 | ) | | | 5,890 | |
Balance on December 31, 2024 | | $ | 118 | | | $ | 452 | | | $ | 407,617 | | | $ | 302,803 | | | $ | (1,495 | ) | | $ | (139,424 | ) | | $ | 570,071 | | | $ | 220 | | | $ | 570,291 | |
See accompanying notes.
VICOR CORPORATION
Notes to Consolidated Financial Statements
1.DESCRIPTION OF BUSINESS
Vicor Corporation (the “Company” or “Vicor”) designs, develops, manufactures, and markets modular power components and power systems for converting electrical power. The Company also licenses certain rights to its technology in return for recurring royalties. The principal markets for the Company’s power converters and systems are large original equipment manufacturers (“OEMs”), original design manufacturers (“ODMs”) and their contract manufacturers, and smaller, lower volume users, which are broadly distributed across several major market areas.
2.SIGNIFICANT ACCOUNTING POLICIES
Principles of consolidation
The Consolidated Financial Statements include the accounts of the Company and its subsidiaries. All intercompany transactions and balances have been eliminated upon consolidation.
Use of estimates
The preparation of financial statements in conformity with accounting principles generally accepted in the United States (“U.S. GAAP”) requires management to make estimates and assumptions that affect the reported amounts of assets and liabilities and disclosure of contingencies at the date of the financial statements and the reported amounts of revenue and expenses during the reporting period. Such estimates and assumptions relate to the useful lives of fixed assets and identified intangible assets, recoverability of long-lived assets, fair value of short-term and long-term investments, allowances for doubtful accounts, potential excess, obsolete or unmarketable inventory, potential reserves relating to litigation matters, accrued liabilities, accrued taxes, deferred tax valuation allowances, assumptions pertaining to share-based payments, and other reserves. Actual results could differ from those based on these estimates and assumptions, and such differences may be material to the financial statements.
Foreign currency translation
The financial statements of Vicor Japan Company, Ltd. ("VJCL"), a majority-owned subsidiary, for which the functional currency is the Japanese Yen, have been translated into U.S. Dollars using the exchange rate in effect at the balance sheet date for balance sheet amounts and the average exchange rates in effect during the year for income statement amounts. The gains and losses resulting from the changes in exchange rates from year to year have been reported in other comprehensive income.
Transaction gains and losses resulting from the remeasurement of foreign currency denominated assets and liabilities of the Company’s foreign subsidiaries where the functional currency is the U.S. Dollar are included in other income (expense), net. Foreign currency losses included in other income (expense), net were approximately $(622,000), $(161,000), and $(653,000) in 2024, 2023, and 2022, respectively.
Investments
The Company’s principal sources of liquidity are its existing balances of cash, cash equivalents, and cash generated from operations. Consistent with the guidelines of the Company’s investment policy, the Company can invest, and has historically invested, its cash balances in demand deposit accounts, money market funds, government debt securities, and auction rate securities meeting certain quality criteria.
Cash and Cash Equivalents
Cash and cash equivalents are highly liquid investments with insignificant interest rate risk and maturities of 90 days or less at the time of acquisition. Cash and cash equivalents include funds held in disbursement (i.e., checking) and money market accounts, certificates of deposit, and debt securities with maturities of less than three months at the time of purchase. Cash and cash equivalents are valued at cost, approximating market value. The Company’s money market securities are purchased and redeemed at par value. Their estimated fair value is equal to their cost, and, due to the nature of the securities and their classification as cash equivalents, there are no unrealized gains or losses recorded at the balance sheet dates.
VICOR CORPORATION
Notes to Consolidated Financial Statements
Short-term Investments
The Company’s short-term investments, consisting of obligations of the U.S. Treasury, are debt securities with original maturities greater than three months but less than one year at the time of purchase.
Long-term Investment
The Company’s long-term investment is an auction rate debt security with a maturity of greater than one year and is subject to credit, liquidity, market, and interest rate risk.
Available-For-Sale Securities
Certain of the cash and cash equivalents, all of the short-term investments and the long-term investment are classified as available-for-sale securities (“AFS”). These securities are recorded at fair value, with unrealized gains and losses, net of tax, attributable to credit loss recorded through the Consolidated Statement of Operations and unrealized gains and losses, net of tax, attributable to other non-credit factors recorded in “Accumulated other comprehensive loss,” a component of Total Equity. Given the nature of the cash and cash equivalents and the short-term investments designated as AFS, credit losses are not considered to be material. In determining the amount of credit loss for the long-term investment, the Company compares the present value of cash flows expected to be collected to the amortized cost basis of the security, considering credit default risk probabilities and changes in credit ratings, among other factors.
The Company periodically evaluates the long-term investment to determine if impairment is required, whether an impairment is other than temporary, and the measurement of an impairment loss. The Company considers a variety of impairment indicators such as, but not limited to, a significant deterioration in the earnings performance, credit rating, or asset quality of the investment.
The amortized cost of the debt securities are adjusted for amortization of premiums and accretion of discounts to maturity, the net amount of which, along with interest and realized gains and losses, is included in “Other income (expense), net” in the Consolidated Statements of Operations.
Fair value measurements
The Company accounts for certain financial assets at fair value, defined as the price that would be received to sell an asset or paid to transfer a liability (i.e., an exit price) in the principal or most advantageous market for the asset or liability in an orderly transaction between market participants on the measurement date. As such, fair value is a market-based measurement that should be determined based on assumptions that market participants would use in pricing an asset or liability. A three-level hierarchy is used to show the extent and level of judgment used to estimate fair value measurements:
| | |
| Level 1 | Inputs used to measure fair value are unadjusted quoted prices available in active markets for the identical assets or liabilities as of the reporting date. |
| Level 2 | Inputs used to measure fair value, other than quoted prices included in Level 1, are either directly or indirectly observable as of the reporting date through correlation with market data, including quoted prices for similar assets and liabilities in active markets and quoted prices in inactive markets. Level 2 also includes assets and liabilities valued using models or other pricing methodologies that do not require significant judgment since the input assumptions used in the models, such as interest rates and volatility factors, are corroborated by readily observable data from actively quoted markets for substantially the full term of the financial instrument. |
| Level 3 | Inputs used to measure fair value are unobservable inputs supported by little or no market activity and reflect the use of significant management judgment. These values are generally determined using pricing models for which the assumptions utilize management’s estimates of market participant assumptions. |
The carrying amounts of cash and cash equivalents, short-term investments, accounts receivable, and accounts payable approximate fair value because of the short maturities of these financial instruments.
VICOR CORPORATION
Notes to Consolidated Financial Statements
Inventories
Inventories are valued at the lower of cost (determined using the first-in, first-out method) or net realizable value. Fixed production overhead is allocated to the inventory cost per unit based on the normal capacity of the production facilities. Abnormal production costs, including fixed cost variances from normal production capacity, if any, are charged to cost of product revenues in the period incurred. All shipping and handling costs incurred in connection with the sale of products are included in cost of product revenues.
Inventory estimated to be excess, obsolete, or unmarketable is written down to net realizable value. The Company’s estimation process for assessing net realizable value is based upon management’s estimate of expected future utility which is derived based on backlog, historical consumption and expected market conditions. If the Company’s estimated demand and/or market expectations were to change or if product sales were to decline, the Company’s estimation process may cause larger inventory reserves to be recorded, resulting in larger charges to cost of product revenues.
Government Grants
The Company accounts for government assistance that is not subject to the scope of Accounting Standards Codification ("ASC") 740, Income Taxes using a grant accounting model, by analogy to International Accounting Standards 20, Accounting for Government Grants and Disclosure of Government Assistance, and recognize such grants when we have reasonable assurance that we will comply with the grant’s conditions and that the grant will be received. Government grants whose primary condition is the purchase, construction, or acquisition of a long-lived asset are considered asset-based grants and are recognized as a reduction to such asset’s cost basis, which reduces future depreciation. Other government grants not related to long-lived assets are considered income-based grants, which are initially recognized as “Government grants receivable” and are also recognized as a reduction to the related cost of activities that generated the benefit. Proceeds received from asset based grants are presented as cash inflows from investing activities on the consolidated statements of cash flows, whereas proceeds received from income based grants are presented as cash inflows from operating activities.
Concentrations of risk
Financial instruments potentially subjecting the Company to significant concentrations of credit risk consist principally of cash and cash equivalents and short-term investments, of which a significant portion are held by three financial institutions, its long-term investment, and trade accounts receivable. The Company maintains cash and cash equivalents, short-term investments and certain other financial instruments with high credit counterparties, and continuously monitors the amount of credit exposure to any one issuer and diversifies its investments in order to minimize its credit risk. Generally, amounts invested with these financial institutions are in excess of federal deposit insurance limits. The Company has not experienced any losses in such accounts, and management believes the Company is not exposed to significant credit risk. The Company’s long-term investment as of December 31, 2024 consists of a single auction rate security with a par value of $3,000,000, which is collateralized by student loans. It is a highly rated (Aaa/AA+) municipal and corporate debt security. Through December 31, 2024, auctions held for the Company’s auction rate security have failed. The funds associated with an auction rate security that has failed auction may not be accessible until a successful auction occurs, a buyer is found outside of the auction process, the security is called, or the underlying securities have matured. If the credit rating of the issuer of the auction rate security held deteriorates, the Company may be required to adjust the carrying value of the investment for an other-than-temporary decline in value through an impairment charge. The Company’s investment policy, approved by the Board of Directors, limits the amount the Company may invest in any issuer, thereby reducing credit risk concentrations.
The Company’s products are sold worldwide to customers ranging from smaller, independent manufacturers of highly specialized electronic devices, to larger OEMs, ODMs and their contract manufacturers. The Company’s Brick Products’ customers are primarily concentrated in the following industries: aerospace and defense electronics, industrial equipment, instrumentation and test equipment, and transportation (notably in rail and heavy equipment applications). The Company’s Advanced Products’ customers are concentrated in the data center and hyperscaler segments of enterprise computing, in which the Company’s products are used for power delivery on server motherboards, in server racks, and across datacenter infrastructure. The Company also serves applications in aerospace and aviation, defense electronics, satellites, factory automation, instrumentation, test equipment, transportation, telecommunications and networking infrastructure, and vehicles (notably in the autonomous driving, electric vehicle, and hybrid vehicle niches of the vehicle segment). While, overall, the Company has a broad customer base and sells into a variety of industries, a substantial portion of the Company’s revenue from its Advanced Products line has been derived from a limited number of customers. This concentration of revenue is a
VICOR CORPORATION
Notes to Consolidated Financial Statements
reflection of the relatively early stage of adoption of the technologies, architectures and products offered in the Advanced Products line, and the Company’s strategy of targeting market leading innovators as initial customers for its Advanced Products. Concentrations of credit risk with respect to trade accounts receivable are limited due to the number of entities comprising the Company’s customer base. As of December 31, 2024 and 2023, one customer accounted for approximately 11.5% and 12.0%, respectively, of trade account receivables.
Components and materials used in the Company’s products are purchased from a variety of vendors. While most of the components are available from multiple sources, some key components for certain Advanced Products, in particular, are supplied by single vendors. In instances of single source items, the Company maintains levels of inventories management considers appropriate to enable meeting the delivery requirements of customers. If suppliers or subcontractors cannot provide their products or services on time or to the required specifications, the Company may not be able to meet the demand for its products and its delivery times may be negatively affected.
Long-lived assets
The Company reviews property, plant and equipment and finite-lived intangible assets for impairment whenever events or changes in circumstances indicate the carrying value of such assets may not be recoverable. Management determines whether the carrying value of an asset or asset group is recoverable based on comparison to the undiscounted expected future cash flows the assets are expected to generate over their remaining economic lives. If an asset value is not recoverable, the impairment loss is equal to the amount by which the carrying value of the asset exceeds its fair value, which is determined by either a quoted market price, if any, or a value determined by utilizing a discounted cash flow technique. Evaluation of impairment of long-lived assets requires estimates of future operating results that are used in the preparation of the expected future undiscounted cash flows. Actual future operating results and the remaining economic lives of our long-lived assets could differ from the estimates used in assessing the recoverability of these assets. These differences could result in impairment charges, which could be material.
Intangible assets
Patents
Values assigned to patents are amortized using the straight-line method over periods ranging from three to 20 years. Patents and other intangible assets are included in “Other assets” in the accompanying Consolidated Balance Sheets.
Internally Developed Software
We capitalize internal and external costs related to developing, modifying or obtaining software for internal use, incurred during the application development stage in accordance with Accounting Standards Codification 350-40, Internal-Use Software. Costs related to software upgrades and enhancements are capitalized if it is determined that these upgrades or enhancements provide additional functionality to the software. The capitalized software is amortized using the straight-line method over the estimated useful life of the software. As of December 31, 2024 and 2023, we had $20,469,000 and $11,712,000, respectively, of capitalized internal-use software costs which have not been amortized as the software has not yet been placed in service.
Product warranties
The Company generally offers a two-year warranty for all of its products, though it has extended the warranty period to three years for certain products. The Company provides for the estimated cost of product warranties at the time product revenue is recognized. Factors influencing the Company’s warranty reserves include the number of units sold, historical and anticipated rates of warranty returns, and the cost per return. The Company periodically assesses the adequacy of warranty reserves and adjusts the amounts as necessary. Warranty obligations are included in "Accrued expenses" in the accompanying Consolidated Balance Sheets.
Revenue recognition
Revenue is recognized when control of the promised goods or services is transferred to a customer, in an amount that reflects the consideration the Company expects to be entitled to in exchange for those goods or services. Sales, value add, and other taxes collected concurrent with revenue producing activities are excluded from revenue. The expected costs associated
VICOR CORPORATION
Notes to Consolidated Financial Statements
with product warranties continue to be recognized at the time product revenue is recognized. Shipping and handling costs associated with outbound freight after control over a product has transferred to a customer are accounted for as a fulfillment cost and are included in cost of product revenues.
The Company’s primary source of net revenue comes from the sale of products, which are modular power components and power systems for converting, regulating and controlling electric current. The principal customers for the Company’s power converters and systems are large OEMs, ODMs and the original design manufacturers and contract manufacturers serving them, and smaller, lower volume users, which are broadly distributed across several major market areas. The Company recognizes revenue for product sales at a point in time following the transfer of control of such products to the customer, including sales to stocking distributors, which typically occurs upon shipment or delivery, depending on the terms of the underlying contract. The Company establishes sales allowances on shipments to stocking distributors for estimated future product returns including distributor returns and price adjustment credits, primarily based upon historical and anticipated rates of product returns and allowances.
Certain contracts with customers contain multiple performance obligations, which typically may include a combination of non-recurring engineering services (“NRE”), prototype units, and production units. For these contracts, the individual performance obligations are accounted for separately if they are distinct. Generally, the Company has determined the NRE and prototype units represent one distinct performance obligation and the production units represent a separate distinct performance obligation. For such arrangements, revenue is allocated to each performance obligation based on its relative standalone selling price, based on prices charged to customers or using the expected cost plus a margin approach. The Company recognizes revenue for NRE and prototype units at the point in time at which the final milestone under the NRE arrangement is completed and control is transferred to the customer, which is generally the shipment or delivery of the prototype. Revenue for production units is recognized upon shipment or delivery, consistent with product revenue summarized above.
The Company licenses its intellectual property under right to use licenses, in which royalties due to the Company are based upon a percentage of the licensee’s sales. The Company utilizes the exception under the revenue recognition guidance for the recognition of sales- or usage-based royalties, in which the royalties are not recognized until the later of when 1) the customer’s subsequent sales or usages occur, or 2) the performance obligation to which some or all of the sales- or usage-based royalty has been allocated is satisfied or partially satisfied.
Accounts receivable includes amounts billed and currently due from customers. The amounts due are stated at their estimated realizable value. The Company’s payment terms vary by the type and location of its customers and the products or services offered, although terms generally include a requirement of payment within 30 to 60 days. The Company maintains allowances for doubtful accounts for estimated losses resulting from the inability of its customers to make required payments, based on assessments of customers’ credit-risk profiles and payment histories. If the financial condition of the Company’s customers were to deteriorate, resulting in an impairment of their ability to make payments, additional allowances may be required. The Company does not require collateral from its customers, although there have been circumstances when the Company has required cash in advance (i.e., a partial down-payment) to facilitate orders in excess of a customer’s established credit limit. To date, such amounts have not been material.
The Company records deferred revenue, which represents a contract liability, when cash payments are received or due in advance of performance under a contract with a customer. During the years ended December 31, 2024 and 2023, the Company recognized revenue of approximately $1,865,000 and $7,568,000, respectively, which was included in deferred revenue at the beginning of the respective period.
The Company applies the practical expedient for the incremental costs of obtaining a contract for sales commissions, which are expensed when incurred because the amortization period is generally less than one year. These costs are included in selling, general and administrative expenses.
The Company also applies another practical expedient and does not disclose the value of unsatisfied performance obligations for contracts with an original expected length of one year or less.
Advertising expense
The cost of advertising is expensed as incurred. The Company incurred approximately $3,490,000, $3,730,000, and
VICOR CORPORATION
Notes to Consolidated Financial Statements
$3,786,000 in advertising costs during 2024, 2023, and 2022, respectively.
Legal Costs
Legal costs in connection with litigation are expensed as incurred.
Stock-based compensation
The Company uses the Black-Scholes option-pricing model to calculate the fair value of stock option awards, whether they possess time-based vesting provisions or performance-based vesting provisions, and awards granted under the Vicor Corporation 2017 Employee Stock Purchase Plan (“ESPP”), as of their grant date. For stock options with time-based vesting provisions, the calculated compensation expense, net of expected forfeitures, is recognized on a straight-line basis over the service period of the award, which is generally five years for stock options. For stock options with performance-based vesting provisions, recognition of compensation expense, net of expected forfeitures, commences if and when the achievement of the performance criteria is deemed probable. For stock options with performance-based vesting provisions, compensation expense, net of expected forfeitures, when recognized, is recognized over the relevant performance period.
Income taxes
Deferred tax assets and liabilities are determined based on the differences between the financial reporting and tax bases of assets and liabilities and are measured using the enacted income tax rates and laws expected to be in effect when the temporary differences are expected to reverse. Deferred tax assets are reduced by a valuation allowance if management determines it is more likely than not that some portion or all of the deferred tax assets will not be realized. All deferred tax assets and liabilities are classified as noncurrent.
The Company follows a two-step process to determine the amount of tax benefit to recognize. The first step is to evaluate the tax position to determine the likelihood it would be sustained upon examination by a tax authority. If the tax position is deemed “more-likely-than-not” to be sustained, the second step is to assess the tax position to determine the amount of tax benefit to be recognized in the financial statements. The amount of the benefit that may be recognized is the largest amount that possesses greater than 50 percent likelihood of being realized upon ultimate settlement. If the tax position does not meet the “more-likely-than-not” threshold, then it is not recognized in the financial statements. Additionally, the Company accrues interest and penalties, if any, related to unrecognized tax benefits as a component of income tax expense. The unrecognized tax benefits, including accrued interest and penalties, if any, are included in “Long-term income taxes payable” in the accompanying Consolidated Balance Sheets.
Net income per common share
The Company computes basic net income per share using the weighted average number of common shares outstanding and diluted net income per share using the weighted average number of common shares outstanding plus the effect of outstanding dilutive stock options, if any. The following table sets forth the computation of basic and diluted net income per share for the years ended December 31 (in thousands, except per share amounts):
| | | | | | | | | | | | |
| | 2024 | | | 2023 | | | 2022 | |
Numerator: | | | | | | | | | |
Net income attributable to Vicor Corporation | | $ | 6,129 | | | $ | 53,595 | | | $ | 25,446 | |
Denominator: | | | | | | | | | |
Denominator for basic net income per share-
weighted average shares (1) | | | 44,912 | | | | 44,320 | | | | 44,005 | |
Effect of dilutive securities: | | | | | | | | | |
Employee stock options (2) | | | 256 | | | | 684 | | | | 889 | |
Denominator for diluted net income per share-
adjusted weighted-average shares and assumed conversions (3) | | | 45,168 | | | | 45,004 | | | | 44,894 | |
Basic net income per share | | $ | 0.14 | | | $ | 1.21 | | | $ | 0.58 | |
Diluted net income per share | | $ | 0.14 | | | $ | 1.19 | | | $ | 0.57 | |
VICOR CORPORATION
Notes to Consolidated Financial Statements
(1)Denominator represents weighted average number of Common Shares and Class B Common Shares outstanding.
(2)Options to purchase 2,504,068, 1,557,927 and 879,228 shares of Common Stock in 2024, 2023, and 2022, respectively, were not included in the calculation of net income per share as the effect would have been antidilutive.
(3)Denominator represents weighted average number of Common Shares and Class B Common Shares outstanding for the year, adjusted to include the dilutive effect, if any, of outstanding options.
Comprehensive income (loss)
The components of comprehensive income (loss) include, in addition to consolidated net income, unrealized gains and losses on investments, net of tax and foreign currency translation adjustments related to VJCL, net of tax.
Impact of recently issued accounting standards
On November 27, 2023, the Financial Accounting Standards Board (“FASB”) issued Accounting Standards Update (“ASU”) No. 2023-07, Segment Reporting (Topic 280): Improvements to Reportable Segment Disclosures, which enhances segment disclosures and requires additional disclosures of segment expenses. This ASU is effective for annual periods in fiscal years beginning after December 15, 2023, and interim periods thereafter. The Company adopted ASU 2023-07 during the year ended December 31, 2024 on a retrospective basis. See Note 10 Segment Information to the consolidated financial statements.
In December 2023, the FASB issued ASU No. 2023-09, Income Taxes (Topic 740): Improvements to Income Tax Disclosures, which focuses on the rate reconciliation and income taxes paid. ASU No. 2023-09 requires a public business entity ("PBE") to disclose, on an annual basis, a tabular rate reconciliation using both percentages and currency amounts, broken out into specified categories with certain reconciling items further broken out by nature and jurisdiction to the extent those items exceed a specified threshold. In addition, all entities are required to disclose income taxes paid, net of refunds received disaggregated by federal, state/local, and foreign and by jurisdiction if the amount is at least 5% of total income tax payments, net of refunds received. For PBEs, the new standard is effective for annual periods beginning after December 15, 2024, with early adoption permitted. An entity may apply the amendments in this ASU prospectively by providing the revised disclosures for the period ending December 31, 2025 and continuing to provide the pre-ASU disclosures for the prior periods, or may apply the amendments retrospectively by providing the revised disclosures for all period presented. The Company expects this ASU to impact disclosures with no impact to the Company’s consolidated financial statements.
In November 2024, the FASB issued ASU 2024-03, Income Statement-Reporting Comprehensive Income-Expense Disaggregation Disclosures (Subtopic 220-40): Disaggregation of Income Statement Expenses, requiring public entities to disclose additional information about specific expense categories in the notes to the financial statements on an interim and annual basis. ASU 2024-03 is effective for fiscal years beginning after December 15, 2026, and for interim periods beginning after December 15, 2027, with early adoption permitted. The Company is currently evaluating the impact of adopting ASU 2024-03.
Other new pronouncements issued but not effective until after December 31, 2024 are not expected to have a material impact on the Company’s consolidated financial statements.
Inventories as of December 31 were as follows (in thousands):
| | | | | | | | |
| | 2024 | | | 2023 | |
Raw materials | | $ | 78,934 | | | $ | 88,716 | |
Work-in-process | | | 16,389 | | | | 10,525 | |
Finished goods | | | 10,709 | | | | 7,338 | |
| | $ | 106,032 | | | $ | 106,579 | |
VICOR CORPORATION
Notes to Consolidated Financial Statements
As of December 31, 2024 and 2023, the Company held one auction rate security with a par value of $3,000,000 and an estimated fair value of approximately $2,641,000 and $2,530,000, respectively, purchased through and held in custody by a broker-dealer affiliate of Bank of America, N.A., that has experienced failed auctions (the “Failed Auction Security”) since February 2008. The Failed Auction Security held by the Company is Aaa/AA+ rated by major credit rating agencies, is collateralized by student loans, and is guaranteed by the U.S. Department of Education under the Federal Family Education Loan Program. Management is not aware of any reason to believe the issuer of the Failed Auction Security is presently at risk of default. Through December 31, 2024, the Company has continued to receive interest payments on the Failed Auction Security in accordance with the terms of its indenture. Management believes the Company ultimately should be able to liquidate the Failed Auction Security without significant loss primarily due to the overall quality of the issue held and the collateral securing the substantial majority of the underlying obligation. Changes in the estimated fair value of the Failed Auction Security have not been significant in the past three years. However, current conditions in the auction rate securities market have led management to conclude the recovery period for the Failed Auction Security exceeds 12 months. As a result, the Company continued to classify the Failed Auction Security as long-term as of December 31, 2024.
At this time, the Company has no intent to sell the Failed Auction Security and does not believe it is more likely than not the Company will be required to sell the security. If current market conditions deteriorate further, the Company may be required to record additional unrealized losses. If the credit rating of the security deteriorates, the Company may be required to adjust the carrying value of the investment through impairment charges recorded in the Consolidated Statement of Operations, and any such impairment adjustments may be material.
Details of our investments are as follows (in thousands):
| | | | | | | | |
| | December 31, 2024 | |
| | Cash and Cash | | | Long-Term | |
Measured at fair value: | | Equivalents | | | Investment | |
Available-for-sale debt securities: | | | | | | |
Money Market Funds | | $ | 246,745 | | | $ | — | |
Failed Auction Security | | | — | | | | 2,641 | |
Total | | | 246,745 | | | | 2,641 | |
| | | | | | |
Other measurement basis: | | | | | | |
Cash on hand | | | 30,528 | | | | — | |
Total | | $ | 277,273 | | | $ | 2,641 | |
| | | | | | | | |
| | December 31, 2023 | |
| | Cash and Cash | | | Long-Term | |
Measured at fair value: | | Equivalents | | | Investment | |
Available-for-sale debt securities: | | | | | | |
Money Market Funds | | $ | 209,489 | | | $ | — | |
Failed Auction Security | | | — | | | | 2,530 | |
Total | | | 209,489 | | | | 2,530 | |
Other measurement basis: | | | | | | |
Cash on hand | | | 32,730 | | | | — | |
Total | | $ | 242,219 | | | $ | 2,530 | |
The following is a summary of the available-for-sale securities (in thousands):
VICOR CORPORATION
Notes to Consolidated Financial Statements
| | | | | | | | | | | | | | | | |
| | | | | Gross | | | Gross | | | Estimated | |
| | | | | Unrealized | | | Unrealized | | | Fair | |
December 31, 2024 | | Cost | | | Gains | | | Losses | | | Value | |
Failed Auction Security | | $ | 3,000 | | | $ | — | | | $ | 359 | | | $ | 2,641 | |
| | | | | | | | | | | | |
December 31, 2023 | | | | | | | | | | | | |
Failed Auction Security | | $ | 3,000 | | | $ | — | | | $ | 470 | | | $ | 2,530 | |
As of December 31, 2024 and 2023, the Failed Auction Security had been in an unrealized loss position for greater than 12 months.
The amortized cost and estimated fair value of the available-for-sale securities on December 31, 2024, by type and contractual maturities, are shown below (in thousands):
Failed Auction Security:
| | | | | | | | |
| | | | | Estimated | |
| | Cost | | | Fair Value | |
Due in seventeen years | | $ | 3,000 | | | $ | 2,641 | |
5.Fair Value Measurements
The Company accounts for certain financial assets at fair value, defined as the price that would be received to sell an asset or paid to transfer a liability (i.e., an exit price) in the principal or most advantageous market for the asset or liability in an orderly transaction between market participants on the measurement date. As such, fair value is a market-based measurement that should be determined based on assumptions market participants would use in pricing an asset or liability. A three-level hierarchy is used to show the extent and level of judgment used to estimate fair value measurements.
Assets and liabilities measured at fair value on a recurring basis included the following as of December 31, 2024 (in thousands):
| | | | | | | | | | | | | | | | |
| | Using | | | | |
| | | | | Significant | | | | | | | |
| | Quoted Prices | | | Other | | | Significant | | | | |
| | in Active | | | Observable | | | Unobservable | | | Total Fair | |
| | Markets | | | Inputs | | | Inputs | | | Value as of | |
| | (Level 1) | | | (Level 2) | | | (Level 3) | | | December 31, 2024 | |
Cash equivalents: | | | | | | | | | | | | |
Money market funds | | $ | 246,745 | | | $ | — | | | $ | — | | | $ | 246,745 | |
Long-term investment: | | | | | | | | | | | | |
Failed Auction Security | | | — | | | | — | | | | 2,641 | | | | 2,641 | |
Assets measured at fair value on a recurring basis included the following as of December 31, 2023 (in thousands):
| | | | | | | | | | | | | | | | |
| | Using | | | | |
| | | | | Significant | | | | | | | |
| | Quoted Prices | | | Other | | | Significant | | | | |
| | in Active | | | Observable | | | Unobservable | | | Total Fair | |
| | Markets | | | Inputs | | | Inputs | | | Value as of | |
| | (Level 1) | | | (Level 2) | | | (Level 3) | | | December 31, 2023 | |
Cash equivalents: | | | | | | | | | | | | |
Money market funds | | $ | 209,489 | | | $ | — | | | $ | — | | | $ | 209,489 | |
Long-term investment: | | | | | | | | | | | | |
Failed Auction Security | | | — | | | | — | | | | 2,530 | | | | 2,530 | |
VICOR CORPORATION
Notes to Consolidated Financial Statements
The change in the estimated fair value calculated for the investment valued on a recurring basis utilizing Level 3 inputs (i.e., the Failed Auction Security) for the year ended December 31, 2024 was as follows (in thousands):
| | | | |
Balance at the beginning of the period | | $ | 2,530 | |
Gain included in Other comprehensive income | | | 111 | |
Balance at the end of the period | | $ | 2,641 | |
Management utilized a probability weighted discounted cash flow model to determine the estimated fair value of this investment as of December 31, 2024.
6.PROPERTY, PLANT AND EQUIPMENT
Property, plant and equipment are stated at cost and are depreciated and amortized over a period of three to 39 years generally under the straight-line method for financial reporting purposes and accelerated methods for income tax purposes.
Property, plant and equipment as of December 31 were as follows (in thousands):
| | | | | | | | |
| | 2024 | | | 2023 | |
Land | | $ | 3,600 | | | $ | 3,600 | |
Buildings and improvements | | | 86,502 | | | | 82,861 | |
Machinery and equipment | | | 298,688 | | | | 282,084 | |
Furniture and fixtures | | | 14,567 | | | | 14,346 | |
Construction in-progress and deposits | | | 8,229 | | | | 17,723 | |
| | | 411,586 | | | | 400,614 | |
Accumulated depreciation and amortization | | | (265,248 | ) | | | (250,315 | ) |
Right of use asset - net | | | 6,367 | | | | 7,390 | |
Net balance | | $ | 152,705 | | | $ | 157,689 | |
Depreciation expense for the years ended December 31, 2024, 2023 and 2022 was approximately $18,583,000, $17,174,000, and $13,701,000, respectively. As of December 31, 2024, the Company had approximately $12,669,000 of capital expenditure commitments.
On August 9, 2022, Congress enacted a 25 percent tax credit for investment in semiconductor manufacturing to incentivize domestic semiconductor production. The Advanced Manufacturing Investment Tax Credit ("ITC") was enacted as part of the Creating Helpful Incentives to Produce Semiconductors Act in response to supply chain disruptions.
The Company had undergone a study of its 2024 and 2023 capital expenditures to determine which additions would qualify under the ITC guidance and which would not. The Company believes that it does comply with the grant conditions supported by the study and that the grant will be received based on meeting these conditions.
The Company recorded in the years ended December 31, 2024 and 2023 an Other current asset for the associated value of the ITC credit receivable of $6,274,000 and $13,248,000, respectively, with a corresponding offset to the Property, plant and equipment line item on its Consolidated Balance Sheet. The Company expects to receive the ITC credit next year in the form of a cash refund.
Patent costs, which are included in Other assets in the accompanying Consolidated Balance Sheets, as of December 31 were as follows (in thousands):
VICOR CORPORATION
Notes to Consolidated Financial Statements
| | | | | | | | |
| | 2024 | | | 2023 | |
Patent costs | | $ | 637 | | | $ | 900 | |
Accumulated amortization | | | (488 | ) | | | (708 | ) |
| | $ | 149 | | | $ | 192 | |
Definite lived intangible assets, such as patent rights, are amortized and tested for impairment if a triggering event occurs.
Amortization expense was approximately $43,000, $66,000 and $75,000 in 2024, 2023, and 2022, respectively.
Product warranty activity for the years ended December 31 was as follows (in thousands):
| | | | | | | | | | | | |
| | 2024 | | | 2023 | | | 2022 | |
Balance at the beginning of the period | | $ | 1,034 | | | $ | 497 | | | $ | 292 | |
Accruals for warranties for products sold in the period | | | 507 | | | | 1,353 | | | | 376 | |
Fulfillment of warranty obligations | | | (760 | ) | | | (815 | ) | | | (131 | ) |
Revisions of estimated obligations | | | (33 | ) | | | (1 | ) | | | (40 | ) |
Balance at the end of the period | | $ | 748 | | | $ | 1,034 | | | $ | 497 | |
Each share of Common Stock entitles the holder thereof to one vote on all matters submitted to the stockholders.
Each share of Class B Common Stock entitles the holder thereof to ten votes on all such matters.
Shares of Class B Common Stock are not transferable by a stockholder except to or among the stockholder’s spouse, certain of the stockholder’s relatives, and certain other defined transferees. Class B Common Stock is not listed or traded on any exchange or in any market. Class B Common Stock is convertible at the option of the holder thereof at any time and without cost to the stockholder into shares of Common Stock on a one-for-one basis.
In November 2000, the Board of Directors of the Company authorized the repurchase of up to $30,000,000 of the Company's Common Stock (the “November 2000 Plan”). In July 2024, the Board of Directors of the Company authorized the repurchase of up to $100,000,000 of the Company's Common Stock (the “New Repurchase Authorization”). The New Repurchase Authorization replaces the November 2000 Plan in its entirety and no further repurchases will be made pursuant to the November 2000 Plan. There were no repurchases under the November 2000 Plan in 2024, 2023 or 2022. Repurchases of approximately $497,000 were made under the New Purchase Authorization in 2024. On December 31, 2024, the Company had approximately $99,503,000 available for share repurchases under the New Repurchase Authorization.
Dividends are declared at the discretion of the Company’s Board of Directors and depend on actual cash from operations, the Company’s financial condition and capital requirements and any other factors the Company’s Board of Directors may consider relevant at the time. Common Stock and Class B Common Stock participate in dividends and earnings equally.
On December 31, 2024, 2023, and 2022, there were 19,975,730, 20,703,238, and 21,080,950, respectively, shares of Vicor Common Stock reserved for issuance upon exercise of Vicor stock options, upon conversion of Class B Common Stock and under the ESPP.
The Company has determined its Chief Operating Decision Maker (“CODM”) to be the Chief Executive Officer (“CEO”). The CEO reviews financial information presented on a consolidated basis for purposes of managing the business,
VICOR CORPORATION
Notes to Consolidated Financial Statements
allocating resources, making operating decisions and assessing financial performance. The Company is organized and operates as single operating and reportable segment. The CODM assesses performance for the segment and decides how to allocate resources based on consolidated net income. The CODM manages the business using consolidated expense information for the single operating segment. All expense categories on the Consolidated Statements of Operations are significant and there are no other significant segment expenses that would require disclosure.
The Company offers a comprehensive range of modular building blocks enabling rapid design of a power system specific to a customer’s precise needs. Based on design, performance, and form factor considerations, as well as the range of evolving applications for which the products are appropriate, the Company categorizes its product portfolios as either Advanced Products or Brick Products, which constitute one segment. Both product lines are built in the Company’s manufacturing facility in Andover, Massachusetts employing similar processing and production techniques, and are supported by the same sales and marketing organizations. The measure of segment assets is reported on the balance sheet as total consolidated assets.
The following tables present the Company’s net revenues disaggregated by geography with respect to the Company’s single operating segment for the years ended December 31, 2024, 2023 and 2022 (in thousands):
| | | | | | | | | | | | |
| | Year Ended December 31, | |
| | 2024 | | | 2023 | | | 2022 | |
United States | | $ | 185,834 | | | $ | 149,456 | | | $ | 129,422 | |
Europe | | | 41,803 | | | | 59,742 | | | | 38,378 | |
Asia Pacific | | | 129,981 | | | | 192,267 | | | | 228,335 | |
All other | | | 1,440 | | | | 3,594 | | | | 2,944 | |
| | $ | 359,058 | | | $ | 405,059 | | | $ | 399,079 | |
The Company's long-lived tangible assets, as well as the Company's operating lease right-of-use assets recognized on the Consolidated Balance Sheets were located as follows:
| | | | | | | | |
| | As of December 31, | |
| | 2024 | | | 2023 | |
| | (in thousands) | |
United States | | $ | 146,472 | | | $ | 151,439 | |
International | | | 6,233 | | | | 6,250 | |
See the consolidated financial statements and footnotes for other financial information regarding the Company’s operating segment.
11. REVENUES
The following tables present the Company’s net revenues disaggregated by geography based on the location of the customer, by product line (in thousands):
| | | | | | | | | | | | |
| | Year Ended December 31, 2024 | |
| | Brick
Products | | | Advanced
Products | | | Total | |
United States | | $ | 85,347 | | | $ | 100,487 | | | $ | 185,834 | |
Europe | | | 27,088 | | | | 14,715 | | | | 41,803 | |
Asia Pacific | | | 48,347 | | | | 81,634 | | | | 129,981 | |
All other | | | 947 | | | | 493 | | | | 1,440 | |
| | $ | 161,729 | | | $ | 197,329 | | | $ | 359,058 | |
VICOR CORPORATION
Notes to Consolidated Financial Statements
| | | | | | | | | | | | |
| | Year Ended December 31, 2023 | |
| | Brick
Products | | | Advanced
Products | | | Total | |
United States | | $ | 82,400 | | | $ | 67,056 | | | $ | 149,456 | |
Europe | | | 31,792 | | | | 27,950 | | | | 59,742 | |
Asia Pacific | | | 63,631 | | | | 128,636 | | | | 192,267 | |
All other | | | 3,343 | | | | 251 | | | | 3,594 | |
| | $ | 181,166 | | | $ | 223,893 | | | $ | 405,059 | |
| | | | | | | | | | | | |
| | Year Ended December 31, 2022 | |
| | Brick
Products | | | Advanced
Products | | | Total | |
United States | | $ | 76,306 | | | $ | 53,116 | | | $ | 129,422 | |
Europe | | | 27,856 | | | | 10,522 | | | | 38,378 | |
Asia Pacific | | | 49,076 | | | | 179,259 | | | | 228,335 | |
All other | | | 2,520 | | | | 424 | | | | 2,944 | |
| | $ | 155,758 | | | $ | 243,321 | | | $ | 399,079 | |
The following tables present the Company’s net revenues disaggregated by the category of revenue, by product line (in thousands):
| | | | | | | | | | | | |
| | Year Ended December 31, 2024 | |
| | Brick
Products | | | Advanced
Products | | | Total | |
Direct customers, contract manufacturers and non-stocking
distributors | | $ | 88,144 | | | $ | 113,359 | | | $ | 201,503 | |
Stocking distributors, net of sales allowances | | | 72,713 | | | | 31,061 | | | | 103,774 | |
Non-recurring engineering | | | 872 | | | | 4,874 | | | | 5,746 | |
Royalties | | | — | | | | 46,595 | | | | 46,595 | |
Other | | | — | | | | 1,440 | | | | 1,440 | |
| | $ | 161,729 | | | $ | 197,329 | | | $ | 359,058 | |
| | | | | | | | | | | | |
| | Year Ended December 31, 2023 | |
| | Brick
Products | | | Advanced
Products | | | Total | |
Direct customers, contract manufacturers and non-stocking
distributors | | $ | 113,448 | | | $ | 163,549 | | | $ | 276,997 | |
Stocking distributors, net of sales allowances | | | 66,544 | | | | 29,893 | | | | 96,437 | |
Non-recurring engineering | | | 1,174 | | | | 13,421 | | | | 14,595 | |
Royalties | | | — | | | | 15,872 | | | | 15,872 | |
Other | | | — | | | | 1,158 | | | | 1,158 | |
| | $ | 181,166 | | | $ | 223,893 | | | $ | 405,059 | |
VICOR CORPORATION
Notes to Consolidated Financial Statements
| | | | | | | | | | | | |
| | Year Ended December 31, 2022 | |
| | Brick
Products | | | Advanced
Products | | | Total | |
Direct customers, contract manufacturers and
non-stocking distributors | | $ | 102,905 | | | $ | 216,685 | | | $ | 319,590 | |
Stocking distributors, net of sales allowances | | | 51,819 | | | | 13,831 | | | | 65,650 | |
Non-recurring engineering | | | 1,034 | | | | 9,933 | | | | 10,967 | |
Royalties | | | — | | | | 2,801 | | | | 2,801 | |
Other | | | — | | | | 71 | | | | 71 | |
| | $ | 155,758 | | | $ | 243,321 | | | $ | 399,079 | |
The following table presents the changes in certain contract assets and (liabilities) (in thousands):
| | | | | | | | | | | | |
| | December 31, 2024 | | | December 31, 2023 | | | Change | |
Short-term deferred revenue and customer prepayments | | $ | (5,312 | ) | | $ | (3,157 | ) | | $ | (2,155 | ) |
Long-term deferred revenue | | | — | | | | (1,020 | ) | | | 1,020 | |
Sales allowances | | | (1,667 | ) | | | (3,482 | ) | | | 1,815 | |
During 2024, 2023, and 2022, one customer accounted for approximately 12.1%, 10.7%, and 12.4% of net revenues, respectively.
Net revenues from customers in China (including Hong Kong), accounted for approximately 12.6% of total net revenues in 2024, 17.7% in 2023 and 18.8% in 2022, respectively.
12.STOCK-BASED COMPENSATION AND EMPLOYEE BENEFIT PLANS
Vicor currently grants options for the purchase of Common Stock (i.e., “stock options”) under the following equity compensation plans that are stockholder-approved:
Amended and Restated 2000 Stock Option and Incentive Plan, as amended and restated (the “2000 Plan”) — Under the 2000 Plan, the Board of Directors or the Compensation Committee of the Board of Directors may grant stock incentive awards based on the Company’s Common Stock, including stock options, stock appreciation rights, restricted stock, performance shares, unrestricted stock, deferred stock, and dividend equivalent rights. Awards may be granted to employees and other key persons, including non-employee directors. Incentive stock options may be granted to employees at a price at least equal to the fair market value per share of the Common Stock on the date of grant, and non-qualified options may be granted to non-employee directors at a price at least equal to 85% of the fair market value of the Common Stock on the date of grant. A total of 10,000,000 shares of Common Stock have been reserved for issuance under the 2000 Plan. The period of time during which an option may be exercised and the vesting periods are determined by the Compensation Committee. The term of each option may not exceed 10 years from the date of grant and have a vesting period of five years.
Vicor Corporation 2017 Employee Stock Purchase Plan (the “Plan” or the “ESPP”). Under the ESPP, the Company has reserved 2,000,000 shares of Common Stock for issuance to eligible employees who elect to participate. The ESPP is intended to qualify as an “employee stock purchase plan” under Section 423 of the Internal Revenue Code. The ESPP operates in successive periods of approximately six months, each referred to as an “offering period.” Generally, offering periods commence on or around September 1 and March 1 and end on or around the following February 28 or August 31, respectively. Under the ESPP, an option is granted to participating employees on the first day of an offering period to purchase shares of the Company’s Common Stock at the end of that offering period at a purchase price equal to 85% of the lesser of the fair market value of a share of Common Stock on either the first day or the last day of that offering period. The purchase of shares is funded by means of periodic payroll deductions, which may not exceed 15.0% of the employee’s eligible compensation, as defined in the Plan. Among other provisions, the Plan limits the number of shares that can be purchased by a participant during any offering period and cumulatively for any calendar year.
VICOR CORPORATION
Notes to Consolidated Financial Statements
Stock-based compensation expense for the years ended December 31 was as follows (in thousands):
| | | | | | | | | | | | |
| | 2024 | | | 2023 | | | 2022 | |
Cost of product revenues | | $ | 3,243 | | | $ | 2,429 | | | $ | 1,648 | |
Selling, general and administrative | | | 7,818 | | | | 6,829 | | | | 5,735 | |
Research and development | | | 4,241 | | | | 3,611 | | | | 2,881 | |
Total stock-based compensation | | $ | 15,302 | | | $ | 12,869 | | | $ | 10,264 | |
Compensation expense by type of award for the years ended December 31 was as follows (in thousands):
| | | | | | | | | | | | |
| | 2024 | | | 2023 | | | 2022 | |
Stock options | | $ | 14,231 | | | $ | 11,585 | | | $ | 9,093 | |
ESPP | | | 1,071 | | | | 1,284 | | | | 1,171 | |
Total stock-based compensation | | $ | 15,302 | | | $ | 12,869 | | | $ | 10,264 | |
All time-based (i.e., non-performance-based) options for the purchase of Vicor common stock are granted with an exercise price equal to or greater than the market price for Vicor Common Stock at the date of the grant. The fair value for non-performance-based stock options awarded under the 2000 Plan for the years shown below was estimated at the date of grant using the Black-Scholes option pricing model with the following weighted-average assumptions:
| | | | | | | | | | | | |
| | 2024 | | | 2023 | | | 2022 | |
Risk-free interest rate | | | 4.6 | % | | | 3.7 | % | | | 2.8 | % |
Expected dividend yield | | | — | | | | — | | | | — | |
Expected volatility | | | 58 | % | | | 54 | % | | | 51 | % |
Expected term (years) | | | 4.1 | | | | 4.2 | | | | 4.4 | |
Risk-free interest rate:
The Company uses the yield on zero-coupon U.S. Treasury “Strip” securities for a period that is commensurate with the expected term assumption for each vesting period.
Expected dividend yield:
The Company determines the expected dividend yield by annualizing the most recent prior cash dividends declared by the Company’s Board of Directors, if any, and dividing that result by the closing stock price on the date of that dividend declaration. Dividends are not paid on options.
Expected volatility:
Vicor uses historical volatility to estimate the grant-date fair value of the options, using the expected term for the period over which to calculate the volatility (see below). The Company does not expect its future volatility to differ from its historical volatility. The computation of the Company’s volatility is based on a simple average calculation of monthly volatilities over the expected term.
Expected term:
The Company uses historical employee exercise and option expiration data to estimate the expected term assumption for the Black-Scholes grant-date valuation. The Company believes this historical data is currently the best estimate of the expected term of options, and all groups of the Company’s employees exhibit similar exercise behavior.
Forfeiture rate:
The amount of stock-based compensation recognized during a period is based on the value of the portion of the awards
VICOR CORPORATION
Notes to Consolidated Financial Statements
that are ultimately expected to vest. Forfeitures are estimated at the time of grant and revised, if necessary, in subsequent periods if actual forfeitures differ from those estimates. The term “forfeitures” is distinct from “cancellations” or “expirations” and represents only the unvested portion of the surrendered option. The forfeiture analysis is re-evaluated annually and the forfeiture rate is adjusted as necessary. Ultimately, the actual expense recognized over the vesting period will only be for those shares that vest.
Based on an analysis of historical forfeitures, the Company applied an annual forfeiture rate of 4.30% in 2024, estimating approximately 88% of its options would actually vest. For 2023 and 2022, the Company applied an annual forfeiture rate of 5.00% and 5.35%, respectively, estimating approximately 86% and 85%, respectively, of its options would actually vest.
A summary of the activity under the 2000 Plan as of December 31, 2024 and changes during the year then ended, is presented below (in thousands except for share and weighted-average data):
| | | | | | | | | | | | | | | | |
| | Options
Outstanding | | | Weighted-
Average
Exercise
Price | | | Weighted-
Average
Remaining
Contractual
Life in Years | | | Aggregate
Intrinsic
Value | |
| | | | | | | | | | | | |
Outstanding on December 31, 2023 | | | 2,555,242 | | | $ | 43.51 | | | | | | | |
Granted | | | 1,159,611 | | | $ | 34.26 | | | | | | | |
Forfeited and expired | | | (155,478 | ) | | $ | 52.38 | | | | | | | |
Exercised | | | (642,468 | ) | | $ | 9.23 | | | | | | | |
Outstanding on December 31, 2024 | | | 2,916,907 | | | $ | 46.91 | | | | 4.31 | | | $ | 23,544 | |
Exercisable on December 31, 2024 | | | 681,949 | | | $ | 58.76 | | | | 3.36 | | | $ | 3,350 | |
Vested or expected to vest as of December 31,
2024 (1) | | | 2,735,891 | | | $ | 47.33 | | | | 4.25 | | | $ | 21,697 | |
(1)In addition to the vested options, the Company expects a portion of the unvested options to vest at some point in the future. The number of options expected to vest is calculated by applying an estimated forfeiture rate to the unvested options.
As of December 31, 2023 and 2022, the Company had options exercisable for 973,894 and 1,046,092 shares, respectively, for which the weighted average exercise prices were $27.39 and $18.26, respectively.
During the years ended December 31, 2024, 2023, and 2022, the total intrinsic value of Vicor options exercised (i.e., the difference between the market price at exercise and the price paid by the employee to exercise the options) was approximately $17,460,000, $14,396,000, and $7,252,000, respectively. The total amount of cash received by the Company from options exercised in 2024, 2023, and 2022 was $5,929,000, $7,798,000, and $1,634,000, respectively. The total grant-date fair value of stock options granted during the years ended December 31, 2024, 2023, and 2022 was approximately $19,283,000, $17,957,000, and $15,087,000, respectively.
As of December 31, 2024, there was approximately $26,273,000 of total unrecognized compensation cost related to unvested awards for Vicor. That cost is expected to be recognized over a weighted-average period of 2.0 years for those awards. The expense will be recognized as follows: $12,878,000 in 2025, $7,537,000 in 2026, $3,911,000 in 2027, $1,614,000 in 2028, and $333,000 in 2029.
The weighted-average fair value of Vicor options granted was $16.63, $19.56, and $26.53, in 2024, 2023, and 2022, respectively.
401(k) Plan
The Company sponsors a savings plan available to all domestic employees, which qualifies under Section 401(k) of the Internal Revenue Code. Employees may contribute to the plan in amounts representing from 1% to 80% of their pre-tax
VICOR CORPORATION
Notes to Consolidated Financial Statements
salary, subject to statutory limitations. The Company matches employee contributions to the plan at a rate of 50%, up to the first 6% of an employee’s compensation. The Company’s matching contributions currently vest at a rate of 20% per year, based upon years of service. The Company’s contributions to the plan were approximately $2,171,000, $2,317,000, and $2,211,000 in 2024, 2023, and 2022, respectively.
Stock Bonus Plan
Under the Company’s 1985 Stock Bonus Plan, as amended, shares of Common Stock may be awarded to employees from time to time as determined by the Board of Directors. On December 31, 2024, 109,964 shares were available for further award. All shares awarded to employees under this plan have vested. No further awards are contemplated under this plan at the present time.
All of the Company’s leases are classified as operating leases. The majority of the Company’s leases are for office and manufacturing space, along with several automobiles and certain equipment. Leases with initial terms of less than twelve months are not recorded on the balance sheet. Expense for these leases is recognized on a straight-line basis over the lease term. The Company’s leases have remaining terms of less than one year to just over 11 years. The majority of the Company’s leases do not have options to renew, although several have renewal terms to extend the lease for one five-year term, and one lease contains two five-year renewal options. None of the renewal options are included in determining the term of the lease, used for calculating the associated lease liabilities. None of the Company’s leases include variable payments, residual value guarantees or restrictive covenants. A number of the Company’s leases for office and manufacturing space include provisions for common area maintenance (“CAM”). The Company accounts for CAM separately from lease payments, and therefore costs for CAM are not included in the determination of lease liabilities. The Company is a party to one arrangement as the lessor, for its facility located in Sunnyvale, California, with a third party. The initial term of the lease agreement expired on May 31, 2024 and was extended for an additional eighty-four months, commencing June 1, 2024 and ending May 31, 2031.
As of December 31, 2024 and 2023, the balance of right of use (“ROU”) assets was approximately $6,367,000 and $7,390,000, respectively. As of December 31, 2024, the balances of short-term and long-term lease liabilities were approximately $1,716,000 and $5,620,000, respectively. As of December 31, 2023, the balances of short-term and long-term lease liabilities were approximately $1,864,000 and $6,364,000, respectively. For the year ended December 31, 2024, the Company recorded operating lease cost, including short-term lease cost, of approximately $2,108,000 ($2,138,000 in 2023). The ROU assets are included in “Property, plant and equipment, net” in the accompanying Consolidated Balance Sheets.
The maturities of the Company’s lease liabilities are as follows (in thousands):
| | | | |
2025 | | $ | 2,009 | |
2026 | | | 1,389 | |
2027 | | | 1,031 | |
2028 | | | 846 | |
2029 | | | 644 | |
Thereafter | | | 2,697 | |
Total lease payments | | $ | 8,616 | |
Less: Imputed interest | | | 1,280 | |
Present value of lease liabilities | | $ | 7,336 | |
As of December 31, 2024 and 2023, the weighted-average remaining lease term was 6.7 years and 6.8 years, respectively, and the weighted-average discount rate was 4.45% and 4.22%, respectively, for the Company’s operating leases. The Company developed the discount rates used based on a Secured Overnight Financing Rate (“SOFR”) over a term approximating the term of the related lease, plus an additional interest factor, which was generally 1.25%.
For the years ended December 31, 2024 and December 31, 2023, the Company paid approximately $2,194,000 and $2,096,000, respectively, for amounts included in the measurement of lease liabilities through operating cash flows. The
VICOR CORPORATION
Notes to Consolidated Financial Statements
Company obtained approximately $902,000 and $1,180,000 in ROU assets in exchange for $896,000 and $1,165,000 of new operating lease liabilities for the years ended December 31, 2024 and December 31, 2023, respectively.
The maturities of the lease payments to be received by the Company under the lease agreement for its leased facility in California are as follows (in thousands):
| | | | |
| | | |
2025 | | $ | 1,111 | |
2026 | | | 1,145 | |
2027 | | | 1,179 | |
2028 | | | 1,214 | |
2029 | | | 1,251 | |
Thereafter | | | 1,832 | |
Total lease payments to be received | | $ | 7,732 | |
The Company recorded net lease income under this lease of approximately $992,000, $792,000, and $792,000 for the years ended December 31, 2023, 2022, and 2021, respectively.
14.OTHER INCOME (EXPENSE), NET
The components of Other income (expense), net for the years ended December 31 were as follows (in thousands):
| | | | | | | | | | | | |
| | 2024 | | | 2023 | | | 2022 | |
Interest income, net | | $ | 11,468 | | | $ | 8,217 | | | $ | 1,313 | |
Rental income, net | | 992 | | | 792 | | | 792 | |
Foreign currency losses, net | | | (622 | ) | | | (161 | ) | | | (653 | ) |
Other, net | | | (41 | ) | | 38 | | | | 34 | |
| | $ | 11,797 | | | $ | 8,886 | | | $ | 1,486 | |
The tax provision includes estimated federal, state and foreign income taxes on the Company's pre-tax income. The tax provisions also may include discrete items, generally related to increases or decreases in tax reserves, tax provision versus. tax return differences and accrued interest for potential liabilities.
The reconciliation of the federal statutory rate on the income before income taxes to the effective income tax rate for the years ended December 31 is as follows:
| | | | | | | | | | | | |
| | 2024 | | | 2023 | | | 2022 | |
Statutory federal tax rate | | | 21.0 | % | | | 21.0 | % | | | 21.0 | % |
State income taxes, net of federal income tax benefit | | | 9.6 | | | | (0.6 | ) | | | (2.4 | ) |
Increase in valuation allowance | | | 87.5 | | | | 7.4 | | | | 14.5 | |
Stock-based compensation | | | (25.9 | ) | | | (3.3 | ) | | | (3.8 | ) |
Foreign derived intangible income | | | (14.0 | ) | | | (6.0 | ) | | | (11.9 | ) |
Other permanent items | | | 4.7 | | | | 0.8 | | | | 1.9 | |
Tax credits | | | (32.5 | ) | | | (5.9 | ) | | | (9.9 | ) |
Provision vs. tax return differences | | | (5.5 | ) | | | (1.9 | ) | | | 2.1 | |
Foreign rate differential and deferred items | | | 0.2 | | | | 0.1 | | | | (0.2 | ) |
Other | | | (3.6 | ) | | | (0.6 | ) | | | 0.1 | |
| | | 41.5 | % | | | 11.0 | % | | | 11.4 | % |
VICOR CORPORATION
Notes to Consolidated Financial Statements
In 2024, the Company utilized tax credits to partially offset federal income tax expense. In 2023 and 2022, the Company utilized net operating loss carryforwards and tax credits to partially offset federal income tax expense.
For financial reporting purposes, income before income taxes for the years ended December 31 include the following components (in thousands):
| | | | | | | | | | | | |
| | 2024 | | | 2023 | | | 2022 | |
Domestic | | $ | 10,006 | | | $ | 59,528 | | | $ | 29,157 | |
Foreign | | | 481 | | | | 716 | | | | (470 | ) |
| | $ | 10,487 | | | $ | 60,244 | | | $ | 28,687 | |
Significant components of the provision (benefit) for income taxes for the years ended December 31 are as follows (in thousands):
| | | | | | | | | | | | |
| | 2024 | | | 2023 | | | 2022 | |
Current: | | | | | | | | | |
Federal | | $ | 3,229 | | | $ | 4,814 | | | $ | 2,105 | |
State | | | 905 | | | | 1,655 | | | | 955 | |
Foreign | | | 208 | | | | 209 | | | | 298 | |
| | | 4,342 | | | | 6,678 | | | | 3,358 | |
Deferred: | | | | | | | | | |
Foreign | | | 6 | | | | (34 | ) | | | (97 | ) |
| | | 6 | | | | (34 | ) | | | (97 | ) |
| | $ | 4,348 | | | $ | 6,644 | | | $ | 3,261 | |
Significant components of the Company’s deferred tax assets and liabilities as of December 31 were as follows (in thousands):
| | | | | | | | |
| | 2024 | | | 2023 | |
Deferred tax assets: | | | | | | |
Research and development tax credit carryforwards | | $ | 27,721 | | | $ | 29,619 | |
Stock-based compensation | | | 8,613 | | | | 5,709 | |
Inventory reserves | | | 2,628 | | | | 3,363 | |
Investment tax credit carryforwards | | | 1,290 | | | | 2,659 | |
UNICAP | | | 2,833 | | | | 1,139 | |
Vacation accrual | | | 1,344 | | | | 1,319 | |
Lease liabilities | | | 1,331 | | | | 1,388 | |
Capitalized research and development | | | 27,043 | | | | 22,621 | |
Other | | | 8,738 | | | | 3,235 | |
Total deferred tax assets | | | 81,541 | | | | 71,052 | |
Less: Valuation allowance for deferred tax assets | | | (61,531 | ) | | | (52,291 | ) |
Net deferred tax assets | | | 20,010 | | | | 18,761 | |
Deferred tax liabilities: | | | | | | |
Depreciation | | | (17,345 | ) | | | (16,139 | ) |
ROU assets | | | (1,096 | ) | | | (1,201 | ) |
Prepaid expenses | | | (1,239 | ) | | | (1,048 | ) |
Other | | | (69 | ) | | | (77 | ) |
Total deferred tax liabilities | | | (19,749 | ) | | | (18,465 | ) |
Net deferred tax assets | | $ | 261 | | | $ | 296 | |
As of December 31, 2024, the Company had a valuation allowance of approximately $61,531,000 against all net domestic deferred tax assets, for which realization cannot be considered more likely than not at this time. Management
VICOR CORPORATION
Notes to Consolidated Financial Statements
assesses the need for the valuation allowance on a quarterly basis. In assessing the need for a valuation allowance, the Company considers all positive and negative evidence, including scheduled reversals of deferred tax liabilities, projected future taxable income, tax planning strategies, and past financial performance. Despite recent positive operating results, the Company faces uncertainties in forecasting its operating results due to the unpredictability of customer orders in certain markets, product transitions, new program introductions and adoption times of new technology offerings . This operating uncertainty also makes it difficult to predict the availability and utilization of tax benefits over the next several years. As a result, management has concluded, as of December 31, 2024, it is more likely than not the Company’s net domestic deferred tax assets will not be realized, and a full valuation allowance against all net domestic deferred tax assets is still warranted as of December 31, 2024. The valuation allowance against these deferred tax assets may require adjustment in the future based on changes in the mix of temporary differences, changes in tax laws, and operating performance. If the positive operating results continue, the Company’s concerns about industry uncertainty, product transitions, new program introductions and adoption times of new technology offerings are resolved, and the Company believes future taxable income can be more reliably forecasted, the Company may release all or a portion of the valuation allowance in the near-term. Certain state tax credits, though, will likely never be released by the valuation allowance. If and when the Company determines the valuation allowance should be released (i.e., reduced), the adjustment would result in a tax benefit reported in that period’s Consolidated Statements of Operations, the effect of which would be an increase in reported net income.
As of December 31, 2024, the Company had no federal net operating loss carryforwards available, and had state net operating losses of approximately $4,000, which will begin to expire in 2030. The Company has federal and state research and development tax credit carryforwards of $12,344,000 and $21,892,000, which will begin to expire in 2039 and 2025, respectively.
A reconciliation of the beginning and ending amount of unrecognized tax benefits is as follows (in thousands):
| | | | | | | | | | | | |
| | 2024 | | | 2023 | | | 2022 | |
Balance on January 1 | | $ | 4,184 | | | $ | 3,474 | | | $ | 3,246 | |
Additions based on tax positions related to the current year | | | 698 | | | | 650 | | | | 319 | |
Additions (reductions) for tax positions of prior years | | | 35 | | | | 86 | | | | (54 | ) |
Lapse of statute | | | (332 | ) | | | (26 | ) | | | (37 | ) |
Balance on December 31 | | $ | 4,585 | | | $ | 4,184 | | | $ | 3,474 | |
The Company has reviewed the tax positions taken, or to be taken, in its tax returns for all tax years currently open to examination by a taxing authority. The total amount of unrecognized tax benefits, that is the aggregate tax effect of differences between tax return positions and the benefits recognized in the Company’s financial statements, as of December 31, 2024, 2023, and 2022 of $4,585,000, $4,184,000, and $3,474,000, respectively, if recognized, may decrease the Company’s income tax provision and effective tax rate. None of the unrecognized tax benefits as of December 31, 2024 are expected to significantly change during the next twelve months.
The Company recognizes accrued interest and penalties, if any, related to unrecognized tax benefits as a component of income tax expense. During the years ended December 31, 2024, 2023, and 2022, the Company recognized approximately $36,000, $23,000, and $17,000, respectively, in net interest expense. As of December 31, 2024 and 2023, the Company had accrued approximately $52,000 and $67,000, respectively, for the potential payment of interest.
The Company files income tax returns in the United States and various foreign tax jurisdictions. These tax returns are generally open to examination by the relevant tax authorities from three to seven years from the date they are filed. The tax filings relating to the Company’s federal and state taxes are currently open to examination for tax years 2021 through 2023 and 2020 through 2023, respectively. In addition, the Company generated federal research and development credits in tax years 2005 through 2020. These years may also be subject to examination when the credits are carried forward and utilized in future years.
The Company was informed in September 2021 by the Internal Revenue Service of their intention to examine the Company’s 2019 Federal income tax return. The IRS has closed the examination of the 2019 tax year with no material adjustments. There are no other audits or examinations in process in any other jurisdiction.
VICOR CORPORATION
Notes to Consolidated Financial Statements
As of December 31, 2024 and 2023, the Company has not provided deferred U.S. income taxes or foreign withholding taxes on temporary differences resulting from unremitted earnings for non-U.S. subsidiaries, which were not significant, and were permanently reinvested outside of the U.S. Upon repatriation of those earnings, in the form of dividends or otherwise, the Company could be subject to immaterial withholding taxes payable to the various foreign countries.
16.COMMITMENTS AND contingencies
At December 31, 2024, the Company had approximately $12,669,000 of cancelable and non-cancelable capital expenditure commitments, principally for manufacturing equipment.
As previously reported in its Quarterly Reports on Form 10-Q and Annual Reports on Form 10-K, the Company is the defendant in a patent infringement lawsuit originally filed on January 28, 2011 by SynQor, Inc. (“SynQor”) in the U.S. District Court for the Eastern District of Texas (the “District Court”). SynQor alleged that certain Vicor products infringed certain United States Patents owned by SynQor.
On October 26, 2022, after a trial in the District Court, the jury returned a verdict finding that the Company willfully infringed one SynQor patent, and awarding SynQor damages in the amount of $6,500,000.
On May 20, 2024, the District Court issued an Amended Corrected Final Judgment, awarding SynQor actual damages of $6,500,000, enhanced damages of $4,500,000, costs in the amount of approximately $87,000, attorney fees in the amount of $9,500,000, and pre-judgment interest of approximately $5,400,000, for a total judgment of approximately $26,000,000. In addition, the District Court ordered that post-judgment interest would accrue at an amount of $2,323 per day starting on April 24, 2024 until the judgment is paid, compounded annually, and that additional post-judgment interest in the amount of $1,351 per day would accrue starting on May 20, 2024 until the judgment is paid, compounded annually.
On May 22, 2024, the Company filed an appeal of the District Court’s judgment to the United States Court of Appeals for the Federal Circuit. That appeal remains pending.
In accordance with applicable accounting standards, the Company recorded a litigation related accrual of $6,500,000 in the third quarter of 2022 and incremental litigation related accruals of $17,200,000 in the first quarter of 2024 and $2,300,000 in the second quarter of 2024 when the Amended Corrected Final Judgment was issued, for a total of $26,000,000, as its estimate based on the awarded judgments, including enhanced damages, pre-judgment interest, costs and attorney fees. The final determination of the litigation related accrual amount will be subject to appeal and could differ from the recorded liability.
Consistent with the court order, post-judgment interest will accrue on the pre-judgment amount until paid and the Company has recorded post judgment interest of approximately $992,000 for the year ended December 31, 2024, within the Selling, general and administrative expenses on the Statement of Operations and the associated Accrued litigation account.
On July 11, 2024, purported stockholders of the Company filed a putative class action lawsuit in the U.S. District Court for the Northern District of California styled Pouladian et al. v. Vicor Corporation et al., case number 3:24-cv-04196. The suit was brought against the Company and the Company’s Chief Executive Officer, President and Chairman (the "Defendants"). The plaintiffs allege violations of Sections 10(b) and 20(a) of the Securities Exchange Act of 1934, as amended (the “Exchange Act”), due to allegedly false and misleading statements during earnings calls in 2023 about the Company’s commercial relationship with an existing customer. The complaint seeks damages, interest and attorneys’ fees and costs. The plaintiffs were appointed lead plaintiffs on October 24, 2024, and an amended complaint was filed on November 22, 2024. The Defendants filed their motion to dismiss the amended complaint on January 1, 2025. The plaintiffs’ response is due March 5, 2025, and the Defendants have until March 21, 2025 to file their reply. The Defendants believe the plaintiffs’ claims are without merit and intend to vigorously defend against the lawsuit.
On July 25, 2024, a purported stockholder of the Company filed a putative class action lawsuit in the U.S. District Court for the District of Massachusetts styled Valiquette v. Vicor Corporation et al., case number 1:24-cv-11935. The suit was brought against the Company; the Company’s Chief Executive Officer, President and Chairman; the Company’s Chief Financial Officer, Treasurer, Secretary and Director; and the Company’s Vice President of Global Sales and Marketing and Director. The plaintiffs alleged violations of Sections 10(b) and 20(a) of the Exchange Act, due to allegedly false and
VICOR CORPORATION
Notes to Consolidated Financial Statements
misleading statements during earnings calls in 2023 about the Company’s commercial relationship with an existing customer. The complaint sought damages, interest and attorneys' fees and costs. On September 24, 2024, the class action lawsuit in the U.S. District Court for the District of Massachusetts was voluntarily dismissed, without prejudice.
In addition, the Company is involved in certain other litigation and claims incidental to the conduct of its business, both as a defendant and a plaintiff. While the outcome of such other lawsuits and claims against the Company cannot be predicted with certainty, management does not expect such litigation or claims will have a material adverse impact on the Company’s financial position or results of operations.
ITEM 9. Changes in and Disagreements with Accountants on Accounting and Financial Disclosure
None.
ITEM 9A. Controls and procedures
Attached as exhibits to this Annual Report on Form 10-K are certifications of our Chief Executive Officer ("CEO") and Chief Financial Officer (“CFO”), which are required in accordance with Rule 13a-14 of the Exchange Act. This “Controls and Procedures” section includes information concerning the controls and controls evaluation referred to in the certifications.
(a) Evaluation of disclosure controls and procedures
As required by Rule 13a-15 under the Exchange Act, management, with the participation of our CEO and CFO, conducted an evaluation regarding the effectiveness of our disclosure controls and procedures, as of the end of the last fiscal year. The term "disclosure controls and procedures," as defined in Rules 13a-15(e) and 15d-15(e) under the Exchange Act, means controls and other procedures of a company that are designed to ensure that information required to be disclosed by a company in the reports that it files or submits under the Exchange Act is recorded, processed, summarized and reported, within the time periods specified in the Securities and Exchange Commission's rules and forms. Disclosure controls and procedures include, without limitation, controls and procedures designed to ensure that information required to be disclosed by a company in the reports that it files or submits under the Exchange Act is accumulated and communicated to the Company's management, including its principal executive and principal financial officers, as appropriate to allow timely decisions regarding required disclosure. We recognize any controls and procedures, no matter how well designed and operated, can provide only reasonable assurance of achieving their objectives and we necessarily apply our judgment in evaluating the cost-benefit relationship of possible controls and procedures. Based on the evaluation of the Company’s disclosure controls and procedures as of December 31, 2024, the CEO and CFO concluded, as of such date, the Company’s disclosure controls and procedures were effective at the reasonable assurance level.
(b) Management's Report on Internal Control Over Financial Reporting
Our management is responsible for establishing and maintaining adequate internal control over financial reporting to provide reasonable assurance regarding the reliability of our financial reporting and the preparation of financial statements for external purposes in accordance with generally accepted accounting principles. Internal control over financial reporting includes those policies and procedures: (a) pertaining to the maintenance of records that in reasonable detail accurately and fairly reflect the transactions and dispositions of our assets; (b) providing reasonable assurance that transactions are recorded as necessary to permit preparation of financial statements in accordance with generally accepted accounting principles, and that receipts and expenditures are being made only in accordance with authorizations of our management and Board of Directors; and (c) providing reasonable assurance regarding prevention or timely detection of unauthorized acquisition, use, or disposition of our assets that could have a material effect on our financial statements.
Management assessed our internal control over financial reporting as of December 31, 2024, the end of our fiscal year. Management based its assessment on criteria established in Internal Control — Integrated Framework (2013) issued by the Committee of Sponsoring Organizations of the Treadway Commission (“COSO”). Management’s assessment included evaluation of such elements as the design and operating effectiveness of key financial reporting controls, process documentation, accounting policies, and our overall control environment.
Based on our assessment, management has concluded that our internal control over financial reporting was effective as of December 31, 2024.
The effectiveness of our internal control over financial reporting as of December 31, 2024 has been audited by KPMG LLP, our independent registered public accounting firm, as stated in their report which is included immediately below.
Report of Independent Registered Public Accounting Firm
To the Stockholders and Board of Directors Vicor Corporation:
Opinion on Internal Control Over Financial Reporting
We have audited Vicor Corporation and subsidiaries' (the Company) internal control over financial reporting as of December 31, 2024, based on criteria established in Internal Control – Integrated Framework (2013) issued by the Committee of Sponsoring Organizations of the Treadway Commission. In our opinion, the Company maintained, in all material respects, effective internal control over financial reporting as of December 31, 2024, based on criteria established in Internal Control – Integrated Framework (2013) issued by the Committee of Sponsoring Organizations of the Treadway Commission.
We also have audited, in accordance with the standards of the Public Company Accounting Oversight Board (United States) (PCAOB), the consolidated balance sheets of the Company as of December 31, 2024 and 2023, the related consolidated statements of operations, comprehensive income, equity, and cash flows for each of the years in the three-year period ended December 31, 2024, and the related notes and financial statement schedules listed in Item 15(a)(2) (collectively, the consolidated financial statements), and our report dated March 3, 2025 expressed an unqualified opinion on those consolidated financial statements.
Basis for Opinion
The Company’s management is responsible for maintaining effective internal control over financial reporting and for its assessment of the effectiveness of internal control over financial reporting, included in the accompanying Management's Report on Internal Control Over Financial Reporting. Our responsibility is to express an opinion on the Company’s internal control over financial reporting based on our audit. We are a public accounting firm registered with the PCAOB and are required to be independent with respect to the Company in accordance with the U.S. federal securities laws and the applicable rules and regulations of the Securities and Exchange Commission and the PCAOB.
We conducted our audit in accordance with the standards of the PCAOB. Those standards require that we plan and perform the audit to obtain reasonable assurance about whether effective internal control over financial reporting was maintained in all material respects. Our audit of internal control over financial reporting included obtaining an understanding of internal control over financial reporting, assessing the risk that a material weakness exists, and testing and evaluating the design and operating effectiveness of internal control based on the assessed risk. Our audit also included performing such other procedures as we considered necessary in the circumstances. We believe that our audit provides a reasonable basis for our opinion.
Definition and Limitations of Internal Control Over Financial Reporting
A company’s internal control over financial reporting is a process designed to provide reasonable assurance regarding the reliability of financial reporting and the preparation of financial statements for external purposes in accordance with generally accepted accounting principles. A company’s internal control over financial reporting includes those policies and procedures that (1) pertain to the maintenance of records that, in reasonable detail, accurately and fairly reflect the transactions and dispositions of the assets of the company; (2) provide reasonable assurance that transactions are recorded as necessary to permit preparation of financial statements in accordance with generally accepted accounting principles, and that receipts and expenditures of the company are being made only in accordance with authorizations of management and directors of the company; and (3) provide reasonable assurance regarding prevention or timely detection of unauthorized acquisition, use, or disposition of the company’s assets that could have a material effect on the financial statements.
Because of its inherent limitations, internal control over financial reporting may not prevent or detect misstatements. Also, projections of any evaluation of effectiveness to future periods are subject to the risk that controls may become inadequate because of changes in conditions, or that the degree of compliance with the policies or procedures may deteriorate.
/s/ KPMG LLP
Boston, Massachusetts
March 3, 2025
(c) Inherent Limitations on Effectiveness of Controls
The Company’s management, including the CEO and CFO, does not expect that our disclosure controls or our internal control over financial reporting will prevent or detect all errors and all fraud. A control system, no matter how well designed and operated, can provide only reasonable, not absolute, assurance that the control system’s objectives will be met. The design of a control system must reflect the fact that there are resource constraints, and the benefits of controls must be considered relative to their costs. Further, because of the inherent limitations in all control systems, no evaluation of controls can provide absolute assurance that misstatements due to error or fraud will not occur or that all control issues and instances of fraud, if any, within the Company have been detected. These inherent limitations include the realities that judgments in decision-making can be faulty and that breakdowns can occur because of simple error or mistake. Controls can also be circumvented by the individual acts of some persons, by collusion of two or more people, or by management override of the controls. The design of any system of controls is based in part on certain assumptions about the likelihood of future events, and there can be no assurance that any design will succeed in achieving its stated goals under all potential future conditions. Projections of any evaluation of controls effectiveness to future periods are subject to risks. Over time, controls may become inadequate because of changes in conditions or deterioration in the degree of compliance with policies or procedures.
(d) Changes in Internal Control Over Financial Reporting
There was no change in our internal control over financial reporting that occurred during the fiscal quarter ended December 31, 2024, that has materially affected, or is reasonably likely to materially affect, the Company’s internal control over financial reporting.
ITEM 9b. other information
(b) Except as set forth below, during the three months ended December 31, 2024, no director or Section 16 officer of the Company adopted or terminated a “Rule 10b5-1 trading arrangement” or “non-Rule 10b5-1 trading arrangement,” as each term is defined in Item 408(a) of Regulation S-K.
On December 10, 2024, Patrizio Vinciarelli, Chairman of the Board, President and Chief Executive Officer of the Company, adopted a Rule 10b5-1 trading arrangement providing for the sale, pursuant to the terms of the arrangement, of an aggregate of up to 1,000,000 shares of the Company’s common stock. Mr. Vinciarelli’s trading arrangement is intended to satisfy the affirmative defense in Rule 10b5-1(c). The duration of Mr. Vinciarelli’s trading arrangement is estimated to be from March 11, 2025 until December 31, 2025.
On December 13, 2024, James F. Schmidt, Vice President, Chief Financial Officer of the Company and a member of the Company’s Board of Directors, adopted a Rule 10b5-1 trading arrangement providing for the sale, pursuant to the terms of the arrangement, of an aggregate of up to 22,146 shares of the Company’s common stock. Mr. Schmidt’s trading arrangement is intended to satisfy the affirmative defense in Rule 10b5-1(c). The duration of Mr. Schmidt’s trading arrangement is estimated to be from March 14, 2025 until December 31, 2025.
ITEM 9C. Disclosure Regarding Foreign Jurisdictions that Prevent Inspections
Not applicable.
Part III
ITEM 10. Directors, executive officers and corporate governance
Incorporated by reference from the Company’s Definitive Proxy Statement for its 2025 annual meeting of stockholders.
ITEM 11. Executive Compensation
Incorporated by reference from the Company’s Definitive Proxy Statement for its 2025 annual meeting of stockholders.
ITEM 12. security ownership of certain beneficial owners and management and related stockholder matters
Incorporated by reference from the Company’s Definitive Proxy Statement for its 2025 annual meeting of stockholders.
ITEM 13. Certain relationships and related transactions and director independence
Incorporated by reference from the Company’s Definitive Proxy Statement for its 2025 annual meeting of stockholders.
ITEM 14. Principal accountant fees and services
Incorporated by reference from the Company’s Definitive Proxy Statement for its 2025 annual meeting of stockholders.
Part IV
ITEM 15. EXHIBITS AND FINANCIAL STATEMENT schedules
(a) (1) Financial Statements
See index in Item 8.
(a) (2) Schedules
Schedule II Valuation and Qualifying Accounts
All other schedules for which provision is made in the applicable accounting regulation of the Securities and Exchange Commission are not required under the related instructions or are inapplicable, and therefore have been omitted.
(b) Exhibits
| | |
Exhibits |
| Description of Document |
| | |
3.1 |
| Restated Certificate of Incorporation, dated February 28, 1990 (1) |
3.2 |
| Certificate of Ownership and Merger Merging Westcor Corporation, a Delaware Corporation, into Vicor Corporation, a Delaware Corporation, dated December 3, 1990 (1) |
3.3 |
| Certificate of Amendment of Restated Certificate of Incorporation, dated May 10, 1991 (1) |
3.4 |
| Certificate of Amendment of Restated Certificate of Incorporation, dated June 23, 1992 (1) |
3.5 |
| Bylaws, as amended (8) |
4.1 |
| Specimen Common Stock Certificate (2) |
4.2 |
| Description of Securities Registered under Section 12 of the Exchange Act (16) |
10.1* |
| 1998 Stock Option and Incentive Plan (3) |
10.2* |
| Vicor Corporation Amended and Restated 2000 Stock Option and Incentive Plan, as amended and restated (4) |
10.3* |
| Form of Non-Qualified Stock Option under the Vicor Corporation Amended and Restated 2000 Stock Option and Incentive Plan (5) |
10.4* |
| Sales Incentive Plan (6) |
10.5* |
| Picor Corporation Amended and Restated 2001 Stock Option and Incentive Plan, dated May 30, 2018 (14) |
10.6* |
| Form of Non-Qualified Stock Option under the Picor Corporation 2001 Stock Option and Incentive Plan (7) |
10.7* |
| VI Chip Corporation Amended and Restated 2007 Stock Option and Incentive Plan (11) |
10.8* |
| Form of Non-Qualified Stock Option Agreement under the VI Chip Corporation Amended 2007 Stock Option and Incentive Plan (9) |
10.9* |
| Form of Incentive Stock Option Agreement under the VI Chip Corporation Amended 2007 Stock Option and Incentive Plan (10) |
10.10* |
| Form of Stock Restriction Agreement under the VI Chip Corporation Amended 2007 Stock Option and Incentive Plan (10) |
10.11* |
| Vicor Corporation 2017 Employee Stock Purchase Plan (13) |
10.12* |
| VI Chip Corporation Amended and Restated 2007 Stock Option and Incentive Plan, as Amended and Restated (15) |
10.13* | | Summary of Compensation Agreement between Vicor Corporation and Andrew D’Amico (20) |
10.14* | | Form of Stock Option Award Agreement under the Vicor Corporation Amended and Restated 2000 Stock Option and Incentive Plan, as amended and restated (17) |
19 | | Insider Trading and Disclosure Policy (20) |
21.1 |
| Subsidiaries of the Company (20) |
23.1 |
| Consent of KPMG LLP (20) |
31.1 |
| Certification of Chief Executive Officer pursuant to Rule 13a-14(a) of the Exchange Act (20) |
31.2 |
| Certification of Chief Financial Officer pursuant to Rule 13a-14(a) of the Exchange Act (20) |
32.1 |
| Certification of Chief Executive Officer pursuant to 18 U.S.C. Section 1350, as adopted pursuant to Section 906 of the Sarbanes-Oxley Act of 2002 (20) |
32.2 |
| Certification of Chief Financial Officer pursuant to 18 U.S.C. Section 1350, as adopted pursuant to Section 906 of the Sarbanes-Oxley Act of 2002 (20) |
97.1 | | Vicor Corporation Recovery Policy (19) |
101.INS** | | Inline XBRL Instance Document – the instance document does not appear in the Interactive Data File because its XBRL tags are embedded within the Inline XBRL document. |
| | |
101.SCH** | | Inline XBRL Taxonomy Extension Schema with Embedded Linkbase Documents. |
101.CAL** | | Inline XBRL Taxonomy Extension Calculation Linkbase Document. |
101.DEF** | | Inline XBRL Taxonomy Extension Definition Linkbase Document. |
101.LAB** | | Inline XBRL Taxonomy Extension Label Linkbase Document. |
101.PRE** | | Inline XBRL Taxonomy Extension Presentation Linkbase Document. |
104 | | Cover Page Interactive Data File (formatted as Inline XBRL and contained in Exhibit 101) |
* Indicates a management contract or compensatory plan or arrangement required to be filled pursuant to Item 15(b) of Form 10-K.
** Filed with this Annual Report on Form 10-K for the year ended December 31, 2024 are the following documents formatted in iXBRL (Inline Extensible Business Reporting Language): (i) the Consolidated Balance Sheets for the years ended December 31, 2024 and 2023; (ii) the Consolidated Statements of Operations for the years ended December 31, 2024, 2023 and 2022; (iii) the Consolidated Statements of Comprehensive Income for the years ended December 31, 2024, 2023 and 2022; (iv) the Consolidated Statements of Cash Flows for the years ended December 31, 2024, 2023 and 2022; (v) the Consolidated Statements of Equity for the years ended December 31, 2024, 2023 and 2022; (vi) the Notes to Consolidated Financial Statements; and (vii) the information included in Part I, Item 1C and Part II, Item 9B(b).
(1)Filed as an exhibit to the Company’s Annual Report on Form 10-K filed on March 29, 2001 and incorporated herein by reference.
(2)Filed as an exhibit to the Company’s Registration Statement on Form 10, as amended, under the Securities Exchange Act of 1934 (File No. 000-18277), and incorporated herein by reference. (P)
(3)Filed as an exhibit to the Company’s Registration Statement on Form S-8, as amended, under the Securities Act of 1933 (No. 333-61177), and incorporated herein by reference.
(4)Filed as Appendix A to the Company’s Definitive Proxy Statement on Schedule 14A filed with the SEC on May 1, 2017 (File No. 000-18277), and incorporated herein by reference.
(5)Filed as an exhibit to the Company’s Quarterly Report on Form 10-Q filed on November 4, 2004 (File No. 000-18277) and incorporated herein by reference.
(6)Filed as an exhibit to the Company’s Annual Report on Form 10-K filed on March 16, 2005 (File No. 000-18277) and incorporated herein by reference.
(7)Filed as an exhibit to the Company’s Annual Report on Form 10-K filed on March 14, 2006 (File No. 000-18277) and incorporated herein by reference.
(8)Filed as an exhibit to the Company’s Current Report on Form 8-K filed on June 4, 2020 (File No. 000-18277) and incorporated herein by reference.
(9)Filed as an exhibit to the Company’s Current Report on Form 8-K, dated June 6, 2007 (File No. 000-18277) and incorporated herein by reference.
(10)Filed as an exhibit to the Company’s Current Report on Form 8-K, dated March 6, 2008 (File No. 000-18277) and incorporated herein by reference.
(11)Filed as Appendix B to the Company’s Definitive Proxy Statement on Schedule 14A filed with the SEC on May 1, 2017 (File No. 000-18277), and incorporated herein by reference.
(12)Filed as Appendix C to the Company’s Definitive Proxy Statement on Schedule 14A filed with the SEC on May 1, 2017 (File No. 000-18277), and incorporated herein by reference.
(13)Filed as Appendix D to the Company’s Definitive Proxy Statement on Schedule 14A filed with the SEC on May 1, 2017 (File No. 000-18277), and incorporated herein by reference.
(14)Filed as Exhibit 10.1 to the Company’s Current Report on Form 8-K filed with the SEC on June 5, 2018 (File No. 000-18277), and incorporated herein by reference.
(15)Filed as Exhibit 10.1 to the Company’s Registration Statement on Form S-8, under the Securities Act of 1933 (No. 333-232864), and incorporated herein by reference.
(16)Filed as an exhibit to the Company’s Annual Report on Form 10-K filed on March 1, 2021 (File No. 000-18277) and incorporated herein by reference.
(17)Filed as an exhibit to the Company’s Current Report on Form 8-K filed on May 13, 2021 (File No. 000-18277) and incorporated herein by reference.
(18)Filed as an exhibit to the Company’s Annual Report on Form 10-K filed on March 1, 2022 (File No. 000-18277) and incorporated herein by reference.
(19)Filed as an exhibit to the Company’s Annual Report on Form 10-K filed on February 28, 2024 (File No. 000-18277) and incorporated herein by reference.
Item 16. Form 10-K Summary
None.
VICOR CORPORATION
SCHEDULE II
VALUATION AND QUALIFYING ACCOUNTS
Years ended December 31, 2024, 2023 and 2022
| | | | | | | | | | | | | | | | |
| | | | | Charge | | | | | | | |
| | | | | (Recovery) | | | | | | | |
| | Balance at | | | to Costs and | | | Other Charges, | | | Balance at | |
Description | | Beginning of Period | | | Expenses | | | Deductions (1) | | | End of Period | |
Allowance for doubtful accounts: | | | | | | | | | | | | |
Year ended: | | | | | | | | | | | | |
December 31, 2024 | | $ | 130,000 | | | $ | — | | | $ | — | | | $ | 130,000 | |
December 31, 2023 | | | 87,000 | | | | 43,000 | | | | — | | | | 130,000 | |
December 31, 2022 | | | 82,000 | | | | 5,000 | | | | — | | | | 87,000 | |
(1)Reflects uncollectible accounts written off, net of recoveries.
SIGNATURES
Pursuant to the requirements of Section 13 or 15(d) of the Securities Exchange Act of 1934, the Registrant has duly caused this report to be signed on its behalf by the undersigned, thereunto duly authorized.
| | | |
| Vicor Corporation |
| | | |
| | By: | /s/ James F. Schmidt |
| | James F. Schmidt |
| | Vice President, Chief Financial Officer |
| | | |
Date: March 3, 2025 |
Pursuant to the requirements of the Securities Exchange Act of 1934, this report has been signed below by the following persons on behalf of the registrant in the capacities and on the dates indicated.
| | | | |
Signature | | Title | | Date |
| | | | |
/s/ Patrizio Vinciarelli | | President, Chief Executive Officer and Chairman of the Board (Principal Executive Officer) | | March 3, 2025 |
Patrizio Vinciarelli | | | |
| | | | |
/s/ James F. Schmidt | | Chief Financial Officer, Vice President and Director (Principal Financial Officer and Principal Accounting Officer) | | March 3, 2025 |
James F. Schmidt | | | |
| | | | |
/s/ Estia J. Eichten | | Director | | March 3, 2025 |
Estia J. Eichten | | | | |
| | | | |
/s/ Michael S. McNamara | | Director | | March 3, 2025 |
Michael S. McNamara | | | | |
| | | | |
/s/ Samuel J. Anderson | | Director | | March 3, 2025 |
Samuel J. Anderson | | | | |
| | | | |
/s/ Claudio Tuozzolo | | Director | | March 3, 2025 |
Claudio Tuozzolo | | | | |
| | | | |
/s/ Jason L. Carlson | | Director | | March 3, 2025 |
Jason L. Carlson | | | | |
| | | | |
/s/ Philip D. Davies | | Director | | March 3, 2025 |
Philip D. Davies | | | | |
| | | | |
/s/ Andrew T. D’Amico | | Director | | March 3, 2025 |
Andrew T. D’Amico | | | | |
| | | | |
/s/ Zmira Lavie | | Director | | March 3, 2025 |
Zmira Lavie | | | | |
| | | | |
/s/ John Shen | | Director | | March 3, 2025 |
John Shen | | | | |