Exhibit 99.2

Fourth Quarter/Fiscal 2008
Earnings Conference Call
March 2, 2009
Forward Looking Statements
This presentation contains forward-looking statements regarding the Company's
prospects, including the outlook for tanker and articulated tug barge markets, the
outcome of negotiations with Aker and Bender, changing oil trading patterns,
anticipated levels of newbuilding and scrapping, prospects for certain strategic
alliances and investments, prospects for the growth of the OSG Gas transport
business, estimated TCE rates and synthetic TCE rates achieved for 2009,
projected drydock and repair schedule, timely delivery of newbuildings in
accordance with contractual terms, credit risks of counterparties including
charterers, suppliers and shipyards and the impact this may have on OSG and
prospects of OSG’s strategy of being a market leader in the segments in which it
competes. Factors, risks and uncertainties that could cause actual results to differ
from the expectations reflected in these forward-looking statements are described in
the Company’s Annual Report for 2008 on Form 10-K.
Extraordinary Times OSG
A balanced growth strategy has positioned OSG to handle the
extraordinary difficult economic times we are operating in
Today and beyond, we can focus on running our ships flawlessly, optimizing our
commercial management and servicing our customers
Balance sheet strength, liability management and healthy liquidity
means OSG can manage a prolonged downturn in the markets
OSG’s portfolio – a combination of time charters, FFA coverage, COA
business and cargo systems – will enable us to remain cash flow
positive and profitable
Well-positioned for an expected weak 2009 tanker market
The U.S. Flag unit’s performance has been disappointing
Decisive actions underway to turn it around
Extraordinary Times The Market
Single hull phase-out
Scrapping 98 remaining single hull VLCCs will spark a recovery in tanker rates in
2010
The lack of available bank financing will profoundly impact the tanker
orderbook
The orderbook is not static. A much healthier market could result
Banking system problems will create enormous opportunities for
strong shipping companies in the next few years
Patience and discipline will be key
When the global economy recovers, OSG will emerge as one of the
clear winners in the tanker trades
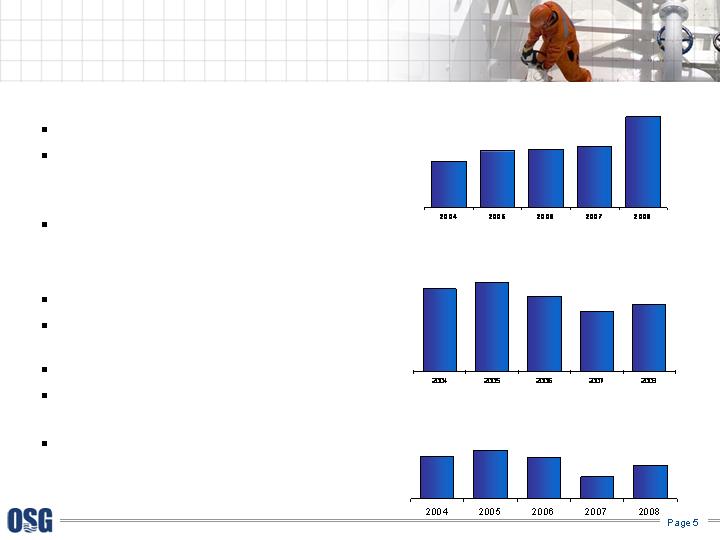
Strong Financial Performance
TCE revenues up 49% to $1.5B
$318M net income includes noncash
goodwill and asset impairment charges
on 4 ATBs of $168M
Net income and EPS more than doubled
Adjusted net income $449M1
Adjusted EPS $13.831
Cash generated from operations $367M
4.5 million shares repurchased
14.4%, for $259M
$45M dividends paid
$1.5B total liquidity
Cash as of Feb-27 $500M
36.8% liquidity-adjusted debt to cap
1See reconciling items on page 22.
$790
$962
$993
$1,039
$1,546
TCE Revenues
EBITDA
$211
$401
$465
$393
$318
Net Income
$655
$706
$595
$476
$530
$ in millions
$ in millions
$ in millions

A Platform of Commercial Excellence
$38K
$47K
Suezmax
4Q07
4Q08
$21K
$26K
Handysize
$30K
$36K
Panamax
$30K
$45K
LR1
$25K
$34K
Aframax
$35K
$57K
VLCC
4Q08 Average TCE Spot Rates/Day
$38K
$50K
Suezmax
FY07
FY08
$28K
$27K
Handysize
$32K
$36K
Panamax
$28K
$39K
LR1
$30K
$44K
Aframax
$43K
$92K
VLCC
2008 Average TCE Spot Rates/Day
Cargo is king, especially in weak markets
OSG has more COA business than any competitor through the 5 pools
we operate
Scale matters
Commercial pools
Improved laden to ballast ratios
Beating the competition on results
Scale makes us more important to clients and brokers giving us an
information advantage
Scale enables us to build cargo systems
New business derived from partners / customers
Unipec (China), Flopec (Ecuador), SONAP (Chile), PDV and Citgo
(Venezuela)
Korea Line from TI is also a partner in CPI
Ultragas from PI is also a partner in CPI
Seaarland from AI is also a partner in SI
Best-in-class platform leads to higher margin projects /
business
Superior commercial operations =
outperforming the competition
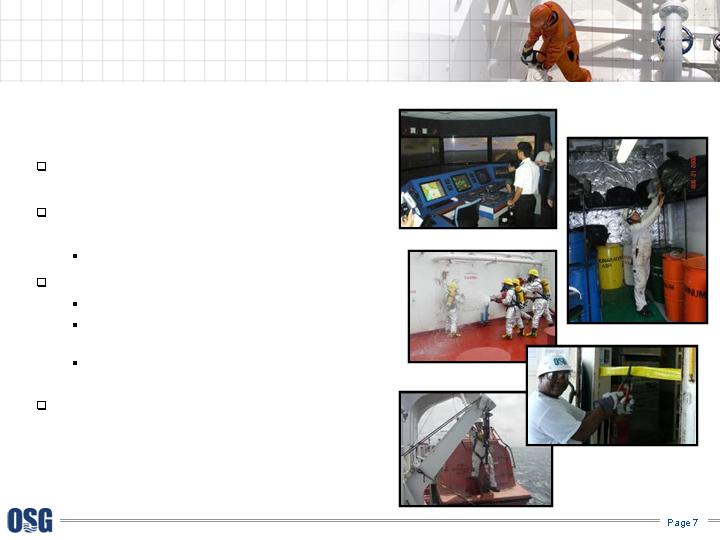
A Platform of Technical Excellence
OSG remains strongly committed to best-
in-class in-house technical management
Weaker markets will benefit the better
operators
Vetted and approved by all the oil majors
Tenacious focus yields results
Crew retention: U.S. mariners 90%, Int’l 97%
Improved training programs: dedicated facilities
in Manila and Tampa
Long-term commitment to sea staff and clients
is paying off
The cost of regulatory compliance will
continue to escalate: those that fail to plan
for this can plan to fail
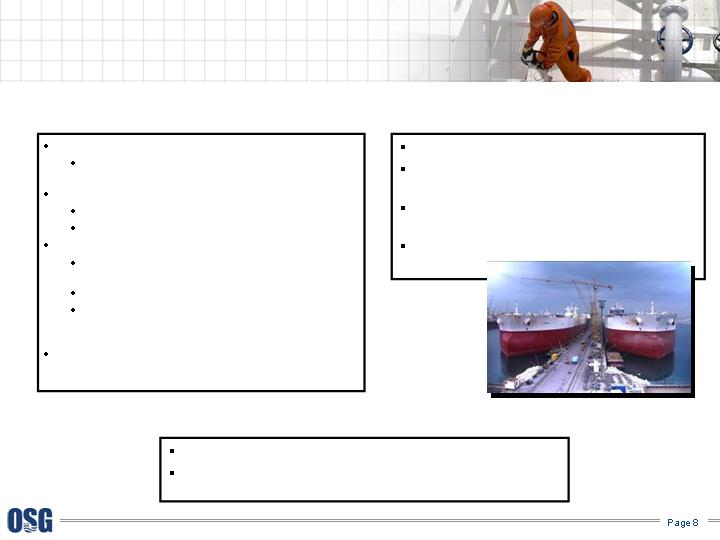
2009 Key Events
Sale of Donna generated $77M gain in Q109
FSO project on schedule and very healthy
returns
Lightering is contract-oriented business and
a good hedge in weaker markets
Tight control and emphasis on daily running
costs
MR expansion 2009-2011
9 vessels total, 2 already delivered and entered CPI
Pool.
CPI Pool Expansion 2009
2 additional vessels: Ya-Sa (Jan); Ultragas (May)
Total 12 vessels in pool
LR1 Expansion 2009-2011
3 currently trading in PI pool to take advantage of pool’s
strong earnings
1 delivers in March and will enter PI pool
Ongoing evaluation of clean and dirty markets in 2010-
2011 to determine best trades to obtain the highest
returns
Bottom line: Fleet replacement program improves profit on
11 vessels redelivering in 2009 by approx. $4,500 per day, or
$1.6M per year per vessel adding $18M to the bottom line.
Crude
Products
U.S. Flag
6 Aker ships trading
Higher-yielding Aker vessels deliver through Q1 2011,
including 2 shuttle tankers
TI Africa and TI Asia in Dubai
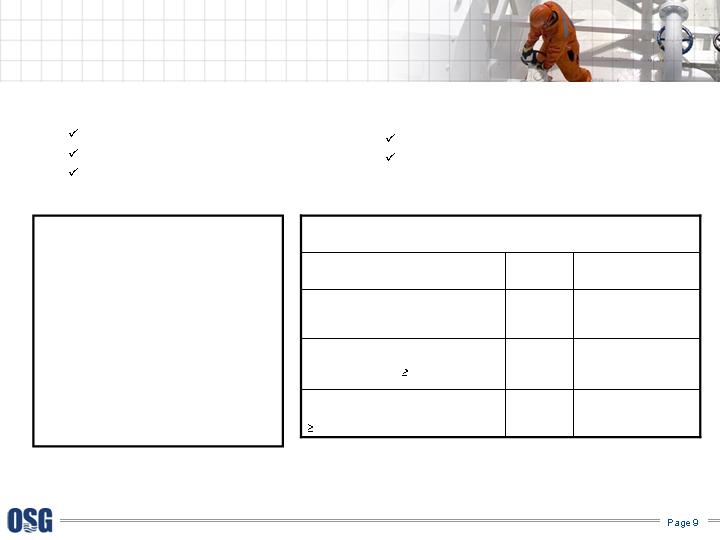
Liquidity / Bank Commitments
299%
$2.4B
36%
23%
$965M debt on
$1.4B of vessels
$1.2B in losses or
shareholder
distributions
$963M
add’l debt
$279M
add’l secured debt
Minimum Net Worth
Tangible net worth $1.2B
Minimum Unencumbered Assets
Tangible assets to unsecured debt
150%
Maximum Leverage
Funded indebtedness to total
capitalization <60%
Limit on Secured Debt
Maximum 30%
Well-positioned to capitalize on opportunities
without going to the equity or debt markets
for funding
Unsecured revolving facilities $794
Public debt 220
Secured term loans 408
Total 1,422
Less current debt
Long-term debt outstanding $1,396
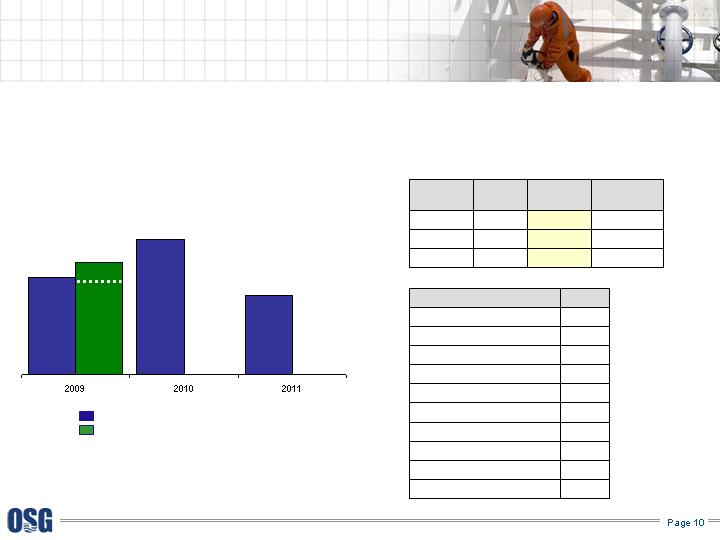
Debt Obligations
Debt Amortization per Annum
2009 2010 2011
$26.2$29.7$33.3
Covenants on $1.8B facility
$ in millions
Capacity
Predominantly unsecured borrower
Back-end liability structure
Low level of capital commitments in 2009
No loan to collateral maintenance clauses
Uniform covenants on facilities
(26)
As of Dec. 31 2008
2009 Liquidity Position Expected to be Similar to 2008
Note: minimum unencumbered asset capacity assumes 70% advance rate
10
9
10
Total
4
6
2009
Chartered-
in
Owned
Vessel
Deliveries
4
6
2011
4
5
2010
Fleet Development / Commitments
Cash from operations, asset sales and debt capacity
provide ample newbuild funding coverage
$256M
$357M
$209M
Newbuild Commitments / Funding
As of Feb. 20, 2009
$296M
Newbuilding capital requirements
Proceeds from asset sales + CCF
121
As of 12/31/11
10
Deliveries
(6)
Redeliveries
10
Deliveries
112
As of 12/31/09
(4)
Redeliveries
120
Operating Fleet as of 2/20/09
(18)
Redeliveries
9
Deliveries
117
Total
Fleet Development
As of 12/31/10
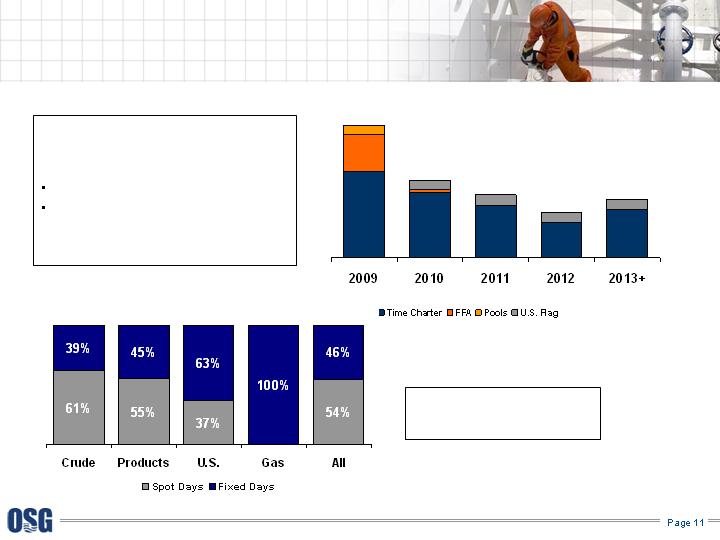
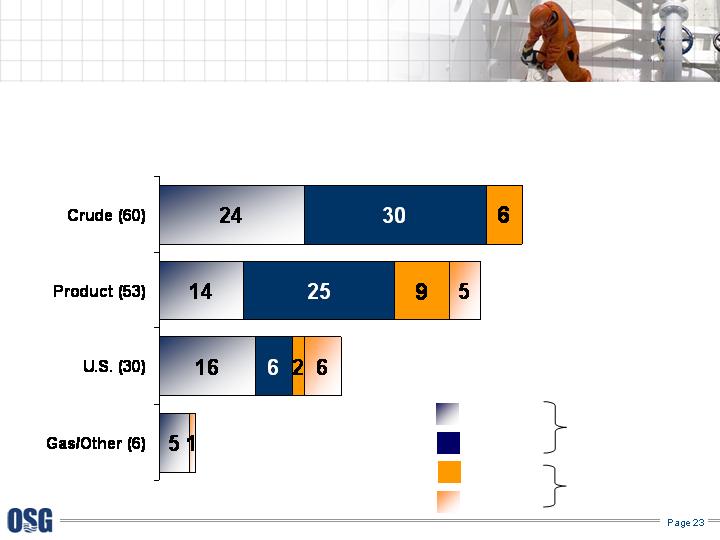
Contract Portfolio
2009 Portfolio Mix
(in revenue days)
$507M
$299M
$242M
$174M
$479
Portfolio of
Contractual Business
$507M1 fixed revenue in 2009
LNG and FSO joint venture projects
to generate $77M in fixed revenues
in 2009
1Excludes gas revenue days as gas revenue is reported in Equity in Income of Affiliated Companies.
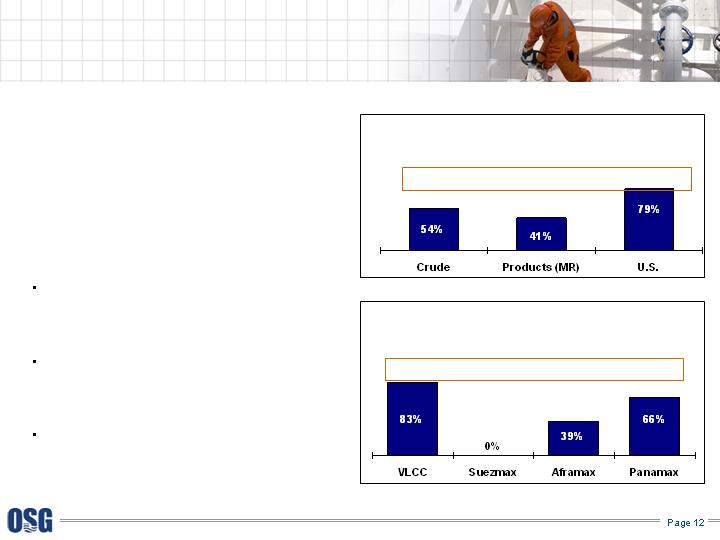
Fixed Revenue / Cash Expense Coverage
2009 contracted revenue provides
stable cash flow covering a significant
portion of cash expenditures
54% of Crude cash expenditures are
covered by fixed revenue requiring
$20K/day to be earned on open days to
cover balance of cash expenditures
41% of Product (MR) cash expenditures
arecovered by fixed revenue requiring
$20K/day to be earned on open days to
cover balance of cash expenditures
79% of U.S. Flag cash expenditures are
covered by fixed revenue
$12K/day $45K/day $22K/day $9K/day
$20K/day $20K/day $17K/day
Rates required per day to cover cash expenditures are net of fixed revenue earned and include vessel operating expenses, charter-in expenses
(cash basis), drydock cost, allocated G&A, debt amortization and interest expense.
By Operating Segment
By Crude Vessel Class
In 2009, 57% of cash opex is
covered by fixed revenue
Financial Review
Myles R. Itkin
Chief Financial Officer
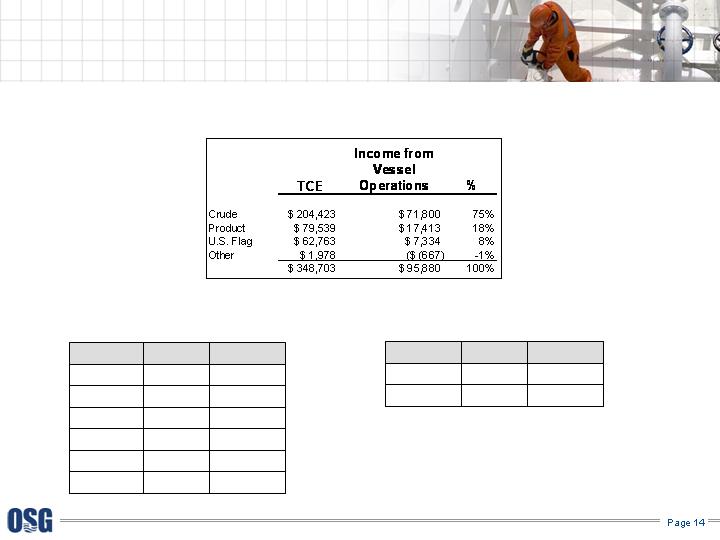
Rate Performance
TCE Revenues / Income from Vessel Ops
$38K
$47K
Suezmax
4Q07
4Q08
$21K
$26K
Handysize
$30K
$36K
Panamax
$30K
$45K
LR1
$25K
$34K
Aframax
$35K
$57K
VLCC
4Q08 Average TCE Spot Rates/Day
4,473
6,054
Days
Fixed
Spot
39%
61%
%
Spot/Fixed Mix
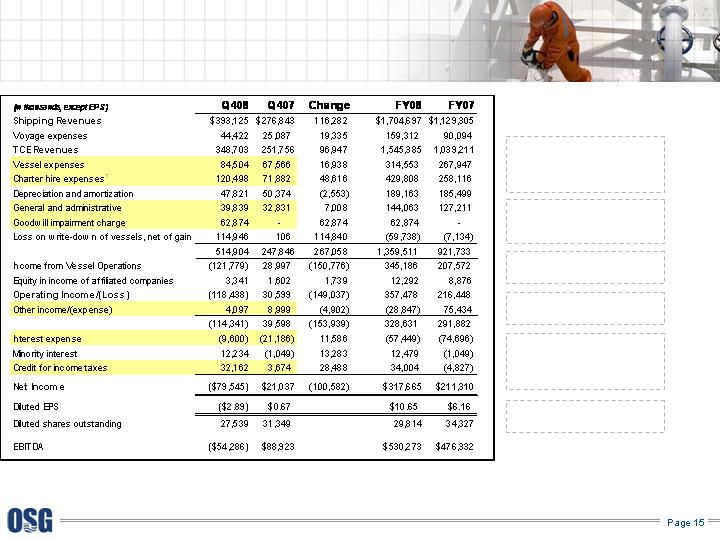
Financial Review – Income Statement
39% increase due to spot rates
increases VLCCs (+60%) and
Aframaxes (+38%); 1,240
increase in revenue days
10 additional chartered-in ships
and $9M increase in profit share
expense
Goodwill impairment on U.S.
Flag operations
$105M write-down on 4 ATBs;
Q109 write-down $20 to $35M
$6.5M in lower interest income
offset by $2.7M favorable gains
on derivatives that do not qualify
for hedge accounting
$33M tax benefit resulting from
write-down on vessels
Supplemental information detailing specific items affecting net income for fourth quarters and
fiscal years 2008 and 2007 is available in the Appendix (page 22) and on the Investor Relations
Webcasts and Presentations section of www.osg.com.
1For detail of charter-hire expense, see Appendix “Charter Hire Expense by Segment.”
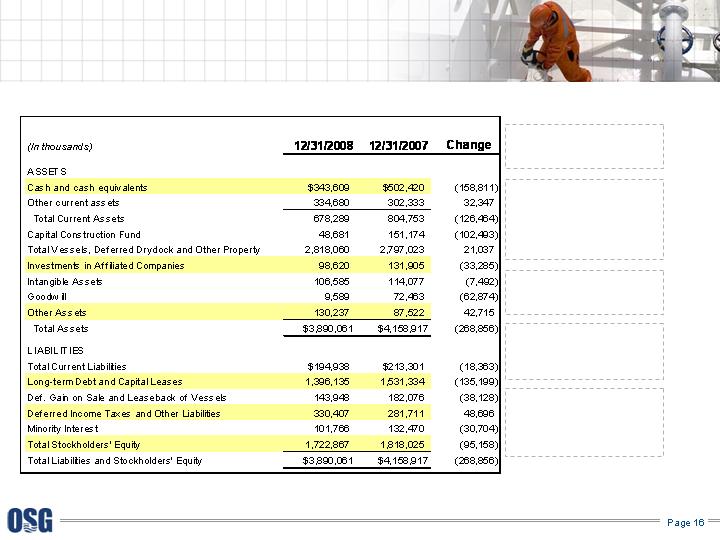
Financial Review – Balance Sheet
$545 repatriation of foreign cash
used to pay down debt and
purchase treasury stock
Investment in JVs reflects
decrease of $94M due to mark-
to-market losses on interest rate
swaps; offset by an increase of
$88M related to FSO JV
investment
Other assets in 2008 includes
$69M related to margin call on
derivatives positions
$545M repatriation of foreign
cash used to pay down debt;
offset by funding of share
repurchases
Equity reflects $318M net
income; offset by $259M stock
repurchases, $45M dividends
and $118M in losses on
interest rate swaps

2009 Guidance
Estimated vessel expenses
$300M to $320M
Time and bareboat charter hire expenses
$415M to $435M
Depreciation and Amortization
$175M to $195M
G&A
$125M to $130M
Equity income of affiliated companies
$12 to $16M
Other income, net of interest expense
Interest expense approx. $55M to $65M
Other income, net of derivative transactions, $8M to $10M
Taxes
Approx. <$5M
Capital Expenditures
$35M in drydock costs (Q1 $7M; Q2 $17M Q3 $7M and Q4 $4M)
$286M newbuild progress payments, vessel improvements and capitalized interest in
2009 (Q1 $80M; Q2 $52M Q3 $62M and Q4 $92M)

Morten Arntzen – Wrap up
Built for the Positive Momentum in 2010
Our balance sheet strength, strong liquidity and superior liability management means that we
can focus on running the business well, taking advantage of opportunities and reducing
costs, not on meeting with our banks for covenant or maturity relief
Product tanker segment redelivers 9 old double sided problem tankers by July 6, 2009 and
eliminates the drag on earnings they represent
In 2010 we will get a full year contribution from the FSOs stationed in Qatar
By the middle of 2010, we will have 6 more of the Aker ships deliver, all with terms and all
higher rates than the first 5
Our U.S. Gulf lightering business, which we acquired to provide stable contract revenues in
weaker markets, should do just that in 2009 and with greater market share is well-positioned
for 2010.
The crude tanker fleet will benefit from the single-hull phase out in 2010
The banking crisis will both winnow down the newbuilding orderbook and create
opportunities for the strong companies with liquidity and real operating platforms
We have already identified $15M of G&A cuts in 2009 and intend to make further progress in
the coming two years
OSG will be a winner in this difficult environment
An invitation to investors to join OSG
management at the Company’s
Annual Investor Event
New York
May 21, 2009
Contact: Jennifer Schlueter

Appendix

Reconciliation and Supplemental Information
EBITDA
EBITDA represents operating earnings, which is before interest expense and
income taxes, plus other income and depreciation and amortization expense.
EBITDA is presented to provide investors with meaningful additional
information that management uses to monitor ongoing operating results and
evaluate trends over comparative periods. EBITDA should not be considered
a substitute for net income or cash flow from operating activities prepared in
accordance with accounting principles generally accepted in the United States
or as a measure of profitability or liquidity. While EBITDA is frequently used as
a measure of operating results and performance, it is not necessarily
comparable to other similarly titled captions of other companies due to
differences in methods of calculation.
TCE Revenues
Consistent with general practice in the shipping industry, the Company uses time charter
equivalent revenues, which represents shipping revenues less voyage expenses, as a
measure to compare revenue generated from a voyage charter to revenue generated
from a time charter. Time charter equivalent revenues, a non-GAAP measure, provides
additional meaningful information in conjunction with shipping revenues, the most
directly comparable GAAP measure, because it assists Company management in
making decisions regarding the deployment and use of its vessels and in evaluating their
financial performance.
Specific Items Affecting Net Income
Set forth below are significant items of income and expense that affected the Company’s net income for the three and twelve months ended December 31, 2008 and 2007, all of which
items are typically excluded by securities analysts in their published estimates of the Company’s financial results
Fiscal Year Ended Dec. 31,
Three Months Ended Dec. 31,
$1,129,305
$1,704,697
$276,843
$393,125
Shipping Revenues
90,094
159,313
25,087
44,422
Add: Voyage expenses
$1,039,211
$1,545,384
$251,756
$348,703
Time charter equivalent revenues
2007
2008
2007
2008
$ in thousands
(in thousands, except EPS)
$
$ Per Share
$
$ Per Share
$
$ Per Share
$
$ Per Share
(Gain)/loss on sales of vessels
$1,081
$0.04
$ -
-
($77,970)
($2.62)
($7,134)
($0.21)
Write-down on vessels held for sale
8,754
0.20
(1)
-
-
32,597
0.60
Asset impairment
105,111
3.18
-
-
105,111
2.93
-
-
(Gain)/loss on sale of securities
1,087
0.03
-
-
1,269
0.03
(41,173)
(0.78)
Goodwill impairment
62,874
2.28
-
-
62,874
2.11
-
-
Unrealized derivative activity
(8,289)
(0.30)
-
-
(2,137)
(0.07)
-
-
Redemption of 8.25% Senior Notes
-
-
9,415
0.20
-
-
Total
$170,618
$5.42
(2)
$ -
$0.00
$131,159
$3.18
($48,307)
($0.99)
Reported Net Income / EPS
($79,545)
($2.89)
$21,037
$0.67
317,665
$
$10.65
$211,310
$6.16
Adjusted Net Income / EPS
$91,073
(3)
$2.53
(3)
$21,037
$0.67
448,824
$
$13.83
$163,003
$5.17
(1) The $8.7 million vessel writedown is made up of $1.8M on the Integrity and $6.9M on the OSG 300. The calculation deducts 22.9% minority interest on the Integrity and is tax effected ($6.9M+$1.8*.771)*.65
(2) Rounding effect
(3) 4Q08 net income includes a $32.2M tax benefit, which includes $21.1M related to the vessel write-downs and write-down on asset held for sale
Fiscal Year Ended
Dec. 31, 2008
Twelve Months Ended
Dec. 31, 2007
Three Months Ended
Dec. 31, 2008
Three Months Ended
Dec. 31, 2007
114,946
Owned
Chartered-in
Owned
Chartered-in
120 OPERATING
29 NEWBUILD/
CONVERSIONS
59
61
17
12
As of February 20, 2009
Fleet Snapshot
1
1Includes 2 ships in layup
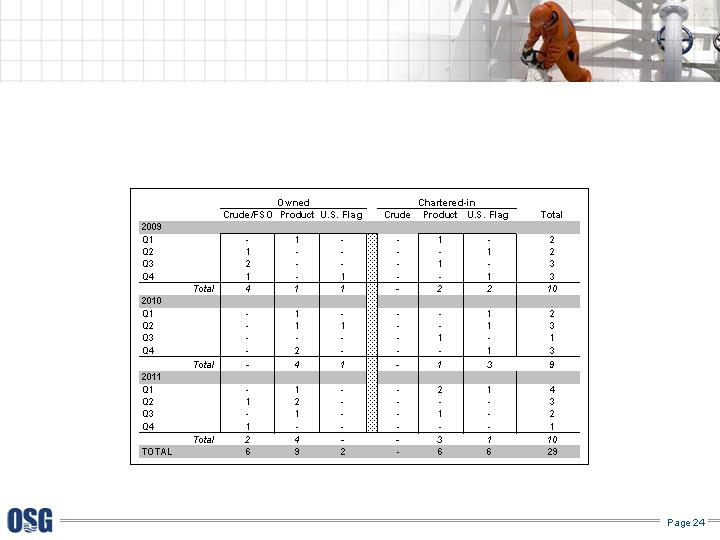
Vessel Delivery Schedule
As of February 20, 2009
An excel spreadsheet of OSG’s full fleet, including delivery date information, can be found on www.osg.com.

Charter Hire Expense by Segment
For the Quarter Ended December 31, 2008

Charter Hire Expense by Segment
For the Fiscal Ended December 31, 2008

Future Revenue $/Days by Segment
Locked-in Time Charter
Days by Segment
Locked-in Time Charter
Revenue by Segment
Locked-in
Charter Revenue
www.osg.com