Overseas Shipholding Group, Inc. - Ordinary Shares (OSG)
Filed: 12 Jun 14, 12:00am
Exhibit 99.1
Sources and Uses of Funds
The following table sets forth the estimated sources and uses of the Transaction:
Sources And Uses ($Millions)
Sources and Uses
| Sources of Cash Funds | Uses of Cash Funds | |||||||||
| New $75.0 million OBS ABL Revolver | $ | - | IRS Settlement | $ | 270.0 | |||||
| New $75.0 million OIN Revolver | - | Charter Rejection Claims | 292.0 | |||||||
| New OBS Senior Secured TL | 600.0 | Repayment of Debt & Accrued Interest | 2,309.0 | |||||||
| New OIN Senior Secured TL | 600.0 | Employee/Professional/Contingencies/Other(1) | 144.3 | |||||||
| Rights Offering | 1,510.0 | International Business Transition Costs | 34.0 | |||||||
| Cash from Balance Sheet | 481.0 | Remaining Construction Costs for OS Shenandoah | 20.0 | |||||||
| OS Tampa Shuttle Tanker Conversion Costs | 20.0 | |||||||||
| Required Working Capital Investment | 9.0 | |||||||||
| Priority/Admin Claims/Other | 53.0 | |||||||||
| Transaction Fees and Expenses | 39.7 | |||||||||
| Total Cash Sources | $ | 3,191.0 | Total Cash Uses | $ | 3,191.0 | |||||
Source: Company filings & projections.
| (1) | Excludes Transaction Fees and Expenses of $39.7 million and Rights Offering Fee Paid in Stock of $76.0 million. |
Pro Forma Capitalization and Credit Statistics
The following table sets forth the pro forma capitalization and credit statistics of the Company as of June 30, 2014 after giving effect to the Transaction:
Pro Forma Capitalization ($Millions)
Pro Forma Capitalization (Assumed emergence of June 30, 2014)
| Current | Projected | Pro Forma | ||||||||||||||
| 3/31/14 | 6/30/14 | 6/30/14 | Leverage(1) | |||||||||||||
| Cash & Cash Equivalents(2) | $ | 638.7 | $ | 669.0 | $ | 188.0 | ||||||||||
| OBS: | ||||||||||||||||
| OBS Cash & Cash Equivalents | 70.0 | |||||||||||||||
| Existing $1.5 billion Revolver | 1,500.0 | 1,500.0 | - | |||||||||||||
| New $75.0 million ABL Revolver | - | |||||||||||||||
| New $600.0 million Senior Secured TL | 600.0 | |||||||||||||||
| Total OBS Debt | 1,500.0 | 1,500.0 | 600.0 | 3.6 | x | |||||||||||
| OIN: | ||||||||||||||||
| OIN Cash & Cash Equivalents | 70.0 | |||||||||||||||
| Existing Floating Rate Secured TLs (CEXIM & DSF) | 579.0 | 579.0 | - | |||||||||||||
| New $75.0 million Revolver | - | |||||||||||||||
| New $600.0 million Senior Secured TL | 600.0 | |||||||||||||||
| Total OIN Debt | 579.0 | 579.0 | 600.0 | 5.7 | x | |||||||||||
| Consolidated: | ||||||||||||||||
| Existing 8.75% Senior Notes | 66.0 | 66.0 | - | |||||||||||||
| Existing 8.125% Senior Notes | 300.0 | 300.0 | 300.0 | |||||||||||||
| Existing 7.5% Senior Notes | 146.0 | 146.0 | 146.0 | |||||||||||||
| Total Consolidated Debt | $ | 2,591.0 | $ | 2,591.0 | $ | 1,646.0 | 6.0 | x | ||||||||
| Net Consolidated Debt | 1,952.3 | 1,922.0 | 1,458.0 | 5.4 | x | |||||||||||
| Shareholders' Equity | 1,101.2 | |||||||||||||||
| Total Capitalization | $ | 2,747.2 | ||||||||||||||
Source: Company filings & projections.
| (1) | PF 6/30/14 Leverage based on OBS LTM 3/31/14 Adj. EBITDA of $167.8 million, OIN LTM 3/31/14 Adj. EBITDA of $104.5 million and Consolidated LTM 3/31/14 Adj. EBITDA of $272.3 million. |
| (2) | PF 6/30/14 Cash & Cash Equivalents assume $70.0 million at OBS, $70.0 million at OIN and the balance of $48 million at Parent, respectively. |
| 4. | OBS – Company Overview |
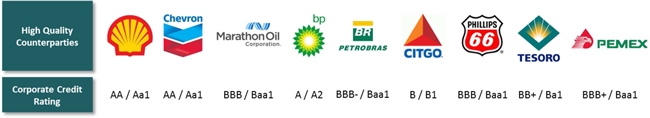
High Quality Counterparties
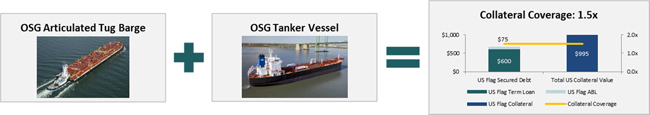
Significant Collateral Value
The OBS fleet is appraised at $795 million. The Company also estimates the value of the charter-in contracts with ASC are worth approximately $200 million, resulting in total OBS collateral of $995 million. This value provides collateral coverage of 1.5x the proposed $675 million aggregate Term Loan and ABL Facility financing.
| ($ in millions) | As of 12/31/13 | |||||||||||||||||||||
| Year | ||||||||||||||||||||||
| Vessel Name | Barge Value | Rebuilt/Built | Tug Name | Year Built | Tug Value | Total | ||||||||||||||||
| ATBs | ||||||||||||||||||||||
| OSG 192 | $ | 4.5 | 1998 | * | OSG Endurance | 2011 | $ | 22.0 | $ | 26.5 | ||||||||||||
| OSG 209 | 8.5 | 2005 | * | OSG Honour | 1973 | 0.9 | 9.4 | |||||||||||||||
| OSG 214 | 6.5 | 2004 | * | OSG Enterprise | 1977 | 1.4 | 7.9 | |||||||||||||||
| OSG 242 | 13.0 | 2007 | * | OSG Columbia | 1981 | 1.8 | 14.8 | |||||||||||||||
| OSG 243 | 13.0 | 2007 | * | OSG Independence | 1980 | 1.8 | 14.8 | |||||||||||||||
| OSG 244 | 6.0 | 2001 | * | OSG Courageous | 2011 | 22.0 | 28.0 | |||||||||||||||
| OSG 252 | 6.0 | 2002 | * | OSG Navigator | 1971 | 0.8 | 6.8 | |||||||||||||||
| OSG 254 | 6.0 | 2002 | * | OSG Intrepid | 1970 | 0.8 | 6.8 | |||||||||||||||
| OSG 350 | 2010 | OSG Vision | 2010 | 148.0 | ||||||||||||||||||
| OSG 351 | 2011 | OSG Horizon | 2011 | 148.0 | ||||||||||||||||||
| Total ATB Value | $ | 411.0 | ||||||||||||||||||||
| Tanker | ||||||||||||||||||||||
| Overseas Cascade - Shuttle Tanker | 2009 | $ | 160.0 | |||||||||||||||||||
| Overseas Chinook - Shuttle Tanker | 2010 | 160.0 | ||||||||||||||||||||
| Overseas Mykonos - MSP Tanker | 2010 | 32.0 | ||||||||||||||||||||
| Overseas Santorini - MSP Tanker | 2010 | 32.0 | ||||||||||||||||||||
| Total Tanker Value | $ | 384.0 | ||||||||||||||||||||
| Total US Flag Owned Collateral | $ | 795.0 | ||||||||||||||||||||
| Approximate Value of Chartered-in Contracts | 200.0 | |||||||||||||||||||||
| Total US Flag Collateral | $ | 995.0 | ||||||||||||||||||||
| ABL Revolver | (75.0 | ) | ||||||||||||||||||||
| Term Loan Collateral | $ | 920.0 | ||||||||||||||||||||
| Term Loan LTV | 65 | % | ||||||||||||||||||||
| *Rebuild date | ||||||||||||||||||||||
Note: Loan to Value assumes US Flag Secured Term Loan size of $600mm and ABL Facility of $75mm; Overseas Mykonos and Overseas Santorini are non-Jones Act vessels; Asterisk denotes year in which vessel was rebuilt; OSG 350 and OSG 351 and related tags were constructed using CCF which prevents the Company from pledging the vessels as collateral, other than the pledge of the stock of the subsidiaries that own the vessels.
Historical financials
Historical Income Statement ($Millions)
| FY12(1) | FY13(1) | LTM 3/31/14(2) | ||||||||||
| Time and bareboat charter revenues | $ | 246.1 | $ | 326.9 | $ | 337.3 | ||||||
| Voyage charter revenues | 191.1 | 103.8 | 97.7 | |||||||||
| Sunoco termination fee(3) | 13.3 | - | - | |||||||||
| Total Shipping Revenue | 450.5 | 430.6 | 435.0 | |||||||||
| Voyage expenses | (48.9 | ) | (29.8 | ) | (28.4 | ) | ||||||
| Vessel expenses | (120.9 | ) | (129.8 | ) | (129.7 | ) | ||||||
| Charter hire expenses | (93.2 | ) | (90.6 | ) | (90.6 | ) | ||||||
| Depreciation and amortization | (69.1 | ) | (67.6 | ) | (67.5 | ) | ||||||
| General and administrative(4) | (26.7 | ) | (27.8 | ) | (29.5 | ) | ||||||
| Severance and relocation costs(5) | (0.1 | ) | (1.0 | ) | (1.6 | ) | ||||||
| Gain / (loss) on disposal of vessels, including impairments | (0.4 | ) | 1.2 | 1.2 | ||||||||
| Total Operating Expenses | (359.4 | ) | (345.4 | ) | (346.2 | ) | ||||||
| Income / (Loss) from Vessel Operations | 91.0 | 85.2 | 88.8 | |||||||||
| Equity in Income of Affiliated Companies | 4.0 | 3.8 | 3.7 | |||||||||
| Operating Income / (Loss) | 95.0 | 89.1 | 92.5 | |||||||||
| Other Income/(Expense) | 0.4 | 0.4 | 0.7 | |||||||||
| Income / (Loss) before Interest Exp, Reorg Items and Taxes | 95.4 | 89.5 | 93.2 | |||||||||
| Interest expense | (74.9 | ) | - | - | ||||||||
| Income / (Loss) before Reorg Items and Income Taxes | 20.5 | 89.5 | 93.2 | |||||||||
| Reorganization items, net(6) | (1.8 | ) | (22.9 | ) | (26.1 | ) | ||||||
| Income/ (Loss) before Income Taxes | 18.7 | 66.6 | 67.1 | |||||||||
| Income tax benefit/(provision) | 1.6 | 19.0 | 11.8 | |||||||||
| Net Income / (Loss) | $ | 20.3 | $ | 85.6 | $ | 78.9 | ||||||
| (1) | OBS represents the difference between the OSG consolidated 10-K and the OIN carve out financial statements for FY12 and FY13. |
| (2) | Represents last twelve months of operations to Mar-14, applying the same assumptions to FY12 and FY13 for the purposes of the OBS standalone figures. LTM Mar-14 information was derived by adding FY13 and Q1-14 balances less the Q1-13 balances. |
| (3) | One-time termination fee received by OBS for the termination, settlement and replacement of the Sunoco lightering contract in Sep-12. |
| (4) | G&A expenses are presented on an allocated basis based on certain cost sharing arrangements and stewardship costs are allocated based on operating days. |
| (5) | Represents costs associated with the relocation of the technical management team and termination of employees. |
| (6) | Represents reorganization costs incurred relating to the bankruptcy. |
Management Adjusted EBITDA Reconciliation ($Millions)
| FY12 | FY13 | LTM 3/31/14 | ||||||||||
| Net Income | $ | 20.3 | $ | 85.6 | $ | 78.9 | ||||||
| Depreciation and amortization | 69.1 | 67.6 | 67.5 | |||||||||
| Interest expense | 74.9 | - | - | |||||||||
| Income tax provision/(benefit) | (1.6 | ) | (19.0 | ) | (11.8 | ) | ||||||
| EBITDA | 162.8 | 134.2 | 134.6 | |||||||||
| (Gain)/loss on disposal of vessels, including impairments(1) | 0.4 | (1.2 | ) | (1.2 | ) | |||||||
| Reorganization items, net | 1.8 | 22.9 | 26.1 | |||||||||
| Severance and relocation costs(2) | 0.1 | 1.0 | 1.6 | |||||||||
| Sunoco adjustment(3) | (40.4 | ) | - | - | ||||||||
| Non-cash earnings in affiliated companies(4) | 0.6 | (0.3 | ) | (0.2 | ) | |||||||
| Charter hire amortization of deferred costs(5) | 3.9 | 2.0 | 2.0 | |||||||||
| Adjusted EBITDA | 129.2 | 158.7 | 163.0 | |||||||||
| Dormant/Discontinued Operations | (0.2 | ) | (0.3 | ) | (0.2 | ) | ||||||
| G&A(6) | 4.1 | 3.7 | 5.1 | |||||||||
| Pro forma Adjusted EBITDA | $ | 133.1 | $ | 162.1 | $ | 167.8 | ||||||
Commentary
| (1) | Gain/loss on disposal of vessels, including impairments |
| - | Reflects one time disposal cost primarily attributable to OSG Freedom, a spare tug boat that had been idle since FY11. The Freedom tugboat was impaired at December 2012 and subsequently delivered to buyers in April 2013 |
| (2) | Severance and relocation costs |
| - | Reflects non-recurring severance and relocation costs incurred in FY12 in relation to the termination of one executive and in FY13 in connection with bankruptcy and restructuring costs |
| (3) | Sunoco adjustment |
| - | Reflects exclusion of TCE Revenue impact of Sunoco termination fee plus acceleration of deferred revenue |
| (4) | Non-cash earnings in affiliated companies |
| - | Reflects reconciliation of cash receipts related to earnings in affiliates and earnings in affiliated companies on the income statement. An adjustment is made to exclude the non-cash portion of equity income from affiliates to present Adjusted EBITDA on a cash basis |
| (5) | Charter hire amortization of deferred costs |
| - | Removal of amortization recorded in charter-hire expense (rather than depreciation and amortization line item) relating to capital expenditures on the charter in Aker vessels paid for by OBS and recorded in other assets. The reduction in amortization of deferred costs from $3.9 million to $2.0 million from FY12 to FY13 is due to the extension to 2019 of the Aker charter in leases that increased the period over which the amortization is being distributed. The change in the deferred cost-capital expenditures balance is treated as a non-cash reconciling item to arrive at operating cash flow for purposes of OSG's cash flow statement |
| (6) | G&A |
| - | Represents adjustment to reflect the estimated annual run-rate of G&A expense upon completion of the outsourcing model |
Source: Management information.
Note: The schedule above summarizes adjustments made to EBITDA to arrive at Pro Forma Adjusted EBITDA for FY12, FY13 and LTM 3/31/14.
Management’s Discussion & Analysis
Quarter Ended March 31, 2014 compared to Quarter Ended March 31, 2013
TCE Revenue increased from $94.7 million in Q1 2013 to $100.4 million in Q1 2014. The increase was primarily attributable to the increase in average TCE rates, from $45,500/day to $48,100/day, as a result of continued demand for coast-wise movement of domestic crude oil.
Capital expenditures increased $1.7 million due to initial payments towards shuttle conversion.
Year Ended December 31, 2013 compared to Year Ended December 31, 2012
Pro Forma Adjusted TCE Revenue increased from $361.2 million in FY12 to $400.9 million in FY13, while Pro Forma Adjusted EBITDA increased from $133.1 million in FY12 to $162.1 million in FY13.
The increase was primarily due to TCE rates for the US Flag fleet increasing by 11% between FY12 and FY13. Management indicated this is a result of the recent increase in demand for coast-wise movement of domestic crude oil.
| 5. | OIN – Company Overview |
Credit strengths
The OIN business benefits from several market and company-specific trends. The crude and product tanker trade benefits from steady ton-mile demand growth complemented by a tanker orderbook that has declined significantly from highs in 2007 and 2008. Rates and asset values have shown the first signs of recovery and are expected to rise as oversupply of capacity is absorbed over the next several years.
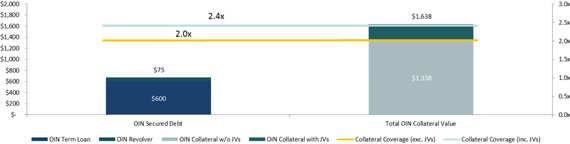
Diversified International Fleet Profile with Significant Collateral Value
OSG’s owned international fleet consists of 47 vessels with a total collateral value of over $1.3 billion according to recent appraisals. In addition to the international crude and product tankers that OIN operates, the Company also has joint venture interests with an approximate value of $300 million, based on management’s estimates. Assuming a $600 million Term Loan and a Revolver with $75 million capacity, the OIN segment provides collateral coverage of 2.0x without joint venture interests and 2.4x including the value of the joint ventures.
| Vessel Type | Ship Count | Avg. DWT | Avg. Age | Total Value | ||||||||||||
| VLCC / ULCC | 11 | 317,103 | 11 | $ | 526 | |||||||||||
| Aframax / LR2 | 9 | 110,593 | 9 | 249 | ||||||||||||
| Panamax / LR1 | 13 | 71,117 | 10 | 283 | ||||||||||||
| MR (All Coated) | 14 | 45,959 | 9 | 280 | ||||||||||||
| Total Value of Owned Vessels(1) | 47 | $ | 1,338 | |||||||||||||
| Approximate Value of Interest in FSO & LNG Joint Ventures(2) | 300 | |||||||||||||||
| Total Collateral Value | $ | 1,638 | ||||||||||||||
| Loan to Value (Excluding JV Interest) | 50 | % | ||||||||||||||
| Loan to Value (Including JV Interest) | 41 | % | ||||||||||||||
Significant Operational Improvements through the Bankruptcy Process
During the bankruptcy, the Company reviewed the charters for all vessels chartered to OIN. The Company had chartered most of these vessels when prevailing charter rates were far higher, and the subsequent drop in market rates made it difficult to employ these vessels out profitably.
The Company rejected the charters on twenty-five of the OIN vessels. OIN entered into renegotiated charters for seven of the rejected charters. In addition, the debtors assumed and amended the existing charters on two vessels that lowered rates and shortened terms. One other OIN vessel remains chartered under a “back-to-back” arrangement with the charter-in, meaning that the charter-in and charter-out rates are equal and offsetting. Rejections of loss-leading charter contracts will result in savings of $279 million over the remaining life of the charters.
OIN has also undertaken the process of outsourcing vessel management (technical and commercial) of its international fleet. OIN has executed a number of contracts with V.Ships and an affiliated company for technical management of OIN fleet and related services and is committed to placing its vessels into third party pools. The Company expects to benefit by approximately $32 million in annual general and administrative expense savings.
Rates Expected to Rise across All Asset Classes as Oversupply is Absorbed
Both the crude and product tanker sectors have low orderbooks relative to the global on-the-water fleet as compared to the historical highs of 2007 and 2008. Both segments enjoy healthy ton-mile demand, while refinery dislocation and US shale oil developments fundamentally change global energy flows resulting in longer voyages and increased ton-mile demand. As a result, the average tanker earnings in 2014 on a time charter equivalent basis according to Clarksons is $18,220, the highest since 2008, but still below the 10-year average of $29,673.
| 1 | Appraisals completed as of April 2014. Does not include appraised values of the Overseas Maremar or Overseas Rubymar as the vessels are subject to bareboat charters that do not allow for a pledge. |
| 2 | Includes approximated value of Company’s interest in joint ventures; JV equity interests will not be pledged to secure the OIN facilities. |
Joint Ventures Offer Diversified Footprint and Meaningful Cash Dividends
The FSO and LNG joint ventures that the Company is party to provide global diversification through participation in market segments less correlated to the international tanker market. The joint ventures also offer meaningful cash dividends and are with high-quality counterparties. The LNG joint venture is subject to long-term contracts.
OIN Benefits from Commercial Pooling Arrangements
OIN operates a significant portion of its fleet in commercial pools in order to improve operational flexibility and achieve economies of scale. OIN’s crude oil commercial strategy is to build scale in key trading areas in order to provide superior reliability and service to quality focused customers. Increased scale is achieved through commercial pool participation. Pooling agreements provide greater operational flexibility, economies of scale and service levels, while increasing vessel utilization and minimizing idle time. Pool earnings are distributed among pool participants based on a pre-agreed pool point allocation formula and such distribution is independent of each vessel’s actual performance. As a result, even idle vessels could earn revenue, when employed in a pool.
Historical financials
Historical Income Statement ($Millions)
| FY12(1) | FY13(1) | LTM 3/31/14(2) | ||||||||||
| Pool revenues | $ | 241.3 | $ | 177.1 | $ | 165.9 | ||||||
| Time and bareboat charter revenues | 53.2 | 43.8 | 44.7 | |||||||||
| Voyage charter revenues | 392.2 | 364.5 | 415.4 | |||||||||
| Total Shipping Revenue | 686.7 | 585.4 | 626.0 | |||||||||
| Voyage expenses | (247.4 | ) | (222.9 | ) | (250.4 | ) | ||||||
| Vessel expenses | (164.1 | ) | (135.4 | ) | (135.7 | ) | ||||||
| Charter hire expenses | (277.2 | ) | (116.3 | ) | (96.2 | ) | ||||||
| Depreciation and amortization | (132.2 | ) | (108.7 | ) | (105.6 | ) | ||||||
| General and administrative(3) | (62.1 | ) | (69.8 | ) | (72.9 | ) | ||||||
| Technical management transition costs | - | - | (0.2 | ) | ||||||||
| Severance and relocation costs(4) | (3.1 | ) | (2.1 | ) | (8.6 | ) | ||||||
| Goodwill and other intangibles impairment charge | - | (16.2 | ) | (16.2 | ) | |||||||
| Gain / (loss) on disposal of vessels, including impairments | (270.9 | ) | (366.4 | ) | (364.9 | ) | ||||||
| Total Operating Expenses | (1,156.9 | ) | (1,037.8 | ) | (1,050.7 | ) | ||||||
| Income / (Loss) from Vessel Operations | (470.3 | ) | (452.4 | ) | (424.7 | ) | ||||||
| Equity in Income of Affiliated Companies | 29.5 | 37.1 | 35.4 | |||||||||
| Operating Income / (Loss) | (440.8 | ) | (415.4 | ) | (389.4 | ) | ||||||
| Other Income/(Expense) | (1.7 | ) | 0.4 | 0.5 | ||||||||
| Income / (Loss) before Interest Exp, Reorg Items and Taxes | (442.5 | ) | (415.0 | ) | (388.9 | ) | ||||||
| Interest expense | (18.5 | ) | (0.4 | ) | (0.2 | ) | ||||||
| Income / (Loss) before Reorg Items and Income Taxes | (461.0 | ) | (415.3 | ) | (389.1 | ) | ||||||
| Reorganization items, net(5) | (39.3 | ) | (304.3 | ) | (145.7 | ) | ||||||
| Income/ (Loss) before Income Taxes | (500.3 | ) | (719.6 | ) | (534.8 | ) | ||||||
| Income tax benefit/(provision) | (0.1 | ) | (4.2 | ) | (4.2 | ) | ||||||
| Net Income / (Loss) | $ | (500.4 | ) | $ | (723.8 | ) | $ | (539.0 | ) | |||
| (1) | Carve out OIN audited financial statements were produced for the international business in FY12 and FY13. |
| (2) | Represents last twelve months of operations to Mar-14. LTM Mar-14 information was derived by adding FY13 and Q1-14 balances less the Q1-13 balances. |
| (3) | G&A expenses are presented on an allocated basis based on certain cost sharing arrangements and stewardship costs are allocated based on operating days. |
| (4) | Represents costs associated with the relocation of the technical management team and termination of employees. |
| (5) | Represents reorganization costs incurred relating to the bankruptcy. |
Management Adjusted EBITDA Reconciliation ($Millions)
| FY12 | FY13 | LTM 3/31/14 | ||||||||||
| Net Income | $ | (500.4 | ) | $ | (723.8 | ) | $ | (539.0 | ) | |||
| Depreciation and amortization | 132.2 | 108.7 | 105.6 | |||||||||
| Interest expense | 18.5 | 0.4 | 0.2 | |||||||||
| Income tax provision/(benefit) | 0.1 | 4.2 | 4.2 | |||||||||
| EBITDA | (349.6 | ) | (610.6 | ) | (429.0 | ) | ||||||
| Goodwill and other intangibles impairment charge | - | 16.2 | 16.2 | |||||||||
| (Gain)/loss on disposal of vessels, including impairments(1) | 270.9 | 366.4 | 364.9 | |||||||||
| Reorganization items, net | 39.3 | 304.3 | 145.7 | |||||||||
| Technical management transition costs | - | - | 0.2 | |||||||||
| Severance and relocation costs(2) | 3.1 | 2.1 | 8.6 | |||||||||
| Non-cash earnings in affiliated companies(3) | (23.4 | ) | (35.6 | ) | (33.9 | ) | ||||||
| Adjusted EBITDA | (59.7 | ) | 42.9 | 72.7 | ||||||||
| Dormant/Discontinued Operations(4) | 73.9 | 12.0 | (5.8 | ) | ||||||||
| G&A(5) | 38.2 | 45.6 | 48.6 | |||||||||
| Outsourcing(6) | (11.0 | ) | (11.0 | ) | (11.1 | ) | ||||||
| Pro forma Adjusted EBITDA | $ | 41.4 | $ | 89.6 | $ | 104.5 | ||||||
Commentary
| (1) | Gain/loss on disposal of vessels, including impairments |
| - | Includes non-cash impairments on OIN vessels totaling $278.4 million, recorded during FY12. Management adjusted EBITDA excludes the impact of these non-cash losses. Additionally, reflects impairment charges of $366.4 million recorded in FY13 related to OIN vessels |
| (2) | Severance and relocation costs |
| - | In Q1 2012, OIN announced the relocation of the technical management team of its conventional International Flag crude oil tanker fleet from the Newcastle, U.K. office to the Athens, Greece office. In relation to the relocation, approximately 50 employees were terminated in Newcastle. The adjustment reflects the associated severance and relocation costs allocated to OIN. As the costs are non-recurring in nature, an adjustment is made to add these costs to Adjusted EBITDA |
| - | In April 2013, OSG terminated 37 employees as part of a workforce reduction. OIN’s FY13 expense mainly reflects the portion allocated to OIN for employees who perform work for the international group |
| - | In January 2014, OSG announced that certain subsidiaries of OIN that own or charter-in vessels intend to outsource certain management services. OIN’s Q1 2014 expense includes $6.1 million related to employees who perform work for the international group related to this outsourcing reduction in force |
| (3) | Non-cash earnings in affiliated companies |
| - | Reflects reconciliation of cash receipts related to earnings in affiliates and earnings in affiliated companies on the income statement. An adjustment is made to exclude the non-cash portion of equity income from affiliates to present Adjusted EBITDA on a cash basis |
| (4) | Dormant / discontinued operations |
| - | Reflects exclusion of the historical results of operations that will not be part of OIN’s operations going forward, including rejected charters, Beryl, Suezmax International pool and the full service lightering business |
| (5) | G&A |
| - | Represents adjustment to reflect the estimated annual run-rate of G&A expense upon completion of the outsourcing model |
| (6) | Outsourcing |
| - | Includes estimated fees for OIN vessels included under technical management of V.Ships and in commercial pools |
Source: Management information.
Note: The schedule above summarizes adjustments made to EBITDA to arrive at Pro Forma Adjusted EBITDA for FY12, FY13 and LTM 3/31/14.
Management’s Discussion & Analysis
Quarter Ended March 31, 2014 compared to Quarter Ended March 31, 2013
TCE Revenue increased from $100.9 million in Q1 2013 to $114.2 million in Q1 2014. The increase was primarily attributable to strong crude markets in January and February which helped to increase the average TCE rate from $14,500/day to $19,800/day.
Charter hire expenses decreased by $20.1 million year-over-year primarily due to the rejection of charter-in vessels ($19.0 million). The balance was due to the renegotiation of long term chartered-in MRs and the extension of short term chartered-in Aframaxes. Drydock / IRP expenses increased due to a larger number of regularly scheduled drydocks.
Year Ended December 31, 2013 compared to Year Ended December 31, 2012
Pro Forma Adjusted TCE Revenue increased from $237.3 million in FY12 to $269.7 million in FY13, while Pro Forma Adjusted EBITDA increased from $41.4 million in FY12 to $89.6 million in FY13.
The increase was primarily due to the following factors:
| · | An increase in operating days for the go forward fleet due to the delivery of the Redwood mid-2013 |
| · | The number of operating days on the Crude tankers increased by 147 days or 1.6%, primarily due to slight increase in revenue days |
| · | TCE rates for Product vessels also increased by 25.3% between FY12 and FY13, primarily due to improved market conditions during FY13 whereby vessels on voyage charter outs were earning significantly higher TCE per day than the prior year |
| · | Improved operating expenses resulting from rejecting twenty-five loss-leading charter contracts while entering into renegotiated charters for eight of the rejected charters |
| 7. | Appendix I – OSG Historical Financials |
Historical income statement reconciliation
| FY12(1) | FY13(1) | LTM 3/31/14(2) | ||||||||||||||||||||||||||||||||||
| OBS | OIN | OSG | OBS | OIN | OSG | OBS | OIN | OSG | ||||||||||||||||||||||||||||
| Pool revenues | $ | - | $ | 241.3 | $ | 241.3 | $ | - | $ | 177.1 | $ | 177.1 | $ | - | $ | 165.9 | $ | 165.9 | ||||||||||||||||||
| Time and bareboat charter revenues | 246.1 | 53.2 | 299.3 | 326.9 | 43.8 | 370.7 | 337.3 | 44.7 | 382.0 | |||||||||||||||||||||||||||
| Voyage charter revenues | 191.1 | 392.2 | 583.3 | 103.8 | 364.5 | 468.2 | 97.7 | 415.4 | 513.1 | |||||||||||||||||||||||||||
| Sunoco termination fee(3) | 13.3 | - | 13.3 | - | - | - | - | - | - | |||||||||||||||||||||||||||
| Total Shipping Revenue | 450.5 | 686.7 | 1,137.1 | 430.6 | 585.4 | 1,016.0 | 435.0 | 626.0 | 1,061.0 | |||||||||||||||||||||||||||
| Voyage expenses | (48.9 | ) | (247.4 | ) | (296.3 | ) | (29.8 | ) | (222.9 | ) | (252.7 | ) | (28.4 | ) | (250.4 | ) | (278.8 | ) | ||||||||||||||||||
| Vessel expenses | (120.9 | ) | (164.1 | ) | (285.0 | ) | (129.8 | ) | (135.4 | ) | (265.1 | ) | (129.7 | ) | (135.7 | ) | (265.5 | ) | ||||||||||||||||||
| Charter hire expenses | (93.2 | ) | (277.2 | ) | (370.4 | ) | (90.6 | ) | (116.3 | ) | (206.9 | ) | (90.6 | ) | (96.2 | ) | (186.9 | ) | ||||||||||||||||||
| Depreciation and amortization | (69.1 | ) | (132.2 | ) | (201.3 | ) | (67.6 | ) | (108.7 | ) | (176.3 | ) | (67.5 | ) | (105.6 | ) | (173.1 | ) | ||||||||||||||||||
| General and administrative(4) | (26.7 | ) | (62.1 | ) | (88.8 | ) | (27.8 | ) | (69.8 | ) | (97.7 | ) | (29.5 | ) | (72.9 | ) | (102.4 | ) | ||||||||||||||||||
| Technical management transition costs | - | - | - | - | - | - | - | (0.2 | ) | (0.2 | ) | |||||||||||||||||||||||||
| Severance and relocation costs(5) | (0.1 | ) | (3.1 | ) | (3.2 | ) | (1.0 | ) | (2.1 | ) | (3.1 | ) | (1.6 | ) | (8.6 | ) | (10.2 | ) | ||||||||||||||||||
| Goodwill and other intangibles impairment charge | - | - | - | - | (16.2 | ) | (16.2 | ) | - | (16.2 | ) | (16.2 | ) | |||||||||||||||||||||||
| Gain / (loss) on disposal of vessels, including impairments | (0.4 | ) | (270.9 | ) | (271.4 | ) | 1.2 | (366.4 | ) | (365.3 | ) | 1.2 | (364.9 | ) | (363.8 | ) | ||||||||||||||||||||
| Total Operating Expenses | (359.4 | ) | (1,156.9 | ) | (1,516.4 | ) | (345.4 | ) | (1,037.8 | ) | (1,383.2 | ) | (346.2 | ) | (1,050.7 | ) | (1,396.9 | ) | ||||||||||||||||||
| Income / (Loss) from Vessel Operations | 91.0 | (470.3 | ) | (379.2 | ) | 85.2 | (452.4 | ) | (367.2 | ) | 88.8 | (424.7 | ) | (335.9 | ) | |||||||||||||||||||||
| Equity in Income of Affiliated Companies | 4.0 | 29.5 | 33.5 | 3.8 | 37.1 | 40.9 | 3.7 | 35.4 | 39.1 | |||||||||||||||||||||||||||
| Operating Income / (Loss) | 95.0 | (440.8 | ) | (345.7 | ) | 89.1 | (415.4 | ) | (326.3 | ) | 92.5 | (389.4 | ) | (296.8 | ) | |||||||||||||||||||||
| Other Income/(Expense) | 0.4 | (1.7 | ) | (1.3 | ) | 0.4 | 0.4 | 0.8 | 0.7 | 0.5 | 1.2 | |||||||||||||||||||||||||
| Income / (Loss) before Interest Exp, Reorg Items and Taxes | 95.4 | (442.5 | ) | (347.1 | ) | 89.5 | (415.0 | ) | (325.5 | ) | 93.2 | (388.9 | ) | (295.6 | ) | |||||||||||||||||||||
| Interest expense | (74.9 | ) | (18.5 | ) | (93.4 | ) | - | (0.4 | ) | (0.4 | ) | - | (0.2 | ) | (0.2 | ) | ||||||||||||||||||||
| Income / (Loss) before Reorg Items and Income Taxes | 20.5 | (461.0 | ) | (440.5 | ) | 89.5 | (415.3 | ) | (325.8 | ) | 93.2 | (389.1 | ) | (295.8 | ) | |||||||||||||||||||||
| Reorganization items, net(6) | (1.8 | ) | (39.3 | ) | (41.1 | ) | (22.9 | ) | (304.3 | ) | (327.2 | ) | (26.1 | ) | (145.7 | ) | (171.8 | ) | ||||||||||||||||||
| Income/ (Loss) before Income Taxes | 18.7 | (500.3 | ) | (481.6 | ) | 66.6 | (719.6 | ) | (653.0 | ) | 67.1 | (534.8 | ) | (467.6 | ) | |||||||||||||||||||||
| Income tax benefit/(provision) | 1.6 | (0.1 | ) | 1.5 | 19.0 | (4.2 | ) | 14.7 | 11.8 | (4.2 | ) | 7.6 | ||||||||||||||||||||||||
| Net Income / (Loss) | 20.3 | $ | (500.4 | ) | $ | (480.1 | ) | $ | 85.6 | $ | (723.8 | ) | $ | (638.2 | ) | $ | 78.9 | $ | (539.0 | ) | $ | (460.1 | ) | |||||||||||||
| (1) | Represents OBS and OIN components of OSG to arrive at the consolidated 10-K figures. Carve out OIN audited financial statements were produced for the international business in FY12 and FY13. OBS represents the difference between the consolidated 10-K and the OIN financial statements for FY12 and FY13. |
| (2) | Represents last twelve months of operations to Mar-14, applying the same assumptions to FY12 and FY13 for the purposes of the OIN and OBS standalone figures. LTM Mar-14 information was derived by adding FY13 and Q1-14 balances less the Q1-13 balances. |
| (3) | One-time termination fee received by OBS for the termination, settlement and replacement of the Sunoco lightering contract in Sep-12. |
| (4) | G&A expenses are presented on an allocated basis based on certain cost sharing arrangements and stewardship costs are allocated based on operating days. |
| (5) | Represents costs associated with the relocation of the technical management team and termination of employees. |
| (6) | Represents reorganization costs incurred relating to the bankruptcy. |
Historical Balance sheet reconciliation
| FY12(1) | FY13(1) | 3/31/14(2) | ||||||||||||||||||||||||||||||||||
| OBS | OIN | OSG | OBS | OIN | OSG | OBS | OIN | OSG | ||||||||||||||||||||||||||||
| Assets | ||||||||||||||||||||||||||||||||||||
| Cash and cash equivalents | $ | 401.0 | $ | 106.3 | $ | 507.3 | $ | 428.0 | $ | 173.9 | $ | 601.9 | $ | 450.5 | $ | 188.2 | $ | 638.7 | ||||||||||||||||||
| Voyage receivables, including unbilled | 11.2 | 168.1 | 179.3 | 9.6 | 138.3 | 148.0 | 11.5 | 132.4 | 143.9 | |||||||||||||||||||||||||||
| Other receivables | 6.1 | 22.8 | 28.9 | 3.1 | 13.7 | 16.8 | 2.3 | 13.0 | 15.3 | |||||||||||||||||||||||||||
| Inventories | 2.0 | 13.5 | 15.5 | 2.1 | 14.8 | 16.9 | 2.0 | 15.2 | 17.2 | |||||||||||||||||||||||||||
| Income taxes recoverable | - | - | - | 4.0 | - | 4.0 | 11.6 | - | 11.6 | |||||||||||||||||||||||||||
| Deferred income taxes | - | - | - | 5.5 | - | 5.5 | 5.5 | - | 5.5 | |||||||||||||||||||||||||||
| Prepaid expenses and other current assets | 14.9 | 25.5 | 40.4 | 12.8 | 11.5 | 24.3 | 12.2 | 15.6 | 27.7 | |||||||||||||||||||||||||||
| Total Current Assets | 435.2 | 336.2 | 771.4 | 465.1 | 352.2 | 817.3 | 495.7 | 364.3 | 860.0 | |||||||||||||||||||||||||||
| Vessels and other property, less accumulated depreciation | 985.4 | 1,851.9 | 2,837.3 | 931.7 | 1,427.7 | 2,359.4 | 919.7 | 1,411.7 | 2,331.5 | |||||||||||||||||||||||||||
| Deferred drydock expenditures, net | 24.4 | 50.0 | 74.4 | 21.2 | 36.1 | 57.2 | 20.7 | 33.3 | 54.1 | |||||||||||||||||||||||||||
| Total Vessels, Deferred Drydock and Other Property | 1,009.8 | 1,901.9 | 2,911.7 | 952.9 | 1,463.7 | 2,416.6 | 940.4 | 1,445.1 | 2,385.5 | |||||||||||||||||||||||||||
| Investments in affiliated companies | 3.1 | 249.3 | 252.4 | 3.4 | 319.9 | 323.3 | 0.3 | 325.5 | 325.8 | |||||||||||||||||||||||||||
| Intangible assets, less accumulated amortization | 64.6 | 7.4 | 72.0 | 59.9 | 0.2 | 60.2 | 58.8 | 0.2 | 59.0 | |||||||||||||||||||||||||||
| Goodwill | - | 9.6 | 9.6 | - | - | - | - | - | - | |||||||||||||||||||||||||||
| Other assets(3) | 23.0 | 3.5 | 26.4 | 26.6 | 0.5 | 27.1 | 27.7 | 0.4 | 28.0 | |||||||||||||||||||||||||||
| Total Assets | $ | 1,535.7 | $ | 2,507.8 | $ | 4,043.5 | $ | 1,507.9 | $ | 2,136.6 | $ | 3,644.5 | $ | 1,522.8 | $ | 2,135.5 | $ | 3,658.3 | ||||||||||||||||||
| Liabilities | ||||||||||||||||||||||||||||||||||||
| Accounts payable, accrued expenses and other current liabilities | (32.1 | ) | (67.2 | ) | (99.3 | ) | (60.6 | ) | (61.0 | ) | (121.6 | ) | (62.1 | ) | (60.4 | ) | (122.5 | ) | ||||||||||||||||||
| Deferred income taxes | (25.9 | ) | - | (25.9 | ) | - | - | - | - | - | - | |||||||||||||||||||||||||
| Income taxes payable, including reserve for uncertain tax positions | (329.8 | ) | - | (329.8 | ) | (256.3 | ) | - | (256.3 | ) | (256.4 | ) | (0.3 | ) | (256.7 | ) | ||||||||||||||||||||
| Due to parent for cost sharing arrangements | 3.9 | (3.9 | ) | - | 26.9 | (26.9 | ) | - | 1.4 | (1.4 | ) | - | ||||||||||||||||||||||||
| Total Current Liabilities | (384.0 | ) | (71.0 | ) | (455.0 | ) | (289.9 | ) | (87.9 | ) | (377.8 | ) | (317.2 | ) | (62.0 | ) | (379.2 | ) | ||||||||||||||||||
| Reserve for Uncertain Tax Positions | (17.1 | ) | - | (17.1 | ) | (26.6 | ) | - | (26.6 | ) | (26.7 | ) | - | (26.7 | ) | |||||||||||||||||||||
| Deferred Gain on Sale and Leaseback of Vessels | - | (3.8 | ) | (3.8 | ) | - | - | - | - | - | - | |||||||||||||||||||||||||
| Deferred Income Taxes(3) | (343.2 | ) | - | (343.2 | ) | (370.0 | ) | - | (370.0 | ) | (378.4 | ) | - | (378.4 | ) | |||||||||||||||||||||
| Other Liabilities | (26.3 | ) | (11.5 | ) | (37.7 | ) | (30.9 | ) | (11.3 | ) | (42.2 | ) | (31.7 | ) | (11.4 | ) | (43.1 | ) | ||||||||||||||||||
| Liabilities Subject to Compromise(4) | (1,824.5 | ) | (828.0 | ) | (2,652.5 | ) | (1,819.6 | ) | (1,068.6 | ) | (2,888.2 | ) | (1,818.9 | ) | (1,063.4 | ) | (2,882.3 | ) | ||||||||||||||||||
| Total Liabilities | (2,595.0 | ) | (914.3 | ) | (3,509.3 | ) | (2,537.0 | ) | (1,167.8 | ) | (3,704.7 | ) | (2,572.9 | ) | (1,136.8 | ) | (3,709.7 | ) | ||||||||||||||||||
| Net Assets | $ | (1,059.3 | ) | $ | 1,593.5 | $ | 534.2 | $ | (1,029.1 | ) | $ | 968.8 | $ | (60.2 | ) | $ | (1,050.0 | ) | $ | 998.7 | $ | (51.3 | ) | |||||||||||||
| (1) | Represents OBS and OIN components of OSG to arrive at the consolidated 10-K figures. Carve out OIN audited financial statements are produced for the international business. OBS represents the difference between the consolidated 10-K and the OIN financial statements and include balances held at corporate (OSG) legal entities. |
| (2) | Refers to the period as of March 31 2014. The same assumptions which have been applied in FY12 and FY13 for the purposes of the OIN and OBS standalone figures have been applied as of March 2014. |
| (3) | OBS amount as of Dec-12 does not reflect the impact of a top-side adjustment recorded for purposes of the OIN audited financial statements related to deferred taxes. The impact of such adjustment would increase other assets and deferred income taxes liabilities in the amount of $3.5m. |
| (4) | Represents adjusted pre-petition liabilities including accounts payable and accrued expenses, long term debt and related interest and pension liabilities. |
Historical cash flow statement reconciliation
| FY12(1) | FY13(1) | Q1 2014(2) | ||||||||||||||||||||||||||
| OBS | OIN | OSG | OBS | OIN | OSG | OSG | ||||||||||||||||||||||
| Cash Flows from Operating Activities: | ||||||||||||||||||||||||||||
| Net income/(loss) | $ | 20.3 | $ | (500.4 | ) | $ | (480.1 | ) | $ | 85.6 | $ | (723.8 | ) | $ | (638.2 | ) | $ | 10.4 | ||||||||||
| Items included in net income/(loss) not affecting cash flows: | ||||||||||||||||||||||||||||
| Non-cash items | 92.6 | 414.0 | 506.6 | 71.9 | 491.5 | 563.4 | 41.7 | |||||||||||||||||||||
| Deferred income tax provision/(benefit) | (29.8 | ) | 0.1 | (29.8 | ) | (10.9 | ) | 3.5 | (7.4 | ) | 8.5 | |||||||||||||||||
| Undistributed earnings of affiliated companies | 0.6 | (23.4 | ) | (22.8 | ) | (0.3 | ) | (35.6 | ) | (35.8 | ) | (5.0 | ) | |||||||||||||||
| Reorganization items, non-cash | (4.1 | ) | 38.8 | 34.7 | (42.9 | ) | 304.2 | 261.2 | 14.3 | |||||||||||||||||||
| Other net | 7.2 | (0.0 | ) | 7.1 | 2.0 | 0.2 | 2.2 | 0.6 | ||||||||||||||||||||
| Items included in net income/(loss) related to investing and | �� | |||||||||||||||||||||||||||
| financing activities: | ||||||||||||||||||||||||||||
| Payments for drydocking | (18.7 | ) | (27.3 | ) | (46.0 | ) | (11.8 | ) | (10.3 | ) | (22.0 | ) | (5.7 | ) | ||||||||||||||
| Other net | (0.9 | ) | (3.9 | ) | (4.9 | ) | (1.0 | ) | - | (1.0 | ) | (1.5 | ) | |||||||||||||||
| Changes in operating assets and liabilities: | (19.2 | ) | ||||||||||||||||||||||||||
| Decrease/(increase) in receivables | (8.7 | ) | (21.7 | ) | (30.3 | ) | (7.0 | ) | 40.4 | 33.5 | ||||||||||||||||||
| Security deposits with vendors and lenders | (10.3 | ) | - | (10.3 | ) | - | - | - | ||||||||||||||||||||
| Decrease in Sunoco deferred revenue | (27.1 | ) | - | (27.1 | ) | - | - | - | ||||||||||||||||||||
| Net change in prepaid items and accounts payable, accrued expenses and other current and long- term liabilities | 42.6 | 27.3 | 69.9 | (45.5 | ) | 31.5 | (13.9 | ) | ||||||||||||||||||||
| Net cash provided by/(used in) operating activities | 63.6 | (96.5 | ) | (32.9 | ) | 40.2 | 101.7 | 141.9 | 44.1 | |||||||||||||||||||
| Cash Flows from Investing Activities: | ||||||||||||||||||||||||||||
| Proceeds from sale of marketable securities and investments | $ | 12.7 | $ | 0.3 | 13.0 | $ | 0.5 | $ | - | $ | 0.5 | $ | - | |||||||||||||||
| Expenditures for vessels | (0.5 | ) | (52.1 | ) | (52.6 | ) | (2.7 | ) | (33.7 | ) | (36.4 | ) | (9.5 | ) | ||||||||||||||
| Proceeds from/deposits received for disposal of vessels | - | 12.9 | 12.9 | 0.5 | - | 0.5 | 7.6 | |||||||||||||||||||||
| Expenditures for other property | (0.4 | ) | (2.5 | ) | (2.9 | ) | (0.6 | ) | (1.6 | ) | (2.2 | ) | (0.1 | ) | ||||||||||||||
| Investments in and advances to affiliated companies(3) | (41.5 | ) | 41.5 | - | - | - | - | - | ||||||||||||||||||||
| Distributions from affiliated companies, net | (0.2 | ) | 6.8 | 6.6 | - | 2.1 | 2.1 | - | ||||||||||||||||||||
| Other net | 0.6 | (0.1 | ) | 0.6 | 1.3 | (0.3 | ) | 1.0 | 0.1 | |||||||||||||||||||
| Net cash used in investing activities | (29.2 | ) | 6.8 | (22.4 | ) | (1.0 | ) | (33.5 | ) | (34.5 | ) | (1.8 | ) | |||||||||||||||
| Cash Flows from Financing Activities: | ||||||||||||||||||||||||||||
| Purchases of treasury stock | $ | (0.3 | ) | $ | - | $ | (0.3 | ) | $ | - | $ | - | $ | - | $ | (0.2 | ) | |||||||||||
| Issuance of debt, net of issuance costs and deferred financing costs | 572.0 | - | 572.0 | - | - | - | - | |||||||||||||||||||||
| Payments on debt, including adequate protection payments(4) | - | (64.0 | ) | (64.0 | ) | - | (12.7 | ) | (12.7 | ) | (5.3 | ) | ||||||||||||||||
| Issuance of common stock upon exercise of stock options | 0.1 | - | 0.1 | - | - | - | - | |||||||||||||||||||||
| Drawdown on co-borrower obligation | (197.0 | ) | 197.0 | - | - | - | - | - | ||||||||||||||||||||
| Net change in net investment of parent(5) | (40.4 | ) | 40.4 | - | (12.2 | ) | 12.2 | - | - | |||||||||||||||||||
| Net cash (used in)/provided by financing activities | 334.3 | 173.4 | 507.8 | (12.1 | ) | (0.6 | ) | (12.7 | ) | (5.5 | ) | |||||||||||||||||
| Net increase in cash and cash equivalents | 368.7 | 83.8 | 452.5 | 27.0 | 67.6 | 94.6 | 36.8 | |||||||||||||||||||||
| Cash and cash equivalents at beginning of year | 32.3 | 22.6 | 54.9 | 401.0 | 106.3 | 507.3 | 601.9 | |||||||||||||||||||||
| Cash and cash equivalents at end of year | $ | 401.0 | $ | 106.3 | $ | 507.3 | $ | 428.0 | $ | 173.9 | $ | 601.9 | $ | 638.7 | ||||||||||||||
| (1) | Represents OBS and OIN components of OSG to arrive at the consolidated 10-K. Carve out OIN audited financial statements are produced for the international business in FY12 and FY13. OBS represents the difference between the consolidated 10-K and the OIN financial statements for FY12 and FY13. |
| (2) | Per interim financials. |
| (3) | Represents the net cash exchange between OIN and OBS for vessel transfer of Mykonos and Santorini to US Maritime Security Program and Luxmar to OIN. |
| (4) | Amounts are displayed net of intercompany debt payments. |
| (5) | Amount adjusted as a result of the intercompany transactions related to the MSP-related transfers and payments on debt presented net of intercompany, as decribed in notes 3 and 4 above. |
Historical management adjusted ebitda reconciliation
| FY12 | FY13 | LTM 3/31/14 | ||||||||||||||||||||||||||||||||||
| OBS | OIN 1 | Combined | OBS | OIN 1 | Combined | OBS | OIN | Combined | ||||||||||||||||||||||||||||
| Net Income | 20.3 | (500.4 | ) | (480.1 | ) | 85.6 | (723.8 | ) | (638.2 | ) | 78.9 | (539.0 | ) | (460.1 | ) | |||||||||||||||||||||
| Depreciation and amortization | 69.1 | 132.2 | 201.3 | 67.6 | 108.7 | 176.3 | 67.5 | 105.6 | 173.1 | |||||||||||||||||||||||||||
| Interest expense | 74.9 | 18.5 | 93.4 | - | 0.4 | 0.4 | - | 0.2 | 0.2 | |||||||||||||||||||||||||||
| Income tax provision/(benefit) | (1.6 | ) | 0.1 | (1.5 | ) | (19.0 | ) | 4.2 | (14.7 | ) | (11.8 | ) | 4.2 | (7.6 | ) | |||||||||||||||||||||
| EBITDA | 162.8 | (349.6 | ) | (186.9 | ) | 134.2 | (610.6 | ) | (476.3 | ) | 134.6 | (429.0 | ) | (294.4 | ) | |||||||||||||||||||||
| Goodwill and other intangibles impairment charge | - | - | - | - | 16.2 | 16.2 | - | 16.2 | 16.2 | |||||||||||||||||||||||||||
| (Gain)/loss on disposal of vessels, including impairments(1) | 0.4 | 270.9 | 271.4 | (1.2 | ) | 366.4 | 365.3 | (1.2 | ) | 364.9 | 363.8 | |||||||||||||||||||||||||
| Reorganization items, net | 1.8 | 39.3 | 41.1 | 22.9 | 304.3 | 327.2 | 26.1 | 145.7 | 171.8 | |||||||||||||||||||||||||||
| Technical management transition costs | - | - | - | - | - | - | - | 0.2 | 0.2 | |||||||||||||||||||||||||||
| Severance and relocation costs(2) | 0.1 | 3.1 | 3.2 | 1.0 | 2.1 | 3.1 | 1.6 | 8.6 | 10.2 | |||||||||||||||||||||||||||
| Sunoco adjustment(3) | (40.4 | ) | - | (40.4 | ) | - | - | - | - | - | - | |||||||||||||||||||||||||
| Non-cash earnings in affiliated companies(4) | 0.6 | (23.4 | ) | (22.8 | ) | (0.3 | ) | (35.6 | ) | (35.8 | ) | (0.2 | ) | (33.9 | ) | (34.1 | ) | |||||||||||||||||||
| Charter hire amortization of deferred costs(5) | 3.9 | - | 3.9 | 2.0 | 2.0 | 2.0 | - | 2.0 | ||||||||||||||||||||||||||||
| Adjusted EBITDA | 129.2 | (59.7 | ) | 69.5 | 158.7 | 42.9 | 201.6 | 163.0 | 72.7 | 235.7 | ||||||||||||||||||||||||||
| Dormant/Discontinued Operations(6) | (0.2 | ) | 73.9 | 73.7 | (0.3 | ) | 12.0 | 11.7 | (0.2 | ) | (5.8 | ) | (6.0 | ) | ||||||||||||||||||||||
| G&A(7) | 4.1 | 38.2 | 42.3 | 3.7 | 45.6 | 49.3 | 5.1 | 48.6 | 53.7 | |||||||||||||||||||||||||||
| Outsourcing(8) | - | (11.0 | ) | (11.0 | ) | - | (11.0 | ) | (11.0 | ) | - | (11.1 | ) | (11.1 | ) | |||||||||||||||||||||
| Pro forma Adjusted EBITDA | 133.1 | 41.4 | 174.5 | 162.1 | 89.6 | 251.6 | 167.8 | 104.5 | 272.3 | |||||||||||||||||||||||||||
Commentary
| (1) | Gain/loss on disposal of vessels, including impairments |
| - | OBS – Reflects one time disposal cost primarily attributable to OSG Freedom, a spare tug boat that had been idle since FY11. The Freedom tugboat was impaired at December 2012 and subsequently delivered to buyers in April 2013 |
| - | OIN – Includes non-cash impairments on OIN vessels totaling $278.4 million, recorded during FY12. Management adjusted EBITDA excludes the impact of these non-cash losses. Additionally, reflects impairment charges of $366.4 million recorded in FY13 related to OIN vessels and goodwill and intangible assets relating to the Lightering business |
| (2) | Severance and relocation costs |
| - | OBS – Reflects non-recurring severance and relocation costs incurred in FY12 in relation to the termination of one executive and in FY13 in connection with bankruptcy and restructuring costs |
| - | OIN – In Q1 2012, OIN announced the relocation of the technical management team of its conventional International Flag crude oil tanker fleet from the Newcastle, U.K. office to the Athens, Greece office. In relation to the relocation, approximately 50 employees were terminated in Newcastle. The adjustment reflects the associated severance and relocation costs allocated to OIN. As the costs are non-recurring in nature, an adjustment is made to add these costs to Adjusted EBITDA |
| - | In April 2013, OSG terminated 37 employees as part of a workforce reduction. OIN’s FY13 expense mainly reflects the portion allocated to OIN for employees who perform work for the international group |
| - | In January 2014, OSG announced that certain subsidiaries of OIN that own or charter-in vessels intend to outsource certain management services. OIN’s Q1 2014 expense includes $6.1 million related to employees who perform work for the international group related to this outsourcing reduction in force |
| (3) | Sunoco adjustment |
| - | Reflects exclusion of TCE Revenue impact of Sunoco termination fee plus acceleration of deferred revenue |
| (4) | Non-cash earnings in affiliated companies |
| - | Reflects reconciliation of cash receipts related to earnings in affiliates and earnings in affiliated companies on the income statement. An adjustment is made to exclude the non-cash portion of equity income from affiliates to present Adjusted EBITDA on a cash basis |
| (5) | Charter hire amortization of deferred costs |
| - | Removal of amortization recorded in charter-hire expense (rather than depreciation and amortization line item) relating to capital expenditures on the charter in Aker vessels paid for by OBS and recorded in other assets. The reduction in amortization of deferred costs from $3.9 million to $2.0 million from FY12 to FY13 is due to the extension to 2019 of the Aker charter in leases that increased the period over which the amortization is being distributed. The change in the deferred cost-capital expenditures balance is treated as a non-cash reconciling item to arrive at operating cash flow for purposes of OSG's cash flow statement |
| (6) | Dormant / discontinued operations |
| - | Reflects exclusion of the historical results of operations that will not be part of OIN’s operations going forward, including rejected charters, Beryl, Suezmax International pool and the full service lightering business |
| (7) | G&A |
| - | Represents adjustment to reflect the estimated annual run-rate of G&A expense upon completion of the outsourcing model |
| (8) | Outsourcing |
| - | Includes estimated fees for OIN vessels included under technical management of V.Ships and in commercial pools |
Source: Management information.
Note: The schedule above summarizes adjustments made to EBITDA to arrive at Pro Forma Adjusted EBITDA for FY12, FY13 and LTM 3/31/14.