UNITED STATES
SECURITIES AND EXCHANGE COMMISSION
Washington, D.C. 20549
FORM N-CSR
CERTIFIED SHAREHOLDER REPORT
OF
REGISTERED MANAGEMENT INVESTMENT COMPANIES
Investment Company Act file number: 811-4098
Name of Registrant: Vanguard Chester Funds
Address of Registrant: | P.O. Box 2600 |
| Valley Forge, PA 19482 |
|
|
Name and address of agent for service: | Heidi Stam, Esquire |
| P.O. Box 876 |
| Valley Forge, PA 19482 |
|
|
Registrant’s telephone number, including area code: (610) 669-1000
Date of fiscal year end: September 30
Date of reporting period: October 1, 2007–September 30, 2008
Item 1: Reports to Shareholders |

> | For its 2008 fiscal year, Vanguard PRIMECAP Fund returned about –14.0%, a disappointing result that nevertheless was significantly ahead of the fund’s comparative standards. |
> | A heavy commitment to economically sensitive information technology companies accounted for about half of the fund’s decline. |
> | For the decade ended September 30, the fund’s 9.1% average annual return for Investor Shares led both the comparable return of the S&P 500 Index and the average result for multi-capitalization growth funds by about 6 percentage points. |
Contents |
|
|
|
Your Fund’s Total Returns | 1 |
President’s Letter | 2 |
Advisor’s Report | 7 |
Fund Profile | 10 |
Performance Summary | 11 |
Financial Statements | 13 |
Your Fund’s After-Tax Returns | 25 |
About Your Fund’s Expenses | 26 |
Trustees Approve Advisory Agreement | 28 |
Glossary | 29 |
The figures shown represent past performance, which is not a guarantee of future results. (Current performance may be lower or higher than the performance data cited. For performance data current to the most recent month-end, visit our website at www.vanguard.com/performance.)
Please note: The opinions expressed in this report are just that—informed opinions. They should not be considered promises or advice. Also, please keep in mind that the information and opinions cover the period through the date on the front of this report. Of course, the risks of investing in your fund are spelled out in the prospectus.
Your Fund’s Total Returns
Fiscal Year Ended September 30, 2008 |
|
|
| Ticker | Total |
| Symbol | Returns |
Vanguard PRIMECAP Fund |
|
|
Investor Shares | VPMCX | –14.0% |
Admiral™ Shares1 | VPMAX | –13.9 |
S&P 500 Index |
| –22.0 |
Average Multi-Cap Growth Fund2 |
| –24.1 |
Your Fund’s Performance at a Glance |
|
|
|
|
September 30, 2007–September 30, 2008 |
|
|
|
|
|
|
| Distributions Per Share | |
| Starting | Ending | Income | Capital |
| Share Price | Share Price | Dividends | Gains |
Vanguard PRIMECAP Fund |
|
|
|
|
Investor Shares | $77.82 | $62.76 | $0.476 | $4.223 |
Admiral Shares | 80.82 | 65.19 | 0.586 | 4.381 |
1 A lower-cost class of shares available to many longtime shareholders and to those with significant investments in the fund.
2 Derived from data provided by Lipper Inc.
1

President’s Letter
Dear Shareholder,
For the 12 months ended September 30, Vanguard PRIMECAP Fund declined –14.0% for Investor Shares and –13.9% for Admiral Shares, holding up significantly better than the Standard & Poor’s 500 Index and the average multi-cap growth fund in a difficult environment.
Although the fiscal year began auspiciously, with many global stock markets reaching record highs in October 2007, the depth and breadth of credit market turmoil drove stocks far below their peaks by the end of the period. Nearly all sectors in the fund—and the stock market in general—lost ground. However, the advisor’s favorable stock selection among materials and beleaguered financial companies significantly boosted the fund’s relative performance.
For those who invest in the fund through taxable accounts, page 25 shows after-tax returns based on the highest tax bracket. Please note that our preliminary estimates suggest that the fund will distribute capital gains of roughly $3.60 per share for Investor Shares and $3.70 per share for Admiral Shares in December 2008.
Credit-market turbulence weighed heavily on stock prices
Troubles simmering in the credit markets for much of the past year came to a boil at the end of the fiscal period, producing several high-profile bankruptcies and putting severe pressure on stock prices
2
around the world. The broad U.S. stock market returned –21.2% for the 12 months ended September 30. In September alone, stock prices fell more than –9%. International stock markets were similarly disappointing, returning –30.0% for the full 12 months.
Policymakers and elected officials, both in the United States and abroad, responded to the upheavals with dramatic new programs designed to help stabilize the credit markets. As participants struggled to make sense of the markets’ fast-changing dynamics, stock prices were exceptionally volatile, with daily ups and downs of 2 percentage points or more becoming common.
U.S. Treasuries rallied in a nervous market
Nervousness in the stock market was echoed, and even amplified, in the bond market. For the 12 months, the broad U.S. bond market returned 3.7%, largely on the strength of Treasuries—investors’ security of choice in times of duress. Corporate bonds generally produced negative returns for the period, coming under heavy selling pressure during investors’ flight to safety. Even the municipal market, made up of generally high-quality securities issued by states and municipalities, recorded a negative 12-month return.
Market Barometer |
| ||
| Average Annual Total Returns | ||
| Periods Ended September 30, 2008 | ||
| One Year | Three Years | Five Years |
Stocks |
|
|
|
Russell 1000 Index (Large-caps) | –22.1% | 0.1% | 5.5% |
Russell 2000 Index (Small-caps) | –14.5 | 1.8 | 8.1 |
Dow Jones Wilshire 5000 Index (Entire market) | –21.2 | 0.6 | 6.0 |
MSCI All Country World Index ex USA (International) | –30.0 | 3.1 | 11.8 |
|
|
|
|
Bonds |
|
|
|
Lehman U.S. Aggregate Bond Index (Broad taxable market) | 3.7% | 4.2% | 3.8% |
Lehman Municipal Bond Index | –1.9 | 1.9 | 2.8 |
Citigroup 3-Month Treasury Bill Index | 2.6 | 4.0 | 3.1 |
|
|
|
|
CPI |
|
|
|
Consumer Price Index | 4.9% | 3.2% | 3.4% |
3
The U.S. Federal Reserve Board responded to the turmoil with a dramatic easing of monetary policy. Over the full 12 months, the Fed reduced its target for the federal funds rate from 4.75% to 2.00%. On October 8, shortly after the close of the fiscal period, the Fed cut rates again, to 1.50%. The move was made in coordination with rate cuts by several other central banks.
Stock selection added value in several sectors
The primary drivers of PRIMECAP Fund’s performance were information technology and health care holdings, which together represented about half of the fund’s average assets. The advisor has built significant positions in these two sectors in recent years, anticipating expanded use of computer chips and other electronics, particularly in the developing world, as well as strong growth in pharmaceuticals consumption. The challenging environment, however, led companies in both sectors to struggle.
As credit grew scarce, consumers and businesses (including major financial customers) cut spending on technology, a sector that accounted for about half of the fund’s retreat. Among the notable detractors were Google and the semiconductor manufacturers Texas Instruments (a top-ten holding during the year) and Micron Technology.
In health care, Genzyme and Amgen reported higher revenues and promising clinical results, and were among the fund’s
Expense Ratios1 |
|
|
|
Your Fund Compared With Its Peer Group |
|
|
|
|
|
| Average |
| Investor | Admiral | Multi-Cap |
| Shares | Shares | Growth Fund |
PRIMECAP Fund | 0.43% | 0.31% | 1.43% |
Total Returns |
|
Ten Years Ended September 30, 2008 |
|
|
|
| Average |
| Annual Return |
PRIMECAP Fund Investor Shares | 9.1% |
S&P 500 Index | 3.1 |
Average Multi-Cap Growth Fund2 | 3.5 |
The figures shown represent past performance, which is not a guarantee of future results. (Current performance may be lower or higher than the performance data cited. For performance data current to the most recent month-end, visit our website at www.vanguard.com/performance.) Note, too, that both investment returns and principal value can fluctuate widely, so an investor’s shares, when sold, could be worth more or less than their original cost.
1 The fund expense ratios shown are from the prospectus dated January 25, 2008. For the fiscal year ended September 30, 2008, the fund’s expense ratios were 0.43% for Investor Shares and 0.31% for Admiral Shares. The peer-group expense ratio is derived from data provided by Lipper Inc. and captures information through year-end 2007.
2 Derived from data provided by Lipper Inc.
4
strongest contributors. Overall, however, health care stocks trimmed almost 2 percentage points from the fund’s return for the fiscal year.
PRIMECAP Management Company, the fund’s advisor, seeks to identify companies or industries that appear to have superior long-term growth potential but are underappreciated by the market. This somewhat contrarian strategy can cause the fund’s results to diverge significantly from the performance of its benchmark index and peers, as was evident during the volatile 12 months. Two of the smaller sectors in the portfolio—materials and financials—illustrate this point.
After climbing steeply during much of the past year, prices of raw materials and industrial commodities reversed course in midsummer, leading to weak 12-month returns in the market’s materials sector. In the PRIMECAP portfolio, by contrast, the advisor managed to capitalize on rising grain and food prices through sizable investments in fertilizer producer Potash Corp. of Saskatchewan (one of the fund’s largest holdings) and Monsanto. The fund’s materials holdings rose almost 9%, compared with a decline of more than –21% for this sector in the benchmark.
And although gains were scarce in the embattled financial sector, the fund’s relatively small exposure to banks, brokerages, insurers, and other financial companies meant that shareholders escaped some of the industry’s trauma. The advisor also held some of the sector’s better performers, including insurance broker Marsh & McLennan, which notched a double-digit gain for the year—helping to moderate some of the downdraft from small positions in fallen giants AIG, Fannie Mae, and Freddie Mac.
For more on the advisor’s strategy and outlook, please see the Advisor’s Report on page 7.
Focus and discipline have enhanced the fund’s long-term results
PRIMECAP Management Company has adhered to a disciplined, focused, and patient investment philosophy throughout the fund’s almost 25-year history. The advisor’s approach to identifying out-of-favor growth companies typically results in low turnover and fairly concentrated holdings, and it has handsomely rewarded shareholders over the years.
For the ten years ended September 30, the Investor Shares of PRIMECAP Fund earned an average annual return of 9.1%, almost 6 percentage points above the result for both the fund’s benchmark index and the average return of competing multi-cap growth funds. A hypothetical initial $25,000 investment in the fund’s Investor Shares made ten years ago would have compounded to almost $60,000 by September 30, compared with about $34,000 for a similar investment in the S&P 500. And the fund’s modest expense ratio has helped investors to keep more of the portfolio’s returns, an advantage that compounds over time.
5
During turbulent times, focus on the long run
Over the past year—and more acutely in recent weeks—global financial markets have experienced an unprecedented confluence of events. Understandably, many investors have been unnerved by the headlines about shrinking investment portfolios, declining home values, tight credit, and last-minute bank rescues. We firmly believe that maintaining a long-term perspective can help investors get through such rocky periods. Selling in a panic—or letting your emotions drive your investment decisions—is often a recipe for disappointment.
Instead, it’s important to focus on the time-tested principles of balance and diversification, both within and across asset classes. That’s why we encourage you to determine a mix of stock, bond, and money market funds that is consistent with your goals, time horizon, and tolerance for the markets’ inevitable ups and downs—and then try to stick with it. Of course, even balanced portfolios have faced tough times during the past 12 months. Everything that history has taught us about the markets, however, suggests that these principles can put you in the best position to achieve long-term investment success.
Thank you for your confidence in Vanguard.
Sincerely,

F. William McNabb III
President and Chief Executive Officer
October 10, 2008
6
Advisor’s Report
For the fiscal year ended September 30, the Investor and Admiral Shares of Vanguard PRIMECAP Fund returned –14.0% and –13.9%, respectively. The fund outperformed the –22.0% return of the S&P 500 Index and the –24.1% average return of multi-cap growth funds.
Investment environment
As the fiscal year came to a close, the deterioration in the financial sector accelerated. Many of the larger players experienced significant asset write-downs, recapitalizations, and even bankruptcies. The urgency to deleverage and rapidly falling stock prices led to a further decline in the sector.
The Federal Reserve Board and the U.S. Treasury Department responded swiftly, introducing a number of programs designed to help stabilize the markets, including the $700 billion Emergency Economic Stabilization Act of 2008. The act gives the Treasury broad authority to help banks strengthen their balance sheets. The bill’s passage by Congress was keenly anticipated—passage came a few days after the end of the fund’s fiscal year—but initially, at least, the financial markets remained under severe pressure. Stock prices fell sharply, and credit-market activity came to a near-standstill.
These dramatic events capped a 12-month period of already-poor stock market performance. What at first looked like a slowdown seemed likely to become a recession. The employment situation continues to deteriorate, and retail sales have declined significantly. Although the sharp correction in energy and commodity prices has hurt investors, the cost relief to consumers will potentially have the same impact as a tax cut and will help overextended household budgets.
Management of the fund
Our primary objective is to identify companies whose long-term fundamentals will evolve significantly better than the current Wall Street consensus or valuation suggests. To help find these underappreciated companies, we rely on rigorous fundamental research and meet not only with company management but also with competitors, suppliers, and customers. We invest with a long-term perspective, in the expectation that over a three- to five-year horizon our choices will outperform the market.
In recent years, this process has led us to establish large positions in information technology and health care stocks. Together, these holdings accounted for more than 50% of portfolio assets at the end of the period. Both sectors struggled during the past 12 months; however, some bright spots included Amgen and Genzyme, both of which have benefited from investors’ renewed interest in biotech stocks. Among the weaker performers were pharmaceuticals giant Eli Lilly, which has been buffeted by regulatory setbacks, and information technology holdings Texas
7
Instruments and Micron Technologies, which have seen their share prices fall as demand for computers and computer chips has softened.
During the past 12 months, the fund earned its highest returns in the materials sector. Potash Corp. of Saskatchewan, the world’s leading supplier of fertilizer compound potash, and Monsanto, which produces genetically engineered seeds and high-value-added herbicides, have capitalized on the global boom in grain prices. The fund also benefited from having limited exposure to financial stocks. At the end of the period, financials accounted for less than 5% of the fund’s assets, one-third the benchmark weighting. This low weighting reflects our long-standing assessment that the sector’s opaque financial statements make these businesses difficult to value. Results were, however, hurt by insurance company American International Group, which was essentially taken over by the Treasury Department. While our allocation to AIG was small, the company’s approximately 95% share price decline trimmed almost a full percentage point from the fund’s return.
Outlook
As previously mentioned, our greatest areas of conviction remain health care and information technology. The bearish arguments on the health care sector are well known: increased scrutiny during the Food and Drug Administration (FDA) approval process, patent expirations, generic competition, price controls, and government intervention. We have been surprised and disappointed by the difficulties that pharmaceutical companies have encountered in trying to get new products approved by the FDA. In our view, however, investors are overlooking some companies’ promising drug pipelines, exciting and innovative new medical devices, and valuations that are near 30-year lows. We have positioned the portfolio to take advantage of a potential shift in market leadership, and we believe the innovation and financial strength of the health care industry are likely to be recognized in the coming years.
Historically, technology spending has been cyclical, and tech stocks are trading at valuations that suggest this is still the case. In addition, there is pervasive fear that the meltdown in the financial sector will have a significant impact on technology spending, as financial firms have traditionally been large consumers of information technology. We think the tech industry has changed dramatically over the last ten years: Market shares are more concentrated, companies are more global in nature, and balance sheets are among the strongest in corporate America. We maintain our conviction in the companies we own in this area, and we look for a recovery in 2009.
The most immediate concern is the financial-market turmoil. The lack of liquidity in many areas of the market is debilitating for corporate America. Long
8
term, we believe the equity markets will recover and investors will be rewarded for purchasing equities. However, the recovery in economic growth will take time, as the system needs to deleverage the excesses of the past seven or eight years. Unlike in some prior recoveries, we do not view the consumer as the engine for growth; consumers have taken on excessive debt and need to repair their damaged balance sheets. Personal saving has been nonexistent and needs to increase. The process will take time, and patience is required.
We remain optimistic about the fund’s portfolio. We believe that the companies we hold are positioned well for what might prove to be an increasingly difficult economic environment. In difficult times, fundamentals matter most, and we will continue to search for companies whose valuations now make them attractive long-term investments.
We thank you for entrusting your hard-earned capital to us. We will continue to work diligently to prove worthy of that trust.
Howard B. Schow |
| Theo A. Kolokotrones |
Portfolio Manager |
| Portfolio Manager |
| Joel P. Fried |
|
| Portfolio Manager |
|
Mitchell J. Milias |
| Alfred W. Mordecai |
Portfolio Manager |
| Portfolio Manager |
| David H. Van Slooten |
|
| Portfolio Manager |
|
|
|
|
PRIMECAP Management Company |
| October 14, 2008 |
9
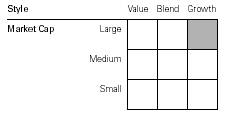
Fund Profile
As of September 30, 2008
Portfolio Characteristics |
|
|
|
| Comparative |
| Fund | Index1 |
Number of Stocks | 120 | 499 |
Median Market Cap | $29.5B | $43.8B |
Price/Earnings Ratio | 17.0x | 14.8x |
Price/Book Ratio | 2.6x | 2.3x |
Yield2 |
| 2.4% |
Investor Shares | 0.9% |
|
Admiral Shares | 1.0% |
|
Return on Equity | 18.9% | 21.3% |
Earnings Growth Rate | 24.9% | 17.8% |
Foreign Holdings | 12.5% | 0% |
Turnover Rate | 11% | — |
Expense Ratio (9/30/2007)3 |
| — |
Investor Shares | 0.43% |
|
Admiral Shares | 0.31% |
|
Short-Term Reserves | 3.6% | — |
Sector Diversification (% of equity exposure) | ||
|
| Comparative |
| Fund | Index1 |
Consumer Discretionary | 12.0% | 8.5% |
Consumer Staples | 1.8 | 12.2 |
Energy | 6.9 | 13.4 |
Financials | 4.8 | 15.6 |
Health Care | 25.2 | 13.1 |
Industrials | 12.7 | 11.1 |
Information Technology | 28.4 | 16.0 |
Materials | 7.9 | 3.4 |
Telecommunication Services | 0.2 | 3.1 |
Utilities | 0.1 | 3.6 |
Volatility Measures4 |
|
| Fund Versus |
| Comparative Index1 |
R-Squared | 0.86 |
Beta | 0.92 |
Ten Largest Holdings5 (% of total net assets) | ||
|
|
|
Eli Lilly & Co. | pharmaceuticals | 4.0% |
FedEx Corp. | air freight and |
|
| logistics | 3.7 |
Medtronic, Inc. | health care |
|
| equipment | 3.7 |
Novartis AG ADR | pharmaceuticals | 3.5 |
Adobe Systems, Inc. | application software | 3.4 |
Amgen, Inc. | biotechnology | 3.3 |
Oracle Corp. | systems software | 2.9 |
Potash Corp. of | fertilizers and |
|
Saskatchewan, Inc. | agricultural |
|
| chemicals | 2.9 |
DIRECTV Group, Inc. | cable and satelite | 2.6 |
Microsoft Corp. | systems software | 2.4 |
Top Ten |
| 32.4% |
Investment Focus
1 S&P 500 Index.
2 30-day SEC yield for the fund; annualized dividend yield for the index.
3 The expense ratios shown are from the prospectus dated January 25, 2008. For the fiscal year ended September 30, 2008, the expense ratios were 0.43% for Investor Shares and 0.31% for Admiral Shares.
4 For an explanation of R-squared, beta, and other terms used here, see the Glossary.
5 The holdings listed exclude any temporary cash investments and equity index products.
10
Performance Summary
All of the returns in this report represent past performance, which is not a guarantee of future results that may be achieved by the fund. (Current performance may be lower or higher than the performance data cited. For performance data current to the most recent month-end, visit our website at www.vanguard.com/performance.) Note, too, that both investment returns and principal value can fluctuate widely, so an investor’s shares, when sold, could be worth more or less than their original cost. The returns shown do not reflect taxes that a shareholder would pay on fund distributions or on the sale of fund shares.
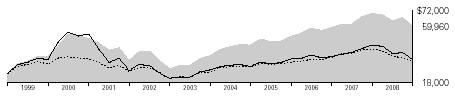
Cumulative Performance: September 30, 1998–September 30, 2008
Initial Investment of $25,000
| Average Annual Total Returns | Final Value | ||
| Periods Ended September 30, 2008 | of a $25,000 | ||
| One Year | Five Years | Ten Years | Investment |
PRIMECAP Fund Investor Shares1,2 | –13.96% | 9.39% | 9.14% | $59,960 |
S&P 500 Index | –21.98 | 5.17 | 3.06 | 33,800 |
Average Multi-Cap Growth Fund3 | –24.07 | 4.79 | 3.45 | 35,108 |
|
|
|
| Final Value |
|
|
| Since | of a $100,000 |
| One Year | Five Years | Inception4 | Investment |
PRIMECAP Fund Admiral Shares1 | –13.85% | 9.55% | 6.89% | $158,143 |
S&P 500 Index | –21.98 | 5.17 | 2.47 | 118,275 |
1 Total return figures do not reflect the 1% redemption fee assessed on redemptions of shares held less than one year, or the 1% fee assessed until March 23, 2005, on shares purchased on or after April 23, 2001, and held for less than five years.
2 Total returns do not include the account service fee that may be applicable to certain accounts with balances below $10,000.
3 Derived from data provided by Lipper Inc.
4 Performance for the fund’s Admiral Shares and its comparative standard is calculated since the Admiral Shares’ inception: November 12, 2001.
11
Fiscal-Year Total Returns (%): September 30, 1998–September 30, 2008
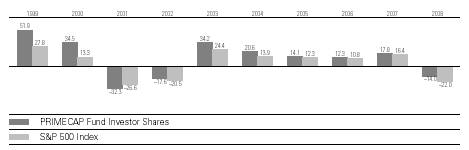
Note: See Financial Highlights tables for dividend and capital gains information.
12
Financial Statements
Statement of Net Assets
As of September 30, 2008
The fund provides a complete list of its holdings four times in each fiscal year, at the quarter-ends. For the second and fourth fiscal quarters, the lists appear in the fund’s semiannual and annual reports to shareholders. For the first and third fiscal quarters, the fund files the lists with the Securities and Exchange Commission on Form N-Q. Shareholders can look up the fund’s Forms N-Q on the SEC’s website at www.sec.gov. Forms N-Q may also be reviewed and copied at the SEC’s Public Reference Room (see the back cover of this report for further information).
|
|
| Market |
|
|
| Value• |
|
| Shares | ($000) |
Common Stocks (96.5%) |
|
| |
Consumer Discretionary (11.6%) |
|
| |
* | DIRECTV Group, Inc. | 28,720,807 | 751,624 |
1 | Whirlpool Corp. | 5,585,000 | 442,835 |
| TJX Cos., Inc. | 12,844,800 | 392,023 |
| Sony Corp. ADR | 12,150,000 | 375,070 |
| Target Corp. | 5,019,000 | 246,182 |
* | Kohl’s Corp. | 5,172,400 | 238,344 |
| The Walt Disney Co. | 5,650,000 | 173,398 |
* | Amazon.com, Inc. | 2,302,600 | 167,537 |
| Eastman Kodak Co. | 9,000,000 | 138,420 |
* | Bed Bath & Beyond, Inc. | 3,350,975 | 105,254 |
| Mattel, Inc. | 4,600,000 | 82,984 |
| Best Buy Co., Inc. | 1,575,000 | 59,063 |
| Lowe’s Cos., Inc. | 2,450,000 | 58,041 |
| Carnival Corp. | 1,200,000 | 42,420 |
* | Viacom Inc. Class B | 1,400,000 | 34,776 |
| Comcast Corp. Class A | 831,450 | 16,321 |
| Abercrombie & Fitch Co. | 375,000 | 14,794 |
|
|
| 3,339,086 |
Consumer Staples (1.8%) |
|
| |
| Costco Wholesale Corp. | 6,900,000 | 448,017 |
| Avon Products, Inc. | 1,600,000 | 66,512 |
|
|
| 514,529 |
Energy (6.6%) |
|
| |
| Schlumberger Ltd. | 5,103,500 | 398,532 |
| Noble Energy, Inc. | 5,960,000 | 331,316 |
| EOG Resources, Inc. | 3,045,000 | 272,406 |
| Peabody Energy Corp. | 5,513,600 | 248,112 |
| Hess Corp. | 3,000,000 | 246,240 |
| EnCana Corp. | 2,257,000 | 148,353 |
* | Plains Exploration & |
|
|
| Production Co. | 3,869,620 | 136,056 |
| ConocoPhillips Co. | 900,000 | 65,925 |
| Murphy Oil Corp. | 350,000 | 22,449 |
* | Patriot Coal Corp. | 720,000 | 20,916 |
| Noble Corp. | 470,000 | 20,633 |
* | National Oilwell Varco Inc. | 13,000 | 653 |
|
|
| 1,911,591 |
|
|
| Market |
|
|
| Value• |
|
| Shares | ($000) |
Financials (4.6%) |
|
| |
| Marsh & McLennan |
|
|
| Cos., Inc. | 13,778,000 | 437,589 |
* | Berkshire Hathaway Inc. |
|
|
| Class B | 65,600 | 288,312 |
| Discover Financial |
|
|
| Services | 10,140,800 | 140,146 |
| The Chubb Corp. | 2,400,000 | 131,760 |
| Bank of New York |
|
|
| Mellon Corp. | 3,881,140 | 126,448 |
| AFLAC Inc. | 980,000 | 57,575 |
| Wells Fargo & Co. | 1,150,000 | 43,159 |
| JPMorgan Chase & Co. | 880,000 | 41,096 |
| Progressive Corp. of Ohio | 1,650,000 | 28,710 |
| Capital One Financial Corp. | 505,000 | 25,755 |
| State Street Corp. | 180,000 | 10,238 |
| Fifth Third Bancorp | 445,000 | 5,296 |
* | SLM Corp. | 100,000 | 1,234 |
| Citigroup, Inc. | 60,000 | 1,231 |
|
|
| 1,338,549 |
Health Care (24.3%) |
|
| |
| Eli Lilly & Co. | 26,214,500 | 1,154,225 |
| Medtronic, Inc. | 21,206,652 | 1,062,453 |
| Novartis AG ADR | 18,859,765 | 996,550 |
* | Amgen, Inc. | 15,989,500 | 947,698 |
* | Biogen Idec Inc. | 13,750,893 | 691,532 |
* | Boston Scientific Corp. | 39,417,610 | 483,654 |
| Roche Holdings AG | 3,050,000 | 477,453 |
* | Genzyme Corp. | 4,400,000 | 355,916 |
1 | Applied Biosystems Inc. | 8,799,800 | 301,393 |
| GlaxoSmithKline PLC ADR | 5,755,000 | 250,112 |
*,1 | Millipore Corp. | 2,820,000 | 194,016 |
| Wyeth | 1,250,000 | 46,175 |
* | Sepracor Inc. | 2,200,000 | 40,282 |
* | Genentech, Inc. | 156,000 | 13,834 |
| Sanofi-Aventis ADR | 160,000 | 5,259 |
|
|
| 7,020,552 |
13
|
|
| Market |
|
|
| Value• |
|
| Shares | ($000) |
Industrials (12.2%) |
|
| |
| FedEx Corp. | 13,591,800 | 1,074,296 |
| Southwest Airlines Co. | 34,123,300 | 495,129 |
| C.H. Robinson |
|
|
| Worldwide Inc. | 6,541,000 | 333,329 |
| Caterpillar, Inc. | 4,956,900 | 295,431 |
| Honeywell |
|
|
| International Inc. | 6,697,400 | 278,277 |
| United Parcel Service, Inc. | 3,515,000 | 221,058 |
| Union Pacific Corp. | 2,501,300 | 177,993 |
*,1 | AMR Corp. | 15,219,100 | 149,452 |
| Deere & Co. | 2,251,900 | 111,469 |
| Canadian Pacific |
|
|
| Railway Ltd. | 1,632,700 | 87,937 |
| The Boeing Co. | 1,404,650 | 80,557 |
| Donaldson Co., Inc. | 1,600,000 | 67,056 |
*,1 | Alaska Air Group, Inc. | 2,800,000 | 57,092 |
| Granite Construction Co. | 1,500,000 | 53,730 |
| Pall Corp. | 750,000 | 25,793 |
| 3M Co. | 300,000 | 20,493 |
| Norfolk Southern Corp. | 30,500 | 2,019 |
| Canadian National |
|
|
| Railway Co. | 4,600 | 220 |
|
|
| 3,531,331 |
Information Technology (27.5%) |
|
| |
| Communications Equipment (3.9%) |
|
|
| QUALCOMM Inc. | 10,733,000 | 461,197 |
| Corning, Inc. | 16,280,400 | 254,626 |
^ | LM Ericsson Telephone |
|
|
| Co. ADR Class B | 17,255,714 | 162,721 |
1 | Plantronics, Inc. | 4,701,500 | 105,878 |
| Motorola, Inc. | 14,170,000 | 101,174 |
* | Cisco Systems, Inc. | 1,550,000 | 34,968 |
* | Nortel Networks Corp. | 5,472,040 | 12,257 |
|
|
|
|
| Computers & Peripherals (2.4%) |
|
|
| Hewlett-Packard Co. | 8,650,000 | 399,976 |
* | EMC Corp. | 22,229,200 | 265,861 |
* | Dell Inc. | 1,380,000 | 22,743 |
|
|
|
|
| Electronic Equipment, Instruments & |
|
|
| Components (0.0%) |
|
|
* | Agilent Technologies, Inc. | 107,681 | 3,194 |
|
|
|
|
| Internet Software & Services (2.9%) |
|
|
* | Google Inc. | 1,649,000 | 660,457 |
* | eBay Inc. | 6,625,000 | 148,267 |
* | Yahoo! Inc. | 882,400 | 15,266 |
|
|
| Market |
|
|
| Value• |
|
| Shares | ($000) |
| IT Services (0.5%) |
|
|
| Accenture Ltd. | 4,136,200 | 157,175 |
|
|
|
|
| Semiconductors & Semiconductor |
|
|
| Equipment (5.4%) |
|
|
| Texas Instruments, Inc. | 31,030,000 | 667,145 |
| Intel Corp. | 15,000,000 | 280,950 |
* | NVIDIA Corp. | 15,150,000 | 162,256 |
* | Micron Technology, Inc. | 36,512,373 | 147,875 |
| Applied Materials, Inc. | 7,958,000 | 120,405 |
| KLA-Tencor Corp. | 2,691,000 | 85,170 |
| ASML Holding NV |
|
|
| (New York Shares) | 3,623,111 | 63,803 |
* | Rambus Inc. | 2,500,000 | 32,125 |
* | Entegris Inc. | 2,583,472 | 12,504 |
* | Verigy Ltd. | 13,184 | 215 |
|
|
|
|
| Software (12.4%) |
|
|
* | Adobe Systems, Inc. | 25,055,000 | 988,921 |
* | Oracle Corp. | 41,550,600 | 843,893 |
| Microsoft Corp. | 26,490,000 | 707,018 |
*,1 | Intuit, Inc. | 17,300,000 | 546,853 |
*,1 | Citrix Systems, Inc. | 9,950,000 | 251,337 |
* | Symantec Corp. | 12,009,200 | 235,140 |
|
|
| 7,951,370 |
Materials (7.6%) |
|
| |
| Potash Corp. of |
|
|
| Saskatchewan, Inc. | 6,243,300 | 824,178 |
| Monsanto Co. | 6,351,460 | 628,667 |
| Praxair, Inc. | 3,670,867 | 263,348 |
| Weyerhaeuser Co. | 2,377,231 | 144,013 |
| Alcoa Inc. | 4,854,000 | 109,603 |
^ | Vulcan Materials Co. | 1,100,000 | 81,950 |
* | Domtar Corp. | 12,617,723 | 58,042 |
| Dow Chemical Co. | 1,500,000 | 47,670 |
| Freeport-McMoRan |
|
|
| Copper & Gold, Inc. |
|
|
| Class B | 600,000 | 34,110 |
|
|
| 2,191,581 |
Telecommunication Services (0.2%) |
|
| |
| Sprint Nextel Corp. | 11,290,000 | 68,869 |
|
|
|
|
Utilities (0.1%) |
|
| |
* | AES Corp. | 1,635,000 | 19,113 |
Total Common Stocks |
|
| |
(Cost $21,430,683) |
| 27,886,571 | |
14
|
| Market |
|
| Value• |
| Shares | ($000) |
Temporary Cash Investment (4.3%) |
| |
2,3 Vanguard Market Liquidity |
| |
Fund, 2.296% |
|
|
(Cost $1,234,248) | 1,234,247,604 | 1,234,248 |
Total Investments (100.8%) |
| |
(Cost $22,664,931) |
| 29,120,819 |
Other Assets and Liabilities— |
| |
Net (–0.8%) |
| (236,273) |
Net Assets (100%) |
| 28,884,546 |
|
|
|
Statement of Assets and Liabilities |
| |
Assets |
|
|
Investments in Securites, at Value | 29,120,819 | |
Receivables for Capital Shares Issued | 27,380 | |
Other Assets |
| 24,769 |
Total Assets |
| 29,172,968 |
Liabilities |
|
|
Security Lending Collateral |
|
|
Payable to Brokers |
| 142,154 |
Payables for Investment |
|
|
Securities Purchased |
| 21,850 |
Payables for Capital |
|
|
Shares Redeemed |
| 47,518 |
Other Liabilities |
| 76,900 |
Total Liabilities |
| 288,422 |
Net Assets |
| 28,884,546 |
At September 30, 2008, net assets consisted of: | |
| Amount |
| ($000) |
Paid-in Capital | 20,660,644 |
Undistributed |
|
Net Investment Income | 127,927 |
Accumulated Net |
|
Realized Gains | 1,640,319 |
Unrealized Appreciation |
|
(Depreciation) |
|
Investment Securities | 6,455,888 |
Foreign Currencies | (232) |
Net Assets | 28,884,546 |
|
|
Investor Shares—Net Assets |
|
Applicable to 306,456,208 outstanding |
|
$.001 par value shares of beneficial |
|
interest (unlimited authorization) | 19,233,520 |
Net Asset Value Per Share— |
|
Investor Shares | $62.76 |
|
|
Admiral Shares—Net Assets |
|
Applicable to 148,054,160 outstanding |
|
$.001 par value shares of beneficial |
|
interest (unlimited authorization) | 9,651,026 |
Net Asset Value Per Share— |
|
Admiral Shares | $65.19 |
• | See Note A in Notes to Financial Statements. |
* | Non-income-producing security. |
^ | Part of security position is on loan to broker-dealers. The total value of securities on loan is $135,043,000. |
1 Considered an affiliated company of the fund as the fund owns more than 5% of the outstanding voting securities of such company.
2 Affiliated money market fund available only to Vanguard funds and certain trusts and accounts managed by Vanguard. Rate shown is the 7-day yield.
3 Includes $142,154,000 of collateral received for securities on loan.
See accompanying Notes, which are an integral part of the Financial Statements.
ADR—American Depositary Receipt.
15
Statement of Operations
| Year Ended |
| September 30, 2008 |
| ($000) |
Investment Income |
|
Income |
|
Dividends1,2 | 337,215 |
Interest2 | 45,571 |
Security Lending | 2,817 |
Total Income | 385,603 |
Expenses |
|
Investment Advisory Fees—Note B | 67,558 |
The Vanguard Group—Note C |
|
Management and Administrative—Investor Shares | 42,534 |
Management and Administrative—Admiral Shares | 8,244 |
Marketing and Distribution—Investor Shares | 4,224 |
Marketing and Distribution—Admiral Shares | 1,731 |
Custodian Fees | 475 |
Auditing Fees | 21 |
Shareholders’ Reports—Investor Shares | 306 |
Shareholders’ Reports—Admiral Shares | 89 |
Trustees’ Fees and Expenses | 45 |
Total Expenses | 125,227 |
Net Investment Income | 260,376 |
Realized Net Gain (Loss) |
|
Investment Securities Sold2 | 2,165,773 |
Foreign Currencies | (132) |
Realized Net Gain (Loss) | 2,165,641 |
Change in Unrealized Appreciation (Depreciation) |
|
Investment Securities | (7,148,917) |
Foreign Currencies | (237) |
Change in Unrealized Appreciation (Depreciation) | (7,149,154) |
Net Increase (Decrease) in Net Assets Resulting from Operations | (4,723,137) |
1 Dividends are net of foreign withholding taxes of $9,071,000.
2 Dividend income, interest income, and realized net gain (loss) from affiliated companies of the fund were $10,267,000, $45,571,000, and $118,543,000, respectively.
See accompanying Notes, which are an integral part of the Financial Statements.
16
Statement of Changes in Net Assets
| Year Ended September 30, | |
| 2008 | 2007 |
| ($000) | ($000) |
Increase (Decrease) in Net Assets |
|
|
Operations |
|
|
Net Investment Income | 260,376 | 213,011 |
Realized Net Gain (Loss) | 2,165,641 | 1,902,346 |
Change in Unrealized Appreciation (Depreciation) | (7,149,154) | 3,159,826 |
Net Increase (Decrease) in Net Assets Resulting from Operations | (4,723,137) | 5,275,183 |
Distributions |
|
|
Net Investment Income |
|
|
Investor Shares | (140,925) | (134,480) |
Admiral Shares | (78,490) | (68,524) |
Realized Capital Gain1 |
|
|
Investor Shares | (1,250,270) | (1,222,618) |
Admiral Shares | (586,796) | (498,927) |
Total Distributions | (2,056,481) | (1,924,549) |
Capital Share Transactions |
|
|
Investor Shares | 374,088 | (733,663) |
Admiral Shares | 1,290,705 | 1,011,830 |
Net Increase (Decrease) from Capital Share Transactions | 1,664,793 | 278,167 |
Total Increase (Decrease) | (5,114,825) | 3,628,801 |
Net Assets |
|
|
Beginning of Period | 33,999,371 | 30,370,570 |
End of Period2 | 28,884,546 | 33,999,371 |
1 Includes fiscal 2008 and 2007 short-term gain distributions totaling $42,196,000 and $16,355,000, respectively. Short-term gain distributions are treated as ordinary income dividends for tax purposes.
2 Net Assets—End of Period includes undistributed net investment income of $127,927,000 and $104,080,000.
See accompanying Notes, which are an integral part of the Financial Statements.
17
Financial Highlights
Investor Shares |
|
|
|
|
|
|
|
|
|
|
| Sept. 1, | Year |
|
|
|
|
| 2004, to | Ended |
For a Share Outstanding | Year Ended September 30, | Sept. 30, | Aug. 31, | |||
Throughout Each Period | 2008 | 2007 | 2006 | 2005 | 20041 | 2004 |
Net Asset Value, Beginning of Period | $77.82 | $70.30 | $64.79 | $57.18 | $54.93 | $48.50 |
Investment Operations |
|
|
|
|
|
|
Net Investment Income | .552 | .460 | .437 | .5112 | .030 | .250 |
Net Realized and Unrealized Gain (Loss) |
|
|
|
|
|
|
on Investments | (10.913) | 11.500 | 7.367 | 7.544 | 2.220 | 6.390 |
Total from Investment Operations | (10.361) | 11.960 | 7.804 | 8.055 | 2.250 | 6.640 |
Distributions |
|
|
|
|
|
|
Dividends from Net Investment Income | (.476) | (.440) | (.386) | (.445) | — | (.210) |
Distributions from Realized Capital Gains | (4.223) | (4.000) | (1.908) | — | — | — |
Total Distributions | (4.699) | (4.440) | (2.294) | (.445) | — | (.210) |
Net Asset Value, End of Period | $62.76 | $77.82 | $70.30 | $64.79 | $57.18 | $54.93 |
|
|
|
|
|
|
|
Total Return3 | –13.96% | 17.77% | 12.30% | 14.13% | 4.10% | 13.72% |
|
|
|
|
|
|
|
Ratios/Supplemental Data |
|
|
|
|
|
|
Net Assets, End of Period (Millions) | $19,234 | $23,435 | $21,828 | $20,643 | $20,933 | $20,115 |
Ratio of Total Expenses to |
|
|
|
|
|
|
Average Net Assets | 0.43% | 0.43% | 0.46% | 0.46% | 0.45%4 | 0.46% |
Ratio of Net Investment Income to |
|
|
|
|
|
|
Average Net Assets | 0.76% | 0.62% | 0.64% | 0.85%2 | 0.57%4 | 0.48% |
Portfolio Turnover Rate | 11% | 11% | 10% | 12% | 1% | 9% |
1 The fund’s fiscal year-end changed from August 31 to September 30, effective September 30, 2004.
2 Net investment income per share and the ratio of net investment income to average net assets include $.144 and 0.24%, respectively, resulting from a special dividend from Microsoft Corp. in November 2004.
3 Total returns do not reflect the 1% fee assessed on redemptions after March 23, 2005, of shares held for less than one year, or the 1% fee assessed until March 23, 2005, on shares purchased on or after April 23, 2001, and held for less than five years. Total returns do not include the account service fee that may be applicable to certain accounts with balances below $10,000.
4 Annualized.
See accompanying Notes, which are an integral part of the Financial Statements.
18
Admiral Shares |
|
|
|
|
|
|
|
|
|
|
| Sept. 1, | Year |
|
|
|
|
| 2004, to | Ended |
For a Share Outstanding | Year Ended September 30, | Sept. 30, | Aug. 31, | |||
Throughout Each Period | 2008 | 2007 | 2006 | 2005 | 20041 | 2004 |
Net Asset Value, Beginning of Period | $80.82 | $73.03 | $67.28 | $59.36 | $57.02 | $50.34 |
Investment Operations |
|
|
|
|
|
|
Net Investment Income | .664 | .580 | .562 | .6362 | .030 | .350 |
Net Realized and Unrealized Gain (Loss) |
|
|
|
|
|
|
on Investments | (11.327) | 11.930 | 7.640 | 7.836 | 2.310 | 6.620 |
Total from Investment Operations | (10.663) | 12.510 | 8.202 | 8.472 | 2.340 | 6.970 |
Distributions |
|
|
|
|
|
|
Dividends from Net Investment Income | (.586) | (.570) | (.472) | (.552) | — | (.290) |
Distributions from Realized Capital Gains | (4.381) | (4.150) | (1.980) | — | — | — |
Total Distributions | (4.967) | (4.720) | (2.452) | (.552) | — | (.290) |
Net Asset Value, End of Period | $65.19 | $80.82 | $73.03 | $67.28 | $59.36 | $57.02 |
|
|
|
|
|
|
|
Total Return3 | –13.85% | 17.91% | 12.45% | 14.33% | 4.10% | 13.88% |
|
|
|
|
|
|
|
Ratios/Supplemental Data |
|
|
|
|
|
|
Net Assets, End of Period (Millions) | $9,651 | $10,565 | $8,542 | $6,930 | $3,773 | $3,605 |
Ratio of Total Expenses to |
|
|
|
|
|
|
Average Net Assets | 0.31% | 0.31% | 0.31% | 0.31% | 0.30%4 | 0.31% |
Ratio of Net Investment Income to |
|
|
|
|
|
|
Average Net Assets | 0.88% | 0.74% | 0.79% | 0.96%2 | 0.72%4 | 0.63% |
Portfolio Turnover Rate | 11% | 11% | 10% | 12% | 1% | 9% |
1 The fund’s fiscal year-end changed from August 31 to September 30, effective September 30, 2004.
2 Net investment income per share and the ratio of net investment income to average net assets include $.149 and 0.24%, respectively, resulting from a special dividend from Microsoft Corp. in November 2004.
3 Total returns do not reflect the 1% fee assessed on redemptions after March 23, 2005, of shares held for less than one year, or the 1% fee previously assessed on shares held for less than five years.
4 Annualized.
See accompanying Notes, which are an integral part of the Financial Statements.
19
Notes to Financial Statements
Vanguard PRIMECAP Fund is registered under the Investment Company Act of 1940 as an open-end investment company, or mutual fund. The fund offers two classes of shares: Investor Shares and Admiral Shares. Investor Shares are available to any investor who meets the fund’s minimum purchase requirements. Admiral Shares are designed for investors who meet certain administrative, service, tenure, and account-size criteria.
A. The following significant accounting policies conform to generally accepted accounting principles for U.S. mutual funds. The fund consistently follows such policies in preparing its financial statements.
1. Security Valuation: Securities are valued as of the close of trading on the New York Stock Exchange (generally 4 p.m., Eastern time) on the valuation date. Equity securities are valued at the latest quoted sales prices or official closing prices taken from the primary market in which each security trades; such securities not traded on the valuation date are valued at the mean of the latest quoted bid and asked prices. Securities for which market quotations are not readily available, or whose values have been affected by events occurring before the fund’s pricing time but after the close of the securities’ primary markets, are valued at their fair values calculated according to procedures adopted by the board of trustees. These procedures include obtaining quotations from an independent pricing service, monitoring news to identify significant market- or security-specific events, and evaluating changes in the values of foreign market proxies (for example, ADRs, futures contracts, or exchange-traded funds), between the time the foreign markets close and the fund’s pricing time. When fair-value pricing is employed, the prices of securities used by a fund to calculate its net asset value may differ from quoted or published prices for the same securities. Investments in Vanguard Market Liquidity Fund are valued at that fund’s net asset value.
2. Foreign Currency: Securities and other assets and liabilities denominated in foreign currencies are translated into U.S. dollars using exchange rates obtained from an independent third party as of the fund’s pricing time on the valuation date. Realized gains (losses) and unrealized appreciation (depreciation) on investment securities include the effects of changes in exchange rates since the securities were purchased, combined with the effects of changes in security prices. Fluctuations in the value of other assets and liabilities resulting from changes in exchange rates are recorded as unrealized foreign currency gains (losses) until the assets or liabilities are settled in cash, at which time they are recorded as realized foreign currency gains (losses).
3. Federal Income Taxes: The fund intends to continue to qualify as a regulated investment company and distribute all of its taxable income. Management has analyzed the fund’s tax positions taken on federal income tax returns for all open tax years (tax years ended September 30, 2005–2008), and has concluded that no provision for federal income tax is required in the fund’s financial statements.
4. Distributions: Distributions to shareholders are recorded on the ex-dividend date.
5. Security Lending: The fund may lend its securities to qualified institutional borrowers to earn additional income. Security loans are required to be secured at all times by collateral at least equal to the market value of securities loaned. The fund invests cash collateral received in Vanguard Market Liquidity Fund, and records a liability for the return of the collateral, during the period the securities are on loan. Security lending income represents the income earned on investing cash collateral, less expenses associated with the loan.
20
6. Other: Dividend income is recorded on the ex-dividend date. Interest income includes income distributions received from Vanguard Market Liquidity Fund and is accrued daily. Security transactions are accounted for on the date securities are bought or sold. Costs used to determine realized gains (losses) on the sale of investment securities are those of the specific securities sold. Fees assessed on redemptions of capital shares are credited to paid-in capital.
Each class of shares has equal rights as to assets and earnings, except that each class separately bears certain class-specific expenses related to maintenance of shareholder accounts (included in Management and Administrative expenses) and shareholder reporting. Marketing and distribution expenses are allocated to each class of shares based on a method approved by the board of trustees. Income, other non-class-specific expenses, and gains and losses on investments are allocated to each class of shares based on its relative net assets.
B. PRIMECAP Management Company provides investment advisory services to the fund for a fee calculated at an annual percentage rate of average net assets. For the year ended September 30, 2008, the investment advisory fee represented an effective annual rate of 0.21% of the fund’s average net assets.
C. The Vanguard Group furnishes at cost corporate management, administrative, marketing, and distribution services. The costs of such services are allocated to the fund under methods approved by the board of trustees. The fund has committed to provide up to 0.40% of its net assets in capital contributions to Vanguard. At September 30, 2008, the fund had contributed capital of $2,767,000 to Vanguard (included in Other Assets), representing 0.01% of the fund’s net assets and 2.77% of Vanguard’s capitalization. The fund’s trustees and officers are also directors and officers of Vanguard.
D. Distributions are determined on a tax basis and may differ from net investment income and realized capital gains for financial reporting purposes. Differences may be permanent or temporary. Permanent differences are reclassified among capital accounts in the financial statements to reflect their tax character. Temporary differences arise when certain items of income, expense, gain, or loss are recognized in different periods for financial statement and tax purposes; these differences will reverse at some time in the future. Differences in classification may also result from the treatment of short-term gains as ordinary income for tax purposes.
During the year ended September 30, 2008, the fund realized net foreign currency losses of $132,000, which decreased distributable net income for tax purposes; accordingly, such losses have been reclassified from accumulated net realized gains to undistributed net investment income.
The fund used a tax accounting practice to treat a portion of the price of capital shares redeemed during the year as distributions from net investment income and realized capital gains. Accordingly, the fund has reclassified $16,982,000 from undistributed net investment income, and $137,747,000 from accumulated net realized gains, to paid-in capital.
For tax purposes, at September 30, 2008, the fund had $182,005,000 of ordinary income and $1,640,516,000 of long-term capital gains available for distribution.
At September 30, 2008, the cost of investment securities for tax purposes was $22,664,931,000. Net unrealized appreciation of investment securities for tax purposes was $6,455,888,000, consisting of unrealized gains of $9,284,450,000 on securities that had risen in value since their purchase and $2,828,562,000 in unrealized losses on securities that had fallen in value since their purchase.
E. During the year ended September 30, 2008, the fund purchased $3,480,174,000 of investment securities and sold $3,930,283,000 of investment securities, other than temporary cash investments.
21
F. Capital share transactions for each class of shares were:
|
| Year Ended September 30, | ||
|
| 2008 |
| 2007 |
| Amount | Shares | Amount | Shares |
| ($000) | (000) | ($000) | (000) |
Investor Shares |
|
|
|
|
Issued | 2,077,166 | 29,316 | 1,811,548 | 25,085 |
Issued in Lieu of Cash Distributions | 1,373,695 | 19,529 | 1,339,306 | 19,279 |
Redeemed1 | (3,076,773) | (43,528) | (3,884,517) | (53,726) |
Net Increase (Decrease)—Investor Shares | 374,088 | 5,317 | (733,663) | (9,362) |
Admiral Shares |
|
|
|
|
Issued | 1,585,771 | 21,398 | 1,527,181 | 20,281 |
Issued in Lieu of Cash Distributions | 623,446 | 8,542 | 536,593 | 7,443 |
Redeemed1 | (918,512) | (12,597) | (1,051,944) | (13,979) |
Net Increase (Decrease)—Admiral Shares | 1,290,705 | 17,343 | 1,011,830 | 13,745 |
G. Certain of the fund’s investments are in companies that are considered to be affiliated companies of the fund because the fund owns more than 5% of the outstanding voting securities of the company. Transactions during the period in securities of these companies were as follows:
|
| Current Period Transactions |
| ||
| Sept. 30, 2007 |
| Proceeds from |
| Sept. 30, 2008 |
| Market | Purchases | Securities | Dividend | Market |
| Value | at Cost | Sold | Income | Value |
| ($000) | ($000) | ($000) | ($000) | ($000) |
Alaska Air Group, Inc. | 58,649 | 2,804 | — | — | 57,092 |
AMR Corp. | NA2 | 117,622 | — | — | 149,452 |
Applied Biosystems Inc. | NA2,3 | — | 4,999 | 374 | 301,393 |
Citrix Systems, Inc. | 401,184 | — | — | — | 251,337 |
Intuit, Inc. | NA2 | 16,636 | — | — | 546,853 |
Millipore Corp. | 213,756 | — | — | — | 194,016 |
Plantronics, Inc. | 134,228 | — | — | 940 | 105,878 |
Pogo Producing Co. | 173,139 | — | — | — | NA4 |
Tektronix, Inc. | 132,359 | — | 181,313 | 286 | — |
Whirlpool Corp. | 356,400 | 121,103 | — | 8,667 | 442,835 |
| 1,469,715 |
|
| 10,267 | 2,048,856 |
1 Net of redemption fees of $1,871,000 and $1,507,000 (fund totals).
2 At September 30, 2007, the issuer was not an affiliated company of the fund.
3 Applera Corp.–Applied Biosystems Group changed its name on July 1, 2008, to Applied Biosystems Inc. The issuer became an affiliated company of the fund as a result of a reduction in its voting shares.
4 In November 2007, Pogo Producing Co. merged with Plains Exploration & Production Co. At September 30, 2008, Plains Exploration & Production Co. was not an affiliated company of the fund.
22
H. In September 2006, the Financial Accounting Standards Board issued Statement of Financial Accounting Standards No. 157 (“FAS 157”), “Fair Value Measurements.” FAS 157 establishes a framework for measuring fair value and expands disclosures about fair value measurements in financial statements.
The various inputs that may be used to determine the value of the fund’s investments are summarized in three broad levels. The inputs or methodologies used for valuing securities are not necessarily an indication of the risk associated with investing in those securities.
Level 1—Quoted prices in active markets for identical securities.
Level 2—Other significant observable inputs (including quoted prices for similar securities, interest rates, prepayment speeds, credit risk, etc.).
Level 3—Significant unobservable inputs (including the fund’s own assumptions used to determine the fair value of investments).
The following table summarizes the fund’s investments as of September 30, 2008, based on the inputs used to value them:
| Investments |
| in Securities |
Valuation Inputs | ($000) |
Level 1—Quoted prices | 28,643,366 |
Level 2—Other significant observable inputs | 477,453 |
Level 3—Significant unobservable inputs | — |
Total | 29,120,819 |
23
Report of Independent Registered Public Accounting Firm
To the Trustees of Vanguard Chester Funds and the Shareholders of Vanguard PRIMECAP Fund:
In our opinion, the accompanying statement of net assets and statement of assets and liabilities, and the related statements of operations and of changes in net assets and the financial highlights present fairly, in all material respects, the financial position of the Vanguard PRIMECAP Fund (the “Fund”) at September 30, 2008, the results of its operations for the year then ended, the changes in its net assets for each of the two years in the period then ended and the financial highlights for each of the periods indicated, in conformity with accounting principles generally accepted in the United States of America. These financial statements and financial highlights (hereafter referred to as “financial statements”) are the responsibility of the Fund’s management; our responsibility is to express an opinion on these financial statements based on our audits. We conducted our audits of these financial statements in accordance with the standards of the Public Company Accounting Oversight Board (United States). Those standards require that we plan and perform the audit to obtain reasonable assurance about whether the financial statements are free of material misstatement. An audit includes examining, on a test basis, evidence supporting the amounts and disclosures in the financial statements, assessing the accounting principles used and significant estimates made by management, and evaluating the overall financial statement presentation. We believe that our audits, which included confirmation of securities at September 30, 2008 by correspondence with the custodian and by agreement to the underlying ownership records for Vanguard Market Liquidity Fund, provide a reasonable basis for our opinion.
PricewaterhouseCoopers LLP
Philadelphia, Pennsylvania
November 19, 2008
Special 2008 tax information (unaudited) for Vanguard PRIMECAP Fund |
This information for the fiscal year ended September 30, 2008, is included pursuant to provisions of the Internal Revenue Code.
The fund distributed $1,932,491,000 as capital gain dividends (from net long-term capital gains) to shareholders during the fiscal period.
For non-resident alien shareholders, 100% of short-term capital gain dividends distributed by the fund are qualified short-term capital gains.
The fund distributed $261,611,000 of qualified dividend income to shareholders during the fiscal year.
For corporate shareholders, 91.9% of investment income (dividend income plus short-term gains, if any) qualifies for the dividends-received deduction.
24
Your Fund’s After-Tax Returns
This table presents returns for your fund both before and after taxes. The after-tax returns are shown in two ways: (1) assuming that an investor owned the fund during the entire period and paid taxes on the fund’s distributions, and (2) assuming that an investor paid taxes on the fund’s distributions and sold all shares at the end of each period.
Calculations are based on the highest individual federal income tax and capital gains tax rates in effect at the times of the distributions and the hypothetical sales. State and local taxes were not considered. After-tax returns reflect any qualified dividend income, using actual prior-year figures and estimates for 2008. (In the example, returns after the sale of fund shares may be higher than those assuming no sale. This occurs when the sale would have produced a capital loss. The calculation assumes that the investor received a tax deduction for the loss.)
The table shows returns for Investor Shares only; returns for other share classes will differ. Please note that your actual after-tax returns will depend on your tax situation and may differ from those shown. Also note that if you own the fund in a tax-deferred account, such as an individual retirement account or a 401(k) plan, this information does not apply to you. Such accounts are not subject to current taxes.
Finally, keep in mind that a fund’s performance—whether before or after taxes—does not guarantee future results.
Average Annual Total Returns: PRIMECAP Fund Investor Shares1 | |||
Periods Ended September 30, 2008 |
|
|
|
| One | Five | Ten |
| Year | Years | Years |
Returns Before Taxes | –13.96% | 9.39% | 9.14% |
Returns After Taxes on Distributions | –14.77 | 8.84 | 8.31 |
Returns After Taxes on Distributions and Sale of Fund Shares | –7.81 | 8.19 | 7.83 |
1 Total returns do not reflect the 1% fee assessed on redemptions of shares held for less than one year, or the 1% fee assessed until March 23, 2005, on shares purchased on or after April 23, 2001, and held for less than five years. Nor do they include the account service fee that may be applicable to certain accounts with balances below $10,000.
25
About Your Fund’s Expenses
As a shareholder of the fund, you incur ongoing costs, which include costs for portfolio management, administrative services, and shareholder reports (like this one), among others. Operating expenses, which are deducted from a fund’s gross income, directly reduce the investment return of the fund.
A fund’s expenses are expressed as a percentage of its average net assets. This figure is known as the expense ratio. The following examples are intended to help you understand the ongoing costs (in dollars) of investing in your fund and to compare these costs with those of other mutual funds. The examples are based on an investment of $1,000 made at the beginning of the period shown and held for the entire period.
The accompanying table illustrates your fund’s costs in two ways:
• Based on actual fund return. This section helps you to estimate the actual expenses that you paid over the period. The “Ending Account Value” shown is derived from the fund’s actual return, and the third column shows the dollar amount that would have been paid by an investor who started with $1,000 in the fund. You may use the information here, together with the amount you invested, to estimate the expenses that you paid over the period.
To do so, simply divide your account value by $1,000 (for example, an $8,600 account value divided by $1,000 = 8.6), then multiply the result by the number given for your fund under the heading “Expenses Paid During Period.”
• Based on hypothetical 5% yearly return. This section is intended to help you compare your fund’s costs with those of other mutual funds. It assumes that the fund had a yearly return of 5% before expenses, but that the expense ratio is unchanged. In this case—because the return used is not the fund’s actual return—the results do not apply to your investment. The example is useful in making comparisons because the Securities and Exchange Commission requires all mutual funds to calculate expenses based on a 5% return. You can assess your fund’s costs by comparing this hypothetical example with the hypothetical examples that appear in shareholder reports of other funds.
Six Months Ended September 30, 2008 |
|
|
|
| Beginning | Ending | Expenses |
| Account Value | Account Value | Paid During |
PRIMECAP Fund | 3/31/2008 | 9/30/2008 | Period1 |
Based on Actual Fund Return |
|
|
|
Investor Shares | $1,000.00 | $934.76 | $2.04 |
Admiral Shares | 1,000.00 | 935.29 | 1.50 |
Based on Hypothetical 5% Yearly Return |
|
|
|
Investor Shares | $1,000.00 | $1,022.96 | $2.13 |
Admiral Shares | 1,000.00 | 1,023.51 | 1.57 |
1 The calculations are based on expenses incurred in the most recent six-month period. The fund’s annualized six-month expense ratios for that period are 0.42% for Investor Shares and 0.31% for Admiral Shares. The dollar amounts shown as “Expenses Paid” are equal to the annualized expense ratio multiplied by the average account value over the period, multiplied by the number of days in the most recent six-month period, then divided by the number of days in the most recent 12-month period.
26
Note that the expenses shown in the table are meant to highlight and help you compare ongoing costs only and do not reflect transaction costs incurred by the fund for buying and selling securities. Further, the expenses do not include the 1% fee on redemptions of shares held for less than one year, nor do they include the account service fee described in the prospectus. If such fees were applied to your account, your costs would be higher. Your fund does not carry a “sales load.”
The calculations assume no shares were bought or sold during the period. Your actual costs may have been higher or lower, depending on the amount of your investment and the timing of any purchases or redemptions.
You can find more information about the fund’s expenses, including annual expense ratios, in the Financial Statements section of this report. For additional information on operating expenses and other shareholder costs, please refer to your fund’s current prospectus.
27
Trustees Approve Advisory Agreement
The board of trustees of Vanguard PRIMECAP Fund has renewed the fund’s investment advisory agreement with PRIMECAP Management Company. The board determined that the retention of PRIMECAP Management was in the best interests of the fund and its shareholders.
The board based its decision upon an evaluation of the advisor’s investment staff, portfolio management process, and performance. The trustees considered the factors discussed below, among others. However, no single factor determined whether the board approved the agreement. Rather, it was the totality of the circumstances that drove the board’s decision.
Nature, extent, and quality of services
The board considered the quality of the fund’s investment management over both the short and long term, and took into account the organizational depth and stability of the firm. The board noted that PRIMECAP Management, founded in 1983, is recognized for its long-term approach to growth equity investing. The firm has managed the fund since the fund’s inception in 1984. Six experienced portfolio managers are responsible for separate subportfolios, and each manager employs a fundamental, research-driven approach in seeking to identify companies with long-term growth potential that have been overlooked by the market and are trading at attractive valuation levels.
The board concluded that the advisor’s experience, stability, depth, and performance, among other factors, warranted continuation of the advisory agreement.
Investment performance
The board considered the short- and long-term performance of the fund, including any periods of outperformance or underperformance of a relevant benchmark and peer group. The board concluded that PRIMECAP Management has carried out its investment strategy in disciplined fashion, and that the results have been solid. Information about the fund’s most recent performance can be found in the Performance Summary section of this report.
Cost
The board concluded that the fund’s expense ratio was far below the average expense ratio charged by funds in its peer group. The board noted that the fund’s advisory fee rate was also well below the peer-group average. Information about the fund’s expense ratio appears in the About Your Fund’s Expenses section of this report as well as in the Financial Statements section, which also includes information about the advisory fee rate. The board did not consider profitability of PRIMECAP Management in determining whether to approve the advisory fee, because PRIMECAP Management is independent of Vanguard and the advisory fee is the result of arm’s-length negotiations.
The benefit of economies of scale
The board concluded that the fund’s shareholders benefit from economies of scale because of breakpoints in the fund’s advisory fee schedule. The breakpoints reduce the effective rate of the fee as the fund’s assets increase.
The board will consider whether to renew the advisory agreement again after a one-year period.
28
Glossary
Beta. A measure of the magnitude of a fund’s past share-price fluctuations in relation to the ups and downs of a given market index. The index is assigned a beta of 1.00. Compared with a given index, a fund with a beta of 1.20 typically would have seen its share price rise or fall by 12% when the index rose or fell by 10%. For this report, beta is based on returns over the past 36 months for both the fund and the index. Note that a fund’s beta should be reviewed in conjunction with its R-squared. The lower the R-squared, the less correlation there is between the fund and the index, and the less reliable beta is as an indicator of volatility.
Earnings Growth Rate. The average annual rate of growth in earnings over the past five years for the stocks now in a fund.
Equity Exposure. A measure that reflects a fund’s investments in stocks and stock futures. Any holdings in short-term reserves are excluded.
Expense Ratio. The percentage of a fund’s average net assets used to pay its annual administrative and advisory expenses. These expenses directly reduce returns to investors.
Foreign Holdings. The percentage of a fund represented by stocks or depositary receipts of companies based outside the United States.
Inception Date. The date on which the assets of a fund (or one of its share classes) are first invested in accordance with the fund’s investment objective. For funds with a subscription period, the inception date is the day after that period ends. Investment performance is measured from the inception date.
Median Market Cap. An indicator of the size of companies in which a fund invests; the midpoint of market capitalization (market price x shares outstanding) of a fund’s stocks, weighted by the proportion of the fund’s assets invested in each stock. Stocks representing half of the fund’s assets have market capitalizations above the median, and the rest are below it.
Price/Book Ratio. The share price of a stock divided by its net worth, or book value, per share. For a fund, the weighted average price/book ratio of the stocks it holds.
Price/Earnings Ratio. The ratio of a stock’s current price to its per-share earnings over the past year. For a fund, the weighted average P/E of the stocks it holds. P/E is an indicator of market expectations about corporate prospects; the higher the P/E, the greater the expectations for a company’s future growth.
R-Squared. A measure of how much of a fund’s past returns can be explained by the returns from the market in general, as measured by a given index. If a fund’s total returns were precisely synchronized with an index’s returns, its R-squared would be 1.00. If the fund’s returns bore no relationship to the index’s returns, its R-squared would be 0. For this report, R-squared is based on returns over the past 36 months for both the fund and the index.
Return on Equity. The annual average rate of return generated by a company during the past five years for each dollar of shareholder’s equity (net income divided by shareholder’s equity). For a fund, the weighted average return on equity for the companies whose stocks it holds.
Short-Term Reserves. The percentage of a fund invested in highly liquid, short-term securities that can be readily converted to cash.
Turnover Rate. An indication of the fund’s trading activity. Funds with high turnover rates incur higher transaction costs and may be more likely to distribute capital gains (which may be taxable to investors). The turnover rate excludes in-kind transactions, which have minimal impact on costs.
29
Yield. A fund’s 30-day SEC yield is derived using a formula specified by the U.S. Securities and Exchange Commission. Under the formula, data related to the fund’s security holdings in the previous 30 days are used to calculate the fund’s hypothetical net income for that period, which is then annualized and divided by the fund’s estimated average net assets over the calculation period. For the purposes of this calculation, a security’s income is based on its current market yield to maturity (in the case of bonds) or its projected dividend yield (for stocks). Because the SEC yield represents hypothetical annualized income, it will differ—at times significantly—from the fund’s actual experience. As a result, the fund’s income distributions may be higher or lower than implied by the SEC yield.
30
This page intentionally left blank.
The People Who Govern Your Fund
The trustees of your mutual fund are there to see that the fund is operated and managed in your best interests since, as a shareholder, you are a part owner of the fund. Your fund’s trustees also serve on the board of directors of The Vanguard Group, Inc., which is owned by the Vanguard funds and provides services to them on an at-cost basis.
A majority of Vanguard’s board members are independent, meaning that they have no affiliation with Vanguard or the funds they oversee, apart from the sizable personal investments they have made as private individuals.
Our independent board members bring distinguished backgrounds in business, academia, and public service to their task of working with Vanguard officers to establish the policies and oversee the activities of the funds. Among board members’ responsibilities are selecting investment advisors for the funds; monitoring fund operations, performance, and costs; reviewing contracts; nominating and selecting new trustees/directors; and electing Vanguard officers.
Each trustee serves a fund until its termination; or until the trustee’s retirement, resignation, or death; or otherwise as specified in the fund’s organizational documents. Any trustee may be removed at a shareholders’ meeting by a vote representing two-thirds of the net asset value of all shares of the fund together with shares of other Vanguard funds organized within the same trust. The table on these two pages shows information for each trustee and executive officer of the fund. The mailing address of the trustees and officers is P.O. Box 876, Valley Forge, PA 19482.
Chairman of the Board and Trustee | |
|
|
John J. Brennan1 |
|
Born 1954 | Principal Occupation(s) During the Past Five Years: Chairman of the Board and Director/ |
Trustee Since May 1987; | Trustee of The Vanguard Group, Inc., and of each of the investment companies served |
Chairman of the Board | by The Vanguard Group; Chief Executive Officer and President of The Vanguard Group |
156 Vanguard Funds Overseen | and of each of the investment companies served by The Vanguard Group (1996–2008). |
|
|
Independent Trustees |
|
|
|
Charles D. Ellis |
|
Born 1937 | Principal Occupation(s) During the Past Five Years: Applecore Partners (pro bono ventures |
Trustee Since January 2001 | in education); Senior Advisor to Greenwich Associates (international business strategy |
156 Vanguard Funds Overseen | consulting); Successor Trustee of Yale University; Overseer of the Stern School of Business |
| at New York University; Trustee of the Whitehead Institute for Biomedical Research. |
|
|
Emerson U. Fullwood |
|
Born 1948 | Principal Occupation(s) During the Past Five Years: Executive Chief Staff and Marketing |
Trustee Since January 2008 | Officer for North America since 2004 and Corporate Vice President of Xerox Corporation |
156 Vanguard Funds Overseen | (photocopiers and printers); Director of SPX Corporation (multi-industry manufacturing), |
| of the United Way of Rochester, and of the Boy Scouts of America. |
|
|
Rajiv L. Gupta |
|
Born 1945 | Principal Occupation(s) During the Past Five Years: Chairman, President, and |
Trustee Since December 20012 | Chief Executive Officer of Rohm and Haas Co. (chemicals); Board Member of |
156 Vanguard Funds Overseen | the American Chemistry Council; Director of Tyco International, Ltd. (diversified |
| manufacturing and services) since 2005. |
|
|
Amy Gutmann |
|
Born 1949 | Principal Occupation(s) During the Past Five Years: President of the University of |
Trustee Since June 2006 | Pennsylvania since 2004; Professor in the School of Arts and Sciences, Annenberg School |
156 Vanguard Funds Overseen | for Communication, and Graduate School of Education of the University of Pennsylvania |
| since 2004; Provost (2001–2004) and Laurance S. Rockefeller Professor of Politics and |
| the University Center for Human Values (1990–2004), Princeton University; Director of |
| Carnegie Corporation of New York since 2005 and of Schuylkill River Development |
| Corporation and Greater Philadelphia Chamber of Commerce since 2004; Trustee of |
| the National Constitution Center since 2007. |
JoAnn Heffernan Heisen |
|
Born 1950 | Principal Occupation(s) During the Past Five Years: Corporate Vice President and |
Trustee Since July 1998 | Chief Global Diversity Officer since 2006, Vice President and Chief Information |
156 Vanguard Funds Overseen | Officer (1997–2005), and Member of the Executive Committee of Johnson & |
| Johnson (pharmaceuticals/consumer products); Director of the University Medical |
| Center at Princeton and Women’s Research and Education Institute. |
|
|
André F. Perold |
|
Born 1952 | Principal Occupation(s) During the Past Five Years: George Gund Professor of Finance |
Trustee Since December 2004 | and Banking, Harvard Business School; Senior Associate Dean and Director of Faculty |
156 Vanguard Funds Overseen | Recruiting, Harvard Business School; Director and Chairman of UNX, Inc. (equities |
| trading firm); Chair of the Investment Committee of HighVista Strategies LLC (private |
| investment firm) since 2005. |
|
|
Alfred M. Rankin, Jr. |
|
Born 1941 | Principal Occupation(s) During the Past Five Years: Chairman, President, Chief Executive |
Trustee Since January 1993 | Officer, and Director of NACCO Industries, Inc. (forklift trucks/housewares/lignite); Director |
156 Vanguard Funds Overseen | of Goodrich Corporation (industrial products/aircraft systems and services). |
|
|
J. Lawrence Wilson |
|
Born 1936 | Principal Occupation(s) During the Past Five Years: Retired Chairman and Chief Executive |
Trustee Since April 1985 | Officer of Rohm and Haas Co. (chemicals); Director of Cummins Inc. (diesel engines) and |
156 Vanguard Funds Overseen | AmerisourceBergen Corp. (pharmaceutical distribution); Trustee of Vanderbilt University |
| and of Culver Educational Foundation. |
|
|
Executive Officers1 |
|
|
|
Thomas J. Higgins |
|
Born 1957 | Principal Occupation(s) During the Past Five Years: Principal of The Vanguard Group, Inc.; |
Chief Financial Officer | Treasurer of each of the investment companies served by The Vanguard Group; Chief |
Since September 2008 | Financial Officer of each of the investment companies served by The Vanguard |
Treasurer Since July 1998 | Group since 2008. |
156 Vanguard Funds Overseen |
|
|
|
F. William McNabb III |
|
Born 1957 | Principal Occupation(s) During the Past Five Years: Chief Executive Officer, Director, |
Chief Executive Officer | and President of The Vanguard Group, Inc., since 2008; Chief Executive Officer and |
Since August 31, 2008 | President of each of the investment companies served by The Vanguard Group since |
President Since March 2008 | 2008; Director of Vanguard Marketing Corporation; Managing Director of The Vanguard |
156 Vanguard Funds Overseen | Group (1995–2008). |
|
|
Heidi Stam |
|
Born 1956 | Principal Occupation(s) During the Past Five Years: Managing Director of The Vanguard |
Secretary Since July 2005 | Group, Inc., since 2006; General Counsel of The Vanguard Group since 2005; Secretary of |
156 Vanguard Funds Overseen | The Vanguard Group and of each of the investment companies served by The Vanguard |
| Group since 2005; Director and Senior Vice President of Vanguard Marketing Corporation |
| since 2005; Principal of The Vanguard Group (1997–2006). |
Vanguard Senior Management Team |
|
| |
|
|
|
|
R. Gregory Barton | Kathleen C. Gubanich | Michael S. Miller | Glenn W. Reed |
Mortimer J. Buckley | Paul A. Heller | Ralph K. Packard | George U. Sauter |
Founder |
|
John C. Bogle |
Chairman and Chief Executive Officer, 1974–1996 |
1 These individuals are “interested persons” as defined in the Investment Company Act of 1940.
2 December 2002 for Vanguard Equity Income Fund, Vanguard Growth Equity Fund, the Vanguard Municipal Bond Funds, and the Vanguard State Tax-Exempt Funds.
More information about the trustees is in the Statement of Additional Information, available from The Vanguard Group.
|
|
| P.O. Box 2600 |
| Valley Forge, PA 19482-2600 |

Connect with Vanguard® > www.vanguard.com
Fund Information > 800-662-7447 | All comparative mutual fund data are from Lipper Inc. |
| or Morningstar, Inc., unless otherwise noted. |
Direct Investor Account Services > 800-662-2739 |
|
|
|
Institutional Investor Services > 800-523-1036 | You can obtain a free copy of Vanguard’s proxy voting |
| guidelines by visiting our website, www.vanguard.com, |
Text Telephone for People | and searching for “proxy voting guidelines,” or by |
With Hearing Impairment > 800-952-3335 | calling Vanguard at 800-662-2739. The guidelines are |
| also available from the SEC’s website, www.sec.gov. |
| In addition, you may obtain a free report on how your |
| fund voted the proxies for securities it owned during |
This material may be used in conjunction | the 12 months ended June 30. To get the report, visit |
with the offering of shares of any Vanguard | either www.vanguard.com or www.sec.gov. |
fund only if preceded or accompanied by |
|
the fund’s current prospectus. |
|
| You can review and copy information about your fund |
| at the SEC’s Public Reference Room in Washington, D.C. |
Standard & Poor’s 500® and S&P 500® are trademarks | To find out more about this public service, call the SEC |
of The McGraw-Hill Companies, Inc., and have been | at 202-551-8090. Information about your fund is also |
licensed for use by The Vanguard Group, Inc. | available on the SEC’s website, and you can receive |
Vanguard mutual funds are not sponsored, endorsed, | copies of this information, for a fee, by sending a |
sold, or promoted by Standard & Poor’s, and Standard & | request in either of two ways: via e-mail addressed to |
Poor’s makes no representation regarding the advisability | publicinfo@sec.gov or via regular mail addressed to the |
of investing in the funds. | Public Reference Section, Securities and Exchange |
| Commission, Washington, DC 20549-0102. |
The funds or securities referred to herein are not |
|
sponsored, endorsed, or promoted by MSCI, and MSCI |
|
bears no liability with respect to any such funds or |
|
securities. For any such funds or securities, the |
|
prospectus or the Statement of Additional Information |
|
contains a more detailed description of the limited |
|
relationship MSCI has with The Vanguard Group and |
|
any related funds. |
|
|
|
Russell is a trademark of The Frank Russell Company. |
|
| © 2008 The Vanguard Group, Inc., |
| All rights reserved. |
| Vanguard Marketing Corporation, Distributor. |
|
|
| Q590 112008 |
> | The broad U.S. stock market retreated –21.2% in the fiscal year ended September 30, 2008, as a year-long credit crunch came to a head. |
> | Helped by strong demand for U.S. Treasury securities, returns from the broad U.S. bond market were positive, providing a bit of a cushion for the Vanguard Target Retirement Funds. |
> | For the 12 months, the returns for the six Target Retirement Funds in this report ranged from –4.2% for the most income-oriented fund to –17.6% for the 2025 fund, which has the highest allocation to equities. |
Contents |
|
|
|
Your Fund’s Total Returns | 1 |
President’s Letter | 2 |
Target Retirement Income Fund | 8 |
Target Retirement 2005 Fund | 17 |
Target Retirement 2010 Fund | 26 |
Target Retirement 2015 Fund | 34 |
Target Retirement 2020 Fund | 43 |
Target Retirement 2025 Fund | 51 |
Your Fund’s After-Tax Returns | 62 |
About Your Fund’s Expenses | 64 |
Glossary | 66 |
Please note: The opinions expressed in this report are just that—informed opinions. They should not be considered promises or advice. Also, please keep in mind that the information and opinions cover the period through the date on the front of this report. Of course, the risks of investing in your fund are spelled out in the prospectus.
Your Fund’s Total Returns
Fiscal Year Ended September 30, 2008 |
|
|
| Ticker | Total |
| Symbol | Returns |
Vanguard Target Retirement Income Fund | VTINX | –4.2% |
Target Income Composite Index1 |
| –4.5 |
Target Income Composite Average2 |
| –7.9 |
|
|
|
Vanguard Target Retirement 2005 Fund | VTOVX | –7.9% |
Target 2005 Composite Index1 |
| –8.0 |
Target 2005 Composite Average2 |
| –11.2 |
|
|
|
Vanguard Target Retirement 2010 Fund | VTENX | –11.3% |
Target 2010 Composite Index1 |
| –11.3 |
Target 2010 Composite Average2 |
| –14.3 |
|
|
|
Vanguard Target Retirement 2015 Fund | VTXVX | –13.7% |
Target 2015 Composite Index1 |
| –13.9 |
Target 2015 Composite Average2 |
| –16.5 |
|
|
|
Vanguard Target Retirement 2020 Fund | VTWNX | –15.6% |
Target 2020 Composite Index1 |
| –15.8 |
Target 2020 Composite Average2 |
| –18.1 |
|
|
|
Vanguard Target Retirement 2025 Fund | VTTVX | –17.6% |
Target 2025 Composite Index1 |
| –17.8 |
Target 2025 Composite Average2 |
| –19.6 |
1 Returns for the composite indexes are derived by applying the funds’ target allocations to the results of the following benchmarks: for U.S. stocks, the Morgan Stanley Capital International (MSCI) US Broad Market Index; for international stocks, the MSCI Europe, Australasia, Far East Index and the MSCI Emerging Markets Index; for bonds, the Lehman U.S. Aggregate Bond Index and the Lehman U.S. Treasury Inflation Notes Index; and for short-term reserves, the Citigroup 3-Month Treasury Bill Index.
2 Each composite average weights the average returns of the appropriate mutual fund peer groups in proportion with the targeted weighting of the specific Target Retirement Fund. All together, the composites use returns for the average fixed income fund, the average Treasury inflation-protected securities fund, the average money market fund, the average general equity fund, the average international fund, and the average emerging markets fund. These returns are derived from data provided by Lipper Inc.
1

President’s Letter
Dear Shareholder,
For the fiscal year ended September 30, 2008, both domestic and international stocks suffered their worst losses since the bear market that ended in 2002. U.S. bond returns were modestly positive, providing a bit of counterbalance for the Target Retirement Funds, particularly those with larger weightings in bonds.
The six Target Retirement Funds included in this report all posted declines consistent with their respective asset allocations. The returns ranged from –4.2% for the Target Retirement Income Fund, which has the heaviest allocation to bonds, to –17.6% for the Target Retirement 2025 Fund, with its heavier weighting in stocks, particularly international equities.
Credit market turbulence weighed heavily on stock prices
Troubles simmering in the credit markets for much of the past year came to a boil at the end of the fiscal period, producing several high-profile bankruptcies and putting severe pressure on stock prices around the world. The broad U.S. stock market returned –21.2% for the 12 months ended September 30. In September alone, stock prices fell more than 9%. International stock markets were similarly disappointing, returning –30.0% for the full 12 months.
2
Policy-makers and elected officials, both in the United States and abroad, responded to the upheavals with dramatic new programs designed to help stabilize the credit markets. As participants struggled to make sense of the markets’ fast-changing dynamics, stock prices were exceptionally volatile, with daily ups and downs of 2 percentage points or more becoming commonplace.
U.S. Treasuries rallied in a nervous market
Nervousness in the stock market was echoed, and even amplified, in the bond market. For the 12 months, the broad U.S. bond market returned 3.7%, largely on the strength of Treasuries—investors’ security of choice in times of duress.
Corporate bonds generally produced negative returns for the period, coming under heavy selling pressure during investors’ flight to safety. Even the municipal market, made up of generally high-quality securities issued by states and municipalities, recorded a negative 12-month return.
The U.S. Federal Reserve Board responded to the turmoil with a dramatic easing of monetary policy. Over the full 12 months, the Fed reduced its target for the federal funds rate from 4.75% to 2.00%. On October 8, shortly after the close of the fiscal period, the Fed cut rates again, to 1.50%. The move was made in coordination with rate cuts by several other central banks.
Market Barometer |
| ||
| Average Annual Total Returns | ||
| Periods Ended September 30, 2008 | ||
| One Year | Three Years | Five Years |
Stocks |
|
|
|
Russell 1000 Index (Large-caps) | –22.1% | 0.1% | 5.5% |
Russell 2000 Index (Small-caps) | –14.5 | 1.8 | 8.1 |
Dow Jones Wilshire 5000 Index (Entire market) | –21.2 | 0.6 | 6.0 |
MSCI All Country World Index ex USA (International) | –30.0 | 3.1 | 11.8 |
|
|
|
|
Bonds |
|
|
|
Lehman U.S. Aggregate Bond Index (Broad taxable market) | 3.7% | 4.2% | 3.8% |
Lehman Municipal Bond Index | –1.9 | 1.9 | 2.8 |
Citigroup 3-Month Treasury Bill Index | 2.6 | 4.0 | 3.1 |
|
|
|
|
CPI |
|
|
|
Consumer Price Index | 4.9% | 3.2% | 3.4% |
3
Funds with higher bond allocations suffered less than the others
During the fiscal year, performance for the Vanguard Target Retirement Funds depended on where each fund stood on the retirement-year spectrum. The best return—although still negative—came from the Target Retirement Income Fund, which is designed for investors in or near retirement. It has the highest exposure to bonds and invests about 5% of its assets in a money market portfolio.
At the other end of the spectrum was the Target Retirement 2025 Fund, which has the most distant retirement date in this group. Consequently, it is the most aggressive of the six funds, with 15% of its assets in international stocks, 63% in U.S. stocks, and 22% in bonds as of September 30. Therefore, its return was the lowest, given the poor performance of stocks.
Each Target Retirement Fund includes a mix of Vanguard stock and bond funds (and in two cases a money market fund), with that mix calibrated according to the fund’s target maturity date. As the retirement date approaches, these mixes gradually shift to become more conservative, and more income-oriented.
The funds designed for investors in or closest to retirement—the Target Retirement Income Fund and the Target
Asset Allocations on September 30, 2008 |
|
|
|
|
|
|
|
|
|
| Short-Term |
| Stocks1 | Bonds | Investments |
Income2 | 30% | 65% | 5% |
2005 | 42 | 56 | 2 |
2010 | 54 | 46 | 0 |
2015 | 63 | 37 | 0 |
2020 | 70 | 30 | 0 |
2025 | 78 | 22 | 0 |
1 As of September 30, 2008, international stock weightings for the Income, 2005, 2010, 2015, 2020, and 2025 Funds were 6%, 8%, 11%, 12%, 14%, and 15% of assets, respectively.
2 Allocations do not change.
4
Retirement 2005 Fund—both hold some portion of their assets in Vanguard Prime Money Market Fund and Vanguard Inflation-Protected Securities Fund. The inclusion of these two funds is intended to provide shareholders with a combination of inflation protection and stability. The Inflation-Protected Securities Fund seeks to protect investors against the long-term effects of inflation by investing in bonds with a builtin inflation safeguard.
Over the 12 months, the worst performers among the underlying Vanguard funds represented in the Target Retirement portfolios were the international funds: Vanguard Emerging Markets Stock Index Fund (–32.7%), European Stock Index Fund (–30.0%), and Pacific Stock Index Fund (–27.3%). The Total Stock Market Index Fund, reflecting U.S. equities, returned –21.2%. On the other hand, modest gains were posted by Vanguard
Total Returns |
|
Inception1 through September 30, 2008 |
|
| Average Annual |
| Total Return |
Vanguard Target Retirement Income Fund | 4.2% |
Target Income Composite Index | 4.2 |
Target Income Composite Average2 | 3.1 |
Vanguard Target Retirement 2005 Fund | 4.4% |
Target 2005 Composite Index | 4.4 |
Target 2005 Composite Average2 | 3.3 |
Vanguard Target Retirement 2010 Fund | 2.2% |
Target 2010 Composite Index | 2.2 |
Target 2010 Composite Average2 | 0.1 |
Vanguard Target Retirement 2015 Fund | 4.6% |
Target 2015 Composite Index | 4.6 |
Target 2015 Composite Average2 | 3.5 |
Vanguard Target Retirement 2020 Fund | 1.2% |
Target 2020 Composite Index | 1.1 |
Target 2020 Composite Average2 | –0.7 |
Vanguard Target Retirement 2025 Fund | 4.7% |
Target 2025 Composite Index | 4.6 |
Target 2025 Composite Average2 | 3.7 |
The figures shown represent past performance, which is not a guarantee of future results. (Current performance may be lower or higher than the performance data cited. For performance data current to the most recent month-end, visit our website at www.vanguard.com/performance.) Note, too, that both investment returns and principal value can fluctuate widely, so an investor’s shares, when sold, could be worth more or less than their original cost.
1 For the Income, 2005, 2015, and 2025 Funds, inception was October 27, 2003; for the 2010 and 2020 Funds, inception was June 7, 2006.
2 Derived from data provided by Lipper Inc.
5
Total Bond Market Index Fund (+3.8%) and the Inflation-Protected Securities Fund (+6.2%). The Prime Money Market Fund provided a return of 3.4%.
Low expenses provide a cost-efficient investment
To accomplish their mission of providing broadly diversified investments across asset classes in a mix that becomes more conservative over time, the Target Retirement Funds invest primarily in cost-efficient Vanguard index funds that seek to capture the returns of the broad stock and bond markets.
The funds have provided competitive performance since their inception, as you can see in the table on page 5. The return of each of the Target Retirement Funds falls within 0.1 percentage point of the performance of its composite benchmark index, which reflects market performance without operating costs subtracted. And each fund’s return has outperformed an appropriate composite average based on mutual-fund peer groups.
Over time, the low costs of the Vanguard Target Retirement Funds have provided a distinct advantage. For a look at how the funds’ costs compare with the composite average expenses of peers, please see the table below.
Still a smart way to help keep your retirement plan on track
There’s no doubt the past year has been unsettling for investors. While we cannot predict what will happen in the markets
Expense Ratios |
|
|
Your Fund Compared With Its Peer Group |
|
|
| Acquired Fund | Peer-Group |
| Fees and | Expense |
| Expenses1 | Ratio2 |
Income | 0.19% | 1.11% |
2005 | 0.19 | 1.16 |
2010 | 0.20 | 1.22 |
2015 | 0.19 | 1.27 |
2020 | 0.20 | 1.29 |
2025 | 0.19 | 1.32 |
1 This figure—drawn from the prospectus dated January 25, 2008—represents a weighted average of the annualized expense ratios and any transaction fees charged by the underlying mutual funds (the “acquired” funds) in which the Target Retirement Funds invest. The Target Retirement Funds do not charge any expenses or fees of their own. For the fiscal year ended September 30, 2008, the acquired fund fees and expenses were 0.19% for the Target Retirement Income Fund, 0.18% for the 2005 Fund, 0.19% for the 2010 Fund, 0.18% for the 2015 Fund, 0.19% for the 2020 Fund, and 0.18% for the 2025 Fund.
2 Peer groups are (from top to bottom) the Target Income Composite Average, the Target 2005 Composite Average, the Target 2010 Composite Average, the Target 2015 Composite Average, the Target 2020 Composite Average, and the Target 2025 Composite Average. Each average is a blended composite that weights the returns of the average comparable mutual funds for each asset class in proportion to the target weighting of the appropriate Target Retirement Fund. Peer-group expense ratios are derived from data provided by Lipper Inc. and capture information through year-end 2007.
6
in the future, experienced investors know we have navigated through stormy times before. Through good times and bad, investors who have been in the market over several decades have experienced the benefits of sticking with a long-term investment program, particularly one that relies on a diversified, carefully constructed mix of stock, bond, and money market investments suited to one’s personal goals, time horizon, and tolerance for risk.
As we’ve seen in the past year, even a highly diversified strategy doesn’t prevent sharp losses during times of widespread market turmoil. Over time, however, the principles of broad diversification, careful balance, and low costs have been powerful allies for retirement investors. By investing in a Target Retirement Fund, you have chosen an investment that is designed for your time horizon and is managed to help you meet your needs for a lifetime.
Thank you for your confidence in Vanguard.
Sincerely,

F. William McNabb III
President and Chief Executive Officer
October 13, 2008
Your Fund’s Performance at a Glance | |||||
September 30, 2007–September 30, 2008 | |||||
|
|
|
|
|
|
|
|
| Distributions Per Share |
| |
| Starting | Ending |
|
|
|
| Share | Share | Income | Capital | 30-Day |
| Price | Price | Dividends | Gains | SEC Yield |
Income | $11.08 | $10.19 | $0.439 | $0.000 | 4.28% |
2005 | 12.31 | 10.99 | 0.380 | 0.000 | 4.03 |
2010 | 23.54 | 20.47 | 0.460 | 0.000 | 3.70 |
2015 | 13.49 | 11.34 | 0.340 | 0.000 | 3.41 |
2020 | 24.15 | 20.03 | 0.410 | 0.000 | 3.22 |
2025 | 14.26 | 11.49 | 0.310 | 0.000 | 3.03 |
7
Target Retirement Income Fund
Fund Profile
As of September 30, 2008
Financial Attributes |
|
|
|
Yield1 | 4.3% |
Acquired Fund Fees and Expenses |
|
(9/30/2007)2 | 0.19% |
Volatility Measures3 |
|
| Fund Versus |
| Composite Index4 |
R-Squared | 1.00 |
Beta | 0.99 |
Allocation to Underlying Vanguard Funds |
|
|
|
Total Bond Market Index Fund | 45.1% |
Total Stock Market Index Fund | 24.2 |
Inflation-Protected Securities Fund | 19.9 |
Prime Money Market Fund | 5.2 |
European Stock Index Fund | 3.1 |
Pacific Stock Index Fund | 1.4 |
Emerging Markets Stock Index Fund | 1.1 |
Fund Asset Allocation
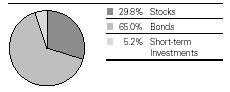
Equity Investment Focus
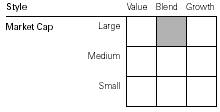
Fixed Income Investment Focus
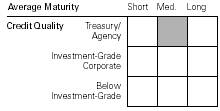
1 30-day SEC yield for the fund. See the Glossary.
2 This figure—drawn from the prospectus dated January 25, 2008—represents a weighted average of the annualized expense ratios and any transaction fees charged by the underlying mutual funds (the “acquired” funds) in which the Target Retirement Income Fund invests. The Target Retirement Income Fund does not charge any expenses or fees of its own. For the fiscal year ended September 30, 2008, the acquired fund fees and expenses was 0.19%.
3 For an explanation of R-squared, beta, and other terms used here, see the Glossary.
4 Target Income Composite Index: Derived by applying the fund’s target asset allocation to the results of the following benchmarks: for international stocks of developed markets, the MSCI EAFE Index; for emerging markets stocks, the Select Emerging Markets Index from inception through August 23, 2006, and the MSCI Emerging Markets Index thereafter; for bonds, the Lehman U.S. Aggregate Bond Index and the Lehman U.S. Treasury Inflation Notes Index; for short-term reserves, the Citigroup 3-Month Treasury Bill Index; and for U.S. stocks, the Dow Jones Wilshire 5000 Index from inception through April 22, 2005, and the MSCI US Broad Market Index thereafter. MSCI EAFE Index returns are adjusted for withholding taxes applicable to Luxembourg holding companies.
8
Target Retirement Income Fund
Performance Summary
All of the returns in this report represent past performance, which is not a guarantee of future results that may be achieved by the fund. (Current performance may be lower or higher than the performance data cited. For performance data current to the most recent month-end, visit our website at www.vanguard.com/performance.) Note, too, that both investment returns and principal value can fluctuate widely, so an investor’s shares, when sold, could be worth more or less than their original cost. The returns shown do not reflect taxes that a shareholder would pay on fund distributions or on the sale of fund shares.
Cumulative Performance: October 27, 2003–September 30, 2008
Initial Investment of $10,000
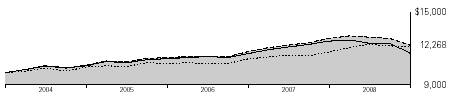
| Average Annual Total Returns | Final Value | |
| Periods Ended September 30, 2008 | of a $10,000 | |
| One Year | Since Inception1 | Investment |
Vanguard Target Retirement Income Fund2 | –4.23% | 4.24% | $12,268 |
Lehman U.S. Aggregate Bond Index | 3.65 | 4.04 | 12,156 |
Target Income Composite Index3 | –4.49 | 4.24 | 12,268 |
Target Income Composite Average4 | –7.91 | 3.08 | 11,613 |
1 Performance for the fund and its comparative standards is calculated since the fund’s inception: October 27, 2003.
2 Total returns do not include the account service fee that may be applicable to certain accounts with balances below $10,000.
3 Target Income Composite Index: Derived by applying the fund’s target asset allocation to the results of the following benchmarks: for international stocks of developed markets, the MSCI EAFE Index; for emerging markets stocks, the Select Emerging Markets Index from inception through August 23, 2006, and the MSCI Emerging Markets Index thereafter; for bonds, the Lehman U.S. Aggregate Bond Index and the Lehman U.S. Treasury Inflation Notes Index; for short-term reserves, the Citigroup 3-Month Treasury Bill Index; and for U.S. stocks, the Dow Jones Wilshire 5000 Index from inception through April 22, 2005, and the MSCI US Broad Market Index thereafter. MSCI EAFE Index returns are adjusted for withholding taxes applicable to Luxembourg holding companies.
4 Target Income Composite Average: Derived by applying the fund’s target allocation to the following peer-group averages: the average fixed income fund, average general equity fund, average Treasury inflation protected securities fund, average money market fund, average international fund, and average emerging markets fund. Derived from data provided by Lipper Inc.
9
Target Retirement Income Fund
Fiscal-Year Total Returns (%): October 27, 2003–September 30, 2008 | ||||
|
|
|
| Target |
|
|
|
| Income |
Fiscal | Capital | Income | Total | Composite |
Year | Return | Return | Return | Index1 |
2004 | 3.3% | 2.9% | 6.2% | 6.3% |
2005 | 2.1 | 3.6 | 5.7 | 5.8 |
2006 | 0.1 | 4.3 | 4.4 | 4.5 |
2007 | 5.3 | 4.1 | 9.4 | 9.3 |
2008 | –8.0 | 3.8 | –4.2 | –4.5 |
1 Target Income Composite Index: Derived by applying the fund’s target asset allocation to the results of the following benchmarks: for international stocks of developed markets, the MSCI EAFE Index; for emerging markets stocks, the Select Emerging Markets Index from inception through August 23, 2006, and the MSCI Emerging Markets Index thereafter; for bonds, the Lehman U.S. Aggregate Bond Index and the Lehman U.S. Treasury Inflation Notes Index; for short-term reserves, the Citigroup 3-Month Treasury Bill Index; and for U.S. stocks, the Dow Jones Wilshire 5000 Index from inception through April 22, 2005, and the MSCI US Broad Market Index thereafter. MSCI EAFE Index returns are adjusted for withholding taxes applicable to Luxembourg holding companies.
Note: See Financial Highlights table for dividend and capital gains information.
10
Target Retirement Income Fund
Financial Statements
Statement of Net Assets
As of September 30, 2008
The fund provides a complete list of its holdings four times in each fiscal year, at the quarter-ends. For the second and fourth fiscal quarters, the lists appear in the fund’s semiannual and annual reports to shareholders. For the first and third fiscal quarters, the fund files the lists with the Securities and Exchange Commission on Form N-Q. Shareholders can look up the fund’s Forms N-Q on the SEC’s website at www.sec.gov. Forms N-Q may also be reviewed and copied at the SEC’s Public Reference Room (see the back cover of this report for further information).
|
| Market |
|
| Value• |
| Shares | ($000) |
Investment Companies (100.0%) |
|
|
U.S. Stock Fund (24.2%) |
|
|
Vanguard Total Stock Market Index Fund Investor Shares | 17,413,487 | 494,891 |
|
|
|
International Stock Funds (5.6%) |
|
|
Vanguard European Stock Index Fund Investor Shares | 2,250,461 | 63,260 |
Vanguard Pacific Stock Index Fund Investor Shares | 3,009,196 | 29,280 |
Vanguard Emerging Markets Stock Index Fund Investor Shares | 1,071,378 | 23,195 |
|
|
|
Bond Funds (65.0%) |
|
|
Vanguard Total Bond Market Index Fund Investor Shares | 93,400,281 | 921,861 |
Vanguard Inflation-Protected Securities Fund Investor Shares | 33,970,226 | 407,643 |
|
|
|
Money Market Fund (5.2%) |
|
|
Vanguard Prime Money Market Fund Investor Shares | 105,922,330 | 105,922 |
Total Investment Companies (Cost $2,148,988) |
| 2,046,052 |
Other Assets and Liabilities (0.0%) |
|
|
Other Assets |
| 18,531 |
Liabilities |
| (18,388) |
|
| 143 |
Net Assets (100%) |
|
|
Applicable to 200,755,665 outstanding $.001 par value shares of |
|
|
beneficial interest (unlimited authorization) |
| 2,046,195 |
Net Asset Value Per Share |
| $10.19 |
|
|
|
|
|
|
At September 30, 2008, net assets consisted of: |
|
|
|
| Amount |
|
| ($000) |
Paid-in Capital |
| 2,156,516 |
Undistributed Net Investment Income |
| 1,697 |
Accumulated Net Realized Losses |
| (9,082) |
Unrealized Appreciation (Depreciation) |
| (102,936) |
Net Assets |
| 2,046,195 |
• | See Note A in Notes to Financial Statements. |
See accompanying Notes, which are an integral part of the Financial Statements.
11
Target Retirement Income Fund
Statement of Operations
| Year Ended |
| September 30, 2008 |
| ($000) |
Investment Income |
|
Income |
|
Income Distributions Received | 73,806 |
Net Investment Income—Note B | 73,806 |
Realized Net Gain (Loss) |
|
Capital Gain Distributions Received | — |
Investment Securities Sold | (4,008) |
Realized Net Gain (Loss) | (4,008) |
Change in Unrealized Appreciation (Depreciation) of Investment Securities | (166,391) |
Net Increase (Decrease) in Net Assets Resulting from Operations | (96,593) |
See accompanying Notes, which are an integral part of the Financial Statements.
12
Target Retirement Income Fund
Statement of Changes in Net Assets
| Year Ended September 30, | |
| 2008 | 2007 |
| ($000) | ($000) |
Increase (Decrease) in Net Assets |
|
|
Operations |
|
|
Net Investment Income | 73,806 | 41,580 |
Realized Net Gain (Loss) | (4,008) | 373 |
Change in Unrealized Appreciation (Depreciation) | (166,391) | 50,792 |
Net Increase (Decrease) in Net Assets Resulting from Operations | (96,593) | 92,745 |
Distributions |
|
|
Net Investment Income | (74,307) | (40,667) |
Realized Capital Gain | — | — |
Total Distributions | (74,307) | (40,667) |
Capital Share Transactions |
|
|
Issued | 1,279,636 | 676,276 |
Issued in Lieu of Cash Distributions | 69,952 | 37,472 |
Redeemed | (468,082) | (251,865) |
Net Increase (Decrease) from Capital Share Transactions | 881,506 | 461,883 |
Total Increase (Decrease) | 710,606 | 513,961 |
Net Assets |
|
|
Beginning of Period | 1,335,589 | 821,628 |
End of Period1 | 2,046,195 | 1,335,589 |
1 Net Assets—End of Period includes undistributed net investment income of $1,697,000 and $2,198,000.
See accompanying Notes, which are an integral part of the Financial Statements.
13
Target Retirement Income Fund
Financial Highlights
|
|
|
|
| Sept. 1, | Oct. 27, |
|
|
|
|
| 2004, to | 20032 to |
For a Share Outstanding | Year Ended September 30, | Sept. 30, | Aug. 31, | |||
Throughout Each Period | 2008 | 2007 | 2006 | 2005 | 20041 | 2004 |
Net Asset Value, Beginning of Period | $11.08 | $10.52 | $10.52 | $10.31 | $10.34 | $10.00 |
Investment Operations |
|
|
|
|
|
|
Net Investment Income | .427 | .4303 | .4393 | .3993 | .060 | .235 |
Capital Gain Distributions Received | — | — | .0033 | .0223 | — | .015 |
Net Realized and Unrealized Gain (Loss) |
|
|
|
|
|
|
on Investments | (.878) | .540 | .003 | .163 | (.010) | .310 |
Total from Investment Operations | (.451) | .970 | .445 | .584 | .050 | .560 |
Distributions |
|
|
|
|
|
|
Dividends from Net Investment Income | (.439) | (.410) | (.430) | (.370) | (.080) | (.205) |
Distributions from Realized Capital Gains | — | — | (.015) | (.004) | — | (.015) |
Total Distributions | (.439) | (.410) | (.445) | (.374) | (.080) | (.220) |
Net Asset Value, End of Period | $10.19 | $11.08 | $10.52 | $10.52 | $10.31 | $10.34 |
|
|
|
|
|
|
|
Total Return4 | –4.23% | 9.36% | 4.36% | 5.73% | 0.48% | 5.65% |
|
|
|
|
|
|
|
Ratios/Supplemental Data |
|
|
|
|
|
|
Net Assets, End of Period (Millions) | $2,046 | $1,336 | $822 | $677 | $315 | $297 |
Ratio of Total Expenses to |
|
|
|
|
|
|
Average Net Assets | 0%5 | 0% | 0% | 0% | 0% | 0% |
Ratio of Net Investment Income to |
|
|
|
|
|
|
Average Net Assets | 4.11% | 4.03% | 4.21% | 3.80% | 3.96%6 | 3.62%6 |
Portfolio Turnover Rate | 14% | 3% | 22% | 0% | 0% | 1% |
1 The fund’s fiscal year-end changed from August 31 to September 30, effective September 30, 2004.
2 Inception.
3 Calculated based on average shares outstanding.
4 Total returns do not include the account service fee that may be applicable to certain accounts with balances below $10,000.
5 The acquired fund fees and expenses were 0.19%.
6 Annualized.
See accompanying Notes, which are an integral part of the Financial Statements.
14
Target Retirement Income Fund
Notes to Financial Statements
Vanguard Target Retirement Income Fund is registered under the Investment Company Act of 1940 as an open-end investment company, or mutual fund. The fund follows a balanced investment strategy by investing in selected Vanguard funds to achieve its targeted allocation of assets to U.S. stocks, international stocks, bonds, and short-term reserves.
A. The following significant accounting policies conform to generally accepted accounting principles for U.S. mutual funds. The fund consistently follows such policies in preparing its financial statements.
1. Security Valuation: Investments are valued at the net asset value of each underlying Vanguard fund determined as of the close of the New York Stock Exchange (generally 4 p.m., Eastern time) on the valuation date.
2. Federal Income Taxes: The fund intends to continue to qualify as a regulated investment company and distribute all of its taxable income. Management has analyzed the fund’s tax positions taken on federal income tax returns for all open tax years (tax years ended September 30, 2005–2008), and has concluded that no provision for federal income tax is required in the fund’s financial statements.
3. Distributions: Distributions to shareholders are recorded on the ex-dividend date.
4. Other: Income and capital gain distributions received are recorded on the ex-dividend date. Security transactions are accounted for on the date securities are bought or sold. Costs used to determine realized gains (losses) on the sale of investment securities are those of the specific securities sold.
B. Under a service agreement, The Vanguard Group furnishes investment advisory, corporate management, administrative, marketing, and distribution services to the fund. The service agreement provides that the fund’s expenses may be reduced or eliminated to the extent of savings realized by the Vanguard funds by the operation of the fund. Accordingly, all incremental expenses for services provided by Vanguard and all other expenses incurred by the fund during the year ended September 30, 2008, were borne by the funds in which the fund invests. The fund’s trustees and officers are also directors and officers of Vanguard and the funds in which the fund invests.
C. Distributions are determined on a tax basis and may differ from net investment income and realized capital gains for financial reporting purposes. Differences may be permanent or temporary. Permanent differences are reclassified among capital accounts in the financial statements to reflect their tax character. Temporary differences arise when certain items of income, expense, gain, or loss are recognized in different periods for financial statement and tax purposes; these differences will reverse at some time in the future. Differences in classification may also result from the treatment of short-term gains as ordinary income for tax purposes.
For tax purposes, at September 30, 2008, the fund had $1,709,000 of ordinary income available for distribution. The fund had available realized losses of $4,561,000 to offset future net capital gains through September 30, 2015.
At September 30, 2008, the cost of investment securities for tax purposes was $2,153,521,000. Net unrealized depreciation of investment securities for tax purposes was $107,469,000, consisting entirely of unrealized losses on securities that had fallen in value since their purchase.
D. During the year ended September 30, 2008, the fund purchased $1,136,485,000 of investment securities and sold $254,581,000 of investment securities, other than temporary cash investments.
15
Target Retirement Income Fund
E. Capital shares issued and redeemed were:
| Year Ended September 30, | |
| 2008 | 2007 |
| Shares | Shares |
| (000) | (000) |
Issued | 116,714 | 62,175 |
Issued in Lieu of Cash Distributions | 6,507 | 3,453 |
Redeemed | (42,975) | (23,195) |
Net Increase (Decrease) in Shares Outstanding | 80,246 | 42,433 |
F. In September 2006, the Financial Accounting Standards Board issued Statement of Financial Accounting Standards No. 157 (“FAS 157”), “Fair Value Measurements.” FAS 157 establishes a framework for measuring fair value and expands disclosures about fair value measurements in financial statements.
The various inputs that may be used to determine the value of the fund’s investments are summarized in three broad levels. The inputs or methodologies used for valuing securities are not necessarily an indication of the risk associated with investing in those securities.
Level 1—Quoted prices in active markets for identical securities.
Level 2—Other significant observable inputs (including quoted prices for similar securities, interest rates, prepayment speeds, credit risk, etc.).
Level 3—Significant unobservable inputs (including the fund’s own assumptions used to determine the fair value of investments).
At September 30, 2008, 100% of the fund’s investments were valued based on Level 1 inputs.
16
Target Retirement 2005 Fund
Fund Profile
As of September 30, 2008
Financial Attributes |
|
|
|
Yield1 | 4.0% |
Acquired Fund Fees and Expenses |
|
(9/30/2007)2 | 0.19% |
Volatility Measures3 |
|
| Fund Versus |
| Composite Index4 |
R-Squared | 1.00 |
Beta | 0.99 |
Allocation to Underlying Vanguard Funds |
|
|
|
Total Bond Market Index Fund | 41.9% |
Total Stock Market Index Fund | 33.4 |
Inflation-Protected Securities Fund | 14.2 |
European Stock Index Fund | 4.6 |
Prime Money Market Find | 2.3 |
Pacific Stock Index Fund | 2.0 |
Emerging Markets Stock Index Fund | 1.6 |
Fund Asset Allocation
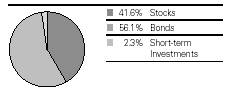
Equity Investment Focus
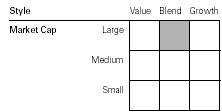
Fixed Income Investment Focus
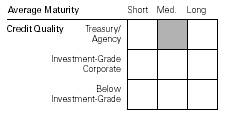
1 30-day SEC yield for the fund. See the Glossary.
2 This figure—drawn from the prospectus dated January 25, 2008—represents a weighted average of the annualized expense ratios and any transaction fees charged by the underlying mutual funds (the “acquired” funds) in which the Target Retirement 2005 Fund invests. The Target Retirement 2005 Fund does not charge any expenses or fees of its own. For the fiscal year ended September 30, 2008, the acquired fund fees and expenses was 0.18%.
3 For an explanation of R-squared, beta, and other terms used here, see the Glossary.
4 Target 2005 Composite Index: Derived by applying the fund’s target asset allocation to the results of the following benchmarks: for international stocks of developed markets, the MSCI EAFE Index; for emerging markets stocks, the Select Emerging Markets Index from inception through August 23, 2006, and the MSCI Emerging Markets Index thereafter; for bonds, the Lehman U.S. Aggregate Bond Index and the Lehman U.S. Treasury Inflation Notes Index; for short-term reserves, the Citigroup 3-Month Treasury Bill Index; and for U.S. stocks, the Dow Jones Wilshire 5000 Index from inception through April 22, 2005, and the MSCI US Broad Market Index thereafter. MSCI EAFE Index returns are adjusted for withholding taxes applicable to Luxembourg holding companies.
17
Target Retirement 2005 Fund
Performance Summary
All of the returns in this report represent past performance, which is not a guarantee of future results that may be achieved by the fund. (Current performance may be lower or higher than the performance data cited. For performance data current to the most recent month-end, visit our website at www.vanguard.com/performance.) Note, too, that both investment returns and principal value can fluctuate widely, so an investor’s shares, when sold, could be worth more or less than their original cost. The returns shown do not reflect taxes that a shareholder would pay on fund distributions or on the sale of fund shares.
Cumulative Performance: October 27, 2003–September 30, 2008
Initial Investment of $10,000
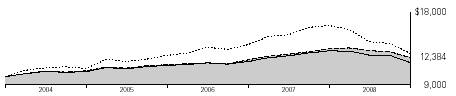
| Average Annual Total Returns | Final Value | |
| Periods Ended September 30, 2008 | of a $10,000 | |
| One Year | Since Inception1 | Investment |
Vanguard Target Retirement 2005 Fund2 | –7.89% | 4.43% | $12,384 |
Dow Jones Wilshire 5000 Index | –21.20 | 5.29 | 12,893 |
Target 2005 Composite Index3 | –7.99 | 4.44 | 12,385 |
Target 2005 Composite Average4 | –11.16 | 3.31 | 11,738 |
1 Performance for the fund and its comparative standards is calculated since the fund’s inception: October 27, 2003.
2 Total returns do not include the account service fee that may be applicable to certain accounts with balances below $10,000.
3 Target 2005 Composite Index: Derived by applying the fund’s target asset allocation to the results of the following benchmarks: for international stocks of developed markets, the MSCI EAFE Index; for emerging markets stocks, the Select Emerging Markets Index from inception through August 23, 2006, and the MSCI Emerging Markets Index thereafter; for bonds, the Lehman U.S. Aggregate Bond Index and the Lehman U.S. Treasury Inflation Notes Index; for short-term reserves, the Citigroup 3-Month Treasury Bill Index; and for U.S. stocks, the Dow Jones Wilshire 5000 Index from inception through April 22, 2005, and the MSCI US Broad Market Index thereafter. MSCI EAFE Index returns are adjusted for withholding taxes applicable to Luxembourg holding companies.
4 Target 2005 Composite Average: Derived by applying the fund’s target allocation to the following peer-group averages: the average fixed income fund, average general equity fund, average Treasury inflation protected securities fund, average international fund, average money market fund, and average emerging markets fund. Derived from data provided by Lipper Inc.
18
Target Retirement 2005 Fund
Fiscal-Year Total Returns (%): October 27, 2003–September 30, 2008 | ||||
|
|
|
| Target |
|
|
|
| 2005 |
Fiscal | Capital | Income | Total | Composite |
Year | Return | Return | Return | Index1 |
2004 | 6.6% | 0.6% | 7.2% | 7.3% |
2005 | 4.6 | 2.4 | 7.0 | 7.1 |
2006 | 2.2 | 2.9 | 5.1 | 5.2 |
2007 | 8.2 | 3.4 | 11.6 | 11.3 |
2008 | –10.7 | 2.8 | –7.9 | –8.0 |
1 Target 2005 Composite Index: Derived by applying the fund’s target asset allocation to the results of the following benchmarks: for international stocks of developed markets, the MSCI EAFE Index; for emerging markets stocks, the Select Emerging Markets Index from inception through August 23, 2006, and the MSCI Emerging Markets Index thereafter; for bonds, the Lehman U.S. Aggregate Bond Index and the Lehman U.S. Treasury Inflation Notes Index; for short-term reserves, the Citigroup 3-Month Treasury Bill Index; and for U.S. stocks, the Dow Jones Wilshire 5000 Index from inception through April 22, 2005, and the MSCI US Broad Market Index thereafter. MSCI EAFE Index returns are adjusted for withholding taxes applicable to Luxembourg holding companies.
Note: See Financial Highlights table for dividend and capital gains information.
19
Target Retirement 2005 Fund
Financial Statements
Statement of Net Assets
As of September 30, 2008
The fund provides a complete list of its holdings four times in each fiscal year, at the quarter-ends. For the second and fourth fiscal quarters, the lists appear in the fund’s semiannual and annual reports to shareholders. For the first and third fiscal quarters, the fund files the lists with the Securities and Exchange Commission on Form N-Q. Shareholders can look up the fund’s Forms N-Q on the SEC’s website at www.sec.gov. Forms N-Q may also be reviewed and copied at the SEC’s Public Reference Room (see the back cover of this report for further information).
|
| Market |
|
| Value• |
| Shares | ($000) |
Investment Companies (100.2%) |
|
|
U.S. Stock Funds (33.4%) |
|
|
Vanguard Total Stock Market Index Fund Investor Shares | 20,473,919 | 581,869 |
Vanguard Total Stock Market ETF | 146,512 | 8,678 |
|
|
|
International Stock Funds (8.2%) |
|
|
Vanguard European Stock Index Fund Investor Shares | 2,879,615 | 80,946 |
Vanguard Pacific Stock Index Fund Investor Shares | 3,668,266 | 35,692 |
Vanguard Emerging Markets Stock Index Fund Investor Shares | 1,288,881 | 27,904 |
|
|
|
Bond Funds (56.3%) |
|
|
Vanguard Total Bond Market Index Fund Investor Shares | 75,305,391 | 743,264 |
Vanguard Inflation-Protected Securities Fund Investor Shares | 20,974,789 | 251,698 |
|
|
|
Money Market Fund (2.3%) |
|
|
Vanguard Prime Money Market Fund Investor Shares | 39,871,799 | 39,872 |
Total Investment Companies (Cost $1,862,046) |
| 1,769,923 |
Other Assets and Liabilities (–0.2%) |
|
|
Other Assets |
| 19,790 |
Liabilities |
| (22,762) |
|
| (2,972) |
Net Assets (100%) |
|
|
Applicable to 160,821,189 outstanding $.001 par value shares of |
|
|
beneficial interest (unlimited authorization) |
| 1,766,951 |
Net Asset Value Per Share |
| $10.99 |
|
|
|
|
|
|
At September 30, 2008, net assets consisted of: |
|
|
|
| Amount |
|
| ($000) |
Paid-in Capital |
| 1,822,751 |
Undistributed Net Investment Income |
| 47,138 |
Accumulated Net Realized Losses |
| (10,815) |
Unrealized Appreciation (Depreciation) |
| (92,123) |
Net Assets |
| 1,766,951 |
• | See Note A in Notes to Financial Statements. |
See accompanying Notes, which are an integral part of the Financial Statements.
20
Target Retirement 2005 Fund
Statement of Operations
| Year Ended |
| September 30, 2008 |
| ($000) |
Investment Income |
|
Income |
|
Income Distributions Received | 63,474 |
Net Investment Income—Note B | 63,474 |
Realized Net Gain (Loss) |
|
Capital Gain Distributions Received | — |
Investment Securities Sold | (5,945) |
Realized Net Gain (Loss) | (5,945) |
Change in Unrealized Appreciation (Depreciation) of Investment Securities | (206,608) |
Net Increase (Decrease) in Net Assets Resulting from Operations | (149,079) |
See accompanying Notes, which are an integral part of the Financial Statements.
21
Target Retirement 2005 Fund
Statement of Changes in Net Assets
| Year Ended September 30, | |
| 2008 | 2007 |
| ($000) | ($000) |
Increase (Decrease) in Net Assets |
|
|
Operations |
|
|
Net Investment Income | 63,474 | 42,868 |
Realized Net Gain (Loss) | (5,945) | 1,349 |
Change in Unrealized Appreciation (Depreciation) | (206,608) | 84,706 |
Net Increase (Decrease) in Net Assets Resulting from Operations | (149,079) | 128,923 |
Distributions |
|
|
Net Investment Income | (49,631) | (31,941) |
Realized Capital Gain | — | — |
Total Distributions | (49,631) | (31,941) |
Capital Share Transactions |
|
|
Issued | 902,990 | 683,917 |
Issued in Lieu of Cash Distributions | 48,860 | 31,382 |
Redeemed | (459,171) | (296,270) |
Net Increase (Decrease) from Capital Share Transactions | 492,679 | 419,029 |
Total Increase (Decrease) | 293,969 | 516,011 |
Net Assets |
|
|
Beginning of Period | 1,472,982 | 956,971 |
End of Period1 | 1,766,951 | 1,472,982 |
1 Net Assets—End of Period includes undistributed net investment income of $47,138,000 and $33,295,000.
See accompanying Notes, which are an integral part of the Financial Statements.
22
Target Retirement 2005 Fund
Financial Highlights
|
|
|
|
| Sept. 1, | Oct. 27, |
|
|
|
|
| 2004, to | 20032 to |
For a Share Outstanding | Year Ended September 30, | Sept. 30, | Aug. 31, | |||
Throughout Each Period | 2008 | 2007 | 2006 | 2005 | 20041 | 2004 |
Net Asset Value, Beginning of Period | $12.31 | $11.38 | $11.14 | $10.65 | $10.58 | $10.00 |
Investment Operations |
|
|
|
|
|
|
Net Investment Income | .4393 | .4203 | .4083 | .3883 | .050 | .185 |
Capital Gain Distributions Received | — | — | .0023 | .0153 | — | .010 |
Net Realized and Unrealized Gain (Loss) |
|
|
|
|
|
|
on Investments | (1.379) | .870 | .149 | .331 | .020 | .450 |
Total from Investment Operations | (.940) | 1.290 | .559 | .734 | .070 | .645 |
Distributions |
|
|
|
|
|
|
Dividends from Net Investment Income | (.380) | (.360) | (.310) | (.240) | — | (.055) |
Distributions from Realized Capital Gains | — | — | (.009) | (.004) | — | (.010) |
Total Distributions | (.380) | (.360) | (.319) | (.244) | — | (.065) |
Net Asset Value, End of Period | $10.99 | $12.31 | $11.38 | $11.14 | $10.65 | $10.58 |
|
|
|
|
|
|
|
Total Return4 | –7.89% | 11.56% | 5.13% | 6.96% | 0.66% | 6.47% |
|
|
|
|
|
|
|
Ratios/Supplemental Data |
|
|
|
|
|
|
Net Assets, End of Period (Millions) | $1,767 | $1,473 | $957 | $651 | $237 | $219 |
Ratio of Total Expenses to |
|
|
|
|
|
|
Average Net Assets | 0%5 | 0% | 0% | 0% | 0% | 0% |
Ratio of Net Investment Income to |
|
|
|
|
|
|
Average Net Assets | 3.71% | 3.56% | 3.68% | 3.57% | 3.57%6 | 3.31%6 |
Portfolio Turnover Rate | 21% | 6% | 19% | 4% | 0% | 2% |
1 The fund’s fiscal year-end changed from August 31 to September 30, effective September 30, 2004.
2 Inception.
3 Calculated based on average shares outstanding.
4 Total returns do not include the account service fee that may be applicable to certain accounts with balances below $10,000.
5 The acquired fund fees and expenses were 0.18%.
6 Annualized.
See accompanying Notes, which are an integral part of the Financial Statements.
23
Target Retirement 2005 Fund
Notes to Financial Statements
Vanguard Target Retirement 2005 Fund is registered under the Investment Company Act of 1940 as an open-end investment company, or mutual fund. The fund follows a balanced investment strategy by investing in selected Vanguard funds to achieve its targeted allocation of assets to U.S. stocks, international stocks, bonds, and short-term reserves.
A. The following significant accounting policies conform to generally accepted accounting principles for U.S. mutual funds. The fund consistently follows such policies in preparing its financial statements.
1. Security Valuation: Securities are valued as of the close of trading on the New York Stock Exchange (generally 4 p.m., Eastern time) on the valuation date. Investments in other Vanguard funds (with the exception of ETF Shares) are valued at that fund’s net asset value. ETFs are valued at the latest quoted sales prices or official closing prices taken from their primary market or, if not traded on the valuation date, at the mean of the latest quoted bid and asked prices.
2. Federal Income Taxes: The fund intends to continue to qualify as a regulated investment company and distribute all of its taxable income. Management has analyzed the fund’s tax positions taken on federal income tax returns for all open tax years (tax years ended September 30, 2005–2008), and has concluded that no provision for federal income tax is required in the fund’s financial statements.
3. Distributions: Distributions to shareholders are recorded on the ex-dividend date.
4. Other: Income and capital gain distributions received are recorded on the ex-dividend date. Security transactions are accounted for on the date securities are bought or sold. Costs used to determine realized gains (losses) on the sale of investment securities are those of the specific securities sold.
B. Under a service agreement, The Vanguard Group furnishes investment advisory, corporate management, administrative, marketing, and distribution services to the fund. The service agreement provides that the fund’s expenses may be reduced or eliminated to the extent of savings realized by the Vanguard funds by the operation of the fund. Accordingly, all incremental expenses for services provided by Vanguard and all other expenses incurred by the fund during the year ended September 30, 2008, were borne by the funds in which the fund invests. The fund’s trustees and officers are also directors and officers of Vanguard and the funds in which the fund invests.
C. Distributions are determined on a tax basis and may differ from net investment income and realized capital gains for financial reporting purposes. Differences may be permanent or temporary. Permanent differences are reclassified among capital accounts in the financial statements to reflect their tax character. Temporary differences arise when certain items of income, expense, gain, or loss are recognized in different periods for financial statement and tax purposes; these differences will reverse at some time in the future. Differences in classification may also result from the treatment of short-term gains as ordinary income for tax purposes.
For tax purposes, at September 30, 2008, the fund had $47,131,000 of ordinary income available for distribution. The fund had available realized losses of $5,576,000 to offset future net capital gains of $4,417,000 through September 30, 2015, and $1,159,000 through September 30, 2017.
At September 30, 2008, the cost of investment securities for tax purposes was $1,867,277,000. Net unrealized depreciation of investment securities for tax purposes was $97,354,000, consisting of unrealized gains of $319,000 on securities that had risen in value since their purchase and $97,673,000 in unrealized losses on securities that had fallen in value since their purchase.
24
Target Retirement 2005 Fund
D. During the year ended September 30, 2008, the fund purchased $874,685,000 of investment securities and sold $365,961,000 of investment securities, other than temporary cash investments.
E. Capital shares issued and redeemed were:
| Year Ended September 30, | |
| 2008 | 2007 |
| Shares | Shares |
| (000) | (000) |
Issued | 76,093 | 57,990 |
Issued in Lieu of Cash Distributions | 4,078 | 2,729 |
Redeemed | (39,032) | (25,100) |
Net Increase (Decrease) in Shares Outstanding | 41,139 | 35,619 |
F. In September 2006, the Financial Accounting Standards Board issued Statement of Financial Accounting Standards No. 157 (“FAS 157”), “Fair Value Measurements.” FAS 157 establishes a framework for measuring fair value and expands disclosures about fair value measurements in financial statements.
The various inputs that may be used to determine the value of the fund’s investments are summarized in three broad levels. The inputs or methodologies used for valuing securities are not necessarily an indication of the risk associated with investing in those securities.
Level 1—Quoted prices in active markets for identical securities.
Level 2—Other significant observable inputs (including quoted prices for similar securities, interest rates, prepayment speeds, credit risk, etc.).
Level 3—Significant unobservable inputs (including the fund’s own assumptions used to determine the fair value of investments).
At September 30, 2008, 100% of the fund’s investments were valued based on Level 1 inputs.
25
Target Retirement 2010 Fund
Fund Profile
As of September 30, 2008
Financial Attributes |
|
|
|
Yield1 | 3.7% |
Acquired Fund Fees and Expenses |
|
(9/30/2007)2 | 0.20% |
Allocation to Underlying Vanguard Funds |
|
|
|
Total Stock Market Index Fund | 43.4% |
Total Bond Market Index Fund | 39.9 |
European Stock Index Fund | 5.8 |
Inflation-Protected Securities Fund | 6.1 |
Pacific Stock Index Fund | 2.7 |
Emerging Markets Stock Index Fund | 2.1 |
Fund Asset Allocation
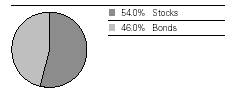
Equity Investment Focus

Fixed Income Investment Focus
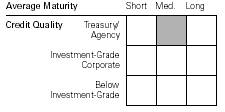
1 30-day SEC yield for the fund. See the Glossary.
2 This figure—drawn from the prospectus dated January 25, 2008—represents a weighted average of the annualized expense ratios and any transaction fees charged by the underlying mutual funds (the “acquired” funds) in which the Target Retirement 2010 Fund invests. The Target Retirement 2010 Fund does not charge any expenses or fees of its own. For the fiscal year ended September 30, 2008, the acquired fund fees and expenses was 0.19%.
26
Target Retirement 2010 Fund
Performance Summary
All of the returns in this report represent past performance, which is not a guarantee of future results that may be achieved by the fund. (Current performance may be lower or higher than the performance data cited. For performance data current to the most recent month-end, visit our website at www.vanguard.com/performance.) Note, too, that both investment returns and principal value can fluctuate widely, so an investor’s shares, when sold, could be worth more or less than their original cost. The returns shown do not reflect taxes that a shareholder would pay on fund distributions or on the sale of fund shares.
Cumulative Performance: June 7, 2006–September 30, 2008
Initial Investment of $10,000
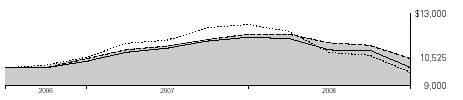
| Average Annual Total Returns | Final Value | |
| Periods Ended September 30, 2008 | of a $10,000 | |
| One Year | Since Inception1 | Investment |
Vanguard Target Retirement 2010 Fund2 | –11.30% | 2.24% | $10,525 |
Dow Jones Wilshire 5000 Index | –21.20 | –1.03 | 9,762 |
Target 2010 Composite Index3 | –11.33 | 2.16 | 10,508 |
Target 2010 Composite Average4 | –14.27 | 0.07 | 10,017 |
Fiscal-Year Total Returns (%): June 7, 20061–September 30, 2008 | ||||
|
|
|
| Target |
|
|
|
| 2010 |
Fiscal | Capital | Income | Total | Composite |
Year | Return | Return | Return | Index3 |
2006 | 5.1% | 0.0% | 5.1% | 5.0% |
2007 | 12.0 | 1.0 | 13.0 | 12.9 |
2008 | –13.0 | 1.7 | –11.3 | –11.3 |
1 Performance for the fund and its comparative standards is calculated since the fund’s inception: June 7, 2006.
2 Total returns do not include the account service fee that may be applicable to certain accounts with balances below $10,000.
3 Target 2010 Composite Index: Derived by applying the fund’s target asset allocation to the results of the following benchmarks: for international stocks of developed markets, the MSCI EAFE Index; for emerging markets stocks, the Select Emerging Markets Index from inception through August 23, 2006, and the MSCI Emerging Markets Index thereafter; for bonds, the Lehman U.S. Aggregate Bond Index and the Lehman U.S. Treasury Inflation Notes Index; and for U.S. stocks, the MSCI US Broad Market Index. MSCI EAFE Index returns are adjusted for withholding taxes applicable to Luxembourg holding companies.
4 Target 2010 Composite Average: Derived by applying the fund’s target allocation to the following peer-group averages: the average general equity fund, average fixed income fund, average international fund, average Treasury inflation protected securities fund, and average emerging markets fund. Derived from data provided by Lipper Inc.
Note: See Financial Highlights table for dividend and capital gains information.
27
Target Retirement 2010 Fund
Financial Statements
Statement of Net Assets
As of September 30, 2008
The fund provides a complete list of its holdings four times in each fiscal year, at the quarter-ends. For the second and fourth fiscal quarters, the lists appear in the fund’s semiannual and annual reports to shareholders. For the first and third fiscal quarters, the fund files the lists with the Securities and Exchange Commission on Form N-Q. Shareholders can look up the fund’s Forms N-Q on the SEC’s website at www.sec.gov. Forms N-Q may also be reviewed and copied at the SEC’s Public Reference Room (see the back cover of this report for further information).
|
| Market |
|
| Value• |
| Shares | ($000) |
Investment Companies (100.1%) |
|
|
U.S. Stock Fund (43.4%) |
|
|
Vanguard Total Stock Market Index Fund Investor Shares | 39,217,520 | 1,114,562 |
|
|
|
International Stock Funds (10.6%) |
|
|
Vanguard European Stock Index Fund Investor Shares | 5,303,307 | 149,076 |
Vanguard Pacific Stock Index Fund Investor Shares | 7,096,607 | 69,050 |
Vanguard Emerging Markets Stock Index Fund Investor Shares | 2,550,995 | 55,229 |
|
|
|
Bond Funds (46.1%) |
|
|
Vanguard Total Bond Market Index Fund Investor Shares | 103,999,273 | 1,026,473 |
Vanguard Inflation-Protected Securities Fund Investor Shares | 12,996,752 | 155,961 |
Total Investment Companies (Cost $2,880,849) |
| 2,570,351 |
Other Assets and Liabilities (–0.1%) |
|
|
Other Assets |
| 27,247 |
Liabilities |
| (30,889) |
|
| (3,642) |
Net Assets (100%) |
|
|
Applicable to 125,407,828 outstanding $.001 par value shares of |
|
|
beneficial interest (unlimited authorization) |
| 2,566,709 |
Net Asset Value Per Share |
| $20.47 |
|
|
|
|
|
|
At September 30, 2008, net assets consisted of: |
|
|
|
| Amount |
|
| ($000) |
Paid-in Capital |
| 2,832,285 |
Undistributed Net Investment Income |
| 53,920 |
Accumulated Net Realized Losses |
| (8,998) |
Unrealized Appreciation (Depreciation) |
| (310,498) |
Net Assets |
| 2,566,709 |
• | See Note A in Notes to Financial Statements. |
See accompanying Notes, which are an integral part of the Financial Statements.
28
Target Retirement 2010 Fund
Statement of Operations
| Year Ended |
| September 30, 2008 |
| ($000) |
Investment Income |
|
Income |
|
Income Distributions Received | 72,341 |
Net Investment Income—Note B | 72,341 |
Realized Net Gain (Loss) |
|
Capital Gain Distributions Received | — |
Investment Securities Sold | (9,018) |
Realized Net Gain (Loss) | (9,018) |
Change in Unrealized Appreciation (Depreciation) of Investment Securities | (356,455) |
Net Increase (Decrease) in Net Assets Resulting from Operations | (293,132) |
See accompanying Notes, which are an integral part of the Financial Statements.
29
Target Retirement 2010 Fund
Statement of Changes in Net Assets
| Year Ended September 30, | |
| 2008 | 2007 |
| ($000) | ($000) |
Increase (Decrease) in Net Assets |
|
|
Operations |
|
|
Net Investment Income | 72,341 | 20,078 |
Realized Net Gain (Loss) | (9,018) | 23 |
Change in Unrealized Appreciation (Depreciation) | (356,455) | 44,637 |
Net Increase (Decrease) in Net Assets Resulting from Operations | (293,132) | 64,738 |
Distributions |
|
|
Net Investment Income | (36,684) | (2,109) |
Realized Capital Gain | — | — |
Total Distributions | (36,684) | (2,109) |
Capital Share Transactions |
|
|
Issued | 2,079,645 | 1,301,181 |
Issued in Lieu of Cash Distributions | 36,584 | 2,103 |
Redeemed | (517,140) | (143,478) |
Net Increase (Decrease) from Capital Share Transactions | 1,599,089 | 1,159,806 |
Total Increase (Decrease) | 1,269,273 | 1,222,435 |
Net Assets |
|
|
Beginning of Period | 1,297,436 | 75,001 |
End of Period1 | 2,566,709 | 1,297,436 |
1 Net Assets—End of Period includes undistributed net investment income of $53,920,000 and $18,263,000.
See accompanying Notes, which are an integral part of the Financial Statements.
30
Target Retirement 2010 Fund
Financial Highlights
|
|
| June 7, |
| Year Ended | 20061 to | |
|
| September 30, | Sept. 30, |
For a Share Outstanding Throughout Each Period | 2008 | 2007 | 2006 |
Net Asset Value, Beginning of Period | $23.54 | $21.01 | $20.00 |
Investment Operations |
|
|
|
Net Investment Income | .7442 | .7302 | .2302 |
Capital Gain Distributions Received | — | — | — |
Net Realized and Unrealized Gain (Loss) on Investments | (3.354) | 1.980 | .780 |
Total from Investment Operations | (2.610) | 2.710 | 1.010 |
Distributions |
|
|
|
Dividends from Net Investment Income | (.460) | (.180) | — |
Distributions from Realized Capital Gains | — | — | — |
Total Distributions | (.460) | (.180) | — |
Net Asset Value, End of Period | $20.47 | $23.54 | $21.01 |
|
|
|
|
Total Return3 | –11.30% | 12.96% | 5.05% |
|
|
|
|
Ratios/Supplemental Data |
|
|
|
Net Assets, End of Period (Millions) | $2,567 | $1,297 | $75 |
Ratio of Total Expenses to Average Net Assets | 0%4 | 0% | 0% |
Ratio of Net Investment Income to Average Net Assets | 3.34% | 3.26% | 2.89%5 |
Portfolio Turnover Rate | 18% | 4% | 4% |
1 Inception.
2 Calculated based on average shares outstanding.
3 Total returns do not include the account service fee that may be applicable to certain accounts with balances below $10,000.
4 The acquired fund fees and expenses were 0.19%.
5 Annualized.
See accompanying Notes, which are an integral part of the Financial Statements.
31
Target Retirement 2010 Fund
Notes to Financial Statements
Vanguard Target Retirement 2010 Fund is registered under the Investment Company Act of 1940 as an open-end investment company, or mutual fund. The fund follows a balanced investment strategy by investing in selected Vanguard funds to achieve its targeted allocation of assets to U.S. stocks, international stocks, and bonds.
A. The following significant accounting policies conform to generally accepted accounting principles for U.S. mutual funds. The fund consistently follows such policies in preparing its financial statements.
1. Security Valuation: Investments are valued at the net asset value of each underlying Vanguard fund determined as of the close of the New York Stock Exchange (generally 4 p.m., Eastern time) on the valuation date.
2. Federal Income Taxes: The fund intends to continue to qualify as a regulated investment company and distribute all of its taxable income. Management has analyzed the fund’s tax positions taken on federal income tax returns for all open tax years (tax years ended September 30, 2006–2008), and has concluded that no provision for federal income tax is required in the fund’s financial statements.
3. Distributions: Distributions to shareholders are recorded on the ex-dividend date.
4. Other: Income and capital gain distributions received are recorded on the ex-dividend date. Security transactions are accounted for on the date securities are bought or sold. Costs used to determine realized gains (losses) on the sale of investment securities are those of the specific securities sold.
B. Under a service agreement, The Vanguard Group furnishes investment advisory, corporate management, administrative, marketing, and distribution services to the fund. The service agreement provides that the fund’s expenses may be reduced or eliminated to the extent of savings realized by the Vanguard funds by the operation of the fund. Accordingly, all incremental expenses for services provided by Vanguard and all other expenses incurred by the fund during the year ended September 30, 2008, were borne by the funds in which the fund invests. The fund’s trustees and officers are also directors and officers of Vanguard and the funds in which the fund invests.
C. Distributions are determined on a tax basis and may differ from net investment income and realized capital gains for financial reporting purposes. Differences may be permanent or temporary. Permanent differences are reclassified among capital accounts in the financial statements to reflect their tax character. Temporary differences arise when certain items of income, expense, gain, or loss are recognized in different periods for financial statement and tax purposes; these differences will reverse at some time in the future. Differences in classification may also result from the treatment of short-term gains as ordinary income for tax purposes.
For tax purposes, at September 30, 2008, the fund had $53,940,000 of ordinary income available for distribution. The fund had available realized losses of $1,423,000 to offset future net capital gains through September 30, 2017.
At September 30, 2008, the cost of investment securities for tax purposes was $2,888,444,000. Net unrealized depreciation of investment securities for tax purposes was $318,093,000, consisting entirely of unrealized losses on securities that had fallen in value since their purchase.
D. During the year ended September 30, 2008, the fund purchased $2,035,954,000 of investment securities and sold $397,392,000 of investment securities, other than temporary cash investments.
32
Target Retirement 2010 Fund
E. Capital shares issued and redeem
| Year Ended September 30, | |
| 2008 | 2007 |
| Shares | Shares |
| (000) | (000) |
Issued | 92,025 | 57,778 |
Issued in Lieu of Cash Distributions | 1,589 | 96 |
Redeemed | (23,324) | (6,326) |
Net Increase (Decrease) in Shares Outstanding | 70,290 | 51,548 |
F. In September 2006, the Financial Accounting Standards Board issued Statement of Financial Accounting Standards No. 157 (“FAS 157”), “Fair Value Measurements.” FAS 157 establishes a framework for measuring fair value and expands disclosures about fair value measurements in financial statements.
The various inputs that may be used to determine the value of the fund’s investments are summarized in three broad levels. The inputs or methodologies used for valuing securities are not necessarily an indication of the risk associated with investing in those securities.
Level 1—Quoted prices in active markets for identical securities.
Level 2—Other significant observable inputs (including quoted prices for similar securities, interest rates, prepayment speeds, credit risk, etc.).
Level 3—Significant unobservable inputs (including the fund’s own assumptions used to determine the fair value of investments).
At September 30, 2008, 100% of the fund’s investments were valued based on Level 1 inputs.
33
Target Retirement 2015 Fund
Fund Profile
As of September 30, 2008
Financial Attributes |
|
|
|
Yield1 | 3.4% |
Acquired Fund Fees and Expenses |
|
(9/30/2007)2 | 0.19% |
Volatility Measures3 |
|
| Fund Versus |
| Composite Index4 |
R-Squared | 1.00 |
Beta | 0.99 |
Allocation to Underlying Vanguard Funds |
|
|
|
Total Stock Market Index Fund | 50.5% |
Total Bond Market Index Fund | 37.1 |
European Stock Index Fund | 6.7 |
Pacific Stock Index Fund | 3.1 |
Emerging Markets Stock Index Fund | 2.6 |
Fund Asset Allocation
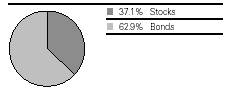
Equity Investment Focus
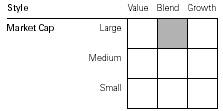
Fixed Income Investment Focus

1 30-day SEC yield for the fund. See the Glossary.
2 This figure—drawn from the prospectus dated January 25, 2008—represents a weighted average of the annualized expense ratios and any transaction fees charged by the underlying mutual funds (the “acquired” funds) in which the Target Retirement 2015 Fund invests. The Target Retirement 2015 Fund does not charge any expenses or fees of its own. For the fiscal year ended September 30, 2008, the acquired fund fees and expenses was 0.18%.
3 For an explanation of R-squared, beta, and other terms used here, see the Glossary.
4 Target 2015 Composite Index: Derived by applying the fund’s target asset allocation to the results of the following benchmarks: for international stocks of developed markets, the MSCI EAFE Index; for emerging markets stocks, the Select Emerging Markets Index from inception through August 23, 2006, and the MSCI Emerging Markets Index thereafter; for bonds, the Lehman U.S. Aggregate Bond Index; and for U.S. stocks, the Dow Jones Wilshire 5000 Index from inception through April 22, 2005, and the MSCI US Broad Market Index thereafter. MSCI EAFE Index returns are adjusted for withholding taxes applicable to Luxembourg holding companies.
34
Target Retirement 2015 Fund
Performance Summary
All of the returns in this report represent past performance, which is not a guarantee of future results that may be achieved by the fund. (Current performance may be lower or higher than the performance data cited. For performance data current to the most recent month-end, visit our website at www.vanguard.com/performance.) Note, too, that both investment returns and principal value can fluctuate widely, so an investor’s shares, when sold, could be worth more or less than their original cost. The returns shown do not reflect taxes that a shareholder would pay on fund distributions or on the sale of fund shares.
Cumulative Performance: October 27, 2003–September 30, 2008
Initial Investment of $10,000
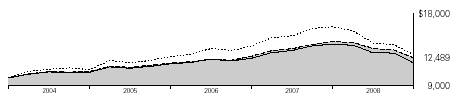
| Average Annual Total Returns | Final Value | |
| Periods Ended September 30, 2008 | of a $10,000 | |
| One Year | Since Inception1 | Investment |
Vanguard Target Retirement 2015 Fund2 | –13.75% | 4.62% | $12,489 |
Dow Jones Wilshire 5000 Index | –21.20 | 5.29 | 12,893 |
Target 2015 Composite Index3 | –13.89 | 4.60 | 12,482 |
Target 2015 Composite Average4 | –16.53 | 3.52 | 11,858 |
1 Performance for the fund and its comparative standards is calculated since the fund’s inception: October 27, 2003.
2 Total returns do not include the account service fee that may be applicable to certain accounts with balances below $10,000.
3 Target 2015 Composite Index: Derived by applying the fund’s target asset allocation to the results of the following benchmarks: for international stocks of developed markets, the MSCI EAFE Index; for emerging markets stocks, the Select Emerging Markets Index from inception through August 23, 2006, and the MSCI Emerging Markets Index thereafter; for bonds, the Lehman U.S. Aggregate Bond Index; and for U.S. stocks, the Dow Jones Wilshire 5000 Index from inception through April 22, 2005, and the MSCI US Broad Market Index thereafter. MSCI EAFE Index returns are adjusted for withholding taxes applicable to Luxembourg holding companies.
4 Target 2015 Composite Average: Derived by applying the fund’s target allocation to the following peer-group averages: the average general equity fund, average fixed income fund, average international fund, and average emerging markets fund. Derived from data provided by Lipper Inc.
35
Target Retirement 2015 Fund
Fiscal-Year Total Returns (%): October 27, 2003–September 30, 2008 | ||||
|
|
|
| Target |
|
|
|
| 2015 |
Fiscal | Capital | Income | Total | Composite |
Year | Return | Return | Return | Index1 |
2004 | 7.4% | 0.6% | 8.0% | 8.0% |
2005 | 7.5 | 1.9 | 9.4 | 9.5 |
2006 | 4.9 | 2.3 | 7.2 | 7.3 |
2007 | 11.5 | 2.8 | 14.3 | 14.2 |
2008 | –15.9 | 2.2 | –13.7 | –13.9 |
1 Target 2015 Composite Index: Derived by applying the fund’s target asset allocation to the results of the following benchmarks: for international stocks of developed markets, the MSCI EAFE Index; for emerging markets stocks, the Select Emerging Markets Index from inception through August 23, 2006, and the MSCI Emerging Markets Index thereafter; for bonds, the Lehman U.S. Aggregate Bond Index; and for U.S. stocks, the Dow Jones Wilshire 5000 Index from inception through April 22, 2005, and the MSCI US Broad Market Index thereafter. MSCI EAFE Index returns are adjusted for withholding taxes applicable to Luxembourg holding companies.
Note: See Financial Highlights table for dividend and capital gains information.
36
Target Retirement 2015 Fund
Financial Statements
Statement of Net Assets
As of September 30, 2008
The fund provides a complete list of its holdings four times in each fiscal year, at the quarter-ends. For the second and fourth fiscal quarters, the lists appear in the fund’s semiannual and annual reports to shareholders. For the first and third fiscal quarters, the fund files the lists with the Securities and Exchange Commission on Form N-Q. Shareholders can look up the fund’s Forms N-Q on the SEC’s website at www.sec.gov. Forms N-Q may also be reviewed and copied at the SEC’s Public Reference Room (see the back cover of this report for further information).
|
| Market |
|
| Value• |
| Shares | ($000) |
Investment Companies (100.1%) |
|
|
U.S. Stock Funds (50.5%) |
|
|
Vanguard Total Stock Market Index Fund Investor Shares | 137,853,199 | 3,917,788 |
Vanguard Total Stock Market ETF | 425,882 | 25,225 |
|
|
|
International Stock Funds (12.4%) |
|
|
Vanguard European Stock Index Fund Investor Shares | 18,578,778 | 522,249 |
Vanguard Pacific Stock Index Fund Investor Shares | 24,927,742 | 242,547 |
Vanguard Emerging Markets Stock Index Fund Investor Shares | 9,346,968 | 202,362 |
|
|
|
Bond Fund (37.2%) |
|
|
Vanguard Total Bond Market Index Fund Investor Shares | 293,963,388 | 2,901,419 |
Total Investment Companies (Cost $8,463,945) |
| 7,811,590 |
Other Assets and Liabilities (–0.1%) |
|
|
Other Assets |
| 64,022 |
Liabilities |
| (72,087) |
|
| (8,065) |
Net Assets (100%) |
|
|
Applicable to 687,843,403 outstanding $.001 par value shares of |
|
|
beneficial interest (unlimited authorization) |
| 7,803,525 |
Net Asset Value Per Share |
| $11.34 |
At September 30, 2008, net assets consisted of: |
|
| Amount |
| ($000) |
Paid-in Capital | 8,350,566 |
Undistributed Net Investment Income | 157,589 |
Accumulated Net Realized Losses | (52,275) |
Unrealized Appreciation (Depreciation) | (652,355) |
Net Assets | 7,803,525 |
• | See Note A in Notes to Financial Statements. |
See accompanying Notes, which are an integral part of the Financial Statements.
37
Target Retirement 2015 Fund
Statement of Operations
| Year Ended |
| September 30, 2008 |
| ($000) |
Investment Income |
|
Income |
|
Income Distributions Received | 228,895 |
Net Investment Income—Note B | 228,895 |
Realized Net Gain (Loss) |
|
Capital Gain Distributions Received | — |
Investment Securities Sold | (35,964) |
Realized Net Gain (Loss) | (35,964) |
Change in Unrealized Appreciation (Depreciation) of Investment Securities | (1,349,722) |
Net Increase (Decrease) in Net Assets Resulting from Operations | (1,156,791) |
See accompanying Notes, which are an integral part of the Financial Statements.
38
Target Retirement 2015 Fund
Statement of Changes in Net Assets
| Year Ended September 30, | |
| 2008 | 2007 |
| ($000) | ($000) |
Increase (Decrease) in Net Assets |
|
|
Operations |
|
|
Net Investment Income | 228,895 | 151,696 |
Realized Net Gain (Loss) | (35,964) | 182 |
Change in Unrealized Appreciation (Depreciation) | (1,349,722) | 505,907 |
Net Increase (Decrease) in Net Assets Resulting from Operations | (1,156,791) | 657,785 |
Distributions |
|
|
Net Investment Income | (181,936) | (104,720) |
Realized Capital Gain | — | — |
Total Distributions | (181,936) | (104,720) |
Capital Share Transactions |
|
|
Issued | 3,567,141 | 2,889,953 |
Issued in Lieu of Cash Distributions | 181,232 | 104,087 |
Redeemed | (1,224,652) | (648,837) |
Net Increase (Decrease) from Capital Share Transactions | 2,523,721 | 2,345,203 |
Total Increase (Decrease) | 1,184,994 | 2,898,268 |
Net Assets |
|
|
Beginning of Period | 6,618,531 | 3,720,263 |
End of Period1 | 7,803,525 | 6,618,531 |
1 Net Assets—End of Period includes undistributed net investment income of $157,589,000 and $110,630,000.
See accompanying Notes, which are an integral part of the Financial Statements.
39
Target Retirement 2015 Fund
Financial Highlights
|
|
|
|
| Sept. 1, | Oct. 27, |
|
|
|
|
| 2004, to | 20032 to |
For a Share Outstanding | Year Ended September 30, | Sept. 30, | Aug. 31, | |||
Throughout Each Period | 2008 | 2007 | 2006 | 2005 | 20041 | 2004 |
Net Asset Value, Beginning of Period | $13.49 | $12.10 | $11.54 | $10.74 | $10.63 | $10.00 |
Investment Operations |
|
|
|
|
|
|
Net Investment Income | .3803 | .3803 | .3563 | .3463 | .030 | .160 |
Capital Gain Distributions Received | — | — | — | .0043 | — | — |
Net Realized and Unrealized Gain (Loss) |
|
|
|
|
|
|
on Investments | (2.190) | 1.320 | .466 | .652 | .080 | .530 |
Total from Investment Operations | (1.810) | 1.700 | .822 | 1.002 | .110 | .690 |
Distributions |
|
|
|
|
|
|
Dividends from Net Investment Income | (.340) | (.310) | (.260) | (.200) | — | (.060) |
Distributions from Realized Capital Gains | — | — | (.002) | (.002) | — | — |
Total Distributions | (.340) | (.310) | (.262) | (.202) | — | (.060) |
Net Asset Value, End of Period | $11.34 | $13.49 | $12.10 | $11.54 | $10.74 | $10.63 |
|
|
|
|
|
|
|
Total Return4 | –13.75% | 14.25% | 7.25% | 9.40% | 1.03% | 6.92% |
|
|
|
|
|
|
|
Ratios/Supplemental Data |
|
|
|
|
|
|
|
|
|
|
|
|
|
Net Assets, End of Period (Millions) | $7,804 | $6,619 | $3,720 | $1,804 | $470 | $427 |
Ratio of Total Expenses to |
|
|
|
|
|
|
Average Net Assets | 0%5 | 0% | 0% | 0% | 0% | 0% |
Ratio of Net Investment Income to |
|
|
|
|
|
|
Average Net Assets | 3.02% | 2.93% | 3.04% | 3.11% | 2.85%6 | 2.69%6 |
Portfolio Turnover Rate | 24% | 5% | 15% | 1% | 0% | 1% |
1 The fund’s fiscal year-end changed from August 31 to September 30, effective September 30, 2004.
2 Inception.
3 Calculated based on average shares outstanding.
4 Total returns do not include the account service fee that may be applicable to certain accounts with balances below $10,000.
5 The acquired fund fees and expenses were 0.18%.
6 Annualized.
See accompanying Notes, which are an integral part of the Financial Statements.
40
Target Retirement 2015 Fund
Notes to Financial Statements
Vanguard Target Retirement 2015 Fund is registered under the Investment Company Act of 1940 as an open-end investment company, or mutual fund. The fund follows a balanced investment strategy by investing in selected Vanguard funds to achieve its targeted allocation of assets to U.S. stocks, international stocks, and bonds.
A. The following significant accounting policies conform to generally accepted accounting principles for U.S. mutual funds. The fund consistently follows such policies in preparing its financial statements.
1. Security Valuation: Securities are valued as of the close of trading on the New York Stock Exchange (generally 4 p.m., Eastern time) on the valuation date. Investments in other Vanguard funds (with the exception of ETF Shares) are valued at that fund’s net asset value. ETFs are valued at the latest quoted sales prices or official closing prices taken from their primary market or, if not traded on the valuation date, at the mean of the latest quoted bid and asked prices.
2. Federal Income Taxes: The fund intends to continue to qualify as a regulated investment company and distribute all of its taxable income. Management has analyzed the fund’s tax positions taken on federal income tax returns for all open tax years (tax years ended September 30, 2005–2008), and has concluded that no provision for federal income tax is required in the fund’s financial statements.
3. Distributions: Distributions to shareholders are recorded on the ex-dividend date.
4. Other: Income and capital gain distributions received are recorded on the ex-dividend date. Security transactions are accounted for on the date securities are bought or sold. Costs used to determine realized gains (losses) on the sale of investment securities are those of the specific securities sold.
B. Under a service agreement, The Vanguard Group furnishes investment advisory, corporate management, administrative, marketing, and distribution services to the fund. The service agreement provides that the fund’s expenses may be reduced or eliminated to the extent of savings realized by the Vanguard funds by the operation of the fund. Accordingly, all incremental expenses for services provided by Vanguard and all other expenses incurred by the fund during the year ended September 30, 2008, were borne by the funds in which the fund invests. The fund’s trustees and officers are also directors and officers of Vanguard and the funds in which the fund invests.
C. Distributions are determined on a tax basis and may differ from net investment income and realized capital gains for financial reporting purposes. Differences may be permanent or temporary. Permanent differences are reclassified among capital accounts in the financial statements to reflect their tax character. Temporary differences arise when certain items of income, expense, gain, or loss are recognized in different periods for financial statement and tax purposes; these differences will reverse at some time in the future. Differences in classification may also result from the treatment of short-term gains as ordinary income for tax purposes.
For tax purposes, at September 30, 2008, the fund had $157,655,000 of ordinary income available for distribution. The fund had available realized losses of $18,548,000 to offset future net capital gains of $15,574,000 through September 30, 2015, and $2,974,000 through September 30, 2017.
At September 30, 2008, the cost of investment securities for tax purposes was $8,497,739,000. Net unrealized depreciation of investment securities for tax purposes was $686,149,000, consisting of unrealized gains of $1,542,000 on securities that had risen in value since their purchase and $687,691,000 in unrealized losses on securities that had fallen in value since their purchase.
41
Target Retirement 2015 Fund
D. During the year ended September 30, 2008, the fund purchased $4,433,889,000 of investment securities and sold $1,850,896,000 of investment securities, other than temporary cash investments.
E. Capital shares issued and redeemed were:
| Year Ended September 30, | |
| 2008 | 2007 |
| Shares | Shares |
| (000) | (000) |
Issued | 282,206 | 225,167 |
Issued in Lieu of Cash Distributions | 13,888 | 8,327 |
Redeemed | (98,726) | (50,427) |
Net Increase (Decrease) in Shares Outstanding | 197,368 | 183,067 |
F. In September 2006, the Financial Accounting Standards Board issued Statement of Financial Accounting Standards No. 157 (“FAS 157”), “Fair Value Measurements.” FAS 157 establishes a framework for measuring fair value and expands disclosures about fair value measurements in financial statements.
The various inputs that may be used to determine the value of the fund’s investments are summarized in three broad levels. The inputs or methodologies used for valuing securities are not necessarily an indication of the risk associated with investing in those securities.
Level 1—Quoted prices in active markets for identical securities.
Level 2—Other significant observable inputs (including quoted prices for similar securities, interest rates, prepayment speeds, credit risk, etc.).
Level 3—Significant unobservable inputs (including the fund’s own assumptions used to determine the fair value of investments).
At September 30, 2008, 100% of the fund’s investments were valued based on Level 1 inputs.
Target Retirement 2020 Fund
Fund Profile
As of September 30, 2008
Financial Attributes |
|
|
|
Yield1 | 3.2% |
Acquired Fund Fees and Expenses |
|
(9/30/2007)2 | 0.20% |
Allocation to Underlying Vanguard Funds |
|
|
|
Total Stock Market Index Fund | 56.5% |
Total Bond Market Index Fund | 29.5 |
European Stock Index Fund | 7.6 |
Pacific Stock Index Fund | 3.5 |
Emerging Markets Stock Index Fund | 2.9 |
Fund Asset Allocation
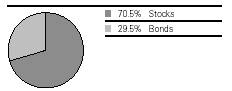
Equity Investment Focus
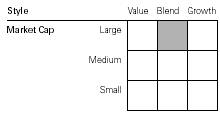
Fixed Income Investment Focus
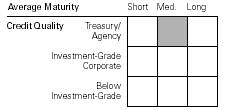
1 30-day SEC yield for the fund. See the Glossary.
2 This figure—drawn from the prospectus dated January 25, 2008—represents a weighted average of the annualized expense ratios and any transaction fees charged by the underlying mutual funds (the “acquired” funds) in which the Target Retirement 2020 Fund invests. The Target Retirement 2020 Fund does not charge any expenses or fees of its own. For the fiscal year ended September 30, 2008, the acquired fund fees and expenses was 0.19%.
43
Target Retirement 2020 Fund
Performance Summary
All of the returns in this report represent past performance, which is not a guarantee of future results that may be achieved by the fund. (Current performance may be lower or higher than the performance data cited. For performance data current to the most recent month-end, visit our website at www.vanguard.com/performance.) Note, too, that both investment returns and principal value can fluctuate widely, so an investor’s shares, when sold, could be worth more or less than their original cost. The returns shown do not reflect taxes that a shareholder would pay on fund distributions or on the sale of fund shares.
Cumulative Performance: June 7, 2006–September 30, 2008
Initial Investment of $10,000
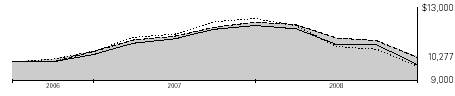
| Average Annual Total Returns | Final Value | |
| Periods Ended September 30, 2008 | of a $10,000 | |
| One Year | Since Inception1 | Investment |
Vanguard Target Retirement 2020 Fund2 | –15.61% | 1.19% | $10,277 |
Dow Jones Wilshire 5000 Index | –21.20 | –1.03 | 9,762 |
Target 2020 Composite Index3 | –15.84 | 1.10 | 10,257 |
Target 2020 Composite Average4 | –18.10 | –0.73 | 9,832 |
Fiscal-Year Total Returns (%): June 7, 20061–September 30, 2008 | ||||
|
|
|
| Target |
|
|
|
| 2020 |
Fiscal | Capital | Income | Total | Composite |
Year | Return | Return | Return | Index3 |
2006 | 5.7% | 0.0% | 5.7% | 5.7% |
2007 | 14.2 | 1.0 | 15.2 | 15.3 |
2008 | –17.1 | 1.5 | –15.6 | –15.8 |
1 Performance for the fund and its comparative standards is calculated since the fund’s inception: June 7, 2006.
2 Total returns do not include the account service fee that may be applicable to certain accounts with balances below $10,000.
3 Target 2020 Composite Index: Derived by applying the fund’s target asset allocation to the results of the following benchmarks: for international stocks of developed markets, the MSCI EAFE Index; for emerging markets stocks, the Select Emerging Markets Index from inception through August 23, 2006, and the MSCI Emerging Markets Index thereafter; for bonds, the Lehman U.S. Aggregate Bond Index; and for U.S. stocks, the MSCI US Broad Market Index. MSCI EAFE Index returns are adjusted for withholding taxes applicable to Luxembourg holding companies.
4 Target 2020 Composite Average: Derived by applying the fund’s target allocation to the following peer-group averages: the average general equity fund, average fixed income fund, average international fund, and average emerging markets fund. Derived from data provided by Lipper Inc.
Note: See Financial Highlights table for dividend and capital gains information.
44
Target Retirement 2020 Fund
Financial Statements
Statement of Net Assets
As of September 30, 2008
The fund provides a complete list of its holdings four times in each fiscal year, at the quarter-ends. For the second and fourth fiscal quarters, the lists appear in the fund’s semiannual and annual reports to shareholders. For the first and third fiscal quarters, the fund files the lists with the Securities and Exchange Commission on Form N-Q. Shareholders can look up the fund’s Forms N-Q on the SEC’s website at www.sec.gov. Forms N-Q may also be reviewed and copied at the SEC’s Public Reference Room (see the back cover of this report for further information).
|
| Market |
|
| Value• |
| Shares | ($000) |
Investment Companies (100.0%) |
|
|
U.S. Stock Fund (56.5%) |
|
|
Vanguard Total Stock Market Index Fund Investor Shares | 76,671,101 | 2,178,993 |
|
|
|
International Stock Funds (14.0%) |
|
|
Vanguard European Stock Index Fund Investor Shares | 10,474,123 | 294,428 |
Vanguard Pacific Stock Index Fund Investor Shares | 13,776,762 | 134,048 |
Vanguard Emerging Markets Stock Index Fund Investor Shares | 5,242,133 | 113,492 |
|
|
|
Bond Fund (29.5%) |
|
|
Vanguard Total Bond Market Index Fund Investor Shares | 115,388,474 | 1,138,884 |
Total Investment Companies (Cost $4,433,138) |
| 3,859,845 |
Other Assets and Liabilities (0.0%) |
|
|
Other Assets |
| 31,040 |
Liabilities |
| (31,888) |
|
| (848) |
Net Assets (100%) |
|
|
Applicable to 192,661,349 outstanding $.001 par value shares of |
|
|
beneficial interest (unlimited authorization) |
| 3,858,997 |
Net Asset Value Per Share |
| $20.03 |
At September 30, 2008, net assets consisted of: |
|
| Amount |
| ($000) |
Paid-in Capital | 4,379,828 |
Undistributed Net Investment Income | 61,901 |
Accumulated Net Realized Losses | (9,439) |
Unrealized Appreciation (Depreciation) | (573,293) |
Net Assets | 3,858,997 |
• | See Note A in Notes to Financial Statements. |
See accompanying Notes, which are an integral part of the Financial Statements.
45
Target Retirement 2020 Fund
Statement of Operations
| Year Ended |
| September 30, 2008 |
| ($000) |
Investment Income |
|
Income |
|
Income Distributions Received | 84,945 |
Net Investment Income—Note B | 84,945 |
Realized Net Gain (Loss) |
|
Capital Gain Distributions Received | — |
Investment Securities Sold | (9,462) |
Realized Net Gain (Loss) | (9,462) |
Change in Unrealized Appreciation (Depreciation) of Investment Securities | (655,255) |
Net Increase (Decrease) in Net Assets Resulting from Operations | (579,772) |
See accompanying Notes, which are an integral part of the Financial Statements.
46
Target Retirement 2020 Fund
Statement of Changes in Net Assets
| Year Ended September 30, | |
| 2008 | 2007 |
| ($000) | ($000) |
Increase (Decrease) in Net Assets |
|
|
Operations |
|
|
Net Investment Income | 84,945 | 22,355 |
Realized Net Gain (Loss) | (9,462) | 24 |
Change in Unrealized Appreciation (Depreciation) | (655,255) | 79,776 |
Net Increase (Decrease) in Net Assets Resulting from Operations | (579,772) | 102,155 |
Distributions |
|
|
Net Investment Income | (42,617) | (3,141) |
Realized Capital Gain | — | — |
Total Distributions | (42,617) | (3,141) |
Capital Share Transactions |
|
|
Issued | 3,161,786 | 1,602,760 |
Issued in Lieu of Cash Distributions | 42,557 | 3,137 |
Redeemed | (441,547) | (103,496) |
Net Increase (Decrease) from Capital Share Transactions | 2,762,796 | 1,502,401 |
Total Increase (Decrease) | 2,140,407 | 1,601,415 |
Net Assets |
|
|
Beginning of Period | 1,718,590 | 117,175 |
End of Period1 | 3,858,997 | 1,718,590 |
1 Net Assets—End of Period includes undistributed net investment income of $61,901,000 and $19,573,000.
See accompanying Notes, which are an integral part of the Financial Statements.
47
Target Retirement 2020 Fund
Financial Highlights
|
| June 7, | |
| Year Ended | 20061 to | |
| September 30, | Sept. 30, | |
For a Share Outstanding Throughout Each Period | 2008 | 2007 | 2006 |
Net Asset Value, Beginning of Period | $24.15 | $21.14 | $20.00 |
Investment Operations |
|
|
|
Net Investment Income | .6192 | .6002 | .1902 |
Capital Gain Distributions Received | — | — | — |
Net Realized and Unrealized Gain (Loss) on Investments | (4.329) | 2.600 | .950 |
Total from Investment Operations | (3.710) | 3.200 | 1.140 |
Distributions |
|
|
|
Dividends from Net Investment Income | (.410) | (.190) | — |
Distributions from Realized Capital Gains | — | — | — |
Total Distributions | (.410) | (.190) | — |
Net Asset Value, End of Period | $20.03 | $24.15 | $21.14 |
|
|
|
|
Total Return3 | –15.61% | 15.21% | 5.70% |
|
|
|
|
Ratios/Supplemental Data |
|
|
|
Net Assets, End of Period (Millions) | $3,859 | $1,719 | $117 |
Ratio of Total Expenses to Average Net Assets | 0%4 | 0% | 0% |
Ratio of Net Investment Income to Average Net Assets | 2.79% | 2.61% | 2.24%5 |
Portfolio Turnover Rate | 15% | 4% | 2% |
1 Inception.
2 Calculated based on average shares outstanding.
3 Total returns do not include the account service fee that may be applicable to certain accounts with balances below $10,000.
4 The acquired fund fees and expenses were 0.19%.
5 Annualized.
See accompanying Notes, which are an integral part of the Financial Statements.
48
Target Retirement 2020 Fund
Notes to Financial Statements
Vanguard Target Retirement 2020 Fund is registered under the Investment Company Act of 1940 as an open-end investment company, or mutual fund. The fund follows a balanced investment strategy by investing in selected Vanguard funds to achieve its targeted allocation of assets to U.S. stocks, international stocks, and bonds.
A. The following significant accounting policies conform to generally accepted accounting principles for U.S. mutual funds. The fund consistently follows such policies in preparing its financial statements.
1. Security Valuation: Investments are valued at the net asset value of each underlying Vanguard fund determined as of the close of the New York Stock Exchange (generally 4 p.m., Eastern time) on the valuation date.
2. Federal Income Taxes: The fund intends to continue to qualify as a regulated investment company and distribute all of its taxable income. Management has analyzed the fund’s tax positions taken on federal income tax returns for all open tax years (tax years ended September 30, 2006–2008), and has concluded that no provision for federal income tax is required in the fund’s financial statements.
3. Distributions: Distributions to shareholders are recorded on the ex-dividend date.
4. Other: Income and capital gain distributions received are recorded on the ex-dividend date. Security transactions are accounted for on the date securities are bought or sold. Costs used to determine realized gains (losses) on the sale of investment securities are those of the specific securities sold.
B. Under a service agreement, The Vanguard Group furnishes investment advisory, corporate management, administrative, marketing, and distribution services to the fund. The service agreement provides that the fund’s expenses may be reduced or eliminated to the extent of savings realized by the Vanguard funds by the operation of the fund. Accordingly, all incremental expenses for services provided by Vanguard and all other expenses incurred by the fund during the year ended September 30, 2008, were borne by the funds in which the fund invests. The fund’s trustees and officers are also directors and officers of Vanguard and the funds in which the fund invests.
C. Distributions are determined on a tax basis and may differ from net investment income and realized capital gains for financial reporting purposes. Differences may be permanent or temporary. Permanent differences are reclassified among capital accounts in the financial statements to reflect their tax character. Temporary differences arise when certain items of income, expense, gain, or loss are recognized in different periods for financial statement and tax purposes; these differences will reverse at some time in the future. Differences in classification may also result from the treatment of short-term gains as ordinary income for tax purposes.
For tax purposes, at September 30, 2008, the fund had $61,923,000 of ordinary income available for distribution. The fund had available realized losses of $320,000 to offset future net capital gains through September 30, 2017.
At September 30, 2008, the cost of investment securities for tax purposes was $4,442,279,000. Net unrealized depreciation of investment securities for tax purposes was $582,434,000, consisting entirely of unrealized losses on securities that had fallen in value since their purchase.
D. During the year ended September 30, 2008, the fund purchased $3,266,310,000 of investment securities and sold $458,489,000 of investment securities, other than temporary cash investments.
49
Target Retirement 2020 Fund
E. Capital shares issued and redeemed were:
| Year Ended September 30, | |
| 2008 | 2007 |
| Shares | Shares |
| (000) | (000) |
Issued | 139,639 | 69,925 |
Issued in Lieu of Cash Distributions | 1,813 | 141 |
Redeemed | (19,939) | (4,461) |
Net Increase (Decrease) in Shares Outstanding | 121,513 | 65,605 |
F. In September 2006, the Financial Accounting Standards Board issued Statement of Financial Accounting Standards No. 157 (“FAS 157”), “Fair Value Measurements.” FAS 157 establishes a framework for measuring fair value and expands disclosures about fair value measurements in financial statements.
The various inputs that may be used to determine the value of the fund’s investments are summarized in three broad levels. The inputs or methodologies used for valuing securities are not necessarily an indication of the risk associated with investing in those securities.
Level 1—Quoted prices in active markets for identical securities.
Level 2—Other significant observable inputs (including quoted prices for similar securities, interest rates, prepayment speeds, credit risk, etc.).
Level 3—Significant unobservable inputs (including the fund’s own assumptions used to determine the fair value of investments).
At September 30, 2008, 100% of the fund’s investments were valued based on Level 1 inputs.
50
Target Retirement 2025 Fund
Fund Profile
As of September 30, 2008
Financial Attributes |
|
|
|
Yield1 | 3.0% |
Acquired Fund Fees and Expenses |
|
(9/30/2007)2 | 0.19% |
Volatility Measures3 |
|
| Fund Versus |
| Composite Index4 |
R-Squared | 1.00 |
Beta | 0.99 |
Allocation to Underlying Vanguard Funds |
|
|
|
Total Stock Market Index Fund | 62.5% |
Total Bond Market Index Fund | 22.1 |
European Stock Index Fund | 8.4 |
Pacific Stock Index Fund | 3.8 |
Emerging Markets Stock Index Fund | 3.2 |
Fund Asset Allocation
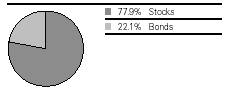
Equity Investment Focus

Fixed Income Investment Focus

1 30-day SEC yield for the fund. See the Glossary.
2 This figure—drawn from the prospectus dated January 25, 2008—represents a weighted average of the annualized expense ratios and any transaction fees charged by the underlying mutual funds (the “acquired” funds) in which the Target Retirement 2025 Fund invests. The Target Retirement 2025 Fund does not charge any expenses or fees of its own. For the fiscal year ended September 30, 2008, the acquired fund fees and expenses was 0.18%.
3 For an explanation of R-squared, beta, and other terms used here, see the Glossary.
4 Target 2025 Composite Index: Derived by applying the fund’s target asset allocation to the results of the following benchmarks: for international stocks of developed markets, the MSCI EAFE Index; for emerging markets stocks, the Select Emerging Markets Index from inception through August 23, 2006, and the MSCI Emerging Markets Index thereafter; for bonds, the Lehman U.S. Aggregate Bond Index; and for U.S. stocks, the Dow Jones Wilshire 5000 Index from inception through April 22, 2005, and the MSCI US Broad Market Index thereafter. MSCI EAFE Index returns are adjusted for withholding taxes applicable to Luxembourg holding companies.
51
Target Retirement 2025 Fund
Performance Summary
All of the returns in this report represent past performance, which is not a guarantee of future results that may be achieved by the fund. (Current performance may be lower or higher than the performance data cited. For performance data current to the most recent month-end, visit our website at www.vanguard.com/performance.) Note, too, that both investment returns and principal value can fluctuate widely, so an investor’s shares, when sold, could be worth more or less than their original cost. The returns shown do not reflect taxes that a shareholder would pay on fund distributions or on the sale of fund shares.
Cumulative Performance: October 27, 2003–September 30, 2008
Initial Investment of $10,000
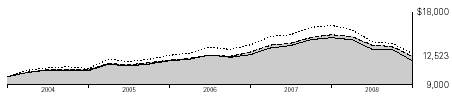
| Average Annual Total Returns | Final Value | |
| Periods Ended September 30, 2008 | of a $10,000 | |
| One Year | Since Inception1 | Investment |
Vanguard Target Retirement 2025 Fund2 | –17.61% | 4.67% | $12,523 |
Dow Jones Wilshire 5000 Index | –21.20 | 5.29 | 12,893 |
Target 2025 Composite Index3 | –17.77 | 4.64 | 12,502 |
Target 2025 Composite Average4 | –19.64 | 3.65 | 11,932 |
1 Performance for the fund and its comparative standards is calculated since the fund’s inception: October 27, 2003.
2 Total returns do not include the account service fee that may be applicable to certain accounts with balances below $10,000.
3 Target 2025 Composite Index: Derived by applying the fund’s target asset allocation to the results of the following benchmarks: for international stocks of developed markets, the MSCI EAFE Index; for emerging markets stocks, the Select Emerging Markets Index from inception through August 23, 2006, and the MSCI Emerging Markets Index thereafter; for bonds, the Lehman U.S. Aggregate Bond Index; and for U.S. stocks, the Dow Jones Wilshire 5000 Index from inception through April 22, 2005, and the MSCI US Broad Market Index thereafter. MSCI EAFE Index returns are adjusted for withholding taxes applicable to Luxembourg holding companies.
4 Target 2025 Composite Average: Derived by applying the fund’s target allocation to the following peer-group averages: the average general equity fund, average fixed income fund, average international fund, and average emerging markets fund. Derived from data provided by Lipper Inc.
52
Target Retirement 2025 Fund
Fiscal-Year Total Returns (%): October 27, 2003–September 30, 2008 | ||||
|
|
|
| Target |
|
|
|
| 2025 |
Fiscal | Capital | Income | Total | Composite1 |
Year | Return | Return | Return | Index |
2004 | 8.2% | 0.6% | 8.8% | 8.7% |
2005 | 9.1 | 1.7 | 10.8 | 11.0 |
2006 | 6.0 | 2.2 | 8.2 | 8.3 |
2007 | 14.0 | 2.5 | 16.5 | 16.4 |
2008 | –19.4 | 1.8 | –17.6 | –17.8 |
1 Target 2025 Composite Index: Derived by applying the fund’s target asset allocation to the results of the following benchmarks: for international stocks of developed markets, the MSCI EAFE Index; for emerging markets stocks, the Select Emerging Markets Index from inception through August 23, 2006, and the MSCI Emerging Markets Index thereafter; for bonds, the Lehman U.S. Aggregate Bond Index; and for U.S. stocks, the Dow Jones Wilshire 5000 Index from inception through April 22, 2005, and the MSCI US Broad Market Index thereafter. MSCI EAFE Index returns are adjusted for withholding taxes applicable to Luxembourg holding companies.
Note: See Financial Highlights table for dividend and capital gains information.
53
Target Retirement 2025 Fund
Financial Statements
Statement of Net Assets
As of September 30, 2008
The fund provides a complete list of its holdings four times in each fiscal year, at the quarter-ends. For the second and fourth fiscal quarters, the lists appear in the fund’s semiannual and annual reports to shareholders. For the first and third fiscal quarters, the fund files the lists with the Securities and Exchange Commission on Form N-Q. Shareholders can look up the fund’s Forms N-Q on the SEC’s website at www.sec.gov. Forms N-Q may also be reviewed and copied at the SEC’s Public Reference Room (see the back cover of this report for further information).
|
| Market |
|
| Value• |
| Shares | ($000) |
Investment Companies (100.0%) |
|
|
U.S. Stock Funds (62.4%) |
|
|
Vanguard Total Stock Market Index Fund Investor Shares | 169,098,609 | 4,805,783 |
Vanguard Total Stock Market ETF | 742,584 | 43,983 |
|
|
|
International Stock Funds (15.5%) |
|
|
Vanguard European Stock Index Fund Investor Shares | 23,198,008 | 652,096 |
Vanguard Pacific Stock Index Fund Investor Shares | 30,743,774 | 299,137 |
Vanguard Emerging Markets Stock Index Fund Investor Shares | 11,642,479 | 252,060 |
|
|
|
Bond Fund (22.1%) |
|
|
Vanguard Total Bond Market Index Fund Investor Shares | 174,165,268 | 1,719,011 |
Total Investment Companies (Cost $8,535,058) |
| 7,772,070 |
Other Assets and Liabilities (0.0%) |
|
|
Other Assets |
| 49,300 |
Liabilities |
| (51,892) |
|
| (2,592) |
Net Assets (100%) |
|
|
Applicable to 675,993,201 outstanding $.001 par value shares of |
|
|
beneficial interest (unlimited authorization) |
| 7,769,478 |
Net Asset Value Per Share |
| $11.49 |
At September 30, 2008, net assets consisted of: |
|
| Amount |
| ($000) |
Paid-in Capital | 8,455,979 |
Undistributed Net Investment Income | 126,495 |
Accumulated Net Realized Losses | (50,008) |
Unrealized Appreciation (Depreciation) | (762,988) |
Net Assets | 7,769,478 |
• | See Note A in Notes to Financial Statements. |
See accompanying Notes, which are an integral part of the Financial Statements.
54
Target Retirement 2025 Fund
Statement of Operations
| Year Ended |
| September 30, 2008 |
| ($000) |
Investment Income |
|
Income |
|
Income Distributions Received | 197,015 |
Net Investment Income—Note B | 197,015 |
Realized Net Gain (Loss) |
|
Capital Gain Distributions Received | — |
Investment Securities Sold | (21,723) |
Realized Net Gain (Loss) | (21,723) |
Change in Unrealized Appreciation (Depreciation) of Investment Securities | (1,673,419) |
Net Increase (Decrease) in Net Assets Resulting from Operations | (1,498,127) |
See accompanying Notes, which are an integral part of the Financial Statements.
55
Target Retirement 2025 Fund
Statement of Changes in Net Assets
| Year Ended September 30, | |
| 2008 | 2007 |
| ($000) | ($000) |
Increase (Decrease) in Net Assets |
|
|
Operations |
|
|
Net Investment Income | 197,015 | 130,000 |
Realized Net Gain (Loss) | (21,723) | 747 |
Change in Unrealized Appreciation (Depreciation) | (1,673,419) | 647,918 |
Net Increase (Decrease) in Net Assets Resulting from Operations | (1,498,127) | 778,665 |
Distributions |
|
|
Net Investment Income | (159,322) | (99,473) |
Realized Capital Gain | — | — |
Total Distributions | (159,322) | (99,473) |
Capital Share Transactions |
|
|
Issued | 3,447,494 | 2,514,282 |
Issued in Lieu of Cash Distributions | 158,878 | 99,047 |
Redeemed | (900,232) | (528,787) |
Net Increase (Decrease) from Capital Share Transactions | 2,706,140 | 2,084,542 |
Total Increase (Decrease) | 1,048,691 | 2,763,734 |
Net Assets |
|
|
Beginning of Period | 6,720,787 | 3,957,053 |
End of Period1 | 7,769,478 | 6,720,787 |
1 Net Assets—End of Period includes undistributed net investment income of $126,495,000 and $88,802,000.
See accompanying Notes, which are an integral part of the Financial Statements.
56
Target Retirement 2025 Fund
Financial Highlights
|
|
|
|
| Sept. 1, | Oct. 27, |
|
|
|
|
| 2004, to | 20032 to |
For a Share Outstanding | Year Ended September 30, | Sept. 30, | Aug. 31, | |||
Throughout Each Period | 2008 | 2007 | 2006 | 2005 | 20041 | 2004 |
Net Asset Value, Beginning of Period | $14.26 | $12.51 | $11.80 | $10.82 | $10.69 | $10.00 |
Investment Operations |
|
|
|
|
|
|
Net Investment Income | .307 | .300 | .3213 | .3203 | .020 | .130 |
Capital Gain Distributions Received | — | — | — | .0033 | — | — |
Net Realized and Unrealized Gain (Loss) |
|
|
|
|
|
|
on Investments | (2.767) | 1.740 | .630 | .839 | .110 | .620 |
Total from Investment Operations | (2.460) | 2.040 | .951 | 1.162 | .130 | .750 |
Distributions |
|
|
|
|
|
|
Dividends from Net Investment Income | (.310) | (.290) | (.240) | (.180) | — | (.060) |
Distributions from Realized Capital Gains | — | — | (.001) | (.002) | — | — |
Total Distributions | (.310) | (.290) | (.241) | (.182) | — | (.060) |
Net Asset Value, End of Period | $11.49 | $14.26 | $12.51 | $11.80 | $10.82 | $10.69 |
|
|
|
|
|
|
|
Total Return4 | –17.61% | 16.51% | 8.18% | 10.80% | 1.22% | 7.52% |
|
|
|
|
|
|
|
Ratios/Supplemental Data |
|
|
|
|
|
|
Net Assets, End of Period (Millions) | $7,769 | $6,721 | $3,957 | $1,968 | $495 | $453 |
Ratio of Total Expenses to |
|
|
|
|
|
|
Average Net Assets | 0%5 | 0% | 0% | 0% | 0% | 0% |
Ratio of Net Investment Income to |
|
|
|
|
|
|
Average Net Assets | 2.59% | 2.43% | 2.66% | 2.84% | 2.55%6 | 2.33%6 |
Portfolio Turnover Rate | 17% | 4% | 22% | 2% | 0% | 3% |
1 The fund’s fiscal year-end changed from August 31 to September 30, effective September 30, 2004.
2 Inception.
3 Calculated based on average shares outstanding.
4 Total returns do not include the account service fee that may be applicable to certain accounts with balances below $10,000.
5 The acquired fund fees and expenses were 0.18%.
6 Annualized.
See accompanying Notes, which are an integral part of the Financial Statements.
57
Target Retirement 2025 Fund
Notes to Financial Statements
Vanguard Target Retirement 2025 Fund is registered under the Investment Company Act of 1940 as an open-end investment company, or mutual fund. The fund follows a balanced investment strategy by investing in selected Vanguard funds to achieve its targeted allocation of assets to U.S. stocks, international stocks, and bonds.
A. The following significant accounting policies conform to generally accepted accounting principles for U.S. mutual funds. The fund consistently follows such policies in preparing its financial statements.
1. Security Valuation: Securities are valued as of the close of trading on the New York Stock Exchange (generally 4 p.m., Eastern time) on the valuation date. Investments in other Vanguard funds (with the exception of ETF Shares) are valued at that fund’s net asset value. ETFs are valued at the latest quoted sales prices or official closing prices taken from their primary market or, if not traded on the valuation date, at the mean of the latest quoted bid and asked prices.
2. Federal Income Taxes: The fund intends to continue to qualify as a regulated investment company and distribute all of its taxable income. Management has analyzed the fund’s tax positions taken on federal income tax returns for all open tax years (tax years ended September 30, 2005–2008), and has concluded that no provision for federal income tax is required in the fund’s financial statements.
3. Distributions: Distributions to shareholders are recorded on the ex-dividend date.
4. Other: Income and capital gain distributions received are recorded on the ex-dividend date. Security transactions are accounted for on the date securities are bought or sold. Costs used to determine realized gains (losses) on the sale of investment securities are those of the specific securities sold.
B. Under a service agreement, The Vanguard Group furnishes investment advisory, corporate management, administrative, marketing, and distribution services to the fund. The service agreement provides that the fund’s expenses may be reduced or eliminated to the extent of savings realized by the Vanguard funds by the operation of the fund. Accordingly, all incremental expenses for services provided by Vanguard and all other expenses incurred by the fund during the year ended September 30, 2008, were borne by the funds in which the fund invests. The fund’s trustees and officers are also directors and officers of Vanguard and the funds in which the fund invests.
C. Distributions are determined on a tax basis and may differ from net investment income and realized capital gains for financial reporting purposes. Differences may be permanent or temporary. Permanent differences are reclassified among capital accounts in the financial statements to reflect their tax character. Temporary differences arise when certain items of income, expense, gain, or loss are recognized in different periods for financial statement and tax purposes; these differences will reverse at some time in the future. Differences in classification may also result from the treatment of short-term gains as ordinary income for tax purposes.
For tax purposes, at September 30, 2008, the fund had $126,557,000 of ordinary income available for distribution. The fund had available realized losses of $28,071,000 to offset future net capital gains of $27,716,000 through September 30, 2015, and $355,000 through September 30, 2017.
At September 30, 2008, the cost of investment securities for tax purposes was $8,557,056,000. Net unrealized depreciation of investment securities for tax purposes was $784,986,000, consisting of unrealized gains of $1,270,000 on securities that had risen in value since their purchase and $786,256,000 in unrealized losses on securities that had fallen in value since their purchase.
58
Target Retirement 2025 Fund
D. During the year ended September 30, 2008, the fund purchased $4,054,617,000 of investment securities and sold $1,299,848,000 of investment securities, other than temporary cash investments.
E. Capital shares issued and redeemed were:
| Year Ended September 30, | |
| 2008 | 2007 |
| Shares | Shares |
| (000) | (000) |
Issued | 262,709 | 186,702 |
Issued in Lieu of Cash Distributions | 11,563 | 7,567 |
Redeemed | (69,696) | (39,196) |
Net Increase (Decrease) in Shares Outstanding | 204,576 | 155,073 |
F. In September 2006, the Financial Accounting Standards Board issued Statement of Financial Accounting Standards No. 157 (“FAS 157”), “Fair Value Measurements.” FAS 157 establishes a framework for measuring fair value and expands disclosures about fair value measurements in financial statements.
The various inputs that may be used to determine the value of the fund’s investments are summarized in three broad levels. The inputs or methodologies used for valuing securities are not necessarily an indication of the risk associated with investing in those securities.
Level 1—Quoted prices in active markets for identical securities.
Level 2—Other significant observable inputs (including quoted prices for similar securities, interest rates, prepayment speeds, credit risk, etc.).
Level 3—Significant unobservable inputs (including the fund’s own assumptions used to determine the fair value of investments).
At September 30, 2008, 100% of the fund’s investments were valued based on Level 1 inputs.
59
Report of Independent Registered Public Accounting Firm
To the Trustees of Vanguard Chester Funds and the Shareholders of Vanguard Target Retirement
Income Fund, Vanguard Target Retirement 2005 Fund, Vanguard Target Retirement 2010 Fund, Vanguard Target Retirement 2015 Fund, Vanguard Target Retirement 2020 Fund, and Vanguard Target Retirement 2025 Fund:
In our opinion, the accompanying statements of net assets and the related statements of operations and of changes in net assets and the financial highlights present fairly, in all material respects, the financial position of Vanguard Target Retirement Income Fund, Vanguard Target Retirement 2005 Fund, Vanguard Target Retirement 2010 Fund, Vanguard Target Retirement 2015 Fund, Vanguard Target Retirement 2020 Fund, and Vanguard Target Retirement 2025 Fund (the “Funds”) at September 30, 2008, the results of each of their operations for the year then ended, the changes in each of their net assets for each of the two years in the period then ended, and the financial highlights for each of the periods indicated, in conformity with accounting principles generally accepted in the United States of America. These financial statements and financial highlights (hereafter referred to as “financial statements”) are the responsibility of the Funds’ management; our responsibility is to express an opinion on these financial statements based on our audits. We conducted our audits of these financial statements in accordance with the standards of the Public Company Accounting Oversight Board (United States). Those standards require that we plan and perform the audit to obtain reasonable assurance about whether the financial statements are free of material misstatement. An audit includes examining, on a test basis, evidence supporting the amounts and disclosures in the financial statements, assessing the accounting principles used and significant estimates made by management, and evaluating the overall financial statement presentation. We believe that our audits, which included confirmation of securities at September 30, 2008 by agreement to the underlying ownership records for the Vanguard funds, provide a reasonable basis for our opinion.
PricewaterhouseCoopers LLP
Philadelphia, Pennsylvania
November 19, 2008
60
Special 2008 tax information (unaudited) for Vanguard Target Retirement Funds |
This information for the fiscal year ended September 30, 2008, is included pursuant to provisions of the Internal Revenue Code.
The funds distributed qualified dividend income to shareholders during the fiscal year as follows:
| Qualified Dividend Income |
Fund | ($000) |
Target Retirement Income Fund | 9,435 |
Target Retirement 2005 Fund | 10,954 |
Target Retirement 2010 Fund | 12,770 |
Target Retirement 2015 Fund | 70,391 |
Target Retirement 2020 Fund | 21,632 |
Target Retirement 2025 Fund | 89,236 |
For corporate shareholders, the percentage of investment income (dividend income plus short-term gains, if any) that qualifies for the dividends-received deduction is as follows:
Fund | Percentage |
Target Retirement Income Fund | 10.7% |
Target Retirement 2005 Fund | 16.4 |
Target Retirement 2010 Fund | 24.2 |
Target Retirement 2015 Fund | 30.2 |
Target Retirement 2020 Fund | 37.8 |
Target Retirement 2025 Fund | 43.3 |
61
Your Fund’s After-Tax Returns
This table presents returns for your fund both before and after taxes. The after-tax returns are shown in two ways: (1) assuming that an investor owned the fund during the entire period and paid taxes on the fund’s distributions, and (2) assuming that an investor paid taxes on the fund’s distributions and sold all shares at the end of each period.
Calculations are based on the highest individual federal income tax and capital gains tax rates in effect at the times of the distributions and the hypothetical sales. State and local taxes were not considered. After-tax returns reflect any qualified dividend income, using actual prior-year figures and estimates for 2008. (In the example, returns after the sale of fund shares may be higher than those assuming no sale. This occurs when the sale would have produced a capital loss. The calculation assumes that the investor received a tax deduction for the loss.)
Please note that your actual after-tax returns will depend on your tax situation and may differ from those shown. Also note that if you own the fund in a tax-deferred account, such as an individual retirement account or a 401(k) plan, this information does not apply to you. Such accounts are not subject to current taxes.
Finally, keep in mind that a fund’s performance—whether before or after taxes—does not guarantee future results.
Average Annual Total Returns: Vanguard Target Retirement Funds1 | ||
Periods Ended September 30, 2008 |
|
|
| One | Since |
| Year | Inception2 |
Target Retirement Income Fund |
|
|
Returns Before Taxes | –4.23% | 4.24% |
Returns After Taxes on Distributions | –5.48 | 2.97 |
Returns After Taxes on Distributions and Sale of Fund Shares | –2.62 | 2.93 |
|
|
|
Target Retirement 2005 Fund |
|
|
Returns Before Taxes | –7.89% | 4.43% |
Returns After Taxes on Distributions | –8.76 | 3.66 |
Returns After Taxes on Distributions and Sale of Fund Shares | –4.94 | 3.41 |
|
|
|
Target Retirement 2010 Fund |
|
|
Returns Before Taxes | –11.30% | 2.24% |
Returns After Taxes on Distributions | –11.79 | 1.90 |
Returns After Taxes on Distributions and Sale of Fund Shares | –7.17 | 1.76 |
1 Total returns do not include the account service fee that my be applicable to certain accounts with balances below $10,000.
2 For the Income and 2005 Funds, October 27, 2003; for the 2010 Fund, June 7, 2006.
62
| One | Since |
| Year | Inception1 |
Target Retirement 2015 Fund |
|
|
Returns Before Taxes | –13.75% | 4.62% |
Returns After Taxes on Distributions | –14.34 | 4.05 |
Returns After Taxes on Distributions and Sale of Fund Shares | –8.68 | 3.71 |
|
|
|
Target Retirement 2020 Fund |
|
|
Returns Before Taxes | –15.61% | 1.19% |
Returns After Taxes on Distributions | –15.97 | 0.91 |
Returns After Taxes on Distributions and Sale of Fund Shares | –9.94 | 0.94 |
|
|
|
Target Retirement 2025 Fund |
|
|
Returns Before Taxes | –17.61% | 4.67% |
Returns After Taxes on Distributions | –18.04 | 4.21 |
Returns After Taxes on Distributions and Sale of Fund Shares | –11.15 | 3.84 |
1 For the 2015 and 2025 Funds, October 27, 2003; for the 2020 Fund, June 7, 2006.
63
About Your Fund’s Expenses
As a shareholder of the fund, you incur ongoing costs, which include costs for portfolio management, administrative services, and shareholder reports (like this one), among others. Operating expenses, which are deducted from a fund’s gross income, directly reduce the investment return of the fund.
A typical fund’s expenses are expressed as a percentage of its average net assets. The Target Retirement Funds have no direct expenses, but each fund bears its proportionate share of the costs for the underlying funds in which it invests. These indirect expenses make up the acquired fund fees and expenses, also expressed as a percentage of average net assets.
The following examples are intended to help you understand the ongoing costs (in dollars) of investing in your fund and to compare these costs with those of other mutual funds. The examples are based on an investment of $1,000 made at the beginning of the period shown and held for the entire period. The costs were calculated using the acquired fund fees and expenses for each Target Retirement Fund.
The accompanying table illustrates your fund’s costs in two ways:
• Based on actual fund return. This section helps you to estimate the actual expenses that you paid over the period. The “Ending Account Value” shown is derived from the fund’s actual return, and the third column shows the dollar amount that would have been paid by an investor who started with $1,000 in the fund. You may use the information here, together with the amount you invested, to estimate the expenses that you paid over the period.
To do so, simply divide your account value by $1,000 (for example, an $8,600 account value divided by $1,000 = 8.6), then multiply the result by the number given for your fund under the heading “Expenses Paid During Period.”
• Based on hypothetical 5% yearly return. This section is intended to help you compare your fund’s costs with those of other mutual funds. It assumes that the fund had a yearly return of 5% before expenses, but that the expense ratio is unchanged. In this case—because the return used is not the fund’s actual return—the results do not apply to your investment. The example is useful in making comparisons because the Securities and Exchange Commission requires all mutual funds to calculate expenses based on a 5% return. You can assess your fund’s costs by comparing this hypothetical example with the hypothetical examples that appear in shareholder reports of other funds.
64
Six Months Ended September 30, 2008 |
|
|
|
| Beginning | Ending | Expenses |
| Account Value | Account Value | Paid During |
| 3/31/2008 | 9/30/2008 | Period1 |
Based on Actual Fund Return |
|
|
|
Income | $1,000.00 | $949.11 | $0.93 |
2005 | 1,000.00 | 937.71 | 0.87 |
2010 | 1,000.00 | 925.41 | 0.87 |
2015 | 1,000.00 | 915.99 | 0.86 |
2020 | 1,000.00 | 908.39 | 0.86 |
2025 | 1,000.00 | 899.77 | 0.81 |
Based on Hypothetical 5% Yearly Return |
|
|
|
Income | $1,000.00 | $1,024.12 | $0.96 |
2005 | 1,000.00 | 1,024.17 | 0.91 |
2010 | 1,000.00 | 1,024.17 | 0.91 |
2015 | 1,000.00 | 1,024.17 | 0.91 |
2020 | 1,000.00 | 1,024.17 | 0.91 |
2025 | 1,000.00 | 1,024.22 | 0.86 |
Note that the expenses shown in the table are meant to highlight and help you compare ongoing costs only and do not reflect transaction costs incurred by the fund for buying and selling securities. Further, the expenses do not include the account service fee described in the prospectus. If such a fee were applied to your account, your costs would be higher. Your fund does not charge transaction fees, such as purchase or redemption fees, nor does it carry a “sales load.”
The calculations assume no shares were bought or sold during the period. Your actual costs may have been higher or lower, depending on the amount of your investment and the timing of any purchases or redemptions.
You can find more information about the fund’s expenses, including annual expense ratios, in the Financial Statements section of this report. For additional information on operating expenses and other shareholder costs, please refer to your fund’s current prospectus.
1 The calculations are based on the acquired fund fees and expenses for the most recent six-month period. The funds’ annualized expense ratios for that period are (in order as listed from top to bottom above) 0.19%, 0.18%, 0.18%, 0.18%, 0.18%, and 0.17%. The dollar amounts shown as “Expenses Paid” are equal to the annualized expense figures, multiplied by the average account value over the period, multiplied by the number of days in the most recent six-month period, then divided by the number of days in the most recent 12-month period.
65
Glossary
Acquired Fund Fees and Expenses. Funds that invest in other Vanguard funds incur no direct expenses, but they do bear proportionate shares of the operating, administrative, and advisory expenses of the underlying funds, and they must pay any fees charged by those funds. The figure for acquired fund fees and expenses represents a weighted average of these underlying costs. Acquired is a term that the Securities and Exchange Commission applies to any mutual fund whose shares are owned by another fund.
Beta. A measure of the magnitude of a fund’s past share-price fluctuations in relation to the ups and downs of a given market index. The index is assigned a beta of 1.00. Compared with a given index, a fund with a beta of 1.20 typically would have seen its share price rise or fall by 12% when the index rose or fell by 10%. For this report, beta is based on returns over the past 36 months for both the fund and the index. Note that a fund’s beta should be reviewed in conjunction with its R-squared (see definition). The lower the R-squared, the less correlation there is between the fund and the index, and the less reliable beta is as an indicator of volatility.
Expense Ratio. The percentage of a fund’s average net assets used to pay its annual administrative and advisory expenses. These expenses directly reduce returns to investors.
Inception Date. The date on which the assets of a fund (or one of its share classes) are first invested in accordance with the fund’s investment objective. For funds with a subscription period, the inception date is the day after that period ends. Investment performance is measured from the inception date.
R-Squared. A measure of how much of a fund’s past returns can be explained by the returns from the market in general, as measured by a given index. If a fund’s total returns were precisely synchronized with an index’s returns, its R-squared would be 1.00. If the fund’s returns bore no relationship to the index’s returns, its R-squared would be 0. For this report, R-squared is based on returns over the past 36 months for both the fund and the index.
Yield. A fund’s 30-day SEC yield is derived using a formula specified by the U.S. Securities and Exchange Commission. Under the formula, data related to the fund’s security holdings in the previous 30 days are used to calculate the fund’s hypothetical net income for that period, which is then annualized and divided by the fund’s estimated average net assets over the calculation period. For the purposes of this calculation, a security’s income is based on its current market yield to maturity (in the case of bonds) or its projected dividend yield (for stocks). Because the SEC yield represents hypothetical annualized income, it will differ—at times significantly—from the fund’s actual experience. As a result, the fund’s income distributions may be higher or lower than implied by the SEC yield.
66
This page intentionally left blank.
The People Who Govern Your Fund
The trustees of your mutual fund are there to see that the fund is operated and managed in your best interests since, as a shareholder, you are a part owner of the fund. Your fund’s trustees also serve on the board of directors of The Vanguard Group, Inc., which is owned by the Vanguard funds and provides services to them on an at-cost basis.
A majority of Vanguard’s board members are independent, meaning that they have no affiliation with Vanguard or the funds they oversee, apart from the sizable personal investments they have made as private individuals.
Our independent board members bring distinguished backgrounds in business, academia, and public service to their task of working with Vanguard officers to establish the policies and oversee the activities of the funds. Among board members’ responsibilities are selecting investment advisors for the funds; monitoring fund operations, performance, and costs; reviewing contracts; nominating and selecting new trustees/directors; and electing Vanguard officers.
Each trustee serves a fund until its termination; or until the trustee’s retirement, resignation, or death; or otherwise as specified in the fund’s organizational documents. Any trustee may be removed at a shareholders’ meeting by a vote representing two-thirds of the net asset value of all shares of the fund together with shares of other Vanguard funds organized within the same trust. The table on these two pages shows information for each trustee and executive officer of the fund. The mailing address of the trustees and officers is P.O. Box 876, Valley Forge, PA 19482.
Chairman of the Board and Trustee | |
|
|
John J. Brennan1 |
|
Born 1954 | Principal Occupation(s) During the Past Five Years: Chairman of the Board and Director/ |
Trustee Since May 1987; | Trustee of The Vanguard Group, Inc., and of each of the investment companies served |
Chairman of the Board | by The Vanguard Group; Chief Executive Officer and President of The Vanguard Group |
156 Vanguard Funds Overseen | and of each of the investment companies served by The Vanguard Group (1996–2008). |
|
|
Independent Trustees |
|
|
|
Charles D. Ellis |
|
Born 1937 | Principal Occupation(s) During the Past Five Years: Applecore Partners (pro bono ventures |
Trustee Since January 2001 | in education); Senior Advisor to Greenwich Associates (international business strategy |
156 Vanguard Funds Overseen | consulting); Successor Trustee of Yale University; Overseer of the Stern School of Business |
| at New York University; Trustee of the Whitehead Institute for Biomedical Research. |
|
|
Emerson U. Fullwood |
|
Born 1948 | Principal Occupation(s) During the Past Five Years: Executive Chief Staff and Marketing |
Trustee Since January 2008 | Officer for North America since 2004 and Corporate Vice President of Xerox Corporation |
156 Vanguard Funds Overseen | (photocopiers and printers); Director of SPX Corporation (multi-industry manufacturing), |
| of the United Way of Rochester, and of the Boy Scouts of America. |
|
|
Rajiv L. Gupta |
|
Born 1945 | Principal Occupation(s) During the Past Five Years: Chairman, President, and |
Trustee Since December 20012 | Chief Executive Officer of Rohm and Haas Co. (chemicals); Board Member of |
156 Vanguard Funds Overseen | the American Chemistry Council; Director of Tyco International, Ltd. (diversified |
| manufacturing and services) since 2005. |
|
|
Amy Gutmann |
|
Born 1949 | Principal Occupation(s) During the Past Five Years: President of the University of |
Trustee Since June 2006 | Pennsylvania since 2004; Professor in the School of Arts and Sciences, Annenberg School |
156 Vanguard Funds Overseen | for Communication, and Graduate School of Education of the University of Pennsylvania |
| since 2004; Provost (2001–2004) and Laurance S. Rockefeller Professor of Politics and |
| the University Center for Human Values (1990–2004), Princeton University; Director of |
| Carnegie Corporation of New York since 2005 and of Schuylkill River Development |
| Corporation and Greater Philadelphia Chamber of Commerce since 2004; Trustee of |
| the National Constitution Center since 2007. |
JoAnn Heffernan Heisen |
|
Born 1950 | Principal Occupation(s) During the Past Five Years: Corporate Vice President and |
Trustee Since July 1998 | Chief Global Diversity Officer since 2006, Vice President and Chief Information |
156 Vanguard Funds Overseen | Officer (1997–2005), and Member of the Executive Committee of Johnson & |
| Johnson (pharmaceuticals/consumer products); Director of the University Medical |
| Center at Princeton and Women’s Research and Education Institute. |
|
|
André F. Perold |
|
Born 1952 | Principal Occupation(s) During the Past Five Years: George Gund Professor of Finance |
Trustee Since December 2004 | and Banking, Harvard Business School; Senior Associate Dean and Director of Faculty |
156 Vanguard Funds Overseen | Recruiting, Harvard Business School; Director and Chairman of UNX, Inc. (equities |
| trading firm); Chair of the Investment Committee of HighVista Strategies LLC (private |
| investment firm) since 2005. |
|
|
Alfred M. Rankin, Jr. |
|
Born 1941 | Principal Occupation(s) During the Past Five Years: Chairman, President, Chief Executive |
Trustee Since January 1993 | Officer, and Director of NACCO Industries, Inc. (forklift trucks/housewares/lignite); Director |
156 Vanguard Funds Overseen | of Goodrich Corporation (industrial products/aircraft systems and services). |
|
|
J. Lawrence Wilson |
|
Born 1936 | Principal Occupation(s) During the Past Five Years: Retired Chairman and Chief Executive |
Trustee Since April 1985 | Officer of Rohm and Haas Co. (chemicals); Director of Cummins Inc. (diesel engines) and |
156 Vanguard Funds Overseen | AmerisourceBergen Corp. (pharmaceutical distribution); Trustee of Vanderbilt University |
| and of Culver Educational Foundation. |
|
|
Executive Officers1 |
|
|
|
Thomas J. Higgins |
|
Born 1957 | Principal Occupation(s) During the Past Five Years: Principal of The Vanguard Group, Inc.; |
Chief Financial Officer | Treasurer of each of the investment companies served by The Vanguard Group; Chief |
Since September 2008 | Financial Officer of each of the investment companies served by The Vanguard |
Treasurer Since July 1998 | Group since 2008. |
156 Vanguard Funds Overseen |
|
|
|
F. William McNabb III |
|
Born 1957 | Principal Occupation(s) During the Past Five Years: Chief Executive Officer, Director, |
Chief Executive Officer | and President of The Vanguard Group, Inc., since 2008; Chief Executive Officer and |
Since August 31, 2008 | President of each of the investment companies served by The Vanguard Group since |
President Since March 2008 | 2008; Director of Vanguard Marketing Corporation; Managing Director of The Vanguard |
156 Vanguard Funds Overseen | Group (1995–2008). |
|
|
Heidi Stam |
|
Born 1956 | Principal Occupation(s) During the Past Five Years: Managing Director of The Vanguard |
Secretary Since July 2005 | Group, Inc., since 2006; General Counsel of The Vanguard Group since 2005; Secretary of |
156 Vanguard Funds Overseen | The Vanguard Group and of each of the investment companies served by The Vanguard |
| Group since 2005; Director and Senior Vice President of Vanguard Marketing Corporation |
| since 2005; Principal of The Vanguard Group (1997–2006). |
Vanguard Senior Management Team |
|
| |
|
|
|
|
R. Gregory Barton | Kathleen C. Gubanich | Michael S. Miller | Glenn W. Reed |
Mortimer J. Buckley | Paul A. Heller | Ralph K. Packard | George U. Sauter |
Founder |
|
John C. Bogle |
Chairman and Chief Executive Officer, 1974–1996 |
1 These individuals are “interested persons” as defined in the Investment Company Act of 1940.
2 December 2002 for Vanguard Equity Income Fund, Vanguard Growth Equity Fund, the Vanguard Municipal Bond Funds, and the Vanguard State Tax-Exempt Funds.
More information about the trustees is in the Statement of Additional Information, available from The Vanguard Group.
|
|
| P.O. Box 2600 |
| Valley Forge, PA 19482-2600 |

Connect with Vanguard® > www.vanguard.com
Fund Information > 800-662-7447 | All comparative mutual fund data are from Lipper Inc. |
| or Morningstar, Inc., unless otherwise noted. |
Direct Investor Account Services > 800-662-2739 |
|
|
|
Institutional Investor Services > 800-523-1036 | You can obtain a free copy of Vanguard’s proxy voting |
| guidelines by visiting our website, www.vanguard.com, |
Text Telephone for People | and searching for “proxy voting guidelines,” or by |
With Hearing Impairment > 800-952-3335 | calling Vanguard at 800-662-2739. The guidelines are |
| also available from the SEC’s website, www.sec.gov. |
| In addition, you may obtain a free report on how your |
| fund voted the proxies for securities it owned during |
This material may be used in conjunction | the 12 months ended June 30. To get the report, visit |
with the offering of shares of any Vanguard | either www.vanguard.com or www.sec.gov. |
fund only if preceded or accompanied by |
|
the fund’s current prospectus. |
|
|
|
| You can review and copy information about your fund |
| at the SEC’s Public Reference Room in Washington, D.C. |
The funds or securities referred to herein are not | To find out more about this public service, call the SEC |
sponsored, endorsed, or promoted by MSCI, and MSCI | at 202-551-8090. Information about your fund is also |
bears no liability with respect to any such funds or | available on the SEC’s website, and you can receive |
securities. For any such funds or securities, the | copies of this information, for a fee, by sending a |
prospectus or the Statement of Additional Information | request in either of two ways: via e-mail addressed to |
contains a more detailed description of the limited | publicinfo@sec.gov or via regular mail addressed to the |
relationship MSCI has with The Vanguard Group and | Public Reference Section, Securities and Exchange |
any related funds. | Commission, Washington, DC 20549-0102. |
|
|
|
|
Russell is a trademark of The Frank Russell Company. |
|
|
|
|
|
|
|
|
|
|
|
|
|
| © 2008 The Vanguard Group, Inc. |
| All rights reserved. |
| Vanguard Marketing Corporation, Distributor. |
|
|
| Q3080 112008 |
> | The broad U.S. stock market retreated –21.2% in the fiscal year ended September 30, 2008, as a year-long credit crunch came to a head. International stocks suffered even worse losses. |
> | Helped by strong demand for U.S. Treasury securities, returns from the broad U.S. bond market were positive, providing a small cushion for the Target Retirement Funds. |
> | For the 12 months, the Target Retirement Funds in this report returned –20.4% except for the 2030 fund, which returned –19.4% because of its slightly higher allocation to bonds. |
Contents |
|
|
|
Your Fund’s Total Returns | 1 |
President’s Letter | 2 |
Target Retirement 2030 Fund | 8 |
Target Retirement 2035 Fund | 16 |
Target Retirement 2040 Fund | 25 |
Target Retirement 2045 Fund | 33 |
Target Retirement 2050 Fund | 41 |
Your Fund’s After-Tax Returns | 51 |
About Your Fund’s Expenses | 53 |
Glossary | 55 |
Please note: The opinions expressed in this report are just that—informed opinions. They should not be considered promises or advice. Also, please keep in mind that the information and opinions cover the period through the date on the front of this report. Of course, the risks of investing in your fund are spelled out in the prospectus.
Your Fund’s Total Returns
Fiscal Year Ended September 30, 2008 |
|
|
| Ticker | Total |
| Symbol | Returns |
Vanguard Target Retirement 2030 Fund | VTHRX | –19.4% |
Target 2030 Composite Index1 |
| –19.7 |
Target 2030 Composite Average2 |
| –21.2 |
|
|
|
Vanguard Target Retirement 2035 Fund | VTTHX | –20.4% |
Target 2035 Composite Index1 |
| –20.7 |
Target 2035 Composite Average2 |
| –22.0 |
|
|
|
Vanguard Target Retirement 2040 Fund | VFORX | –20.4% |
Target 2040 Composite Index1 |
| –20.7 |
Target 2040 Composite Average2 |
| –22.0 |
|
|
|
Vanguard Target Retirement 2045 Fund | VTIVX | –20.4% |
Target 2045 Composite Index1 |
| –20.7 |
Target 2045 Composite Average2 |
| –22.0 |
|
|
|
Vanguard Target Retirement 2050 Fund | VFIFX | –20.4% |
Target 2050 Composite Index1 |
| –20.7 |
Target 2050 Composite Average2 |
| –22.0 |
1 Returns for the composite indexes are derived by applying the funds’ target allocations to the results of the following benchmarks: for U.S. stocks, the Morgan Stanley Capital International (MSCI) US Broad Market Index; for international stocks, the MSCI Europe, Australasia, Far East Index and the MSCI Emerging Markets Index; and for bonds, the Lehman U.S. Aggregate Bond Index.
2 Each composite average weights the average returns of the appropriate mutual fund peer groups in proportion with the targeted weighting of the specific Target Retirement Fund. All together, the composites use returns for the average fixed income fund, the average general equity fund, the average international fund, and the average emerging markets fund. These returns are derived from data provided by Lipper Inc.
1

President’s Letter
Dear Shareholder,
For the fiscal year ended September 30, 2008, both domestic and international stocks suffered their worst losses since the bear market that ended in 2002. U.S. bond returns were modestly positive, providing a bit of counterbalance for the Target Retirement Funds.
The five Target Retirement Funds included in this report all posted declines consistent with their respective asset allocations. The four Target Retirement Funds that have allocated 90% of their assets to stocks returned –20.4%, while the 2030 fund, with its slightly lower stock weighting, lost –19.4%.
Credit market turbulence weighed heavily on stock prices
Troubles simmering in the credit markets for much of the past year came to a boil at the end of the fiscal period, producing several high-profile bankruptcies and putting severe pressure on stock prices around the world. The broad U.S. stock market returned –21.2% for the 12 months ended September 30. In September alone, the market fell more than 9%. International stock markets were similarly disappointing, returning –30.0% for the full 12 months.
Policymakers and elected officials, both in the United States and abroad, responded to the upheavals with dramatic new programs designed to help stabilize the credit markets. As participants struggled to make sense of the markets’ fast-changing
2
dynamics, stock prices were exceptionally volatile, with daily ups and downs of 2 percentage points or more becoming commonplace.
U.S. Treasuries rallied in a nervous market
Nervousness in the stock market was echoed, and even amplified, in the bond market. For the 12 months, the broad U.S. bond market returned 3.7%, largely on the strength of Treasuries—investors’ security of choice in times of duress. Corporate bonds generally produced negative returns for the period, coming under heavy selling pressure during investors’ flight to safety. Even the municipal market, made up of generally high-quality securities issued by states and municipalities, recorded a negative 12-month return.
The U.S. Federal Reserve Board responded to the turmoil with a dramatic easing of monetary policy. Over the full 12 months, the Fed reduced its target for the federal funds rate from 4.75% to 2.00%. On October 8, shortly after the close of the fiscal period, the Fed cut rates again, to 1.50%. The move was made in coordination with rate cuts by several other central banks.
The funds’ stock-heavy allocations led to significant losses
Each Target Retirement Fund includes a mix of Vanguard stock and bond funds calibrated according to the fund’s target maturity date. As the targeted retirement year approaches, each fund’s stock-to-bond ratio gradually shifts to a more conservative, income-oriented mix.
Market Barometer |
| ||
| Average Annual Total Returns | ||
| Periods Ended September 30, 2008 | ||
| One Year | Three Years | Five Years |
Stocks |
|
|
|
Russell 1000 Index (Large-caps) | –22.1% | 0.1% | 5.5% |
Russell 2000 Index (Small-caps) | –14.5 | 1.8 | 8.1 |
Dow Jones Wilshire 5000 Index (Entire market) | –21.2 | 0.6 | 6.0 |
MSCI All Country World Index ex USA (International) | –30.0 | 3.1 | 11.8 |
|
|
|
|
Bonds |
|
|
|
Lehman U.S. Aggregate Bond Index (Broad taxable market) | 3.7% | 4.2% | 3.8% |
Lehman Municipal Bond Index | –1.9 | 1.9 | 2.8 |
Citigroup 3-Month Treasury Bill Index | 2.6 | 4.0 | 3.1 |
|
|
|
|
CPI |
|
|
|
Consumer Price Index | 4.9% | 3.2% | 3.4% |
3
Because the Target Retirement Funds in this report are designed for longer time horizons (with targeted dates at least 20 years away), all five funds invest primarily in U.S. and international stocks in seeking to provide long-term growth of capital. However, a stock-heavy mix presents greater short-term risks at times, and this was clearly the case during the just-concluded fiscal year.
As stock markets outside the United States retreated, the worst performers among the underlying Vanguard funds represented in the Target Retirement portfolios were the international funds: Vanguard Emerging Markets Stock Index Fund (–32.7%), European Stock Index Fund
(–30.0%), and Pacific Stock Index Fund (–27.3%). These funds constitute between 17% and 18% of the Target Retirement Funds’ assets. The rest of the Target Retirement Funds’ stock allocation is invested in Vanguard Total Stock Market Index Fund, which tracks the broad U.S. market and returned –21.2%.
On the other hand, modest gains were posted by Vanguard Total Bond Market Index Fund (+3.8%). Although the Target Retirement Funds in this report allocate only a small portion of their assets to bonds, their positive return during the retreat by stocks reflected their classic role as a useful counterweight to the sometimes-volatile stock market.
Asset Allocations on September 30, 2008 | |||
|
|
| Short-Term |
| Stocks1 | Bonds | Investments |
2030 | 86% | 14% | 0% |
2035 | 90 | 10 | 0 |
2040 | 90 | 10 | 0 |
2045 | 90 | 10 | 0 |
2050 | 90 | 10 | 0 |
1 As of September 30, 2008, international stock weightings for the 2030, 2035, 2040, 2045, and 2050 Funds were 17%, 18%, 18%, 18%, and 18% of assets, respectively.
4
The funds’ low expenses provide a cost-efficient investment
To accomplish their mission of providing broadly diversified investments across asset classes in a mix that becomes more conservative over time, the Target Retirement Funds invest primarily in cost-efficient Vanguard index funds that seek to capture the returns of the broad stock and bond markets.
The funds have provided competitive performance since their inceptions, as you can see in the table below. The return of each of the Target Retirement Funds falls within 0.1 percentage point of the performance of its composite benchmark index, which reflects market performance without operating costs subtracted. And each fund’s return is higher than an appropriate composite average based on mutual-fund peer groups.
Over time, the low costs of the Vanguard Target Retirement Funds have provided a distinct advantage. For a look at how the funds’ costs compare with the composite average expenses of peers, please see page 6.
Total Returns |
|
Inception1 Through September 30, 2008 |
|
| Average |
| Annual Return |
Vanguard Target Retirement 2030 Fund | 0.2% |
Target 2030 Composite Index | 0.1 |
Target 2030 Composite Average2 | –1.4 |
Vanguard Target Retirement 2035 Fund | 5.2 |
Target 2035 Composite Index | 5.2 |
Target 2035 Composite Average2 | 4.2 |
Vanguard Target Retirement 2040 Fund | –0.4 |
Target 2040 Composite Index | –0.5 |
Target 2040 Composite Average2 | –1.9 |
Vanguard Target Retirement 2045 Fund | 5.8 |
Target 2045 Composite Index | 5.8 |
Target 2045 Composite Average2 | 4.8 |
Vanguard Target Retirement 2050 Fund | –0.2 |
Target 2050 Composite Index | –0.3 |
Target 2050 Composite Average2 | –1.7 |
The figures shown represent past performance, which is not a guarantee of future results. (Current performance may be lower or higher than the performance data cited. For performance data current to the most recent month-end, visit our website at www.vanguard.com/performance.) Note, too, that both investment returns and principal value can fluctuate widely, so an investor’s shares, when sold, could be worth more or less than their original cost.
1 For the 2035 and 2045 Funds, October 27, 2003; for the 2030, 2040, and 2050 Funds, June 7, 2006.
2 Derived from data provided by Lipper Inc.
5
Still a smart way to help keep your retirement plan on track
There’s no doubt the past year has been unsettling for investors. While we cannot predict what will happen in the markets in the future, experienced investors know we have navigated through stormy times before. Through good times and bad, investors who have been in the market over several decades have experienced the benefits of sticking with a long-term investment program, particularly one that relies on a diversified, carefully constructed mix of stock, bond, and money market investments suited to one’s personal goals, time horizon, and tolerance for risk.
As we’ve seen in the past year, even a highly diversified strategy that combines stocks and bonds doesn’t prevent sharp losses during times of widespread market turmoil. Over time, however, the principles of broad and steady diversification, careful balance, and low costs have served as powerful allies for long-term investors. By investing in a Target Retirement Fund, you have chosen an investment that is designed for your time horizon and is managed to help you meet your needs for a lifetime.
Thank you for your confidence in Vanguard.
Sincerely,

F. William McNabb III
President and Chief Executive Officer
October 15, 2008
Expense Ratios |
|
|
Your Fund Compared With Its Peer Group |
|
|
| Acquired | Peer-Group |
| Fund Fees | Expense |
| and Expenses1 | Ratio2 |
2030 | 0.21% | 1.35% |
2035 | 0.19 | 1.37 |
2040 | 0.21 | 1.37 |
2045 | 0.19 | 1.37 |
2050 | 0.21 | 1.37 |
1 This figure—drawn from the prospectus dated January 25, 2008—represents a weighted average of the annualized expense ratios and any transaction fees charged by the underlying mutual funds (the “acquired” funds) in which the Target Retirement Funds invest. The Target Retirement Funds do not charge any expenses or fees of their own. For the fiscal year ended September 30, 2008, the acquired fund fees and expenses were 0.19% for the 2030 Fund, 0.18% for the 2035 Fund, 0.19% for the 2040 Fund, 0.18% for the 2045 Fund, and 0.19% for the 2050 Fund.
2 Peer groups are (from top to bottom) the Target 2030 Composite Average, the Target 2035 Composite Average, the Target 2040 Composite Average, the Target 2045 Composite Average, and the Target 2050 Composite Average. Each average is a blended composite that weights the return of the average comparable mutual fund for each asset class in proportion to the target weighting of the appropriate Target Retirement Fund. Peer-group expense ratios are derived from data provided by Lipper Inc. and capture information through year-end 2007.
6
Your Fund’s Performance at a Glance | |||||
September 30, 2007–September 30, 2008 | |||||
|
|
|
|
|
|
| Starting | Ending | Distributions Per Share |
| |
| Share | Share | Income | Capital | 30-Day |
| Price | Price | Dividends | Gains | SEC Yield |
2030 | $24.74 | $19.63 | $0.370 | $0.00 | 2.84% |
2035 | 15.25 | 11.90 | 0.290 | 0.00 | 2.72 |
2040 | 24.70 | 19.36 | 0.370 | 0.00 | 2.72 |
2045 | 15.75 | 12.29 | 0.300 | 0.00 | 2.72 |
2050 | 24.79 | 19.43 | 0.370 | 0.00 | 2.72 |
7
Target Retirement 2030 Fund
Fund Profile
As of September 30, 2008
Financial Attributes |
|
|
|
Yield1 | 2.8% |
Acquired Fund Fees and Expenses (9/30/2007)2 | 0.21% |
Allocation to Underlying Vanguard Funds |
|
|
|
Total Stock Market Index Fund | 68.5% |
Total Bond Market Index Fund | 14.5 |
European Stock Index Fund | 9.2 |
Pacific Stock Index Fund | 4.2 |
Emerging Markets Stock Index Fund | 3.6 |
Fund Asset Allocation
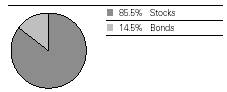
Equity Investment Focus
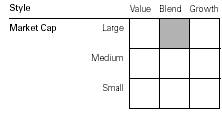
Fixed Income Investment Focus
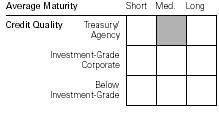
1 30-day SEC yield for the fund. See the Glossary.
2 This figure—drawn from the prospectus dated January 25, 2008—represents a weighted average of the annualized expense ratios and any transaction fees charged by the underlying mutual funds (the “acquired” funds) in which the Target Retirement Funds invest. The 2030 Fund does not charge any expenses or fees of its own. For the fiscal year ended September 30, 2008, the acquired fund fees and expenses figure was 0.19%.
8
Target Retirement 2030 Fund
Performance Summary
All of the returns in this report represent past performance, which is not a guarantee of future results that may be achieved by the fund. (Current performance may be lower or higher than the performance data cited. For performance data current to the most recent month-end, visit our website at www.vanguard.com/performance.) Note, too, that both investment returns and principal value can fluctuate widely, so an investor’s shares, when sold, could be worth more or less than their original cost. The returns shown do not reflect taxes that a shareholder would pay on fund distributions or on the sale of fund shares.
Cumulative Performance: June 7, 2006–September 30, 2008
Initial Investment of $10,000
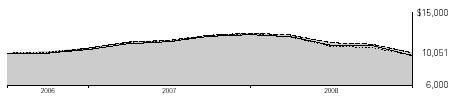
| Average Annual Total Returns | Final Value | |
| Periods Ended September 30, 2008 | of a $10,000 | |
| One Year | Since Inception1 | Investment |
Vanguard Target Retirement 2030 Fund2 | –19.43% | 0.22% | $10,051 |
Dow Jones Wilshire 5000 Index | –21.20 | –1.03 | 9,762 |
Target 2030 Composite Index3 | –19.66 | 0.15 | 10,034 |
Target 2030 Composite Average4 | –21.18 | –1.35 | 9,690 |
Fiscal-Year Total Returns (%): June 7, 2006–September 30, 2008 | ||||
|
|
|
| Target 2030 |
Fiscal | Capital | Income | Total | Composite |
Year | Return | Return | Return | Index3 |
2006 | 6.3% | 0.0% | 6.3% | 6.3% |
2007 | 16.4 | 1.0 | 17.4 | 17.5 |
2008 | –20.6 | 1.2 | –19.4 | –19.7 |
1 Performance for the fund and its comparative standards is calculated since the fund’s inception: June 7, 2006.
2 Total returns do not include the account service fee that may be applicable to certain accounts with balances below $10,000.
3 Target 2030 Composite Index: Derived by applying the fund’s target asset allocation to the results of the following benchmarks: for international stocks of developed markets, the MSCI EAFE Index; for emerging markets stocks, the Select Emerging Markets Index from inception through August 23, 2006, and the MSCI Emerging Markets Index thereafter; for bonds, the Lehman U.S. Aggregate Bond Index; and for U.S. stocks, the MSCI US Broad Market Index. MSCI EAFE Index returns are adjusted for withholding taxes applicable to Luxembourg holding companies.
4 Target 2030 Composite Average: Derived by applying the fund’s target allocation to the following peer-group averages: the average general equity fund, average fixed income fund, average international fund, and average emerging markets fund. Derived from data provided by Lipper Inc.
Note: See Financial Highlights table for dividend and capital gains information.
9
Target Retirement 2030 Fund
Financial Statements
Statement of Net Assets
As of September 30, 2008
The fund provides a complete list of its holdings four times in each fiscal year, at the quarter-ends. For the second and fourth fiscal quarters, the lists appear in the fund’s semiannual and annual reports to shareholders. For the first and third fiscal quarters, the fund files the lists with the Securities and Exchange Commission on Form N-Q. Shareholders can look up the fund’s Forms N-Q on the SEC’s website at www.sec.gov. Forms N-Q may also be reviewed and copied at the SEC’s Public Reference Room (see the back cover of this report for further information).
|
| Market |
|
| Value• |
| Shares | ($000) |
Investment Companies (99.9%) |
|
|
U.S. Stock Fund (68.4%) |
|
|
Vanguard Total Stock Market Index Fund Investor Shares | 56,793,443 | 1,614,070 |
|
|
|
International Stock Funds (17.0%) |
|
|
Vanguard European Stock Index Fund Investor Shares | 7,727,601 | 217,223 |
Vanguard Pacific Stock Index Fund Investor Shares | 10,098,035 | 98,254 |
Vanguard Emerging Markets Stock Index Fund Investor Shares | 3,925,015 | 84,976 |
|
|
|
Bond Fund (14.5%) |
|
|
Vanguard Total Bond Market Index Fund Investor Shares | 34,670,231 | 342,195 |
|
|
|
Money Market Fund (0.0%) |
|
|
1 Vanguard Market Liquidity Fund, 2.296% | 381,608 | 382 |
Total Investment Companies (Cost $2,776,304) |
| 2,357,100 |
Other Assets and Liabilities (0.1%) |
|
|
Other Assets |
| 14,289 |
Liabilities |
| (12,344) |
|
| 1,945 |
Net Assets (100%) |
|
|
Applicable to 120,178,564 outstanding $.001 par value shares of |
|
|
beneficial interest (unlimited authorization) |
| 2,359,045 |
Net Asset Value Per Share |
| $19.63 |
At September 30, 2008, net assets consisted of: |
|
| Amount |
| ($000) |
Paid-in Capital | 2,752,232 |
Undistributed Net Investment Income | 30,330 |
Accumulated Net Realized Losses | (4,313) |
Unrealized Appreciation (Depreciation) | (419,204) |
Net Assets | 2,359,045 |
• | See Note A in Notes to Financial Statements. |
1 Affiliated money market fund available only to Vanguard funds and certain trusts and accounts managed by Vanguard. Rate shown is the 7-day yield.
See accompanying Notes, which are an integral part of the Financial Statements.
10
Target Retirement 2030 Fund
Statement of Operations
| Year Ended |
| September 30, 2008 |
| ($000) |
Investment Income |
|
Income |
|
Income Distributions Received | 43,703 |
Net Investment Income—Note B | 43,703 |
Realized Net Gain (Loss) |
|
Capital Gain Distributions Received | — |
Investment Securities Sold | (4,329) |
Realized Net Gain (Loss) | (4,329) |
Change in Unrealized Appreciation (Depreciation) of Investment Securities | (480,336) |
Net Increase (Decrease) in Net Assets Resulting from Operations | (440,962) |
See accompanying Notes, which are an integral part of the Financial Statements.
11
Target Retirement 2030 Fund
Statement of Changes in Net Assets
| Year Ended September 30, | |
| 2008 | 2007 |
| ($000) | ($000) |
Increase (Decrease) in Net Assets |
|
|
Operations |
|
|
Net Investment Income | 43,703 | 11,196 |
Realized Net Gain (Loss) | (4,329) | 20 |
Change in Unrealized Appreciation (Depreciation) | (480,336) | 59,689 |
Net Increase (Decrease) in Net Assets Resulting from Operations | (440,962) | 70,905 |
Distributions |
|
|
Net Investment Income | (22,914) | (1,844) |
Realized Capital Gain | — | — |
Total Distributions | (22,914) | (1,844) |
Capital Share Transactions |
|
|
Issued | 1,955,546 | 1,037,335 |
Issued in Lieu of Cash Distributions | 22,869 | 1,842 |
Redeemed | (258,051) | (74,341) |
Net Increase (Decrease) from Capital Share Transactions | 1,720,364 | 964,836 |
Total Increase (Decrease) | 1,256,488 | 1,033,897 |
Net Assets |
|
|
Beginning of Period | 1,102,557 | 68,660 |
End of Period1 | 2,359,045 | 1,102,557 |
1 Net Assets—End of Period includes undistributed net investment income of $30,330,000 and $9,541,000.
See accompanying Notes, which are an integral part of the Financial Statements.
12
Target Retirement 2030 Fund
Financial Highlights
|
|
| June 7, |
| Year Ended | 20061 to | |
| September 30, | Sept. 30, | |
For a Share Outstanding Throughout Each Period | 2008 | 2007 | 2006 |
Net Asset Value, Beginning of Period | $24.74 | $21.25 | $20.00 |
Investment Operations |
|
|
|
Net Investment Income | .5222 | .4902 | .1702 |
Capital Gain Distributions Received | — | — | — |
Net Realized and Unrealized Gain (Loss) on Investments | (5.262) | 3.190 | 1.080 |
Total from Investment Operations | (4.740) | 3.680 | 1.250 |
Distributions |
|
|
|
Dividends from Net Investment Income | (.370) | (.190) | — |
Distributions from Realized Capital Gains | — | — | — |
Total Distributions | (.370) | (.190) | — |
Net Asset Value, End of Period | $19.63 | $24.74 | $21.25 |
|
|
|
|
Total Return3 | –19.43% | 17.40% | 6.25% |
|
|
|
|
Ratios/Supplemental Data |
|
|
|
Net Assets, End of Period (Millions) | $2,359 | $1,103 | $69 |
Ratio of Total Expenses to Average Net Assets | 0%4 | 0% | 0% |
Ratio of Net Investment Income to Average Net Assets | 2.35% | 2.10% | 1.81%5 |
Portfolio Turnover Rate | 6% | 4% | 13% |
1 Inception.
2 Calculated based on average shares outstanding.
3 Total returns do not include the account service fee that may be applicable to certain accounts with balances below $10,000.
4 The acquired fund fees and expenses were 0.19%.
5 Annualized.
See accompanying Notes, which are an integral part of the Financial Statements.
13
Target Retirement 2030 Fund
Notes to Financial Statements
Vanguard Target Retirement 2030 Fund is registered under the Investment Company Act of 1940 as an open-end investment company, or mutual fund. The fund follows a balanced investment strategy by investing in selected Vanguard funds to achieve its targeted allocation of assets to U.S. stocks, international stocks, and bonds.
A. The following significant accounting policies conform to generally accepted accounting principles for U.S. mutual funds. The fund consistently follows such policies in preparing its financial statements.
1. Security Valuation: Investments are valued at the net asset value of each underlying Vanguard fund determined as of the close of the New York Stock Exchange (generally 4 p.m., Eastern time) on the valuation date.
2. Federal Income Taxes: The fund intends to continue to qualify as a regulated investment company and distribute all of its taxable income. Management has analyzed the fund’s tax positions taken on federal income tax returns for all open tax years (tax years ended September 30, 2006–2008), and has concluded that no provision for federal income tax is required in the fund’s financial statements.
3. Distributions: Distributions to shareholders are recorded on the ex-dividend date.
4. Other: Income and capital gain distributions received are recorded on the ex-dividend date. Security transactions are accounted for on the date securities are bought or sold. Costs used to determine realized gains (losses) on the sale of investment securities are those of the specific securities sold.
B. Under a service agreement, The Vanguard Group furnishes investment advisory, corporate management, administrative, marketing, and distribution services to the fund. The service agreement provides that the fund’s expenses may be reduced or eliminated to the extent of savings realized by the Vanguard funds by the operation of the fund. Accordingly, all incremental expenses for services provided by Vanguard and all other expenses incurred by the fund during the year ended September 30, 2008, were borne by the funds in which the fund invests. The fund’s trustees and officers are also directors and officers of Vanguard and the funds in which the fund invests.
C. Distributions are determined on a tax basis and may differ from net investment income and realized capital gains for financial reporting purposes. Differences may be permanent or temporary. Permanent differences are reclassified among capital accounts in the financial statements to reflect their tax character. Temporary differences arise when certain items of income, expense, gain, or loss are recognized in different periods for financial statement and tax purposes; these differences will reverse at some time in the future. Differences in classification may also result from the treatment of short-term gains as ordinary income for tax purposes.
For tax purposes, at September 30, 2008, the fund had $30,347,000 of ordinary income available for distribution. The fund had available realized losses of $125,000 to offset future net capital gains through September 30, 2017.
At September 30, 2008, the cost of investment securities for tax purposes was $2,780,509,000. Net unrealized depreciation of investment securities for tax purposes was $423,409,000, consisting entirely of unrealized losses on securities that had fallen in value since their purchase.
D. During the year ended September 30, 2008, the fund purchased $1,845,112,000 of investment securities and sold $104,827,000 of investment securities, other than temporary cash investments.
14
Target Retirement 2030 Fund
E. Capital shares issued and redeemed were:
| Year Ended September 30, | |
| 2008 | 2007 |
| Shares | Shares |
| (000) | (000) |
Issued | 86,285 | 44,391 |
Issued in Lieu of Cash Distributions | 956 | 81 |
Redeemed | (11,624) | (3,142) |
Net Increase (Decrease) in Shares Outstanding | 75,617 | 41,330 |
F. In September 2006, the Financial Accounting Standards Board issued Statement of Financial Accounting Standards No. 157 (“FAS 157”), “Fair Value Measurements.” FAS 157 establishes a framework for measuring fair value and expands disclosures about fair value measurements in financial statements.
The various inputs that may be used to determine the value of the fund’s investments are summarized in three broad levels. The inputs or methodologies used for valuing securities are not necessarily an indication of the risk associated with investing in those securities.
Level 1—Quoted prices in active markets for identical securities.
Level 2—Other significant observable inputs (including quoted prices for similar securities, interest rates, prepayment speeds, credit risk, etc.).
Level 3—Significant unobservable inputs (including the fund’s own assumptions used to determine the fair value of investments).
At September 30, 2008, 100% of the fund’s investments were valued based on Level 1 inputs.
15
Target Retirement 2035 Fund
Fund Profile
As of September 30, 2008
Financial Attributes |
|
|
|
Yield1 | 2.7% |
Acquired Fund Fees and Expenses (9/30/2007)2 | 0.19% |
Volatility Measures3 |
|
| Fund Versus |
| Composite Index4 |
R-Squared | 1.00 |
Beta | 0.99 |
Allocation to Underlying Vanguard Funds |
|
|
|
Total Stock Market Index Fund | 72.2% |
Total Bond Market Index Fund | 10.0 |
European Stock Index Fund | 9.6 |
Pacific Stock Index Fund | 4.5 |
Emerging Markets Stock Index Fund | 3.7 |
Fund Asset Allocation
Equity Investment Focus

Fixed Income Investment Focus

1 30-day SEC yield for the fund. See the Glossary.
2 This figure—drawn from the prospectus dated January 25, 2008—represents a weighted average of the annualized expense ratios and any transaction fees charged by the underlying mutual funds (the “acquired” funds) in which the Target Retirement Funds invest. The 2035 Fund does not charge any expenses or fees of its own. For the fiscal year ended September 30, 2008, the acquired fund fees and expenses figure was 0.18%.
3 For an explanation of R-squared, beta, and other terms used here, see the Glossary for a definition.
4 Target 2035 Composite Index: Derived by applying the fund’s target asset allocation to the results of the following benchmarks: for international stocks of developed markets, the MSCI EAFE Index; for emerging markets stocks, the Select Emerging Markets Index from inception through August 23, 2006, and the MSCI Emerging Markets Index thereafter; for bonds, the Lehman U.S. Aggregate Bond Index; and for U.S. stocks, the Dow Jones Wilshire 5000 Index from inception through April 22, 2005, and the MSCI US Broad Market Index thereafter. MSCI EAFE Index returns are adjusted for withholding taxes applicable to Luxembourg holding companies.
16
Target Retirement 2035 Fund
Performance Summary
All of the returns in this report represent past performance, which is not a guarantee of future results that may be achieved by the fund. (Current performance may be lower or higher than the performance data cited. For performance data current to the most recent month-end, visit our website at www.vanguard.com/performance.) Note, too, that both investment returns and principal value can fluctuate widely, so an investor’s shares, when sold, could be worth more or less than their original cost. The returns shown do not reflect taxes that a shareholder would pay on fund distributions or on the sale of fund shares.
Cumulative Performance: October 27, 2003–September 30, 2008
Initial Investment of $10,000
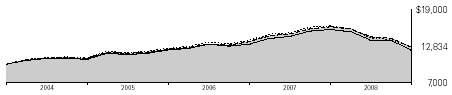
| Average Annual Total Returns | Final Value | |
| Periods Ended September 30, 2008 | of a $10,000 | |
| One Year | Since Inception1 | Investment |
Vanguard Target Retirement 2035 Fund2 | –20.42 | 5.20% | $12,834 |
Dow Jones Wilshire 5000 Index | –21.20 | 5.29 | 12,893 |
Target 2035 Composite Index3 | –20.73 | 5.21 | 12,845 |
Target 2035 Composite Average4 | –22.04 | 4.25 | 12,275 |
Fiscal-Year Total Returns (%): October 27, 2003–September 30, 2008 | ||||
|
|
|
| Target 2035 |
Fiscal | Capital | Income | Total | Composite |
Year | Return | Return | Return | Index3 |
2004 | 9.2% | 0.7% | 9.9% | 10.0% |
2005 | 11.9 | 1.6 | 13.5 | 13.6 |
2006 | 7.9 | 1.8 | 9.7 | 9.9 |
2007 | 15.7 | 2.2 | 17.9 | 18.0 |
2008 | –22.0 | 1.6 | –20.4 | –20.7 |
1 Performance for the fund and its comparative standards is calculated since the fund’s inception: October 27, 2003.
2 Total returns do not include the account service fee that may be applicable to certain accounts with balances below $10,000.
3 Target 2035 Composite Index: Derived by applying the fund’s target asset allocation to the results of the following benchmarks: for international stocks of developed markets, the MSCI EAFE Index; for emerging markets stocks, the Select Emerging Markets Index from inception through August 23, 2006, and the MSCI Emerging Markets Index thereafter; for bonds, the Lehman U.S. Aggregate Bond Index; and for U.S. stocks, the Dow Jones Wilshire 5000 Index from inception through April 22, 2005, and the MSCI US Broad Market Index thereafter. MSCI EAFE Index returns are adjusted for withholding taxes applicable to Luxembourg holding companies.
4 Target 2035 Composite Average: Derived by applying the fund’s target allocation to the following peer-group averages: the average general equity fund, average international fund, average fixed income fund, and average emerging markets fund. Derived from data provided by Lipper Inc.
Note: See Financial Highlights table for dividend and capital gains information.
17
Target Retirement 2035 Fund
Financial Statements
Statement of Net Assets
As of September 30, 2008
The fund provides a complete list of its holdings four times in each fiscal year, at the quarter-ends. For the second and fourth fiscal quarters, the lists appear in the fund’s semiannual and annual reports to shareholders. For the first and third fiscal quarters, the fund files the lists with the Securities and Exchange Commission on Form N-Q. Shareholders can look up the fund’s Forms N-Q on the SEC’s website at www.sec.gov. Forms N-Q may also be reviewed and copied at the SEC’s Public Reference Room (see the back cover of this report for further information).
|
| Market |
|
| Value• |
| Shares | ($000) |
Investment Companies (99.9%) |
|
|
U.S. Stock Funds (72.1%) |
|
|
Vanguard Total Stock Market Index Fund Investor Shares | 126,492,584 | 3,594,919 |
Vanguard Total Stock Market ETF | 519,038 | 30,743 |
|
|
|
International Stock Funds (17.8%) |
|
|
Vanguard European Stock Index Fund Investor Shares | 17,171,393 | 482,688 |
Vanguard Pacific Stock Index Fund Investor Shares | 23,182,050 | 225,561 |
Vanguard Emerging Markets Stock Index Fund Investor Shares | 8,681,699 | 187,959 |
|
|
|
Bond Fund (10.0%) |
|
|
Vanguard Total Bond Market Index Fund Investor Shares | 51,142,502 | 504,777 |
|
|
|
Money Market Fund (0.0%) |
|
|
1 Vanguard Market Liquidity Fund, 2.296% | 401,358 | 401 |
Total Investment Companies (Cost $5,614,717) |
| 5,027,048 |
Other Assets and Liabilities (0.1%) |
|
|
Other Assets |
| 22,390 |
Liabilities |
| (19,661) |
|
| 2,729 |
Net Assets (100%) |
|
|
Applicable to 422,572,261 outstanding $.001 par value shares of |
|
|
beneficial interest (unlimited authorization) |
| 5,029,777 |
Net Asset Value Per Share |
| $11.90 |
18
Target Retirement 2035 Fund
At September 30, 2008, net assets consisted of: |
|
| Amount |
| ($000) |
Paid-in Capital | 5,568,083 |
Undistributed Net Investment Income | 68,951 |
Accumulated Net Realized Losses | (19,588) |
Unrealized Appreciation (Depreciation) | (587,669) |
Net Assets | 5,029,777 |
• | See Note A in Notes to Financial Statements. |
1 Affiliated money market fund available only to Vanguard funds and certain trusts and accounts managed by Vanguard. Rate shown is the 7-day yield.
See accompanying Notes, which are an integral part of the Financial Statements.
19
Target Retirement 2035 Fund
Statement of Operations
| Year Ended |
| September 30, 2008 |
| ($000) |
Investment Income |
|
Income |
|
Income Distributions Received | 114,085 |
Net Investment Income—Note B | 114,085 |
Realized Net Gain (Loss) |
|
Capital Gain Distributions Received | — |
Investment Securities Sold | (9,743) |
Realized Net Gain (Loss) | (9,743) |
Change in Unrealized Appreciation (Depreciation) of Investment Securities | (1,262,430) |
Net Increase (Decrease) in Net Assets Resulting from Operations | (1,158,088) |
See accompanying Notes, which are an integral part of the Financial Statements.
20
Target Retirement 2035 Fund
Statement of Changes in Net Assets
| Year Ended September 30, | |
| 2008 | 2007 |
| ($000) | ($000) |
Increase (Decrease) in Net Assets |
|
|
Operations |
|
|
Net Investment Income | 114,085 | 74,617 |
Realized Net Gain (Loss) | (9,743) | 460 |
Change in Unrealized Appreciation (Depreciation) | (1,262,430) | 480,868 |
Net Increase (Decrease) in Net Assets Resulting from Operations | (1,158,088) | 555,945 |
Distributions |
|
|
Net Investment Income | (93,585) | (55,711) |
Realized Capital Gain | — | — |
Total Distributions | (93,585) | (55,711) |
Capital Share Transactions |
|
|
Issued | 2,228,973 | 1,808,436 |
Issued in Lieu of Cash Distributions | 93,310 | 55,512 |
Redeemed | (594,084) | (373,254) |
Net Increase (Decrease) from Capital Share Transactions | 1,728,199 | 1,490,694 |
Total Increase (Decrease) | 476,526 | 1,990,928 |
Net Assets |
|
|
Beginning of Period | 4,553,251 | 2,562,323 |
End of Period1 | 5,029,777 | 4,553,251 |
1 Net Assets—End of Period includes undistributed net investment income of $68,951,000 and $48,451,000.
See accompanying Notes, which are an integral part of the Financial Statements.
21
Target Retirement 2035 Fund
Financial Highlights
|
|
|
|
| Sept. 1, | Oct. 27, |
|
|
|
|
| 2004, to | 20032 to |
For a Share Outstanding | Year Ended September 30, | Sept. 30, | Aug. 31, | |||
Throughout Each Period | 2008 | 2007 | 2006 | 2005 | 20041 | 2004 |
Net Asset Value, Beginning of Period | $15.25 | $13.18 | $12.22 | $10.92 | $10.76 | $10.00 |
Investment Operations |
|
|
|
|
|
|
Net Investment Income | .293 | .270 | .2803 | .2703 | .030 | .115 |
Capital Gain Distributions Received | — | — | — | — | — | — |
Net Realized and Unrealized Gain (Loss) |
|
|
|
|
|
|
on Investments | (3.353) | 2.060 | .890 | 1.200 | .130 | .710 |
Total from Investment Operations | (3.060) | 2.330 | 1.170 | 1.470 | .160 | .825 |
Distributions |
|
|
|
|
|
|
Dividends from Net Investment Income | (.290) | (.260) | (.210) | (.170) | — | (.065) |
Distributions from Realized Capital Gains | — | — | — | — | — | — |
Total Distributions | (.290) | (.260) | (.210) | (.170) | — | (.065) |
Net Asset Value, End of Period | $11.90 | $15.25 | $13.18 | $12.22 | $10.92 | $10.76 |
|
|
|
|
|
|
|
Total Return4 | –20.42% | 17.87% | 9.70% | 13.53% | 1.49% | 8.27% |
|
|
|
|
|
|
|
Ratios/Supplemental Data |
|
|
|
|
|
|
Net Assets, End of Period (Millions) | $5,030 | $4,553 | $2,562 | $1,092 | $236 | $211 |
Ratio of Total Expenses to |
|
|
|
|
|
|
Average Net Assets | 0%5 | 0% | 0% | 0% | 0% | 0% |
Ratio of Net Investment Income to |
|
|
|
|
|
|
Average Net Assets | 2.28% | 2.09% | 2.21% | 2.33% | 1.97%6 | 1.70%6 |
Portfolio Turnover Rate | 10% | 1% | 14% | 0% | 0% | 2% |
1 The fund’s fiscal year-end changed from August 31 to September 30, effective September 30, 2004.
2 Inception.
3 Calculated based on average shares outstanding.
4 Total returns do not include the account service fee that may be applicable to certain accounts with balances below $10,000.
5 The acquired fund fees and expenses were 0.18%.
6 Annualized.
See accompanying Notes, which are an integral part of the Financial Statements.
22
Target Retirement 2035 Fund
Notes to Financial Statements
Vanguard Target Retirement 2035 Fund is registered under the Investment Company Act of 1940 as an open-end investment company, or mutual fund. The fund follows a balanced investment strategy by investing in selected Vanguard funds to achieve its targeted allocation of assets to U.S. stocks, international stocks, and bonds.
A. The following significant accounting policies conform to generally accepted accounting principles for U.S. mutual funds. The fund consistently follows such policies in preparing its financial statements.
1. Security Valuation: Securities are valued as of the close of trading on the New York Stock Exchange (generally 4 p.m., Eastern time) on the valuation date. Investments in other Vanguard funds (with the exception of ETF Shares) are valued at that fund’s net asset value. ETFs are valued at the latest quoted sales prices or official closing prices taken from their primary market or, if not traded on the valuation date, at the mean of the latest quoted bid and asked prices.
2. Federal Income Taxes: The fund intends to continue to qualify as a regulated investment company and distribute all of its taxable income. Management has analyzed the fund’s tax positions taken on federal income tax returns for all open tax years (tax years ended September 30, 2005–2008), and has concluded that no provision for federal income tax is required in the fund’s financial statements.
3. Distributions: Distributions to shareholders are recorded on the ex-dividend date.
4. Other: Income and capital gain distributions received are recorded on the ex-dividend date. Security transactions are accounted for on the date securities are bought or sold. Costs used to determine realized gains (losses) on the sale of investment securities are those of the specific securities sold.
B. Under a service agreement, The Vanguard Group furnishes investment advisory, corporate management, administrative, marketing, and distribution services to the fund. The service agreement provides that the fund’s expenses may be reduced or eliminated to the extent of savings realized by the Vanguard funds by the operation of the fund. Accordingly, all incremental expenses for services provided by Vanguard and all other expenses incurred by the fund during the year ended September 30, 2008, were borne by the funds in which the fund invests. The fund’s trustees and officers are also directors and officers of Vanguard and the funds in which the fund invests.
C. Distributions are determined on a tax basis and may differ from net investment income and realized capital gains for financial reporting purposes. Differences may be permanent or temporary. Permanent differences are reclassified among capital accounts in the financial statements to reflect their tax character. Temporary differences arise when certain items of income, expense, gain, or loss are recognized in different periods for financial statement and tax purposes; these differences will reverse at some time in the future. Differences in classification may also result from the treatment of short-term gains as ordinary income for tax purposes.
For tax purposes, at September 30, 2008, the fund had $69,071,000 of ordinary income available for distribution. The fund had available realized losses of $11,986,000 to offset future net capital gains of $9,886,000 through September 30, 2015 and $2,100,000 through September 30, 2017.
At September 30, 2008, the cost of investment securities for tax purposes was $5,622,439,000. Net unrealized depreciation of investment securities for tax purposes was $595,391,000, consisting of unrealized gains of $1,176,000 on securities that had risen in value since their purchase and $596,567,000 in unrealized losses on securities that had fallen in value since their purchase.
23
Target Retirement 2035 Fund
D. During the year ended September 30, 2008, the fund purchased $2,250,063,000 of investment securities and sold $492,004,000 of investment securities, other than temporary cash investments.
E. Capital shares issued and redeemed were:
| Year Ended September 30, | |
| 2008 | 2007 |
| Shares | Shares |
| (000) | (000) |
Issued | 161,252 | 125,990 |
Issued in Lieu of Cash Distributions | 6,365 | 3,985 |
Redeemed | (43,526) | (25,894) |
Net Increase (Decrease) in Shares Outstanding | 124,091 | 104,081 |
F. In September 2006, the Financial Accounting Standards Board issued Statement of Financial Accounting Standards No. 157 (“FAS 157”), “Fair Value Measurements.” FAS 157 establishes a framework for measuring fair value and expands disclosures about fair value measurements in financial statements.
The various inputs that may be used to determine the value of the fund’s investments are summarized in three broad levels. The inputs or methodologies used for valuing securities are not necessarily an indication of the risk associated with investing in those securities.
Level 1—Quoted prices in active markets for identical securities.
Level 2—Other significant observable inputs (including quoted prices for similar securities, interest rates, prepayment speeds, credit risk, etc.).
Level 3—Significant unobservable inputs (including the fund’s own assumptions used to determine the fair value of investments).
At September 30, 2008, 100% of the fund’s investments were valued based on Level 1 inputs.
24
Target Retirement 2040 Fund
Fund Profile
As of September 30, 2008
Financial Attributes |
|
|
|
Yield1 | 2.7% |
Acquired Fund Fees and Expenses (9/30/2007)2 | 0.21% |
Allocation to Underlying Vanguard Funds |
|
|
|
Total Stock Market Index Fund | 72.1% |
Total Bond Market Index Fund | 10.1 |
European Stock Index Fund | 9.7 |
Pacific Stock Index Fund | 4.4 |
Emerging Markets Stock Index Fund | 3.7 |
Fund Asset Allocation
Equity Investment Focus
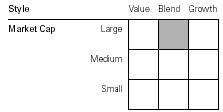
Fixed Income Investment Focus
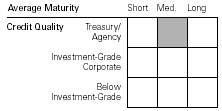
1 30-day SEC yield for the fund. See the Glossary.
2 This figure—drawn from the prospectus dated January 25, 2008—represents a weighted average of the annualized expense ratios and any transaction fees charged by the underlying mutual funds (the “acquired” funds) in which the Target Retirement Funds invest. The 2040 Fund does not charge any expenses or fees of its own. For the fiscal year ended September 30, 2008, the acquired fund fees and expenses figure was 0.19%.
25
Target Retirement 2040 Fund
Performance Summary
All of the returns in this report represent past performance, which is not a guarantee of future results that may be achieved by the fund. (Current performance may be lower or higher than the performance data cited. For performance data current to the most recent month-end, visit our website at www.vanguard.com/performance.) Note, too, that both investment returns and principal value can fluctuate widely, so an investor’s shares, when sold, could be worth more or less than their original cost. The returns shown do not reflect taxes that a shareholder would pay on fund distributions or on the sale of fund shares.
Cumulative Performance: June 7, 2006–September 30, 2008
Initial Investment of $10,000
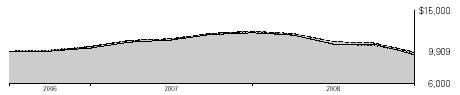
| Average Annual Total Returns | Final Value | |
| Periods Ended September 30, 2008 | of a $10,000 | |
| One Year | Since Inception1 | Investment |
Vanguard Target Retirement 2040 Fund2 | –20.40% | –0.40% | $9,909 |
Dow Jones Wilshire 5000 Index | –21.20 | –1.03 | 9,762 |
Target 2040 Composite Index3 | –20.73 | –0.50 | 9,885 |
Target 2040 Composite Average4 | –22.04 | –1.88 | 9,570 |
Fiscal-Year Total Returns (%): June 7, 2006–September 30, 2008 | ||||
|
|
|
| Target 2040 |
Fiscal | Capital | Income | Total | Composite |
Year | Return | Return | Return | Index3 |
2006 | 5.7% | 0.0% | 5.7% | 5.7% |
2007 | 16.9 | 0.9 | 17.8 | 18.0 |
2008 | –21.6 | 1.2 | –20.4 | –20.7 |
1 Performance for the fund and its comparative standards is calculated since the fund’s inception: June 7, 2006.
2 Total returns do not include the account service fee that may be applicable to certain accounts with balances below $10,000.
3 Target 2040 Composite Index: Derived by applying the fund’s target asset allocation to the results of the following benchmarks: for international stocks of developed markets, the MSCI EAFE Index; for emerging markets stocks, the Select Emerging Markets Index from inception through August 23, 2006, and the MSCI Emerging Markets Index thereafter; for bonds, the Lehman U.S. Aggregate Bond Index; and for U.S. stocks, the MSCI US Broad Market Index. MSCI EAFE Index returns are adjusted for withholding taxes applicable to Luxembourg holding companies.
4 Target 2040 Composite Average: Derived by applying the fund’s target allocation to the following peer-group averages: the average general equity fund, average international fund, average fixed income fund, and average emerging markets fund. Derived from data provided by Lipper Inc.
Note: See Financial Highlights table for dividend and capital gains information.
26
Target Retirement 2040 Fund
Financial Statements
Statement of Net Assets
As of September 30, 2008
The fund provides a complete list of its holdings four times in each fiscal year, at the quarter-ends. For the second and fourth fiscal quarters, the lists appear in the fund’s semiannual and annual reports to shareholders. For the first and third fiscal quarters, the fund files the lists with the Securities and Exchange Commission on Form N-Q. Shareholders can look up the fund’s Forms N-Q on the SEC’s website at www.sec.gov. Forms N-Q may also be reviewed and copied at the SEC’s Public Reference Room (see the back cover of this report for further information).
|
| Market |
|
| Value• |
| Shares | ($000) |
Investment Companies (99.8%) |
|
|
U.S. Stock Fund (71.9%) |
|
|
Vanguard Total Stock Market Index Fund Investor Shares | 30,349,988 | 862,547 |
|
|
|
International Stock Funds (17.8%) |
|
|
Vanguard European Stock Index Fund Investor Shares | 4,146,840 | 116,568 |
Vanguard Pacific Stock Index Fund Investor Shares | 5,377,694 | 52,325 |
Vanguard Emerging Markets Stock Index Fund Investor Shares | 2,023,607 | 43,811 |
|
|
|
Bond Fund (10.1%) |
|
|
Vanguard Total Bond Market Index Fund Investor Shares | 12,258,177 | 120,988 |
|
|
|
Money Market Fund (0.0%) |
|
|
1 Vanguard Market Liquidity Fund | 374,002 | 374 |
Total Investment Companies (Cost $1,413,750) |
| 1,196,613 |
Other Assets and Liabilities (0.2%) |
|
|
Other Assets |
| 8,051 |
Liabilities |
| (5,580) |
|
| 2,471 |
Net Assets (100%) |
|
|
Applicable to 61,941,130 outstanding $.001 par value shares of |
|
|
beneficial interest (unlimited authorization) |
| 1,199,084 |
Net Asset Value Per Share |
| $19.36 |
At September 30, 2008, net assets consisted of: |
|
| Amount |
| ($000) |
Paid-in Capital | 1,406,706 |
Undistributed Net Investment Income | 13,895 |
Accumulated Net Realized Losses | (4,380) |
Unrealized Appreciation (Depreciation) | (217,137) |
Net Assets | 1,199,084 |
• | See Note A in Notes to Financial Statements. |
1 Affiliated money market fund available only to Vanguard funds and certain trusts and accounts managed by Vanguard. Rate shown is the 7-day yield.
See accompanying Notes, which are an integral part of the Financial Statements.
27
Target Retirement 2040 Fund
Statement of Operations
| Year Ended |
| September 30, 2008 |
| ($000) |
Investment Income |
|
Income |
|
Income Distributions Received | 20,451 |
Net Investment Income—Note B | 20,451 |
Realized Net Gain (Loss) |
|
Capital Gain Distributions Received | — |
Investment Securities Sold | (4,367) |
Realized Net Gain (Loss) | (4,367) |
Change in Unrealized Appreciation (Depreciation) of Investment Securities | (245,843) |
Net Increase (Decrease) in Net Assets Resulting from Operations | (229,759) |
See accompanying Notes, which are an integral part of the Financial Statements.
28
Target Retirement 2040 Fund
Statement of Changes in Net Assets
| Year Ended September 30, | |
| 2008 | 2007 |
| ($000) | ($000) |
Increase (Decrease) in Net Assets |
|
|
Operations |
|
|
Net Investment Income | 20,451 | 4,793 |
Realized Net Gain (Loss) | (4,367) | (13) |
Change in Unrealized Appreciation (Depreciation) | (245,843) | 28,039 |
Net Increase (Decrease) in Net Assets Resulting from Operations | (229,759) | 32,819 |
Distributions |
|
|
Net Investment Income | (10,639) | (794) |
Realized Capital Gain | — | — |
Total Distributions | (10,639) | (794) |
Capital Share Transactions |
|
|
Issued | 1,070,554 | 496,598 |
Issued in Lieu of Cash Distributions | 10,628 | 793 |
Redeemed | (154,452) | (48,582) |
Net Increase (Decrease) from Capital Share Transactions | 926,730 | 448,809 |
Total Increase (Decrease) | 686,332 | 480,834 |
Net Assets |
|
|
Beginning of Period | 512,752 | 31,918 |
End of Period1 | 1,199,084 | 512,752 |
1 Net Assets—End of Period includes undistributed net investment income of $13,895,000 and $4,083,000.
See accompanying Notes, which are an integral part of the Financial Statements.
29
Target Retirement 2040 Fund
Financial Highlights
|
|
| June 7, |
| Year Ended | 20061 to | |
| September 30, | Sept. 30, | |
For a Share Outstanding Throughout Each Period | 2008 | 2007 | 2006 |
Net Asset Value, Beginning of Period | $24.70 | $21.13 | $20.00 |
Investment Operations |
|
|
|
Net Investment Income | .4942 | .4602 | .1602 |
Capital Gain Distributions Received | — | — | — |
Net Realized and Unrealized Gain (Loss) on Investments | (5.464) | 3.290 | .970 |
Total from Investment Operations | (4.970) | 3.750 | 1.130 |
Distributions |
|
|
|
Dividends from Net Investment Income | (.370) | (.180) | — |
Distributions from Realized Capital Gains | — | — | — |
Total Distributions | (.370) | (.180) | — |
Net Asset Value, End of Period | $19.36 | $24.70 | $21.13 |
|
|
|
|
Total Return3 | –20.40% | 17.83% | 5.65% |
|
|
|
|
Ratios/Supplemental Data |
|
|
|
Net Assets, End of Period (Millions) | $1,199 | $513 | $32 |
Ratio of Total Expenses to Average Net Assets | 0%4 | 0% | 0% |
Ratio of Net Investment Income to Average Net Assets | 2.24% | 1.99% | 1.72%5 |
Portfolio Turnover Rate | 4% | 4% | 0% |
1 Inception.
2 Calculated based on average shares outstanding.
3 Total returns do not include the account service fee that may be applicable to certain accounts with balances below $10,000.
4 The acquired fund fees and expenses were 0.19%.
5 Annualized.
See accompanying Notes, which are an integral part of the Financial Statements.
30
Target Retirement 2040 Fund
Notes to Financial Statements
Vanguard Target Retirement 2040 Fund is registered under the Investment Company Act of 1940 as an open-end investment company, or mutual fund. The fund follows a balanced investment strategy by investing in selected Vanguard funds to achieve its targeted allocation of assets to U.S. stocks, international stocks, and bonds.
A. The following significant accounting policies conform to generally accepted accounting principles for U.S. mutual funds. The fund consistently follows such policies in preparing its financial statements.
1. Security Valuation: Investments are valued at the net asset value of each underlying Vanguard fund determined as of the close of the New York Stock Exchange (generally 4 p.m., Eastern time) on the valuation date.
2. Federal Income Taxes: The fund intends to continue to qualify as a regulated investment company and distribute all of its taxable income. Management has analyzed the fund’s tax positions taken on federal income tax returns for all open tax years (tax years ended September 30, 2006–2008), and has concluded that no provision for federal income tax is required in the fund’s financial statements.
3. Distributions: Distributions to shareholders are recorded on the ex-dividend date.
4 Other: Income and capital gain distributions received are recorded on the ex-dividend date. Security transactions are accounted for on the date securities are bought or sold. Costs used to determine realized gains (losses) on the sale of investment securities are those of the specific securities sold.
B. Under a service agreement, The Vanguard Group furnishes investment advisory, corporate management, administrative, marketing, and distribution services to the fund. The service agreement provides that the fund’s expenses may be reduced or eliminated to the extent of savings realized by the Vanguard funds by the operation of the fund. Accordingly, all incremental expenses for services provided by Vanguard and all other expenses incurred by the fund during the year ended September 30, 2008, were borne by the funds in which the fund invests. The fund’s trustees and officers are also directors and officers of Vanguard and the funds in which the fund invests.
C. Distributions are determined on a tax basis and may differ from net investment income and realized capital gains for financial reporting purposes. Differences may be permanent or temporary. Permanent differences are reclassified among capital accounts in the financial statements to reflect their tax character. Temporary differences arise when certain items of income, expense, gain, or loss are recognized in different periods for financial statement and tax purposes; these differences will reverse at some time in the future. Differences in classification may also result from the treatment of short-term gains as ordinary income for tax purposes.
For tax purposes, at September 30, 2008, the fund had $13,896,000 of ordinary income available for distribution. The fund had available realized losses of $36,000 to offset future net capital gains through September 30, 2017.
At September 30, 2008, the cost of investment securities for tax purposes was $1,418,095,000. Net unrealized depreciation of investment securities for tax purposes was $221,482,000, consisting entirely of unrealized losses on securities that had fallen in value since their purchase.
D. During the year ended September 30, 2008, the fund purchased $971,010,000 of investment securities and sold $35,048,000 of investment securities, other than temporary cash investments.
31
Target Retirement 2040 Fund
E. Capital shares issued and redeemed were:
| Year Ended September 30, | |
| 2008 | 2007 |
| Shares | Shares |
| (000) | (000) |
Issued | 47,729 | 21,263 |
Issued in Lieu of Cash Distributions | 446 | 35 |
Redeemed | (6,997) | (2,046) |
Net Increase (Decrease) in Shares Outstanding | 41,178 | 19,252 |
F. In September 2006, the Financial Accounting Standards Board issued Statement of Financial Accounting Standards No. 157 (“FAS 157”), “Fair Value Measurements.” FAS 157 establishes a framework for measuring fair value and expands disclosures about fair value measurements in financial statements.
The various inputs that may be used to determine the value of the fund’s investments are summarized in three broad levels. The inputs or methodologies used for valuing securities are not necessarily an indication of the risk associated with investing in those securities.
Level 1—Quoted prices in active markets for identical securities.
Level 2—Other significant observable inputs (including quoted prices for similar securities, interest rates, prepayment speeds, credit risk, etc.).
Level 3—Significant unobservable inputs (including the fund’s own assumptions used to determine the fair value of investments).
At September 30, 2008, 100% of the fund’s investments were valued based on Level 1 inputs.
32
Target Retirement 2045 Fund
Fund Profile
As of September 30, 2008
Financial Attributes |
|
|
|
Yield1 | 2.7% |
Acquired Fund Fees and Expenses (9/30/2007)2 | 0.19% |
Volatility Measures3 |
|
| Fund Versus |
| Composite Index4 |
R-Squared | 1.00 |
Beta | 0.99 |
Allocation to Underlying Vanguard Funds |
|
|
|
Total Stock Market Index Fund | 72.1% |
Total Bond Market Index Fund | 10.1 |
European Stock Index Fund | 9.7 |
Pacific Stock Index Fund | 4.4 |
Emerging Markets Stock Index Fund | 3.7 |
Fund Asset Allocation
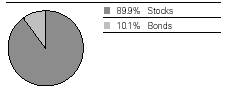
Equity Investment Focus
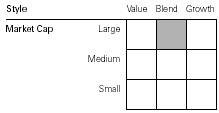
Fixed Income Investment Focus
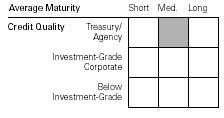
1 30-day SEC yield for the fund. See the Glossary.
2 This figure—drawn from the prospectus dated January 25, 2008—represents a weighted average of the annualized expense ratios and any transaction fees charged by the underlying mutual funds (the “acquired” funds) in which the Target Retirement Funds invest. The 2045 Fund does not charge any expenses or fees of its own. For the fiscal year ended September 30, 2008, the acquired fund fees and expenses figure was 0.18%. 3 For an explanation of R-squared, beta, and other terms used here, see the Glossary.
4 Target 2045 Composite Index: Derived by applying the fund’s target asset allocation to the results of the following benchmarks: for international stocks of developed markets, the MSCI EAFE Index; for emerging markets stocks, the Select Emerging Markets Index from inception through August 23, 2006, and the MSCI Emerging Markets Index thereafter; for bonds, the Lehman U.S. Aggregate Bond Index; and for U.S. stocks, the Dow Jones Wilshire 5000 Index from inception through April 22, 2005, and the MSCI US Broad Market Index thereafter. MSCI EAFE Index returns are adjusted for withholding taxes applicable to Luxembourg holding companies.
33
Target Retirement 2045 Fund
Performance Summary
All of the returns in this report represent past performance, which is not a guarantee of future results that may be achieved by the fund. (Current performance may be lower or higher than the performance data cited. For performance data current to the most recent month-end, visit our website at www.vanguard.com/performance.) Note, too, that both investment returns and principal value can fluctuate widely, so an investor’s shares, when sold, could be worth more or less than their original cost. The returns shown do not reflect taxes that a shareholder would pay on fund distributions or on the sale of fund shares.
Cumulative Performance: October 27, 2003–September 30, 2008
Initial Investment of $10,000
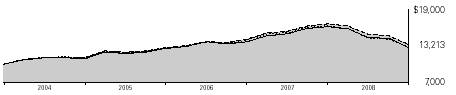
| Average Annual Total Returns | Final Value | |
| Periods Ended September 30, 2008 | of a $10,000 | |
| One Year | Since Inception1 | Investment |
Vanguard Target Retirement 2045 Fund2 | –20.42% | 5.82% | $13,213 |
Dow Jones Wilshire 5000 Index | –21.20 | 5.29 | 12,983 |
Target 2045 Composite Index3 | –20.73 | 5.82 | 13,214 |
Target 2045 Composite Average4 | –22.04 | 4.84 | 12,625 |
Fiscal-Year Total Returns (%): October 27, 2003–September 30, 2008 | ||||
|
|
|
| Target 2045 |
Fiscal | Capital | Income | Total | Composite |
Year | Return | Return | Return | Index3 |
2004 | 9.8% | 0.7% | 10.5% | 10.7% |
2005 | 13.6 | 1.5 | 15.1 | 15.2 |
2006 | 9.1 | 1.6 | 10.7 | 10.8 |
2007 | 15.9 | 2.0 | 17.9 | 18.0 |
2008 | –22.0 | 1.6 | –20.4 | –20.7 |
1 Performance for the fund and its comparative standards is calculated since the fund’s inception: October 27, 2003.
2 Total returns do not include the account service fee that may be applicable to certain accounts with balances below $10,000.
3 Target 2045 Composite Index: Derived by applying the fund’s target asset allocation to the results of the following benchmarks: for international stocks of developed markets, the MSCI EAFE Index; for emerging markets stocks, the Select Emerging Markets Index from inception through August 23, 2006, and the MSCI Emerging Markets Index thereafter; for bonds, the Lehman U.S. Aggregate Bond Index; and for U.S. stocks, the Dow Jones Wilshire 5000 Index from inception through April 22, 2005, and the MSCI US Broad Market Index thereafter. MSCI EAFE Index returns are adjusted for withholding taxes applicable to Luxembourg holding companies.
4 Target 2045 Composite Average: Derived by applying the fund’s target allocation to the following peer-group averages: the average general equity fund, average international fund, average fixed income fund, and average emerging markets fund. Derived from data provided by Lipper Inc.
Note: See Financial Highlights table for dividend and capital gains information.
34
Target Retirement 2045 Fund
Financial Statements
Statement of Net Assets
As of September 30, 2008
The fund provides a complete list of its holdings four times in each fiscal year, at the quarter-ends. For the second and fourth fiscal quarters, the lists appear in the fund’s semiannual and annual reports to shareholders. For the first and third fiscal quarters, the fund files the lists with the Securities and Exchange Commission on Form N-Q. Shareholders can look up the fund’s Forms N-Q on the SEC’s website at www.sec.gov. Forms N-Q may also be reviewed and copied at the SEC’s Public Reference Room (see the back cover of this report for further information).
|
| Market |
|
| Value• |
| Shares | ($000) |
Investment Companies (99.9%) |
|
|
U.S. Stock Funds (72.0%) |
|
|
Vanguard Total Stock Market Index Fund Investor Shares | 62,605,203 | 1,779,240 |
Vanguard Total Stock Market ETF | 272,726 | 16,153 |
|
|
|
International Stock Funds (17.8%) |
|
|
Vanguard European Stock Index Fund Investor Shares | 8,556,357 | 240,519 |
Vanguard Pacific Stock Index Fund Investor Shares | 11,342,060 | 110,358 |
Vanguard Emerging Markets Stock Index Fund Investor Shares | 4,208,154 | 91,107 |
|
|
|
Bond Fund (10.1%) |
|
|
Vanguard Total Bond Market Index Fund Investor Shares | 25,515,391 | 251,837 |
Total Investment Companies (Cost $2,787,977) |
| 2,489,214 |
Other Assets and Liabilities (0.1%) |
|
|
Other Assets |
| 12,837 |
Liabilities |
| (9,221) |
|
| 3,616 |
Net Assets (100%) |
|
|
Applicable to 202,766,052 outstanding $.001 par value shares of |
|
|
beneficial interest (unlimited authorization) |
| 2,492,830 |
Net Asset Value Per Share |
| $12.29 |
At September 30, 2008, net assets consisted of: |
|
| Amount |
| ($000) |
Paid-in Capital | 2,766,392 |
Undistributed Net Investment Income | 33,123 |
Accumulated Net Realized Losses | (7,922) |
Unrealized Appreciation (Depreciation) | (298,763) |
Net Assets | 2,492,830 |
• | See Note A in Notes to Financial Statements. |
See accompanying Notes, which are an integral part of the Financial Statements.
35
Target Retirement 2045 Fund
Statement of Operations
| Year Ended |
| September 30, 2008 |
| ($000) |
Investment Income |
|
Income |
|
Income Distributions Received | 56,083 |
Net Investment Income—Note B | 56,083 |
Realized Net Gain (Loss) |
|
Capital Gain Distributions Received | — |
Investment Securities Sold | (7,999) |
Realized Net Gain (Loss) | (7,999) |
Change in Unrealized Appreciation (Depreciation) of Investment Securities | (618,023) |
Net Increase (Decrease) in Net Assets Resulting from Operations | (569,939) |
See accompanying Notes, which are an integral part of the Financial Statements.
36
Target Retirement 2045 Fund
Statement of Changes in Net Assets
| Year Ended September 30, | |
| 2008 | 2007 |
| ($000) | ($000) |
Increase (Decrease) in Net Assets |
|
|
Operations |
|
|
Net Investment Income | 56,083 | 35,783 |
Realized Net Gain (Loss) | (7,999) | 89 |
Change in Unrealized Appreciation (Depreciation) | (618,023) | 229,398 |
Net Increase (Decrease) in Net Assets Resulting from Operations | (569,939) | 265,270 |
Distributions |
|
|
Net Investment Income | (45,796) | (24,576) |
Realized Capital Gain1 | — | (983) |
Total Distributions | (45,796) | (25,559) |
Capital Share Transactions |
|
|
Issued | 1,272,485 | 994,069 |
Issued in Lieu of Cash Distributions | 45,696 | 25,473 |
Redeemed | (413,544) | (241,108) |
Net Increase (Decrease) from Capital Share Transactions | 904,637 | 778,434 |
Total Increase (Decrease) | 288,902 | 1,018,145 |
Net Assets |
|
|
Beginning of Period | 2,203,928 | 1,185,783 |
End of Period2 | 2,492,830 | 2,203,928 |
1 Includes fiscal 2007 short-term gain distributions totaling $983,000. Short-term gain distributions are treated as ordinary income dividends for tax purposes.
2 Net Assets—End of Period includes undistributed net investment income of $33,123,000 and $22,836,000.
See accompanying Notes, which are an integral part of the Financial Statements.
37
Target Retirement 2045 Fund
Financial Highlights
|
|
|
|
| Sept. 1, | Oct. 27, |
|
|
|
|
| 2004, to | 20032 to |
For a Share Outstanding | Year Ended September 30, | Sept. 30, | Aug. 31, | |||
Throughout Each Period | 2008 | 2007 | 2006 | 2005 | 20041 | 2004 |
Net Asset Value, Beginning of Period | $15.75 | $13.60 | $12.47 | $10.98 | $10.80 | $10.00 |
Investment Operations |
|
|
|
|
|
|
Net Investment Income | .303 | .280 | .2703 | .2403 | .030 | .110 |
Capital Gain Distributions Received | — | — | — | — | — | — |
Net Realized and Unrealized Gain (Loss) |
|
|
|
|
|
|
on Investments | (3.463) | 2.130 | 1.050 | 1.410 | .150 | .760 |
Total from Investment Operations | (3.160) | 2.410 | 1.320 | 1.650 | .180 | .870 |
Distributions |
|
|
|
|
|
|
Dividends from Net Investment Income | (.300) | (.250) | (.190) | (.160) | — | (.070) |
Distributions from Realized Capital Gains | — | (.010) | — | — | — | — |
Total Distributions | (.300) | (.260) | (.190) | (.160) | — | (.070) |
Net Asset Value, End of Period | $12.29 | $15.75 | $13.60 | $12.47 | $10.98 | $10.80 |
|
|
|
|
|
|
|
Total Return4 | –20.42% | 17.90% | 10.70% | 15.09% | 1.67% | 8.72% |
|
|
|
|
|
|
|
Ratios/Supplemental Data |
|
|
|
|
|
|
Net Assets, End of Period (Millions) | $2,493 | $2,204 | $1,186 | $492 | $85 | $76 |
Ratio of Total Expenses to |
|
|
|
|
|
|
Average Net Assets | 0%5 | 0% | 0% | 0% | 0% | 0% |
Ratio of Net Investment Income to |
|
|
|
|
|
|
Average Net Assets | 2.28% | 2.08% | 2.03% | 2.07% | 1.65%6 | 1.38%6 |
Portfolio Turnover Rate | 9% | 1% | 3% | 7% | 0% | 7% |
1 The fund’s fiscal year-end changed from August 31 to September 30, effective September 30, 2004.
2 Inception.
3 Calculated based on average shares outstanding.
4 Total returns do not include the account service fee that may be applicable to certain accounts with balances below $10,000.
5 The acquired fund fees and expenses were 0.18%.
6 Annualized.
See accompanying Notes, which are an integral part of the Financial Statements.
38
Target Retirement 2045 Fund
Notes to Financial Statements
Vanguard Target Retirement 2045 Fund is registered under the Investment Company Act of 1940 as an open-end investment company, or mutual fund. The fund follows a balanced investment strategy by investing in selected Vanguard funds to achieve its targeted allocation of assets to U.S. stocks, international stocks, and bonds.
A. The following significant accounting policies conform to generally accepted accounting principles for U.S. mutual funds. The fund consistently follows such policies in preparing its financial statements.
1. Security Valuation: Securities are valued as of the close of trading on the New York Stock Exchange (generally 4 p.m., Eastern time) on the valuation date. Investments in other Vanguard funds (with the exception of ETF Shares) are valued at that fund’s net asset value. ETFs are valued at the latest quoted sales prices or official closing prices taken from their primary market or, if not traded on the valuation date, at the mean of the latest quoted bid and asked prices.
2 Federal Income Taxes: The fund intends to continue to qualify as a regulated investment company and distribute all of its taxable income. Management has analyzed the fund’s tax positions taken on federal income tax returns for all open tax years (tax years ended September 30, 2005–2008), and has concluded that no provision for federal income tax is required in the fund’s financial statements.
3. Distributions: Distributions to shareholders are recorded on the ex-dividend date.
4. Other: Income and capital gain distributions received are recorded on the ex-dividend date. Security transactions are accounted for on the date securities are bought or sold. Costs used to determine realized gains (losses) on the sale of investment securities are those of the specific securities sold.
B. Under a service agreement, The Vanguard Group furnishes investment advisory, corporate management, administrative, marketing, and distribution services to the fund. The service agreement provides that the fund’s expenses may be reduced or eliminated to the extent of savings realized by the Vanguard funds by the operation of the fund. Accordingly, all incremental expenses for services provided by Vanguard and all other expenses incurred by the fund during the year ended September 30, 2008, were borne by the funds in which the fund invests. The fund’s trustees and officers are also directors and officers of Vanguard and the funds in which the fund invests.
C. Distributions are determined on a tax basis and may differ from net investment income and realized capital gains for financial reporting purposes. Differences may be permanent or temporary. Permanent differences are reclassified among capital accounts in the financial statements to reflect their tax character. Temporary differences arise when certain items of income, expense, gain, or loss are recognized in different periods for financial statement and tax purposes; these differences will reverse at some time in the future. Differences in classification may also result from the treatment of short-term gains as ordinary income for tax purposes.
For tax purposes, at September 30, 2008, the fund had $33,274,000 of ordinary income available for distribution. The fund had available realized losses of $539,000 to offset future net capital gains through September 30, 2017.
At September 30, 2008, the cost of investment securities for tax purposes was $2,795,512,000. Net unrealized depreciation of investment securities for tax purposes was $306,298,000, consisting of unrealized gains of $376,000 on securities that had risen in value since their purchase and $306,674,000 in unrealized losses on securities that had fallen in value since their purchase.
39
Target Retirement 2045 Fund
D. During the year ended September 30, 2008, the fund purchased $1,143,650,000 of investment securities and sold $226,308,000 of investment securities, other than temporary cash investments.
E. Capital shares issued and redeemed were:
| Year Ended September 30, | |
| 2008 | 2007 |
| Shares | Shares |
| (000) | (000) |
Issued | 89,071 | 67,196 |
Issued in Lieu of Cash Distributions | 3,018 | 1,771 |
Redeemed | (29,227) | (16,238) |
Net Increase (Decrease) in Shares Outstanding | 62,862 | 52,729 |
F. In September 2006, the Financial Accounting Standards Board issued Statement of Financial Accounting Standards No. 157 (“FAS 157”), “Fair Value Measurements.” FAS 157 establishes a framework for measuring fair value and expands disclosures about fair value measurements in financial statements.
The various inputs that may be used to determine the value of the fund’s investments are summarized in three broad levels. The inputs or methodologies used for valuing securities are not necessarily an indication of the risk associated with investing in those securities.
Level 1—Quoted prices in active markets for identical securities.
Level 2—Other significant observable inputs (including quoted prices for similar securities, interest rates, prepayment speeds, credit risk, etc.).
Level 3—Significant unobservable inputs (including the fund’s own assumptions used to determine the fair value of investments).
At September 30, 2008, 100% of the fund’s investments were valued based on Level 1 inputs.
40
Target Retirement 2050 Fund
Fund Profile
As of September 30, 2008
Financial Attributes |
|
|
|
Yield1 | 2.7% |
Acquired Fund Fees and Expenses (9/30/2007)2 | 0.21% |
Allocation to Underlying Vanguard Funds |
|
|
|
Total Stock Market Index Fund | 72.0% |
Total Bond Market Index Fund | 10.2 |
European Stock Index Fund | 9.6 |
Pacific Stock Index Fund | 4.4 |
Emerging Markets Stock Index Fund | 3.8 |
Fund Asset Allocation
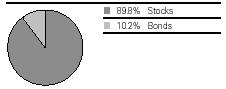
Equity Investment Focus

Fixed Income Investment Focus

1 30-day SEC yield for the fund. See the Glossary.
2 This figure—drawn from the prospectus dated January 25, 2008—represents a weighted average of the annualized expense ratios and any transaction fees charged by the underlying mutual funds (the “acquired” funds) in which the Target Retirement Funds invest. The 2050 Fund does not charge any expenses or fees of its own. For the fiscal year ended September 30, 2008, the acquired fund fees and expenses figure was 0.19%.
41
Target Retirement 2050 Fund
Performance Summary
All of the returns in this report represent past performance, which is not a guarantee of future results that may be achieved by the fund. (Current performance may be lower or higher than the performance data cited. For performance data current to the most recent month-end, visit our website at www.vanguard.com/performance.) Note, too, that both investment returns and principal value can fluctuate widely, so an investor’s shares, when sold, could be worth more or less than their original cost. The returns shown do not reflect taxes that a shareholder would pay on fund distributions or on the sale of fund shares.
Cumulative Performance: June 7, 2006–September 30, 2008
Initial Investment of $10,000
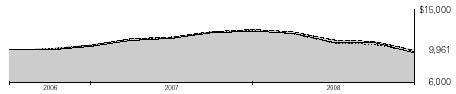
| Average Annual Total Returns | Final Value | |
| Periods Ended September 30, 2008 | of a $10,000 | |
| One Year | Since Inception1 | Investment |
Vanguard Target Retirement 2050 Fund2 | –20.41% | –0.17% | $9,961 |
Dow Jones Wilshire 5000 Index | –21.20 | –1.03 | 9,762 |
Target 2050 Composite Index3 | –20.73 | –0.31 | 9,929 |
Target 2050 Composite Average4 | –22.04 | –1.69 | 9,612 |
Fiscal-Year Total Returns (%): June 7, 2006–September 30, 2008 | ||||
|
|
|
| Target 2050 |
Fiscal | Capital | Income | Total | Composite |
Year | Return | Return | Return | Index3 |
2006 | 6.2% | 0.0% | 6.2% | 6.2% |
2007 | 16.7 | 1.1 | 17.8 | 18.0 |
2008 | –21.6 | 1.2 | –20.4 | –20.7 |
1 Performance for the fund and its comparative standards is calculated since the fund’s inception: June 7, 2006.
2 Total returns do not include the account service fee that may be applicable to certain accounts with balances below $10,000.
3 Target 2050 Composite Index: Derived by applying the fund’s target asset allocation to the results of the following benchmarks: for international stocks of developed markets, the MSCI EAFE Index; for emerging markets stocks, the Select Emerging Markets Index from inception through August 23, 2006, and the MSCI Emerging Markets Index thereafter; for bonds, the Lehman U.S. Aggregate Bond Index; and for U.S. stocks, the MSCI US Broad Market Index. MSCI EAFE Index returns are adjusted for withholding taxes applicable to Luxembourg holding companies.
4 Target 2050 Composite Average: Derived by applying the fund’s target allocation to the following peer-group averages: the average general equity fund, average international fund, average fixed income fund, and average emerging markets fund. Derived from data provided by Lipper Inc.
Note: See Financial Highlights table for dividend and capital gains information.
42
Target Retirement 2050 Fund
Financial Statements
Statement of Net Assets
As of September 30, 2008
The fund provides a complete list of its holdings four times in each fiscal year, at the quarter-ends. For the second and fourth fiscal quarters, the lists appear in the fund’s semiannual and annual reports to shareholders. For the first and third fiscal quarters, the fund files the lists with the Securities and Exchange Commission on Form N-Q. Shareholders can look up the fund’s Forms N-Q on the SEC’s website at www.sec.gov. Forms N-Q may also be reviewed and copied at the SEC’s Public Reference Room (see the back cover of this report for further information).
|
| Market |
|
| Value• |
| Shares | ($000) |
Investment Companies (99.7%) |
|
|
U.S. Stock Fund (71.8%) |
|
|
Vanguard Total Stock Market Index Fund Investor Shares | 10,322,621 | 293,369 |
|
|
|
International Stock Funds (17.7%) |
|
|
Vanguard European Stock Index Fund Investor Shares | 1,393,370 | 39,168 |
Vanguard Pacific Stock Index Fund Investor Shares | 1,830,771 | 17,813 |
Vanguard Emerging Markets Stock Index Fund Investor Shares | 719,656 | 15,580 |
|
|
|
Bond Fund (10.2%) |
|
|
Vanguard Total Bond Market Index Fund Investor Shares | 4,207,053 | 41,524 |
Total Investment Companies (Cost $480,673) |
| 407,454 |
Other Assets and Liabilities (0.3%) |
|
|
Other Assets |
| 5,084 |
Liabilities |
| (3,956) |
|
| 1,128 |
Net Assets (100%) |
|
|
Applicable to 21,033,090 outstanding $.001 par value shares of |
|
|
beneficial interest (unlimited authorization) |
| 408,582 |
Net Asset Value Per Share |
| $19.43 |
At September 30, 2008, net assets consisted of: |
|
| Amount |
| ($000) |
Paid-in Capital | 478,983 |
Undistributed Net Investment Income | 4,832 |
Accumulated Net Realized Losses | (2,014) |
Unrealized Appreciation (Depreciation) | (73,219) |
Net Assets | 408,582 |
• | See Note A in Notes to Financial Statements. |
See accompanying Notes, which are an integral part of the Financial Statements.
43
Target Retirement 2050 Fund
Statement of Operations
| Year Ended |
| September 30, 2008 |
| ($000) |
Investment Income |
|
Income |
|
Income Distributions Received | 7,161 |
Net Investment Income—Note B | 7,161 |
Realized Net Gain (Loss) |
|
Capital Gain Distributions Received | — |
Investment Securities Sold | (2,001) |
Realized Net Gain (Loss) | (2,001) |
Change in Unrealized Appreciation (Depreciation) of Investment Securities | (83,852) |
Net Increase (Decrease) in Net Assets Resulting from Operations | (78,692) |
See accompanying Notes, which are an integral part of the Financial Statements.
44
Target Retirement 2050 Fund
Statement of Changes in Net Assets
| Year Ended September 30, | |
| 2008 | 2007 |
| ($000) | ($000) |
Increase (Decrease) in Net Assets |
|
|
Operations |
|
|
Net Investment Income | 7,161 | 1,803 |
Realized Net Gain (Loss) | (2,001) | (13) |
Change in Unrealized Appreciation (Depreciation) | (83,852) | 10,271 |
Net Increase (Decrease) in Net Assets Resulting from Operations | (78,692) | 12,061 |
Distributions |
|
|
Net Investment Income | (3,847) | (328) |
Realized Capital Gain | — | — |
Total Distributions | (3,847) | (328) |
Capital Share Transactions |
|
|
Issued | 393,021 | 203,586 |
Issued in Lieu of Cash Distributions | 3,836 | 326 |
Redeemed | (97,882) | (35,763) |
Net Increase (Decrease) from Capital Share Transactions | 298,975 | 168,149 |
Total Increase (Decrease) | 216,436 | 179,882 |
Net Assets |
|
|
Beginning of Period | 192,146 | 12,264 |
End of Period1 | 408,582 | 192,146 |
1 Net Assets—End of Period includes undistributed net investment income of $4,832,000 and $1,518,000.
See accompanying Notes, which are an integral part of the Financial Statements.
45
Target Retirement 2050 Fund
Financial Highlights
|
|
| June 7, |
| Year Ended | 20061 to | |
| September 30, | Sept. 30, | |
For a Share Outstanding Throughout Each Period | 2008 | 2007 | 2006 |
Net Asset Value, Beginning of Period | $24.79 | $21.24 | $20.00 |
Investment Operations |
|
|
|
Net Investment Income | .5032 | .4802 | .1702 |
Capital Gain Distributions Received | — | — | — |
Net Realized and Unrealized Gain (Loss) on Investments | (5.493) | 3.290 | 1.070 |
Total from Investment Operations | (4.990) | 3.770 | 1.240 |
Distributions |
|
|
|
Dividends from Net Investment Income | (.370) | (.220) | — |
Distributions from Realized Capital Gains | — | — | — |
Total Distributions | (.370) | (.220) | — |
Net Asset Value, End of Period | $19.43 | $24.79 | $21.24 |
|
|
|
|
Total Return3 | –20.41% | 17.85% | 6.20% |
|
|
|
|
Ratios/Supplemental Data |
|
|
|
Net Assets, End of Period (Millions) | $409 | $192 | $12 |
Ratio of Total Expenses to Average Net Assets | 0%4 | 0% | 0% |
Ratio of Net Investment Income to Average Net Assets | 2.27% | 2.04% | 1.88%5 |
Portfolio Turnover Rate | 4% | 2% | 0% |
1 Inception.
2 Calculated based on average shares outstanding.
3 Total returns do not include the account service fee that may be applicable to certain accounts with balances below $10,000.
4 The acquired fund fees and expenses were 0.19%.
5 Annualized.
See accompanying Notes, which are an integral part of the Financial Statements.
46
Target Retirement 2050 Fund
Notes to Financial Statements
Vanguard Target Retirement 2050 Fund is registered under the Investment Company Act of 1940 as an open-end investment company, or mutual fund. The fund follows a balanced investment strategy by investing in selected Vanguard funds to achieve its targeted allocation of assets to U.S. stocks, international stocks, and bonds.
A. The following significant accounting policies conform to generally accepted accounting principles for U.S. mutual funds. The fund consistently follows such policies in preparing its financial statements.
1. Security Valuation: Investments are valued at the net asset value of each underlying Vanguard fund determined as of the close of the New York Stock Exchange (generally 4 p.m., Eastern time) on the valuation date.
2. Federal Income Taxes: The fund intends to continue to qualify as a regulated investment company and distribute all of its taxable income. Management has analyzed the fund’s tax positions taken on federal income tax returns for all open tax years (tax years ended September 30, 2006–2008), and has concluded that no provision for federal income tax is required in the fund’s financial statements.
3. Distributions: Distributions to shareholders are recorded on the ex-dividend date.
4. Other: Income and capital gain distributions received are recorded on the ex-dividend date. Security transactions are accounted for on the date securities are bought or sold. Costs used to determine realized gains (losses) on the sale of investment securities are those of the specific securities sold.
B. Under a service agreement, The Vanguard Group furnishes investment advisory, corporate management, administrative, marketing, and distribution services to the fund. The service agreement provides that the fund’s expenses may be reduced or eliminated to the extent of savings realized by the Vanguard funds by the operation of the fund. Accordingly, all incremental expenses for services provided by Vanguard and all other expenses incurred by the fund during the year ended September 30, 2008, were borne by the funds in which the fund invests. The fund’s trustees and officers are also directors and officers of Vanguard and the funds in which the fund invests.
C. Distributions are determined on a tax basis and may differ from net investment income and realized capital gains for financial reporting purposes. Differences may be permanent or temporary. Permanent differences are reclassified among capital accounts in the financial statements to reflect their tax character. Temporary differences arise when certain items of income, expense, gain, or loss are recognized in different periods for financial statement and tax purposes; these differences will reverse at some time in the future. Differences in classification may also result from the treatment of short-term gains as ordinary income for tax purposes.
For tax purposes, at September 30, 2008, the fund had $4,833,000 of ordinary income available for distribution. The fund had available realized losses of $1,000 to offset future net capital gains through September 30, 2016.
At September 30, 2008, the cost of investment securities for tax purposes was $482,687,000. Net unrealized depreciation of investment securities for tax purposes was $75,233,000, consisting entirely of unrealized losses on securities that had fallen in value since their purchase.
D. During the year ended September 30, 2008, the fund purchased $316,174,000 of investment securities and sold $13,413,000 of investment securities, other than temporary cash investments.
47
Target Retirement 2050 Fund
E. Capital shares issued and redeemed were:
| Year Ended September 30, | |
| 2008 | 2007 |
| Shares | Shares |
| (000) | (000) |
Issued | 17,508 | 8,660 |
Issued in Lieu of Cash Distributions | 160 | 14 |
Redeemed | (4,386) | (1,500) |
Net Increase (Decrease) in Shares Outstanding | 13,282 | 7,174 |
F. In September 2006, the Financial Accounting Standards Board issued Statement of Financial Accounting Standards No. 157 (“FAS 157”), “Fair Value Measurements.” FAS 157 establishes a framework for measuring fair value and expands disclosures about fair value measurements in financial statements.
The various inputs that may be used to determine the value of the fund’s investments are summarized in three broad levels. The inputs or methodologies used for valuing securities are not necessarily an indication of the risk associated with investing in those securities.
Level 1—Quoted prices in active markets for identical securities.
Level 2—Other significant observable inputs (including quoted prices for similar securities, interest rates, prepayment speeds, credit risk, etc.).
Level 3—Significant unobservable inputs (including the fund’s own assumptions used to determine the fair value of investments).
At September 30, 2008, 100% of the fund’s investments were valued based on Level 1 inputs.
48
Report of Independent Registered Public Accounting Firm
To the Trustees of Vanguard Chester Funds and the Shareholders of Vanguard Target Retirement 2030 Fund, Vanguard Target Retirement 2035 Fund, Vanguard Target Retirement 2040 Fund, Vanguard Target Retirement 2045 Fund, and Vanguard Target Retirement 2050 Fund:
In our opinion, the accompanying statements of net assets and the related statements of operations and of changes in net assets and the financial highlights present fairly, in all material respects, the financial position of Vanguard Target Retirement 2030 Fund, Vanguard Target Retirement 2035 Fund, Vanguard Target Retirement 2040 Fund, Vanguard Target Retirement 2045 Fund, and Vanguard Target Retirement 2050 Fund (the “Funds”) at September 30, 2008, the results of each of their operations for the year then ended, the changes in each of their net assets for each of the two years in the period then ended, and the financial highlights for each of the periods indicated, in conformity with accounting principles generally accepted in the United States of America. These financial statements and financial highlights (hereafter referred to as “financial statements”) are the responsibility of the Funds’ management; our responsibility is to express an opinion on these financial statements based on our audits. We conducted our audits of these financial statements in accordance with the standards of the Public Company Accounting Oversight Board (United States). Those standards require that we plan and perform the audit to obtain reasonable assurance about whether the financial statements are free of material misstatement. An audit includes examining, on a test basis, evidence supporting the amounts and disclosures in the financial statements, assessing the accounting principles used and significant estimates made by management, and evaluating the overall financial statement presentation. We believe that our audits, which included confirmation of securities at September 30, 2008 by agreement to the underlying ownership records for the Vanguard funds, provide a reasonable basis for our opinion.
PricewaterhouseCoopers LLP
Philadelphia, Pennsylvania
November 19, 2008
49
Special 2008 tax information (unaudited) for Vanguard Target Retirement Funds |
This information for the fiscal year ended September 30, 2008, is included pursuant to provisions of the Internal Revenue Code.
The fund distributed qualified dividend income to shareholders during the fiscal year as follows:
| Qualified Dividend Income |
Fund | ($000) |
Target Retirement 2030 Fund | 15,870 |
Target Retirement 2035 Fund | 67,494 |
Target Retirement 2040 Fund | 7,878 |
Target Retirement 2045 Fund | 33,015 |
Target Retirement 2050 Fund | 2,845 |
For corporate shareholders, the percentage of investment income (dividend income plus short-term gains, if any) that qualifies for the dividends-received deduction is as follows:
Fund | Percentage |
Target Retirement 2030 Fund | 54.3% |
Target Retirement 2035 Fund | 56.7 |
Target Retirement 2040 Fund | 60.0 |
Target Retirement 2045 Fund | 56.8 |
Target Retirement 2050 Fund | 59.8 |
50
Your Fund’s After-Tax Returns
This table presents returns for your fund both before and after taxes. The after-tax returns are shown in two ways: (1) assuming that an investor owned the fund during the entire period and paid taxes on the fund’s distributions, and (2) assuming that an investor paid taxes on the fund’s distributions and sold all shares at the end of each period.
Calculations are based on the highest individual federal income tax and capital gains tax rates in effect at the times of the distributions and the hypothetical sales. State and local taxes were not considered. After-tax returns reflect any qualified dividend income, using actual prior-year figures and estimates for 2008. (In the example, returns after the sale of fund shares may be higher than those assuming no sale. This occurs when the sale would have produced a capital loss. The calculation assumes that the investor received a tax deduction for the loss.)
Please note that your actual after-tax returns will depend on your tax situation and may differ from those shown. Also note that if you own the fund in a tax-deferred account, such as an individual retirement account or a 401(k) plan, this information does not apply to you. Such accounts are not subject to current taxes.
Finally, keep in mind that a fund’s performance—whether before or after taxes—does not guarantee future results.
Average Annual Total Returns: Vanguard Target Retirement Funds1 |
|
|
Periods Ended September 30, 2008 |
|
|
| One | Since |
| Year | Inception2 |
Target Retirement 2030 Fund |
|
|
Returns Before Taxes | –19.43% | 0.22% |
Returns After Taxes on Distributions | –19.69 | 0.00 |
Returns After Taxes on Distributions and Sale of Fund Shares | –12.38 | 0.17 |
|
|
|
Target Retirement 2035 Fund |
|
|
Returns Before Taxes | –20.42% | 5.20% |
Returns After Taxes on Distributions | –20.74 | 4.84 |
Returns After Taxes on Distributions and Sale of Fund Shares | –12.95 | 4.38 |
|
|
|
Target Retirement 2040 Fund |
|
|
Returns Before Taxes | –20.40% | –0.40% |
Returns After Taxes on Distributions | –20.65 | –0.60 |
Returns After Taxes on Distributions and Sale of Fund Shares | –13.00 | –0.34 |
1 Total returns do not include the account service fee that may be applicable to certain accounts with balances below $10,000.
2 For the 2035 Fund, October 27, 2003; for the 2030 and 2040 Funds, June 7, 2006.
51
| One | Since |
| Year | Inception1 |
Target Retirement 2045 Fund |
|
|
Returns Before Taxes | –20.42% | 5.82% |
Returns After Taxes on Distributions | –20.74 | 5.50 |
Returns After Taxes on Distributions and Sale of Fund Shares | –12.95 | 4.95 |
|
|
|
Target Retirement 2050 Fund |
|
|
Returns Before Taxes | –20.41% | –0.17% |
Returns After Taxes on Distributions | –20.65 | –0.38 |
Returns After Taxes on Distributions and Sale of Fund Shares | –13.01 | –0.15 |
1 For the 2045 Fund, October 27, 2003; for the 2050 Fund, June 7, 2006.
52
About Your Fund’s Expenses
As a shareholder of the fund, you incur ongoing costs, which include costs for portfolio management, administrative services, and shareholder reports (like this one), among others. Operating expenses, which are deducted from a fund’s gross income, directly reduce the investment return of the fund.
A typical fund’s expenses are expressed as a percentage of its average net assets. The Target Retirement Funds have no direct expenses, but each fund bears its proportionate share of the costs for the underlying funds in which it invests. These indirect expenses make up the acquired fund fees and expenses, also expressed as a percentage of average net assets.
The following examples are intended to help you understand the ongoing costs (in dollars) of investing in your fund and to compare these costs with those of other mutual funds. The examples are based on an investment of $1,000 made at the beginning of the period shown and held for the entire period. The costs were calculated using the acquired fund fees and expenses for each Target Retirement Fund listed.
The accompanying table illustrates your fund’s costs in two ways:
• Based on actual fund return. This section helps you to estimate the actual expenses that you paid over the period. The “Ending Account Value” shown is derived from the fund’s actual return, and the third column shows the dollar amount that would have been paid by an investor who started with $1,000 in the fund. You may use the information here, together with the amount you invested, to estimate the expenses that you paid over the period.
To do so, simply divide your account value by $1,000 (for example, an $8,600 account value divided by $1,000 = 8.6), then multiply the result by the number given for your fund under the heading “Expenses Paid During Period.”
Six Months Ended September 30, 2008 |
|
|
|
| Beginning | Ending | Expenses |
| Account Value | Account Value | Paid During |
Target Retirement Fund | 3/31/2008 | 9/30/2008 | Period1 |
Based on Actual Fund Return |
|
|
|
2030 | $1,000.00 | $891.46 | $0.85 |
2035 | 1,000.00 | 886.08 | 0.80 |
2040 | 1,000.00 | 886.85 | 0.80 |
2045 | 1,000.00 | 886.09 | 0.80 |
2050 | 1,000.00 | 886.81 | 0.85 |
Based on Hypothetical 5% Yearly Return |
|
|
|
2030 | $1,000.00 | $1,024.17 | $0.91 |
2035 | 1,000.00 | 1,024.22 | 0.86 |
2040 | 1,000.00 | 1,024.22 | 0.86 |
2045 | 1,000.00 | 1,024.22 | 0.86 |
2050 | 1,000.00 | 1,024.17 | 0.91 |
1 The calculations are based on the acquired fund fees and expenses for the most recent six-month period. The funds’ annualized expense figures for that period are (in order as listed from top to bottom above) 0.18%, 0.17%, 0.17%, 0.17%, and 0.18%. The dollar amounts shown as “Expenses Paid” are equal to the annualized expense figures for the underlying funds, multiplied by the average account value over the period, multiplied by the number of days in the most recent six-month period, then divided by the number of days in the most recent 12-month period.
53
• Based on hypothetical 5% yearly return. This section is intended to help you compare your fund’s costs with those of other mutual funds. It assumes that the fund had a yearly return of 5% before expenses, but that the expense ratio is unchanged. In this case—because the return used is not the fund’s actual return—the results do not apply to your investment. The example is useful in making comparisons, because the Securities and Exchange Commission requires all mutual funds to calculate expenses based on a 5% return. You can assess your fund’s costs by comparing this hypothetical example with the hypothetical examples that appear in shareholder reports of other funds.
Note that the expenses shown in the table are meant to highlight and help you compare ongoing costs only and do not reflect transaction costs incurred by the fund for buying and selling securities. Further, the expenses do not include the account service fee described in the prospectus. If such a fee were applied to your account, your costs would be higher. Your fund does not charge transaction fees, such as purchase or redemption fees, nor does it carry a “sales load.”
The calculations assume no shares were bought or sold during the period. Your actual costs may have been higher or lower, depending on the amount of your investment and the timing of any purchases or redemptions.
You can find more information about the fund’s expenses, including annual expense ratios, in the Financial Statements section of this report. For additional information on operating expenses and other shareholder costs, please refer to your fund’s current prospectus.
54
Glossary
Acquired Fund Fees and Expenses. Funds that invest in other Vanguard funds incur no direct expenses, but they do bear proportionate shares of the operating, administrative, and advisory expenses of the underlying funds, and they must pay any fees charged by those funds. The figure for acquired fund fees and expenses represents a weighted average of these underlying costs. Acquired is a term that the Securities and Exchange Commission applies to any mutual fund whose shares are owned by another fund.
Beta. A measure of the magnitude of a fund’s past share-price fluctuations in relation to the ups and downs of a given market index. The index is assigned a beta of 1.00. Compared with a given index, a fund with a beta of 1.20 typically would have seen its share price rise or fall by 12% when the index rose or fell by 10%. For this report, beta is based on returns over the past 36 months for both the fund and the index. Note that a fund’s beta should be reviewed in conjunction with its R-squared (see definition). The lower the R-squared, the less correlation there is between the fund and the index, and the less reliable beta is as an indicator of volatility.
Expense Ratio. The percentage of a fund’s average net assets used to pay its annual administrative and advisory expenses. These expenses directly reduce returns to investors.
Inception Date. The date on which the assets of a fund (or one of its share classes) are first invested in accordance with the fund’s investment objective. For funds with a subscription period, the inception date is the day after that period ends. Investment performance is measured from the inception date.
R-Squared. A measure of how much of a fund’s past returns can be explained by the returns from the market in general, as measured by a given index. If a fund’s total returns were precisely synchronized with an index’s returns, its R-squared would be 1.00. If the fund’s returns bore no relationship to the index’s returns, its R-squared would be 0. For this report, R-squared is based on returns over the past 36 months for both the fund and the index.
Yield. A fund’s 30-day SEC yield is derived using a formula specified by the U.S. Securities and Exchange Commission. Under the formula, data related to the fund’s security holdings in the previous 30 days are used to calculate the fund’s hypothetical net income for that period, which is then annualized and divided by the fund’s estimated average net assets over the calculation period. For the purposes of this calculation, a security’s income is based on its current market yield to maturity (in the case of bonds) or its projected dividend yield (for stocks). Because the SEC yield represents hypothetical annualized income, it will differ—at times significantly—from the fund’s actual experience. As a result, the fund’s income distributions may be higher or lower than implied by the SEC yield.
55
The People Who Govern Your Fund
The trustees of your mutual fund are there to see that the fund is operated and managed in your best interests since, as a shareholder, you are a part owner of the fund. Your fund’s trustees also serve on the board of directors of The Vanguard Group, Inc., which is owned by the Vanguard funds and provides services to them on an at-cost basis.
A majority of Vanguard’s board members are independent, meaning that they have no affiliation with Vanguard or the funds they oversee, apart from the sizable personal investments they have made as private individuals.
Our independent board members bring distinguished backgrounds in business, academia, and public service to their task of working with Vanguard officers to establish the policies and oversee the activities of the funds. Among board members’ responsibilities are selecting investment advisors for the funds; monitoring fund operations, performance, and costs; reviewing contracts; nominating and selecting new trustees/directors; and electing Vanguard officers.
Each trustee serves a fund until its termination; or until the trustee’s retirement, resignation, or death; or otherwise as specified in the fund’s organizational documents. Any trustee may be removed at a shareholders’ meeting by a vote representing two-thirds of the net asset value of all shares of the fund together with shares of other Vanguard funds organized within the same trust. The table on these two pages shows information for each trustee and executive officer of the fund. The mailing address of the trustees and officers is P.O. Box 876, Valley Forge, PA 19482.
Chairman of the Board and Trustee | |
|
|
John J. Brennan1 |
|
Born 1954 | Principal Occupation(s) During the Past Five Years: Chairman of the Board and Director/ |
Trustee Since May 1987; | Trustee of The Vanguard Group, Inc., and of each of the investment companies served |
Chairman of the Board | by The Vanguard Group; Chief Executive Officer and President of The Vanguard Group |
156 Vanguard Funds Overseen | and of each of the investment companies served by The Vanguard Group (1996–2008). |
|
|
Independent Trustees |
|
|
|
Charles D. Ellis |
|
Born 1937 | Principal Occupation(s) During the Past Five Years: Applecore Partners (pro bono ventures |
Trustee Since January 2001 | in education); Senior Advisor to Greenwich Associates (international business strategy |
156 Vanguard Funds Overseen | consulting); Successor Trustee of Yale University; Overseer of the Stern School of Business |
| at New York University; Trustee of the Whitehead Institute for Biomedical Research. |
|
|
Emerson U. Fullwood |
|
Born 1948 | Principal Occupation(s) During the Past Five Years: Executive Chief Staff and Marketing |
Trustee Since January 2008 | Officer for North America since 2004 and Corporate Vice President of Xerox Corporation |
156 Vanguard Funds Overseen | (photocopiers and printers); Director of SPX Corporation (multi-industry manufacturing), |
| of the United Way of Rochester, and of the Boy Scouts of America. |
|
|
Rajiv L. Gupta |
|
Born 1945 | Principal Occupation(s) During the Past Five Years: Chairman, President, and |
Trustee Since December 20012 | Chief Executive Officer of Rohm and Haas Co. (chemicals); Board Member of |
156 Vanguard Funds Overseen | the American Chemistry Council; Director of Tyco International, Ltd. (diversified |
| manufacturing and services) since 2005. |
|
|
Amy Gutmann |
|
Born 1949 | Principal Occupation(s) During the Past Five Years: President of the University of |
Trustee Since June 2006 | Pennsylvania since 2004; Professor in the School of Arts and Sciences, Annenberg School |
156 Vanguard Funds Overseen | for Communication, and Graduate School of Education of the University of Pennsylvania |
| since 2004; Provost (2001–2004) and Laurance S. Rockefeller Professor of Politics and |
| the University Center for Human Values (1990–2004), Princeton University; Director of |
| Carnegie Corporation of New York since 2005 and of Schuylkill River Development |
| Corporation and Greater Philadelphia Chamber of Commerce since 2004; Trustee of |
| the National Constitution Center since 2007. |
JoAnn Heffernan Heisen |
|
Born 1950 | Principal Occupation(s) During the Past Five Years: Corporate Vice President and |
Trustee Since July 1998 | Chief Global Diversity Officer since 2006, Vice President and Chief Information |
156 Vanguard Funds Overseen | Officer (1997–2005), and Member of the Executive Committee of Johnson & |
| Johnson (pharmaceuticals/consumer products); Director of the University Medical |
| Center at Princeton and Women’s Research and Education Institute. |
|
|
André F. Perold |
|
Born 1952 | Principal Occupation(s) During the Past Five Years: George Gund Professor of Finance |
Trustee Since December 2004 | and Banking, Harvard Business School; Senior Associate Dean and Director of Faculty |
156 Vanguard Funds Overseen | Recruiting, Harvard Business School; Director and Chairman of UNX, Inc. (equities |
| trading firm); Chair of the Investment Committee of HighVista Strategies LLC (private |
| investment firm) since 2005. |
|
|
Alfred M. Rankin, Jr. |
|
Born 1941 | Principal Occupation(s) During the Past Five Years: Chairman, President, Chief Executive |
Trustee Since January 1993 | Officer, and Director of NACCO Industries, Inc. (forklift trucks/housewares/lignite); Director |
156 Vanguard Funds Overseen | of Goodrich Corporation (industrial products/aircraft systems and services). |
|
|
J. Lawrence Wilson |
|
Born 1936 | Principal Occupation(s) During the Past Five Years: Retired Chairman and Chief Executive |
Trustee Since April 1985 | Officer of Rohm and Haas Co. (chemicals); Director of Cummins Inc. (diesel engines) and |
156 Vanguard Funds Overseen | AmerisourceBergen Corp. (pharmaceutical distribution); Trustee of Vanderbilt University |
| and of Culver Educational Foundation. |
|
|
Executive Officers1 |
|
|
|
Thomas J. Higgins |
|
Born 1957 | Principal Occupation(s) During the Past Five Years: Principal of The Vanguard Group, Inc.; |
Chief Financial Officer | Treasurer of each of the investment companies served by The Vanguard Group; Chief |
Since September 2008 | Financial Officer of each of the investment companies served by The Vanguard |
Treasurer Since July 1998 | Group since 2008. |
156 Vanguard Funds Overseen |
|
|
|
F. William McNabb III |
|
Born 1957 | Principal Occupation(s) During the Past Five Years: Chief Executive Officer, Director, |
Chief Executive Officer | and President of The Vanguard Group, Inc., since 2008; Chief Executive Officer and |
Since August 31, 2008 | President of each of the investment companies served by The Vanguard Group since |
President Since March 2008 | 2008; Director of Vanguard Marketing Corporation; Managing Director of The Vanguard |
156 Vanguard Funds Overseen | Group (1995–2008). |
|
|
Heidi Stam |
|
Born 1956 | Principal Occupation(s) During the Past Five Years: Managing Director of The Vanguard |
Secretary Since July 2005 | Group, Inc., since 2006; General Counsel of The Vanguard Group since 2005; Secretary of |
156 Vanguard Funds Overseen | The Vanguard Group and of each of the investment companies served by The Vanguard |
| Group since 2005; Director and Senior Vice President of Vanguard Marketing Corporation |
| since 2005; Principal of The Vanguard Group (1997–2006). |
Vanguard Senior Management Team |
|
| |
|
|
|
|
R. Gregory Barton | Kathleen C. Gubanich | Michael S. Miller | Glenn W. Reed |
Mortimer J. Buckley | Paul A. Heller | Ralph K. Packard | George U. Sauter |
Founder |
|
John C. Bogle |
Chairman and Chief Executive Officer, 1974–1996 |
1 These individuals are “interested persons” as defined in the Investment Company Act of 1940.
2 December 2002 for Vanguard Equity Income Fund, Vanguard Growth Equity Fund, the Vanguard Municipal Bond Funds, and the Vanguard State Tax-Exempt Funds.
More information about the trustees is in the Statement of Additional Information, available from The Vanguard Group.
|
|
| P.O. Box 2600 |
| Valley Forge, PA 19482-2600 |

Connect with Vanguard® > www.vanguard.com
Fund Information > 800-662-7447 | All comparative mutual fund data are from Lipper Inc. |
| or Morningstar, Inc., unless otherwise noted. |
Direct Investor Account Services > 800-662-2739 |
|
|
|
Institutional Investor Services > 800-523-1036 | You can obtain a free copy of Vanguard’s proxy voting |
| guidelines by visiting our website, www.vanguard.com, |
Text Telephone for People | and searching for “proxy voting guidelines,” or by |
With Hearing Impairment > 800-952-3335 | calling Vanguard at 800-662-2739. The guidelines are |
| also available from the SEC’s website, www.sec.gov. |
| In addition, you may obtain a free report on how your |
| fund voted the proxies for securities it owned during |
This material may be used in conjunction | the 12 months ended June 30. To get the report, visit |
with the offering of shares of any Vanguard | either www.vanguard.com or www.sec.gov. |
fund only if preceded or accompanied by |
|
the fund’s current prospectus. |
|
| You can review and copy information about your fund |
| at the SEC’s Public Reference Room in Washington, D.C. |
The funds or securities referred to herein are not | To find out more about this public service, call the SEC |
sponsored, endorsed, or promoted by MSCI, and MSCI | at 202-551-8090. Information about your fund is also |
bears no liability with respect to any such funds or | available on the SEC’s website, and you can receive |
securities. For any such funds or securities, the | copies of this information, for a fee, by sending a |
prospectus or the Statement of Additional Information | request in either of two ways: via e-mail addressed to |
contains a more detailed description of the limited | publicinfo@sec.gov or via regular mail addressed to the |
relationship MSCI has with The Vanguard Group and | Public Reference Section, Securities and Exchange |
any related funds. | Commission, Washington, DC 20549-0102. |
|
|
Russell is a trademark of The Frank Russell Company. |
|
|
|
|
|
|
|
|
|
|
|
|
|
|
|
|
|
|
|
|
|
| © 2008 The Vanguard Group, Inc. All rights reserved. |
| Vanguard Marketing Corporation, Distributor. |
|
|
| Q3080B 112008 |
Item 2: Code of Ethics. The Registrant has adopted a code of ethics that applies to the Registrant’s principal executive officer, principal financial officer, principal accounting officer or controller or persons performing similar functions. The Code of Ethics was amended during the reporting period covered by this report to make certain technical, non-material changes.
Item 3: Audit Committee Financial Expert. The following members of the Audit Committee have been determined by the Registrant’s Board of Trustees to be Audit Committee Financial Experts serving on its Audit Committee, and to be independent: Charles D. Ellis, Rajiv L. Gupta, JoAnn Heffernan Heisen, André F. Perold, Alfred M. Rankin, Jr., and J. Lawrence Wilson.
Item 4: Principal Accountant Fees and Services.
(a) Audit Fees.
Audit Fees of the Registrant
Fiscal Year Ended September 30, 2008: $168,000
Fiscal Year Ended September 30, 2007: $170,000
Aggregate Audit Fees of Registered Investment Companies in the Vanguard Group.
Fiscal Year Ended September 30, 2008: $3,055,590
Fiscal Year Ended September 30, 2007: $2,835,320
(b) Audit-Related Fees.
Fiscal Year Ended September 30, 2008: $626,240
Fiscal Year Ended September 30, 2007: $630,400
Includes fees billed in connection with assurance and related services provided to the Registrant, The Vanguard Group, Inc., Vanguard Marketing Corporation, and other registered investment companies in the Vanguard Group.
(c) Tax Fees.
Fiscal Year Ended September 30, 2008: $230,400
Fiscal Year Ended September 30, 2007: $215,900
Includes fees billed in connection with tax compliance, planning and advice services provided to the Registrant, The Vanguard Group, Inc., Vanguard Marketing Corporation, and other registered investment companies in the Vanguard Group and related to income and excise taxes.
(d) All Other Fees.
Fiscal Year Ended September 30, 2008: $0
Fiscal Year Ended September 30, 2007: $0
Includes fees billed for services related to risk management and privacy matters. Services were provided to the Registrant, The Vanguard Group, Inc., Vanguard Marketing Corporation, and other registered investment companies in the Vanguard Group.
(e) (1) Pre-Approval Policies. The policy of the Registrant’s Audit Committee is to consider and, if appropriate, approve before the principal accountant is engaged for such services, all specific audit and non-audit services provided to: (1) the Registrant; (2) The Vanguard Group, Inc.; (3) other entities controlled by The Vanguard Group, Inc. that provide ongoing services to the Registrant; and (4) other registered investment companies in the Vanguard Group. In making a determination, the Audit Committee considers whether the services are consistent with maintaining the principal accountant’s independence.
In the event of a contingency situation in which the principal accountant is needed to provide services in between scheduled Audit Committee meetings, the Chairman of the Audit Committee would be called on to consider and, if appropriate, pre-approve audit or permitted non-audit services in an amount sufficient to complete services through the next Audit Committee meeting, and to determine if such services would be consistent with maintaining the accountant’s independence. At the next scheduled Audit Committee meeting, services and fees would be presented to the Audit Committee for formal consideration, and, if appropriate, approval by the entire Audit Committee. The Audit Committee would again consider whether such services and fees are consistent with maintaining the principal accountant’s independence.
The Registrant’s Audit Committee is informed at least annually of all audit and non-audit services provided by the principal accountant to the Vanguard complex, whether such services are provided to: (1) the Registrant; (2) The Vanguard Group, Inc.; (3) other entities controlled by The Vanguard Group, Inc. that provide ongoing services to the Registrant; or (4) other registered investment companies in the Vanguard Group.
(2) No percentage of the principal accountant’s fees or services were approved pursuant to the waiver provision of paragraph (c)(7)(i)(C) of Rule 2-01 of Regulation S-X.
(f) For the most recent fiscal year, over 50% of the hours worked under the principal accountant’s engagement were not performed by persons other than full-time, permanent employees of the principal accountant.
(g) Aggregate Non-Audit Fees.
Fiscal Year Ended September 30, 2008: $230,400
Fiscal Year Ended September 30, 2007: $215,900
Includes fees billed for non-audit services provided to the Registrant, The Vanguard Group, Inc., Vanguard Marketing Corporation, and other registered investment companies in the Vanguard Group.
(h) For the most recent fiscal year, the Audit Committee has determined that the provision of all non-audit services was consistent with maintaining the principal accountant’s independence.
Item 5: Not Applicable.
Item 6: Not Applicable.
Item 7: Not Applicable.
Item 8: Not Applicable.
Item 9: Not Applicable.
Item 10: Not Applicable.
Item 11: Controls and Procedures.
(a) Disclosure Controls and Procedures. The Principal Executive and Financial Officers concluded that the Registrant's Disclosure Controls and Procedures are effective based on their evaluation of the Disclosure Controls and Procedures as of a date within 90 days of the filing date of this report.
(b) Internal Control Over Financial Reporting. There were no significant changes in Registrant’s Internal Control Over Financial Reporting or in other factors that could significantly affect this control subsequent to the date of the evaluation, including any corrective actions with regard to significant deficiencies and material weaknesses.
Item 12: Exhibits.
| (a) | Code of Ethics. |
| (b) | Certifications. |
Pursuant to the requirements of the Securities Exchange Act of 1934 and the Investment Company Act of 1940, the registrant has duly caused this report to be signed on its behalf by the undersigned, thereunto duly authorized.
| VANGUARD CHESTER FUNDS |
|
|
By: | /s/ F. WILLIAM MCNABB III* |
| F. WILLIAM MCNABB III |
| CHIEF EXECUTIVE OFFICER |
|
|
Date: November 18, 2008 | |
Pursuant to the requirements of the Securities Exchange Act of 1934 and the Investment Company Act of 1940, this report has been signed below by the following persons on behalf of the registrant and in the capacities and on the dates indicated.
| VANGUARD CHESTER FUNDS |
|
|
By: | /s/ F. WILLIAM MCNABB III* |
| F. WILLIAM MCNABB III |
| CHIEF EXECUTIVE OFFICER |
|
|
Date: November 18, 2008 | |
| VANGUARD CHESTER FUNDS |
|
|
By: | /s/ THOMAS J. HIGGINS* |
| THOMAS J. HIGGINS |
| CHIEF FINANCIAL OFFICER |
|
|
Date: November 18, 2008 | |
* By: /s/ Heidi Stam
Heidi Stam, pursuant to a Power of Attorney filed on January 18, 2008, see file Number 2-29601, Incorporated by Reference; and pursuant to a Power of Attorney filed on September 26, 2008, see File Number 2-47371, Incorporated by Reference.