UNITED STATES
SECURITIES AND EXCHANGE COMMISSION
Washington, D.C. 20549
FORM N-CSR
CERTIFIED SHAREHOLDER REPORT
OF
REGISTERED MANAGEMENT INVESTMENT COMPANIES
Investment Company Act file number: 811-04098
| Name of Registrant: | | Vanguard Chester Funds |
| Address of Registrant: | | P.O. Box 2600 |
| | | Valley Forge, PA 19482 |
| Name and address of agent for service: | | John E. Schadl, Esquire |
| | | P.O. Box 876 |
| | | Valley Forge, PA 19482 |
Registrant’s telephone number, including area code: (610) 669-1000
Date of fiscal year end: September 30
Date of reporting period: October 1, 2023—September 30, 2024
Item 1: Reports to Shareholders.
TABLE OF CONTENTS
Annual Shareholder Report | September 30, 2024
This annual shareholder report contains important information about Vanguard PRIMECAP Fund (the "Fund") for the period of October 1, 2023, to September 30, 2024. You can find additional information about the Fund at https://personal1.vanguard.com/ngf-next-gen-form-webapp/fund-literature. You can also request this information by contacting us at 800-662-7447.
What were the Fund costs for the last year?
(based on a hypothetical $10,000 investment)
| Share Class Name | Costs of a $10,000 investment | Costs paid as a percentage of a $10,000 investment |
|---|
| Admiral Shares | $35 | 0.31% |
How did the Fund perform during the reporting period?
For the 12 months ended September 30, 2024, the Fund underperformed its benchmark, the S&P 500 Index.
U.S. economic growth hovered around 3% on a year-over-year basis during the period, quelling recession fears. The Federal Reserve began cutting interest rates for the first time since early 2020, and the year-over-year rate of consumer price inflation eased to around 2.5%. Even with some negative monthly returns, U.S. stocks finished the period up sharply.
Small-, mid-, and large-capitalization stocks all posted positive returns for the 12-month period. Large-capitalization stocks held up better than mid- and small-caps, while growth stocks outperformed value.
Though the Fund recorded a strong gain in absolute terms, its shortfall relative to its benchmark reflected challenges with both security selection and sector allocation. Health care was the only sector in which the Fund outperformed the benchmark. Selection in information technology and industrials was one of the largest sources of underperformance.
How did the Fund perform over the past 10 years?
Keep in mind that the Fund's past performance does not indicate how the Fund will perform in the future. Updated performance information is available on our website at vanguard.com/performance or by calling Vanguard toll-free at 800-662-7447. The graph and returns shown do not reflect taxes that a shareholder would pay on fund distributions or on the sale of fund shares.
Cumulative Performance: September 30, 2014, Through September 30, 2024
Initial investment of $50,000
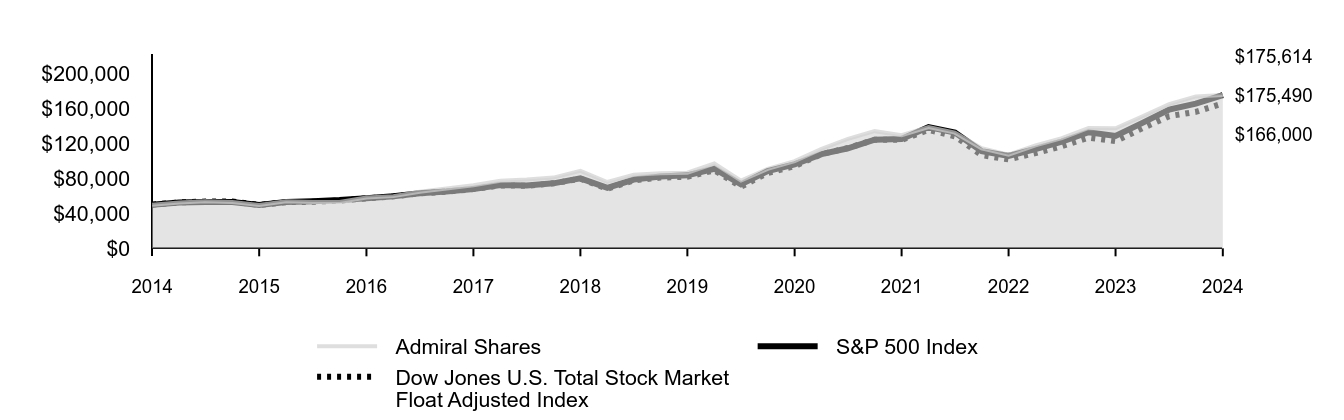
| Admiral Shares | S&P 500 Index | Dow Jones U.S. Total Stock Market Float Adjusted Index |
|---|
| 2014 | $50,000 | $50,000 | $50,000 |
| 2014 | $52,627 | $52,466 | $52,614 |
| 2015 | $53,822 | $52,965 | $53,561 |
| 2015 | $53,012 | $53,112 | $53,625 |
| 2015 | $49,654 | $49,693 | $49,727 |
| 2015 | $54,018 | $53,192 | $52,846 |
| 2016 | $52,967 | $53,909 | $53,329 |
| 2016 | $53,118 | $55,233 | $54,723 |
| 2016 | $58,333 | $57,361 | $57,150 |
| 2016 | $59,806 | $59,554 | $59,514 |
| 2017 | $64,752 | $63,167 | $62,962 |
| 2017 | $68,511 | $65,117 | $64,856 |
| 2017 | $72,237 | $68,035 | $67,818 |
| 2017 | $77,507 | $72,556 | $72,109 |
| 2018 | $78,766 | $72,005 | $71,673 |
| 2018 | $81,029 | $74,478 | $74,449 |
| 2018 | $88,814 | $80,220 | $79,740 |
| 2018 | $76,005 | $69,375 | $68,290 |
| 2019 | $84,199 | $78,843 | $77,878 |
| 2019 | $86,040 | $82,236 | $81,062 |
| 2019 | $86,732 | $83,633 | $81,983 |
| 2019 | $97,193 | $91,218 | $89,391 |
| 2020 | $77,602 | $73,341 | $70,654 |
| 2020 | $90,998 | $88,408 | $86,261 |
| 2020 | $99,856 | $96,302 | $94,089 |
| 2020 | $114,031 | $108,001 | $107,976 |
| 2021 | $125,512 | $114,670 | $114,939 |
| 2021 | $134,273 | $124,473 | $124,465 |
| 2021 | $129,648 | $125,198 | $124,318 |
| 2021 | $139,006 | $139,004 | $135,680 |
| 2022 | $132,550 | $132,611 | $128,354 |
| 2022 | $114,626 | $111,260 | $106,744 |
| 2022 | $107,358 | $105,827 | $101,873 |
| 2022 | $118,031 | $113,829 | $109,183 |
| 2023 | $126,257 | $122,363 | $117,093 |
| 2023 | $137,956 | $133,060 | $126,920 |
| 2023 | $137,569 | $128,704 | $122,744 |
| 2023 | $151,296 | $143,752 | $137,635 |
| 2024 | $165,163 | $158,926 | $151,462 |
| 2024 | $174,085 | $165,734 | $156,368 |
| 2024 | $175,614 | $175,490 | $166,000 |
Average Annual Total Returns
| | 1 Year | 5 Years | 10 Years |
|---|
| Admiral Shares | 27.66% | 15.15% | 13.39% |
| S&P 500 Index | 36.35% | 15.98% | 13.38% |
| Dow Jones U.S. Total Stock Market Float Adjusted Index | 35.24% | 15.15% | 12.75% |
This table reflects the Fund's investments, including short-term investments and other assets and liabilities.
Portfolio Composition % of Net Assets
(as of September 30, 2024)
| Communication Services | 5.7% | |
| Consumer Discretionary | 10.5% | |
| Consumer Staples | 0.5% | |
| Energy | 2.1% | |
| Financials | 6.7% | |
| Health Care | 30.4% | |
| Industrials | 12.6% | |
| Information Technology | 28.4% | |
| Materials | 1.2% | |
| Other Assets and Liabilities—Net | 1.9% | |
Fund Statistics
(as of September 30, 2024)
| Fund Net Assets (in millions) | $78,334 |
| Number of Portfolio Holdings | 169 |
| Portfolio Turnover Rate | 4% |
| Total Investment Advisory Fees (in thousands) | $130,465 |
Where can I find additional information about the Fund?
Additional information about the Fund, including its prospectus, financial information, holdings, and proxy voting information is available at https://personal1.vanguard.com/ngf-next-gen-form-webapp/fund-literature.
Connect with Vanguard® • vanguard.com
Fund Information • 800-662-7447
Direct Investor Account Services • 800-662-2739
Text Telephone for People Who Are Deaf or Hard of Hearing •
800-749-7273
© 2024 The Vanguard Group, Inc.
All rights reserved.
Vanguard Marketing Corporation, Distributor.
AR559
Annual Shareholder Report | September 30, 2024
This annual shareholder report contains important information about Vanguard PRIMECAP Fund (the "Fund") for the period of October 1, 2023, to September 30, 2024. You can find additional information about the Fund at https://personal1.vanguard.com/ngf-next-gen-form-webapp/fund-literature. You can also request this information by contacting us at 800-662-7447.
What were the Fund costs for the last year?
(based on a hypothetical $10,000 investment)
| Share Class Name | Costs of a $10,000 investment | Costs paid as a percentage of a $10,000 investment |
|---|
| Investor Shares | $43 | 0.38% |
How did the Fund perform during the reporting period?
For the 12 months ended September 30, 2024, the Fund underperformed its benchmark, the S&P 500 Index.
U.S. economic growth hovered around 3% on a year-over-year basis during the period, quelling recession fears. The Federal Reserve began cutting interest rates for the first time since early 2020, and the year-over-year rate of consumer price inflation eased to around 2.5%. Even with some negative monthly returns, U.S. stocks finished the period up sharply.
Small-, mid-, and large-capitalization stocks all posted positive returns for the 12-month period. Large-capitalization stocks held up better than mid- and small-caps, while growth stocks outperformed value.
Though the Fund recorded a strong gain in absolute terms, its shortfall relative to its benchmark reflected challenges with both security selection and sector allocation. Health care was the only sector in which the Fund outperformed the benchmark. Selection in information technology and industrials was one of the largest sources of underperformance.
How did the Fund perform over the past 10 years?
Keep in mind that the Fund's past performance does not indicate how the Fund will perform in the future. Updated performance information is available on our website at vanguard.com/performance or by calling Vanguard toll-free at 800-662-7447. The graph and returns shown do not reflect taxes that a shareholder would pay on fund distributions or on the sale of fund shares.
Cumulative Performance: September 30, 2014, Through September 30, 2024
Initial investment of $10,000

| Investor Shares | S&P 500 Index | Dow Jones U.S. Total Stock Market Float Adjusted Index |
|---|
| 2014 | $10,000 | $10,000 | $10,000 |
| 2014 | $10,524 | $10,493 | $10,523 |
| 2015 | $10,760 | $10,593 | $10,712 |
| 2015 | $10,598 | $10,622 | $10,725 |
| 2015 | $9,924 | $9,939 | $9,945 |
| 2015 | $10,796 | $10,638 | $10,569 |
| 2016 | $10,584 | $10,782 | $10,666 |
| 2016 | $10,612 | $11,047 | $10,945 |
| 2016 | $11,651 | $11,472 | $11,430 |
| 2016 | $11,944 | $11,911 | $11,903 |
| 2017 | $12,929 | $12,633 | $12,592 |
| 2017 | $13,677 | $13,023 | $12,971 |
| 2017 | $14,419 | $13,607 | $13,564 |
| 2017 | $15,468 | $14,511 | $14,422 |
| 2018 | $15,717 | $14,401 | $14,335 |
| 2018 | $16,166 | $14,896 | $14,890 |
| 2018 | $17,715 | $16,044 | $15,948 |
| 2018 | $15,158 | $13,875 | $13,658 |
| 2019 | $16,789 | $15,769 | $15,576 |
| 2019 | $17,154 | $16,447 | $16,212 |
| 2019 | $17,288 | $16,727 | $16,397 |
| 2019 | $19,369 | $18,244 | $17,878 |
| 2020 | $15,462 | $14,668 | $14,131 |
| 2020 | $18,130 | $17,682 | $17,252 |
| 2020 | $19,890 | $19,260 | $18,818 |
| 2020 | $22,710 | $21,600 | $21,595 |
| 2021 | $24,992 | $22,934 | $22,988 |
| 2021 | $26,731 | $24,895 | $24,893 |
| 2021 | $25,805 | $25,040 | $24,864 |
| 2021 | $27,664 | $27,801 | $27,136 |
| 2022 | $26,373 | $26,522 | $25,671 |
| 2022 | $22,805 | $22,252 | $21,349 |
| 2022 | $21,354 | $21,165 | $20,375 |
| 2022 | $23,473 | $22,766 | $21,837 |
| 2023 | $25,104 | $24,473 | $23,419 |
| 2023 | $27,425 | $26,612 | $25,384 |
| 2023 | $27,345 | $25,741 | $24,549 |
| 2023 | $30,067 | $28,750 | $27,527 |
| 2024 | $32,816 | $31,785 | $30,292 |
| 2024 | $34,585 | $33,147 | $31,274 |
| 2024 | $34,884 | $35,098 | $33,200 |
Average Annual Total Returns
| | 1 Year | 5 Years | 10 Years |
|---|
| Investor Shares | 27.57% | 15.07% | 13.31% |
| S&P 500 Index | 36.35% | 15.98% | 13.38% |
| Dow Jones U.S. Total Stock Market Float Adjusted Index | 35.24% | 15.15% | 12.75% |
This table reflects the Fund's investments, including short-term investments and other assets and liabilities.
Portfolio Composition % of Net Assets
(as of September 30, 2024)
| Communication Services | 5.7% | |
| Consumer Discretionary | 10.5% | |
| Consumer Staples | 0.5% | |
| Energy | 2.1% | |
| Financials | 6.7% | |
| Health Care | 30.4% | |
| Industrials | 12.6% | |
| Information Technology | 28.4% | |
| Materials | 1.2% | |
| Other Assets and Liabilities—Net | 1.9% | |
Fund Statistics
(as of September 30, 2024)
| Fund Net Assets (in millions) | $78,334 |
| Number of Portfolio Holdings | 169 |
| Portfolio Turnover Rate | 4% |
| Total Investment Advisory Fees (in thousands) | $130,465 |
Where can I find additional information about the Fund?
Additional information about the Fund, including its prospectus, financial information, holdings, and proxy voting information is available at https://personal1.vanguard.com/ngf-next-gen-form-webapp/fund-literature.
Connect with Vanguard® • vanguard.com
Fund Information • 800-662-7447
Direct Investor Account Services • 800-662-2739
Text Telephone for People Who Are Deaf or Hard of Hearing •
800-749-7273
© 2024 The Vanguard Group, Inc.
All rights reserved.
Vanguard Marketing Corporation, Distributor.
AR59
Item 2: Code of Ethics.
The Registrant has adopted a code of ethics that applies to the Registrant’s principal executive officer, principal financial officer, principal accounting officer or controller or persons performing similar functions. The Code of Ethics was amended during the reporting period covered by this report to make certain technical, non-material changes.
Item 3: Audit Committee Financial Expert.
All members of the Audit Committee have been determined by the Registrant’s Board of Trustees to be Audit Committee Financial Experts and to be independent: F. Joseph Loughrey, Mark Loughridge, Sarah Bloom Raskin, and Peter F. Volanakis.
Item 4: Principal Accountant Fees and Services.
Includes fees billed in connection with services to the Registrant only.
| | | Fiscal Year Ended
September 30,
2024 | | | Fiscal Year Ended
September 30,
2023 | |
| (a) Audit Fees. | | $ | 32,000 | | | $ | 30,000 | |
| (b) Audit-Related Fees. | | | 0 | | | | 0 | |
| (c) Tax Fees. | | | 0 | | | | 0 | |
| (d) All Other Fees. | | | 0 | | | | 0 | |
| Total. | | $ | 32,000 | | | $ | 30,000 | |
| (e) | (1) Pre-Approval Policies. The audit committee is responsible for pre-approving all audit and non-audit services provided by PwC to: (i) the Vanguard funds; and (ii) Vanguard, or any entity controlled by Vanguard that provides ongoing services to the Vanguard funds. All services provided to Vanguard entities by the independent auditor, whether or not they are subject to preapproval, must be disclosed to the audit committee. The audit committee chair may preapprove any permissible audit and non-audit services as long as any preapproval is brought to the attention of the full audit committee at the next scheduled meeting. |
| | | (2) No percentage of the principal accountant’s fees or services were approved pursuant to the waiver provision of paragraph (c)(7)(i)(C) of Rule 2-01 of Regulation S-X. |
| (f) | For the most recent fiscal year, over 50% of the hours worked under the principal accountant’s engagement were not performed by persons other than full-time, permanent employees of the principal accountant. |
| (g) | Aggregate Non-Audit Fees. |
Includes fees billed for non-audit services provided to the Registrant, other registered investment companies in the Vanguard complex, The Vanguard Group, Inc., and Vanguard Marketing Corporation.
| | | Fiscal Year
Ended
September 30,
2024 | | | Fiscal Year
Ended
September 30,
2023 | |
| Non-audit fees to the Registrant only, listed as (b)through (d)above. | | $ | 0 | | | $ | 0 | |
| | | | | | | | | |
| Non-audit Fees to other registered investment companies in the Vanguard complex, The Vanguard Group,Inc., and Vanguard Marketing Corporation. | | | | | | | | |
| Audit-Related Fees. | | $ | 3,508,505 | | | $ | 3,295,934 | |
| Tax Fees. | | $ | 2,017,364 | | | $ | 1,678,928 | |
| All Other Fees. | | $ | 268,000 | | | $ | 25,000 | |
| Total. | | $ | 5,793,869 | | | $ | 4,999,862 | |
| (h) | For the most recent fiscal year, the Audit Committee has determined that the provision of all non-audit services was consistent with maintaining the principal accountant’s independence. |
Item 5: Audit Committee of Listed Registrants.
The Registrant is a listed issuer as defined in rule 10A-3 under the Securities Exchange Act of 1934 (“Exchange Act”). The Registrant has a separately-designated standing audit committee established in accordance with Section 3(a)(58)(A) of the Exchange Act. The Registrant’s audit committee members are: F. Joseph Loughrey, Mark Loughridge, Sarah Bloom Raskin, and Peter F. Volanakis.
Item 6: Investments.
Not applicable. The complete schedule of investments is included in the financial statements filed under Item 7 of this Form.
Item 7: Financial Statements and Financial Highlights for Open-End Management Investment Companies.
Financial Statements
For the year ended September 30, 2024
Vanguard PRIMECAP Fund
Contents
Financial Statements
| 1 |
Report of Independent Registered Public Accounting Firm
| 14 |
Tax information
| 15 |
| | |
Schedule of Investments
As of September 30, 2024
The fund files its complete schedule of portfolio holdings with the Securities and Exchange Commission (SEC) for the first and third quarters of each fiscal year as an exhibit to its reports on Form N-PORT. The fund’s Form N-PORT reports are available on the SEC’s website at www.sec.gov.
| | | Shares | Market
Value•
($000) |
| Common Stocks (98.1%) |
| Communication Services (5.7%) |
| | Alphabet Inc. Class A | 11,031,240 | 1,829,531 |
| | Alphabet Inc. Class C | 6,336,720 | 1,059,436 |
| * | Baidu Inc. ADR | 6,943,141 | 731,043 |
| | Walt Disney Co. | 4,597,005 | 442,186 |
| | Meta Platforms Inc. Class A | 259,750 | 148,691 |
| | T-Mobile US Inc. | 337,800 | 69,709 |
| * | Charter Communications Inc. Class A | 193,600 | 62,742 |
| * | Live Nation Entertainment Inc. | 499,000 | 54,636 |
| * | Netflix Inc. | 75,100 | 53,266 |
| | Universal Music Group NV | 807,908 | 21,136 |
| * | Altice USA Inc. Class A | 4,710,800 | 11,589 |
| | Comcast Corp. Class A | 51,000 | 2,130 |
| | Nintendo Co. Ltd. | 17,500 | 935 |
| | | | 4,487,030 |
| Consumer Discretionary (10.5%) |
| * | Tesla Inc. | 5,679,300 | 1,485,875 |
| | Alibaba Group Holding Ltd. ADR | 12,169,717 | 1,291,450 |
| 1 | Sony Group Corp. ADR | 12,915,400 | 1,247,240 |
| | Ross Stores Inc. | 7,590,900 | 1,142,506 |
| | TJX Cos. Inc. | 7,553,500 | 887,838 |
| * | Amazon.com Inc. | 3,063,500 | 570,822 |
| *,2 | Mattel Inc. | 25,160,838 | 479,314 |
| 2 | Whirlpool Corp. | 3,137,832 | 335,748 |
| | Royal Caribbean Cruises Ltd. | 1,858,947 | 329,703 |
| | Bath & Body Works Inc. | 3,480,714 | 111,104 |
| | eBay Inc. | 1,189,000 | 77,416 |
| * | Burlington Stores Inc. | 217,700 | 57,360 |
| * | Flutter Entertainment plc | 210,942 | 49,603 |
| | Newell Brands Inc. | 4,991,000 | 38,331 |
| * | Carnival Corp. | 2,054,065 | 37,959 |
| * | Victoria's Secret & Co. | 1,164,071 | 29,917 |
| | Marriott International Inc. Class A | 97,000 | 24,114 |
| * | MGM Resorts International | 540,000 | 21,109 |
| * | Ulta Beauty Inc. | 21,000 | 8,172 |
| | | | 8,225,581 |
| Consumer Staples (0.5%) |
| | Sysco Corp. | 3,383,501 | 264,116 |
| * | Dollar Tree Inc. | 1,430,614 | 100,601 |
| | Altria Group Inc. | 572,600 | 29,225 |
| | Dollar General Corp. | 77,000 | 6,512 |
| | Tyson Foods Inc. Class A | 100,000 | 5,956 |
| 1 | Haleon plc ADR | 548,000 | 5,798 |
| | | | 412,208 |
| Energy (2.1%) |
| | Hess Corp. | 4,771,700 | 647,997 |
| | Exxon Mobil Corp. | 3,714,527 | 435,417 |
| | ConocoPhillips | 2,265,600 | 238,522 |
| | EOG Resources Inc. | 1,605,300 | 197,340 |
| * | Transocean Ltd. (XNYS) | 17,429,773 | 74,077 |
| | Schlumberger NV | 706,400 | 29,633 |
| | | | 1,622,986 |
| Financials (6.7%) |
| | Wells Fargo & Co. | 21,831,417 | 1,233,257 |
| | JPMorgan Chase & Co. | 3,653,400 | 770,356 |
| | Visa Inc. Class A | 2,331,400 | 641,019 |
| | Marsh & McLennan Cos. Inc. | 2,610,516 | 582,380 |
| | Raymond James Financial Inc. | 4,306,903 | 527,423 |
| | Bank of America Corp. | 6,907,832 | 274,103 |
| | | Shares | Market
Value•
($000) |
| * | PayPal Holdings Inc. | 3,003,956 | 234,399 |
| | Progressive Corp. | 833,000 | 211,382 |
| | Northern Trust Corp. | 2,094,900 | 188,604 |
| | Mastercard Inc. Class A | 308,300 | 152,239 |
| | CME Group Inc. | 629,768 | 138,958 |
| | Citigroup Inc. | 1,795,000 | 112,367 |
| | Fidelity National Information Services Inc. | 1,066,500 | 89,319 |
| | Charles Schwab Corp. | 687,414 | 44,551 |
| | Goldman Sachs Group Inc. | 51,700 | 25,597 |
| | Morgan Stanley | 205,000 | 21,369 |
| | | | 5,247,323 |
| Health Care (30.4%) |
| | Eli Lilly & Co. | 10,656,328 | 9,440,867 |
| | Amgen Inc. | 8,987,985 | 2,896,019 |
| * | Boston Scientific Corp. | 25,696,344 | 2,153,354 |
| | AstraZeneca plc ADR | 25,729,688 | 2,004,600 |
| *,2 | Biogen Inc. | 9,179,801 | 1,779,413 |
| | Thermo Fisher Scientific Inc. | 1,554,547 | 961,596 |
| | Novartis AG ADR | 7,783,525 | 895,261 |
| | Bristol-Myers Squibb Co. | 12,726,086 | 658,448 |
| * | BioMarin Pharmaceutical Inc. | 7,270,808 | 511,065 |
| * | BeiGene Ltd. ADR | 2,200,190 | 493,965 |
| | GSK plc ADR | 10,357,490 | 423,414 |
| | Roche Holding AG | 985,345 | 315,327 |
| * | Elanco Animal Health Inc. (XNYS) | 19,016,439 | 279,351 |
| | Zimmer Biomet Holdings Inc. | 2,204,500 | 237,976 |
| | CVS Health Corp. | 2,145,500 | 134,909 |
| | Stryker Corp. | 343,400 | 124,057 |
| | Agilent Technologies Inc. | 732,516 | 108,764 |
| | Abbott Laboratories | 660,000 | 75,247 |
| | UnitedHealth Group Inc. | 94,615 | 55,319 |
| | Sanofi SA ADR | 893,000 | 51,463 |
| | Medtronic plc | 570,000 | 51,317 |
| * | IQVIA Holdings Inc. | 213,584 | 50,613 |
| 3 | Siemens Healthineers AG | 721,300 | 43,322 |
| | Alcon Inc. | 431,300 | 43,160 |
| * | Edwards Lifesciences Corp. | 492,100 | 32,474 |
| | Sandoz Group AG | 364,572 | 15,193 |
| * | Waters Corp. | 33,680 | 12,121 |
| | Danaher Corp. | 12,402 | 3,448 |
| | Humana Inc. | 10,076 | 3,191 |
| * | Zimvie Inc. | 27,100 | 430 |
| | | | 23,855,684 |
| Industrials (12.6%) |
| | FedEx Corp. | 8,522,158 | 2,332,344 |
| | Siemens AG (Registered) | 7,802,676 | 1,578,543 |
| | Southwest Airlines Co. | 25,401,478 | 752,646 |
| * | United Airlines Holdings Inc. | 12,148,403 | 693,188 |
| | Delta Air Lines Inc. | 11,321,900 | 575,039 |
| | Airbus SE | 3,517,566 | 514,818 |
| | Caterpillar Inc. | 1,224,400 | 478,887 |
| | TransDigm Group Inc. | 309,316 | 441,434 |
| | Union Pacific Corp. | 1,327,800 | 327,276 |
| | Textron Inc. | 3,601,000 | 318,977 |
| *,1 | American Airlines Group Inc. | 26,384,413 | 296,561 |
| | United Parcel Service Inc. Class B (XNYS) | 1,928,970 | 262,996 |
| | Otis Worldwide Corp. | 1,517,260 | 157,704 |
| | General Dynamics Corp. | 511,300 | 154,515 |
| * | Alaska Air Group Inc. | 3,280,700 | 148,320 |
| | Carrier Global Corp. | 1,670,200 | 134,434 |
| | JB Hunt Transport Services Inc. | 515,900 | 88,905 |
| | Norfolk Southern Corp. | 310,800 | 77,234 |
| | CSX Corp. | 1,988,800 | 68,673 |
| | nVent Electric plc | 859,000 | 60,353 |
| | Honeywell International Inc. | 221,000 | 45,683 |
| | RTX Corp. | 376,870 | 45,662 |
| | L3Harris Technologies Inc. | 189,000 | 44,957 |
| | Rockwell Automation Inc. | 165,500 | 44,430 |
| * | Boeing Co. | 271,300 | 41,248 |
| | | Shares | Market
Value•
($000) |
| * | Lyft Inc. Class A | 3,209,900 | 40,926 |
| | Deere & Co. | 73,700 | 30,757 |
| | AMETEK Inc. | 170,200 | 29,225 |
| | Ryanair Holdings plc ADR | 625,000 | 28,238 |
| * | WillScot Holdings Corp. | 722,300 | 27,159 |
| * | Uber Technologies Inc. | 121,150 | 9,106 |
| | | | 9,850,238 |
| Information Technology (28.4%) |
| | Microsoft Corp. | 6,072,600 | 2,613,040 |
| | KLA Corp. | 3,277,680 | 2,538,268 |
| | Micron Technology Inc. | 23,745,774 | 2,462,674 |
| | Texas Instruments Inc. | 10,527,272 | 2,174,619 |
| * | Adobe Inc. | 4,198,957 | 2,174,136 |
| | NVIDIA Corp. | 14,418,000 | 1,750,922 |
| | Oracle Corp. | 8,807,770 | 1,500,844 |
| | Intel Corp. | 47,355,148 | 1,110,952 |
| | NetApp Inc. | 8,028,602 | 991,613 |
| | Intuit Inc. | 1,135,000 | 704,835 |
| | Analog Devices Inc. | 2,490,000 | 573,123 |
| | HP Inc. | 13,725,716 | 492,341 |
| | QUALCOMM Inc. | 2,728,806 | 464,033 |
| | Apple Inc. | 1,810,000 | 421,730 |
| | Hewlett Packard Enterprise Co. | 17,166,842 | 351,234 |
| | Telefonaktiebolaget LM Ericsson ADR | 33,116,269 | 251,021 |
| | Cisco Systems Inc. | 4,371,279 | 232,639 |
| | Entegris Inc. | 1,835,622 | 206,562 |
| | Applied Materials Inc. | 947,300 | 191,402 |
| | Corning Inc. | 3,913,600 | 176,699 |
| * | Autodesk Inc. | 489,200 | 134,765 |
| | Teradyne Inc. | 857,900 | 114,898 |
| * | Palo Alto Networks Inc. | 315,600 | 107,872 |
| | Broadcom Inc. | 435,930 | 75,198 |
| | Marvell Technology Inc. | 927,500 | 66,891 |
| | Salesforce Inc. | 198,300 | 54,277 |
| * | Western Digital Corp. | 700,000 | 47,803 |
| * | Gartner Inc. | 70,100 | 35,524 |
| * | Okta Inc. | 464,500 | 34,531 |
| | Infineon Technologies AG | 943,116 | 33,111 |
| | Dell Technologies Inc. Class C | 273,900 | 32,468 |
| * | Keysight Technologies Inc. | 179,500 | 28,528 |
| *,1 | BlackBerry Ltd. | 9,975,500 | 26,136 |
| | Jabil Inc. | 213,000 | 25,524 |
| * | Unity Software Inc. | 290,000 | 6,560 |
| * | Fortinet Inc. | 69,450 | 5,386 |
| * | Arista Networks Inc. | 4,000 | 1,535 |
| * | Nice Ltd. ADR | 2,250 | 391 |
| * | RingCentral Inc. Class A | 8,000 | 253 |
| | | | 22,214,338 |
| Materials (1.2%) |
| | Glencore plc | 40,673,825 | 232,925 |
| | Albemarle Corp. | 2,174,794 | 205,975 |
| | DuPont de Nemours Inc. | 1,969,556 | 175,507 |
| | Linde plc | 245,300 | 116,974 |
| | Freeport-McMoRan Inc. | 2,261,900 | 112,914 |
| | Dow Inc. | 1,233,817 | 67,403 |
| | Corteva Inc. | 1,099,216 | 64,623 |
| | | | 976,321 |
| Total Common Stocks (Cost $24,749,764) | 76,891,709 |
| | | Shares | Market
Value•
($000) |
| Temporary Cash Investments (2.0%) |
| Money Market Fund (2.0%) |
| 4,5 | Vanguard Market Liquidity Fund, 5.014% (Cost $1,541,649) | 15,420,203 | 1,542,020 |
| Total Investments (100.1%) (Cost $26,291,413) | 78,433,729 |
| Other Assets and Liabilities—Net (-0.1%) | (100,021) |
| Net Assets (100%) | 78,333,708 |
| Cost is in $000. |
| • | See Note A in Notes to Financial Statements. |
| * | Non-income-producing security. |
| 1 | Includes partial security positions on loan to broker-dealers. The total value of securities on loan is $121,678,000. |
| 2 | Considered an affiliated company of the fund as the fund owns more than 5% of the outstanding voting securities of such company. |
| 3 | Security exempt from registration under Rule 144A of the Securities Act of 1933. Such securities may be sold in transactions exempt from registration, normally to qualified institutional buyers. At September 30, 2024, the aggregate value was $43,322,000, representing 0.1% of net assets. |
| 4 | Affiliated money market fund available only to Vanguard funds and certain trusts and accounts managed by Vanguard. Rate shown is the 7-day yield. |
| 5 | Collateral of $125,176,000 was received for securities on loan. |
| | ADR—American Depositary Receipt. |
See accompanying Notes, which are an integral part of the Financial Statements.
Statement of Assets and Liabilities
|
| ($000s, except shares, footnotes, and per-share amounts) | Amount |
| Assets | |
| Investments in Securities, at Value1 | |
| Unaffiliated Issuers (Cost $23,532,414) | 74,297,234 |
| Affiliated Issuers (Cost $2,758,999) | 4,136,495 |
| Total Investments in Securities | 78,433,729 |
| Investment in Vanguard | 2,183 |
| Cash | 106,489 |
| Foreign Currency, at Value (Cost $5) | 5 |
| Receivables for Investment Securities Sold | 843 |
| Receivables for Accrued Income | 82,640 |
| Receivables for Capital Shares Issued | 9,483 |
| Total Assets | 78,635,372 |
| Liabilities | |
| Payables for Investment Securities Purchased | 114,044 |
| Collateral for Securities on Loan | 125,176 |
| Payables to Investment Advisor | 34,225 |
| Payables for Capital Shares Redeemed | 23,334 |
| Payables to Vanguard | 4,885 |
| Total Liabilities | 301,664 |
| Net Assets | 78,333,708 |
| 1 Includes $121,678,000 of securities on loan. | |
| At September 30, 2024, net assets consisted of: | |
| | |
| Paid-in Capital | 21,675,125 |
| Total Distributable Earnings (Loss) | 56,658,583 |
| Net Assets | 78,333,708 |
| |
| Investor Shares—Net Assets | |
Applicable to 28,983,812 outstanding $.001 par value shares of
beneficial interest (unlimited authorization) | 5,075,891 |
| Net Asset Value Per Share—Investor Shares | $175.13 |
| |
| Admiral™ Shares—Net Assets | |
Applicable to 403,673,027 outstanding $.001 par value shares of
beneficial interest (unlimited authorization) | 73,257,817 |
| Net Asset Value Per Share—Admiral Shares | $181.48 |
See accompanying Notes, which are an integral part of the Financial Statements.
|
| | Year Ended
September 30, 2024 |
| | ($000) |
| Investment Income | |
| Income | |
| Dividends—Unaffiliated Issuers1 | 914,904 |
| Dividends—Affiliated Issuers | 21,634 |
| Interest—Unaffiliated Issuers | 8 |
| Interest—Affiliated Issuers | 61,469 |
| Securities Lending—Net | 127 |
| Total Income | 998,142 |
| Expenses | |
| Investment Advisory Fees—Note B | 130,465 |
| The Vanguard Group—Note C | |
| Management and Administrative—Investor Shares | 9,653 |
| Management and Administrative—Admiral Shares | 84,678 |
| Marketing and Distribution—Investor Shares | 202 |
| Marketing and Distribution—Admiral Shares | 1,975 |
| Custodian Fees | 1,697 |
| Auditing Fees | 32 |
| Shareholders’ Reports and Proxy Fees—Investor Shares | 70 |
| Shareholders’ Reports and Proxy Fees—Admiral Shares | 205 |
| Trustees’ Fees and Expenses | 48 |
| Other Expenses | 221 |
| Total Expenses | 229,246 |
| Expenses Paid Indirectly | (68) |
| Net Expenses | 229,178 |
| Net Investment Income | 768,964 |
| Realized Net Gain (Loss) | |
| Capital Gains Distributions Received – Affiliated Issuers | 6 |
| Investment Securities Sold—Unaffiliated Issuers | 4,403,535 |
| Investment Securities Sold—Affiliated Issuers | (6,965) |
| Foreign Currencies | 134 |
| Realized Net Gain (Loss) | 4,396,710 |
| Change in Unrealized Appreciation (Depreciation) | |
| Investment Securities—Unaffiliated Issuers | 13,137,346 |
| Investment Securities—Affiliated Issuers | (729,009) |
| Foreign Currencies | 1,126 |
| Change in Unrealized Appreciation (Depreciation) | 12,409,463 |
| Net Increase (Decrease) in Net Assets Resulting from Operations | 17,575,137 |
| 1 | Dividends are net of foreign withholding taxes of $14,402,000. |
See accompanying Notes, which are an integral part of the Financial Statements.
Statement of Changes in Net Assets
|
| | Year Ended September 30, |
| | 2024
($000) | 2023
($000) |
| Increase (Decrease) in Net Assets | | |
| Operations | | |
| Net Investment Income | 768,964 | 784,990 |
| Realized Net Gain (Loss) | 4,396,710 | 4,158,837 |
| Change in Unrealized Appreciation (Depreciation) | 12,409,463 | 10,273,895 |
| Net Increase (Decrease) in Net Assets Resulting from Operations | 17,575,137 | 15,217,722 |
| Distributions | | |
| Investor Shares | (342,044) | (408,794) |
| Admiral Shares | (4,449,800) | (5,062,138) |
| Total Distributions | (4,791,844) | (5,470,932) |
| Capital Share Transactions | | |
| Investor Shares | (571,119) | (215,027) |
| Admiral Shares | 862,243 | (113,439) |
| Net Increase (Decrease) from Capital Share Transactions | 291,124 | (328,466) |
| Total Increase (Decrease) | 13,074,417 | 9,418,324 |
| Net Assets | | |
| Beginning of Period | 65,259,291 | 55,840,967 |
| End of Period | 78,333,708 | 65,259,291 |
See accompanying Notes, which are an integral part of the Financial Statements.
| Investor Shares | | | | | |
For a Share Outstanding
Throughout Each Period | Year Ended September 30, |
| 2024 | 2023 | 2022 | 2021 | 2020 |
| Net Asset Value, Beginning of Period | $147.17 | $126.26 | $168.72 | $142.86 | $133.12 |
| Investment Operations | | | | | |
| Net Investment Income1 | 1.591 | 1.632 | 1.456 | 1.183 | 1.745 |
| Net Realized and Unrealized Gain (Loss) on Investments | 37.177 | 31.717 | (27.430) | 39.134 | 17.947 |
| Total from Investment Operations | 38.768 | 33.349 | (25.974) | 40.317 | 19.692 |
| Distributions | | | | | |
| Dividends from Net Investment Income | (1.659) | (1.549) | (1.150) | (1.542) | (1.690) |
| Distributions from Realized Capital Gains | (9.149) | (10.890) | (15.336) | (12.915) | (8.262) |
| Total Distributions | (10.808) | (12.439) | (16.486) | (14.457) | (9.952) |
| Net Asset Value, End of Period | $175.13 | $147.17 | $126.26 | $168.72 | $142.86 |
| Total Return2 | 27.57% | 28.06% | -17.25% | 29.74% | 15.05% |
| Ratios/Supplemental Data | | | | | |
| Net Assets, End of Period (Millions) | $5,076 | $4,762 | $4,243 | $5,878 | $5,697 |
| Ratio of Total Expenses to Average Net Assets | 0.38%3 | 0.38%3 | 0.38%3 | 0.38% | 0.38% |
| Ratio of Net Investment Income to Average Net Assets | 0.99% | 1.17% | 0.95% | 0.73% | 1.31% |
| Portfolio Turnover Rate | 4% | 4% | 3% | 5% | 6% |
| 1 | Calculated based on average shares outstanding. |
| 2 | Total returns do not include account service fees that may have applied in the periods shown. Fund prospectuses provide information about any applicable account service fees. |
| 3 | The ratio of expenses to average net assets for the period net of reduction from custody fee offset arrangements was 0.38%. |
See accompanying Notes, which are an integral part of the Financial Statements.
| Admiral Shares | | | | | |
For a Share Outstanding
Throughout Each Period | Year Ended September 30, |
| 2024 | 2023 | 2022 | 2021 | 2020 |
| Net Asset Value, Beginning of Period | $152.51 | $130.87 | $174.92 | $148.12 | $138.02 |
| Investment Operations | | | | | |
| Net Investment Income1 | 1.762 | 1.793 | 1.621 | 1.345 | 1.920 |
| Net Realized and Unrealized Gain (Loss) on Investments | 38.521 | 32.854 | (28.426) | 40.564 | 18.600 |
| Total from Investment Operations | 40.283 | 34.647 | (26.805) | 41.909 | 20.520 |
| Distributions | | | | | |
| Dividends from Net Investment Income | (1.830) | (1.718) | (1.343) | (1.716) | (1.853) |
| Distributions from Realized Capital Gains | (9.483) | (11.289) | (15.902) | (13.393) | (8.567) |
| Total Distributions | (11.313) | (13.007) | (17.245) | (15.109) | (10.420) |
| Net Asset Value, End of Period | $181.48 | $152.51 | $130.87 | $174.92 | $148.12 |
| Total Return2 | 27.66% | 28.14% | -17.19% | 29.83% | 15.13% |
| Ratios/Supplemental Data | | | | | |
| Net Assets, End of Period (Millions) | $73,258 | $60,497 | $51,598 | $68,059 | $58,626 |
| Ratio of Total Expenses to Average Net Assets | 0.31%3 | 0.31%3 | 0.31%3 | 0.31% | 0.31% |
| Ratio of Net Investment Income to Average Net Assets | 1.06% | 1.24% | 1.02% | 0.80% | 1.39% |
| Portfolio Turnover Rate | 4% | 4% | 3% | 5% | 6% |
| 1 | Calculated based on average shares outstanding. |
| 2 | Total returns do not include account service fees that may have applied in the periods shown. Fund prospectuses provide information about any applicable account service fees. |
| 3 | The ratio of expenses to average net assets for the period net of reduction from custody fee offset arrangements was 0.31%. |
See accompanying Notes, which are an integral part of the Financial Statements.
Notes to Financial Statements
Vanguard PRIMECAP Fund is registered under the Investment Company Act of 1940 as an open-end investment company, or mutual fund. The fund offers two classes of shares: Investor Shares and Admiral Shares. Each of the share classes has different eligibility and minimum purchase requirements, and is designed for different types of investors.
| A. | The following significant accounting policies conform to generally accepted accounting principles for U.S. investment companies. The fund consistently follows such policies in preparing its financial statements. |
1. Security Valuation: Securities are valued as of the close of trading on the New York Stock Exchange (generally 4 p.m., Eastern time) on the valuation date. Equity securities are valued at the latest quoted sales prices or official closing prices taken from the primary market in which each security trades; such securities not traded on the valuation date are valued at the mean of the latest quoted bid and asked prices. Securities for which market quotations are not readily available, or whose values have been affected by events occurring before the fund’s pricing time but after the close of the securities’ primary markets, are valued by methods deemed by the valuation designee to represent fair value and subject to oversight by the board of trustees. These procedures include obtaining quotations from an independent pricing service, monitoring news to identify significant market- or security-specific events, and evaluating changes in the values of foreign market proxies (for example, ADRs, futures contracts, or exchange-traded funds), between the time the foreign markets close and the fund’s pricing time. When fair-value pricing is employed, the prices of securities used by a fund to calculate its net asset value may differ from quoted or published prices for the same securities. Investments in Vanguard Market Liquidity Fund are valued at that fund's net asset value.
2. Foreign Currency: Securities and other assets and liabilities denominated in foreign currencies are translated into U.S. dollars using exchange rates obtained from an independent third party as of the fund’s pricing time on the valuation date. Realized gains (losses) and unrealized appreciation (depreciation) on investment securities include the effects of changes in exchange rates since the securities were purchased, combined with the effects of changes in security prices. Fluctuations in the value of other assets and liabilities resulting from changes in exchange rates are recorded as unrealized foreign currency gains (losses) until the assets or liabilities are settled in cash, at which time they are recorded as realized foreign currency gains (losses).
3. Federal Income Taxes: The fund intends to continue to qualify as a regulated investment company and distribute virtually all of its taxable income. The fund’s tax returns are open to examination by the relevant tax authorities until expiration of the applicable statute of limitations, which is generally three years after the filing of the tax return. Management has analyzed the fund’s tax positions taken for all open federal and state income tax years, and has concluded that no provision for income tax is required in the fund’s financial statements.
4. Distributions: Distributions to shareholders are recorded on the ex-dividend date. Distributions are determined on a tax basis at the fiscal year-end and may differ from net investment income and realized capital gains for financial reporting purposes.
5. Securities Lending: To earn additional income, the fund lends its securities to qualified institutional borrowers. Security loans are subject to termination by the fund at any time, and are required to be secured at all times by collateral in an amount at least equal to the market value of securities loaned. Daily market fluctuations could cause the value of loaned securities to be more or less than the value of the collateral received. When this occurs, the collateral is adjusted and settled before the opening of the market on the next business day. The fund further mitigates its counterparty risk by entering into securities lending transactions only with a diverse group of prequalified counterparties, monitoring their financial strength, and entering into master securities lending agreements with its counterparties. The master securities lending agreements provide that, in the event of a counterparty’s default (including bankruptcy), the fund may terminate any loans with that borrower, determine the net amount owed, and sell or retain the collateral up to the net amount owed to the fund; however, such actions may be subject to legal proceedings. While collateral mitigates counterparty risk, in the event of a default, the fund may experience delays and costs in recovering the securities loaned. The fund invests cash collateral received in Vanguard Market Liquidity Fund, and records a liability in the Statement of Assets and Liabilities for the return of the collateral, during the period the securities are on loan. Collateral investments in Vanguard Market Liquidity Fund are subject to market appreciation or depreciation. Securities lending income represents fees charged to borrowers plus income earned on invested cash collateral, less expenses associated with the loan. During the term of the loan, the fund is entitled to all distributions made on or in respect of the loaned securities.
6. Credit Facilities and Interfund Lending Program: The fund and certain other funds managed by The Vanguard Group ("Vanguard") participate in a $4.3 billion committed credit facility provided by a syndicate of lenders pursuant to a credit agreement and an uncommitted credit facility provided by Vanguard. Both facilities may be renewed annually. Each fund is individually liable for its borrowings, if any, under the credit facilities. Borrowings may be utilized for temporary or emergency purposes and are subject to the fund’s regulatory and contractual borrowing restrictions. With respect to the committed credit facility, the participating funds are charged administrative fees and an annual commitment fee of 0.10% of the undrawn committed amount of the facility, which are allocated to the funds based on a method approved by the fund’s board of trustees and included in Management and Administrative expenses on the fund’s Statement of Operations. Any borrowings under either facility bear interest at an agreed-upon spread plus the higher of the federal funds effective rate, the overnight bank funding rate, or the Daily Simple Secured Overnight Financing Rate inclusive of an additional agreed-upon spread. However, borrowings under the uncommitted credit facility may bear interest based upon an alternate rate agreed to by the fund and Vanguard.
In accordance with an exemptive order (the “Order”) from the SEC, the fund may participate in a joint lending and borrowing program that allows registered open-end Vanguard funds to borrow money from and lend money to each other for temporary or emergency purposes (the “Interfund Lending Program”), subject to compliance with the terms and conditions of the Order, and to the extent permitted by the fund’s investment objective and investment policies. Interfund loans and borrowings normally extend overnight but can have a maximum duration of seven days. Loans may be called on one business day’s notice. The interest rate to be charged is governed by the conditions of the Order and internal procedures adopted by the board of trustees. The board of trustees is responsible for overseeing the Interfund Lending Program.
For the year ended September 30, 2024, the fund did not utilize the credit facilities or the Interfund Lending Program.
7. Other: Dividend income is recorded on the ex-dividend date. Non-cash dividends included in income, if any, are recorded at the fair value of the securities received. Interest income includes income distributions received from Vanguard Market Liquidity Fund and is accrued daily. Security transactions are accounted for on the date securities are bought or sold. Costs used to determine realized gains (losses) on the sale of investment securities are those of the specific securities sold.
Taxes on foreign dividends and capital gains have been provided for in accordance with the applicable countries' tax rules and rates. Deferred foreign capital gains tax, if any, is accrued daily based upon net unrealized gains. The fund has filed tax reclaims for previously withheld taxes on dividends earned in certain European Union countries. These filings are subject to various administrative and judicial proceedings within these countries. Amounts related to these reclaims are recorded when there are no significant uncertainties as to the ultimate resolution of proceedings, the likelihood of receipt of these reclaims, and the potential timing of payment. Such tax reclaims and related professional fees, if any, are included in dividend income and other expenses, respectively.
Each class of shares has equal rights as to assets and earnings, except that each class separately bears certain class-specific expenses related to maintenance of shareholder accounts (included in Management and Administrative expenses), shareholder reporting, and proxy fees. Marketing and distribution expenses are allocated to each class of shares based on a method approved by the board of trustees. Income, other non-class-specific expenses, and gains and losses on investments are allocated to each class of shares based on its relative net assets.
| B. | PRIMECAP Management Company provides investment advisory services to the fund for a fee calculated at an annual percentage rate of average net assets. For the year ended September 30, 2024, the investment advisory fee represented an effective annual basic rate of 0.18% of the fund’s average net assets. |
| C. | In accordance with the terms of a Funds' Service Agreement (the “FSA”) between Vanguard and the fund, Vanguard furnishes to the fund corporate management, administrative, marketing, and distribution services at Vanguard’s cost of operations (as defined by the FSA). These costs of operations are allocated to the fund based on methods and guidelines approved by the board of trustees and are generally settled twice a month. |
Upon the request of Vanguard, the fund may invest up to 0.40% of its net assets as capital in Vanguard. At September 30, 2024, the fund had contributed to Vanguard capital in the amount of $2,183,000, representing less than 0.01% of the fund’s net assets and 0.87% of Vanguard’s capital received pursuant to the FSA. The fund’s trustees and officers are also directors and employees, respectively, of Vanguard.
| D. | The fund’s custodian bank has agreed to reduce its fees when the fund maintains cash on deposit in the non-interest-bearing custody account. For the year ended September 30, 2024, custodian fee offset arrangements reduced the fund’s expenses by $68,000 (an annual rate of less than 0.01% of average net assets). |
| E. | Various inputs may be used to determine the value of the fund’s investments. These inputs are summarized in three broad levels for financial statement purposes. The inputs or methodologies used to value securities are not necessarily an indication of the risk associated with investing in those securities. |
Level 1—Quoted prices in active markets for identical securities.
Level 2—Other significant observable inputs (including quoted prices for similar securities, interest rates, prepayment speeds, credit risk, etc.).
Level 3—Significant unobservable inputs (including the fund’s own assumptions used to determine the fair value of investments). Any investments valued with significant unobservable inputs are noted on the Schedule of Investments.
The following table summarizes the market value of the fund’s investments as of September 30, 2024, based on the inputs used to value them:
| | Level 1
($000) | Level 2
($000) | Level 3
($000) | Total
($000) |
| Investments | | | | |
| Assets | | | | |
| Common Stocks | 74,086,796 | 2,804,913 | — | 76,891,709 |
| Temporary Cash Investments | 1,542,020 | — | — | 1,542,020 |
| Total | 75,628,816 | 2,804,913 | — | 78,433,729 |
| F. | Permanent differences between book-basis and tax-basis components of net assets are reclassified among capital accounts in the financial statements to reflect their tax character. These reclassifications have no effect on net assets or net asset value per share. As of period end, permanent differences primarily attributable to the accounting for foreign currency transactions and distributions in connection with fund share redemptions were reclassified between the following accounts: |
| | Amount
($000) |
| Paid-in Capital | 156,634 |
| Total Distributable Earnings (Loss) | (156,634) |
Temporary differences between book-basis and tax-basis components of total distributable earnings (loss) arise when certain items of income, gain, or loss are recognized in different periods for financial statement and tax purposes; these differences will reverse at some time in the future. The
differences are primarily related to the deferral of losses from wash sales. As of period end, the tax-basis components of total distributable earnings (loss) are detailed in the table as follows:
| | Amount
($000) |
| Undistributed Ordinary Income | 603,701 |
| Undistributed Long-Term Gains | 3,949,253 |
| Net Unrealized Gains (Losses) | 52,105,629 |
| Capital Loss Carryforwards | — |
| Qualified Late-Year Losses | — |
| Other Temporary Differences | — |
| Total | 56,658,583 |
The tax character of distributions paid was as follows:
| | Year Ended September 30, |
| | 2024
Amount
($000) | 2023
Amount
($000) |
| Ordinary Income* | 796,382 | 721,198 |
| Long-Term Capital Gains | 3,995,462 | 4,749,734 |
| Total | 4,791,844 | 5,470,932 |
| * | Includes short-term capital gains, if any. |
As of September 30, 2024, gross unrealized appreciation and depreciation for investments based on cost for U.S. federal income tax purposes were as follows:
| | Amount
($000) |
| Tax Cost | 26,329,217 |
| Gross Unrealized Appreciation | 55,015,229 |
| Gross Unrealized Depreciation | (2,910,717) |
| Net Unrealized Appreciation (Depreciation) | 52,104,512 |
| G. | During the year ended September 30, 2024, the fund purchased $2,720,745,000 of investment securities and sold $6,810,450,000 of investment securities, other than temporary cash investments. |
| H. | Capital share transactions for each class of shares were: |
| | Year Ended September 30, |
| | 2024 | | 2023 |
| | Amount
($000) | Shares
(000) | | Amount
($000) | Shares
(000) |
| Investor Shares | | | | | |
| Issued | 374,366 | 2,347 | | 205,544 | 1,472 |
| Issued in Lieu of Cash Distributions | 324,042 | 2,159 | | 388,807 | 3,083 |
| Redeemed | (1,269,527) | (7,883) | | (809,378) | (5,800) |
| Net Increase (Decrease)—Investor Shares | (571,119) | (3,377) | | (215,027) | (1,245) |
| Admiral Shares | | | | | |
| Issued | 2,201,007 | 13,110 | | 1,725,734 | 12,228 |
| Issued in Lieu of Cash Distributions | 4,151,273 | 26,707 | | 4,730,931 | 36,219 |
| Redeemed | (5,490,037) | (32,813) | | (6,570,104) | (46,041) |
| Net Increase (Decrease)—Admiral Shares | 862,243 | 7,004 | | (113,439) | 2,406 |
| I. | Certain of the fund’s investments are in companies that are considered to be affiliated companies of the fund because the fund owns more than 5% of the outstanding voting securities of the company or the issuer is another member of The Vanguard Group. Transactions during the period in securities of these companies were as follows: |
| | | Current Period Transactions | |
| | Sep. 30,
2023
Market
Value
($000) | Purchases
at Cost
($000) | Proceeds
from
Securities
Sold
($000) | Realized
Net
Gain
(Loss)
($000) | Change in
Unrealized
App. (Dep.)
($000) | Income
($000) | Capital Gain
Distributions
Received
($000) | Sep. 30,
2024
Market
Value
($000) |
| Biogen Inc. | 2,317,349 | 48,269 | 9,911 | (2,792) | (573,502) | — | — | 1,779,413 |
| Mattel Inc. | 582,822 | — | 23,669 | (4,273) | (75,566) | — | — | 479,314 |
| Vanguard Market Liquidity Fund | 1,211,327 | NA1 | NA1 | 100 | 103 | 61,469 | 6 | 1,542,020 |
| Whirlpool Corp. | 402,147 | 13,645 | — | — | (80,044) | 21,634 | — | 335,748 |
| Total | 4,513,645 | 61,914 | 33,580 | (6,965) | (729,009) | 83,103 | 6 | 4,136,495 |
| 1 | Not applicable—purchases and sales are for temporary cash investment purposes. |
| J. | Significant market disruptions, such as those caused by pandemics, natural or environmental disasters, war, acts of terrorism, or other events, can adversely affect local and global markets and normal market operations. Any such disruptions could have an adverse impact on the value of the fund’s investments and fund performance. |
To the extent the fund’s investment portfolio reflects concentration in a particular market, industry, sector, country or asset class, the fund may be adversely affected by the performance of these concentrations and may be subject to increased price volatility and other risks.
| K. | Management has determined that no events or transactions occurred subsequent to September 30, 2024, that would require recognition or disclosure in these financial statements. |
Report of Independent Registered
Public Accounting Firm
To the Board of Trustees of Vanguard Chester Funds and Shareholders of Vanguard PRIMECAP Fund
Opinion on the Financial Statements
We have audited the accompanying statement of assets and liabilities, including the schedule of investments, of Vanguard PRIMECAP Fund (one of the funds constituting Vanguard Chester Funds, referred to hereafter as the "Fund") as of September 30, 2024, the related statement of operations for the year ended September 30, 2024, the statement of changes in net assets for each of the two years in the period ended September 30, 2024, including the related notes, and the financial highlights for each of the five years in the period ended September 30, 2024 (collectively referred to as the "financial statements"). In our opinion, the financial statements present fairly, in all material respects, the financial position of the Fund as of September 30, 2024, the results of its operations for the year then ended, the changes in its net assets for each of the two years in the period ended September 30, 2024 and the financial highlights for each of the five years in the period ended September 30, 2024 in conformity with accounting principles generally accepted in the United States of America.
Basis for Opinion
These financial statements are the responsibility of the Fund’s management. Our responsibility is to express an opinion on the Fund’s financial statements based on our audits. We are a public accounting firm registered with the Public Company Accounting Oversight Board (United States) (PCAOB) and are required to be independent with respect to the Fund in accordance with the U.S. federal securities laws and the applicable rules and regulations of the Securities and Exchange Commission and the PCAOB.
We conducted our audits of these financial statements in accordance with the standards of the PCAOB. Those standards require that we plan and perform the audit to obtain reasonable assurance about whether the financial statements are free of material misstatement, whether due to error or fraud.
Our audits included performing procedures to assess the risks of material misstatement of the financial statements, whether due to error or fraud, and performing procedures that respond to those risks. Such procedures included examining, on a test basis, evidence regarding the amounts and disclosures in the financial statements. Our audits also included evaluating the accounting principles used and significant estimates made by management, as well as evaluating the overall presentation of the financial statements. Our procedures included confirmation of securities owned as of September 30, 2024 by correspondence with the custodian, transfer agent and brokers; when replies were not received from brokers, we performed other auditing procedures. We believe that our audits provide a reasonable basis for our opinion.
/s/PricewaterhouseCoopers LLP
Philadelphia, Pennsylvania
November 20, 2024
We have served as the auditor of one or more investment companies in The Vanguard Group of Funds since 1975.
Tax information (unaudited)
For corporate shareholders, 92.1%, or if subsequently determined to be different, the maximum percentage allowable by law, of ordinary income (dividend income plus short-term gains, if any) for the fiscal year qualified for the dividends-received deduction.
The fund hereby designates $931,630,000, or if subsequently determined to be different, the maximum amount allowable by law, as qualified dividend income for purposes of the maximum rate under section 1(h)(11) for calendar year 2023. Shareholders will be notified in January 2025 via IRS Form 1099 of the amounts for use in preparing their 2024 income tax return.
The fund hereby designates for the fiscal year $19,008,000, or if subsequently determined to be different, the maximum amount allowable by law, of interest earned from obligations of the U.S. government which is generally exempt from state income tax.
For nonresident alien shareholders, 100% of short-term capital gain dividends distributed by the fund for the fiscal year are qualified short-term capital gains.
The fund distributed $4,127,606,000 as capital gain dividends (20% rate gain distributions) to shareholders during the fiscal year.
Q590 112024
Item 8: Changes in and Disagreements with Accountants for Open-End Management Investment Companies.
Not applicable.
Item 9: Proxy Disclosures for Open-End Management Investment Companies.
Not applicable.
Item 10: Remuneration Paid to Directors, Officers, and Others of Open-End Management Investment Companies.
Not applicable. The Trustees’ Fees and Expenses are included in the financial statements filed under Item 7 of this Form.
Item 11: Statement Regarding Basis for Approval of Investment Advisory Contracts.
Trustees Approve Advisory Arrangement – PRIMECAP Fund
The board of trustees of Vanguard PRIMECAP Fund has renewed the fund’s investment advisory arrangement with PRIMECAP Management Company (PRIMECAP). The board determined that renewing the fund’s advisory arrangement was in the best interests of the fund and its shareholders.
The board based its decision upon an evaluation of the advisor’s investment staff, portfolio management process, and performance. This evaluation included information provided to the board by Vanguard’s Portfolio Review Department, which is responsible for fund and advisor oversight and product management. The Portfolio Review Department met regularly with the advisor and made presentations to the board during the fiscal year that directed the board’s focus to relevant information and topics.
The board, or an investment committee made up of board members, also received information throughout the year during advisor presentations conducted by the Portfolio Review Department. For each advisor presentation, the board was provided with letters and reports that included information about, among other things, the advisory firm and the advisor’s assessment of the investment environment, portfolio performance, and portfolio characteristics.
In addition, the board received periodic reports throughout the year, which included information about the fund’s performance relative to its peers and benchmark, as applicable, and updates, as needed, on the Portfolio Review Department’s ongoing assessment of the advisor.
Prior to their meeting, the trustees were provided with a memo and material that summarized the information they received over the course of the year. They also considered the factors discussed below, among others. However, no single factor determined whether the board approved the arrangement. Rather, it was the totality of the circumstances that drove the board’s decision.
Nature, extent, and quality of services
The board reviewed the quality of the fund’s investment management services over both the short and long term, and took into account the organizational depth and stability of the advisor. The board considered that PRIMECAP, founded in 1983, is recognized for its long-term approach to growth equity investing. Five experienced portfolio managers are responsible for separate sub-portfolios, and each portfolio manager employs a fundamental, research-driven approach in seeking to identify companies with long-term growth potential that the market has yet to appreciate. The multi-counselor approach employed by PRIMECAP is designed to emphasize individual decision-making and enable the portfolio managers to invest in their highest-conviction ideas. The advisor’s fundamental research focuses on developing opinions independent from Wall Street’s consensus and maintaining a long-term horizon. PRIMECAP has managed the fund since its inception in 1984.
The board concluded that the advisor’s experience, stability, depth, and performance, among other factors, warranted continuation of the advisory arrangement.
Investment performance
The board considered the short- and long-term performance of the fund, including any periods of outperformance or underperformance compared with a relevant benchmark index and peer group. The board concluded that the performance was such that the advisory arrangement should continue.
Cost
The board concluded that the fund’s expense ratio was below the average expense ratio charged by funds in its peer group and that the fund’s advisory fee rate was also below the peer-group average.
The board did not consider the profitability of PRIMECAP in determining whether to approve the advisory fee, because PRIMECAP is independent of Vanguard and the advisory fee is the result of arm’s-length negotiations.
The benefit of economies of scale
The board concluded that the fund’s shareholders benefit from economies of scale because of breakpoints in the fund’s advisory fee schedule. The breakpoints reduce the effective rate of the fee as the fund’s assets increase.
The board will consider whether to renew the advisory arrangement again after a one-year period.
Item 12: Disclosure of Proxy Voting Policies and Procedures for Closed-End Management Investment Companies.
Not applicable.
Item 13: Portfolio Managers of Closed-End Management Investment Companies.
Not applicable.
Item 14: Purchase of Equity Securities by Closed-End Management Investment Company and Affiliated Purchasers.
Not applicable.
Item 15: Submission of Matters to a Vote of Security Holders.
Not applicable.
Item 16: Controls and Procedures.
(a) Disclosure Controls and Procedures. The Principal Executive and Financial Officers concluded that the Registrant’s disclosure controls and procedures are effective based on their evaluation of the disclosure controls and procedures as of a date within 90 days of the filing date of this report.
(b) Internal Control Over Financial Reporting. In February 2024, a third-party service provider began performing security pricing services for the Registrant. There were no other changes in the Registrant’s internal control over financial reporting or in other factors that could significantly affect this control during the period covered by this report, including any corrective actions with regard to significant deficiencies and material weaknesses.
Item 17: Disclosure of Securities Lending Activities for Closed-End Management
Investment Companies.
Not applicable.
Item 18: Recovery of Erroneously Awarded Compensation.
Not applicable.
Item 19: Exhibits.
Pursuant to the requirements of the Securities Exchange Act of 1934 and the Investment Company Act of 1940, the registrant has duly caused this report to be signed on its behalf by the undersigned, thereunto duly authorized.
| | VANGUARD CHESTER FUNDS | | |
| | | |
| BY: | /s/ SALIM RAMJI* | | |
| | SALIM RAMJI | | |
| | CHIEF EXECUTIVE OFFICER | | |
Date: November 22, 2024
Pursuant to the requirements of the Securities Exchange Act of 1934 and the Investment Company Act of 1940, this report has been signed below by the following persons on behalf of the registrant and in the capacities and on the dates indicated.
| | VANGUARD CHESTER FUNDS | | |
| | | |
| BY: | /s/ SALIM RAMJI* | | |
| | SALIM RAMJI | | |
| | CHIEF EXECUTIVE OFFICER | | |
Date: November 22, 2024
| | VANGUARD CHESTER FUNDS | | |
| | | |
| BY: | /s/ CHRISTINE BUCHANAN* | | |
| | CHRISTINE BUCHANAN | | |
| | CHIEF FINANCIAL OFFICER | | |
Date: November 22, 2024
* By: /s/ John E. Schadl
John E. Schadl, pursuant to a Power of Attorney filed on July 25, 2024 (see File Number 33-48863), Incorporated by Reference.