Exhibit 99.1 Investor Presentation February 28, 2022 – March 1, 2022 Confidential & Proprietary to Owens & Minor, Inc. 1
This presentation contains certain “forward looking” statements made pursuant to the Safe Harbor provisions of the Private Securities Litigation Reform Act of 1995. These statements include, but are not limited to, statements regarding the proposed transaction with Apria, Inc. (“Apria”) and opportunities related thereto, expectations with respect to our financial performance and related assumptions, the Owens & Minor, Inc.’s (“Owens & Minor” or the “Company”) business, the impact of COVID-19 on the Company’s results and operations, and the Company’s financial targets. Forward looking statements involve known and unknown risks and uncertainties that may cause our actual results in future periods to differ materially from those projected, targeted or contemplated in the forward looking statements, including that the proposed transaction will not be completed on a timely basis or at all, whether due to the failure to satisfy the conditions of the related agreement (including approvals or clearances from regulatory and other agencies and bodies) or otherwise, the possibility that stockholders of Apria may not approve the transaction, the risk that problems may arise in successfully integrating the businesses of the companies, which may result in the combined company not operating as effectively and efficiently as expected and the risk that the combined company may be unable to achieve synergies or that it may take longer than expected to achieve those synergies. Investors should refer to each of Owens & Minor’s and Apria’s Annual Report on Form 10-K for the year ended December 31, 2021 filed with the SEC, including the sections captioned “Cautionary Note Regarding Forward Looking Statements” and “Item 1A. Risk Factors,” and subsequent current reports on Form 8-K filed with the SEC, for a discussion of certain known risk factors that could cause the Company’s actual results to differ materially from those projected, targeted or contemplated in the forward looking statements. Given these risks and uncertainties, Owens & Minor can give no assurance that any forward-looking statements will, in fact, transpire and, therefore, cautions investors not to place undue reliance on them. Owens & Minor specifically disclaims any obligation to update or revise any forward- Safe Harbor looking statements, as a result of new information, future developments or otherwise. This presentation includes certain combined financial information which reflects the sum of the relevant financial information for the Company and Apria without any other adjustments and refer to such presentation as on a “combined” basis for the applicable period. This combination does not comply with U.S. GAAP or with the rules for pro forma presentation. As a result, the combined financial information included in this presentation may differ from pro forma financial information prepared in accordance with U.S. GAAP and the rules and regulations of the SEC, and any such differences could be material. Numerical figures included in this presentation have been subject to rounding adjustments. Accordingly, numerical figures shown as totals in various tables may not be arithmetic aggregations of the figures that precede them. As such, the corresponding percentage aggregations may not sum to 100%. We present certain potential cost savings as an adjustment to Combined Adjusted EBITDA because we expect them to be a permitted addback pursuant to agreements that govern our indebtedness. These potential cost savings are based on assumptions and estimates that could be proved to be incorrect, and accordingly should not be viewed as a projection of future performance. Certain financial measures included herein are not made in accordance with U.S. GAAP and use of such terms varies from others in the same industry. Management uses these non-GAAP financial measures internally to evaluate our performance, evaluate the balance sheet, engage in financial and operational planning and determine incentive compensation. Non-GAAP financial measures should not be considered as alternatives to measures derived in accordance with U.S. GAAP. Non-GAAP financial measures have important limitations as analytical tools and you should not consider them in isolation or as substitutes for results as reported under U.S. GAAP. The appendix to this presentation includes a reconciliation of these non-GAAP financial measures to the most directly comparable financial measures calculated in accordance with U.S. GAAP. C Co on nffide iden nttial ial & & P Pr ro op pr riet ieta ar ry y tto o Ow Owe en ns s & & M Mino inor r,, IIn nc c.. 2 2

Today’s Presenters Ed Pesicka Jonathan Leon Andy Long President & CEO SVP, Corporate Treasurer EVP, Chief Financial Officer C Co on nffide iden nttial ial & & P Pr ro op pr riet ieta ar ry y tto o Ow Owe en ns s & & M Mino inor r,, IIn nc c.. 3 3

Executive Summary C Co on nffide iden nttial ial & & P Pr ro op pr riet ieta ar ry y tto o Ow Owe en ns s & & M Mino inor r,, IIn nc c.. 4 4
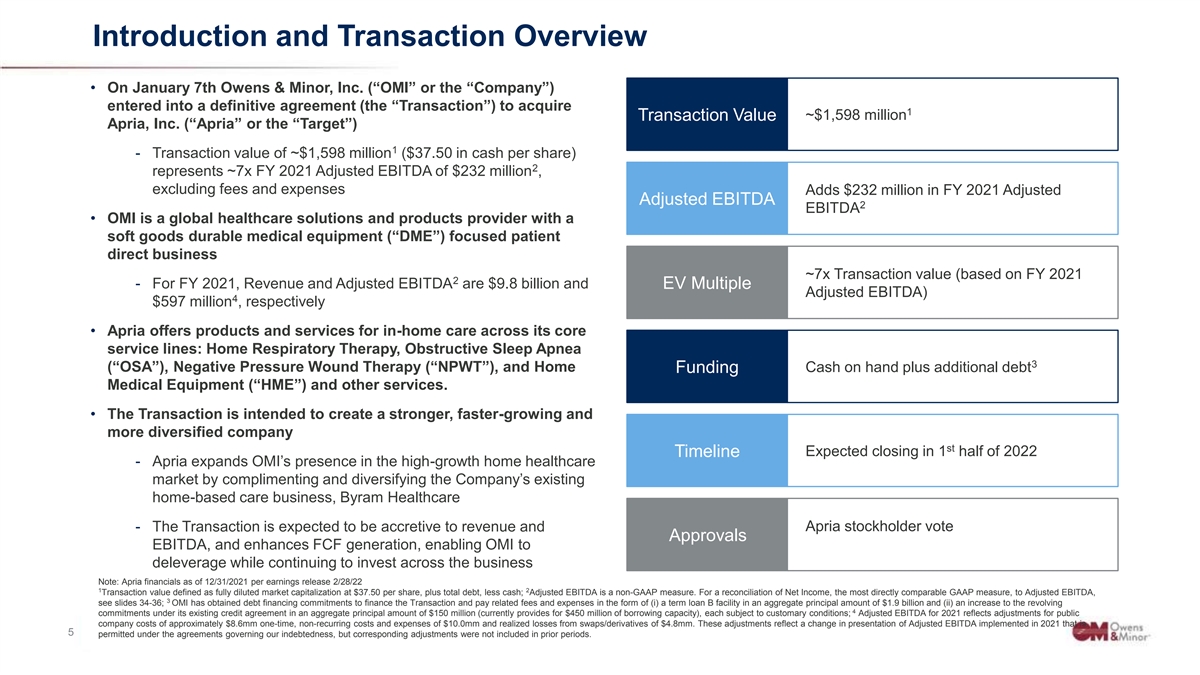
Introduction and Transaction Overview • On January 7th Owens & Minor, Inc. (“OMI” or the “Company”) entered into a definitive agreement (the “Transaction”) to acquire 1 ~$1,598 million Transaction Value Apria, Inc. (“Apria” or the “Target”) 1 - Transaction value of ~$1,598 million ($37.50 in cash per share) 2 represents ~7x FY 2021 Adjusted EBITDA of $232 million , excluding fees and expenses Adds $232 million in FY 2021 Adjusted Adjusted EBITDA 2 EBITDA • OMI is a global healthcare solutions and products provider with a soft goods durable medical equipment (“DME”) focused patient direct business ~7x Transaction value (based on FY 2021 2 - For FY 2021, Revenue and Adjusted EBITDA are $9.8 billion and EV Multiple Adjusted EBITDA) 4 $597 million , respectively • Apria offers products and services for in-home care across its core service lines: Home Respiratory Therapy, Obstructive Sleep Apnea 3 (“OSA”), Negative Pressure Wound Therapy (“NPWT”), and Home Cash on hand plus additional debt Funding Medical Equipment (“HME”) and other services. • The Transaction is intended to create a stronger, faster-growing and more diversified company st Expected closing in 1 half of 2022 Timeline - Apria expands OMI’s presence in the high-growth home healthcare market by complimenting and diversifying the Company’s existing home-based care business, Byram Healthcare - The Transaction is expected to be accretive to revenue and Apria stockholder vote Approvals EBITDA, and enhances FCF generation, enabling OMI to deleverage while continuing to invest across the business Note: Apria financials as of 12/31/2021 per earnings release 2/28/22 1 2 Transaction value defined as fully diluted market capitalization at $37.50 per share, plus total debt, less cash; Adjusted EBITDA is a non-GAAP measure. For a reconciliation of Net Income, the most directly comparable GAAP measure, to Adjusted EBITDA, 3 see slides 34-36; OMI has obtained debt financing commitments to finance the Transaction and pay related fees and expenses in the form of (i) a term loan B facility in an aggregate principal amount of $1.9 billion and (ii) an increase to the revolving 4 commitments under its existing credit agreement in an aggregate principal amount of $150 million (currently provides for $450 million of borrowing capacity), each subject to customary conditions; Adjusted EBITDA for 2021 reflects adjustments for public company costs of approximately $8.6mm one-time, non-recurring costs and expenses of $10.0mm and realized losses from swaps/derivatives of $4.8mm. These adjustments reflect a change in presentation of Adjusted EBITDA implemented in 2021 that is C Co on nffide iden nttial ial & & P Pr ro op pr riet ieta ar ry y tto o Ow Owe en ns s & & M Mino inor r,, IIn nc c.. 5 5 permitted under the agreements governing our indebtedness, but corresponding adjustments were not included in prior periods.
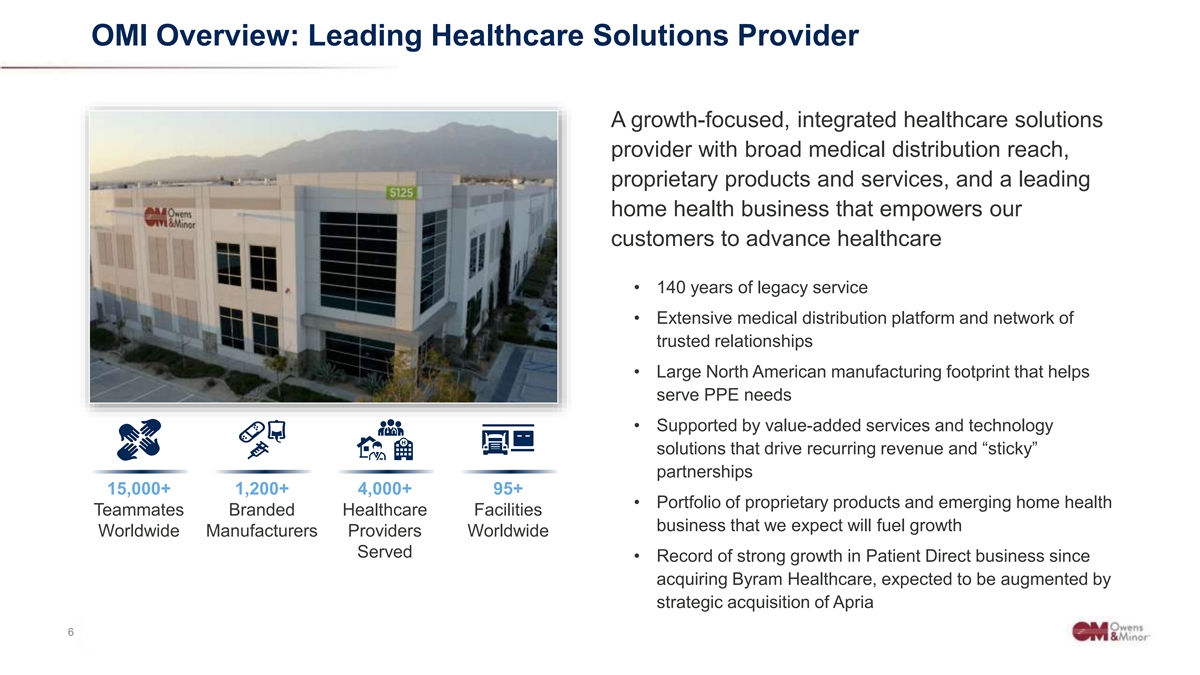
OMI Overview: Leading Healthcare Solutions Provider A growth-focused, integrated healthcare solutions provider with broad medical distribution reach, proprietary products and services, and a leading home health business that empowers our customers to advance healthcare • 140 years of legacy service • Extensive medical distribution platform and network of trusted relationships • Large North American manufacturing footprint that helps serve PPE needs • Supported by value-added services and technology solutions that drive recurring revenue and “sticky” partnerships 15,000+ 1,200+ 4,000+ 95+ • Portfolio of proprietary products and emerging home health Teammates Branded Healthcare Facilities business that we expect will fuel growth Worldwide Manufacturers Providers Worldwide Served • Record of strong growth in Patient Direct business since acquiring Byram Healthcare, expected to be augmented by strategic acquisition of Apria C Co on nffide iden nttial ial & & P Pr ro op pr riet ieta ar ry y tto o Ow Owe en ns s & & M Mino inor r,, IIn nc c.. 6 6
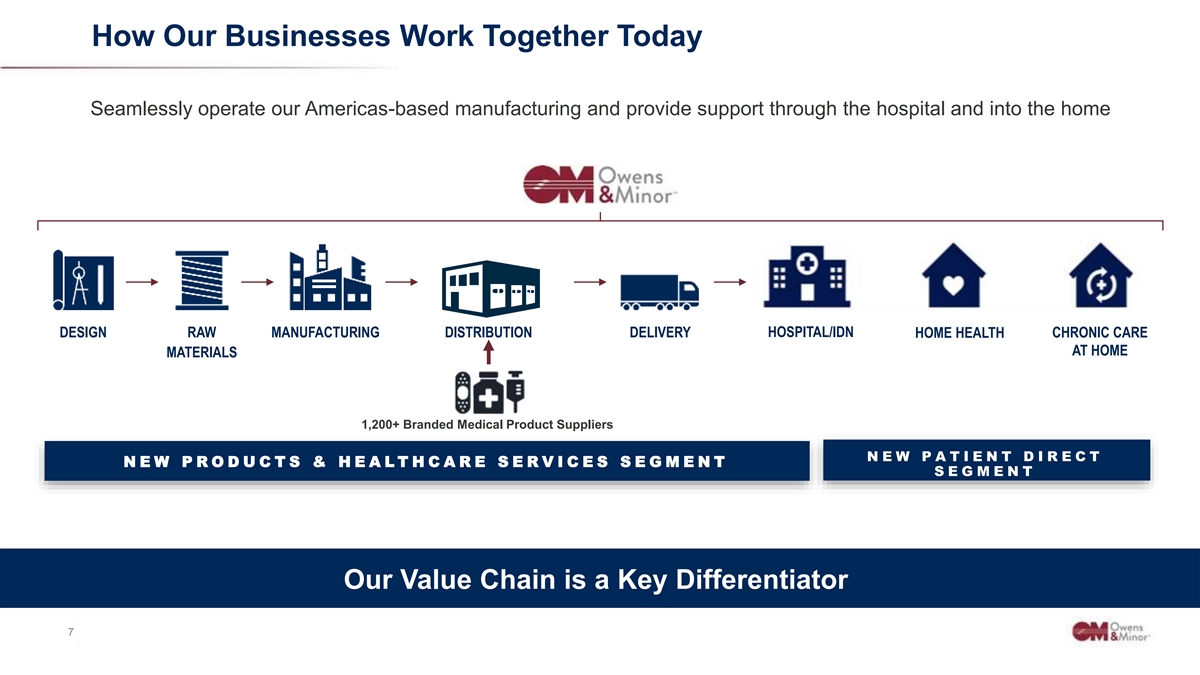
How Our Businesses Work Together Today Seamlessly operate our Americas-based manufacturing and provide support through the hospital and into the home DESIGN RAW MANUFACTURING DISTRIBUTION DELIVERY HOSPITAL/IDN HOME HEALTH CHRONIC CARE AT HOME MATERIALS 1,200+ Branded Medical Product Suppliers N E W P A T I E N T D I R E C T N E W P R O D U C T S & H E A L T H C A R E S E R V I C E S S E G M E N T S E G M E N T Our Value Chain is a Key Differentiator C Co on nffide iden nttial ial & & P Pr ro op pr riet ieta ar ry y tto o Ow Owe en ns s & & M Mino inor r,, IIn nc c.. 7 7
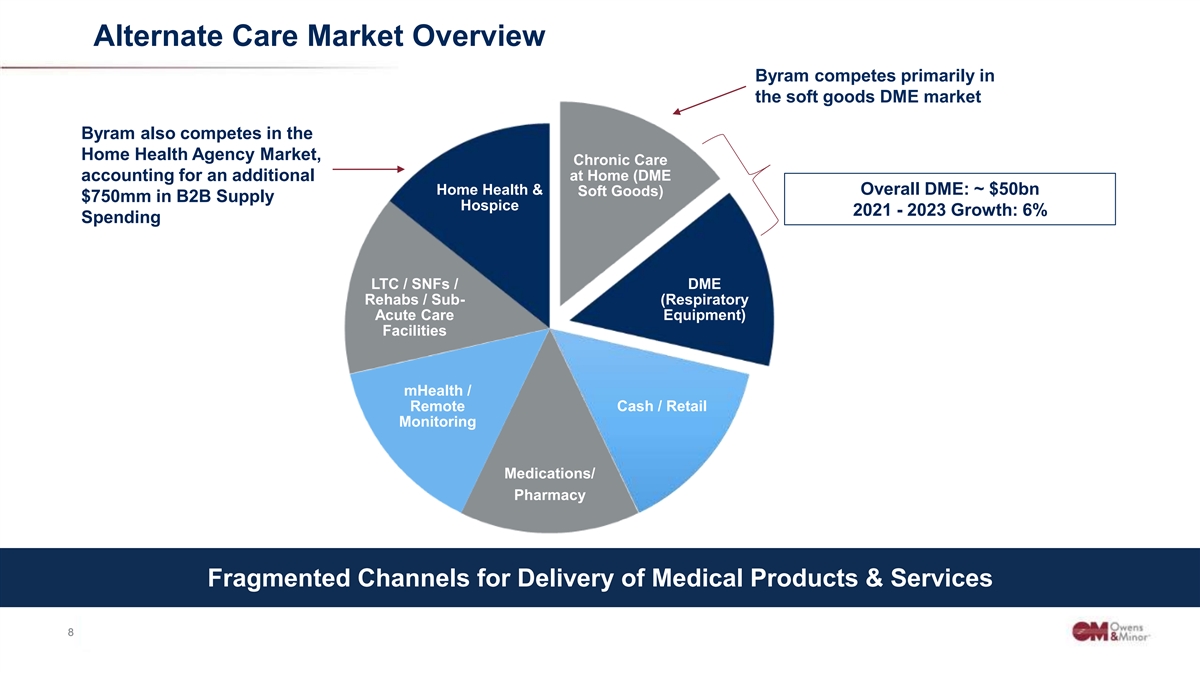
Alternate Care Market Overview Byram competes primarily in the soft goods DME market Byram also competes in the Home Health Agency Market, Chronic Care accounting for an additional at Home (DME Home Health & Overall DME: ~ $50bn Soft Goods) $750mm in B2B Supply Hospice 2021 - 2023 Growth: 6% Spending LTC / SNFs / DME Rehabs / Sub- (Respiratory Acute Care Equipment) Facilities Expansion into mobile Health (“mHealth”), Cash/Retail and mHealth / Remote Cash / Retail other verticals (e.g. Monitoring Respiratory) are actively being explored Medications/ Pharmacy Fragmented Channels for Delivery of Medical Products & Services C Co on nffide iden nttial ial & & P Pr ro op pr riet ieta ar ry y tto o Ow Owe en ns s & & M Mino inor r,, IIn nc c.. 8 8 8
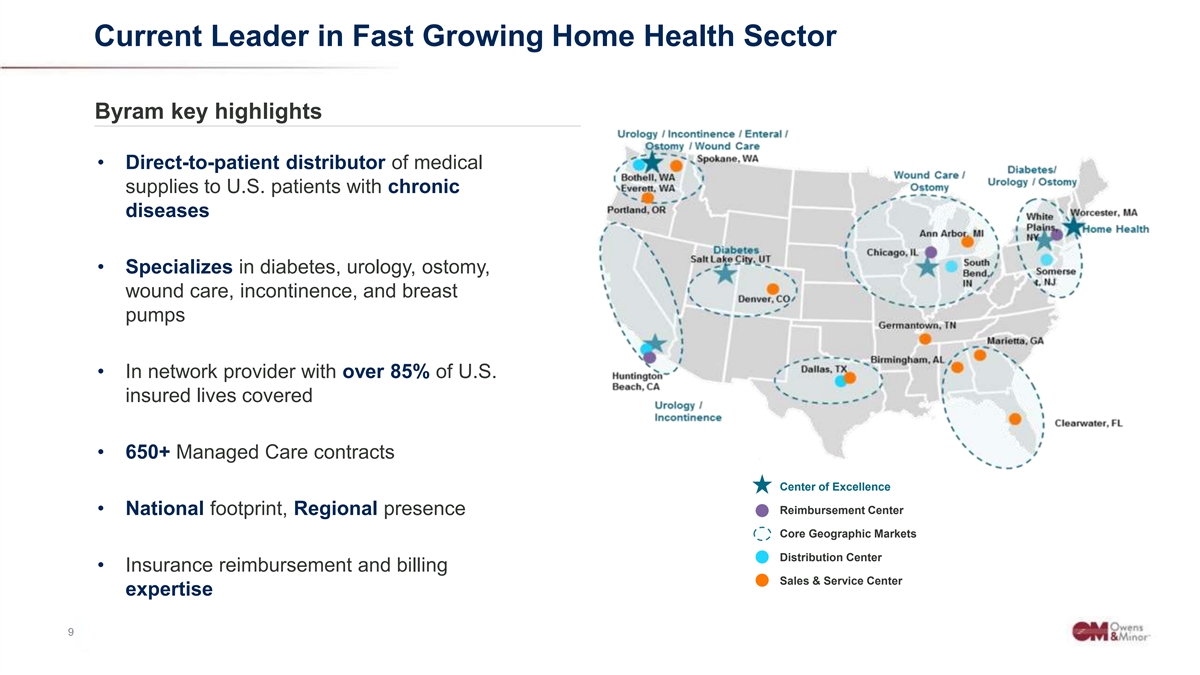
Current Leader in Fast Growing Home Health Sector Byram key highlights • Direct-to-patient distributor of medical supplies to U.S. patients with chronic diseases • Specializes in diabetes, urology, ostomy, wound care, incontinence, and breast pumps • In network provider with over 85% of U.S. insured lives covered • 650+ Managed Care contracts Center of Excellence Reimbursement Center • National footprint, Regional presence Core Geographic Markets Distribution Center • Insurance reimbursement and billing Sales & Service Center expertise C Co on nffide iden nttial ial & & P Pr ro op pr riet ieta ar ry y tto o Ow Owe en ns s & & M Mino inor r,, IIn nc c.. 9 9
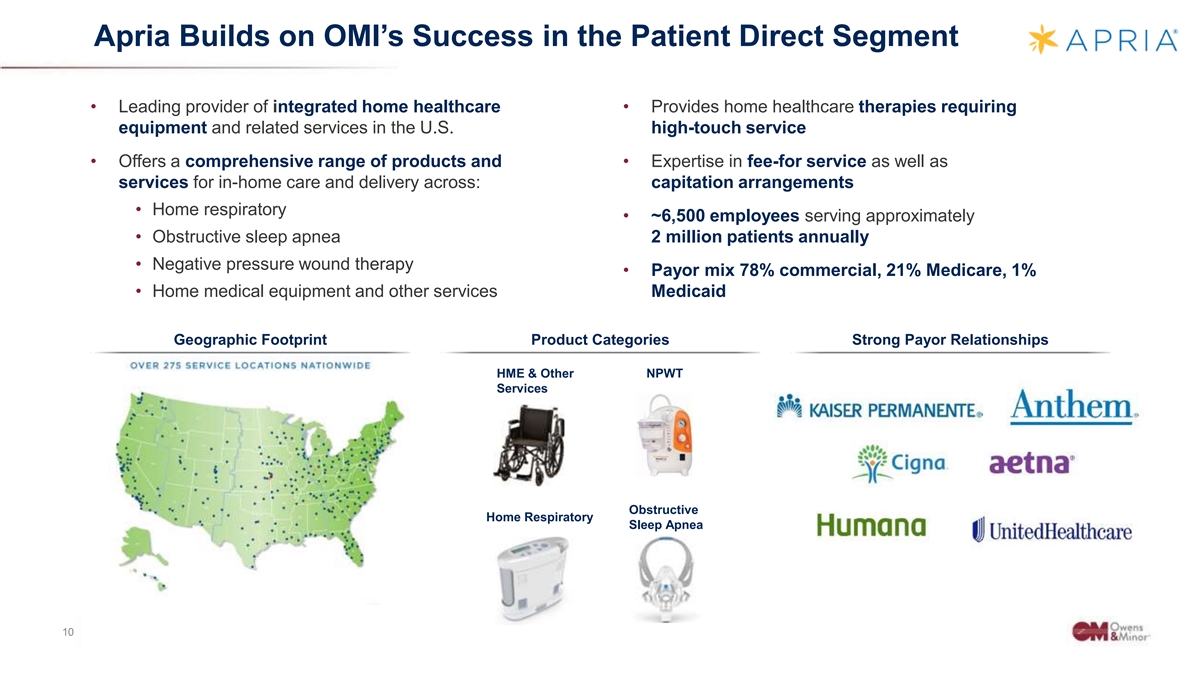
Apria Builds on OMI’s Success in the Patient Direct Segment • Leading provider of integrated home healthcare • Provides home healthcare therapies requiring equipment and related services in the U.S. high-touch service • Offers a comprehensive range of products and • Expertise in fee-for service as well as services for in-home care and delivery across: capitation arrangements • Home respiratory • ~6,500 employees serving approximately • Obstructive sleep apnea 2 million patients annually • Negative pressure wound therapy • Payor mix 78% commercial, 21% Medicare, 1% • Home medical equipment and other services Medicaid Geographic Footprint Product Categories Strong Payor Relationships HME & Other NPWT Services Obstructive Home Respiratory Sleep Apnea C Co on nffide iden nttial ial & & P Pr ro op pr riet ieta ar ry y tto o Ow Owe en ns s & & M Mino inor r,, IIn nc c.. 10 10
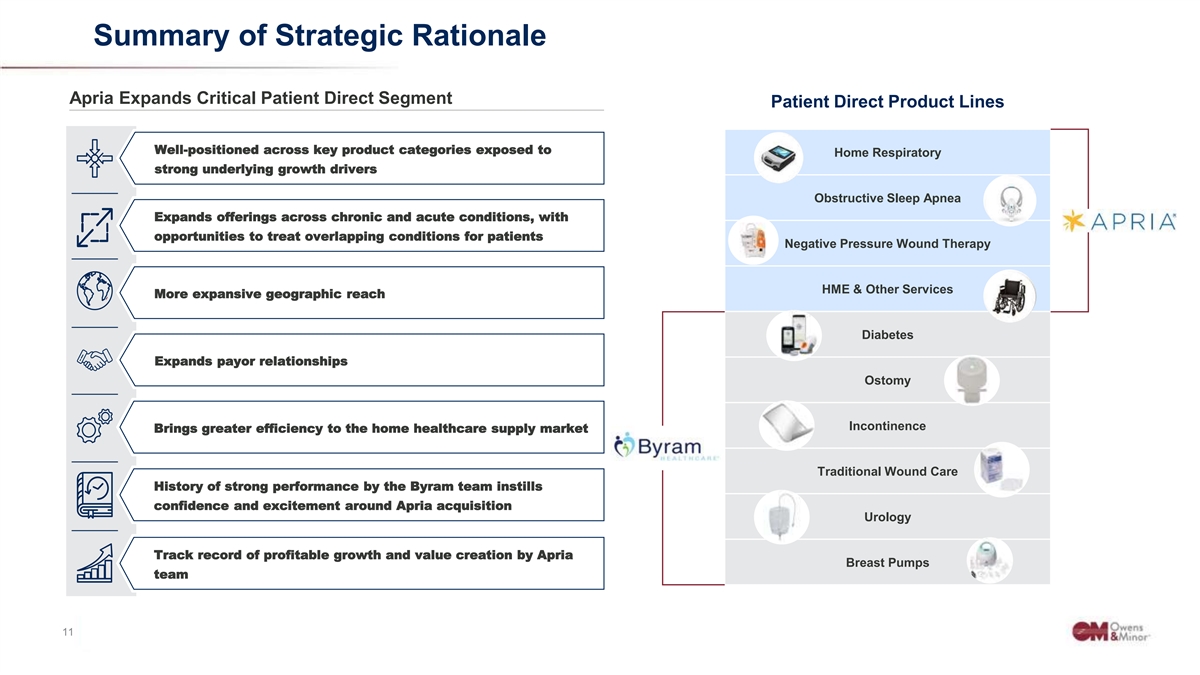
Summary of Strategic Rationale Apria Expands Critical Patient Direct Segment Patient Direct Product Lines Well-positioned across key product categories exposed to Home Respiratory strong underlying growth drivers Obstructive Sleep Apnea Expands offerings across chronic and acute conditions, with opportunities to treat overlapping conditions for patients Negative Pressure Wound Therapy HME & Other Services More expansive geographic reach Diabetes Expands payor relationships Ostomy Incontinence Brings greater efficiency to the home healthcare supply market Traditional Wound Care History of strong performance by the Byram team instills confidence and excitement around Apria acquisition Urology Track record of profitable growth and value creation by Apria Breast Pumps team C Co on nffide iden nttial ial & & P Pr ro op pr riet ieta ar ry y tto o Ow Owe en ns s & & M Mino inor r,, IIn nc c.. 11 11
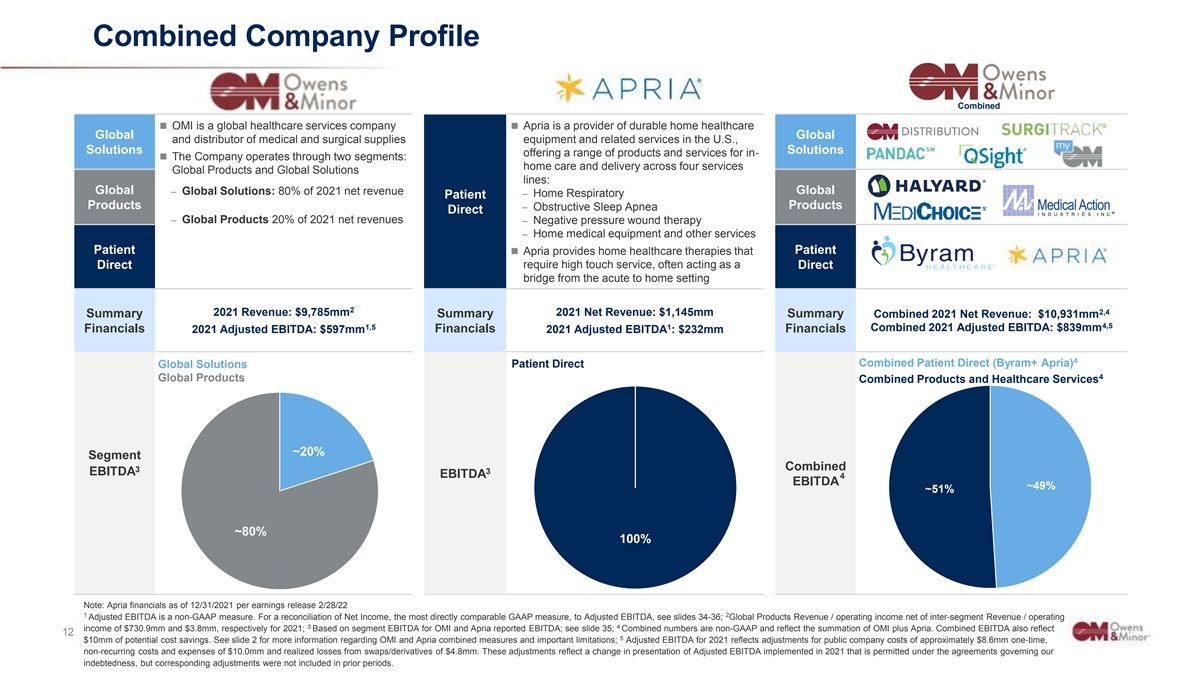
Combined Company Profile Combined ◼ OMI is a global healthcare services company ◼ Apria is a provider of durable home healthcare Global Global and distributor of medical and surgical supplies equipment and related services in the U.S., Solutions Solutions offering a range of products and services for in- ◼ The Company operates through two segments: home care and delivery across four services Global Products and Global Solutions lines: Global Global − Global Solutions: 80% of 2021 net revenue − Home Respiratory Patient Products Products − Obstructive Sleep Apnea Direct − Global Products 20% of 2021 net revenues− Negative pressure wound therapy − Home medical equipment and other services Patient Patient ◼ Apria provides home healthcare therapies that Direct require high touch service, often acting as a Direct bridge from the acute to home setting 2 2,4 2021 Revenue: $9,785mm 2021 Net Revenue: $1,145mm Summary Summary Summary Combined 2021 Net Revenue: $10,931mm 4,5 1,5 1 Combined 2021 Adjusted EBITDA: $839mm Financials Financials Financials 2021 Adjusted EBITDA: $597mm 2021 Adjusted EBITDA : $232mm 4 Patient Direct Combined Patient Direct (Byram+ Apria) Global Solutions 4 Global Products Combined Products and Healthcare Services ~20% Segment Combined 3 3 EBITDA EBITDA 4 EBITDA ~49% ~51% ~80% 100% Note: Apria financials as of 12/31/2021 per earnings release 2/28/22 1 2 Adjusted EBITDA is a non-GAAP measure. For a reconciliation of Net Income, the most directly comparable GAAP measure, to Adjusted EBITDA, see slides 34-36; Global Products Revenue / operating income net of inter-segment Revenue / operating 3 4 income of $730.9mm and $3.8mm, respectively for 2021; Based on segment EBITDA for OMI and Apria reported EBITDA; see slide 35; Combined numbers are non-GAAP and reflect the summation of OMI plus Apria. Combined EBITDA also reflect C Co on nffide iden nttial ial & & P Pr ro op pr riet ieta ar ry y tto o Ow Owe en ns s & & M Mino inor r,, IIn nc c.. 12 12 5 $10mm of potential cost savings. See slide 2 for more information regarding OMI and Apria combined measures and important limitations; Adjusted EBITDA for 2021 reflects adjustments for public company costs of approximately $8.6mm one-time, non-recurring costs and expenses of $10.0mm and realized losses from swaps/derivatives of $4.8mm. These adjustments reflect a change in presentation of Adjusted EBITDA implemented in 2021 that is permitted under the agreements governing our indebtedness, but corresponding adjustments were not included in prior periods.
Key Credit Highlights C Co on nffide iden nttial ial & & P Pr ro op pr riet ieta ar ry y tto o Ow Owe en ns s & & M Mino inor r,, IIn nc c.. 13 13
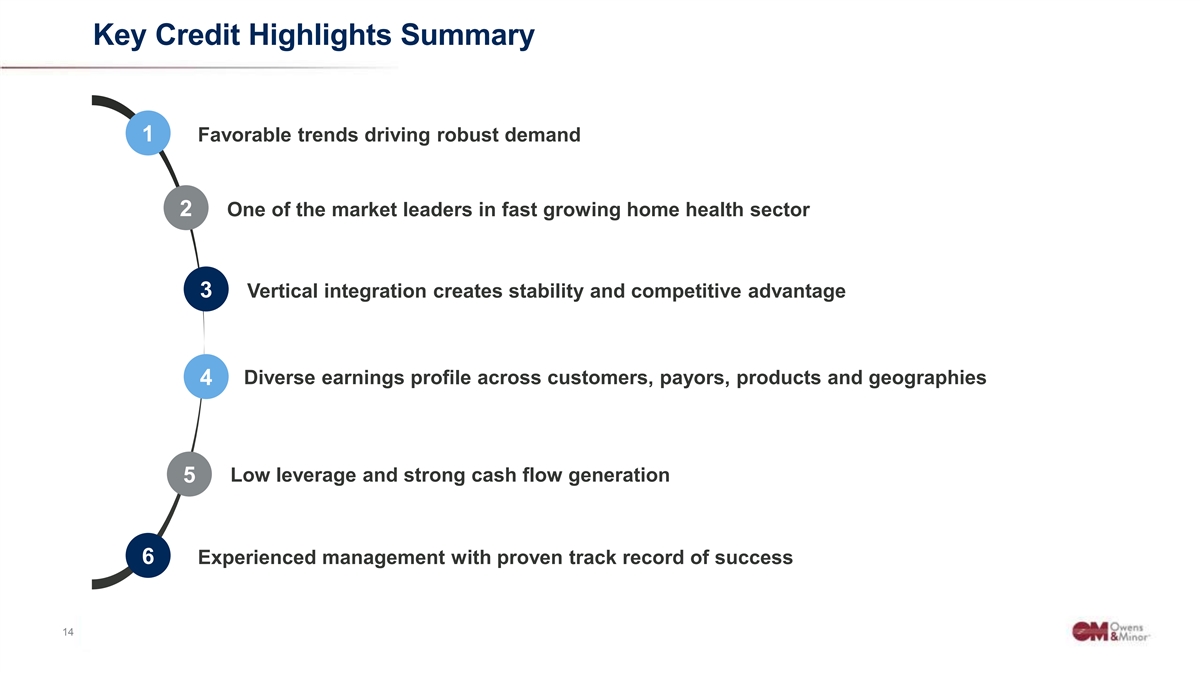
Key Credit Highlights Summary 1 Favorable trends driving robust demand 2 One of the market leaders in fast growing home health sector 3 Vertical integration creates stability and competitive advantage 4 Diverse earnings profile across customers, payors, products and geographies 5 Low leverage and strong cash flow generation 6 Experienced management with proven track record of success C Co on nffide iden nttial ial & & P Pr ro op pr riet ieta ar ry y tto o Ow Owe en ns s & & M Mino inor r,, IIn nc c.. 14 14
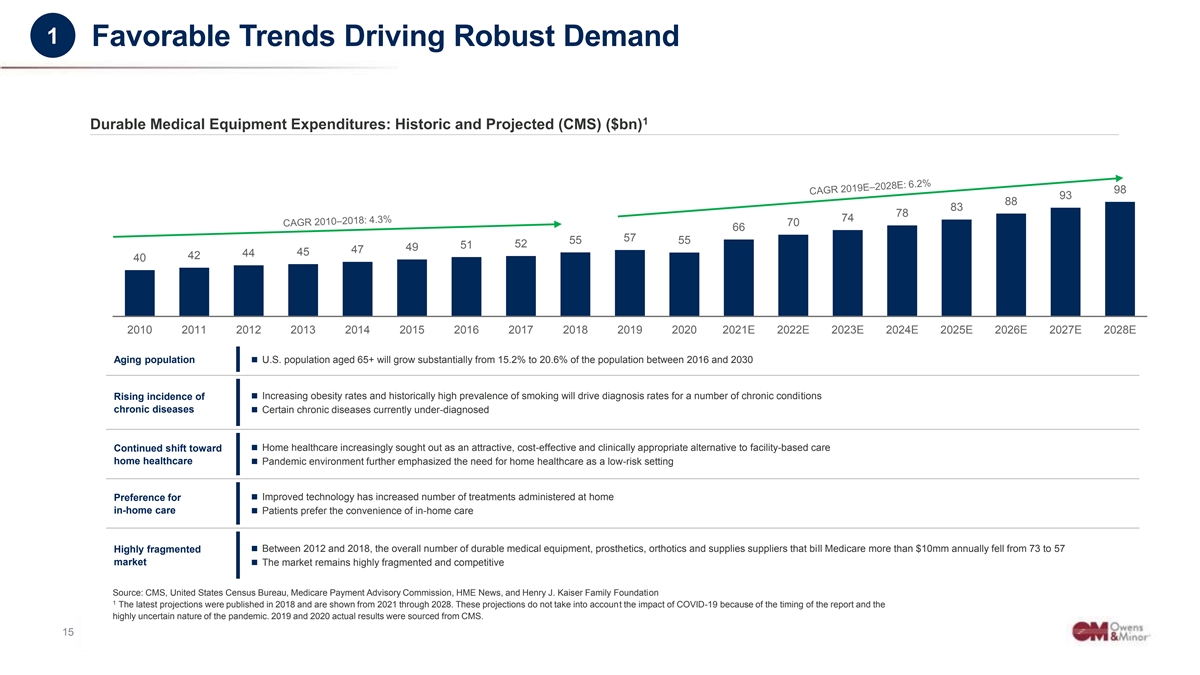
1 Favorable Trends Driving Robust Demand 1 Durable Medical Equipment Expenditures: Historic and Projected (CMS) ($bn) 98 93 88 83 78 74 70 66 57 55 55 52 51 49 47 45 44 42 40 2010 2011 2012 2013 2014 2015 2016 2017 2018 2019 2020 2021E 2022E 2023E 2024E 2025E 2026E 2027E 2028E A Ag giin ng g p po op pu ulla ati tio on n◼ U.S. population aged 65+ will grow substantially from 15.2% to 20.6% of the population between 2016 and 2030 R Riis siin ng g iin nc ciid de en nc ce e o of f ◼ Increasing obesity rates and historically high prevalence of smoking will drive diagnosis rates for a number of chronic conditions c ch hr ro on niic c d diis se ea as se es s ◼ Certain chronic diseases currently under-diagnosed ◼ Home healthcare increasingly sought out as an attractive, cost-effective and clinically appropriate alternative to facility-based care C Co on nti tin nu ue ed d s sh hiift ft to tow wa ar rd d h ho om me e h he ea allth thc ca ar re e◼ Pandemic environment further emphasized the need for home healthcare as a low-risk setting ◼ Improved technology has increased number of treatments administered at home Pr Pre efe fer re en nc ce e fo for r in in- -h ho om me e c ca ar re e ◼ Patients prefer the convenience of in-home care H Hiig gh hlly y fr fra ag gm me en nte ted d ◼ Between 2012 and 2018, the overall number of durable medical equipment, prosthetics, orthotics and supplies suppliers that bill Medicare more than $10mm annually fell from 73 to 57 market market ◼ The market remains highly fragmented and competitive Source: CMS, United States Census Bureau, Medicare Payment Advisory Commission, HME News, and Henry J. Kaiser Family Foundation 1 The latest projections were published in 2018 and are shown from 2021 through 2028. These projections do not take into account the impact of COVID-19 because of the timing of the report and the highly uncertain nature of the pandemic. 2019 and 2020 actual results were sourced from CMS. C Co on nffide iden nttial ial & & P Pr ro op pr riet ieta ar ry y tto o Ow Owe en ns s & & M Mino inor r,, IIn nc c.. 15 15
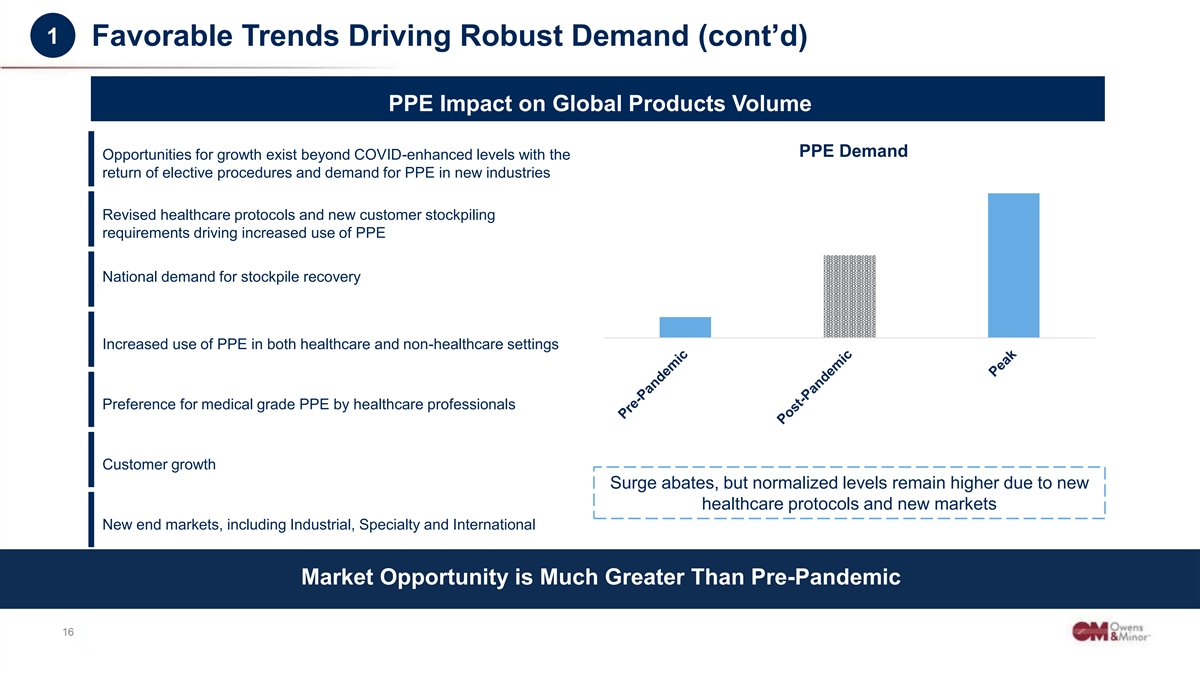
1 Favorable Trends Driving Robust Demand (cont’d) PPE Impact on Global Products Volume PPE Demand Opportunities for growth exist beyond COVID-enhanced levels with the return of elective procedures and demand for PPE in new industries Revised healthcare protocols and new customer stockpiling requirements driving increased use of PPE National demand for stockpile recovery Increased use of PPE in both healthcare and non-healthcare settings Preference for medical grade PPE by healthcare professionals Customer growth Surge abates, but normalized levels remain higher due to new healthcare protocols and new markets New end markets, including Industrial, Specialty and International Market Opportunity is Much Greater Than Pre-Pandemic C Co on nffide iden nttial ial & & P Pr ro op pr riet ieta ar ry y tto o Ow Owe en ns s & & M Mino inor r,, IIn nc c.. 16 16
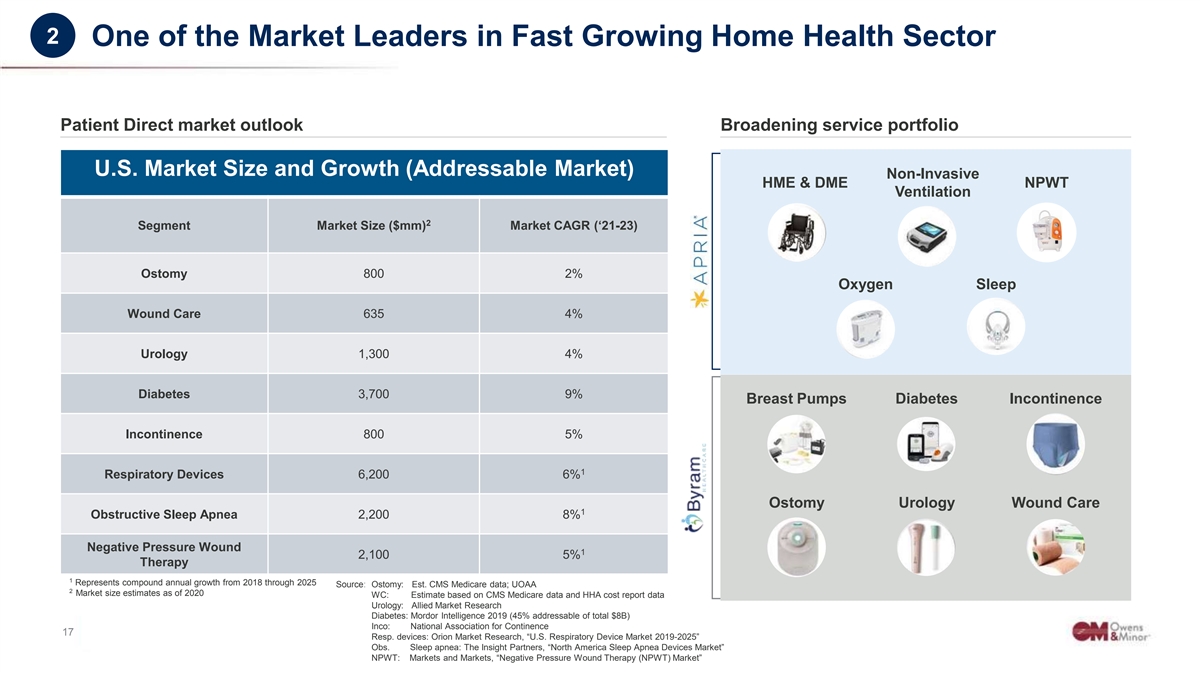
2 One of the Market Leaders in Fast Growing Home Health Sector Patient Direct market outlook Broadening service portfolio U.S. Market Size and Growth (Addressable Market) Non-Invasive HME & DME NPWT Ventilation 2 Segment Market Size ($mm) Market CAGR (‘21-23) Ostomy 800 2% Oxygen Sleep Wound Care 635 4% Urology 1,300 4% Diabetes 3,700 9% Breast Pumps Diabetes Incontinence Incontinence 800 5% 1 Respiratory Devices 6,200 6% Ostomy Urology Wound Care 1 Obstructive Sleep Apnea 2,200 8% Negative Pressure Wound 1 2,100 5% Therapy 1 Represents compound annual growth from 2018 through 2025 Source: Ostomy: Est. CMS Medicare data; UOAA 2 Market size estimates as of 2020 WC: Estimate based on CMS Medicare data and HHA cost report data Urology: Allied Market Research Diabetes: Mordor Intelligence 2019 (45% addressable of total $8B) Inco: National Association for Continence C Co on nffide iden nttial ial & & P Pr ro op pr riet ieta ar ry y tto o Ow Owe en ns s & & M Mino inor r,, IIn nc c.. 17 17 Resp. devices: Orion Market Research, “U.S. Respiratory Device Market 2019-2025” Obs. Sleep apnea: The Insight Partners, “North America Sleep Apnea Devices Market” NPWT: Markets and Markets, “Negative Pressure Wound Therapy (NPWT) Market”
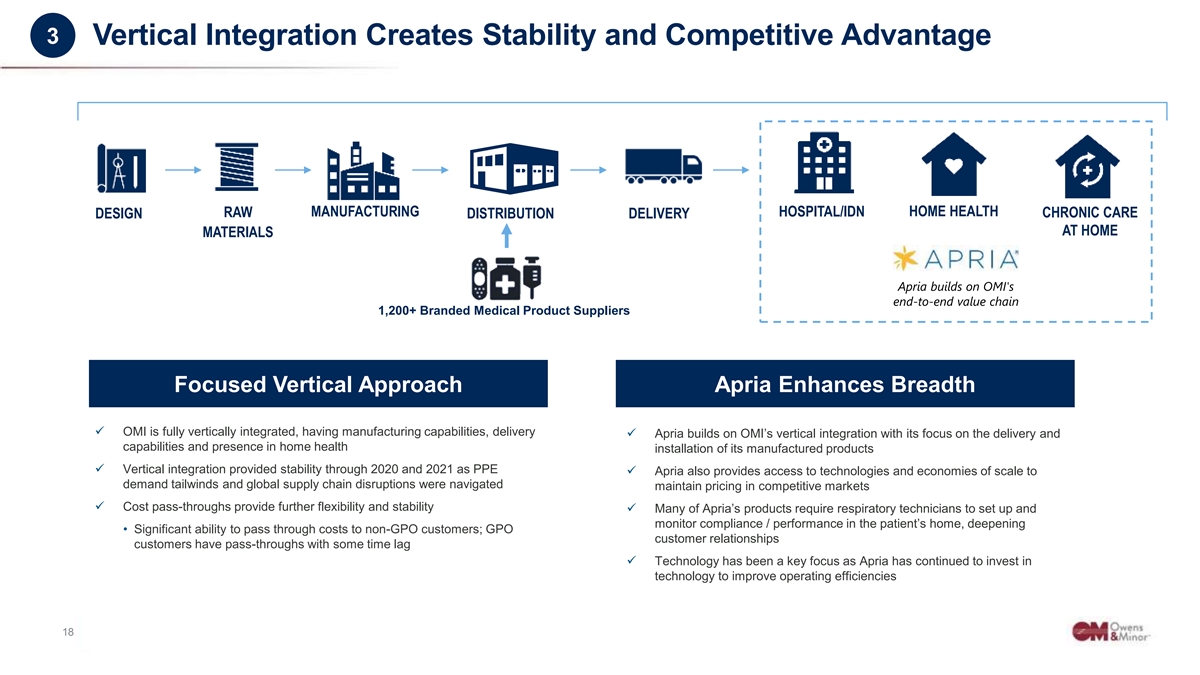
3 Vertical Integration Creates Stability and Competitive Advantage MANUFACTURING HOSPITAL/IDN HOME HEALTH RAW CHRONIC CARE DESIGN DISTRIBUTION DELIVERY AT HOME MATERIALS Apria builds on OMI's end-to-end value chain 1,200+ Branded Medical Product Suppliers Financial Strength Drivers Focused Vertical Approach Apria Enhances Breadth ✓ ✓ OMI is fully vertically integrated, having manufacturing capabilities, delivery ✓ Apria builds on OMI’s vertical integration with its focus on the delivery and capabilities and presence in home health installation of its manufactured products ✓ Vertical integration provided stability through 2020 and 2021 as PPE ✓ Apria also provides access to technologies and economies of scale to demand tailwinds and global supply chain disruptions were navigated maintain pricing in competitive markets ✓ Cost pass-throughs provide further flexibility and stability ✓ Many of Apria’s products require respiratory technicians to set up and monitor compliance / performance in the patient’s home, deepening • Significant ability to pass through costs to non-GPO customers; GPO customer relationships customers have pass-throughs with some time lag ✓ Technology has been a key focus as Apria has continued to invest in technology to improve operating efficiencies C Co on nffide iden nttial ial & & P Pr ro op pr riet ieta ar ry y tto o Ow Owe en ns s & & M Mino inor r,, IIn nc c.. 18 18
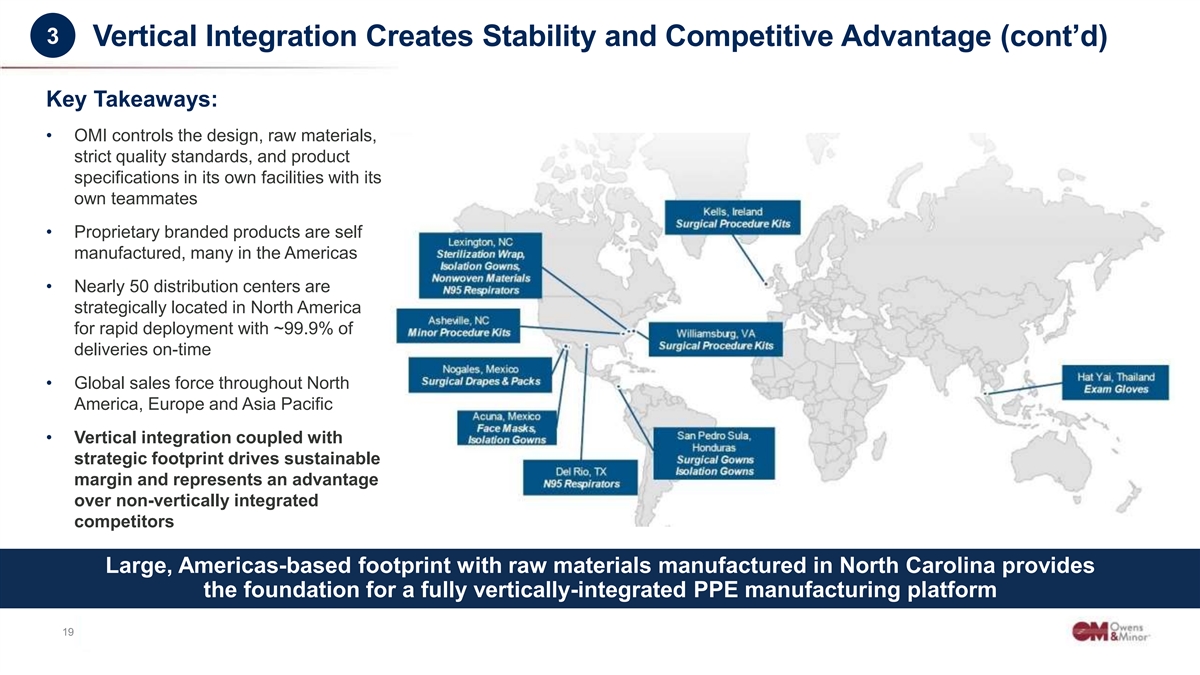
3 Vertical Integration Creates Stability and Competitive Advantage (cont’d) Key Takeaways: • OMI controls the design, raw materials, strict quality standards, and product specifications in its own facilities with its own teammates • Proprietary branded products are self manufactured, many in the Americas • Nearly 50 distribution centers are strategically located in North America for rapid deployment with ~99.9% of deliveries on-time • Global sales force throughout North America, Europe and Asia Pacific • Vertical integration coupled with strategic footprint drives sustainable margin and represents an advantage over non-vertically integrated competitors Large, Americas-based footprint with raw materials manufactured in North Carolina provides the foundation for a fully vertically-integrated PPE manufacturing platform C Co on nffide iden nttial ial & & P Pr ro op pr riet ieta ar ry y tto o Ow Owe en ns s & & M Mino inor r,, IIn nc c.. 19 19
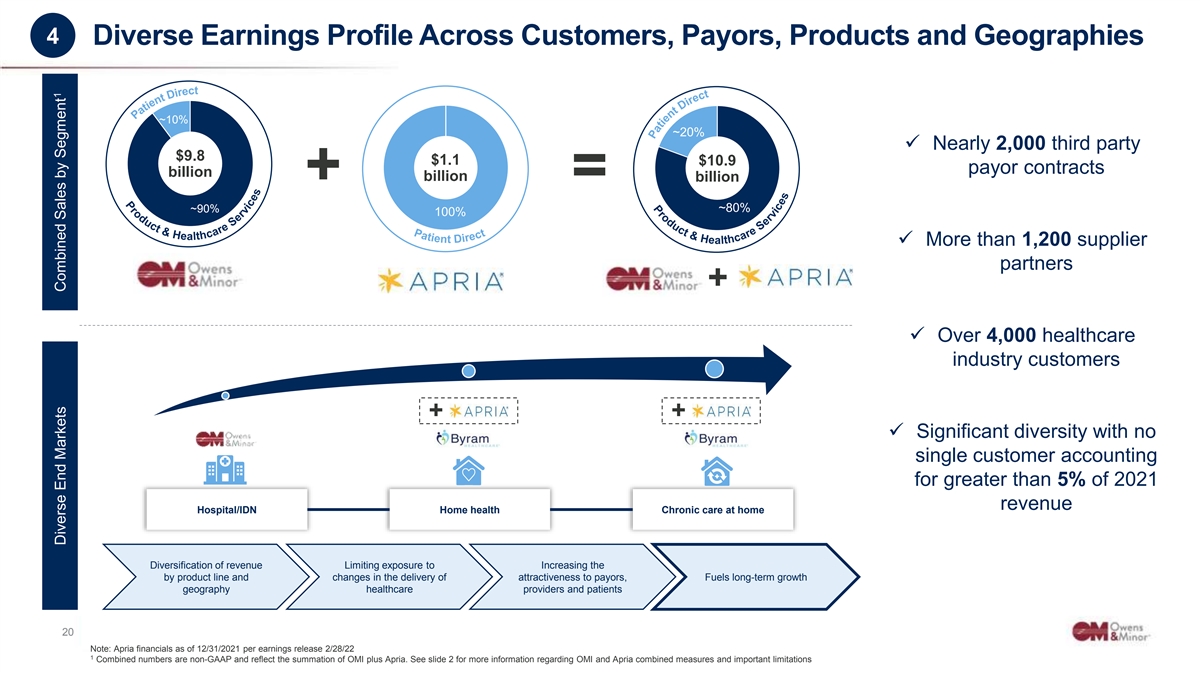
4 Diverse Earnings Profile Across Customers, Payors, Products and Geographies ~10% ~20% ✓ Nearly 2,000 third party $9.8 $1.1 $10.9 payor contracts billion billion billion + = ~90% ~80% 100% ✓ More than 1,200 supplier partners + ✓ Over 4,000 healthcare industry customers + + ✓ Significant diversity with no single customer accounting for greater than 5% of 2021 revenue Hospital/IDN Home health Chronic care at home Diversification of revenue Limiting exposure to Increasing the by product line and changes in the delivery of attractiveness to payors, Fuels long-term growth geography healthcare providers and patients C Co on nffide iden nttial ial & & P Pr ro op pr riet ieta ar ry y tto o Ow Owe en ns s & & M Mino inor r,, IIn nc c.. 20 20 Note: Apria financials as of 12/31/2021 per earnings release 2/28/22 1 Combined numbers are non-GAAP and reflect the summation of OMI plus Apria. See slide 2 for more information regarding OMI and Apria combined measures and important limitations 1 Diverse End Markets Combined Sales by Segment
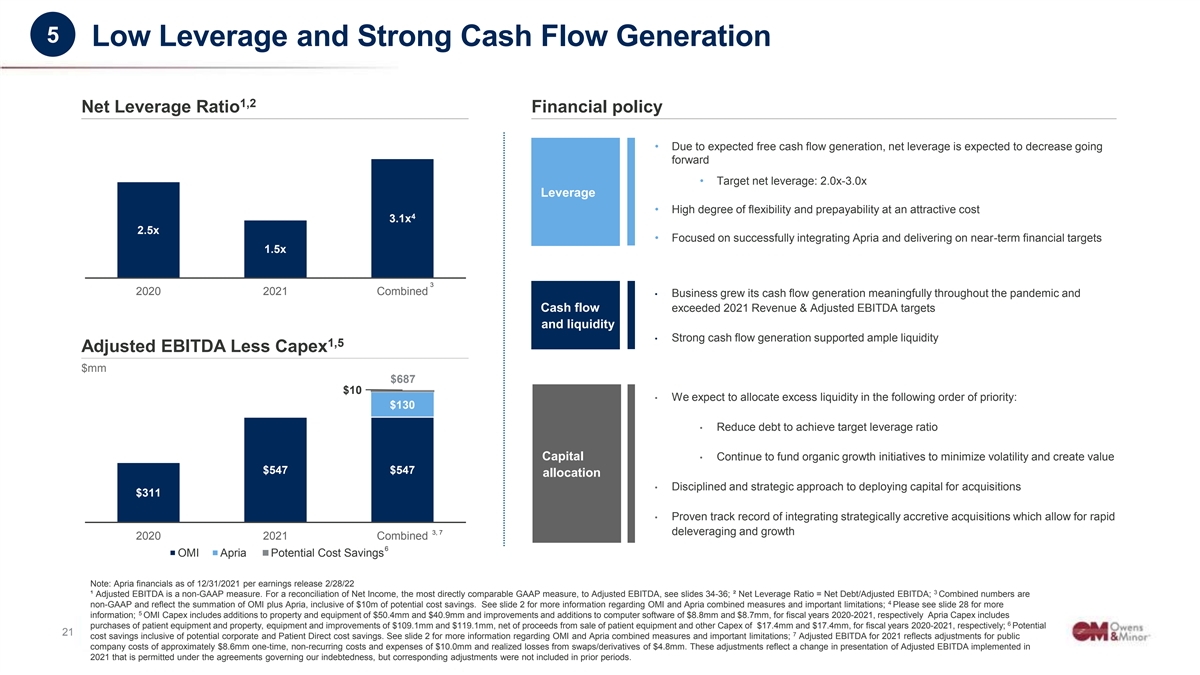
5 Low Leverage and Strong Cash Flow Generation 1,2 Net Leverage Ratio Financial policy • Due to expected free cash flow generation, net leverage is expected to decrease going forward • Target net leverage: 2.0x-3.0x Leverage • High degree of flexibility and prepayability at an attractive cost 4 3.1x 2.5x • Focused on successfully integrating Apria and delivering on near-term financial targets 1.5x 3 2020 2021 Combined • Business grew its cash flow generation meaningfully throughout the pandemic and Cash flow exceeded 2021 Revenue & Adjusted EBITDA targets and liquidity • Strong cash flow generation supported ample liquidity 1,5 Adjusted EBITDA Less Capex $mm $687 $10 • We expect to allocate excess liquidity in the following order of priority: $130 • Reduce debt to achieve target leverage ratio Capital • Continue to fund organic growth initiatives to minimize volatility and create value $547 $547 allocation • Disciplined and strategic approach to deploying capital for acquisitions $311 • Proven track record of integrating strategically accretive acquisitions which allow for rapid 3, 7 deleveraging and growth 2020 2021 Combined 6 OMI Apria Potential Cost Savings Note: Apria financials as of 12/31/2021 per earnings release 2/28/22 3 ¹ Adjusted EBITDA is a non-GAAP measure. For a reconciliation of Net Income, the most directly comparable GAAP measure, to Adjusted EBITDA, see slides 34-36; ² Net Leverage Ratio = Net Debt/Adjusted EBITDA; Combined numbers are 4 non-GAAP and reflect the summation of OMI plus Apria, inclusive of $10m of potential cost savings. See slide 2 for more information regarding OMI and Apria combined measures and important limitations; Please see slide 28 for more 5 information; OMI Capex includes additions to property and equipment of $50.4mm and $40.9mm and improvements and additions to computer software of $8.8mm and $8.7mm, for fiscal years 2020-2021, respectively Apria Capex includes 6 purchases of patient equipment and property, equipment and improvements of $109.1mm and $119.1mm, net of proceeds from sale of patient equipment and other Capex of $17.4mm and $17.4mm, for fiscal years 2020-2021, respectively; Potential C Co on nffide iden nttial ial & & P Pr ro op pr riet ieta ar ry y tto o Ow Owe en ns s & & M Mino inor r,, IIn nc c.. 21 21 7 cost savings inclusive of potential corporate and Patient Direct cost savings. See slide 2 for more information regarding OMI and Apria combined measures and important limitations; Adjusted EBITDA for 2021 reflects adjustments for public company costs of approximately $8.6mm one-time, non-recurring costs and expenses of $10.0mm and realized losses from swaps/derivatives of $4.8mm. These adjustments reflect a change in presentation of Adjusted EBITDA implemented in 2021 that is permitted under the agreements governing our indebtedness, but corresponding adjustments were not included in prior periods.
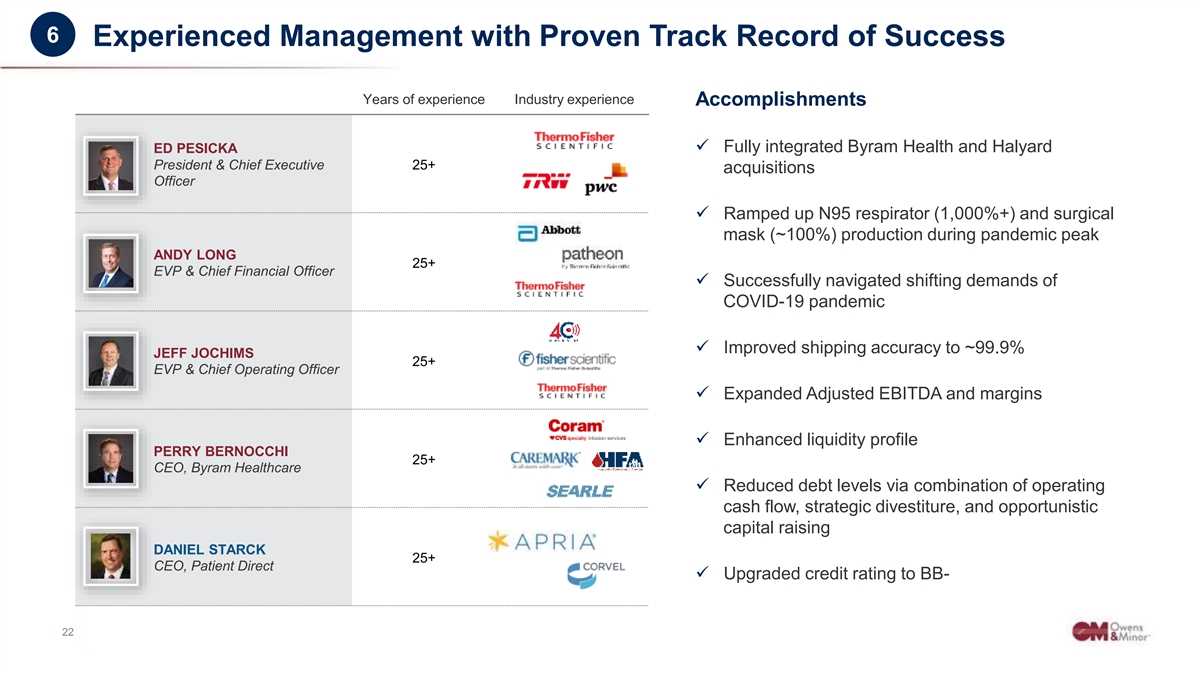
6 Experienced Management with Proven Track Record of Success Years of experience Industry experience Accomplishments ✓ Fully integrated Byram Health and Halyard ED PESICKA President & Chief Executive 25+ acquisitions Officer ✓ Ramped up N95 respirator (1,000%+) and surgical mask (~100%) production during pandemic peak ANDY LONG 25+ EVP & Chief Financial Officer ✓ Successfully navigated shifting demands of COVID-19 pandemic ✓ Improved shipping accuracy to ~99.9% JEFF JOCHIMS 25+ EVP & Chief Operating Officer ✓ Expanded Adjusted EBITDA and margins ✓ Enhanced liquidity profile PERRY BERNOCCHI 25+ CEO, Byram Healthcare ✓ Reduced debt levels via combination of operating cash flow, strategic divestiture, and opportunistic capital raising DANIEL STARCK 25+ CEO, Patient Direct ✓ Upgraded credit rating to BB- C Co on nffide iden nttial ial & & P Pr ro op pr riet ieta ar ry y tto o Ow Owe en ns s & & M Mino inor r,, IIn nc c.. 22 22
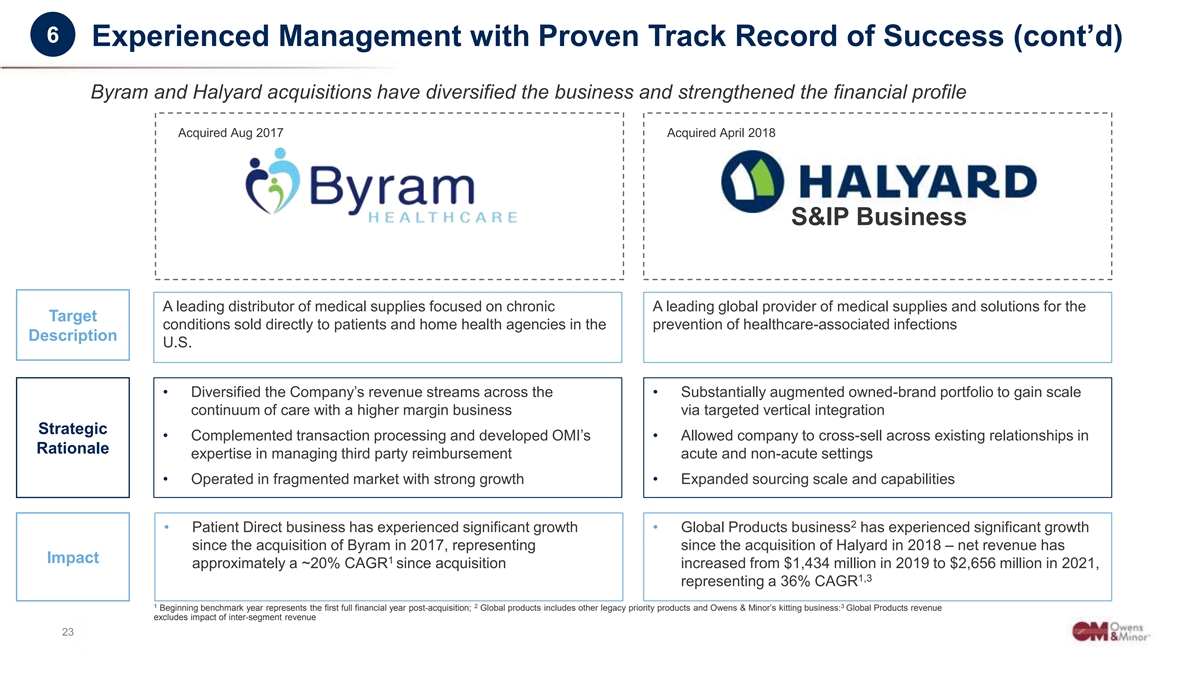
6 Experienced Management with Proven Track Record of Success (cont’d) Byram and Halyard acquisitions have diversified the business and strengthened the financial profile Acquired Aug 2017 Acquired April 2018 S&IP Business A leading distributor of medical supplies focused on chronic A leading global provider of medical supplies and solutions for the Target conditions sold directly to patients and home health agencies in the prevention of healthcare-associated infections Description U.S. • Diversified the Company’s revenue streams across the • Substantially augmented owned-brand portfolio to gain scale continuum of care with a higher margin business via targeted vertical integration Strategic • Complemented transaction processing and developed OMI’s • Allowed company to cross-sell across existing relationships in Rationale expertise in managing third party reimbursement acute and non-acute settings • Operated in fragmented market with strong growth • Expanded sourcing scale and capabilities 2 • Patient Direct business has experienced significant growth • Global Products business has experienced significant growth since the acquisition of Byram in 2017, representing since the acquisition of Halyard in 2018 – net revenue has Impact 1 approximately a ~20% CAGR since acquisition increased from $1,434 million in 2019 to $2,656 million in 2021, 1,3 representing a 36% CAGR 1 2 3 Beginning benchmark year represents the first full financial year post-acquisition; Global products includes other legacy priority products and Owens & Minor’s kitting business: Global Products revenue excludes impact of inter-segment revenue C Co on nffide iden nttial ial & & P Pr ro op pr riet ieta ar ry y tto o Ow Owe en ns s & & M Mino inor r,, IIn nc c.. 23 23
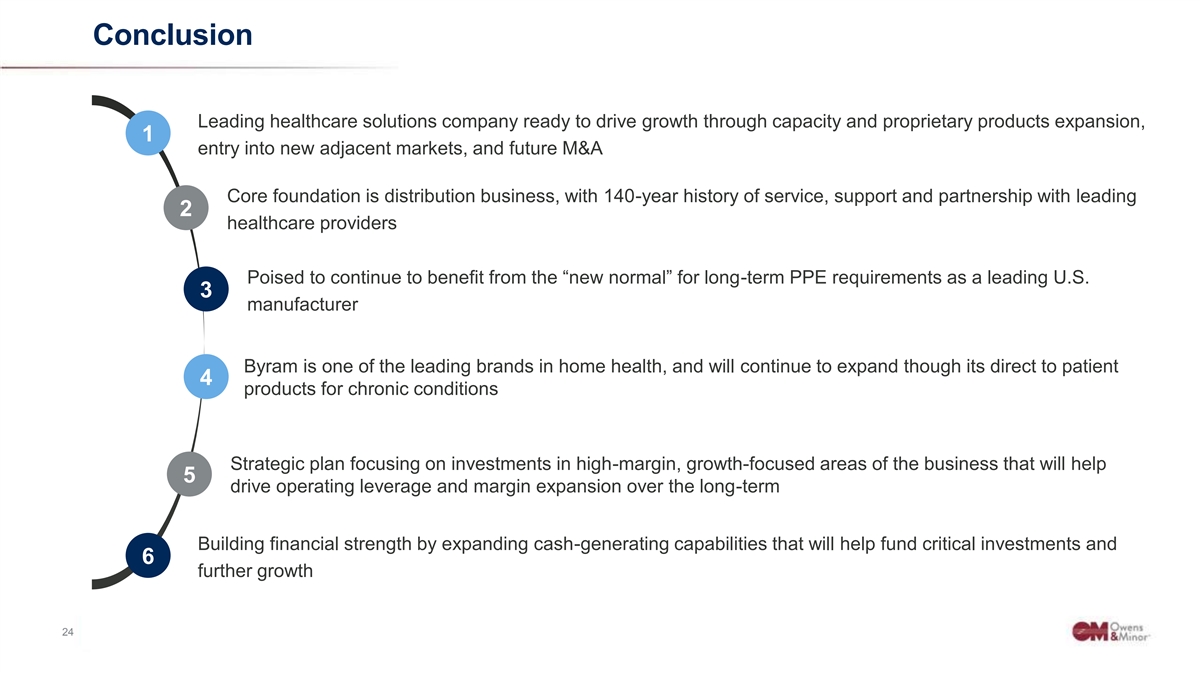
Conclusion Leading healthcare solutions company ready to drive growth through capacity and proprietary products expansion, 1 entry into new adjacent markets, and future M&A Core foundation is distribution business, with 140-year history of service, support and partnership with leading 2 healthcare providers Poised to continue to benefit from the “new normal” for long-term PPE requirements as a leading U.S. 3 manufacturer Byram is one of the leading brands in home health, and will continue to expand though its direct to patient 4 products for chronic conditions Strategic plan focusing on investments in high-margin, growth-focused areas of the business that will help 5 drive operating leverage and margin expansion over the long-term Building financial strength by expanding cash-generating capabilities that will help fund critical investments and 6 further growth C Co on nffide iden nttial ial & & P Pr ro op pr riet ieta ar ry y tto o Ow Owe en ns s & & M Mino inor r,, IIn nc c.. 24 24
Financials C Co on nffide iden nttial ial & & P Pr ro op pr riet ieta ar ry y tto o Ow Owe en ns s & & M Mino inor r,, IIn nc c.. 25 25
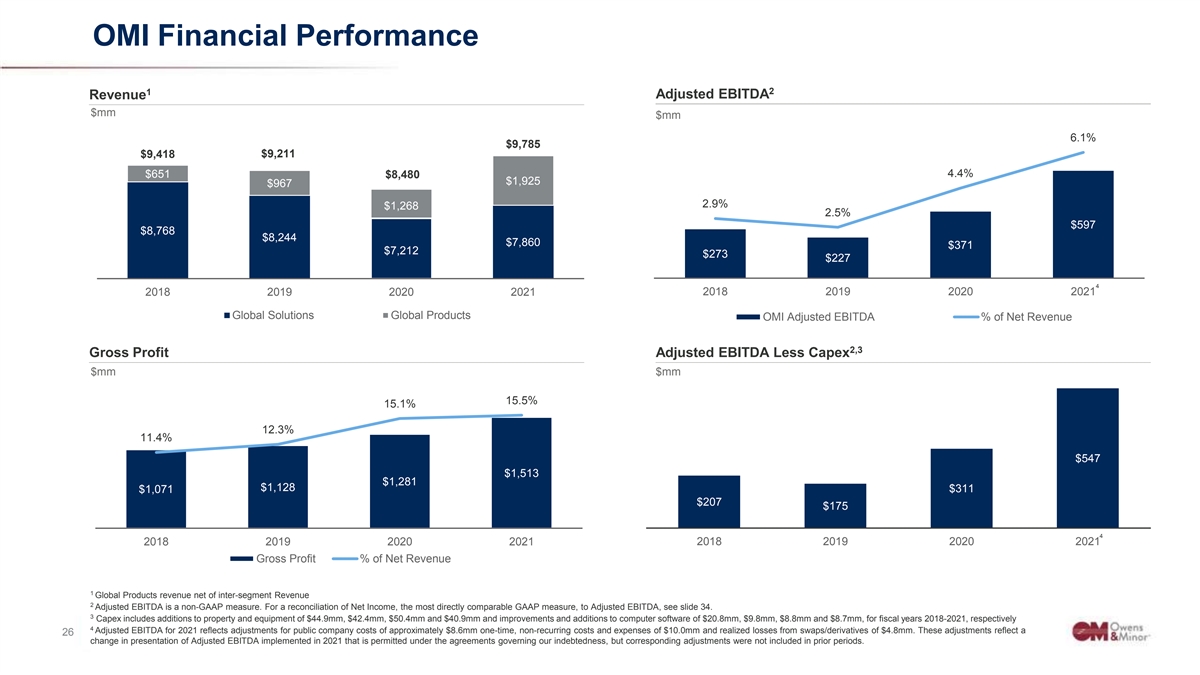
OMI Financial Performance 1 2 Adjusted EBITDA Revenue $mm $mm 6.1% $9,785 $9,418 $9,211 $651 4.4% $8,480 $1,925 $967 2.9% $1,268 2.5% $597 $8,768 $8,244 $7,860 $371 $7,212 $273 $227 4 2018 2019 2020 2021 2018 2019 2020 2021 Global Solutions Global Products OMI Adjusted EBITDA % of Net Revenue 2,3 Gross Profit Adjusted EBITDA Less Capex $mm $mm 15.5% 15.1% 12.3% 11.4% $547 $1,513 $1,281 $1,128 $311 $1,071 $207 $175 4 2018 2019 2020 2021 2018 2019 2020 2021 Gross Profit % of Net Revenue 1 Global Products revenue net of inter-segment Revenue 2 Adjusted EBITDA is a non-GAAP measure. For a reconciliation of Net Income, the most directly comparable GAAP measure, to Adjusted EBITDA, see slide 34. 3 Capex includes additions to property and equipment of $44.9mm, $42.4mm, $50.4mm and $40.9mm and improvements and additions to computer software of $20.8mm, $9.8mm, $8.8mm and $8.7mm, for fiscal years 2018-2021, respectively 4 Adjusted EBITDA for 2021 reflects adjustments for public company costs of approximately $8.6mm one-time, non-recurring costs and expenses of $10.0mm and realized losses from swaps/derivatives of $4.8mm. These adjustments reflect a C Co on nffide iden nttial ial & & P Pr ro op pr riet ieta ar ry y tto o Ow Owe en ns s & & M Mino inor r,, IIn nc c.. 26 26 change in presentation of Adjusted EBITDA implemented in 2021 that is permitted under the agreements governing our indebtedness, but corresponding adjustments were not included in prior periods.
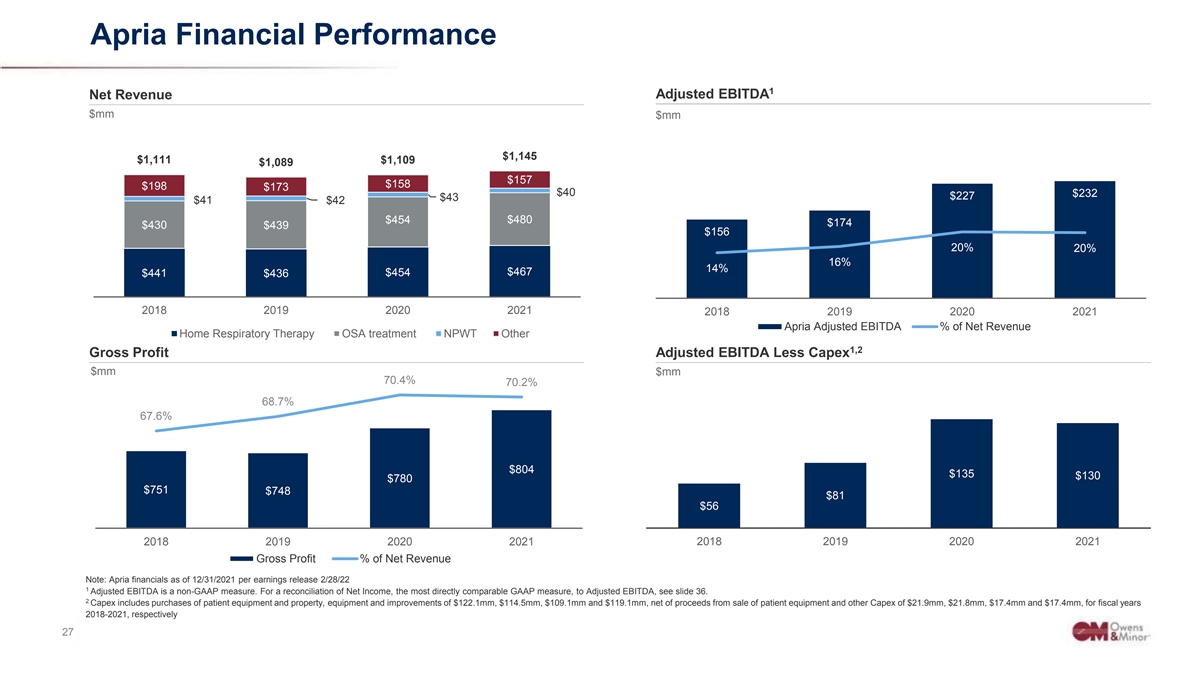
Apria Financial Performance 1 Adjusted EBITDA Net Revenue $mm $mm $1,145 $1,111 $1,109 $1,089 $157 $158 $198 $173 $40 $232 $227 $43 $41 $42 $454 $480 $174 $430 $439 $156 20% 20% 16% 14% $467 $454 $441 $436 2018 2019 2020 2021 2018 2019 2020 2021 Apria Adjusted EBITDA % of Net Revenue Home Respiratory Therapy OSA treatment NPWT Other 1,2 Gross Profit Adjusted EBITDA Less Capex $mm $mm 70.4% 70.2% 68.7% 67.6% $804 $135 $130 $780 $751 $748 $81 $56 2018 2019 2020 2021 2018 2019 2020 2021 Gross Profit % of Net Revenue Note: Apria financials as of 12/31/2021 per earnings release 2/28/22 1 Adjusted EBITDA is a non-GAAP measure. For a reconciliation of Net Income, the most directly comparable GAAP measure, to Adjusted EBITDA, see slide 36. 2 Capex includes purchases of patient equipment and property, equipment and improvements of $122.1mm, $114.5mm, $109.1mm and $119.1mm, net of proceeds from sale of patient equipment and other Capex of $21.9mm, $21.8mm, $17.4mm and $17.4mm, for fiscal years 2018-2021, respectively C Co on nffide iden nttial ial & & P Pr ro op pr riet ieta ar ry y tto o Ow Owe en ns s & & M Mino inor r,, IIn nc c.. 27 27
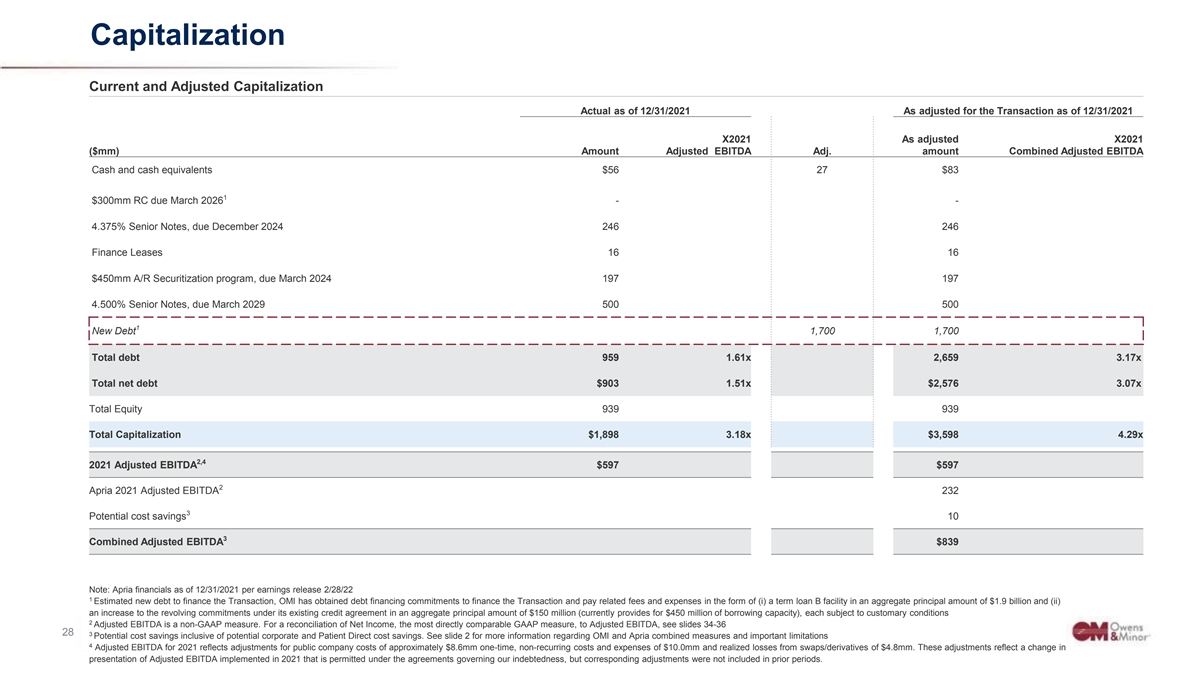
Capitalization Current and Adjusted Capitalization Actual as of 12/31/2021 As adjusted for the Transaction as of 12/31/2021 X2021 As adjusted X2021 ($mm) Amount Adjusted EBITDA Adj. amount Combined Adjusted EBITDA Cash and cash equivalents $56 27 $83 1 $300mm RC due March 2026 - - 4.375% Senior Notes, due December 2024 246 246 Finance Leases 16 16 $450mm A/R Securitization program, due March 2024 197 197 4.500% Senior Notes, due March 2029 500 500 1 New Debt 1,700 1,700 Total debt 959 1.61x 2,659 3.17x Total net debt $903 1.51x $2,576 3.07x Total Equity 939 939 Total Capitalization $1,898 3.18x $3,598 4.29x 2,4 2021 Adjusted EBITDA $597 $597 2 Apria 2021 Adjusted EBITDA 232 3 Potential cost savings 10 3 Combined Adjusted EBITDA $839 Note: Apria financials as of 12/31/2021 per earnings release 2/28/22 1 Estimated new debt to finance the Transaction, OMI has obtained debt financing commitments to finance the Transaction and pay related fees and expenses in the form of (i) a term loan B facility in an aggregate principal amount of $1.9 billion and (ii) an increase to the revolving commitments under its existing credit agreement in an aggregate principal amount of $150 million (currently provides for $450 million of borrowing capacity), each subject to customary conditions 2 Adjusted EBITDA is a non-GAAP measure. For a reconciliation of Net Income, the most directly comparable GAAP measure, to Adjusted EBITDA, see slides 34-36 C Co on nffide iden nttial ial & & P Pr ro op pr riet ieta ar ry y tto o Ow Owe en ns s & & M Mino inor r,, IIn nc c.. 28 28 3 Potential cost savings inclusive of potential corporate and Patient Direct cost savings. See slide 2 for more information regarding OMI and Apria combined measures and important limitations 4 Adjusted EBITDA for 2021 reflects adjustments for public company costs of approximately $8.6mm one-time, non-recurring costs and expenses of $10.0mm and realized losses from swaps/derivatives of $4.8mm. These adjustments reflect a change in presentation of Adjusted EBITDA implemented in 2021 that is permitted under the agreements governing our indebtedness, but corresponding adjustments were not included in prior periods.
Appendix C Co on nffide iden nttial ial & & P Pr ro op pr riet ieta ar ry y tto o Ow Owe en ns s & & M Mino inor r,, IIn nc c.. 29 29
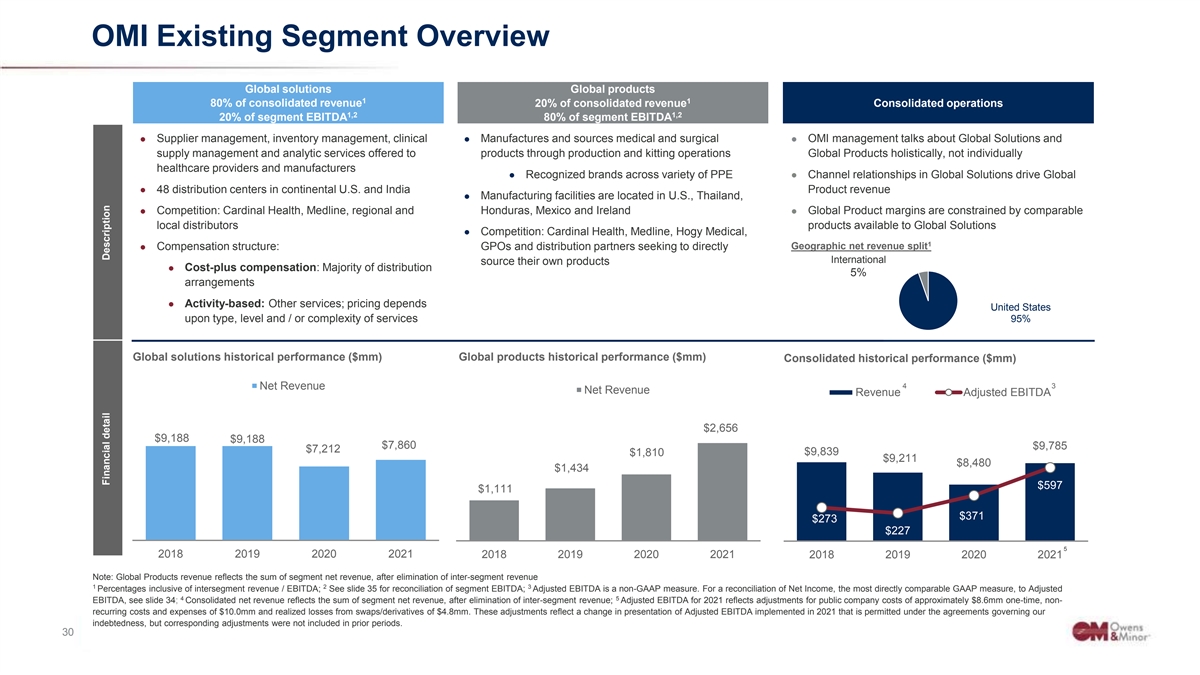
OMI Existing Segment Overview Global solutions Global products 1 1 80% of consolidated revenue 20% of consolidated revenue Consolidated operations 1,2 1,2 20% of segment EBITDA 80% of segment EBITDA ● Supplier management, inventory management, clinical ● Manufactures and sources medical and surgical ● OMI management talks about Global Solutions and supply management and analytic services offered to products through production and kitting operations Global Products holistically, not individually healthcare providers and manufacturers ● Recognized brands across variety of PPE ● Channel relationships in Global Solutions drive Global ● 48 distribution centers in continental U.S. and India Product revenue ● Manufacturing facilities are located in U.S., Thailand, ● Competition: Cardinal Health, Medline, regional and Honduras, Mexico and Ireland ● Global Product margins are constrained by comparable local distributors products available to Global Solutions ● Competition: Cardinal Health, Medline, Hogy Medical, 1 ● Compensation structure: GPOs and distribution partners seeking to directly Geographic net revenue split International source their own products ● Cost-plus compensation: Majority of distribution 5% arrangements ● Activity-based: Other services; pricing depends United States upon type, level and / or complexity of services 95% Global solutions historical performance ($mm) Global products historical performance ($mm) Consolidated historical performance ($mm) 4 3 Net Revenue Net Revenue Revenue Adjusted EBITDA $2,656 $9,188 $9,188 $7,860 $9,785 $7,212 $9,839 $1,810 $9,211 $8,480 $1,434 $597 $1,111 $371 $273 $227 5 2018 2019 2020 2021 2018 2019 2020 2021 2018 2019 2020 2021 Note: Global Products revenue reflects the sum of segment net revenue, after elimination of inter-segment revenue 1 2 3 Percentages inclusive of intersegment revenue / EBITDA; See slide 35 for reconciliation of segment EBITDA; Adjusted EBITDA is a non-GAAP measure. For a reconciliation of Net Income, the most directly comparable GAAP measure, to Adjusted 4 5 EBITDA, see slide 34; Consolidated net revenue reflects the sum of segment net revenue, after elimination of inter-segment revenue; Adjusted EBITDA for 2021 reflects adjustments for public company costs of approximately $8.6mm one-time, non- recurring costs and expenses of $10.0mm and realized losses from swaps/derivatives of $4.8mm. These adjustments reflect a change in presentation of Adjusted EBITDA implemented in 2021 that is permitted under the agreements governing our indebtedness, but corresponding adjustments were not included in prior periods. C Co on nffide iden nttial ial & & P Pr ro op pr riet ieta ar ry y tto o Ow Owe en ns s & & M Mino inor r,, IIn nc c.. 30 30 Financial detail Description
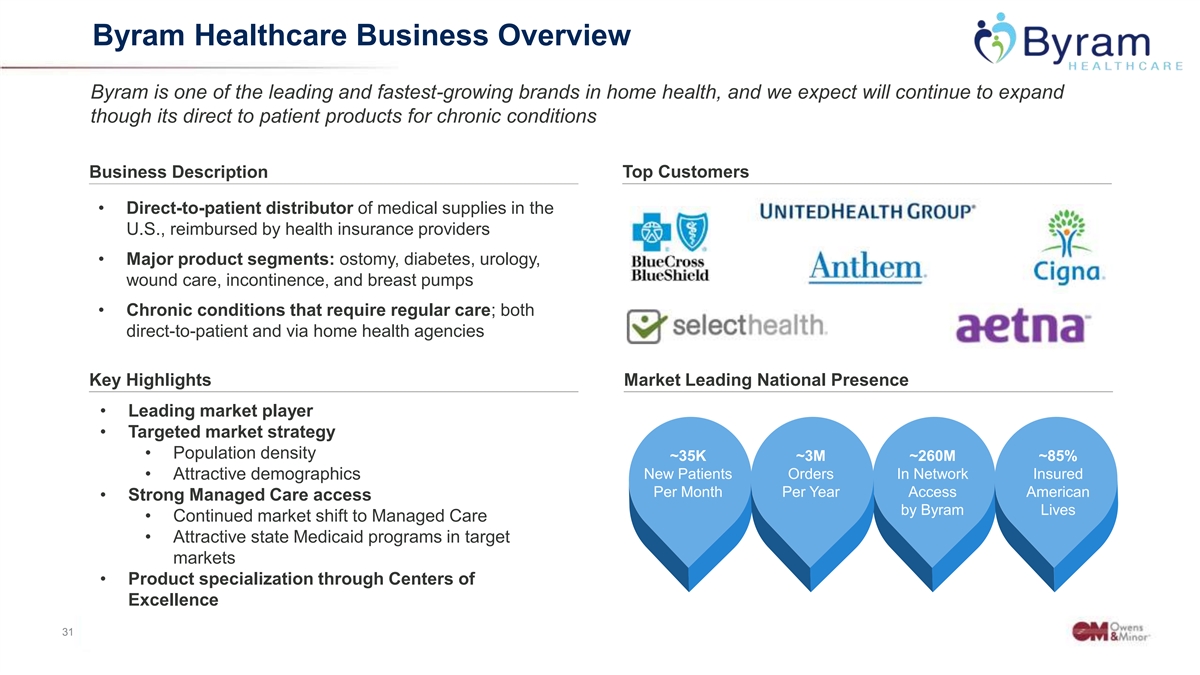
Byram Healthcare Business Overview Byram is one of the leading and fastest-growing brands in home health, and we expect will continue to expand though its direct to patient products for chronic conditions Business Description Top Customers • Direct-to-patient distributor of medical supplies in the U.S., reimbursed by health insurance providers • Major product segments: ostomy, diabetes, urology, wound care, incontinence, and breast pumps • Chronic conditions that require regular care; both direct-to-patient and via home health agencies Key Highlights Market Leading National Presence • Leading market player • Targeted market strategy • Population density ~35K ~3M ~260M ~85% New Patients Orders In Network Insured • Attractive demographics Per Month Per Year Access American • Strong Managed Care access by Byram Lives • Continued market shift to Managed Care • Attractive state Medicaid programs in target markets • Product specialization through Centers of YOU YOU YOU Excellence R R R C Co on nffide iden nttial ial & & P Pr ro op pr riet ieta ar ry y tto o Ow Owe en ns s & & M Mino inor r,, IIn nc c.. 31 31 TITL TITL TITL E E E
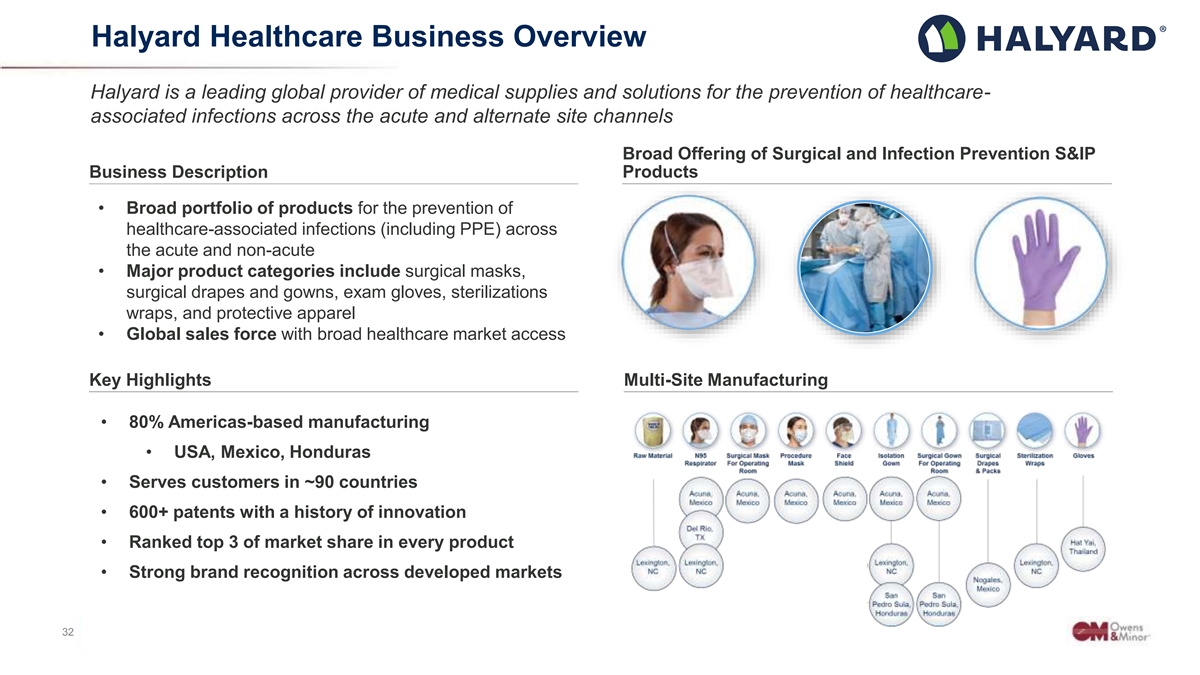
Halyard Healthcare Business Overview Halyard is a leading global provider of medical supplies and solutions for the prevention of healthcare- associated infections across the acute and alternate site channels Broad Offering of Surgical and Infection Prevention S&IP Business Description Products • Broad portfolio of products for the prevention of healthcare-associated infections (including PPE) across the acute and non-acute • Major product categories include surgical masks, surgical drapes and gowns, exam gloves, sterilizations wraps, and protective apparel • Global sales force with broad healthcare market access Key Highlights Multi-Site Manufacturing • 80% Americas-based manufacturing • USA, Mexico, Honduras • Serves customers in ~90 countries • 600+ patents with a history of innovation • Ranked top 3 of market share in every product • Strong brand recognition across developed markets C Co on nffide iden nttial ial & & P Pr ro op pr riet ieta ar ry y tto o Ow Owe en ns s & & M Mino inor r,, IIn nc c.. 32 32
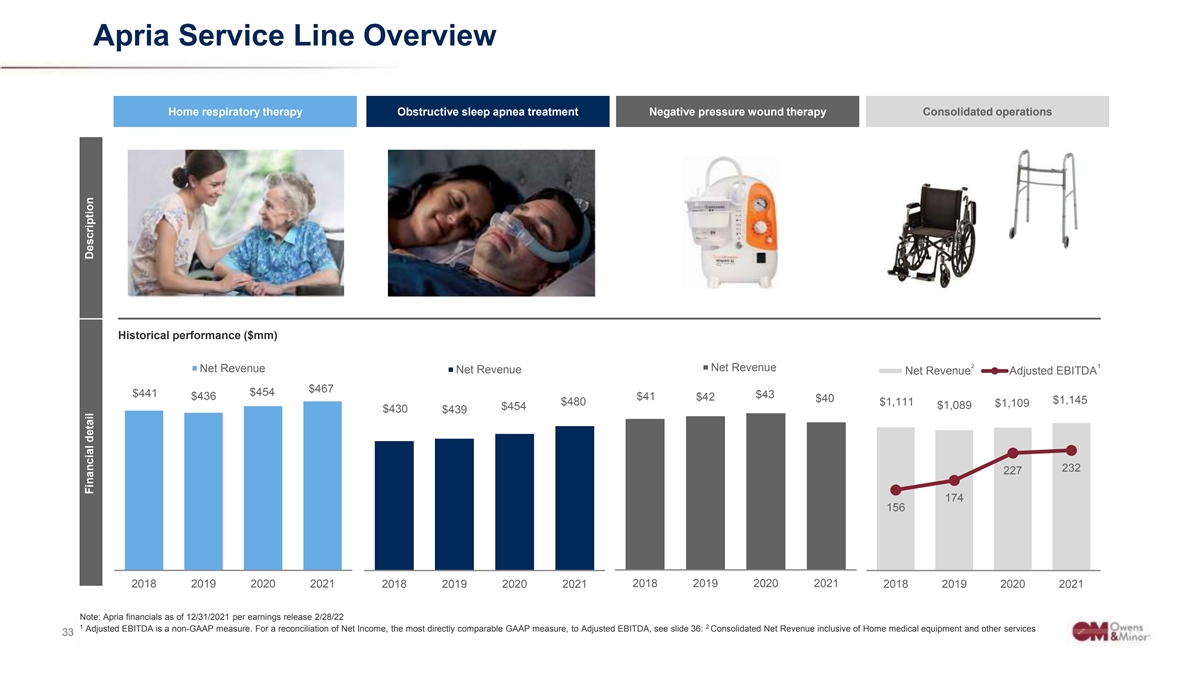
Apria Service Line Overview Home respiratory therapy Obstructive sleep apnea treatment Negative pressure wound therapy Consolidated operations Historical performance ($mm) 2 1 Net Revenue Net Revenue Net Revenue Net Revenue Adjusted EBITDA $467 $454 $441 $43 $436 $41 $42 $40 $1,145 $480 $1,111 $1,109 $1,089 $454 $430 $439 232 227 174 156 2018 2019 2020 2021 2018 2019 2020 2021 2018 2019 2020 2021 2018 2019 2020 2021 Note: Apria financials as of 12/31/2021 per earnings release 2/28/22 1 2 Adjusted EBITDA is a non-GAAP measure. For a reconciliation of Net Income, the most directly comparable GAAP measure, to Adjusted EBITDA, see slide 36: Consolidated Net Revenue inclusive of Home medical equipment and other services Confidential & Proprietary to Owens & Minor, Inc. 33 33 33 Financial detail Description
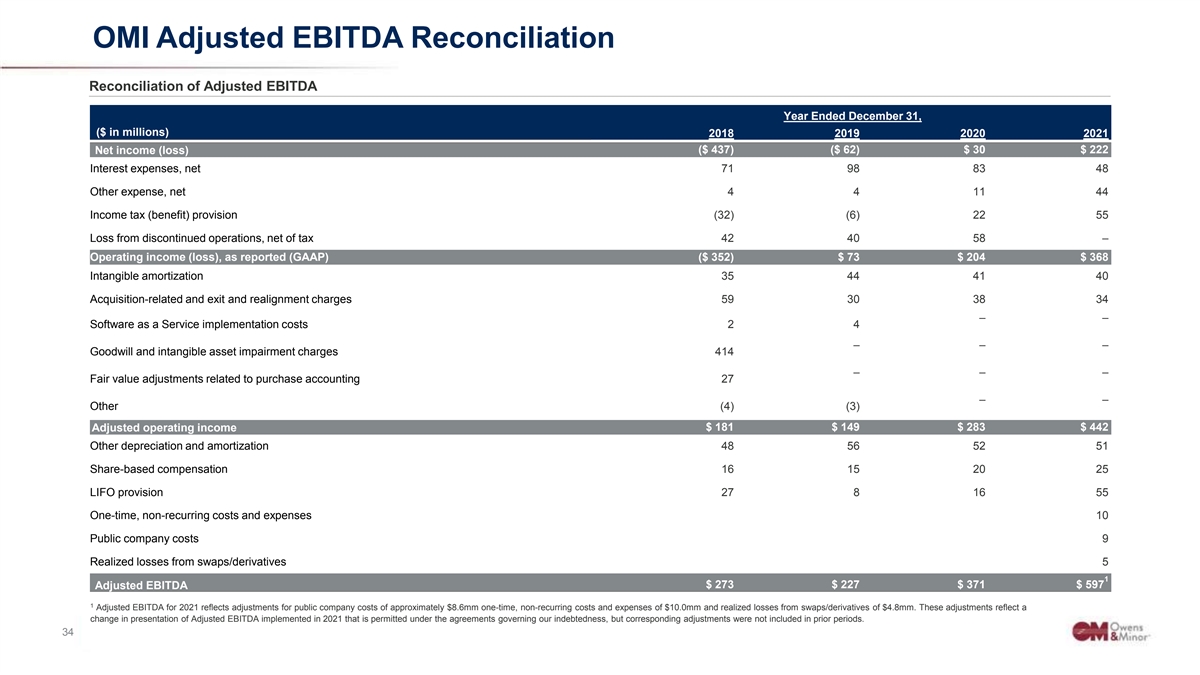
OMI Adjusted EBITDA Reconciliation Reconciliation of Adjusted EBITDA Year Ended December 31, ($ in millions) 2018 2019 2020 2021 ($ 437) ($ 62) $ 30 $ 222 Net income (loss) Interest expenses, net 71 98 83 48 Other expense, net 4 4 11 44 Income tax (benefit) provision (32) (6) 22 55 Loss from discontinued operations, net of tax 42 40 58 – Operating income (loss), as reported (GAAP) ($ 352) $ 73 $ 204 $ 368 Intangible amortization 35 44 41 40 Acquisition-related and exit and realignment charges 59 30 38 34 – – Software as a Service implementation costs 2 4 – – – Goodwill and intangible asset impairment charges 414 – – – Fair value adjustments related to purchase accounting 27 – – Other (4) (3) Adjusted operating income $ 181 $ 149 $ 283 $ 442 Other depreciation and amortization 48 56 52 51 Share-based compensation 16 15 20 25 LIFO provision 27 8 16 55 One-time, non-recurring costs and expenses 10 Public company costs 9 Realized losses from swaps/derivatives 5 1 Adjusted EBITDA $ 273 $ 227 $ 371 $ 597 1 Adjusted EBITDA for 2021 reflects adjustments for public company costs of approximately $8.6mm one-time, non-recurring costs and expenses of $10.0mm and realized losses from swaps/derivatives of $4.8mm. These adjustments reflect a change in presentation of Adjusted EBITDA implemented in 2021 that is permitted under the agreements governing our indebtedness, but corresponding adjustments were not included in prior periods. C Co on nffide iden nttial ial & & P Pr ro op pr riet ieta ar ry y tto o Ow Owe en ns s & & M Mino inor r,, IIn nc c.. 34 34
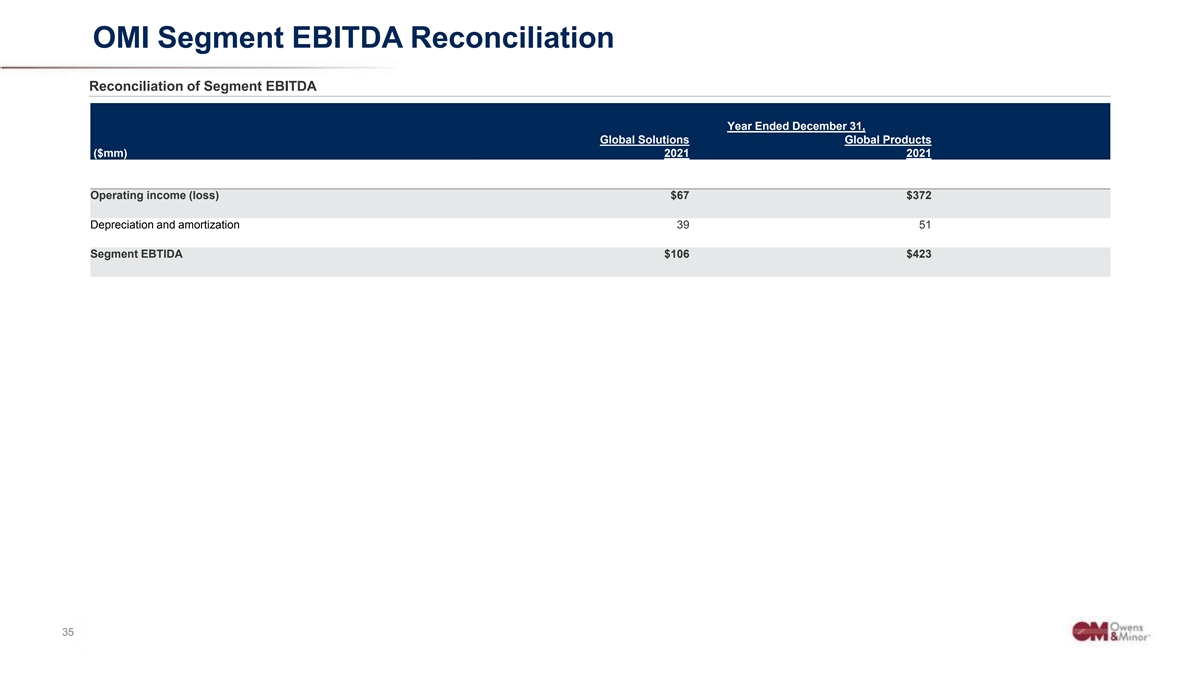
OMI Segment EBITDA Reconciliation Reconciliation of Segment EBITDA Year Ended December 31, Global Solutions Global Products ($mm) 2021 2021 Operating income (loss) $67 $372 Depreciation and amortization 39 51 Segment EBTIDA $106 $423 C Co on nffide iden nttial ial & & P Pr ro op pr riet ieta ar ry y tto o Ow Owe en ns s & & M Mino inor r,, IIn nc c.. 35 35
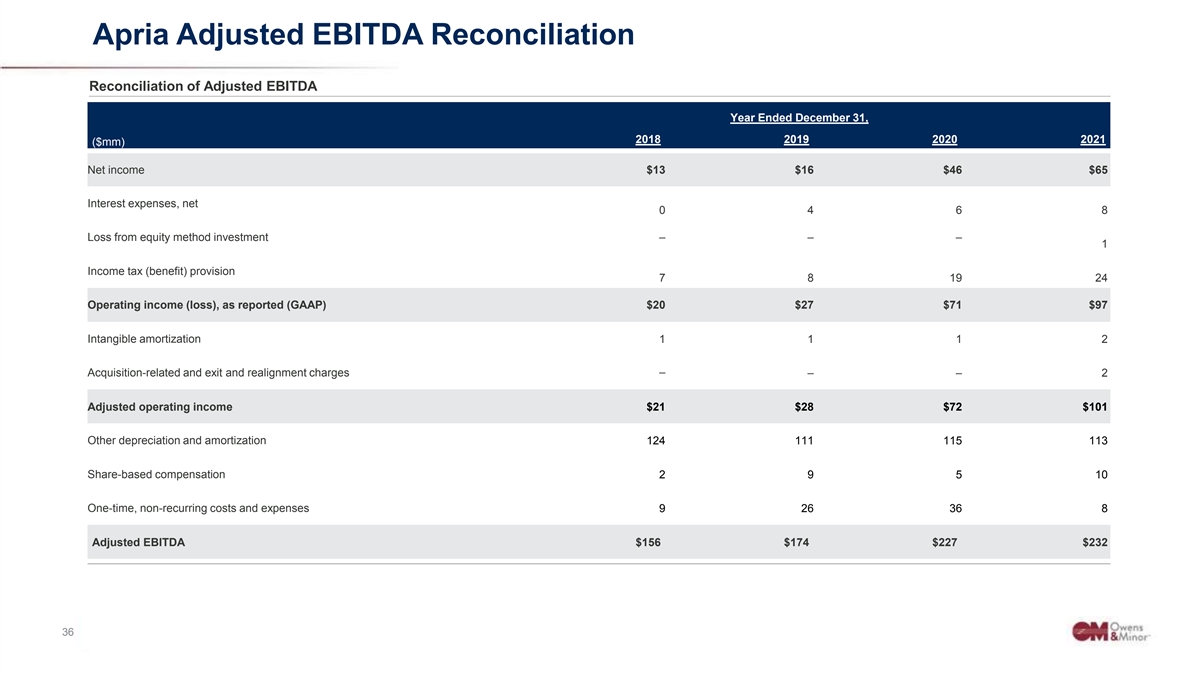
Apria Adjusted EBITDA Reconciliation Reconciliation of Adjusted EBITDA Year Ended December 31, 2018 2019 2020 2021 ($mm) Net income $13 $16 $46 $65 Interest expenses, net 0 4 6 8 Loss from equity method investment – – – 1 Income tax (benefit) provision 7 8 19 24 Operating income (loss), as reported (GAAP) $20 $27 $71 $97 Intangible amortization 1 1 1 2 Acquisition-related and exit and realignment charges – – – 2 Adjusted operating income $21 $28 $72 $101 Other depreciation and amortization 124 111 115 113 Share-based compensation 2 9 5 10 One-time, non-recurring costs and expenses 9 26 36 8 Adjusted EBITDA $156 $174 $227 $232 C Co on nffide iden nttial ial & & P Pr ro op pr riet ieta ar ry y tto o Ow Owe en ns s & & M Mino inor r,, IIn nc c.. 36 36