Exhibit 99.2 Rotech – Investor Presentation July 23, 2024
Disclaimer This presentation is intended to be disclosure through methods reasonably designed to provide broad, non-exclusionary distribution to the public in compliance with the SEC's Fair Disclosure Regulation. This presentation contains certain “forward-looking” statements made pursuant to the Safe Harbor provisions of the Private Securities Litigation Reform Act of 1995. Some of these statements can be identified by terms and phrases such as “outlook,” “believes,” “expects,” “potential,” “continues,” “may,” “will,” “should,” “could,” “seeks,” “predicts,” “intends,” “trends,” “plans,” “estimates,” “anticipates” or the negative version of these words or other comparable words. These statements include, but are not limited to, statements regarding the proposed transaction with Rotech Healthcare Holdings, Inc. (“Rotech”) and opportunities related thereto, Owens & Minor’s (“Owens & Minor’s” or the “Company’s”) expectations with respect to its financial performance and expectations of its business. Forward-looking statements involve known and unknown risks and uncertainties that may cause our actual results in future periods to differ materially from those projected, targeted or contemplated in the forward-looking statements, including the occurrence of any event, change or other circumstances that could give rise to the termination of the agreement relating to the proposed transaction; risks related to disruption of management’s attention from Owens & Minor’s ongoing business operations due to the proposed transaction; the effect of the announcement of the proposed transaction on Owens & Minor’s or Rotech’s relationships with its customers, suppliers and other third parties, as well as operating results and their businesses generally; the risk that the proposed transaction will not be consummated in a timely manner or at all; exceeding the expected costs of the transaction; the risk that problems may arise in successfully integrating the businesses of the companies, which may result in the combined company not operating as effectively and efficiently as expected and the risk that the combined company may be unable to achieve synergies or it may take longer than expected to achieve those synergies. Investors should refer to Owen & Minor’s Annual Report on Form 10-K for the year ended December 31, 2023, including the sections captioned ‘Cautionary Note Regarding Forward-Looking Statements’ and ‘Item 1A. Risk Factors,’ and subsequent Quarterly Reports on Form 10-Q and Current Reports on Form 8-K filed with or furnished to the SEC, for a discussion of certain known risk factors that could cause the actual results to differ materially from those projected, targeted or contemplated in the forward-looking statements. Given these risks and uncertainties, Owens & Minor can give no assurance that any forward-looking statements will, in fact, transpire and, therefore, cautions investors not to place undue reliance on them. Owens & Minor specifically disclaims any obligation to update or revise any forward-looking statements, as a result of new information, future developments or otherwise. This presentation includes certain combined financial information which reflects the sum of the relevant financial information for the Company and Rotech without any other adjustments and refer to such presentation as on a pro forma basis for the applicable period. This combination does not comply with U.S. GAAP or with the rules for pro forma presentation. As a result, the combined financial information included in this presentation may differ from pro forma financial information prepared in accordance with U.S. GAAP and the rules and regulations of the SEC, and any such differences could be material. Certain financial measures included herein are not made in accordance with U.S. GAAP, including Adjusted EBITDA and Adjusted EPS, and use of such terms varies from others in the same industry. Management uses these non-GAAP financial measures internally to evaluate our performance, evaluate the balance sheet, engage in financial and operational planning and determine incentive compensation. Non-GAAP financial measures should not be considered as alternatives to measures derived in accordance with U.S. GAAP. Non-GAAP financial measures have important limitations as analytical tools and you should not consider them in isolation or as substitutes for results as reported in accordance with U.S. GAAP. Projected or targeted GAAP financial measures and reconciliations of projected or targeted non-GAAP financial measures are not provided herein because such GAAP financial measures are not available on a forward-looking basis and such reconciliations could not be derived without unreasonable effort. Note: To be updated to reflect final presentation. Owens & Minor uses its web site, www.owens-minor.com, as a channel of distribution for material Company information, including news releases, investor presentations and financial information. This information is routinely posted and accessible under the Investor Relations section. 2 2
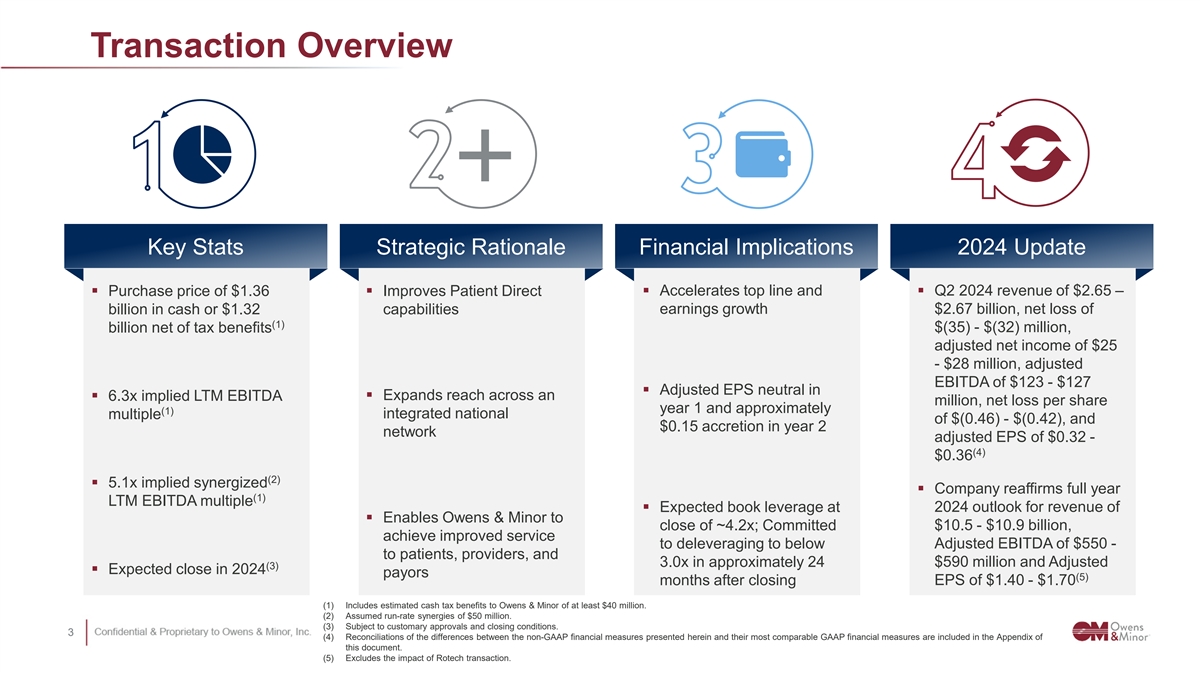
Transaction Overview Key Stats Strategic Rationale Financial Implications 2024 Update § Purchase price of $1.36 § Improves Patient Direct § Accelerates top line and § Q2 2024 revenue of $2.65 – earnings growth $2.67 billion, net loss of billion in cash or $1.32 capabilities (1) billion net of tax benefits $(35) - $(32) million, adjusted net income of $25 - $28 million, adjusted EBITDA of $123 - $127 § Adjusted EPS neutral in § Expands reach across an § 6.3x implied LTM EBITDA million, net loss per share year 1 and approximately (1) multiple integrated national of $(0.46) - $(0.42), and $0.15 accretion in year 2 network adjusted EPS of $0.32 - (4) $0.36 (2) § 5.1x implied synergized § Company reaffirms full year (1) LTM EBITDA multiple § Expected book leverage at 2024 outlook for revenue of § Enables Owens & Minor to close of ~4.2x; Committed $10.5 - $10.9 billion, achieve improved service to deleveraging to below Adjusted EBITDA of $550 - to patients, providers, and 3.0x in approximately 24 $590 million and Adjusted (3) § Expected close in 2024 payors (5) months after closing EPS of $1.40 - $1.70 (1) Includes estimated cash tax benefits to Owens & Minor of at least $40 million. (2) Assumed run-rate synergies of $50 million. (3) Subject to customary approvals and closing conditions. 3 3 (4) Reconciliations of the differences between the non-GAAP financial measures presented herein and their most comparable GAAP financial measures are included in the Appendix of this document. (5) Excludes the impact of Rotech transaction. 2
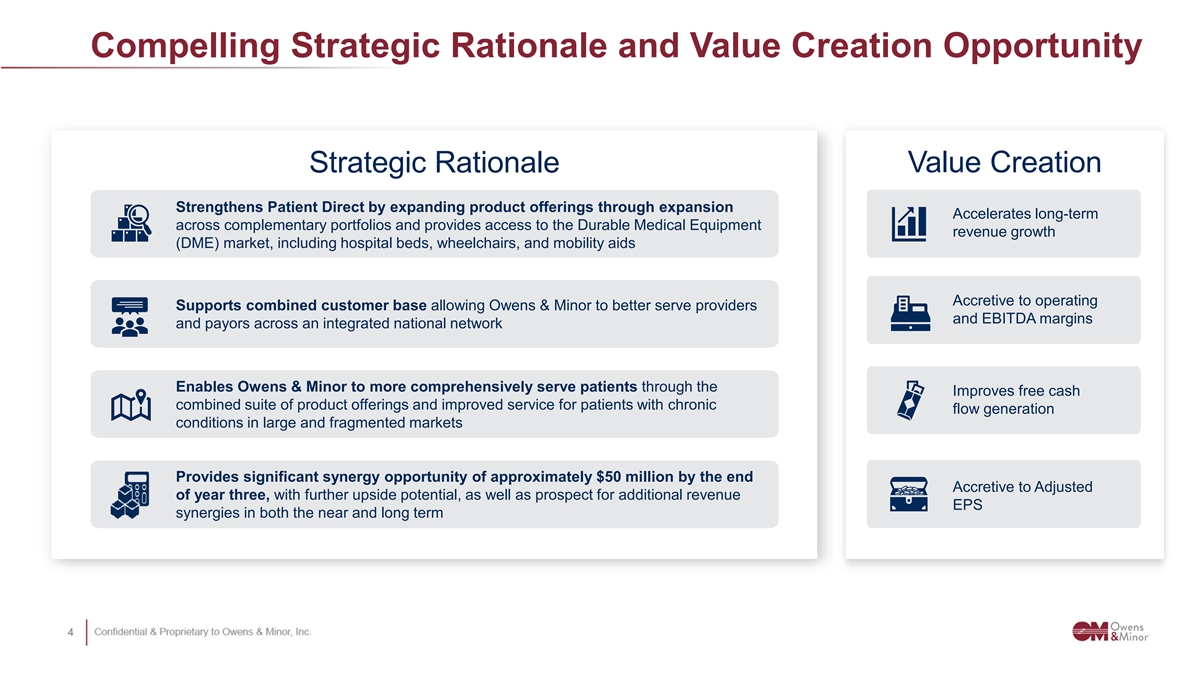
Compelling Strategic Rationale and Value Creation Opportunity Strategic Rationale Value Creation Strengthens Patient Direct by expanding product offerings through expansion Accelerates long-term across complementary portfolios and provides access to the Durable Medical Equipment revenue growth (DME) market, including hospital beds, wheelchairs, and mobility aids Accretive to operating Supports combined customer base allowing Owens & Minor to better serve providers and EBITDA margins and payors across an integrated national network Enables Owens & Minor to more comprehensively serve patients through the Improves free cash combined suite of product offerings and improved service for patients with chronic flow generation conditions in large and fragmented markets Provides significant synergy opportunity of approximately $50 million by the end Accretive to Adjusted of year three, with further upside potential, as well as prospect for additional revenue EPS synergies in both the near and long term 4 4
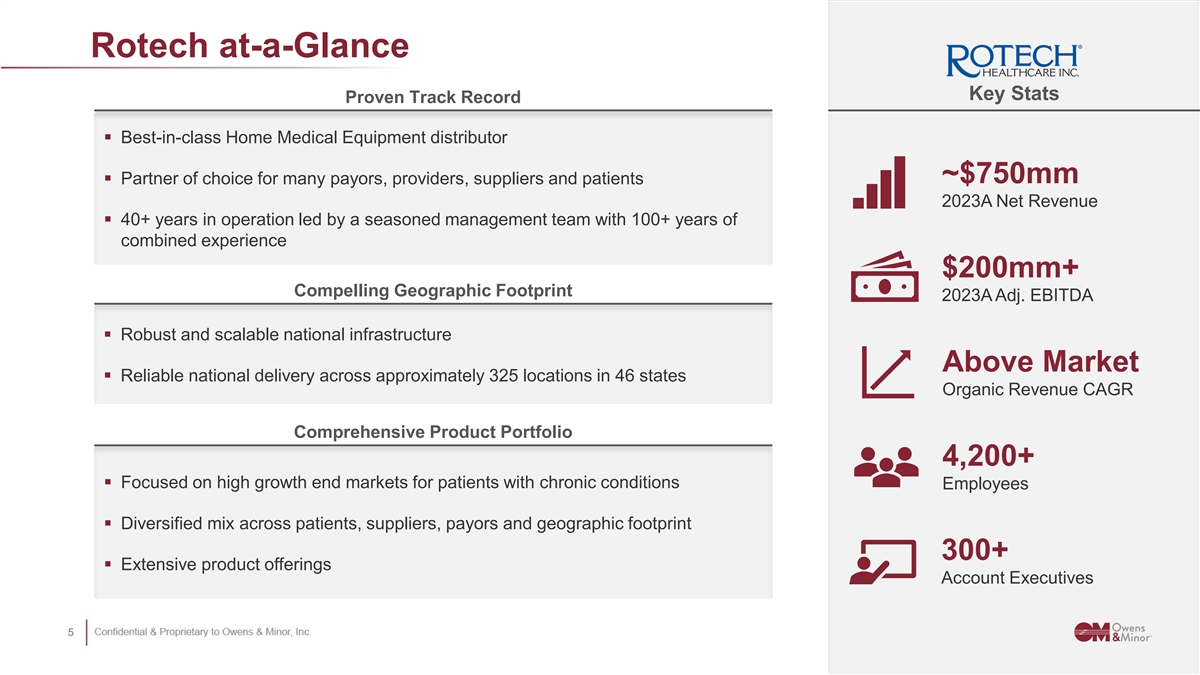
Rotech at-a-Glance Key Stats Proven Track Record § Best-in-class Home Medical Equipment distributor ~$750mm § Partner of choice for many payors, providers, suppliers and patients 2023A Net Revenue § 40+ years in operation led by a seasoned management team with 100+ years of combined experience $200mm+ Compelling Geographic Footprint 2023A Adj. EBITDA § Robust and scalable national infrastructure Above Market § Reliable national delivery across approximately 325 locations in 46 states Organic Revenue CAGR Comprehensive Product Portfolio 4,200+ § Focused on high growth end markets for patients with chronic conditions Employees § Diversified mix across patients, suppliers, payors and geographic footprint 300+ § Extensive product offerings Account Executives 5 5
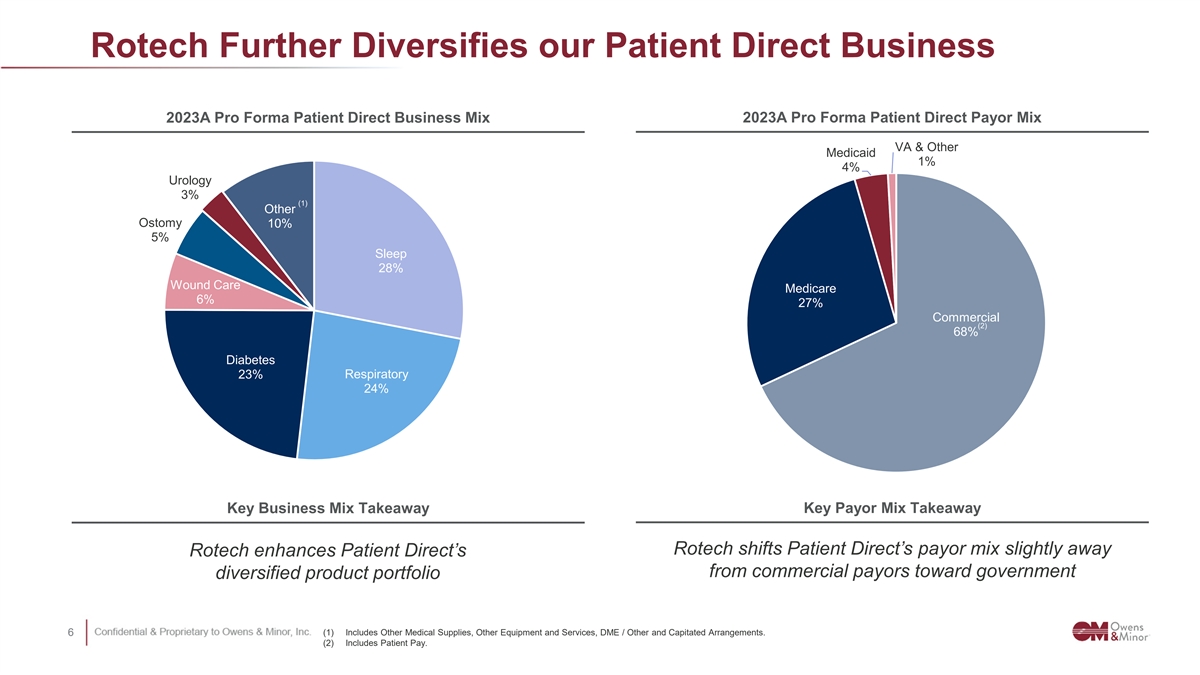
Rotech Further Diversifies our Patient Direct Business 2023A Pro Forma Patient Direct Business Mix 2023A Pro Forma Patient Direct Payor Mix VA & Other Medicaid 1% 4% Urology 3% (1) Other Ostomy 10% 5% Sleep 28% Wound Care Medicare 6% 27% Commercial (2) 68% Diabetes 23% Respiratory 24% Key Business Mix Takeaway Key Payor Mix Takeaway Rotech shifts Patient Direct’s payor mix slightly away Rotech enhances Patient Direct’s from commercial payors toward government diversified product portfolio 6 6 (1) Includes Other Medical Supplies, Other Equipment and Services, DME / Other and Capitated Arrangements. (2) Includes Patient Pay.
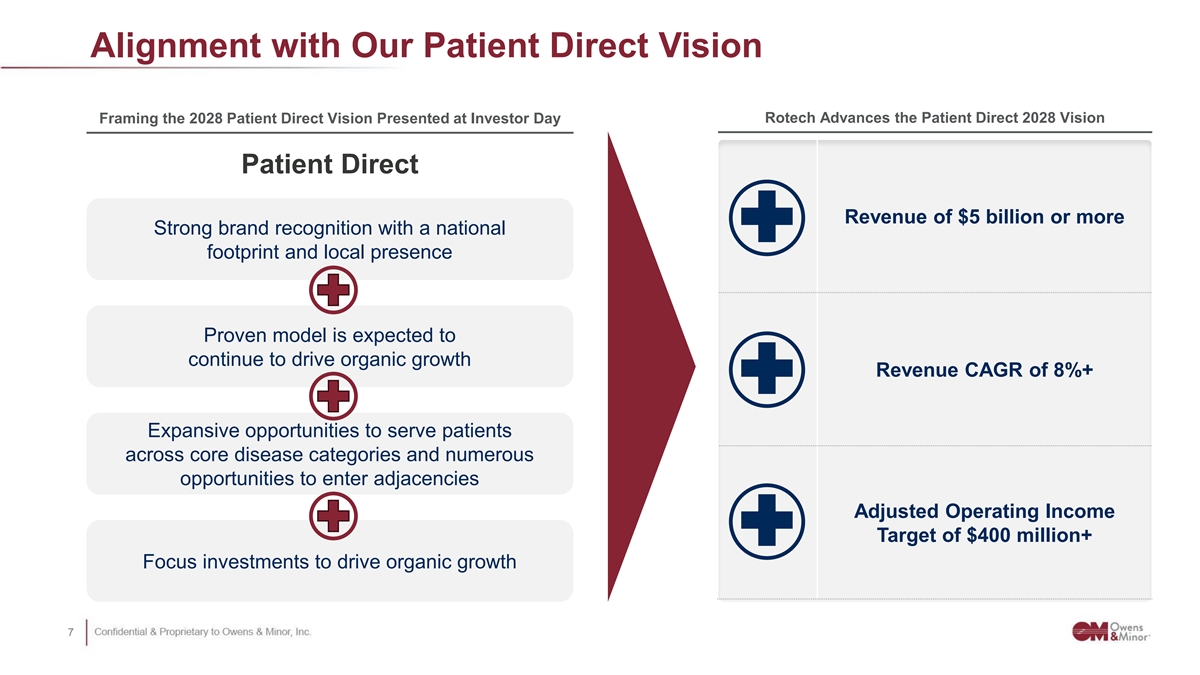
Alignment with Our Patient Direct Vision Rotech Advances the Patient Direct 2028 Vision Framing the 2028 Patient Direct Vision Presented at Investor Day Patient Direct Revenue of $5 billion or more Strong brand recognition with a national footprint and local presence Proven model is expected to continue to drive organic growth Revenue CAGR of 8%+ Expansive opportunities to serve patients across core disease categories and numerous opportunities to enter adjacencies Adjusted Operating Income Target of $400 million+ Focus investments to drive organic growth 7 7
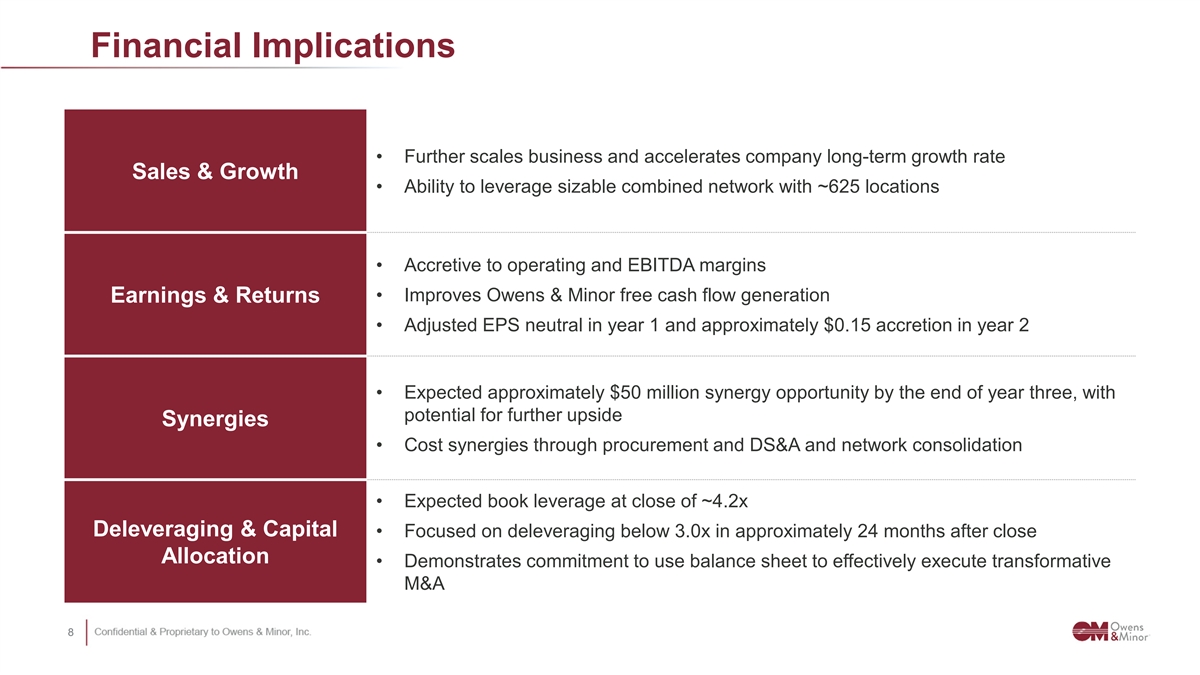
Financial Implications • Further scales business and accelerates company long-term growth rate Sales & Growth • Ability to leverage sizable combined network with ~625 locations • Accretive to operating and EBITDA margins • Improves Owens & Minor free cash flow generation Earnings & Returns • Adjusted EPS neutral in year 1 and approximately $0.15 accretion in year 2 • Expected approximately $50 million synergy opportunity by the end of year three, with potential for further upside Synergies • Cost synergies through procurement and DS&A and network consolidation • Expected book leverage at close of ~4.2x Deleveraging & Capital • Focused on deleveraging below 3.0x in approximately 24 months after close Allocation • Demonstrates commitment to use balance sheet to effectively execute transformative M&A 8 8
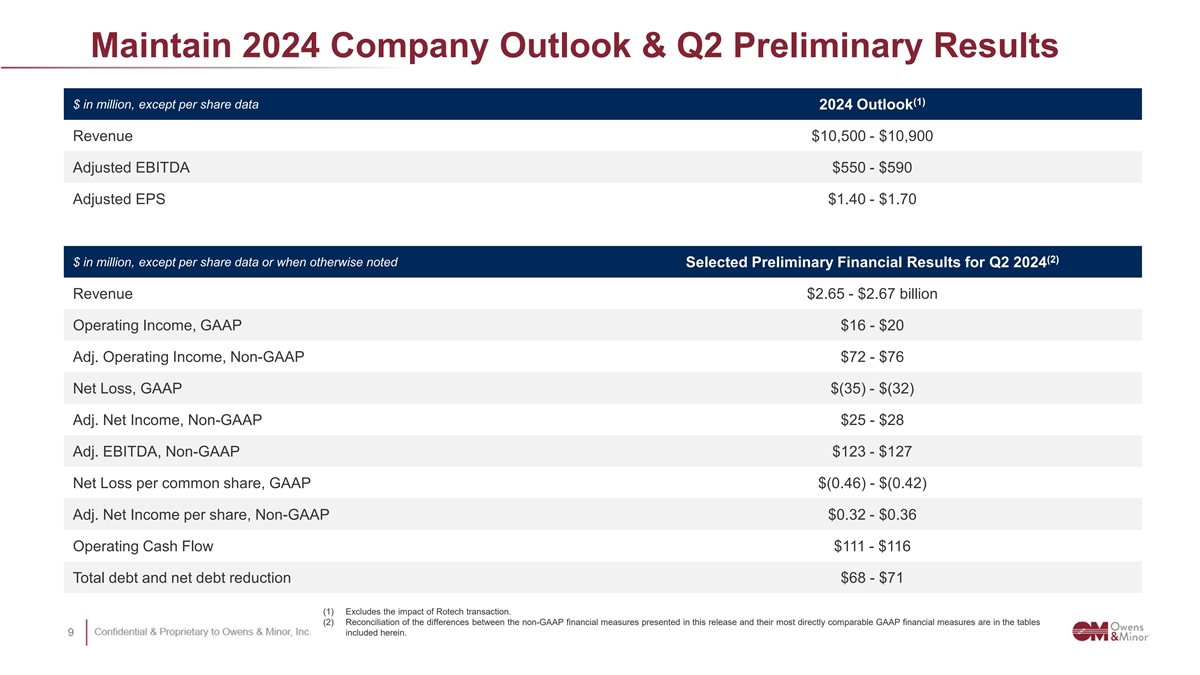
Maintain 2024 Company Outlook & Q2 Preliminary Results (1) $ in million, except per share data 2024 Outlook Revenue $10,500 - $10,900 Adjusted EBITDA $550 - $590 Adjusted EPS $1.40 - $1.70 (2) $ in million, except per share data or when otherwise noted Selected Preliminary Financial Results for Q2 2024 Revenue $2.65 - $2.67 billion Operating Income, GAAP $16 - $20 Adj. Operating Income, Non-GAAP $72 - $76 Net Loss, GAAP $(35) - $(32) Adj. Net Income, Non-GAAP $25 - $28 Adj. EBITDA, Non-GAAP $123 - $127 Net Loss per common share, GAAP $(0.46) - $(0.42) Adj. Net Income per share, Non-GAAP $0.32 - $0.36 Operating Cash Flow $111 - $116 Total debt and net debt reduction $68 - $71 (1) Excludes the impact of Rotech transaction. (2) Reconciliation of the differences between the non-GAAP financial measures presented in this release and their most directly comparable GAAP financial measures are in the tables 9 9 included herein.
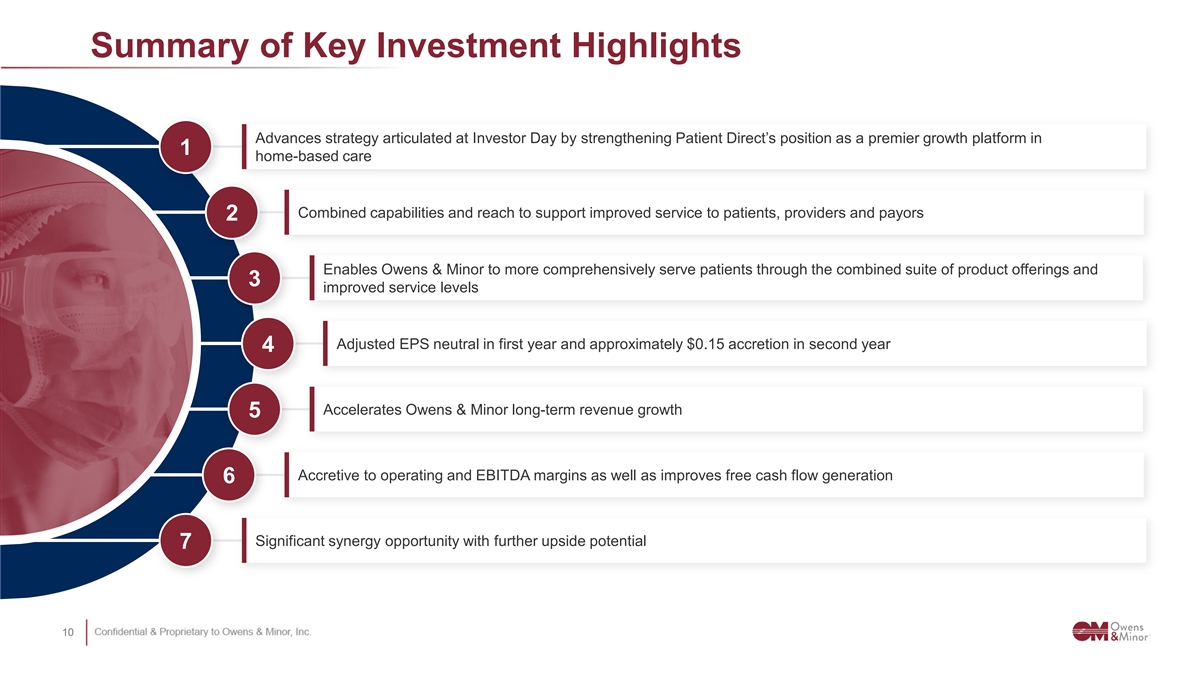
Summary of Key Investment Highlights Advances strategy articulated at Investor Day by strengthening Patient Direct’s position as a premier growth platform in 1 home-based care Combined capabilities and reach to support improved service to patients, providers and payors 2 Enables Owens & Minor to more comprehensively serve patients through the combined suite of product offerings and 3 improved service levels Adjusted EPS neutral in first year and approximately $0.15 accretion in second year 4 Accelerates Owens & Minor long-term revenue growth 5 Accretive to operating and EBITDA margins as well as improves free cash flow generation 6 Significant synergy opportunity with further upside potential 7 10 10

• • • A P P E N D I X • • •
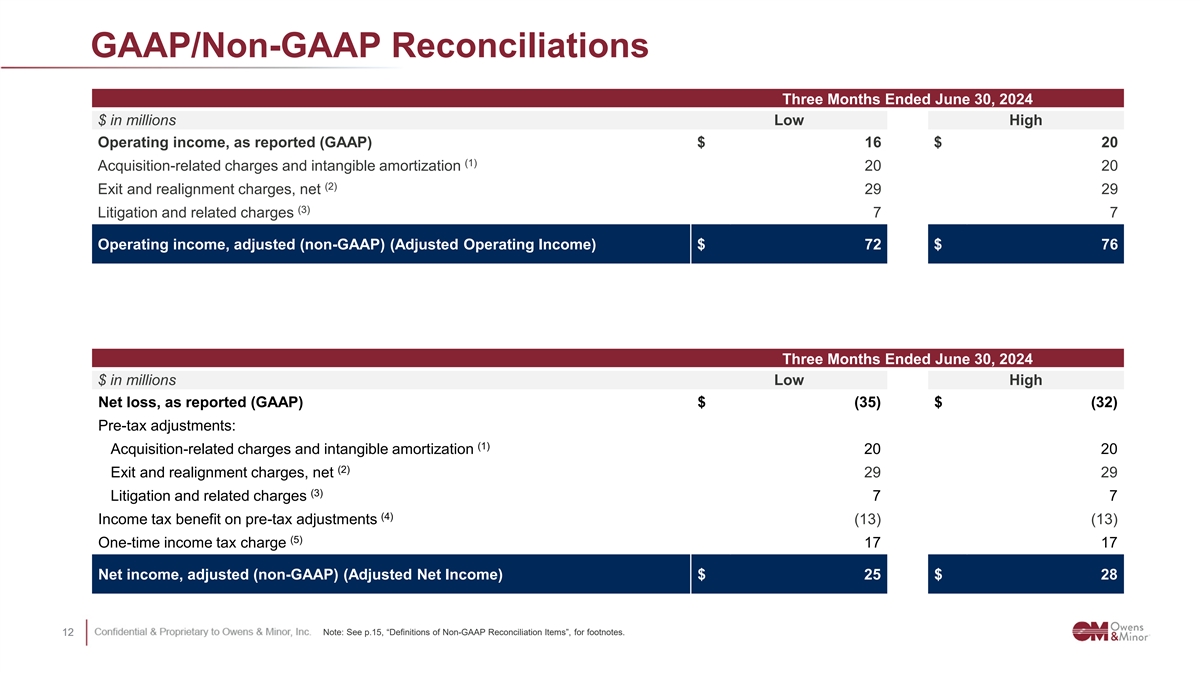
GAAP/Non-GAAP Reconciliations Three Months Ended June 30, 2024 $ in millions Low High Operating income, as reported (GAAP) $ 16 $ 20 (1) Acquisition-related charges and intangible amortization 20 20 (2) Exit and realignment charges, net 29 29 (3) Litigation and related charges 7 7 Operating income, adjusted (non-GAAP) (Adjusted Operating Income) $ 72 $ 76 Three Months Ended June 30, 2024 $ in millions Low High Net loss, as reported (GAAP) $ (35) $ (32) Pre-tax adjustments: (1) Acquisition-related charges and intangible amortization 20 20 (2) Exit and realignment charges, net 29 29 (3) Litigation and related charges 7 7 (4) Income tax benefit on pre-tax adjustments (13) (13) (5) One-time income tax charge 17 17 Net income, adjusted (non-GAAP) (Adjusted Net Income) $ 25 $ 28 Note: See p.15, “Definitions of Non-GAAP Reconciliation Items”, for footnotes. 12 12
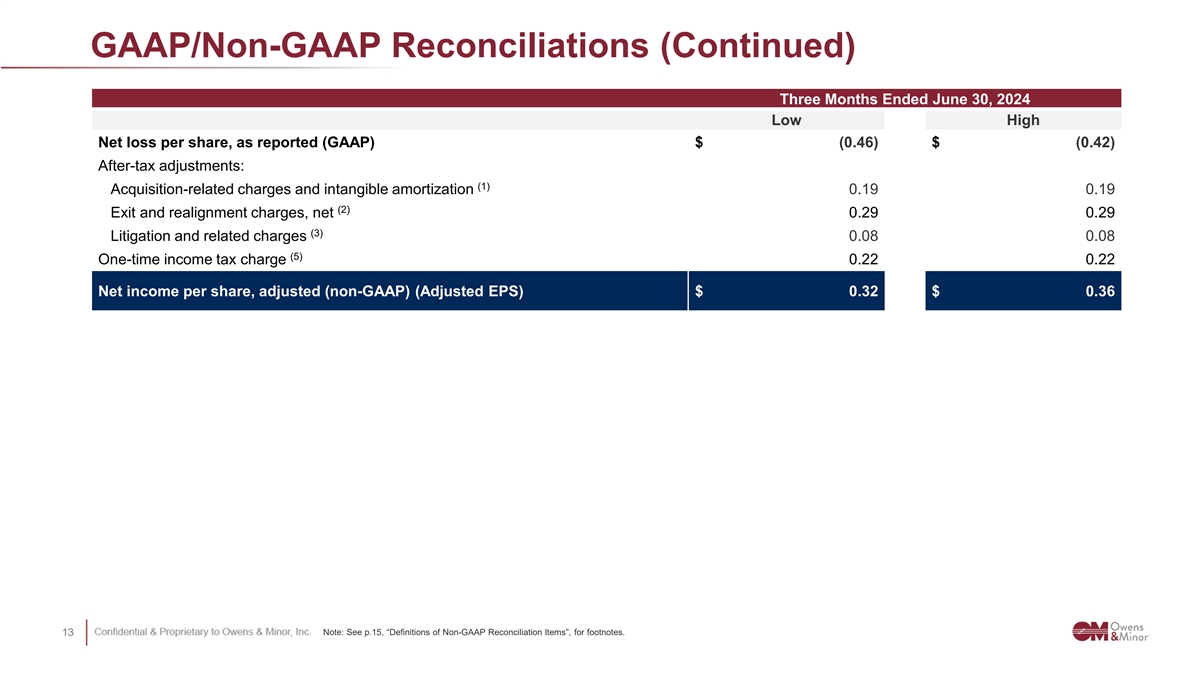
GAAP/Non-GAAP Reconciliations (Continued) Three Months Ended June 30, 2024 Low High Net loss per share, as reported (GAAP) $ (0.46) $ (0.42) After-tax adjustments: (1) Acquisition-related charges and intangible amortization 0.19 0.19 (2) Exit and realignment charges, net 0.29 0.29 (3) Litigation and related charges 0.08 0.08 (5) One-time income tax charge 0.22 0.22 Net income per share, adjusted (non-GAAP) (Adjusted EPS) $ 0.32 $ 0.36 Note: See p.15, “Definitions of Non-GAAP Reconciliation Items”, for footnotes. 13 13
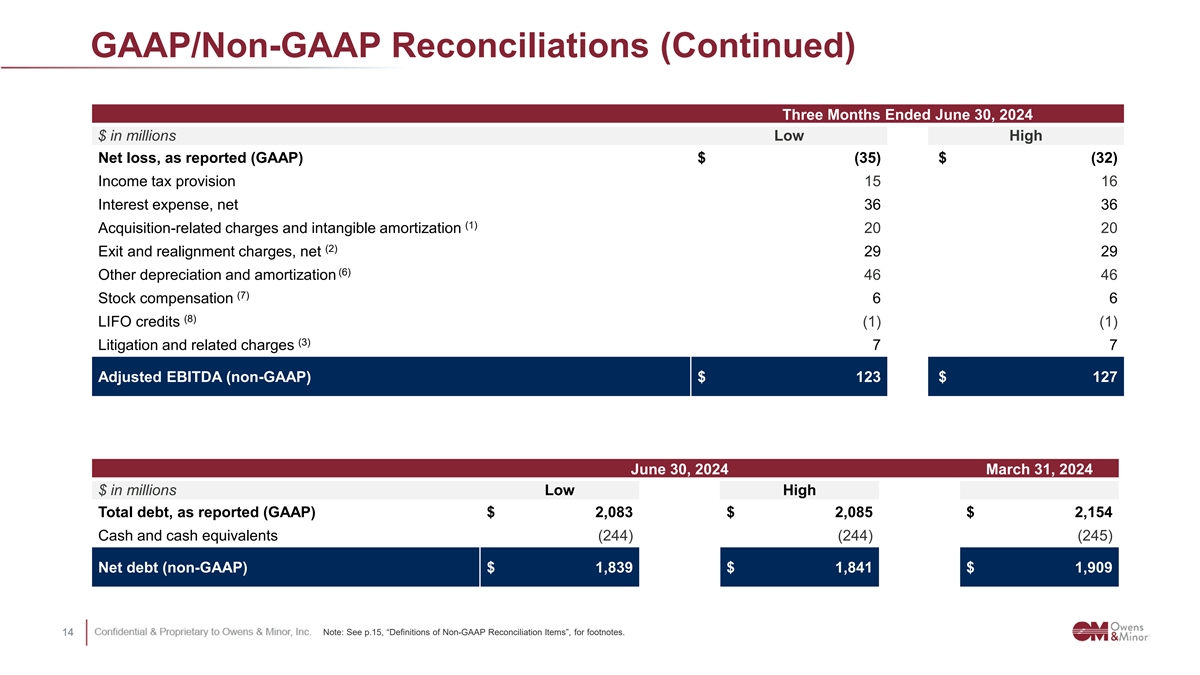
GAAP/Non-GAAP Reconciliations (Continued) Three Months Ended June 30, 2024 $ in millions Low High Net loss, as reported (GAAP) $ (35) $ (32) Income tax provision 15 16 Interest expense, net 36 36 (1) Acquisition-related charges and intangible amortization 20 20 (2) Exit and realignment charges, net 29 29 (6) Other depreciation and amortization 46 46 (7) Stock compensation 6 6 (8) LIFO credits (1) (1) (3) Litigation and related charges 7 7 Adjusted EBITDA (non-GAAP) $ 123 $ 127 June 30, 2024 March 31, 2024 $ in millions Low High Total debt, as reported (GAAP) $ 2,083 $ 2,085 $ 2,154 Cash and cash equivalents (244) (244) (245) Net debt (non-GAAP) $ 1,839 $ 1,841 $ 1,909 Note: See p.15, “Definitions of Non-GAAP Reconciliation Items”, for footnotes. 14 14
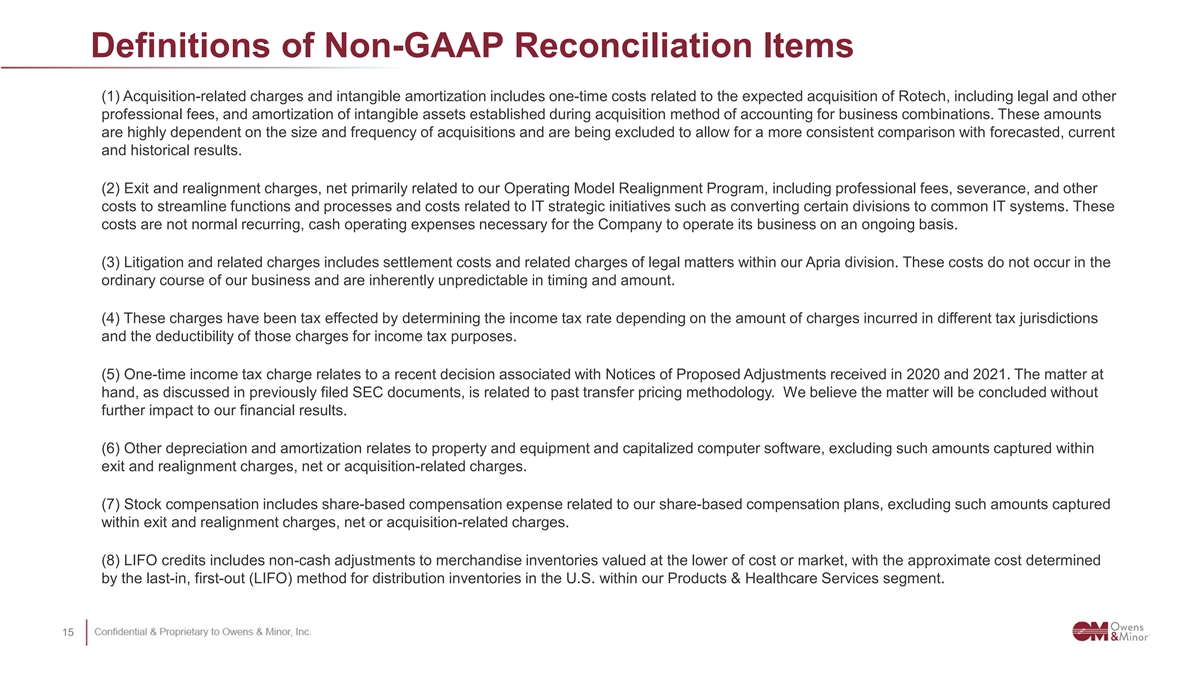
Definitions of Non-GAAP Reconciliation Items (1) Acquisition-related charges and intangible amortization includes one-time costs related to the expected acquisition of Rotech, including legal and other professional fees, and amortization of intangible assets established during acquisition method of accounting for business combinations. These amounts are highly dependent on the size and frequency of acquisitions and are being excluded to allow for a more consistent comparison with forecasted, current and historical results. (2) Exit and realignment charges, net primarily related to our Operating Model Realignment Program, including professional fees, severance, and other costs to streamline functions and processes and costs related to IT strategic initiatives such as converting certain divisions to common IT systems. These costs are not normal recurring, cash operating expenses necessary for the Company to operate its business on an ongoing basis. (3) Litigation and related charges includes settlement costs and related charges of legal matters within our Apria division. These costs do not occur in the ordinary course of our business and are inherently unpredictable in timing and amount. (4) These charges have been tax effected by determining the income tax rate depending on the amount of charges incurred in different tax jurisdictions and the deductibility of those charges for income tax purposes. (5) One-time income tax charge relates to a recent decision associated with Notices of Proposed Adjustments received in 2020 and 2021. The matter at hand, as discussed in previously filed SEC documents, is related to past transfer pricing methodology. We believe the matter will be concluded without further impact to our financial results. (6) Other depreciation and amortization relates to property and equipment and capitalized computer software, excluding such amounts captured within exit and realignment charges, net or acquisition-related charges. (7) Stock compensation includes share-based compensation expense related to our share-based compensation plans, excluding such amounts captured within exit and realignment charges, net or acquisition-related charges. (8) LIFO credits includes non-cash adjustments to merchandise inventories valued at the lower of cost or market, with the approximate cost determined by the last-in, first-out (LIFO) method for distribution inventories in the U.S. within our Products & Healthcare Services segment. 15 15