| Supplemental Information |  | March 31, 2015 |

| UMH Properties, Inc. | | | |
| | | | |
| Juniper Business Plaza | | Website: | www.umh.com |
| 3499 Route 9 North, Suite 3C | Email: | umh@umh.com |
| Freehold, NJ 07728 | | Phone: | (732) 577-9997 |
| Table of Contents |
| | |
| | Page |
| | |
| Financial Highlights | 3 |
| | |
| Consolidated Balance Sheets | 4 |
| | |
| Consolidated Statements of Income (Loss) | 5 |
| | |
| Consolidated Statement of Cash Flows | 6 |
| | |
| Reconciliation of Net Income to EBITDA and Net Income (Loss) Attributable | 7 |
| to Common Shareholders to FFO, Core FFO and Normalized FFO | |
| | |
| Market Capitalization, Debt and Coverage Levels | 8 |
| | |
| Debt Analysis and Debt Maturity | 9 |
| | |
| Property Summary and Snapshot | 10 |
| | |
| Acquisition Summary | 11 |
| | |
| Same Store Statistics | 12 |
| | |
| Marcellus and Utica Shale Region Exposure | 13 |
| | |
| Definitions | 14 |
| | |
| Press Release Dated May 7, 2015 | 15 |
| | |
| | |
| | |
| | |
| | |
The statement of operations and supplemental statement of operations provided in this supplemental information package present funds from operations, core funds from operations, community NOI, same store community NOI and EBITDA which are REIT industry financial measures that are not calculated in accordance with accounting principles generally accepted in the United States of America. Please see page 14 for a definition of these supplemental performance measures. Please see the supplemental statement of operations reconciliation for a reconciliation of certain captions in the supplemental statement of operations reported in this supplemental information package to the statement of operations as reported in the Company's filings with the SEC on Form 10-Q.
| UMH Properties, Inc. | First Quarter FY 2015 Supplemental Information | 2 |
| Financial Highlights | | | |
| (unaudited) | | | |
| | | As of and for the Three Months Ended |
| | | 3/31/2015 | | 3/31/2014 |
| Operating Information | | | |
| | Rental and Related Income | $ 17,215,686 | | $ 14,846,776 |
| | Community Operating Expenses | $ 8,812,489 | | $ 8,287,609 |
| | Community NOI | $ 8,403,197 | | $ 6,559,167 |
| | Expense Ratio | 51.2% | | 55.8% |
| | Sales of Manufactured Homes | $ 1,128,400 | | $ 1,002,405 |
| | Number of Homes Sold | 24 | | 20 |
| | Net Income | $ 718,517 | | $ 568,189 |
| | Net Loss Attributable to Common Shareholders | $ (1,170,630) | | $ (1,320,958) |
| | EBITDA | $ 7,976,945 | | $ 6,414,566 |
| | FFO | $ 3,052,931 | | $ 2,139,358 |
| | Core FFO | $ 3,159,062 | | $ 2,424,537 |
| | Normalized FFO | $ 3,225,862 | | $ 1,916,134 |
| | | | | |
| Shares Outstanding and Per Share Data | | | |
| | Weighted Average Shares Outstanding | | | |
| | Basic | 24,796,898 | | 21,261,375 |
| | Diluted | 24,840,565 | | 21,307,103 |
| | Community NOI – Basic and Diluted | $ 0.34 | | $ 0.31 |
| | Net Income (Loss) Attributable to Common | | | |
| | Shareholders per Share - Basic and Diluted | $ (0.05) | | $ (0.06) |
| | FFO per Share - Basic and Diluted | $ 0.12 | | $ 0.10 |
| | Core FFO per Share - Basic and Diluted | $ 0.13 | | $ 0.11 |
| | Normalized FFO per Share- Basic and Diluted | $ 0.13 | | $ 0.09 |
| | Dividends per Common Share | $ 0.18 | | $ 0.18 |
| | | | | |
| Balance Sheet | | | |
| | Total Assets | $ 491,321,322 | | $ 478,268,976 |
| | Total Liabilities | $ 279,408,961 | | $ 269,441,871 |
| | | | | |
| Market Capitalization | | | |
| | Total Debt | $ 269,593,926 | | $ 231,264,351 |
| | Equity Market Capitalization | $ 254,730,750 | | $ 211,985,168 |
| | Total Market Capitalization | $ 615,919,676 | | $ 534,844,519 |
| UMH Properties, Inc. | First Quarter FY 2015 Supplemental Information | 3 |
| Consolidated Balance Sheets | | | |
| | March 31, | | December 31, |
| | 2015 | | 2014 |
| ASSETS | (unaudited) | | |
| Investment Property and Equipment | | | |
| Land | $ 39,347,514 | | $ 39,133,514 |
| Site and Land Improvements | 304,264,910 | | 299,776,250 |
| Buildings and Improvements | 17,702,478 | | 17,534,698 |
| Rental Homes | 96,998,180 | | 91,719,997 |
| Total Investment Property | 458,313,082 | | 448,164,459 |
| Equipment and Vehicles | 12,525,718 | | 12,242,086 |
| Total Investment Property and Equipment | 470,838,800 | | 460,406,545 |
| Accumulated Depreciation | (103,674,038) | | (99,522,180) |
| Net Investment Property and Equipment | 367,164,762 | | 360,884,365 |
| | | | |
| Other Assets | | | |
| Cash and Cash Equivalents | 11,076,165 | | 8,082,792 |
| Securities Available for Sale | 67,917,983 | | 63,555,961 |
| Inventory of Manufactured Homes | 10,564,525 | | 12,306,715 |
| Notes and Other Receivables, net | 21,379,667 | | 21,992,566 |
| Unamortized Financing Costs | 3,242,248 | | 2,228,779 |
| Prepaid Expenses and Other Assets | 4,052,133 | | 3,356,034 |
| Land Development Costs | 5,923,839 | | 5,861,764 |
| Total Other Assets | 124,156,560 | | 117,384,611 |
| | | | |
| TOTAL ASSETS | $491,321,322 | | $ 478,268,976 |
| | | | |
| LIABILITIES AND SHAREHOLDERS' EQUITY | | | |
| Liabilities | | | |
| Mortgages Payable | $221,963,780 | | $ 182,670,854 |
| Other Liabilities | | | |
| Accounts Payable | 2,073,377 | | 1,824,293 |
| Loans Payable | 47,630,146 | | 77,439,230 |
| Accrued Liabilities and Deposits | 4,880,245 | | 4,757,604 |
| Tenant Security Deposits | 2,861,413 | | 2,749,890 |
| Total Other Liabilities | 57,445,181 | | 86,771,017 |
| Total Liabilities | 279,408,961 | | 269,441,871 |
| | | | |
| COMMITMENTS AND CONTINGENCIES | | | |
| | | | |
| Shareholders' Equity: | | | |
Series A – 8.25% Cumulative Redeemable Preferred Stock, Par Value $0.10, Per Share, 3,663,800 Shares Authorized, Issued and Outstanding as of March 31, 2015 and December 31, 2014 | 91,595,000 | | 91,595,000 |
Common Stock – $0.10 Par Value Per Share, 42,000,000 Shares Authorized; 25,296,003 and 24,372,083 Shares Issued and Outstanding as of March 31, 2015 and December 31, 2014 | 2,529,600 | | 2,437,208 |
Excess Stock – $0.10 Par Value Per Share, 3,000,000 Shares Authorized; No Shares Issued or Outstanding | -0- | | -0- |
| Additional Paid-In Capital | 113,078,637 | | 110,422,454 |
| Accumulated Other Comprehensive Income | 5,376,917 | | 5,040,236 |
| Accumulated Deficit | (667,793) | | (667,793) |
| Total Shareholders' Equity | 211,912,361 | | 208,827,105 |
| | | | |
| TOTAL LIABILITIES AND SHAREHOLDERS' EQUITY | $491,321,322 | | $ 478,268,976 |
| UMH Properties, Inc. | First Quarter FY 2015 Supplemental Information | 4 |
| Consolidated Statements of Income (Loss) | | | |
| (unaudited) | | | |
| | Three Months Ended |
| | 3/31/2015 | | 3/31/2014 |
| INCOME: | | | |
| Rental and Related Income | $ 17,215,686 | | $ 14,846,776 |
| Sales of Manufactured Homes | 1,128,400 | | 1,002,405 |
| TOTAL INCOME | 18,344,086 | | 15,849,181 |
| | | | |
| EXPENSES: | | | |
| Community Operating Expenses | 8,812,489 | | 8,287,609 |
| Cost of Sales of Manufactured Homes | 880,670 | | 766,379 |
| Selling Expenses | 685,539 | | 720,679 |
| General and Administrative Expenses | 1,656,700 | | 1,603,923 |
| Acquisition Costs | 106,131 | | 285,179 |
| Depreciation Expense | 4,228,274 | | 3,437,672 |
| TOTAL EXPENSES | 16,369,803 | | 15,101,441 |
| | | | |
| OTHER INCOME (EXPENSE): | | | |
| Interest Income | 478,333 | | 547,243 |
| Dividend Income | 1,094,778 | | 1,059,465 |
| Gain on Sale of Securities Transactions, net | 58,200 | | 508,403 |
| Other Income | 49,864 | | 52,687 |
| Interest Expense | (2,811,611) | | (2,208,125) |
| Amortization of Financing Costs | (130,043) | | (116,580) |
| TOTAL OTHER INCOME (EXPENSE) | (1,260,479) | | (156,907) |
| | | | |
| Income before Loss on Sales of | | | |
| Investment Property and Equipment | 713,804 | | 590,833 |
| Gain (Loss) on Sales of Investment Property | | | |
| Income | 4,713 | | (22,644) |
| NET INCOME | 718,517 | | 568,189 |
| | | | |
| Less: Preferred Dividend | 1,889,147 | | 1,889,147 |
| | | | |
| NET LOSS ATTRIBUTABLE TO | | | |
| COMMON SHAREHOLDERS | $ (1,170,630) | | $ (1,320,958) |
| UMH Properties, Inc. | First Quarter FY 2015 Supplemental Information | 5 |
| Consolidated Statements of Cash Flows | | | |
| (unaudited) | Three Months Ended |
| | 3/31/2015 | | 3/31/2014 |
| | | | |
| CASH FLOWS FROM OPERATING ACTIVITIES: | | | |
| Net Income | $ 718,517 | | $ 568,189 |
| Non-Cash Adjustments: | | | |
| Depreciation | 4,228,274 | | 3,437,672 |
| Amortization of Financing Costs | 130,043 | | 116,580 |
| Stock Compensation Expense | 177,801 | | 223,797 |
| Increase in Provision for Uncollectible Notes and Other Receivables | 265,409 | | 213,776 |
| Gains on Sales of Securities Transactions, net | (58,200) | | (508,403) |
| (Gain) Loss on Sales of Investment Property and Equipment | (4,713) | | 22,644 |
| | | | |
| Changes in Operating Assets and Liabilities: | | | |
| Inventory of Manufactured Homes | 1,742,190 | | 1,679,688 |
| Notes and Other Receivables | 347,490 | | (605,728) |
| Prepaid Expenses and Other Assets | (696,099) | | 309,527 |
| Accounts Payable | 249,084 | | 128,093 |
| Accrued Liabilities and Deposits | 33,559 | | (16,065) |
| Tenant Security Deposits | 111,523 | | 264,285 |
| Net Cash Provided by Operating Activities | 7,244,878 | | 5,834,055 |
| | | | |
| CASH FLOWS FROM INVESTING ACTIVITIES: | | | |
| Purchase of Manufactured Home Communities, net of assumed mortgages | (1,509,524) | | (6,837,261) |
| Purchase of Investment Property and Equipment | (6,844,617) | | (6,564,391) |
| Proceeds from Sales of Assets | 140,659 | | 112,650 |
| Additions to Land Development | (62,075) | | (99,499) |
| Purchase of Securities Available for Sale | (4,566,259) | | (1,153,766) |
| Proceeds from Sales of Securities Available for Sale | 688,200 | | 3,538,309 |
| Net Cash Used in Investing Activities | (12,153,616) | | (11,003,958) |
| | | | |
| CASH FLOWS FROM FINANCING ACTIVITIES: | | | |
| Proceeds from Mortgages, net of Mortgages Assumed | 44,985,000 | | -0- |
| Net Proceeds (Payments) on short term borrowings | (29,809,084) | | 4,504,287 |
| Principal Payments of Mortgages | (7,982,550) | | (1,111,615) |
| Financing Costs on Debt | (1,143,512) | | (241,177) |
| Proceeds from Issuance of Common Stock, net of Reinvestments | 7,680,628 | | 7,454,456 |
| Proceeds from Exercise of Stock Options | 52,910 | | -0- |
| Preferred Dividends Paid | (1,889,147) | | (1,889,147) |
| Dividends Paid, net reinvestments | (3,992,134) | | (3,401,283) |
| Net Cash Provided by Financing Activities | 7,902,111 | | 5,315,521 |
| | | | |
| NET INCREASE IN CASH AND CASH EQUIVALENTS | 2,993,373 | | 145,618 |
| CASH AND CASH EQUIVALENTS – BEGINNING OF PERIOD | 8,082,792 | | 7,615,143 |
| CASH AND CASH EQUIVALENTS – ENDING OF PERIOD | $ 11,076,165 | | $ 7,760,761 |
| UMH Properties, Inc. | First Quarter FY 2015 Supplemental Information | 6 |
| Reconciliation of Net Income to EBITDA and Net Income (Loss) Attributable | |
| to Common Shareholders to FFO, Core FFO and Normalized FFO | |
| (unaudited) | | | |
| | | |
| | | |
| | | Three Months Ended |
| | | 3/31/2015 | | 3/31/2014 |
| Reconciliation of Net Income to EBITDA | | | |
| | | | | |
| | Net Income | $ 718,517 | | $ 568,189 |
| | Add: Interest Expense | 2,811,611 | | 2,208,125 |
| | Add: Franchise Taxes | 88,500 | | 84,000 |
| | Add: Depreciation Expense | 4,228,274 | | 3,437,672 |
| | Add: Amortization of Financing Costs | 130,043 | | 116,580 |
| | | | | |
| | EBITDA | $ 7,976,945 | | $ 6,414,566 |
| | | | | |
| | | | | |
| Reconciliation of Net Income (Loss) to Funds from Operations | | | |
| | | | | |
| | Net Loss Attributable to Common Shareholders | $ (1,170,630) | | $ (1,320,958) |
| | Add: Depreciation Expense | 4,228,274 | | 3,437,672 |
| | Less: (Gain) Loss on Sales of Depreciable Assets | (4,713) | | 22,644 |
| | | | | |
| | Funds from Operations ("FFO") | 3,052,931 | | 2,139,358 |
| | | | | |
| | Adjustments: | | | |
| | Add: Acquisition Costs | 106,131 | | 285,179 |
| | | | | |
| | Core Funds from Operations ("Core FFO") | 3,159,062 | | 2,424,537 |
| | | | | |
| | Adjustments: | | | |
| | Less: Gain on Sale of Securities Transactions, net | (58,200) | | (508,403) |
| | Add: Settlement of Memphis Mobile City Litigation | 125,000 | | -0- |
| | | | | |
| | Normalized Funds from Operations (“Normalized FFO”) | $ 3,225,862 | | $ 1,916,134 |
| UMH Properties, Inc. | First Quarter FY 2015 Supplemental Information | 7 |
| Market Capitalization, Debt and Coverage Levels | | |
| (unaudited) | | | |
| | | Three Months Ended |
| | | 3/31/2015 | | 3/31/2014 |
| | | | | |
| | Shares Outstanding | 25,296,003 | | 21,675,375 |
| | Market Price Per Share | $ 10.07 | | $ 9.78 |
| | Equity Market Capitalization | $ 254,730,750 | | $ 211,985,168 |
| | Total Debt | 269,593,926 | | 231,264,351 |
| | Preferred | 91,595,000 | | 91,595,000 |
| | Total Market Capitalization | $ 615,919,676 | | $ 534,844,519 |
| | | | | |
| | Total Debt | $ 269,593,926 | | $ 231,264,351 |
| | Less: Cash and Cash Equivalents | (11,076,165) | | (7,760,761) |
| | Net Debt | 258,517,761 | | 223,503,590 |
| | Less: Securities Available for Sale at Fair Value (Securities) | 67,917,983 | | 60,770,743 |
| | Net Debt Less Securities | $ 190,599,778 | | $ 162,732,847 |
| | | | | |
| | Interest Expense | $ 2,811,611 | | $ 2,208,125 |
| | Preferred Dividends Paid | 1,889,147 | | 1,889,147 |
| | Total Fixed Charges | $ 4,700,758 | | $ 4,097,272 |
| | | | | |
| | EBITDA | $ 7,976,945 | | $ 6,414,566 |
| | | | | |
DEBT AND COVERAGE RATIOS | | | |
| | | | | |
| | Net Debt / Total Market Capitalization | 42.0% | | 41.8% |
| | | | | |
| | Net Debt + Preferred / Total Market Capitalization | 56.8% | | 58.9% |
| | | | | |
| | Net Debt Less Securities / Total Market Capitalization | 30.9% | | 30.4% |
| | | | | |
| | Net Debt Less Securities + Preferred / Total Market Capitalization | 45.8% | | 47.6% |
| | | | | |
| | Interest Coverage | 2.8x | | 2.9x |
| | | | | |
| | Fixed Charge Coverage | 1.7x | | 1.6x |
| | | | | |
| | Net Debt / EBITDA | 8.1x | | 8.7x |
| | | | | |
| | Net Debt + Preferred / EBITDA | 11.0x | | 12.3x |
| UMH Properties, Inc. | First Quarter FY 2015 Supplemental Information | 8 |
| Debt Analysis | | | |
| (unaudited) | Three Months Ended |
| | | 3/31/2015 | | 3/31/2014 |
| DEBT OUTSTANDING | | | |
| | Mortgages Payable | $ 221,963,780 | | $ 177,641,068 |
| | Loans Payable: | | | |
| | Unsecured Line of Credit | 30,000,000 | | 30,000,000 |
| | Other Loans Payable | 17,630,146 | | 23,623,283 |
| | Total Loans Payable | 47,630,146 | | 53,623,283 |
| | Total Debt | 269,593,926 | | 231,264,351 |
| | | | | |
| % FIXED/FLOATING | | | |
| | Fixed | 83.7% | | 73.3% |
| | Floating | 16.3% | | 26.7% |
| | Total | 100.0% | | 100.0% |
| | | | | |
| WEIGHTED AVERAGE INTEREST RATES | | | |
| | Mortgages Payable | 4.69% | | 4.76% |
| | Loans Payable | 3.69% | | 2.81% |
| | Total | 4.51% | | 4.31% |
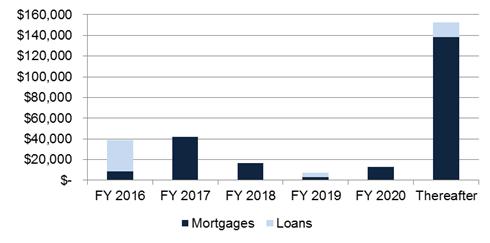
Debt Maturity
Total Debt (000’s
| | | | | | |
| Year Ended | Mortgages | Loans | | Total | % of Total |
| 2016 | $ 8,750,833 | $30,000,000 | (1) | $ 38,750,833 | 14.4% |
| 2017 | 41,840,982 | -0- | | 41,840,982 | 15.5% |
| 2018 | 16,303,931 | -0- | | 16,303,931 | 6.0% |
| 2019 | 3,310,559 | 4,000,000 | | 7,310,559 | 2.7% |
| 2020 | 13,136,033 | -0- | | 13,136,033 | 4.9% |
| Thereafter | 138,621,442 | 13,630,146 | | 152,251,588 | 56.5% |
| | | | | | |
| Total as of 03/31/2015 | $ 221,963,780 | $47,630,146 | | $ 269,593,926 | 100.0% |
| | | | | | |
| Notes: | | | | | |
| (1) Includes $30 million Line of Credit due March 2016, which has a one year extension option. |
| UMH Properties, Inc. | First Quarter FY 2015 Supplemental Information | 9 |
Property Summary and Snapshot
(unaudited)
| | | | | |
| | 3/31/2015 | | 3/31/2014 | |
| Number of Communities | 89 | | 82 | |
| Total Sites | 15,176 | | 14,461 | |
| Occupied Sites | 12,356 | | 11,564 | |
| Occupancy % (1) | 82.3% | | 80.8% | |
| | | | | |
| As of March 31, 2015: | | | | | | | |
| Region | Number | Total Acreage (2) | Developed Acreage | Vacant Acreage (2) | Total Sites | Occupied Sites | Occupancy Percentage (1) | Monthly Rent Per Site |
| | | | | | | | | |
| Indiana | 6 | 345 | 296 | 49 | 1,395 | 1,119 | 80.2% | $ 381 |
| Michigan | 1 | 28 | 28 | -0- | 143 | 106 | 74.1% | $ 386 |
| New Jersey | 4 | 349 | 187 | 162 | 1,006 | 956 | 95.0% | $ 569 |
| New York | 7 | 397 | 301 | 96 | 1,133 | 904 | 79.8% | $ 459 |
| Ohio | 25 | 995 | 770 | 225 | 3,627 | 2,836 | 78.2% | $ 320 |
| E. Pennsylvania | 25 | 921 | 769 | 152 | 3,447 | 2,950 | 85.6% | $ 447 |
| W. Pennsylvania | 14 | 763 | 608 | 155 | 2,602 | 1,988 | 76.4% | $ 378 |
| Tennessee | 7 | 413 | 321 | 92 | 1,823 | 1,497 | 82.1% | $ 403 |
| | | | | | | | | |
| | 89 | 4,211 | 3,280 | 931 | 15,176 | 12,356 | 82.3% | $ 400 |
| | | | | | | | | |
| Notes: | |
| (1) The 156 Vacant Sites at Memphis Mobile City are not Included in the calculation of occupancy. |
| (2) Total and Vacant Acreage of 220 for the Mountain View Estates property is not included in the summary since there are |
| no current sites and approval for sites is still in process. |
| UMH Properties, Inc. | First Quarter FY 2015 Supplemental Information | 10 |
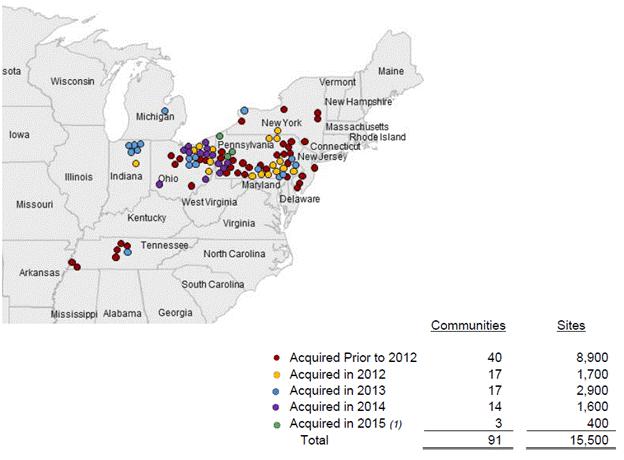
| Acquisition Summary | | | | | |
| | | | | | | |
| | | | | | | |
| | | | | | | |
| Year of Acquisition | Number of Communities | Sites | Occupied Sites | Occupancy % | Price | Total Acres |
| | | | | | | |
| 2012 | 17 | 1,727 | 1,559 | 90% | $ 47,600,000 | 382 |
| 2013 | 17 | 2,738 | 2,279 | 83% | $ 88,270,000 | 232 |
| 2014 | 14 | 1,612 | 1,230 | 76% | $ 42,550,000 | 547 |
| 2015 to date | 3 | 465 | 340 | 73% | $ 9,100,000 | 180 |
| Notes: |
| (1) Includes 2 communities purchased subsequent to quarter end. |
| UMH Properties, Inc. | First Quarter FY 2015 Supplemental Information | 11 |
Same Store Statistics
(unaudited)
| | | | | | | | | |
| | | 3/31/2015 | | 3/31/2014 | | Change | | % Change |
| Community Net Operating Income | | | | | | |
| | | | | | | | | |
| | Rental and Related Income | 15,898,985 | | 14,690,579 | | 1,208,406 | | 8.2% |
| | | | | | | | | |
| | Community Operating Expenses | 7,952,259 | | 8,025,661 | | (73,402) | | (0.9%) |
| | | | | | | | | |
| | Community NOI | 7,946,726 | | 6,664,918 | | 1,281,808 | | 19.2% |
| | | | | | | | | |
| | | | | | | | | |
| Other Information | | | | | | | |
| | Number of Properties | 73 | | 73 | | -0- | | N/A |
| | | | | | | | | |
| | Developed Acreage | 2,907 | | 2,907 | | -0- | | N/A |
| | | | | | | | | |
| | Vacant Acreage | 724 | | 724 | | -0- | | N/A |
| | | | | | | | | |
| | Total Sites | 13,279 | | 13,303 | | (24) | | (0.2%) |
| | | | | | | | | |
| | Occupied Sites | 11,026 | | 10,866 | | 160 | | 1.5% |
| | | | | | | | | |
| | Occupancy % | 83.0% | | 81.7% | | 1.3% | | N/A |
| | | | | | | | | |
| | Monthly Rent Per Site | $ 413 | | $ 398 | | $ 15 | | 3.8% |
| Notes: |
| Same store includes all properties owned as of January 1, 2014, with the exception of Memphis Mobile City. |
| |
| UMH Properties, Inc. | First Quarter FY 2015 Supplemental Information | 12 |
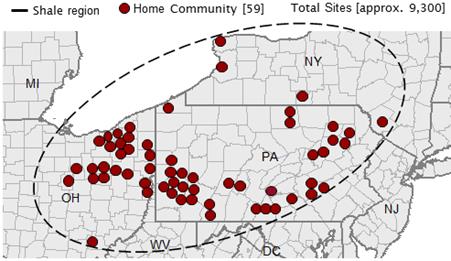
Marcellus and Utica Shale Region Exposure
The Marcellus and Utica Shale Regions are large natural gas fields located beneath much of Pennsylvania, Ohio, West Virginia and New York. These fields have the potential to be among the largest sources of natural gas in the world. It is also expected that the activity surrounding the development of the shale regions is to accelerate over the next few years. With the rise in development, economies in the shale region are expected to benefit from increased employment, wealth of landowners, and state and local tax revenues. UMH is already seeing increased demand for residential units in the region as a result of the Marcellus and Utica Shale related activity. Demand for rental homes has increased substantially over the past year. UMH added 900 rental homes, including those acquired with acquisitions, in 2014 to satisfy demand. | | UMH benefits from significant exposures to the Marcellus and Utica Shale Regions with over 2,600 acres in existing communities. Total Acreage Total – 4,600 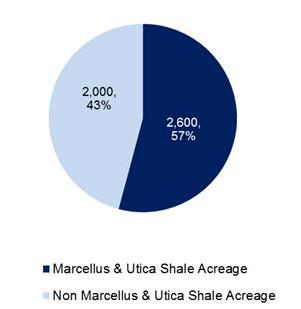
|
Existing Home Communities
| UMH Properties, Inc. | First Quarter FY 2015 Supplemental Information | 13 |
Definitions
Investors and analysts following the real estate industry utilize funds from operations ("FFO"), core funds from operations ("Core FFO"), normalized funds from operations (“Normalized FFO”), community NOI, same store community NOI, and earnings before interest, taxes, depreciation and amortization ("EBITDA"), variously defined, as supplemental performance measures. While the Company believes net income available to common stockholders, as defined by accounting principles generally accepted in the United States of America (U.S. GAAP), is the most appropriate measure, it considers Community NOI, Same Store Community NOI, EBITDA, FFO, and Core FFO, given their wide use by and relevance to investors and analysts, appropriate supplemental performance measures. FFO, reflecting the assumption that real estate asset values rise or fall with market conditions, principally adjusts for the effects of U.S. GAAP depreciation and amortization of real estate assets. Core FFO reflects the same assumptions as FFO except that is also adjusts for the effects of acquisitions costs. Community NOI and Same Store Community NOI provides a measure of rental operations, and does not factor in depreciation and amortization and non-property specific expenses such as general and administrative expenses. EBITDA provides a tool to further evaluate the ability to incur and service debt and to fund dividends and other cash needs. In addition, Community NOI, Same Store Community NOI, EBITDA, FFO, and Core FFO are commonly used in various ratios, pricing multiples, yields and returns and valuation of calculations used to measure financial position, performance and value.
As used herein, the Company calculates FFO, as defined by The National Association of Real Estate Investment Trusts (NAREIT), to be equal to net income (loss) applicable to common shareholders, as defined by U.S. GAAP, excluding extraordinary items as defined by U.S. GAAP, gains or losses from sales of previously depreciated real estate assets, impairment charges related to depreciable real estate assets, plus certain non-cash items such as real estate asset depreciation and amortization. FFO includes gains and losses realized on securities investments.
Core FFO is calculated as FFO plus acquisition costs.
Normalized FFOis calculated as Core FFO excluding gains and losses realized on securities investments and certain one-time charges.
Community NOI is calculated as rental and related income less community operating expenses such as real estate taxes, repairs and maintenance, community salaries, utilities, insurance and other expenses. Community NOI excludes realized gains (losses) on securities transactions.
Same Store Community NOIis calculated as Community NOI, using all properties owned as of January 1, 2014, with the exception of Memphis Mobile City.
EBITDA is calculated as net income plus interest expense, franchise taxes, depreciation expense and amortization of financing costs.
Community NOI, Same Store Community NOI, EBITDA, FFO, Core FFO and Normalized FFO do not represent cash generated from operating activities in accordance with U.S. GAAP and are not necessarily indicative of cash available to fund cash needs, including the repayment of principal on debt and payment of dividends and distributions. Community NOI, Same Store Community NOI, EBITDA, FFO, Core FFO and Normalized FFO should not be considered as substitutes for net income applicable to common shareholders (calculated in accordance with U.S. GAAP) as a measure of results of operations, or cash flows (calculated in accordance with U.S. GAAP) as a measure of liquidity. Community NOI, Same Store Community NOI, EBITDA, FFO, Core FFO and Normalized FFO as currently calculated by the Company may not be comparable to similarly titled, but variously calculated, measures of other REITs.
| UMH Properties, Inc. | First Quarter FY 2015 Supplemental Information | 14 |
Press Release Dated May 7, 2015
FOR IMMEDIATE RELEASE
May 7, 2015
Contact: Susan Jordan
732-577-9997
UMH PROPERTIES, INC. REPORTS 1st QUARTER 2015 EARNINGS
FREEHOLD, NJ, May 7, 2015........ UMH Properties, Inc. (NYSE:UMH) reported Core Funds from Operations (Core FFO) of $3,159,000 or $0.13 per diluted share for the quarter ended March 31, 2015, as compared to $2,425,000 or $0.11 per diluted share for the quarter ended March 31, 2014. Normalized Funds from Operations (Normalized FFO), was $3,226,000 or $0.13 per diluted share for the quarter ended March 31, 2015, as compared to $1,916,000 or $0.09 per diluted share for the quarter ended March 31, 2014.
A summary of significant financial information for the three months ended March 31, 2015 and 2014 is as follows:
| | For the Three Months Ended |
| | | March 31, |
| | | 2015 | | | 2014 |
| | | | | | |
| Total Income | $ | 18,344,000 | | $ | 15,849,000 |
| Total Expenses | $ | 16,370,000 | | $ | 15,101,000 |
| Gain on Securities Transactions, net | $ | 58,000 | | $ | 508,000 |
| Net Loss Attributable to Common Shareholders | $ | (1,171,000) | | $ | (1,321,000) |
Net Loss Attributable to Common Shareholders per Diluted Common Share | $ | (0.05) | | $ | (0.06) |
| Core FFO (1) | $ | 3,159,000 | | $ | 2,425,000 |
| Core FFO(1) per Diluted Common Share | $ | 0.13 | | $ | 0.11 |
| Normalized FFO(1) | $ | 3,226,000 | | $ | 1,916,000 |
| Normalized FFO(1) per Diluted Common Share | $ | 0.13 | | $ | 0.09 |
| Weighted Average Diluted Shares Outstanding | | 24,841,000 | | | 21,307,000 |
A summary of significant balance sheet information as of March 31, 2015 and December 31, 2014 is as follows:
| | March 31, 2015 | | December 31, 2014 |
| | | | |
| Total Assets | $ 491,321,000 | | $ 478,269,000 |
| Securities Available for Sale at Fair Value | $ 67,918,000 | | $ 63,556,000 |
| Mortgages Payable | $ 221,964,000 | | $ 182,671,000 |
| Loans Payable | $ 47,630,000 | | $ 77,439,000 |
| Total Shareholders’ Equity | $ 211,912,000 | | $ 208,827,000 |
| UMH Properties, Inc. | First Quarter FY 2015 Supplemental Information | 15 |
Samuel A. Landy, President and CEO, commented on the results of the first quarter of 2015:
“We are pleased with the progress achieved during the quarter. Normalized FFO was $3.2 million or $0.13 per diluted share for the first quarter of 2015, compared to $1.9 million or $0.09 per diluted share in the prior year period, representing an increase of 44% on a per share basis. Community Net Operating Income (NOI) increased 28% to $8.4 million for the first quarter of 2015, as compared to $6.6 million for the same period in 2014. This growth in earnings has been driven by our occupancy gains as well as our community acquisitions. Overall occupancy increased 150 basis points from 80.8% in the first quarter of 2014 to 82.3% currently. Same store occupancy increased 130 basis points from 81.7% to 83.0% currently. Over the prior year period, same store revenue increased 8.2% and expenses decreased 0.9%. This coupled with our increase in same store occupancy resulted in a very strong increase in same store community NOI of 19.2%. Our year over year 19.2% same store community NOI represents solid evidence that our on-going program of acquiring communities and upgrading them is working. Community operating expenses for the quarter were 51.2% of rental and related income, representing a 460 basis point improvement over the prior year period. As we noted in the past, our expense ratio will continue to improve as we upgrade and integrate our acquisitions.”
“During the quarter, we continued to grow our property portfolio by purchasing one Pennsylvania community containing 141 developed homesites for a purchase price of $3.8 million, and subsequent to quarter end, we acquired two additional Pennsylvania communities containing a total of 324 developed homesites for an aggregate purchase price of $5.3 million. We continue to seek acquisitions in our target markets and in addition to the acquisitions completed in 2015 thus far, we have a definitive agreement to purchase an additional Pennsylvania community containing 158 developed homesites for approximately $3.5 million. This acquisition is anticipated to close during the second quarter of 2015. We are currently in various stages of negotiations for additional community acquisitions.”
“We have successfully completed our previously announced financings and, including one loan which closed on April 1, 2015, we obtained ten Freddie Mac mortgage loans for total proceeds of approximately $57.7 million. These loans have 10-year maturities and principal repayments based on 30-year amortization schedules. Interest on these mortgages are at a weighted-average fixed rate of 3.87%. The entrance of Freddie Mac into our sector and the favorable financing terms obtained will allow us to continue to refinance our communities and execute our growth strategy for the long-term benefit of our shareholders.”
UMH Properties, Inc. will host its First Quarter 2015 Financial Results Webcast and Conference Call. Senior management will discuss the results, current market conditions and future outlook on Friday, May 8, 2015 at 10:00 a.m. Eastern Time.
The Company’s 2015 first quarter financial results being released herein will be available on the Company’s website at www.umh.com in the “Financial Information and Filings” section under the “Investors” tab.
To participate in the webcast, select the “Investors” tab at the top of the company’s website at www.umh.com, then select the microphone icon. Interested parties can also participate via conference call by calling toll free 888-317-6016 (domestically) or 412-317-6016 (internationally).
| UMH Properties, Inc. | First Quarter FY 2015 Supplemental Information | 16 |
The replay of the conference call will be available at 12:00 p.m. Eastern Time on Friday, May 8, 2015. It will be available until August 1, 2015, and can be accessed by dialing toll free 877-344-7529 (domestically) and 412-317-0088 (internationally) and entering the passcode 10061574. A transcript of the call and the webcast replay will be available at the company’s website, www.umh.com under the “Investors” tab.
UMH Properties, Inc., which was organized in 1968, is a public equity REIT that owns and operates ninety-one manufactured home communities containing approximately 15,500 developed homesites. These communities are located in New Jersey, New York, Ohio, Pennsylvania, Tennessee, Indiana and Michigan. In addition, the Company owns a portfolio of REIT securities.
Certain statements included in this press release which are not historical facts may be deemed forward-looking statements within the meaning of the Private Securities Litigation Reform Act of 1995. Although the Company believes the expectations reflected in any forward-looking statements are based on reasonable assumptions, the Company can provide no assurance those expectations will be achieved. Factors and risks that could cause actual results or events to differ materially from expectations are contained in the Company’s annual report on Form 10-K and described from time to time in the Company’s other filings with the SEC. The Company undertakes no obligation to publicly update or revise any forward-looking statements whether as a result of new information, future events, or otherwise.
(1) Non-GAAP Information: We assess and measure our overall operating results based upon an industry performance measure referred to as Funds From Operations (FFO), which management believes is a useful indicator of our operating performance. FFO is used by industry analysts and investors as a supplemental operating performance measure of a REIT. FFO, as defined by The National Association of Real Estate Investment Trusts (NAREIT), represents Net Income (Loss) Attributable to Common Shareholders, as defined by accounting principles generally accepted in the United States of America (US GAAP), excluding Extraordinary Items, as defined under US GAAP, Gains or Losses from sales of previously depreciated real estate assets, Impairment Charges related to depreciable real estate assets, plus certain non-cash items such as Real Estate Asset Depreciation and Amortization. NAREIT created FFO as a non-US GAAP supplemental measure of REIT operating performance. We define Core Funds From Operations (Core FFO) as FFO plus Acquisition Costs. We define Normalized Funds From Operations (Normalized FFO) as Core FFO excluding gains and losses realized on securies investments and and certain one-time charges. FFO, Core FFO and Normalized FFO should be considered as supplemental measures of operating performance used by REITs. FFO, Core FFO and Normalized FFO exclude historical Cost Depreciation as an expense and may facilitate the comparison of REITs which have a different cost basis. The items excluded from FFO, Core FFO and Normalized FFO are significant components in understanding the Company’s financial performance.
FFO, Core FFO and Normalized FFO (i) do not represent Cash Flow from Operations as defined by US GAAP; (ii) should not be considered as an alternative to Net Income as a measure of operating performance or to Cash Flows from Operating, Investing and Financing activities; and (iii) are not alternatives to Cash Flow as a measure of liquidity. FFO, Core FFO and Normalized FFO, as calculated by the Company, may not be comparable to similarly titled measures reported by other REITs.
| UMH Properties, Inc. | First Quarter FY 2015 Supplemental Information | 17 |
The Company’s FFO, Core FFO and Normalized FFO for the three months ended March 31, 2015 and 2014 are calculated as follows:
| | | Three Months Ended | | |
| | | 3/31/15 | | 3/31/14 | | |
| | | | | | |
| Net Income (Loss) Attributable to Common Shareholders | | $(1,171,000) | $(1,321,000) | | |
| Depreciation Expense | | 4,229,000 | 3,438,000 | | |
| (Gain) Loss on Sales of Depreciable Assets | | (5,000) | 22,000 | | |
| FFO Attributable to Common Shareholders | | 3,053,000 | | 2,139,000 | | |
| Add: Acquisition Costs | | 106,000 | | 285,000 | | |
| Core FFO Attributable to Common Shareholders | | 3,159,000 | | 2,424,000 | | |
| Less: Gain on Sale of Securities Transactions, net | | (58,000) | | (508,000) | | |
| Add: Settlement of Litigation | | 125,000 | -0- | | |
| Normalized FFO Attributable to Common Shareholders | | $3,226,000 | | $1,916,000 | | |
The following are the cash flows provided (used) by operating, investing and financing activities for the three months ended March 31, 2015 and 2014:
| | | Three Months Ended |
| | | 3/31/15 | | 3/31/14 |
| | | | |
| Operating Activities | | $7,245,000 | $5,834,000 |
| Investing Activities | | (12,154,000) | (11,004,000) |
| Financing Activities | | 7,902,000 | 5,316,000 |
# # # #

| UMH Properties, Inc. | First Quarter FY 2015 Supplemental Information | 18 |