Table of Contents
Certain information in this Supplemental Information Package contain Non-GAAP financial measures. These Non-GAAP financial measures are REIT industry financial measures that are not calculated in accordance with accounting principles generally accepted in the United States of America. Please see page 14 for a definition of these Non-GAAP financial measures and page 7 for the reconciliation of certain captions in the Supplemental Information Package to the statement of operations as reported in the Company’s filings with the SEC on Form 10-Q.
| UMH Properties, Inc. | Fourth Quarter FY 2017 Supplemental Information | 2 |
Financial Highlights
(unaudited)
| | | Three Months Ended | | | Twelve Months Ended | |
| | | | 12/31/2017 | | | | 12/31/2016 | | | | 12/31/2017 | | | | 12/31/2016 | |
| Operating Information | | | | | | | | | | | | | | | | |
| Number of Communities | | | | | | | | | | | 112 | | | | 101 | |
| Number of Sites | | | | | | | | | | | 20,029 | | | | 18,054 | |
| Rental and Related Income | | $ | 26,122,486 | | | $ | 23,366,346 | | | $ | 101,801,425 | | | $ | 90,679,557 | |
| Community Operating Expenses | | $ | 12,176,772 | | | $ | 10,644,368 | | | $ | 47,846,565 | | | $ | 42,638,333 | |
| Community NOI | | $ | 13,945,714 | | | $ | 12,721,978 | | | $ | 53,954,860 | | | $ | 48,041,224 | |
| Expense Ratio | | | 46.6 | % | | | 45.6 | % | | | 47.0 | % | | | 47.0 | % |
| Sales of Manufactured Homes | | $ | 2,574,099 | | | $ | 1,777,351 | | | $ | 10,846,494 | | | $ | 8,534,272 | |
| Number of Homes Sold | | | 53 | | | | 38 | | | | 222 | | | | 170 | |
| Number of Rentals Added | | | 258 | | | | 212 | | | | 948 | | | | 927 | |
| Net Income | | $ | 3,530,616 | | | $ | 3,376,615 | | | $ | 12,668,034 | | | $ | 11,534,559 | |
| Net Loss Attributable to Common Shareholders | | $ | (795,765 | ) | | $ | (413,132 | ) | | $ | (7,679,265 | ) | | $ | (2,568,873 | ) |
| Adjusted EBITDA | | $ | 14,630,013 | | | $ | 13,380,376 | | | $ | 56,347,752 | | | $ | 50,565,254 | |
| FFO | | $ | 6,552,815 | | | $ | 5,686,945 | | | $ | 19,959,411 | | | $ | 20,647,390 | |
| Core FFO | | $ | 6,552,815 | | | $ | 5,719,937 | | | $ | 23,461,898 | | | $ | 20,731,742 | |
| Normalized FFO | | $ | 6,323,576 | | | $ | 5,333,472 | | | $ | 21,714,370 | | | $ | 18,446,441 | |
| | | | | | | | | | | | | | | | | |
| Shares Outstanding and Per Share Data | | | | | | | | | | | | | | | | |
| Weighted Average Shares Outstanding Basic and Diluted | | | 35,071,943 | | | | 28,829,801 | | | | 32,675,650 | | | | 27,808,895 | |
| Net Loss Attributable to Common Shareholders per Share- Basic and Diluted | | $ | (0.03 | ) | | $ | (0.02 | ) | | $ | (0.24 | ) | | $ | (0.10 | ) |
| FFO per Share- Diluted | | $ | 0.19 | | | $ | 0.19 | | | $ | 0.60 | | | $ | 0.73 | |
| Core FFO per Share- Diluted | | $ | 0.19 | | | $ | 0.20 | | | $ | 0.71 | | | $ | 0.74 | |
| Normalized FFO per Share- Diluted | | $ | 0.18 | | | $ | 0.18 | | | $ | 0.66 | | | $ | 0.66 | |
| | | | | | | | | | | | | | | | | |
| Dividends per Common Share | | $ | 0.18 | | | $ | 0.18 | | | $ | 0.72 | | | $ | 0.72 | |
| | | | | | | | | | | | | | | | | |
| Balance Sheet | | | | | | | | | | | | | | | | |
| Total Assets | | | | | | | | | | $ | 823,881,326 | | | $ | 680,444,818 | |
| Total Liabilities | | | | | | | | | | $ | 402,665,862 | | | $ | 363,412,851 | |
| | | | | | | | | | | | | | | | | |
| Market Capitalization | | | | | | | | | | | | | | | | |
| Total Debt, Net of Unamortized Debt Issuance Costs | | | | | | | | | | $ | 389,599,604 | | | $ | 351,310,977 | |
| Equity Market Capitalization | | | | | | | | | | $ | 528,772,213 | | | $ | 442,301,606 | |
| Series A Preferred Stock | | | | | | | | | | $ | -0- | | | $ | 91,595,000 | |
| Series B Preferred Stock | | | | | | | | | | $ | 95,030,000 | | | $ | 95,030,000 | |
| Series C Preferred Stock | | | | | | | | | | $ | 143,750,000 | | | $ | -0- | |
| Total Market Capitalization | | | | | | | | | | $ | 1,157,151,817 | | | $ | 980,237,583 | |
| UMH Properties, Inc. | Fourth Quarter FY 2017 Supplemental Information | 3 |
Consolidated Balance Sheets
| | | December 31, 2017 | | | December 31, 2016 | |
| ASSETS | | | | | | |
| Investment Property and Equipment | | | | | | | | |
| Land | | $ | 61,239,644 | | | $ | 47,476,314 | |
| Site and Land Improvements | | | 463,242,075 | | | | 398,776,390 | |
| Buildings and Improvements | | | 22,963,926 | | | | 21,101,836 | |
| Rental Homes and Accessories | | | 216,992,988 | | | | 172,862,227 | |
| Total Investment Property | | | 764,438,633 | | | | 640,216,767 | |
| Equipment and Vehicles | | | 16,874,760 | | | | 14,986,196 | |
| Total Investment Property and Equipment | | | 781,313,393 | | | | 655,202,963 | |
| Accumulated Depreciation | | | (166,444,512 | ) | | | (140,255,603 | ) |
| Net Investment Property and Equipment | | | 614,868,881 | | | | 514,947,360 | |
| | | | | | | | | |
| Other Assets | | | | | | | | |
| Cash and Cash Equivalents | | | 23,242,090 | | | | 4,216,592 | |
| Securities Available for Sale at Fair Value | | | 132,964,276 | | | | 108,755,172 | |
| Inventory of Manufactured Homes | | | 17,569,365 | | | | 17,424,574 | |
| Notes and Other Receivables, net | | | 25,451,053 | | | | 20,323,191 | |
| Prepaid Expenses and Other Assets | | | 3,457,083 | | | | 4,497,937 | |
| Land Development Costs | | | 6,328,578 | | | | 10,279,992 | |
| Total Other Assets | | | 209,012,445 | | | | 165,497,458 | |
| | | | | | | | | |
| TOTAL ASSETS | | $ | 823,881,326 | | | $ | 680,444,818 | |
| | | | | | | | | |
| LIABILITIES AND SHAREHOLDERS’ EQUITY | | | | | | | | |
| Liabilities | | | | | | | | |
| Mortgages Payable, net of Unamortized Debt Issuance Costs | | $ | 304,895,117 | | | $ | 293,025,592 | |
| Other Liabilities | | | | | | | | |
| Accounts Payable | | | 2,960,739 | | | | 2,962,037 | |
| Loans Payable, net of Unamortized Debt Issuance Costs | | | 84,704,487 | | | | 58,285,385 | |
| Accrued Liabilities and Deposits | | | 4,977,886 | | | | 4,820,142 | |
| Tenant Security Deposits | | | 5,127,633 | | | | 4,319,695 | |
| Total Other Liabilities | | | 97,770,745 | | | | 70,387,259 | |
| Total Liabilities | | | 402,665,862 | | | | 363,412,851 | |
| | | | | | | | | |
| COMMITMENTS AND CONTINGENCIES | | | | | | | | |
| | | | | | | | | |
| Shareholders’ Equity: | | | | | | | | |
| Series A - 8.25% Cumulative Redeemable Preferred Stock, par value $0.10 per share: -0- and 3,663,800 shares authorized, issued and outstanding as of December 31, 2017 and 2016, respectively | | | -0- | | | | 91,595,000 | |
| Series B - 8.0% Cumulative Redeemable Preferred Stock, par value $0.10 per share: 4,000,000 shares authorized; 3,801,200 shares issued and outstanding as of December 31, 2017 and 2016, respectively | | | 95,030,000 | | | | 95,030,000 | |
| Series C - 6.75% Cumulative Redeemable Preferred Stock, par value $0.10 per Share; 5,750,000 and -0- shares authorized, issued and outstanding as of December 31, 2017 and 2016, respectively. | | | 143,750,000 | | | | -0- | |
| Common Stock – $0.10 par value per share: 113,663,800 and 75,000,000 shares authorized; 35,488,068 and 29,388,811 shares issued and outstanding as of December 31, 2017 and 2016, respectively | | | 3,548,807 | | | | 2,938,881 | |
| Excess Stock – $0.10 par value per share: 3,000,000 shares authorized; no shares issued or outstanding as of December 31, 2017 and 2016, respectively | | | -0- | | | | -0- | |
| Additional Paid-In Capital | | | 168,034,868 | | | | 111,422,691 | |
| Accumulated Other Comprehensive Income | | | 11,519,582 | | | | 16,713,188 | |
| Accumulated Deficit | | | (667,793 | ) | | | (667,793 | ) |
| Total Shareholders’ Equity | | | 421,215,464 | | | | 317,031,967 | |
| | | | | | | | | |
| TOTAL LIABILITIES AND SHAREHOLDERS’ EQUITY | | $ | 823,881,326 | | | $ | 680,444,818 | |
| UMH Properties, Inc. | Fourth Quarter FY 2017 Supplemental Information | 4 |
Consolidated Statements of Income (Loss)
| | | (unaudited) | | | | |
| | | Three Months Ended | | | Twelve Months Ended | |
| | | 12/31/2017 | | | 12/31/2016 | | | 12/31/2017 | | | 12/31/2016 | |
| INCOME: | | | | | | | | | | | | | | | | |
| Rental and Related Income | | $ | 26,122,486 | | | $ | 23,366,346 | | | $ | 101,801,425 | | | $ | 90,679,557 | |
| Sales of Manufactured Homes | | | 2,574,099 | | | | 1,777,351 | | | | 10,846,494 | | | | 8,534,272 | |
| TOTAL INCOME | | | 28,696,585 | | | | 25,143,697 | | | | 112,647,919 | | | | 99,213,829 | |
| | | | | | | | | | | | | | | | | |
| EXPENSES: | | | | | | | | | | | | | | | | |
| Community Operating Expenses | | | 12,176,772 | | | | 10,644,368 | | | | 47,846,565 | | | | 42,638,333 | |
| Cost of Sales of Manufactured Homes | | | 2,005,525 | | | | 1,187,933 | | | | 8,471,190 | | | | 6,466,520 | |
| Selling Expenses | | | 633,375 | | | | 581,544 | | | | 3,095,155 | | | | 2,852,405 | |
| General and Administrative Expenses | | | 2,455,016 | | | | 2,071,626 | | | | 9,645,681 | | | | 8,004,925 | |
| Acquisition Costs | | | -0- | | | | 27,871 | | | | -0- | | | | 79,231 | |
| Depreciation Expense | | | 7,297,190 | | | | 6,121,424 | | | | 27,557,746 | | | | 23,214,100 | |
| TOTAL EXPENSES | | | 24,567,878 | | | | 20,634,766 | | | | 96,616,337 | | | | 83,255,514 | |
| | | | | | | | | | | | | | | | | |
| OTHER INCOME (EXPENSE): | | | | | | | | | | | | | | | | |
| Interest Income | | | 527,385 | | | | 377,727 | | | | 2,006,880 | | | | 1,584,585 | |
| Dividend Income | | | 2,419,860 | | | | 1,801,309 | | | | 8,134,898 | | | | 6,636,126 | |
| Gain on Sales of Securities, net | | | 229,239 | | | | 386,465 | | | | 1,747,528 | | | | 2,285,301 | |
| Other Income | | | 112,797 | | | | 109,077 | | | | 705,048 | | | | 504,759 | |
| Interest Expense | | | (3,835,982 | ) | | | (3,828,241 | ) | | | (15,876,972 | ) | | | (15,432,364 | ) |
| TOTAL OTHER INCOME (EXPENSE) | | | (546,701 | ) | | | (1,153,663 | ) | | | (3,282,618 | ) | | | (4,421,593 | ) |
| | | | | | | | | | | | | | | | | |
| Income before Gain (Loss) on Sales of Investment Property and Equipment | | | 3,582,006 | | | | 3,355,268 | | | | 12,748,964 | | | | 11,536,722 | |
| Gain (Loss) on Sales of Investment Property and Equipment | | | (51,390 | ) | | | 21,347 | | | | (80,930 | ) | | | (2,163 | ) |
| NET INCOME | | | 3,530,616 | | | | 3,376,615 | | | | 12,668,034 | | | | 11,534,559 | |
| | | | | | | | | | | | | | | | | |
| Less: Preferred Dividends | | | (4,326,381 | ) | | | (3,789,747 | ) | | | (16,844,812 | ) | | | (14,103,432 | ) |
| Less: Redemption of Preferred Stock | | | -0- | | | | -0- | | | | (3,502,487 | ) | | | -0- | |
| | | | | | | | | | | | | | | | | |
| NET LOSS ATTRIBUTABLE TO COMMON SHAREHOLDERS | | $ | (795,765 | ) | | $ | (413,132 | ) | | $ | (7,679,265 | ) | | $ | (2,568,873 | ) |
| UMH Properties, Inc. | Fourth Quarter FY 2017 Supplemental Information | 5 |
Consolidated Statements of Cash Flows
| | | Twelve Months Ended | |
| | | 12/31/2017 | | | 12/31/2016 | |
| | | | | | | |
| CASH FLOWS FROM OPERATING ACTIVITIES: | | | | | | | | |
| Net Income | | $ | 12,668,034 | | | $ | 11,534,559 | |
| Non-Cash Items Included in Net Income: | | | | | | | | |
| Depreciation | | | 27,557,746 | | | | 23,214,100 | |
| Amortization of Financing Costs | | | 660,910 | | | | 733,485 | |
| Stock Compensation Expense | | | 1,314,491 | | | | 1,064,678 | |
| Provision for Uncollectible Notes and Other Receivables | | | (1,273,535 | ) | | | 909,397 | |
| Gain on Sales of Securities, net | | | (1,747,528 | ) | | | (2,285,301 | ) |
| Loss on Sales of Investment Property and Equipment | | | 80,930 | | | | 2,163 | |
| Changes in Operating Assets and Liabilities: | | | | | | | | |
| Inventory of Manufactured Homes | | | (144,791 | ) | | | (3,113,164 | ) |
| Notes and Other Receivables, net of Notes Acquired with Acquisitions | | | 215,684 | | | | (1,204,014 | ) |
| Prepaid Expenses and Other Assets | | | 1,040,854 | | | | (435,124 | ) |
| Accounts Payable | | | (1,298 | ) | | | 145,747 | |
| Accrued Liabilities and Deposits | | | 161,727 | | | | (1,878,719 | ) |
| Tenant Security Deposits | | | 807,938 | | | | 665,605 | |
| Net Cash Provided by Operating Activities | | | 41,341,162 | | | | 29,353,412 | |
| | | | | | | | | |
| CASH FLOWS FROM INVESTING ACTIVITIES: | | | | | | | | |
| Purchase of Manufactured Home Communities, net of Mortgages Assumed | | | (61,669,247 | ) | | | (4,081,798 | ) |
| Purchase of Investment Property and Equipment | | | (62,009,984 | ) | | | (58,184,812 | ) |
| Proceeds from Sales of Investment Property and Equipment | | | 2,299,670 | | | | 1,114,503 | |
| Additions to Land Development Costs | | | (3,881,035 | ) | | | (3,728,869 | ) |
| Purchase of Securities Available for Sale | | | (45,075,311 | ) | | | (27,518,151 | ) |
| Proceeds from Sales of Securities Available for Sale | | | 17,416,146 | | | | 14,831,737 | |
| Net Cash Used in Investing Activities | | | (152,919,761 | ) | | | (77,567,390 | ) |
| | | | | | | | | |
| CASH FLOWS FROM FINANCING ACTIVITIES: | | | | | | | | |
| Proceeds from Mortgages, net of Mortgages Assumed | | | 44,420,000 | | | | 31,804,000 | |
| Net Proceeds on Short Term Borrowings | | | 26,401,635 | | | | 406,935 | |
| Principal Payments of Mortgages and Loans | | | (34,970,645 | ) | | | (25,072,315 | ) |
| Financing Costs on Debt | | | (641,471 | ) | | | (668,338 | ) |
| Proceeds from Issuance of Preferred Stock, net of offering costs | | | 138,975,847 | | | | 49,120,853 | |
| Redemption of 8.25% Series A Preferred Stock | | | (91,595,000 | ) | | | -0- | |
| Proceeds from Registered Direct Placement of Common Stock, net of Offering Costs | | | 22,518,238 | | | | -0- | |
| Proceeds from Issuance of Common Stock in the DRIP, net of Dividend Reinvestments | | | 57,506,016 | | | | 20,012,393 | |
| Proceeds from Exercise of Stock Options | | | 5,435,634 | | | | 2,485,060 | |
| Preferred Dividends Paid | | | (16,665,934 | ) | | | (14,563,645 | ) |
| Common Dividends Paid, net of Reinvestments | | | (20,780,223 | ) | | | (17,630,270 | ) |
| Net Cash Provided by Financing Activities | | | 130,604,097 | | | | 45,894,673 | |
| | | | | | | | | |
| NET INCREASE (DECREASE) IN CASH AND CASH EQUIVALENTS | | | 19,025,498 | | | | (2,319,305 | ) |
| CASH AND CASH EQUIVALENTS – BEGINNING OF YEAR | | | 4,216,592 | | | | 6,535,897 | |
| CASH AND CASH EQUIVALENTS – END OF YEAR | | $ | 23,242,090 | | | $ | 4,216,592 | |
| UMH Properties, Inc. | Fourth Quarter FY 2017 Supplemental Information | 6 |
Reconciliation of Net Income to Adjusted EBITDA and Net Loss Attributable
to Common Shareholders to FFO, Core FFO and Normalized FFO
(unaudited)
| | | Three Months Ended | | | Twelve Months Ended | |
| | | 12/31/2017 | | | 12/31/2016 | | | 12/31/2017 | | | 12/31/2016 | |
| Reconciliation of Net Income to Adjusted EBITDA | | | | | | | | | | | | | | | |
| | | | | | | | | | | | | | | | | |
| Net Income | | $ | 3,530,616 | | | $ | 3,376,615 | | | $ | 12,668,034 | | | $ | 11,534,559 | |
| Interest Expense | | | 3,835,982 | | | | 3,828,241 | | | | 15,876,972 | | | | 15,432,364 | |
| Franchise Taxes | | | (33,775 | ) | | | 26,225 | | | | 245,000 | | | | 305,000 | |
| Depreciation Expense | | | 7,297,190 | | | | 6,121,424 | | | | 27,557,746 | | | | 23,214,100 | |
| Acquisition Costs | | | -0- | | | | 27,871 | | | | -0- | | | | 79,231 | |
| | | | | | | | | | | | | | | | | |
| Adjusted EBITDA | | $ | 14,630,013 | | | $ | 13,380,376 | | | $ | 56,347,752 | | | $ | 50,565,254 | |
| | | | | | | | | | | | | | | | | |
| Reconciliation of Net Loss Attributable to Common Shareholders to Funds from Operations | | | | | |
| | | | | | | | | | | | | | | | | |
| Net Loss Attributable to Common Shareholders | | $ | (795,765 | ) | | $ | (413,132 | ) | | $ | (7,679,265 | ) | | $ | (2,568,873 | ) |
| Depreciation Expense | | | 7,297,190 | | | | 6,121,424 | | | | 27,557,746 | | | | 23,214,100 | |
| (Gain) Loss on Sales of Depreciable Assets | | | 51,390 | | | | (21,347 | ) | | | 80,930 | | | | 2,163 | |
| | | | | | | | | | | | | | | | | |
| Funds from Operations (“FFO”) | | | 6,552,815 | | | | 5,686,945 | | | | 19,959,411 | | | | 20,647,390 | |
| | | | | | | | | | | | | | | | | |
| Adjustments: | | | | | | | | | | | | | | | | |
| Acquisition Costs | | | -0- | | | | 27,871 | | | | -0- | | | | 79,231 | |
| Cost of Early Extinguishment of Debt | | | -0- | | | | 5,121 | | | | -0- | | | | 5,121 | |
| Redemption of Preferred Stock | | | -0- | | | | -0- | | | | 3,502,487 | | | | -0- | |
| | | | | | | | | | | | | | | | | |
| Core Funds from Operations (“Core FFO”) | | | 6,552,815 | | | | 5,719,937 | | | | 23,461,898 | | | | 20,731,742 | |
| | | | | | | | | | | | | | | | | |
| Adjustments: | | | | | | | | | | | | | | | | |
| Gain on Sale of Securities, net | | | (229,239 | ) | | | (386,465 | ) | | | (1,747,528 | ) | | | (2,285,301 | ) |
| | | | | | | | | | | | | | | | | |
| Normalized Funds From Operations (“Normalized FFO”) | | $ | 6,323,576 | | | $ | 5,333,472 | | | $ | 21,714,370 | | | $ | 18,446,441 | |
| UMH Properties, Inc. | Fourth Quarter FY 2017 Supplemental Information | 7 |
Market Capitalization, Debt and Coverage Ratios
(unaudited)
| | | Twelve Months Ended | |
| | | 12/31/2017 | | | 12/31/2016 | |
| Shares Outstanding | | | 35,488,068 | | | | 29,388,811 | |
| Market Price Per Share | | $ | 14.90 | | | $ | 15.05 | |
| Equity Market Capitalization | | $ | 528,772,213 | | | $ | 442,301,606 | |
| Total Debt | | | 389,599,604 | | | | 351,310,977 | |
| Preferred | | | 238,780,000 | | | | 186,625,000 | |
| Total Market Capitalization | | $ | 1,157,151,817 | | | $ | 980,237,583 | |
| | | | | | | | | |
| Total Debt | | $ | 389,599,604 | | | $ | 351,310,977 | |
| Less: Cash and Cash Equivalents | | | (23,242,090 | ) | | | (4,216,592 | ) |
| Net Debt | | | 366,357,514 | | | | 347,094,385 | |
| Less: Securities Available for Sale at Fair Value (“Securities”) | | | (132,964,276 | ) | | | (108,755,172 | ) |
| Net Debt Less Securities | | $ | 233,393,238 | | | $ | 238,339,213 | |
| | | | | | | | | |
| Interest Expense | | $ | 15,876,972 | | | $ | 15,432,364 | |
| Capitalized Interest | | | 500,859 | | | | 359,906 | |
| Preferred Dividends | | | 16,844,812 | | | | 14,103,432 | |
| Total Fixed Charges | | $ | 33,222,643 | | | $ | 29,895,702 | |
| | | | | | | | | |
| Adjusted EBITDA | | $ | 56,347,752 | | | $ | 50,565,254 | |
| | | | | | | | | |
| Debt and Coverage Ratios | | | | | | | | |
| | | | | | | | | |
| Net Debt / Total Market Capitalization | | | 31.7 | % | | | 35.4 | % |
| | | | | | | | | |
| Net Debt Plus Preferred / Total Market Capitalization | | | 52.3 | % | | | 54.4 | % |
| | | | | | | | | |
| Net Debt Less Securities / Total Market Capitalization | | | 20.2 | % | | | 24.3 | % |
| | | | | | | | | |
| Net Debt Less Securities Plus Preferred / Total Market Capitalization | | | 40.8 | % | | | 43.4 | % |
| | | | | | | | | |
| Interest Coverage | | | 3.4 | x | | | 3.2 | x |
| | | | | | | | | |
| Fixed Charge Coverage | | | 1.7 | x | | | 1.7 | x |
| | | | | | | | | |
| Net Debt / Adjusted EBITDA | | | 6.5 | x | | | 6.9 | x |
| | | | | | | | | |
| Net Debt Less Securities / Adjusted EBITDA | | | 4.1 | x | | | 4.7 | x |
| | | | | | | | | |
| Net Debt Plus Preferred / Adjusted EBITDA | | | 10.7 | x | | | 10.6 | x |
| | | | | | | | | |
| Net Debt Less Securities Plus Preferred / Adjusted EBITDA | | | 8.4 | x | | | 8.4 | x |
| UMH Properties, Inc. | Fourth Quarter FY 2017 Supplemental Information | 8 |
Debt Analysis
(unaudited)
| | | Twelve Months Ended | |
| | | 12/31/2017 | | | 12/31/2016 | |
| Debt Outstanding | | | | | | | | |
| Mortgages Payable: | | | | | | | | |
| Fixed Rate Mortgages(1) | | $ | 308,444,180 | | | $ | 296,209,454 | |
| Variable Rate Mortgages | | | 16,606 | | | | 354,529 | |
| | | | | | | | | |
| Total Mortgages Before Unamortized Debt Issuance Costs | | | 308,460,786 | | | | 296,563,983 | |
| Unamortized Debt Issuance Costs | | | (3,565,669 | ) | | | (3,538,391 | ) |
| Mortgages, Net of Unamortized Debt Issuance Costs | | $ | 304,895,117 | | | $ | 293,025,592 | |
| Loans Payable: | | | | | | | | |
| Unsecured Line of Credit | | $ | 35,000,000 | | | $ | 20,000,000 | |
| Other Loans Payable | | | 49,765,824 | | | | 38,393,439 | |
| | | | | | | | | |
| Total Loans Before Unamortized Debt Issuance Costs | | | 84,765,824 | | | | 58,393,439 | |
| Unamortized Debt Issuance Costs | | | (61,337 | ) | | | (108,054 | ) |
| Loans, Net of Unamortized Debt Issuance Costs | | $ | 84,704,487 | | | $ | 58,285,385 | |
| | | | | | | | | |
| Total Debt, Net of Unamortized Debt Issuance Costs | | $ | 389,599,604 | | | $ | 351,310,977 | |
| | | | | | | | | |
| % Fixed/Floating | | | | | | | | |
| Fixed | | | 80.1 | % | | | 85.0 | % |
| Floating | | | 19.9 | % | | | 15.0 | % |
| Total | | | 100.0 | % | | | 100.0 | % |
| | | | | | | | | |
| Weighted Average Interest Rates(2) | | | | | | | | |
| Mortgages Payable | | | 4.24 | % | | | 4.34 | % |
| Loans Payable | | | 3.14 | % | | | 3.06 | % |
| Total Average | | | 4.01 | % | | | 4.13 | % |
Notes:
| (1) | Includes a variable rate mortgage with a balance of $-0-, and $10,625,352 as of December 31, 2017 and 2016, respectively, which had been effectively fixed at an interest rate of 3.89% with an interest rate swap agreement. |
| (2) | Weighted average interest rates do not include the effect of unamortized debt issuance costs. |
| UMH Properties, Inc. | Fourth Quarter FY 2017 Supplemental Information | 9 |
Debt Maturity
(unaudited)

| As of 12/31/17: | | | | | | | | | | | | |
| Fiscal Year Ended | | Mortgages | | | Loans | | | Total | | | % of Total | |
| 2018 | | $ | 16,606 | | | $ | 2,776,329 | | | $ | 2,792,935 | | | | 0.7 | % |
| 2019 | | | 2,633,664 | | | | 4,506,895 | | | | 7,140,559 | | | | 1.8 | % |
| 2020 | | | 12,144,422 | | | | 39,526,583 | (1) | | | 51,671,005 | | | | 13.1 | % |
| 2021 | | | 2,194,312 | | | | 420,131 | | | | 2,614,443 | | | | 0.7 | % |
| 2022 | | | 20,904,217 | | | | 236,217 | | | | 21,140,434 | | | | 5.4 | % |
| Thereafter | | | 270,567,565 | | | | 37,299,669 | | | | 307,867,234 | | | | 78.3 | % |
| | | | | | | | | | | | | | | | | |
| Total Debt Before Unamortized Debt Issuance Cost | | | 308,460,786 | | | | 84,765,824 | | | | 393,226,610 | | | | 100.0 | % |
| | | | | | | | | | | | | | | | | |
| Unamortized Debt Issuance Cost | | | 3,565,669 | | | | 61,337 | | | | 3,627,006 | | | | | |
| | | | | | | | | | | | | | | | | |
| Total Debt, Net of Unamortized Debt Issuance Costs | | $ | 304,895,117 | | | $ | 84,704,487 | | | $ | 389,599,604 | | | | | |
| Notes: |
| (1) Includes $35 million balance outstanding on the Company’s Line of Credit due March 2020, with an additional one year option. |
| UMH Properties, Inc. | Fourth Quarter FY 2017 Supplemental Information | 10 |
Property Summary and Snapshot
(unaudited)
| | | 12/31/2017 | | | 12/31/2016 | | | Change | |
| | | | | | | | | | |
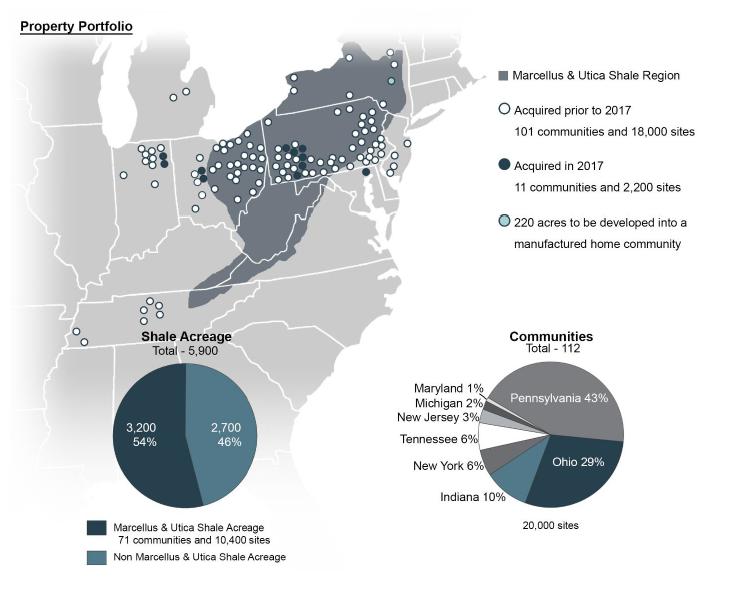
| Communities | | | 112 | | | | 101 | | | | 10.9 | % |
| Developed Sites | | | 20,029 | | | | 18,054 | | | | 10.9 | % |
| Occupied | | | 16,208 | | | | 14,499 | | | | 11.8 | % |
| Occupancy %(1) | | | 81.4 | % | | | 81.0 | % | | | 40 | bps |
| Total Rentals | | | 5,607 | | | | 4,659 | | | | 20.3 | % |
| Occupied Rentals | | | 5,213 | | | | 4,261 | | | | 22.3 | % |
| Rental Occupancy % | | | 93.0 | % | | | 91.5 | % | | | 150 | bps |
| Monthly Rent Per Site | | $ | 428 | | | $ | 422 | | | | 1.4 | % |
| Monthly Rent per Home Rental Including Site | | $ | 726 | | | $ | 709 | | | | 2.4 | % |
| Region | | Number | | | Total
Acreage | | | Developed
Acreage | | | Vacant
Acreage | | | Total
Sites | | | Occupied
Sites | | | Occupancy
Percentage | | | Monthly
Rent
Per Site | | | Total
Rentals | | | Occupied
Rentals | | | Rental
Occupancy
Percentage | | | Monthly
Rent
Per
Home
Rental | |
| | | | | | (2) | | | | | | (2) | | | | | | | | | (1) | | | | | | | | | | | | | | | (3) | |
| | | | | | | | | | | | | | | | | | | | | | | | | | | | | | | | | | | | | |
| Indiana | | | 11 | | | | 816 | | | | 685 | | | | 131 | | | | 3,221 | | | | 2,497 | | | | 77.5 | % | | $ | 397 | | | | 1,052 | | | | 1,002 | | | | 95.2 | % | | $ | 731 | |
| Maryland | | | 1 | | | | 77 | | | | 10 | | | | 67 | | | | 63 | | | | 58 | | | | 92.1 | % | | $ | 478 | | | | -0- | | | | -0- | | | | N/A | | | | N/A | |
| Michigan | | | 2 | | | | 68 | | | | 68 | | | | -0- | | | | 354 | | | | 259 | | | | 73.2 | % | | $ | 432 | | | | 165 | | | | 151 | | | | 91.5 | % | | $ | 721 | |
| New Jersey | | | 4 | | | | 349 | | | | 187 | | | | 162 | | | | 1,005 | | | | 959 | | | | 95.4 | % | | $ | 607 | | | | 36 | | | | 34 | | | | 94.4 | % | | $ | 953 | |
| New York | | | 7 | | | | 617 | | | | 308 | | | | 309 | | | | 1,144 | | | | 943 | | | | 82.4 | % | | $ | 508 | | | | 289 | | | | 268 | | | | 92.7 | % | | $ | 860 | |
| Ohio | | | 32 | | | | 1,475 | | | | 1,065 | | | | 410 | | | | 5,099 | | | | 4,038 | | | | 79.2 | % | | $ | 365 | | | | 1,374 | | | | 1,293 | | | | 94.1 | % | | $ | 662 | |
| Pennsylvania | | | 48 | | | | 2,087 | | | | 1,728 | | | | 359 | | | | 7,343 | | | | 5,878 | | | | 80.0 | % | | $ | 436 | | | | 1,891 | | | | 1,712 | | | | 90.5 | % | | $ | 751 | |
| Tennessee | | | 7 | | | | 413 | | | | 321 | | | | 92 | | | | 1,800 | | | | 1,576 | | | | 87.6 | % | | $ | 445 | | | | 800 | | | | 753 | | | | 94.1 | % | | $ | 722 | |
| Total as of December 31, 2017 | | | 112 | | | | 5,902 | | | | 4,372 | | | | 1,530 | | | | 20,029 | | | | 16,208 | | | | 81.4 | % | | $ | 428 | | | | 5,607 | | | | 5,213 | | | | 93.0 | % | | $ | 726 | |
| Notes: |
| (1) The 144 Sites at Memphis Blues are not included in the calculation of occupancy. |
| (2) Total and Vacant Acreage of 220 for the Mountain View Estates property is included in the above summary. |
| (3) Includes home and site rent charges. |
| UMH Properties, Inc. | Fourth Quarter FY 2017 Supplemental Information | 11 |
Same Property Statistics
(unaudited)
| | | For Three Months Ended | | | For Twelve Months Ended | |
| | | 12/31/2017 | | | 12/31/2016 | | | Change | | | % Change | | | 12/31/2017 | | | 12/31/2016 | | | Change | | | % Change | |
| Community Net Operating Income | | | | | | | | | | | | | | | | | | | | | | | | | | | | | | | | |
| | | | | | | | | | | | | | | | | | | | | | | | | | | | | | | | | |
| Rental and Related Income | | $ | 24,461,737 | | | $ | 23,229,637 | | | $ | 1,232,100 | | | | 5.3 | % | | $ | 95,973,126 | | | $ | 90,505,068 | | | $ | 5,468,058 | | | | 6.0 | % |
| Community Operating Expenses | | | 10,526,340 | | | | 9,969,780 | | | | 556,560 | | | | 5.6 | % | | | 41,968,168 | | | | 40,309,468 | | | | 1,658,700 | | | | 4.1 | % |
| | | | | | | | | | | | | | | | | | | | | | | | | | | | | | | | | |
| Community NOI | | $ | 13,935,397 | | | $ | 13,259,857 | | | $ | 675,540 | | | | 5.1 | % | | $ | 54,004,958 | | | $ | 50,195,600 | | | $ | 3,809,358 | | | | 7.6 | % |
| | | As of | | | | |
| | | 12/31/2017 | | | 12/31/2016 | | | Change | |
| Other Information | | | | | | | | | | | | |
| Total Sites | | | 17,605 | | | | 17,609 | | | | 0.0 | % |
| Occupied Sites | | | 14,561 | | | | 14,292 | | | | 1.9 | % |
| Occupancy % | | | 82.7 | % | | | 81.2 | % | | | 150 | bps |
| Number of Properties | | | 98 | | | | 98 | | | | N/A | |
| Total Rentals | | | 5,254 | | | | 4,610 | | | | 14.0 | % |
| Occupied Rentals | | | 4,913 | | | | 4,245 | | | | 15.7 | % |
| Rental Occupancy | | | 93.5 | % | | | 92.1 | % | | | 140 | bps |
| Monthly Rent Per Site | | $ | 436 | | | $ | 423 | | | | 3.1 | % |
| Monthly Rent Per Home Rental Including Site | | $ | 723 | | | $ | 709 | | | | 2.0 | % |
| Notes: |
| Same Property includes all properties owned as of January 1, 2016, with the exception of Memphis Blues. |
| UMH Properties, Inc. | Fourth Quarter FY 2017 Supplemental Information | 12 |
Acquisition Summary
At Acquisition:
Year of
Acquisition | | Number of
Communities | | | Sites | | | Occupied
Sites | | | Occupancy % | | | Price | | | Total
Acres | |
| 2015 | | | 10 | | | | 2,774 | | | | 1,764 | | | | 64 | % | | $ | 81,217,000 | | | | 717 | |
| 2016 | | | 3 | | | | 289 | | | | 215 | | | | 74 | % | | $ | 7,277,000 | | | | 219 | |
| 2017 | | | 11 | | | | 1,997 | | | | 1,333 | | | | 67 | % | | $ | 63,290,000 | | | | 602 | |
2017 Acquisitions
| Community | | Date of
Acquisition | | | State | | | Number
of Sites | | | Purchase
Price | | | Number
of Acres | | | Occupancy | |
| | | | | | | | | | | | | | | | | | | |
| Marysville Estates and Hillcrest Estates | | | January 20, 2017 | | | | OH | | | | 532 | | | $ | 9,588,000 | | | | 149 | | | | 57 | % |
| Boardwalk and Parke Place | | | January 20, 2017 | | | | IN | | | | 559 | | | | 24,437,000 | | | | 155 | | | | 77 | % |
| Hillcrest Crossing | | | January 24, 2017 | | | | PA | | | | 200 | | | | 2,485,000 | | | | 78 | | | | 40 | % |
| Cinnamon Woods | | | May 31, 2017 | | | | MD | | | | 63 | | | | 4,000,000 | | | | 79 | | | | 92 | % |
Pennsylvania 5 Community Portfolio | | | December 22, 2017 | | | | PA | | | | 643 | | | | 22,780,000 | | | | 141 | | | | 72 | % |
| Total 2017 | | | | | | | | | | | 1,997 | | | $ | 63,290,000 | | | | 602 | | | | 67 | % |
| UMH Properties, Inc. | Fourth Quarter FY 2017 Supplemental Information | 13 |
Definitions
Investors and analysts following the real estate industry utilize funds from operations (“FFO”), core funds from operations (“Core FFO”), normalized funds from operations (“Normalized FFO”), community NOI, same property NOI, and earnings before interest, taxes, depreciation, amortization and acquisition costs (“Adjusted EBITDA”), variously defined, as supplemental performance measures. While the Company believes net income available to common stockholders, as defined by accounting principles generally accepted in the United States of America (U.S. GAAP), is the most appropriate measure, it considers Community NOI, Same Property NOI, Adjusted EBITDA, FFO, Core FFO and Normalized FFO, given their wide use by and relevance to investors and analysts, appropriate supplemental performance measures. FFO, reflecting the assumption that real estate asset values rise or fall with market conditions, principally adjusts for the effects of U.S. GAAP depreciation and amortization of real estate assets. Core FFO reflects the same assumptions as FFO except that it also adjusts for the effects of acquisitions costs and costs of early extinguishment of debt. Normalized FFO reflects the same assumptions as Core FFO except that it also adjusts for gains and losses realized on securities investments and certain one-time charges. Community NOI and Same Property NOI provides a measure of rental operations, and does not factor in depreciation and amortization and non-property specific expenses such as general and administrative expenses. Adjusted EBITDA provides a tool to further evaluate the ability to incur and service debt and to fund dividends and other cash needs. In addition, Community NOI, Same Property NOI, Adjusted EBITDA, FFO, Core FFO and Normalized FFO are commonly used in various ratios, pricing multiples, yields and returns and valuation of calculations used to measure financial position, performance and value.
As used herein, the Company calculates FFO, as defined by The National Association of Real Estate Investment Trusts (“NAREIT”), to be equal to net income (loss) applicable to common shareholders, as defined by U.S. GAAP, excluding extraordinary items as defined by U.S. GAAP, gains or losses from sales of previously depreciated real estate assets, impairment charges related to depreciable real estate assets, plus certain non-cash items such as real estate asset depreciation and amortization. FFO includes gains and losses realized on securities investments.
Core FFO is calculated as FFO plus acquisition costs and costs of extinguishment of debt.
Normalized FFOis calculated as Core FFO excluding gains and losses realized on securities investments and certain one-time charges.
FFO per Diluted Common Share, Core FFO per Diluted Common Share and Normalized FFO per Diluted Common Share is calculated using diluted weighted shares outstanding of 35,478,000 and 33,146,000 shares for the three and twelve months ended December 31, 2017, respectively, and 29,279,000 and 28,136,000 for the three and twelve months ended December 31, 2016, respectively. Common stock equivalents resulting from stock options in the amount of 406,000 and 470,000 shares for the three and twelve months ended December 31, 2017, respectively, and 449,000 and 327,000 shares for the three and twelve months ended December 31, 2016, respectively, are included in the diluted weighted shares outstanding. Common stock equivalents were excluded from the computation of the Diluted Net Loss per Share as their effect would be anti-dilutive.
Community NOI is calculated as rental and related income less community operating expenses such as real estate taxes, repairs and maintenance, community salaries, utilities, insurance and other expenses. Community NOI excludes realized gains (losses) on securities transactions.
Same Property NOI is calculated as Community NOI, using all properties owned as of January 1, 2016, with the exception of Memphis Blues.
AdjustedEBITDAis calculated as net income plus interest expense, franchise taxes, depreciation, amortization and acquisition costs.
Community NOI, Same Property NOI, Adjusted EBITDA, FFO, Core FFO and Normalized FFOdo not represent cash generated from operating activities in accordance with U.S. GAAP and are not necessarily indicative of cash available to fund cash needs, including the repayment of principal on debt and payment of dividends and distributions. Community NOI, Same Property NOI, Adjusted EBITDA, FFO, Core FFO and Normalized FFO should not be considered as substitutes for net income applicable to common shareholders (calculated in accordance with U.S. GAAP) as a measure of results of operations, or cash flows (calculated in accordance with U.S. GAAP) as a measure of liquidity. Community NOI, Same Property NOI, Adjusted EBITDA, FFO, Core FFO and Normalized FFO as currently calculated by the Company may not be comparable to similarly titled, but variously calculated, measures of other REITs.
| UMH Properties, Inc. | Fourth Quarter FY 2017 Supplemental Information | 14 |
Press Release Dated March 8, 2018
| FOR IMMEDIATE RELEASE | March 8, 2018 |
| | Contact: Nelli Madden |
| | 732-577-9997 |
UMH PROPERTIES, INC. REPORTS RESULTS FOR THE YEAR ENDED AND THE FOURTH QUARTER ENDED DECEMBER 31, 2017
FREEHOLD, NJ, March 8, 2018........ UMH Properties, Inc. (NYSE:UMH) reported Total Income of $112,648,000 for the year ended December 31, 2017 as compared to $99,214,000 for the year ended December 31, 2016, representing an increase of 14%. Total Income for the quarter ended December 31, 2017 was $28,697,000 as compared to $25,144,000 for the quarter ended December 31, 2016, representing an increase of 14%. Net Loss Attributable to Common Shareholders amounted to $7,679,000 or $0.24 per diluted share for the year ended December 31, 2017 as compared to $2,569,000 or $0.10 per diluted share for the year ended December 31, 2016. This increase was primarily due to a non-recurring, non-cash $3.5 million preferred redemption charge and to an increase in depreciation expense, attributable to acquisitions made. Net Loss Attributable to Common Shareholders amounted to $796,000 or $0.03 per diluted share for the quarter ended December 31, 2017 as compared to $413,000 or $0.02 per diluted share for the quarter ended December 31, 2016.
Core Funds from Operations (“Core FFO”) was $23,462,000 or $0.71 per diluted share for the year ended December 31, 2017 as compared to $20,731,000 or $0.74 per diluted share for the year ended December 31, 2016, representing a decrease in Core FFO per diluted share of 4%. Core FFO was $6,553,000 or $0.19 per diluted share for the quarter ended December 31, 2017 as compared to $5,719,000 or $0.20 per diluted share for the quarter ended December 31, 2016, representing a decrease in Core FFO per diluted share of 5%. Normalized Funds from Operations (“Normalized FFO”), was $21,714,000 or $0.66 per diluted share for the year ended December 31, 2017, as compared to $18,446,000 or $0.66 per diluted share for the year ended December 31, 2016. Normalized FFO was $6,324,000 or $0.18 per diluted share for the quarter ended December 31, 2017, as compared to $5,333,000 or $0.18 per diluted share for the quarter ended December 31, 2016.
A summary of significant financial information for the three and twelve months ended December 31, 2017 and 2016 is as follows:
| | | For the Three Months Ended | |
| | | December 31, | |
| | | 2017 | | | 2016 | |
| | | | | | | |
| Total Income | | $ | 28,697,000 | | | $ | 25,144,000 | |
| Total Expenses | | $ | 24,568,000 | | | $ | 20,635,000 | |
| Gain on Sales of Securities, net | | $ | 229,000 | | | $ | 386,000 | |
| Net Loss Attributable to Common Shareholders | | $ | (796,000 | ) | | $ | (413,000 | ) |
| Net Loss Attributable to Common Shareholders per Diluted Common Share | | $ | (0.03 | ) | | $ | (0.02 | ) |
| Core FFO(1) | | $ | 6,553,000 | | | $ | 5,719,000 | |
| Core FFO(1) per Diluted Common Share | | $ | 0.19 | | | $ | 0.20 | |
| Normalized FFO(1) | | $ | 6,324,000 | | | $ | 5,333,000 | |
| Normalized FFO(1) per Diluted Common Share | | $ | 0.18 | | | $ | 0.18 | |
| Weighted Average Shares Outstanding | | | 35,072,000 | | | | 28,830,000 | |
| UMH Properties, Inc. | Fourth Quarter FY 2017 Supplemental Information | 15 |
| | | For the Twelve Months Ended | |
| | | December 31, | |
| | | 2017 | | | 2016 | |
| | | | | | | |
| Total Income | | $ | 112,648,000 | | | $ | 99,214,000 | |
| Total Expenses | | $ | 96,616,000 | | | $ | 83,256,000 | |
| Gain on Sales of Securities, net | | $ | 1,748,000 | | | $ | 2,285,000 | |
| Net Loss Attributable to Common Shareholders | | $ | (7,679,000 | ) | | $ | (2,569,000 | ) |
| Net Loss Attributable to Common Shareholders per Diluted Common Share | | $ | (0.24 | ) | | $ | (0.10 | ) |
| Core FFO(1) | | $ | 23,462,000 | | | $ | 20,731,000 | |
| Core FFO(1) per Diluted Common Share | | $ | 0.71 | | | $ | 0.74 | |
| Normalized FFO(1) | | $ | 21,714,000 | | | $ | 18,446,000 | |
| Normalized FFO(1) per Diluted Common Share | | $ | 0.66 | | | $ | 0.66 | |
| Weighted Average Shares Outstanding | | | 32,676,000 | | | | 27,809,000 | |
A summary of significant balance sheet information as of December 31, 2017 and 2016 is as follows:
| | | December 31, 2017 | | | December 31, 2016 | |
| | | | | | | |
| Gross Real Estate Investments | | $ | 764,439,000 | | | $ | 640,217,000 | |
| Securities Available for Sale at Fair Value | | $ | 132,964,000 | | | $ | 108,755,000 | |
| Total Assets | | $ | 823,881,000 | | | $ | 680,445,000 | |
| Mortgages Payable, net | | $ | 304,895,000 | | | $ | 293,026,000 | |
| Loans Payable, net | | $ | 84,704,000 | | | $ | 58,285,000 | |
| Total Shareholders’ Equity | | $ | 421,215,000 | | | $ | 317,032,000 | |
Samuel A. Landy, President and CEO, commented on the 2017 results.
“We are pleased to announce a very productive 2017. We have generated solid operating results, achieved strong growth and improved our financial position. We have reached a number of milestones this year. We now own and operate 112 manufactured home communities with over 20,000 developed homesites. We have been included in the MSCI REIT index. We have reached an all-time high stock price of $17.90. Our total market capitalization is over $1 billion with an equity market capitalization of over $500 million. Our accomplishments during the year include:
| | ● | Increased Rental and Related Income by 12.3%; |
| | ● | Increased Community Net Operating Income (“NOI”) by 12.3%; |
| | ● | Increased Same Property NOI by 7.6% |
| | ● | Increased Same Property Occupancy by 150 basis points from 81.2% to 82.7%; |
| | ● | Increased home sales by 27.1%; |
| | ● | Acquired 11 communities containing approximately 2,000 home sites for a total cost of $63.3 million, including our first community in Maryland, bringing our total property portfolio to 112 manufactured home communities with over 20,000 developed homesites; |
| | ● | Completed Phase I of a redevelopment community, Memphis Blues, our first all rental community; |
| | ● | Increased our rental home portfolio by 948 homes to approximately 5,600 total rental homes, representing an increase of 20.3%; |
| | ● | Increased rental home occupancy by 150 basis points from 91.5% to 93.0%; |
| | ● | Reduced the weighted average interest rate on our mortgage debt from 4.3% to 4.2%; |
| | ● | Reduced the weighted average interest rate on our total debt from 4.1% to 4.0%; |
| | ● | Issued 5,750,000 shares of a new 6.75% Series C Cumulative Redeemable Preferred Stock, for net proceeds after deducting the underwriting discount and other estimated offering expenses, of approximately $139 million; |
| UMH Properties, Inc. | Fourth Quarter FY 2017 Supplemental Information | 16 |
| | ● | Redeemed our high coupon 8.25% Series A Preferred Stock, resulting in $1.4 million in annual preferred dividend savings; |
| | ● | Issued 1,400,000 shares of our common stock raising net proceeds of $22.5 million, in conjunction with our inclusion in the MSCI REIT Index; |
| | ● | Raised $60.4 million through our Dividend Reinvestment and Stock Purchase Plan; |
| | ● | Reduced our Net Debt to Total Market Capitalization from 35.4% to 31.7% and our Net Debt Less Securities to Total Market Capitalization from 24.3% to 20.2%; and, |
| | ● | Increased our total market capitalization to $1.2 billion, representing an increase of 18%.” |
Mr. Landy stated, “This year, we successfully replaced all of the outstanding shares of our high coupon 8.25% Series A Preferred Stock with our new 6.75% Series C Perpetual Preferred Stock. This 150 basis point reduction will result in $1.4 million in annual preferred dividend savings going forward. Our 2017 earnings were impacted due to the expenses associated with completing this transaction, including a non-recurring, non-cash $3.5 million preferred redemption charge, and the short-term dilution associated with carrying the additional preferred stock until it was fully deployed. For the fourth quarter, our Normalized FFO was $0.18 per diluted share. We are pleased that our Normalized FFO for the quarter fully covered our $0.18 dividend.”
“Subsequent to yearend, UMH issued and sold 2,000,000 shares of a new 6.375% Series D Cumulative Redeemable Preferred Stock, and received net proceeds from the offering after expenses of approximately $48.1 million. We expect increased earnings as we fully deploy these proceeds.”
“In 2017, we increased our community portfolio by 11%. We acquired 11 communities containing approximately 2,000 developed homesites for an aggregate cost of approximately $63.3 million. The average occupancy of these communities is 67%. These communities are located within our existing footprint and provide additional growth opportunities through the filling of vacant sites and from expansion capabilities.”
“Home sales have been improving and increased 27% this year. With population growth, rising wages and steady job creation, housing demand should continue to increase. Our customers are seeing increased wages which is translating into rising housing demand.”
“Same Property NOI increased by 7.6% this year, driven by a 150 basis point increase in occupancy and a 310 basis point increase in site rent. Our 2017 accomplishments reflect consistent strong performance across our portfolio and position us for continued success in 2018.”
UMH Properties, Inc. will host its Fourth Quarter and Year End 2017 Financial Results Webcast and Conference Call. Senior management will discuss the results, current market conditions and future outlook on Friday, March 9, 2018 at 10:00 a.m. Eastern Time.
The Company’s 2017 fourth quarter and yearend financial results being released herein will be available on the Company’s website atwww.umh.reit in the “Financial Information and Filings” section.
To participate in the webcast, select the microphone icon found on the homepagewww.umh.reitto access the call. Interested parties can also participate via conference call by calling toll free 877-513-1898 (domestically) or 412-902-4147 (internationally).
The replay of the conference call will be available at 12:00 p.m. Eastern Time on Friday, March 9, 2018. It will be available until June 9, 2018, and can be accessed by dialing toll free 877-344-7529 (domestically) and 412-317-0088 (internationally) and entering the passcode 10116327.A transcript of the call and the webcast replay will be available at the Company’s website,www.umh.reit.
| UMH Properties, Inc. | Fourth Quarter FY 2017 Supplemental Information | 17 |
UMH Properties, Inc., which was organized in 1968, is a public equity REIT that owns and operates 112 manufactured home communities containing approximately 20,000 developed homesites. These communities are located in New Jersey, New York, Ohio, Pennsylvania, Tennessee, Indiana, Michigan and Maryland. In addition, the Company owns a portfolio of REIT securities.
Certain statements included in this press release which are not historical facts may be deemed forward-looking statements within the meaning of the Private Securities Litigation Reform Act of 1995. Any such forward-looking statements are based on the Company’s current expectations and involve various risks and uncertainties. Although the Company believes the expectations reflected in any forward-looking statements are based on reasonable assumptions, the Company can provide no assurance those expectations will be achieved. The risks and uncertainties that could cause actual results or events to differ materially from expectations are contained in the Company’s annual report on Form 10-K and described from time to time in the Company’s other filings with the SEC. The Company undertakes no obligation to publicly update or revise any forward-looking statements whether as a result of new information, future events, or otherwise.
Note:
| | (1) | Non-GAAP Information: We assess and measure our overall operating results based upon an industry performance measure referred to as Funds From Operations (“FFO”), which management believes is a useful indicator of our operating performance. FFO is used by industry analysts and investors as a supplemental operating performance measure of a REIT. FFO, as defined by The National Association of Real Estate Investment Trusts (“NAREIT”), represents Net Income (Loss) Attributable to Common Shareholders, as defined by accounting principles generally accepted in the United States of America (“U.S. GAAP”), excluding extraordinary items, as defined under U.S. GAAP, gains or losses from sales of previously depreciated real estate assets, impairment charges related to depreciable real estate assets, plus certain non-cash items such as real estate asset depreciation and amortization. NAREIT created FFO as a non-U.S. GAAP supplemental measure of REIT operating performance. We define Core Funds From Operations (“Core FFO”) as FFO plus acquisition costs and costs of early extinguishment of debt. We define Normalized Funds From Operations (“Normalized FFO”) as Core FFO excluding gains and losses realized on securities investments and certain non-recurring charges. We define Community NOI as rental and related income less community operating expenses such as real estate taxes, repairs and maintenance, community salaries, utilities, insurance and other expenses. FFO, Core FFO and Normalized FFO, as well as Community NOI, should be considered as supplemental measures of operating performance used by REITs. FFO, Core FFO and Normalized FFO exclude historical cost depreciation as an expense and may facilitate the comparison of REITs which have a different cost basis. However, other REITs may use different methodologies to calculate FFO, Core FFO, Normalized FFO and Community NOI and, accordingly, our FFO, Core FFO, Normalized FFO and Community NOI may not be comparable to all other REITs. The items excluded from FFO, Core FFO and Normalized FFO are significant components in understanding the Company’s financial performance. |
| | | |
| | | FFO, Core FFO and Normalized FFO (i) do not represent Cash Flow from Operations as defined by U.S. GAAP; (ii) should not be considered as an alternative to net income (loss) as a measure of operating performance or to cash flows from operating, investing and financing activities; and (iii) are not alternatives to cash flow as a measure of liquidity. |
The reconciliation of the Company’s U.S. GAAP net loss to the Company’s FFO, Core FFO and Normalized FFO for the three and twelve months ended December 31, 2017 and 2016 are calculated as follows:
| | | Three Months Ended | | | Twelve Months Ended | |
| | | 12/31/17 | | | 12/31/16 | | | 12/31/17 | | | 12/31/16 | |
| Net Loss Attributable to Common Shareholders | | $ | (796,000 | ) | | $ | (413,000 | ) | | $ | (7,679,000 | ) | | $ | (2,569,000 | ) |
| Depreciation Expense | | | 7,297,000 | | | | 6,121,000 | | | | 27,557,000 | | | | 23,214,000 | |
| (Gain) Loss on Sales of Depreciable Assets | | | 52,000 | | | | (22,000 | ) | | | 81,000 | | | | 2,000 | |
| FFO Attributable to Common Shareholders | | | 6,553,000 | | | | 5,686,000 | | | | 19,959,000 | | | | 20,647,000 | |
| Acquisition Costs | | | -0- | | | | 28,000 | | | | -0- | | | | 79,000 | |
| Cost of Early Extinguishment of Debt | | | -0- | | | | 5,000 | | | | -0- | | | | 5,000 | |
| Redemption of Preferred Stock | | | -0- | | | | -0- | | | | 3,503,000 | | | | -0- | |
| Core FFO Attributable to Common Shareholders | | | 6,553,000 | | | | 5,719,000 | | | | 23,462,000 | | | | 20,731,000 | |
| Gain on Sales of Securities, net | | | (229,000 | ) | | | (386,000 | ) | | | (1,748,000 | ) | | | (2,285,000 | ) |
| Normalized FFO Attributable to Common Shareholders | | $ | 6,324,000 | | | $ | 5,333,000 | | | $ | 21,714,000 | | | $ | 18,446,000 | |
The diluted weighted shares outstanding used in the calculation of Core FFO per Diluted Common Share and Normalized FFO per Diluted Common Share were 35,478,000 and 33,146,000 shares for the three and twelve months ended December 31, 2017, respectively, and 29,279,000 and 28,136,000 for the three and twelve months ended December 31, 2016, respectively. Common stock equivalents resulting from stock options in the amount of 406,000 and 470,000 shares for the three and twelve months ended December 31, 2017, respectively, and 449,000 and 327,000 shares for the three and twelve months ended December 31, 2016, respectively, are included in the diluted weighted shares outstanding. Common stock equivalents were excluded from the computation of the Diluted Net Loss per Share as their effect would be anti-dilutive.
| UMH Properties, Inc. | Fourth Quarter FY 2017 Supplemental Information | 18 |
The following are the cash flows provided (used) by operating, investing and financing activities for the twelve months ended December 31, 2017 and 2016:
| | | 2017 | | | 2016 | |
| Operating Activities | | $ | 41,341,000 | | | $ | 29,353,000 | |
| Investing Activities | | | (152,920,000 | ) | | | (77,567,000 | ) |
| Financing Activities | | | 130,604,000 | | | | 45,895,000 | |
# # # #
| UMH Properties, Inc. | Fourth Quarter FY 2017 Supplemental Information | 19 |