UNITED STATES
SECURITIES AND EXCHANGE COMMISSION
WASHINGTON, D.C. 20549
FORM N-CSR
CERTIFIED SHAREHOLDER REPORT OF REGISTERED MANAGEMENT
INVESTMENT COMPANIES
Investment Company Act file number 811-4108
Oppenheimer Variable Account Funds
(Exact name of registrant as specified in charter)
6803 South Tucson Way, Centennial, Colorado 80112-3924
(Address of principal executive offices) (Zip code)
Robert G. Zack, Esq.
OppenheimerFunds, Inc.
Two World Financial Center, New York, New York 10281-1008
(Name and address of agent for service)
Registrant’s telephone number, including area code: (303) 768-3200
Date of fiscal year end: December 31
Date of reporting period: 12/31/2008
Item 1. Reports to Stockholders.
| December 31, 2008 Oppenheimer Management MidCap Fund/VA Commentaries and A Series of Oppenheimer Variable Account Funds Annual Report M A N A G E M E N T C O M M E N TA R I E S Listing of Top Holdings A N N UA L R E P O RT Fund Performance Discussion Listing of Investments Financial Statements |
FUND PERFORMANCE DISCUSSION
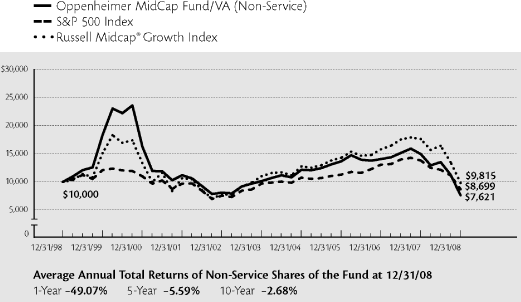
Management’s Discussion of Fund Performance. During an extremely difficult operating environment, Oppenheimer MidCap Fund/VA’s Non-Service shares returned -49.07% and underperformed the broader equity market, as measured by the S&P 500 Index, which returned -36.99%, and the Russell Midcap Growth Index, which returned -44.32% for the one–year period ended December 31, 2008. Although the Fund’s total returns were negatively impacted by volatile equity market conditions, we continue to find long-term opportunities in mid-sized companies that are being punished for reasons that we believe are mainly short-term or cyclical. During an environment where the market brutalized both good and bad companies indiscriminately, the Fund’s focus on investing in high-quality businesses with experienced management and proven records of performance continues to yield what we believe to be are many attractive new opportunities. In terms of sector performance relative to the Russell Midcap Growth Index, the Fund benefited from its holdings in the energy, utilities, materials and information technology sectors. In contrast, holdings in the consumer discretionary, healthcare and consumer staples sectors detracted from relative Fund performance.
In terms of individual contributors, top performing securities were C. H. Robinson Worldwide, Inc., Science Applications International Corporation (SAIC), Inc. and Burger King Holdings, Inc. Within the industrials sector, C.H. Robinson Worldwide, an airfreight and logistics company, has exceeded earnings forecasts for many quarters in a row and is a beneficiary of growing global trade. Within the information technology sector, SAIC, which provides scientific, engineering and technology applications to various U.S. government agencies including the U.S. Department of Defense, was awarded several new defense contracts. Burger King held up well during the reporting period as the economic downturn led consumers to favor lower-priced eateries.
The Fund’s weakest performing sectors included consumer discretionary, healthcare and consumer staples. Consumer discretionary was by far the biggest detractor from performance, led by steep declines in the media, hotels/restaurants/leisure and specialty retail subsectors within this category. Within consumer discretionary, Las Vegas Sands Corp., the world’s largest casino company by market value, was the largest detractor and declined due to costs associated with declining property values and some missteps with the opening of the Venetian Macao. Within the media sub-sector, Focus Media Holding Ltd. and Liberty Global, Inc. experienced significant declines. Focus Media, one of the largest publicly traded advertising companies in China, fell sharply due to a shakeup in management and issues over business practices. Liberty Global, an international provider of video, voice and broadband Internet services, declined due to the fact that it was highly financially leveraged and the market was very concerned with companies that have high debt. Also, Liberty Global has been hurt by the strengthening dollar—despite the fact that it is based in Colorado, its operations are located in Europe, Puerto Rico and Japan. Within the telecommunication services sector, Crown Castle International, Inc., a wireless infrastructure company, struggled during the reporting period with the difficult credit markets and a decline in market value of some of its investments. We maintained our position in Liberty Global and exited our positions in the other companies mentioned above.
During the reporting period, a portfolio manager change occurred. Effective November 17, 2008, Ronald J. Zibelli, Jr. became the new portfolio manager. Mr. Zibelli, CFA, has been a Vice President of OppenheimerFunds, Inc. (the “Manager”) and portfolio manager since May 2006. Mr. Zibelli has an extensive and successful track record within the investment management business, having spent a combined 18 years at Merrill Lynch and Chase Manhattan Bank. While at Merrill Lynch, Mr. Zibelli served as a Managing Director and Small Cap Growth Team Leader, responsible for 11 portfolios. Prior to joining Merrill Lynch Investment Managers, Mr. Zibelli spent 12 years with Chase Manhattan Bank, including two years as Senior Portfolio Manager (U.S. Small Cap Equity) at Chase Asset Management.
As a result of the management change, we would like to inform investors of our investment process. Regardless of the broader market environment, we follow a consistent investment strategy. We are long-term investors by nature and do not in general rebalance due to current market conditions. We focus on higher-quality, faster growing companies that exhibit leadership within their market sector. Specifically, by employing a disciplined, research-driven stock selection process combined with a risk control strategy, we seek to uncover lesser-known
3 | OPPENHEIMER MIDCAP FUND/VA
FUND PERFORMANCE DISCUSSION
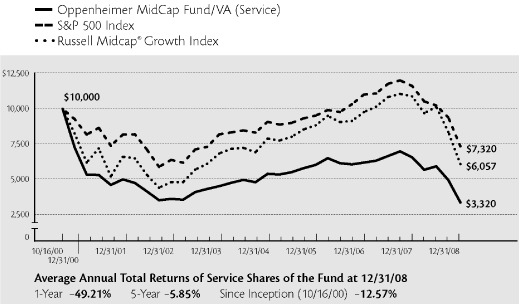
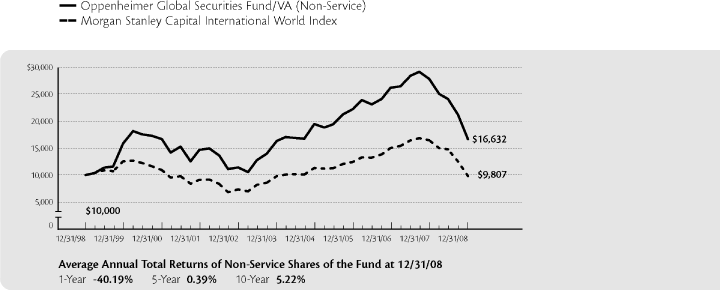
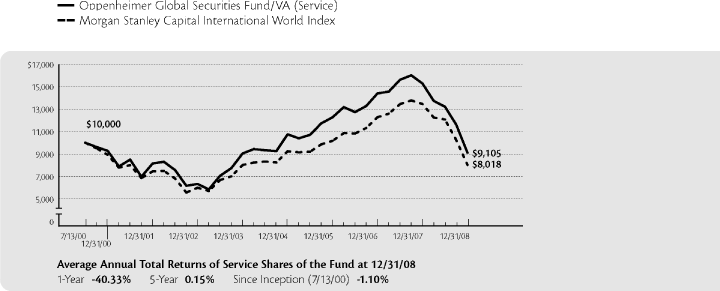
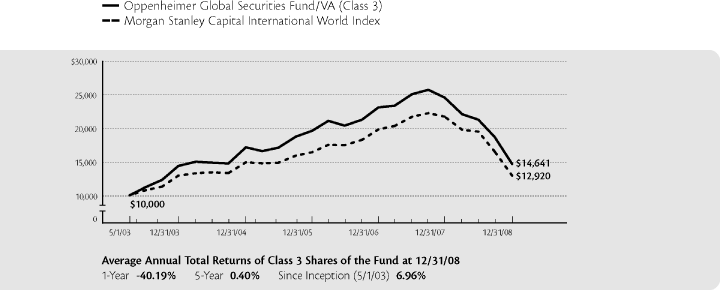
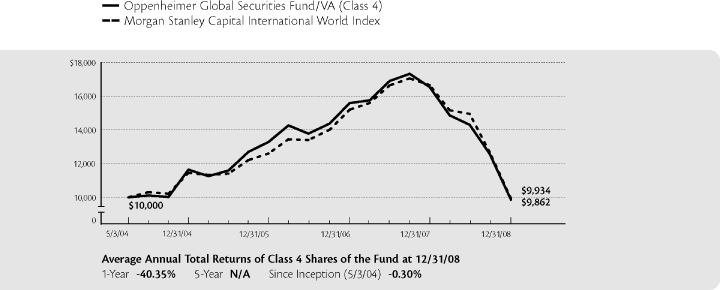
companies with a competitive edge within their marketplace. We target those companies we believe offer innovative products or services, fast growing earnings, sustainable growth rates and accomplished management teams. Comparing the Fund’s Performance to the Market. The graphs that follow show the performance of a hypothetical $10,000 investment in each share class of the Fund held until December 31, 2008. In the case of Non-Service shares, performance is measured over a ten-year period. In the case of Service shares, performance is measured from inception of the Class on October 16, 2000. Performance information does not reflect charges that apply to separate accounts investing in the Fund. If these charges were taken into account, performance would be lower. The graphs assume that all dividends and capital gains distributions were reinvested in additional shares. Past performance cannot guarantee future results.
The Fund’s performance is compared to the performance of the S&P 500 Index, an unmanaged index of equity securities that is a measure of the general domestic stock market, and the Russell Midcap® Growth Index, an unmanaged index of medium-capitalization domestic growth stocks. The indices’ performance includes reinvestment of income but does not reflect transaction costs, fees or expenses. The Fund’s performance reflects the effects of the Fund’s business and operating expenses. While index comparisons may be useful to provide a benchmark for the Fund’s performance, it must be noted that the Fund’s investments are not limited to the investments in the index.
4 | OPPENHEIMER MIDCAP FUND/VA
Non-Service Shares
Comparison of Change in Value of $10,000 Hypothetical Investments in:
Service Shares
Comparison of Change in Value of $10,000 Hypothetical Investments in:
The performance data quoted represents past performance, which does not guarantee future results. The investment return and principal value of an investment in the Fund will fluctuate so that an investor’s shares, when redeemed, may be worth more or less than their original cost. Current performance may be lower or higher than the performance quoted. For performance data current to the most recent month end, call us at 1.800.981.2871. The Fund’s total returns should not be expected to be the same as the returns of other funds, whether or not both funds have the same portfolio managers and/or similar names. The Fund’s total returns do not include the charges associated with the separate account products that offer this Fund. Such performance would have been lower if such charges were taken into account.
5 | OPPENHEIMER MIDCAP FUND/VA
FUND EXPENSES
Fund Expenses. As a shareholder of the Fund, you incur two types of costs: (1) transaction costs, which may include redemption fees (if applicable); and (2) ongoing costs, including management fees; distribution and service fees; and other Fund expenses. These examples are intended to help you understand your ongoing costs (in dollars) of investing in the Fund and to compare these costs with the ongoing costs of investing in other mutual funds.
The examples are based on an investment of $1,000.00 invested at the beginning of the period and held for the entire 6-month period ended December 31, 2008.
Actual Expenses. The first section of the table provides information about actual account values and actual expenses. You may use the information in this section for the class of shares you hold, together with the amount you invested, to estimate the expense that you paid over the period. Simply divide your account value by $1,000.00 (for example, an $8,600.00 account value divided by $1,000.00 = 8.60), then multiply the result by the number in the first section under the heading entitled “Expenses Paid During Period” to estimate the expenses you paid on your account during this period.
Hypothetical Example for Comparison Purposes. The second section of the table provides information about hypothetical account values and hypothetical expenses based on the Fund’s actual expense ratio for each class of shares, and an assumed rate of return of 5% per year for each class before expenses, which is not the actual return. The hypothetical account values and expenses may not be used to estimate the actual ending account balance or expenses you paid for the period. You may use this information to compare the ongoing costs of investing in the Fund and other funds. To do so, compare this 5% hypothetical example for the class of shares you hold with the 5% hypothetical examples that appear in the shareholder reports of the other funds.
Please note that the expenses shown in the table are meant to highlight your ongoing costs only and do not reflect any charges associated with the separate accounts that offer this Fund. Therefore, the “hypothetical” lines of the table are useful in comparing ongoing costs only, and will not help you determine the relative total costs of owning different funds. In addition, if these separate account charges were included your costs would have been higher.
| | | | | | | | | | | | | |
| | | Beginning | | Ending | | Expenses |
| | | Account | | Account | | Paid During |
| | | Value | | Value | | 6 Months Ended |
| | | July 1, 2008 | | December 31, 2008 | | December 31, 2008 |
| |
Actual | | | | | | | | | | | | |
| Non-Service shares | | $ | 1,000.00 | | | $ | 563.70 | | | $ | 2.56 | |
| |
| Service shares | | | 1,000.00 | | | | 562.90 | | | | 3.66 | |
| | | | | | | | | | | | | |
Hypothetical
(5% return before expenses) | | | | | | | | | | | | |
| |
| Non-Service shares | | | 1,000.00 | | | | 1,021.87 | | | | 3.31 | |
| |
| Service shares | | | 1,000.00 | | | | 1,020.46 | | | | 4.73 | |
Expenses are equal to the Fund’s annualized expense ratio for that class, multiplied by the average account value over the period, multiplied by 184/366 (to reflect the one-half year period). Those annualized expense ratios, excluding indirect expenses from affiliated fund, based on the 6-month period ended December 31, 2008 are as follows:
| | | | | |
| Class | | Expense Ratios |
| |
| Non-Service shares | | | 0.65 | % |
| Service shares | | | 0.93 | |
The expense ratios reflect reduction to custodian expenses and voluntary waivers or reimbursements of expenses by the Fund’s Manager that can be terminated at any time, without advance notice. The “Financial Highlights” tables in the Fund’s financial statements, included in this report, also show the gross expense ratios, without such waivers or reimbursements and reduction to custodian expenses, if applicable.
6 | OPPENHEIMER MIDCAP FUND/VA
STATEMENT OF INVESTMENTS December 31, 2008
| | | | | | | | | |
| | | Shares | | | Value | |
| |
Common Stocks—90.6% | | | | | | | | |
Consumer Discretionary—15.8% | | | | | | | | |
Diversified Consumer Services—3.8% | | | | | | | | |
| DeVry, Inc. | | | 80,900 | | | $ | 4,644,469 | |
New Oriental Education & Technology Group, Inc., Sponsored ADR1 | | | 164,700 | | | | 9,043,677 | |
| Strayer Education, Inc. | | | 22,200 | | | | 4,759,902 | |
| | | | | | | | |
| | | | | | | | 18,448,048 | |
| | | | | | | | | |
Hotels, Restaurants & Leisure—3.6% | | | | | | | | |
| Burger King Holdings, Inc. | | | 730,300 | | | | 17,439,564 | |
Media—4.6% | | | | | | | | |
| Cablevision Systems Corp. | | | | | | | | |
| New York Group, Cl. A | | | 737,800 | | | | 12,424,552 | |
Liberty Global, Inc., Series C1 | | | 355,704 | | | | 5,399,587 | |
Liberty Media Corp.-Entertainment, Series A1 | | | 257,100 | | | | 4,494,108 | |
| | | | | | | | |
| | | | | | | | 22,318,247 | |
| | | | | | | | | |
Multiline Retail—1.4% | | | | | | | | |
Dollar Tree, Inc.1 | | | 158,100 | | | | 6,608,580 | |
Specialty Retail—1.2% | | | | | | | | |
GameStop Corp., Cl. A1 | | | 269,500 | | | | 5,837,370 | |
Textiles, Apparel & Luxury Goods—1.2% | | | | | | | | |
| Polo Ralph Lauren Corp., Cl. A | | | 130,400 | | | | 5,921,464 | |
Consumer Staples—2.2% | | | | | | | | |
Beverages—0.4% | | | | | | | | |
Central European Distribution Corp.1 | | | 98,900 | | | | 1,948,330 | |
Food Products—1.2% | | | | | | | | |
| Flowers Foods, Inc. | | | 241,000 | | | | 5,870,760 | |
Personal Products—0.6% | | | | | | | | |
Chattem, Inc.1 | | | 36,100 | | | | 2,582,233 | |
Energy—7.7% | | | | | | | | |
Energy Equipment & Services—2.9% | | | | | | | | |
Cameron International Corp.1 | | | 235,400 | | | | 4,825,700 | |
IHS, Inc., Cl. A1 | | | 250,800 | | | | 9,384,936 | |
| | | | | | | | |
| | | | | | | | 14,210,636 | |
| | | | | | | | | |
Oil, Gas & Consumable Fuels—4.8% | | | | | | | | |
| Cabot Oil & Gas Corp., Cl. A | | | 112,300 | | | | 2,919,800 | |
Petrohawk Energy Corp.1 | | | 483,500 | | | | 7,557,105 | |
| Range Resources Corp. | | | 335,800 | | | | 11,548,162 | |
SandRidge Energy, Inc.1 | | | 166,440 | | | | 1,023,606 | |
| | | | | | | | |
| | | | | | | | 23,048,673 | |
| | | | | | | | | |
Financials—8.2% | | | | | | | | |
Capital Markets—3.7% | | | | | | | | |
Affiliated Managers Group, Inc.1 | | | 125,200 | | | | 5,248,384 | |
| Eaton Vance Corp. | | | 202,500 | | | | 4,254,525 | |
| Lazard Ltd., Cl. A | | | 277,800 | | | | 8,261,772 | |
| | | | | | | | |
| | | | | | | | 17,764,681 | |
| | | | | | | | | |
Diversified Financial Services—3.0% | | | | | | | | |
IntercontinentalExchange, Inc.1 | | | 98,500 | | | | 8,120,340 | |
MSCI, Inc., Cl. A1 | | | 351,500 | | | | 6,242,640 | |
| | | | | | | | |
| | | | | | | | 14,362,980 | |
| | | | | | | | | |
Insurance—0.7% | | | | | | | | |
| RenaissanceRe Holdings Ltd. | | | 70,600 | | | | 3,640,136 | |
Real Estate Investment Trusts—0.8% | | | | | | | | |
| Boston Properties, Inc. | | | 69,900 | | | | 3,844,500 | |
Health Care—16.9% | | | | | | | | |
Biotechnology—2.2% | | | | | | | | |
Alexion Pharmaceuticals, Inc.1 | | | 220,000 | | | | 7,961,800 | |
Myriad Genetics, Inc.1 | | | 38,000 | | | | 2,517,880 | |
| | | | | | | | |
| | | | | | | | 10,479,680 | |
| | | | | | | | | |
Health Care Equipment & Supplies—7.3% | | | | | | | | |
| Bard (C.R.), Inc. | | | 163,900 | | | | 13,810,214 | |
Edwards Lifesciences Corp.1 | | | 164,600 | | | | 9,044,770 | |
Haemonetics Corp.1 | | | 44,600 | | | | 2,519,900 | |
IDEXX Laboratories, Inc.1 | | | 141,300 | | | | 5,098,104 | |
NuVasive, Inc.1 | | | 135,100 | | | | 4,681,215 | |
| | | | | | | | |
| | | | | | | | 35,154,203 | |
| | | | | | | | | |
Health Care Providers & Services—1.0% | | | | | | | | |
Schein (Henry), Inc.1 | | | 133,800 | | | | 4,909,122 | |
Life Sciences Tools & Services—3.1% | | | | | | | | |
Covance, Inc.1 | | | 88,200 | | | | 4,059,846 | |
Illumina, Inc.1 | | | 256,500 | | | | 6,681,825 | |
Waters Corp.1 | | | 120,000 | | | | 4,398,000 | |
| | | | | | | | |
| | | | | | | | 15,139,671 | |
| | | | | | | | | |
Pharmaceuticals—3.3% | | | | | | | | |
| Perrigo Co. | | | 187,700 | | | | 6,064,587 | |
| Shire Ltd., ADR | | | 226,400 | | | | 10,138,192 | |
| | | | | | | | |
| | | | | | | | 16,202,779 | |
F1 | OPPENHEIMER MIDCAP FUND/VA
STATEMENT OF INVESTMENTS Continued
| | | | | | | | | |
| | | Shares | | | Value | |
| |
Industrials—15.9% | | | | | | | | |
Aerospace & Defense—2.7% | | | | | | | | |
Alliant Techsystems, Inc.1 | | | 55,700 | | | $ | 4,776,832 | |
| Curtiss-Wright Corp. | | | 148,400 | | | | 4,955,076 | |
| Rockwell Collins, Inc. | | | 86,700 | | | | 3,389,103 | |
| | | | | | | | |
| | | | | | | | 13,121,011 | |
| | | | | | | | | |
Air Freight & Logistics—3.4% | | | | | | | | |
| C.H. Robinson Worldwide, Inc. | | | 169,900 | | | | 9,349,597 | |
| Expeditors International of Washington, Inc. | | | 209,600 | | | | 6,973,392 | |
| | | | | | | | |
| | | | | | | | 16,322,989 | |
| | | | | | | | | |
Commercial Services & Supplies—6.9% | | | | | | | | |
Clean Harbors, Inc.1 | | | 101,500 | | | | 6,439,160 | |
FTI Consulting, Inc.1 | | | 156,100 | | | | 6,974,548 | |
Stericycle, Inc.1 | | | 274,100 | | | | 14,275,128 | |
Waste Connections, Inc.1 | | | 176,200 | | | | 5,562,634 | |
| | | | | | | | |
| | | | | | | | 33,251,470 | |
| | | | | | | | | |
Construction & Engineering—2.3% | | | | | | | | |
Foster Wheeler Ltd.1 | | | 100,200 | | | | 2,342,676 | |
Quanta Services, Inc.1 | | | 458,000 | | | | 9,068,400 | |
| | | | | | | | |
| | | | | | | | 11,411,076 | |
| | | | | | | | | |
Machinery—0.6% | | | | | | | | |
| Bucyrus International, Inc., Cl. A | | | 151,000 | | | | 2,796,520 | |
Information Technology—19.1% | | | | | | | | |
Computers & Peripherals—1.1% | | | | | | | | |
NetApp, Inc.1 | | | 390,200 | | | | 5,451,094 | |
Electronic Equipment & Instruments—3.1% | | | | | | | | |
| Amphenol Corp., Cl. A | | | 347,500 | | | | 8,333,050 | |
FLIR Systems, Inc.1 | | | 82,600 | | | | 2,534,168 | |
Trimble Navigation Ltd.1 | | | 195,600 | | | | 4,226,916 | |
| | | | | | | | |
| | | | | | | | 15,094,134 | |
| | | | | | | | | |
Internet Software & Services—1.7% | | | | | | | | |
Equinix, Inc.1 | | | 150,200 | | | | 7,989,138 | |
IT Services—5.0% | | | | | | | | |
Cognizant Technology Solutions Corp.1 | | | 311,200 | | | | 5,620,272 | |
SAIC, Inc.1 | | | 946,400 | | | | 18,435,872 | |
| | | | | | | | |
| | | | | | | | 24,056,144 | |
Software—8.2% | | | | | | | | |
Ansys, Inc.1 | | | 356,400 | | | | 9,939,996 | |
Autodesk, Inc.1 | | | 249,100 | | | | 4,894,815 | |
| FactSet Research Systems, Inc. | | | 253,850 | | | | 11,230,324 | |
Macrovision Solutions Corp.1 | | | 576,509 | | | | 7,292,839 | |
Salesforce.com, Inc.1 | | | 201,300 | | | | 6,443,613 | |
| | | | | | | | |
| | | | | | | | 39,801,587 | |
| | | | | | | | | |
Materials—2.4% | | | | | | | | |
Chemicals—2.4% | | | | | | | | |
Intrepid Potash, Inc.1 | | | 126,920 | | | | 2,636,128 | |
| Lubrizol Corp. (The) | | | 242,400 | | | | 8,820,936 | |
| | | | | | | | |
| | | | | | | | 11,457,064 | |
| | | | | | | | | |
Telecommunication Services—1.2% | | | | | | | | |
Wireless Telecommunication Services—1.2% | | | | | | | | |
American Tower Corp.1 | | | 193,200 | | | | 5,664,624 | |
Utilities—1.2% | | | | | | | | |
Gas Utilities—1.2% | | | | | | | | |
| Questar Corp. | | | 178,600 | | | | 5,838,434 | |
| | | | | | | | |
| Total Common Stocks (Cost $547,027,310) | | | | | | | 437,986,942 | |
Investment Company—5.9% | | | | | | | | |
Oppenheimer Institutional Money Market Fund, Cl. E, 1.96%2,3
(Cost $28,742,391) | | | 28,742,391 | | | | 28,742,391 | |
Total Investments, at Value
(Cost $575,769,701) | | | 96.5 | % | | | 466,729,333 | |
Other Assets Net of Liabilities | | | 3.5 | | | | 16,906,522 | |
| | | |
Net Assets | | | 100.0 | % | | $ | 483,635,855 | |
| | | |
Industry classifications are unaudited.
F2 | OPPENHEIMER MIDCAP FUND/VA
Footnotes to Statement of Investments
| | |
| 1. | | Non-income producing security. |
| |
| 2. | | Is or was an affiliate, as defined in the Investment Company Act of 1940, at or during the period ended December 31, 2008, by virtue of the Fund owning at least 5% of the voting securities of the issuer or as a result of the Fund and the issuer having the same investment adviser. Transactions during the period in which the issuer was an affiliate are as follows: |
| | | | | | | | | | | | | | | | | |
| | | Shares | | | Gross | | | Gross | | | Shares | |
| | | December 31, 2007 | | | Additions | | | Reductions | | | December 31, 2008 | |
| |
| Oppenheimer Institutional Money Market Fund, Cl. E | | | 35,791,815 | | | | 295,082,029 | | | | 302,131,453 | | | | 28,742,391 | |
| |
| | | | | | | | | | | Value | | | Income | |
| |
| Oppenheimer Institutional Money Market Fund, Cl. E | | | | | | | | | | | $28,742,391 | | | | $368,202 | |
| | |
| 3. | | Rate shown is the 7-day yield as of December 31, 2008. |
Valuation Inputs
Various data inputs are used in determining the value of each of the Fund’s investments as of the reporting period end. These data inputs are categorized in the following hierarchy under applicable financial accounting standards:
1) Level 1—quoted prices in active markets for identical assets or liabilities (including securities actively traded on a securities exchange)
2) Level 2—inputs other than quoted prices that are observable for the asset (such as quoted prices for similar assets and market corroborated inputs such as interest rates, prepayment speeds, credit risks, etc.)
3) Level 3—unobservable inputs (including the Manager’s own judgments about assumptions that market participants would use in pricing the asset).
The market value of the Fund’s investments was determined based on the following inputs as of December 31, 2008:
| | | | | | | | | |
| | | Investments in | | | Other Financial | |
| Valuation Description | | Securities | | | Instruments* | |
| Level 1—Quoted Prices | | $ | 466,729,333 | | | $ | — | |
| Level 2—Other Significant Observable Inputs | | | — | | | | — | |
| Level 3—Significant Unobservable Inputs | | | — | | | | — | |
| | | |
| Total | | $ | 466,729,333 | | | $ | — | |
| | | |
| | |
| * | | Other financial instruments include options written, currency contracts, futures, forwards and swap contracts. Currency contracts and forwards are reported at their unrealized appreciation/depreciation at measurement date, which represents the change in the contract’s value from trade date. Futures are reported at their variation margin at measurement date, which represents the amount due to/from the Fund at that date. Options written and swaps are reported at their market value at measurement date. |
See the accompanying Notes for further discussion of the methods used in determining value of the Fund’s investments, and a summary of changes to the valuation techniques, if any, during the reporting period.
See accompanying Notes to Financial Statements.
F3 | OPPENHEIMER MIDCAP FUND/VA
STATEMENT OF ASSETS AND LIABILITIES December 31, 2008
| | | | | |
Assets | | | | |
| Investments, at value—see accompanying statement of investments: | | | | |
| Unaffiliated companies (cost $ 547,027,310) | | $ | 437,986,942 | |
| Affiliated companies (cost $28,742,391) | | | 28,742,391 | |
| | | | |
| | | | 466,729,333 | |
| Cash | | | 306,249 | |
| Receivables and other assets: | | | | |
| Shares of beneficial interest sold | | | 16,208,249 | |
| Investments sold | | | 542,845 | |
| Dividends | | | 153,408 | |
| Due from Manager | | | 79 | |
| Other | | | 18,542 | |
| | | | |
| Total assets | | | 483,958,705 | |
| | | | | |
Liabilities | | | | |
| Payables and other liabilities: | | | | |
| Shares of beneficial interest redeemed | | | 243,634 | |
| Legal, auditing and other professional fees | | | 29,420 | |
| Shareholder communications | | | 18,237 | |
| Distribution and service plan fees | | | 13,525 | |
| Trustees’ compensation | | | 10,110 | |
| Transfer and shareholder servicing agent fees | | | 1,720 | |
| Other | | | 6,204 | |
| | | | |
| Total liabilities | | | 322,850 | |
| | | | | |
Net Assets | | $ | 483,635,855 | |
| | | | |
| | | | | |
Composition of Net Assets | | | | |
| Par value of shares of beneficial interest | | $ | 17,575 | |
| Additional paid-in capital | | | 1,274,620,037 | |
| Accumulated net investment income | | | 80,204 | |
| Accumulated net realized loss on investments | | | (682,041,593 | ) |
| Net unrealized depreciation on investments | | | (109,040,368 | ) |
| | | | |
Net Assets | | $ | 483,635,855 | |
| | | | |
| | | | | |
Net Asset Value Per Share | | | | |
| Non-Service Shares: | | | | |
Net asset value, redemption price per share and offering price per share
(based on net assets of $461,684,362 and 16,763,350 shares of beneficial interest outstanding) | | $ | 27.54 | |
| Service Shares: | | | | |
Net asset value, redemption price per share and offering price per share
(based on net assets of $21,951,493 and 812,009 shares of beneficial interest outstanding) | | $ | 27.03 | |
See accompanying Notes to Financial Statements.
F4 | OPPENHEIMER MIDCAP FUND/VA
STATEMENT OF OPERATIONS For the Year Ended December 31, 2008
| | | | | |
Investment Income | | | | |
| Dividends: | | | | |
| Unaffiliated companies (net of foreign withholding taxes of $14,130) | | $ | 2,676,265 | |
| Affiliated companies | | | 368,202 | |
| Interest | | | 9,313 | |
| | | | |
| Total investment income | | | 3,053,780 | |
| | | | | |
Expenses | | | | |
| Management fees | | | 5,532,191 | |
| Distribution and service plan fees—Service shares | | | 89,039 | |
| Transfer and shareholder servicing agent fees: | | | | |
| Non-Service shares | | | 9,994 | |
| Service shares | | | 9,994 | |
| Trustees’ compensation | | | 23,861 | |
| Custodian fees and expenses | | | 4,996 | |
| Other | | | 13,186 | |
| | | | |
| Total expenses | | | 5,683,261 | |
| Less reduction to custodian expenses | | | (1,361 | ) |
| Less waivers and reimbursements of expenses | | | (198,509 | ) |
| | | | |
| Net expenses | | | 5,483,391 | |
| | | | | |
Net Investment Loss | | | (2,429,611 | ) |
| | | | | |
Realized and Unrealized Loss | | | | |
| Net realized loss on investments from unaffiliated companies | | | (219,835,993 | ) |
| Net change in unrealized depreciation on investments | | | (251,402,010 | ) |
| | | | |
| | | | | |
Net Decrease in Net Assets Resulting from Operations | | $ | (473,667,614 | ) |
| | | | |
See accompanying Notes to Financial Statements.
F5 | OPPENHEIMER MIDCAP FUND/VA
STATEMENTS OF CHANGES IN NET ASSETS
| | | | | | | | | |
| Year Ended December 31, | | 2008 | | | 2007 | |
| |
Operations | | | | | | | | |
| Net investment loss | | $ | (2,429,611 | ) | | $ | (570,739 | ) |
| Net realized gain (loss) | | | (219,835,993 | ) | | | 186,877,254 | |
| Net change in unrealized appreciation (depreciation) | | | (251,402,010 | ) | | | (117,202,651 | ) |
| | | |
| Net increase (decrease) in net assets resulting from operations | | | (473,667,614 | ) | | | 69,103,864 | |
| | | | | | | | | |
Beneficial Interest Transactions | | | | | | | | |
| Net decrease in net assets resulting from beneficial interest transactions: | | | | | | | | |
| Non-Service shares | | | (88,752,649 | ) | | | (118,530,501 | ) |
| Service shares | | | (3,655,383 | ) | | | (2,801,818 | ) |
| | | |
| | | | (92,408,032 | ) | | | (121,332,319 | ) |
| | | | | | | | | |
Net Assets | | | | | | | | |
| Total decrease | | | (566,075,646 | ) | | | (52,228,455 | ) |
| Beginning of period | | | 1,049,711,501 | | | | 1,101,939,956 | |
| | | |
| End of period (including accumulated net investment income (loss) of $80,204 and $(16,629), respectively) | | $ | 483,635,855 | | | $ | 1,049,711,501 | |
| | | |
See accompanying Notes to Financial Statements.
F6 | OPPENHEIMER MIDCAP FUND/VA
FINANCIAL HIGHLIGHTS
| | | | | | | | | | | | | | | | | | | | | |
| Non-Service Shares Year Ended December 31, | | 2008 | | | 2007 | | | 2006 | | | 2005 | | | 2004 | |
| |
Per Share Operating Data | | | | | | | | | | | | | | | | | | | | |
| Net asset value, beginning of period | | $ | 54.07 | | | $ | 50.85 | | | $ | 49.39 | | | $ | 43.97 | | | $ | 36.71 | |
| |
| Income (loss) from investment operations: | | | | | | | | | | | | | | | | | | | | |
Net investment loss1 | | | (.13 | ) | | | (.02 | ) | | | (.02 | ) | | | (.12 | ) | | | (.15 | ) |
| Net realized and unrealized gain (loss) | | | (26.40 | ) | | | 3.24 | | | | 1.48 | | | | 5.54 | | | | 7.41 | |
| | | |
| Total from investment operations | | | (26.53 | ) | | | 3.22 | | | | 1.46 | | | | 5.42 | | | | 7.26 | |
| |
| Net asset value, end of period | | $ | 27.54 | | | $ | 54.07 | | | $ | 50.85 | | | $ | 49.39 | | | $ | 43.97 | |
| | | |
| | | | | | | | | | | | | | | | | | | | | |
Total Return, at Net Asset Value2 | | | (49.07 | )% | | | 6.33 | % | | | 2.96 | % | | | 12.33 | % | | | 19.78 | % |
| | | | | | | | | | | | | | | | | | | | | |
Ratios/Supplemental Data | | | | | | | | | | | | | | | | | | | | |
| Net assets, end of period (in thousands) | | $ | 461,684 | | | $ | 1,002,442 | | | $ | 1,054,809 | | | $ | 1,227,881 | | | $ | 1,209,459 | |
| |
| Average net assets (in thousands) | | $ | 754,170 | | | $ | 1,045,592 | | | $ | 1,135,831 | | | $ | 1,177,979 | | | $ | 1,124,874 | |
| |
Ratios to average net assets:3 | | | | | | | | | | | | | | | | | | | | |
| Net investment loss | | | (0.30 | )% | | | (0.04 | )% | | | (0.04 | )% | | | (0.26 | )% | | | (0.39 | )% |
| Total expenses | | | 0.71 | %4 | | | 0.69 | %4 | | | 0.69 | %4 | | | 0.69 | % | | | 0.69 | % |
| Expenses after payments, waivers and/or reimbursements and reduction to custodian expenses | | | 0.68 | % | | | 0.69 | % | | | 0.69 | % | | | 0.69 | % | | | 0.69 | % |
| |
| Portfolio turnover rate | | | 78 | % | | | 112 | % | | | 56 | % | | | 32 | % | | | 53 | % |
| | |
| 1. | | Per share amounts calculated based on the average shares outstanding during the period. |
| |
| 2. | | Assumes an investment on the business day before the first day of the fiscal period, with all dividends and distributions reinvested in additional shares on the reinvestment date, and redemption at the net asset value calculated on the last business day of the fiscal period. Total returns are not annualized for periods less than one full year. Total return information does not reflect expenses that apply at the separate account level or to related insurance products. Inclusion of these charges would reduce the total return figures for all periods shown. Returns do not reflect the deduction of taxes that a shareholder would pay on fund distributions or the redemption of fund shares. |
| |
| 3. | | Annualized for periods less than one full year. |
| |
| 4. | | Total expenses including indirect expenses from affiliated fund were as follows: |
| | | | | |
| Year Ended December 31, 2008 | | | 0.71 | % |
| Year Ended December 31, 2007 | | | 0.69 | % |
| Year Ended December 31, 2006 | | | 0.69 | % |
See accompanying Notes to Financial Statements.
F7 | OPPENHEIMER MIDCAP FUND/VA
FINANCIAL HIGHLIGHTS Continued
| | | | | | | | | | | | | | | | | | | | | |
| Service Shares Year Ended December 31, | | 2008 | | | 2007 | | | 2006 | | | 2005 | | | 2004 | |
| |
Per Share Operating Data | | | | | | | | | | | | | | | | | | | | |
| Net asset value, beginning of period | | $ | 53.22 | | | $ | 50.19 | | | $ | 48.87 | | | $ | 43.64 | | | $ | 36.54 | |
| |
| Income (loss) from investment operations: | | | | | | | | | | | | | | | | | | | | |
Net investment loss1 | | | (.24 | ) | | | (.17 | ) | | | (.16 | ) | | | (.25 | ) | | | (.27 | ) |
| Net realized and unrealized gain (loss) | | | (25.95 | ) | | | 3.20 | | | | 1.48 | | | | 5.48 | | | | 7.37 | |
| | | |
| Total from investment operations | | | (26.19 | ) | | | 3.03 | | | | 1.32 | | | | 5.23 | | | | 7.10 | |
| |
| Net asset value, end of period | | $ | 27.03 | | | $ | 53.22 | | | $ | 50.19 | | | $ | 48.87 | | | $ | 43.64 | |
| | | |
| | | | | | | | | | | | | | | | | | | | | |
Total Return, at Net Asset Value2 | | | (49.21 | )% | | | 6.04 | % | | | 2.70 | % | | | 11.99 | % | | | 19.43 | % |
| | | | | | | | | | | | | | | | | | | | | |
Ratios/Supplemental Data | | | | | | | | | | | | | | | | | | | | |
| Net assets, end of period (in thousands) | | $ | 21,952 | | | $ | 47,270 | | | $ | 47,131 | | | $ | 36,551 | | | $ | 24,151 | |
| |
| Average net assets (in thousands) | | $ | 35,815 | | | $ | 49,421 | | | $ | 44,273 | | | $ | 28,798 | | | $ | 17,579 | |
| |
Ratios to average net assets:3 | | | | | | | | | | | | | | | | | | | | |
| Net investment loss | | | (0.57 | )% | | | (0.31 | )% | | | (0.33 | )% | | | (0.54 | )% | | | (0.68 | )% |
| Total expenses | | | 0.98 | %4 | | | 0.96 | %4 | | | 0.97 | %4 | | | 0.97 | % | | | 0.99 | % |
| Expenses after payments, waivers and/or reimbursements and reduction to custodian expenses | | | 0.95 | % | | | 0.96 | % | | | 0.97 | % | | | 0.97 | % | | | 0.99 | % |
| |
| Portfolio turnover rate | | | 78 | % | | | 112 | % | | | 56 | % | | | 32 | % | | | 53 | % |
| | |
| 1. | | Per share amounts calculated based on the average shares outstanding during the period. |
| |
| 2. | | Assumes an investment on the business day before the first day of the fiscal period, with all dividends and distributions reinvested in additional shares on the reinvestment date, and redemption at the net asset value calculated on the last business day of the fiscal period. Total returns are not annualized for periods less than one full year. Total return information does not reflect expenses that apply at the separate account level or to related insurance products. Inclusion of these charges would reduce the total return figures for all periods shown. Returns do not reflect the deduction of taxes that a shareholder would pay on fund distributions or the redemption of fund shares. |
| |
| 3. | | Annualized for periods less than one full year. |
| |
| 4. | | Total expenses including indirect expenses from affiliated fund were as follows: |
| | | | | |
| Year Ended December 31, 2008 | | | 0.98 | % |
| Year Ended December 31, 2007 | | | 0.96 | % |
| Year Ended December 31, 2006 | | | 0.97 | % |
See accompanying Notes to Financial Statements.
F8 | OPPENHEIMER MIDCAP FUND/VA
NOTES TO FINANCIAL STATEMENTS
1. Significant Accounting Policies
Oppenheimer MidCap Fund/VA (the “Fund”), is a separate series of Oppenheimer Variable Account Funds, an open-end management investment company registered under the Investment Company Act of 1940, as amended. The Fund’s investment objective is to seek capital appreciation by investing in “growth type” companies. The Fund’s investment adviser is OppenheimerFunds, Inc. (the “Manager”).
The Fund offers two classes of shares. Both classes are sold at their offering price, which is the net asset value per share, to separate investment accounts of participating insurance companies as an underlying investment for variable life insurance policies, variable annuity contracts or other investment products. The class of shares designated as Service shares is subject to a distribution and service plan. Both classes of shares have identical rights and voting privileges with respect to the Fund in general and exclusive voting rights on matters that affect that class alone. Earnings, net assets and net asset value per share may differ due to each class having its own expenses, such as transfer and shareholder servicing agent fees and shareholder communications, directly attributable to that class.
The following is a summary of significant accounting policies consistently followed by the Fund.
Securities Valuation. The Fund calculates the net asset value of its shares as of the close of the New York Stock Exchange (the “Exchange”), normally 4:00 P.M. Eastern time, on each day the Exchange is open for trading.
Effective for fiscal periods beginning after November 15, 2007, FASB Statement of Financial Accounting Standards No. 157, Fair Value Measurements, establishes a hierarchy for measuring fair value of assets and liabilities. As required by the standard, each investment asset or liability of the Fund is assigned a level at measurement date based on the significance and source of the inputs to its valuation. Quoted prices in active markets for identical securities are classified as “Level 1”, inputs other than quoted prices for an asset that are observable are classified as “Level 2” and unobservable inputs, including the Manager’s judgment about the assumptions that a market participant would use in pricing an asset or liability are classified as “Level 3”. The inputs used for valuing securities are not necessarily an indication of the risks associated with investing in those securities. A table summarizing the Fund’s investments under these levels of classification is included following the Statement of Investments.
Securities are valued using quoted market prices, when available, as supplied primarily either by portfolio pricing services approved by the Board of Trustees or dealers. These securities are typically classified within Level 1 or 2; however, they may be designated as Level 3 if the dealer or portfolio pricing service values a security through an internal model with significant unobservable market data inputs.
Securities traded on a registered U.S. securities exchange are valued based on the last sale price of the security reported on the principal exchange on which traded, prior to the time when the Fund’s assets are valued. Securities whose principal exchange is NASDAQ® are valued based on the official closing prices reported by NASDAQ prior to the time when the Fund’s assets are valued. In the absence of a sale, the security is valued at the last sale price on the prior trading day, if it is within the spread of the current day’s closing “bid” and “asked” prices, and if not, at the current day’s closing bid price. A foreign security traded on a foreign exchange is valued based on the last sale price on the principal exchange on which the security is traded, as identified by the portfolio pricing service used by the Manager, prior to the time when the Fund’s assets are valued. In the absence of a sale, the security is valued at the most recent official closing price on the principal exchange on which it is traded.
Shares of a registered investment company that are not traded on an exchange are valued at that investment company’s net asset value per share.
Corporate, government and municipal debt instruments having a remaining maturity in excess of sixty days and all mortgage-backed securities, collateralized mortgage obligations and other asset-backed securities are valued at the mean between the “bid” and “asked” prices.
“Money market-type” debt instruments with remaining maturities of sixty days or less are valued at cost adjusted by the amortization of discount or premium to maturity (amortized cost), which approximates market value. These securities are typically designated as Level 2.
F9 | OPPENHEIMER MIDCAP FUND/VA
NOTES TO FINANCIAL STATEMENTS Continued
1. Significant Accounting Policies Continued
In the absence of a readily available quoted market price, including for securities whose values have been materially affected by what the Manager identifies as a significant event occurring before the Fund’s assets are valued but after the close of the securities’ respective exchanges, the Manager, acting through its internal valuation committee, in good faith determines the fair valuation of that asset using consistently applied procedures under the supervision of the Board of Trustees (which reviews those fair valuations by the Manager). Those procedures include certain standardized methodologies to fair value securities. Such methodologies include, but are not limited to, pricing securities initially at cost and subsequently adjusting the value based on: changes in company specific fundamentals, changes in an appropriate securities index, or changes in the value of similar securities which may be adjusted for any discounts related to resale restrictions. When possible, such methodologies use observable market inputs such as quoted prices of similar securities, observable interest rates, currency rates and yield curves. The methodologies used for valuing securities are not necessarily an indication of the risks associated with investing in those securities.
Fair valued securities may be classified as “Level 3” if the valuation primarily reflects the Manager’s own assumptions about the inputs that market participants would use in valuing such securities.
There have been no significant changes to the fair valuation methodologies during the period.
Foreign Currency Translation. The Fund’s accounting records are maintained in U.S. dollars. The values of securities denominated in foreign currencies and amounts related to the purchase and sale of foreign securities and foreign investment income are translated into U.S. dollars as of the close of the Exchange, normally 4:00 P.M. Eastern time, on each day the Exchange is open for trading. Foreign exchange rates may be valued primarily using a reliable bank, dealer or service authorized by the Board of Trustees.
Reported net realized gains and losses from foreign currency transactions arise from sales of portfolio securities, sales and maturities of short-term securities, sales of foreign currencies, exchange rate fluctuations between the trade and settlement dates on securities transactions, and the difference between the amounts of dividends, interest, and foreign withholding taxes recorded on the Fund’s books and the U.S. dollar equivalent of the amounts actually received or paid. Net unrealized appreciation and depreciation on the translation of assets and liabilities denominated in foreign currencies arise from changes in the values of assets and liabilities, including investments in securities at fiscal period end, resulting from changes in exchange rates.
The effect of changes in foreign currency exchange rates on investments is separately identified from the fluctuations arising from changes in market values of securities held and reported with all other foreign currency gains and losses in the Fund’s Statement of Operations.
Investment in Oppenheimer Institutional Money Market Fund. The Fund is permitted to invest daily available cash balances in an affiliated money market fund. The Fund may invest the available cash in Class E shares of Oppenheimer Institutional Money Market Fund (“IMMF”) to seek current income while preserving liquidity. IMMF is a registered open-end management investment company, regulated as a money market fund under the Investment Company Act of 1940, as amended. The Manager is also the investment adviser of IMMF. The Fund’s investment in IMMF is included in the Statement of Investments. As a shareholder, the Fund is subject to its proportional share of IMMF’s Class E expenses, including its management fee. The Manager will waive fees and/or reimburse Fund expenses in an amount equal to the indirect management fees incurred through the Fund’s investment in IMMF.
Allocation of Income, Expenses, Gains and Losses. Income, expenses (other than those attributable to a specific class), gains and losses are allocated on a daily basis to each class of shares based upon the relative proportion of net assets represented by such class. Operating expenses directly attributable to a specific class are charged against the operations of that class.
Federal Taxes. The Fund intends to comply with provisions of the Internal Revenue Code applicable to regulated investment companies and to distribute substantially all of its investment company taxable income, including any net
F10 | OPPENHEIMER MIDCAP FUND/VA
realized gain on investments not offset by capital loss carryforwards, if any, to shareholders. Therefore, no federal income or excise tax provision is required. The Fund files income tax returns in U.S. federal and applicable state jurisdictions. The statute of limitations on the Fund’s tax return filings generally remain open for the three preceding fiscal reporting period ends.
The tax components of capital shown in the following table represent distribution requirements the Fund must satisfy under the income tax regulations, losses the Fund may be able to offset against income and gains realized in future years and unrealized appreciation or depreciation of securities and other investments for federal income tax purposes.
| | | | | | | | | | | | | |
| | | | | | | | | | | Net Unrealized | |
| | | | | | | | | | | Depreciation | |
| | | | | | | | | | | Based on Cost of | |
| Undistributed | | Undistributed | | | Accumulated | | | Securities and Other | |
| Net Investment | | Long-Term | | | Loss | | | Investments for Federal | |
| Income | | Gain | | | Carryforward1,2,3,4 | | | Income Tax Purposes | |
| |
| $— | | $ | — | | | | $673,554,628 | | | | $117,437,028 | |
| | |
| 1. | | As of December 31, 2008, the Fund had $455,557,670 of net capital loss carryforwards available to offset future realized capital gains, if any, and thereby reduce future taxable gain distributions. As of December 31, 2008, details of the capital loss carryforwards were as follows: |
| | | | | |
| Expiring | | | | |
| |
| 2009 | | $ | 225,332,848 | |
| 2010 | | | 230,224,822 | |
| | | | |
| Total | | $ | 455,557,670 | |
| | | | |
| | |
| 2. | | As of December 31, 2008, the Fund had $217,996,958 of post-October losses available to offset future realized capital gains, if any. Such losses, if unutilized, will expire in 2017. |
| |
| 3. | | During the fiscal year ended December 31, 2008, the Fund utilized $4,134,778 of capital loss carryforward to offset capital gains realized in that fiscal year. |
| |
| 4. | | During the fiscal year ended December 31, 2007, the Fund utilized $189,103,306 of capital loss carryforward to offset capital gains realized in that fiscal year. |
Net investment income (loss) and net realized gain (loss) may differ for financial statement and tax purposes. The character of dividends and distributions made during the fiscal year from net investment income or net realized gains may differ from their ultimate characterization for federal income tax purposes. Also, due to timing of dividends and distributions, the fiscal year in which amounts are distributed may differ from the fiscal year in which the income or net realized gain was recorded by the Fund.
Accordingly, the following amounts have been reclassified for December 31, 2008. Net assets of the Fund were unaffected by the reclassifications.
| | | | | |
| | | Reduction to | |
| | | Accumulated Net | |
| Reduction | | Investment | |
| to Paid-in Capital | | Loss | |
| |
| $2,526,444 | | | $2,526,444 | |
No distributions were paid during the years ended December 31, 2008 and December 31, 2007.
The aggregate cost of securities and other investments and the composition of unrealized appreciation and depreciation of securities and other investments for federal income tax purposes as of December 31, 2008 are noted in the following table. The primary difference between book and tax appreciation or depreciation of securities and other investments, if applicable, is attributable to the tax deferral of losses or tax realization of financial statement unrealized gain or loss.
| | | | | |
| Federal tax cost of securities | | $ | 584,166,361 | |
| | | | |
| | | | | |
| Gross unrealized appreciation | | $ | 23,103,445 | |
| Gross unrealized depreciation | | | (140,540,473 | ) |
| | | | |
| Net unrealized depreciation | | $ | (117,437,028 | ) |
| | | | |
F11 | OPPENHEIMER MIDCAP FUND/ VA
NOTES TO FINANCIAL STATEMENTS Continued
1. Significant Accounting Policies Continued
Trustees’ Compensation. The Board of Trustees has adopted a compensation deferral plan for independent trustees that enables trustees to elect to defer receipt of all or a portion of the annual compensation they are entitled to receive from the Fund. For purposes of determining the amount owed to the Trustee under the plan, deferred amounts are treated as though equal dollar amounts had been invested in shares of the Fund or in other Oppenheimer funds selected by the Trustee. The Fund purchases shares of the funds selected for deferral by the Trustee in amounts equal to his or her deemed investment, resulting in a Fund asset equal to the deferred compensation liability. Such assets are included as a component of “Other” within the asset section of the Statement of Assets and Liabilities. Deferral of trustees’ fees under the plan will not affect the net assets of the Fund, and will not materially affect the Fund’s assets, liabilities or net investment income per share. Amounts will be deferred until distributed in accordance to the compensation deferral plan.
Dividends and Distributions to Shareholders. Dividends and distributions to shareholders, which are determined in accordance with income tax regulations and may differ from U.S. generally accepted accounting principles, are recorded on the ex-dividend date. Income and capital gain distributions, if any, are declared and paid annually or at other times as deemed necessary by the Manager.
Investment Income. Dividend income is recorded on the ex-dividend date or upon ex-dividend notification in the case of certain foreign dividends where the ex-dividend date may have passed. Non-cash dividends included in dividend income, if any, are recorded at the fair market value of the securities received. Interest income is recognized on an accrual basis. Discount and premium, which are included in interest income on the Statement of Operations, are amortized or accreted daily.
Custodian Fees. “Custodian fees and expenses” in the Statement of Operations may include interest expense incurred by the Fund on any cash overdrafts of its custodian account during the period. Such cash overdrafts may result from the effects of failed trades in portfolio securities and from cash outflows resulting from unanticipated shareholder redemption activity. The Fund pays interest to its custodian on such cash overdrafts, to the extent they are not offset by positive cash balances maintained by the Fund, at a rate equal to the Federal Funds Rate plus 0.50%. The “Reduction to custodian expenses” line item, if applicable, represents earnings on cash balances maintained by the Fund during the period. Such interest expense and other custodian fees may be paid with these earnings.
Security Transactions. Security transactions are recorded on the trade date. Realized gains and losses on securities sold are determined on the basis of identified cost.
Indemnifications. The Fund’s organizational documents provide current and former trustees and officers with a limited indemnification against liabilities arising in connection with the performance of their duties to the Fund. In the normal course of business, the Fund may also enter into contracts that provide general indemnifications. The Fund’s maximum exposure under these arrangements is unknown as this would be dependent on future claims that may be made against the Fund. The risk of material loss from such claims is considered remote.
Other. The preparation of financial statements in conformity with accounting principles generally accepted in the United States of America requires management to make estimates and assumptions that affect the reported amounts of assets and liabilities and disclosure of contingent assets and liabilities at the date of the financial statements and the reported amounts of increases and decreases in net assets from operations during the reporting period. Actual results could differ from those estimates.
F12 | OPPENHEIMER MIDCAP FUND/VA
2. Shares of Beneficial Interest
The Fund has authorized an unlimited number of $0.001 par value shares of beneficial interest of each class. Transactions in shares of beneficial interest were as follows:
| | | | | | | | | | | | | | | | | |
| | | Year Ended December 31, 2008 | | | Year Ended December 31, 2007 | |
| | | Shares | | | Amount | | | Shares | | | Amount | |
| |
Non-Service Shares | | | | | | | | | | | | | | | | |
| Sold | | | 1,670,583 | | | $ | 61,944,000 | | | | 1,842,068 | | | $ | 99,805,796 | |
| Redeemed | | | (3,445,654 | ) | | | (150,696,649 | ) | | | (4,045,787 | ) | | | (218,336,297 | ) |
| | | |
| Net decrease | | | (1,775,071 | ) | | $ | (88,752,649 | ) | | | (2,203,719 | ) | | $ | (118,530,501 | ) |
| | | |
| | | | | | | | | | | | | | | | | |
Service Shares | | | | | | | | | | | | | | | | |
| Sold | | | 131,251 | | | $ | 5,180,963 | | | | 158,587 | | | $ | 8,425,522 | |
| Redeemed | | | (207,366 | ) | | | (8,836,346 | ) | | | (209,531 | ) | | | (11,227,340 | ) |
| | | |
| Net decrease | | | (76,115 | ) | | $ | (3,655,383 | ) | | | (50,944 | ) | | $ | (2,801,818 | ) |
| | | |
3. Purchases and Sales of Securities
The aggregate cost of purchases and proceeds from sales of securities, other than short-term obligations and investments in Oppenheimer Institutional Money Market Fund and OFI Liquid Assets Fund, LLC, for the year ended December 31, 2008, were as follows:
| | | | | | | | | |
| | | Purchases | | | Sales | |
| |
| Investment securities | | $ | 616,640,852 | | | $ | 718,329,116 | |
4. Fees and Other Transactions with Affiliates
Management Fees. Under the investment advisory agreement, the Fund pays the Manager a management fee based on the daily net assets of the Fund at an annual rate as shown in the following table:
| | | | | |
| Fee Schedule | | | | |
| |
| Up to $200 million | | | 0.75 | % |
| Next $200 million | | | 0.72 | |
| Next $200 million | | | 0.69 | |
| Next $200 million | | | 0.66 | |
| Next $700 million | | | 0.60 | |
| Over $1.5 billion | | | 0.58 | |
Transfer Agent Fees. OppenheimerFunds Services (“OFS”), a division of the Manager, acts as the transfer and shareholder servicing agent for the Fund. The Fund pays OFS a per account fee. For the year ended December 31, 2008, the Fund paid $20,028 to OFS for services to the Fund.
Additionally, funds offered in variable annuity separate accounts are subject to minimum fees of $10,000 per class, for class level assets of $10 million or more. Each class is subject to the minimum fee in the event that the per account fee does not equal or exceed the applicable minimum fee.
Distribution and Service Plan for Service Shares. The Fund has adopted a Distribution and Service Plan (the “Plan”) in accordance with Rule 12b-1 under the Investment Company Act of 1940 for Service shares to pay OppenheimerFunds Distributor, Inc. (the “Distributor”), for distribution related services, personal service and account maintenance for the Fund’s Service shares. Under the Plan, payments are made periodically at an annual rate of up to 0.25% of the average annual net assets of Service shares of the Fund. The Distributor currently uses all of those fees to compensate sponsor(s) of the insurance product that offers Fund shares, for providing personal service and maintenance of accounts of their variable contract owners that hold Service shares. These fees are paid out of the Fund’s assets on an on-going basis and increase operating expenses of the Service shares, which results in lower performance compared to the Fund’s shares that are not subject to a service fee. Fees incurred by the Fund under the Plan are detailed in the Statement of Operations.
F13 | OPPENHEIMER MIDCAP FUND/VA
NOTES TO FINANCIAL STATEMENTS Continued
4. Fees and Other Transactions with Affiliates Continued
Waivers and Reimbursements of Expenses. Effective September 1, 2008 through August 31, 2009 (the “waiver period”), the Manager has voluntarily agreed to reduce its advisory fee rate by 0.10% of the Fund’s average daily net assets if the Fund’s trailing one-year total return performance is in the fourth or fifth quintile of the Fund’s Lipper peer group as of August 31, 2008. However, if the Fund’s trailing one-year total return performance, as measured at the end of any subsequent calendar quarter during the waiver period, improves to the third or higher quintile of the Fund’s Lipper peer group, the advisory fee reduction will be terminated effective the following business day. During the year ended December 31, 2008, OFI waived $186,318. The advisory fee reduction is a voluntary undertaking and may be terminated by the Manager at any time.
OFS has voluntarily agreed to limit transfer and shareholder servicing agent fees for all classes to 0.35% of average annual net assets per class. This undertaking may be amended or withdrawn at any time.
The Manager will waive fees and/or reimburse Fund expenses in an amount equal to the indirect management fees incurred through the Fund’s investment in IMMF. During the year ended December 31, 2008, the Manager waived $12,191 for IMMF management fees.
5. Recent Accounting Pronouncement
In March 2008, the Financial Accounting Standards Board (“FASB”) issued Statement on Financial Accounting Standards (“SFAS”) No. 161, Disclosures about Derivative Instruments and Hedging Activities. This standard requires enhanced disclosures about derivative and hedging activities, including qualitative disclosures about how and why the Fund uses derivative instruments, how these activities are accounted for, and their effect on the Fund’s financial position, financial performance and cash flows. SFAS No. 161 is effective for financial statements issued for fiscal years and interim periods beginning after November 15, 2008. At this time, management is evaluating the implications of SFAS No. 161 and its impact on the Fund’s financial statements and related disclosures.
6. Change In Independent Registered Public Accounting Firm (Unaudited)
At a meeting held on August 20, 2008, the Board of Trustees of the Fund appointed KPMG LLP as the independent registered public accounting firm to the Fund for fiscal year 2009, replacing the firm of Deloitte & Touche LLP, effective at the conclusion of the fiscal 2008 audit. During the two most recent fiscal years the audit reports of Deloitte & Touche LLP contained no adverse opinion or disclaimer of opinion and were not qualified or modified as to uncertainty, audit scope or accounting principles. Further, there were no disagreements between the Fund and Deloitte & Touche LLP on accounting principles, financial statement disclosure or audit scope, which if not resolved to the satisfaction of Deloitte & Touche LLP would have caused it to make reference to the disagreements in connection with its reports.
F14 | OPPENHEIMER MIDCAP FUND/VA
REPORT OF INDEPENDENT REGISTERED PUBLIC ACCOUNTING FIRM
To the Board of Trustees and Shareholders of Oppenheimer MidCap Fund/VA:
We have audited the accompanying statement of assets and liabilities of Oppenheimer MidCap Fund/VA (the “Fund”), a series of Oppenheimer Variable Account Funds, including the statement of investments, as of December 31, 2008, and the related statement of operations for the year then ended, the statements of changes in net assets for each of the two years in the period then ended, and the financial highlights for each of the five years in the period then ended. These financial statements and financial highlights are the responsibility of the Fund’s management. Our responsibility is to express an opinion on these financial statements and financial highlights based on our audits.
We conducted our audits in accordance with the standards of the Public Company Accounting Oversight Board (United States). Those standards require that we plan and perform the audit to obtain reasonable assurance about whether the financial statements and financial highlights are free of material misstatement. The Fund is not required to have, nor were we engaged to perform, an audit of its internal control over financial reporting. Our audits included consideration of internal control over financial reporting as a basis for designing audit procedures that are appropriate in the circumstances, but not for the purpose of expressing an opinion on the effectiveness of the Fund’s internal control over financial reporting. Accordingly, we express no such opinion. An audit also includes examining, on a test basis, evidence supporting the amounts and disclosures in the financial statements, assessing the accounting principles used and significant estimates made by management, as well as evaluating the overall financial statement presentation. Our procedures included confirmation of securities owned as of December 31, 2008, by correspondence with the custodian and brokers. We believe that our audits provide a reasonable basis for our opinion.
In our opinion, the financial statements and financial highlights referred to above present fairly, in all material respects, the financial position of the Fund as of December 31, 2008, the results of its operations for the year then ended, the changes in its net assets for each of the two years in the period then ended, and the financial highlights for each of the five years in the period then ended, in conformity with accounting principles generally accepted in the United States of America.
Deloitte & Touche LLP
Denver, Colorado
February 11, 2009
F15 | OPPENHEIMER MIDCAP FUND/VA
FEDERAL INCOME TAX INFORMATION Unaudited
In early 2009, if applicable, shareholders of record received information regarding all dividends and distributions paid to them by the Fund during calendar year 2008. Regulations of the U.S. Treasury Department require the Fund to report this information to the Internal Revenue Service.
The foregoing information is presented to assist shareholders in reporting distributions received from the Fund to the Internal Revenue Service. Because of the complexity of the federal regulations which may affect your individual tax return and the many variations in state and local tax regulations, we recommend that you consult your tax advisor for specific guidance.
7 | OPPENHEIMER MIDCAP FUND/VA
BOARD APPROVAL OF THE FUND’S INVESTMENT ADVISORY AGREE MENT Unaudited
Each year, the Board of Trustees (the “Board”), including a majority of the independent Trustees, is required to determine whether to renew the Fund’s investment advisory agreement (the “Agreement”). The Investment Company Act of 1940, as amended, requires that the Board request and evaluate, and that the Manager provide, such information as may be reasonably necessary to evaluate the terms of the Agreement. The Board employs an independent consultant to prepare a report that provides information, including comparative information, the Board requests for that purpose. In addition, the Board receives information throughout the year regarding Fund services, fees, expenses and performance.
The Manager and the independent consultant provided information to the Board on the following factors: (i) the nature, quality and extent of the Manager’s services, (ii) the investment performance of the Fund and the Manager, (iii) the fees and expenses of the Fund, including comparative expense information, (iv) the profitability of the Manager and its affiliates, including an analysis of the cost of providing services, (v) whether economies of scale are realized as the Fund grows and whether fee levels reflect these economies of scale for Fund investors and (vi) other benefits to the Manager from its relationship with the Fund. The Board was aware that there are alternatives to retaining the Manager.
Outlined below is a summary of the principal information considered by the Board as well as the Board’s conclusions.
Nature, Quality and Extent of Services. The Board considered information about the nature, quality and extent of the services provided to the Fund and information regarding the Manager’s key personnel who provide such services. The Manager’s duties include providing the Fund with the services of the portfolio manager and the Manager’s investment team, who provide research, analysis and other advisory services in regard to the Fund’s investments; securities trading services; oversight of third party service providers; monitoring compliance with applicable Fund policies and procedures and adherence to the Fund’s investment restrictions. The Manager is responsible for providing certain administrative services to the Fund as well. Those services include providing and supervising all administrative and clerical personnel who are necessary in order to provide effective corporate administration for the Fund; compiling and maintaining records with respect to the Fund’s operations; preparing and filing reports required by the Securities and Exchange Commission; preparing periodic reports regarding the operations of the Fund for its shareholders; preparing proxy materials for shareholder meetings; and preparing the registration statements required by Federal and state securities laws for the sale of the Fund’s shares. The Manager also provides the Fund with office space, facilities and equipment.
The Board also considered the quality of the services provided and the quality of the Manager’s resources that are available to the Fund. The Board took account of the fact that the Manager has had over forty years of experience as an investment adviser and that its assets under management rank it among the top mutual fund managers in the United States. The Board evaluated the Manager’s advisory, administrative, accounting, legal and compliance services, and information the Board has received regarding the experience and professional qualifications of the Manager’s key personnel and the size and functions of its staff. In its evaluation of the quality of the portfolio management services provided, the Board considered the experience of Richard Royce, the portfolio manager for the Fund, and the Manager’s investment team and analysts. The Board members also considered the totality of their experiences with the Manager as Directors or Trustees of the Fund and other funds advised by the Manager. The Board considered information regarding the quality of services provided by affiliates of the Manager, which its members have become knowledgeable about in connection with the renewal of the Fund’s service agreements. The Board concluded that, in light of the Manager’s experience, reputation, personnel, operations and resources, the Fund benefits from the services provided under the Agreement.
Investment Performance of the Manager and the Fund. Throughout the year, the Manager provided information on the investment performance of the Fund and the Manager, including comparative performance information. The Board also reviewed information, prepared by the Manager and by the independent consultant, comparing the Fund’s historical performance to relevant market indices and to the performance of other mid-cap growth funds underlying
8 | OPPENHEIMER MIDCAP FUND/VA
variable insurance products. The Board considered that the Fund underperformed its performance universe median during the one-, three-, five-, and ten-year periods. The Board considered that a new portfolio manager took over the Fund on June 5, 2007 as well as the Manager’s assertion that more time is required to properly assess the performance of the new portfolio manager. The Board considered that the Fund’s performance in more recent periods improved and that through April 30, 2008 the Fund ranked in the third quintile for the year-to-date performance period.
Costs of Services by the Manager. The Board reviewed the fees paid to the Manager and the other expenses borne by the Fund. The Board also considered the comparability of the fees charged and the services provided to the Fund to the fees and services for other clients or accounts advised by the Manager. The independent consultant provided comparative data in regard to the fees and expenses of the Fund and mid-cap growth funds underlying variable insurance products with comparable asset levels and distribution features. The Board considered that the Fund’s total expenses were lower than the expense group median. The Board also considered that, effective September 1, 2008 through August 31, 2009, the Manager voluntarily undertook to waive 10 basis points of its management fee until such time as the Fund is ranked in the third quintile of its performance universe. In reviewing the fees and expenses charged to the VA Funds, the Board considered the Manager’s assertion that, because of the disparity among VA funds in how insurance companies may be compensated for the services they provide to shareholders, when comparing the expenses of the various VA funds it is most appropriate to focus on the total expenses rather than on the management fees. Accordingly, while the Board reviewed and considered all expenses in its consideration of the Advisory Agreement, it paid particular attention to total expenses.
Economies of Scale and Profits Realized by the Manager. The Board considered information regarding the Manager’s costs in serving as the Fund’s investment adviser, including the costs associated with the personnel and systems necessary to manage the Fund, and information regarding the Manager’s profitability from its relationship with the Fund. The Board reviewed whether the Manager may realize economies of scale in managing and supporting the Fund. The Board noted that the Fund currently has management fee breakpoints, which are intended to share with Fund shareholders economies of scale that may exist as the Fund’s assets grow.
Other Benefits to the Manager. In addition to considering the profits realized by the Manager, the Board considered information that was provided regarding the direct and indirect benefits the Manager receives as a result of its relationship with the Fund, including compensation paid to the Manager’s affiliates and research provided to the Manager in connection with permissible brokerage arrangements (soft dollar arrangements). The Board also considered that the Manager must be able to pay and retain experienced professional personnel at competitive rates to provide quality services to the Fund and that maintaining the financial viability of the Manager is important in order for the Manager to continue to provide significant services to the Fund and its shareholders.
Conclusions. These factors were also considered by the independent Trustees meeting separately from the full Board, assisted by experienced counsel to the Fund and to the independent Trustees. Fund counsel and the independent Trustees’ counsel are independent of the Manager within the meaning and intent of the Securities and Exchange Commission Rules.
Based on its review of the information it received and its evaluations described above, the Board, including a majority of the independent Trustees, decided to continue the Agreement for another year. In arriving at this decision, the Board did not single out any factor or factors as being more important than others, but considered all of the above information, and considered the terms and conditions of the Agreement, including the management fee, in light of all of the surrounding circumstances.
9 | OPPENHEIMER MIDCAP FUND/VA
PORTFOLIO PROXY VOTING POLICIES AND PROCEDURES; UPDATES TO STATEMENTS OF INVESTMENTS Unaudited
The Fund has adopted Portfolio Proxy Voting Policies and Procedures under which the Fund votes proxies relating to securities (“portfolio proxies”) held by the Fund. A description of the Fund’s Portfolio Proxy Voting Policies and Procedures is available (i) without charge, upon request, by calling the Fund toll-free at 1.800.525.7048, (ii) on the Fund’s website at www.oppenheimerfunds.com, and (iii) on the SEC’s website at www.sec.gov. In addition, the Fund is required to file Form N-PX, with its complete proxy voting record for the 12 months ended June 30th, no later than August 31st of each year. The Fund’s voting record is available (i) without charge, upon request, by calling the Fund toll-free at 1.800.525.7048, and (ii) in the Form N-PX filing on the SEC’s website at www.sec.gov.
The Fund files its complete schedule of portfolio holdings with the SEC for the first quarter and the third quarter of each fiscal year on Form N-Q. The Fund’s Form N-Q filings are available on the SEC’s website at http://www.sec.gov. Those forms may be reviewed and copied at the SEC’s Public Reference Room in Washington, D.C. Information on the operation of the Public Reference Room may be obtained by calling 1-800-SEC-0330.
10 | OPPENHEIMER MIDCAP FUND/VA
TRUSTEES AND OFFICERS Unaudited
| | | |
| Name, Position(s) Held with the | | Principal Occupation(s) During the Past 5 Years; Other Trusteeships/Directorships Held; Number of |
| Fund, Length of Service, Age | | Portfolios in the Fund Complex Currently Overseen |
| | | |
INDEPENDENT
TRUSTEES | | The address of each Trustee in the chart below is 6803 S. Tucson Way, Centennial, Colorado 80112-3924. Each Trustee serves for an indefinite term, or until his or her resignation, retirement, death or removal. |
| | | |
William L. Armstrong,
Chairman of the Board of Trustees (since 2003), Trustee (since 1999)
Age: 71 | | President, Colorado Christian University (since 2006); Chairman, Cherry Creek Mortgage Company (since 1991), Chairman, Centennial State Mortgage Company (since 1994), Chairman, The El Paso Mortgage Company (since 1993); Chairman, Ambassador Media Corporation (since 1984); Chairman, Broadway Ventures (since 1984); Director of Helmerich & Payne, Inc. (oil and gas drilling/production company) (since 1992), Campus Crusade for Christ (non-profit) (since 1991); Former Director, The Lynde and Harry Bradley Foundation, Inc. (non-profit organization) (2002-2006); former Chairman of: Transland Financial Services, Inc. (private mortgage banking company) (1997-2003), Great Frontier Insurance (1995-2000), Frontier Real Estate, Inc. (residential real estate brokerage) (1994-2000) and Frontier Title (title insurance agency) (1995-2000); former Director of the following: UNUMProvident (insurance company) (1991-2004), Storage Technology Corporation (computer equipment company) (1991-2003) and International Family Entertainment (television channel) (1992-1997); U.S. Senator (January 1979-January 1991). Oversees 41 portfolios in the OppenheimerFunds complex. |
| | | |
George C. Bowen,
Trustee (since 1999)
Age: 72 | | Assistant Secretary and Director of Centennial Asset Management Corporation (December 1991-April 1999); President, Treasurer and Director of Centennial Capital Corporation (June 1989-April 1999); Chief Executive Officer and Director of MultiSource Services, Inc. (March 1996-April 1999); Mr. Bowen held several positions with the Manager and with subsidiary or affiliated companies of the Manager (September 1987-April 1999). Oversees 41 portfolios in the OppenheimerFunds complex. |
| | | |
Edward L. Cameron,
Trustee (since 1999)
Age: 70 | | Member of The Life Guard of Mount Vernon (George Washington historical site) (June 2000 – June 2006); Partner of PricewaterhouseCoopers LLP (accounting firm) (July 1974-June 1999); Chairman of Price Waterhouse LLP Global Investment Management Industry Services Group (accounting firm) (July 1994-June 1998). Oversees 41 portfolios in the OppenheimerFunds complex. |
| | | |
Jon S. Fossel,
Trustee (since 1990)
Age: 66 | | Director of UNUMProvident (insurance company) (since June 2002); Director of Northwestern Energy Corp. (public utility corporation) (since November 2004); Director of P.R. Pharmaceuticals (October 1999-October 2003); Director of Rocky Mountain Elk Foundation (non-profit organization) (February 1998-February 2003 and February 2005-February 2007); Chairman and Director (until October 1996) and President and Chief Executive Officer (until October 1995) of the Manager; President, Chief Executive Officer and Director of the following: Oppenheimer Acquisition Corp. (“OAC”) (parent holding company of the Manager), Shareholders Services, Inc. and Shareholder Financial Services, Inc. (until October 1995). Oversees 41 portfolios in the OppenheimerFunds complex. |
| | | |
Sam Freedman,
Trustee (since 1996)
Age: 68 | | Director of Colorado UpLIFT (charitable organization) (since September 1984). Mr. Freedman held several positions with the Manager and with subsidiary or affiliated companies of the Manager (until October 1994). Oversees 41 portfolios in the OppenheimerFunds complex. |
| | | |
Beverly L. Hamilton,
Trustee (since 2002)
Age: 62 | | Trustee of Monterey Institute for International Studies (educational organization) (since February 2000); Board Member of Middlebury College (educational organization) (since December 2005); Director of The California Endowment (philanthropic organization) (since April 2002); Director (February 2002-2005) and Chairman of Trustees (2006-2007) of the Community Hospital of Monterey Peninsula; Director (October 1991-2005) and Vice Chairman (since 2006) of American Funds’ Emerging Markets Growth Fund, Inc. (mutual fund); President of ARCO Investment Management Company (February 1991-April 2000); Member of the investment commit- tees of The Rockefeller Foundation (2001-2006) and The University of Michigan (since 2000); Advisor at Credit Suisse First Boston’s Sprout venture capital unit (venture capital fund) (1994-January 2005); Trustee of MassMutual Institutional Funds (investment company) (1996-June 2004); Trustee of MML Series Investment Fund (investment company) (April 1989-June 2004); Member of the investment committee of Hartford Hospital (2000-2003); and Advisor to Unilever (Holland) pension fund (2000-2003). Oversees 41 portfolios in the OppenheimerFunds complex. |
11 | OPPENHEIMER MIDCAP FUND/VA
TRUSTEES AND OFFICERS Unaudited / Continued
| | | |
| | | |
Robert J. Malone,
Trustee (since 2002)
Age: 64 | | Board of Directors of Opera Colorado Foundation (non-profit organization) (since March 2008); Director of Jones Knowledge, Inc. (since 2006); Director of Jones International University (educational organization) (since August 2005); Chairman, Chief Executive Officer and Director of Steele Street Bank & Trust (commercial banking) (since August 2003); Director of Colorado UpLIFT (charitable organization) (since 1986); Trustee of the Gallagher Family Foundation (non-profit organization) (since 2000); Former Chairman of U.S. Bank-Colorado (subsidiary of U.S. Bancorp and formerly Colorado National Bank) (July 1996-April 1999); Director of Commercial Assets, Inc. (real estate investment trust) (1993-2000); Director of Jones Knowledge, Inc. (2001-July 2004); and Director of U.S. Exploration, Inc. (oil and gas exploration) (1997-February 2004). Oversees 41 portfolios in the OppenheimerFunds complex. |
| | | |
F. William Marshall, Jr.,
Trustee (since 2001)
Age: 66 | | Trustee Emeritas of Worcester Polytech Institute (WPI) (private university) (since 2009); Trustee of MassMutual Select Funds (formerly MassMutual Institutional Funds) (investment company) (since 1996) and MML Series Investment Fund (investment company) (since 1996); President and Treasurer of the SIS Funds (private charitable fund) (since January 1999); Former Trustee of WPI (1985-2008); Former Chairman of the Board (2004-2006) and Former Chairman of the Investment Committee of WPI (1994-2008); Chairman of SIS & Family Bank, F.S.B. (formerly SIS Bank) (commercial bank) (January 1999-July 1999); Executive Vice President of Peoples Heritage Financial Group, Inc. (commercial bank) (January 1999-July 1999); and Former President and Chief Executive Officer of SIS Bancorp. (1993-1999). Oversees 43 portfolios in the OppenheimerFunds complex. |
| | | |
INTERESTED TRUSTEE
AND OFFICER | | The address of Mr. Murphy is Two World Financial Center, 225 Liberty Street, 11th Floor, New York, New York 10281-1008. Mr. Murphy serves as a Trustee for an indefinite term, or until his resignation, retirement, death or removal and as an Officer for an indefinite term, or until his resignation, retirement, death or removal. Mr. Murphy is an interested Trustee due to his positions with OppenheimerFunds, Inc. and its affiliates. |
| | | |
John V. Murphy,
Trustee, President and Principal Executive Officer (since 2001)
Age: 59 | | Chairman and Director of the Manager (since June 2001); Chief Executive Officer of the Manager (June 2001- December 2008); President of the Manager (September 2000-February 2007); President and director or trustee of other Oppenheimer funds; President and Director of Oppenheimer Acquisition Corp. (“OAC”) (the Manager’s parent holding company) and of Oppenheimer Partnership Holdings, Inc. (holding company subsidiary of the Manager) (since July 2001); Director of OppenheimerFunds Distributor, Inc. (subsidiary of the Manager) (November 2001-December 2006); Chairman and Director of Shareholder Services, Inc. and of Shareholder Financial Services, Inc. (transfer agent subsidiaries of the Manager) (since July 2001); President and Director of OppenheimerFunds Legacy Program (charitable trust program established by the Manager) (since July 2001); Director of the following investment advisory subsidiaries of the Manager: OFI Institutional Asset Management, Inc., Centennial Asset Management Corporation, Trinity Investment Management Corporation and Tremont Capital Management, Inc. (since November 2001), HarbourView Asset Management Corporation and OFI Private Investments, Inc. (since July 2001); President (since November 2001) and Director (since July 2001) of Oppenheimer Real Asset Management, Inc.; Executive Vice President of Massachusetts Mutual Life Insurance Company (OAC’s parent company) (since February 1997); Director of DLB Acquisition Corporation (holding company parent of Babson Capital Management LLC) (since June 1995); Chairman (since October 2007) and Member of the Investment Company Institute’s Board of Governors (since October 2003). Oversees 105 portfolios in the OppenheimerFunds complex. |
| | | |
OTHER OFFICERS OF
THE FUND | | The addresses of the Officers in the chart below are as follows: for Mr. Zack, Two World Financial Center, 225 Liberty Street, New York, New York 10281-1008, for Messrs. Vandehey and Wixted, 6803 S. Tucson Way, Centennial, Colorado 80112-3924. Each Officer serves for an indefinite term or until his or her resignation, retirement, death or removal. |
| | | |
Mark S. Vandehey,
Vice President and Chief Compliance Officer
(since 2004)
Age: 58 | | Senior Vice President and Chief Compliance Officer of the Manager (since March 2004); Chief Compliance Officer of OppenheimerFunds Distributor, Inc., Centennial Asset Management and Shareholder Services, Inc. (since March 2004); Vice President of OppenheimerFunds Distributor, Inc., Centennial Asset Management Corporation and Shareholder Services, Inc. (since June 1983); Former Vice President and Director of Internal Audit of the Manager (1997-February 2004). An officer of 105 portfolios in the OppenheimerFunds complex. |
12 | OPPENHEIMER MIDCAP FUND/VA
| | | |
Brian W. Wixted,
Treasurer and Principal
Financial & Accounting
Officer (since 1999)
Age: 49 | | Senior Vice President and Treasurer of the Manager (since March 1999); Treasurer of the following: HarbourView Asset Management Corporation, Shareholder Financial Services, Inc., Shareholder Services, Inc., Oppenheimer Real Asset Management, Inc. and Oppenheimer Partnership Holdings, Inc. (since March 1999), OFI Private Investments, Inc. (since March 2000), OppenheimerFunds International Ltd. and OppenheimerFunds plc (since May 2000), OFI Institutional Asset Management, Inc. (since November 2000), and OppenheimerFunds Legacy Program (charitable trust program established by the Manager) (since June 2003); Treasurer and Chief Financial Officer of OFI Trust Company (trust company subsidiary of the Manager) (since May 2000); Assistant Treasurer of the following: OAC (since March 1999), Centennial Asset Management Corporation (March 1999-October 2003) and OppenheimerFunds Legacy Program (April 2000-June 2003). An officer of 105 portfolios in the OppenheimerFunds complex. |
| | | |
Robert G. Zack,
Vice President and Secretary
(since 2001)
Age: 60 | | Executive Vice President (since January 2004) and General Counsel (since March 2002) of the Manager; General Counsel and Director of the Distributor (since December 2001); General Counsel of Centennial Asset Management Corporation (since December 2001); Senior Vice President and General Counsel of HarbourView Asset Management Corporation (since December 2001); Secretary and General Counsel of OAC (since November 2001); Assistant Secretary (since September 1997) and Director (since November 2001) of OppenheimerFunds International Ltd. and OppenheimerFunds plc; Vice President and Director of Oppenheimer Partnership Holdings, Inc. (since December 2002); Director of Oppenheimer Real Asset Management, Inc. (since November 2001); Senior Vice President, General Counsel and Director of Shareholder Financial Services, Inc. and Shareholder Services, Inc. (since December 2001); Senior Vice President, General Counsel and Director of OFI Private Investments, Inc. and OFI Trust Company (since November 2001); Vice President of OppenheimerFunds Legacy Program (since June 2003); Senior Vice President and General Counsel of OFI Institutional Asset Management, Inc. (since November 2001); Director of OppenheimerFunds International Distributor Limited (since December 2003); Senior Vice President (May 1985-December 2003). An officer of 105 portfolios in the OppenheimerFunds complex. |
The Fund’s Statement of Additional Information contains additional information about the Fund’s Trustees and Officers and is available without charge, upon request, by calling 1.800.981.2871.
13 | OPPENHEIMER MIDCAP FUND/ VA
FUND PERFORMANCE DISCUSSION
Management’s Discussion of Fund Performance. For the fiscal year ended December 31, 2008, Oppenheimer Balanced Fund/VA’s Non-Service shares returned -43.47% compared to the S&P 500 Index and the Barclays Capital Aggregate Bond Index, performance benchmarks used for the Fund, which returned -36.99% and 5.24%, respectively. While several factors contributed to the Fund’s very disappointing results, we believe the most significant factors influencing Fund performance for this reporting period were the overwhelmingly volatile and declining market backdrop that dominated 2008, and severe underperformance in both the Fund’s equity and bond components.
In terms of the Fund’s equity component, our less-than-market exposure to financial stocks strongly benefited results. As major financial institutions faced or neared bankruptcy in 2008, investors’ fears concerning financial services companies caused the sector to end the year as the worst-performing area of the domestic stock market. Similarly, our underweight in energy stocks benefited the Fund, as crude oil prices plummeted quickly in the third quarter from previous highs of approximately $140 a barrel to roughly $40 a barrel by the end of the reporting period.
Stock selection within the video game industry caused our overall exposure to information technology (IT) stocks to lag and accounted most for the underperformance of the equity component versus its S&P 500 Index benchmark. At year-end, negative pre-announcements by third parties hurt the prices of many video game stocks, some of which we owned. In this regard, a small segment of our IT holdings lost ground and thereby negatively impacted Fund performance at-large. Relative to the S&P 500 Index, the equity component also lost ground in the consumer discretionary and health care sectors. Together, these three sectors accounted for most of the equity underperformance.
On its own, the bond component significantly lagged its fixed-income benchmark, thereby hurting Fund returns markedly. While several factors contributed to these very disappointing results, we believe the most significant factors influencing Fund performance for this reporting period were the volatility of the markets for fixed-income securities throughout 2008 and, later in the period, the Fund’s investments in the high-quality commercial mortgage-backed securities (CMBSs) sector and long-maturity fixed-income securities of highly-rated financial institutions.
In the wake of the continuing mortgage crisis and ensuing global economic downturn, the fixed-income markets were subject to high volatility, price declines and lack of liquidity, as were the fixed-income securities and derivative investments based on such securities in which the Fund invested. We believe that even highly-rated mortgage securities suffered declines because of their association by investors with the residential mortgage market, and that market concerns about sub-prime mortgages, and expected default rates in CMBS, affected the prices of higher quality CMBS. Similarly, as major banks experienced balance sheet impairments and government officials scrambled to assemble bailout programs, nearly all debt associated with the financial sector dropped sharply in value, even highly-rated corporate debt.
In such an environment, and particularly after Lehman Brothers collapsed into bankruptcy in September 2008, many investors engaged in panic selling. This led to a situation in which the prices of most non-Treasury fixed-income securities, or “spread products,” detached from their underlying fundamentals, meaning that a security’s price had little correlation to its true, underlying value. As investors sought protection in U.S. Treasury securities, the volatility in the corporate debt market created a backdrop in which even the highest-rated assets were battered, including the Fund’s investments in high quality CMBSs, non-agency residential mortgage- backed securities (MBSs) and longer-maturity investment grade financial bonds, which we had believed to be fundamentally sound.
At the time the reporting period began, the Fund held positions in highly rated CMBSs and non-agency MBSs, and long-maturity fixed income securities of highly rated financial institutions. These holdings were acquired based on our assessment that they would provide attractive relative valuation opportunities and risk adjusted return, as well as diversification. To avoid large concentrations in individual MBSs and to gain access to the CMBS asset class through an instrument that was broader based and better diversified with respect to geography and property type than individual CMBS, we had pursued CMBS exposure through total return swaps using several CMBS Index securities. In addition, the CMBS Index investments we made were (and are) senior in the capital structure, which means that investors who purchased bonds subordinate to the ones purchased by the Fund would absorb losses from any defaults before the Fund did. The non-agency MBSs we purchased were backed by prime rate, residential jumbo mortgages
3 | OPPENHEIMER BALANCED FUND/VA
FUND PERFORMANCE DISCUSSION
from highly rated borrowers, not sub-prime borrowers. Additionally, the yield advantage over agency debt was considerable and, we believed, offered a better relative value opportunity than traditional agency mortgage-backed securities. Finally, we saw the opportunity to hold positions in financials due to the higher current yields they offered, and our analysis that the deleveraging process that banks were undergoing would improve their balance sheets.
By the spring of 2008, we saw even more potential value in these three areas and continued to build out our positions. After JPMorgan Chase and the Federal Reserve Board intervened to rescue Bear Stearns, the credit markets rallied markedly during the second quarter and performance in the Fund improved, which we believed validated our investment thesis and instilled confidence about our allocation decisions.
However, as the second half of 2008 began, domestic economic conditions worsened, a global recession loomed and investor panic spread. Three primary performance factors emerged. First, there was an unprecedented and unanticipated widening of credit spreads of mortgage-backed securities over Treasury securities, which accelerated during the month of November and had a negative impact on the Fund’s positions in total return swaps in the CMBS sector. Second, the historical correlation between highly rated securities and Treasuries and investor behavior in past economic crises did not occur in this one. Accordingly, amidst the difficult financial conditions, in a flight to quality, investors flocked to U.S. Treasury securities and not to highly-rated non-Treasury securities, such as the ones the Fund held, which also contributed to the Fund’s poor performance. Third, liquidity virtually disappeared as the markets in mortgage-related instruments effectively shut down. Rather than continuing to expand their positions, traditional financial intermediaries began aggressively shrinking their balance sheets, severely limiting the ability of the Fund’s portfolio team to either scale back or hedge away portfolio holdings that detracted from performance, which had a very negative impact on performance. These events contributed to the Fund’s negative performance and the significant decline in the Fund’s net asset value during the period (and especially in the fourth quarter). Within the challenging constraints of the limited liquidity in the market, we moved to adjust the Fund’s positions in total return swaps in the CMBS sector, and to seek liquidity to position the Fund to deal with the effect of ongoing volatility.
A less significant, yet still negative, influence on the Fund’s returns came from certain investments within the Fund’s short-maturity, high-yield bond holdings in which we obtained mixed results. A large portion of our holdings in this area performed well, maturing as expected and experiencing no defaults. However, the Fund’s performance was hurt by credit default swaps it had entered into in various sectors (such as the financial and auto-related sectors). Our investments in high-yield debt of auto-related companies and auto-financing entities severely detracted from the Fund’s returns. Much like the financial sector, many issuers associated with the beleaguered auto industry in 2008 struggled to stay afloat, so our investments in those credits—albeit small—suffered declines significant enough to hurt the Fund’s performance.
We continue to assess the changing market conditions and seek to position the Fund to deal with the effects of ongoing market volatility.
Comparing the Fund’s Performance to the Market. The graphs that follow show the performance of a hypothetical $10,000 investment in each share class of the Fund held until December 31, 2008. In the case of Non-Service shares, performance is measured over a ten-year period. In the case of Service shares, performance is measured from inception of the class on May 1, 2002. Performance information does not reflect charges that apply to separate accounts investing in the Fund. If these charges were taken into account, performance would be lower. The graphs assume that all dividends and capital gains distributions were reinvested in additional shares.
The Fund’s performance is compared to the performance of both the S&P 500 Index, an unmanaged index of U.S. equity securities that is a measure of the general domestic stock market and the Barclays Capital Aggregate Bond Index (formerly the Lehman Brothers Capital Aggregate Bond Index), an unmanaged index of U.S. corporate, government and mortgage-backed securities that is a measure of the domestic bond market. The indices performance includes reinvestment of income but does not reflect transaction costs, fees or expenses. The Fund’s performance reflects the effects of the Fund’s business and operating expenses. While index comparisons may be useful to provide a benchmark for the Fund’s performance, it must be noted that the Fund’s investments are not limited to the investments in the index.
4 | OPPENHEIMER BALANCED FUND/VA
Non-Service Shares
Comparison of Change in Value of $10,000 Hypothetical Investments in:
Service Shares
Comparison of Change in Value of $10,000 Hypothetical Investments in:
The performance data quoted represents past performance, which does not guarantee future results. The investment return and principal value of an investment in the Fund will fluctuate so that an investor’s shares, when redeemed, may be worth more or less than their original cost. Current performance may be lower or higher than the performance quoted. For performance data current to the most recent month end, call us at 1.800.981.2871. The Fund’s total returns should not be expected to be the same as the returns of other funds, whether or not both funds have the same portfolio managers and/or similar names. The Fund’s total returns do not include the charges associated with the separate account products that offer this Fund. Such performance would have been lower if such charges were taken into account.
5 | OPPENHEIMER BALANCED FUND/VA
FUND EXPENSES
Fund Expenses. As a shareholder of the Fund, you incur two types of costs: (1) transaction costs, which may include redemption fees (if applicable); and (2) ongoing costs, including management fees; distribution and service fees; and other Fund expenses. These examples are intended to help you understand your ongoing costs (in dollars) of investing in the Fund and to compare these costs with the ongoing costs of investing in other mutual funds.
The examples are based on an investment of $1,000.00 invested at the beginning of the period and held for the entire 6-month period ended December 31, 2008.
Actual Expenses. The first section of the table provides information about actual account values and actual expenses. You may use the information in this section for the class of shares you hold, together with the amount you invested, to estimate the expense that you paid over the period. Simply divide your account value by $1,000.00 (for example, an $8,600.00 account value divided by $1,000.00 = 8.60), then multiply the result by the number in the first section under the heading entitled “Expenses Paid During Period” to estimate the expenses you paid on your account during this period.
Hypothetical Example for Comparison Purposes. The second section of the table provides information about hypothetical account values and hypothetical expenses based on the Fund’s actual expense ratio for each class of shares, and an assumed rate of return of 5% per year for each class before expenses, which is not the actual return. The hypothetical account values and expenses may not be used to estimate the actual ending account balance or expenses you paid for the period. You may use this information to compare the ongoing costs of investing in the Fund and other funds. To do so, compare this 5% hypothetical example for the class of shares you hold with the 5% hypothetical examples that appear in the shareholder reports of the other funds.
Please note that the expenses shown in the table are meant to highlight your ongoing costs only and do not reflect any charges associated with the separate accounts that offer this Fund. Therefore, the “hypothetical” lines of the table are useful in comparing ongoing costs only, and will not help you determine the relative total costs of owning different funds. In addition, if these separate account charges were included your costs would have been higher.
| | | | | | | | | | | | | |
| | | Beginning | | Ending | | Expenses |
| | | Account | | Account | | Paid During |
| | | Value | | Value | | 6 Months Ended |
| | | July 1, 2008 | | December 31, 2008 | | December 31, 2008 |
| |
Actual | | | | | | | | | | | | |
| Non-Service Shares | | $ | 1,000.00 | | | $ | 607.00 | | | $ | 2.71 | |
| Service Shares | | | 1,000.00 | | | | 606.40 | | | | 3.73 | |
| | | | | | | | | | | | | |
Hypothetical | | | | | | | | | | | | |
| (5% return before expenses) | | | | | | | | | | | | |
| Non-Service Shares | | | 1,000.00 | | | | 1,021.77 | | | | 3.41 | |
| Service Shares | | | 1,000.00 | | | | 1,020.51 | | | | 4.68 | |
Expenses are equal to the Fund’s annualized expense ratio for that class, multiplied by the average account value over the period, multiplied by 184/366 (to reflect the one-half year period). Those annualized expense ratios, excluding indirect expenses from affiliated fund, based on the 6-month period ended December 31, 2008 are as follows:
| | | | | |
| Class | | Expense Ratios |
| |
| Non-Service Shares | | | 0.67 | % |
| Service Shares | | | 0.92 | |
The expense ratios reflect voluntary waivers or reimbursements of expenses by the Fund’s Manager that can be terminated at any time, without advance notice. The “Financial Highlights” tables in the Fund’s financial statements, included in this report, also show the gross expense ratios, without such waivers or reimbursements and reduction to custodian expenses, if applicable.
6 | OPPENHEIMER BALANCED FUND/VA
STATEMENT OF INVESTMENTS December 31, 2008
| | | | | | | | | |
| | | Shares | | | Value | |
| |
Common Stocks—65.1% | | | | | | | | |
Consumer Discretionary—10.5% | | | | | | | | |
Hotels, Restaurants & Leisure—1.1% | | | | | | | | |
Las Vegas Sands Corp.1 | | | 440,320 | | | $ | 2,611,098 | |
Media—9.4% | | | | | | | | |
| Cablevision Systems Corp. | | | | | | | | |
| New York Group, Cl. A | | | 193,360 | | | | 3,256,182 | |
| Comcast Corp., Cl. A Special, Non-Vtg. | | | 244,090 | | | | 3,942,054 | |
| Jupiter Telecommunications Co. Ltd. | | | 4,088 | | | | 4,257,100 | |
Liberty Global, Inc., Series A1 | | | 257,738 | | | | 4,103,189 | |
Liberty Global, Inc., Series C1 | | | 171,460 | | | | 2,602,763 | |
| National CineMedia, Inc. | | | 233,260 | | | | 2,365,256 | |
Time Warner Cable, Inc., Cl. A1 | | | 87,407 | | | | 1,874,880 | |
| | | | | | | | |
| | | | | | | | 22,401,424 | |
| | | | | | | | | |
Consumer Staples—5.9% | | | | | | | | |
Food Products—1.4% | | | | | | | | |
| Nestle SA | | | 87,780 | | | | 3,453,633 | |
Tobacco—4.5% | | | | | | | | |
| Altria Group, Inc. | | | 83,010 | | | | 1,250,131 | |
| Lorillard, Inc. | | | 50,660 | | | | 2,854,691 | |
| Philip Morris International, Inc. | | | 151,010 | | | | 6,570,445 | |
| | | | | | | | |
| | | | | | | | 10,675,267 | |
| | | | | | | | | |
Energy—3.9% | | | | | | | | |
Oil, Gas & Consumable Fuels—3.9% | | | | | | | | |
Alpha Natural Resources, Inc.1 | | | 25,310 | | | | 409,769 | |
| Exxon Mobil Corp. | | | 96,370 | | | | 7,693,217 | |
| Petroleo Brasileiro SA, ADR | | | 52,490 | | | | 1,285,480 | |
| | | | | | | | |
| | | | | | | | 9,388,466 | |
| | | | | | | | | |
Financials—6.3% | | | | | | | | |
Capital Markets—2.6% | | | | | | | | |
| Credit Suisse Group AG, ADR | | | 54,070 | | | | 1,528,018 | |
| Julius Baer Holding AG | | | 123,317 | | | | 4,735,493 | |
| | | | | | | | |
| | | | | | | | 6,263,511 | |
| | | | | | | | | |
Consumer Finance—1.5% | | | | | | | | |
SLM Corp.1 | | | 390,890 | | | | 3,478,921 | |
Insurance—2.2% | | | | | | | | |
| Everest Re Group Ltd. | | | 68,430 | | | | 5,210,260 | |
Health Care—7.0% | | | | | | | | |
Biotechnology—0.9% | | | | | | | | |
Amicus Therapeutics, Inc.1 | | | 95,449 | | | | 761,683 | |
Human Genome Sciences, Inc.1 | | | 256,420 | | | | 543,610 | |
Orexigen Therapeutics, Inc.1 | | | 153,170 | | | | 854,689 | |
| | | | | | | | |
| | | | | | | | 2,159,982 | |
| | | | | | | | | |
Health Care Equipment & Supplies—0.6% | | | | | | | | |
| Beckman Coulter, Inc. | | | 32,120 | | | | 1,411,353 | |
Health Care Providers & Services—2.4% | | | | | | | | |
| Aetna, Inc. | | | 51,240 | | | | 1,460,340 | |
Health Net, Inc.1 | | | 142,240 | | | | 1,548,994 | |
Medco Health Solutions, Inc.1 | | | 53,320 | | | | 2,234,641 | |
Skilled Healthcare Group, Inc., Cl. A1 | | | 46,060 | | | | 388,746 | |
| | | | | | | | |
| | | | | | | | 5,632,721 | |
| | | | | | | | | |
Life Sciences Tools & Services—0.9% | | | | | | | | |
Thermo Fisher Scientific, Inc.1 | | | 63,710 | | | | 2,170,600 | |
Pharmaceuticals—2.2% | | | | | | | | |
| Abbott Laboratories | | | 48,410 | | | | 2,583,642 | |
| Wyeth | | | 69,000 | | | | 2,588,190 | |
| | | | | | | | |
| | | | | | | | 5,171,832 | |
| | | | | | | | | |
Industrials—4.1% | | | | | | | | |
Aerospace & Defense—0.5% | | | | | | | | |
Orbital Sciences Corp.1 | | | 65,404 | | | | 1,277,340 | |
Industrial Conglomerates—2.4% | | | | | | | | |
| Siemens AG, Sponsored ADR | | | 74,840 | | | | 5,669,130 | |
Machinery—0.9% | | | | | | | | |
| Joy Global, Inc. | | | 57,780 | | | | 1,322,584 | |
Navistar International Corp.1 | | | 35,050 | | | | 749,369 | |
| | | | | | | | |
| | | | | | | | 2,071,953 | |
| | | | | | | | | |
Trading Companies & Distributors—0.3% | | | | | | | | |
| Aircastle Ltd. | | | 168,100 | | | | 803,518 | |
Information Technology—25.6% | | | | | | | | |
Communications Equipment—5.4% | | | | | | | | |
| QUALCOMM, Inc. | | | 184,560 | | | | 6,612,785 | |
Research in Motion Ltd.1 | | | 154,780 | | | | 6,280,972 | |
| | | | | | | | |
| | | | | | | | 12,893,757 | |
| | | | | | | | | |
Computers & Peripherals—1.2% | | | | | | | | |
| International Business Machines Corp. | | | 33,760 | | | | 2,841,242 | |
Electronic Equipment & Instruments—0.0% | | | | | | | | |
CalAmp Corp.1 | | | 19 | | | | 9 | |
Internet Software & Services—5.3% | | | | | | | | |
eBay, Inc.1 | | | 271,900 | | | | 3,795,724 | |
Google, Inc., Cl. A1 | | | 21,510 | | | | 6,617,552 | |
Yahoo!, Inc.1 | | | 193,370 | | | | 2,359,114 | |
| | | | | | | | |
| | | | | | | | 12,772,390 | |
F1 | OPPENHEIMER BALANCED FUND/VA
STATEMENT OF INVESTMENTS Continued
| | | | | | | | | |
| | | Shares | | | Value | |
| |
Semiconductors & Semiconductor Equipment—1.5% | | | | | | | | |
| Applied Materials, Inc. | | | 245,390 | | | $ | 2,485,801 | |
Varian Semiconductor Equipment Associates, Inc.1 | | | 54,720 | | | | 991,526 | |
| | | | | | | | |
| | | | | | | | 3,477,327 | |
| | | | | | | | | |
Software—12.2% | | | | | | | | |
Electronic Arts, Inc.1 | | | 151,000 | | | | 2,422,040 | |
| Microsoft Corp. | | | 344,800 | | | | 6,702,912 | |
Novell, Inc.1 | | | 337,980 | | | | 1,314,742 | |
Synopsys, Inc.1 | | | 114,640 | | | | 2,123,133 | |
| Take-Two Interactive Software, Inc. | | | 1,714,376 | | | | 12,960,683 | |
THQ, Inc.1 | | | 853,300 | | | | 3,575,327 | |
| | | | | | | | |
| | | | | | | | 29,098,837 | |
| | | | | | | | | |
Materials—1.3% | | | | | | | | |
Chemicals—1.3% | | | | | | | | |
| Lubrizol Corp. (The) | | | 44,140 | | | | 1,606,255 | |
| Mosaic Co. (The) | | | 42,010 | | | | 1,453,546 | |
| | | | | | | | |
| | | | | | | | 3,059,801 | |
| | | | | | | | | |
Telecommunication Services—0.0% | | | | | | | | |
Diversified Telecommunication Services—0.0% | | | | | | | | |
XO Holdings, Inc.1 | | | 85 | | | | 14 | |
Utilities—0.5% | | | | | | | | |
Energy Traders—0.5% | | | | | | | | |
NRG Energy, Inc.1 | | | 50,540 | | | | 1,179,098 | |
| | | | | | | | |
| | | | | | | | | |
| Total Common Stocks | | | | | | | | |
| (Cost $191,452,153) | | | | | | | 155,173,484 | |
| | | | | | | | | |
Preferred Stocks—3.2% | | | | | | | | |
| Mylan, Inc., 6.50% Cv., Non-Vtg. | | | 4,800 | | | | 3,163,344 | |
| Petroleo Brasileiro SA, Preference | | | 120,540 | | | | 1,223,055 | |
| Schering-Plough Corp., 6% Cv. | | | 18,800 | | | | 3,280,600 | |
| | | | | | | | |
| | | | | | | | | |
| Total Preferred Stocks | | | | | | | | |
| (Cost $6,066,144) | | | | | | | 7,666,999 | |
| | | | | | | | | |
| | | Units | | | | | |
| |
Rights, Warrants and Certificates—0.0% | | | | | | | | |
| XO Communications, Inc.: | | | | | | | | |
Series A Wts., Strike Price $6.25, Exp. 1/16/101,2 | | | 171 | | | | 1 | |
Series B Wts., Strike Price $7.50, Exp. 1/16/101,2 | | | 128 | | | | 1 | |
Series C Wts., Strike Price $10, Exp. 1/16/101,2 | | | 128 | | | | — | |
| | | | | | | | |
| | | | | | | | | |
| Total Rights, Warrants and Certificates (Cost $0) | | | | | | | 2 | |
| | | | | | | | | |
| | | Principal | | | | |
| | | Amount | | | Value | |
| |
Asset-Backed Securities—2.4% | | | | | | | | |
Argent Securities Trust 2004-W8, Asset-Backed Pass-Through Certificates, Series 2004-W8, Cl. A2, 0.951%, 5/25/343 | | $ | 830,484 | | | $ | 641,424 | |
Capital One Prime Auto Receivables Trust, Automobile Asset-Backed Certificates, Series 2005-1, Cl. A4, 1.215%, 4/15/113 | | | 1,354,945 | | | | 1,315,474 | |
| Citibank Credit Card Issuance Trust, Credit Card Receivable Nts., Series 2003-C4, Cl. C4, 5%, 6/10/15 | | | 180,000 | | | | 97,743 | |
| Countrywide Home Loans, Asset-Backed Certificates: | | | | | | | | |
Series 2002-4, Cl. A1, 1.211%, 2/25/333 | | | 18,836 | | | | 8,782 | |
| Series 2005-11, Cl. AF2, 4.657%, 2/25/36 | | | 85,643 | | | | 84,377 | |
Series 2005-16, Cl. 2AF2, 5.382%, 5/25/363 | | | 360,000 | | | | 287,909 | |
Series 2005-17, Cl. 1AF2, 5.363%, 5/25/363 | | | 223,831 | | | | 193,021 | |
CWABS, Inc. Asset-Backed Certificates Trust, Asset-Backed Certificates, Series 2006-25, Cl. 2A2, 0.591%, 12/5/293 | | | 480,000 | | | | 369,061 | |
HSBC Home Equity Loan Trust 2005-3, Closed-End Home Equity Loan Asset-Backed Nts., Series 2005-3, Cl. A1, 0.768%, 1/20/353 | | | 293,512 | | | | 208,659 | |
HSBC Home Equity Loan Trust 2006-4, Closed-End Home Equity Loan Asset-Backed Certificates, Series 2006-4, Cl. A2V, 0.618%, 3/20/363 | | | 180,000 | | | | 150,818 | |
Lehman XS Trust, Mtg. Pass-Through Certificates, Series 2005-2, Cl. 2A1B, 5.18%, 8/25/353 | | | 110,498 | | | | 108,427 | |
MBNA Credit Card Master Note Trust, Credit Card Receivables, Series 2003-C7, Cl. C7, 2.545%, 3/15/163 | | | 1,710,000 | | | | 665,119 | |
Option One Mortgage Loan Trust, Asset-Backed Certificates, Series 2006-2, Cl. 2A2, 0.571%, 7/1/363 | | | 910,060 | | | | 801,961 | |
RASC Series 2006-KS7 Trust, Home Equity Mtg. Asset-Backed Pass-Through Certificates, Series 2006-KS7, Cl. A2, 0.571%, 9/25/363 | | | 665,152 | | | | 605,196 | |
Structured Asset Investment Loan Trust, Mtg. Pass-Through Certificates, Series 2006-BNC3, Cl. A2, 0.511%, 9/25/363 | | | 188,309 | | | | 176,291 | |
| | | | | | | | |
| | | | | | | | | |
| Total Asset-Backed Securities | | | | | | | | |
| (Cost $7,654,859) | | | | | | | 5,714,262 | |
F2 | OPPENHEIMER BALANCED FUND/VA
| | | | | | | | | |
| | | Principal | | | | |
| | | Amount | | | Value | |
| |
Mortgage-Backed Obligations—33.6% | | | | | | | | |
Government Agency—23.5% | | | | | | | | |
FHLMC/FNMA/Sponsored—23.3% | | | | | | | | |
Federal Home Loan Mortgage Corp., 6.50%, 1/1/244 | | $ | 1,110,000 | | | $ | 1,151,625 | |
Federal Home Loan Mortgage Corp.,Gtd. Real Estate Mtg. Investment Conduit Multiclass
Pass-Through Certificates: | | | | | | | | |
Series 2006-11, Cl. PS, 22.839%, 3/25/363 | | | 318,633 | | | | 363,264 | |
Series 3025, Cl. SJ, 20.368%, 8/15/353 | | | 102,496 | | | | 117,184 | |
Series 3094, Cl. HS, 20.002%, 6/15/343 | | | 195,832 | | | | 218,120 | |
| Federal Home Loan Mortgage Corp., Interest-Only Stripped Mtg.-Backed Security: | | | | | | | | |
Series 176, Cl. IO, 3.205%, 6/1/265 | | | 171,080 | | | | 33,825 | |
Series 183, Cl. IO, 1.189%, 4/1/275 | | | 273,554 | | | | 40,597 | |
Series 184, Cl. IO, 7.51%, 12/1/265 | | | 299,662 | | | | 59,663 | |
Series 192, Cl. IO, 4.855%, 2/1/285 | | | 81,532 | | | | 11,519 | |
Series 200, Cl. IO, 4.491%, 1/1/295 | | | 100,250 | | | | 17,097 | |
Series 2130, Cl. SC, 35.774%, 3/15/295 | | | 215,198 | | | | 32,570 | |
Series 216, Cl. IO, 2.681%, 12/1/315 | | | 161,020 | | | | 20,364 | |
Series 224, Cl. IO, (0.528)%, 3/1/335 | | | 509,627 | | | | 75,981 | |
Series 243, Cl. 6, 15.224%, 12/15/325 | | | 304,809 | | | | 39,862 | |
Series 2527, Cl. SG, 31.83%, 2/15/325 | | | 208,322 | | | | 13,348 | |
Series 2531, Cl. ST, 35.211%, 2/15/305 | | | 240,175 | | | | 15,606 | |
Series 2796, Cl. SD, 45.683%, 7/15/265 | | | 309,171 | | | | 29,689 | |
Series 2802, Cl. AS, 99.999%, 4/15/335 | | | 448,100 | | | | 42,633 | |
Series 2920, Cl. S, 54.664%, 1/15/355 | | | 1,700,651 | | | | 167,142 | |
Series 3000, Cl. SE, 99.999%, 7/15/255 | | | 1,765,318 | | | | 141,242 | |
Series 3110, Cl. SL, 99.999%, 2/15/265 | | | 259,125 | | | | 18,628 | |
Series 3146, Cl. SA, 38.014%, 4/15/365 | | | 1,611,418 | | | | 191,529 | |
| Federal Home Loan Mortgage Corp., Principal-Only Stripped Mtg.-Backed Security: | | | | | | | | |
Series 176, Cl. PO, 6.166%, 6/1/266 | | | 75,291 | | | | 63,842 | |
Series 192, Cl. PO, 8.464%, 2/1/286 | | | 81,532 | | | | 73,282 | |
| Federal National Mortgage Assn.: | | | | | | | | |
4.50%, 1/1/224 | | | 4,057,000 | | | | 4,147,017 | |
5%, 1/1/24-1/1/394 | | | 11,094,000 | | | | 11,351,289 | |
| 5.50%, 9/25/20 | | | 19,835 | | | | 20,483 | |
5.50%, 1/1/24-1/1/394 | | | 9,264,000 | | | | 9,504,359 | |
6%, 1/1/24-1/1/394 | | | 11,292,000 | | | | 11,646,682 | |
6.50%, 1/1/24-1/1/394 | | | 6,480,000 | | | | 6,728,684 | |
7%, 1/1/394 | | | 2,705,000 | | | | 2,832,644 | |
7%, 11/1/177 | | | 414,783 | | | | 430,356 | |
7.50%, 1/1/337 | | | 303,388 | | | | 321,711 | |
| 8.50%, 7/1/32 | | | 13,025 | | | | 14,166 | |
| Federal National Mortgage Assn., Gtd. Real Estate Mtg. Investment Conduit Pass-Through Certificates: | | | | | | | | |
| Trust 1998-61, Cl. PL, 6%, 11/25/28 | | | 279,524 | | | | 289,643 | |
| Trust 2001-70, Cl. LR, 6%, 9/25/30 | | | 7,043 | | | | 7,030 | |
Trust 2003-130, Cl. CS, 13.158%, 12/25/333 | | | 177,323 | | | | 178,176 | |
Trust 2006-46, Cl. SW, 22.471%, 6/25/363 | | | 237,240 | | | | 265,125 | |
Trust 2006-50, Cl. KS, 22.472%, 6/25/363 | | | 624,000 | | | | 701,269 | |
| Federal National Mortgage Assn., Interest-Only Stripped Mtg.-Backed Security: | | | | | | | | |
Trust 2001-65, Cl. S, 40.848%, 11/25/315 | | | 816,463 | | | | 111,862 | |
Trust 2001-81, Cl. S, 24.811%, 1/25/325 | | | 172,699 | | | | 24,371 | |
Trust 2002-47, Cl. NS, 22.828%, 4/25/325 | | | 383,101 | | | | 51,966 | |
Trust 2002-51, Cl. S, 23.117%, 8/25/325 | | | 351,777 | | | | 47,863 | |
Trust 2002-52, Cl. SD, 23.975%, 9/25/325 | | | 390,175 | | | | 54,059 | |
Trust 2002-77, Cl. SH, 29.712%, 12/18/325 | | | 233,714 | | | | 29,369 | |
Trust 2002-84, Cl. SA, 42.181%, 12/25/325 | | | 723,859 | | | | 103,708 | |
Trust 2002-9, Cl. MS, 23.539%, 3/25/325 | | | 259,084 | | | | 32,619 | |
Trust 2003-118, Cl. S, 32.829%, 12/25/335 | | | 1,565,319 | | | | 189,069 | |
Trust 2003-33, Cl. SP, 22.276%, 5/25/335 | | | 813,547 | | | | 108,061 | |
Trust 2003-4, Cl. S, 37.987%, 2/25/335 | | | 468,196 | | | | 60,055 | |
Trust 2003-46, Cl. IH, (5.771)%, 6/1/335 | | | 2,706,545 | | | | 366,899 | |
Trust 2003-89, Cl. XS, 20.272%, 11/25/325 | | | 388,157 | | | | 30,326 | |
Trust 2004-54, Cl. DS, 33.428%, 11/25/305 | | | 331,381 | | | | 36,981 | |
Trust 2005-40, Cl. SA, 55.764%, 5/25/355 | | | 960,653 | | | | 98,612 | |
Trust 2005-6, Cl. SE, 67.902%, 2/25/355 | | | 1,275,120 | | | | 117,236 | |
Trust 2005-71, Cl. SA, 73.083%, 8/25/255 | | | 1,112,596 | | | | 83,422 | |
Trust 2005-87, Cl. SE, 99.999%, 10/25/355 | | | 2,291,731 | | | | 162,705 | |
Trust 2005-87, Cl. SG, 98.88%, 10/25/355 | | | 2,278,394 | | | | 193,116 | |
Trust 2006-33, Cl. SP, 65.426%, 5/25/365 | | | 2,545,444 | | | | 265,198 | |
Trust 222, Cl. 2, 7.132%, 6/1/235 | | | 626,955 | | | | 170,730 | |
Trust 233, Cl. 2, 14.075%, 8/1/235 | | | 518,872 | | | | 124,723 | |
Trust 240, Cl. 2, 11.408%, 9/1/235 | | | 997,831 | | | | 154,850 | |
Trust 252, Cl. 2, 12.742%, 11/1/235 | | | 470,043 | | | | 107,800 | |
Trust 273, Cl. 2, 4.64%, 8/1/265 | | | 130,292 | | | | 23,276 | |
Trust 319, Cl. 2, (1.176)%, 2/1/325 | | | 173,065 | | | | 24,396 | |
Trust 321, Cl. 2, (5.624)%, 4/1/325 | | | 1,800,435 | | | | 250,387 | |
Trust 331, Cl. 9, 22.162%, 2/1/335 | | | 491,652 | | | | 55,556 | |
Trust 333, Cl. 2, (12.058)%, 4/1/335 | | | 423,442 | | | | 51,787 | |
Trust 334, Cl. 17, 29.34%, 2/1/335 | | | 283,066 | | | | 48,444 | |
Trust 334, Cl. 3, 13.538%, 7/1/335 | | | 75,036 | | | | 8,419 | |
Trust 338, Cl. 2, (13.036)%, 7/1/335 | | | 390,562 | | | | 47,139 | |
Trust 339, Cl. 12, 13.466%, 7/1/335 | | | 506,390 | | | | 65,038 | |
Trust 339, Cl. 7, 11.167%, 7/1/335 | | | 1,918,575 | | | | 212,402 | |
Trust 339, Cl. 8, 12.211%, 8/1/335 | | | 41,905 | | | | 4,703 | |
Trust 342, Cl. 2, (1.109)%, 9/1/335 | | | 16,333 | | | | 2,335 | |
Trust 343, Cl. 13, 12.001%, 9/1/335 | | | 408,736 | | | | 43,227 | |
Trust 345, Cl. 9, 13.48%, 1/1/345 | | | 714,329 | | | | 78,019 | |
Trust 346, Cl. 2, (12.874)%, 12/1/335 | | | 409,372 | | | | 49,177 | |
Trust 351, Cl. 10, 14.256%, 4/1/345 | | | 70,261 | | | | 7,613 | |
Trust 351, Cl. 11, 12.86%, 11/1/345 | | | 71,211 | | | | 7,906 | |
Trust 351, Cl. 8, 12.789%, 4/1/345 | | | 215,225 | | | | 23,318 | |
Trust 356, Cl. 10, 13.15%, 6/1/355 | | | 183,704 | | | | 20,170 | |
Trust 356, Cl. 12, 13.355%, 2/1/355 | | | 99,862 | | | | 10,796 | |
Trust 362, Cl. 12, 12.979%, 8/1/355 | | | 1,187,328 | | | | 158,191 | |
Trust 362, Cl. 13, 12.965%, 8/1/355 | | | 657,004 | | | | 87,443 | |
Trust 364, Cl. 16, 14.77%, 9/1/355 | | | 520,060 | | | | 82,712 | |
Federal National Mortgage Assn., Principal-Only Stripped Mtg.-Backed Security, Trust 1993-184, Cl. M, 6.795%, 9/25/236 | | | 222,423 | | | | 189,115 | |
| | | | | | | | |
| | | | | | | | 55,654,415 | |
F3 | OPPENHEIMER BALANCED FUND/VA
STATEMENT OF INVESTMENTS Continued
| | | | | | | | | |
| | | Principal | | | | |
| | | Amount | | | Value | |
| |
GNMA/Guaranteed—0.2% | | | | | | | | |
| Government National Mortgage Assn., 8%, 4/15/23 | | $ | 134,100 | | | $ | 142,564 | |
| Government National Mortgage Assn., Interest-Only Stripped Mtg.-Backed Security: | | | | | | | | |
Series 2001-21, Cl. SB, 66.825%, 1/16/275 | | | 356,086 | | | | 51,056 | |
Series 2002-15, Cl. SM, 58.098%, 2/16/325 | | | 419,891 | | | | 62,078 | |
Series 2002-76, Cl. SY, 58.175%, 12/16/265 | | | 900,302 | | | | 138,177 | |
Series 2004-11, Cl. SM, 39.538%, 1/17/305 | | | 284,001 | | | | 31,153 | |
| | | | | | | | |
| | | | | | | | 425,028 | |
| | | | | | | | | |
Non-Agency—10.1% | | | | | | | | |
Commercial—3.7% | | | | | | | | |
| Banc of America Commercial Mortgage, Inc., Commercial Mtg. Pass-Through Certificates, Series 2006-1, Cl. AM, 5.421%, 9/1/45 | | | 1,800,000 | | | | 922,563 | |
| Banc of America Funding Corp., Mtg. Pass-Through Certificates, Series 2004-2, Cl. 2A1, 6.50%, 7/20/32 | | | 473,691 | | | | 453,528 | |
ChaseFlex Trust 2006-2, Multiclass Mtg. Pass-Through Certificates, Series 2006-2, Cl. A1B, 1.495%, 9/25/363 | | | 107,032 | | | | 102,549 | |
Citigroup Commercial Mortgage Trust 2008-C7, Commercial Mtg. Pass-Through Certificates, Series 2008-C7, Cl. AM, 6.096%, 12/1/493 | | | 780,000 | | | | 368,596 | |
| Citigroup Mortgage Loan Trust, Inc. 2006-WF1, Asset-Backed Pass-Through Certificates, Series 2006-WF1, Cl. A2B, 5.536%, 3/1/36 | | | 29,882 | | | | 29,635 | |
| CitiMortgage Alternative Loan Trust 2006-A5, Real Estate Mtg. Investment Conduit Pass-Through Certificates: | | | | | | | | |
Series 2006-A5, Cl. 1A1, 0.871%, 10/25/363 | | | 1,346,226 | | | | 581,956 | |
Series 2006-A5, Cl. 1A13, 0.921%, 10/25/363 | | | 709,695 | | | | 289,956 | |
CWALT Alternative Loan Trust 2006-HY13, Mtg. Pass-Through Certificates, Series 2006-HY13, Cl. 3A1, 5.97%, 1/1/473 | | | 157,235 | | | | 104,591 | |
| Deutsche Alt-A Securities Mortgage Loan Trust, Mtg. Pass-Through Certificates: | | | | | | | | |
| Series 2006-AB2, Cl. A7, 5.961%, 6/25/36 | | | 190,644 | | | | 175,475 | |
| Series 2006-AB4, Cl. A1A, 6.005%, 10/25/36 | | | 648,457 | | | | 519,568 | |
| Series 2006-AB3, Cl. A7, 6.36%, 7/1/36 | | | 74,183 | | | | 71,495 | |
| First Horizon Alternative Mortgage Securities Trust 2004-FA2, Mtg. Pass-Through Certificates, Series 2004-FA2, Cl. 3A1, 6%, 1/25/35 | | | 354,834 | | | | 259,423 | |
| First Horizon Alternative Mortgage Securities Trust 2007-FA2, Mtg. Pass-Through Certificates, Series 2007-FA2, Cl. 1A1, 5.50%, 4/25/37 | | | 413,790 | | | | 389,011 | |
| JPMorgan Chase Commercial Mortgage Securities Corp., Commercial Mtg. Pass-Through Certificates, Series 2005-LDP4, Cl. AM, 4.999%, 10/1/42 | | | 450,000 | | | | 265,876 | |
| JPMorgan Chase Commercial Mortgage Securities Trust, Commercial Mtg. Pass-Through Certificates: | | | | | | | | |
| Series 2007-LDPX, Cl. A2S, 5.305%, 1/15/49 | | | 235,000 | | | | 185,773 | |
Series 2007-LD11, Cl. A2, 5.804%, 6/15/493 | | | 270,000 | | | | 207,218 | |
| LB-UBS Commercial Mortgage Trust 2006-C1, Commercial Mtg. Pass-Through Certificates: | | | | | | | | |
| Series 2006-C1, Cl. A2, 5.084%, 2/11/31 | | | 345,000 | | | | 301,293 | |
Series 2006-C1, Cl. AM, 5.217%, 2/11/313 | | | 1,010,000 | | | | 509,580 | |
Mastr Adjustable Rate Mortgages Trust 2004-13, Mtg. Pass-Through Certificates, Series 2004-13, Cl. 2A2, 4.555%, 4/1/343 | | | 372,288 | | | | 285,045 | |
| Mastr Alternative Loan Trust 2004-6, Mtg. Pass-Through Certificates, Series 2004-6, Cl. 10A1, 6%, 7/25/34 | | | 753,256 | | | | 550,725 | |
| Merrill Lynch/Countrywide Commercial Mortgage Trust 2007-9, Commercial Mtg. Pass-Through Certificates, Series 2007-9, Cl. A4, 5.70%, 9/1/17 | | | 900,000 | | | | 626,506 | |
| Nomura Asset Securities Corp., Commercial Mtg. Pass-Through Certificates, Series 1998-D6, Cl. A1B, 6.59%, 3/15/30 | | | 10,115 | | | | 10,102 | |
| RALI Series 2007-QS6 Trust, Mtg. Asset-Backed Pass-Through Certificates, Series 2007-QS6, Cl. A114, 5.75%, 4/25/37 | | | 604,462 | | | | 263,961 | |
| Residential Asset Securitization Trust 2006-A9CB, Mtg. Pass-Through Certificates, Series 2006-A9CB, Cl. A5, 6%, 9/25/36 | | | 792,300 | | | | 387,593 | |
Wachovia Mortgage Loan Trust LLC, Mtg. Pass-Through Certificates, Series 2007-A, Cl. 1A1, 5.981%, 3/1/373 | | | 259,944 | | | | 140,235 | |
WaMu Mortgage Pass-Through Certificates 2007-HY1 Trust, Mtg. Pass-Through Certificates, Series 2007-HY1, Cl. 1A2, 5.706%, 2/25/372,3 | | | 341,592 | | | | 78,566 | |
WaMu Mortgage Pass-Through Certificates 2007-HY3 Trust, Mtg. Pass-Through Certificates, Series 2007-HY3, Cl. 2A2, 5.668%, 3/1/373 | | | 856,356 | | | | 221,331 | |
WaMu Mortgage Pass-Through Certificates 2007-HY4 Trust, Mtg. Pass-Through Certificates, Series 2007-HY4, Cl. 5A1, 5.548%, 11/1/363 | | | 226,594 | | | | 148,907 | |
F4 | OPPENHEIMER BALANCED FUND/VA
| | | | | | | | | |
| | | Principal | | | | |
| | | Amount | | | Value | |
| |
Commercial Continued | | | | | | | | |
WaMu Mortgage Pass-Through Certificates 2007-HY5 Trust, Mtg. Pass-Through Certificates, Series 2007-HY5, Cl. 2A3, 5.647%, 5/1/373 | | $ | 232,600 | | | $ | 148,739 | |
Wells Fargo Mortgage-Backed Securities 2004-U Trust, Mtg. Pass-Through Certificates, Series 2004-U, Cl. A1, 5.245%, 10/1/343 | | | 72,327 | | | | 61,756 | |
| | | | | | | | |
| | | | | | | | 8,661,552 | |
| | | | | | | | | |
Manufactured Housing—0.4% | | | | | | | | |
Wells Fargo Mortgage-Backed Securities 2006-AR12 Trust, Mtg. Pass-Through Certificates, Series 2006-AR12, Cl. 2A1, 6.099%, 9/25/363 | | | 1,386,950 | | | | 891,596 | |
Multifamily—2.5% | | | | | | | | |
Banc of America Mortgage Securities, Inc., Mtg. Pass-Through Certificates, Series 2003-E, Cl. 2A2, 4.71%, 6/25/333 | | | 781,643 | | | | 617,800 | |
CHL Mortgage Pass-Through Trust 2005-HYB1, Mtg. Pass-Through Certificates, Series 2005-HYB1, Cl. 1A2, 4.982%, 3/25/353 | | | 1,221,635 | | | | 764,858 | |
Citigroup Mortgage Loan Trust, Inc. 2006-AR5, Asset-Backed Pass-Through Certificates, Series 2006-AR5, Cl. 1A3A, 5.89%, 7/25/363 | | | 557,279 | | | | 292,211 | |
| CWALT Alternative Loan Trust 2005-85CB, Mtg. Pass-Through Certificates, Series 2005-85CB, Cl. 2A3, 5.50%, 2/25/36 | | | 860,000 | | | | 658,896 | |
| GMAC Mortgage Corp. Loan Trust, Mtg. Pass-Through Certificates, Series 2004-J4, Cl. A7, 5.50%, 9/25/34 | | | 800,000 | | | | 639,580 | |
GSR Mortgage Loan Trust 2005-AR7, Mtg. Pass-Through Certificates, Series 2005-AR7, Cl. 3A1, 5.14%, 11/25/353 | | | 1,945,351 | | | | 1,230,814 | |
Wells Fargo Mortgage-Backed Securities 2004-AA Trust, Mtg. Pass-Through Certificates, Series 2004-AA, Cl. 2A, 4.992%, 12/25/343 | | | 400,986 | | | | 310,463 | |
Wells Fargo Mortgage-Backed Securities 2004-S Trust, Mtg. Pass-Through Certificates, Series 2004-S, Cl. A1, 3.742%, 9/25/343 | | | 329,933 | | | | 241,462 | |
| Wells Fargo Mortgage-Backed Securities 2006-AR10 Trust, Mtg. Pass-Through Certificates: | | | | | | | | |
Series 2006-AR10, Cl. 4A1, 5.557%, 7/25/363 | | | 826,442 | | | | 542,072 | |
Series 2006-AR10, Cl. 2A1, 5.628%, 7/25/363 | | | 643,979 | | | | 344,967 | |
Wells Fargo Mortgage-Backed Securities 2006-AR2 Trust, Mtg. Pass-Through Certificates, Series 2006-AR2, Cl. 2A6, 5.093%, 3/25/363 | | | 329,516 | | | | 91,812 | |
Wells Fargo Mortgage-Backed Securities 2006-AR6 Trust, Mtg. Pass-Through Certificates, Series 2006-AR6, Cl. 3A1, 5.093%, 3/25/363 | | | 415,887 | | | | 298,692 | |
| | | | | | | | |
| | | | | | | | 6,033,627 | |
| | | | | | | | | |
Residential—3.5% | | | | | | | | |
| CWALT Alternative Loan Trust 2004-24CB, Mtg. Pass-Through Certificates, Series 2004-24CB, Cl. 1A1, 6%, 11/1/34 | | | 650,123 | | | | 572,900 | |
| CWALT Alternative Loan Trust 2004-28CB, Mtg. Pass-Through Certificates, Series 2004-28CB, Cl. 3A1, 6%, 1/1/35 | | | 526,826 | | | | 358,925 | |
| CWALT Alternative Loan Trust 2005-18CB, Mtg. Pass-Through Certificates, Series 2005-18CB, Cl. A8, 5.50%, 5/25/36 | | | 1,170,000 | | | | 864,628 | |
| CWALT Alternative Loan Trust 2005-J1, Mtg. Pass-Through Certificates, Series 2005-J1, Cl. 3A1, 6.50%, 8/25/32 | | | 969,805 | | | | 621,137 | |
LB-UBS Commercial Mortgage Trust 2007-C7, Commercial Mtg. Pass- Through Certificates, Series 2007-C7, Cl. AM, 6.166%, 9/11/453 | | | 550,000 | | | | 260,181 | |
Morgan Stanley Mortgage Loan Trust 2006-AR, Mtg. Pass-Through Certificates, Series 2006-AR, Cl. 5A3, 5.416%, 6/25/363 | | | 530,000 | | | | 367,333 | |
| RALI Series 2003-QS1 Trust, Mtg. Asset-Backed Pass-Through Certificates, Series 2003-QS1, Cl. A2, 5.75%, 1/25/33 | | | 300,087 | | | | 299,135 | |
RALI Series 2004-QS10 Trust, Mtg. Asset-Backed Pass-Through Certificates, Series 2004-QS10, Cl. A3, 0.971%, 7/25/343 | | | 111,702 | | | | 94,078 | |
| RALI Series 2006-QS13 Trust, Mtg. Asset-Backed Pass-Through Certificates, Series 2006-QS13, Cl. 1A8, 6%, 9/25/36 | | | 377,968 | | | | 363,789 | |
| RALI Series 2006-QS5 Trust, Mtg. Asset-Backed Pass-Through Certificates, Series 2006-QS5, Cl. 2A2, 6%, 5/1/36 | | | 198,296 | | | | 193,893 | |
F5 | OPPENHEIMER BALANCED FUND/VA
STATEMENT OF INVESTMENTS Continued
| | | | | | | | | |
| | | Principal | | | | |
| | | Amount | | | Value | |
| |
Residential Continued | | | | | | | | |
WaMu Mortgage Pass-Through Certificates 2003-AR9 Trust, Mtg. Pass-Through Certificates, Series 2003-AR9, Cl. 2A, 4.491%, 9/25/333 | | $ | 490,334 | | | $ | 422,839 | |
WaMu Mortgage Pass-Through Certificates 2006-AR12 Trust, Mtg. Pass-Through Certificates, Series 2006-AR12, Cl. 2A1, 5.75%, 10/25/363 | | | 1,719,504 | | | | 974,827 | |
WaMu Mortgage Pass-Through Certificates 2006-AR8 Trust, Mtg. Pass- Through Certificates, Series 2006-AR8, Cl. 2A1, 6.127%, 8/25/363 | | | 1,591,462 | | | | 1,058,645 | |
WaMu Mortgage Pass-Through Certificates 2007-HY2 Trust, Mtg. Pass-Through Certificates, Series 2007-HY2, Cl. 2A1, 6.615%, 11/1/363 | | | 94,656 | | | | 54,037 | |
| Washington Mutual Mortgage Pass-Through Certificates, Mtg. Pass-Through Certificates, Series 2007-1, Cl. 1A8, 6%, 2/25/37 | | | 1,796,633 | | | | 1,571,810 | |
Wells Fargo Mortgage-Backed Securities 2004-R Trust, Mtg. Pass-Through Certificates, Series 2004-R, Cl. 2A1, 4.368%, 9/1/343 | | | 90,473 | | | | 64,768 | |
Wells Fargo Mortgage-Backed Securities 2006-AR5 Trust, Mtg. Pass-Through Certificates, Series 2006-AR5, Cl. 2A2, 5.545%, 4/1/362,3 | | | 694,776 | | | | 180,642 | |
| | | | | | | | |
| |
| | | | | | | | 8,323,567 | |
| | | | | | | | |
| | | | | | | | | |
Total Mortgage-Backed Obligations
(Cost $91,093,083) | | | | | | | 79,989,785 | |
Non-Convertible Corporate Bonds and Notes—11.4% | | | | | | | | |
| ABN Amro Bank NV (NY Branch), 7.125% Sub. Nts., Series B, 10/15/93 | | | 400,000 | | | | 329,268 | |
| Albertson’s, Inc., 8% Sr. Unsec. Debs., 5/1/31 | | | 880,000 | | | | 532,400 | |
| American International Group, Inc., 6.25% Jr. Sub. Bonds, 3/15/37 | | | 560,000 | | | | 209,636 | |
Axa SA, 6.379% Sub. Perpetual Bonds8,9 | | | 2,135,000 | | | | 956,734 | |
| Bank of America Corp.: | | | | | | | | |
8% Unsec. Perpetual Bonds, Series K9 | | | 1,025,000 | | | | 738,328 | |
8.125% Perpetual Bonds, Series M9 | | | 225,000 | | | | 168,581 | |
Barclays Bank plc, 6.278% Perpetual Bonds9 | | | 2,600,000 | | | | 1,505,062 | |
| Buckeye Partners LP, 4.625% Sr. Nts., 7/15/13 | | | 310,000 | | | | 263,817 | |
| Capmark Financial Group, Inc.: | | | | | | | | |
3.038% Sr. Unsec. Nts., 5/10/103 | | | 375,000 | | | | 191,431 | |
| 5.875% Sr. Unsec. Nts., 5/10/12 | | | 585,000 | | | | 199,596 | |
| Centex Corp., 5.80% Sr. Unsec. Nts., 9/15/09 | | | 485,000 | | | | 463,175 | |
| CIT Group Funding Co. of Canada, 4.65% Sr. Unsec. Nts., 7/1/10 | | | 670,000 | | | | 588,373 | |
| Citigroup, Inc.: | | | | | | | | |
8.30% Jr. Sub. Bonds, 12/21/573 | | | 1,520,000 | | | | 1,174,925 | |
8.40% Perpetual Bonds, Series E9 | | | 760,000 | | | | 502,770 | |
| Clear Channel Communications, Inc., 6.25% Nts., 3/15/11 | | | 710,000 | | | | 216,550 | |
| Coca-Cola Co. (The), 7.375% Unsec. Debs., 7/29/93 | | | 360,000 | | | | 422,745 | |
| Energy Transfer Partners LP, 5.65% Sr. Unsec. Unsub. Nts., 8/1/12 | | | 195,000 | | | | 174,229 | |
| Ford Motor Credit Co., 9.75% Sr. Unsec. Nts., 9/15/10 | | | 2,030,000 | | | | 1,624,564 | |
| General Motors Acceptance Corp., 8% Bonds, 11/1/31 | | | 1,400,000 | | | | 820,625 | |
| Goldman Sachs Capital, Inc. (The), 6.345% Sub. Bonds, 2/15/34 | | | 1,850,000 | | | | 1,345,962 | |
HBOS plc, 6.413% Sub. Perpetual Bonds, Series A8,9 | | | 3,100,000 | | | | 1,204,245 | |
HSBC Finance Capital Trust IX, 5.911% Nts., 11/30/353 | | | 2,530,000 | | | | 1,059,746 | |
JPMorgan Chase & Co., 7.90% Perpetual Bonds, Series 19 | | | 1,205,000 | | | | 1,005,001 | |
| Kaneb Pipe Line Operating Partnership LP, 5.875% Sr. Unsec. Nts., 6/1/13 | | | 830,000 | | | | 699,228 | |
Lehman Brothers Holdings, Inc., 7.50% Sub. Nts., 5/11/3810 | | | 2,910,000 | | | | 291 | |
| Lennar Corp., 7.625% Sr. Unsec. Nts., 3/1/09 | | | 170,000 | | | | 169,150 | |
| Macy’s Retail Holdings, Inc., 4.80% Sr. Nts., 7/15/09 | | | 535,000 | | | | 507,155 | |
| MBIA, Inc., 5.70% Sr. Unsec. Unsub. Nts., 12/1/34 | | | 565,000 | | | | 229,882 | |
| Merrill Lynch & Co., Inc., 7.75% Jr. Sub. Bonds, 5/14/38 | | | 1,335,000 | | | | 1,475,258 | |
MetLife Capital Trust X, 9.25% Sec. Bonds, 4/8/383 | | | 300,000 | | | | 209,665 | |
MetLife, Inc., 6.40% Jr. Unsec. Sub. Bonds, 12/15/363 | | | 1,710,000 | | | | 1,028,372 | |
| MGM Mirage, Inc., 6% Sr. Sec. Nts., 10/1/09 | | | 925,000 | | | | 888,000 | |
| Monongahela Power Co., 7.36% Unsec. Nts., Series A, 1/15/10 | | | 680,000 | | | | 665,833 | |
| NCR Corp., 7.125% Sr. Unsec. Unsub. Nts., 6/15/09 | | | 565,000 | | | | 566,718 | |
F6 | OPPENHEIMER BALANCED FUND/VA
| | | | | | | | | |
| | | Principal | | | | |
| | | Amount | | | Value | |
| |
Non-Convertible Corporate Bonds and Notes Continued | | | | | | | | |
PF Export Receivables Master Trust, 3.748% Sr. Nts., Series B, 6/1/138 | | $ | 244,572 | | | $ | 260,005 | |
| Popular North America, Inc., 4.70% Nts., 6/30/09 | | | 845,000 | | | | 825,967 | |
Prudential Holdings LLC, 8.695% Bonds, Series C, 12/18/238 | | | 1,285,000 | | | | 1,240,868 | |
Prudential Insurance Co. of America, 8.30% Nts., 7/1/258 | | | 1,110,000 | | | | 750,067 | |
| TEPPCO Partners LP, 6.125% Nts., 2/1/13 | | | 490,000 | | | | 436,334 | |
| Valero Logistics Operations LP, 6.05% Nts., 3/15/13 | | | 210,000 | | | | 179,902 | |
Washington Mutual Bank NV, 3.337% Sr. Unsec. Nts., 5/1/0910 | | | 970,000 | | | | 286,150 | |
| Westar Energy, Inc., 7.125% Sr. Unsec. Nts., 8/1/09 | | | 685,000 | | | | 682,196 | |
| Wynn Las Vegas LLC/Wynn Las Vegas Capital Corp., 6.625% Nts., 12/1/14 | | | 565,000 | | | | 429,400 | |
| | | | | | | | |
| Total Non-Convertible Corporate Bonds and Notes (Cost $41,637,125) | | | | | | | 27,228,204 | |
Convertible Corporate Bonds and Notes—0.6% | | | | | | | | |
| Theravance, Inc., 3% Cv. Sub. Nts., 1/15/15 (Cost $1,850,149) | | $ | 2,247,000 | | | $ | 1,387,523 | |
| | | | | | | | | |
| | | Shares | | | | | |
| |
Investment Company—3.6% | | | | | | | | |
Oppenheimer Institutional Money Market Fund, Cl. E, 1.96%11,12
(Cost $8,646,429) | | | 8,646,429 | | | | 8,646,429 | |
| | | | | | | | | |
Total Investments, at Value
(Cost $348,399,942) | | | 119.9 | % | | | 285,806,688 | |
Liabilities in Excess of Other Assets | | | (19.9 | ) | | | (47,387,415 | ) |
| | | |
Net Assets | | | 100.0 | % | | $ | 238,419,273 | |
| | | |
Industry classifications are unaudited.
Footnotes to Statement of Investments
| | |
| |
| 1. | | Non-income producing security. |
| |
| 2. | | Illiquid security. The aggregate value of illiquid securities as of December 31, 2008 was $259,210, which represents 0.11% of the Fund’s net assets. See Note 8 of accompanying Notes. |
| |
| 3. | | Represents the current interest rate for a variable or increasing rate security. |
| |
| 4. | | When-issued security or delayed delivery to be delivered and settled after December 31, 2008. See Note 1 of accompanying Notes. |
| |
| 5. | | Interest-Only Strips represent the right to receive the monthly interest payments on an underlying pool of mortgage loans. These securities typically decline in price as interest rates decline. Most other fixed income securities increase in price when interest rates decline. The principal amount of the underlying pool represents the notional amount on which current interest is calculated. The price of these securities is typically more sensitive to changes in prepayment rates than traditional mortgage-backed securities (for example, GNMA pass-throughs). Interest rates disclosed represent current yields based upon the current cost basis and estimated timing and amount of future cash flows. These securities amount to $5,321,813 or 2.23% of the Fund’s net assets as of December 31, 2008. |
| |
| 6. | | Principal-Only Strips represent the right to receive the monthly principal payments on an underlying pool of mortgage loans. The value of these securities generally increases as interest rates decline and prepayment rates rise. The price of these securities is typically more volatile than that of coupon-bearing bonds of the same maturity. Interest rates disclosed represent current yields based upon the current cost basis and estimated timing of future cash flows. These securities amount to $326,239 or 0.14% of the Fund’s net assets as of December 31, 2008. |
| |
| 7. | | All or a portion of the security is held in collateralized accounts to cover initial margin requirements on open futures contracts. The aggregate market value of such securities is $752,067. See Note 6 of accompanying Notes. |
| |
| 8. | | Represents securities sold under Rule 144A, which are exempt from registration under the Securities Act of 1933, as amended. These securities have been determined to be liquid under guidelines established by the Board of Trustees. These securities amount to $4,411,919 or 1.85% of the Fund’s net assets as of December 31, 2008. |
| |
| 9. | | This bond has no contractual maturity date, is not redeemable and contractually pays an indefinite stream of interest. Rate reported represents the current interest rate for this variable rate security. |
| |
| 10. | | Issue is in default. See Note 1 of accompanying Notes. |
| |
| 11. | | Is or was an affiliate, as defined in the Investment Company Act of 1940, at or during the period ended December 31, 2008, by virtue of the Fund owning at least 5% of the voting securities of the issuer or as a result of the Fund and the issuer having the same investment adviser. Transactions during the period in which the issuer was an affiliate are as follows: |
| | | | | | | | | | | | | | | | | |
| | | Shares | | | Gross | | | Gross | | | Shares | |
| | | December 31, 2007 | | | Additions | | | Reductions | | | December 31, 2008 | |
| |
| OFI Liquid Assets Fund, LLC | | | — | | | | 667,850 | | | | 667,850 | | | | — | |
| Oppenheimer Institutional Money Market Fund, Cl. E | | | 16,578,809 | | | | 165,592,548 | | | | 173,524,928 | | | | 8,646,429 | |
| |
| | | | | | | | | | | Value | | | Income | |
| |
| OFI Liquid Assets Fund, LLC | | | | | | | | | | $ | — | | | $ | 96 | a |
| Oppenheimer Institutional Money Market Fund, Cl. E | | | | | | | | | | | 8,646,429 | | | | 172,114 | |
| | | | | | | | | | | |
| | | | | | | | | | | $ | 8,646,429 | | | $ | 172,210 | |
| | | | | | | | | | | |
| | |
| a. | | Net of compensation to the securities lending agent and rebates paid to the borrowing counterparties. |
| |
| 12. | | Rate shown is the 7-day yield as of December 31, 2008. |
F7 | OPPENHEIMER BALANCED FUND/VA
STATEMENT OF INVESTMENTS Continued
Footnotes to Statement of Investments Continued
Valuation Inputs
Various data inputs are used in determining the value of each of the Fund’s investments as of the reporting period end. These data inputs are categorized in the following hierarchy under applicable financial accounting standards:
1) Level 1—quoted prices in active markets for identical assets or liabilities (including securities actively traded on a securities exchange)
2) Level 2—inputs other than quoted prices that are observable for the asset (such as quoted prices for similar assets and market corroborated inputs such as interest rates, prepayment speeds, credit risks, etc.)
3) Level 3—unobservable inputs (including the Manager’s own judgments about assumptions that market participants would use in pricing the asset).
The market value of the Fund’s investments was determined based on the following inputs as of December 31, 2008:
| | | | | | | | | |
| | | Investments in | | | Other Financial | |
| Valuation Description | | Securities | | | Instruments* | |
| |
| Level 1—Quoted Prices | | $ | 154,537,033 | | | $ | (393,056 | ) |
| Level 2—Other Significant Observable Inputs | | | 131,269,655 | | | | (535,629 | ) |
| Level 3—Significant Unobservable Inputs | | | — | | | | — | |
| | | |
| Total | | $ | 285,806,688 | | | $ | (928,685 | ) |
| | | |
| | |
| * | | Other financial instruments include options written, currency contracts, futures, forwards and swap contracts. Currency contracts and forwards are reported at their unrealized appreciation/depreciation at measurement date, which represents the change in the contract’s value from trade date. Futures are reported at their variation margin at measurement date, which represents the amount due to/from the Fund at that date. Options written and swaps are reported at their market value at measurement date. |
See the accompanying Notes for further discussion of the methods used in determining value of the Fund’s investments, and a summary of changes to the valuation techniques, if any, during the reporting period.
Futures Contracts as of December 31, 2008 are as follows:
| | | | | | | | | | | | | | | | | | | |
| | | | | | | | | | | | | | | | | Unrealized | |
| | | | | Number of | | | Expiration | | | | | | | Appreciation | |
| Contract Description | | Buy/Sell | | Contracts | | | Date | | | Value | | | (Depreciation) | |
| |
| U.S. Treasury Bonds, 10 yr. | | Buy | | | 85 | | | | 3/20/09 | | | $ | 10,688,750 | | | $ | 110,843 | |
| U.S. Treasury Bonds, 20 yr. | | Buy | | | 81 | | | | 3/20/09 | | | | 11,181,797 | | | | 978,929 | |
| U.S. Treasury Nts., 2 yr. | | Sell | | | 171 | | | | 3/31/09 | | | | 37,288,688 | | | | (143,074 | ) |
| | | | | | | | | | | | | | | | | | |
| | | | | | | | | | | | | | | | | $ | 946,698 | |
| | | | | | | | | | | | | | | | | | |
Credit Default Swap Contracts as of December 31, 2008 are as follows:
| | | | | | | | | | | | | | | | | | | | | | | | | | | |
| | | | | Buy/Sell | | Notional | | | Pay/ | | | | | | | Upfront | | | | |
| | | | | Credit | | Amount | | | Receive | | | Termination | | | Payment | | | | |
| Swap Reference Entity | | Counterparty | | Protection | | (000s) | | | Fixed Rate | | | Date | | | Received/(Paid) | | | Value | |
| |
| ABX.HE.AA.06-2 Index: | | | | | | | | | | | | | | | | | | | | | | | | |
| | | Barclays Bank plc | | Sell | | $ | 350 | | | | 0.170 | % | | | 5/25/46 | | | $ | 270,766 | | | $ | (307,387 | ) |
| | | Deutsche Bank AG | | Sell | | | 240 | | | | 0.170 | | | | 5/25/46 | | | | 28,798 | | | | (210,780 | ) |
| | | Goldman Sachs Bank USA | | Sell | | | 85 | | | | 0.170 | | | | 5/25/46 | | | | 7,003 | | | | (74,651 | ) |
| | | Goldman Sachs Bank USA | | Sell | | | 330 | | | | 0.170 | | | | 5/25/46 | | | | 130,342 | | | | (289,822 | ) |
| | | Morgan Stanley Capital Services, Inc. | | Sell | | | 85 | | | | 0.170 | | | | 5/25/46 | | | | 6,791 | | | | (74,651 | ) |
| | | Morgan Stanley Capital Services, Inc. | | Sell | | | 160 | | | | 0.170 | | | | 5/25/46 | | | | 15,999 | | | | (140,520 | ) |
| | | | | | | | | | | | | | | | | | | | |
| | | | | Total | | | 1,250 | | | | | | | | | | | | 459,699 | | | | (1,097,811 | ) |
| Allied Waste North America, Inc.: | | | | | | | | | | | | | | | | | | | | | | | | |
| | | Deutsche Bank AG | | Sell | | | 340 | | | | 2.000 | | | | 9/20/09 | | | | — | | | | 2,625 | |
| | | Deutsche Bank AG | | Sell | | | 530 | | | | 2.000 | | | | 9/20/09 | | | | — | | | | 4,092 | |
| | | | | | | | | | | | | | | | | | | | |
| | | | | Total | | | 870 | | | | | | | | | | | | — | | | | 6,717 | |
| American International Group, Inc.: | | | | | | | | | | | | | | | | | | | | | | | | |
| | | Barclays Bank plc | | Sell | | | 180 | | | | 3.000 | | | | 3/20/09 | | | | — | | | | (1,055 | ) |
| | | Barclays Bank plc | | Sell | | | 695 | | | | 4.000 | | | | 3/20/09 | | | | — | | | | (2,396 | ) |
| | | Barclays Bank plc | | Sell | | | 595 | | | | 5.350 | | | | 3/20/09 | | | | — | | | | (112 | ) |
| | | Deutsche Bank AG | | Sell | | | 870 | | | | 4.000 | | | | 3/20/09 | | | | — | | | | (2,999 | ) |
| | | Morgan Stanley Capital Services, Inc. | | Sell | | | 520 | | | | 4.000 | | | | 3/20/09 | | | | — | | | | (1,792 | ) |
| | | | | | | | | | | | | | | | | | | | |
| | | | | Total | | | 2,860 | | | | | | | | | | | | — | | | | (8,354 | ) |
F8 | OPPENHEIMER BALANCED FUND/VA
Credit Default Swap Contracts: Continued
| | | | | | | | | | | | | | | | | | | | | | | | | | | |
| | | | | Buy/Sell | | Notional | | | Pay/ | | | | | | | Upfront | | | | |
| | | | | Credit | | Amount | | | Receive | | | Termination | | | Payment | | | | |
| Swap Reference Entity | | Counterparty | | Protection | | (000s) | | | Fixed Rate | | | Date | | | Received/(Paid) | | | Value | |
| |
| Capmark Financial Group, Inc.: | | | | | | | | | | | | | | | | | | | | | | | | | | |
| | | Barclays Bank plc | | Sell | | $ | 520 | | | | 1.000 | % | | | 6/20/12 | | | $ | — | | | $ | (272,564 | ) |
| | | Goldman Sachs Bank USA | | Sell | | | 535 | | | | 0.950 | | | | 6/20/12 | | | | — | | | | (280,786 | ) |
| | | Morgan Stanley Capital Services, Inc. | | Sell | | | 50 | | | | 5.000 | | | | 6/20/12 | | | | 13,500 | | | | (23,523 | ) |
| | | | | | | | | | | | | | | | | | | | |
| | | | | Total | | | 1,105 | | | | | | | | | | | | 13,500 | | | | (576,873 | ) |
| CDX North America High Yield Index, Series 7 | | Deutsche Bank AG | | Buy | | | 4,587 | | | | 0.400 | | | | 12/20/11 | | | | (483 | ) | | | 167,165 | |
| | | | | | | | | | | | | | | | | | | | |
| | | | | Total | | | 4,587 | | | | | | | | | | | | (483 | ) | | | 167,165 | |
| Cemex SAB de CV | | Deutsche Bank AG | | Sell | | | 300 | | | | 2.000 | | | | 3/20/09 | | | | — | | | | (4,388 | ) |
| | | | | | | | | | | | | | | | | | | | |
| | | | | Total | | | 300 | | | | | | | | | | | | — | | | | (4,388 | ) |
| Centex Corp. | | Deutsche Bank AG | | Sell | | | 135 | | | | 1.550 | | | | 9/20/09 | | | | — | | | | (3,231 | ) |
| | | | | | | | | | | | | | | | | | | | |
| | | | | Total | | | 135 | | | | | | | | | | | | — | | | | (3,231 | ) |
| CIT Group, Inc. | | Barclays Bank plc | | Sell | | | 115 | | | | 10.500 | | | | 6/20/09 | | | | — | | | | 1,520 | |
| | | | | | | | | | | | | | | | | | | | |
| | | | | Total | | | 115 | | | | | | | | | | | | — | | | | 1,520 | |
| Countrywide Home Loans, Inc. | | Morgan Stanley Capital Services, Inc. | | Sell | | | 1,615 | | | | 0.420 | | | | 6/20/09 | | | | — | | | | (6,136 | ) |
| | | | | | | | | | | | | | | | | | | | |
| | | | | Total | | | 1,615 | | | | | | | | | | | | — | | | | (6,136 | ) |
| Energy Future Holdings Corp.: | | | | | | | | | | | | | | | | | | | | | | | | | | |
| | | Credit Suisse International | | Sell | | | 175 | | | | 5.910 | | | | 12/20/12 | | | | — | | | | (48,030 | ) |
| | | Credit Suisse International | | Sell | | | 170 | | | | 6.050 | | | | 12/20/12 | | | | — | | | | (46,109 | ) |
| | | Credit Suisse International | | Sell | | | 175 | | | | 6.000 | | | | 12/20/12 | | | | — | | | | (47,667 | ) |
| | | | | | | | | | | | | | | | | | | | |
| | | | | Total | | | 520 | | | | | | | | | | | | — | | | | (141,806 | ) |
| Ford Motor Co.: | | | | | | | | | | | | | | | | | | | | | | | | | | |
| | | Deutsche Bank AG | | Sell | | | 150 | | | | 5.000 | | | | 12/20/18 | | | | 81,000 | | | | (105,941 | ) |
| | | Morgan Stanley Capital Services, Inc. | | Sell | | | 1,100 | | | | 7.150 | | | | 12/20/16 | | | | — | | | | (715,769 | ) |
| | | Morgan Stanley Capital Services, Inc. | | Sell | | | 525 | | | | 7.050 | | | | 12/20/16 | | | | — | | | | (345,617 | ) |
| | | | | | | | | | | | | | | | | | | | |
| | | | | Total | | | 1,775 | | | | | | | | | | | | 81,000 | | | | (1,167,327 | ) |
| General Electric Capital Corp.: | | | | | | | | | | | | | | | | | | | | | | | | | | |
| | | Barclays Bank plc | | Sell | | | 347 | | | | 8.000 | | | | 12/20/09 | | | | — | | | | 10,224 | |
| | | Barclays Bank plc | | Sell | | | 410 | | | | 5.750 | | | | 12/20/09 | | | | — | | | | 3,209 | |
| | | Credit Suisse International | | Sell | | | 325 | | | | 8.000 | | | | 12/20/09 | | | | — | | | | 9,575 | |
| | | | | | | | | | | | | | | | | | | | |
| | | | | Total | | | 1,082 | | | | | | | | | | | | — | | | | 23,008 | |
| General Motors Corp.: | | | | | | | | | | | | | | | | | | | | | | | | | | |
| | | Deutsche Bank AG | | Sell | | | 210 | | | | 5.000 | | | | 12/20/18 | | | | 140,700 | | | | (166,259 | ) |
| | | Morgan Stanley Capital Services, Inc. | | Sell | | | 545 | | | | 5.800 | | | | 12/20/16 | | | | — | | | | (431,098 | ) |
| | | Morgan Stanley Capital Services, Inc. | | Sell | | | 535 | | | | 5.750 | | | | 12/20/16 | | | | — | | | | (423,420 | ) |
| | | | | | | | | | | | | | | | | | | | |
| | | | | Total | | | 1,290 | | | | | | | | | | | | 140,700 | | | | (1,020,777 | ) |
| Goldman Sachs Group, Inc. (The): | | | | | | | | | | | | | | | | | | | | | | | | | | |
| | | Barclays Bank plc | | Sell | | | 520 | | | | 5.750 | | | | 12/20/09 | | | | — | | | | 10,597 | |
| | | Deutsche Bank AG | | Sell | | | 525 | | | | 5.500 | | | | 12/20/09 | | | | — | | | | 9,424 | |
| | | Deutsche Bank AG | | Sell | | | 420 | | | | 5.450 | | | | 12/20/09 | | | | — | | | | 7,335 | |
| | | | | | | | | | | | | | | | | | | | |
| | | | | Total | | | 1,465 | | | | | | | | | | | | — | | | | 27,356 | |
| Hartford Financial Services Group, Inc. | | Morgan Stanley Capital Services, Inc. | | Sell | | | 300 | | | | 2.400 | | | | 3/20/09 | | | | — | | | | (2,997 | ) |
| | | | | | | | | | | | | | | | | | | | |
| | | | | Total | | | 300 | | | | | | | | | | | | — | | | | (2,997 | ) |
| HCP, Inc. | | Barclays Bank plc | | Sell | | | 455 | | | | 4.600 | | | | 3/20/09 | | | | — | | | | 522 | |
| | | | | | | | | | | | | | | | | | | | |
| | | | | Total | | | 455 | | | | | | | | | | | | — | | | | 522 | |
| Idearc, Inc. | | Credit Suisse International | | Sell | | | 60 | | | | 5.000 | | | | 12/20/09 | | | | 12,300 | | | | (43,404 | ) |
| | | | | | | | | | | | | | | | | | | | |
| | | | | Total | | | 60 | | | | | | | | | | | | 12,300 | | | | (43,404 | ) |
| Inco Ltd.: | | | | | | | | | | | | | | | | | | | | | | | | | | |
| | | Morgan Stanley Capital Services, Inc. | | Buy | | | 545 | | | | 0.700 | | | | 3/20/17 | | | | — | | | | 86,986 | |
| | | Morgan Stanley Capital Services, Inc. | | Buy | | | 550 | | | | 0.630 | | | | 3/20/17 | | | | — | | | | 90,175 | |
| | | | | | | | | | | | | | | | | | | | |
| | | | | Total | | | 1,095 | | | | | | | | | | | | — | | | | 177,161 | |
| | | | | | | | | | | | | | | | | | | | |
| | | Morgan Stanley Capital Services, Inc. | | Sell | | | 545 | | | | 1.170 | | | | 3/20/17 | | | | — | | | | (69,265 | ) |
| | | Morgan Stanley Capital Services, Inc. | | Sell | | | 550 | | | | 1.100 | | | | 3/20/17 | | | | — | | | | (72,382 | ) |
| | | | | | | | | | | | | | | | | | | | |
| | | | | Total | | | 1,095 | | | | | | | | | | | | — | | | | (141,647 | ) |
F9 | OPPENHEIMER BALANCED FUND/VA
STATEMENT OF INVESTMENTS Continued
Footnotes to Statement of Investments Continued
Credit Default Swap Contracts: Continued
| | | | | | | | | | | | | | | | | | | | | | | | | | | |
| | | | | Buy/Sell | | Notional | | | Pay/ | | | | | | | Upfront | | | | |
| | | | | Credit | | Amount | | | Receive | | | Termination | | | Payment | | | | |
| Swap Reference Entity | | Counterparty | | Protection | | (000s) | | | Fixed Rate | | | Date | | | Received/(Paid) | | | Value | |
| |
| iStar Financial, Inc.: | | | | | | | | | | | | | | | | | | | | | | | | | | |
| | | Barclays Bank plc | | Sell | | $ | 480 | | | | 4.400 | % | | | 12/20/12 | | | $ | — | | | $ | (260,245 | ) |
| | | Credit Suisse International | | Sell | | | 65 | | | | 4.000 | | | | 12/20/12 | | | | — | | | | (35,405 | ) |
| | | Credit Suisse International | | Sell | | | 160 | | | | 12.000 | | | | 3/20/09 | | | | — | | | | (17,497 | ) |
| | | Deutsche Bank AG | | Sell | | | 75 | | | | 4.320 | | | | 12/20/12 | | | | — | | | | (40,701 | ) |
| | | Deutsche Bank AG | | Sell | | | 400 | | | | 12.000 | | | | 3/20/09 | | | | — | | | | (43,741 | ) |
| | | Goldman Sachs Bank USA | | Sell | | | 75 | | | | 3.950 | | | | 12/20/12 | | | | — | | | | (40,876 | ) |
| | | | | | | | | | | | | | | | | | | | |
| | | | | Total | | | 1,255 | | | | | | | | | | | | — | | | | (438,465 | ) |
| | | | | | | | | | | | | | | | | | | | | | | | | | | |
| J.C. Penney Corp., Inc.: | | | | | | | | | | | | | | | | | | | | | | | | | | |
| | | Morgan Stanley Capital Services, Inc. | | Sell | | | 525 | | | | 1.070 | | | | 12/20/17 | | | | — | | | | (102,264 | ) |
| | | Morgan Stanley Capital Services, Inc. | | Sell | | | 545 | | | | 1.300 | | | | 12/20/17 | | | | — | | | | (98,390 | ) |
| | | | | | | | | | | | | | | | | | | | |
| | | | | Total | | | 1,070 | | | | | | | | | | | | — | | | | (200,654 | ) |
| | | | | | | | | | | | | | | | | | | | | | | | | | | |
| Jones Apparel Group, Inc.: | | | | | | | | | | | | | | | | | | | | | | | | | | |
| | | Deutsche Bank AG | | Buy | | | 290 | | | | 2.635 | | | | 6/20/18 | | | | — | | | | 64,768 | |
| | | Morgan Stanley Capital Services, Inc. | | Buy | | | 575 | | | | 2.970 | | | | 6/20/18 | | | | — | | | | 117,956 | |
| | | | | | | | | | | | | | | | | | | | |
| | | | | Total | | | 865 | | | | | | | | | | | | — | | | | 182,724 | |
| | | | | | | | | | | | | | | | | | | | |
| | | Deutsche Bank AG | | Sell | | | 290 | | | | 2.720 | | | | 6/20/13 | | | | — | | | | (57,512 | ) |
| | | Morgan Stanley Capital Services, Inc. | | Sell | | | 575 | | | | 3.200 | | | | 6/20/13 | | | | — | | | | (105,184 | ) |
| | | | | | | | | | | | | | | | | | | | |
| | | | | Total | | | 865 | | | | | | | | | | | | — | | | | (162,696 | ) |
| | | | | | | | | | | | | | | | | | | | | | | | | | | |
| Kohl’s Corp.: | | | | | | | | | | | | | | | | | | | | | | | | | | |
| | | Barclays Bank plc | | Buy | | | 285 | | | | 1.180 | | | | 6/20/18 | | | | — | | | | 25,444 | |
| | | Barclays Bank plc | | Buy | | | 285 | | | | 1.040 | | | | 6/20/18 | | | | — | | | | 28,345 | |
| | | Deutsche Bank AG | | Buy | | | 280 | | | | 1.300 | | | | 6/20/18 | | | | — | | | | 22,555 | |
| | | Morgan Stanley Capital Services, Inc. | | Buy | | | 785 | | | | 0.660 | | | | 12/20/17 | | | | — | | | | 95,759 | |
| | | Morgan Stanley Capital Services, Inc. | | Buy | | | 820 | | | | 0.870 | | | | 12/20/17 | | | | — | | | | 87,983 | |
| | | | | | | | | | | | | | | | | | | | |
| | | | | Total | | | 2,455 | | | | | | | | | | | | — | | | | 260,086 | |
| | | | | | | | | | | | | | | | | | | | |
| | | Barclays Bank plc | | Sell | | | 285 | | | | 1.080 | | | | 6/20/13 | | | | — | | | | (19,174 | ) |
| | | Barclays Bank plc | | Sell | | | 285 | | | | 0.900 | | | | 6/20/13 | | | | — | | | | (21,205 | ) |
| | | Deutsche Bank AG | | Sell | | | 280 | | | | 1.180 | | | | 6/20/13 | | | | — | | | | (17,729 | ) |
| | | | | | | | | | | | | | | | | | | | |
| | | | | Total | | | 850 | | | | | | | | | | | | — | | | | (58,108 | ) |
| | | | | | | | | | | | | | | | | | | | | | | | | | | |
| Liz Claiborne, Inc.: | | | | | | | | | | | | | | | | | | | | | | | | | | |
| | | Morgan Stanley Capital Services, Inc. | | Buy | | | 560 | | | | 2.900 | | | | 6/20/18 | | | | — | | | | 173,389 | |
| | | | | | | | | | | | | | | | | | | | |
| | | | | Total | | | 560 | | | | | | | | | | | | — | | | | 173,389 | |
| | | | | | | | | | | | | | | | | | | | |
| | | Deutsche Bank AG | | Sell | | | 1,095 | | | | 3.250 | | | | 6/20/09 | | | | — | | | | (32,151 | ) |
| | | Morgan Stanley Capital Services, Inc. | | Sell | | | 560 | | | | 3.100 | | | | 6/20/13 | | | | — | | | | (148,646 | ) |
| | | | | | | | | | | | | | | | | | | | |
| | | | | Total | | | 1,655 | | | | | | | | | | | | — | | | | (180,797 | ) |
| | | | | | | | | | | | | | | | | | | | | | | | | | | |
| Louisiana-Pacific Corp. | | Morgan Stanley Capital Services, Inc. | | Sell | | | 550 | | | | 6.250 | | | | 9/20/09 | | | | — | | | | (46,997 | ) |
| | | | | | | | | | | | | | | | | | | | |
| | | | | Total | | | 550 | | | | | | | | | | | | — | | | | (46,997 | ) |
| | | | | | | | | | | | | | | | | | | | | | | | | | | |
| Merrill Lynch & Co., Inc.: | | | | | | | | | | | | | | | | | | | | | | | | | | |
| | | Barclays Bank plc | | Sell | | | 1,080 | | | | 4.150 | | | | 9/20/09 | | | | — | | | | 1,440 | |
| | | Credit Suisse International | | Sell | | | 540 | | | | 4.150 | | | | 9/20/09 | | | | — | | | | 720 | |
| | | | | | | | | | | | | | | | | | | | |
| | | | | Total | | | 1,620 | | | | | | | | | | | | — | | | | 2,160 | |
| | | | | | | | | | | | | | | | | | | | | | | | | | | |
| Morgan Stanley | | Credit Suisse International | | Sell | | | 715 | | | | 7.800 | | | | 12/20/13 | | | | — | | | | 106,944 | |
| | | | | | | | | | | | | | | | | | | | |
| | | | | Total | | | 715 | | | | | | | | | | | | — | | | | 106,944 | |
| | | | | | | | | | | | | | | | | | | | | | | | | | | |
| Prudential Financial, Inc. | | Deutsche Bank AG | | Sell | | | 385 | | | | 2.050 | | | | 6/20/09 | | | | — | | | | (12,290 | ) |
| | | | | | | | | | | | | | | | | | | | |
| | | | | Total | | | 385 | | | | | | | | | | | | — | | | | (12,290 | ) |
| | | | | | | | | | | | | | | | | | | | | | | | | | | |
| Pulte Homes, Inc. | | Goldman Sachs Bank USA | | Sell | | | 800 | | | | 2.750 | | | | 9/20/09 | | | | — | | | | (1,125 | ) |
| | | | | | | | | | | | | | | | | | | | |
| | | | | Total | | | 800 | | | | | | | | | | | | — | | | | (1,125 | ) |
| | | | | | | | | | | | | | | | | | | | | | | | | | | |
| Reliant Energy, Inc.: | | | | | | | | | | | | | | | | | | | | | | | | | | |
| | | Credit Suisse International | | Sell | | | 280 | | | | 9.000 | | | | 12/20/09 | | | | — | | | | (7,027 | ) |
| | | Credit Suisse International | | Sell | | | 285 | | | | 9.000 | | | | 12/20/09 | | | | — | | | | (7,152 | ) |
| | | | | | | | | | | | | | | | | | | | |
| | | | | Total | | | 565 | | | | | | | | | | | | — | | | | (14,179 | ) |
| | | | | | | | | | | | | | | | | | | | | | | | | | | |
| R.H. Donnelley Corp. | | Goldman Sachs International | | Sell | | | 655 | | | | 9.000 | | | | 3/20/09 | | | | — | | | | (28,240 | ) |
| | | | | | | | | | | | | | | | | | | | |
| | | | | Total | | | 655 | | | | | | | | | | | | — | | | | (28,240 | ) |
| | | | | | | | | | | | | | | | | | | | | | | | | | | |
| Rite Aid Corp.: | | | | | | | | | | | | | | | | | | | | | | | | | | |
| | | Credit Suisse International | | Sell | | | 115 | | | | 7.500 | | | | 3/20/09 | | | | — | | | | (5,885 | ) |
| | | Credit Suisse International | | Sell | | | 305 | | | | 5.000 | | | | 9/20/09 | | | | 18,300 | | | | (54,205 | ) |
| | | | | | | | | | | | | | | | | | | | |
| | | | | Total | | | 420 | | | | | | | | | | | | 18,300 | | | | (60,090 | ) |
F10 | OPPENHEIMER BALANCED FUND/VA
Credit Default Swap Contracts: Continued
| | | | | | | | | | | | | | | | | | | | | | | | | | | |
| | | | | Buy/Sell | | Notional | | | Pay/ | | | | | | | Upfront | | | | |
| | | | | Credit | | Amount | | | Receive | | | Termination | | | Payment | | | | |
| Swap Reference Entity | | Counterparty | | Protection | | (000s) | | | Fixed Rate | | | Date | | | Received/(Paid) | | | Value | |
| |
| Sprint Nextel Corp.: | | | | | | | | | | | | | | | | | | | | | | | | | | |
| | | Credit Suisse International | | Sell | | $ | 1,300 | | | | 6.300 | % | | | 3/20/09 | | | $ | — | | | $ | (18,104 | ) |
| | | Goldman Sachs Bank USA | | Sell | | | 470 | | | | 6.300 | | | | 3/20/09 | | | | — | | | | (6,545 | ) |
| | | | | | | | | | | | | | | | | | | | |
| | | | | Total | | | 1,770 | | | | | | | | | | | | — | | | | (24,649 | ) |
| | | | | | | | | | | | | | | | | | | | | | | | | | | |
| Temple-Inland, Inc. | | Deutsche Bank AG | | Sell | | | 135 | | | | 3.000 | | | | 9/20/09 | | | | — | | | | (8,026 | ) |
| | | | | | | | | | | | | | | | | | | | |
| | | | | Total | | | 135 | | | | | | | | | | | | — | | | | (8,026 | ) |
| | | | | | | | | | | | | | | | | | | | | | | | | | | |
| Tenet Healthcare Corp. | | Deutsche Bank AG | | Sell | | | 870 | | | | 1.600 | | | | 3/20/09 | | | | — | | | | (20,156 | ) |
| | | | | | | | | | | | | | | | | | | | |
| | | | | Total | | | 870 | | | | | | | | | | | | — | | | | (20,156 | ) |
| | | | | | | | | | | | | | | | | | | | | | | | | | | |
| Tribune Co.: | | | | | | | | | | | | | | | | | | | | | | | | | | |
| | | Credit Suisse International | | Sell | | | 50 | | | | 5.000 | | | | 1/16/09 | | | | 11,000 | | | | (46,881 | ) |
| | | Credit Suisse International | | Sell | | | 255 | | | | 5.000 | | | | 1/16/09 | | | | 58,650 | | | | (239,094 | ) |
| | | Credit Suisse International | | Sell | | | 15 | | | | 5.000 | | | | 1/16/09 | | | | 4,800 | | | | (14,064 | ) |
| | | Credit Suisse International | | Sell | | | 150 | | | | 5.000 | | | | 1/16/09 | | | | 52,500 | | | | (140,643 | ) |
| | | Credit Suisse International | | Sell | | | 195 | | | | 5.000 | | | | 1/16/09 | | | | 76,050 | | | | (182,836 | ) |
| | | | | | | | | | | | | | | | | | | | |
| | | | | Total | | | 665 | | | | | | | | | | | | 203,000 | | | | (623,518 | ) |
| | | | | | | | | | | | | | | | | | | | | | | | | | | |
| Univision Communications, Inc.: | | | | | | | | | | | | | | | | | | | | | | | | | | |
| | | Goldman Sachs Bank USA | | Sell | | | 155 | | | | 5.000 | | | | 6/20/09 | | | | 15,500 | | | | (51,242 | ) |
| | | Goldman Sachs Bank USA | | Sell | | | 60 | | | | 5.000 | | | | 6/20/09 | | | | 6,600 | | | | (19,836 | ) |
| | | Goldman Sachs Bank USA | | Sell | | | 160 | | | | 5.000 | | | | 6/20/09 | | | | 9,600 | | | | (52,895 | ) |
| | | Morgan Stanley Capital Services, Inc. | | Sell | | | 110 | | | | 5.000 | | | | 12/20/09 | | | | 7,700 | | | | (37,775 | ) |
| | | Morgan Stanley Capital Services, Inc. | | Sell | | | 120 | | | | 5.000 | | | | 12/20/09 | | | | 15,600 | | | | (41,209 | ) |
| | | | | | | | | | | | | | | | | | | | |
| | | | | Total | | | 605 | | | | | | | | | | | | 55,000 | | | | (202,957 | ) |
| | | | | | | | | | | | | | | | | | | | | | | | | | | |
| Vornado Realty LP: | | | | | | | | | | | | | | | | | | | | | | | | | | |
| | | Credit Suisse International | | Sell | | | 300 | | | | 3.600 | | | | 3/20/09 | | | | — | | | | (2,607 | ) |
| | | Deutsche Bank AG | | Sell | | | 605 | | | | 3.875 | | | | 6/20/09 | | | | — | | | | (4,851 | ) |
| | | | | | | | | | | | | | | | | | | | |
| | | | | Total | | | 905 | | | | | | | | | | | | — | | | | (7,458 | ) |
| | | | | | | | | | | | | | | | | | | | | | | | | | | |
| XL Capital Ltd.: | | | | | | | | | | | | | | | | | | | | | | | | | | |
| | | Barclays Bank plc | | Sell | | | 610 | | | | 3.550 | | | | 9/20/09 | | | | — | | | | (45,272 | ) |
| | | Deutsche Bank AG | | Sell | | | 690 | | | | 3.550 | | | | 9/20/09 | | | | — | | | | (51,210 | ) |
| | | | | | | | | | | | | | | | | | | | |
| | | | | Total | | | 1,300 | | | | | | | | | | | | — | | | | (96,482 | ) |
| | | | | | | | | | | | | | | | | | | | |
| | | | | Grand Total Buys | | | 9,562 | | | | | | | | | | | | (483 | ) | | | 960,525 | |
| | | | | Grand Total Sells | | | 33,947 | | | | | | | | | | | | 983,499 | | | | (6,233,411 | ) |
| | | | | | | | | | | | | | | | | | | | | |
| | | | | | | | |
Total Credit Default Swaps | | | $ | 983,016 | | | $ | (5,272,886 | ) |
| | | | | | | | | | | | | | | | | | | | | |
The table that follows shows the undiscounted maximum potential payment by the Fund related to selling credit protection in credit default swaps:
| | | | | | | | | | | | | |
| Type of Reference | | Total Maximum Potential | | | | | | | | |
| Asset on which the | | Payments for Selling Credit | | | | | | | Reference Asset | |
| Fund Sold Protection | | Protection (Undiscounted) | | | Amount Recoverable* | | | Rating Range** | |
| |
| Asset-Backed Indexes | | $ | 1,250,000 | | | $ | — | | | AA |
| Single Name Corporate Debt | | | 19,497,000 | | | | 850,000 | | | AAA to BBB- |
| Single Name Corporate Debt | | | 13,200,000 | | | | 1,425,000 | | | BB+ to D |
| | | | | | | |
| Total | | $ | 33,947,000 | | | $ | 2,275,000 | | | | | |
| | | | | | | |
| | |
| * | | Amounts recoverable includes potential payments from related purchased protection for instances where the Fund is the seller of protection. In addition, the Fund has no recourse provisions under the credit derivatives and holds no collateral which can offset or reduce potential payments under a triggering event. |
| |
| ** | | The reference asset security rating, as rated by any rating organization, are included in the equivalent Standard & Poor’s rating category. The reference asset rating represents the likelihood of a potential payment by the Fund if the reference asset experiences a credit event as of period end. |
Interest Rate Swap Contracts as of December 31, 2008 are as follows:
| | | | | | | | | | | | | | | | | | | | | | | | | |
| | | | | | | Notional | | | | | | | | | | | | | |
| | | | | | | Amount | | | Paid by | | | Received by | | | Termination | | | | |
| Reference Entity | | Swap Counterparty | | (000’s) | | | the Fund | | | the Fund | | | Date | | | Value | |
| |
| USD BBA LIBOR | | Deutsche Bank AG | | $ | 4,300 | | | Three-Month
USD BBA LIBOR | | | | 5.529 | % | | | 8/10/17 | | | $ | 1,133,699 | |
Abbreviation/Definition is as follows:
BBA LIBOR British Bankers’ Association London-Interbank Offered Rate
F11 | OPPENHEIMER BALANCED FUND/VA
STATEMENT OF INVESTMENTS Continued
Footnotes to Statement of Investments Continued
Total Return Swap Contracts as of December 31, 2008 are as follows:
| | | | | | | | | | | | | | | | | | | | | |
| | | Notional | | | | | | | | | | | | | |
| | | Amount | | | Paid by | | | Received by | | | Termination | | | | |
| Reference Entity/Swap Counterparty | | (000’s) | | | the Fund | | | the Fund | | | Date | | | Value | |
| |
Banc of America Securities LLC AAA 10 yr. | | | | | | | | | | | | | | | | | | | | |
CMBS Daily Index*: | | | | | | | | | | | | | | | | | | | | |
| Goldman Sachs Group, Inc. (The) | | $ | 16,370 | | | | A | | | | D | | | | 3/31/09 | | | $ | 3,526,234 | |
| Goldman Sachs Group, Inc. (The) | | | 12,980 | | | | A | | | | D | | | | 1/31/09 | | | | (3,083,724 | ) |
| | | | | | | | | | | | | | | | | | | | |
| | | | | | | | | | | | | | | Reference Entity Total | | | | 442,510 | |
| | | | | | | | | | | | | | | | | | | | | |
Barclays Capital U.S. CMBS AAA Index*: | | | | | | | | | | | | | | | | | | | | |
| Morgan Stanley | | | 3,200 | | | | A | | | | D | | | | 2/1/09 | | | | 350,027 | |
| Morgan Stanley | | | 6,100 | | | | A | | | | D | | | | 3/1/09 | | | | 668,445 | |
| | | | | | | | | | | | | | | | | | | | |
| | | | | | | | | | | | | | | Reference Entity Total | | | | 1,018,472 | |
| | | | | | | | | | | | | | | | | | | | | |
Barclays Capital U.S. CMBS AAA 8.5+ Index*: | | | | | | | | | | | | | | | | | | | | |
| Goldman Sachs Group, Inc. (The) | | | 1,100 | | | | A | | | | D | | | | 3/1/09 | | | | 187,820 | |
| Goldman Sachs Group, Inc. (The) | | | 1,440 | | | | A | | | | D | | | | 3/1/09 | | | | 245,291 | |
| Goldman Sachs Group, Inc. (The) | | | 1,880 | | | | A | | | | D | | | | 2/1/09 | | | | 321,002 | |
| Morgan Stanley | | | 1,070 | | | | A | | | | D | | | | 3/1/09 | | | | 182,450 | |
| Morgan Stanley | | | 2,900 | | | | A | | | | D | | | | 3/1/09 | | | | 490,858 | |
| Morgan Stanley | | | 180 | | | | A | | | | D | | | | 2/1/09 | | | | 30,305 | |
| Morgan Stanley | | | 1,530 | | | | A | | | | D | | | | 2/1/09 | | | | 260,367 | |
| Morgan Stanley | | | 1,590 | | | | A | | | | D | | | | 2/1/09 | | | | 271,828 | |
| Morgan Stanley | | | 900 | | | | A | | | | D | | | | 2/1/09 | | | | 152,655 | |
| | | | | | | | | | | | | | | | | | | | |
| | | | | | | | | | | | | | | Reference Entity Total | | | | 2,142,576 | |
| | | | | | | | | | | | | | | | | | | | |
| | | | | | | | | | | | | | | Total of Total Return Swaps | | | $ | 3,603,558 | |
| | | | | | | | | | | | | | | | | | | | |
| | |
| * | | The CMBS Indexes are representative indexes of segments of the commercial mortgage backed securities market. These indexes are measured by movements in the credit spreads of the underlying holdings. As the credit market perceives an improvement in the credit quality of an Index’s underlying holdings and reduced probability of default, the spread of an index narrows. As the credit market perceives a decrease in credit quality and an increased probability of default on an Index’s underlying holdings, the spread widens. |
Abbreviation is as follows:
CMBS Commercial Mortgage Backed Securities
A — The Fund makes periodic payments when credit spreads, as represented by the Reference Entity, widen.
B — The Fund makes periodic payments when credit spreads, as represented by the Reference Entity, narrow.
C — The Fund receives periodic payments when credit spreads, as represented by the Reference Enitiy, widen.
D — The Fund receives periodic payments when credit spreads, as represented by the Reference Enitiy, narrow.
F12 | OPPENHEIMER BALANCED FUND/VA
The following table aggregates, as of period end, the amount receivable from/(payable to) each counterparty with whom the Fund has entered into a swap agreement. Swaps are individually disclosed in the preceding tables.
Swap Summary as of December 31, 2008 is as follows:
| | | | | | | | | | | |
| | | | | Notional | | | | |
| | | Swap Type from | | Amount | | | | |
| Swap Counterparty | | Fund Perspective | | (000’s) | | | Value | |
| |
| Barclays Bank plc: | | | | | | | | | | |
| | | Credit Default Buy Protection | | $ | 570 | | | $ | 53,789 | |
| | | Credit Default Sell Protection | | | 6,927 | | | | (901,898 | ) |
| | | | | | | | | | |
| | | | | | | | | | (848,109 | ) |
| Credit Suisse International | | Credit Default Sell Protection | | | 5,635 | | | | (839,371 | ) |
| Deutsche Bank AG: | | | | | | | | | | |
| | | Credit Default Buy Protection | | | 5,157 | | | | 254,488 | |
| | | Credit Default Sell Protection | | | 8,545 | | | | (758,489 | ) |
| | | Interest Rate | | | 4,300 | | | | 1,133,699 | |
| | | | | | | | | | |
| | | | | | | | | | 629,698 | |
| Goldman Sachs Bank USA | | Credit Default Sell Protection | | | 2,670 | | | | (817,778 | ) |
| Goldman Sachs Group, Inc. (The) | | Total Return | | | 33,770 | | | | 1,196,623 | |
| Goldman Sachs International | | Credit Default Sell Protection | | | 655 | | | | (28,240 | ) |
| Morgan Stanley | | Total Return | | | 17,470 | | | | 2,406,935 | |
| Morgan Stanley Capital Services, Inc.: | | | | | | | | | | |
| | | Credit Default Buy Protection | | | 3,835 | | | | 652,248 | |
| | | Credit Default Sell Protection | | | 9,515 | | | | (2,887,635 | ) |
| | | | | | | | | | |
| | | | | | | | | | (2,235,387 | ) |
| | | | | | | | | | |
| | | | | Total Swaps | | $ | (535,629 | ) |
| | | | | | | | | | |
See accompanying Notes to Financial Statements.
F13 | OPPENHEIMER BALANCED FUND/VA
STATEMENT OF ASSETS AND LIABILITIES December 31, 2008
| | | | | |
Assets | | | | |
| Investments, at value—see accompanying statement of investments: | | | | |
| Unaffiliated companies (cost $339,753,513) | | $ | 277,160,259 | |
| Affiliated companies (cost $8,646,429) | | | 8,646,429 | |
| | | | |
| | | | 285,806,688 | |
| Cash | | | 583,454 | |
| Swaps, at value (upfront payment paid $483) | | | 8,949,733 | |
| Receivables and other assets: | | | | |
| Interest, dividends and principal paydowns | | | 1,202,325 | |
| Shares of beneficial interest sold | | | 222,975 | |
| Investments sold | | | 31,041 | |
| Terminated investment contracts | | | 20,836 | |
| Due from Manager | | | 48 | |
| Other | | | 12,554 | |
| | | | |
| Total assets | | | 296,829,654 | |
| | | | | |
Liabilities | | | | |
| Swaps, at value (upfront payment received $983,499) | | | 9,485,362 | |
| Payables and other liabilities: | | | | |
| Investments purchased (including $46,852,956 purchased on a when-issued or delayed delivery basis) | | | 48,157,988 | |
| Futures margins | | | 393,056 | |
| Shares of beneficial interest redeemed | | | 128,054 | |
| Terminated investment contracts | | | 126,740 | |
| Distribution and service plan fees | | | 44,085 | |
| Shareholder communications | | | 18,025 | |
| Trustees’ compensation | | | 6,798 | |
| Transfer and shareholder servicing agent fees | | | 1,720 | |
| Other | | | 48,553 | |
| | | | |
| Total liabilities | | | 58,410,381 | |
| | | | | |
Net Assets | | $ | 238,419,273 | |
| | | | |
| | | | | |
Composition of Net Assets | | | | |
| Par value of shares of beneficial interest | | $ | 28,279 | |
| Additional paid-in capital | | | 361,723,545 | |
| Accumulated net investment income | | | 657,969 | |
| Accumulated net realized loss on investments and foreign currency transactions | | | (62,802,368 | ) |
| Net unrealized depreciation on investments and translation of assets and liabilities denominated in foreign currencies | | | (61,188,152 | ) |
| | | | |
| | | | | |
Net Assets | | $ | 238,419,273 | |
| | | | |
| | | | | |
Net Asset Value Per Share | | | | |
| Non-Service Shares: | | | | |
| Net asset value, redemption price per share and offering price per share (based on net assets of $169,621,580 and 20,071,377 shares of beneficial interest outstanding) | | $ | 8.45 | |
| | | | | |
| Service Shares: | | | | |
| Net asset value, redemption price per share and offering price per share (based on net assets of $68,797,693 and 8,207,865 shares of beneficial interest outstanding) | | $ | 8.38 | |
See accompanying Notes to Financial Statements.
F14 | OPPENHEIMER BALANCED FUND/VA
STATEMENT OF OPERATIONS For the Year Ended December 31, 2008
| | | | | |
Investment Income | | | | |
| Interest | | $ | 11,890,092 | |
| Dividends: | | | | |
| Unaffiliated companies (net of foreign withholding taxes of $101,430) | | | 3,012,437 | |
| Affiliated companies | | | 172,114 | |
| Income from investment of securities lending cash collateral, net—affiliated companies | | | 96 | |
| | | | |
| Total investment income | | | 15,074,739 | |
| | | | | |
Expenses | | | | |
| Management fees | | | 2,905,296 | |
| Distribution and service plan fees—Service shares | | | 250,142 | |
| Transfer and shareholder servicing agent fees: | | | | |
| Non-Service shares | | | 9,994 | |
| Service shares | | | 9,994 | |
| Custodian fees and expenses | | | 17,253 | |
| Trustees’ compensation | | | 13,460 | |
| Other | | | 54,492 | |
| | | | |
| Total expenses | | | 3,260,631 | |
| Less waivers and reimbursements of expenses | | | (363,511 | ) |
| | | | |
| Net expenses | | | 2,897,120 | |
| | | | | |
Net Investment Income | | | 12,177,619 | |
| | | | | |
Realized and Unrealized Gain (Loss) | | | | |
| Net realized gain (loss) on: | | | | |
| Investments from unaffiliated companies | | | (46,686,226 | ) |
| Closing and expiration of futures contracts | | | (3,712,632 | ) |
| Foreign currency transactions | | | 1,865,139 | |
| Short positions | | | 311 | |
| Swap contracts | | | (36,620,419 | ) |
| | | | |
| Net realized loss | | | (85,153,827 | ) |
| Net change in unrealized appreciation (depreciation) on: | | | | |
| Investments | | | (122,673,038 | ) |
| Translation of assets and liabilities denominated in foreign currencies | | | (897,338 | ) |
| Futures contracts | | | 1,048,047 | |
| Short positions | | | 1,220 | |
| Swap contracts | | | 989,805 | |
| | | | |
| Net change in unrealized depreciation | | | (121,531,304 | ) |
| | | | | |
Net Decrease in Net Assets Resulting from Operations | | $ | (194,507,512 | ) |
| | | | |
See accompanying Notes to Financial Statements.
F15 | OPPENHEIMER BALANCED FUND/VA
STATEMENTS OF CHANGES IN NET ASSETS
| | | | | | | | | |
| Year Ended December 31, | | 2008 | | | 2007 | |
| |
Operations | | | | | | | | |
| Net investment income | | $ | 12,177,619 | | | $ | 13,368,547 | |
| Net realized gain (loss) | | | (85,153,827 | ) | | | 19,935,422 | |
| Net change in unrealized appreciation (depreciation) | | | (121,531,304 | ) | | | (13,245,008 | ) |
| | | |
| Net increase (decrease) in net assets resulting from operations | | | (194,507,512 | ) | | | 20,058,961 | |
| | | | | | | | | |
Dividends and/or Distributions to Shareholders | | | | | | | | |
| Dividends from net investment income: | | | | | | | | |
| Non-Service shares | | | (8,878,080 | ) | | | (10,919,746 | ) |
| Service shares | | | (2,607,795 | ) | | | (2,568,291 | ) |
| | | |
| | | | (11,485,875 | ) | | | (13,488,037 | ) |
| Distributions from net realized gain: | | | | | | | | |
| Non-Service shares | | | (21,412,945 | ) | | | (34,150,478 | ) |
| Service shares | | | (7,011,379 | ) | | | (8,836,795 | ) |
| | | |
| | | | (28,424,324 | ) | | | (42,987,273 | ) |
| | | | | | | | | |
Beneficial Interest Transactions | | | | | | | | |
| Net increase (decrease) in net assets resulting from beneficial interest transactions: | | | | | | | | |
| Non-Service shares | | | (42,030,701 | ) | | | (21,014,578 | ) |
| Service shares | | | 7,520,395 | | | | 17,776,612 | |
| | | |
| | | | (34,510,306 | ) | | | (3,237,966 | ) |
| | | | | | | | | |
Net Assets | | | | | | | | |
| Total decrease | | | (268,928,017 | ) | | | (39,654,315 | ) |
| Beginning of period | | | 507,347,290 | | | | 547,001,605 | |
| | | |
| End of period (including accumulated net investment income of $657,969 and $12,343,063, respectively) | | $ | 238,419,273 | | | $ | 507,347,290 | |
| | | |
See accompanying Notes to Financial Statements.
F16 | OPPENHEIMER BALANCED FUND/VA
FINANCIAL HIGHLIGHTS
| | | | | | | | | | | | | | | | | | | | | |
| Non-Service Shares Year Ended December 31, | | 2008 | | | 2007 | | | 2006 | | | 2005 | | | 2004 | |
| |
Per Share Operating Data | | | | | | | | | | | | | | | | | | | | |
| Net asset value, beginning of period | | $ | 16.41 | | | $ | 17.69 | | | $ | 17.07 | | | $ | 17.35 | | | $ | 15.92 | |
| Income (loss) from investment operations: | | | | | | | | | | | | | | | | | | | | |
Net investment income1 | | | .41 | | | | .43 | | | | .40 | | | | .33 | | | | .26 | |
| Net realized and unrealized gain (loss) | | | (7.03 | ) | | | .19 | | | | 1.38 | | | | .31 | | | | 1.33 | |
| | | |
| Total from investment operations | | | (6.62 | ) | | | .62 | | | | 1.78 | | | | .64 | | | | 1.59 | |
| Dividends and/or distributions to shareholders: | | | | | | | | | | | | | | | | | | | | |
| Dividends from net investment income | | | (.39 | ) | | | (.46 | ) | | | (.36 | ) | | | (.30 | ) | | | (.16 | ) |
| Distributions from net realized gain | | | (.95 | ) | | | (1.44 | ) | | | (.80 | ) | | | (.62 | ) | | | — | |
| | | |
| Total dividends and/or distributions to shareholders | (1.34 | ) | | | (1.90 | ) | | | (1.16 | ) | | | (.92 | ) | | | (.16 | ) |
| Net asset value, end of period | | $ | 8.45 | | | $ | 16.41 | | | $ | 17.69 | | | $ | 17.07 | | | $ | 17.35 | |
| | | |
Total Return, at Net Asset Value2 | | | (43.47 | )% | | | 3.79 | % | | | 11.15 | % | | | 3.89 | % | | | 10.10 | % |
| | | | | | | | | | | | | | | | | | | | | |
Ratios/Supplemental Data | | | | | | | | | | | | | | | | | | | | |
| Net assets, end of period (in thousands) | | $ | 169,621 | | | $ | 385,948 | | | $ | 435,639 | | | $ | 503,753 | | | $ | 547,290 | |
| Average net assets (in thousands) | | $ | 295,669 | | | $ | 418,103 | | | $ | 456,513 | | | $ | 522,754 | | | $ | 528,655 | |
Ratios to average net assets:3 | | | | | | | | | | | | | | | | | | | | |
| Net investment income | | | 3.14 | % | | | 2.55 | % | | | 2.42 | % | | | 1.98 | % | | | 1.59 | % |
| Total expenses | | | 0.76 | %4 | | | 0.75 | %4 | | | 0.75 | %4 | | | 0.74 | % | | | 0.74 | % |
| Expenses after payments, waivers and/or reimbursements and reduction to custodian expenses | | | 0.67 | % | | | 0.73 | % | | | 0.75 | % | | | 0.74 | % | | | 0.74 | % |
Portfolio turnover rate5 | | | 67 | % | | | 68 | % | | | 76 | % | | | 67 | % | | | 68 | % |
| | |
| 1. | | Per share amounts calculated based on the average shares outstanding during the period. |
| |
| 2. | | Assumes an investment on the business day before the first day of the fiscal period, with all dividends and distributions reinvested in additional shares on the reinvestment date, and redemption at the net asset value calculated on the last business day of the fiscal period. Total returns are not annualized for periods less than one full year. Total return information does not reflect expenses that apply at the separate account level or to related insurance products. Inclusion of these charges would reduce the total return figures for all periods shown. Returns do not reflect the deduction of taxes that a shareholder would pay on fund distributions or the redemption of fund shares. |
| |
| 3. | | Annualized for periods less than one full year. |
| |
| 4. | | Total expenses including indirect expenses from affiliated fund were as follows: |
| | | | | |
| Year Ended December 31, 2008 | | | 0.76 | % |
| Year Ended December 31, 2007 | | | 0.75 | % |
| Year Ended December 31, 2006 | | | 0.75 | % |
| | |
| 5. | | The portfolio turnover rate excludes purchase and sale transactions of To Be Announced (TBA) mortgage-related securities as follows: |
| | | | | | | | | |
| | | Purchase Transactions | | | Sale Transactions | |
| |
| Year Ended December 31, 2008 | | $ | 474,582,075 | | | $ | 434,587,487 | |
| Year Ended December 31, 2007 | | $ | 296,201,319 | | | $ | 315,527,720 | |
| Year Ended December 31, 2006 | | $ | 612,825,833 | | | $ | 666,549,894 | |
| Year Ended December 31, 2005 | | $ | 1,224,652,741 | | | $ | 1,250,455,539 | |
| Year Ended December 31, 2004 | | $ | 1,460,076,994 | | | $ | 1,473,590,963 | |
See accompanying Notes to Financial Statements.
F17 | OPPENHEIMER BALANCED FUND/VA
FINANCIAL HIGHLIGHTS Continued
| | | | | | | | | | | | | | | | | | | | | |
| Service Shares Year Ended December 31, | | 2008 | | | 2007 | | | 2006 | | | 2005 | | | 2004 | |
| |
Per Share Operating Data | | | | | | | | | | | | | | | | | | | | |
| Net asset value, beginning of period | | $ | 16.28 | | | $ | 17.57 | | | $ | 16.97 | | | $ | 17.26 | | | $ | 15.87 | |
| Income (loss) from investment operations: | | | | | | | | | | | | | | | | | | | | |
Net investment income1 | | | .37 | | | | .38 | | | | .36 | | | | .29 | | | | .23 | |
| Net realized and unrealized gain (loss) | | | (6.97 | ) | | | .19 | | | | 1.37 | | | | .31 | | | | 1.31 | |
| | | |
| Total from investment operations | | | (6.60 | ) | | | .57 | | | | 1.73 | | | | .60 | | | | 1.54 | |
| Dividends and/or distributions to shareholders: | | | | | | | | | | | | | | | | | | | | |
| Dividends from net investment income | | | (.35 | ) | | | (.42 | ) | | | (.33 | ) | | | (.27 | ) | | | (.15 | ) |
| Distributions from net realized gain | | | (.95 | ) | | | (1.44 | ) | | | (.80 | ) | | | (.62 | ) | | | — | |
| | | |
| Total dividends and/or distributions to shareholders | (1.30 | ) | | | (1.86 | ) | | | (1.13 | ) | | | (.89 | ) | | | (.15 | ) |
| Net asset value, end of period | | $ | 8.38 | | | $ | 16.28 | | | $ | 17.57 | | | $ | 16.97 | | | $ | 17.26 | |
| | | |
| | | | | | | | | | | | | | | | | | | | | |
Total Return, at Net Asset Value2 | | | (43.62 | )% | | | 3.49 | % | | | 10.86 | % | | | 3.67 | % | | | 9.79 | % |
| | | | | | | | | | | | | | | | | | | | | |
Ratios/Supplemental Data | | | | | | | | | | | | | | | | | | | | |
| Net assets, end of period (in thousands) | | $ | 68,798 | | | $ | 121,399 | | | $ | 111,363 | | | $ | 88,156 | | | $ | 59,650 | |
| Average net assets (in thousands) | | $ | 100,164 | | | $ | 117,012 | | | $ | 100,010 | | | $ | 72,977 | | | $ | 39,851 | |
Ratios to average net assets:3 | | | | | | | | | | | | | | | | | | | | |
| Net investment income | | | 2.90 | % | | | 2.30 | % | | | 2.17 | % | | | 1.74 | % | | | 1.41 | % |
| Total expenses | | | 1.01 | %4 | | | 1.00 | %4 | | | 1.01 | %4 | | | 1.00 | % | | | 1.02 | % |
| Expenses after payments, waivers and/or reimbursements and reduction to custodian expenses | | | 0.92 | % | | | 0.98 | % | | | 1.01 | % | | | 1.00 | % | | | 1.02 | % |
Portfolio turnover rate5 | | | 67 | % | | | 68 | % | | | 76 | % | | | 67 | % | | | 68 | % |
| | |
| 1. | | Per share amounts calculated based on the average shares outstanding during the period. |
| |
| 2. | | Assumes an investment on the business day before the first day of the fiscal period, with all dividends and distributions reinvested in additional shares on the reinvestment date, and redemption at the net asset value calculated on the last business day of the fiscal period. Total returns are not annualized for periods less than one full year. Total return information does not reflect expenses that apply at the separate account level or to related insurance products. Inclusion of these charges would reduce the total return figures for all periods shown. Returns do not reflect the deduction of taxes that a shareholder would pay on fund distributions or the redemption of fund shares. |
| |
| 3. | | Annualized for periods less than one full year. |
| |
| 4. | | Total expenses including indirect expenses from affiliated fund were as follows: |
| | | | | |
| Year Ended December 31, 2008 | | | 1.01 | % |
| Year Ended December 31, 2007 | | | 1.00 | % |
| Year Ended December 31, 2006 | | | 1.01 | % |
| | |
| 5. | | The portfolio turnover rate excludes purchase and sale transactions of To Be Announced (TBA) mortgage-related securities as follows: |
| | | | | | | | | |
| | | Purchase Transactions | | | Sale Transactions | |
| |
| Year Ended December 31, 2008 | | $ | 474,582,075 | | | $ | 434,587,487 | |
| Year Ended December 31, 2007 | | $ | 296,201,319 | | | $ | 315,527,720 | |
| Year Ended December 31, 2006 | | $ | 612,825,833 | | | $ | 666,549,894 | |
| Year Ended December 31, 2005 | | $ | 1,224,652,741 | | | $ | 1,250,455,539 | |
| Year Ended December 31, 2004 | | $ | 1,460,076,994 | | | $ | 1,473,590,963 | |
See accompanying Notes to Financial Statements.
F18 | OPPENHEIMER BALANCED FUND/VA
NOTES TO FINANCIAL STATEMENTS
1. Significant Accounting Policies
Oppenheimer Balanced Fund/VA (the “Fund”), is a separate series of Oppenheimer Variable Account Funds, an open end management investment company registered under the Investment Company Act of 1940, as amended. The Fund’s investment objective is to seek a high total investment return, which includes current income and capital appreciation in the value of its shares. The Fund’s investment adviser is OppenheimerFunds, Inc. (the “Manager”).
The Fund offers two classes of shares. Both classes are sold at their offering price, which is the net asset value per share, to separate investment accounts of participating insurance companies as an underlying investment for variable life insurance policies, variable annuity contracts or other investment products. The class of shares designated as Service shares is subject to a distribution and service plan. Both classes of shares have identical rights and voting privileges with respect to the Fund in general and exclusive voting rights on matters that affect that class alone. Earnings, net assets and net asset value per share may differ due to each class having its own expenses, such as transfer and shareholder servicing agent fees and shareholder communications, directly attributable to that class.
The following is a summary of significant accounting policies consistently followed by the Fund.
Securities Valuation. The Fund calculates the net asset value of its shares as of the close of the New York Stock Exchange (the “Exchange”), normally 4:00 P.M. Eastern time, on each day the Exchange is open for trading.
Effective for fiscal periods beginning after November 15, 2007, FASB Statement of Financial Accounting Standards No. 157, Fair Value Measurements, establishes a hierarchy for measuring fair value of assets and liabilities. As required by the standard, each investment asset or liability of the Fund is assigned a level at measurement date based on the significance and source of the inputs to its valuation. Quoted prices in active markets for identical securities are classified as “Level 1”, inputs other than quoted prices for an asset that are observable are classified as “Level 2” and unobservable inputs, including the Manager’s judgment about the assumptions that a market participant would use in pricing an asset or liability are classified as “Level 3”. The inputs used for valuing securities are not necessarily an indication of the risks associated with investing in those securities. A table summarizing the Fund’s investments under these levels of classification is included following the Statement of Investments.
Securities are valued using quoted market prices, when available, as supplied primarily either by portfolio pricing services approved by the Board of Trustees or dealers. These securities are typically classified within Level 1 or 2; however, they may be designated as Level 3 if the dealer or portfolio pricing service values a security through an internal model with significant unobservable market data inputs.
Securities traded on a registered U.S. securities exchange are valued based on the last sale price of the security reported on the principal exchange on which traded, prior to the time when the Fund’s assets are valued. Securities whose principal exchange is NASDAQ® are valued based on the official closing prices reported by NASDAQ prior to the time when the Fund’s assets are valued. In the absence of a sale, the security is valued at the last sale price on the prior trading day, if it is within the spread of the current day’s closing “bid” and “asked” prices, and if not, at the current day’s closing bid price. A foreign security traded on a foreign exchange is valued based on the last sale price on the principal exchange on which the security is traded, as identified by the portfolio pricing service used by the Manager, prior to the time when the Fund’s assets are valued. In the absence of a sale, the security is valued at the most recent official closing price on the principal exchange on which it is traded.
Shares of a registered investment company that are not traded on an exchange are valued at that investment company’s net asset value per share.
Corporate, government and municipal debt instruments having a remaining maturity in excess of sixty days and all mortgage-backed securities, collateralized mortgage obligations and other asset-backed securities are valued at the mean between the “bid” and “asked” prices.
“Money market-type” debt instruments with remaining maturities of sixty days or less are valued at cost adjusted by the amortization of discount or premium to maturity (amortized cost), which approximates market value. These securities are typically designated as Level 2.
F19 | OPPENHEIMER BALANCED FUND/VA
NOTES TO FINANCIAL STATEMENTS Continued
1. Significant Accounting Policies Continued
In the absence of a readily available quoted market price, including for securities whose values have been materially affected by what the Manager identifies as a significant event occurring before the Fund’s assets are valued but after the close of the securities’ respective exchanges, the Manager, acting through its internal valuation committee, in good faith determines the fair valuation of that asset using consistently applied procedures under the supervision of the Board of Trustees (which reviews those fair valuations by the Manager). Those procedures include certain standardized methodologies to fair value securities. Such methodologies include, but are not limited to, pricing securities initially at cost and subsequently adjusting the value based on: changes in company specific fundamentals, changes in an appropriate securities index, or changes in the value of similar securities which may be adjusted for any discounts related to resale restrictions. When possible, such methodologies use observable market inputs such as quoted prices of similar securities, observable interest rates, currency rates and yield curves. The methodologies used for valuing securities are not necessarily an indication of the risks associated with investing in those securities.
Fair valued securities may be classified as “Level 3” if the valuation primarily reflects the Manager’s own assumptions about the inputs that market participants would use in valuing such securities.
There have been no significant changes to the fair valuation methodologies during the period.
Securities on a When-Issued or Delayed Delivery Basis. The Fund may purchase securities on a “when-issued” basis, and may purchase or sell securities on a “delayed delivery” basis. “When-issued” or “delayed delivery” refers to securities whose terms and indenture are available and for which a market exists, but which are not available for immediate delivery. Delivery and payment for securities that have been purchased by the Fund on a when-issued basis normally takes place within six months and possibly as long as two years or more after the trade date. During this period, such securities do not earn interest, are subject to market fluctuation and may increase or decrease in value prior to their delivery. The purchase of securities on a when-issued basis may increase the volatility of the Fund’s net asset value to the extent the Fund executes such transactions while remaining substantially fully invested. When the Fund engages in when-issued or delayed delivery transactions, it relies on the buyer or seller, as the case may be, to complete the transaction. Their failure to do so may cause the Fund to lose the opportunity to obtain or dispose of the security at a price and yield it considers advantageous. The Fund maintains internally designated assets with a market value equal to or greater than the amount of its purchase commitments. The Fund may also sell securities that it purchased on a when-issued basis or forward commitment prior to settlement of the original purchase.
As of December 31, 2008, the Fund had purchased securities issued on a when-issued or delayed delivery basis and sold securities issued on a delayed delivery basis as follows:
| | | | | |
| | | When-Issued or Delayed Delivery | |
| | | Basis Transactions | |
| |
| Purchased securities | | $ | 46,852,956 | |
The Fund may enter into “forward roll” transactions with respect to mortgage-related securities. In this type of transaction, the Fund sells a mortgage-related security to a buyer and simultaneously agrees to repurchase a similar security (same type, coupon and maturity) at a later date at a set price. During the period between the sale and the repurchase, the Fund will not be entitled to receive interest and principal payments on the securities that have been sold. The Fund records the incremental difference between the forward purchase and sale of each forward roll as realized gain (loss) on investments or as fee income in the case of such transactions that have an associated fee in lieu of a difference in the forward purchase and sale price.
Risks of entering into forward roll transactions include the potential inability of the counterparty to meet the terms of the agreement; the potential of the Fund to receive inferior securities at redelivery as compared to the securities sold to the counterparty; counterparty credit risk. To assure its future payment of the purchase price, the Fund maintains internally designated assets with a market value equal to or greater than the payment obligation under the roll.
F20 | OPPENHEIMER BALANCED FUND/VA
Securities Sold Short. The Fund may short sell when-issued securities for future settlement. The value of the open short position is recorded as a liability, and the Fund records an unrealized gain or loss for the change in value of the open short position. The Fund records a realized gain or loss when the short position is closed out.
As of December 31, 2008, the Fund had no securities sold short.
Credit Risk. The Fund invests in high-yield, non-investment-grade bonds, which may be subject to a greater degree of credit risk. Credit risk relates to the ability of the issuer to meet interest or principal payments or both as they become due. The Fund may acquire securities in default, and is not obligated to dispose of securities whose issuers subsequently default. As of December 31, 2008, securities with an aggregate market value of $286,441, representing 0.12% of the Fund’s net assets, were in default.
Foreign Currency Translation. The Fund’s accounting records are maintained in U.S. dollars. The values of securities denominated in foreign currencies and amounts related to the purchase and sale of foreign securities and foreign investment income are translated into U.S. dollars as of the close of the Exchange, normally 4:00 P.M. Eastern time, on each day the Exchange is open for trading. Foreign exchange rates may be valued primarily using a reliable bank, dealer or service authorized by the Board of Trustees.
Reported net realized gains and losses from foreign currency transactions arise from sales of portfolio securities, sales and maturities of short-term securities, sales of foreign currencies, exchange rate fluctuations between the trade and settlement dates on securities transactions, and the difference between the amounts of dividends, interest, and foreign withholding taxes recorded on the Fund’s books and the U.S. dollar equivalent of the amounts actually received or paid. Net unrealized appreciation and depreciation on the translation of assets and liabilities denominated in foreign currencies arise from changes in the values of assets and liabilities, including investments in securities at fiscal period end, resulting from changes in exchange rates.
The effect of changes in foreign currency exchange rates on investments is separately identified from the fluctuations arising from changes in market values of securities held and reported with all other foreign currency gains and losses in the Fund’s Statement of Operations.
Investment in Oppenheimer Institutional Money Market Fund. The Fund is permitted to invest daily available cash balances in an affiliated money market fund. The Fund may invest the available cash in Class E shares of Oppenheimer Institutional Money Market Fund (“IMMF”) to seek current income while preserving liquidity. IMMF is a registered open-end management investment company, regulated as a money market fund under the Investment Company Act of 1940, as amended. The Manager is also the investment adviser of IMMF. The Fund’s investment in IMMF is included in the Statement of Investments. As a shareholder, the Fund is subject to its proportional share of IMMF’s Class E expenses, including its management fee. The Manager will waive fees and/or reimburse Fund expenses in an amount equal to the indirect management fees incurred through the Fund’s investment in IMMF.
Investments in OFI Liquid Assets Fund, LLC. The Fund is permitted to invest cash collateral received in connection with its securities lending activities. Pursuant to the Fund’s Securities Lending Procedures, the Fund may invest cash collateral in, among other investments, an affiliated money market fund. OFI Liquid Assets Fund, LLC (“LAF”) is a limited liability company whose investment objective is to seek current income and stability of principal. The Manager is also the investment adviser of LAF. LAF is not registered under the Investment Company Act of 1940. However, LAF does comply with the investment restrictions applicable to registered money market funds set forth in Rule 2a-7 adopted under the Investment Company Act. The Fund’s investment in LAF is included in the Statement of Investments. As a shareholder, the Fund is subject to its proportional share of LAF’s expenses, including its management fee of 0.08%.
Investments With Off-Balance Sheet Market Risk. The Fund enters into financial instrument transactions (such as swaps, futures, options and other derivatives) that may have off-balance sheet market risk. Off-balance sheet market risk exists when the maximum potential loss on a particular financial instrument is greater than the value of such financial instrument, as reflected in the Fund’s Statement of Assets and Liabilities.
F21 | OPPENHEIMER BALANCED FUND/VA
NOTES TO FINANCIAL STATEMENTS Continued
1. Significant Accounting Policies Continued
Allocation of Income, Expenses, Gains and Losses. Income, expenses (other than those attributable to a specific class), gains and losses are allocated on a daily basis to each class of shares based upon the relative proportion of net assets represented by such class. Operating expenses directly attributable to a specific class are charged against the operations of that class.
Federal Taxes. The Fund intends to comply with provisions of the Internal Revenue Code applicable to regulated investment companies and to distribute substantially all of its investment company taxable income, including any net realized gain on investments not offset by capital loss carryforwards, if any, to shareholders. Therefore, no federal income or excise tax provision is required. The Fund files income tax returns in U.S. federal and applicable state jurisdictions. The statute of limitations on the Fund’s tax return filings generally remain open for the three preceding fiscal reporting period ends. The tax components of capital shown in the following table represent distribution requirements the Fund must satisfy under the income tax regulations, losses the Fund may be able to offset against income and gains realized in future years and unrealized appreciation or depreciation of securities and other investments for federal income tax purposes.
| | | | | | | | | | �� | | | |
| | | | | | | | | | | Net Unrealized | |
| | | | | | | | | | | Depreciation | |
| | | | | | | | | | | Based on Cost of | |
| | | | | | | | | | | Securities and | |
| Undistributed | | Undistributed | | | Accumulated | | | Other Investments | |
| Net Investment | | Long-Term | | | Loss | | | for Federal Income | |
| Income | | Gain | | | Carryforward1,2,3,4,5,6 | | | Tax Purposes | |
| |
| $— | | $ | — | | | $ | 60,472,103 | | | $ | 62,853,657 | |
| | |
| 1. | | As of December 31, 2008, the Fund had $44,402,106 of net capital loss carryforwards available to offset future realized capital gains, if any, and thereby reduce future taxable gain distributions. As of December 31, 2008, details of the capital loss carryforward were as follows: |
| | | | | |
| Expiring | | | | |
| |
| 2016 | | $ | 44,402,106 | |
| | |
| 2. | | As of December 31, 2008, the Fund had $15,792,384 of post-October losses available to offset future realized capital gains, if any. Such losses, if unutilized, will expire in 2017. |
| |
| 3. | | The Fund had $526 of post-October foreign currency losses which were deferred. |
| |
| 4. | | The Fund had $277,087 of straddle losses which were deferred. |
| |
| 5. | | During the fiscal year ended December 31, 2008, the Fund did not utilize any capital loss carryforward. |
| |
| 6. | | During the fiscal year ended December 31, 2007, the Fund did not utilize any capital loss carryforward. |
Net investment income (loss) and net realized gain (loss) may differ for financial statement and tax purposes. The character of dividends and distributions made during the fiscal year from net investment income or net realized gains may differ from their ultimate characterization for federal income tax purposes. Also, due to timing of dividends and distributions, the fiscal year in which amounts are distributed may differ from the fiscal year in which the income or net realized gain was recorded by the Fund.
Accordingly, the following amounts have been reclassified for December 31, 2008. Net assets of the Fund were unaffected by the reclassifications.
| | | | | | | | | |
| | | Reduction | | | Reduction | |
| | | to Accumulated | | | to Accumulated Net | |
| Reduction | | Net Investment | | | Realized Loss | |
| to Paid-in Capital | | Income | | | on Investments | |
| |
| $20,496,805 | | $ | 12,376,838 | | | $ | 32,873,643 | |
The tax character of distributions paid during the years ended December 31, 2008 and December 31, 2007 was as follows:
| | | | | | | | | |
| | | Year Ended | | | Year Ended | |
| | | December 31, 2008 | | | December 31, 2007 | |
| |
| Distributions paid from: | | | | | | | | |
| Ordinary income | | $ | 16,601,502 | | | $ | 14,806,317 | |
| Long-term capital gain | | | 23,308,697 | | | | 41,668,993 | |
| | | |
| Total | | $ | 39,910,199 | | | $ | 56,475,310 | |
| | | |
F22 | OPPENHEIMER BALANCED FUND/VA
The aggregate cost of securities and other investments and the composition of unrealized appreciation and depreciation of securities and other investments for federal income tax purposes as of December 31, 2008 are noted in the following table. The primary difference between book and tax appreciation or depreciation of securities and other investments, if applicable, is attributable to the tax deferral of losses or tax realization of financial statement unrealized gain or loss.
| | | | | |
| Federal tax cost of securities | | $ | 349,782,510 | |
| Federal tax cost of other investments | | | (17,064,917 | ) |
| | | | |
| Total federal tax cost | | $ | 332,717,593 | |
| | | | |
| | | | | |
| Gross unrealized appreciation | | $ | 29,038,573 | |
| Gross unrealized depreciation | | | (91,892,230 | ) |
| | | | |
| Net unrealized depreciation | | $ | (62,853,657 | ) |
| | | | |
Trustees’ Compensation. The Board of Trustees has adopted a compensation deferral plan for independent trustees that enables trustees to elect to defer receipt of all or a portion of the annual compensation they are entitled to receive from the Fund. For purposes of determining the amount owed to the Trustee under the plan, deferred amounts are treated as though equal dollar amounts had been invested in shares of the Fund or in other Oppenheimer funds selected by the Trustee. The Fund purchases shares of the funds selected for deferral by the Trustee in amounts equal to his or her deemed investment, resulting in a Fund asset equal to the deferred compensation liability. Such assets are included as a component of “Other” within the asset section of the Statement of Assets and Liabilities. Deferral of trustees’ fees under the plan will not affect the net assets of the Fund, and will not materially affect the Fund’s assets, liabilities or net investment income per share. Amounts will be deferred until distributed in accordance to the compensation deferral plan.
Dividends and Distributions to Shareholders. Dividends and distributions to shareholders, which are determined in accordance with income tax regulations and may differ from U.S. generally accepted accounting principles, are recorded on the ex-dividend date. Income and capital gain distributions, if any, are declared and paid annually or at other times as deemed necessary by the Manager.
Investment Income. Dividend income is recorded on the ex-dividend date or upon ex-dividend notification in the case of certain foreign dividends where the ex-dividend date may have passed. Non-cash dividends included in dividend income, if any, are recorded at the fair market value of the securities received. Interest income is recognized on an accrual basis. Discount and premium, which are included in interest income on the Statement of Operations, are amortized or accreted daily.
Custodian Fees. “Custodian fees and expenses” in the Statement of Operations may include interest expense incurred by the Fund on any cash overdrafts of its custodian account during the period. Such cash overdrafts may result from the effects of failed trades in portfolio securities and from cash outflows resulting from unanticipated shareholder redemption activity. The Fund pays interest to its custodian on such cash overdrafts, to the extent they are not offset by positive cash balances maintained by the Fund, at a rate equal to the Federal Funds Rate plus 0.50%. The “Reduction to custodian expenses” line item, if applicable, represents earnings on cash balances maintained by the Fund during the period. Such interest expense and other custodian fees may be paid with these earnings.
Security Transactions. Security transactions are recorded on the trade date. Realized gains and losses on securities sold are determined on the basis of identified cost.
Indemnifications. The Fund’s organizational documents provide current and former trustees and officers with a limited indemnification against liabilities arising in connection with the performance of their duties to the Fund. In the normal course of business, the Fund may also enter into contracts that provide general indemnifications. The Fund’s maximum exposure under these arrangements is unknown as this would be dependent on future claims that may be made against the Fund. The risk of material loss from such claims is considered remote.
F23 | OPPENHEIMER BALANCED FUND/VA
NOTES TO FINANCIAL STATEMENTS Continued
1. Significant Accounting Policies Continued
Other. The preparation of financial statements in conformity with accounting principles generally accepted in the United States of America requires management to make estimates and assumptions that affect the reported amounts of assets and liabilities and disclosure of contingent assets and liabilities at the date of the financial statements and the reported amounts of increases and decreases in net assets from operations during the reporting period. Actual results could differ from those estimates.
2. Shares of Beneficial Interest
The Fund has authorized an unlimited number of $0.001 par value shares of beneficial interest of each class. Transactions in shares of beneficial interest were as follows:
| | | | | | | | | | | | | | | | | |
| | | Year Ended December 31, 2008 | | | Year Ended December 31, 2007 | |
| | | Shares | | | Amount | | | Shares | | | Amount | |
| |
Non-Service Shares | | | | | | | | | | | | | | | | |
| Sold | | | 908,475 | | | $ | 11,841,885 | | | | 999,612 | | | $ | 16,748,816 | |
| Dividends and/or distributions reinvested | | | 2,214,256 | | | | 30,291,025 | | | | 2,818,651 | | | | 45,070,224 | |
| Redeemed | | | (6,571,367 | ) | | | (84,163,611 | ) | | | (4,921,045 | ) | | | (82,833,618 | ) |
| | | |
| Net decrease | | | (3,448,636 | ) | | $ | (42,030,701 | ) | | | (1,102,782 | ) | | $ | (21,014,578 | ) |
| | | |
| | | | | | | | | | | | | | | | | |
Service Shares | | | | | | | | | | | | | | | | |
| Sold | | | 1,716,888 | | | $ | 19,475,736 | | | | 1,507,547 | | | $ | 25,038,747 | |
| Dividends and/or distributions reinvested | | | 707,292 | | | | 9,619,174 | | | | 717,301 | | | | 11,405,086 | |
| Redeemed | | | (1,673,753 | ) | | | (21,574,515 | ) | | | (1,107,184 | ) | | | (18,667,221 | ) |
| | | |
| Net increase | | | 750,427 | | | $ | 7,520,395 | | | | 1,117,664 | | | $ | 17,776,612 | |
| | | |
3. Purchases and Sales of Securities
The aggregate cost of purchases and proceeds from sales of securities, other than short-term obligations and investments in Oppenheimer Institutional Money Market Fund and OFI Liquid Assets Fund, LCC, for the year ended December 31, 2008, were as follows:
| | | | | | | | | |
| | | Purchases | | | Sales | |
| |
| Investment securities | | $ | 234,240,565 | | | $ | 310,538,658 | |
| U.S. government and government agency obligations | | | — | | | | 1,031,793 | |
| To Be Announced (TBA) mortgage-related securities | | | 474,582,075 | | | | 434,587,487 | |
4. Fees and Other Transactions with Affiliates
Management Fees. Under the investment advisory agreement, the Fund pays the Manager a management fee based on the daily net assets of the Fund at an annual rate as shown in the following table:
| | | | | |
| Fee Schedule | | | | |
| |
| Up to $200 million | | | 0.75 | % |
| Next $200 million | | | 0.72 | |
| Next $200 million | | | 0.69 | |
| Next $200 million | | | 0.66 | |
| Over $800 million | | | 0.60 | |
F24 | OPPENHEIMER BALANCED FUND/VA
Transfer Agent Fees. OppenheimerFunds Services (“OFS”), a division of the Manager, acts as the transfer and shareholder servicing agent for the Fund. The Fund pays OFS a per account fee. For the year ended December 31, 2008, the Fund paid $20,022 to OFS for services to the Fund.
Additionally, funds offered in variable annuity separate accounts are subject to minimum fees of $10,000 per class, for class level assets of $10 million or more. Each class is subject to the minimum fee in the event that the per account fee does not equal or exceed the applicable minimum fee.
Distribution and Service Plan for Service Shares. The Fund has adopted a Distribution and Service Plan (the “Plan”) in accordance with Rule 12b-1 under the Investment Company Act of 1940 for Service shares to pay OppenheimerFunds Distributor, Inc. (the “Distributor”), for distribution related services, personal service and account maintenance for the Fund’s Service shares. Under the Plan, payments are made periodically at an annual rate of up to 0.25% of the average annual net
4. Fees and Other Transactions with Affiliates Continued
assets of Service shares of the Fund. The Distributor currently uses all of those fees to compensate sponsor(s) of the insurance product that offers Fund shares, for providing personal service and maintenance of accounts of their variable contract owners that hold Service shares. These fees are paid out of the Fund’s assets on an on-going basis and increase operating expenses of the Service shares, which results in lower performance compared to the Fund’s shares that are not subject to a service fee. Fees incurred by the Fund under the Plan are detailed in the Statement of Operations.
Waivers and Reimbursements of Expenses. Effective September 1, 2007, the Manager voluntarily agreed to waive a portion of the advisory fee and/or reimburse certain expenses so the “Expenses after payments, waivers and/or reimbursements and reduction to custodian expenses” will not exceed 0.67% of average net assets for Non-Service shares and 0.92% of average annual net assets for Service shares. During the year ended December 31, 2008, OFS waived $263,110 and $95,094 for Non-Service and Service shares, respectively. This voluntary waiver and/or reimbursement may be withdrawn at any time.
OFS has voluntarily agreed to limit transfer and shareholder servicing agent fees for all classes to 0.35% of average annual net assets per class. This undertaking may be amended or withdrawn at any time.
The Manager will waive fees and/or reimburse Fund expenses in an amount equal to the indirect management fees incurred through the Fund’s investment in IMMF. During the year ended December 31, 2008, the Manager waived $5,307 for IMMF management fees.
5. Foreign Currency Exchange Contracts
The Fund may enter into foreign currency exchange contracts (“forward contracts”) for the purchase or sale of a foreign currency at a negotiated rate at a future date.
Forward contracts are reported on a schedule following the Statement of Investments. Forward contracts will be valued daily based upon the closing prices of the forward currency rates determined at the close of the Exchange as provided by a bank, dealer or pricing service. The resulting unrealized appreciation (depreciation) is reported in the Statement of Assets and Liabilities as a receivable or payable and in the Statement of Operations within the change in unrealized appreciation (depreciation). At contract close, the difference between the original cost of the contract and the value at the close date is recorded as a realized gain (loss) in the Statement of Operations.
Risks to the Fund include both market and credit risk. Market risk is the risk that the value of the forward contract will depreciate due to unfavorable changes in the exchange rates. Credit risk arises from the possibility that the counterparty will default. If the counterparty defaults, the Fund’s loss will consist of the net amount of contractual payments that the Fund has not yet received.
As of December 31, 2008, the Fund had no outstanding forward contracts.
F25 | OPPENHEIMER BALANCED FUND/VA
NOTES TO FINANCIAL STATEMENTS Continued
6. Futures Contracts
A futures contract is a commitment to buy or sell a specific amount of a financial instrument at a negotiated price on a stipulated future date. The Fund may buy and sell futures contracts and may also buy or write put or call options on these futures contracts.
Futures contracts traded on a commodities or futures exchange will be valued at the final settlement price or official closing price on the principal exchange as reported by such principal exchange at its trading session ending at, or most recently prior to, the time when the Fund’s assets are valued.
Upon entering into a futures contract, the Fund is required to deposit either cash or securities (initial margin) in an amount equal to a certain percentage of the contract value. Subsequent payments (variation margin) are made or received by the Fund each day. The variation margin payments are equal to the daily changes in the contract value and are recorded as unrealized gains and losses.
Futures contracts are reported on a schedule following the Statement of Investments. Securities held in collateralized accounts to cover initial margin requirements on open futures contracts are noted in the Statement of Investments. Cash held by the broker to cover initial margin requirements on open futures contracts and the receivable and/or payable for the daily mark to market for the variation margin are noted in the Statement of Assets and Liabilities. The net change in unrealized appreciation and depreciation is reported in the Statement of Operations. Realized gains (losses) are reported in the Statement of Operations at the closing or expiration of futures contracts.
Risks of entering into futures contracts (and related options) include the possibility that there may be an illiquid market where the Fund is unable to liquidate the contract or enter into an offsetting position and, if used for hedging purposes, the risk that the price of the contract will correlate imperfectly with the prices of the Fund’s securities.
7. Swap Contracts
The Fund may enter into privately negotiated agreements with a counterparty to exchange or “swap” payments at specified future intervals based on the return of an asset (such as a stock, bond or currency) or non-asset reference (such as an interest rate or index). The swap agreement will specify the “notional” amount of the asset or non-asset reference to which the contract relates. As derivative contracts, swaps typically do not have an associated cost at contract inception. At initiation, contract terms are typically set at market value such that the value of the swap is $0. If a counterparty specifies terms that would result in the contract having a value other than $0 at initiation, one counterparty will pay the other an upfront payment to equalize the contract. Subsequent changes in market value are calculated based upon changes in the performance of the asset or non-asset reference multiplied by the notional value of the contract. Contract types may include credit default, interest rate, total return, and currency swaps.
Swaps are marked to market daily using quotations primarily from pricing services, counterparties or brokers. Swap contracts are reported on a schedule following the Statement of Investments. The value of the contracts is separately disclosed on the Statement of Assets and Liabilities. The unrealized appreciation (depreciation) is comprised of the change in the valuation of the swap combined with the accrued interest due to (owed by) the Fund at termination or settlement. The net change in this amount during the period is included on the Statement of Operations. Any payment received or paid to initiate a contract is recorded as a cost of the swap in the Statement of Assets and Liabilities and as a component of unrealized gain or loss on the Statement of Operations until contract termination; upon contract termination, this amount is recorded as realized gain or loss on the Statement of Operations. Excluding amounts paid at contract initiation as described above, the Fund also records any periodic payments received from (paid to) the counterparty, including at termination, as realized gain (loss) on the Statement of Operations.
Risks of entering into swap contracts include credit, market and liquidity risk. Credit risk arises from the possibility that the counterparty fails to make a payment when due or otherwise defaults under the terms of the contract. If the counterparty defaults, the Fund’s loss will consist of the net amount of contractual payments that the Fund has not yet received. Market risk is the risk that the value of the contract will depreciate due to unfavorable changes in the performance of the asset or non-asset reference. Liquidity risk is the risk that the Fund may be unable to close the contract prior to its termination.
F26 | OPPENHEIMER BALANCED FUND/VA
Credit Default Swap Contracts. A credit default swap is a bilateral contract that enables an investor to buy or sell protection on a debt security against a defined-issuer credit event, such as the issuer’s failure to make timely payments of interest or principal on the debt security, bankruptcy or restructuring. The Fund may enter into credit default swaps either by buying or selling protection on a single security or a basket of securities (the “reference asset”).
The buyer of protection pays a periodic fee to the seller of protection based on the notional amount of debt securities underlying the swap contract. The seller of protection agrees to compensate the buyer of protection for future potential losses as a result of a credit event on the reference asset. The contract effectively transfers the credit event risk of the reference asset from the buyer of protection to the seller of protection.
The ongoing value of the contract will fluctuate throughout the term of the contract based primarily on the credit risk of the reference asset. If the credit quality of the reference asset improves relative to the credit quality at contract initiation, the buyer of protection may have an unrealized loss greater than the anticipated periodic fee owed. This unrealized loss would be the result of current credit protection being cheaper than the cost of credit protection at contract initiation. If the buyer elects to terminate the contract prior to its maturity, and there has been no credit event, this unrealized loss will become realized. If the contract is held to maturity, and there has been no credit event, the realized loss will be equal to the periodic fee paid over the life of the contract.
If there is a credit event, the buyer of protection can exercise its rights under the contract and receive a payment from the seller of protection equal to the notional amount of the reference asset less the market value of the reference asset. Upon exercise of the contract the difference between the value of the underlying reference asset and the notional amount is recorded as realized gain (loss) and is included on the Statement of Operations.
Risks of credit default swaps include credit, market and liquidity risk. Additional risks include but are not limited to: the cost of paying for credit protection if there are no credit events or the cost of selling protection when a credit event occurs (paying the notional amount to the protection buyer); and pricing transparency when assessing the value of a credit default swap.
As of the period end, the Fund has sold credit protection through credit default swaps to gain exposure to the credit risk of individual securities and/or indexes that are either unavailable or considered to be less attractively priced in the bond market. The Fund has also engaged in pairs trades by purchasing protection through a credit default swap referenced to the debt of an issuer, and simultaneously selling protection through a credit default swap referenced to the debt of a different issuer with the intent to realize gains from the pricing differences of the two issuers who are expected to have similar market risks. Pairs trades attempt to gain exposure to credit risk while hedging or offsetting the effects of overall market movements. In addition, the Fund has engaged in spread curve trades by simultaneously purchasing and selling protection through credit default swaps referenced to the same issuer but with different maturities. Spread curve trades attempt to gain exposure to credit risk on a forward basis by realizing gains on the expected differences in spreads.
Interest Rate Swap Contracts. An interest rate swap is an agreement between counterparties to exchange periodic payments based on interest rates. One cash flow stream will typically be a floating rate payment based upon a specified interest rate while the other is typically a fixed interest rate.
Risks of interest rate swaps include credit, market and liquidity risk. Additional risks include but are not limited to, interest rate risk. There is a risk, based on future movements of interest rates that the payments made by the Fund under a swap agreement will be greater than the payments it received.
Total Return Swap Contracts. A total return swap is an agreement between counterparties to exchange periodic payments based on asset or non-asset references. One cash flow is typically based on a non-asset reference (such as an interest rate or index) and the other on the total return of a reference asset (such as a security or a basket of securities). The total return of the reference asset typically includes appreciation or depreciation on the reference asset, plus any interest or dividend payments.
Risks of total return swaps include credit, market and liquidity risk.
F27 | OPPENHEIMER BALANCED FUND/VA
NOTES TO FINANCIAL STATEMENTS Continued
8. Illiquid Securities
As of December 31, 2008, investments in securities included issues that are illiquid. Investments may be illiquid because they do not have an active trading market, making it difficult to value them or dispose of them promptly at an acceptable price. The Fund will not invest more than 15% of its net assets (determined at the time of purchase and reviewed periodically) in illiquid securities. Securities that are illiquid are marked with an applicable footnote on the Statement of Investments.
9. Securities Lending
The Fund lends portfolio securities from time to time in order to earn additional income in the form of fees or interest on securities received as collateral or the investment of any cash received as collateral. The loans are secured by collateral (either securities, letters of credit, or cash) in an amount not less than 100% of the market value of the loaned securities during the period of the loan. The market value of the loaned securities is determined at the close of each business day and any additional required collateral is delivered to the Fund on the next business day. If the borrower defaults on its obligation to return the securities loaned because of insolvency or other reasons, the Fund could experience delays and cost in recovering the securities loaned or in gaining access to the collateral. The Fund continues to receive the economic benefit of interest or dividends paid on the securities loaned in the form of a substitute payment received from the borrower and recognizes the gain or loss in the fair value of the securities loaned that may occur during the term of the loan. The Fund has the right under the lending agreement to recover the securities from the borrower on demand.
As of December 31, 2008, the Fund had no securities on loan.
10. Recent Accounting Pronouncement
In March 2008, the Financial Accounting Standards Board (“FASB”) issued Statement on Financial Accounting Standards (“SFAS”) No. 161, Disclosures about Derivative Instruments and Hedging Activities. This standard requires enhanced disclosures about derivative and hedging activities, including qualitative disclosures about how and why the Fund uses derivative instruments, how these activities are accounted for, and their effect on the Fund’s financial position, financial performance and cash flows. SFAS No. 161 is effective for financial statements issued for fiscal years and interim periods beginning after November 15, 2008. At this time, management is evaluating the implications of SFAS No. 161 and its impact on the Fund’s financial statements and related disclosures.
11. Change In Independent Registered Public Accounting Firm (Unaudited)
At a meeting held on August 20, 2008, the Board of Trustees of the Fund appointed KPMG LLP as the independent registered public accounting firm to the Fund for fiscal year 2009, replacing the firm of Deloitte & Touche LLP, effective at the conclusion of the fiscal 2008 audit. During the two most recent fiscal years the audit reports of Deloitte & Touche LLP contained no adverse opinion or disclaimer of opinion and were not qualified or modified as to uncertainty, audit scope or accounting principles. Further, there were no disagreements between the Fund and Deloitte & Touche LLP on accounting principles, financial statement disclosure or audit scope, which if not resolved to the satisfaction of Deloitte & Touche LLP would have caused it to make reference to the disagreements in connection with its reports.
F28 | OPPENHEIMER BALANCED FUND/VA
REPORT OF INDEPENDENT REGISTERED PUBLIC ACCOUNTING FIRM
To the Board of Trustees and Shareholders of Oppenheimer Balanced Fund/VA:
We have audited the accompanying statement of assets and liabilities of Oppenheimer Balanced Fund/VA (the “Fund”), a series of Oppenheimer Variable Account Funds, including the statement of investments, as of December 31, 2008, and the related statement of operations for the year then ended, the statements of changes in net assets for each of the two years in the period then ended, and the financial highlights for each of the five years in the period then ended. These financial statements and financial highlights are the responsibility of the Fund’s management. Our responsibility is to express an opinion on these financial statements and financial highlights based on our audits.
We conducted our audits in accordance with the standards of the Public Company Accounting Oversight Board (United States). Those standards require that we plan and perform the audit to obtain reasonable assurance about whether the financial statements and financial highlights are free of material misstatement. The Fund is not required to have, nor were we engaged to perform, an audit of its internal control over financial reporting. Our audits included consideration of internal control over financial reporting as a basis for designing audit procedures that are appropriate in the circumstances, but not for the purpose of expressing an opinion on the effectiveness of the Fund’s internal control over financial reporting. Accordingly, we express no such opinion. An audit also includes examining, on a test basis, evidence supporting the amounts and disclosures in the financial statements, assessing the accounting principles used and significant estimates made by management, as well as evaluating the overall financial statement presentation. Our procedures included confirmation of securities owned as of December 31, 2008, by correspondence with the custodian and brokers; where replies were not received from brokers, we performed other auditing procedures. We believe that our audits provide a reasonable basis for our opinion.
In our opinion, the financial statements and financial highlights referred to above present fairly, in all material respects, the financial position of the Fund as of December 31, 2008, the results of its operations for the year then ended, the changes in its net assets for each of the two years in the period then ended, and the financial highlights for each of the five years in the period then ended, in conformity with accounting principles generally accepted in the United States of America.
Deloitte & Touche LLP
Denver, Colorado
February 11, 2009
F29 | OPPENHEIMER BALANCED FUND/VA
THIS PAGE INTENTIONALLY LEFT BLANK.
F30 | TOTAL RETURN PORTFOLIO
FEDERAL INCOME TAX INFORMATION Unaudited
In early 2009, if applicable, shareholders of record received information regarding all dividends and distributions paid to them by the Fund during calendar year 2008. Regulations of the U.S. Treasury Department require the Fund to report this information to the Internal Revenue Service.
Capital gain distributions of $0.7755 per share were paid to Non-Service and Service shareholders, respectively, on March 10, 2008. Whether received in stock or in cash, the capital gain distribution should be treated by shareholders as a gain from the sale of the capital assets held for more than one year (long-term capital gains).
None of the dividends paid by the Fund during the fiscal year ended December 31, 2008 are eligible for the corporate dividend-received deduction.
The foregoing information is presented to assist shareholders in reporting distributions received from the Fund to the Internal Revenue Service. Because of the complexity of the federal regulations which may affect your individual tax return and the many variations in state and local tax regulations, we recommend that you consult your tax advisor for specific guidance.
7 | OPPENHEIMER BALANCED FUND/VA
BOARD APPROVAL OF THE FUND’S INVESTMENT ADVISORY AGREEMENT Unaudited
Each year, the Board of Trustees (the “Board”), including a majority of the independent Trustees, is required to determine whether to renew the Fund’s investment advisory agreement (the “Agreement”). The Investment Company Act of 1940, as amended, requires that the Board request and evaluate, and that the Manager provide, such information as may be reasonably necessary to evaluate the terms of the Agreement. The Board employs an independent consultant to prepare a report that provides information, including comparative information, the Board requests for that purpose. In addition, the Board receives information throughout the year regarding Fund services, fees, expenses and performance.
The Manager and the independent consultant provided information to the Board on the following factors: (i) the nature, quality and extent of the Manager’s services, (ii) the investment performance of the Fund and the Manager, (iii) the fees and expenses of the Fund, including comparative expense information, (iv) the profitability of the Manager and its affiliates, including an analysis of the cost of providing services, (v) whether economies of scale are realized as the Fund grows and whether fee levels reflect these economies of scale for Fund investors and (vi) other benefits to the Manager from its relationship with the Fund. The Board was aware that there are alternatives to retaining the Manager.
Outlined below is a summary of the principal information considered by the Board as well as the Board’s conclusions.
Nature, Quality and Extent of Services. The Board considered information about the nature, quality and extent of the services provided to the Fund and information regarding the Manager’s key personnel who provide such services. The Manager’s duties include providing the Fund with the services of the portfolio managers and the Manager’s investment team, who provide research, analysis and other advisory services in regard to the Fund’s investments; securities trading services; oversight of third party service providers; monitoring compliance with applicable Fund policies and procedures and adherence to the Fund’s investment restrictions. The Manager is responsible for providing certain administrative services to the Fund as well. Those services include providing and supervising all administrative and clerical personnel who are necessary in order to provide effective corporate administration for the Fund; compiling and maintaining records with respect to the Fund’s operations; preparing and filing reports required by the Securities and Exchange Commission; preparing periodic reports regarding the operations of the Fund for its shareholders; preparing proxy materials for shareholder meetings; and preparing the registration statements required by Federal and state securities laws for the sale of the Fund’s shares. The Manager also provides the Fund with office space, facilities and equipment.
The Board also considered the quality of the services provided and the quality of the Manager’s resources that are available to the Fund. The Board took account of the fact that the Manager has had over forty years of experience as an investment adviser and that its assets under management rank it among the top mutual fund managers in the United States. The Board evaluated the Manager’s advisory, administrative, accounting, legal and compliance services, and information the Board has received regarding the experience and professional qualifications of the Manager’s key personnel and the size and functions of its staff. In its evaluation of the quality of the portfolio management services provided, the Board considered the experience of Emmanuel Ferreira, Angelo Manioudakis, Antulio Bomfim, Geoffrey Caan, Benjamin Gord and Thomas Swaney, the portfolio managers for the Fund, and the Manager’s investment team and analysts. The Board members also considered the totality of their experiences with the Manager as Directors or Trustees of the Fund and other funds advised by the Manager. The Board considered information regarding the quality of services provided by affiliates of the Manager, which its members have become knowledgeable about in connection with the renewal of the Fund’s service agreements. The Board concluded that, in light of the Manager’s experience, reputation, personnel, operations and resources, the Fund benefits from the services provided under the Agreement.
Investment Performance of the Manager and the Fund. Throughout the year, the Manager provided information on the investment performance of the Fund and the Manager, including comparative performance information. The Board also reviewed information, prepared by the Manager and by the independent consultant, comparing the Fund’s historical performance to relevant market indices and to the performance of other mixed-asset target allocation moderate
8 | OPPENHEIMER BALANCED FUND/VA
funds underlying variable insurance products. The Board considered that the Fund outperformed its performance universe median during the five- and ten-year periods, though it underperformed its performance universe median during the one- and three-year periods. The Board considered that the Fund’s underperformance in 2007 reflected a combination of a severe downturn and lack of liquidity in the fixed income markets as well as the underperformance of certain types of securities in the Fund’s portfolio. The Board considered that the Fund’s longer term relative rankings are solid.
Costs of Services by the Manager. The Board reviewed the fees paid to the Manager and the other expenses borne by the Fund. The Board also considered the comparability of the fees charged and the services provided to the Fund to the fees and services for other clients or accounts advised by the Manager. The independent consultant provided comparative data in regard to the fees and expenses of the Fund and mixed-asset target allocation moderate funds underlying variable insurance products with comparable asset levels and distribution features. The Board considered that the Fund’s total expenses were higher than its expense group median. The Board considered the Manager’s assertion that running a VA fund is more expensive than running a retail fund and that the Fund’s management fee schedule was equal to the management fee schedule for the Oppenheimer Balanced Fund. The Board also considered that, effective September 1, 2007 the Manager voluntarily undertook to waive a portion of the management fee so that annual total expenses would not exceed 0.67% of average annual net assets for non-service shares and 0.92% of average annual net assets for service shares. In reviewing the fees and expenses charged to the VA Funds, the Board considered the Manager’s assertion that, because of the disparity among VA funds in how insurance companies may be compensated for the services they provide to shareholders, when comparing the expenses of the various VA funds it is most appropriate to focus on the total expenses rather than on the management fees. Accordingly, while the Board reviewed and considered all expenses in its consideration of the Advisory Agreement, it paid particular attention to total expenses.
Economies of Scale and Profits Realized by the Manager. The Board considered information regarding the Manager’s costs in serving as the Fund’s investment adviser, including the costs associated with the personnel and systems necessary to manage the Fund, and information regarding the Manager’s profitability from its relationship with the Fund. The Board reviewed whether the Manager may realize economies of scale in managing and supporting the Fund. The Board noted that the Fund currently has management fee breakpoints, which are intended to share with Fund shareholders economies of scale that may exist as the Fund’s assets grow.
Other Benefits to the Manager. In addition to considering the profits realized by the Manager, the Board considered information that was provided regarding the direct and indirect benefits the Manager receives as a result of its relationship with the Fund, including compensation paid to the Manager’s affiliates and research provided to the Manager in connection with permissible brokerage arrangements (soft dollar arrangements). The Board also considered that the Manager must be able to pay and retain experienced professional personnel at competitive rates to provide quality services to the Fund and that maintaining the financial viability of the Manager is important in order for the Manager to continue to provide significant services to the Fund and its shareholders.
Conclusions. These factors were also considered by the independent Trustees meeting separately from the full Board, assisted by experienced counsel to the Fund and to the independent Trustees. Fund counsel and the independent Trustees’ counsel are independent of the Manager within the meaning and intent of the Securities and Exchange Commission Rules.
Based on its review of the information it received and its evaluations described above, the Board, including a majority of the independent Trustees, decided to continue the Agreement for another year. In arriving at this decision, the Board did not single out any factor or factors as being more important than others, but considered all of the above information, and considered the terms and conditions of the Agreement, including the management fee, in light of all of the surrounding circumstances.
9 | OPPENHEIMER BALANCED FUND/VA
PORTFOLIO PROXY VOTING POLICIES AND PROCEDURES; UPDATES TO STATEMENTS OF INVESTMENTS Unaudited
The Fund has adopted Portfolio Proxy Voting Policies and Procedures under which the Fund votes proxies relating to securities (“portfolio proxies”) held by the Fund. A description of the Fund’s Portfolio Proxy Voting Policies and Procedures is available (i) without charge, upon request, by calling the Fund toll-free at 1.800.525.7048, (ii) on the Fund’s website at www.oppenheimerfunds.com, and (iii) on the SEC’s website at www.sec.gov. In addition, the Fund is required to file Form N-PX, with its complete proxy voting record for the 12 months ended June 30th, no later than August 31st of each year. The Fund’s voting record is available (i) without charge, upon request, by calling the Fund toll-free at 1.800.525.7048, and (ii) in the Form N-PX filing on the SEC’s website at www.sec.gov.
The Fund files its complete schedule of portfolio holdings with the SEC for the first quarter and the third quarter of each fiscal year on Form N-Q. The Fund’s Form N-Q filings are available on the SEC’s website at http://www.sec.gov. Those forms may be reviewed and copied at the SEC’s Public Reference Room in Washington, D.C. Information on the operation of the Public Reference Room may be obtained by calling 1-800-SEC-0330.
10 | OPPENHEIMER BALANCED FUND/VA
TRUSTEES AND OFFICERS Unaudited
| | | |
Name, Position(s) Held with the Fund, Length of Service, Age | | Principal Occupation(s) During the Past 5 Years; Other Trusteeships/Directorships Held; Number of Portfolios in the Fund Complex Currently Overseen |
| | | |
INDEPENDENT
TRUSTEES | | The address of each Trustee in the chart below is 6803 S. Tucson Way, Centennial, Colorado 80112-3924. Each Trustee serves for an indefinite term, or until his or her resignation, retirement, death or removal. |
| | | |
William L. Armstrong,
Chairman of the Board of
Trustees (since 2003),
Trustee (since 1999)
Age: 71 | | President, Colorado Christian University (since 2006); Chairman, Cherry Creek Mortgage Company (since 1991), Chairman, Centennial State Mortgage Company (since 1994), Chairman, The El Paso Mortgage Company (since 1993); Chairman, Ambassador Media Corporation (since 1984); Chairman, Broadway Ventures (since 1984); Director of Helmerich & Payne, Inc. (oil and gas drilling/production company) (since 1992), Campus Crusade for Christ (non-profit) (since 1991); Former Director, The Lynde and Harry Bradley Foundation, Inc. (non-profit organization) (2002-2006); former Chairman of: Transland Financial Services, Inc. (private mortgage banking company) (1997-2003), Great Frontier Insurance (1995-2000), Frontier Real Estate, Inc. (residential real estate brokerage) (1994-2000) and Frontier Title (title insurance agency) (1995-2000); former Director of the following: UNUMProvident (insurance company) (1991-2004), Storage Technology Corporation (computer equipment company) (1991-2003) and International Family Entertainment (television channel) (1992-1997); U.S. Senator (January 1979-January 1991). Oversees 41 portfolios in the OppenheimerFunds complex. |
| | | |
George C. Bowen,
Trustee (since 1999)
Age: 72 | | Assistant Secretary and Director of Centennial Asset Management Corporation (December 1991-April 1999); President, Treasurer and Director of Centennial Capital Corporation (June 1989-April 1999); Chief Executive Officer and Director of MultiSource Services, Inc. (March 1996-April 1999); Mr. Bowen held several positions with the Manager and with subsidiary or affiliated companies of the Manager (September 1987-April 1999). Oversees 41 portfolios in the OppenheimerFunds complex. |
| | | |
Edward L. Cameron,
Trustee (since 1999)
Age: 70 | | Member of The Life Guard of Mount Vernon (George Washington historical site) (June 2000–June 2006); Partner of PricewaterhouseCoopers LLP (accounting firm) (July 1974-June 1999); Chairman of Price Waterhouse LLP Global Investment Management Industry Services Group (accounting firm) (July 1994-June 1998). Oversees 41 portfolios in the OppenheimerFunds complex. |
| | | |
Jon S. Fossel,
Trustee (since 1990)
Age: 66 | | Director of UNUMProvident (insurance company) (since June 2002); Director of Northwestern Energy Corp. (public utility corporation) (since November 2004); Director of P.R. Pharmaceuticals (October 1999-October 2003); Director of Rocky Mountain Elk Foundation (non-profit organization) (February 1998-February 2003 and February 2005-February 2007); Chairman and Director (until October 1996) and President and Chief Executive Officer (until October 1995) of the Manager; President, Chief Executive Officer and Director of the following: Oppenheimer Acquisition Corp. (“OAC”) (parent holding company of the Manager), Shareholders Services, Inc. and Shareholder Financial Services, Inc. (until October 1995). Oversees 41 portfolios in the OppenheimerFunds complex. |
| | | |
Sam Freedman,
Trustee (since 1996)
Age: 68 | | Director of Colorado UpLIFT (charitable organization) (since September 1984). Mr. Freedman held several positions with the Manager and with subsidiary or affiliated companies of the Manager (until October 1994). Oversees 41 portfolios in the OppenheimerFunds complex. |
| | | |
Beverly L. Hamilton,
Trustee (since 2002)
Age: 62 | | Trustee of Monterey Institute for International Studies (educational organization) (since February 2000); Board Member of Middlebury College (educational organization) (since December 2005); Director of The California Endowment (philanthropic organization) (since April 2002); Director (February 2002-2005) and Chairman of Trustees (2006-2007) of the Community Hospital of Monterey Peninsula; Director (October 1991-2005) and Vice Chairman (since 2006) of American Funds’ Emerging Markets Growth Fund, Inc. (mutual fund); President of ARCO Investment Management Company (February 1991-April 2000); Member of the investment committees of The Rockefeller Foundation (2001-2006) and The University of Michigan (since 2000); Advisor at Credit Suisse First Boston’s Sprout venture capital unit (venture capital fund) (1994-January 2005); Trustee of MassMutual Institutional Funds (investment company) (1996-June 2004); Trustee of MML Series Investment Fund (investment company) (April 1989-June 2004); Member of the investment committee of Hartford Hospital (2000-2003); and Advisor to Unilever (Holland) pension fund (2000-2003). Oversees 41 portfolios in the OppenheimerFunds complex. |
11 | OPPENHEIMER BALANCED FUND/VA
TRUSTEES AND OFFICERS Unaudited / Continued
| | | |
Robert J. Malone,
Trustee (since 2002)
Age: 64 | | Board of Directors of Opera Colorado Foundation (non-profit organization) (since March 2008); Director of Jones Knowledge, Inc. (since 2006); Director of Jones International University (educational organization) (since August 2005); Chairman, Chief Executive Officer and Director of Steele Street Bank & Trust (commercial banking) (since August 2003); Director of Colorado UpLIFT (charitable organization) (since 1986); Trustee of the Gallagher Family Foundation (non-profit organization) (since 2000); Former Chairman of U.S. Bank-Colorado (subsidiary of U.S. Bancorp and formerly Colorado National Bank) (July 1996-April 1999); Director of Commercial Assets, Inc. (real estate investment trust) (1993-2000); Director of Jones Knowledge, Inc. (2001-July 2004); and Director of U.S. Exploration, Inc. (oil and gas exploration) (1997-February 2004). Oversees 41 portfolios in the OppenheimerFunds complex. |
| | | |
F. William Marshall, Jr.,
Trustee (since 2000)
Age: 66 | | Trustee Emeritas of Worcester Polytech Institute (WPI) (private university) (since 2009); Trustee of MassMutual Select Funds (formerly MassMutual Institutional Funds) (investment company) (since 1996) and MML Series Investment Fund (investment company) (since 1996); President and Treasurer of the SIS Funds (private charitable fund) (since January 1999); Former Trustee of WPI (1985-2008); Former Chairman of the Board (2004-2006) and Former Chairman of the Investment Committee of WPI (1994-2008); Chairman of SIS & Family Bank, F.S.B. (formerly SIS Bank) (commercial bank) (January 1999-July 1999); Executive Vice President of Peoples Heritage Financial Group, Inc. (commercial bank) (January 1999-July 1999); and Former President and Chief Executive Officer of SIS Bancorp. (1993-1999). Oversees 43 portfolios in the OppenheimerFunds complex. |
| | | |
INTERESTED TRUSTEE
AND OFFICER | | The address of Mr. Murphy is Two World Financial Center, 225 Liberty Street, 11th Floor, New York, New York 10281-1008. Mr. Murphy serves as a Trustee for an indefinite term, or until his resignation, retirement, death or removal and as an Officer for an indefinite term, or until his resignation, retirement, death or removal. Mr. Murphy is an interested Trustee due to his positions with OppenheimerFunds, Inc. and its affiliates. |
| | | |
John V. Murphy,
Trustee, President and
Principal Executive Officer
(since 2001)
Age: 59 | | Chairman and Director of the Manager (since June 2001); Chief Executive Officer of the Manager (June 2001- December 2008); President of the Manager (September 2000-February 2007); President and director or trustee of other Oppenheimer funds; President and Director of Oppenheimer Acquisition Corp. (“OAC”) (the Manager’s parent holding company) and of Oppenheimer Partnership Holdings, Inc. (holding company subsidiary of the Manager) (since July 2001); Director of OppenheimerFunds Distributor, Inc. (subsidiary of the Manager) (November 2001-December 2006); Chairman and Director of Shareholder Services, Inc. and of Shareholder Financial Services, Inc. (transfer agent subsidiaries of the Manager) (since July 2001); President and Director of OppenheimerFunds Legacy Program (charitable trust program established by the Manager) (since July 2001); Director of the following investment advisory subsidiaries of the Manager: OFI Institutional Asset Management, Inc., Centennial Asset Management Corporation, Trinity Investment Management Corporation and Tremont Capital Management, Inc. (since November 2001), HarbourView Asset Management Corporation and OFI Private Investments, Inc. (since July 2001); President (since November 2001) and Director (since July 2001) of Oppenheimer Real Asset Management, Inc.; Executive Vice President of Massachusetts Mutual Life Insurance Company (OAC’s parent company) (since February 1997); Director of DLB Acquisition Corporation (holding company parent of Babson Capital Management LLC) (since June 1995); Chairman (since October 2007) and Member of the Investment Company Institute’s Board of Governors (since October 2003). Oversees 105 portfolios in the OppenheimerFunds complex. |
| | | |
OTHER OFFICERS OF
THE FUND | | The addresses of the Officers in the chart below are as follows: for Messrs. Ferreira and Zack, Two World Financial Center, 225 Liberty Street, New York, New York 10281-1008, for Messrs. Vandehey and Wixted, 6803 S. Tucson Way, Centennial, Colorado 80112-3924; for Messrs. Bomfim, Caan, Gord and Swaney, 470 Atlantic Avenue, 11th Floor, Boston, Massachusetts 02210. Each Officer serves for an indefinite term or until his or her resignation, retirement, death or removal. |
| | | |
Emmanuel Ferreira,
Vice President and Portfolio
Manager (since 2003)
Age: 41 | | Vice President of the Manager (since January 2003); Portfolio Manager at Lashire Investments (July 1999- December 2002). A portfolio manager and officer of 3 portfolios in the OppenheimerFunds complex. |
| | | |
Antulio N. Bomfim,
Vice President (since 2006)
and Portfolio Manager
(since 2003)
Age: 41 | | Vice President of the Manager (since October 2003); Senior Economist at the Board of Governors of the Federal Reserve System (June 1992-October 2003). A portfolio manager and officer of 11 portfolios in the OppenheimerFunds complex. |
12 | OPPENHEIMER BALANCED FUND/VA
| | | |
| |
Geoffrey Caan,
Vice President (since 2006)
and Portfolio Manager
(since 2003)
Age: 39 | | Vice President of the Manager (since August 2003); Vice President of ABN AMRO NA, Inc. (June 2002-August 2003); Vice President of Zurich Scudder Investments (January 1999-June 2002). A portfolio manager and officer of 11 portfolios in the OppenheimerFunds complex. |
| | | |
Benjamin J. Gord,
Vice President (since 2006)
and Portfolio Manager
(since 2003)
Age: 46 | | Vice President of the Manager (since April 2002) of HarbourView Asset Management Corporation (since April 2002) and of OFI Institutional Asset Management, Inc. (as of June 2002); Executive Director and senior fixed income analyst at Miller Anderson & Sherrerd, a division of Morgan Stanley Investment Management (April 1992-March 2002). A portfolio manager and officer of 11 portfolios in the OppenheimerFunds complex. |
| | | |
Thomas Swaney,
Vice President and Portfolio Manager (since 2006)
Age: 36 | | Vice President of the Manager (since April 2006); senior analyst on high grade investment team (June 2002- March 2006); senior fixed income analyst at Miller Anderson & Sherrerd, a division of Morgan Stanley Investment Management (May 1998-May 2002). A portfolio manager and officer of 11 portfolios in the OppenheimerFunds complex. |
| | | |
Mark S. Vandehey,
Vice President and Chief
Compliance Officer
(since 2004)
Age: 58 | | Senior Vice President and Chief Compliance Officer of the Manager (since March 2004); Chief Compliance Officer of OppenheimerFunds Distributor, Inc., Centennial Asset Management and Shareholder Services, Inc. (since March 2004); Vice President of OppenheimerFunds Distributor, Inc., Centennial Asset Management Corporation and Shareholder Services, Inc. (since June 1983); Former Vice President and Director of Internal Audit of the Manager (1997-February 2004). An officer of 105 portfolios in the OppenheimerFunds complex. |
| | | |
Brian W. Wixted,
Treasurer and Principal
Financial & Accounting
Officer (since 1999)
Age: 49 | | Senior Vice President and Treasurer of the Manager (since March 1999); Treasurer of the following: HarbourView Asset Management Corporation, Shareholder Financial Services, Inc., Shareholder Services, Inc., Oppenheimer Real Asset Management, Inc. and Oppenheimer Partnership Holdings, Inc. (since March 1999), OFI Private Investments, Inc. (since March 2000), OppenheimerFunds International Ltd. and OppenheimerFunds plc (since May 2000), OFI Institutional Asset Management, Inc. (since November 2000), and OppenheimerFunds Legacy Program (charitable trust program established by the Manager) (since June 2003); Treasurer and Chief Financial Officer of OFI Trust Company (trust company subsidiary of the Manager) (since May 2000); Assistant Treasurer of the following: OAC (since March 1999), Centennial Asset Management Corporation (March 1999- October 2003) and OppenheimerFunds Legacy Program (April 2000-June 2003). An officer of 105 portfolios in the OppenheimerFunds complex. |
| | | |
Robert G. Zack,
Vice President and Secretary
(since 2001)
Age: 60 | | Executive Vice President (since January 2004) and General Counsel (since March 2002) of the Manager; General Counsel and Director of the Distributor (since December 2001); General Counsel of Centennial Asset Management Corporation (since December 2001); Senior Vice President and General Counsel of HarbourView Asset Management Corporation (since December 2001); Secretary and General Counsel of OAC (since November 2001); Assistant Secretary (since September 1997) and Director (since November 2001) of OppenheimerFunds International Ltd. and OppenheimerFunds plc; Vice President and Director of Oppenheimer Partnership Holdings, Inc. (since December 2002); Director of Oppenheimer Real Asset Management, Inc. (since November 2001); Senior Vice President, General Counsel and Director of Shareholder Financial Services, Inc. and Shareholder Services, Inc. (since December 2001); Senior Vice President, General Counsel and Director of OFI Private Investments, Inc. and OFI Trust Company (since November 2001); Vice President of OppenheimerFunds Legacy Program (since June 2003); Senior Vice President and General Counsel of OFI Institutional Asset Management, Inc. (since November 2001); Director of OppenheimerFunds International Distributor Limited (since December 2003); Senior Vice President (May 1985-December 2003). An officer of 105 portfolios in the OppenheimerFunds complex. |
The Fund’s Statement of Additional Information contains additional information about the Fund’s Trustees and Officers and is available without charge, upon request, by calling 1.800.981.2871.
13 | OPPENHEIMER BALANCED FUND/VA
FUND PERFORMANCE DISCUSSION
Management’s Discussion of Fund Performance. In an extremely difficult operating environment, Oppenheimer Capital Appreciation Fund/VA’s Non-Service shares produced a -45.52% return for the 12-month period ended December 31, 2008. By comparison, the Russell 1000 Growth Index produced a return of -38.44% and the S&P 500 returned a -36.99% for the same period. While we are disappointed with the achieved results, some of the Fund’s better results versus the Russell 1000 Growth Index stemmed from its holdings in the materials and energy sectors. Conversely, results in the consumer discretionary, consumer staples and financial sectors accounted for most of the Fund’s underperformance.
In terms of individual contributors to Fund performance, Gilead Sciences, Inc. and Celgene Corp., both health-care stocks, performed nicely. Healthcare stocks were not as adversely affected as other sectors by the credit crisis and severe economic downturn. Within information technology, Affiliated Computer Services, Inc. and Visa, Inc. both managed to weather the financial storm relatively well and were positive contributors. Within materials, we outperformed the index in terms of stock selection, although the sector as a whole experienced sharp declines.
Mirroring the performance of the overall U.S. economy, the Fund’s most disappointing returns stemmed from its holdings in the financials, consumer discretionary and consumer staples groups. Financial stocks continued to falter in the wake of the U.S. sub-prime mortgage market debacle, the subsequent global credit crisis and stock market downturns. Given this backdrop, a number of financial stocks hindered the Fund’s performance including capital markets firms Credit Suisse Group AG, Goldman Sachs Group, Inc. and Fortress Investment Group LLC (which we exited). CME Group, Inc., a diversified financial services company, also experienced sharp declines, leading us to exit our position.
Consumer stocks presented difficulties for the Fund as overextended consumers grappled to keep pace with rising energy, gas and food costs. Those concerns were further intensified by continued job layoffs. Among the Fund’s consumer discretionary stocks, hotels, restaurants and retailers were hit particularly hard, including Las Vegas Sands Corp. and Abercrombie & Fitch. We exited our position in both stocks. A handful of media stocks also lagged, in contrast to what has traditionally been a strong period for their services, i.e. coverage of the 2008 Summer Olympic Games and the impending U.S. presidential elections. Laggards here included Focus Media Holding Ltd.
Consumer staples stocks also produced negative results for the Fund, primarily the result of our limited exposure to better-performing tobacco, household products and beverages stocks. Over the course of the reporting period, we tended to emphasize international and European-based consumer staples stocks over their domestic counterparts, a decision that did not serve us well. That’s because investors flocked to large, well-known companies because of their perceived relative safety. However, we remained largely underweight the consumer staples group because we believed many of these stocks appeared relatively overvalued.
As of December 31, 2008, the Fund’s largest area of investment was within the information technology sector, followed by the healthcare and energy sectors. Conversely, the Fund’s smallest area of investment was the utilities sector, where we have no exposure, followed by the telecommunication services, consumer discretionary and materials sectors.
Comparing the Fund’s Performance to the Market. The graphs that follow show the performance of a hypothetical $10,000 investment in each share class of the Fund held until December 31, 2008. In the case of Non-Service shares, performance is measured over a ten-year period. In the case of Service shares, performance is measured from inception of the class on September 18, 2001. Performance information does not reflect charges that apply to separate accounts investing in the Fund. If these charges were taken into account, performance would be lower. The graph assumes that all dividends and capital gains distributions were reinvested in additional shares.
The Fund’s performance is compared to the performance of the S&P 500 Index, an unmanaged index of equity securities that is a measure of the general domestic stock market, and the Russell 1000 Growth Index, an unmanaged index of 1,000 U.S. large cap growth stocks. The index performance includes reinvestment of income but does not reflect transaction costs, fees or expenses. The Fund’s performance reflects the effects of the Fund’s business and operating expenses. While index comparisons may be useful to provide a benchmark for the Fund’s performance, it must be noted that the Fund’s investments are not limited to the investments in the index.
3 | OPPENHEIMER CAPITAL APPRECIATION FUND/ VA
FUND PERFORMANCE DISCUSSION
Non-Service Shares
Comparison of Change in Value of $10,000 Hypothetical Investments in: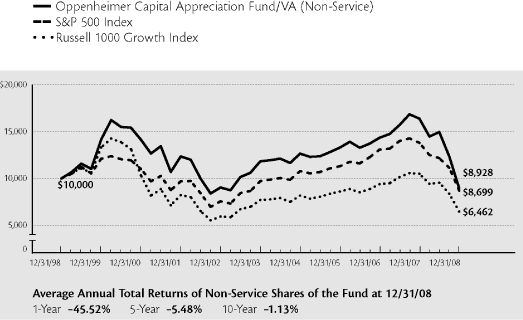
Service Shares
Comparison of Change in Value of $10,000 Hypothetical Investments in: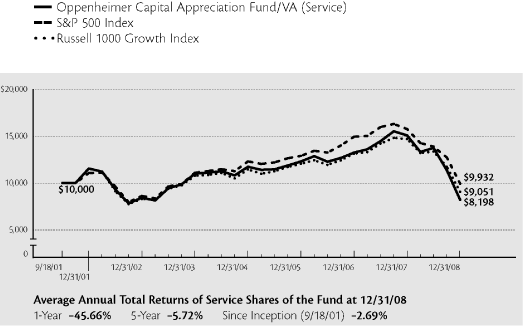
The performance data quoted represents past performance, which does not guarantee future results. The investment return and principal value of an investment in the Fund will fluctuate so that an investor’s shares, when redeemed, may be worth more or less than their original cost. Current performance may be lower or higher than the performance quoted. For performance data current to the most recent month end, call us at 1.800.981.2871. The Fund’s total returns should not be expected to be the same as the returns of other funds, whether or not both funds have the same portfolio managers and/or similar names. The Fund’s total returns do not include the charges associated with the separate account products that offer this Fund. Such performance would have been lower if such charges were taken into account.
4 | OPPENHEIMER CAPITAL APPRECIATION FUND/ VA
FUND EXPENSES
Fund Expenses. As a shareholder of the Fund, you incur two types of costs: (1) transaction costs, which may include redemption fees (if applicable); and (2) ongoing costs, including management fees; distribution and service fees; and other Fund expenses. These examples are intended to help you understand your ongoing costs (in dollars) of investing in the Fund and to compare these costs with the ongoing costs of investing in other mutual funds.
The examples are based on an investment of $1,000.00 invested at the beginning of the period and held for the entire 6-month period ended December 31, 2008.
Actual Expenses. The first section of the table provides information about actual account values and actual expenses. You may use the information in this section for the class of shares you hold, together with the amount you invested, to estimate the expense that you paid over the period. Simply divide your account value by $1,000.00 (for example, an $8,600.00 account value divided by $1,000.00 = 8.60), then multiply the result by the number in the first section under the heading entitled “Expenses Paid During Period” to estimate the expenses you paid on your account during this period.
Hypothetical Example for Comparison Purposes. The second section of the table provides information about hypothetical account values and hypothetical expenses based on the Fund’s actual expense ratio for each class of shares, and an assumed rate of return of 5% per year for each class before expenses, which is not the actual return. The hypothetical account values and expenses may not be used to estimate the actual ending account balance or expenses you paid for the period. You may use this information to compare the ongoing costs of investing in the Fund and other funds. To do so, compare this 5% hypothetical example for the class of shares you hold with the 5% hypothetical examples that appear in the shareholder reports of the other funds.
Please note that the expenses shown in the table are meant to highlight your ongoing costs only and do not reflect any charges associated with the separate accounts that offer this Fund. Therefore, the “hypothetical” lines of the table are useful in comparing ongoing costs only, and will not help you determine the relative total costs of owning different funds. In addition, if these separate account charges were included your costs would have been higher.
| | | | | | | | | | | | | |
| | | Beginning | | | Ending | | | Expenses | |
| | | Account | | | Account | | | Paid During | |
| | | Value | | | Value | | | 6 Months Ended | |
| | | July 1, 2008 | | | December 31, 2008 | | | December 31, 2008 | |
| |
Actual | | | | | | | | | | | | |
| Non-Service shares | | $ | 1,000.00 | | | $ | 596.80 | | | $ | 2.69 | |
| Service shares | | | 1,000.00 | | | | 596.10 | | | | 3.70 | |
| | | | | | | | | | | | | |
Hypothetical | | | | | | | | | | | | |
| (5% return before expenses) | | | | | | | | | | | | |
| Non-Service shares | | | 1,000.00 | | | | 1,021.77 | | | | 3.41 | |
| Service shares | | | 1,000.00 | | | | 1,020.51 | | | | 4.68 | |
Expenses are equal to the Fund’s annualized expense ratio for that class, multiplied by the average account value over the period, multiplied by 184/366 (to reflect the one-half year period). Those annualized expense ratios, excluding indirect expenses from affiliated fund, based on the 6-month period ended December 31, 2008 are as follows:
| | | | | |
| Class | | Expense Ratios |
| |
| Non-Service shares | | | 0.67 | % |
| Service shares | | | 0.92 | |
The expense ratios reflect reduction to custodian expenses and voluntary waivers or reimbursements of expenses by the Fund’s Manager that can be terminated at any time, without advance notice. The “Financial Highlights” tables in the Fund’s financial statements, included in this report, also show the gross expense ratios, without such waivers or reimbursements and reduction to custodian expenses, if applicable.
5 | OPPENHEIMER CAPITAL APPRECIATION FUND/ VA
THIS PAGE INTENTIONALLY LEFT BLANK.
6 | OPPENHEIMER CAPITAL APPRECIATION FUND/ VA
STATEMENT OF INVESTMENTS December 31, 2008
| | | | | | | | | |
| | | Shares | | | Value | |
Common Stocks—96.1% | | | | | | | | |
Consumer Discretionary—4.9% | | | | | | | | |
Hotels, Restaurants & Leisure—0.6% | | | | | | | | |
| Burger King Holdings, Inc. | | | 270,820 | | | $ | 6,467,182 | |
Media—2.0% | | | | | | | | |
| Cablevision Systems Corp. New York Group, Cl. A | | | 578,790 | | | | 9,746,824 | |
Focus Media Holding Ltd., ADR1 | | | 435,900 | | | | 3,962,331 | |
| McGraw-Hill Cos., Inc. (The) | | | 275,900 | | | | 6,398,121 | |
| Walt Disney Co. (The) | | | 152,100 | | | | 3,451,149 | |
| | | | | | | | |
| | | | | | | | 23,558,425 | |
| | | | | | | | | |
Specialty Retail—0.5% | | | | | | | | |
| Staples, Inc. | | | 310,710 | | | | 5,567,923 | |
Textiles, Apparel & Luxury Goods—1.8% | | | | | | | | |
Coach, Inc.1 | | | 384,540 | | | | 7,986,896 | |
| Polo Ralph Lauren Corp., Cl. A | | | 282,200 | | | | 12,814,702 | |
| | | | | | | | |
| | | | | | | | 20,801,598 | |
| | | | | | | | | |
Consumer Staples—8.4% | | | | | | | | |
Beverages—2.0% | | | | | | | | |
| PepsiCo, Inc. | | | 415,500 | | | | 22,756,935 | |
Food & Staples Retailing—2.0% | | | | | | | | |
| Wal-Mart Stores, Inc. | | | 401,400 | | | | 22,502,484 | |
Food Products—3.9% | | | | | | | | |
| Cadbury plc | | | 1,957,050 | | | | 17,379,417 | |
| Nestle SA | | | 700,387 | | | | 27,556,158 | |
| | | | | | | | |
| | | | | | | | 44,935,575 | |
| | | | | | | | | |
Household Products—0.5% | | | | | | | | |
| Colgate-Palmolive Co. | | | 82,300 | | | | 5,640,842 | |
Energy—9.1% | | | | | | | | |
Energy Equipment & Services—2.5% | | | | | | | | |
Cameron International Corp.1 | | | 277,700 | | | | 5,692,850 | |
| Schlumberger Ltd. | | | 431,500 | | | | 18,265,395 | |
Transocean Ltd.1 | | | 91,100 | | | | 4,304,475 | |
| | | | | | | | |
| | | | | | | | 28,262,720 | |
| | | | | | | | | |
Oil, Gas & Consumable Fuels—6.6% | | | | | | | | |
| Devon Energy Corp. | | | 187,900 | | | | 12,346,909 | |
| Occidental Petroleum Corp. | | | 409,900 | | | | 24,589,901 | |
| Range Resources Corp. | | | 468,380 | | | | 16,107,588 | |
| XTO Energy, Inc. | | | 640,430 | | | | 22,587,966 | |
| | | | | | | | |
| | | | | | | | 75,632,364 | |
| | | | | | | | | |
Financials—7.9% | | | | | | | | |
Capital Markets—3.8% | | | | | | | | |
| Charles Schwab Corp. (The) | | | 315,700 | | | | 5,104,869 | |
| Credit Suisse Group AG | | | 338,023 | | | | 9,248,879 | |
| Goldman Sachs Group, Inc. (The) | | | 93,200 | | | | 7,865,148 | |
| Julius Baer Holding AG | | | 130,984 | | | | 5,029,913 | |
| Northern Trust Corp. | | | 209,390 | | | | 10,917,595 | |
| T. Rowe Price Group, Inc. | | | 151,900 | | | | 5,383,336 | |
| | | | | | | | |
| | | | | | | | 43,549,740 | |
| | | | | | | | | |
Diversified Financial Services—3.0% | | | | | | | | |
| BM&F BOVESPA SA | | | 1,928,000 | | | | 5,111,731 | |
Intercontinental Exchange, Inc.1 | | | 247,200 | | | | 20,379,168 | |
MSCI, Inc., Cl. A1 | | | 504,899 | | | | 8,967,006 | |
| | | | | | | | |
| | | | | | | | 34,457,905 | |
| | | | | | | | | |
Insurance—0.6% | | | | | | | | |
| Aon Corp. | | | 145,600 | | | | 6,651,008 | |
Real Estate Management & Development—0.5% | | | | | | | | |
| Jones Lang LaSalle, Inc. | | | 229,510 | | | | 6,357,427 | |
Health Care—19.5% | | | | | | | | |
Biotechnology—5.4% | | | | | | | | |
Amgen, Inc.1 | | | 136,300 | | | | 7,871,325 | |
Celgene Corp.1 | | | 343,220 | | | | 18,973,202 | |
Genentech, Inc.1 | | | 101,300 | | | | 8,398,783 | |
Gilead Sciences, Inc.1 | | | 519,800 | | | | 26,582,572 | |
| | | | | | | | |
| | | | | | | | 61,825,882 | |
| | | | | | | | | |
Health Care Equipment & Supplies—5.1% | | | | | | | | |
| Bard (C.R.), Inc. | | | 66,390 | | | | 5,594,021 | |
| Baxter International, Inc. | | | 466,700 | | | | 25,010,453 | |
| Dentsply International, Inc. | | | 349,800 | | | | 9,878,352 | |
Intuitive Surgical, Inc.1 | | | 37,800 | | | | 4,800,222 | |
| Medtronic, Inc. | | | 206,100 | | | | 6,475,662 | |
| Stryker Corp. | | | 159,700 | | | | 6,380,015 | |
| | | | | | | | |
| | | | | | | | 58,138,725 | |
| | | | | | | | | |
Health Care Providers & Services—2.7% | | | | | | | | |
Express Scripts, Inc.1 | | | 405,300 | | | | 22,283,394 | |
Schein (Henry), Inc.1 | | | 230,290 | | | | 8,449,340 | |
| | | | | | | | |
| | | | | | | | 30,732,734 | |
| | | | | | | | | |
Life Sciences Tools & Services—3.3% | | | | | | | | |
Covance, Inc.1 | | | 184,427 | | | | 8,489,175 | |
Illumina, Inc.1 | | | 349,800 | | | | 9,112,290 | |
Thermo Fisher Scientific, Inc.1 | | | 591,180 | | | | 20,141,503 | |
| | | | | | | | |
| | | | | | | | 37,742,968 | |
| | | | | | | | | |
Pharmaceuticals—3.0% | | | | | | | | |
| Allergan, Inc. | | | 305,500 | | | | 12,317,760 | |
| Roche Holding AG | | | 81,755 | | | | 12,563,013 | |
| Shire plc | | | 693,500 | | | | 10,287,960 | |
| | | | | | | | |
| | | | | | | | 35,168,733 | |
F1 | OPPENHEIMER CAPITAL APPRECIATION FUND/ VA
STATEMENT OF INVESTMENTS Continued
| | | | | | | | | |
| | | Shares | | | Value | |
Industrials—7.5% | | | | | | | | |
Aerospace & Defense—4.3% | | | | | | | | |
| General Dynamics Corp. | | | 107,300 | | | $ | 6,179,407 | |
| Lockheed Martin Corp. | | | 290,020 | | | | 24,384,882 | |
| United Technologies Corp. | | | 344,600 | | | | 18,470,560 | |
| | | | | | | | |
| | | | | | | | 49,034,849 | |
| | | | | | | | | |
Construction & Engineering—0.4% | | | | | | | | |
Quanta Services, Inc.1 | | | 211,000 | | | | 4,177,800 | |
Electrical Equipment—1.6% | | | | | | | | |
| ABB Ltd. | | | 1,214,015 | | | | 18,268,565 | |
Machinery—0.5% | | | | | | | | |
| Joy Global, Inc. | | | 267,400 | | | | 6,120,786 | |
Road & Rail—0.7% | | | | | | | | |
| Burlington Northern Santa Fe Corp. | | | 102,800 | | | | 7,782,988 | |
Information Technology—29.9% | | | | | | | | |
Communications Equipment—8.3% | | | | | | | | |
Cisco Systems, Inc.1 | | | 1,389,200 | | | | 22,643,960 | |
F5 Networks, Inc.1 | | | 355,360 | | | | 8,123,530 | |
| QUALCOMM, Inc. | | | 1,142,910 | | | | 40,950,465 | |
Research in Motion Ltd.1 | | | 583,100 | | | | 23,662,198 | |
| | | | | | | | |
| | | | | | | | 95,380,153 | |
| | | | | | | | | |
Computers & Peripherals—3.3% | | | | | | | | |
Apple, Inc.1 | | | 320,400 | | | | 27,346,140 | |
NetApp, Inc.1 | | | 748,930 | | | | 10,462,552 | |
| | | | | | | | |
| | | | | | | | 37,808,692 | |
| | | | | | | | | |
Electronic Equipment & Instruments—0.4% | | | | | | | | |
FLIR Systems, Inc.1 | | | 163,400 | | | | 5,013,112 | |
Internet Software & Services—4.0% | | | | | | | | |
eBay, Inc.1 | | | 737,000 | | | | 10,288,520 | |
Google, Inc., Cl. A1 | | | 116,100 | | | | 35,718,165 | |
| | | | | | | | |
| | | | | | | | 46,006,685 | |
| | | | | | | | | |
IT Services—4.9% | | | | | | | | |
Affiliated Computer Services, Inc., Cl. A1 | | | 245,522 | | | | 11,281,736 | |
| MasterCard, Inc., Cl. A | | | 135,560 | | | | 19,375,591 | |
SAIC, Inc.1 | | | 381,300 | | | | 7,427,724 | |
| Visa, Inc., Cl. A | | | 340,930 | | | | 17,881,779 | |
| | | | | | | | |
| | | | | | | | 55,966,830 | |
| | | | | | | | | |
Semiconductors & Semiconductor Equipment—3.6% | | | | | | | | |
Broadcom Corp., Cl. A1 | | | 824,900 | | | | 13,998,553 | |
| Microchip Technology, Inc. | | | 469,530 | | | | 9,169,921 | |
NVIDIA Corp. 1 | | | 1,029,400 | | | | 8,307,258 | |
| Texas Instruments, Inc. | | | 599,150 | | | | 9,298,808 | |
| | | | | | | | |
| | | | | | | | 40,774,540 | |
| | | | | | | | | |
Software—5.4% | | | | | | | | |
Adobe Systems, Inc.1 | | | 581,900 | | | | 12,388,651 | |
Autodesk, Inc. 1 | | | 584,900 | | | | 11,493,285 | |
| Microsoft Corp. | | | 566,000 | | | | 11,003,040 | |
| Nintendo Co. Ltd. | | | 16,800 | | | | 6,449,494 | |
Oracle Corp.1 | | | 657,800 | | | | 11,662,794 | |
Salesforce.com, Inc.1 | | | 259,660 | | | | 8,311,717 | |
| | | | | | | | |
| | | | | | | | 61,308,981 | |
| | | | | | | | | |
Materials—6.3% | | | | | | | | |
Chemicals—6.3% | | | | | | | | |
| Ecolab, Inc. | | | 144,700 | | | | 5,086,205 | |
| Monsanto Co. | | | 481,200 | | | | 33,852,420 | |
| Mosaic Co. (The) | | | 216,400 | | | | 7,487,440 | |
| Potash Corp. of Saskatchewan, Inc. | | | 102,000 | | | | 7,468,440 | |
| Praxair, Inc. | | | 302,232 | | | | 17,940,488 | |
| | | | | | | | |
| | | | | | | | 71,834,993 | |
Telecommunication Services—2.6% | | | | | | | | |
Wireless Telecommunication Services—2.6% | | | | | | | | |
Crown Castle International Corp.1 | | | 938,600 | | | | 16,500,588 | |
NII Holdings, Inc.1 | | | 702,470 | | | | 12,770,905 | |
| | | | | | | | |
| | | | | | | | 29,271,493 | |
| | | | | | | | |
| Total Common Stocks (Cost $1,240,594,659) | | | | | | | 1,099,501,637 | |
| | | | | | | | | |
Other Securities—0.0% | | | | | | | | |
Seagate Technology International, Inc.1,2,3(Cost $—) | | | 325,000 | | | | 32,500 | |
| | | | | | | | | |
Investment Company—2.0% | | | | | | | | |
Oppenheimer Institutional Money Market Fund, Cl. E, 1.96%4,5 (Cost $22,383,442) | | | 22,383,442 | | | | 22,383,442 | |
Total Investments, at Value (Cost $1,262,978,101) | | | 98.1 | % | | | 1,121,917,579 | |
Other Assets Net of Liabilities | | | 1.9 | | | | 21,944,634 | |
| | | |
Net Assets | | | 100.0 | % | | $ | 1,143,862,213 | |
| | | |
Industry classifications are unaudited.
F2 | OPPENHEIMER CAPITAL APPRECIATION FUND/ VA
| | |
| Footnotes to Statement of Investments |
| |
| 1. | | Non-income producing security. |
| |
| 2. | | Illiquid security. The aggregate value of illiquid securities as of December 31, 2008 was $32,500, which represents less than 0.005% of the Fund’s net assets. See Note 6 of accompanying Notes. |
| |
| 3. | | Escrow shares received as the result of issuer reorganization. |
| |
| 4. | | Is or was an affiliate, as defined in the Investment Company Act of 1940, at or during the period ended December 31, 2008, by virtue of the Fund owning at least 5% of the voting securities of the issuer or as a result of the Fund and the issuer having the same investment adviser. Transactions during the period in which the issuer was an affiliate are as follows: |
| | | | | | | | | | | | | | | | | |
| | | Shares | | | Gross | | | Gross | | | Shares | |
| | | December 31, 2007 | | | Additions | | | Reductions | | | December 31, 2008 | |
| Oppenheimer Institutional Money Market Fund, Cl. E | | | 24,161,830 | | | | 325,338,559 | | | | 327,116,947 | | | | 22,383,442 | |
| | | | | | | | | |
| | | Value | | | Income | |
| Oppenheimer Institutional Money Market Fund, Cl. E | | $ | 22,383,442 | | | $ | 470,999 | |
5. Rate shown is the 7-day yield as of December 31, 2008.
Valuation Inputs
Various data inputs are used in determining the value of each of the Fund’s investments as of the reporting period end. These data inputs are categorized in the following hierarchy under applicable financial accounting standards:
1) Level 1—quoted prices in active markets for identical assets or liabilities (including securities actively traded on a securities exchange)
2) Level 2—inputs other than quoted prices that are observable for the asset (such as quoted prices for similar assets and market corroborated inputs such as interest rates, prepayment speeds, credit risks, etc.) 3)
Level 3—unobservable inputs (including the Manager’s own judgments about assumptions that market participants would use in pricing the asset).
The market value of the Fund’s investments was determined based on the following inputs as of December 31, 2008:
| | | | | | | | | |
| | | Investments in | | | Other Financial | |
| Valuation Description | | Securities | | | Instruments* | |
| Level 1—Quoted Prices | | $ | 1,009,989,949 | | | $ | — | |
| Level 2—Other Significant Observable Inputs | | | 111,927,630 | | | | (3,757 | ) |
| Level 3—Significant Unobservable Inputs | | | — | | | | — | |
| | | | | | | | | |
| Total | | $ | 1,121,917,579 | | | $ | (3,757 | ) |
* Other financial instruments include options written, currency contracts, futures, forwards and swap contracts. Currency contracts and forwards are reported at their unrealized appreciation/depreciation at measurement date, which represents the change in the contract’s value from trade date. Futures are reported at their variation margin at measurement date, which represents the amount due to/from the Fund at that date. Options written and swaps are reported at their market value at measurement date.
See the accompanying Notes for further discussion of the methods used in determining value of the Fund’s investments, and a summary of changes to the valuation techniques, if any, during the reporting period.
Foreign Currency Exchange Contracts as of December 31, 2008 are as follows:
| | | | | | | | | | | | | | | | | | | | | |
| | | | | | | Contract | | | | | | | | | | | |
| | | | | | | Amount | | | Expiration | | | | | | | Unrealized | |
| Contract Description | | Buy | | | (000s) | | | Date | | | Value | | | Depreciation | |
| Japanese Yen (JPY) | | Buy | | | 87,635 JPY | | | | 1/7/09 | | | $ | 966,131 | | | $ | 3,757 | |
See accompanying Notes to Financial Statements.
F3 | OPPENHEIMER CAPITAL APPRECIATION FUND/ VA
STATEMENT OF ASSETS AND LIABILITIES December 31, 2008
| | | | | |
Assets | | | | |
| Investments, at value—see accompanying statement of investments: | | | | |
| Unaffiliated companies (cost $1,240,594,659) | | $ | 1,099,534,137 | |
| Affiliated companies (cost $22,383,442) | | | 22,383,442 | |
| | | | |
| | | | 1,121,917,579 | |
| Cash | | | 2,067,950 | |
| Cash—foreign currencies (cost $1,053,483) | | | 1,048,664 | |
| Receivables and other assets: | | | | |
| Shares of beneficial interest sold | | | 14,968,791 | |
| Investments sold | | | 12,279,834 | |
| Interest and dividends | | | 2,025,178 | |
| Due from Manager | | | 61 | |
| Other | | | 27,401 | |
| | | | |
| Total assets | | | 1,154,335,458 | |
| | | | | |
Liabilities | | | | |
| Unrealized depreciation on foreign currency exchange contracts | | | 3,757 | |
| Payables and other liabilities: | | | | |
| Investments purchased | | | 9,666,341 | |
| Shares of beneficial interest redeemed | | | 452,312 | |
| Distribution and service plan fees | | | 195,096 | |
| Shareholder communications | | | 89,824 | |
| Trustees’ compensation | | | 15,301 | |
| Transfer and shareholder servicing agent fees | | | 1,720 | |
| Other | | | 48,894 | |
| | | | |
| Total liabilities | | | 10,473,245 | |
| | | | | |
Net Assets | | $ | 1,143,862,213 | |
| | | | |
| | | | | |
Composition of Net Assets | | | | |
| Par value of shares of beneficial interest | | $ | 44,679 | |
| Additional paid-in capital | | | 1,687,264,770 | |
| Accumulated net investment income | | | 1,288,398 | |
| Accumulated net realized loss on investments and foreign currency transactions | | | (403,693,868 | ) |
| Net unrealized depreciation on investments and translation of assets and liabilities denominated in foreign currencies | | | (141,041,766 | ) |
| | | | |
Net Assets | | $ | 1,143,862,213 | |
| | | | |
| | | | | |
Net Asset Value Per Share | | | | |
| Non-Service Shares: | | | | |
| Net asset value, redemption price per share and offering price per share (based on net assets of $829,931,181 and 32,330,539 shares of beneficial interest outstanding) | | $ | 25.67 | |
| Service Shares: | | | | |
| Net asset value, redemption price per share and offering price per share (based on net assets of $313,931,032 and 12,348,907 shares of beneficial interest outstanding) | | $ | 25.42 | |
See accompanying Notes to Financial Statements.
F4 | OPPENHEIMER CAPITAL APPRECIATION FUND/ VA
STATEMENT OF OPERATIONS For the Year Ended December 31, 2008
| | | | | |
Investment Income | | | | |
| Dividends: | | | | |
| Unaffiliated companies (net of foreign withholding taxes of $479,565) | | $ | 15,197,599 | |
| Affiliated companies | | | 470,999 | |
| Interest | | | 22,380 | |
| | | | |
| Total investment income | | | 15,690,978 | |
| | | | | |
Expenses | | | | |
| Management fees | | | 11,123,637 | |
| Distribution and service plan fees — Service shares | | | 1,131,349 | |
| Transfer and shareholder servicing agent fees: | | | | |
| Non-Service shares | | | 9,994 | |
| Service shares | | | 9,994 | |
| Shareholder communications: | | | | |
| Non-Service shares | | | 61,927 | |
| Service shares | | | 22,304 | |
| Trustees’ compensation | | | 42,605 | |
| Custodian fees and expenses | | | 32,095 | |
| Other | | | 71,052 | |
| | | | |
| Total expenses | | | 12,504,957 | |
| Less reduction to custodian expenses | | | (2,455 | ) |
| Less waivers and reimbursements of expenses | | | (15,619 | ) |
| | | | |
| Net expenses | | | 12,486,883 | |
| | | | | |
Net Investment Income | | | 3,204,095 | |
| | | | | |
Realized and Unrealized Gain (Loss) | | | | |
| Net realized gain (loss) on: | | | | |
| Investments from unaffiliated companies | | | (273,400,291 | ) |
| Foreign currency transactions | | | 8,524,454 | |
| | | | |
| Net realized loss | | | (264,875,837 | ) |
| Net change in unrealized depreciation on: | | | | |
| Investments | | | (659,463,207 | ) |
| Translation of assets and liabilities denominated in foreign currencies | | | (17,301,633 | ) |
| | | | |
| Net change in unrealized depreciation | | | (676,764,840 | ) |
| | | | | |
Net Decrease in Net Assets Resulting from Operations | | $ | (938,436,582 | ) |
| | | | |
See accompanying Notes to Financial Statements.
F5 | OPPENHEIMER CAPITAL APPRECIATION FUND/ VA
STATEMENTS OF CHANGES IN NET ASSETS
| | | | | | | | | |
| Year Ended December 31, | | 2008 | | | 2007 | |
Operations | | | | | | | | |
| Net investment income | | $ | 3,204,095 | | | $ | 1,866,225 | |
| Net realized gain (loss) | | | (264,875,837 | ) | | | 148,525,993 | |
| Net change in unrealized appreciation (depreciation) | | | (676,764,840 | ) | | | 130,279,389 | |
| | | |
| Net increase (decrease) in net assets resulting from operations | | | (938,436,582 | ) | | | 280,671,607 | |
| | | | | | | | | |
Dividends and/or Distributions to Shareholders | | | | | | | | |
| Dividends from net investment income: | | | | | | | | |
| Non-Service shares | | | (1,851,681 | ) | | | (3,712,463 | ) |
| Service shares | | | — | | | | (46,654 | ) |
| | | |
| | | | (1,851,681 | ) | | | (3,759,117 | ) |
| | | | | | | | | |
Beneficial Interest Transactions | | | | | | | | |
| Net increase (decrease) in net assets resulting from beneficial interest transactions: | | | | | | | | |
| Non-Service shares | | | (114,814,298 | ) | | | (179,103,584 | ) |
| Service shares | | | 20,286,295 | | | | 18,763,021 | |
| | | |
| | | | (94,528,003 | ) | | | (160,340,563 | ) |
| | | | | | | | | |
Net Assets | | | | | | | | |
| Total increase (decrease) | | | (1,034,816,266 | ) | | | 116,571,927 | |
| Beginning of period | | | 2,178,678,479 | | | | 2,062,106,552 | |
| | | |
| End of period (including accumulated net investment income of $1,288,398 and $511,377, respectively) | | $ | 1,143,862,213 | | | $ | 2,178,678,479 | |
| | | |
See accompanying Notes to Financial Statements.
F6 | OPPENHEIMER CAPITAL APPRECIATION FUND/ VA
FINANCIAL HIGHLIGHTS
| | | | | | | | | | | | | | | | | | | | | |
| Non-Service Shares Year Ended December 31, | | 2008 | | | 2007 | | | 2006 | | | 2005 | | | 2004 | |
| |
Per Share Operating Data | | | | | | | | | | | | | | | | | | | | |
| Net asset value, beginning of period | | $ | 47.18 | | | $ | 41.43 | | | $ | 38.52 | | | $ | 36.99 | | | $ | 34.70 | |
| Income (loss) from investment operations: | | | | | | | | | | | | | | | | | | | | |
Net investment income1 | | | .10 | | | | .07 | | | | .07 | | | | .18 | | | | .35 | 2 |
| Net realized and unrealized gain (loss) | | | (21.55 | ) | | | 5.78 | | | | 2.98 | | | | 1.68 | | | | 2.05 | |
| | | |
| Total from investment operations | | | (21.45 | ) | | | 5.85 | | | | 3.05 | | | | 1.86 | | | | 2.40 | |
| Dividends and/or distributions to shareholders: | | | | | | | | | | | | | | | | | | | | |
| Dividends from net investment income | | | (.06 | ) | | | (.10 | ) | | | (.14 | ) | | | (.33 | ) | | | (.11 | ) |
| Net asset value, end of period | | $ | 25.67 | | | $ | 47.18 | | | $ | 41.43 | | | $ | 38.52 | | | $ | 36.99 | |
| | | |
| | | | | | | | | | | | | | | | | | | | | |
Total Return, at Net Asset Value3 | | | (45.52 | )% | | | 14.15 | % | | | 7.95 | % | | | 5.10 | % | | | 6.93 | % |
| | | | | | | | | | | | | | | | | | | | | |
Ratios/Supplemental Data | | | | | | | | | | | | | | | | | | | | |
| Net assets, end of period (in thousands) | | $ | 829,931 | | | $ | 1,631,791 | | | $ | 1,598,967 | | | $ | 1,652,282 | | | $ | 1,770,273 | |
| Average net assets (in thousands) | | $ | 1,256,525 | | | $ | 1,631,686 | | | $ | 1,615,352 | | | $ | 1,658,910 | | | $ | 1,708,511 | |
Ratios to average net assets:4 | | | | | | | | | | | | | | | | | | | | |
| Net investment income | | | 0.25 | % | | | 0.15 | % | | | 0.17 | % | | | 0.47 | % | | | 0.99 | %2 |
| Total expenses | | | 0.66 | %5,6,7 | | | 0.65 | %5,6,7 | | | 0.67 | %5,6,7 | | | 0.66 | %6 | | | 0.66 | %6 |
| Portfolio turnover rate | | | 67 | % | | | 59 | % | | | 47 | % | | | 70 | % | | | 44 | % |
| | |
| 1. | | Per share amounts calculated based on the average shares outstanding during the period. |
| |
| 2. | | Net investment income per share and the net investment income ratio include $.16 and 0.43%, respectively, resulting from a special dividend from Microsoft Corp. in November 2004. |
| |
| 3. | | Assumes an investment on the business day before the first day of the fiscal period, with all dividends and distributions reinvested in additional shares on the reinvestment date, and redemption at the net asset value calculated on the last business day of the fiscal period. Total returns are not annualized for periods less than one full year. Total return information does not reflect expenses that apply at the separate account level or to related insurance products. Inclusion of these charges would reduce the total return figures for all periods shown. Returns do not reflect the deduction of taxes that a shareholder would pay on fund distributions or the redemption of fund shares. |
| |
| 4. | | Annualized for periods less than one full year. |
| |
| 5. | | Total expenses including indirect expenses from affiliated fund were as follows: |
| | | | | |
| Year Ended December 31, 2008 | | | 0.66 | % |
| Year Ended December 31, 2007 | | | 0.65 | % |
| Year Ended December 31, 2006 | | | 0.67 | % |
| 6. | | Reduction to custodian expenses less than 0.005%. |
| |
| 7. | | Waiver or reimbursement of indirect management fees less than 0.005%. |
See accompanying Notes to Financial Statements.
F7 | OPPENHEIMER CAPITAL APPRECIATION FUND/ VA
FINANCIAL HIGHLIGHTS Continued
| | | | | | | | | | | | | | | | | | | | | |
| Service Shares Year Ended December 31, | | 2008 | | | 2007 | | | 2006 | | | 2005 | | | 2004 | |
| |
Per Share Operating Data | | | | | | | | | | | | | | | | | | | | |
| Net asset value, beginning of period | | $ | 46.78 | | | $ | 41.09 | | | $ | 38.23 | | | $ | 36.73 | | | $ | 34.53 | |
| Income (loss) from investment operations: | | | | | | | | | | | | | | | | | | | | |
Net investment income (loss)1 | | | — | 2 | | | (.05 | ) | | | (.03 | ) | | | .08 | | | | .29 | 3 |
| Net realized and unrealized gain (loss) | | | (21.36 | ) | | | 5.74 | | | | 2.96 | | | | 1.69 | | | | 1.99 | |
| | | |
| Total from investment operations | | | (21.36 | ) | | | 5.69 | | | | 2.93 | | | | 1.77 | | | | 2.28 | |
| Dividends and/or distributions to shareholders: | | | | | | | | | | | | | | | | | | | | |
| Dividends from net investment income | | | — | | | | — | 2 | | | (.07 | ) | | | (.27 | ) | | | (.08 | ) |
| Net asset value, end of period | | $ | 25.42 | | | $ | 46.78 | | | $ | 41.09 | | | $ | 38.23 | | | $ | 36.73 | |
| | | |
| | | | | | | | | | | | | | | | | | | | | |
Total Return, at Net Asset Value4 | | | (45.66 | )% | | | 13.86 | % | | | 7.68 | % | | | 4.87 | % | | | 6.62 | % |
| | | | | | | | | | | | | | | | | | | | | |
Ratios/Supplemental Data | | | | | | | | | | | | | | | | | | | | |
| Net assets, end of period (in thousands) | | $ | 313,931 | | | $ | 546,887 | | | $ | 463,140 | | | $ | 381,852 | | | $ | 248,649 | |
| Average net assets (in thousands) | | $ | 454,558 | | | $ | 510,874 | | | $ | 426,539 | | | $ | 301,780 | | | $ | 184,273 | |
Ratios to average net assets:5 | | | | | | | | | | | | | | | | | | | | |
| Net investment income (loss) | | | 0.00 | %6 | | | (0.10 | )% | | | (0.08 | )% | | | 0.20 | % | | | 0.85 | %3 |
| Total expenses | | | 0.91 | %7,8,9 | | | 0.91 | %7,8,9 | | | 0.92 | %7,8,9 | | | 0.91 | %8 | | | 0.91 | %8 |
| Portfolio turnover rate | | | 67 | % | | | 59 | % | | | 47 | % | | | 70 | % | | | 44 | % |
| | |
| 1. | | Per share amounts calculated based on the average shares outstanding during the period. |
| |
| 2. | | Less than $0.005 per share. |
| |
| 3. | | Net investment income per share and the net investment income ratio include $.16 and 0.43%, respectively, resulting from a special dividend from Microsoft Corp. in November 2004. |
| |
| 4. | | Assumes an investment on the business day before the first day of the fiscal period, with all dividends and distributions reinvested in additional shares on the reinvestment date, and redemption at the net asset value calculated on the last business day of the fiscal period. Total returns are not annualized for periods less than one full year. Total return information does not reflect expenses that apply at the separate account level or to related insurance products. Inclusion of these charges would reduce the total return figures for all periods shown. Returns do not reflect the deduction of taxes that a shareholder would pay on fund distributions or the redemption of fund shares. |
| |
| 5. | | Annualized for periods less than one full year. |
| |
| 6. | | Less than 0.005%. |
| |
| 7. | | Total expenses including indirect expenses from affiliated fund were as follows: |
| | | | | |
| Year Ended December 31, 2008 | | | 0.91 | % |
| Year Ended December 31, 2007 | | | 0.91 | % |
| Year Ended December 31, 2006 | | | 0.92 | % |
| 8. | | Reduction to custodian expenses less than 0.005%. |
| |
| 9. | | Voluntary waiver or reimbursement of indirect management fees less than 0.005%. |
See accompanying Notes to Financial Statements.
F8 | OPPENHEIMER CAPITAL APPRECIATION FUND/ VA
NOTES TO FINANCIAL STATEMENTS
1. Significant Accounting Policies
Oppenheimer Capital Appreciation Fund/VA (the “Fund”) is a separate series of Oppenheimer Variable Account Funds, an open-end management investment company registered under the Investment Company Act of 1940, as amended. The Fund’s investment objective is to seek capital appreciation by investing in securities of well-known, established companies. The Fund’s investment adviser is OppenheimerFunds, Inc. (the “Manager”).
The Fund offers two classes of shares. Both classes are sold at their offering price, which is the net asset value per share, to separate investment accounts of participating insurance companies as an underlying investment for variable life insurance policies, variable annuity contracts or other investment products. The class of shares designated as Service shares is subject to a distribution and service plan. Both classes of shares have identical rights and voting privileges with respect to the Fund in general and exclusive voting rights on matters that affect that class alone. Earnings, net assets and net asset value per share may differ due to each class having its own expenses, such as transfer and shareholder servicing agent fees and shareholder communications, directly attributable to that class.
The following is a summary of significant accounting policies consistently followed by the Fund.
Securities Valuation. The Fund calculates the net asset value of its shares as of the close of the New York Stock Exchange (the “Exchange”), normally 4:00 P.M. Eastern time, on each day the Exchange is open for trading.
Effective for fiscal periods beginning after November 15, 2007, FASB Statement of Financial Accounting Standards No. 157, Fair Value Measurements, establishes a hierarchy for measuring fair value of assets and liabilities. As required by the standard, each investment asset or liability of the Fund is assigned a level at measurement date based on the significance and source of the inputs to its valuation. Quoted prices in active markets for identical securities are classified as “Level 1”, inputs other than quoted prices for an asset that are observable are classified as “Level 2” and unobservable inputs, including the Manager’s judgment about the assumptions that a market participant would use in pricing an asset or liability are classified as “Level 3”. The inputs used for valuing securities are not necessarily an indication of the risks associated with investing in those securities. A table summarizing the Fund’s investments under these levels of classification is included following the Statement of Investments.
Securities are valued using quoted market prices, when available, as supplied primarily either by portfolio pricing services approved by the Board of Trustees or dealers. These securities are typically classified within Level 1 or 2; however, they may be designated as Level 3 if the dealer or portfolio pricing service values a security through an internal model with significant unobservable market data inputs.
Securities traded on a registered U.S. securities exchange are valued based on the last sale price of the security reported on the principal exchange on which traded, prior to the time when the Fund’s assets are valued. Securities whose principal exchange is NASDAQ® are valued based on the official closing prices reported by NASDAQ prior to the time when the Fund’s assets are valued. In the absence of a sale, the security is valued at the last sale price on the prior trading day, if it is within the spread of the current day’s closing “bid” and “asked” prices, and if not, at the current day’s closing bid price. A foreign security traded on a foreign exchange is valued based on the last sale price on the principal exchange on which the security is traded, as identified by the portfolio pricing service used by the Manager, prior to the time when the Fund’s assets are valued. In the absence of a sale, the security is valued at the most recent official closing price on the principal exchange on which it is traded.
Shares of a registered investment company that are not traded on an exchange are valued at that investment company’s net asset value per share.
Corporate, government and municipal debt instruments having a remaining maturity in excess of sixty days and all mortgage-backed securities, collateralized mortgage obligations and other asset-backed securities are valued at the mean between the “bid” and “asked” prices.
“Money market-type” debt instruments with remaining maturities of sixty days or less are valued at cost adjusted by the amortization of discount or premium to maturity (amortized cost), which approximates market value. These securities are typically designated as Level 2.
F9 | OPPENHEIMER CAPITAL APPRECIATION FUND/ VA
NOTES TO FINANCIAL STATEMENTS Continued
1. Significant Accounting Policies Continued
In the absence of a readily available quoted market price, including for securities whose values have been materially affected by what the Manager identifies as a significant event occurring before the Fund’s assets are valued but after the close of the securities’ respective exchanges, the Manager, acting through its internal valuation committee, in good faith determines the fair valuation of that asset using consistently applied procedures under the supervision of the Board of Trustees (which reviews those fair valuations by the Manager). Those procedures include certain standardized methodologies to fair value securities. Such methodologies include, but are not limited to, pricing securities initially at cost and subsequently adjusting the value based on: changes in company specific fundamentals, changes in an appropriate securities index, or changes in the value of similar securities which may be adjusted for any discounts related to resale restrictions. When possible, such methodologies use observable market inputs such as quoted prices of similar securities, observable interest rates, currency rates and yield curves. The methodologies used for valuing securities are not necessarily an indication of the risks associated with investing in those securities.
Fair valued securities may be classified as “Level 3” if the valuation primarily reflects the Manager’s own assumptions about the inputs that market participants would use in valuing such securities.
There have been no significant changes to the fair valuation methodologies during the period.
Foreign Currency Translation. The Fund’s accounting records are maintained in U.S. dollars. The values of securities denominated in foreign currencies and amounts related to the purchase and sale of foreign securities and foreign investment income are translated into U.S. dollars as of the close of the Exchange, normally 4:00 P.M. Eastern time, on each day the Exchange is open for trading. Foreign exchange rates may be valued primarily using a reliable bank, dealer or service authorized by the Board of Trustees.
Reported net realized gains and losses from foreign currency transactions arise from sales of portfolio securities, sales and maturities of short-term securities, sales of foreign currencies, exchange rate fluctuations between the trade and settlement dates on securities transactions, and the difference between the amounts of dividends, interest, and foreign withholding taxes recorded on the Fund’s books and the U.S. dollar equivalent of the amounts actually received or paid. Net unrealized appreciation and depreciation on the translation of assets and liabilities denominated in foreign currencies arise from changes in the values of assets and liabilities, including investments in securities at fiscal period end, resulting from changes in exchange rates.
The effect of changes in foreign currency exchange rates on investments is separately identified from the fluctuations arising from changes in market values of securities held and reported with all other foreign currency gains and losses in the Fund’s Statement of Operations.
Investment in Oppenheimer Institutional Money Market Fund. The Fund is permitted to invest daily available cash balances in an affiliated money market fund. The Fund may invest the available cash in Class E shares of Oppenheimer Institutional Money Market Fund (“IMMF”) to seek current income while preserving liquidity. IMMF is a registered open-end management investment company, regulated as a money market fund under the Investment Company Act of 1940, as amended. The Manager is also the investment adviser of IMMF. The Fund’s investment in IMMF is included in the Statement of Investments. As a shareholder, the Fund is subject to its proportional share of IMMF’s Class E expenses, including its management fee. The Manager will waive fees and/or reimburse Fund expenses in an amount equal to the indirect management fees incurred through the Fund’s investment in IMMF.
Investments With Off-Balance Sheet Market Risk. The Fund enters into financial instrument transactions (such as swaps, futures, options and other derivatives) that may have off-balance sheet market risk. Off-balance sheet market risk exists when the maximum potential loss on a particular financial instrument is greater than the value of such financial instrument, as reflected in the Fund’s Statement of Assets and Liabilities.
Allocation of Income, Expenses, Gains and Losses. Income, expenses (other than those attributable to a specific class), gains and losses are allocated on a daily basis to each class of shares based upon the relative proportion of net assets
F10 | OPPENHEIMER CAPITAL APPRECIATION FUND/ VA
represented by such class. Operating expenses directly attributable to a specific class are charged against the operations of that class.
Federal Taxes. The Fund intends to comply with provisions of the Internal Revenue Code applicable to regulated investment companies and to distribute substantially all of its investment company taxable income, including any net realized gain on investments not offset by capital loss carryforwards, if any, to shareholders. Therefore, no federal income or excise tax provision is required. The Fund files income tax returns in U.S. federal and applicable state jurisdictions. The statute of limitations on the Fund’s tax return filings generally remain open for the three preceding fiscal reporting period ends.
The tax components of capital shown in the following table represent distribution requirements the Fund must satisfy under the income tax regulations, losses the Fund may be able to offset against income and gains realized in future years and unrealized appreciation or depreciation of securities and other investments for federal income tax purposes.
| | | | | | | | | | | | | |
| | | | | | | | | | | Net Unrealized | |
| | | | | | | | | | | Depreciation | |
| | | | | | | | | | | Based on Cost of | |
| Undistributed | | Undistributed | | | Accumulated | | | Securities and Other | |
| Net Investment | | Long-Term | | | Loss | | | Investments for Federal | |
| Income | | Gain | | | Carryforward1,2,3,4,5 | | | Income Tax Purposes | |
| |
| $2,994,641 | | $ | — | | | $ | 382,458,902 | | | $ | 162,785,069 | |
| | |
| 1. | | As of December 31, 2008, the Fund had $243,920,551 of net capital loss carryforwards available to offset future realized capital gains, if any, and thereby reduce future taxable gain distributions. As of December 31, 2008, details of the capital loss carryforwards were as follows: |
| | | | | |
| Expiring | | | | |
| |
| 2011 | | $ | 96,270,872 | |
| 2013 | | | 34,677,838 | |
| 2016 | | | 112,971,841 | |
| | | | |
| Total | | $ | 243,920,551 | |
| | | | |
| 2. | | As of December 31, 2008, the Fund had $138,475,074 of post-October losses available to offset future realized capital gains, if any. Such losses, if unutilized, will expire in 2017. |
| |
| 3. | | The Fund had $63,277 of post-October foreign currency losses which were deferred. |
| |
| 4. | | During the fiscal year ended December 31, 2008, the Fund did not utilize any capital loss carryforward. |
| |
| 5. | | During the fiscal year ended December 31, 2007, the Fund utilized $151,992,802 of capital loss carryforward to offset capital gains realized in that fiscal year. |
Net investment income (loss) and net realized gain (loss) may differ for financial statement and tax purposes. The character of dividends and distributions made during the fiscal year from net investment income or net realized gains may differ from their ultimate characterization for federal income tax purposes. Also, due to timing of dividends and distributions, the fiscal year in which amounts are distributed may differ from the fiscal year in which the income or net realized gain was recorded by the Fund.
Accordingly, the following amounts have been reclassified for December 31, 2008. Net assets of the Fund were unaffected by the reclassifications.
| | | | | |
| | | Reduction | |
| Reduction | | to Accumulated Net | |
| to Accumulated Net | | Realized Loss | |
| Investment Income | | on Investments | |
| |
| $575,393 | | $ | 575,393 | |
F11 | OPPENHEIMER CAPITAL APPRECIATION FUND/ VA
NOTES TO FINANCIAL STATEMENTS Continued
1. Significant Accounting Policies Continued
The tax character of distributions paid during the years ended December 31, 2008 and December 31, 2007 was as follows:
| | | | | | | | | |
| | | Year Ended | | | Year Ended | |
| | | December 31, 2008 | | | December 31, 2007 | |
| |
| Distributions paid from: | | | | | | | | |
| Ordinary income | | $ | 1,851,681 | | | $ | 3,759,117 | |
The aggregate cost of securities and other investments and the composition of unrealized appreciation and depreciation of securities and other investments for federal income tax purposes as of December 31, 2008 are noted in the following table. The primary difference between book and tax appreciation or depreciation of securities and other investments, if applicable, is attributable to the tax deferral of losses or tax realization of financial statement unrealized gain or loss.
| | | | | |
| Federal tax cost of securities | | $ | 1,284,725,161 | |
| Federal tax cost of other investments | | | 2,019,614 | |
| | | | |
| Total federal tax cost | | $ | 1,286,744,775 | |
| | | | |
| | | | | |
| Gross unrealized appreciation | | $ | 97,073,159 | |
| Gross unrealized depreciation | | | (259,858,228 | ) |
| | | | |
| Net unrealized depreciation | | $ | (162,785,069 | ) |
| | | | |
Trustees’ Compensation. The Board of Trustees has adopted a compensation deferral plan for independent trustees that enables trustees to elect to defer receipt of all or a portion of the annual compensation they are entitled to receive from the Fund. For purposes of determining the amount owed to the Trustee under the plan, deferred amounts are treated as though equal dollar amounts had been invested in shares of the Fund or in other Oppenheimer funds selected by the Trustee. The Fund purchases shares of the funds selected for deferral by the Trustee in amounts equal to his or her deemed investment, resulting in a Fund asset equal to the deferred compensation liability. Such assets are included as a component of “Other” within the asset section of the Statement of Assets and Liabilities. Deferral of trustees’ fees under the plan will not affect the net assets of the Fund, and will not materially affect the Fund’s assets, liabilities or net investment income per share. Amounts will be deferred until distributed in accordance to the compensation deferral plan.
Dividends and Distributions to Shareholders. Dividends and distributions to shareholders, which are determined in accordance with income tax regulations and may differ from U.S. generally accepted accounting principles, are recorded on the ex-dividend date. Income and capital gain distributions, if any, are declared and paid annually or at other times as deemed necessary by the Manager.
Investment Income. Dividend income is recorded on the ex-dividend date or upon ex-dividend notification in the case of certain foreign dividends where the ex-dividend date may have passed. Non-cash dividends included in dividend income, if any, are recorded at the fair market value of the securities received. Interest income is recognized on an accrual basis. Discount and premium, which are included in interest income on the Statement of Operations, are amortized or accreted daily.
Custodian Fees. “Custodian fees and expenses” in the Statement of Operations may include interest expense incurred by the Fund on any cash overdrafts of its custodian account during the period. Such cash overdrafts may result from the effects of failed trades in portfolio securities and from cash outflows resulting from unanticipated shareholder redemption activity. The Fund pays interest to its custodian on such cash overdrafts, to the extent they are not offset by positive cash balances maintained by the Fund, at a rate equal to the Federal Funds Rate plus 0.50%. The “Reduction to custodian expenses” line item, if applicable, represents earnings on cash balances maintained by the Fund during the period. Such interest expense and other custodian fees may be paid with these earnings.
F12 | OPPENHEIMER CAPITAL APPRECIATION FUND/ VA
Security Transactions. Security transactions are recorded on the trade date. Realized gains and losses on securities sold are determined on the basis of identified cost.
Indemnifications. The Fund’s organizational documents provide current and former trustees and officers with a limited indemnification against liabilities arising in connection with the performance of their duties to the Fund. In the normal course of business, the Fund may also enter into contracts that provide general indemnifications. The Fund’s maximum exposure under these arrangements is unknown as this would be dependent on future claims that may be made against the Fund. The risk of material loss from such claims is considered remote.
Other. The preparation of financial statements in conformity with accounting principles generally accepted in the United States of America requires management to make estimates and assumptions that affect the reported amounts of assets and liabilities and disclosure of contingent assets and liabilities at the date of the financial statements and the reported amounts of increases and decreases in net assets from operations during the reporting period. Actual results could differ from those estimates.
2. Shares of Beneficial Interest
The Fund has authorized an unlimited number of $0.001 par value shares of beneficial interest of each class. Transactions in shares of beneficial interest were as follows:
| | | | | | | | | | | | | | | | | |
| | | Year Ended December 31, 2008 | | | Year Ended December 31, 2007 | |
| | | Shares | | | Amount | | | Shares | | | Amount | |
| |
Non-Service Shares | | | | | | | | | | | | | | | | |
| Sold | | | 5,158,989 | | | $ | 168,163,089 | | | | 3,540,352 | | | $ | 160,454,788 | |
| Dividends and/or distributions reinvested | | | 45,642 | | | | 1,851,681 | | | | 88,964 | | | | 3,712,463 | |
| Redeemed | | | (7,457,105 | ) | | | (284,829,068 | ) | | | (7,638,575 | ) | | | (343,270,835 | ) |
| | | |
| Net decrease | | | (2,252,474 | ) | | $ | (114,814,298 | ) | | | (4,009,259 | ) | | $ | (179,103,584 | ) |
| | | |
| | | | | | | | | | | | | | | | | |
Service Shares | | | | | | | | | | | | | | | | |
| Sold | | | 2,605,573 | | | $ | 92,870,576 | | | | 2,132,039 | | | $ | 95,722,464 | |
| Dividends and/or distributions reinvested | | | — | | | | — | | | | 1,121 | | | | 46,477 | |
| Redeemed | | | (1,946,810 | ) | | | (72,584,281 | ) | | | (1,714,792 | ) | | | (77,005,920 | ) |
| | | |
| Net increase | | | 658,763 | | | $ | 20,286,295 | | | | 418,368 | | | $ | 18,763,021 | |
| | | |
3. Purchases and Sales of Securities
The aggregate cost of purchases and proceeds from sales of securities, other than short-term obligations and investments in Oppenheimer Institutional Money Market Fund and OFI Liquid Assets Fund, LLC, for the year ended December 31, 2008, were as follows:
| | | | | | | | | |
| | | Purchases | | | Sales | |
| |
| Investment securities | | $ | 1,153,045,787 | | | $ | 1,267,426,544 | |
4. Fees and Other Transactions with Affiliates
Management Fees. Under the investment advisory agreement, the Fund pays the Manager a management fee based on the daily net assets of the Fund at an annual rate as shown in the following table:
| | | | | |
| Fee Schedule | | | | |
| |
| Up to$200 million | | | 0.75 | % |
| Next $200 million | | | 0.72 | |
| Next $200 million | | | 0.69 | |
| Next $200 million | | | 0.66 | |
| Over $800 million | | | 0.60 | |
F13 | OPPENHEIMER CAPITAL APPRECIATION FUND/ VA
NOTES TO FINANCIAL STATEMENTS Continued
4. Fees and Other Transactions with Affiliates Continued
Transfer Agent Fees. OppenheimerFunds Services (“OFS”), a division of the Manager, acts as the transfer and shareholder servicing agent for the Fund. The Fund pays OFS a per account fee. For the year ended December 31, 2008, the Fund paid $20,074 to OFS for services to the Fund.
Additionally, funds offered in variable annuity separate accounts are subject to minimum fees of $10,000 per class, for class level assets of $10 million or more. Each class is subject to the minimum fee in the event that the per account fee does not equal or exceed the applicable minimum fee.
Distribution and Service Plan for Service Shares. The Fund has adopted a Distribution and Service Plan (the “Plan”) in accordance with Rule 12b-1 under the Investment Company Act of 1940 for Service shares to pay OppenheimerFunds Distributor, Inc. (the “Distributor”), for distribution related services, personal service and account maintenance for the Fund’s Service shares. Under the Plan, payments are made periodically at an annual rate of up to 0.25% of the average annual net assets of Service shares of the Fund. The Distributor currently uses all of those fees to compensate sponsor(s) of the insurance product that offers Fund shares, for providing personal service and maintenance of accounts of their variable contract owners that hold Service shares. These fees are paid out of the Fund’s assets on an on-going basis and increase operating expenses of the Service shares, which results in lower performance compared to the Fund’s shares that are not subject to a service fee. Fees incurred by the Fund under the Plan are detailed in the Statement of Operations.
Waivers and Reimbursements of Expenses. OFS has voluntarily agreed to limit transfer and shareholder servicing agent fees for all classes to 0.35% of average annual net assets per class. This undertaking may be amended or withdrawn at any time.
The Manager will waive fees and/or reimburse Fund expenses in an amount equal to the indirect management fees incurred through the Fund’s investment in IMMF. During the year ended December 31, 2008, the Manager waived $15,619 for IMMF management fees.
5. Foreign Currency Exchange Contracts
The Fund may enter into foreign currency exchange contracts (“forward contracts”) for the purchase or sale of a foreign currency at a negotiated rate at a future date.
Forward contracts are reported on a schedule following the Statement of Investments. Forward contracts will be valued daily based upon the closing prices of the forward currency rates determined at the close of the Exchange as provided by a bank, dealer or pricing service. The resulting unrealized appreciation (depreciation) is reported in the Statement of Assets and Liabilities as a receivable or payable and in the Statement of Operations within the change in unrealized appreciation (depreciation). At contract close, the difference between the original cost of the contract and the value at the close date is recorded as a realized gain (loss) in the Statement of Operations.
Risks to the Fund include both market and credit risk. Market risk is the risk that the value of the forward contract will depreciate due to unfavorable changes in the exchange rates. Credit risk arises from the possibility that the counterparty will default. If the counterparty defaults, the Fund’s loss will consist of the net amount of contractual payments that the Fund has not yet received.
6. Illiquid Securities
As of December 31, 2008, investments in securities included issues that are illiquid. Investments may be illiquid because they do not have an active trading market, making it difficult to value them or dispose of them promptly at an acceptable price. The Fund will not invest more than 15% of its net assets (determined at the time of purchase and reviewed periodically) in illiquid securities. Securities that are illiquid are marked with an applicable footnote on the Statement of Investments.
F14 | OPPENHEIMER CAPITAL APPRECIATION FUND/ VA
7. Recent Accounting Pronouncement
In March 2008, the Financial Accounting Standards Board (“FASB”) issued Statement on Financial Accounting Standards (“SFAS”) No. 161, Disclosures about Derivative Instruments and Hedging Activities. This standard requires enhanced disclosures about derivative and hedging activities, including qualitative disclosures about how and why the Fund uses derivative instruments, how these activities are accounted for, and their effect on the Fund’s financial position, financial performance and cash flows. SFAS No. 161 is effective for financial statements issued for fiscal years and interim periods beginning after November 15, 2008. At this time, management is evaluating the implications of SFAS No. 161 and its impact on the Fund’s financial statements and related disclosures.
8. Change In Independent Registered Public Accounting Firm (Unaudited)
At a meeting held on August 20, 2008, the Board of Trustees of the Fund appointed KPMG LLP as the independent registered public accounting firm to the Fund for fiscal year 2009, replacing the firm of Deloitte & Touche LLP, effective at the conclusion of the fiscal 2008 audit. During the two most recent fiscal years the audit reports of Deloitte & Touche LLP contained no adverse opinion or disclaimer of opinion and were not qualified or modified as to uncertainty, audit scope or accounting principles. Further, there were no disagreements between the Fund and Deloitte & Touche LLP on accounting principles, financial statement disclosure or audit scope, which if not resolved to the satisfaction of Deloitte & Touche LLP would have caused it to make reference to the disagreements in connection with its reports.
F15 | OPPENHEIMER CAPITAL APPRECIATION FUND/ VA
REPORT OF INDEPENDENT REGISTERED PUBLIC ACCOUNTING FIRM
To the Board of Trustees and Shareholders of Oppenheimer Capital Appreciation Fund/VA:
We have audited the accompanying statement of assets and liabilities of Oppenheimer Capital Appreciation Fund/VA (the “Fund”), a series of Oppenheimer Variable Account Funds, including the statement of investments, as of December 31, 2008, and the related statement of operations for the year then ended, the statements of changes in net assets for each of the two years in the period then ended, and the financial highlights for each of the five years in the period then ended. These financial statements and financial highlights are the responsibility of the Fund’s management. Our responsibility is to express an opinion on these financial statements and financial highlights based on our audits.
We conducted our audits in accordance with the standards of the Public Company Accounting Oversight Board (United States). Those standards require that we plan and perform the audit to obtain reasonable assurance about whether the financial statements and financial highlights are free of material misstatement. The Fund is not required to have, nor were we engaged to perform, an audit of its internal control over financial reporting. Our audits included consideration of internal control over financial reporting as a basis for designing audit procedures that are appropriate in the circumstances, but not for the purpose of expressing an opinion on the effectiveness of the Fund’s internal control over financial reporting. Accordingly, we express no such opinion. An audit also includes examining, on a test basis, evidence supporting the amounts and disclosures in the financial statements, assessing the accounting principles used and significant estimates made by management, as well as evaluating the overall financial statement presentation. Our procedures included confirmation of securities owned as of December 31, 2008, by correspondence with the custodian and brokers; where replies were not received from brokers, we performed other auditing procedures. We believe that our audits provide a reasonable basis for our opinion.
In our opinion, the financial statements and financial highlights referred to above present fairly, in all material respects, the financial position of the Fund as of December 31, 2008, the results of its operations for the year then ended, the changes in its net assets for each of the two years in the period then ended, and the financial highlights for each of the five years in the period then ended, in conformity with accounting principles generally accepted in the United States of America.
Deloitte & Touche LLP
Denver, Colorado
February 11, 2009
F16 | OPPENHEIMER CAPITAL APPRECIATION FUND/ VA
FEDERAL INCOME TAX INFORMATION Unaudited
In early 2009, if applicable, shareholders of record received information regarding all dividends and distributions paid to them by the Fund during calendar year 2008. Regulations of the U.S. Treasury Department require the Fund to report this information to the Internal Revenue Service.
Dividends, if any, paid by the Fund during the fiscal year ended December 31, 2008 which are not designated as capital gain distributions should be multiplied by 100% to arrive at the amount eligible for the corporate dividend-received deduction.
The foregoing information is presented to assist shareholders in reporting distributions received from the Fund to the Internal Revenue Service. Because of the complexity of the federal regulations which may affect your individual tax return and the many variations in state and local tax regulations, we recommend that you consult your tax advisor for specific guidance.
7 | OPPENHEIMER CAPITAL APPRECIATION FUND/ VA
BOARD APPROVAL OF THE FUND’S INVESTMENT ADVISORY AGREEMENT Unaudited
Each year, the Board of Trustees (the “Board”), including a majority of the independent Trustees, is required to determine whether to renew the Fund’s investment advisory agreement (the “Agreement”). The Investment Company Act of 1940, as amended, requires that the Board request and evaluate, and that the Manager provide, such information as may be reasonably necessary to evaluate the terms of the Agreement. The Board employs an independent consultant to prepare a report that provides information, including comparative information, the Board requests for that purpose. In addition, the Board receives information throughout the year regarding Fund services, fees, expenses and performance.
The Manager and the independent consultant provided information to the Board on the following factors: (i) the nature, quality and extent of the Manager’s services, (ii) the investment performance of the Fund and the Manager, (iii) the fees and expenses of the Fund, including comparative expense information, (iv) the profitability of the Manager and its affiliates, including an analysis of the cost of providing services, (v) whether economies of scale are realized as the Fund grows and whether fee levels reflect these economies of scale for Fund investors and (vi) other benefits to the Manager from its relationship with the Fund. The Board was aware that there are alternatives to retaining the Manager.
Outlined below is a summary of the principal information considered by the Board as well as the Board’s conclusions.
Nature, Quality and Extent of Services. The Board considered information about the nature, quality and extent of the services provided to the Fund and information regarding the Manager’s key personnel who provide such services. The Manager’s duties include providing the Fund with the services of the portfolio manager and the Manager’s investment team, who provide research, analysis and other advisory services in regard to the Fund’s investments; securities trading services; oversight of third party service providers; monitoring compliance with applicable Fund policies and procedures and adherence to the Fund’s investment restrictions. The Manager is responsible for providing certain administrative services to the Fund as well. Those services include providing and supervising all administrative and clerical personnel who are necessary in order to provide effective corporate administration for the Fund; compiling and maintaining records with respect to the Fund’s operations; preparing and filing reports required by the Securities and Exchange Commission; preparing periodic reports regarding the operations of the Fund for its shareholders; preparing proxy materials for shareholder meetings; and preparing the registration statements required by Federal and state securities laws for the sale of the Fund’s shares. The Manager also provides the Fund with office space, facilities and equipment.
The Board also considered the quality of the services provided and the quality of the Manager’s resources that are available to the Fund. The Board took account of the fact that the Manager has had over forty years of experience as an investment adviser and that its assets under management rank it among the top mutual fund managers in the United States. The Board evaluated the Manager’s advisory, administrative, accounting, legal and compliance services, and information the Board has received regarding the experience and professional qualifications of the Manager’s key personnel and the size and functions of its staff. In its evaluation of the quality of the portfolio management services provided, the Board considered the experience of Marc Baylin, the portfolio manager for the Fund, and the Manager’s investment team and analysts. The Board members also considered the totality of their experiences with the Manager as Directors or Trustees of the Fund and other funds advised by the Manager. The Board considered information regarding the quality of services provided by affiliates of the Manager, which its members have become knowledgeable about in connection with the renewal of the Fund’s service agreements. The Board concluded that, in light of the Manager’s experience, reputation, personnel, operations and resources, the Fund benefits from the services provided under the Agreement.
Investment Performance of the Manager and the Fund. Throughout the year, the Manager provided information on the investment performance of the Fund and the Manager, including comparative performance information. The Board also reviewed information, prepared by the Manager and by the independent consultant, comparing the Fund’s historical performance to relevant market indices and to the performance of other large-cap growth funds underlying
8 | OPPENHEIMER CAPITAL APPRECIATION FUND/ VA
variable insurance products. The Board considered that the Fund outperformed its performance universe median during the one-, five- and ten-year periods, though it underperformed its performance universe median during the three-year period. The Board also noted the recent addition of a senior research analyst for the Growth Equity Team and that, coupled with newer management, it has had a favorable effect on performance.
Costs of Services by the Manager. The Board reviewed the fees paid to the Manager and the other expenses borne by the Fund. The Board also considered the comparability of the fees charged and the services provided to the Fund to the fees and services for other clients or accounts advised by the Manager. The independent consultant provided comparative data in regard to the fees and expenses of the Fund and large-cap growth funds underlying variable insurance products with comparable asset levels and distribution features. The Board considered that the Fund’s total expenses were competitive vis-à-vis its expense group median. In reviewing the fees and expenses charged to the VA Funds, the Board considered the Manager’s assertion that, because of the disparity among VA funds in how insurance companies may be compensated for the services they provide to shareholders, when comparing the expenses of the various VA funds it is most appropriate to focus on the total expenses rather than on the management fees. Accordingly, while the Board reviewed and considered all expenses in its consideration of the Advisory Agreement, it paid particular attention to total expenses.
Economies of Scale and Profits Realized by the Manager. The Board considered information regarding the Manager’s costs in serving as the Fund’s investment adviser, including the costs associated with the personnel and systems necessary to manage the Fund, and information regarding the Manager’s profitability from its relationship with the Fund. The Board reviewed whether the Manager may realize economies of scale in managing and supporting the Fund. The Board noted that the Fund currently has management fee breakpoints, which are intended to share with Fund shareholders economies of scale that may exist as the Fund’s assets grow.
Other Benefits to the Manager. In addition to considering the profits realized by the Manager, the Board considered information that was provided regarding the direct and indirect benefits the Manager receives as a result of its relationship with the Fund, including compensation paid to the Manager’s affiliates and research provided to the Manager in connection with permissible brokerage arrangements (soft dollar arrangements). The Board also considered that the Manager must be able to pay and retain experienced professional personnel at competitive rates to provide quality services to the Fund and that maintaining the financial viability of the Manager is important in order for the Manager to continue to provide significant services to the Fund and its shareholders.
Conclusions. These factors were also considered by the independent Trustees meeting separately from the full Board, assisted by experienced counsel to the Fund and to the independent Trustees. Fund counsel and the independent Trustees’ counsel are independent of the Manager within the meaning and intent of the Securities and Exchange Commission Rules.
Based on its review of the information it received and its evaluations described above, the Board, including a majority of the independent Trustees, decided to continue the Agreement for another year. In arriving at this decision, the Board did not single out any factor or factors as being more important than others, but considered all of the above information, and considered the terms and conditions of the Agreement, including the management fee, in light of all of the surrounding circumstances.
9 | OPPENHEIMER CAPITAL APPRECIATION FUND/ VA
PORTFOLIO PROXY VOTING POLICIES AND PROCEDURES; UPDATES TO STATEMENTS OF INVESTMENTS Unaudited
The Fund has adopted Portfolio Proxy Voting Policies and Procedures under which the Fund votes proxies relating to securities (“portfolio proxies”) held by the Fund. A description of the Fund’s Portfolio Proxy Voting Policies and Procedures is available (i) without charge, upon request, by calling the Fund toll-free at 1.800.525.7048, (ii) on the Fund’s website at www.oppenheimerfunds.com, and (iii) on the SEC’s website at www.sec.gov. In addition, the Fund is required to file Form N-PX, with its complete proxy voting record for the 12 months ended June 30th, no later than August 31st of each year. The Fund’s voting record is available (i) without charge, upon request, by calling the Fund toll-free at 1.800.525.7048, and (ii) in the Form N-PX filing on the SEC’s website at www.sec.gov.
The Fund files its complete schedule of portfolio holdings with the SEC for the first quarter and the third quarter of each fiscal year on Form N-Q. The Fund’s Form N-Q filings are available on the SEC’s website at http://www.sec.gov. Those forms may be reviewed and copied at the SEC’s Public Reference Room in Washington, D.C. Information on the operation of the Public Reference Room may be obtained by calling 1-800-SEC-0330.
10 | OPPENHEIMER CAPITAL APPRECIATION FUND/ VA
TRUSTEES AND OFFICERS Unaudited
| | | |
Name, Position(s) Held with
the Fund, Length of Service,
Age | | Principal Occupation(s) During the Past 5 Years; Other Trusteeships/Directorships Held; Number of Portfolios in
the Fund Complex Currently Overseen |
| |
INDEPENDENT
TRUSTEES | | The address of each Trustee in the chart below is 6803 S. Tucson Way, Centennial, Colorado 80112-3924. Each Trustee serves for an indefinite term, or until his or her resignation, retirement, death or removal. |
| | | |
William L. Armstrong,
Chairman of the Board
of Trustees (since 2003),
Trustee (since 1999)
Age: 71 | | President, Colorado Christian University (since 2006); Chairman, Cherry Creek Mortgage Company (since 1991), Chairman, Centennial State Mortgage Company (since 1994), Chairman, The El Paso Mortgage Company (since 1993); Chairman, Ambassador Media Corporation (since 1984); Chairman, Broadway Ventures (since 1984); Director of Helmerich & Payne, Inc. (oil and gas drilling/production company) (since 1992), Campus Crusade for Christ (non-profit) (since 1991); Former Director, The Lynde and Harry Bradley Foundation, Inc. (non-profit organization) (2002-2006); former Chairman of: Transland Financial Services, Inc. (private mortgage banking company) (1997-2003), Great Frontier Insurance (1995-2000), Frontier Real Estate, Inc. (residential real estate brokerage) (1994-2000) and Frontier Title (title insurance agency) (1995-2000); former Director of the following: UNUMProvident (insurance company) (1991-2004), Storage Technology Corporation (computer equipment company) (1991-2003) and International Family Entertainment (television channel) (1992-1997); U.S. Senator (January 1979-January 1991). Oversees 41 portfolios in the OppenheimerFunds complex. |
| | | �� |
George C. Bowen,
Trustee (since 1999)
Age: 72 | | Assistant Secretary and Director of Centennial Asset Management Corporation (December 1991-April 1999); President, Treasurer and Director of Centennial Capital Corporation (June 1989-April 1999); Chief Executive Officer and Director of MultiSource Services, Inc. (March 1996-April 1999); Mr. Bowen held several positions with the Manager and with subsidiary or affiliated companies of the Manager (September 1987-April 1999). Oversees 41 portfolios in the OppenheimerFunds complex. |
| | | |
Edward L. Cameron,
Trustee (since 1999)
Age: 70 | | Member of The Life Guard of Mount Vernon (George Washington historical site) (June 2000-June 2006); Partner of PricewaterhouseCoopers LLP (accounting firm) (July 1974-June 1999); Chairman of Price Waterhouse LLP Global Investment Management Industry Services Group (accounting firm) (July 1994-June 1998). Oversees 41 portfolios in the OppenheimerFunds complex. |
| | | |
Jon S. Fossel,
Trustee (since 1990)
Age: 66 | | Director of UNUMProvident (insurance company) (since June 2002); Director of Northwestern Energy Corp. (public utility corporation) (since November 2004); Director of P.R. Pharmaceuticals (October 1999-October 2003); Director of Rocky Mountain Elk Foundation (non-profit organization) (February 1998-February 2003 and February 2005-February 2007); Chairman and Director (until October 1996) and President and Chief Executive Officer (until October 1995) of the Manager; President, Chief Executive Officer and Director of the following: Oppenheimer Acquisition Corp. (“OAC”) (parent holding company of the Manager), Shareholders Services, Inc. and Shareholder Financial Services, Inc. (until October 1995). Oversees 41 portfolios in the OppenheimerFunds complex. |
| | | |
Sam Freedman,
Trustee (since 1996)
Age: 68 | | Director of Colorado UpLIFT (charitable organization) (since September 1984). Mr. Freedman held several positions with the Manager and with subsidiary or affiliated companies of the Manager (until October 1994). Oversees 41 portfolios in the OppenheimerFunds complex. |
| | | |
Beverly L. Hamilton, Trustee (since 2002)
Age: 62 | | Trustee of Monterey Institute for International Studies (educational organization) (since February 2000); Board Member of Middlebury College (educational organization) (since December 2005); Director of The California Endowment (philanthropic organization) (since April 2002); Director (February 2002-2005) and Chairman of Trustees (2006-2007) of the Community Hospital of Monterey Peninsula; Director (October 1991-2005) and Vice Chairman (since 2006) of American Funds’ Emerging Markets Growth Fund, Inc. (mutual fund); President of ARCO Investment Management Company (February 1991-April 2000); Member of the investment committees of The Rockefeller Foundation (2001-2006) and The University of Michigan (since 2000); Advisor at Credit Suisse First Boston’s Sprout venture capital unit (venture capital fund) (1994-January 2005); Trustee of MassMutual Institutional Funds (investment company) (1996-June 2004); Trustee of MML Series Investment Fund (investment company) (April 1989-June 2004); Member of the investment committee of Hartford Hospital (2000-2003); and Advisor to Unilever (Holland) pension fund (2000-2003). Oversees 41 portfolios in the OppenheimerFunds complex. |
11| OPPENHEIMER CAPITAL APPRECIATION FUND/ VA
TRUSTEES AND OFFICERS Unaudited / Continued
| | | |
Robert J. Malone,
Trustee (since 2002)
Age: 64 | | Board of Directors of Opera Colorado Foundation (non-profit organization) (since March 2008); Director of Jones Knowledge, Inc. (since 2006); Director of Jones International University (educational organization) (since August 2005); Chairman, Chief Executive Officer and Director of Steele Street Bank & Trust (commercial banking) (since August 2003); Director of Colorado UpLIFT (charitable organization) (since 1986); Trustee of the Gallagher Family Foundation (non-profit organization) (since 2000); Former Chairman of U.S. Bank-Colorado (subsidiary of U.S. Bancorp and formerly Colorado National Bank) (July 1996-April 1999); Director of Commercial Assets, Inc. (real estate investment trust) (1993-2000); Director of Jones Knowledge, Inc. (2001-July 2004); and Director of U.S. Exploration, Inc. (oil and gas exploration) (1997-February 2004). Oversees 41 portfolios in the OppenheimerFunds complex. |
| | | |
F. William Marshall, Jr.,
Trustee (since 2000)
Age: 66 | | Trustee Emeritas of Worcester Polytech Institute (WPI) (private university) (since 2009); Trustee of MassMutual Select Funds (formerly MassMutual Institutional Funds) (investment company) (since 1996) and MML Series Investment Fund (investment company) (since 1996); President and Treasurer of the SIS Funds (private charitable fund) (since January 1999); Former Trustee of WPI (1985-2008); Former Chairman of the Board (2004-2006) and Former Chairman of the Investment Committee of WPI (1994-2008); Chairman of SIS & Family Bank, F.S.B. (formerly SIS Bank) (commercial bank) (January 1999-July 1999); Executive Vice President of Peoples Heritage Financial Group, Inc. (commercial bank) (January 1999-July 1999); and Former President and Chief Executive Officer of SIS Bancorp. (1993-1999). Oversees 43 portfolios in the OppenheimerFunds complex. |
| | | |
INTERESTED TRUSTEE AND OFFICER | | The address of Mr. Murphy is Two World Financial Center, 225 Liberty Street, 11th Floor, New York, New York 10281-1008. Mr. Murphy serves as a Trustee for an indefinite term, or until his resignation, retirement, death or removal and as an Officer for an indefinite term, or until his resignation, retirement, death or removal. Mr. Murphy is an interested Trustee due to his positions with OppenheimerFunds, Inc. and its affiliates. |
| | | |
John V. Murphy,
Trustee, President and
Principal Executive Officer
(since 2001)
Age: 59 | | Chairman and Director of the Manager (since June 2001); Chief Executive Officer of the Manager (June 2001- December 2008); President of the Manager (September 2000-February 2007); President and director or trustee of other Oppenheimer funds; President and Director of Oppenheimer Acquisition Corp. (“OAC”) (the Manager’s parent holding company) and of Oppenheimer Partnership Holdings, Inc. (holding company subsidiary of the Manager) (since July 2001); Director of OppenheimerFunds Distributor, Inc. (subsidiary of the Manager) (November 2001-December 2006); Chairman and Director of Shareholder Services, Inc. and of Shareholder Financial Services, Inc. (transfer agent subsidiaries of the Manager) (since July 2001); President and Director of OppenheimerFunds Legacy Program (charitable trust program established by the Manager) (since July 2001); Director of the following investment advisory subsidiaries of the Manager: OFI Institutional Asset Management, Inc., Centennial Asset Management Corporation, Trinity Investment Management Corporation and Tremont Capital Management, Inc. (since November 2001), HarbourView Asset Management Corporation and OFI Private Investments, Inc. (since July 2001); President (since November 2001) and Director (since July 2001) of Oppenheimer Real Asset Management, Inc.; Executive Vice President of Massachusetts Mutual Life Insurance Company (OAC’s parent company) (since February 1997); Director of DLB Acquisition Corporation (holding company parent of Babson Capital Management LLC) (since June 1995); Chairman (since October 2007) and Member of the Investment Company Institute’s Board of Governors (since October 2003). Oversees 105 port- folios in the OppenheimerFunds complex. |
| | | |
OTHER OFFICERS OF
THE FUND | | The addresses of the Officers in the chart below are as follows: for Messrs. Baylin and Zack, Two World Financial Center, 225 Liberty Street, New York, New York 10281-1008, for Messrs. Vandehey and Wixted, 6803 S. Tucson Way, Centennial, Colorado 80112-3924. Each Officer serves for an indefinite term or until his or her resignation, retire- ment, death or removal. |
| | | |
Marc L. Baylin,
Vice President and Portfolio
Manager (since 2005)
Age: 41 | | Vice President of the Manager and a member of the Growth Equity Investment Team (since September 2005); a Chartered Financial Analyst; Managing Director and Lead Portfolio Manager at JP Morgan Fleming Investment Management (June 2002 to August 2005); Vice President, Analyst (from June 1993) and Portfolio Manager (March 1999-June 2002) of T. Rowe Price. A portfolio manager and officer of 3 portfolios in the OppenheimerFunds complex. |
| | | |
Mark S. Vandehey,
Vice President and Chief
Compliance Officer
(since 2004)
Age: 58 | | Senior Vice President and Chief Compliance Officer of the Manager (since March 2004); Chief Compliance Officer of OppenheimerFunds Distributor, Inc., Centennial Asset Management and Shareholder Services, Inc. (since March 2004); Vice President of OppenheimerFunds Distributor, Inc., Centennial Asset Management Corporation and Shareholder Services, Inc. (since June 1983); Former Vice President and Director of Internal Audit of the Manager (1997-February 2004). An officer of 105 portfolios in the OppenheimerFunds complex. |
12 | OPPENHEIMER CAPITAL APPRECIATION FUND/ VA
| | | |
Brian W. Wixted,
Treasurer and Principal
Financial & Accounting
Officer (since 1999)
Age: 49 | | Senior Vice President and Treasurer of the Manager (since March 1999); Treasurer of the following: HarbourView Asset Management Corporation, Shareholder Financial Services, Inc., Shareholder Services, Inc., Oppenheimer Real Asset Management, Inc. and Oppenheimer Partnership Holdings, Inc. (since March 1999), OFI Private Investments, Inc. (since March 2000), OppenheimerFunds International Ltd. and OppenheimerFunds plc (since May 2000), OFI Institutional Asset Management, Inc. (since November 2000), and OppenheimerFunds Legacy Program (charitable trust program established by the Manager) (since June 2003); Treasurer and Chief Financial Officer of OFI Trust Company (trust company subsidiary of the Manager) (since May 2000); Assistant Treasurer of the following: OAC (since March 1999), Centennial Asset Management Corporation (March 1999-October 2003) and OppenheimerFunds Legacy Program (April 2000-June 2003). An officer of 105 portfolios in the OppenheimerFunds complex. |
| | | |
Robert G. Zack,
Vice President and
Secretary (since 2001)
Age: 60 | | Executive Vice President (since January 2004) and General Counsel (since March 2002) of the Manager; General Counsel and Director of the Distributor (since December 2001); General Counsel of Centennial Asset Management Corporation (since December 2001); Senior Vice President and General Counsel of HarbourView Asset Management Corporation (since December 2001); Secretary and General Counsel of OAC (since November 2001); Assistant Secretary (since September 1997) and Director (since November 2001) of OppenheimerFunds International Ltd. and OppenheimerFunds plc; Vice President and Director of Oppenheimer Partnership Holdings, Inc. (since December 2002); Director of Oppenheimer Real Asset Management, Inc. (since November 2001); Senior Vice President, General Counsel and Director of Shareholder Financial Services, Inc. and Shareholder Services, Inc. (since December 2001); Senior Vice President, General Counsel and Director of OFI Private Investments, Inc. and OFI Trust Company (since November 2001); Vice President of OppenheimerFunds Legacy Program (since June 2003); Senior Vice President and General Counsel of OFI Institutional Asset Management, Inc. (since November 2001); Director of OppenheimerFunds International Distributor Limited (since December 2003); Senior Vice President (May 1985-December 2003). An officer of 105 portfolios in the OppenheimerFunds complex. |
The Fund’s Statement of Additional Information contains additional information about the Fund’s Trustees and Officers and is available without charge, upon request, by calling 1.800.981.2871.
13 | OPPENHEIMER CAPITAL APPRECIATION FUND/ VA
FUND PERFORMANCE DISCUSSION
Management’s Discussion of Fund Performance. For the fiscal year ended December 31, 2008, Oppenheimer Core Bond Fund/VA’s Non-Service shares delivered a return of —39.05%, compared to the Barclay’s Capital Aggregate Bond Index, a performance benchmark used by the Fund, which returned 5.24%. While several factors contributed to these very disappointing results, we believe the most significant factors influencing Fund performance for this reporting period were the volatility of the markets for fixed-income securities throughout 2008 and, later in the period, the Fund’s investments in the high-quality commercial mortgage-backed securities (CMBSs) sector and long-maturity fixed-income securities of highly-rated financial institutions.
In the wake of the continuing mortgage crisis and ensuing global economic downturn, financial markets in general experienced extreme volatility and steep declines during the 12-month reporting period. In particular, the fixed-income markets were subject to high volatility, price declines and lack of liquidity, as were the fixed-income securities and derivative investments based on such securities in which the Fund invested. We believe that even highly-rated mortgage securities suffered declines because of their association by investors with the residential mortgage market, and that market concerns about sub-prime mortgages, and expected default rates in CMBS, affected the prices of higher quality CMBS. This marked a sharp dislocation between security prices and investment fundamentals as to those securities for such higher quality CMBS.
Similarly as major banks experienced balance sheet impairments and government officials scrambled to assemble bailout programs, nearly all debt associated with the financial sector dropped sharply in value, affecting even highly rated corporate debt. This occurred despite the fact that the U.S. government became a senior debt-holder of many struggling financial companies. In such an environment, and particularly after Lehman Brothers collapsed into bankruptcy in September 2008, many investors, engaged in panic selling. This led to a situation in which the prices of most non-Treasury fixed-income securities, or “spread products,” detached from their underlying fundamentals, meaning that a security’s price had little correlation to its true, underlying value. As investors sought protection in U.S. Treasury securities, the volatility in the corporate debt market created a backdrop in which even the highest-rated assets were battered, including the Fund’s investments in high quality CMBSs, non-agency residential mortgage-backed securities (MBSs) and longer-maturity investment grade financial bonds, which we had believed to be fundamentally sound.
At the time the reporting period began, the Fund held positions in highly rated CMBSs and non-agency MBSs, and long-maturity fixed income securities of highly rated financial institutions. These holdings were acquired based on our assessment that they would provide attractive relative valuation opportunities and risk adjusted return, as well as diversification. To avoid large concentrations in individual MBSs and to gain access to the CMBS asset class through an instrument that was broader based and better diversified with respect to geography and property type than individual CMBS, we had pursued CMBS exposure through total return swaps using several CMBS Index securities. In addition, the CMBS Index investments we made were (and are) senior in the capital structure, which means that investors who purchased bonds subordinate to the ones purchased by the Fund would absorb losses from any defaults before the Fund did. The non-agency MBSs we purchased were backed by prime rate, residential jumbo mortgages from highly rated borrowers, not sub-prime borrowers. Additionally, the yield advantage over agency debt was considerable and, we believed, offered a better relative value opportunity than traditional agency mortgage-backed securities. Finally, we saw the opportunity to hold positions in financials due to the higher current yields they offered, and our analysis that the deleveraging process that banks were undergoing would improve their balance sheets.
By the spring of 2008, we saw even more potential value in these three areas and continued to build out our positions. After JPMorgan Chase and the Federal Reserve Board intervened to rescue Bear Stearns, the credit markets rallied markedly during the second quarter and performance in the Fund improved, which we believed validated our investment thesis and instilled confidence about our allocation decisions.
However, as the second half of 2008 began, domestic economic conditions worsened, a global recession loomed and investor panic spread. Three primary performance factors emerged. First, there was an unprecedented and unanticipated widening of credit spreads of mortgage-backed securities over Treasury securities, which accelerated during the month of November, and had a negative impact on the Fund’s positions in total return swaps in the CMBS sector. Second,
3 | OPPENHEIMER CORE BOND FUND/VA
FUND PERFORMANCE DISCUSSION
the historical correlation between highly rated securities and Treasuries and investor behavior in past economic crises did not occur in this one. Accordingly, amidst the difficult financial conditions, in a flight to quality, investors flocked to U.S. Treasury securities and not to highly-rated non-Treasury securities, such as the ones the Fund held, which also contributed to the Fund’s poor performance. Third, liquidity virtually disappeared as the markets in mortgage-related instruments effectively shut down. Rather than continuing to expand their positions, traditional financial intermediaries began aggressively shrinking their balance sheets, severely limiting the ability of the Fund’s portfolio team to either scale back or hedge away portfolio holdings that detracted from performance, which had a very negative impact on performance. These events contributed to the Fund’s negative performance and the significant decline in the Fund’s net asset value during the period (and especially in the fourth quarter). Within the challenging constraints of the limited liquidity in the market, we moved to adjust the Fund’s positions in total return swaps in the CMBS sector, and to seek liquidity to position the Fund to deal with the effect of ongoing volatility.
A less significant, yet still negative, influence on the Fund’s returns came from certain investments within the Fund’s short-maturity, high-yield bond holdings in which we obtained mixed results. A large portion of our holdings in this area performed well, maturing as expected and experiencing no defaults. However, the Fund’s performance was hurt by credit default swaps it had entered into in various sectors (such as the financial and auto-related sectors). Our investments in high-yield debt of auto-related companies and auto-financing entities severely detracted from the Fund’s returns. Much like the financial sector, many issuers associated with the beleaguered auto industry in 2008 struggled to stay afloat, so our investments in those credits—albeit small—suffered declines significant enough to hurt the Fund’s performance.
We continue to assess the changing market conditions and seek to position the Fund to deal with the effects of ongoing market volatility.
Comparing the Fund’s Performance to the Market. The graphs that follow show the performance of a hypothetical $10,000 investment in each share class of the Fund held until December 31, 2008. In the case of Non-Service shares, performance is measured over a ten-year period. In the case of Service shares, performance is measured from inception of the class on May 1, 2002. Performance information does not reflect charges that apply to separate accounts investing in the Fund. If these charges were taken into account, performance would be lower. The graph assumes that all dividends and capital gains distributions were reinvested in additional shares. Past performance cannot guarantee future results.
The Fund’s performance is compared to the performance of the Citigroup Broad Investment Grade Index, an index of investment grade corporate and U.S. government bonds, the Barclays Capital Aggregate Bond Index (formerly known as the “Lehman Brothers Aggregate Bond Index”), a broad-based index of government agencies and corporate debt, and the Barclays Capital Credit Index (formerly known as the “Lehman Brothers Credit Index”), an index of non-convertible U.S. investment grade corporate bonds. The indices’ performance includes reinvestment of income but does not reflect transaction costs, fees or expenses. The Fund’s performance reflects the effects of the Fund’s business and operating expenses. While index comparisons may be useful to provide a benchmark for the Fund’s performance, it must be noted that the Fund’s investments are not limited to the investments in the index.
4 | OPPENHEIMER CORE BOND FUND/VA
Non-Service Shares
Comparison of Change in Value of $10,000 Hypothetical Investments in:
Service Shares
Comparison of Change in Value of $10,000 Hypothetical Investments in:
The performance data quoted represents past performance, which does not guarantee future results. The investment return and principal value of an investment in the Fund will fluctuate so that an investor’s shares, when redeemed, may be worth more or less than their original cost. Current performance may be lower or higher than the performance quoted. For performance data current to the most recent month end, call us at 1.800.981.2871. The Fund’s total returns should not be expected to be the same as the returns of other funds, whether or not both funds have the same portfolio managers and/or similar names. The Fund’s total returns do not include the charges associated with the separate account products that offer this Fund. Such performance would have been lower if such charges were taken into account.
5 | OPPENHEIMER CORE BOND FUND/VA
FUND EXPENSES
Fund Expenses. As a shareholder of the Fund, you incur two types of costs: (1) transaction costs, which may include redemption fees (if applicable); and (2) ongoing costs, including management fees; distribution and service fees; and other Fund expenses. These examples are intended to help you understand your ongoing costs (in dollars) of investing in the Fund and to compare these costs with the ongoing costs of investing in other mutual funds.
The examples are based on an investment of $1,000.00 invested at the beginning of the period and held for the entire 6-month period ended December 31, 2008.
Actual Expenses. The first section of the table provides information about actual account values and actual expenses. You may use the information in this section for the class of shares you hold, together with the amount you invested, to estimate the expense that you paid over the period. Simply divide your account value by $1,000.00 (for example, an $8,600.00 account value divided by $1,000.00 = 8.60), then multiply the result by the number in the first section under the heading entitled “Expenses Paid During Period” to estimate the expenses you paid on your account during this period.
Hypothetical Example for Comparison Purposes. The second section of the table provides information about hypothetical account values and hypothetical expenses based on the Fund’s actual expense ratio for each class of shares, and an assumed rate of return of 5% per year for each class before expenses, which is not the actual return. The hypothetical account values and expenses may not be used to estimate the actual ending account balance or expenses you paid for the period. You may use this information to compare the ongoing costs of investing in the Fund and other funds. To do so, compare this 5% hypothetical example for the class of shares you hold with the 5% hypothetical examples that appear in the shareholder reports of the other funds.
Please note that the expenses shown in the table are meant to highlight your ongoing costs only and do not reflect any charges associated with the separate accounts that offer this Fund. Therefore, the “hypothetical” lines of the table are useful in comparing ongoing costs only, and will not help you determine the relative total costs of owning different funds. In addition, if these separate account charges were included your costs would have been higher.
| | | | | | | | | | | | | |
| | | Beginning | | Ending | | Expenses |
| | | Account | | Account | | Paid During |
| | | Value | | Value | | 6 Months Ended |
| | | July 1, 2008 | | December 31, 2008 | | December 31, 2008 |
| |
Actual | | | | | | | | | | | | |
| Non-Service shares | | $ | 1,000.00 | | | $ | 617.80 | | | $ | 2.44 | |
| Service shares | | | 1,000.00 | | | | 618.10 | | | | 3.51 | |
| | | | | | | | | | | | | |
Hypothetical | | | | | | | | | | | | |
| (5% return before expenses) | | | | | | | | | | | | |
| Non-Service shares | | | 1,000.00 | | | | 1,022.12 | | | | 3.05 | |
| Service shares | | | 1,000.00 | | | | 1,020.81 | | | | 4.38 | |
Expenses are equal to the Fund’s annualized expense ratio for that class, multiplied by the average account value over the period, multiplied by 184/366 (to reflect the one-half year period). Those annualized expense ratios, excluding indirect expenses from affiliated fund, based on the 6-month period ended December 31, 2008 are as follows:
| | | | | | | | | |
| Class | | Expense Ratios | | | | |
| |
| Non-Service shares | | | 0.60 | % | | | | |
| Service shares | | | 0.86 | | | | | |
The expense ratios reflect reduction to custodian expenses and voluntary waivers or reimbursements of expenses by the Fund’s Manager that can be terminated at any time, without advance notice. The “Financial Highlights” tables in the Fund’s financial statements, included in this report, also show the gross expense ratios, without such waivers or reimbursements and reduction to custodian expenses, if applicable.
6 | OPPENHEIMER CORE BOND FUND/VA
STATEMENT OF INVESTMENTS December 31, 2008
| | | | | | | | | |
| | | Principal | | | |
| | | Amount | | | Value | |
| |
Asset-Backed Securities—3.6% | | | | | | | | |
Ace Securities Corp. Home Equity
Loan Trust, Asset-Backed Pass-
Through Certificates, Series 2005-
HE7, Cl. A2B, 0.651%, 11/25/351 | | $ | 249 | | | $ | 247 | |
Argent Securities Trust 2004-W8,
Asset-Backed Pass-Through
Certificates, Series 2004-W8, Cl. A2, 0.951%, 5/25/341 | | | 1,538,283 | | | | 1,188,091 | |
Argent Securities Trust 2006-M3,
Asset-Backed Pass-Through
Certificates, Series 2006-M3,
Cl. A2B, 0.571%, 9/25/361 | | | 30,000 | | | | 24,047 | |
Argent Securities Trust 2006-W5,
Asset-Backed Pass-Through
Certificates, Series 2006-W5,
Cl. A2B, 0.571%, 5/26/361 | | | 25,853 | | | | 23,630 | |
Centex Home Equity Loan Trust
2006-A, Asset-Backed Certificates,
Series 2006-A, Cl. AV2, 0.571%, 5/16/361 | | | 23,410 | | | | 22,428 | |
Citibank Credit Card Issuance Trust,
Credit Card Receivable Nts.,
Series 2003-C4, Cl. C4, 5%, 6/10/15 | | | 310,000 | | | | 168,335 | |
Countrywide Home Loans,
Asset-Backed Certificates:
| | | 35,747 | | | | 16,667 | |
Series 2002-4, Cl. A1, 1.211%, 2/25/331 | | | | | | | | |
| Series 2005-11, Cl. AF2, 4.657%, 2/25/36 | | | 171,286 | | | | 168,753 | |
Series 2005-16, Cl. 2AF2, 5.382%, 5/25/361 | | | 700,000 | | | | 559,823 | |
Series 2005-17, Cl. 1AF2, 5.363%,5/25/361 | | | 429,010 | | | | 369,958 | |
CWABS, Inc. Asset-Backed Certificates
Trust, Asset-Backed Certificates, Series
2006-25, Cl. 2A2, 0.591%, 12/5/291 | | | 40,000 | | | | 30,755 | |
First Franklin Mortgage Loan Trust
2005-FF10, Mtg. Pass-Through
Certificates, Series 2005-FF10,
Cl. A3, 0.681%, 11/25/351 | | | 8,236 | | | | 8,129 | |
First Franklin Mortgage Loan Trust
2006-FF10, Mtg. Pass-Through
Certificates, Series 2006-FF10,
Cl. A3, 0.561%, 7/25/361 | | | 50,000 | | | | 43,352 | |
First Franklin Mortgage Loan Trust
2006-FF9, Mtg. Pass-Through
Certificates, Series 2006-FF9,
Cl. 2A2, 0.581%, 7/7/361 | | | 30,000 | | | | 25,572 | |
HSBC Home Equity Loan Trust
2005-3, Closed-End Home Equity
Loan Asset-Backed Nts., Series 2005-3,
Cl. A1, 0.768%, 1/20/351 | | | 583,400 | | | | 414,742 | |
HSBC Home Equity Loan Trust
2006-4, Closed-End Home Equity
Loan Asset-Backed Certificates, Series
2006-4, Cl. A2V, 0.618%, 3/20/361 | | | 25,000 | | | | 20,947 | |
Lehman XS Trust, Mtg. Pass-
Through Certificates: | | | 7,997 | | | | 7,847 | |
Series 2005-2, Cl. 2A1B, 5.18%, 8/25/351 | | | | | | | | |
| Series 2005-4, Cl. 2A1B, 5.17%, 10/25/35 | | | 270,631 | | | | 246,694 | |
Litigation Settlement Monetized Fee
Trust, Asset-Backed Certificates, Series
2001-1A, Cl. A1, 8.33%, 4/25/312 | | | 1,444,390 | | | | 1,417,568 | |
Mastr Asset-Backed Securities Trust
2006-WMC3, Mtg. Pass-Through
Certificates, Series 2006-WMC3,
Cl. A3, 0.571%, 8/25/361 | | | 70,000 | | | | 20,848 | |
NC Finance Trust, CMO Pass-Through
Certificates, Series 1999-I, Cl. ECFD,
6.368%, 1/25/291,2 | | | 3,370,016 | | | | 429,677 | |
Option One Mortgage Loan Trust,
Asset-Backed Certificates, Series
2006-2, Cl. 2A2, 0.571%, 7/1/361 | | | 1,034,159 | | | | 911,319 | |
Popular ABS Mortgage Pass-Through
Trust 2005-6, Mtg. Pass-Through
Certificates, Series 2005-6, Cl. A3, 5.68%, 1/25/361 | | | 710,159 | | | | 645,521 | |
RAMP Series 2006-RS4 Trust, Mtg.
Asset-Backed Pass-Through
Certificates, Series 2006-RS4,
Cl. A1, 0.551%, 7/25/361 | | | 763 | | | | 756 | |
RASC Series 2006-KS7 Trust, Home
Equity Mtg. Asset-Backed Pass-
Through Certificates, Series 2006-KS7,
Cl. A2, 0.571%, 9/25/361 | | | 49,886 | | | | 45,390 | |
Structured Asset Investment Loan
Trust, Mtg. Pass-Through Certificates,
Series 2006-BNC3, Cl. A2, 0.511%, 9/25/361 | | | 382,212 | | | | 357,818 | |
Tobacco Settlement Authority,
Asset-Backed Securities,
Series 2001-A, 6.79%, 6/1/10 | | | 660,000 | | | | 670,197 | |
Wells Fargo Home Equity Asset-Backed
Securities 2006-2 Trust, Home Equity
Asset-Backed Certificates, Series
2006-2, Cl. A2, 0.571%, 7/25/361 | | | 41,953 | | | | 39,593 | |
| | | | | | | | | |
| | | | | | | | | |
Total Asset-Backed Securities
(Cost $11,962,091) | | | | | | | 7,878,704 | |
Mortgage-Backed Obligations—100.5% | | | | | | | | |
Government Agency—66.9% | | | | | | | | |
FHLMC/FNMA/Sponsored—66.0% | | | | | | | | |
| Federal Home Loan Mortgage Corp.: | | | | | | | | |
| 5%, 8/15/33-12/15/34 | | | 3,875,685 | | | | 3,970,925 | |
| 6%, 7/15/17-10/15/29 | | | 6,682,229 | | | | 6,929,923 | |
| 6.50%, 4/15/18-4/1/34 | | | 1,215,927 | | | | 1,268,743 | |
| 7%, 8/15/16-11/15/16 | | | 104,347 | | | | 109,489 | |
7%, 10/1/313 | | | 688,044 | | | | 723,284 | |
| 8%, 4/1/16 | | | 438,864 | | | | 467,163 | |
F1 | OPPENHEIMER CORE BOND FUND/VA
STATEMENT OF INVESTMENTS Continued
| | | | | | | | | |
| | | Principal | | | | |
| | | Amount | | | Value | |
| |
FHLMC/FNMA/Sponsored Continued | | | | | | | | |
| Federal Home Loan Mortgage Corp.: | | | | | | | | |
Continued
9%, 8/1/22-5/1/25 | | $ | 126,048 | | | $ | 137,482 | |
| 10.50%, 11/14/20 | | | 5,021 | | | | 5,764 | |
Federal Home Loan Mortgage Corp.,
Gtd. Real Estate Mtg. Investment
Conduit Multiclass Pass-Through
Certificates: | | | | | | | | |
| Series 151, Cl. F, 9%, 5/15/21 | | | 26,338 | | | | 26,330 | |
| Series 1674, Cl. Z, 6.75%, 2/15/24 | | | 86,052 | | | | 91,670 | |
Series 2006-11, Cl. PS, 22.839%, 3/25/361 | | | 612,645 | | | | 698,458 | |
| Series 2034, Cl. Z, 6.50%, 2/15/28 | | | 11,504 | | | | 12,104 | |
| Series 2042, Cl. N, 6.50%, 3/15/28 | | | 32,543 | | | | 33,763 | |
| Series 2043, Cl. ZP, 6.50%, 4/15/28 | | | 961,519 | | | | 1,002,420 | |
| Series 2046, Cl. G, 6.50%, 4/15/28 | | | 96,978 | | | | 101,297 | |
| Series 2053, Cl. Z, 6.50%, 4/15/28 | | | 14,178 | | | | 14,841 | |
| Series 2066, Cl. Z, 6.50%, 6/15/28 | | | 1,862,728 | | | | 1,958,272 | |
| Series 2195, Cl. LH, 6.50%, 10/15/29 | | | 1,087,229 | | | | 1,141,737 | |
| Series 2220, Cl. PD, 8%, 3/15/30 | | | 4,671 | | | | 5,010 | |
| Series 2326, Cl. ZP, 6.50%, 6/15/31 | | | 368,358 | | | | 385,709 | |
| Series 2435, Cl. EQ, 6%, 5/15/31 | | | 38,906 | | | | 39,463 | |
| Series 2461, Cl. PZ, 6.50%, 6/15/32 | | | 1,467,643 | | | | 1,548,642 | |
Series 2470, Cl. LF, 2.195%, 2/15/321 | | | 16,914 | | | | 16,233 | |
Series 2500, Cl. FD, 1.695%, 3/15/321 | | | 271,956 | | | | 263,280 | |
Series 2526, Cl. FE, 1.595%, 6/15/291 | | | 441,631 | | | | 425,958 | |
Series 2538, Cl. F, 1.795%, 12/15/321 | | | 2,678,285 | | | | 2,573,827 | |
Series 2551, Cl. FD, 1.595%, 1/15/331 | | | 332,218 | | | | 323,280 | |
| Series 2641, Cl. CE, 3.50%, 9/15/25 | | | 18,076 | | | | 18,062 | |
| Series 2727, Cl. UA, 3.50%, 10/15/22 | | | 4,829 | | | | 4,827 | |
| Series 2736, Cl. DB, 3.30%, 11/15/26 | | | 88,444 | | | | 88,243 | |
| Series 2750, Cl. XG, 5%, 2/1/34 | | | 130,000 | | | | 134,455 | |
| Series 2777, Cl. PJ, 4%, 5/15/24 | | | 4,984 | | | | 4,986 | |
| Series 2890, Cl. PE, 5%, 11/1/34 | | | 130,000 | | | | 133,475 | |
| Series 2936, Cl. PE, 5%, 2/1/35 | | | 69,000 | | | | 70,675 | |
| Series 2939, Cl. PE, 5%, 2/15/35 | | | 247,000 | | | | 253,525 | |
Series 3025, Cl. SJ, 20.368%, 8/15/351 | | | 129,828 | | | | 148,433 | |
| Series 3035, Cl. DM, 5.50%, 11/15/25 | | | 55,760 | | | | 56,529 | |
Series 3094, Cl. HS, 20.002%, 6/15/341 | | | 361,535 | | | | 402,683 | |
Federal Home Loan Mortgage Corp.,
Interest-Only Stripped Mtg.-Backed
Security: | | | | | | | | |
Series 176, Cl. IO, 3.283%, 6/1/264 | | | 462,005 | | | | 91,344 | |
Series 183, Cl. IO, 1.254%, 4/1/274 | | | 712,736 | | | | 105,775 | |
Series 184, Cl. IO, 7.574%, 12/1/264 | | | 788,765 | | | | 157,044 | |
Series 192, Cl. IO, 4.918%, 2/1/284 | | | 194,683 | | | | 27,505 | |
Series 200, Cl. IO, 4.55%, 1/1/294 | | | 239,241 | | | | 40,801 | |
Series 2003-26, Cl. DI, 1.284%,4/25/334 | | | 37,367 | | | | 6,455 | |
Series 202, Cl. IO, (6.238)%, 4/1/294 | | | 1,627,967 | | | | 227,104 | |
Series 205, Cl. IO, 0.538%, 9/1/294 | | | 36,598 | | | | 8,172 | |
Series 206, Cl. IO, (11.155)%, 12/1/294 | | | 452,042 | | | | 83,629 | |
Series 2074, Cl. S, 38.602%, 7/17/284 | | | 7,404 | | | | 888 | |
Series 2079, Cl. S, 45.314%, 7/17/284 | | | 12,066 | | | | 1,426 | |
Series 2130, Cl. SC, 35.774%, 3/15/294 | | | 504,179 | | | | 76,306 | |
Series 216, Cl. IO, 2.68%, 12/1/314 | | | 324,504 | | | | 41,040 | |
Series 224, Cl. IO, (0.549)%, 3/1/334 | | | 997,097 | | | | 148,658 | |
Series 243, Cl. 6, 15.224%, 12/15/324 | | | 595,440 | | | | 77,869 | |
Series 2526, Cl. SE, 31.293%, 6/15/294 | | | 19,945 | | | | 2,716 | |
Series 2527, Cl. SG, 31.83%, 2/15/324 | | | 609,629 | | | | 39,063 | |
Series 2531, Cl. ST, 35.211%, 2/15/304 | | | 704,395 | | | | 45,769 | |
Series 2796, Cl. SD, 45.618%, 7/15/264 | | | 805,528 | | | | 77,353 | |
Series 2802, Cl. AS, 99.999%, 4/15/334 | | | 879,450 | | | | 83,673 | |
Series 2819, Cl. S, 35.142%, 6/15/344 | | | 163,213 | | | | 21,236 | |
Series 2920, Cl. S, 54.737%, 1/15/354 | | | 3,035,790 | | | | 298,360 | |
Series 3000, Cl. SE, 99.999%, 7/15/254 | | | 3,649,355 | | | | 291,982 | |
Series 3004, Cl. SB, 99.999%, 7/15/354 | | | 183,684 | | | | 19,141 | |
Series 3110, Cl. SL, 99.999%, 2/15/264 | | | 518,251 | | | | 37,255 | |
Federal Home Loan Mortgage
Corp., Principal-Only Stripped
Mtg.-Backed Security: | | | | | | | | |
Series 176, Cl. PO, 6.152%, 6/1/265 | | | 188,228 | | | | 159,606 | |
Series 192, Cl. PO, 8.464%, 2/1/285 | | | 194,683 | | | | 174,984 | |
| Federal National Mortgage Assn.: | | | | | | | | |
4.50%, 1/1/226 | | | 11,152,000 | | | | 11,399,441 | |
| 5%, 2/25/22-7/25/22 | | | 46,912 | | | | 48,234 | |
5%, 1/1/24-1/1/396 | | | 22,873,000 | | | | 23,419,152 | |
| 5.296%, 10/1/36 | | | 496,247 | | | | 502,463 | |
5.50%, 1/1/24-1/1/396 | | | 21,310,000 | | | | 21,862,492 | |
6%, 1/1/24-1/1/396 | | | 18,605,000 | | | | 19,187,237 | |
| 6.50%, 2/25/09-1/1/34 | | | 2,235,773 | | | | 2,324,930 | |
6.50%, 8/25/173 | | | 351,963 | | | | 365,758 | |
6.50%, 1/1/396 | | | 10,570,000 | | | | 10,977,939 | |
| 7%, 11/25/13-7/25/35 | | | 1,373,952 | | | | 1,432,495 | |
7%, 1/1/396 | | | 972,000 | | | | 1,017,867 | |
| 7.50%, 1/1/33 | | | 19,388 | | | | 20,558 | |
| 8%, 5/25/17 | | | 847 | | | | 897 | |
| 8.50%, 7/1/32 | | | 47,760 | | | | 51,940 | |
Federal National Mortgage Assn.,
Gtd. Real Estate Mtg. Investment
Conduit Pass-Through Certificates: | | | | | | | | |
| Trust 1989-17, Cl. E, 10.40%, 4/25/19 | | | 37,445 | | | | 40,507 | |
| Trust 1993-87, Cl. Z, 6.50%, 6/25/23 | | | 1,107,361 | | | | 1,152,127 | |
| Trust 1998-58, Cl. PC, 6.50%, 10/25/28 | | | 940,047 | | | | 980,079 | |
| Trust 1998-61, Cl. PL, 6%, 11/25/28 | | | 526,163 | | | | 545,211 | |
| Trust 1999-54, Cl. LH, 6.50%, 11/25/29 | | | 738,506 | | | | 764,111 | |
| Trust 2001-44, Cl. QC, 6%, 9/25/16 | | | 56,290 | | | | 58,906 | |
| Trust 2001-51, Cl. OD, 6.50%, 10/25/31 | | | 53,397 | | | | 56,203 | |
| Trust 2001-70, Cl. LR, 6%, 9/25/30 | | | 16,737 | | | | 16,705 | |
| Trust 2001-74, Cl. QE, 6%, 12/25/31 | | | 1,574,730 | | | | 1,630,769 | |
| Trust 2002-12, Cl. PG, 6%, 3/25/17 | | | 26,749 | | | | 28,016 | |
Trust 2003-130, Cl. CS, 13.158%, 12/25/331 | | | 355,150 | | | | 356,859 | |
| Trust 2003-23, Cl. EQ, 5.50%, 4/25/23 | | | 137,000 | | | | 141,787 | |
| Trust 2003-28, Cl. KG, 5.50%, 4/25/23 | | | 3,964,000 | | | | 4,056,641 | |
| Trust 2004-101, Cl. BG, 5%, 1/25/20 | | | 1,975,000 | | | | 2,002,706 | |
| Trust 2005-100, Cl. BQ, 5.50%, 11/25/25 | | | 1,160,000 | | | | 1,187,367 | |
| Trust 2005-117, Cl. LA, 5.50%, 12/25/27 | | | 127,811 | | | | 130,205 | |
F2 | OPPENHEIMER CORE BOND FUND/VA
| | | | | | | | | |
| | | Principal | | | | |
| | | Amount | | | Value | |
| |
FHLMC/FNMA/Sponsored Continued | | | | | | | | |
Federal National Mortgage Assn.,
Gtd. Real Estate Mtg. Investment
Conduit Pass-Through Certificates:
Continued | | | | | | | | |
| Trust 2006-110, Cl. PW, 5.50%, 5/25/28 | | $ | 172,388 | | | $ | 176,344 | |
Trust 2006-46, Cl. SW, 22.471%, 6/25/361 | | | 462,353 | | | | 516,697 | |
Trust 2006-50, Cl. KS, 22.472%, 6/25/361 | | | 1,061,516 | | | | 1,192,963 | |
Federal National Mortgage Assn.,
Interest-Only Stripped
Mtg.-Backed Security: | | | | | | | | |
Trust 2001-61, Cl. SH, 43%, 11/18/314 | | | 63,403 | | | | 8,554 | |
Trust 2001-63, Cl. SD, 29.194%, 12/18/314 | | | 18,774 | | | | 2,660 | |
Trust 2001-65, Cl. S, 40.848%, 11/25/314 | | | 1,590,783 | | | | 217,950 | |
Trust 2001-68, Cl. SC, 22.964%, 11/25/314 | | | 13,060 | | | | 1,799 | |
Trust 2001-81, Cl. S, 25.046%, 1/25/324 | | | 390,750 | | | | 55,142 | |
Trust 2002-28, Cl. SA, 27.288%, 4/25/324 | | | 10,021 | | | | 1,330 | |
Trust 2002-38, Cl. IO, 40.014%, 4/25/324 | | | 21,911 | | | | 2,369 | |
Trust 2002-39, Cl. SD, 25.927%, 3/18/324 | | | 14,488 | | | | 2,023 | |
Trust 2002-47, Cl. NS, 22.828%, 4/25/324 | | | 997,192 | | | | 135,265 | |
Trust 2002-48, Cl. S, 24.795%, 7/25/324 | | | 16,821 | | | | 2,335 | |
Trust 2002-51, Cl. S, 23.117%, 8/25/324 | | | 915,425 | | | | 124,553 | |
Trust 2002-52, Cl. SD, 23.596%, 9/25/324 | | | 1,019,734 | | | | 141,285 | |
Trust 2002-52, Cl. SL, 25.286%, 9/25/324 | | | 10,358 | | | | 1,417 | |
Trust 2002-53, Cl. SK, 24.486%, 4/25/324 | | | 50,482 | | | | 6,604 | |
Trust 2002-56, Cl. SN, 27.404%, 7/25/324 | | | 22,935 | | | | 3,166 | |
Trust 2002-60, Cl. SM, 42.196%, 8/25/324 | | | 219,386 | | | | 22,800 | |
Trust 2002-7, Cl. SK, 43.23%, 1/25/324 | | | 103,211 | | | | 10,962 | |
Trust 2002-77, Cl. BS, 32.357%, 12/18/324 | | | 130,519 | | | | 17,330 | |
Trust 2002-77, Cl. IS, 33.07%, 12/18/324 | | | 37,330 | | | | 5,166 | |
Trust 2002-77, Cl. JS, 31.551%, 12/18/324 | | | 222,733 | | | | 29,612 | |
Trust 2002-77, Cl. SA, 32.813%, 12/18/324 | | | 209,792 | | | | 27,370 | |
| Trust 2002-77, Cl. SH, 29.746%, 12/18/324 | | | 487,842 | | | | 61,303 | |
Trust 2002-84, Cl. SA, 42.181%, 12/25/324 | | | 1,413,340 | | | | 202,491 | |
Trust 2002-9, Cl. MS, 23.832%, 3/25/324 | | | 19,249 | | | | 2,424 | |
Trust 2002-90, Cl. SN, 43.76%, 8/25/324 | | | 112,863 | | | | 12,148 | |
Trust 2002-90, Cl. SY, 45.591%, 9/25/324 | | | 70,735 | | | | 7,495 | |
Trust 2003-118, Cl. S, 32.844%, 12/25/334 | | | 3,138,813 | | | | 379,125 | |
Trust 2003-33, Cl. SP, 22.276%, 5/25/334 | | | 1,494,958 | | | | 198,570 | |
Trust 2003-4, Cl. S, 38.007%, 2/25/334 | | | 985,967 | | | | 126,468 | |
Trust 2003-89, Cl. XS, 20.272%, 11/25/324 | | | 1,138,915 | | | | 88,981 | |
Trust 2004-54, Cl. DS, 33.428%, 11/25/304 | | | 736,824 | | | | 82,227 | |
Trust 2005-40, Cl. SA, 55.787%, 5/25/354 | | | 1,731,644 | | | | 177,755 | |
Trust 2005-40, Cl. SB, 70.772%, 5/25/354 | | | 78,898 | | | | 7,774 | |
Trust 2005-6, Cl. SE, 68.059%, 2/25/354 | | | 2,227,425 | | | | 204,792 | |
Trust 2005-71, Cl. SA, 73.118%, 8/25/254 | | | 2,296,317 | | | | 172,177 | |
Trust 2005-87, Cl. SE, 99.999%, 10/25/354 | | | 4,450,093 | | | | 315,941 | |
Trust 2005-87, Cl. SG, 98.925%, 10/25/354 | | | 4,473,433 | | | | 379,167 | |
Trust 2006-33, Cl. SP, 65.623%, 5/25/364 | | | 3,789,404 | | | | 394,800 | |
Trust 2006-42, Cl. CI, 26.305%, 6/25/364 | | | 4,476,411 | | | | 520,247 | |
Trust 221, Cl. 2, 13.156%, 5/1/234 | | | 12,583 | | | | 2,856 | |
Trust 222, Cl. 2, 7.815%, 6/1/234 | | | 1,583,244 | | | | 431,142 | |
Trust 240, Cl. 2, 10.405%, 9/1/234 | | | 1,931,427 | | | | 299,731 | |
Trust 252, Cl. 2, 12.847%, 11/1/234 | | | 1,229,684 | | | | 282,016 | |
Trust 273, Cl. 2, 4.739%, 8/1/264 | | | 351,877 | | | | 62,860 | |
Trust 294, Cl. 2, (0.958)%, 2/1/284 | | | 137,645 | | | | 21,810 | |
Trust 301, Cl. 2, (6.398)%, 4/1/294 | | | 17,327 | | | | 3,484 | |
Trust 302, Cl. 2, (9.691)%, 6/1/294 | | | 573,432 | | | | 81,118 | |
Trust 303, Cl. IO, (6.686)%, 11/1/294 | | | 205,561 | | | | 29,593 | |
Trust 319, Cl. 2, (1.101)%, 2/1/324 | | | 348,871 | | | | 49,179 | |
Trust 321, Cl. 2, (5.704)%, 4/1/324 | | | 3,783,629 | | | | 526,191 | |
Trust 324, Cl. 2, (6.594)%, 7/1/324 | | | 65,243 | | | | 9,237 | |
Trust 331, Cl. 5, 15.598%, 2/1/334 | | | 54,253 | | | | 7,460 | |
Trust 331, Cl. 9, 22.242%, 2/1/334 | | | 867,090 | | | | 97,980 | |
Trust 333, Cl. 2, (11.692)%, 4/1/334 | | | 3,165,316 | | | | 387,120 | |
Trust 334, Cl. 12, 11.56%, 2/1/334 | | | 94,591 | | | | 12,415 | |
Trust 334, Cl. 17, 29.467%, 2/1/334 | | | 597,572 | | | | 102,268 | |
Trust 334, Cl. 3, 13.538%, 7/1/334 | | | 460,569 | | | | 51,675 | |
Trust 334, Cl. 5, 13.587%, 5/1/334 | | | 65,699 | | | | 7,491 | |
Trust 338, Cl. 2, (11.024)%, 7/1/334 | | | 1,874,644 | | | | 226,261 | |
Trust 339, Cl. 12, 13.466%, 7/1/334 | | | 1,214,459 | | | | 155,980 | |
Trust 339, Cl. 7, 12.218%, 7/1/334 | | | 3,228,097 | | | | 357,377 | |
Trust 339, Cl. 8, 12.211%, 8/1/334 | | | 254,426 | | | | 28,552 | |
Trust 342, Cl. 2, (3.317)%, 9/1/334 | | | 19,237 | | | | 2,751 | |
Trust 343, Cl. 13, 12.001%, 9/1/334 | | | 975,230 | | | | 103,138 | |
Trust 343, Cl. 18, 14.18%, 5/1/344 | | | 302,144 | | | | 42,355 | |
Trust 345, Cl. 9, 11.31%, 1/1/344 | | | 1,358,170 | | | | 148,339 | |
Trust 346, Cl. 2, (12.874)%, 12/1/334 | | | 671,881 | | | | 80,711 | |
Trust 351, Cl. 10, 14.256%, 4/1/344 | | | 425,470 | | | | 46,100 | |
Trust 351, Cl. 11, 12.86%, 11/1/344 | | | 218,083 | | | | 24,213 | |
Trust 351, Cl. 8, 12.789%, 4/1/344 | | | 655,197 | | | | 70,985 | |
Trust 355, Cl. 7, 9.047%, 11/1/334` | | | 186,495 | | | | 24,315 | |
Trust 356, Cl. 10, 13.15%, 6/1/354 | | | 579,979 | | | | 63,681 | |
Trust 356, Cl. 12, 13.355%, 2/1/354 | | | 299,585 | | | | 32,387 | |
Trust 356, Cl. 6, 13.305%, 12/1/334 | | | 247,968 | | | | 27,058 | |
Trust 362, Cl. 12, 12.979%, 8/1/354 | | | 1,754,951 | | | | 233,817 | |
Trust 362, Cl. 13, 12.965%, 8/1/354 | | | 971,095 | | | | 129,246 | |
Trust 364, Cl. 15, 15.907%, 9/1/354 | | | 67,318 | | | | 9,247 | |
Trust 364, Cl. 16, 14.77%, 9/1/354 | | | 1,248,748 | | | | 198,605 | |
Trust 365, Cl. 16, 19.029%, 3/1/364 | | | 1,937,115 | | | | 207,935 | |
F3 | OPPENHEIMER CORE BOND FUND/VA
STATEMENT OF INVESTMENTS Continued
| | | | | | | | | |
| | | Principal | | | | |
| | | Amount | | | Value | |
| |
FHLMC/FNMA/Sponsored Continued | | | | | | | | |
Federal National Mortgage Assn.,
Principal-Only Stripped. Mtg.-Backed
Security: | | | | | | | | |
Trust 1993-184, Cl. M, 6.775%, 9/25/235 | | $ | 470,622 | | | $ | 400,145 | |
Trust 324, Cl. 1, 9.919%, 7/1/325 | | | 16,292 | | | | 14,561 | |
| | | | | | | | | |
| | | | | | | | 144,828,682 | |
| | | | | | | | | |
GNMA/Guaranteed—0.9% | | | | | | | | |
| Government National Mortgage Assn.: | | | | | | | | |
| 7%, 5/29/09-3/15/26 | | | 51,209 | | | | 54,258 | |
| 8.50%, 8/1/17-12/15/17 | | | 198,349 | | | | 211,967 | |
Government National Mortgage
Assn., Gtd. Real Estate Mtg.
Investment Conduit Pass-Through
Certificates: | | | | | | | | |
| Series 1999-32, Cl. ZB, 8%, 9/16/29 | | | 113,068 | | | | 124,145 | |
| Series 2000-7, Cl. Z, 8%, 1/16/30 | | | 51,444 | | | | 57,000 | |
Government National Mortgage
Assn., Interest-Only Stripped
Mtg.-Backed Security:
| | | | | | | | |
Series 1998-19, Cl. SB, 34.451%, 7/16/284 | | | 24,329 | | | | 3,311 | |
Series 2001-21, Cl. SB, 67.288%, 1/16/274 | | | 918,902 | | | | 131,752 | |
Series 2002-15, Cl. SM, 58.098%, 2/16/324 | | | 973,438 | | | | 143,917 | |
Series 2004-11, Cl. SM, 39.547%, 1/17/304 | | | 648,514 | | | | 71,139 | |
Series 2006-47, Cl. SA, 79.219%, 8/16/364 | | | 8,923,139 | | | | 1,069,769 | |
| | | | | | | | | |
| | | | | | | | 1,867,258 | |
| | | | | | | | | |
Non-Agency—33.6% | | | | | | | | |
Commercial—15.1% | | | | | | | | |
| Asset Securitization Corp., | | | | | | | | |
Commercial Interest-Only Stripped
Mtg.-Backed Security, Series
1997-D4, Cl. PS1, 2.105%, 4/14/294 | | | 12,432,340 | | | | 295,263 | |
Banc of America Commercial
Mortgage, Inc., Commercial Mtg.
Pass-Through Certificates, Series
2006-1, Cl. AM, 5.421%, 9/1/45 | | | 4,070,000 | | | | 2,086,017 | |
Banc of America Funding Corp., Mtg.
Pass-Through Certificates, Series
2004-2, Cl. 2A1, 6.50%, 7/20/32 | | | 1,080,987 | | | | 1,034,975 | |
Capital Lease Funding Securitization
LP, Interest-Only Corporate-Backed
Pass-Through Certificates, Series
1997-CTL1, (6.348)%, 6/22/244 | | | 8,934,558 | | | | 177,944 | |
ChaseFlex Trust 2006-2, Multiclass
Mtg. Pass-Through Certificates,
Series 2006-2, Cl. A1B, 1.495%, 9/25/361 | | | 7,756 | | | | 7,431 | |
CHL Mortgage Pass-Through Trust
2005-17, Mtg. Pass-Through
Certificates, Series 2005-17,
Cl. 1A8, 5.50%, 9/1/35 | | | 80,000 | | | | 60,462 | |
Citigroup Commercial Mortgage
Trust 2008-C7, Commercial Mtg.
Pass-Through Certificates, Series
2008-C7, Cl. AM, 6.096%, 12/1/491 | | | 1,920,000 | | | | 907,314 | |
Citigroup Mortgage Loan Trust, Inc.
2006-WF1, Asset-Backed Pass-Through
Certificates, Series 2006-WF1,
Cl. A2B, 5.536%, 3/1/36 | | | 52,868 | | | | 52,432 | |
Citigroup/Deutsche Bank 2007-CD4
Commercial Mortgage Trust,
Commercial Mtg. Pass-Through
Certificates, Series 2007-CD4,
Cl. A2B, 5.205%, 12/11/49 | | | 1,630,000 | | | | 1,355,983 | |
CitiMortgage Alternative Loan
Trust 2006-A5, Real Estate Mtg.
Investment Conduit Pass-Through
Certificates: | | | 2,794,883 | | | | 1,208,191 | |
Series 2006-A5, Cl. 1A1, 0.871%, 10/25/361 | | | | | | | | |
Series 2006-A5, Cl. 1A13, 0.921%, 10/25/361 | | | 1,455,973 | | | | 594,858 | |
CWALT Alternative Loan Trust
2007-8CB, Mtg. Pass-Through
Certificates, Series 2007-8CB,
Cl. A1, 5.50%, 5/25/37 | | | 139,679 | | | | 123,599 | |
| Deutsche Alt-A Securities | | | | | | | |
Mortgage Loan Trust, Mtg.
Pass-Through Certificates: | | | | | | | | |
| Series 2006-AB2, Cl. A7, 5.961%, 6/25/36 | | | 364,266 | | | | 335,283 | |
| Series 2006-AB4, Cl. A1A, 6.005%, 10/25/36 | | | 49,881 | | | | 39,967 | |
| Series 2006-AB3, Cl. A7, 6.36%, 7/1/36 | | | 146,820 | | | | 141,501 | |
First Horizon Alternative Mortgage
Securities Trust 2004-FA2, Mtg.
Pass-Through Certificates,
Series 2004-FA2, Cl. 3A1, 6%, 1/25/35 | | | 733,323 | | | | 536,140 | |
First Horizon Alternative Mortgage
Securities Trust 2007-FA2, Mtg.
Pass-Through Certificates, Series
2007-FA2, Cl. 1A1, 5.50%, 4/25/37 | | | 799,527 | | | | 751,649 | |
First Horizon Mortgage Pass-Through
Trust 2007-AR3, Mtg. Pass-Through
Certificates, Series 2007-AR3,
Cl. 1A1, 6.132%, 11/1/371 | | | 648,651 | | | | 432,193 | |
GE Capital Commercial Mortgage
Corp., Commercial Mtg. Obligations,
Series 2004-C3, Cl. A2, 4.433%, 7/10/39 | | | 50,000 | | | | 49,217 | |
F4 | OPPENHEIMER CORE BOND FUND/VA
| | | | | | | | | |
| | | Principal | | |
| | | Amount | | Value |
| |
Commercial Continued | | | | | | | | |
JPMorgan Chase Commercial
Mortgage Securities Corp.,
Commercial Mtg. Pass-Through
Certificates: | | | | | | | | |
| Series 2005-LDP4, Cl. AM, 4.999%, 10/1/42 | | $ | 1,110,000 | | | $ | 655,827 | |
| Series 2008-C2, Cl. A4, 6.068%, 2/1/51 | | | 3,760,000 | | | | 2,676,016 | |
JPMorgan Chase Commercial
Mortgage Securities Trust,
Commercial Mtg. Pass-Through
Certificates: | | | | | | | | |
| Series 2007-LDPX, Cl. A2S, 5.305%, 1/15/49 | | | 3,950,000 | | | | 3,122,566 | |
Series 2007-LD11, Cl. A2, 5.804%, 6/15/491 | | | 110,000 | | | | 84,422 | |
| Series 2007-LD12, Cl. A2, 5.827%, 2/15/51 | | | 1,080,000 | | | | 845,274 | |
LB-UBS Commercial Mortgage Trust
2006-C1, Commercial Mtg.
Pass-Through Certificates: | | | | | | | | |
| Series 2006-C1, Cl. A2, 5.084%, 2/11/31 | | | 2,320,000 | | | | 2,026,085 | |
Series 2006-C1, Cl. AM, 5.217%, 2/11/311 | | | 2,300,000 | | | | 1,160,430 | |
Lehman Brothers Commercial
Conduit Mortgage Trust,
Interest-Only Stripped Mtg.-Backed
Security, Series 1998-C1,
Cl. IO, (0.425)%, 2/18/304 | | | 4,729,592 | | | | 98,614 | |
Lehman Structured Securities
Corp., Commercial Mtg. Pass-Through
Certificates, Series 2002-GE1,
Cl. A, 2.514%, 7/26/242 | | | 245,694 | | | | 183,765 | |
Mastr Alternative Loan Trust
2004-6, Mtg. Pass-Through
Certificates, Series 2004-6,
Cl. 10A1, 6%, 7/25/34 | | | 1,449,610 | | | | 1,059,848 | |
Mastr Asset Securitization Trust
2006-3, Mtg. Pass-Through Certificates,
Series 2006-3, Cl. 2A1, 0.921%, 10/25/361 | | | 149,767 | | | | 94,415 | |
Merrill Lynch Mortgage Investors
Trust 2005-A9, Mtg. Asset-Backed
Certificates, Series 2005-A9,
Cl. 4A1, 5.492%, 12/1/351 | | | 1,947,029 | | | | 1,273,413 | |
Nomura Asset Securities Corp.,
Commercial Mtg. Pass-Through
Certificates, Series 1998-D6,
Cl. A1B, 6.59%, 3/15/30 | | | 778 | | | | 777 | |
RALI Series 2007-QS6 Trust, Mtg.
Asset-Backed Pass-Through
Certificates, Series 2007-QS6,
Cl. A114, 5.75%, 4/25/37 | | | 1,155,364 | | | | 504,534 | |
Residential Asset Securitization
Trust 2006-A9CB, Mtg. Pass-Through
Certificates, Series 2006-A9CB,
Cl. A5, 6%, 9/25/36 | | | 1,562,894 | | | | 764,568 | |
Salomon Brothers Mortgage
Securities VII, Inc., Interest-Only
Commercial Mtg. Pass-Through
Certificates, Series 1999-C1,
Cl. X, 7.658%, 5/18/324 | | | 84,872,080 | | | | 228,951 | |
Structured Asset Securities Corp.,
Mtg. Pass-Through Certificates,
Series 2002-AL1, Cl. B2, 3.45%, 2/25/32 | | | 2,177,430 | | | | 1,024,444 | |
Wachovia Bank Commercial
Mortgage Trust 2006-C29,
Commercial Mtg. Pass-Through
Certificates, Series 2006-C29,
Cl. A2, 5.272%, 11/15/48 | | | 370,000 | | | | 303,664 | |
Wachovia Mortgage Loan Trust
LLC, Mtg. Pass-Through
Certificates, Series 2007-A,
Cl. 1A1, 5.981%, 3/1/371 | | | 1,423,195 | | | | 767,784 | |
WaMu Mortgage Pass-Through
Certificates 2006-AR8 Trust,
Mtg. Pass-Through Certificates,
Series 2006-AR8, Cl. 1A4, 5.871%, 8/1/461 | | | 3,593,218 | | | | 2,000,203 | |
WaMu Mortgage Pass-Through
Certificates 2007-HY1 Trust,
Mtg. Pass-Through Certificates,
Series 2007-HY1, Cl. 1A2, 5.706%, 2/25/371,2 | | | 794,400 | | | | 182,712 | |
WaMu Mortgage Pass-Through
Certificates 2007-HY3 Trust,
Mtg. Pass-Through Certificates,
Series 2007-HY3, Cl. 2A2, 5.668%, 3/1/371 | | | 2,024,842 | | | | 523,335 | |
WaMu Mortgage Pass-Through
Certificates 2007-HY4 Trust, Mtg.
Pass-Through Certificates, Series
2007-HY4, Cl. 5A1, 5.548%, 11/1/361 | | | 1,125,156 | | | | 739,399 | |
WaMu Mortgage Pass-Through
Certificates 2007-HY5 Trust, Mtg.
Pass-Through Certificates,
Series 2007-HY5, Cl. 2A3, 5.647%, 5/1/371 | | | 1,179,613 | | | | 754,317 | |
Wells Fargo Mortgage-Backed
Securities 2004-EE Trust, Mtg.
Pass-Through Certificates,
Series 2004-EE, Cl. 3A2, 4.388%, 12/1/341 | | | 2,117,735 | | | | 1,601,247 | |
Wells Fargo Mortgage-Backed
Securities 2004-U Trust, Mtg.
Pass-Through Certificates, Series
2004-U, Cl. A1, 5.245%, 10/1/341 | | | 404,621 | | | | 345,485 | |
| | | | | | | | | |
| | | | | | | | 33,212,514 | |
F5 | OPPENHEIMER CORE BOND FUND/VA
STATEMENT OF INVESTMENTS Continued
| | | | | | | | | |
| | | Principal | | | | |
| | | Amount | | | Value | |
| |
Manufactured Housing—1.9% | | | | | | | | |
| Wells Fargo Mortgage-Backed Securities 2006-AR12 Trust, Mtg. Pass-Through Certificates, Series 2006-AR12, Cl. 2A1, 6.099%, 9/25/361 | | $ | 2,907,261 | | | $ | 1,868,922 | |
Wells Fargo Mortgage-Backed Securities 2006-AR2 Trust, Mtg. Pass-Through Certificates, Series 2006-AR2, Cl. 2A5, 5.093%, 3/25/361 | | | 3,545,876 | | | | 2,207,239 | |
| | | | | | | | |
| | | | | | | | 4,076,161 | |
| | | | | | | | | |
Multifamily—6.3% | | | | | | | | |
CHL Mortgage Pass-Through Trust 2003-46, Mtg. Pass-Through Certificates, Series 2003-46, Cl. 1A2, 5.15%, 1/19/341 | | | 1,320,462 | | | | 1,113,717 | |
CHL Mortgage Pass-Through Trust 2005-HYB1, Mtg. Pass-Through Certificates, Series 2005-HYB1, Cl. 1A2, 4.982%, 3/25/351 | | | 2,494,437 | | | | 1,561,752 | |
Citigroup Mortgage Loan Trust, Inc. 2006-AR5, Asset-Backed Pass-Through Certificates, Series 2006-AR5, Cl. 1A3A, 5.89%, 7/25/361 | | | 1,459,192 | | | | 765,131 | |
| CWALT Alternative Loan Trust 2005-85CB, Mtg. Pass-Through Certificates, Series 2005-85CB, Cl. 2A3, 5.50%, 2/25/36 | | | 1,790,000 | | | | 1,371,423 | |
| GMAC Mortgage Corp. Loan Trust, Mtg. Pass-Through Certificates, Series 2004-J4, Cl. A7, 5.50%, 9/25/34 | | | 1,660,000 | | | | 1,327,128 | |
GSR Mortgage Loan Trust 2005-AR7, Mtg. Pass-Through Certificates, Series 2005-AR7, Cl. 3A1, 5.14%, 11/25/351 | | | 4,004,761 | | | | 2,533,794 | |
Merrill Lynch Mortgage Investors Trust 2007-2, Mtg. Pass-Through Certificates, Series 2007-2, Cl. 2A1, 5.972%, 6/25/371 | | | 3,073,834 | | | | 2,153,618 | |
Wells Fargo Mortgage-Backed Securities 2004-AA Trust, Mtg. Pass-Through Certificates, Series 2004-AA, Cl. 2A, 4.992%, 12/25/341 | | | 825,559 | | | | 639,189 | |
Wells Fargo Mortgage-Backed Securities 2004-S Trust, Mtg. Pass-Through Certificates, Series 2004-S, Cl. A1, 3.742%, 9/25/341 | | | 672,556 | | | | 492,212 | |
Wells Fargo Mortgage-Backed Securities 2006-AR10 Trust, Mtg. Pass-Through Certificates, Series 2006-AR10, Cl. 4A1, 5.557%, 7/25/361 | | | 1,711,916 | | | | 1,122,862 | |
Wells Fargo Mortgage-Backed Securities 2006-AR2 Trust, Mtg. Pass-Through Certificates, Series 2006-AR2, Cl. 2A6, 5.093%, 3/25/361 | | | 673,358 | | | | 187,615 | |
Wells Fargo Mortgage-Backed Securities 2006-AR6 Trust, Mtg. Pass-Through Certificates, Series 2006-AR6, Cl. 3A1, 5.093%, 3/25/361 | | | 860,456 | | | | 617,983 | |
| | | | | | | | |
| | | | | | | | 13,886,424 | |
| | | | | | | | | |
Other—0.0% | | | | | | | | |
JPMorgan Mortgage Trust 2005-S2, Mtg. Pass-Through Certificates, Series 2005-S2, Cl. 3A1, 6.719%, 2/25/321 | | | 73,634 | | | | 54,972 | |
Salomon Brothers Mortgage Securities VI, Inc., Interest-Only Stripped Mtg.-Backed Security, Series 1987-3, Cl. B, 68.718%, 10/23/174 | | | 4,410 | | | | 539 | |
Salomon Brothers Mortgage Securities VI, Inc., Principal-Only Stripped Mtg.-Backed Security, Series 1987-3, Cl. A, 4.493%, 10/23/175 | | | 6,528 | | | | 6,072 | |
| | | | | | | | |
| | | | | | | | 61,583 | |
| | | | | | | | | |
Residential—10.3% | | | | | | | | |
| CHL Mortgage Pass-Through Trust 2005-J4, Mtg. Pass-Through Certificates, Series 2005-J4, Cl. A7, 5.50%, 11/1/35 | | | 40,000 | | | | 28,241 | |
| CWALT Alternative Loan Trust 2004-24CB, Mtg. Pass-Through Certificates, Series 2004-24CB, Cl. 1A1, 6%, 11/1/34 | | | 1,455,388 | | | | 1,282,516 | |
| CWALT Alternative Loan Trust 2004-28CB, Mtg. Pass-Through Certificates, Series 2004-28CB, Cl. 3A1, 6%, 1/1/35 | | | 1,156,881 | | | | 788,180 | |
| CWALT Alternative Loan Trust 2005-18CB, Mtg. Pass-Through Certificates, Series 2005-18CB, Cl. A8, 5.50%, 5/25/36 | | | 2,420,000 | | | | 1,788,376 | |
| CWALT Alternative Loan Trust 2005-J1, Mtg. Pass-Through Certificates, Series 2005-J1, Cl. 3A1, 6.50%, 8/25/32 | | | 1,942,209 | | | | 1,243,939 | |
| CWALT Alternative Loan Trust 2005-J3, Mtg. Pass-Through Certificates, Series 2005-J3, Cl. 3A1, 6.50%, 9/25/34 | | | 1,737,932 | | | | 1,497,447 | |
JP Morgan Mortgage Trust 2006-A2, Mtg. Pass-Through Certificates, Series 2006-A2, Cl. 5A3, 5.138%, 11/1/331 | | | 1,513,311 | | | | 1,175,351 | |
| Lehman XS Trust, Mtg. Pass-Through Certificates, Series 2005-10, Cl. 2A3B, 5.55%, 1/25/36 | | | 601,025 | | | | 553,920 | |
Merrill Lynch Mortgage Investors Trust 2006-3, Mtg. Pass-Through Certificates, Series 2006-3, Cl. 2A1, 6.076%, 10/25/361 | | | 99,157 | | | | 73,852 | |
F6 | OPPENHEIMER CORE BOND FUND/VA
| | | | | | | | | |
| | | Principal | | | | |
| | | Amount | | | Value | |
| |
Residential Continued | | | | | | | | |
Morgan Stanley Mortgage Loan Trust 2006-AR, Mtg. Pass-Through Certificates, Series 2006-AR, Cl. 5A3, 5.416%, 6/25/361 | | $ | 1,110,000 | | | $ | 769,319 | |
| RALI Series 2003-QS1 Trust, Mtg. Asset-Backed Pass-Through Certificates, Series 2003-QS1, Cl. A2, 5.75%, 1/25/33 | | | 598,225 | | | | 596,328 | |
RALI Series 2004-QS10 Trust, Mtg. Asset-Backed Pass-Through Certificates, Series 2004-QS10, Cl. A3, 0.971%, 7/25/341 | | | 1,409,857 | | | | 1,187,414 | |
| RALI Series 2006-QS13 Trust: | | | | | | | | |
| Mtg. Asset-Backed Pass-Through Certificates, Series 2006-QS13, Cl. 1A5, 6%, 9/25/36 | | | 102,248 | | | | 69,150 | |
| Mtg. Asset-Backed Pass-Through Certificates, Series 2006-QS13, Cl. 1A8, 6%, 9/25/36 | | | 29,911 | | | | 28,789 | |
| RALI Series 2006-QS5 Trust, Mtg. Asset-Backed Pass-Through Certificates, Series 2006-QS5, Cl. 2A2, 6%, 5/1/36 | | | 385,987 | | | | 377,417 | |
| RALI Series 2007-QS6 Trust, Mtg. Asset-Backed Pass-Through Certificates, Series 2007-QS6, Cl. A28, 5.75%, 4/25/37 | | | 38,257 | | | | 18,024 | |
STARM Mortgage Loan Trust 2007-S1, Mtg. Pass-Through Certificates, Series 2007-S1, Cl. 3A1, 5.01%, 8/1/221,2 | | | 3,880,964 | | | | 2,522,627 | |
WaMu Mortgage Pass-Through Certificates 2006-AR8 Trust, Mtg. Pass-Through Certificates, Series 2006-AR8, Cl. 2A1, 6.127%, 8/25/361 | | | 3,308,565 | | | | 2,200,867 | |
WaMu Mortgage Pass-Through Certificates 2007-HY1 Trust, Mtg. Pass-Through Certificates, Series 2007-HY1, Cl. 4A1, 5.449%, 2/1/371 | | | 82,812 | | | | 49,469 | |
WaMu Mortgage Pass-Through Certificates 2007-HY2 Trust, Mtg. Pass-Through Certificates, Series 2007-HY2, Cl. 2A1, 6.615%, 11/1/361 | | | 1,174,842 | | | | 670,696 | |
| Washington Mutual Mortgage Pass-Through Certificates, Mtg. Pass-Through Certificates, Series 2007-1, Cl. 1A8, 6%, 2/25/37 | | | 3,321,774 | | | | 2,906,103 | |
| Wells Fargo Mortgage-Backed Securities 2003-6 Trust, Mtg. Pass-Through Certificates, Series 2003-6, Cl. 1A1, 5%, 6/25/18 | | | 1,288,218 | | | | 1,259,475 | |
Wells Fargo Mortgage-Backed Securities 2004-EE Trust, Mtg. Pass-Through Certificates, Series 2004-EE, Cl. 3A1, 4.388%, 12/1/341 | | | 883,087 | | | | 688,369 | |
Wells Fargo Mortgage-Backed Securities 2004-R Trust, Mtg. Pass-Through Certificates, Series 2004-R, Cl. 2A1, 4.368%, 9/1/341 | | | 452,363 | | | | 323,841 | |
Wells Fargo Mortgage-Backed Securities 2006-AR5 Trust, Mtg. Pass-Through Certificates, Series 2006-AR5, Cl. 2A2, 5.545%, 4/1/361,2 | | | 1,556,566 | | | | 404,707 | |
| | | | | | | | |
| | | | | | | | 22,504,417 | |
| | | | | | | | |
Total Mortgage-Backed Obligations
(Cost $253,425,354) | | | | | | | 220,437,039 | |
| | | | | | | | | |
| |
U.S. Government Obligations—0.2% | | | | | | | | |
Resolution Funding Corp. Bonds, Residual Funding STRIPS, 2.827%, 1/15/217 (Cost $444,184) | | | 825,000 | | | | 520,068 | |
| |
| | | | | | | | | |
Corporate Bonds and Notes—29.1% | | | | | | | | |
Consumer Discretionary—5.6% | | | | | | | | |
Automobiles—2.3% | | | | | | | | |
| Ford Motor Credit Co., 9.75% Sr. Unsec. Nts., 9/15/10 | | | 4,080,000 | | | | 3,265,134 | |
| General Motors Acceptance Corp., 8% Bonds, 11/1/31 | | | 3,185,000 | | | | 1,866,923 | |
| | | | | | | | |
| | | | | | | | 5,132,057 | |
| | | | | | | | | |
Hotels, Restaurants & Leisure—1.6% | | | | | | | | |
| MGM Mirage, Inc., 6% Sr. Sec. Nts., 10/1/09 | | | 2,215,000 | | | | 2,126,400 | |
| Park Place Entertainment Corp., 7.875% Sr. Sub. Nts., 3/15/10 | | | 350,000 | | | | 232,750 | |
| Wynn Las Vegas LLC/Wynn Las Vegas Capital Corp., 6.625% Nts., 12/1/14 | | | 1,340,000 | | | | 1,018,400 | |
| | | | | | | | |
| | | | | | | | 3,377,550 | |
| | | | | | | | | |
Household Durables—0.6% | | | | | | | | |
| Centex Corp., 5.80% Sr. Unsec. Nts., 9/15/09 | | | 910,000 | | | | 869,050 | |
| Lennar Corp., 7.625% Sr. Unsec. Nts., 3/1/09 | | | 400,000 | | | | 398,000 | |
| | | | | | | | |
| | | | | | | | 1,267,050 | |
| | | | | | | | | |
Media—0.2% | | | | | | | | |
| Clear Channel Communications, Inc., 6.25% Nts., 3/15/11 | | | 1,370,000 | | | | 417,850 | |
| | | | | | | | | |
Multiline Retail—0.9% | | | | | | | | |
| Macy’s Retail Holdings, Inc., 4.80% Sr. Nts., 7/15/09 | | | 2,125,000 | | | | 2,014,400 | |
Consumer Staples—0.4% | | | | | | | | |
Food & Staples Retailing—0.4% | | | | | | | | |
| Albertson’s, Inc., 8% Sr. Unsec. Debs., 5/1/31 | | | 1,675,000 | | | | 1,013,375 | |
F7 | OPPENHEIMER CORE BOND FUND/VA
STATEMENT OF INVESTMENTS Continued
| | | | | | | | | |
| | | Principal | | | | |
| | | Amount | | | Value | |
| |
Energy—2.0% | | | | | | | | |
Oil, Gas & Consumable Fuels—2.0% | | | | | | | | |
| Buckeye Partners LP, 4.625% Sr. Nts., 7/15/13 | | $ | 745,000 | | | $ | 634,013 | |
| Energy Transfer Partners LP, 5.65% Sr. Unsec. Unsub. Nts., 8/1/12 | | | 430,000 | | | | 384,197 | |
| Kaneb Pipe Line Operating Partnership LP, 5.875% Sr. Unsec. Nts., 6/1/13 | | | 1,560,000 | | | | 1,314,211 | |
PF Export Receivables Master Trust, 3.748% Sr. Nts., Series B, 6/1/138 | | | 876,612 | | | | 931,928 | |
| TEPPCO Partners LP, 6.125% Nts., 2/1/13 | | | 900,000 | | | | 801,429 | |
| Valero Logistics Operations LP, 6.05% Nts., 3/15/13 | | | 540,000 | | | | 462,604 | |
| | | | | | | | |
| | | | | | | | 4,528,382 | |
| | | | | | | | | |
Financials—18.6% | | | | | | | | |
Capital Markets—1.2% | | | | | | | | |
| Goldman Sachs Capital, Inc. (The), 6.345% Sub. Bonds, 2/15/34 | | | 3,595,000 | | | | 2,615,531 | |
Lehman Brothers Holdings, Inc., 7.50% Sub. Nts., 5/11/389 | | | 7,200,000 | | | | 720 | |
| | | | | | | | |
| | | | | | | | 2,616,251 | |
| | | | | | | | | |
Commercial Banks—4.9% | | | | | | | | |
Barclays Bank plc, 6.278% Perpetual Bonds10 | | | 5,830,000 | | | | 3,374,812 | |
HBOS plc, 6.413% Sub. Perpetual Bonds, Series A8,10 | | | 6,600,000 | | | | 2,563,876 | |
HSBC Finance Capital Trust IX, 5.911% Nts., 11/30/351 | | | 5,920,000 | | | | 2,479,722 | |
| Popular North America, Inc., 4.70% Nts., 6/30/09 | | | 2,485,000 | | | | 2,429,028 | |
| | | | | | | | |
| | | | | | | | 10,847,438 | |
| | | | | | | | | |
Diversified Financial Services—7.7% | | | | | | | | |
| Bank of America Corp.: | | | | | | | | |
8% Unsec. Perpetual Bonds, Series K10 | | | 3,050,000 | | | | 2,196,976 | |
8.125% Perpetual Bonds, Series M10 | | | 515,000 | | | | 385,864 | |
| Capmark Financial Group, Inc.: | | | | | | | | |
3.038% Sr. Unsec. Nts., 5/10/101 | | | 700,000 | | | | 357,338 | |
| 5.875% Sr. Unsec. Nts., 5/10/12 | | | 1,470,000 | | | | 501,548 | |
| CIT Group Funding Co. of Canada, 4.65% Sr. Unsec. Nts., 7/1/10 | | | 1,235,000 | | | | 1,084,537 | |
| Citigroup, Inc.: | | | | | | | | |
8.30% Jr. Sub. Bonds, 12/21/571 | | | 4,485,000 | | | | 3,466,802 | |
8.40% Perpetual Bonds, Series E10 | | | 1,730,000 | | | | 1,144,464 | |
JPMorgan Chase & Co., 7.90% Perpetual Bonds, Series 110 | | | 3,255,000 | | | | 2,714,755 | |
| Merrill Lynch & Co., Inc., 7.75% Jr. Sub. Bonds, 5/14/38 | | | 4,490,000 | | | | 4,961,728 | |
| | | | | | | | |
| | | | | | | | 16,814,012 | |
| | | | | | | | | |
Insurance—4.5% | | | | | | | | |
| American International Group, Inc., 6.25% Jr. Sub. Bonds, 3/15/37 | | | 1,290,000 | | | | 482,912 | |
Axa SA, 6.379% Sub. Perpetual Bonds8,10 | | | 5,205,000 | | | | 2,332,459 | |
| MBIA, Inc., 5.70% Sr. Unsec. Unsub. Nts., 12/1/34 | | | 1,055,000 | | | | 429,248 | |
MetLife Capital Trust X, 9.25% Sec. Bonds, 4/8/381 | | | 700,000 | | | | 489,218 | |
MetLife, Inc., 6.40% Jr. Unsec. Sub. Bonds, 12/15/361 | | | 3,875,000 | | | | 2,330,375 | |
Prudential Holdings LLC, 8.695% Bonds, Series C, 12/18/238 | | | 2,400,000 | | | | 2,317,574 | |
Prudential Insurance Co. of America, 8.30% Nts., 7/1/258 | | | 2,035,000 | | | | 1,375,123 | |
| | | | | | | | |
| | | | | | | | 9,756,909 | |
| | | | | | | | | |
Thrifts & Mortgage Finance—0.3% | | | | | | | | |
| Washington Mutual Bank NV, 3.337% Sr. Unsec. Nts., 5/1/099 | | | 2,380,000 | | | | 702,100 | |
Information Technology—0.8% | | | | | | | | |
Computers & Peripherals—0.8% | | | | | | | | |
| NCR Corp., 7.125% Sr. Unsec. Unsub. Nts., 6/15/09 | | | 1,700,000 | | | | 1,705,170 | |
Utilities—1.7% | | | | | | | | |
Electric Utilities—1.7% | | | | | | | | |
| Monongahela Power Co., 7.36% Unsec. Nts., Series A, 1/15/10 | | | 1,925,000 | | | | 1,884,895 | |
| Westar Energy, Inc., 7.125% Sr. Unsec. Nts., 8/1/09 | | | 1,820,000 | | | | 1,812,571 | |
| | | | | | | | |
| | | | | | | | 3,697,466 | |
| | | | | | | | |
| | | | | | | | | |
Total Corporate Bonds and Notes
(Cost $96,373,886) | | | | | | | 63,890,010 | |
| | | | | | | | | |
| | | Units | | | | | |
| |
Rights, Warrants and Certificates—0.0% | | | | | | | | |
Pathmark Stores, Inc. Wts., Strike Price $22.31, Exp. 9/19/102,11 (Cost $14,872) | | | 5,408 | | | | 189 | |
| | | | | | | | | |
| | | Shares | | | | | |
| |
Investment Company—6.2% | | | | | | | | |
Oppenheimer Institutional Money Market Fund, Cl. E, 1.96%12,13 (Cost $13,605,218) | | | 13,605,218 | | | | 13,605,218 | |
| | | | | | | | | |
Total Investments, at Value
(Cost $375,825,605) | | | 139.6 | % | | | 306,331,228 | |
Liabilities in Excess of Other Assets | | | (39.6 | ) | | | (86,899,653 | ) |
| | | |
Net Assets | | | 100.0 | % | | $ | 219,431,575 | |
| | | |
Industry classifications are unaudited.
F8 | OPPENHEIMER CORE BOND FUND/VA
| | |
| Footnotes to Statement of Investments |
| |
| 1. | | Represents the current interest rate for a variable or increasing rate security. |
| |
| 2. | | Illiquid security. The aggregate value of illiquid securities as of December 31, 2008 was $5,141,245, which represents 2.34% of the Fund’s net assets. See Note 8 of accompanying Notes. |
| |
| 3. | | All or a portion of the security is held in collateralized accounts to cover initial margin requirements on open futures contracts. The aggregate market value of such securities is $825,070. See Note 5 of accompanying Notes. |
| |
| 4. | | Interest-Only Strips represent the right to receive the monthly interest payments on an underlying pool of mortgage loans. These securities typically decline in price as interest rates decline. Most other fixed income securities increase in price when interest rates decline. The principal amount of the underlying pool represents the notional amount on which current interest is calculated. The price of these securities is typically more sensitive to changes in prepayment rates than traditional mortgage-backed securities (for example, GNMA pass-throughs). Interest rates disclosed represent current yields based upon the current cost basis and estimated timing and amount of future cash flows. These securities amount to $13,064,019 or 5.95% of the Fund’s net assets as of December 31, 2008. |
| |
| 5. | | Principal-Only Strips represent the right to receive the monthly principal payments on an underlying pool of mortgage loans. The value of these securities generally increases as interest rates decline and prepayment rates rise. The price of these securities is typically more volatile than that of coupon-bearing bonds of the same maturity. Interest rates disclosed represent current yields based upon the current cost basis and estimated timing of future cash flows. These securities amount to $755,368 or 0.34% of the Fund’s net assets as of December 31, 2008. |
| |
| 6. | | When-issued security or delayed delivery to be delivered and settled after December 31, 2008. See Note 1 of accompanying Notes. |
| |
| 7. | | Zero coupon bond reflects effective yield on the date of purchase. |
| |
| 8. | | Represents securities sold under Rule 144A, which are exempt from registration under the Securities Act of 1933, as amended. These securities have been determined to be liquid under guidelines established by the Board of Trustees. These securities amount to $9,520,960 or 4.34% of the Fund’s net assets as of December 31, 2008. |
| |
| 9. | | Issue is in default. See Note 1 of accompanying Notes. |
| |
| 10. | | This bond has no contractual maturity date, is not redeemable and contractually pays an indefinite stream of interest. Rate reported represents the current interest rate for this variable rate security. |
| |
| 11. | | Non-income producing security. |
| |
| 12. | | Is or was an affiliate, as defined in the Investment Company Act of 1940, at or during the period ended December 31, 2008, by virtue of the Fund owning at least 5% of the voting securities of the issuer or as a result of the Fund and the issuer having the same investment adviser. Transactions during the period in which the issuer was an affiliate are as follows: |
| | | | | | | | | | | | | | | | | |
| | | Shares | | | Gross | | | Gross | | | Shares | |
| | | December 31, 2007 | | | Additions | | | Reductions | | | December 31, 2008 | |
| |
| OFI Liquid Assets Fund, LLC | | | — | | | | 15,411,921 | | | | 15,411,921 | | | | — | |
| Oppenheimer Institutional Money Market Fund, Cl. E | | | 4,105,793 | | | | 260,480,009 | | | | 250,980,584 | | | | 13,605,218 | |
| | | | | | | | | |
| | | Value | | | Income | |
| |
| OFI Liquid Assets Fund, LLC | | $ | — | | | $ | 18,564 | a |
| Oppenheimer Institutional Money | | | 13,605,218 | | | | 246,255 | |
| | | |
| Market Fund, Cl. E | | $ | 13,605,218 | | | $ | 264,819 | |
| | | |
| | |
| a. | | Net of compensation to the securities lending agent and rebates paid to the borrowing counterparties. |
| |
| 13. | | Rate shown is the 7-day yield as of December 31, 2008. |
Valuation Inputs
Various data inputs are used in determining the value of each of the Fund’s investments as of the reporting period end. These data inputs are categorized in the following hierarchy under applicable financial accounting standards:
1) Level 1—quoted prices in active markets for identical assets or liabilities (including securities actively traded on a securities exchange)
2) Level 2—inputs other than quoted prices that are observable for the asset (such as quoted prices for similar assets and market corroborated inputs such as interest rates, prepayment speeds, credit risks, etc.)
3) Level 3—unobservable inputs (including the Manager’s own judgments about assumptions that market participants would use in pricing the asset).
The market value of the Fund’s investments was determined based on the following inputs as of December 31, 2008:
| | | | | | | | | |
| | | Investments | | | Other Financial | |
| Valuation Description | | in Securities | | | Instruments* | |
| |
| Level 1—Quoted Prices | | $ | 13,605,218 | | | $ | (509,885 | ) |
| Level 2—Other Significant Observable Inputs | | | 292,725,821 | | | | (4,069,834 | ) |
| Level 3—Significant Unobservable Inputs | | | 189 | | | | — | |
| | | |
| Total | | $ | 306,331,228 | | | $ | (4,579,719 | ) |
| | | |
| | |
| * | | Other financial instruments include options written, currency contracts, futures, forwards and swap contracts. Currency contracts and forwards are reported at their unrealized appreciation/depreciation at measurement date, which represents the change in the contract’s value from trade date. Futures are reported at their variation margin at measurement date, which represents the amount due to/from the Fund at that date. Options written and swaps are reported at their market value at measurement date. |
See the accompanying Notes for further discussion of the methods used in determining value of the Fund’s investments, and a summary of changes to the valuation techniques, if any, during the reporting period.
F9 | OPPENHEIMER CORE BOND FUND/VA
STATEMENT OF INVESTMENTS Continued
Footnotes to Statement of Investments Continued
Futures Contracts as of December 31, 2008 are as follows:
| | | | | | | | | | | | | | | | | | | | | |
| | | | | | | | | | | | | | | | | | | Unrealized | |
| | | | | | | Number of | | | Expiration | | | | | | | Appreciation | |
| Contract Description | | Buy/Sell | | | Contracts | | | Date | | | Value | | | (Depreciation) | |
| |
| U.S. Treasury Bonds, 10 yr. | | Buy | | | 180 | | | | 3/20/09 | | | $ | 22,635,000 | | | $ | (91,824 | ) |
| U.S. Treasury Bonds, 20 yr. | | Buy | | | 70 | | | | 3/20/09 | | | | 9,663,281 | | | | 14,450 | |
| U.S. Treasury Nts., 2 yr. | | Sell | | | 49 | | | | 3/31/09 | | | | 10,685,063 | | | | (16,096 | ) |
| | | | | | | | | | | | | | | | | | | | |
| | | | | | | | | | | | | | | | | | | $ | (93,470 | ) |
| | | | | | | | | | | | | | | | | | | | |
Credit Default Swap Contracts as of December 31, 2008 are as follows:
| | | | | | | | | | | | | | | | | | | | | | | | | | | |
| | | | | | | | | | | | | | | | | | | | | Upfront | | | | |
| | | | | Buy/Sell | | | Notional | | | Pay/ | | | | | | | Payment | | | | |
| | | | | Credit | | | Amount | | | Receive | | | Termination | | | Received/ | | | | |
| Swap Reference Entity | | Counterparty | | Protection | | | (000s) | | | Fixed Rate | | | Date | | | (Paid) | | | Value | |
| |
| ABX.HE.AA.06-2 Index: | | | | | | | | | | | | | | | | | | | | | | | | |
| | | Barclays Bank plc | | Sell | | $ | 930 | | | �� | 0.170 | % | | | 5/25/46 | | | $ | 719,465 | | | $ | (816,772 | ) |
| | | Deutsche Bank AG | | Sell | | | 450 | | | | 0.170 | | | | 5/25/46 | | | | 53,996 | | | | (395,212 | ) |
| | | Goldman Sachs Bank USA | | Sell | | | 155 | | | | 0.170 | | | | 5/25/46 | | | | 12,771 | | | | (136,129 | ) |
| | | Goldman Sachs Bank USA | | Sell | | | 760 | | | | 0.170 | | | | 5/25/46 | | | | 300,182 | | | | (667,469 | ) |
| | | Morgan Stanley Capital Services, Inc. | | Sell | | | 155 | | | | 0.170 | | | | 5/25/46 | | | | 12,383 | | | | (136,129 | ) |
| | | Morgan Stanley Capital Services, Inc. | | Sell | | | 300 | | | | 0.170 | | | | 5/25/46 | | | | 29,999 | | | | (263,475 | ) |
| | | | | | | | | | | | | | | | | | | | |
| | | | | Total | | | 2,750 | | | | | | | | | | | | 1,128,796 | | | | (2,415,186 | ) |
| | | | | | | | | | | | | | | | | | | | | | | | | | | |
| ABX-HE-AAA 06-2 Index: | | | | | | | | | | | | | | | | | | | | | | | | |
| | | Deutsche Bank AG | | Sell | | | 40 | | | | 0.110 | | | | 5/25/46 | | | | — | | | | (20,371 | ) |
| | | Deutsche Bank AG | | Sell | | | 40 | | | | 0.110 | | | | 5/25/46 | | | | — | | | | (20,371 | ) |
| | | Goldman Sachs Bank USA | | Sell | | | 20 | | | | 0.110 | | | | 5/25/46 | | | | — | | | | (10,186 | ) |
| | | Morgan Stanley Capital Services, Inc. | | Sell | | | 20 | | | | 0.110 | | | | 5/25/46 | | | | — | | | | (10,186 | ) |
| | | | | | | | | | | | | | | | | | | | |
| | | | | Total | | | 120 | | | | | | | | | | | | — | | | | (61,114 | ) |
| | | | | | | | | | | | | | | | | | | | | | | | | | | |
| Allied Waste North America, Inc.: | | | | | | | | | | | | | | | | | | | | | | | | |
| | | Deutsche Bank AG | | Sell | | | 630 | | | | 2.000 | | | | 9/20/09 | | | | — | | | | 4,864 | |
| | | Deutsche Bank AG | | Sell | | | 990 | | | | 2.000 | | | | 9/20/09 | | | | — | | | | 7,644 | |
| | | | | | | | | | | | | | | | | | | | |
| | | | | Total | | | 1,620 | | | | | | | | | | | | — | | | | 12,508 | |
| | | | | | | | | | | | | | | | | | | | | | | | | | | |
| American International Group, Inc.: | | | | | | | | | | | | | | | | | | | | | | | | |
| | | Barclays Bank plc | | Sell | | | 495 | | | | 3.000 | | | | 3/20/09 | | | | — | | | | (2,901 | ) |
| | | Barclays Bank plc | | Sell | | | 2,600 | | | | 5.350 | | | | 3/20/09 | | | | — | | | | (490 | ) |
| | | | | | | | | | | | | | | | | | | | |
| | | | | Total | | | 3,095 | | | | | | | | | | | | — | | | | (3,391 | ) |
| | | | | | | | | | | | | | | | | | | | | | | | | | | |
| Capmark Financial Group, Inc.: | | | | | | | | | | | | | | | | | | | | | | | | |
| | | Barclays Bank plc | | Sell | | | 950 | | | | 1.000 | | | | 6/20/12 | | | | — | | | | (497,954 | ) |
| | | Goldman Sachs Bank USA | | Sell | | | 1,035 | | | | 0.950 | | | | 6/20/12 | | | | — | | | | (543,202 | ) |
| | | Morgan Stanley Capital Services, Inc. | | Sell | | | 405 | | | | 5.000 | | | | 6/20/12 | | | | 109,350 | | | | (190,540 | ) |
| | | | | | | | | | | | | | | | | | | | |
| | | | | Total | | | 2,390 | | | | | | | | | | | | 109,350 | | | | (1,231,696 | ) |
| | | | | | | | | | | | | | | | | | | | | | | | | | | |
| CDX North America Investment | | | | | | | | | | | | | | | | | | | | | | | | |
| Grade Index, Series 7: | | Deutsche Bank AG | | Buy | | | 3,514 | | | | 0.400 | | | | 12/20/11 | | | | (370 | ) | | | 128,041 | |
| | | | | | | | | | | | | | | | | | | | |
| | | | | Total | | | 3,514 | | | | | | | | | | | | (370 | ) | | | 128,041 | |
| | | | | | | | | | | | | | | | | | | | | | | | | | | |
| Cemex SAB de CV | | Deutsche Bank AG | | Sell | | | 665 | | | | 2.000 | | | | 3/20/09 | | | | — | | | | (9,727 | ) |
| | | | | | | | | | | | | | | | | | | | |
| | | | | Total | | | 665 | | | | | | | | | | | | — | | | | (9,727 | ) |
| | | | | | | | | | | | | | | | | | | | | | | | | | | |
| Centex Corp.: | | | | | | | | | | | | | | | | | | | | | | | | | | |
| | | Barclays Bank plc | | Sell | | | 280 | | | | 4.650 | | | | 9/20/09 | | | | — | | | | (370 | ) |
| | | Deutsche Bank AG | | Sell | | | 355 | | | | 1.550 | | | | 9/20/09 | | | | — | | | | (8,497 | ) |
| | | | | | | | | | | | | | | | | | | | |
| | | | | Total | | | 635 | | | | | | | | | | | | — | | | | (8,867 | ) |
| | | | | | | | | | | | | | | | | | | | | | | | | | | |
| CIT Group, Inc.: | | | | | | | | | | | | | | | | | | | | | | | | | | |
| | | Barclays Bank plc | | Sell | | | 195 | | | | 10.500 | | | | 6/20/09 | | | | — | | | | 2,577 | |
| | | Deutsche Bank AG | | Sell | | | 125 | | | | 5.000 | | | | 3/20/09 | | | | 14,375 | | | | (3,573 | ) |
| | | | | | | | | | | | | | | | | | | | |
| | | | | Total | | | 320 | | | | | | | | | | | | 14,375 | | | | (996 | ) |
| | | | | | | | | | | | | | | | | | | | | | | | | | | |
| Countrywide Home Loans, Inc. | | Morgan Stanley Capital Services, Inc. | | Sell | | | 3,070 | | | | 0.420 | | | | 6/20/09 | | | | — | | | | (11,664 | ) |
| | | | | | | | | | | | | | | | | | | | |
| | | | | Total | | | 3,070 | | | | | | | | | | | | — | | | | (11,664 | ) |
| | | | | | | | | | | | | | | | | | | | | | | | | | | |
| Energy Future Holdings Corp.: | | | | | | | | | | | | | | | | | | | | | | | | |
| | | Credit Suisse International | | Sell | | | 365 | | | | 5.910 | | | | 12/20/12 | | | | — | | | | (100,178 | ) |
| | | Credit Suisse International | | Sell | | | 350 | | | | 6.050 | | | | 12/20/12 | | | | — | | | | (94,930 | ) |
F10 | OPPENHEIMER CORE BOND FUND/VA
Credit Default Swap Contracts: Continued
| | | | | | | | | | | | | | | | | | | | | | | | | | | |
| | | | | | | | | | | | | | | | | | | | | Upfront | | | | |
| | | | | Buy/Sell | | | Notional | | | Pay/ | | | | | | | Payment | | | | |
| | | | | Credit | | | Amount | | | Receive | | | Termination | | | Received/ | | | | |
| Swap Reference Entity | | Counterparty | | Protection | | | (000s) | | | Fixed Rate | | | Date | | | (Paid) | | | Value | |
| |
| Energy Future Holdings Corp.: | | | | | | | | | | | | | | | | | | | | | | | | |
| Continued | | | | | | | | | | | | | | | | | | | | | | | | |
| | Credit Suisse International | | Sell | | $ | 365 | | | | 6.000 | % | | | 12/20/12 | | | $ | — | | | $ | (99,420 | ) |
| | | | | | | | | | | | | | | | | | | | |
| | | | | Total | | | 1,080 | | | | | | | | | | | | — | | | | (294,528 | ) |
| | | | | | | | | | | | | | | | | | | | | | | | | | | |
| First Data Corp. | | Goldman Sachs International | | Sell | | | 110 | | | | 4.700 | | | | 3/20/09 | | | | — | | | | (3,428 | ) |
| | | | | | | | | | | | | | | | | | | | |
| | | | | Total | | | 110 | | | | | | | | | | | | — | | | | (3,428 | ) |
| | | | | | | | | | | | | | | | | | | | | | | | | | | |
| Ford Motor Co.: | | | | | | | | | | | | | | | | | | | | | | | | | | |
| | | Deutsche Bank AG | | Sell | | | 1,475 | | | | 5.000 | | | | 12/20/18 | | | | 796,500 | | | | (1,041,756 | ) |
| | | Morgan Stanley Capital Services, Inc. | | Sell | | | 2,065 | | | | 7.150 | | | | 12/20/16 | | | | — | | | | (1,343,693 | ) |
| | | Morgan Stanley Capital Services, Inc. | | Sell | | | 980 | | | | 7.050 | | | | 12/20/16 | | | | — | | | | (645,151 | ) |
| | | | | | | | | | | | | | | | | | | | |
| | | | | Total | | | 4,520 | | | | | | | | | | | | 796,500 | | | | (3,030,600 | ) |
| | | | | | | | | | | | | | | | | | | | | | | | | | | |
| General Electric Capital Corp.: | | | | | | | | | | | | | | | | | | | | | | | | |
| | | Barclays Bank plc | | Sell | | | 880 | | | | 8.000 | | | | 12/20/09 | | | | — | | | | 25,927 | |
| | | Barclays Bank plc | | Sell | | | 1,320 | | | | 5.750 | | | | 12/20/09 | | | | — | | | | 10,332 | |
| | | Credit Suisse International | | Sell | | | 770 | | | | 8.000 | | | | 12/20/09 | | | | — | | | | 22,687 | |
| | | | | | | | | | | | | | | | | | | | |
| | | | | Total | | | 2,970 | | | | | | | | | | | | — | | | | 58,946 | |
| | | | | | | | | | | | | | | | | | | | | | | | | | | |
| General Motors Corp.: | | | | | | | | | | | | | | | | | | | | | | | | | | |
| | | Deutsche Bank AG | | Sell | | | 960 | | | | 5.000 | | | | 12/20/18 | | | | 643,200 | | | | (760,042 | ) |
| | | Morgan Stanley Capital Services, Inc. | | Sell | | | 1,035 | | | | 5.800 | | | | 12/20/16 | | | | — | | | | (818,691 | ) |
| | | Morgan Stanley Capital Services, Inc. | | Sell | | | 1,000 | | | | 5.750 | | | | 12/20/16 | | | | — | | | | (791,439 | ) |
| | | | | | | | | | | | | | | | | | | | |
| | | | | Total | | | 2,995 | | | | | | | | | | | | 643,200 | | | | (2,370,172 | ) |
| | | | | | | | | | | | | | | | | | | | | | | | | | | |
| Goldman Sachs Group, Inc. (The): | | | | | | | | | | | | | | | | | | | | | | | | |
| | | Barclays Bank plc | | Sell | | | 1,285 | | | | 5.750 | | | | 12/20/09 | | | | — | | | | 26,187 | |
| | | Deutsche Bank AG | | Sell | | | 1,290 | | | | 5.500 | | | | 12/20/09 | | | | — | | | | 23,157 | |
| | | Deutsche Bank AG | | Sell | | | 930 | | | | 5.450 | | | | 12/20/09 | | | | — | | | | 16,242 | |
| | | | | | | | | | | | | | | | | | | | |
| | | | | Total | | | 3,505 | | | | | | | | | | | | — | | | | 65,586 | |
| | | | | | | | | | | | | | | | | | | | | | | | | | | |
| Hartford Financial Services Group, Inc. | | | | | | | | | | | | | | | | | | | | | | | | |
| | Morgan Stanley Capital Services, Inc. | | Sell | | | 665 | | | | 2.400 | | | | 3/20/09 | | | | — | | | | (6,644 | ) |
| | | | | | | | | | | | | | | | | | | | |
| | | | | Total | | | 665 | | | | | | | | | | | | — | | | | (6,644 | ) |
| | | | | | | | | | | | | | | | | | | | | | | | | | | |
| HCP, Inc. | | Barclays Bank plc | | Sell | | | 1,005 | | | | 4.600 | | | | 3/20/09 | | | | — | | | | 1,153 | |
| | | | | | | | | | | | | | | | | | | | |
| | | | | Total | | | 1,005 | | | | | | | | | | | | — | | | | 1,153 | |
| | | | | | | | | | | | | | | | | | | | | | | | | | | |
| Idearc, Inc. | | Credit Suisse International | | Sell | | | 140 | | | | 5.000 | | | | 12/20/09 | | | | 28,700 | | | | (101,276 | ) |
| | | | | | | | | | | | | | | | | | | | |
| | | | | Total | | | 140 | | | | | | | | | | | | 28,700 | | | | (101,276 | ) |
| | | | | | | | | | | | | | | | | | | | | | | | | | | |
| iStar Financial, Inc.: | | | | | | | | | | | | | | | | | | | | | | | | |
| | | Barclays Bank plc | | Sell | | | 1,140 | | | | 4.400 | | | | 12/20/12 | | | | — | | | | (618,082 | ) |
| | | Credit Suisse International | | Sell | | | 165 | | | | 4.000 | | | | 12/20/12 | | | | — | | | | (89,875 | ) |
| | | Credit Suisse International | | Sell | | | 410 | | | | 12.000 | | | | 3/20/09 | | | | — | | | | (44,835 | ) |
| | | Deutsche Bank AG | | Sell | | | 180 | | | | 4.320 | | | | 12/20/12 | | | | — | | | | (97,683 | ) |
| | | Deutsche Bank AG | | Sell | | | 1,005 | | | | 12.000 | | | | 3/20/09 | | | | — | | | | (109,900 | ) |
| | | Goldman Sachs International | | Sell | | | 185 | | | | 3.950 | | | | 12/20/12 | | | | — | | | | (100,827 | ) |
| | | Morgan Stanley Capital Services, Inc. | | Sell | | | 170 | | | | 4.860 | | | | 12/20/12 | | | | — | | | | (91,678 | ) |
| | | | | | | | | | | | | | | | | | | | |
| | | | | Total | | | 3,255 | | | | | | | | | | | | — | | | | (1,152,880 | ) |
| | | | | | | | | | | | | | | | | | | | | | | | | | | |
| J.C. Penney Corp., Inc.: | | | | | | | | | | | | | | | | | | | | | | | | |
| | | Morgan Stanley Capital Services, Inc. | | Sell | | | 1,060 | | | | 1.070 | | | | 12/20/17 | | | | — | | | | (206,475 | ) |
| | | Morgan Stanley Capital Services, Inc. | | Sell | | | 1,095 | | | | 1.300 | | | | 12/20/17 | | | | — | | | | (197,682 | ) |
| | | | | | | | | | | | | | | | | | | | |
| | | | | Total | | | 2,155 | | | | | | | | | | | | — | | | | (404,157 | ) |
| | | | | | | | | | | | | | | | | | | | | | | | | | | |
| Jones Apparel Group, Inc.: | | | | | | | | | | | | | | | | | | | | | | | | |
| | | Deutsche Bank AG | | Buy | | | 675 | | | | 2.635 | | | | 6/20/18 | | | | — | | | | 150,753 | |
| | | Morgan Stanley Capital Services, Inc. | | Buy | | | 1,370 | | | | 2.970 | | | | 6/20/18 | | | | — | | | | 281,043 | |
| | | | | | | | | | | | | | | | | | | | |
| | | | | Total | | | 2,045 | | | | | | | | | | | | — | | | | 431,796 | |
| | | | | | | | | | | | | | | | | | | | |
| | | Deutsche Bank AG | | Sell | | | 675 | | | | 2.720 | | | | 6/20/13 | | | | — | | | | (133,864 | ) |
| | | Morgan Stanley Capital Services, Inc. | | Sell | | | 1,370 | | | | 3.200 | | | | 6/20/13 | | | | — | | | | (250,612 | ) |
| | | | | | | | | | | | | | | | | | | | |
| | | | | Total | | | 2,045 | | | | | | | | | | | | — | | | | (384,476 | ) |
F11 | OPPENHEIMER CORE BOND FUND/VA
STATEMENT OF INVESTMENTS Continued
Footnotes to Statement of Investments Continued
Credit Default Swap Contracts: Continued
| | | | | | | | | | | | | | | | | | | | | | | | | | | |
| | | | | | | | | | | | | | | | | | | | | Upfront | | | | |
| | | | | Buy/Sell | | | Notional | | | Pay/ | | | | | | | Payment | | | | |
| | | | | Credit | | | Amount | | | Receive | | | Termination | | | Received/ | | | | |
| Swap Reference Entity | | Counterparty | | Protection | | | (000s) | | | Fixed Rate | | | Date | | | (Paid) | | | Value | |
| |
| Kohl's Corp.: | | | | | | | | | | | | | | | | | | | | | | | | | | |
| | | Barclays Bank plc | | Buy | | $ | 665 | | | | 1.180 | % | | | 6/20/18 | | | $ | — | | | $ | 59,369 | |
| | | Barclays Bank plc | | Buy | | | 665 | | | | 1.040 | | | | 6/20/18 | | | | — | | | | 66,139 | |
| | | Deutsche Bank AG | | Buy | | | 675 | | | | 1.300 | | | | 6/20/18 | | | | — | | | | 54,373 | |
| | | Morgan Stanley Capital Services, Inc. | | Buy | | | 1,590 | | | | 0.660 | | | | 12/20/17 | | | | — | | | | 193,958 | |
| | | Morgan Stanley Capital Services, Inc. | | Buy | | | 1,640 | | | | 0.870 | | | | 12/20/17 | | | | — | | | | 175,965 | |
| | | | | | | | | | | | | | | | | | | | |
| | | | | Total | | | 5,235 | | | | | | | | | | | | — | | | | 549,804 | |
| | | | | | | | | | | | | | | | | | | | |
| | | Barclays Bank plc | | Sell | | | 665 | | | | 1.080 | | | | 6/20/13 | | | | — | | | | (44,740 | ) |
| | | Barclays Bank plc | | Sell | | | 665 | | | | 0.900 | | | | 6/20/13 | | | | — | | | | (49,479 | ) |
| | | Deutsche Bank AG | | Sell | | | 675 | | | | 1.180 | | | | 6/20/13 | | | | — | | | | (42,740 | ) |
| | | | | | | | | | | | | | | | | | | | |
| | | | | Total | | | 2,005 | | | | | | | | | | | | — | | | | (136,959 | ) |
| | | | | | | | | | | | | | | | | | | | | | | | | | | |
| Liz Claiborne, Inc.: | | | | | | | | | | | | | | | | | | | | | | | | | | |
| | | Morgan Stanley Capital Services, Inc. | | Buy | | | 1,345 | | | | 2.900 | | | | 6/20/18 | | | | — | | | | 416,444 | |
| | | | | | | | | | | | | | | | | | | | |
| | | | | Total | | | 1,345 | | | | | | | | | | | | — | | | | 416,444 | |
| | | | | | | | | | | | | | | | | | | | |
| | | Deutsche Bank AG | | Sell | | | 2,485 | | | | 3.250 | | | | 6/20/09 | | | | — | | | | (72,964 | ) |
| | | Morgan Stanley Capital Services, Inc. | | Sell | | | 1,345 | | | | 3.100 | | | | 6/20/13 | | | | — | | | | (357,017 | ) |
| | | | | | | | | | | | | | | | | | | | |
| | | | | Total | | | 3,830 | | | | | | | | | | | | — | | | | (429,981 | ) |
| | | | | | | | | | | | | | | | | | | | | | | | | | | |
| Louisiana-Pacific Corp. | | Morgan Stanley Capital Services, Inc. | | Sell | | | 1,345 | | | | 6.250 | | | | 9/20/09 | | | | — | | | | (114,929 | ) |
| | | | | | | | | | | | | | | | | | | | |
| | | | | Total | | | 1,345 | | | | | | | | | | | | — | | | | (114,929 | ) |
| | | | | | | | | | | | | | | | | | | | | | | | | | | |
| Merrill Lynch & Co., Inc.: | | | | | | | | | | | | | | | | | | | | | | | | | | |
| | | Barclays Bank plc | | Sell | | | 2,575 | | | | 4.150 | | | | 9/20/09 | | | | — | | | | 3,432 | |
| | | Credit Suisse International | | Sell | | | 1,285 | | | | 4.150 | | | | 9/20/09 | | | | — | | | | 1,713 | |
| | | | | | | | | | | | | | | | | | | | |
| | | | | Total | | | 3,860 | | | | | | | | | | | | — | | | | 5,145 | |
| | | | | | | | | | | | | | | | | | | | | | | | | | | |
| Morgan Stanley | | Credit Suisse International | | Sell | | | 1,775 | | | | 7.800 | | | | 12/20/13 | | | | — | | | | 265,490 | |
| | | | | | | | | | | | | | | | | | | | |
| | | | | Total | | | 1,775 | | | | | | | | | | | | — | | | | 265,490 | |
| | | | | | | | | | | | | | | | | | | | | | | | | | | |
| Prudential Financial, Inc. | | Deutsche Bank AG | | Sell | | | 1,430 | | | | 2.050 | | | | 6/20/09 | | | | — | | | | (45,649 | ) |
| | | | | | | | | | | | | | | | | | | | |
| | | | | Total | | | 1,430 | | | | | | | | | | | | — | | | | (45,649 | ) |
| | | | | | | | | | | | | | | | | | | | | | | | | | | |
| Pulte Homes, Inc. | | Goldman Sachs International | | Sell | | | 1,625 | | | | 2.750 | | | | 9/20/09 | | | | — | | | | (2,284 | ) |
| | | | | | | | | | | | | | | | | | | | |
| | | | | Total | | | 1,625 | | | | | | | | | | | | — | | | | (2,284 | ) |
| | | | | | | | | | | | | | | | | | | | | | | | | | | |
| Reliant Energy, Inc.: | | | | | | | | | | | | | | | | | | | | | | | | | | |
| | | Credit Suisse International | | Sell | | | 655 | | | | 9.000 | | | | 12/20/09 | | | | — | | | | (16,437 | ) |
| | | Credit Suisse International | | Sell | | | 680 | | | | 9.000 | | | | 12/20/09 | | | | — | | | | (17,064 | ) |
| | | | | | | | | | | | | | | | | | | | |
| | | | | Total | | | 1,335 | | | | | | | | | | | | — | | | | (33,501 | ) |
| | | | | | | | | | | | | | | | | | | | | | | | | | | |
| R.H. Donnelley Corp. | | Goldman Sachs International | | Sell | | | 1,465 | | | | 9.000 | | | | 3/20/09 | | | | — | | | | (63,164 | ) |
| | | | | | | | | | | | | | | | | | | | |
| | | | | Total | | | 1,465 | | | | | | | | | | | | — | | | | (63,164 | ) |
| | | | | | | | | | | | | | | | | | | | | | | | | | | |
| Rite Aid Corp.: | | | | | | | | | | | | | | | | | | | | | | | | | | |
| | | Credit Suisse International | | Sell | | | 530 | | | | 7.500 | | | | 3/20/09 | | | | — | | | | (27,121 | ) |
| | | Credit Suisse International | | Sell | | | 615 | | | | 5.000 | | | | 9/20/09 | | | | 36,900 | | | | (109,299 | ) |
| | | | | | | | | | | | | | | | | | | | |
| | | | | Total | | | 1,145 | | | | | | | | | | | | 36,900 | | | | (136,420 | ) |
| | | | | | | | | | | | | | | | | | | | | | | | | | | |
| Sprint Nextel Corp.: | | | | | | | | | | | | | | | | | | | | | | | | | | |
| | | Credit Suisse International | | Sell | | | 2,940 | | | | 6.300 | | | | 3/20/09 | | | | — | | | | (40,943 | ) |
| | | Goldman Sachs International | | Sell | | | 1,060 | | | | 6.300 | | | | 3/20/09 | | | | — | | | | (14,762 | ) |
| | | | | | | | | | | | | | | | | | | | |
| | | | | Total | | | 4,000 | | | | | | | | | | | | — | | | | (55,705 | ) |
| | | | | | | | | | | | | | | | | | | | | | | | | | | |
| Temple-Inland, Inc. | | Deutsche Bank AG | | Sell | | | 335 | | | | 3.000 | | | | 9/20/09 | | | | — | | | | (19,916 | ) |
| | | | | | | | | | | | | | | | | | | | |
| | | | | Total | | | 335 | | | | | | | | | | | | — | | | | (19,916 | ) |
| | | | | | | | | | | | | | | | | | | | | | | | | | | |
| Tenet Healthcare Corp. | | Deutsche Bank AG | | Sell | | | 1,635 | | | | 1.600 | | | | 3/20/09 | | | | — | | | | (37,879 | ) |
| | | | | | | | | | | | | | | | | | | | |
| | | | | Total | | | 1,635 | | | | | | | | | | | | — | | | | (37,879 | ) |
| | | | | | | | | | | | | | | | | | | | | | | | | | | |
| Tribune Co.: | | | | | | | | | | | | | | | | | | | | | | | | | | |
| | | Credit Suisse International | | Sell | | | 120 | | | | 5.000 | | | | 1/16/09 | | | | 26,400 | | | | (112,515 | ) |
| | | Credit Suisse International | | Sell | | | 600 | | | | 5.000 | | | | 1/16/09 | | | | 138,000 | | | | (562,573 | ) |
| | | Credit Suisse International | | Sell | | | 45 | | | | 5.000 | | | | 1/16/09 | | | | 14,400 | | | | (42,193 | ) |
F12 | OPPENHEIMER CORE BOND FUND/VA
Credit Default Swap Contracts: Continued
| | | | | | | | | | | | | | | | | | | | | | | | | | | |
| | | | | | | | | | | | | | | | | | | | | Upfront | | | | |
| | | | | Buy/Sell | | | Notional | | | Pay/ | | | | | | | Payment | | | | |
| | | | | Credit | | | Amount | | | Receive | | | Termination | | | Received/ | | | | |
| Swap Reference Entity | | Counterparty | | Protection | | | (000s) | | | Fixed Rate | | | Date | | | (Paid) | | | Value | |
| |
| Tribune Co.: Continued | | | | | | | | | | | | | | | | | | | | | | | | | | |
| | | Credit Suisse International | | Sell | | $ | 430 | | | | 5.000 | % | | | 1/16/09 | | | $ | 150,500 | | | $ | (403,177 | ) |
| | | Credit Suisse International | | Sell | | | 500 | | | | 5.000 | | | | 1/16/09 | | | | 195,000 | | | | (468,811 | ) |
| | | | | | | | | | | | | | | | | | | | |
| | | | | Total | | | 1,695 | | | | | | | | | | | | 524,300 | | | | (1,589,269 | ) |
| | | | | | | | | | | | | | | | | | | | | | | | | | | |
| Univision Communications, Inc.: | | | | | | | | | | | | | | | | | | | | | | | | | | |
| | | Credit Suisse International | | Sell | | | 25 | | | | 14.600 | | | | 3/20/09 | | | | — | | | | (1,807 | ) |
| | | Goldman Sachs International | | Sell | | | 350 | | | | 5.000 | | | | 6/20/09 | | | | 35,000 | | | | (115,708 | ) |
| | | Goldman Sachs International | | Sell | | | 140 | | | | 5.000 | | | | 6/20/09 | | | | 15,400 | | | | (46,283 | ) |
| | | Goldman Sachs International | | Sell | | | 360 | | | | 5.000 | | | | 6/20/09 | | | | 21,600 | | | | (119,014 | ) |
| | | Morgan Stanley Capital Services, Inc. | | Sell | | | 250 | | | | 5.000 | | | | 12/20/09 | | | | 32,500 | | | | (85,853 | ) |
| | | Morgan Stanley Capital Services, Inc. | | Sell | | | 300 | | | | 5.000 | | | | 12/20/09 | | | | 21,000 | | | | (103,024 | ) |
| | | | | | | | | | | | | | | | | | | | |
| | | | | Total | | | 1,425 | | | | | | | | | | | | 125,500 | | | | (471,689 | ) |
| | | | | | | | | | | | | | | | | | | | | | | | | | | |
| Vale Overseas: | | | | | | | | | | | | | | | | | | | | | | | | | | |
| | | Morgan Stanley Capital Services, Inc. | | Buy | | | 1,030 | | | | 0.700 | | | | 3/20/17 | | | | — | | | | 164,396 | |
| | | Morgan Stanley Capital Services, Inc. | | Buy | | | 1,015 | | | | 0.630 | | | | 3/20/17 | | | | — | | | | 166,414 | |
| | | | | | | | | | | | | | | | | | | | |
| | | | | Total | | | 2,045 | | | | | | | | | | | | — | | | | 330,810 | |
| | | | | | | | | | | | | | | | | | | | |
| | | Morgan Stanley Capital Services, Inc. | | Sell | | | 1,030 | | | | 1.170 | | | | 3/20/17 | | | | — | | | | (130,905 | ) |
| | | Morgan Stanley Capital Services, Inc. | | Sell | | | 1,015 | | | | 1.100 | | | | 3/20/17 | | | | — | | | | (133,578 | ) |
| | | | | | | | | | | | | | | | | | | | |
| | | | | Total | | | 2,045 | | | | | | | | | | | | — | | | | (264,483 | ) |
| | | | | | | | | | | | | | | | | | | | | | | | | | | |
| Vornado Realty LP: | | | | | | | | | | | | | | | | | | | | | | | | | | |
| | | Credit Suisse International | | Sell | | | 665 | | | | 3.600 | | | | 3/20/09 | | | | — | | | | (5,780 | ) |
| | | Deutsche Bank AG | | Sell | | | 1,345 | | | | 3.875 | | | | 6/20/09 | | | | — | | | | (10,783 | ) |
| | | | | | | | | | | | | | | | | | | | |
| | | | | Total | | | 2,010 | | | | | | | | | | | | — | | | | (16,563 | ) |
| | | | | | | | | | | | | | | | | | | | | | | | | | | |
| XL Capital Ltd.: | | | | | | | | | | | | | | | | | | | | | | | | | | |
| | | Barclays Bank plc | | Sell | | | 1,485 | | | | 3.550 | | | | 9/20/09 | | | | — | | | | (110,212 | ) |
| | | Deutsche Bank AG | | Sell | | | 1,675 | | | | 3.550 | | | | 9/20/09 | | | | — | | | | (124,313 | ) |
| | | | | | | | | | | | | | | | | | | | |
| | | | | Total | | | 3,160 | | | | | | | | | | | | — | | | | (234,525 | ) |
| | | | | | | | | | | | | | | | | | | | |
| | | | | Grand Total Buys | | | 14,184 | | | | | | | | | | | | (370 | ) | | | 1,856,895 | |
| | | | | Grand Total Sells | | | 75,230 | | | | | | | | | | | | 3,407,621 | | | | (14,734,890 | ) |
| | | | | | | | | | | | | | | | | | | | |
| | | | | | | | | | | | | Total Credit | | Default Swaps | | $ | 3,407,251 | | | $ | (12,877,995 | ) |
| | | | | | | | | | | | | | | | | | | | | |
The table that follows shows the undiscounted maximum potential payment by the Fund related to selling credit protection in credit default swaps:
| | | | | | | | | | | | | |
| Type of Reference | | Total Maximum Potential | | | | | | | | |
| Asset on which the | | Payments for Selling Credit | | | | | | | Reference Asset | |
| Fund Sold Protection | | Protection (Undiscounted) | | | Amount Recoverable* | | | Rating Range** | |
| |
| Asset-Backed Indexes | | $ | 2,870,000 | | | $ | — | | | AAA to AA |
| Single Name Corporate Debt | | | 41,335,000 | | | | 2,005,000 | | | AAA to BBB- |
| Single Name Corporate Debt | | | 31,025,000 | | | | 3,390,000 | | | BB+ to D |
| | | | | | | |
| Total | | $ | 75,230,000 | | | $ | 5,395,000 | | | | | |
| | | | | | | |
| | |
| * | | Amounts recoverable includes potential payments from related purchased protection for instances where the Fund is the seller of protection. In addition, the Fund has no recourse provisions under the credit derivatives and holds no collateral which can offset or reduce potential payments under a triggering event. |
| |
| ** | | The reference asset security rating, as rated by any rating organization, are included in the equivalent Standard & Poor’s rating category. The reference asset rating represents the likelihood of a potential payment by the Fund if the reference asset experiences a credit event as of period end. |
F13 | OPPENHEIMER CORE BOND FUND/VA
STATEMENT OF INVESTMENTS Continued
Footnotes to Statement of Investments Continued
Interest Rate Swap Contracts as of December 31, 2008 are as follows:
| | | | | | | | | | | | | | | | | | | | | |
| | | Notional | | | | | | | | | | |
| | | Amount | | | Paid by | | | Received by | | | Termination | |
| Reference Entity/Swap Counterparty | | (000’s) | | | the Fund | | | the Fund | | | Date | | | Value | |
| |
USD BBA LIBOR: | | | | | | | | | | | | | | | | | | | | |
| Credit Suisse International | | $ | 690 | | | | 4.353 | % | | Three-Month
USD BBA LIBOR | | | 10/21/16 | | | $ | (98,623 | ) |
| Credit Suisse International | | | 2,740 | | | | 2.225 | | | Three-Month
USD BBA LIBOR | | | 11/20/10 | | | | (38,743 | ) |
| Goldman Sachs Group, Inc. (The) | | | 20,000 | | | | 4.488 | | | Three-Month
USD BBA LIBOR | | | 10/17/16 | | | | (3,049,431 | ) |
| Goldman Sachs Group, Inc. (The) | | | 60,000 | | | | 2.820 | | | Three-Month
USD BBA LIBOR | | | 10/29/10 | | | | (1,368,198 | ) |
| Goldman Sachs Group, Inc. (The) | | | 1,810 | | | | 4.358 | | | Three-Month
USD BBA LIBOR | | | 10/21/16 | | | | (259,374 | ) |
| Goldman Sachs Group, Inc. (The) | | | 13,640 | | | | 2.233 | | | Three-Month
USD BBA LIBOR | | | 11/20/10 | | | | (194,887 | ) |
| Goldman Sachs International | | | 12,000 | | | | 4.275 | | | Three-Month
USD BBA LIBOR | | | 9/5/16 | | | | (1,782,468 | ) |
| UBS AG | | | 3,620 | | | | 2.230 | | | Three-Month
USD BBA LIBOR | | | 11/20/10 | | | | (51,543 | ) |
| | | | | | | | | | | | | | | | | | | |
| Total where Fund pays a fixed rate | | | 114,500 | | | | | | | | | | | | | | | | (6,843,267 | ) |
| | | | | | | | | | | | | | | | | | | |
| Credit Suisse International | | | 4,580 | | | Three-Month
USD BBA LIBOR | | | 5.428 | % | | | 8/7/17 | | | | 1,170,547 | |
| Deutsche Bank AG | | | 3,870 | | | Three-Month
USD BBA LIBOR | | | 5.445 | | | | 8/8/17 | | | | 994,845 | |
| Goldman Sachs Group, Inc. (The) | | | 10,000 | | | Three-Month
USD BBA LIBOR | | | 4.543 | | | | 10/21/28 | | | | 2,775,640 | |
| Goldman Sachs Group, Inc. (The) | | | 25,000 | | | Three-Month
USD BBA LIBOR | | | 2.823 | | | | 12/4/16 | | | | 847,600 | |
| | | | | | | | | | | | | | | | | | | |
| Total where Fund pays a variable rate | | | 43,450 | | | | | | | | | | | | | | | | 5,788,632 | |
| | | | | | | | | | | | | | | | | | | |
| Total Interest Rate Swaps | | | | | | | | | | | | | | | | | | $ | (1,054,635 | ) |
| | | | | | | | | | | | | | | | | | | | |
Abbreviation/Definition is as follows:
| | | |
| BBA LIBOR | | British Bankers’ Association London-Interbank Offered Rate |
Total Return Swap Contracts as of December 31, 2008 are as follows:
| | | | | | | | | | | | | | | | | | | | | |
| | | Notional | | | | | | | | | | | | | |
| | | Amount | | | Paid by | | | Received by | | | Termination | | | | |
| Reference Entity/Swap Counterparty | | (000’s) | | | the Fund | | | the Fund | | | Date | | | Value | |
| |
Banc of America Securities LLC AAA 10 yr. CMBS Daily Index*: | | | | | | | | | | | | | | | | | | | | |
| Goldman Sachs Group, Inc. (The) | | $ | 36,590 | | | | A | | | | D | | | | 3/31/09 | | | $ | 7,881,791 | |
| Goldman Sachs Group, Inc. (The) | | | 30,110 | | | | B | | | | C | | | | 1/31/09 | | | | (7,153,383 | ) |
| | | | | | | | | | | | | | | | | | | | |
| | | | | | | | | | | | | | | Reference Entity Total | | | | 728,408 | |
| | | | | | | | | | | | | | | | | | | | | |
Barclays Capital U.S. CMBS AAA Index*: | | | | | | | | | | | | | | | | | | | | |
| Morgan Stanley | | | 7,300 | | | | A | | | | D | | | | 2/1/09 | | | | 798,499 | |
| Morgan Stanley | | | 14,200 | | | | A | | | | D | | | | 3/1/09 | | | | 1,556,053 | |
| | | | | | | | | | | | | | | | | | | | |
| | | | | | | | | | | | | | | Reference Entity Total | | | | 2,354,552 | |
| | | | | | | | | | | | | | | | | | | | | |
Barclays Capital U.S. CMBS AAA 8.5+ Index*: | | | | | | | | | | | | | | | | | | | | |
| Goldman Sachs Group, Inc. (The) | | | 8,500 | | | | A | | | | D | | | | 3/1/09 | | | | 1,451,339 | |
| Goldman Sachs Group, Inc. (The) | | | 3,210 | | | | A | | | | D | | | | 3/1/09 | | | | 546,796 | |
| Goldman Sachs Group, Inc. (The) | | | 6,630 | | | | A | | | | D | | | | 2/1/09 | | | | 1,132,044 | |
| Morgan Stanley | | | 2,290 | | | | A | | | | D | | | | 3/1/09 | | | | 390,478 | |
| Morgan Stanley | | | 5,860 | | | | A | | | | D | | | | 3/1/09 | | | | 991,871 | |
| Morgan Stanley | | | 440 | | | | A | | | | D | | | | 2/1/09 | | | | 74,078 | |
| Morgan Stanley | | | 3,530 | | | | A | | | | D | | | | 2/1/09 | | | | 600,716 | |
| Morgan Stanley | | | 6,170 | | | | A | | | | D | | | | 2/1/09 | | | | 1,054,829 | |
F14 | OPPENHEIMER CORE BOND FUND/VA
Total Return Swap Contracts: Continued
| | | | | | | | | | | | | | | | | | | | | |
| | | Notional | | | | | | | | | | | | | |
| | | Amount | | | Paid by | | | Received by | | | Termination | | | | |
| Reference Entity/Swap Counterparty | | (000’s) | | | the Fund | | | the Fund | | | Date | | | Value | |
| |
Barclays Capital U.S. CMBS AAA 8.5+ Index*: Continued Morgan Stanley | | $ | 3,170 | | | | A | | | | D | | | | 2/1/09 | | | $ | 537,685 | |
| | | | | | | | | | | | | | | | | | | | |
| | | | | | | | | | | | | | | Reference Entity Total | | | | 6,779,836 | |
| | | | | | | | | | | | | | | | | | | | |
| | | | | | | | | | | | | | | Total of Total Return Swaps | | | $ | 9,862,796 | |
| | | | | | | | | | | | | | | | | | | | |
| | |
| * | | The CMBS Indexes are representative indexes of segments of the commercial mortgage backed securities market. These indexes are measured by movements in the credit spreads of the underlying holdings. As the credit market perceives an improvement in the credit quality of an Index’s underlying holdings and reduced probability of default, the spread of an index narrows. As the credit market perceives a decrease in credit quality and an increased probability of default on an Index’s underlying holdings, the spread widens. |
Abbreviation is as follows:
| | | |
| CMBS | | Commercial Mortgage Backed Securities |
A — The Fund makes periodic payments when credit spreads, as represented by the Reference Entity, widen.
B — The Fund makes periodic payments when credit spreads, as represented by the Reference Entity, narrow.
C — The Fund receives periodic payments when credit spreads, as represented by the Reference Enitiy, widen.
D — The Fund receives periodic payments when credit spreads, as represented by the Reference Enitiy, narrow.
The following table aggregates, as of period end, the amount receivable from/(payable to) each counterparty with whom the Fund has entered into a swap agreement. Swaps are individually disclosed in the preceding tables.
Swap Summary as of December 31, 2008 is as follows:
| | | | | | | | | | | |
| | | | | Notional | | | | |
| | | Swap Type from | | Amount | | | | |
| Swap Counterparty | | Fund Perspective | | (000’s) | | | Value | |
| |
| Barclays Bank plc: | | | | | | | | | | |
| | | Credit Default Buy Protection | | $ | 1,330 | | | $ | 125,508 | |
| | | Credit Default Sell Protection | | | 16,470 | | | | (2,071,392 | ) |
| | | | | | | | | | |
| | | | | | | | | | (1,945,884 | ) |
| | | | | | | | | | | |
| Credit Suisse International: | | | | | | | | | | |
| | | Credit Default Sell Protection | | | 13,430 | | | | (2,048,344 | ) |
| | | Interest Rate | | | 8,010 | | | | 1,033,181 | |
| | | | | | | | | | |
| | | | | | | | | | (1,015,163 | ) |
| | | | | | | | | | | |
| Deutsche Bank AG: | | | | | | | | | | |
| | | Credit Default Buy Protection | | | 4,864 | | | | 333,167 | |
| | | Credit Default Sell Protection | | | 19,390 | | | | (2,903,333 | ) |
| | | Interest Rate | | | 3,870 | | | | 994,845 | |
| | | | | | | | | | |
| | | | | | | | | | (1,575,321 | ) |
| | | | | | | | | | | |
| Goldman Sachs Bank USA | | Credit Default Sell Protection | | | 1,970 | | | | (1,356,986 | ) |
| | | | | | | | | | | |
| Goldman Sachs Group, Inc. (The): | | | | | | | | | | |
| | | Total Return | | | 85,040 | | | | 3,858,587 | |
| | | Interest Rate | | | 130,450 | | | | (1,248,650 | ) |
| | | | | | | | | | |
| | | | | | | | | | 2,609,937 | |
| | | | | | | | | | | |
| Goldman Sachs International: | | | | | | | | | | |
| | | Credit Default Sell Protection | | | 5,295 | | | | (465,470 | ) |
| | | Interest Rate | | | 12,000 | | | | (1,782,468 | ) |
| | | | | | | | | | |
| | | | | | | | | | (2,247,938 | ) |
| | | | | | | | | | | |
| Morgan Stanley | | Total Return | | | 42,960 | | | | 6,004,209 | |
| | | | | | | | | | | |
| Morgan Stanley Capital Services, Inc.: | | | | | | | | | | |
| | | Credit Default Buy Protection | | | 7,990 | | | | 1,398,220 | |
| | | Credit Default Sell Protection | | | 18,675 | | | | (5,889,365 | ) |
| | | | | | | | | | |
| | | | | | | | | | (4,491,145 | ) |
| | | | | | | | | | | |
| UBS AG | | Interest Rate | | | 3,620 | | | | (51,543 | ) |
| | | | | | | | | | |
| | | | | Total Swaps | | | $ | (4,069,834 | ) |
| | | | | | | | | | |
See accompanying Notes to Financial Statements.
F15 | OPPENHEIMER CORE BOND FUND/VA
STATEMENT OF ASSETS AND LIABILITIES December 31, 2008
| | | | | |
Assets | | | | |
| Investments, at value—see accompanying statement of investments: | | | | |
| Unaffiliated companies (cost $362,220,387) | | $ | 292,726,010 | |
| Affiliated companies (cost $13,605,218) | | | 13,605,218 | |
| | | | |
| | | | 306,331,228 | |
| Cash | | | 2,989,915 | |
| Swaps, at value (net upfront payment received $14,005) | | | 25,069,538 | |
| Receivables and other assets: | | | | |
| Interest, dividends and principal paydowns | | | 2,286,439 | |
| Shares of beneficial interest sold | | | 171,022 | |
| Terminated investment contracts | | | 33,605 | |
| Investments sold | | | 344 | |
| Due from Manager | | | 37 | |
| Other | | | 14,777 | |
| | | | |
| Total assets | | | 336,896,905 | |
| | | | | |
Liabilities | | | | |
| Swaps, at value (upfront payment received $3,393,246) | | | 29,139,372 | |
| Payables and other liabilities: | | | | |
| Investments purchased on a when-issued or delayed delivery basis | | | 86,956,884 | |
| Futures margins | | | 509,885 | |
| Terminated investment contracts | | | 508,856 | |
| Shares of beneficial interest redeemed | | | 214,068 | |
| Distribution and service plan fees | | | 41,622 | |
| Shareholder communications | | | 10,020 | |
| Trustees’ compensation | | | 8,494 | |
| Transfer and shareholder servicing agent fees | | | 1,720 | |
| Other | | | 74,409 | |
| | | | |
| Total liabilities | | | 117,465,330 | |
| | | | | |
Net Assets | | $ | 219,431,575 | |
| | | | |
| | | | | |
Composition of Net Assets | | | | |
| Par value of shares of beneficial interest | | $ | 34,070 | |
| Additional paid-in capital | | | 355,718,025 | |
| Accumulated net investment loss | | | (466,070 | ) |
| Accumulated net realized loss on investments | | | (65,604,020 | ) |
| Net unrealized depreciation on investments | | | (70,250,430 | ) |
| | | | |
Net Assets | | $ | 219,431,575 | |
| | | | |
| | | | | |
Net Asset Value Per Share | | | | |
| Non-Service Shares: | | | | |
| Net asset value, redemption price per share and offering price per share (based on net assets of $156,339,150 and 24,221,312 shares of beneficial interest outstanding) | | $ | 6.45 | |
| Service Shares: | | | | |
| Net asset value, redemption price per share and offering price per share (based on net assets of $63,092,425 and 9,848,377 shares of beneficial interest outstanding) | | $ | 6.41 | |
See accompanying Notes to Financial Statements.
F16 | OPPENHEIMER CORE BOND FUND/VA
STATEMENT OF OPERATIONS For the Year Ended December 31, 2008
| | | | | |
Investment Income | | | | |
| Interest | | $ | 26,126,967 | |
| Fee income | | | 1,170,034 | |
| Dividends from affiliated companies | | | 246,255 | |
| Income from investment of securities lending cash collateral, net: | | | | |
| Unaffiliated companies | | | 9,712 | |
| Affiliated companies | | | 18,564 | |
| | | | |
| Total investment income | | | 27,571,532 | |
| | | | | |
Expenses | | | | |
| Management fees | | | 2,241,087 | |
| Distribution and service plan fees—Service shares | | | 249,916 | |
| Transfer and shareholder servicing agent fees: | | | | |
| Non-Service shares | | | 9,994 | |
| Service shares | | | 9,995 | |
| Trustees’ compensation | | | 14,749 | |
| Custodian fees and expenses | | | 2,722 | |
| Other | | | 64,261 | |
| | | | |
| Total expenses | | | 2,592,724 | |
| Less reduction to custodian expenses | | | (1,988 | ) |
| Less waivers and reimbursements of expenses | | | (29,721 | ) |
| | | | |
| Net expenses | | | 2,561,015 | |
| | | | | |
Net Investment Income | | | 25,010,517 | |
| | | | | |
Realized and Unrealized Gain (Loss) | | | | |
| Net realized loss on: | | | | |
| Investments from unaffiliated companies | | | (13,666,272 | ) |
| Closing and expiration of futures contracts | | | (5,577,484 | ) |
| Swap contracts | | | (89,718,336 | ) |
| | | | |
| Net realized loss | | | (108,962,092 | ) |
| Net change in unrealized appreciation (depreciation) on: | | | | |
| Investments | | | (68,626,214 | ) |
| Futures contracts | | | 190,392 | |
| Swap contracts | | | 455,655 | |
| | | | |
| Net change in unrealized depreciation | | | (67,980,167 | ) |
| | | | | |
Net Decrease in Net Assets Resulting from Operations | | $ | (151,931,742 | ) |
| | | | |
See accompanying Notes to Financial Statements.
F17 | OPPENHEIMER CORE BOND FUND/VA
STATEMENTS OF CHANGES IN NET ASSETS
| | | | | | | | | |
| Year Ended December 31, | | 2008 | | | 2007 | |
| |
Operations | | | | | | | | |
| Net investment income | | $ | 25,010,517 | | | $ | 20,943,854 | |
| Net realized loss | | | (108,962,092 | ) | | | (3,101,555 | ) |
| Net change in unrealized depreciation | | | (67,980,167 | ) | | | (11,066 | ) |
| | | |
| Net increase (decrease) in net assets resulting from operations | | | (151,931,742 | ) | | | 17,831,233 | |
| | | | | | | | | |
Dividends and/or Distributions to Shareholders | | | | | | | | |
| Dividends from net investment income: | | | | | | | | |
| Non-Service shares | | | (12,773,902 | ) | | | (18,342,384 | ) |
| Service shares | | | (4,423,158 | ) | | | (2,404,569 | ) |
| | | |
| | | | (17,197,060 | ) | | | (20,746,953 | ) |
| | | | | | | | | |
Beneficial Interest Transactions | | | | | | | | |
| Net increase (decrease) in net assets resulting from beneficial interest transactions: | | | | | | | | |
| Non-Service shares | | | (47,839,123 | ) | | | (37,703,583 | ) |
| Service shares | | | 7,196,319 | | | | 61,525,061 | |
| | | |
| | | | (40,642,804 | ) | | | 23,821,478 | |
| | | | | | | | | |
Net Assets | | | | | | | | |
| Total increase (decrease) | | | (209,771,606 | ) | | | 20,905,758 | |
| Beginning of period | | | 429,203,181 | | | | 408,297,423 | |
| | | |
| End of period (including accumulated net investment income (loss) of $(466,070) and $18,856,205, respectively) | | $ | 219,431,575 | | | $ | 429,203,181 | |
| | | |
See accompanying Notes to Financial Statements.
F18 | OPPENHEIMER CORE BOND FUND/VA
FINANCIAL HIGHLIGHTS
| | | | | | | | | | | | | | | | | | | | | |
| Non-Service Shares Year Ended December 31, | | 2008 | | | 2007 | | | 2006 | | | 2005 | | | 2004 | |
| |
Per Share Operating Data | | | | | | | | | | | | | | | | | | | | |
| Net asset value, beginning of period | | $ | 11.06 | | | $ | 11.16 | | | $ | 11.19 | | | $ | 11.50 | | | $ | 11.42 | |
| Income (loss) from investment operations: | | | | | | | | | | | | | | | | | | | | |
Net investment income1 | | | .66 | | | | .55 | | | | .53 | | | | .51 | | | | .43 | |
| Net realized and unrealized gain (loss) | | | (4.82 | ) | | | (.08 | ) | | | .03 | | | | (.23 | ) | | | .18 | |
| | | |
| Total from investment operations | | | (4.16 | ) | | | .47 | | | | .56 | | | | .28 | | | | .61 | |
| Dividends and/or distributions to shareholders: | | | | | | | | | | | | | | | | | | | | |
| Dividends from net investment income | | | (.45 | ) | | | (.57 | ) | | | (.59 | ) | | | (.59 | ) | | | (.53 | ) |
| Net asset value, end of period | | $ | 6.45 | | | $ | 11.06 | | | $ | 11.16 | | | $ | 11.19 | | | $ | 11.50 | |
| | | |
| | | | | | | | | | | | | | | | | | | | | |
Total Return, at Net Asset Value2 | | | (39.05 | )% | | | 4.39 | % | | | 5.28 | % | | | 2.59 | % | | | 5.49 | % |
| | | | | | | | | | | | | | | | | | | | | |
Ratios/Supplemental Data | | | | | | | | | | | | | | | | | | | | |
| Net assets, end of period (in thousands) | | $ | 156,339 | | | $ | 325,661 | | | $ | 367,106 | | | $ | 430,642 | | | $ | 504,244 | |
| Average net assets (in thousands) | | $ | 271,355 | | | $ | 345,723 | | | $ | 391,750 | | | $ | 466,033 | | | $ | 552,293 | |
Ratios to average net assets:3 | | | | | | | | | | | | | | | | | | | | |
| Net investment income | | | 6.76 | % | | | 5.07 | % | | | 4.83 | % | | | 4.56 | % | | | 3.82 | % |
| Total expenses | | | 0.63 | %4 | | | 0.68 | %4 | | | 0.77 | %4 | | | 0.76 | % | | | 0.75 | % |
| Expenses after payments, waivers and/or reimbursements and reduction to custodian expenses | | | 0.62 | % | | | 0.68 | % | | | 0.77 | % | | | 0.76 | % | | | 0.75 | % |
Portfolio turnover rate5 | | | 51 | % | | | 89 | % | | | 114 | % | | | 111 | % | | | 95 | % |
| | |
| 1. | | Per share amounts calculated based on the average shares outstanding during the period. |
| |
| 2. | | Assumes an investment on the business day before the first day of the fiscal period, with all dividends and distributions reinvested in additional shares on the reinvestment date, and redemption at the net asset value calculated on the last business day of the fiscal period. Total returns are not annualized for periods less than one full year. Total return information does not reflect expenses that apply at the separate account level or to related insurance products. Inclusion of these charges would reduce the total return figures for all periods shown. Returns do not reflect the deduction of taxes that a shareholder would pay on fund distributions or the redemption of fund shares. |
| |
| 3. | | Annualized for periods of less than one full year. |
| |
| 4. | | Total expenses including indirect expenses from affiliated fund were as follows: |
| | | | | |
| Year Ended December 31, 2008 | | | 0.63 | % |
| Year Ended December 31, 2007 | | | 0.68 | % |
| Year Ended December 31, 2006 | | | 0.77 | % |
| | |
| 5. | | The portfolio turnover rate excludes purchase and sale transactions of To Be Announced (TBA) mortgage-related securities as follows: |
| | | | | | | | | |
| | | Purchase Transactions | | | Sale Transactions | |
| |
| Year Ended December 31, 2008 | | $ | 1,019,711,829 | | | $ | 963,377,934 | |
| Year Ended December 31, 2007 | | $ | 662,784,931 | | | $ | 678,316,693 | |
| Year Ended December 31, 2006 | | $ | 1,168,229,255 | | | $ | 1,270,329,129 | |
| Year Ended December 31, 2005 | | $ | 2,420,041,493 | | | $ | 2,423,498,913 | |
| Year Ended December 31, 2004 | | $ | 2,841,348,053 | | | $ | 2,925,500,296 | |
See accompanying Notes to Financial Statements.
F19 | OPPENHEIMER CORE BOND FUND/VA
FINANCIAL HIGHLIGHTS Continued
| | | | | | | | | | | | | | | | | | | | | |
| Service Shares Year Ended December 31, | | 2008 | | | 2007 | | | 2006 | | | 2005 | | | 2004 | |
| |
Per Share Operating Data | | | | | | | | | | | | | | | | | | | | |
| Net asset value, beginning of period | | $ | 10.98 | | | $ | 11.10 | | | $ | 11.15 | | | $ | 11.47 | | | $ | 11.39 | |
| Income (loss) from investment operations: | | | | | | | | | | | | | | | | | | | | |
Net investment income1 | | | .63 | | | | .52 | | | | .49 | | | | .47 | | | | .40 | |
| Net realized and unrealized gain (loss) | | | (4.77 | ) | | | (.08 | ) | | | .03 | | | | (.22 | ) | | | .18 | |
| | | |
| Total from investment operations | | | (4.14 | ) | | | .44 | | | | .52 | | | | .25 | | | | .58 | |
| Dividends and/or distributions to shareholders: | | | | | | | | | | | | | | | | | | | | |
| Dividends from net investment income | | | (.43 | ) | | | (.56 | ) | | | (.57 | ) | | | (.57 | ) | | | (.50 | ) |
| Net asset value, end of period | | $ | 6.41 | | | $ | 10.98 | | | $ | 11.10 | | | $ | 11.15 | | | $ | 11.47 | |
| | | |
| | | | | | | | | | | | | | | | | | | | | |
Total Return, at Net Asset Value2 | | | (39.07 | )% | | | 4.09 | % | | | 4.93 | % | | | 2.33 | % | | | 5.22 | % |
| | | | | | | | | | | | | | | | | | | | | |
Ratios/Supplemental Data | | | | | | | | | | | | | | | | | | | | |
| Net assets, end of period (in thousands) | | $ | 63,093 | | | $ | 103,542 | | | $ | 41,191 | | | $ | 11,110 | | | $ | 3,505 | |
| Average net assets (in thousands) | | $ | 101,597 | | | $ | 70,116 | | | $ | 21,265 | | | $ | 7,213 | | | $ | 3,002 | |
Ratios to average net assets:3 | | | | | | | | | | | | | | | | | | | | |
| Net investment income | | | 6.55 | % | | | 4.85 | % | | | 4.56 | % | | | 4.29 | % | | | 3.55 | % |
| Total expenses | | | 0.88 | %4 | | | 0.92 | %4 | | | 1.06 | %4 | | | 1.03 | % | | | 0.99 | % |
| Expenses after payments, waivers and/or reimbursements and reduction to custodian expenses | | | 0.87 | % | | | 0.92 | % | | | 1.06 | % | | | 1.03 | % | | | 0.99 | % |
Portfolio turnover rate5 | | | 51 | % | | | 89 | % | | | 114 | % | | | 111 | % | | | 95 | % |
| | |
| 1. | | Per share amounts calculated based on the average shares outstanding during the period. |
| |
| 2. | | Assumes an investment on the business day before the first day of the fiscal period, with all dividends and distributions reinvested in additional shares on the reinvestment date, and redemption at the net asset value calculated on the last business day of the fiscal period. Total returns are not annualized for periods less than one full year. Total return information does not reflect expenses that apply at the separate account level or to related insurance products. Inclusion of these charges would reduce the total return figures for all periods shown. Returns do not reflect the deduction of taxes that a shareholder would pay on fund distributions or the redemption of fund shares. |
| |
| 3. | | Annualized for periods less than one full year. |
| |
| 4. | | Total expenses including indirect expenses from affiliated fund were as follows: |
| | | | | |
| Year Ended December 31, 2008 | | | 0.88 | % |
| Year Ended December 31, 2007 | | | 0.92 | % |
| Year Ended December 31, 2006 | | | 1.06 | % |
| | |
| 5. | | The portfolio turnover rate excludes purchase and sale transactions of To Be Announced (TBA) mortgage-related securities as follows: |
| | | | | | | | | |
| | | Purchase Transactions | | | Sale Transactions | |
| |
| Year Ended December 31, 2008 | | $ | 1,019,711,829 | | | $ | 963,377,934 | |
| Year Ended December 31, 2007 | | $ | 662,784,931 | | | $ | 678,316,693 | |
| Year Ended December 31, 2006 | | $ | 1,168,229,255 | | | $ | 1,270,329,129 | |
| Year Ended December 31, 2005 | | $ | 2,420,041,493 | | | $ | 2,423,498,913 | |
| Year Ended December 31, 2004 | | $ | 2,841,348,053 | | | $ | 2,925,500,296 | |
See accompanying Notes to Financial Statements.
F20 | OPPENHEIMER CORE BOND FUND/VA
NOTES TO FINANCIAL STATEMENTS
1. Significant Accounting Policies
Oppenheimer Core Bond Fund/VA (the “Fund”), is a separate series of Oppenheimer Variable Account Funds, an open-end management investment company registered under the Investment Company Act of 1940, as amended. The Fund’s main investment objective is to seek a high level of current income. As a secondary objective, the Fund seeks capital appreciation when consistent with its primary objective. The Fund’s investment adviser is OppenheimerFunds, Inc. (the “Manager”).
The Fund offers two classes of shares. Both classes are sold at their offering price, which is the net asset value per share, to separate investment accounts of participating insurance companies as an underlying investment for variable life insurance policies, variable annuity contracts or other investment products. The class of shares designated as Service shares is subject to a distribution and service plan. Both classes of shares have identical rights and voting privileges with respect to the Fund in general and exclusive voting rights on matters that affect that class alone. Earnings, net assets and net asset value per share may differ due to each class having its own expenses, such as transfer and shareholder servicing agent fees and shareholder communications, directly attributable to that class.
The following is a summary of significant accounting policies consistently followed by the Fund.
Securities Valuation. The Fund calculates the net asset value of its shares as of the close of the New York Stock Exchange (the “Exchange”), normally 4:00 P.M. Eastern time, on each day the Exchange is open for trading.
Effective for fiscal periods beginning after November 15, 2007, FASB Statement of Financial Accounting Standards No. 157, Fair Value Measurements, establishes a hierarchy for measuring fair value of assets and liabilities. As required by the standard, each investment asset or liability of the Fund is assigned a level at measurement date based on the significance and source of the inputs to its valuation. Quoted prices in active markets for identical securities are classified as “Level 1”, inputs other than quoted prices for an asset that are observable are classified as “Level 2” and unobservable inputs, including the Manager’s judgment about the assumptions that a market participant would use in pricing an asset or liability are classified as “Level 3”. The inputs used for valuing securities are not necessarily an indication of the risks associated with investing in those securities. A table summarizing the Fund’s investments under these levels of classification is included following the Statement of Investments.
Securities are valued using quoted market prices, when available, as supplied primarily either by portfolio pricing services approved by the Board of Trustees or dealers. These securities are typically classified within Level 1 or 2; however, they may be designated as Level 3 if the dealer or portfolio pricing service values a security through an internal model with significant unobservable market data inputs.
Securities traded on a registered U.S. securities exchange are valued based on the last sale price of the security reported on the principal exchange on which traded, prior to the time when the Fund’s assets are valued. Securities whose principal exchange is NASDAQ® are valued based on the official closing prices reported by NASDAQ prior to the time when the Fund’s assets are valued. In the absence of a sale, the security is valued at the last sale price on the prior trading day, if it is within the spread of the current day’s closing “bid” and “asked” prices, and if not, at the current day’s closing bid price. A foreign security traded on a foreign exchange is valued based on the last sale price on the principal exchange on which the security is traded, as identified by the portfolio pricing service used by the Manager, prior to the time when the Fund’s assets are valued. In the absence of a sale, the security is valued at the most recent official closing price on the principal exchange on which it is traded.
Shares of a registered investment company that are not traded on an exchange are valued at that investment company’s net asset value per share.
Corporate, government and municipal debt instruments having a remaining maturity in excess of sixty days and all mortgage-backed securities, collateralized mortgage obligations and other asset-backed securities are valued at the mean between the “bid” and “asked” prices.
“Money market-type” debt instruments with remaining maturities of sixty days or less are valued at cost adjusted by the amortization of discount or premium to maturity (amortized cost), which approximates market value. These securities are typically designated as Level 2.
F21 | OPPENHEIMER CORE BOND FUND/VA
NOTES TO FINANCIAL STATEMENTS Continued
1. Significant Accounting Policies Continued
In the absence of a readily available quoted market price, including for securities whose values have been materially affected by what the Manager identifies as a significant event occurring before the Fund’s assets are valued but after the close of the securities’ respective exchanges, the Manager, acting through its internal valuation committee, in good faith determines the fair valuation of that asset using consistently applied procedures under the supervision of the Board of Trustees (which reviews those fair valuations by the Manager). Those procedures include certain standardized methodologies to fair value securities. Such methodologies include, but are not limited to, pricing securities initially at cost and subsequently adjusting the value based on: changes in company specific fundamentals, changes in an appropriate securities index, or changes in the value of similar securities which may be adjusted for any discounts related to resale restrictions. When possible, such methodologies use observable market inputs such as quoted prices of similar securities, observable interest rates, currency rates and yield curves. The methodologies used for valuing securities are not necessarily an indication of the risks associated with investing in those securities.
Fair valued securities may be classified as “Level 3” if the valuation primarily reflects the Manager’s own assumptions about the inputs that market participants would use in valuing such securities.
There have been no significant changes to the fair valuation methodologies during the period.
Securities on a When-Issued or Delayed Delivery Basis. The Fund may purchase securities on a “when-issued” basis, and may purchase or sell securities on a “delayed delivery” basis. “When-issued” or “delayed delivery” refers to securities whose terms and indenture are available and for which a market exists, but which are not available for immediate delivery. Delivery and payment for securities that have been purchased by the Fund on a when-issued basis normally takes place within six months and possibly as long as two years or more after the trade date. During this period, such securities do not earn interest, are subject to market fluctuation and may increase or decrease in value prior to their delivery. The purchase of securities on a when-issued basis may increase the volatility of the Fund’s net asset value to the extent the Fund executes such transactions while remaining substantially fully invested. When the Fund engages in when-issued or delayed delivery transactions, it relies on the buyer or seller, as the case may be, to complete the transaction. Their failure to do so may cause the Fund to lose the opportunity to obtain or dispose of the security at a price and yield it considers advantageous. The Fund maintains internally designated assets with a market value equal to or greater than the amount of its purchase commitments. The Fund may also sell securities that it purchased on a when-issued basis or forward commitment prior to settlement of the original purchase.
As of December 31, 2008, the Fund had purchased securities issued on a when-issued or delayed delivery basis and sold securities issued on a delayed delivery basis as follows:
| | | | | |
| | | When-Issued or Delayed | |
| | | Delivery Basis Transactions | |
| |
| Purchased securities | | $ | 86,956,884 | |
The Fund may enter into “forward roll” transactions with respect to mortgage-related securities. In this type of transaction, the Fund sells a mortgage-related security to a buyer and simultaneously agrees to repurchase a similar security (same type, coupon and maturity) at a later date at a set price. During the period between the sale and the repurchase, the Fund will not be entitled to receive interest and principal payments on the securities that have been sold. The Fund records the incremental difference between the forward purchase and sale of each forward roll as realized gain (loss) on investments or as fee income in the case of such transactions that have an associated fee in lieu of a difference in the forward purchase and sale price.
Risks of entering into forward roll transactions include the potential inability of the counterparty to meet the terms of the agreement; the potential of the Fund to receive inferior securities at redelivery as compared to the securities sold to the counterparty; counterparty credit risk. To assure its future payment of the purchase price, the Fund maintains internally designated assets with a market value equal to or greater than the payment obligation under the roll.
F22 | OPPENHEIMER CORE BOND FUND/VA
Credit Risk. The Fund invests in high-yield, non-investment-grade bonds, which may be subject to a greater degree of credit risk. Credit risk relates to the ability of the issuer to meet interest or principal payments or both as they become due. The Fund may acquire securities in default, and is not obligated to dispose of securities whose issuers subsequently default. As of December 31, 2008, securities with an aggregate market value of $702,820, representing 0.32% of the Fund’s net assets, were in default.
Investment in Oppenheimer Institutional Money Market Fund. The Fund is permitted to invest daily available cash balances in an affiliated money market fund. The Fund may invest the available cash in Class E shares of Oppenheimer Institutional Money Market Fund (“IMMF”) to seek current income while preserving liquidity. IMMF is a registered open-end management investment company, regulated as a money market fund under the Investment Company Act of 1940, as amended. The Manager is also the investment adviser of IMMF. The Fund’s investment in IMMF is included in the Statement of Investments. As a shareholder, the Fund is subject to its proportional share of IMMF’s Class E expenses, including its management fee. The Manager will waive fees and/or reimburse Fund expenses in an amount equal to the indirect management fees incurred through the Fund’s investment in IMMF.
Investments in OFI Liquid Assets Fund, LLC. The Fund is permitted to invest cash collateral received in connection with its securities lending activities. Pursuant to the Fund’s Securities Lending Procedures, the Fund may invest cash collateral in, among other investments, an affiliated money market fund. OFI Liquid Assets Fund, LLC (“LAF”) is a limited liability company whose investment objective is to seek current income and stability of principal. The Manager is also the investment adviser of LAF. LAF is not registered under the Investment Company Act of 1940. However, LAF does comply with the investment restrictions applicable to registered money market funds set forth in Rule 2a-7 adopted under the Investment Company Act. The Fund’s investment in LAF is included in the Statement of Investments. As a shareholder, the Fund is subject to its proportional share of LAF’s expenses, including its management fee of 0.08%.
Investments With Off-Balance Sheet Market Risk. The Fund enters into financial instrument transactions (such as swaps, futures, options and other derivatives) that may have off-balance sheet market risk. Off-balance sheet market risk exists when the maximum potential loss on a particular financial instrument is greater than the value of such financial instrument, as reflected in the Fund’s Statement of Assets and Liabilities.
Allocation of Income, Expenses, Gains and Losses. Income, expenses (other than those attributable to a specific class), gains and losses are allocated on a daily basis to each class of shares based upon the relative proportion of net assets represented by such class. Operating expenses directly attributable to a specific class are charged against the operations of that class.
Federal Taxes. The Fund intends to comply with provisions of the Internal Revenue Code applicable to regulated investment companies and to distribute substantially all of its investment company taxable income, including any net realized gain on investments not offset by capital loss carryforwards, if any, to shareholders. Therefore, no federal income or excise tax provision is required. The Fund files income tax returns in U.S. federal and applicable state jurisdictions. The statute of limitations on the Fund’s tax return filings generally remain open for the three preceding fiscal reporting period ends.
F23 | OPPENHEIMER CORE BOND FUND/VA
NOTES TO FINANCIAL STATEMENTS Continued
1. Significant Accounting Policies Continued
The tax components of capital shown in the following table represent distribution requirements the Fund must satisfy under the income tax regulations, losses the Fund may be able to offset against income and gains realized in future years and unrealized appreciation or depreciation of securities and other investments for federal income tax purposes.
| | | | | | | | | | | | | |
| | | | | | | | | | | Net Unrealized | |
| | | | | | | | | | | Depreciation Based | |
| | | | | | | | | | | on Cost of Securities | |
| Undistributed | | Undistributed | | | Accumulated | | | and Other Investments | |
| Net Investment | | Long-Term | | | Loss | | | for Federal Income | |
| Income | | Gain | | | Carryforward1,2,3,4 | | | Tax Purposes | |
| |
| $— | | $ | — | | | $ | 66,764,804 | | | $ | 69,547,225 | |
| | |
| 1. | | As of December 31, 2008, the Fund had $50,047,655 of net capital loss carryforwards available to offset future realized capital gains, if any, and thereby reduce future taxable gain distributions. As of December 31, 2008, details of the capital loss carryforwards were as follows: |
| | | | | |
| Expiring | | | | |
| |
| 2010 | | $ | 29,885,554 | |
| 2013 | | | 57,295 | |
| 2014 | | | 6,081,496 | |
| 2015 | | | 1,245,459 | |
| 2016 | | | 12,777,851 | |
| | | | |
| Total | | $ | 50,047,655 | |
| | | | |
| | |
| 2. | | As of December 31, 2008, the Fund had $16,717,149 of post-October losses available to offset future realized capital gains, if any. Such losses, if unutilized, will expire in 2017. |
| |
| 3. | | During the fiscal year ended December 31, 2008, the Fund did not utilize any capital loss carryforward. |
| |
| 4. | | During the fiscal year ended December 31, 2007, the Fund did not utilize any capital loss carryforward. |
Net investment income (loss) and net realized gain (loss) may differ for financial statement and tax purposes. The character of dividends and distributions made during the fiscal year from net investment income or net realized gains may differ from their ultimate characterization for federal income tax purposes. Also, due to timing of dividends and distributions, the fiscal year in which amounts are distributed may differ from the fiscal year in which the income or net realized gain was recorded by the Fund.
Accordingly, the following amounts have been reclassified for December 31, 2008. Net assets of the Fund were unaffected by the reclassifications.
| | | | | | | | | |
| | | Reduction to | | | Reduction to | |
| | | Accumulated | | | Accumulated Net | |
| Reduction | | Net Investment | | | Realized Loss | |
| to Paid-in Capital | | Income | | | on Investments | |
| |
| $53,556,351 | | $ | 27,135,732 | | | $ | 80,692,083 | |
The tax character of distributions paid during the years ended December 31, 2008 and December 31, 2007 was as follows:
| | | | | | | | | |
| | | Year Ended | | | Year Ended | |
| | | December 31, 2008 | | | December 31, 2007 | |
| |
| Distributions paid from: | | | | | | | | |
| Ordinary income | | $ | 17,197,060 | | | $ | 20,746,953 | |
The aggregate cost of securities and other investments and the composition of unrealized appreciation and depreciation of securities and other investments for federal income tax purposes as of December 31, 2008 are noted in the following table. The primary difference between book and tax appreciation or depreciation of securities and other
F24 | OPPENHEIMER CORE BOND FUND/VA
investments, if applicable, is attributable to the tax deferral of losses or tax realization of financial statement unrealized gain or loss.
| | | | | |
| Federal tax cost of securities | | $ | 374,758,290 | |
| Federal tax cost of other investments | | | 18,663,549 | |
| | | | |
| Total federal tax cost | | $ | 393,421,839 | |
| | | | |
| | | | | |
| Gross unrealized appreciation | | $ | 11,278,504 | |
| Gross unrealized depreciation | | | (80,825,729 | ) |
| | | | |
| Net unrealized depreciation | | $ | (69,547,225 | ) |
| | | | |
Trustees’ Compensation. The Board of Trustees has adopted a compensation deferral plan for independent trustees that enables trustees to elect to defer receipt of all or a portion of the annual compensation they are entitled to receive from the Fund. For purposes of determining the amount owed to the Trustee under the plan, deferred amounts are treated as though equal dollar amounts had been invested in shares of the Fund or in other Oppenheimer funds selected by the Trustee. The Fund purchases shares of the funds selected for deferral by the Trustee in amounts equal to his or her deemed investment, resulting in a Fund asset equal to the deferred compensation liability. Such assets are included as a component of “Other” within the asset section of the Statement of Assets and Liabilities. Deferral of trustees’ fees under the plan will not affect the net assets of the Fund, and will not materially affect the Fund’s assets, liabilities or net investment income per share. Amounts will be deferred until distributed in accordance to the compensation deferral plan.
Dividends and Distributions to Shareholders. Dividends and distributions to shareholders, which are determined in accordance with income tax regulations and may differ from U.S. generally accepted accounting principles, are recorded on the ex-dividend date. Income and capital gain distributions, if any, are declared and paid annually or at other times as deemed necessary by the Manager.
Investment Income. Dividend income is recorded on the ex-dividend date or upon ex-dividend notification in the case of certain foreign dividends where the ex-dividend date may have passed. Non-cash dividends included in dividend income, if any, are recorded at the fair market value of the securities received. Interest income is recognized on an accrual basis. Discount and premium, which are included in interest income on the Statement of Operations, are amortized or accreted daily.
Custodian Fees. “Custodian fees and expenses” in the Statement of Operations may include interest expense incurred by the Fund on any cash overdrafts of its custodian account during the period. Such cash overdrafts may result from the effects of failed trades in portfolio securities and from cash outflows resulting from unanticipated shareholder redemption activity. The Fund pays interest to its custodian on such cash overdrafts, to the extent they are not offset by positive cash balances maintained by the Fund, at a rate equal to the Federal Funds Rate plus 0.50%. The “Reduction to custodian expenses” line item, if applicable, represents earnings on cash balances maintained by the Fund during the period. Such interest expense and other custodian fees may be paid with these earnings.
Security Transactions. Security transactions are recorded on the trade date. Realized gains and losses on securities sold are determined on the basis of identified cost.
Indemnifications. The Fund’s organizational documents provide current and former trustees and officers with a limited indemnification against liabilities arising in connection with the performance of their duties to the Fund. In the normal course of business, the Fund may also enter into contracts that provide general indemnifications. The Fund’s maximum exposure under these arrangements is unknown as this would be dependent on future claims that may be made against the Fund. The risk of material loss from such claims is considered remote.
F25 | OPPENHEIMER CORE BOND FUND/VA
NOTES TO FINANCIAL STATEMENTS Continued
1. Significant Accounting Policies Continued
Other. The preparation of financial statements in conformity with accounting principles generally accepted in the United States of America requires management to make estimates and assumptions that affect the reported amounts of assets and liabilities and disclosure of contingent assets and liabilities at the date of the financial statements and the reported amounts of increases and decreases in net assets from operations during the reporting period. Actual results could differ from those estimates.
2. Shares of Beneficial Interest
The Fund has authorized an unlimited number of $0.001 par value shares of beneficial interest of each class. Transactions in shares of beneficial interest were as follows:
| | | | | | | | | | | | | | | | | |
| | | Year Ended December 31, 2008 | | | Year Ended December 31, 2007 | |
| | | Shares | | | Amount | | | Shares | | | Amount | |
| |
Non-Service Shares | | | | | | | | | | | | | | | | |
| Sold | | | 1,056,698 | | | $ | 9,889,610 | | | | 1,273,250 | | | $ | 13,904,774 | |
| Dividends and/or distributions reinvested | | | 1,288,991 | | | | 12,773,902 | | | | 1,704,683 | | | | 18,342,384 | |
| Acquisition-Note 11 | | | 1,626,777 | | | | 17,178,762 | | | | — | | | | — | |
| Redeemed | | | (9,205,898 | ) | | | (87,681,397 | ) | | | (6,416,114 | ) | | | (69,950,741 | ) |
| | | |
| Net decrease | | | (5,233,432 | ) | | $ | (47,839,123 | ) | | | (3,438,181 | ) | | $ | (37,703,583 | ) |
| | | |
| | | | | | | | | | | | | | | | | |
Service Shares | | | | | | | | | | | | | | | | |
| Sold | | | 4,464,539 | | | $ | 42,884,220 | | | | 6,555,320 | | | $ | 70,649,282 | |
| Dividends and/or distributions reinvested | | | 449,051 | | | | 4,423,158 | | | | 224,516 | | | | 2,404,569 | |
| Redeemed | | | (4,496,387 | ) | | | (40,111,059 | ) | | | (1,059,398 | ) | | | (11,528,790 | ) |
| | | |
| Net increase | | | 417,203 | | | $ | 7,196,319 | | | | 5,720,438 | | | $ | 61,525,061 | |
| | | |
3. Purchases and Sales of Securities
The aggregate cost of purchases and proceeds from sales of securities, other than short-term obligations and investments in Oppenheimer Institutional Money Market Fund and OFI Liquid Assets Fund, LLC, for the year ended December 31, 2008, were as follows:
| | | | | | | | | |
| | | Purchases | | | Sales | |
| |
| Investment securities | | $ | 135,191,911 | | | $ | 261,682,762 | |
| U.S. government and government agency obligations | | | 7,305,293 | | | | 7,709,375 | |
| To Be Announced (TBA) mortgage-related securities | | | 1,019,711,829 | | | | 963,377,934 | |
4. Fees and Other Transactions with Affiliates
Management Fees. Under the investment advisory agreement, the Fund pays the Manager a management fee based on the daily net assets of the Fund at an annual rate as shown in the following table:
| | | | | |
| Fee Schedule | | | | |
| |
| Up to $1 billion | | | 0.60 | % |
| Over $1 billion | | | 0.50 | |
Transfer Agent Fees. OppenheimerFunds Services (“OFS”), a division of the Manager, acts as the transfer and shareholder servicing agent for the Fund. The Fund pays OFS a per account fee. For the year ended December 31, 2008, the Fund paid $20,020 to OFS for services to the Fund.
Additionally, funds offered in variable annuity separate accounts are subject to minimum fees of $10,000 per class, for class level assets of $10 million or more. Each class is subject to the minimum fee in the event that the per account fee does not equal or exceed the applicable minimum fee.
F26 | OPPENHEIMER CORE BOND FUND/VA
Distribution and Service Plan for Service Shares. The Fund has adopted a Distribution and Service Plan (the “Plan”) in accordance with Rule 12b-1 under the Investment Company Act of 1940 for Service shares to pay OppenheimerFunds Distributor, Inc. (the “Distributor”), for distribution related services, personal service and account maintenance for the Fund’s Service shares. Under the Plan, payments are made periodically at an annual rate of up to 0.25% of the average annual net assets of Service shares of the Fund. The Distributor currently uses all of those fees to compensate sponsor(s) of the insurance product that offers Fund shares, for providing personal service and maintenance of accounts of their variable contract owners that hold Service shares. These fees are paid out of the Fund’s assets on an on-going basis and increase operating expenses of the Service shares, which results in lower performance compared to the Fund’s shares that are not subject to a service fee. Fees incurred by the Fund under the Plan are detailed in the Statement of Operations.
Waivers and Reimbursements of Expenses. The Manager voluntarily reimbursed expenses of $21,750 related to the acquisition of Government Securities Portfolio.
OFS has voluntarily agreed to limit transfer and shareholder servicing agent fees for all classes to 0.35% of average annual net assets per class. This undertaking may be amended or withdrawn at any time.
The Manager will waive fees and/or reimburse Fund expenses in an amount equal to the indirect management fees incurred through the Fund’s investment in IMMF. During the year ended December 31, 2008, the Manager waived $7,971 for IMMF management fees.
5. Futures Contracts
A futures contract is a commitment to buy or sell a specific amount of a financial instrument at a negotiated price on a stipulated future date. The Fund may buy and sell futures contracts and may also buy or write put or call options on these futures contracts.
Futures contracts traded on a commodities or futures exchange will be valued at the final settlement price or official closing price on the principal exchange as reported by such principal exchange at its trading session ending at, or most recently prior to, the time when the Fund’s assets are valued.
Upon entering into a futures contract, the Fund is required to deposit either cash or securities (initial margin) in an amount equal to a certain percentage of the contract value. Subsequent payments (variation margin) are made or received by the Fund each day. The variation margin payments are equal to the daily changes in the contract value and are recorded as unrealized gains and losses.
Futures contracts are reported on a schedule following the Statement of Investments. Securities held in collateralized accounts to cover initial margin requirements on open futures contracts are noted in the Statement of Investments. Cash held by the broker to cover initial margin requirements on open futures contracts and the receivable and/or payable for the daily mark to market for the variation margin are noted in the Statement of Assets and Liabilities. The net change in unrealized appreciation and depreciation is reported in the Statement of Operations. Realized gains (losses) are reported in the Statement of Operations at the closing or expiration of futures contracts.
Risks of entering into futures contracts (and related options) include the possibility that there may be an illiquid market where the Fund is unable to liquidate the contract or enter into an offsetting position and, if used for hedging purposes, the risk that the price of the contract will correlate imperfectly with the prices of the Fund’s securities.
6. Swap Contracts
The Fund may enter into privately negotiated agreements with a counterparty to exchange or “swap” payments at specified future intervals based on the return of an asset (such as a stock, bond or currency) or non-asset reference (such as an interest rate or index). The swap agreement will specify the “notional” amount of the asset or non-asset reference to which the contract relates. As derivative contracts, swaps typically do not have an associated cost at contract inception. At initiation, contract terms are typically set at market value such that the value of the swap is $0. If a
F27 | OPPENHEIMER CORE BOND FUND/VA
NOTES TO FINANCIAL STATEMENTS Continued
6. Swap Contracts Continued
counterparty specifies terms that would result in the contract having a value other than $0 at initiation, one counterparty will pay the other an upfront payment to equalize the contract. Subsequent changes in market value are calculated based upon changes in the performance of the asset or non-asset reference multiplied by the notional value of the contract. Contract types may include credit default, interest rate, total return, and currency swaps.
Swaps are marked to market daily using quotations primarily from pricing services, counterparties or brokers. Swap contracts are reported on a schedule following the Statement of Investments. The value of the contracts is separately disclosed on the Statement of Assets and Liabilities. The unrealized appreciation (depreciation) is comprised of the change in the valuation of the swap combined with the accrued interest due to (owed by) the Fund at termination or settlement. The net change in this amount during the period is included on the Statement of Operations. Any payment received or paid to initiate a contract is recorded as a cost of the swap in the Statement of Assets and Liabilities and as a component of unrealized gain or loss on the Statement of Operations until contract termination; upon contract termination, this amount is recorded as realized gain or loss on the Statement of Operations. Excluding amounts paid at contract initiation as described above, the Fund also records any periodic payments received from (paid to) the counterparty, including at termination, as realized gain (loss) on the Statement of Operations.
Risks of entering into swap contracts include credit, market and liquidity risk. Credit risk arises from the possibility that the counterparty fails to make a payment when due or otherwise defaults under the terms of the contract. If the counterparty defaults, the Fund’s loss will consist of the net amount of contractual payments that the Fund has not yet received. Market risk is the risk that the value of the contract will depreciate due to unfavorable changes in the performance of the asset or non-asset reference. Liquidity risk is the risk that the Fund may be unable to close the contract prior to its termination.
Credit Default Swap Contracts. A credit default swap is a bilateral contract that enables an investor to buy or sell protection on a debt security against a defined-issuer credit event, such as the issuer’s failure to make timely payments of interest or principal on the debt security, bankruptcy or restructuring. The Fund may enter into credit default swaps either by buying or selling protection on a single security or a basket of securities (the “reference asset”).
The buyer of protection pays a periodic fee to the seller of protection based on the notional amount of debt securities underlying the swap contract. The seller of protection agrees to compensate the buyer of protection for future potential losses as a result of a credit event on the reference asset. The contract effectively transfers the credit event risk of the reference asset from the buyer of protection to the seller of protection.
The ongoing value of the contract will fluctuate throughout the term of the contract based primarily on the credit risk of the reference asset. If the credit quality of the reference asset improves relative to the credit quality at contract initiation, the buyer of protection may have an unrealized loss greater than the anticipated periodic fee owed. This unrealized loss would be the result of current credit protection being cheaper than the cost of credit protection at contract initiation. If the buyer elects to terminate the contract prior to its maturity, and there has been no credit event, this unrealized loss will become realized. If the contract is held to maturity, and there has been no credit event, the realized loss will be equal to the periodic fee paid over the life of the contract.
If there is a credit event, the buyer of protection can exercise its rights under the contract and receive a payment from the seller of protection equal to the notional amount of the reference asset less the market value of the reference asset. Upon exercise of the contract the difference between the value of the underlying reference asset and the notional amount is recorded as realized gain (loss) and is included on the Statement of Operations.
Risks of credit default swaps include credit, market and liquidity risk. Additional risks include but are not limited to: the cost of paying for credit protection if there are no credit events or the cost of selling protection when a credit event occurs (paying the notional amount to the protection buyer); and pricing transparency when assessing the value of a credit default swap.
F28 | OPPENHEIMER CORE BOND FUND/VA
As of the period end, the Fund has sold credit protection through credit default swaps to gain exposure to the credit risk of individual securities and/or indexes that are either unavailable or considered to be less attractively priced in the bond market. The Fund has also engaged in pairs trades by purchasing protection through a credit default swap referenced to the debt of an issuer, and simultaneously selling protection through a credit default swap referenced to the debt of a different issuer with the intent to realize gains from the pricing differences of the two issuers who are expected to have similar market risks. Pairs trades attempt to gain exposure to credit risk while hedging or offsetting the effects of overall market movements. In addition, the Fund has engaged in spread curve trades by simultaneously purchasing and selling protection through credit default swaps referenced to the same issuer but with different maturities. Spread curve trades attempt to gain exposure to credit risk on a forward basis by realizing gains on the expected differences in spreads.
Interest Rate Swap Contracts. An interest rate swap is an agreement between counterparties to exchange periodic payments based on interest rates. One cash flow stream will typically be a floating rate payment based upon a specified interest rate while the other is typically a fixed interest rate.
Risks of interest rate swaps include credit, market and liquidity risk. Additional risks include but are not limited to, interest rate risk. There is a risk, based on future movements of interest rates that the payments made by the Fund under a swap agreement will be greater than the payments it received.
Total Return Swap Contracts. A total return swap is an agreement between counterparties to exchange periodic payments based on asset or non-asset references. One cash flow is typically based on a non-asset reference (such as an interest rate or index) and the other on the total return of a reference asset (such as a security or a basket of securities). The total return of the reference asset typically includes appreciation or depreciation on the reference asset, plus any interest or dividend payments.
Risks of total return swaps include credit, market and liquidity risk.
8. Illiquid Securities
As of December 31, 2008, investments in securities included issues that are illiquid. Investments may be illiquid because they do not have an active trading market, making it difficult to value them or dispose of them promptly at an acceptable price. The Fund will not invest more than 15% of its net assets (determined at the time of purchase and reviewed periodically) in illiquid securities. Securities that are illiquid are marked with an applicable footnote on the Statement of Investments.
9. Securities Lending
The Fund lends portfolio securities from time to time in order to earn additional income in the form of fees or interest on securities received as collateral or the investment of any cash received as collateral. The loans are secured by collateral (either securities, letters of credit, or cash) in an amount not less than 100% of the market value of the loaned securities during the period of the loan. The market value of the loaned securities is determined at the close of each business day and any additional required collateral is delivered to the Fund on the next business day. If the borrower defaults on its obligation to return the securities loaned because of insolvency or other reasons, the Fund could experience delays and cost in recovering the securities loaned or in gaining access to the collateral. The Fund continues to receive the economic benefit of interest or dividends paid on the securities loaned in the form of a substitute payment received from the borrower and recognizes the gain or loss in the fair value of the securities loaned that may occur during the term of the loan. The Fund has the right under the lending agreement to recover the securities from the borrower on demand.
As of December 31, 2008, the Fund had no securities on loan.
F29 | OPPENHEIMER CORE BOND FUND/VA
NOTES TO FINANCIAL STATEMENTS Continued
10. Recent Accounting Pronouncement
In March 2008, the Financial Accounting Standards Board (“FASB”) issued Statement on Financial Accounting Standards (“SFAS”) No. 161, Disclosures about Derivative Instruments and Hedging Activities. This standard requires enhanced disclosures about derivative and hedging activities, including qualitative disclosures about how and why the Fund uses derivative instruments, how these activities are accounted for, and their effect on the Fund’s financial position, financial performance and cash flows. SFAS No. 161 is effective for financial statements issued for fiscal years and interim periods beginning after November 15, 2008. At this time, management is evaluating the implications of SFAS No. 161 and its impact on the Fund’s financial statements and related disclosures.
11. Acquisition of Government Securities Portfolio
On April 30, 2008, the Fund acquired all of the net assets of Government Securities Portfolio, pursuant to an Agreement and Plan of Reorganization approved by the Government Securities Portfolio shareholders on April 25, 2008. The Fund issued (at an exchange ratio of 1.0341 for Non-Service of the Fund to one share of Government Securities Portfolio) 1,626,777 shares of beneficial interest for Non-Service, valued at $17,178,762 in exchange for the net assets, resulting in combined Non-Service net assets of $321,759,067 on April 30, 2008. The net assets acquired included net unrealized appreciation $284,900 and an unused capital loss carryforward of $194,746, potential utilization subject to tax limitations. The exchange qualified as a tax-free reorganization for federal income tax purposes.
12. Change In Independent Registered Public Accounting Firm (Unaudited)
At a meeting held on August 20, 2008, the Board of Trustees of the Fund appointed KPMG LLP as the independent registered public accounting firm to the Fund for fiscal year 2009, replacing the firm of Deloitte & Touche LLP effective at the conclusion of the fiscal 2008 audit. During the two most recent fiscal years the audit reports of Deloitte & Touche LLP contained no adverse opinion or disclaimer of opinion and were not qualified or modified as to uncertainty, audit scope or accounting principles. Further, there were no disagreements between the Fund and Deloitte & Touche LLP on accounting principles, financial statement disclosure or audit scope, which if not resolved to the satisfaction of Deloitte & Touche LLP would have caused it to make reference to the disagreements in connection with its reports.
F30 | OPPENHEIMER CORE BOND FUND/VA
REPORT OF INDEPENDENT REGISTERED PUBLIC ACCOUNTING FIRM
To the Board of Trustees and Shareholders of Oppenheimer Core Bond Fund/VA:
We have audited the accompanying statement of assets and liabilities of Oppenheimer Core Bond Fund/VA (the “Fund”), a series of Oppenheimer Variable Account Funds, including the statement of investments, as of December 31, 2008, and the related statement of operations for the year then ended, the statements of changes in net assets for each of the two years in the period then ended, and the financial highlights for each of the five years in the period then ended. These financial statements and financial highlights are the responsibility of the Fund’s management. Our responsibility is to express an opinion on these financial statements and financial highlights based on our audits.
We conducted our audits in accordance with the standards of the Public Company Accounting Oversight Board (United States). Those standards require that we plan and perform the audit to obtain reasonable assurance about whether the financial statements and financial highlights are free of material misstatement. The Fund is not required to have, nor were we engaged to perform, an audit of its internal control over financial reporting. Our audits included consideration of internal control over financial reporting as a basis for designing audit procedures that are appropriate in the circumstances, but not for the purpose of expressing an opinion on the effectiveness of the Fund’s internal control over financial reporting. Accordingly, we express no such opinion. An audit also includes examining, on a test basis, evidence supporting the amounts and disclosures in the financial statements, assessing the accounting principles used and significant estimates made by management, as well as evaluating the overall financial statement presentation. Our procedures included confirmation of securities owned as of December 31, 2008, by correspondence with the custodian and brokers; where replies were not received from brokers, we performed other auditing procedures. We believe that our audits provide a reasonable basis for our opinion.
In our opinion, the financial statements and financial highlights referred to above present fairly, in all material respects, the financial position of the Fund as of December 31, 2008, the results of its operations for the year then ended, the changes in its net assets for each of the two years in the period then ended, and the financial highlights for each of the five years in the period then ended, in conformity with accounting principles generally accepted in the United States of America.
Deloitte & Touche LLP
Denver, Colorado
February 11, 2009
F31 | OPPENHEIMER CORE BOND FUND/VA
THIS PAGE INTENTIONALLY LEFT BLANK.
F32 | OPPENHEIMER CORE BOND FUND/VA
FEDERAL INCOME TAX INFORMATION Unaudited
In early 2009, if applicable, shareholders of record received information regarding all dividends and distributions paid to them by the Fund during calendar year 2008. Regulations of the U.S. Treasury Department require the Fund to report this information to the Internal Revenue Service.
The foregoing information is presented to assist shareholders in reporting distributions received from the Fund to the Internal Revenue Service. Because of the complexity of the federal regulations which may affect your individual tax return and the many variations in state and local tax regulations, we recommend that you consult your tax advisor for specific guidance.
7 | OPPENHEIMER CORE BOND FUND/VA
BOARD APPROVAL OF THE FUND’S INVESTMENT ADVISORY AGREEMENT Unaudited
Each year, the Board of Trustees (the “Board”), including a majority of the independent Trustees, is required to determine whether to renew the Fund’s investment advisory agreement (the “Agreement”). The Investment Company Act of 1940, as amended, requires that the Board request and evaluate, and that the Manager provide, such information as may be reasonably necessary to evaluate the terms of the Agreement. The Board employs an independent consultant to prepare a report that provides information, including comparative information, the Board requests for that purpose. In addition, the Board receives information throughout the year regarding Fund services, fees, expenses and performance.
The Manager and the independent consultant provided information to the Board on the following factors: (i) the nature, quality and extent of the Manager’s services, (ii) the investment performance of the Fund and the Manager, (iii) the fees and expenses of the Fund, including comparative expense information, (iv) the profitability of the Manager and its affiliates, including an analysis of the cost of providing services, (v) whether economies of scale are realized as the Fund grows and whether fee levels reflect these economies of scale for Fund investors and (vi) other benefits to the Manager from its relationship with the Fund. The Board was aware that there are alternatives to retaining the Manager. The Board was aware that there are alternatives to retaining the Manager.
Outlined below is a summary of the principal information considered by the Board as well as the Board’s conclusions.
Nature, Quality and Extent of Services. The Board considered information about the nature, quality and extent of the services provided to the Fund and information regarding the Manager’s key personnel who provide such services. The Manager’s duties include providing the Fund with the services of the portfolio managers and the Manager’s investment team, who provide research, analysis and other advisory services in regard to the Fund’s investments; securities trading services; oversight of third party service providers; monitoring compliance with applicable Fund policies and procedures and adherence to the Fund’s investment restrictions. The Manager is responsible for providing certain administrative services to the Fund as well. Those services include providing and supervising all administrative and clerical personnel who are necessary in order to provide effective corporate administration for the Fund; compiling and maintaining records with respect to the Fund’s operations; preparing and filing reports required by the Securities and Exchange Commission; preparing periodic reports regarding the operations of the Fund for its shareholders; preparing proxy materials for shareholder meetings; and preparing the registration statements required by Federal and state securities laws for the sale of the Fund’s shares. The Manager also provides the Fund with office space, facilities and equipment.
The Board also considered the quality of the services provided and the quality of the Manager’s resources that are available to the Fund. The Board took account of the fact that the Manager has had over forty years of experience as an investment adviser and that its assets under management rank it among the top mutual fund managers in the United States. The Board evaluated the Manager’s advisory, administrative, accounting, legal and compliance services, and information the Board has received regarding the experience and professional qualifications of the Manager’s key personnel and the size and functions of its staff. In its evaluation of the quality of the portfolio management services provided, the Board considered the experience of Angelo Manioudakis, Antulio Bomfim, Geoffrey Caan, Benjamin Gord and Thomas Swaney, the portfolio managers for the Fund, and the Manager’s investment team and analysts. The Board members also considered the totality of their experiences with the Manager as Directors or Trustees of the Fund and other funds advised by the Manager. The Board considered information regarding the quality of services provided by affiliates of the Manager, which its members have become knowledgeable about in connection with the renewal of the Fund’s service agreements. The Board concluded that, in light of the Manager’s experience, reputation, personnel, operations and resources, the Fund benefits from the services provided under the Agreement.
8 | OPPENHEIMER CORE BOND FUND/VA
Investment Performance of the Manager and the Fund. Throughout the year, the Manager provided information on the investment performance of the Fund and the Manager, including comparative performance information. The Board also reviewed information, prepared by the Manager and by the independent consultant, comparing the Fund’s historical performance to relevant market indices and to the performance of other A-rated corporate debt funds underlying variable insurance products. The Board considered that the Fund outperformed or performed competitively against its performance universe median during the three-, five- and ten-year periods, though it underperformed its performance universe median during the one-year period.
Costs of Services by the Manager. The Board reviewed the fees paid to the Manager and the other expenses borne by the Fund. The Board also considered the comparability of the fees charged and the services provided to the Fund to the fees and services for other clients or accounts advised by the Manager. The independent consultant provided comparative data in regard to the fees and expenses of the Fund and A-rated corporate debt funds underlying variable insurance products with comparable asset levels and distribution features. The Board considered that the Fund’s actual management fees and total expenses were higher than its expense group median. The Board considered that, effective May 1, 2007, the Manager had agreed to eliminate the first four management fee breakpoints from its fee and that, after the waiver was implemented, the advisory fee of the Fund declined by nine basis points. In reviewing the fees and expenses charged to the VA Funds, the Board considered the Manager’s assertion that, because of the disparity among VA funds in how insurance companies may be compensated for the services they provide to shareholders, when comparing the expenses of the various VA funds it is most appropriate to focus on the total expenses rather than on the management fees. Accordingly, while the Board reviewed and considered all expenses in its consideration of the Advisory Agreement, it paid particular attention to total expenses.
Economies of Scale and Profits Realized by the Manager. The Board considered information regarding the Manager’s costs in serving as the Fund’s investment adviser, including the costs associated with the personnel and systems necessary to manage the Fund, and information regarding the Manager’s profitability from its relationship with the Fund. The Board reviewed whether the Manager may realize economies of scale in managing and supporting the Fund. The Board noted that the Fund currently has management fee breakpoints, which are intended to share with Fund shareholders economies of scale that may exist as the Fund’s assets grow.
Other Benefits to the Manager. In addition to considering the profits realized by the Manager, the Board considered information that was provided regarding the direct and indirect benefits the Manager receives as a result of its relationship with the Fund, including compensation paid to the Manager’s affiliates. The Board also considered that the Manager must be able to pay and retain experienced professional personnel at competitive rates to provide quality services to the Fund and that maintaining the financial viability of the Manager is important in order for the Manager to continue to provide significant services to the Fund and its shareholders.
Conclusions. These factors were also considered by the independent Trustees meeting separately from the full Board, assisted by experienced counsel to the Fund and to the independent Trustees. Fund counsel and the independent Trustees’ counsel are independent of the Manager within the meaning and intent of the Securities and Exchange Commission Rules.
Based on its review of the information it received and its evaluations described above, the Board, including a majority of the independent Trustees, decided to continue the Agreement for another year. In arriving at this decision, the Board did not single out any factor or factors as being more important than others, but considered all of the above information, and considered the terms and conditions of the Agreement, including the management fee, in light of all of the surrounding circumstances.
9 | OPPENHEIMER CORE BOND FUND/VA
PORTFOLIO PROXY VOTING POLICIES AND PROCEDURES; UPDATES TO STATEMENTS OF INVESTMENTS Unaudited
The Fund has adopted Portfolio Proxy Voting Policies and Procedures under which the Fund votes proxies relating to securities (“portfolio proxies”) held by the Fund. A description of the Fund’s Portfolio Proxy Voting Policies and Procedures is available (i) without charge, upon request, by calling the Fund toll-free at 1.800.525.7048, (ii) on the Fund’s website at www.oppenheimerfunds.com, and (iii) on the SEC’s website at www.sec.gov. In addition, the Fund is required to file Form N-PX, with its complete proxy voting record for the 12 months ended June 30th, no later than August 31st of each year. The Fund’s voting record is available (i) without charge, upon request, by calling the Fund toll-free at 1.800.525.7048, and (ii) in the Form N-PX filing on the SEC’s website at www.sec.gov.
The Fund files its complete schedule of portfolio holdings with the SEC for the first quarter and the third quarter of each fiscal year on Form N-Q. The Fund’s Form N-Q filings are available on the SEC’s website at http://www.sec.gov. Those forms may be reviewed and copied at the SEC’s Public Reference Room in Washington, D.C. Information on the operation of the Public Reference Room may be obtained by calling 1-800-SEC-0330.
10 | OPPENHEIMER CORE BOND FUND/VA
TRUSTEES AND OFFICERS Unaudited
| | | |
| Name, Position(s) Held with | | Principal Occupation(s) During the Past 5 Years; Other Trusteeships/Directorships Held; Number of Portfolios in |
| the Funds, Length of Service, Age | | the Funds Complex Currently Overseen |
| | |
| | | |
INDEPENDENT
TRUSTEES | | The address of each Trustee in the chart below is 6803 S. Tucson Way, Centennial, Colorado 80112-3924. Each Trustee serves for an indefinite term, or until his or her resignation, retirement, death or removal. |
| | | |
William L. Armstrong,
Chairman of the Board of
Trustees (since 2003),
Trustee (since 1999)
Age: 71 | | President, Colorado Christian University (since 2006); Chairman, Cherry Creek Mortgage Company (since 1991), Chairman, Centennial State Mortgage Company (since 1994), Chairman, The El Paso Mortgage Company (since 1993); Chairman, Ambassador Media Corporation (since 1984); Chairman, Broadway Ventures (since 1984); Director of Helmerich & Payne, Inc. (oil and gas drilling/production company) (since 1992), Campus Crusade for Christ (non-profit) (since 1991); Former Director, The Lynde and Harry Bradley Foundation, Inc. (non-profit organization) (2002-2006); former Chairman of: Transland Financial Services, Inc. (private mortgage banking company) (1997-2003), Great Frontier Insurance (1995-2000), Frontier Real Estate, Inc. (residential real estate brokerage) (1994-2000) and Frontier Title (title insurance agency) (1995-2000); former Director of the following: UNUMProvident (insurance company) (1991-2004), Storage Technology Corporation (computer equipment company) (1991-2003) and International Family Entertainment (television channel) (1992-1997); U.S. Senator (January 1979-January 1991). Oversees 41 portfolios in the OppenheimerFunds complex. |
| | | |
George C. Bowen,
Trustee (since 1999)
Age: 72 | | Assistant Secretary and Director of Centennial Asset Management Corporation (December 1991-April 1999); President, Treasurer and Director of Centennial Capital Corporation (June 1989-April 1999); Chief Executive Officer and Director of MultiSource Services, Inc. (March 1996-April 1999); Mr. Bowen held several positions with the Manager and with subsidiary or affiliated companies of the Manager (September 1987-April 1999). Oversees 41 portfolios in the OppenheimerFunds complex. |
| | | |
Edward L. Cameron,
Trustee (since 1999)
Age: 70 | | Member of The Life Guard of Mount Vernon (George Washington historical site) (June 2000 – June 2006); Partner of PricewaterhouseCoopers LLP (accounting firm) (July 1974-June 1999); Chairman of Price Waterhouse LLP Global Investment Management Industry Services Group (accounting firm) (July 1994-June 1998). Oversees 39 portfolios in the OppenheimerFunds complex. |
| | | |
Jon S. Fossel,
Trustee (since 1990)
Age: 66 | | Director of UNUMProvident (insurance company) (since June 2002); Director of Northwestern Energy Corp. (public utility corporation) (since November 2004); Director of P.R. Pharmaceuticals (October 1999-October 2003); Director of Rocky Mountain Elk Foundation (non-profit organization) (February 1998-February 2003 and February 2005-February 2007); Chairman and Director (until October 1996) and President and Chief Executive Officer (until October 1995) of the Manager; President, Chief Executive Officer and Director of the following: Oppenheimer Acquisition Corp. (“OAC”) (parent holding company of the Manager), Shareholders Services, Inc. and Shareholder Financial Services, Inc. (until October 1995). Oversees 41 portfolios in the OppenheimerFunds complex. |
| | | |
Sam Freedman,
Trustee (since 1996)
Age: 68 | | Director of Colorado UpLIFT (charitable organization) (since September 1984). Mr. Freedman held several posi- tions with the Manager and with subsidiary or affiliated companies of the Manager (until October 1994). Oversees 41 portfolios in the OppenheimerFunds complex. |
| | | |
Beverly L. Hamilton,
Trustee (since 2002)
Age: 62 | | Trustee of Monterey Institute for International Studies (educational organization) (since February 2000); Board Member of Middlebury College (educational organization) (since December 2005); Director of The California Endowment (philanthropic organization) (since April 2002); Director (February 2002-2005) and Chairman of Trustees (2006-2007) of the Community Hospital of Monterey Peninsula; Director (October 1991-2005) and Vice Chairman (since 2006) of American Funds’ Emerging Markets Growth Fund, Inc. (mutual fund); President of ARCO Investment Management Company (February 1991-April 2000); Member of the investment committees of The Rockefeller Foundation (2001-2006) and The University of Michigan (since 2000); Advisor at Credit Suisse First Boston’s Sprout venture capital unit (venture capital fund) (1994-January 2005); Trustee of MassMutual Institutional Funds (investment company) (1996-June 2004); Trustee of MML Series Investment Fund (investment company) (April 1989-June 2004); Member of the investment committee of Hartford Hospital (2000-2003); and Advisor to Unilever (Holland) pension fund (2000-2003). Oversees 41 portfolios in the OppenheimerFunds complex. |
11 | OPPENHEIMER CORE BOND FUND/VA
TRUSTEES AND OFFICERS Unaudited / Continued
| | | |
| |
Robert J. Malone,
Trustee (since 2002)
Age: 64 | | Board of Directors of Opera Colorado Foundation (non-profit organization) (since March 2008); Director of Jones Knowledge, Inc. (since 2006); Director of Jones International University (educational organization) (since August 2005); Chairman, Chief Executive Officer and Director of Steele Street Bank & Trust (commercial banking) (since August 2003); Director of Colorado UpLIFT (charitable organization) (since 1986); Trustee of the Gallagher Family Foundation (non-profit organization) (since 2000); Former Chairman of U.S. Bank-Colorado (subsidiary of U.S. Bancorp and formerly Colorado National Bank) (July 1996-April 1999); Director of Commercial Assets, Inc. (real estate investment trust) (1993-2000); Director of Jones Knowledge, Inc. (2001-July 2004); and Director of U.S. Exploration, Inc. (oil and gas exploration) (1997-February 2004). Oversees 41 portfolios in the OppenheimerFunds complex. |
| | | |
F. William Marshall, Jr.,
Trustee (since 2000)
Age: 66 | | Trustee Emeritas of Worcester Polytech Institute (WPI) (private university) (since 2009); Trustee of MassMutual Select Funds (formerly MassMutual Institutional Funds) (investment company) (since 1996) and MML Series Investment Fund (investment company) (since 1996); President and Treasurer of the SIS Funds (private charitable fund) (since January 1999); Former Trustee of WPI (1985-2008); Former Chairman of the Board (2004-2006) and Former Chairman of the Investment Committee of WPI (1994-2008); Chairman of SIS & Family Bank, F.S.B. (formerly SIS Bank) (commercial bank) (January 1999-July 1999); Executive Vice President of Peoples Heritage Financial Group, Inc. (commercial bank) (January 1999-July 1999); and Former President and Chief Executive Officer of SIS Bancorp. (1993-1999). Oversees 43 portfolios in the OppenheimerFunds complex. |
| | | |
INTERESTED TRUSTEE
AND OFFICER | | The address of Mr. Murphy is Two World Financial Center, 225 Liberty Street, 11th Floor, New York, New York 10281- 1008. Mr. Murphy serves as a Trustee for an indefinite term, or until his resignation, retirement, death or removal and as an Officer for an indefinite term, or until his resignation, retirement, death or removal. Mr. Murphy is an interested Trustee due to his positions with OppenheimerFunds, Inc. and its affiliates. |
| | | |
John V. Murphy,
Trustee, President and Principal Executive Officer
(since 2001) Age: 59 | | Chairman and Director of the Manager (since June 2001); Chief Executive Officer of the Manager (June 2001-December 2008); President of the Manager (September 2000-February 2007); President and director or trustee of other Oppenheimer funds; President and Director of Oppenheimer Acquisition Corp. (“OAC”) (the Manager’s parent holding company) and of Oppenheimer Partnership Holdings, Inc. (holding company subsidiary of the Manager) (since July 2001); Director of OppenheimerFunds Distributor, Inc. (subsidiary of the Manager) (November 2001-December 2006); Chairman and Director of Shareholder Services, Inc. and of Shareholder Financial Services, Inc. (transfer agent subsidiaries of the Manager) (since July 2001); President and Director of OppenheimerFunds Legacy Program (charitable trust program established by the Manager) (since July 2001); Director of the following investment advisory subsidiaries of the Manager: OFI Institutional Asset Management, Inc., Centennial Asset Management Corporation, Trinity Investment Management Corporation and Tremont Capital Management, Inc. (since November 2001), HarbourView Asset Management Corporation and OFI Private Investments, Inc. (since July 2001); President (since November 2001) and Director (since July 2001) of Oppenheimer Real Asset Management, Inc.; Executive Vice President of Massachusetts Mutual Life Insurance Company (OAC’s parent company) (since February 1997); Director of DLB Acquisition Corporation (holding company parent of Babson Capital Management LLC) (since June 1995); Chairman (since October 2007) and Member of the Investment Company Institute’s Board of Governors (since October 2003). Oversees 105 portfolios in the OppenheimerFunds complex. |
| | | |
OTHER OFFICERS OF
THE FUND | | The addresses of the Officers in the chart below are as follows: for Mr. Zack, Two World Financial Center, 225 Liberty Street, New York, New York 10281-1008, for Messrs. Vandehey and Wixted, 6803 S. Tucson Way, Centennial, Colorado 80112-3924; for Messrs. Bomfim, Caan, Gord and Swaney, 470 Atlantic Avenue, 11th Floor, Boston, Massachusetts 02210. Each Officer serves for an indefinite term or until his or her resignation, retirement, death or removal. |
| | | |
Antulio N. Bomfim,
Vice President (since 2004) and Portfolio Manager (since 2003) Age: 41 | | Vice President of the Manager (since October 2003); Senior Economist at the Board of Governors of the Federal Reserve System (June 1992-October 2003). A portfolio manager and officer of 11 portfolios in the OppenheimerFunds complex. |
| | | |
Geoffrey Caan,
Vice President (since 2004) and Portfolio Manager (since 2003) Age: 39 | | Vice President of the Manager (since August 2003); Vice President of ABN AMRO NA, Inc. (June 2002-August 2003); Vice President of Zurich Scudder Investments (January 1999-June 2002). A portfolio manager and officer of 11 portfolios in the OppenheimerFunds complex. |
12 | OPPENHEIMER CORE BOND FUND/VA
| | | |
| |
Benjamin J. Gord,
Vice President (since 2004) and Portfolio Manager (since 2002)
Age: 46 | | Vice President of the Manager (since April 2002) of HarbourView Asset Management Corporation (since April 2002) and of OFI Institutional Asset Management, Inc. (as of June 2002); Executive Director and senior fixed income analyst at Miller Anderson & Sherrerd, a division of Morgan Stanley Investment Management (April 1992-March 2002). A portfolio manager and officer of 11 portfolios in the OppenheimerFunds complex. |
| | | |
Thomas Swaney,
Vice President and Portfolio Manager (since 2006)
Age: 36 | | Vice President of the Manager (since April 2006); senior analyst, high grade investment team (June 2002- March 2006); senior fixed income analyst at Miller Anderson & Sherrerd, a division of Morgan Stanley Investment Management (May 1998-May 2002). A portfolio manager and officer of 11 portfolios in the OppenheimerFunds complex. |
| | | |
Mark S. Vandehey,
Vice President and Chief
Compliance Officer
(since 2004)
Age: 58 | | Senior Vice President and Chief Compliance Officer of the Manager (since March 2004); Chief Compliance Officer of OppenheimerFunds Distributor, Inc., Centennial Asset Management and Shareholder Services, Inc. (since March 2004); Vice President of OppenheimerFunds Distributor, Inc., Centennial Asset Management Corporation and Shareholder Services, Inc. (since June 1983); Former Vice President and Director of Internal Audit of the Manager (1997-February 2004). An officer of 105 portfolios in the OppenheimerFunds complex. |
| | | |
Brian W. Wixted,
Treasurer and Principal
Financial & Accounting
Officer (since 1999)
Age: 49 | | Senior Vice President and Treasurer of the Manager (since March 1999); Treasurer of the following: HarbourView Asset Management Corporation, Shareholder Financial Services, Inc., Shareholder Services, Inc., Oppenheimer Real Asset Management, Inc. and Oppenheimer Partnership Holdings, Inc. (since March 1999), OFI Private Investments, Inc. (since March 2000), OppenheimerFunds International Ltd. and OppenheimerFunds plc (since May 2000), OFI Institutional Asset Management, Inc. (since November 2000), and OppenheimerFunds Legacy Program (charitable trust program established by the Manager) (since June 2003); Treasurer and Chief Financial Officer of OFI Trust Company (trust company subsidiary of the Manager) (since May 2000); Assistant Treasurer of the following: OAC (since March 1999), Centennial Asset Management Corporation (March 1999-October 2003) and OppenheimerFunds Legacy Program (April 2000-June 2003). An officer of 105 portfolios in the OppenheimerFunds complex. |
| | | |
Robert G. Zack,
Vice President and Secretary (since 2001)
Age: 60 | | Executive Vice President (since January 2004) and General Counsel (since March 2002) of the Manager; General Counsel and Director of the Distributor (since December 2001); General Counsel of Centennial Asset Management Corporation (since December 2001); Senior Vice President and General Counsel of HarbourView Asset Management Corporation (since December 2001); Secretary and General Counsel of OAC (since November 2001); Assistant Secretary (since September 1997) and Director (since November 2001) of OppenheimerFunds International Ltd. and OppenheimerFunds plc; Vice President and Director of Oppenheimer Partnership Holdings, Inc. (since December 2002); Director of Oppenheimer Real Asset Management, Inc. (since November 2001); Senior Vice President, General Counsel and Director of Shareholder Financial Services, Inc. and Shareholder Services, Inc. (since December 2001); Senior Vice President, General Counsel and Director of OFI Private Investments, Inc. and OFI Trust Company (since November 2001); Vice President of OppenheimerFunds Legacy Program (since June 2003); Senior Vice President and General Counsel of OFI Institutional Asset Management, Inc. (since November 2001); Director of OppenheimerFunds International Distributor Limited (since December 2003); Senior Vice President (May 1985-December 2003). An officer of 105 portfolios in the OppenheimerFunds complex. |
The Fund’s Statement of Additional Information contains additional information about the Fund’s Trustees and Officers and is available without charge, upon request, by calling 1.800.981.2871.
13 | OPPENHEIMER CORE BOND FUND/VA
| December 31, 2008 Oppenheimer Management Global Securities Commentaries Fund/VA and Annual Report A Series of Oppenheimer Variable Account Funds MANAGEMENT COMMENTARIES Listing of Top Holdings A N N UA L R E P O RT Fund Performance Discussion Listing of Investments Financial Statements |
FUND PERFORMANCE DISCUSSION
Management’s Discussion of Fund Performance. In an especially volatile period for the financial markets, Oppenheimer Global Securities Fund/VA’s Non-Service shares returned -40.19% for the twelve months ended December 31, 2008. The MSCI World Index returned -40.71% during the same time span. Notwithstanding the outperformance, we are disappointed with the achieved returns thus far. We believe that the appropriateness of our strategy is overwhelmed by the extreme chaos of the market environment. Currently, virtually every company, whether financially sound or not, is tarred with the same brush. There has been an equal decline of value in good companies as well as bad ones as liquidity has dried up and often the only companies that people can sell are their best ones. We believe that as more normal times return, our focus on high-quality businesses will prove to have been the source of superior long-term performance. Several holdings which hindered performance during the reporting period included insurance companies American International Group, Inc. (AIG) and XL Capital Ltd. and energy stocks Technip SA and Transocean Ltd. On the flip side, of our larger holdings, notable successes included Wal-Mart Stores, Inc. in consumer staples, Shionogi & Co. Ltd. and Roche Holding AG in pharmaceuticals, McDonald’s Corp. in consumer discretionary and Intuit, Inc. in information technology. We exited our position in AIG by reporting period end.
Financial sector dislocations have rapidly spread across the world. This has resulted in dramatic outcomes such as the bankruptcies or near bankruptcies of legendary financial companies and an evaporation of confidence, which has permeated the financial markets and frozen credit markets. This has caused further deterioration of company balance sheets and led to questions over firms’ sustainability, regardless of reassurances to the contrary. Subsequent government interventions in the banking systems worldwide have led to uncertain outcomes, especially in the near term, for certain institutions as the system strives to forestall collapse. This has resulted in anomalous behavior in a variety of stocks as weak outperform strong. As the circumstance stabilizes, we should see a return to logic and a greater focus on sustainability and not just survival.
Our strategy during the reporting period resulted in the Fund being underweight in financials and commodities, as it has been for some time. The rationale behind our underweight in financials was the belief that the extreme leverage in financial institutions during a period of high stock prices was a recipe for disaster, the risk of which was not well priced into the market.
As for our avoidance of materials stocks, we felt commodity prices were too high. We did not believe that double-digit growth rates in industrial production and infrastructure development were sustainable in large emerging markets or would continue to offset slowdowns in the developed world. Further, commodity companies, even those in the worst quartile of costs of production, were making returns that were a multiple of their costs of capital. This too we believed to be unsustainable.
We are, however, slowly transitioning to owning more financial stocks. The risk—reward tradeoff is now better. Where credit spreads were virtually non-existent there are now wide margins. Where the yield curve was flat, it is now significantly upward sloping. Where competition was rife in virtually every market, there are now only a few institutions that are able and willing to lend. Despite these banks having to reduce their leverage, it should be a good environment for them to earn a true, sustainable return on their capital for an extended period of time. And now prices too are much lower.
A sector in which we continue to find opportunity is information technology. Information technology deployment in companies allows them to become more efficient and grow faster as they can provide services at lower costs and hence increase demand for those services. Thus providers of information technology and users of information technology win as the overall pie expands. The information technology companies we choose to invest in have sustainable business models where demand for their products or services become integral to their customers, where the cost of switching is high and the value added to the customer is many times the cost of the product or service. The companies in our Fund have excellent balance sheets in what is now a capital short world. This allows them to be self funding; they are able to grow without access to the capital market. This is an extremely important characteristic in the current environment and one that you would expect to be rewarded by the market. However, the economic downturn has hurt information technology stocks, which has caused our Fund’s performance to suffer. We continue to maintain our belief in our current positions and have had very little turnover. The information technology sector accounted for nearly 28% of our Fund at period end.
3 | OPPENHEIMER GLOBAL SECURITIES FUND/ VA
FUND PERFORMANCE DISCUSSION
It is important to mention Telefonaktiebolaget LM Ericsson (Ericsson), our largest holding at period end. Ericsson is the world’s leading vendor of mobile telephony networks. It has leading market shares in both second and third generation networks and is in an excellent position to be a leader in the fourth generation too. As the internet goes mobile worldwide, the capacity required in these networks is growing many-fold. This will happen regardless of the rate of economic growth as the way in which people live evolves. Ericsson as the leading player is well positioned to take advantage of this rapid growth. Its competitive position is enhanced by the weak financial circumstances of many of the other players. Its market share remains about 40% and its margins are industry leading with most of its competitors making at best a low single digit margin in their networks business. While the firm’s stock price was down during the reporting period, it outperformed most of the peers in its category by a substantial margin and was a net contributor to the Fund on a relative basis versus the index. We are convinced that it will deliver excellent returns in the coming years.
We continue to be diversified across a number of geographies. At the end of the reporting period, we had about one-third of the Fund invested in the U.S. The U.S. remains the largest and most innovative economy in the world with very reasonable prices, in our opinion. The second largest country that we were invested in at the end of the reporting period was Japan. Japan has an economy with large and excellent companies, with long track records of significant innovations. We are invested in the U.K. for the same reasons — it is one of the world’s most open economies, with extremely high quality companies. The next largest markets that the Fund had exposure to at period end were the United Kingdom, Sweden, Germany, France, Switzerland, and Mexico. While we tend to find more of these high margin businesses in advanced economies rather than in developing economies, we are expecting to increase our positioning in emerging market companies in the upcoming year as their prices are finally coming into an attractive zone.
Comparing the Fund’s Performance to the Market. The graphs that follow show the performance of a hypothetical $10,000 investment in each share class of the Fund held until December 31, 2008. In the case of Non-Service shares, performance is measured over a ten-year period. In the case of Service shares, performance is measured from inception of the class on July 13, 2000. In the case of Class 3 shares, performance is measured from inception of the class on May 1, 2003. In the case of Class 4 shares, performance is measured from inception of the class on May 3, 2004. Performance information does not reflect charges that apply to separate accounts investing in the Fund. If these charges were taken into account, performance would be lower. The graphs assume that all dividends and capital gains distributions were reinvested in additional shares. Past performance cannot guarantee future results.
The Fund’s performance is compared to the performance of the Morgan Stanley Capital International (MSCI) World Index, an unmanaged index of issuers listed on the stock exchanges of a select number foreign countries and the U.S. The index performance includes reinvestment of income but does not reflect transaction costs, fees or expenses. The Fund’s performance reflects the effects of the Fund’s business and operating expenses. While index comparisons may be useful to provide a benchmark for the Fund’s performance, it must be noted that the Fund’s investments are not limited to the investments in the index.
4 | OPPENHEIMER GLOBAL SECURITIES FUND/ VA
FUND PERFORMANCE DISCUSSION
Non-Service Shares
Comparison of Change in Value of $10,000 Hypothetical Investments in:
Service Shares
Comparison of Change in Value of $10,000 Hypothetical Investments in:
The performance data quoted represents past performance, which does not guarantee future results. The investment return and principal value of an investment in the Fund will fluctuate so that an investor’s shares, when redeemed, may be worth more or less than their original cost. Current performance may be lower or higher than the performance quoted. For performance data current to the most recent month end, call us at 1.800.981.2871. The Fund’s total returns should not be expected to be the same as the returns of other funds, whether or not both funds have the same portfolio managers and/or similar names. The Fund’s total returns do not include the charges associated with the separate account products that offer this Fund. Such performance would have been lower if such charges were taken into account.
5 | OPPENHEIMER GLOBAL SECURITIES FUND/ VA
FUND PERFORMANCE DISCUSSION
Class 3 Shares
Comparison of Change in Value of $10,000 Hypothetical Investments in:
Class 4 Shares
Comparison of Change in Value of $10,000 Hypothetical Investments in:
The performance data quoted represents past performance, which does not guarantee future results. The investment return and principal value of an investment in the Fund will fluctuate so that an investor’s shares, when redeemed, may be worth more or less than their original cost. Current performance may be lower or higher than the performance quoted. For performance data current to the most recent month end, call us at 1.800.981.2871. The Fund’s total returns should not be expected to be the same as the returns of other funds, whether or not both funds have the same portfolio managers and/or similar names. The Fund’s total returns do not include the charges associated with the separate account products that offer this Fund. Such performance would have been lower if such charges were taken into account.
6 | OPPENHEIMER GLOBAL SECURITIES FUND/ VA
FUND EXPENSES
Fund Expenses. As a shareholder of the Fund, you incur two types of costs: (1) transaction costs, which may include redemption fees (if applicable); and (2) ongoing costs, including management fees; distribution and service fees; and other Fund expenses. These examples are intended to help you understand your ongoing costs (in dollars) of investing in the Fund and to compare these costs with the ongoing costs of investing in other mutual funds.
The examples are based on an investment of $1,000.00 invested at the beginning of the period and held for the entire 6-month period ended December 31, 2008.
Actual Expenses. The first section of the table provides information about actual account values and actual expenses. You may use the information in this section for the class of shares you hold, together with the amount you invested, to estimate the expense that you paid over the period. Simply divide your account value by $1,000.00 (for example, an $8,600.00 account value divided by $1,000.00 = 8.60), then multiply the result by the number in the first section under the heading entitled “Expenses Paid During Period” to estimate the expenses you paid on your account during this period.
Hypothetical Example for Comparison Purposes. The second section of the table provides information about hypothetical account values and hypothetical expenses based on the Fund’s actual expense ratio for each class of shares, and an assumed rate of return of 5% per year for each class before expenses, which is not the actual return. The hypothetical account values and expenses may not be used to estimate the actual ending account balance or expenses you paid for the period. You may use this information to compare the ongoing costs of investing in the Fund and other funds. To do so, compare this 5% hypothetical example for the class of shares you hold with the 5% hypothetical examples that appear in the shareholder reports of the other funds.
Please note that the expenses shown in the table are meant to highlight your ongoing costs only and do not reflect any charges associated with the separate accounts that offer this Fund. Therefore, the “hypothetical” lines of the table are useful in comparing ongoing costs only, and will not help you determine the relative total costs of owning different funds. In addition, if these separate account charges were included your costs would have been higher.
7 | OPPENHEIMER GLOBAL SECURITIES FUND/ VA
FUND EXPENSES
| | | | | | | | | | | | | |
| | | Beginning | | | Ending | | | Expenses | |
| | | Account | | | Account | | | Paid During | |
| | | Value | | | Value | | | 6 Months Ended | |
| | | July 1, 2008 | | | December 31, 2008 | | | December 31, 2008 | |
| Actual | | | | | | | | | |
| Non-Service Shares | | $ | 1,000.00 | | | $ | 690.50 | | | $ | 2.77 | |
| Service Shares | | | 1,000.00 | | | | 689.90 | | | | 3.83 | |
| Class 3 Shares | | | 1,000.00 | | | | 690.70 | | | | 2.81 | |
| Class 4 Shares | | | 1,000.00 | | | | 689.70 | | | | 3.88 | |
| | | | | | | | | | | | | |
Hypothetical
(5% return before expenses) | | | | | | | | | | | | |
| Non-Service Shares | | | 1,000.00 | | | | 1,021.87 | | | | 3.31 | |
| Service Shares | | | 1,000.00 | | | | 1,020.61 | | | | 4.58 | |
| Class 3 Shares | | | 1,000.00 | | | | 1,021.82 | | | | 3.36 | |
| Class 4 Shares | | | 1,000.00 | | | | 1,020.56 | | | | 4.63 | |
Expenses are equal to the Fund’s annualized expense ratio for that class, multiplied by the average account value over the period, multiplied by 184/366 (to reflect the one-half year period). Those annualized expense ratios, excluding indirect expenses from affiliated fund, based on the 6-month period ended December 31, 2008 are as follows:
| | | | | |
| Class | | Expense Ratios |
| Non-Service Shares | | | 0.65 | % |
| Service Shares | | | 0.90 | |
| Class 3 Shares | | | 0.66 | |
| Class 4 Shares | | | 0.91 | |
The expense ratios reflect reduction to custodian expenses and voluntary waivers or reimbursements of expenses by the Fund’s Manager that can be terminated at any time, without advance notice. The “Financial Highlights” tables in the Fund’s financial statements, included in this report, also show the gross expense ratios, without such waivers or reimbursements and reduction to custodian expenses, if applicable.
8 | OPPENHEIMER GLOBAL SECURITIES FUND/ VA
STATEMENT OF INVESTMENTS December 31, 2008
| | | | | | | | | |
| | | Shares | | | Value | |
Common Stocks—97.1% | | | | | | | | |
Consumer Discretionary—17.4% | | | | | | | | |
Automobiles—1.7% | | | | | | | | |
| Bayerische Motoren Werke (BMW) AG | | | 648,671 | | | $ | 20,368,555 | |
| Toyota Motor Corp. | | | 527,800 | | | | 17,263,056 | |
| | | | | | | | |
| | | | | | | | 37,631,611 | |
| | | | | | | | | |
Hotels, Restaurants & Leisure—3.4% | | | | | | | | |
| Aristocrat Leisure Ltd. | | | 467,500 | | | | 1,317,123 | |
| Carnival Corp. | | | 1,174,826 | | | | 28,571,768 | |
| International Game Technology | | | 483,500 | | | | 5,748,815 | |
| McDonald’s Corp. | | | 550,400 | | | | 34,229,376 | |
Shuffle Master, Inc.1 | | | 597,800 | | | | 2,965,088 | |
| | | | | | | | |
| | | | | | | | 72,832,170 | |
| | | | | | | | | |
Household Durables—1.4% | | | | | | | | |
| Sony Corp. | | | 1,416,700 | | | | 30,773,903 | |
Leisure Equipment & Products—0.3% | | | | | | | | |
| Sega Sammy Holdings, Inc. | | | 571,100 | | | | 6,621,788 | |
Media—3.2% | | | | | | | | |
Dish TV India Ltd.1 | | | 2,600,122 | | | | 1,078,804 | |
| Grupo Televisa SA, Sponsored GDR | | | 1,730,829 | | | | 25,858,585 | |
Sirius XM Radio, Inc.1 | | | 13,192,210 | | | | 1,583,065 | |
| Walt Disney Co. (The) | | | 1,336,900 | | | | 30,334,261 | |
Wire & Wireless India Ltd.1 | | | 2,382,450 | | | | 606,219 | |
| Zee Entertainment Enterprises Ltd. | | | 2,967,210 | | | | 8,615,954 | |
| | | | | | | | |
| | | | | | | | 68,076,888 | |
| | | | | | | | | |
Specialty Retail—4.3% | | | | | | | | |
| Hennes & Mauritz AB, Cl. B | | | 964,400 | | | | 38,070,800 | |
| Industria de Diseno Textil SA | | | 732,100 | | | | 32,514,613 | |
| Tiffany & Co. | | | 893,500 | | | | 21,113,405 | |
| | | | | | | | |
| | | | | | | | 91,698,818 | |
| | | | | | | | | |
Textiles, Apparel & Luxury Goods—3.1% | | | | | | | | |
| Bulgari SpA | | | 1,893,618 | | | | 11,879,338 | |
| Burberry Group plc | | | 1,539,768 | | | | 5,009,630 | |
| LVMH Moet Hennessey Louis Vuitton | | | 571,970 | | | | 38,612,317 | |
| Tod’s SpA | | | 290,697 | | | | 12,301,811 | |
| | | | | | | | |
| | | | | | | | 67,803,096 | |
| | | | | | | | | |
Consumer Staples—9.6% | | | | | | | | |
Beverages—2.4% | | | | | | | | |
| Diageo plc | | | 982,995 | | | | 13,871,323 | |
| Fomento Economico Mexicano SA de CV, UBD | | | 8,608,400 | | | | 25,966,321 | |
| Grupo Modelo SA de CV, Series C | | | 3,660,600 | | | | 11,735,257 | |
| | | | | | | | |
| | | | | | | | 51,572,901 | |
| | | | | | | | | |
Food & Staples Retailing—3.7% | | | | | | | | |
| Seven & I Holdings Co. Ltd. | | | 507,553 | | | | 17,375,210 | |
| Tesco plc | | | 4,725,005 | | | | 24,972,135 | |
| Wal-Mart Stores, Inc. | | | 694,700 | | | | 38,944,882 | |
| | | | | | | | |
| | | | | | | | 81,292,227 | |
| | | | | | | | | |
Food Products—0.9% | | | | | | | | |
| Cadbury plc | | | 2,153,921 | | | | 19,127,714 | |
Household Products—2.6% | | | | | | | | |
| Colgate-Palmolive Co. | | | 393,400 | | | | 26,963,636 | |
| Hindustan Unilever Ltd. | | | 1,019,691 | | | | 5,266,426 | |
| Reckitt Benckiser Group plc | | | 613,028 | | | | 23,167,602 | |
| | | | | | | | |
| | | | | | | | 55,397,664 | |
| | | | | | | | | |
Energy—4.7% | | | | | | | | |
Energy Equipment & Services—1.7% | | | | | | | | |
| Technip SA | | | 587,010 | | | | 18,069,717 | |
Transocean Ltd.1 | | | 406,672 | | | | 19,215,252 | |
| | | | | | | | |
| | | | | | | | 37,284,969 | |
| | | | | | | | | |
Oil, Gas & Consumable Fuels—3.0% | | | | | | | | |
| BP plc, ADR | | | 438,869 | | | | 20,512,737 | |
| Husky Energy, Inc. | | | 939,230 | | | | 23,830,057 | |
| Total SA | | | 369,620 | | | | 20,247,234 | |
| | | | | | | | |
| | | | | | | | 64,590,028 | |
| | | | | | | | | |
Financials—11.1% | | | | | | | | |
Capital Markets—1.6% | | | | | | | | |
| 3i Group plc | | | 1,105,480 | | | | 4,417,951 | |
| Credit Suisse Group AG | | | 1,088,645 | | | | 29,787,161 | |
| | | | | | | | |
| | | | | | | | 34,205,112 | |
| | | | | | | | | |
Commercial Banks—3.1% | | | | | | | | |
| HSBC Holdings plc | | | 2,619,887 | | | | 25,149,071 | |
| ICICI Bank Ltd., Sponsored ADR | | | 10,150 | | | | 195,388 | |
| Royal Bank of Scotland Group plc (The) | | | 7,593,923 | | | | 5,568,958 | |
| Societe Generale, Cl. A | | | 258,280 | | | | 13,143,831 | |
| Sumitomo Mitsui Financial Group, Inc. | | | 5,312 | | | | 23,917,054 | |
| | | | | | | | |
| | | | | | | | 67,974,302 | |
| | | | | | | | | |
Consumer Finance—0.9% | | | | | | | | |
SLM Corp.1 | | | 2,100,250 | | | | 18,692,225 | |
| | | | | | | | | |
Diversified Financial Services—1.4% | | | | | | | | |
| Citigroup, Inc. | | | 658,700 | | | | 4,419,877 | |
| CME Group, Inc. | | | 11,100 | | | | 2,310,021 | |
| Investor AB, B Shares | | | 1,556,354 | | | | 23,660,583 | |
| | | | | | | | |
| | | | | | | | 30,390,481 | |
F1 | OPPENHEIMER GLOBAL SECURITIES FUND/ VA
STATEMENT OF INVESTMENTS Continued
| | | | | | | | | |
| | | Shares | | | Value | |
Insurance—4.1% | | | | | | | | |
| AFLAC, Inc. | | | 564,500 | | | $ | 25,876,680 | |
| Allianz SE | | | 281,598 | | | | 30,307,706 | |
| Prudential plc | | | 2,840,787 | | | | 17,544,914 | |
| Sony Financial Holdings, Inc. | | | 2,410 | | | | 9,247,755 | |
| XL Capital Ltd., Cl. A | | | 1,502,100 | | | | 5,557,770 | |
| | | | | | | | |
| | | | | | | | 88,534,825 | |
| | | | | | | | | |
Health Care—7.4% | | | | | | | | |
Biotechnology—1.2% | | | | | | | | |
Acadia Pharmaceuticals, Inc.1 | | | 316,300 | | | | 284,670 | |
Basilea Pharmaceutica AG1 | | | 30,457 | | | | 4,290,031 | |
InterMune, Inc.1 | | | 302,300 | | | | 3,198,334 | |
NicOx SA1 | | | 229,530 | | | | 2,518,584 | |
Regeneron Pharmaceuticals, Inc.1 | | | 196,802 | | | | 3,613,285 | |
Seattle Genetics, Inc.1 | | | 579,228 | | | | 5,178,298 | |
Theravance, Inc.1 | | | 499,300 | | | | 6,186,327 | |
| | | | | | | | |
| | | | | | | | 25,269,529 | |
| | | | | | | | | |
Health Care Providers & Services—1.3% | | | | | | | | |
| Aetna, Inc. | | | 735,000 | | | | 20,947,500 | |
WellPoint, Inc.1 | | | 196,735 | | | | 8,288,446 | |
| | | | | | | | |
| | | | | | | | 29,235,946 | |
| | | | | | | | | |
Pharmaceuticals—4.9% | | | | | | | | |
| Roche Holding AG | | | 407,718 | | | | 62,652,637 | |
| Sanofi-Aventis SA | | | 347,185 | | | | 22,156,576 | |
| Shionogi & Co. Ltd. | | | 798,000 | | | | 20,480,784 | |
| | | | | | | | |
| | | | | | | | 105,289,997 | |
| | | | | | | | | |
Industrials—14.6% | | | | | | | | |
Aerospace & Defense—4.6% | | | | | | | | |
| Boeing Co. | | | 242,100 | | | | 10,330,407 | |
| Empresa Brasileira de Aeronautica SA, ADR | | | 871,383 | | | | 14,125,118 | |
| European Aeronautic Defense & Space Co. | | | 1,527,640 | | | | 25,914,509 | |
| Lockheed Martin Corp. | | | 184,200 | | | | 15,487,536 | |
| Northrop Grumman Corp. | | | 245,300 | | | | 11,048,312 | |
| Raytheon Co. | | | 440,200 | | | | 22,467,808 | |
| | | | | | | | |
| | | | | | | | 99,373,690 | |
| | | | | | | | | |
Air Freight & Logistics—0.8% | | | | | | | | |
| TNT NV | | | 910,400 | | | | 17,568,989 | |
Building Products—1.4% | | | | | | | | |
| Assa Abloy AB, Cl. B | | | 2,590,685 | | | | 29,696,111 | |
Commercial Services & Supplies—0.9% | | | | | | | | |
| Secom Co. Ltd. | | | 390,600 | | | | 20,103,748 | |
| | | | | | | | | |
Electrical Equipment—1.3% | | | | | | | | |
| Emerson Electric Co. | | | 480,500 | | | | 17,591,105 | |
| Mitsubishi Electric Corp. | | | 1,642,000 | | | | 10,267,217 | |
| | | | | | | | |
| | | | | | | | 27,858,322 | |
| | | | | | | | | |
Industrial Conglomerates—5.2% | | | | | | | | |
| 3M Co. | | | 499,400 | | | | 28,735,476 | |
| Koninklijke (Royal) Philips Electronics NV | | | 1,400,000 | | | | 27,358,848 | |
| Siemens AG | | | 748,055 | | | | 56,415,296 | |
| | | | | | | | |
| | | | | | | | 112,509,620 | |
| | | | | | | | | |
Machinery—0.4% | | | | | | | | |
| Fanuc Ltd. | | | 126,400 | | | | 8,982,511 | |
Information Technology—27.6% | | | | | | | | |
Communications Equipment—7.4% | | | | | | | | |
| Corning, Inc. | | | 1,959,900 | | | | 18,677,847 | |
Juniper Networks, Inc.1 | | | 2,363,200 | | | | 41,379,632 | |
| Tandberg ASA | | | 1,117,450 | | | | 12,398,509 | |
| Telefonaktiebolaget LM Ericsson, B Shares | | | 11,164,280 | | | | 86,501,253 | |
| | | | | | | | |
| | | | | | | | 158,957,241 | |
| | | | | | | | | |
Electronic Equipment & Instruments—3.6% | | | | | | | | |
| Hoya Corp. | | | 1,012,800 | | | | 17,580,622 | |
| Keyence Corp. | | | 95,840 | | | | 19,608,685 | |
| Kyocera Corp. | | | 157,600 | | | | 11,360,485 | |
| Murata Manufacturing Co. Ltd. | | | 597,500 | | | | 23,403,833 | |
| Nidec Corp. | | | 166,800 | | | | 6,481,465 | |
| | | | | | | | |
| | | | | | | | 78,435,090 | |
| | | | | | | | | |
Internet Software & Services—1.4% | | | | | | | | |
eBay, Inc.1 | | | 2,218,900 | | | | 30,975,844 | |
IT Services—3.0% | | | | | | | | |
| Automatic Data Processing, Inc. | | | 933,200 | | | | 36,712,088 | |
| Infosys Technologies Ltd. | | | 1,237,326 | | | | 28,665,476 | |
| | | | | | | | |
| | | | | | | | 65,377,564 | |
| | | | | | | | | |
Semiconductors & Semiconductor Equipment—4.8% | | | | | | | | |
| Altera Corp. | | | 1,347,500 | | | | 22,516,725 | |
Cree, Inc.1 | | | 588,595 | | | | 9,341,003 | |
| Linear Technology Corp. | | | 541,496 | | | | 11,977,892 | |
| Maxim Integrated Products, Inc. | | | 1,319,465 | | | | 15,068,290 | |
| MediaTek, Inc. | | | 2,652,238 | | | | 17,912,620 | |
| Taiwan Semiconductor Manufacturing Co. Ltd. | | | 12,511,942 | | | | 17,121,822 | |
| Taiwan Semiconductor Manufacturing Co. Ltd., ADR | | | 1,103,573 | | | | 8,718,227 | |
| | | | | | | | |
| | | | | | | | 102,656,579 | |
F2 | OPPENHEIMER GLOBAL SECURITIES FUND/ VA
| | | | | | | | | |
| | | Shares | | | Value | |
Software—7.4% | | | | | | | | |
Adobe Systems, Inc. 1 | | | 1,294,163 | | | $ | 27,552,730 | |
Intuit,Inc.1 | | | 1,543,000 | | | | 36,707,970 | |
| Microsoft Corp. | | | 1,965,300 | | | | 38,205,432 | |
| Nintendo Co. Ltd. | | | 50,000 | | | | 19,194,922 | |
| SAP AG | | | 1,067,019 | | | | 38,127,142 | |
| | | | | | | | |
| | | | | | | | 159,788,196 | |
| | | | | | | | | |
Telecommunication Services—3.8% | | | | | | | | |
Wireless Telecommunication Services—3.8% | | | | | | | | |
| KDDI Corp. | | | 5,916 | | | | 42,103,537 | |
| SK Telecom Co. Ltd., ADR | | | 612,660 | | | | 11,138,159 | |
| Turkcell Iletisim Hizmetleri AS, ADR | | | 516,000 | | | | 7,523,280 | |
| Vodafone Group plc | | | 10,793,252 | | | | 22,041,622 | |
| | | | | | | | |
| | | | | | | | 82,806,598 | |
| | | | | | | | | |
Utilities—0.9% | | | | | | | | |
Electric Utilities—0.9% | | | | | | | | |
| Fortum Oyj | | | 928,500 | | | | 20,039,033 | |
| | | | | | | | |
Total Common Stocks
(Cost $2,527,078,435) | | | | | | | 2,099,425,330 | |
| | | | | | | | | |
Preferred Stocks—1.6% | | | | | | | | |
| Bayerische Motoren Werke (BMW) AG, Preference | | | 228,797 | | | | 4,581,285 | |
| Companhia de Bebidas das Americas, ADR, Preference | | | 368,415 | | | | 16,324,469 | |
| Porsche Automobil Holding, Preference | | | 137,289 | | | | 10,930,839 | |
| Schering-Plough Corp., 6% Cv. | | | 8,750 | | | | 1,526,875 | |
| | | | | | | | |
Total Preferred Stocks
(Cost $21,345,146) | | | | | | | 33,363,468 | |
| |
| | | Principal | | | | | |
| | | Amount | | | | | |
Convertible Corporate Bonds and Notes—0.1% | | | | | | | | |
Theravance, Inc., 3% Cv. Sub.
Nts.,1/15/15 (Cost $2,882,000) | | $ | 2,882,000 | | | | 1,779,635 | |
| |
| | | Units | | | | | |
Rights, Warrants and Certificates—0.0% | | | | | | | | |
Dish TV India Ltd. Rts., Strike Price 22INR, Exp.1/9/091,2 (Cost $0) | | | 3,008,933 | | | | 25,128 | |
| |
| | | Shares | | | | | |
Investment Company—1.1% | | | | | | | | |
| Oppenheimer Institutional | | | | | | | | |
Money Market Fund, Cl. E, 1.96%3,4
(Cost $24,247,807) | | | 24,247,807 | | | | 24,247,807 | |
| |
Total Investments, at Value
(Cost $2,575,553,388) | | | 99.9 | % | | $ | 2,158,841,368 | |
Other Assets Net of Liabilities | | | 0.1 | | | | 2,448,349 | |
| | | |
Net Assets | | | 100.0 | % | | $ | 2,161,289,717 | |
| | | |
Industry classifications are unaudited.
Strike price is reported in the following currency:
INR Indian Rupee
Footnotes to Statement of Investments
| | |
| 1. | | Non-income producing security. |
| |
| 2. | | Illiquid security. The aggregate value of illiquid securities as of December 31, 2008 was $25,128, which represents less than 0.005% of the Fund’s net assets. See Note 6 of accompanying Notes. |
| |
| 3. | | Is or was an affiliate, as defined in the Investment Company Act of 1940, at or during the period ended December 31, 2008, by virtue of the Fund owning at least 5% of the voting securities of the issuer or as a result of the Fund and the issuer having the same investment adviser. Transactions during the period in which the issuer was an affiliate are as follows: |
| | | | | | | | | | | | | | | | | |
| | | Shares | | | | | | | | | | | Shares | |
| | | December 31, | | | Gross | | | Gross | | | December 31, | |
| | | 2007 | | | Additions | | | Reductions | | | 2008 | |
| OFI Liquid Assets Fund, LLC | | | — | | | | 129,524,610 | | | | 129,524,610 | | | | — | |
| Oppenheimer Institutional Money Market Fund, Cl.E | | | 68,796,760 | | | | 564,819,419 | | | | 609,368,372 | | | | 24,247,807 | |
| | | | | | | | | |
| | | Value | | | Income | |
| OFI Liquid Assets Fund, LLC | | $ | — | | | $ | 161,932 | a |
| Oppenheimer Institutional Money Market Fund, Cl. E | | | 24,247,807 | | | | 1,607,885 | |
| | | |
| | | $ | 24,247,807 | | | $ | 1,769,817 | |
| | | |
| | |
| |
| a. | | Net of compensation to the securities lending agent and rebates paid to the borrowing counterparties. |
| |
| 4. | | Rate shown is the 7-day yield as of December 31, 2008. |
Valuation Inputs
Various data inputs are used in determining the value of each of the Fund’s investments as of the reporting period end. These data inputs are categorized in the following hierarchy under applicable financial accounting standards:
1) Level 1-quoted prices in active markets for identical assets or liabilities (including securities actively traded on a securities exchange)
2) Level 2-inputs other than quoted prices that are observable for the asset (such as quoted prices for similar assets and market corroborated inputs such as interest rates, prepayment speeds, credit risks, etc.)
3) Level 3-unobservable inputs (including the Manager’s own judgments about assumptions that market participants would use in pricing the asset).
The market value of the Fund’s investments was determined based on the following inputs as of December 31, 2008:
| | �� | | | | | | | |
| | | Investments | | | Other Financial | |
| Valuation Description | | in Securities | | | Instruments* | |
| Level 1—Quoted Prices | | $ | 899,174,483 | | | $ | — | |
| Level 2—Other Significant Observable Inputs | | | 1,259,666,885 | | | | (531 | ) |
| Level 3—Significant Unobservable Inputs | | | — | | | | — | |
| | | | | | | |
| Total | | $ | 2,158,841,368 | | | $ | (531 | ) |
| | | | | | | |
| | |
| * | | Other financial instruments include options written, currency contracts, futures, forwards and swap contracts. Currency contracts and forwards are reported at their |
F3 | OPPENHEIMER GLOBAL SECURITIES FUND/ VA
STATEMENT OF INVESTMENTS Continued
Footnotes to Statement of Investments Continued
unrealized appreciation/depreciation at measurement date, which represents the change in the contract’s value from trade date. Futures are reported at their variation margin at measurement date, which represents the amount due to/from the Fund at that date. Options written and swaps are reported at their market value at measurement date.
See the accompanying Notes for further discussion of the methods used in determining value of the Fund’s investments, and a summary of changes to the valuation techniques, if any, during the reporting period.
Foreign Currency Exchange Contracts as of December 31, 2008 are as follows:
| | | | | | | | | | | | | | | | | | | | | | | | | |
| | | | | | | Contract Amount | | | Expiration | | | | | | | Unrealized | | | Unrealized | |
| Contract Description | | Buy | | | (000s) | | | | Dates | | | Value | | | Appreciation | | | Depreciation | |
| Euro (EUR) | | Buy | | 334 | EUR | | | 1/2/09-1/5/09 | | | $ | 466,061 | | | $ | — | | | $ | 3,683 | |
| Norwegian Krone (NOK) | | Buy | | 502 | NOK | | | 1/5/09 | | | | 72,229 | | | | 1,891 | | | | — | |
| Swedish Krona (SEK) | | Buy | | 8,679 | SEK | | | 1/5/09 | | | | 1,108,585 | | | | 4,748 | | | | — | |
| Swiss Franc (CHF) | | Buy | | 646 | CHF | | | 1/5/09 | | | | 605,990 | | | | — | | | | 3,487 | |
| | | | | | | | | | | | | | | | | | | |
| Total unrealized appreciation and depreciation | | | | | | | | | | | | | | | | | | $ | 6,639 | | | $ | 7,170 | |
| | | | | | | | | | | | | | | | | | | |
Distribution of investments representing geographic holdings, as a percentage of total investments at value, is as follows:
| | | | | | | | | |
| Geographic Holdings (Unaudited) | | Value | | | Percent | |
| United States | | $ | 730,995,625 | | | | 33.9 | % |
| Japan | | | 304,766,575 | | | | 14.1 | |
| United Kingdom | | | 181,383,657 | | | | 8.4 | |
| Sweden | | | 177,928,747 | | | | 8.2 | |
| Germany | | | 160,730,823 | | | | 7.4 | |
| France | | | 140,662,768 | | | | 6.5 | |
| Switzerland | | | 96,729,829 | | | | 4.5 | |
| Mexico | | | 63,560,163 | | | | 2.9 | |
| The Netherlands | | | 44,927,837 | | | | 2.1 | |
| India | | | 44,453,395 | | | | 2.1 | |
| Taiwan | | | 43,752,669 | | | | 2.0 | |
| Spain | | | 32,514,613 | | | | 1.5 | |
| Brazil | | | 30,449,587 | | | | 1.4 | |
| Italy | | | 24,181,149 | | | | 1.1 | |
| Canada | | | 23,830,057 | | | | 1.1 | |
| Finland | | | 20,039,033 | | | | 0.9 | |
| Norway | | | 12,398,509 | | | | 0.6 | |
| Korea, Republic of South | | | 11,138,159 | | | | 0.5 | |
| Turkey | | | 7,523,280 | | | | 0.4 | |
| Cayman Islands | | | 5,557,770 | | | | 0.3 | |
| Australia | | | 1,317,123 | | | | 0.1 | |
| | | |
| Total | | $ | 2,158,841,368 | | | | 100.0 | % |
| | | |
See accompanying Notes to Financial Statements.
F4 | OPPENHEIMER GLOBAL SECURITIES FUND/ VA
STATEMENT OF ASSETS AND LIABILITIES December 31, 2008
| | | | | |
Assets | | | | |
| Investments, at value—see accompanying statement of investments: | | | | |
| Unaffiliated companies (cost $2,551,305,581) | | $ | 2,134,593,561 | |
| Affiliated companies (cost $24,247,807) | | | 24,247,807 | |
| | | | |
| | | | 2,158,841,368 | |
| Cash | | | 499,266 | |
| Cash—foreign currencies (cost $411) | | | 411 | |
| Unrealized appreciation on foreign currency exchange contracts | | | 6,639 | |
| Receivables and other assets: | | | | |
| Interest and dividends | | | 3,318,367 | |
| Shares of beneficial interest sold | | | 2,475,317 | |
| Investments sold | | | 222,298 | |
| Due from Manager | | | 66 | |
| Other | | | 214,484 | |
| | | | |
| Total assets | | | 2,165,578,216 | |
| | | | | |
Liabilities | | | | |
| Unrealized depreciation on foreign currency exchange contracts | | | 7,170 | |
| Payables and other liabilities: | | | | |
| Investments purchased | | | 2,253,058 | |
| Shares of beneficial interest redeemed | | | 1,202,221 | |
| Distribution and service plan fees | | | 507,549 | |
| Shareholder communications | | | 134,570 | |
| Trustees’ compensation | | | 25,732 | |
| Transfer and shareholder servicing agent fees | | | 3,440 | |
| Other | | | 154,759 | |
| | | | |
| Total liabilities | | | 4,288,499 | |
| | | | | |
Net Assets | | $ | 2,161,289,717 | |
| | | | |
| | | | | |
Composition of Net Assets | | | | |
| Par value of shares of beneficial interest | | $ | 107,267 | |
| Additional paid-in capital | | | 2,525,706,042 | |
| Accumulated net investment income | | | 47,532,805 | |
| Accumulated net realized gain on investments and foreign currency transactions | | | 4,517,239 | |
| Net unrealized depreciation on investments and translation of assets and liabilities denominated in foreign currencies | | | (416,573,636 | ) |
| | | | |
Net Assets | | $ | 2,161,289,717 | |
| | | | |
F5 | OPPENHEIMER GLOBAL SECURITIES FUND/ VA
STATEMENT OF ASSETS AND LIABILITIES Continued
| | | | | |
Net Asset Value Per Share | | | | |
| Non-Service Shares: | | | | |
| Net asset value, redemption price per share and offering price per share (based on net assets of $1,150,113,178 and 56,896,358 shares of beneficial interest outstanding) | | $ | 20.21 | |
| Service Shares: | | | | |
| Net asset value, redemption price per share and offering price per share (based on net assets of $772,106,849 and 38,571,163 shares of beneficial interest outstanding) | | $ | 20.02 | |
| Class 3 Shares: | | | | |
| Net asset value, redemption price per share and offering price per share (based on net assets of $175,971,338 and 8,650,393 shares of beneficial interest outstanding) | | $ | 20.34 | |
| Class 4 Shares: | | | | |
| Net asset value, redemption price per share and offering price per share (based on net assets of $63,098,352 and 3,149,441 shares of beneficial interest outstanding) | | $ | 20.03 | |
See accompanying Notes to Financial Statements.
F6 | OPPENHEIMER GLOBAL SECURITIES FUND/ VA
STATEMENT OF OPERATIONS For the Year Ended December 31, 2008
| | | | | |
Investment Income | | | | |
| Dividends: | | | | |
| Unaffiliated companies (net of foreign withholding taxes of $3,750,833) | | $ | 76,486,584 | |
| Affiliated companies | | | 1,607,885 | |
| Income from investment of securities lending cash collateral, net: | | | | |
| Unaffiliated companies | | | 2,062,471 | |
| Affiliated companies | | | 161,932 | |
| Interest | | | 121,992 | |
| | | | |
| Total investment income | | | 80,440,864 | |
| | | | | |
Expenses | | | | |
| Management fees | | | 19,436,828 | |
| Distribution and service plan fees: | | | | |
| Service shares | | | 2,631,693 | |
| Class 4 shares | | | 234,211 | |
| Transfer and shareholder servicing agent fees: | | | | |
| Non-Service shares | | | 9,994 | |
| Service shares | | | 9,994 | |
| Class 3 shares | | | 9,994 | |
| Class 4 shares | | | 9,994 | |
| Shareholder communications: | | | | |
| Non-Service shares | | | 79,228 | |
| Service shares | | | 49,587 | |
| Class 3 shares | | | 12,706 | |
| Class 4 shares | | | 4,408 | |
| Custodian fees and expenses | | | 345,880 | |
| Trustees’ compensation | | | 63,901 | |
| Other | | | 129,120 | |
| | | | |
| Total expenses | | | 23,027,538 | |
| Less reduction to custodian expenses | | | (1,915 | ) |
| Less waivers and reimbursements of expenses | | | (50,784 | ) |
| | | | |
| Net expenses | | | 22,974,839 | |
| | | | | |
Net Investment Income | | | 57,466,025 | |
| | | | | |
Realized and Unrealized Gain (Loss) | | | | |
| Net realized gain on: | | | | |
| Investments from unaffiliated companies | | | 10,488,755 | |
| Foreign currency transactions | | | 14,259,003 | |
| | | | |
| Net realized gain | | | 24,747,758 | |
| Net change in unrealized depreciation on: | | | | |
| Investments | | | (1,514,074,821 | ) |
| Translation of assets and liabilities denominated in foreign currencies | | | (82,199,935 | ) |
| | | | |
| Net change in unrealized depreciation | | | (1,596,274,756 | ) |
| |
Net Decrease in Net Assets Resulting from Operations | | $ | (1,514,060,973 | ) |
| | | | |
See accompanying Notes to Financial Statements.
F7 | OPPENHEIMER GLOBAL SECURITIES FUND/ VA
STATEMENTS OF CHANGES IN NET ASSETS
| | | | | | | | | |
| Year Ended December 31, | | 2008 | | | 2007 | |
Operations | | | | | | | | |
| Net investment income | | $ | 57,466,025 | | | $ | 44,674,647 | |
| Net realized gain | | | 24,747,758 | | | | 240,399,758 | |
| Net change in unrealized appreciation (depreciation) | | | (1,596,274,756 | ) | | | (48,606,722 | ) |
| | | |
| Net increase (decrease) in net assets resulting from operations | | | (1,514,060,973 | ) | | | 236,467,683 | |
| | | | | | | | | |
Dividends and/or Distributions to Shareholders | | | | | | | | |
| Dividends from net investment income: | | | | | | | | |
| Non-Service shares | | | (26,708,494 | ) | | | (30,881,671 | ) |
| Service shares | | | (13,401,398 | ) | | | (12,491,101 | ) |
| Class 3 shares | | | (4,326,225 | ) | | | (5,291,097 | ) |
| Class 4 shares | | | (1,190,079 | ) | | | (1,330,580 | ) |
| | | |
| | | | (45,626,196 | ) | | | (49,994,449 | ) |
| Distributions from net realized gain: | | | | | | | | |
| Non-Service shares | | | (117,354,093 | ) | | | (112,256,514 | ) |
| Service shares | | | (71,861,924 | ) | | | (52,238,025 | ) |
| Class 3 shares | | | (19,045,871 | ) | | | (19,263,594 | ) |
| Class 4 shares | | | (6,614,741 | ) | | | (5,788,329 | ) |
| | | |
| | | | (214,876,629 | ) | | | (189,546,462 | ) |
| | | | | | | | | |
Beneficial Interest Transactions | | | | | | | | |
| Net increase (decrease) in net assets resulting from beneficial interest transactions: | | | | | | | | |
| Non-Service shares | | | (78,197,928 | ) | | | (104,231,544 | ) |
| Service shares | | | 71,375,736 | | | | 321,202,694 | |
| Class 3 shares | | | (30,841,100 | ) | | | (34,573,579 | ) |
| Class 4 shares | | | (6,272,856 | ) | | | 9,459,510 | |
| | | |
| | | | (43,936,148 | ) | | | 191,857,081 | |
| | | | | | | | | |
Net Assets | | | | | | | | |
| Total increase (decrease) | | | (1,818,499,946 | ) | | | 188,783,853 | |
| Beginning of period | | | 3,979,789,663 | | | | 3,791,005,810 | |
| | | |
| End of period (including accumulated net investment income of $47,532,805 and $31,615,758, respectively) | | $ | 2,161,289,717 | | | $ | 3,979,789,663 | |
| | | |
See accompanying Notes to Financial Statements.
F8 | OPPENHEIMER GLOBAL SECURITIES FUND/ VA
FINANCIAL HIGHLIGHTS
| | | | | | | | | | | | | | | | | | | | | |
| Non-Service Shares Year Ended December 31, | | 2008 | | | 2007 | | | 2006 | | | 2005 | | | 2004 | |
| |
Per Share Operating Data | | | | | | | | | | | | | | | | | | | | |
| Net asset value, beginning of period | | $ | 36.60 | | | $ | 36.79 | | | $ | 33.38 | | | $ | 29.51 | | | $ | 25.08 | |
| Income (loss) from investment operations: | | | | | | | | | | | | | | | | | | | | |
Net investment income1 | | | .55 | | | | .45 | | | | .43 | | | | .32 | | | | .26 | |
| Net realized and unrealized gain (loss) | | | (14.46 | ) | | | 1.69 | | | | 5.20 | | | | 3.85 | | | | 4.49 | |
| | | |
| Total from investment operations | | | (13.91 | ) | | | 2.14 | | | | 5.63 | | | | 4.17 | | | | 4.75 | |
| Dividends and/or distributions to shareholders: | | | | | | | | | | | | | | | | | | | | |
| Dividends from net investment income | | | (.46 | ) | | | (.50 | ) | | | (.36 | ) | | | (.30 | ) | | | (.32 | ) |
| Distributions from net realized gain | | | (2.02 | ) | | | (1.83 | ) | | | (1.86 | ) | | | — | | | | — | |
| | | |
| Total dividends and/or distributions to shareholders | | | (2.48 | ) | | | (2.33 | ) | | | (2.22 | ) | | | (.30 | ) | | | (.32 | ) |
| Net asset value, end of period | | $ | 20.21 | | | $ | 36.60 | | | $ | 36.79 | | | $ | 33.38 | | | $ | 29.51 | |
| | | |
| | | | | | | | | | | | | | | | | | | | | |
Total Return, at Net Asset Value2 | | | (40.19 | )% | | | 6.32 | % | | | 17.69 | % | | | 14.31 | % | | | 19.16 | % |
| | | | | | | | | | | | | | | | | | | | | |
Ratios/Supplemental Data | | | | | | | | | | | | | | | | | | | | |
| Net assets, end of period (in thousands) | | $ | 1,150,113 | | | $ | 2,193,638 | | | $ | 2,297,315 | | | $ | 2,124,413 | | | $ | 2,518,867 | |
| Average net assets (in thousands) | | $ | 1,679,720 | | | $ | 2,302,726 | | | $ | 2,189,511 | | | $ | 2,123,523 | | | $ | 2,451,188 | |
Ratios to average net assets:3 | | | | | | | | | | | | | | | | | | | | |
| Net investment income | | | 1.95 | % | | | 1.21 | % | | | 1.27 | % | | | 1.08 | % | | | 1.01 | % |
| Total expenses | | | 0.65 | %4,5,6 | | | 0.65 | %4,5,6 | | | 0.66 | %4,5,6 | | | 0.67 | %5 | | | 0.66 | %5 |
| Portfolio turnover rate | | | 19 | % | | | 18 | % | | | 21 | % | | | 35 | % | | | 30 | % |
| | |
| 1. | | Per share amounts calculated based on the average shares outstanding during the period. |
| |
| 2. | | Assumes an investment on the business day before the first day of the fiscal period, with all dividends and distributions reinvested in additional shares on the reinvestment date, and redemption at the net asset value calculated on the last business day of the fiscal period. Total returns are not annualized for periods less than one full year. Total return information does not reflect expenses that apply at the separate account level or to related insurance products. Inclusion of these charges would reduce the total return figures for all periods shown. Returns do not reflect the deduction of taxes that a shareholder would pay on fund distributions or the redemption of fund shares. |
| |
| 3. | | Annualized for periods less than one full year. |
| |
| 4. | | Total expenses including indirect expenses from affiliated fund were as follows: |
| | | | | |
| Year Ended December 31, 2008 | | | 0.65 | % |
| Year Ended December 31, 2007 | | | 0.65 | % |
| Year Ended December 31, 2006 | | | 0.66 | % |
| | |
| 5. | | Reduction to custodian expenses less than 0.005%. |
| |
| 6. | | Waiver or reimbursement of indirect management fees less than 0.005%. |
See accompanying Notes to Financial Statements.
F9 | OPPENHEIMER GLOBAL SECURITIES FUND/ VA
FINANCIAL HIGHLIGHTS Continued
| | | | | | | | | | | | | | | | | | | | | |
| Service Shares Year Ended December 31, | | 2008 | | | 2007 | | | 2006 | | | 2005 | | | 2004 | |
| |
Per Share Operating Data | | | | | | | | | | | | | | | | | | | | |
| Net asset value, beginning of period | | $ | 36.27 | | | $ | 36.49 | | | $ | 33.16 | | | $ | 29.33 | | | $ | 24.96 | |
| Income (loss) from investment operations: | | | | | | | | | | | | | | | | | | | | |
Net investment income1 | | | .47 | | | | .33 | | | | .33 | | | | .24 | | | | .20 | |
| Net realized and unrealized gain (loss) | | | (14.32 | ) | | | 1.72 | | | | 5.16 | | | | 3.84 | | | | 4.46 | |
| | | |
| Total from investment operations | | | (13.85 | ) | | | 2.05 | | | | 5.49 | | | | 4.08 | | | | 4.66 | |
| Dividends and/or distributions to shareholders: | | | | | | | | | | | | | | | | | | | | |
| Dividends from net investment income | | | (.38 | ) | | | (.44 | ) | | | (.30 | ) | | | (.25 | ) | | | (.29 | ) |
| Distributions from net realized gain | | | (2.02 | ) | | | (1.83 | ) | | | (1.86 | ) | | | — | | | | — | |
| | | |
| Total dividends and/or distributions to shareholders | | | (2.40 | ) | | | (2.27 | ) | | | (2.16 | ) | | | (.25 | ) | | | (.29 | ) |
| Net asset value, end of period | | $ | 20.02 | | | $ | 36.27 | | | $ | 36.49 | | | $ | 33.16 | | | $ | 29.33 | |
| | | |
| | | | | | | | | | | | | | | | | | | | | |
Total Return, at Net Asset Value2 | | | (40.33 | )% | | | 6.08 | % | | | 17.36 | % | | | 14.06 | % | | | 18.88 | % |
| | | | | | | | | | | | | | | | | | | | | |
Ratios/Supplemental Data | | | | | | | | | | | | | | | | | | | | |
| Net assets, end of period (in thousands) | | $ | 772,107 | | | $ | 1,300,989 | | | $ | 983,558 | | | $ | 557,284 | | | $ | 346,403 | |
| Average net assets (in thousands) | | $ | 1,051,239 | | | $ | 1,180,656 | | | $ | 750,499 | | | $ | 413,849 | | | $ | 247,490 | |
Ratios to average net assets:3 | | | | | | | | | | | | | | | | | | | | |
| Net investment income | | | 1.70 | % | | | 0.91 | % | | | 0.98 | % | | | 0.79 | % | | | 0.77 | % |
| Total expenses | | | 0.90 | %4,5,6 | | | 0.89 | %4,5,6 | | | 0.91 | %4,5,6 | | | 0.92 | %5 | | | 0.91 | %5 |
| Portfolio turnover rate | | | 19 | % | | | 18 | % | | | 21 | % | | | 35 | % | | | 30 | % |
| | |
| 1. | | Per share amounts calculated based on the average shares outstanding during the period. |
| |
| 2. | | Assumes an investment on the business day before the first day of the fiscal period, with all dividends and distributions reinvested in additional shares on the reinvestment date, and redemption at the net asset value calculated on the last business day of the fiscal period. Total returns are not annualized for periods less than one full year. Total return information does not reflect expenses that apply at the separate account level or to related insurance products. Inclusion of these charges would reduce the total return figures for all periods shown. Returns do not reflect the deduction of taxes that a shareholder would pay on fund distributions or the redemption of fund shares. |
| |
| 3. | | Annualized for periods less than one full year. |
| |
| 4. | | Total expenses including indirect expenses from affiliated fund were as follows: |
| | | | | |
| Year Ended December 31, 2008 | | | 0.90 | % |
| Year Ended December 31, 2007 | | | 0.89 | % |
| Year Ended December 31, 2006 | | | 0.91 | % |
| | |
| 5. | | Reduction to custodian expenses less than 0.005%. |
| |
| 6. | | Waiver or reimbursement of indirect management fees less than 0.005%. |
See accompanying Notes to Financial Statements.
F10 | OPPENHEIMER GLOBAL SECURITIES FUND/ VA
| | | | | | | | | | | | | | | | | | | | | |
| Class 3 Shares Year Ended December 31, | | 2008 | | | 2007 | | | 2006 | | | 2005 | | | 2004 | |
| |
Per Share Operating Data | | | | | | | | | | | | | | | | | | | | |
| Net asset value, beginning of period | | $ | 36.82 | | | $ | 36.99 | | | $ | 33.55 | | | $ | 29.65 | | | $ | 25.19 | |
| Income (loss) from investment operations: | | | | | | | | | | | | | | | | | | | | |
Net investment income1 | | | .56 | | | | .45 | | | | .43 | | | | .32 | | | | .26 | |
| Net realized and unrealized gain (loss) | | | (14.56 | ) | | | 1.71 | | | | 5.23 | | | | 3.88 | | | | 4.52 | |
| | | |
| Total from investment operations | | | (14.00 | ) | | | 2.16 | | | | 5.66 | | | | 4.20 | | | | 4.78 | |
| Dividends and/or distributions to shareholders: | | | | | | | | | | | | | | | | | | | | |
| Dividends from net investment income | | | (.46 | ) | | | (.50 | ) | | | (.36 | ) | | | (.30 | ) | | | (.32 | ) |
| Distributions from net realized gain | | | (2.02 | ) | | | (1.83 | ) | | | (1.86 | ) | | | — | | | | — | |
| | | |
| Total dividends and/or distributions to shareholders | | | (2.48 | ) | | | (2.33 | ) | | | (2.22 | ) | | | (.30 | ) | | | (.32 | ) |
| Net asset value, end of period | | $ | 20.34 | | | $ | 36.82 | | | $ | 36.99 | | | $ | 33.55 | | | $ | 29.65 | |
| | | |
| | | | | | | | | | | | | | | | | | | | | |
Total Return, at Net Asset Value2 | | | (40.19 | )% | | | 6.34 | % | | | 17.69 | % | | | 14.34 | % | | | 19.19 | % |
| | | | | | | | | | | | | | | | | | | | | |
Ratios/Supplemental Data | | | | | | | | | | | | | | | | | | | | |
| Net assets, end of period (in thousands) | | $ | 175,971 | | | $ | 361,621 | | | $ | 395,901 | | | $ | 346,064 | | | $ | 265,044 | |
| Average net assets (in thousands) | | $ | 269,650 | | | $ | 391,270 | | | $ | 369,406 | | | $ | 296,252 | | | $ | 199,388 | |
Ratios to average net assets:3 | | | | | | | | | | | | | | | | | | | | |
| Net investment income | | | 1.95 | % | | | 1.22 | % | | | 1.26 | % | | | 1.06 | % | | | 1.00 | % |
| Total expenses | | | 0.65 | %4,5,6 | | | 0.65 | %4,5,6 | | | 0.66 | %4,5,6 | | | 0.67 | %5 | | | 0.66 | %5 |
| Portfolio turnover rate | | | 19 | % | | | 18 | % | | | 21 | % | | | 35 | % | | | 30 | % |
| | |
| 1. | | Per share amounts calculated based on the average shares outstanding during the period. |
| |
| 2. | | Assumes an investment on the business day before the first day of the fiscal period, with all dividends and distributions reinvested in additional shares on the reinvestment date, and redemption at the net asset value calculated on the last business day of the fiscal period. Total returns are not annualized for periods less than one full year. Total return information does not reflect expenses that apply at the separate account level or to related insurance products. Inclusion of these charges would reduce the total return figures for all periods shown. Returns do not reflect the deduction of taxes that a shareholder would pay on fund distributions or the redemption of fund shares. |
| |
| 3. | | Annualized for periods less than one full year. |
| |
| 4. | | Total expenses including indirect expenses from affiliated fund were as follows: |
| | | | | |
| Year Ended December 31, 2008 | | | 0.65 | % |
| Year Ended December 31, 2007 | | | 0.65 | % |
| Year Ended December 31, 2006 | | | 0.66 | % |
| | |
| 5. | | Reduction to custodian expenses less than 0.005%. |
| |
| 6. | | Waiver or reimbursement of indirect management fees less than 0.005%. |
See accompanying Notes to Financial Statements.
F11 | OPPENHEIMER GLOBAL SECURITIES FUND/ VA
FINANCIAL HIGHLIGHTS Continued
| | | | | | | | | | | | | | | | | | | | | |
| Class 4 Shares Year Ended December 31, | | 2008 | | | 2007 | | 2006 | | 2005 | | 20041 |
| |
Per Share Operating Data | | | | | | | | | | | | | | | | | | | | |
| Net asset value, beginning of period | | $ | 36.28 | | | $ | 36.49 | | | $ | 33.15 | | | $ | 29.35 | | | $ | 25.21 | |
| Income (loss) from investment operations: | | | | | | | | | | | | | | | | | | | | |
Net investment income2 | | | .47 | | | | .34 | | | | .34 | | | | .24 | | | | .09 | |
| Net realized and unrealized gain (loss) | | | (14.34 | ) | | | 1.70 | | | | 5.16 | | | | 3.84 | | | | 4.05 | |
| | | |
| Total from investment operations | | | (13.87 | ) | | | 2.04 | | | | 5.50 | | | | 4.08 | | | | 4.14 | |
| Dividends and/or distributions to shareholders: | | | | | | | | | | | | | | | | | | | | |
| Dividends from net investment income | | | (.36 | ) | | | (.42 | ) | | | (.30 | ) | | | (.28 | ) | | | — | |
| Distributions from net realized gain | | | (2.02 | ) | | | (1.83 | ) | | | (1.86 | ) | | | — | | | | — | |
| | | |
| Total dividends and/or distributions to shareholders | | | (2.38 | ) | | | (2.25 | ) | | | (2.16 | ) | | | (.28 | ) | | | — | |
| Net asset value, end of period | | $ | 20.03 | | | $ | 36.28 | | | $ | 36.49 | | | $ | 33.15 | | | $ | 29.35 | |
| | | |
| | | | | | | | | | | | | | | | | | | | | |
Total Return, at Net Asset Value3 | | | (40.35 | )% | | | 6.06 | % | | | 17.40 | % | | | 14.05 | % | | | 16.42 | % |
| | | | | | | | | | | | | | | | | | | | | |
Ratios/Supplemental Data | | | | | | | | | | | | | | | | | | | | |
| Net assets, end of period (in thousands) | | $ | 63,099 | | | $ | 123,542 | | | $ | 114,232 | | | $ | 90,604 | | | $ | 37,384 | |
| Average net assets (in thousands) | | $ | 93,909 | | | $ | 122,385 | | | $ | 100,973 | | | $ | 61,380 | | | $ | 19,774 | |
Ratios to average net assets:4 | | | | | | | | | | | | | | | | | | | | |
| Net investment income | | | 1.69 | % | | | 0.93 | % | | | 1.00 | % | | | 0.79 | % | | | 0.53 | % |
| Total expenses | | | 0.91 | %5,6,7 | | | 0.90 | %5,6,7 | | | 0.91 | %5,6,7 | | | 0.93 | %6 | | | 0.94 | %6 |
| Portfolio turnover rate | | | 19 | % | | | 18 | % | | | 21 | % | | | 35 | % | | | 30 | % |
| | |
| 1. | | For the period from May 3, 2004 (inception of offering) to December 31, 2004. |
| |
| 2. | | Per share amounts calculated based on the average shares outstanding during the period. |
| |
| 3. | | Assumes an investment on the business day before the first day of the fiscal period, with all dividends and distributions reinvested in additional shares on the reinvestment date, and redemption at the net asset value calculated on the last business day of the fiscal period. Total returns are not annualized for periods less than one full year. Total return information does not reflect expenses that apply at the separate account level or to related insurance products. Inclusion of these charges would reduce the total return figures for all periods shown. Returns do not reflect the deduction of taxes that a shareholder would pay on fund distributions or the redemption of fund shares. |
| |
| 4. | | Annualized for periods less than one full year. |
| |
| 5. | | Total expenses including indirect expenses from affiliated fund were as follows: |
| | | | | |
| Year Ended December 31, 2008 | | | 0.91 | % |
| Year Ended December 31, 2007 | | | 0.90 | % |
| Year Ended December 31, 2006 | | | 0.91 | % |
| | |
| 6. | | Reduction to custodian expenses less than 0.005%. |
| |
| 7. | | Waiver or reimbursement of indirect management fees less than 0.005%. |
See accompanying Notes to Financial Statements.
F12 | OPPENHEIMER GLOBAL SECURITIES FUND/ VA
NOTES TO FINANCIAL STATEMENTS
1. Significant Accounting Policies
Oppenheimer Global Securities Fund/VA (the “Fund”) is a separate series of Oppenheimer Variable Account Funds, an open-end management investment company registered under the Investment Company Act of 1940, as amended. The Fund’s investment objective is to seek long-term capital appreciation by investing a substantial portion of its assets in securities of foreign issuers, “growth-type” companies, cyclical industries and special situations that are considered to have appreciation possibilities. The Fund’s investment adviser is OppenheimerFunds, Inc. (the “Manager”).
The Fund offers Non-Service, Service, Class 3 and Class 4 shares. All classes are sold at their offering price, which is the net asset value per share, to separate investment accounts of participating insurance companies as an underlying investment for variable life insurance policies, variable annuity contracts or other investment products. The class of shares being designated as Service shares and Class 4 shares are subject to a distribution and service plan. All classes of shares have identical rights and voting privileges with respect to the Fund in general and exclusive voting rights on matters that affect that class alone. Earnings, net assets and net asset value per share may differ due to each class having its own expenses, such as transfer and shareholder servicing agent fees and shareholder communications, directly attributable to that class. The Fund assesses a 1% fee on the proceeds of Class 3 and Class 4 shares that are redeemed (either by selling or exchanging to another Oppenheimer fund or other investment option offered through your variable life insurance or variable annuity contract) within 60 days of their purchase. The fee, which is retained by the Fund, is accounted for as an addition to paid-in capital.
The following is a summary of significant accounting policies consistently followed by the Fund.
Securities Valuation. The Fund calculates the net asset value of its shares as of the close of the New York Stock Exchange (the “Exchange”), normally 4:00 P.M. Eastern time, on each day the Exchange is open for trading.
Effective for fiscal periods beginning after November 15, 2007, FASB Statement of Financial Accounting Standards No. 157, Fair Value Measurements, establishes a hierarchy for measuring fair value of assets and liabilities. As required by the standard, each investment asset or liability of the Fund is assigned a level at measurement date based on the significance and source of the inputs to its valuation. Quoted prices in active markets for identical securities are classified as “Level 1”, inputs other than quoted prices for an asset that are observable are classified as “Level 2” and unobservable inputs, including the Manager’s judgment about the assumptions that a market participant would use in pricing an asset or liability are classified as “Level 3”. The inputs used for valuing securities are not necessarily an indication of the risks associated with investing in those securities. A table summarizing the Fund’s investments under these levels of classification is included following the Statement of Investments.
Securities are valued using quoted market prices, when available, as supplied primarily either by portfolio pricing services approved by the Board of Trustees or dealers. These securities are typically classified within Level 1 or 2; however, they may be designated as Level 3 if the dealer or portfolio pricing service values a security through an internal model with significant unobservable market data inputs.
Securities traded on a registered U.S. securities exchange are valued based on the last sale price of the security reported on the principal exchange on which traded, prior to the time when the Fund’s assets are valued. Securities whose principal exchange is NASDAQ® are valued based on the official closing prices reported by NASDAQ prior to the time when the Fund’s assets are valued. In the absence of a sale, the security is valued at the last sale price on the prior trading day, if it is within the spread of the current day’s closing “bid” and “asked” prices, and if not, at the current day’s closing bid price. A foreign security traded on a foreign exchange is valued based on the last sale price on the principal exchange on which the security is traded, as identified by the portfolio pricing service used by the Manager, prior to the time when the Fund’s assets are valued. In the absence of a sale, the security is valued at the most recent official closing price on the principal exchange on which it is traded.
Shares of a registered investment company that are not traded on an exchange are valued at that investment company’s net asset value per share.
F13 | OPPENHEIMER GLOBAL SECURITIES FUND/VA
NOTES TO FINANCIAL STATEMENTS Continued
1. Significant Accounting Policies Continued
Corporate, government and municipal debt instruments having a remaining maturity in excess of sixty days and all mortgage-backed securities, collateralized mortgage obligations and other asset-backed securities are valued at the mean between the “bid” and “asked” prices.
“Money market-type” debt instruments with remaining maturities of sixty days or less are valued at cost adjusted by the amortization of discount or premium to maturity (amortized cost), which approximates market value. These securities are typically designated as Level 2.
In the absence of a readily available quoted market price, including for securities whose values have been materially affected by what the Manager identifies as a significant event occurring before the Fund’s assets are valued but after the close of the securities’ respective exchanges, the Manager, acting through its internal valuation committee, in good faith determines the fair valuation of that asset using consistently applied procedures under the supervision of the Board of Trustees (which reviews those fair valuations by the Manager). Those procedures include certain standardized methodologies to fair value securities. Such methodologies include, but are not limited to, pricing securities initially at cost and subsequently adjusting the value based on: changes in company specific fundamentals, changes in an appropriate securities index, or changes in the value of similar securities which may be adjusted for any discounts related to resale restrictions. When possible, such methodologies use observable market inputs such as quoted prices of similar securities, observable interest rates, currency rates and yield curves. The methodologies used for valuing securities are not necessarily an indication of the risks associated with investing in those securities.
Fair valued securities may be classified as “Level 3” if the valuation primarily reflects the Manager’s own assumptions about the inputs that market participants would use in valuing such securities.
There have been no significant changes to the fair valuation methodologies during the period.
Foreign Currency Translation. The Fund’s accounting records are maintained in U.S. dollars. The values of securities denominated in foreign currencies and amounts related to the purchase and sale of foreign securities and foreign investment income are translated into U.S. dollars as of the close of the Exchange, normally 4:00 P.M. Eastern time, on each day the Exchange is open for trading. Foreign exchange rates may be valued primarily using a reliable bank, dealer or service authorized by the Board of Trustees.
Reported net realized gains and losses from foreign currency transactions arise from sales of portfolio securities, sales and maturities of short-term securities, sales of foreign currencies, exchange rate fluctuations between the trade and settlement dates on securities transactions, and the difference between the amounts of dividends, interest, and foreign withholding taxes recorded on the Fund’s books and the U.S. dollar equivalent of the amounts actually received or paid. Net unrealized appreciation and depreciation on the translation of assets and liabilities denominated in foreign currencies arise from changes in the values of assets and liabilities, including investments in securities at fiscal period end, resulting from changes in exchange rates.
The effect of changes in foreign currency exchange rates on investments is separately identified from the fluctuations arising from changes in market values of securities held and reported with all other foreign currency gains and losses in the Fund’s Statement of Operations.
Investment in Oppenheimer Institutional Money Market Fund. The Fund is permitted to invest daily available cash balances in an affiliated money market fund. The Fund may invest the available cash in Class E shares of Oppenheimer Institutional Money Market Fund (“IMMF”) to seek current income while preserving liquidity. IMMF is a registered open-end management investment company, regulated as a money market fund under the Investment Company Act of 1940, as amended. The Manager is also the investment adviser of IMMF. The Fund’s investment in IMMF is included in the Statement of Investments. As a shareholder, the Fund is subject to its proportional share of IMMF’s Class E expenses, including its management fee. The Manager will waive fees and/or reimburse Fund expenses in an amount equal to the indirect management fees incurred through the Fund’s investment in IMMF.
F14 | OPPENHEIMER GLOBAL SECURITIES FUND/VA
Investments in OFI Liquid Assets Fund, LLC. The Fund is permitted to invest cash collateral received in connection with its securities lending activities. Pursuant to the Fund’s Securities Lending Procedures, the Fund may invest cash collateral in, among other investments, an affiliated money market fund. OFI Liquid Assets Fund, LLC (“LAF”) is a limited liability company whose investment objective is to seek current income and stability of principal. The Manager is also the investment adviser of LAF. LAF is not registered under the Investment Company Act of 1940. However, LAF does comply with the investment restrictions applicable to registered money market funds set forth in Rule 2a-7 adopted under the Investment Company Act. The Fund’s investment in LAF is included in the Statement of Investments. As a shareholder, the Fund is subject to its proportional share of LAF’s expenses, including its management fee of 0.08%.
Investments With Off-Balance Sheet Market Risk. The Fund enters into financial instrument transactions (such as swaps, futures, options and other derivatives) that may have off-balance sheet market risk. Off-balance sheet market risk exists when the maximum potential loss on a particular financial instrument is greater than the value of such financial instrument, as reflected in the Fund’s Statement of Assets and Liabilities.
Allocation of Income, Expenses, Gains and Losses. Income, expenses (other than those attributable to a specific class), gains and losses are allocated on a daily basis to each class of shares based upon the relative proportion of net assets represented by such class. Operating expenses directly attributable to a specific class are charged against the operations of that class.
Federal Taxes. The Fund intends to comply with provisions of the Internal Revenue Code applicable to regulated investment companies and to distribute substantially all of its investment company taxable income, including any net realized gain on investments not offset by capital loss carryforwards, if any, to shareholders. Therefore, no federal income or excise tax provision is required. The Fund files income tax returns in U.S. federal and applicable state jurisdictions. The statute of limitations on the Fund’s tax return filings generally remain open for the three preceding fiscal reporting period ends.
The tax components of capital shown in the following table represent distribution requirements the Fund must satisfy under the income tax regulations, losses the Fund may be able to offset against income and gains realized in future years and unrealized appreciation or depreciation of securities and other investments for federal income tax purposes.
| | | | | | | | | | | | | |
| | | | | | | | | | | Net Unrealized | |
| | | | | | | | | | | Depreciation | |
| | | | | | | | | | | Based on Cost of | |
| Undistributed | | Undistributed | | | Accumulated | | | Securities and Other | |
| Net Investment | | Long-Term | | | Loss | | | Investments for Federal | |
| Income | | Gain | | | Carryforward1,2,3 | | | Income Tax Purposes | |
| |
| $49,324,546 | | $ | 49,781,773 | | | $ | 23,157,860 | | | $ | 440,446,473 | |
| | |
| 1. | | As of December 31, 2008, the Fund had $23,157,860 of post-October losses available to offset future realized capital gains, if any. Such losses, if unutilized, will expire in 2017. |
| |
| 2. | | During the fiscal year ended December 31, 2008, the Fund did not utilize any capital loss carryforward. |
| |
| 3. | | During the fiscal year ended December 31, 2007, the Fund did not utilize any capital loss carryforward. |
Net investment income (loss) and net realized gain (loss) may differ for financial statement and tax purposes. The character of dividends and distributions made during the fiscal year from net investment income or net realized gains may differ from their ultimate characterization for federal income tax purposes. Also, due to timing of dividends and distributions, the fiscal year in which amounts are distributed may differ from the fiscal year in which the income or net realized gain was recorded by the Fund.
F15 | OPPENHEIMER GLOBAL SECURITIES FUND/VA
NOTES TO FINANCIAL STATEMENTS Continued
1. Significant Accounting Policies Continued
Accordingly, the following amounts have been reclassified for December 31, 2008. Net assets of the Fund were unaffected by the reclassifications.
| | | | | | | | | |
| | | Increase | | | Reduction to | |
| | | to Accumulated | | | Accumulated Net | |
| Increase to | | Net Investment | | | Realized Gain | |
| Paid-in Capital | | Income | | | on Investments4 | |
| |
| $6,509,001 | | $ | 4,077,218 | | | $ | 10,586,219 | |
| | |
| 4. | | $6,509,001, all of which was long-term capital gain, was distributed in connection with Fund share redemptions. |
The tax character of distributions paid during the years ended December 31, 2008 and December 31, 2007 was as follows:
| | | | | | | | | |
| | | Year Ended | | | Year Ended | |
| | | December 31, 2008 | | | December 31, 2007 | |
| Distributions paid from: | | | | | | | | |
| Ordinary income | | $ | 52,262,946 | | | $ | 64,685,816 | |
| Long-term capital gain | | | 208,239,879 | | | | 174,855,095 | |
| | | |
| Total | | $ | 260,502,825 | | | $ | 239,540,911 | |
| | | |
The aggregate cost of securities and other investments and the composition of unrealized appreciation and depreciation of securities and other investments for federal income tax purposes as of December 31, 2008 are noted in the following table. The primary difference between book and tax appreciation or depreciation of securities and other investments, if applicable, is attributable to the tax deferral of losses or tax realization of financial statement unrealized gain or loss.
| | | | | |
| Federal tax cost of securities | | $ | 2,599,426,756 | |
| Federal tax cost of other investments | | | 2,252,865 | |
| | | | |
| Total federal tax cost | | $ | 2,601,679,621 | |
| | | | |
| | | | | |
| Gross unrealized appreciation | | $ | 238,151,866 | |
| Gross unrealized depreciation | | | (678,598,339 | ) |
| | | | |
| Net unrealized depreciation | | $ | (440,446,473 | ) |
| | | | |
Certain foreign countries impose a tax on capital gains which is accrued by the Fund based on unrealized appreciation, if any, on affected securities. The tax is paid when the gain is realized.
Trustees’ Compensation. The Board of Trustees has adopted a compensation deferral plan for independent trustees that enables trustees to elect to defer receipt of all or a portion of the annual compensation they are entitled to receive from the Fund. For purposes of determining the amount owed to the Trustee under the plan, deferred amounts are treated as though equal dollar amounts had been invested in shares of the Fund or in other Oppenheimer funds selected by the Trustee. The Fund purchases shares of the funds selected for deferral by the Trustee in amounts equal to his or her deemed investment, resulting in a Fund asset equal to the deferred compensation liability. Such assets are included as a component of “Other” within the asset section of the Statement of Assets and Liabilities. Deferral of trustees’ fees under the plan will not affect the net assets of the Fund, and will not materially affect the Fund’s assets, liabilities or net investment income per share. Amounts will be deferred until distributed in accordance to the compensation deferral plan.
Dividends and Distributions to Shareholders. Dividends and distributions to shareholders, which are determined in accordance with income tax regulations and may differ from U.S. generally accepted accounting principles, are recorded on the ex-dividend date. Income and capital gain distributions, if any, are declared and paid annually or at other times as deemed necessary by the Manager.
F16 | OPPENHEIMER GLOBAL SECURITIES FUND/VA
Investment Income. Dividend income is recorded on the ex-dividend date or upon ex-dividend notification in the case of certain foreign dividends where the ex-dividend date may have passed. Non-cash dividends included in dividend income, if any, are recorded at the fair market value of the securities received. Interest income is recognized on an accrual basis. Discount and premium, which are included in interest income on the Statement of Operations, are amortized or accreted daily.
Custodian Fees. “Custodian fees and expenses” in the Statement of Operations may include interest expense incurred by the Fund on any cash overdrafts of its custodian account during the period. Such cash overdrafts may result from the effects of failed trades in portfolio securities and from cash outflows resulting from unanticipated shareholder redemption activity. The Fund pays interest to its custodian on such cash overdrafts, to the extent they are not offset by positive cash balances maintained by the Fund, at a rate equal to the Federal Funds Rate plus 0.50%. The “Reduction to custodian expenses” line item, if applicable, represents earnings on cash balances maintained by the Fund during the period. Such interest expense and other custodian fees may be paid with these earnings.
Security Transactions. Security transactions are recorded on the trade date. Realized gains and losses on securities sold are determined on the basis of identified cost.
Indemnifications. The Fund’s organizational documents provide current and former trustees and officers with a limited indemnification against liabilities arising in connection with the performance of their duties to the Fund. In the normal course of business, the Fund may also enter into contracts that provide general indemnifications. The Fund’s maximum exposure under these arrangements is unknown as this would be dependent on future claims that may be made against the Fund. The risk of material loss from such claims is considered remote.
Other. The preparation of financial statements in conformity with accounting principles generally accepted in the United States of America requires management to make estimates and assumptions that affect the reported amounts of assets and liabilities and disclosure of contingent assets and liabilities at the date of the financial statements and the reported amounts of increases and decreases in net assets from operations during the reporting period. Actual results could differ from those estimates.
2. Shares of Beneficial Interest
The Fund has authorized an unlimited number of $0.001 par value shares of beneficial interest of each class. Transactions in shares of beneficial interest were as follows:
| | | | | | | | | | | | | | | | | |
| | | Year Ended December 31, 2008 | | | Year Ended December 31, 2007 | |
| | | Shares | | | Amount | | | Shares | | | Amount | |
Non-Service Shares | | | | | | | | | | | | | | | | |
| Sold | | | 9,646,046 | | | $ | 259,758,983 | | | | 6,411,129 | | | $ | 236,447,298 | |
| Dividends and/or distributions reinvested | | | 4,840,813 | | | | 144,062,587 | | | | 4,207,471 | | | | 143,138,185 | |
| Redeemed | | | (17,521,140 | ) | | | (482,019,498 | ) | | | (13,131,133 | ) | | | (483,817,027 | ) |
| | | |
| Net decrease | | | (3,034,281 | ) | | $ | (78,197,928 | ) | | | (2,512,533 | ) | | $ | (104,231,544 | ) |
| | | |
| | | | | | | | | | | | | | | | | |
Service Shares | | | | | | | | | | | | | | | | |
| Sold | | | 6,325,047 | | | $ | 162,252,325 | | | | 10,073,670 | | | $ | 368,640,666 | |
| Dividends and/or distributions reinvested | | | 2,887,346 | | | | 85,263,322 | | | | 1,916,196 | | | | 64,729,126 | |
| Redeemed | | | (6,514,971 | ) | | | (176,139,911 | ) | | | (3,068,408 | ) | | | (112,167,098 | ) |
| | | |
| Net increase | | | 2,697,422 | | | $ | 71,375,736 | | | | 8,921,458 | | | $ | 321,202,694 | |
| | | |
F17 | OPPENHEIMER GLOBAL SECURITIES FUND/VA
NOTES TO FINANCIAL STATEMENTS Continued
2. Shares of Beneficial Interest Continued
| | | | | | | | | | | | | | | | | |
| | | Year Ended December 31, 2008 | | | Year Ended December 31, 2007 | |
| | | Shares | | | Amount | | | Shares | | | Amount | |
Class 3 Shares | | | | | | | | | | | | | | | | |
| Sold | | | 277,654 | | | $ | 8,012,360 | | | | 404,332 | | | $ | 14,980,587 | |
| Dividends and/or distributions reinvested | | | 780,370 | | | | 23,372,096 | | | | 717,554 | | | | 24,554,691 | |
| Redeemed | | | (2,229,618 | ) | | | (62,225,556 | )1 | | | (2,002,496 | ) | | | (74,108,857 | )2 |
| | | |
| Net decrease | | | (1,171,594 | ) | | $ | (30,841,100 | ) | | | (880,610 | ) | | $ | (34,573,579 | ) |
| | | |
| | | | | | | | | | | | | | | | | |
Class 4 Shares | | | | | | | | | | | | | | | | |
| Sold | | | 101,469 | | | $ | 2,904,870 | | | | 392,793 | | | $ | 14,359,772 | |
| Dividends and/or distributions reinvested | | | 264,033 | | | | 7,804,820 | | | | 210,681 | | | | 7,118,909 | |
| Redeemed | | | (621,183 | ) | | | (16,982,546 | )1 | | | (328,721 | ) | | | (12,019,171 | )2 |
| | | |
| Net increase (decrease) | | | (255,681 | ) | | $ | (6,272,856 | ) | | | 274,753 | | | $ | 9,459,510 | |
| | | |
| | |
| 1. | | Net of redemption fees of $7,921 and $5,109 for Class 3 and Class 4, respectively. |
| |
| 2. | | Net of redemption fees of $11,158 and $4,865 for Class 3 and Class 4, respectively. |
3. Purchases and Sales of Securities
The aggregate cost of purchases and proceeds from sales of securities, other than short-term obligations and investments in Oppenheimer Institutional Money Market Fund and OFI Liquid Assets Fund, LLC, for the year ended December 31, 2008, were as follows:
| | | | | | | | | |
| | | Purchases | | | Sales | |
| |
| Investment securities | | $ | 575,234,267 | | | $ | 763,285,976 | |
4. Fees and Other Transactions with Affiliates
Management Fees. Under the investment advisory agreement, the Fund pays the Manager a management fee based on the daily net assets of the Fund at an annual rate as shown in the following table:
| | | | | |
| Fee Schedule | | | | |
| |
| Up to $200 million | | | 0.75 | % |
| Next $200 million | | | 0.72 | |
| Next $200 million | | | 0.69 | |
| Next $200 million | | | 0.66 | |
| Over $800 million | | | 0.60 | |
Transfer Agent Fees. OppenheimerFunds Services (“OFS”), a division of the Manager, acts as the transfer and shareholder servicing agent for the Fund. The Fund pays OFS a per account fee. For the year ended December 31, 2008, the Fund paid $40,115 to OFS for services to the Fund.
Additionally, funds offered in variable annuity separate accounts are subject to minimum fees of $10,000 per class, for class level assets of $10 million or more. Each class is subject to the minimum fee in the event that the per account fee does not equal or exceed the applicable minimum fee.
Distribution and Service Plan for Service Shares and Class 4 Shares. The Fund has adopted a Distribution and Service Plan (the “Plan”) in accordance with Rule 12b-1 under the Investment Company Act of 1940 for Service shares and Class 4 shares to pay OppenheimerFunds Distributor, Inc. (the “Distributor”), for distribution related services, personal service and account maintenance for the Fund’s Service shares and Class 4 shares. Under the Plan, payments are made periodically at an annual rate of up to 0.25% of the average annual net assets of Service shares and Class 4 shares of the Fund. The Distributor currently uses all of those fees to compensate sponsor(s) of the insurance product that offers Fund shares, for providing personal service and maintenance of accounts of their variable contract owners that
F18 | OPPENHEIMER GLOBAL SECURITIES FUND/VA
hold Service shares and Class 4 shares. These fees are paid out of the Fund’s assets on an on-going basis and increase operating expenses of the Service shares and Class 4 shares, which results in lower performance compared to the Fund’s shares that are not subject to a service fee. Fees incurred by the Fund under the Plan are detailed in the Statement of Operations.
Waivers and Reimbursements of Expenses. OFS has voluntarily agreed to limit transfer and shareholder servicing agent fees for all classes to 0.35% of average annual net assets per class. This undertaking may be amended or withdrawn at any time.
The Manager will waive fees and/or reimburse Fund expenses in an amount equal to the indirect management fees incurred through the Fund’s investment in IMMF. During the year ended December 31, 2008, the Manager waived $50,784 for IMMF management fees.
5. Foreign Currency Exchange Contracts
The Fund may enter into foreign currency exchange contracts (“forward contracts”) for the purchase or sale of a foreign currency at a negotiated rate at a future date.
Forward contracts are reported on a schedule following the Statement of Investments. Forward contracts will be valued daily based upon the closing prices of the forward currency rates determined at the close of the Exchange as provided by a bank, dealer or pricing service. The resulting unrealized appreciation (depreciation) is reported in the Statement of Assets and Liabilities as a receivable or payable and in the Statement of Operations within the change in unrealized appreciation (depreciation). At contract close, the difference between the original cost of the contract and the value at the close date is recorded as a realized gain (loss) in the Statement of Operations.
Risks to the Fund include both market and credit risk. Market risk is the risk that the value of the forward contract will depreciate due to unfavorable changes in the exchange rates. Credit risk arises from the possibility that the counterparty will default. If the counterparty defaults, the Fund’s loss will consist of the net amount of contractual payments that the Fund has not yet received.
6. Illiquid Securities
As of December 31, 2008, investments in securities included issues that are illiquid. Investments may be illiquid because they do not have an active trading market, making it difficult to value them or dispose of them promptly at an acceptable price. The Fund will not invest more than 15% of its net assets (determined at the time of purchase and reviewed periodically) in illiquid securities. Securities that are illiquid are marked with an applicable footnote on the Statement of Investments.
7. Securities Lending
The Fund lends portfolio securities from time to time in order to earn additional income in the form of fees or interest on securities received as collateral or the investment of any cash received as collateral. The loans are secured by collateral (either securities, letters of credit, or cash) in an amount not less than 100% of the market value of the loaned securities during the period of the loan. The market value of the loaned securities is determined at the close of each business day and any additional required collateral is delivered to the Fund on the next business day. If the borrower defaults on its obligation to return the securities loaned because of insolvency or other reasons, the Fund could experience delays and cost in recovering the securities loaned or in gaining access to the collateral. The Fund continues to receive the economic benefit of interest or dividends paid on the securities loaned in the form of a substitute payment received from the borrower and recognizes the gain or loss in the fair value of the securities loaned that may occur during the term of the loan. The Fund has the right under the lending agreement to recover the securities from the borrower on demand.
As of December 31, 2008, the Fund had no securities on loan.
F19 | OPPENHEIMER GLOBAL SECURITIES FUND/VA
NOTES TO FINANCIAL STATEMENTS Continued
8. Recent Accounting Pronouncement
In March 2008, the Financial Accounting Standards Board (“FASB”) issued Statement on Financial Accounting Standards (“SFAS”) No. 161, Disclosures about Derivative Instruments and Hedging Activities. This standard requires enhanced disclosures about derivative and hedging activities, including qualitative disclosures about how and why the Fund uses derivative instruments, how these activities are accounted for, and their effect on the Fund’s financial position, financial performance and cash flows. SFAS No. 161 is effective for financial statements issued for fiscal years and interim periods beginning after November 15, 2008. At this time, management is evaluating the implications of SFAS No. 161 and its impact on the Fund’s financial statements and related disclosures.
9. Change In Independent Registered Public Accounting Firm (Unaudited)
At a meeting held on August 20, 2008, the Board of Trustees of the Fund appointed KPMG LLP as the independent registered public accounting firm to the Fund for fiscal year 2009, replacing the firm of Deloitte & Touche LLP, effective at the conclusion of the fiscal 2008 audit. During the two most recent fiscal years the audit reports of Deloitte & Touche LLP contained no adverse opinion or disclaimer of opinion and were not qualified or modified as to uncertainty, audit scope or accounting principles. Further, there were no disagreements between the Fund and Deloitte & Touche LLP on accounting principles, financial statement disclosure or audit scope, which if not resolved to the satisfaction of Deloitte & Touche LLP would have caused it to make reference to the disagreements in connection with its reports.
F20 | OPPENHEIMER GLOBAL SECURITIES FUND/VA
REPORT OF INDEPENDENT REGISTERED PUBLIC ACCOUNTING FIRM
To the Board of Trustees and Shareholders of Oppenheimer Global Securities Fund/VA:
We have audited the accompanying statement of assets and liabilities of Oppenheimer Global Securities Fund/VA (the “Fund”), a series of Oppenheimer Variable Account Funds, including the statement of investments, as of December 31, 2008, and the related statement of operations for the year then ended, the statements of changes in net assets for each of the two years in the period then ended, and the financial highlights for each of the five years in the period then ended. These financial statements and financial highlights are the responsibility of the Fund’s management. Our responsibility is to express an opinion on these financial statements and financial highlights based on our audits.
We conducted our audits in accordance with the standards of the Public Company Accounting Oversight Board (United States). Those standards require that we plan and perform the audit to obtain reasonable assurance about whether the financial statements and financial highlights are free of material misstatement. The Fund is not required to have, nor were we engaged to perform, an audit of its internal control over financial reporting. Our audits included consideration of internal control over financial reporting as a basis for designing audit procedures that are appropriate in the circumstances, but not for the purpose of expressing an opinion on the effectiveness of the Fund’s internal control over financial reporting. Accordingly, we express no such opinion. An audit also includes examining, on a test basis, evidence supporting the amounts and disclosures in the financial statements, assessing the accounting principles used and significant estimates made by management, as well as evaluating the overall financial statement presentation. Our procedures included confirmation of securities owned as of December 31, 2008, by correspondence with the custodian and brokers; where replies were not received from brokers, we performed other auditing procedures. We believe that our audits provide a reasonable basis for our opinion.
In our opinion, the financial statements and financial highlights referred to above present fairly, in all material respects, the financial position of the Fund as of December 31, 2008, the results of its operations for the year then ended, the changes in its net assets for each of the two years in the period then ended, and the financial highlights for each of the five years in the period then ended, in conformity with accounting principles generally accepted in the United States of America.
Deloitte & Touche LLP
Denver, Colorado
February 11, 2009
F21 | OPPENHEIMER GLOBAL SECURITIES FUND/VA
THIS PAGE INTENTIONALLY LEFT BLANK.
F22 | OPPENHEIMER GLOBAL SECURITIES FUND/ VA
FEDERAL INCOME TAX INFORMATION Unaudited
In early 2009, if applicable, shareholders of record received information regarding all dividends and distributions paid to them by the Fund during calendar year 2008. Regulations of the U.S. Treasury Department require the Fund to report this information to the Internal Revenue Service.
Capital gain distributions of $1.9545 per share were paid to Non-Service, Service, Class 3 and Class 4 shareholders, respectively, on March 10, 2008. Whether received in stock or in cash, the capital gain distribution should be treated by shareholders as a gain from the sale of the capital assets held for more than one year (long-term capital gains).
Dividends, if any, paid by the Fund during the fiscal year ended December 31, 2008 which are not designated as capital gain distributions should be multiplied by 34.34% to arrive at the amount eligible for the corporate dividend-received deduction.
The Fund has elected the application of Section 853 of the Internal Revenue Code to permit shareholders to take a federal income tax credit or deduction, at their option, on a per share basis for an aggregate amount of $2,398,707 of foreign income taxes paid by the Fund during the fiscal year ended December 31, 2008. A separate notice will be mailed to each shareholder, which will reflect the proportionate share of such foreign taxes which must be treated by shareholders as gross income for federal income tax purposes.
Gross income of $46,126,413 was derived from sources within foreign countries or possessions of the United States.
The foregoing information is presented to assist shareholders in reporting distributions received from the Fund to the Internal Revenue Service. Because of the complexity of the federal regulations which may affect your individual tax return and the many variations in state and local tax regulations, we recommend that you consult your tax advisor for specific guidance.
9 | OPPENHEIMER GLOBAL SECURITIES FUND/VA
BOARD APPROVAL OF THE FUND’S INVESTMENT ADVISORY AGREEMENT Unaudited
Each year, the Board of Trustees (the “Board”), including a majority of the independent Trustees, is required to determine whether to renew the Fund’s investment advisory agreement (the “Agreement”). The Investment Company Act of 1940, as amended, requires that the Board request and evaluate, and that the Manager provide, such information as may be reasonably necessary to evaluate the terms of the Agreement. The Board employs an independent consultant to prepare a report that provides information, including comparative information, the Board requests for that purpose. In addition, the Board receives information throughout the year regarding Fund services, fees, expenses and performance.
The Manager and the independent consultant provided information to the Board on the following factors: (i) the nature, quality and extent of the Manager’s services, (ii) the investment performance of the Fund and the Manager, (iii) the fees and expenses of the Fund, including comparative expense information, (iv) the profitability of the Manager and its affiliates, including an analysis of the cost of providing services, (v) whether economies of scale are realized as the Fund grows and whether fee levels reflect these economies of scale for Fund investors and (vi) other benefits to the Manager from its relationship with the Fund. The Board was aware that there are alternatives to retaining the Manager.
Outlined below is a summary of the principal information considered by the Board as well as the Board’s conclusions.
Nature, Quality and Extent of Services. The Board considered information about the nature, quality and extent of the services provided to the Fund and information regarding the Manager’s key personnel who provide such services. The Manager’s duties include providing the Fund with the services of the portfolio manager and the Manager’s investment team, who provide research, analysis and other advisory services in regard to the Fund’s investments; securities trading services; oversight of third party service providers; monitoring compliance with applicable Fund policies and procedures and adherence to the Fund’s investment restrictions. The Manager is responsible for providing certain administrative services to the Fund as well. Those services include providing and supervising all administrative and clerical personnel who are necessary in order to provide effective corporate administration for the Fund; compiling and maintaining records with respect to the Fund’s operations; preparing and filing reports required by the Securities and Exchange Commission; preparing periodic reports regarding the operations of the Fund for its shareholders; preparing proxy materials for shareholder meetings; and preparing the registration statements required by Federal and state securities laws for the sale of the Fund’s shares. The Manager also provides the Fund with office space, facilities and equipment.
The Board also considered the quality of the services provided and the quality of the Manager’s resources that are available to the Fund. The Board took account of the fact that the Manager has had over forty years of experience as an investment adviser and that its assets under management rank it among the top mutual fund managers in the United States. The Board evaluated the Manager’s advisory, administrative, accounting, legal and compliance services, and information the Board has received regarding the experience and professional qualifications of the Manager’s key personnel and the size and functions of its staff. In its evaluation of the quality of the portfolio management services provided, the Board considered the experience of Rajeev Bhaman, the portfolio manager for the Fund, and the Manager’s investment team and analysts. The Board members also considered the totality of their experiences with the Manager as Directors or Trustees of the Fund and other funds advised by the Manager. The Board considered information regarding the quality of services provided by affiliates of the Manager, which its members have become knowledgeable about in connection with the renewal of the Fund’s service agreements. The Board concluded that, in light of the Manager’s experience, reputation, personnel, operations and resources, the Fund benefits from the services provided under the Agreement.
10 | OPPENHEIMER GLOBAL SECURITIES FUND/VA
Investment Performance of the Manager and the Fund. Throughout the year, the Manager provided information on the investment performance of the Fund and the Manager, including comparative performance information. The Board also reviewed information, prepared by the Manager and by the independent consultant, comparing the Fund’s historical performance to relevant market indices and to the performance of other global growth funds underlying variable insurance products. The Board considered that the Fund outperformed its performance universe median during the five- and ten-year periods, though it underperformed its performance universe median during the one- and three-year periods.
Costs of Services by the Manager. The Board reviewed the fees paid to the Manager and the other expenses borne by the Fund. The Board also considered the comparability of the fees charged and the services provided to the Fund to the fees and services for other clients or accounts advised by the Manager. The independent consultant provided comparative data in regard to the fees and expenses of the Fund and global growth funds underlying variable insurance products with comparable asset levels and distribution features. The Board considered that the Fund’s total expenses were lower than its expense group median. In reviewing the fees and expenses charged to the VA Funds, the Board considered the Manager’s assertion that, because of the disparity among VA funds in how insurance companies may be compensated for the services they provide to shareholders, when comparing the expenses of the various VA funds it is most appropriate to focus on the total expenses rather than on the management fees. Accordingly, while the Board reviewed and considered all expenses in its consideration of the Advisory Agreement, it paid particular attention to total expenses.
Economies of Scale and Profits Realized by the Manager. The Board considered information regarding the Manager’s costs in serving as the Fund’s investment adviser, including the costs associated with the personnel and systems necessary to manage the Fund, and information regarding the Manager’s profitability from its relationship with the Fund. The Board reviewed whether the Manager may realize economies of scale in managing and supporting the Fund. The Board noted that the Fund currently has management fee breakpoints, which are intended to share with Fund shareholders economies of scale that may exist as the Fund’s assets grow.
Other Benefits to the Manager. In addition to considering the profits realized by the Manager, the Board considered information that was provided regarding the direct and indirect benefits the Manager receives as a result of its relationship with the Fund, including compensation paid to the Manager’s affiliates and research provided to the Manager in connection with permissible brokerage arrangements (soft dollar arrangements). The Board also considered that the Manager must be able to pay and retain experienced professional personnel at competitive rates to provide quality services to the Fund and that maintaining the financial viability of the Manager is important in order for the Manager to continue to provide significant services to the Fund and its shareholders.
Conclusions. These factors were also considered by the independent Trustees meeting separately from the full Board, assisted by experienced counsel to the Fund and to the independent Trustees. Fund counsel and the independent Trustees’ counsel are independent of the Manager within the meaning and intent of the Securities and Exchange Commission Rules.
Based on its review of the information it received and its evaluations described above, the Board, including a majority of the independent Trustees, decided to continue the Agreement for another year. In arriving at this decision, the Board did not single out any factor or factors as being more important than others, but considered all of the above information, and considered the terms and conditions of the Agreement, including the management fee, in light of all of the surrounding circumstances.
11 | OPPENHEIMER GLOBAL SECURITIES FUND/VA
PORTFOLIO PROXY VOTING POLICIES AND PROCEDURES; UPDATES TO STATEMENTS OF INVESTMENTS Unaudited
The Fund has adopted Portfolio Proxy Voting Policies and Procedures under which the Fund votes proxies relating to securities (“portfolio proxies”) held by the Fund. A description of the Fund’s Portfolio Proxy Voting Policies and Procedures is available (i) without charge, upon request, by calling the Fund toll-free at 1.800.525.7048, (ii) on the Fund’s website at www.oppenheimerfunds.com, and (iii) on the SEC’s website at www.sec.gov. In addition, the Fund is required to file Form N-PX, with its complete proxy voting record for the 12 months ended June 30th, no later than August 31st of each year. The Fund’s voting record is available (i) without charge, upon request, by calling the Fund toll-free at 1.800.525.7048, and (ii) in the Form N-PX filing on the SEC’s website at www.sec.gov.
The Fund files its complete schedule of portfolio holdings with the SEC for the first quarter and the third quarter of each fiscal year on Form N-Q. The Fund’s Form N-Q filings are available on the SEC’s website at http://www.sec.gov. Those forms may be reviewed and copied at the SEC’s Public Reference Room in Washington, D.C. Information on the operation of the Public Reference Room may be obtained by calling 1-800-SEC-0330.
12 | OPPENHEIMER GLOBAL SECURITIES FUND/VA
TRUSTEES AND OFFICERS Unaudited
| | | |
Name, Position(s) Held with the
Funds, Length of Service, Age | | Principal Occupation(s) During the Past 5 Years; Other Trusteeships/Directorships Held; Number of Portfolios in the Funds Complex Currently Overseen |
| | | |
INDEPENDENT
TRUSTEES | | The address of each Trustee in the chart below is 6803 S. Tucson Way, Centennial, Colorado 80112-3924. Each Trustee serves for an indefinite term, or until his or her resignation, retirement, death or removal. |
| | | |
William L. Armstrong,
Chairman of the Board
of Trustees (since 2003),
Trustee (since 1999)
Age: 71 | | President, Colorado Christian University (since 2006); Chairman, Cherry Creek Mortgage Company (since 1991), Chairman, Centennial State Mortgage Company (since 1994), Chairman, The El Paso Mortgage Company (since 1993); Chairman, Ambassador Media Corporation (since 1984); Chairman, Broadway Ventures (since 1984); Director of Helmerich & Payne, Inc. (oil and gas drilling/production company) (since 1992), Campus Crusade for Christ (non-profit) (since 1991); Former Director, The Lynde and Harry Bradley Foundation, Inc. (non-profit organization) (2002-2006); former Chairman of: Transland Financial Services, Inc. (private mortgage banking company) (1997-2003), Great Frontier Insurance (1995-2000), Frontier Real Estate, Inc. (residential real estate brokerage) (1994-2000) and Frontier Title (title insurance agency) (1995-2000); former Director of the following: UNUMProvident (insurance company) (1991-2004), Storage Technology Corporation (computer equipment company) (1991-2003) and International Family Entertainment (television channel) (1992-1997); U.S. Senator (January 1979-January 1991). Oversees 41 portfolios in the OppenheimerFunds complex. |
| | | |
George C. Bowen,
Trustee (since 1999)
Age: 72 | | Assistant Secretary and Director of Centennial Asset Management Corporation (December 1991-April 1999); President, Treasurer and Director of Centennial Capital Corporation (June 1989-April 1999); Chief Executive Officer and Director of MultiSource Services, Inc. (March 1996-April 1999); Mr. Bowen held several positions with the Manager and with subsidiary or affiliated companies of the Manager (September 1987-April 1999). Oversees 41 portfolios in the OppenheimerFunds complex. |
| | | |
Edward L. Cameron,
Trustee (since 1999)
Age: 70 | | Member of The Life Guard of Mount Vernon (George Washington historical site) (June 2000-June 2006); Partner of PricewaterhouseCoopers LLP (accounting firm) (July 1974-June 1999); Chairman of Price Waterhouse LLP Global Investment Management Industry Services Group (accounting firm) (July 1994-June 1998). Oversees 41 portfolios in the OppenheimerFunds complex. |
| | | |
Jon S. Fossel,
Trustee (since 1990)
Age: 66 | | Director of UNUMProvident (insurance company) (since June 2002); Director of Northwestern Energy Corp. (public utility corporation) (since November 2004); Director of P.R. Pharmaceuticals (October 1999-October 2003); Director of Rocky Mountain Elk Foundation (non-profit organization) (February 1998-February 2003 and February 2005-February 2007); Chairman and Director (until October 1996) and President and Chief Executive Officer (until October 1995) of the Manager; President, Chief Executive Officer and Director of the following: Oppenheimer Acquisition Corp. (“OAC”) (parent holding company of the Manager), Shareholders Services, Inc. and Shareholder Financial Services, Inc. (until October 1995). Oversees 41 portfolios in the OppenheimerFunds complex. |
| | | |
Sam Freedman,
Trustee (since 1996)
Age: 68 | | Director of Colorado UpLIFT (charitable organization) (since September 1984). Mr. Freedman held several positions with the Manager and with subsidiary or affiliated companies of the Manager (until October 1994). Oversees 41 portfolios in the OppenheimerFunds complex. |
| | | |
Beverly L. Hamilton,
Trustee (since 2002)
Age: 62 | | Trustee of Monterey Institute for International Studies (educational organization) (since February 2000); Board Member of Middlebury College (educational organization) (since December 2005); Director of The California Endowment (philanthropic organization) (since April 2002); Director (February 2002-2005) and Chairman of Trustees (2006-2007) of the Community Hospital of Monterey Peninsula; Director (October 1991-2005) and Vice Chairman (since 2006) of American Funds’ Emerging Markets Growth Fund, Inc. (mutual fund); President of ARCO Investment Management Company (February 1991-April 2000); Member of the investment committees of The Rockefeller Foundation (2001-2006) and The University of Michigan (since 2000); Advisor at Credit Suisse First Boston’s Sprout venture capital unit (venture capital fund) (1994-January 2005); Trustee of MassMutual Institutional Funds (investment company) (1996-June 2004); Trustee of MML Series Investment Fund (investment company) (April 1989-June 2004); Member of the investment committee of Hartford Hospital (2000-2003); and Advisor to Unilever (Holland) pension fund (2000-2003). Oversees 41 portfolios in the OppenheimerFunds complex. |
13 | OPPENHEIMER GLOBAL SECURITIES FUND/VA
TRUSTEES AND OFFICERS Unaudited / Continued
| | | |
Robert J. Malone,
Trustee (since 2002)
Age: 64 | | Board of Directors of Opera Colorado Foundation (non-profit organization) (since March 2008); Director of Jones Knowledge, Inc. (since 2006); Director of Jones International University (educational organization) (since August 2005); Chairman, Chief Executive Officer and Director of Steele Street Bank & Trust (commercial banking) (since August 2003); Director of Colorado UpLIFT (charitable organization) (since 1986); Trustee of the Gallagher Family Foundation (non-profit organization) (since 2000); Former Chairman of U.S. Bank-Colorado (subsidiary of U.S. Bancorp and formerly Colorado National Bank) (July 1996-April 1999); Director of Commercial Assets, Inc. (real estate investment trust) (1993-2000); Director of Jones Knowledge, Inc. (2001-July 2004); and Director of U.S. Exploration, Inc. (oil and gas exploration) (1997-February 2004). Oversees 41 portfolios in the OppenheimerFunds complex. |
| | | |
F. William Marshall, Jr.,
Trustee (since 2000)
Age: 66 | | Trustee Emeritas of Worcester Polytech Institute (WPI) (private university) (since 2009); Trustee of MassMutual Select Funds (formerly MassMutual Institutional Funds) (investment company) (since 1996) and MML Series Investment Fund (investment company) (since 1996); President and Treasurer of the SIS Funds (private charitable fund) (since January 1999); Former Trustee of WPI (1985-2008); Former Chairman of the Board (2004-2006) and Former Chairman of the Investment Committee of WPI (1994-2008); Chairman of SIS & Family Bank, F.S.B. (formerly SIS Bank) (commercial bank) (January 1999-July 1999); Executive Vice President of Peoples Heritage Financial Group, Inc. (commercial bank) (January 1999-July 1999); and Former President and Chief Executive Officer of SIS Bancorp. (1993-1999). Oversees 43 portfolios in the OppenheimerFunds complex. |
| | | |
INTERESTED TRUSTEE
AND OFFICER | | The address of Mr. Murphy is Two World Financial Center, 225 Liberty Street, 11th Floor, New York, New York 10281- 1008. Mr. Murphy serves as a Trustee for an indefinite term, or until his resignation, retirement, death or removal and as an Officer for an indefinite term, or until his resignation, retirement, death or removal. Mr. Murphy is an interested Trustee due to his positions with OppenheimerFunds, Inc. and its affiliates. |
| | | |
John V. Murphy,
Trustee, President and
Principal Executive Officer
(since 2001)
Age: 59 | | Chairman and Director of the Manager (since June 2001); Chief Executive Officer of the Manager (June 2001- December 2008); President of the Manager (September 2000-February 2007); President and director or trustee of other Oppenheimer funds; President and Director of Oppenheimer Acquisition Corp. (“OAC”) (the Manager’s parent holding company) and of Oppenheimer Partnership Holdings, Inc. (holding company subsidiary of the Manager) (since July 2001); Director of OppenheimerFunds Distributor, Inc. (subsidiary of the Manager) (November 2001-December 2006); Chairman and Director of Shareholder Services, Inc. and of Shareholder Financial Services, Inc. (transfer agent subsidiaries of the Manager) (since July 2001); President and Director of OppenheimerFunds Legacy Program (charitable trust program established by the Manager) (since July 2001); Director of the following investment advisory subsidiaries of the Manager: OFI Institutional Asset Management, Inc., Centennial Asset Management Corporation, Trinity Investment Management Corporation and Tremont Capital Management, Inc. (since November 2001), HarbourView Asset Management Corporation and OFI Private Investments, Inc. (since July 2001); President (since November 2001) and Director (since July 2001) of Oppenheimer Real Asset Management, Inc.; Executive Vice President of Massachusetts Mutual Life Insurance Company (OAC’s parent company) (since February 1997); Director of DLB Acquisition Corporation (holding company parent of Babson Capital Management LLC) (since June 1995); Chairman (since October 2007) and Member of the Investment Company Institute’s Board of Governors (since October 2003). Oversees 105 portfolios in the OppenheimerFunds complex. |
| | | |
OTHER OFFICERS OF
THE FUND | | The addresses of the Officers in the chart below are as follows: for Messrs. Bhaman and Zack, Two World Financial Center, 225 Liberty Street, New York, New York 10281-1008, for Messrs. Vandehey and Wixted, 6803 S. Tucson Way, Centennial, Colorado 80112-3924. Each Officer serves for an indefinite term or until his or her resignation, retirement, death or removal. |
| | | |
Rajeev Bhaman,
Vice President and Portfolio
Manager (since 2004)
Age: 45 | | Senior Vice President of the Manager (since May 2006); Vice President of the Manager (January 1997-May 2006). A portfolio manager and officer of 2 portfolios in the OppenheimerFunds complex. |
14 | OPPENHEIMER GLOBAL SECURITIES FUND/VA
| | | |
Mark S. Vandehey,
Vice President and Chief
Compliance Officer
(since 2004)
Age: 58 | | Senior Vice President and Chief Compliance Officer of the Manager (since March 2004); Chief Compliance Officer of OppenheimerFunds Distributor, Inc., Centennial Asset Management and Shareholder Services, Inc. (since March 2004); Vice President of OppenheimerFunds Distributor, Inc., Centennial Asset Management Corporation and Shareholder Services, Inc. (since June 1983); Former Vice President and Director of Internal Audit of the Manager (1997-February 2004). An officer of 105 portfolios in the OppenheimerFunds complex. |
| | | |
Brian W. Wixted,
Treasurer and Principal
Financial & Accounting
Officer (since 1999)
Age: 49 | | Senior Vice President and Treasurer of the Manager (since March 1999); Treasurer of the following: HarbourView Asset Management Corporation, Shareholder Financial Services, Inc., Shareholder Services, Inc., Oppenheimer Real Asset Management, Inc. and Oppenheimer Partnership Holdings, Inc. (since March 1999), OFI Private Investments, Inc. (since March 2000), OppenheimerFunds International Ltd. and OppenheimerFunds plc (since May 2000), OFI Institutional Asset Management, Inc. (since November 2000), and OppenheimerFunds Legacy Program (charitable trust program established by the Manager) (since June 2003); Treasurer and Chief Financial Officer of OFI Trust Company (trust company subsidiary of the Manager) (since May 2000); Assistant Treasurer of the following: OAC (since March 1999), Centennial Asset Management Corporation (March 1999-October 2003) and OppenheimerFunds Legacy Program (April 2000-June 2003). An officer of 105 portfolios in the OppenheimerFunds complex. |
| | | |
Robert G. Zack,
Vice President and Secretary
(since 2001)
Age: 60 | | Executive Vice President (since January 2004) and General Counsel (since March 2002) of the Manager; General Counsel and Director of the Distributor (since December 2001); General Counsel of Centennial Asset Management Corporation (since December 2001); Senior Vice President and General Counsel of HarbourView Asset Management Corporation (since December 2001); Secretary and General Counsel of OAC (since November 2001); Assistant Secretary (since September 1997) and Director (since November 2001) of OppenheimerFunds International Ltd. and OppenheimerFunds plc; Vice President and Director of Oppenheimer Partnership Holdings, Inc. (since December 2002); Director of Oppenheimer Real Asset Management, Inc. (since November 2001); Senior Vice President, General Counsel and Director of Shareholder Financial Services, Inc. and Shareholder Services, Inc.(since December 2001); Senior Vice President, General Counsel and Director of OFI Private Investments, Inc. and OFI Trust Company (since November 2001); Vice President of OppenheimerFunds Legacy Program (since June 2003); Senior Vice President and General Counsel of OFI Institutional Asset Management, Inc. (since November 2001); Director of OppenheimerFunds International Distributor Limited (since December 2003); Senior Vice President (May 1985-December 2003). An officer of 105 portfolios in the OppenheimerFunds complex. |
The Fund’s Statement of Additional Information contains additional information about the Fund’s Trustees and Officers and is available without charge, upon request, by calling 1.800.981.2871.
15 | OPPENHEIMER GLOBAL SECURITIES FUND/VA
FUND PERFORMANCE DISCUSSION
Management’s Discussion of Fund Performance. For the fiscal year ended December 31, 2008, Oppenheimer High Income Fund/VA Non-Service shares returned -78.67%, compared to the Merrill Lynch High Yield Master Index, a performance benchmark used by the Fund, which posted a return of - -26.21%. While several factors contributed to these very disappointing results, we believe the most significant factors influencing Fund performance for this reporting period were the volatility of the markets for fixed-income securities throughout 2008 and, later in the period, the Fund’s investments in the high-quality commercial mortgage-backed securities (CMBSs) sector and long-maturity fixed-income securities of highly-rated financial institutions.
In the wake of the continuing mortgage crisis and ensuing global economic downturn, financial markets in general experienced extreme volatility and steep declines during the 12-month reporting period. In particular, the fixed-income markets were subject to high volatility, price declines and lack of liquidity, as were the fixed-income securities and derivative investments based on such securities in which the Fund invested. We believe that even highly-rated mortgage securities suffered declines because of their association by investors with the residential mortgage market, and that market concerns about sub-prime mortgages, and expected default rates in CMBS, affected the prices of higher quality CMBS. This marked a sharp dislocation between security prices and investment fundamentals as to those securities for such higher quality CMBS.
Similarly as major banks experienced balance sheet impairments and government officials scrambled to assemble bailout programs, nearly all debt associated with the financial sector dropped sharply in value, affecting even highly rated corporate debt. This occurred despite the fact that the U.S. government became a senior debt-holder of many struggling financial companies. In such an environment, and particularly after Lehman Brothers collapsed into bankruptcy in September 2008, many investors, engaged in panic selling. This led to a situation in which the prices of most non-Treasury fixed-income securities, or “spread products,” detached from their underlying fundamentals, meaning that a security’s price had little correlation to its true, underlying value. As investors sought protection in U.S. Treasury securities, the volatility in the corporate debt market created a backdrop in which even the highest-rated assets were battered, including the Fund’s investments in high quality CMBSs, non-agency residential mortgage-backed securities (MBSs) and longer-maturity investment grade financial bonds, which we had believed to be fundamentally sound.
At the time the reporting period began, the Fund held positions in highly rated CMBSs and non-agency MBSs, and long-maturity fixed income securities of highly rated financial institutions. These holdings were acquired based on our assessment that they would provide attractive relative valuation opportunities and risk adjusted return, as well as diversification. To avoid large concentrations in individual MBSs and to gain access to the CMBS asset class through an instrument that was broader based and better diversified with respect to geography and property type than individual CMBS, we had pursued CMBS exposure through total return swaps using several CMBS Index securities. In addition, the CMBS Index investments we made were (and are) senior in the capital structure, which means that investors who purchased bonds subordinate to the ones purchased by the Fund would absorb losses from any defaults before the Fund did. The non-agency MBSs we purchased were backed by prime rate, residential jumbo mortgages from highly rated borrowers, not sub-prime borrowers. Additionally, the yield advantage over agency debt was considerable and, we believed, offered a better relative value opportunity than traditional agency mortgage-backed securities. Finally, we saw the opportunity to hold positions in financials due to the higher current yields they offered, and our analysis that the deleveraging process that banks were undergoing would improve their balance sheets.
By the spring of 2008, we saw even more potential value in these three areas and continued to build out our positions. After JPMorgan Chase and the Federal Reserve Board intervened to rescue Bear Stearns, the credit markets rallied markedly during the second quarter and performance in the Fund improved, which we believed validated our investment thesis and instilled confidence about our allocation decisions.
However, as the second half of 2008 began, domestic economic conditions worsened, a global recession loomed and investor panic spread. Three primary performance factors emerged. First, there was an unprecedented and unanticipated widening of credit spreads of mortgage-backed securities over Treasury securities, which accelerated during the month of November, and had a negative impact on the Fund’s positions in total return swaps in the CMBS sector. Second, the historical correlation between highly rated securities and Treasuries and investor behavior in past economic crises did
3 | OPPENHEIMER HIGH INCOME FUND/VA
FUND PERFORMANCE DISCUSSION
not occur in this one. Accordingly, amidst the difficult financial conditions, in a flight to quality, investors flocked to U.S. Treasury securities and not to highly-rated non-Treasury securities, such as the ones the Fund held, which also contributed to the Fund’s poor performance. Third, liquidity virtually disappeared as the markets in mortgage-related instruments effectively shut down. Rather than continuing to expand their positions, traditional financial intermediaries began aggressively shrinking their balance sheets, severely limiting the ability of the Fund’s portfolio team to either scale back or hedge away portfolio holdings that detracted from performance, which had a very negative impact on performance. These events contributed to the Fund’s negative performance and the significant decline in the Fund’s net asset value during the period (and especially in the fourth quarter). Within the challenging constraints of the limited liquidity in the market, we moved to adjust the Fund’s positions in total return swaps in the CMBS sector, and to seek liquidity to position the Fund to deal with the effect of ongoing volatility.
Our decision to gradually improve the credit quality of the Fund’s portfolio hurt us, an ironic event given investors’ overall flight to quality. Over the year, we slowly upgraded the overall credit quality of the Fund’s portfolio to a BB-rating on average, with a significant portion of its assets at an AAA-rating. However, because investors chose Treasury securities in their quest for perceived safety, our efforts to upgrade the Fund’s credit posture did not benefit us. Given our emphasis on higher-quality mortgage-related securities, which suffered markedly this period, our decision to raise the credit posture of the Fund worked against us.
Our investments in the high-yield debt sector of auto-related companies and auto-financing entities severely detracted from the Fund’s returns. Much like the financial sector, many issuers associated with the beleaguered auto industry in 2008 struggled to stay afloat, so our investments in those credits — albeit small — suffered declines significant enough to hurt the Fund’s performance.
Despite these disappointing results, a few factors worked in our favor. First, our allocation to and selectivity within, both specialty chemicals and telecom debt added to performance. These holdings delivered superior yields and suffered less in terms of price declines. Similarly, our investments in energy-related names, an area of the market that for a period fared relatively well, also helped performance.
We continue to assess the changing market conditions and seek to position the Fund to deal with the effects of ongoing market volatility.
Comparing the Fund’s Performance to the Market. The graphs that follow show the performance of a hypothetical $10,000 investment in each share class of the Fund held until December 31, 2008. In the case of Non-Service shares, performance is measured over a ten-year period. In the case of Service shares, performance is measured from inception of the class on September 18, 2001. In the case of Class 3 and Class 4 shares, performance is measured from inception of the class on May 1, 2007. Performance information does not reflect charges that apply to separate accounts investing in the Fund. If these charges were taken into account, performance would be lower. The graphs assume that all dividends and capital gains distributions were reinvested in additional shares. Past performance cannot guarantee future results.
The Fund’s performance is compared to the performance of the Merrill Lynch High Yield Master Index, an unmanaged index of U.S. corporate and government bonds that is a measure of the performance of the high-yield corporate bond market. The index performance includes reinvestment of income but does not reflect transaction fees or expenses. The Fund’s performance reflects the effects of the Fund’s business and operating expenses. While index comparisons may be useful to provide a benchmark for the Fund’s performance, it must be noted that the Fund’s investments are not limited to the investments in the index.
4 | OPPENHEIMER HIGH INCOME FUND/VA
FUND PERFORMANCE DISCUSSION
Non-Service Shares
Comparison of Change in Value of $10,000 Hypothetical Investments in:
Service Shares
Comparison of Change in Value of $10,000 Hypothetical Investments in:
The performance data quoted represents past performance, which does not guarantee future results. The investment return and principal value of an investment in the Fund will fluctuate so that an investor’s shares, when redeemed, may be worth more or less than their original cost. Current performance may be lower or higher than the performance quoted. For performance data current to the most recent month end, call us at 1.800.981.2871. The Fund’s total returns should not be expected to be the same as the returns of other funds, whether or not both funds have the same portfolio managers and/or similar names. The Fund’s total returns do not include the charges associated with the separate account products that offer this Fund. Such performance would have been lower if such charges were taken into account.
5 | OPPENHEIMER HIGH INCOME FUND/VA
FUND PERFORMANCE DISCUSSION
Class 3 Shares
Comparison of Change in Value of $10,000 Hypothetical Investments in:
Class 4 Shares
Comparison of Change in Value of $10,000 Hypothetical Investments in:
The performance data quoted represents past performance, which does not guarantee future results. The investment return and principal value of an investment in the Fund will fluctuate so that an investor’s shares, when redeemed, may be worth more or less than their original cost. Current performance may be lower or higher than the performance quoted. For performance data current to the most recent month end, call us at 1.800.981.2871. The Fund’s total returns should not be expected to be the same as the returns of other funds, whether or not both funds have the same portfolio managers and/or similar names. The Fund’s total returns do not include the charges associated with the separate account products that offer this Fund. Such performance would have been lower if such charges were taken into account.
6 | OPPENHEIMER HIGH INCOME FUND/VA
FUND EXPENSES
Fund Expenses. As a shareholder of the Fund, you incur two types of costs: (1) transaction costs, which may include redemption fees (if applicable); and (2) ongoing costs, including management fees; distribution and service fees; and other Fund expenses. These examples are intended to help you understand your ongoing costs (in dollars) of investing in the Fund and to compare these costs with the ongoing costs of investing in other mutual funds.
The examples are based on an investment of $1,000.00 invested at the beginning of the period and held for the entire 6-month period ended December 31, 2008.
Actual Expenses. The first section of the table provides information about actual account values and actual expenses. You may use the information in this section for the class of shares you hold, together with the amount you invested, to estimate the expense that you paid over the period. Simply divide your account value by $1,000.00 (for example, an $8,600.00 account value divided by $1,000.00 = 8.60), then multiply the result by the number in the first section under the heading entitled “Expenses Paid During Period” to estimate the expenses you paid on your account during this period.
Hypothetical Example for Comparison Purposes. The second section of the table provides information about hypothetical account values and hypothetical expenses based on the Fund’s actual expense ratio for each class of shares, and an assumed rate of return of 5% per year for each class before expenses, which is not the actual return. The hypothetical account values and expenses may not be used to estimate the actual ending account balance or expenses you paid for the period. You may use this information to compare the ongoing costs of investing in the Fund and other funds. To do so, compare this 5% hypothetical example for the class of shares you hold with the 5% hypothetical examples that appear in the shareholder reports of the other funds.
Please note that the expenses shown in the table are meant to highlight your ongoing costs only and do not reflect any charges associated with the separate accounts that offer this Fund. Therefore, the “hypothetical” lines of the table are useful in comparing ongoing costs only, and will not help you determine the relative total costs of owning different funds. In addition, if these separate account charges were included your costs would have been higher.
| | | | | | | | | | | | | |
| | | Beginning | | Ending | | Expenses |
| | | Account | | Account | | Paid During |
| | | Value | | Value | | 6 Months Ended |
| | | July 1, 2008 | | December 31, 2008 | | December 31, 2008 |
| |
| Actual | | | | | | |
| Non-Service shares | | $ | 1,000.00 | | | $ | 224.70 | | | $ | 2.50 | |
| Service shares | | | 1,000.00 | | | | 226.00 | | | | 3.28 | |
| Class 3 | | | 1,000.00 | | | | 222.40 | | | | 2.47 | |
| Class 4 | | | 1,000.00 | | | | 225.50 | | | | 3.47 | |
| | | | | | | | | | | | | |
Hypothetical | | | | | | | | | | | | |
| (5% return before expenses) | | | | | | | | | | | | |
| Non-Service shares | | $ | 1,000.00 | | | $ | 1,021.06 | | | | 4.12 | |
| Service shares | | | 1,000.00 | | | | 1,019.81 | | | | 5.40 | |
| Class 3 | | | 1,000.00 | | | | 1,021.11 | | | | 4.07 | |
| Class 4 | | | 1,000.00 | | | | 1,019.51 | | | | 5.70 | |
Expenses are equal to the Fund’s annualized expense ratio for that class, multiplied by the average account value over the period, multiplied by 184/366 (to reflect the one-half year period). Those annualized expense ratios, excluding indirect expenses from affiliated fund, based on the 6-month period ended December 31, 2008 are as follows:
| | | | | |
| Class | | Expense Ratios |
| |
| Non-Service shares | | | 0.81 | % |
| Service shares | | | 1.06 | |
| Class 3 | | | 0.80 | |
| Class 4 | | | 1.12 | |
The expense ratios reflect reduction to custodian expenses and voluntary waivers or reimbursements of expenses by the Fund’s Manager that can be terminated at any time, without advance notice. The “Financial Highlights” tables in the Fund’s financial statements, included in this report, also show the gross expense ratios, without such waivers or reimbursements and reduction to custodian expenses, if applicable.
7 | OPPENHEIMER HIGH INCOME FUND/VA
THIS PAGE INTENTIONALLY LEFT BLANK.
8 | OPPENHEIMER HIGH INCOME FUND/VA
STATEMENT OF INVESTMENTS December 31, 2008
| | | | | | | | | |
| | | Principal | | | | |
| | | Amount | | | Value | |
| |
Asset-Backed Securities—0.2% | | | | | | | | |
Ameriquest Mortgage Securities, Inc., Home Equity Mtg. Obligations, Series 2005-R10, Cl. A2B, 0.691%, 12/25/351 | | $ | 264,347 | | | $ | 219,060 | |
Mastr Asset-Backed Securities Trust 2005-WF1, Mtg. Pass-Through Certificates, Series 2005-WF1, Cl. A2C, 0.711%, 6/25/351 | | | 128,105 | | | | 113,958 | |
| | | | | | | | |
| Total Asset-Backed Securities (Cost $389,178) | | | | | | | 333,018 | |
| | | | | | | | | |
Mortgage-Backed Obligations—8.2% | | | | | | | | |
Banc of America Commercial Mortgage, Inc., Commercial Mtg. Pass-Through Certificates, Series 2008-1, Cl. AJ, 6.201%, 1/1/181 | | | 1,290,000 | | | | 360,857 | |
Bear Stearns ARM Trust 2006-4, Mtg. Pass-Through Certificates, Series 2006-4, Cl. 2A1, 5.779%, 10/25/361 | | | 103,175 | | | | 49,899 | |
| Citigroup/Deutsche Bank 2007-CD4 Commercial Mortgage Trust, Commercial Mtg. Pass-Through Certificates, Series 2007-CD4, Cl. AJ, 5.398%, 12/1/49 | | | 1,110,000 | | | | 284,426 | |
| CitiMortgage Alternative Loan Trust 2006-A5, Real Estate Mtg. Investment Conduit Pass-Through Certificates: | | | | | | | | |
Series 2006-A5, Cl. 1A1, 0.871%, 10/25/361 | | | 321,924 | | | | 139,163 | |
Series 2006-A5, Cl. 1A13, 0.921%, 10/25/361 | | | 168,278 | | | | 68,752 | |
| CitiMortgage Alternative Loan Trust 2007-A2, Real Estate Mtg. Investment Conduit Pass-Through Certificates, Series 2007-A2, Cl. 1A5, 6%, 2/25/37 | | | 4,183,710 | | | | 2,483,682 | |
| CWALT Alternative Loan Trust 2005-18CB, Mtg. Pass-Through Certificates, Series 2005-18CB, Cl. A8, 5.50%, 5/25/36 | | | 280,000 | | | | 206,920 | |
| CWALT Alternative Loan Trust 2005-85CB, Mtg. Pass-Through Certificates, Series 2005-85CB, Cl. 2A3, 5.50%, 2/25/36 | | | 210,000 | | | | 160,893 | |
| CWALT Alternative Loan Trust 2005-J1, Mtg. Pass-Through Certificates, Series 2005-J1, Cl. 3A1, 6.50%, 8/25/32 | | | 266,323 | | | | 170,574 | |
| Federal Home Loan Mortgage Corp., Interest-Only Stripped Mtg.-Backed Security: | | | | | | | | |
Series 2520, Cl. SE, 70.518%, 5/15/222 | | | 287,271 | | | | 28,321 | |
Series 2527, Cl. SG, 31.83%, 2/15/322 | | | 263,278 | | | | 16,870 | |
Series 2531, Cl. ST, 35.211%, 2/15/302 | | | 302,908 | | | | 19,682 | |
Series 2574, Cl. IN, (2.915)%, 12/15/222 | | | 1,477,355 | | | | 180,342 | |
Series 2989, Cl. TS, 77.854%, 6/15/252 | | | 1,556,188 | | | | 114,740 | |
| Federal National Mortgage Assn., 5.50%, 11/1/33 | | | 92,397 | | | | 94,957 | |
| Federal National Mortgage Assn., Interest-Only Stripped Mtg.-Backed Security: | | | | | | | | |
Trust 2002-60, Cl. SM, 42.196%, 8/25/322 | | | 731,286 | | | | 75,999 | |
Trust 2002-7, Cl. SK, 43.23%, 1/25/322 | | | 280,423 | | | | 29,784 | |
Trust 2002-77, Cl. BS, 32.357%, 12/18/322 | | | 435,063 | | | | 57,766 | |
Trust 2002-90, Cl. SN, 43.76%, 8/25/322 | | | 375,767 | | | | 40,446 | |
Trust 2002-90, Cl. SY, 45.591%, 9/25/322 | | | 193,343 | | | | 20,487 | |
Trust 2003-14, Cl. OI, 0.356%, 3/25/332 | | | 270,531 | | | | 46,687 | |
Trust 2003-23, Cl. ES, 75.427%, 10/25/222 | | | 602,492 | | | | 43,884 | |
Trust 2003-52, Cl. NS, 63.973%, 6/25/232 | | | 648,223 | | | | 56,712 | |
Trust 2003-89, Cl. XS, 20.272%, 11/25/322 | | | 490,388 | | | | 38,313 | |
Trust 2005-86, Cl. AI, (4.411)%, 10/1/352 | | | 279,662 | | | | 38,991 | |
Trust 2006-33, Cl. SP, 48.204%, 5/25/362 | | | 437,903 | | | | 45,623 | |
Trust 302, Cl. 2, (9.691)%, 6/1/292 | | | 551,700 | | | | 78,044 | |
Trust 331, Cl. 18, 13.467%, 2/1/332 | | | 808,975 | | | | 91,782 | |
Trust 334, Cl. 3, 13.538%, 7/1/332 | | | 287,209 | | | | 32,225 | |
Trust 334, Cl. 4, 13.717%, 7/1/332 | | | 452,116 | | | | 50,720 | |
Trust 339, Cl. 12, 13.466%, 7/1/332 | | | 124,953 | | | | 16,048 | |
Trust 339, Cl. 17, 13.133%, 8/1/332 | | | 1,212,918 | | | | 193,240 | |
Trust 339, Cl. 8, 12.211%, 8/1/332 | | | 158,642 | | | | 17,803 | |
Trust 342, Cl. 2, (6.399)%, 9/1/332 | | | 83,493 | | | | 11,939 | |
Trust 343, Cl. 13, 12.001%, 9/1/332 | | | 100,391 | | | | 10,617 | |
Trust 343, Cl. 18, 14.18%, 5/1/342 | | | 291,725 | | | | 40,894 | |
Trust 343, Cl. 20, 13.788%, 10/1/332 | | | 1,142,541 | | | | 161,592 | |
Trust 346, Cl. 2, (12.874)%, 12/1/332 | | | 506,450 | | | | 60,838 | |
Trust 351, Cl. 10, 14.256%, 4/1/342 | | | 265,431 | | | | 28,760 | |
Trust 355, Cl. 7, 9.047%, 11/1/332 | | | 182,157 | | | | 23,750 | |
Trust 356, Cl. 6, 13.305%, 12/1/332 | | | 235,570 | | | | 25,706 | |
Trust 364, Cl. 16, 14.77%, 9/1/352 | | | 130,015 | | | | 20,678 | |
| First Horizon Alternative Mortgage Securities Trust 2004-FA2, Mtg. Pass-Through Certificates, Series 2004-FA2, Cl. 3A1, 6%, 1/25/35 | | | 85,160 | | | | 62,261 | |
| GMAC Mortgage Corp. Loan Trust, Mtg. Pass-Through Certificates, Series 2004-J4, Cl. A7, 5.50%, 9/25/34 | | | 190,000 | | | | 151,900 | |
| GSR Mortgage Loan Trust 2005-4F, Mtg. Pass-Through Certificates, Series 2005-4F, Cl. 6A1, 6.50%, 2/25/35 | | | 211,636 | | | | 174,488 | |
GSR Mortgage Loan Trust 2005-AR7, Mtg. Pass-Through Certificates, Series 2005-AR7, Cl. 3A1, 5.14%, 11/25/351 | | | 1,324,359 | | | | 837,916 | |
| JPMorgan Chase Commercial Mortgage Securities Corp., Commercial Mtg. Pass-Through Certificates: | | | | | | | | |
| Series 2007-CB15, Cl. AJ, 5.502%, 6/1/47 | | | 430,000 | | | | 112,517 | |
Series 2008-C2, Cl. AJ, 6.579%, 2/1/511 | | | 2,170,000 | | | | 590,429 | |
F1 | OPPENHEIMER HIGH INCOME FUND/VA
STATEMENT OF INVESTMENTS Continued
| | | | | | | | | |
| | | Principal | | | | |
| | | Amount | | | Value | |
| |
Mortgage-Backed Obligations Continued | | | | | | | | |
| LB-UBS Commercial Mortgage Trust 2003-C5, Commercial Mtg. Pass-Through Certificates, Series 2003-C5, Cl. A2, 3.478%, 7/15/27 | | $ | 19,707 | | | $ | 19,592 | |
Mastr Asset Securitization Trust 2006-3, Mtg. Pass-Through Certificates, Series 2006-3, Cl. 2A1, 0.921%, 10/25/361 | | | 4,084,541 | | | | 2,574,946 | |
Merrill Lynch Mortgage Investors Trust 2007-3, Mtg. Pass-Through Certificates, Series 2007-3, Cl. 1A1, 5.801%, 9/1/371 | | | 145,305 | | | | 123,773 | |
Merrill Lynch Mortgage Trust 2006-C1, Commercial Mtg. Pass-Through Certificates, Series 2006-C1, Cl. AJ, 5.657%, 5/1/391 | | | 890,000 | | | | 280,635 | |
Morgan Stanley Mortgage Loan Trust 2006-AR, Mtg. Pass-Through Certificates, Series 2006-AR, Cl. 5A3, 5.416%, 6/25/361 | | | 130,000 | | | | 90,100 | |
WaMu Mortgage Pass-Through Certificates 2006-AR12 Trust, Mtg. Pass-Through Certificates, Series 2006-AR12, Cl. 2A1, 5.75%, 10/25/361 | | | 408,228 | | | | 231,434 | |
| WaMu Mortgage Pass-Through Certificates 2006-AR14 Trust, Mtg. Pass-Through Certificates: | | | | | | | | |
Series 2006-AR14, Cl. 1A7, 5.631%, 11/1/361 | | | 1,631,248 | | | | 529,759 | |
Series 2006-AR14, Cl. 2A4, 5.752%, 11/1/361,3 | | | 445,374 | | | | 111,343 | |
WaMu Mortgage Pass-Through Certificates 2006-AR8 Trust, Mtg. Pass-Through Certificates, Series 2006-AR8, Cl. 2A1, 6.127%, 8/25/361 | | | 381,579 | | | | 253,827 | |
| WaMu Mortgage Pass-Through Certificates 2007-HY1 Trust, Mtg. Pass-Through Certificates: | | | | | | | | |
Series 2007-HY1, Cl. 1A2, 5.706%, 2/25/371,3 | | | 79,440 | | | | 18,271 | |
Series 2007-HY1, Cl. 2A4, 5.863%, 2/1/371 | | | 728,270 | | | | 313,094 | |
WaMu Mortgage Pass-Through Certificates 2007-HY2 Trust, Mtg. Pass-Through Certificates, Series 2007-HY2, Cl. 1A2, 5.606%, 12/1/361,3 | | | 1,744,744 | | | | 279,159 | |
WaMu Mortgage Pass-Through Certificates 2007-HY3 Trust, Mtg. Pass-Through Certificates, Series 2007-HY3, Cl. 2A2, 5.668%, 3/1/371 | | | 208,087 | | | | 53,781 | |
WaMu Mortgage Pass-Through Certificates 2007-HY4 Trust, Mtg. Pass-Through Certificates, Series 2007-HY4, Cl. 5A1, 5.548%, 11/1/361 | | | 140,645 | | | | 92,425 | |
WaMu Mortgage Pass-Through Certificates 2007-HY5 Trust, Mtg. Pass-Through Certificates, Series 2007-HY5, Cl. 2A3, 5.647%, 5/1/371 | | | 149,528 | | | | 95,618 | |
Wells Fargo Mortgage-Backed Securities 2004-R Trust, Mtg. Pass-Through Certificates, Series 2004-R, Cl. 2A1, 4.368%, 9/1/341 | | | 67,855 | | | | 48,576 | |
Wells Fargo Mortgage-Backed Securities 2006-AR10 Trust, Mtg. Pass-Through Certificates, Series 2006-AR10, Cl. 4A1, 5.557%, 7/25/361 | | | 199,232 | | | | 130,678 | |
Wells Fargo Mortgage-Backed Securities 2006-AR12 Trust, Mtg. Pass-Through Certificates, Series 2006-AR12, Cl. 2A1, 6.099%, 9/25/361 | | | 333,401 | | | | 214,326 | |
| | | | | | | | |
Total Mortgage-Backed Obligations
(Cost $23,966,497) | | | | | | | 13,130,254 | |
| | | | | | | | | |
Corporate Bonds and Notes—65.4% | | | | | | | | |
Consumer Discretionary—22.2% | | | | | | | | |
Auto Components—1.0% | | | | | | | | |
| Goodyear Tire & Rubber Co. (The): | | | | | | | | |
| 7.857% Nts., 8/15/11 | | | 330,000 | | | | 275,550 | |
| 9% Sr. Unsec. Nts., 7/1/15 | | | 230,000 | | | | 186,300 | |
| Lear Corp., 8.75% Sr. Unsec. Nts., Series B, 12/1/16 | | | 3,945,000 | | | | 1,163,775 | |
| | | | | | | | |
| | | | | | | | 1,625,625 | |
| | | | | | | | | |
Automobiles—2.8% | | | | | | | | |
| Case New Holland, Inc., 7.125% Sr. Unsec. Nts., 3/1/14 | | | 4,390,000 | | | | 3,138,850 | |
| General Motors Acceptance Corp., 8% Bonds, 11/1/31 | | | 2,210,000 | | | | 1,295,416 | |
| | | | | | | | |
| | | | | | | | 4,434,266 | |
| | | | | | | | | |
Diversified Consumer Services—0.2% | | | | | | | | |
| Service Corp. International, 6.75% Sr. Unsec. Nts., 4/1/15 | | | 465,000 | | | | 369,675 | |
Hotels, Restaurants & Leisure—6.3% | | | | | | | | |
CCM Merger, Inc., 8% Unsec. Nts., 8/1/134 | | | 1,655,000 | | | | 860,600 | |
Greektown Holdings, Inc., 10.75% Sr. Nts., 12/1/134,5,6 | | | 2,525,000 | | | | 606,000 | |
Harrah’s Operating Co., Inc., 10.75% Sr. Unsec. Nts., 2/1/164 | | | 2,620,000 | | | | 759,800 | |
| Isle of Capri Casinos, Inc., 7% Sr. Unsec. Sub. Nts., 3/1/14 | | | 2,650,000 | | | | 1,139,500 | |
F2 | OPPENHEIMER HIGH INCOME FUND/VA
| | | | | | | | | |
| | | Principal | | | | |
| | | Amount | | | Value | |
| |
Hotels, Restaurants & Leisure Continued | | | | | | | | |
Mashantucket Pequot Tribe, 8.50% Bonds, Series A, 11/15/154 | | $ | 1,770,000 | | | $ | 703,575 | |
| MGM Mirage, Inc., 8.375% Sr. Unsec. Sub. Nts., 2/1/11 | | | 780,000 | | | | 468,000 | |
| Mohegan Tribal Gaming Authority: | | | | | | | | |
| 6.125% Sr. Unsec. Sub. Nts., 2/15/13 | | | 1,925,000 | | | | 1,222,375 | |
| 8% Sr. Sub. Nts., 4/1/12 | | | 3,415,000 | | | | 2,100,225 | |
| Pinnacle Entertainment, Inc., 8.25% Sr. Unsec. Sub. Nts., 3/15/12 | | | 885,000 | | | | 677,025 | |
Pokagon Gaming Authority, 10.375% Sr. Nts., 6/15/144 | | | 540,000 | | | | 467,100 | |
| Station Casinos, Inc., 6.50% Sr. Unsec. Sub. Nts., 2/1/14 | | | 5,860,000 | | | | 366,250 | |
| Trump Entertainment Resorts, Inc., 8.50% Sec. Nts., 6/1/15 | | | 1,350,000 | | | | 185,625 | |
| Wynn Las Vegas LLC/Wynn Las Vegas Capital Corp., 6.625% Nts., 12/1/14 | | | 790,000 | | | | 600,400 | |
| | | | | | | | |
| | | | | | | | 10,156,475 | |
| | | | | | | | | |
Household Durables—2.2% | | | | | | | | |
| Centex Corp., 5.80% Sr. Unsec. Nts., 9/15/09 | | | 1,175,000 | | | | 1,122,125 | |
| Jarden Corp., 7.50% Sr. Unsec. Sub. Nts., 5/1/17 | | | 625,000 | | | | 429,688 | |
| K. Hovnanian Enterprises, Inc.: | | | | | | | | |
| 7.75% Sr. Unsec. Sub. Nts., 5/15/13 | | | 545,000 | | | | 122,625 | |
| 8.875% Sr. Sub. Nts., 4/1/12 | | | 1,275,000 | | | | 376,125 | |
| Toll Corp., 8.25% Sr. Sub. Nts., 12/1/11 | | | 1,110,000 | | | | 1,015,650 | |
| William Lyon Homes, Inc.: | | | | | | | | |
| 7.50% Sr. Unsec. Nts., 2/15/14 | | | 220,000 | | | | 53,900 | |
| 10.75% Sr. Nts., 4/1/13 | | | 1,510,000 | | | | 385,050 | |
| | | | | | | | |
| | | | | | | | 3,505,163 | |
| | | | | | | | | |
Leisure Equipment & Products—0.4% | | | | | | | | |
| Leslie’s Poolmart, Inc., 7.75% Sr. Unsec. Nts., 2/1/13 | | | 795,000 | | | | 639,975 | |
Media—7.8% | | | | | | | | |
| Allbritton Communications Co., 7.75% Sr. Unsec. Sub. Nts., 12/15/12 | | | 565,000 | | | | 280,381 | |
| AMC Entertainment, Inc., 8% Sr. Unsec. Sub. Nts., 3/1/14 | | | 990,000 | | | | 613,800 | |
| American Media Operations, Inc.: | | | | | | | | |
8.875% Sr. Unsec. Sub. Nts., 1/15/113 | | | 32,724 | | | | 7,854 | |
| 8.875% Sr. Unsec. Sub. Nts., 1/15/11 | | | 875,000 | | | | 180,469 | |
| CCH I LLC/CCH I Capital Corp., 11% Sr. Sec. Nts., 10/1/15 | | | 1,455,000 | | | | 261,900 | |
Cinemark, Inc., 0%/9.75% Sr. Unsec. Nts., 3/15/147 | | | 835,000 | | | | 679,481 | |
| CSC Holdings, Inc., 7.625% Sr. Unsec. Unsub. Nts., Series B, 4/1/11 | | | 450,000 | | | | 426,375 | |
| EchoStar DBS Corp., 6.375% Sr. Unsec. Nts., 10/1/11 | | | 1,180,000 | | | | 1,100,350 | |
| Idearc, Inc., 8% Sr. Unsec. Nts., 11/15/16 | | | 3,045,000 | | | | 243,600 | |
| Lamar Media Corp., 7.25% Sr. Unsec. Sub. Nts., 1/1/13 | | | 790,000 | | | | 633,975 | |
| Lin Television Corp., 6.50% Sr. Sub. Nts., 5/15/13 | | | 1,035,000 | | | | 499,388 | |
Marquee Holdings, Inc., 9.505% Sr. Nts., 8/15/141 | | | 2,180,000 | | | | 1,122,700 | |
| MediaNews Group, Inc.: | | | | | | | | |
| 6.375% Sr. Sub. Nts., 4/1/14 | | | 1,460,000 | | | | 100,375 | |
| 6.875% Sr. Unsec. Sub. Nts., 10/1/13 | | | 2,510,000 | | | | 172,563 | |
| NTL Cable plc, 9.125% Sr. Nts., 8/15/16 | | | 1,340,000 | | | | 998,300 | |
| R.H. Donnelley Corp.: | | | | | | | | |
| 6.875% Sr. Nts., 1/15/13 | | | 1,780,000 | | | | 249,200 | |
| 6.875% Sr. Nts., Series A-2, 1/15/13 | | | 1,960,000 | | | | 274,400 | |
| Radio One, Inc., 8.875% Sr. Unsec. Sub. Nts., Series B, 7/1/11 | | | 430,000 | | | | 213,925 | |
Rainbow National Services LLC, 8.75% Sr. Nts., 9/1/124 | | | 275,000 | | | | 248,875 | |
| Sinclair Broadcast Group, Inc., 8% Sr. Unsec. Sub. Nts., 3/15/12 | | | 2,700,000 | | | | 2,038,500 | |
Videotron Ltd., 9.125% Sr. Nts., 4/15/184 | | | 445,000 | | | | 416,075 | |
| Virgin Media Finance plc, 8.75% Sr. Unsec. Nts., 4/15/14 | | | 410,000 | | | | 309,550 | |
| Warner Music Group Corp., 7.375% Sr. Sub. Bonds, 4/15/14 | | | 800,000 | | | | 472,000 | |
WMG Holdings Corp., 0%/9.50% Sr. Nts., 12/15/147 | | | 2,335,000 | | | | 875,625 | |
| | | | | | | | |
| | | | | | | | 12,419,661 | |
| | | | | | | | | |
Specialty Retail—1.1% | | | | | | | | |
| Claire’s Stores, Inc., 10.50% Sr. Unsec. Sub. Nts., 6/1/17 | | | 2,805,000 | | | | 490,875 | |
| GameStop Corp., 8% Sr. Unsec. Nts., 10/1/12 | | | 490,000 | | | | 458,150 | |
| Sally Holdings LLC: | | | | | | | | |
| 9.25% Sr. Unsec. Nts., 11/15/14 | | | 450,000 | | | | 389,250 | |
| 10.50% Sr. Unsec. Sub. Nts., 11/15/16 | | | 545,000 | | | | 373,325 | |
| | | | | | | | |
| | | | | | | | 1,711,600 | |
| | | | | | | | | |
Textiles, Apparel & Luxury Goods—0.4% | | | | | | | | |
| Levi Strauss & Co., 9.75% Sr. Unsec. Unsub. Nts., 1/15/15 | | | 905,000 | | | | 674,225 | |
F3 | OPPENHEIMER HIGH INCOME FUND/VA
STATEMENT OF INVESTMENTS Continued
| | | | | | | | | |
| | | Principal | | | | |
| | | Amount | | | Value | |
| |
Consumer Staples—3.8% | | | | | | | | |
Food & Staples Retailing—1.9% | | | | | | | | |
| Albertson’s, Inc., 8% Sr. Unsec. Debs., 5/1/31 | | $ | 3,560,000 | | | $ | 2,153,800 | |
| Delhaize America, Inc., 9% Unsub. Debs., 4/15/31 | | | 900,000 | | | | 912,381 | |
Real Time Data Co., 11% Nts., 5/31/093,5,6,8 | | | 476,601 | | | | — | |
| | | | | | | | |
| | | | | | | | 3,066,181 | |
| | | | | | | | | |
Food Products—1.6% | | | | | | | | |
| Dole Food Co., Inc.: | | | | | | | | |
| 7.25% Sr. Unsec. Nts., 6/15/10 | | | 420,000 | | | | 295,050 | |
| 8.625% Sr. Nts., 5/1/09 | | | 687,000 | | | | 625,170 | |
| 8.875% Sr. Unsec. Nts., 3/15/11 | | | 146,000 | | | | 91,980 | |
| Pinnacle Foods Finance LLC/Pinnacle Foods Finance Corp., 10.625% Sr. Sub. Nts., 4/1/17 | | | 2,475,000 | | | | 1,348,875 | |
| Smithfield Foods, Inc., 7% Sr. Nts., 8/1/11 | | | 360,000 | | | | 257,400 | |
| | | | | | | | |
| | | | | | | | 2,618,475 | |
| | | | | | | | | |
Personal Products—0.3% | | | | | | | | |
| Elizabeth Arden, Inc., 7.75% Sr. Unsec. Sub. Nts., 1/15/14 | | | 625,000 | | | | 409,375 | |
Energy—7.4% | | | | | | | | |
Energy Equipment & Services—1.1% | | | | | | | | |
Helix Energy Solutions Group, Inc., 9.50% Sr. Unsec. Nts., 1/15/164 | | | 1,210,000 | | | | 647,350 | |
| Key Energy Services, Inc., 8.375% Sr. Unsec. Nts., 12/1/14 | | | 1,740,000 | | | | 1,157,100 | |
| | | | | | | | |
| | | | | | | | 1,804,450 | |
| | | | | | | | | |
Oil, Gas & Consumable Fuels—6.3% | | | | | | | | |
Atlas Energy Resources LLC, 10.75% Sr. Nts., 2/1/184 | | | 1,590,000 | | | | 977,850 | |
| Atlas Pipeline Partners LP, 8.125% Sr. Unsec. Nts., 12/15/15 | | | 630,000 | | | | 428,400 | |
| Berry Petroleum Co., 8.25% Sr. Sub. Nts., 11/1/16 | | | 1,035,000 | | | | 564,075 | |
Copano Energy LLC/Copano Energy Finance Corp., 7.75% Sr. Nts., 6/1/184 | | | 1,465,000 | | | | 996,200 | |
| Denbury Resources, Inc., 7.50% Sr. Sub. Nts., 12/15/15 | | | 905,000 | | | | 647,075 | |
Enterprise Products Operating LP, 8.375% Jr. Sub. Nts., 8/1/661 | | | 2,075,000 | | | | 1,142,553 | |
| Forest Oil Corp., 7.75% Sr. Nts., 5/1/14 | | | 795,000 | | | | 671,775 | |
| Kinder Morgan Energy Partners LP, 7.30% Sr. Unsec. Nts., 8/15/33 | | | 1,382,000 | | | | 1,150,092 | |
| Quicksilver Resources, Inc.: | | | | | | | | |
| 7.125% Sr. Sub. Nts., 4/1/16 | | | 1,720,000 | | | | 928,800 | |
| 8.25% Sr. Unsec. Nts., 8/1/15 | | | 340,000 | | | | 217,600 | |
| Sabine Pass LNG LP: | | | | | | | | |
| 7.25% Sr. Sec. Nts., 11/30/13 | | | 450,000 | | | | 330,750 | |
| 7.50% Sr. Sec. Nts., 11/30/16 | | | 1,325,000 | | | | 960,625 | |
| Tesoro Corp., 6.625% Sr. Unsec. Nts., 11/1/15 | | | 1,855,000 | | | | 1,085,175 | |
| | | | | | | | |
| | | | | | | | 10,100,970 | |
Financials—11.1% | | | | | | | | |
Capital Markets—1.4% | | | | | | | | |
| Berry Plastics Holding Corp., 8.875% Sr. Sec. Nts., 9/15/14 | | | 2,255,000 | | | | 992,200 | |
| Goldman Sachs Capital, Inc. (The), 6.345% Sub. Bonds, 2/15/34 | | | 1,350,000 | | | | 982,188 | |
Lehman Brothers Holdings, Inc., 7.50% Sub. Nts., 5/11/386 | | | 5,341,000 | | | | 534 | |
| Travelport LLC, 11.875% Sr. Unsec. Sub. Nts., 9/1/16 | | | 990,000 | | | | 282,150 | |
| | | | | | | | |
| | | | | | | | 2,257,072 | |
| | | | | | | | | |
Commercial Banks—4.4% | | | | | | | | |
Barclays Bank plc, 6.278% Perpetual Bonds9 | | | 4,940,000 | | | | 2,859,618 | |
HBOS plc, 6.413% Sub. Perpetual Bonds, Series A4,9 | | | 5,700,000 | | | | 2,214,256 | |
HSBC Finance Capital Trust IX, 5.911% Nts., 11/30/351 | | | 4,900,000 | | | | 2,052,473 | |
| | | | | | | | |
| | | | | | | | 7,126,347 | |
| | | | | | | | | |
Consumer Finance—1.4% | | | | | | | | |
| SLM Corp., 4.50% Nts., Series A, 7/26/10 | | | 2,600,000 | | | | 2,257,252 | |
Diversified Financial Services—3.0% | | | | | | | | |
| AAC Group Holding Corp., 0%/10.25% Sr. Unsec. Nts., 10/1/127 | | | 200,000 | | | | 133,000 | |
| Bank of America Corp.: | | | | | | | | |
8% Unsec. Perpetual Bonds, Series K9 | | | 830,000 | | | | 597,866 | |
8.125% Perpetual Bonds, Series M9 | | | 285,000 | | | | 213,536 | |
| Citigroup, Inc.: | | | | | | | | |
8.30% Jr. Sub. Bonds, 12/21/571 | | | 585,000 | | | | 452,192 | |
8.40% Perpetual Bonds, Series E9 | | | 2,345,000 | | | | 1,551,311 | |
| JPMorgan Chase & Co., 7.90% Perpetual Bonds, Series 19 | | | 2,130,000 | | | | 1,776,475 | |
| | | | | | | | |
| | | | | | | | 4,724,380 | |
| | | | | | | | | |
Insurance—0.7% | | | | | | | | |
MetLife Capital Trust X, 9.25% Sec. Bonds, 4/8/381 | | | 200,000 | | | | 139,777 | |
MetLife, Inc., 6.40% Jr. Unsec. Sub. Bonds, 12/15/361 | | | 1,210,000 | | | | 727,678 | |
Prudential Holdings LLC, 8.695% Bonds, Series C, 12/18/234 | | | 210,000 | | | | 202,788 | |
F4 | OPPENHEIMER HIGH INCOME FUND/VA
| | | | | | | | | |
| | | Principal | | | | |
| | | Amount | | | Value | |
| |
Insurance Continued | | | | | | | | |
Prudential Insurance Co. of America, 8.30% Nts., 7/1/254 | | $ | 160,000 | | | $ | 108,118 | |
| | | | | | | | |
| | | | | | | | 1,178,361 | |
| | | | | | | | | |
Real Estate Investment Trusts—0.2% | | | | | | | | |
iStar Financial, Inc., 2.471% Sr. Unsec. Nts., 3/16/091 | | | 415,000 | | | | 299,319 | |
Health Care—8.2% | | | | | | | | |
Health Care Equipment & Supplies—1.4% | | | | | | | | |
Novelis, Inc., 7.25% Sr. Unsec. Nts., 2/15/151 | | | 1,750,000 | | | | 1,023,750 | |
Universal Hospital Services, Inc., 8.50% Sr. Sec. Nts., 6/1/158 | | | 1,790,000 | | | | 1,279,850 | |
| | | | | | | | |
| | | | | | | | 2,303,600 | |
| | | | | | | | | |
Health Care Providers & Services—5.9% | | | | | | | | |
Catalent Pharma Solutions, Inc., 9.50% Sr. Unsec. Nts., 4/15/158 | | | 1,155,000 | | | | 444,675 | |
| Community Health Systems, Inc., 8.875% Sr. Unsec. Nts., 7/15/15 | | | 490,000 | | | | 453,250 | |
| DaVita, Inc., 6.625% Sr. Unsec. Nts., 3/15/13 | | | 705,000 | | | | 673,275 | |
| Fresenius Medical Care Capital Trust IV, 7.875% Sr. Sub. Nts., 6/15/11 | | | 235,000 | | | | 224,425 | |
| HCA, Inc.: | | | | | | | | |
| 6.375% Nts., 1/15/15 | | | 2,490,000 | | | | 1,531,350 | |
| 9.25% Sr. Sec. Nts., 11/15/16 | | | 345,000 | | | | 317,400 | |
| HealthSouth Corp., 10.75% Sr. Unsec. Nts., 6/15/16 | | | 1,350,000 | | | | 1,245,375 | |
| Select Medical Corp., 7.625% Sr. Unsec. Sub. Nts., 2/1/15 | | | 2,290,000 | | | | 1,225,150 | |
US Oncology Holdings, Inc., 8.334% Sr. Unsec. Nts., 3/15/121,8 | | | 1,057,000 | | | | 671,195 | |
| US Oncology, Inc., 9% Sr. Unsec. Nts., 8/15/12 | | | 515,000 | | | | 471,225 | |
Vanguard Health Holding Co. I LLC, 0%/11.25% Sr. Nts., 10/1/157 | | | 2,765,000 | | | | 2,184,350 | |
| | | | | | | | |
| | | | | | | | 9,441,670 | |
| | | | | | | | | |
Pharmaceuticals—0.9% | | | | | | | | |
| DJO Finance LLC/DJO Finance Corp., 10.875% Sr. Unsec. Nts., 11/15/14 | | | 1,915,000 | | | | 1,388,375 | |
Industrials—3.9% | | | | | | | | |
Aerospace & Defense—0.7% | | | | | | | | |
| BE Aerospace, Inc., 8.50% Sr. Unsec. Nts., 7/1/18 | | | 245,000 | | | | 221,113 | |
| L-3 Communications Corp., 5.875% Sr. Sub. Nts., 1/15/15 | | | 1,020,000 | | | | 923,100 | |
| | | | | | | | |
| | | | | | | | 1,144,213 | |
| | | | | | | | | |
Building Products—0.2% | | | | | | | | |
| Nortek, Inc., 8.50% Sr. Unsec. Unsub. Nts., 9/1/14 | | | 860,000 | | | | 202,100 | |
Commercial Services & Supplies—1.5% | | | | | | | | |
| Allied Waste North America, Inc., 7.375% Sr. Sec. Nts., Series B, 4/15/14 | | | 1,195,000 | | | | 1,130,482 | |
American Pad & Paper Co., 13% Sr. Sub. Nts., Series B, 11/15/053,5,6 | | | 200,000 | | | | — | |
| Iron Mountain, Inc., 8.625% Sr. Unsec. Sub. Nts., 4/1/13 | | | 1,300,000 | | | | 1,228,500 | |
| | | | | | | | |
| | | | | | | | 2,358,982 | |
| | | | | | | | | |
Road & Rail—0.9% | | | | | | | | |
| Avis Budget Car Rental LLC, 7.625% Sr. Unsec. Unsub. Nts., 5/15/14 | | | 2,370,000 | | | | 699,150 | |
| Hertz Corp.: | | | | | | | | |
| 8.875% Sr. Unsec. Nts., 1/1/14 | | | 90,000 | | | | 55,800 | |
| 10.50% Sr. Unsec. Sub. Nts., 1/1/16 | | | 1,570,000 | | | | 724,163 | |
| | | | | | | | |
| | | | | | | | 1,479,113 | |
| | | | | | | | | |
Trading Companies & Distributors—0.6% | | | | | | | | |
| United Rentals, Inc., 7% Sr. Sub. Nts., 2/15/14 | | | 1,605,000 | | | | 987,075 | |
Information Technology—0.0% | | | | | | | | |
Communications Equipment—0.0% | | | | | | | | |
Orion Network Systems, Inc., 12.50% Sr. Unsub. Nts., 1/15/073,5,6 | | | 1,150,000 | | | | 12 | |
Internet Software & Services—0.0% | | | | | | | | |
Exodus Communications, Inc., 10.75% Sr. Nts., 12/15/093,5,6 | | 844,866 EUR | | | | — | |
NorthPoint Communications Group, Inc., 12.875% Nts., 2/15/103,5,6 | | | 240,208 | | | | — | |
| | | | | | | | |
| | | | | | | | — | |
| | | | | | | | | |
Materials—4.3% | | | | | | | | |
Chemicals—0.4% | | | | | | | | |
| Momentive Performance Materials, Inc., 11.50% Sr. Unsec. Sub. Nts., 12/1/16 | | | 2,255,000 | | | | 676,500 | |
Construction Materials—0.2% | | | | | | | | |
NTK Holdings, Inc., 0%/10.75% Sr. Unsec. Nts., 3/1/147 | | | 1,535,000 | | | | 337,700 | |
Containers & Packaging—1.9% | | | | | | | | |
| Crown Americas, Inc., 7.75% Sr. Nts., 11/15/15 | | | 720,000 | | | | 720,000 | |
| Graham Packaging Co., Inc., 9.875% Sr. Unsec. Sub. Nts., 10/15/14 | | | 1,315,000 | | | | 815,300 | |
| Graphic Packaging International Corp., 8.50% Sr. Nts., 8/15/11 | | | 1,715,000 | | | | 1,440,600 | |
| | | | | | | | |
| | | | | | | | 2,975,900 | |
F5 | OPPENHEIMER HIGH INCOME FUND/VA
STATEMENT OF INVESTMENTS Continued
| | | | | | | | | |
| | | Principal | | | | |
| | | Amount | | | Value | |
| |
Metals & Mining—1.5% | | | | | | | | |
| Freeport-McMoRan Copper & Gold, Inc., 8.375% Sr. Nts., 4/1/17 | | $ | 1,695,000 | | | $ | 1,391,826 | |
| Ispat Inland ULC, 9.75% Sr. Sec. Nts., 4/1/14 | | | 660,000 | | | | 564,936 | |
| Steel Dynamics, Inc., 7.375% Sr. Unsec. Unsub. Nts., 11/1/12 | | | 600,000 | | | | 441,000 | |
| | | | | | | | |
| | | | | | | | 2,397,762 | |
| | | | | | | | | |
Paper & Forest Products—0.3% | | | | | | | | |
| NewPage Corp., 10% Sr. Sec. Nts., 5/1/12 | | | 990,000 | | | | 440,550 | |
Telecommunication Services—4.3% | | | | | | | | |
Diversified Telecommunication Services—2.4% | | | | | | | | |
| Citizens Communications Co., 6.25% Sr. Nts., 1/15/13 | | | 1,280,000 | | | | 1,094,400 | |
| FairPoint Communications, Inc., 13.125% Sr. Nts., 4/1/18 | | | 1,340,000 | | | | 649,900 | |
| Qwest Corp., 8.875% Unsec. Unsub. Nts., 3/15/12 | | | 1,080,000 | | | | 1,004,400 | |
Teligent, Inc., 11.50% Sr. Nts., 12/1/083,5,6 | | | 400,000 | | | | — | |
| Windstream Corp.: | | | | | | | | |
| 8.125% Sr. Unsec. Unsub. Nts., 8/1/13 | | | 700,000 | | | | 647,500 | |
| 8.625% Sr. Unsec. Unsub. Nts., 8/1/16 | | | 570,000 | | | | 507,300 | |
Winstar Communications, Inc., 12.75% Sr. Nts., 4/15/103,5,6 | | | 1,000,000 | | | | — | |
| | | | | | | | |
| | | | | | | | 3,903,500 | |
| | | | | | | | | |
Wireless Telecommunication Services—1.9% | | | | | | | | |
| American Tower Corp., 7.50% Sr. Nts., 5/1/12 | | | 430,000 | | | | 425,700 | |
| Nextel Communications, Inc., 7.375% Sr. Nts., Series D, 8/1/15 | | | 2,040,000 | | | | 857,190 | |
| Sprint Capital Corp., 8.75% Nts., 3/15/32 | | | 2,470,000 | | | | 1,670,389 | |
| | | | | | | | |
| | | | | | | | 2,953,279 | |
| | | | | | | | | |
Utilities—0.2% | | | | | | | | |
Gas Utilities—0.2% | | | | | | | | |
Ferrellgas Partners LP, 6.75% Sr. Nts,, 5/1/144 | | | 520,000 | | | | 361,400 | |
| | | | | | | | |
Total Corporate Bonds and Notes
(Cost $184,573,474) | | | | | | | 104,730,578 | |
| | | | | | | | | |
| | | Shares | | | Value | |
| |
Preferred Stocks—0.4% | | | | | | | | |
AmeriKing, Inc., 13% Cum. Sr. Exchangeable, Non-Vtg.3,5,8 | | | 13,764 | | | $ | — | |
| Eagle-Picher Holdings, Inc., | | | | | | | | |
11.75% Cum. Exchangeable, Series B, Non-Vtg.3,5 | | | 8,000 | | | | — | |
| Fannie Mae, 8.25% Non-Cum. Sub., Series S, Non-Vtg. | | | 160,075 | | | | 132,858 | |
ICG Holdings, Inc., 14.25% Exchangeable, Non-Vtg.3,5,8 | | | 342 | | | | — | |
Sovereign Real Estate Investment Trust, 12% Non-Cum., Series A3 | | | 545 | | | | 453,713 | |
| | | | | | | | |
| Total Preferred Stocks (Cost $5,592,567) | | | | | | | 586,571 | |
| | | | | | | | | |
Common Stocks—0.1% | | | | | | | | |
Global Aero Logistics, Inc.3,5 | | | 4,647 | | | | 4,647 | |
Revlon, Inc., Cl. A5 | | | 28,649 | | | | 191,089 | |
| | | | | | | | |
| Total Common Stocks (Cost $395,996) | | | | | | | 195,736 | |
| | | | | | | | | |
| | | Units | | | | | |
| |
Rights, Warrants and Certificates—0.0% | | | | | | | | |
Global Aero Logistics, Inc. Wts., Strike Price $10, Exp. 2/28/113,5
(Cost $4,339) | | | 570 | | | | 6 | |
| | | | | | | | | |
| | | Shares | | | | | |
| |
Investment Company—48.0% | | | | | | | | |
Oppenheimer Institutional Money Market Fund, Cl. E, 1.96%10,11
(Cost $76,839,590) | | | 76,839,590 | | | | 76,839,590 | |
| | | | | | | | | |
Total Investments, at Value
(Cost $291,761,641) | | | 122.3 | % | | | 195,815,753 | |
Liabilities in Excess of Other Assets | | | (22.3 | ) | | | (35,651,430 | ) |
| | | |
Net Assets | | | 100.0 | % | | $ | 160,164,323 | |
| | | |
Industry classifications are unaudited.
F6 | OPPENHEIMER HIGH INCOME FUND/VA
| | |
| Footnotes to Statement of Investments |
| |
| Principal amount is reported in U.S. Dollars, except for those denoted in the following currency: |
| |
| EUR | | Euro |
| |
| 1. | | Represents the current interest rate for a variable or increasing rate security. |
| |
| 2. | | Interest-Only Strips represent the right to receive the monthly interest payments on an underlying pool of mortgage loans. These securities typically decline in price as interest rates decline. Most other fixed income securities increase in price when interest rates decline. The principal amount of the underlying pool represents the notional amount on which current interest is calculated. The price of these securities is typically more sensitive to changes in prepayment rates than traditional mortgage-backed securities (for example, GNMA pass-throughs). Interest rates disclosed represent current yields based upon the current cost basis and estimated timing and amount of future cash flows. These securities amount to $1,719,283 or 1.07% of the Fund’s net assets as of December 31, 2008. |
| |
| 3. | | Illiquid security. The aggregate value of illiquid securities as of December 31, 2008 was $875,005, which represents 0.55% of the Fund’s net assets. See Note 7 of accompanying Notes. |
| |
| 4. | | Represents securities sold under Rule 144A, which are exempt from registration under the Securities Act of 1933, as amended. These securities have been determined to be liquid under guidelines established by the Board of Trustees. These securities amount to $9,569,987 or 5.98% of the Fund’s net assets as of December 31, 2008. |
| |
| 5. | | Non-income producing security. |
| |
| 6. | | Issue is in default. See Note 1 of accompanying Notes. |
| |
| 7. | | Denotes a step bond: a zero coupon bond that converts to a fixed or variable interest rate at a designated future date. |
| |
| 8. | | Interest or dividend is paid-in-kind, when applicable. |
| |
| 9. | | This bond has no contractual maturity date, is not redeemable and contractually pays an indefinite stream of interest. Rate reported represents the current interest rate for this variable rate security. |
| |
| 10. | | Is or was an affiliate, as defined in the Investment Company Act of 1940, at or during the period ended December 31, 2008, by virtue of the Fund owning at least 5% of the voting securities of the issuer or as a result of the Fund and the issuer having the same investment adviser. Transactions during the period in which the issuer was an affiliate are as follows: |
| | | | | | | | | | | | | | | | | |
| | | Shares | | | Gross | | | Gross | | | Shares | |
| | | December 31, 2007 | | | Additions | | | Reductions | | | December 31, 2008 | |
| |
| Oppenheimer Institutional Money Market Fund, Cl. E | | | 10,989,620 | | | | 348,482,278 | | | | 282,632,308 | | | | 76,839,590 | |
| |
| | | | | | | | | | | Value | | | Income | |
| |
| Oppenheimer Institutional Money Market Fund, Cl. E | | | | | | | | | | $ | 76,839,590 | | | $ | 371,423 | |
11. Rate shown is the 7-day yield as of December 31, 2008.
Valuation Inputs
Various data inputs are used in determining the value of each of the Fund’s investments as of the reporting period end. These data inputs are categorized in the following hierarchy under applicable financial accounting standards:
1) Level 1—quoted prices in active markets for identical assets or liabilities (including securities actively traded on a securities exchange)
2) Level 2—inputs other than quoted prices that are observable for the asset (such as quoted prices for similar assets and market corroborated inputs such as interest rates, prepayment speeds, credit risks, etc.)
3) Level 3—unobservable inputs (including the Manager’s own judgments about assumptions that market participants would use in pricing the asset).
The market value of the Fund’s investments was determined based on the following inputs as of December 31, 2008:
| | | | | | | | | |
| | | Investments in | | | Other Financial | |
| Valuation Description | | Securities | | | Instruments* | |
| |
| Level 1—Quoted Prices | | $ | 77,030,679 | | | $ | — | |
| Level 2—Other Significant Observable Inputs | | | 118,780,421 | | | | (44,330,311 | ) |
| Level 3—Significant Unobservable Inputs | | | 4,653 | | | | — | |
| | | |
| Total | | $ | 195,815,753 | | | $ | (44,330,311 | ) |
| | | |
| | |
| * | | Other financial instruments include options written, currency contracts, futures, forwards and swap contracts. Currency contracts and forwards are reported at their unrealized appreciation/depreciation at measurement date, which represents the change in the contract’s value from trade date. Futures are reported at their variation margin at measurement date, which represents the amount due to/from the Fund at that date. Options written and swaps are reported at their market value at measurement date. |
See the accompanying Notes for further discussion of the methods used in determining value of the Fund’s investments, and a summary of changes to the valuation techniques, if any, during the reporting period.
F7 | OPPENHEIMER HIGH INCOME FUND/VA
STATEMENT OF INVESTMENTS Continued
Footnotes to Statement of Investments Continued
The following is a reconciliation of assets in which significant observable inputs (level 3) were used in determining fair value::
| | | | | | | | | |
| | | Investments in | | | Other Financial | |
| Valuation Description | | Securities | | | Instruments | |
| |
| Value as of December 31, 2007: | | $ | — | | | $ | — | |
| Realized gain (loss) | | | (2,473,993 | ) | | | — | |
| Change in unrealized appreciation (depreciation) | | | 2,448,807 | | | | — | |
Accretion/(amortization) of premium discount1 | | | (1,251 | ) | | | — | |
| Net purchases (sales) | | | (3,763 | ) | | | — | |
| Transfers in and out of Level 3 | | | 34,853 | | | | — | |
| | | |
| Value as of December 31, 2008 | | $ | 4,653 | | | $ | — | |
| | | |
| | |
| 1. | | Included in net investment income for fixed income securities |
Credit Default Swaps as of December 31, 2008 are as follows:
| | | | | | | | | | | | | | | | | | | | | | | | | | | |
| | | | | | | | | | | | | | | | | | | | | Upfront | | | | |
| | | | | | | | | Notional | | | Pay/ | | | | | | | Payment | | | | |
| | | | | Buy/Sell Credit | | | Amount | | | Receive | | | Termination | | | Received/ | | | | |
| Swap Reference Entity | | Counterparty | | Protection | | | (000s) | | | Fixed Rate | | | Date | | | (Paid) | | | Value | |
| |
| ABX.HE.AA.06-2 Index: | | | | | | | | | | | | | | | | | | | | | | | | |
| | | Barclays Bank plc | | Sell | | $ | 1,760 | | | | 0.170 | % | | | 5/25/46 | | | $ | 1,361,567 | | | $ | (1,545,719 | ) |
| | | Morgan Stanley Capital Services, Inc. | | Sell | | | 380 | | | | 0.170 | | | | 5/25/46 | | | | 30,359 | | | | (333,735 | ) |
| | | Morgan Stanley Capital Services, Inc. | | Sell | | | 730 | | | | 0.170 | | | | 5/25/46 | | | | 72,997 | | | | (641,122 | ) |
| | | | | | | | | | | | | | | | | | | | |
| | | | | Total | | | 2,870 | | | | | | | | | | | | 1,464,923 | | | | (2,520,576 | ) |
| American International Group, Inc.: | | | | | | | | | | | | | | | | | | | | | | | | |
| | | Barclays Bank plc | | Sell | | | 140 | | | | 3.000 | | | | 3/20/09 | | | | — | | | | (821 | ) |
| | | Barclays Bank plc | | Sell | | | 260 | | | | 4.000 | | | | 3/20/09 | | | | — | | | | (896 | ) |
| | | Barclays Bank plc | | Sell | | | 170 | | | | 5.350 | | | | 3/20/09 | | | | — | | | | (32 | ) |
| | | Deutsche Bank AG | | Sell | | | 325 | | | | 4.000 | | | | 3/20/09 | | | | — | | | | (1,120 | ) |
| | | Morgan Stanley Capital Services, Inc. | | Sell | | | 195 | | | | 4.000 | | | | 3/20/09 | | | | — | | | | (672 | ) |
| | | | | | | | | | | | | | | | | | | | |
| | | | | Total | | | 1,090 | | | | | | | | | | | | — | | | | (3,541 | ) |
| ARAMARK Corp.: | | | | | | | | | | | | | | | | | | | | | | | | |
| | | Credit Suisse International | | Sell | | | 705 | | | | 6.000 | | | | 3/20/13 | | | | — | | | | (12,628 | ) |
| | | Credit Suisse International | | Sell | | | 60 | | | | 4.750 | | | | 12/20/13 | | | | — | | | | (4,048 | ) |
| | | Morgan Stanley Capital Services, Inc. | | Sell | | | 835 | | | | 5.920 | | | | 3/20/13 | | | | — | | | | (17,179 | ) |
| | | | | | | | | | | | | | | | | | | | |
| | | | | Total | | | 1,600 | | | | | | | | | | | | — | | | | (33,855 | ) |
| Cablevision Systems Corp. | | Citibank NA, New York | | Sell | | | 160 | | | | 3.100 | | | | 12/20/10 | | | | — | | | | (15,228 | ) |
| | | | | | | | | | | | | | | | | | | | |
| | | | | Total | | | 160 | | | | | | | | | | | | — | | | | (15,228 | ) |
| Capmark Financial Group, Inc.: | | | | | | | | | | | | | | | | | | | | | | | | |
| | | Barclays Bank plc | | Sell | | | 160 | | | | 5.000 | | | | 6/20/12 | | | | 44,800 | | | | (75,275 | ) |
| | | Citibank NA, New York | | Sell | | | 3,300 | | | | 7.125 | | | | 12/20/12 | | | | — | | | | (1,506,436 | ) |
| | | Citibank NA, New York | | Sell | | | 1,485 | | | | 9.700 | | | | 12/20/12 | | | | — | | | | (625,254 | ) |
| | | Citibank NA, New York | | Sell | | | 1,235 | | | | 9.750 | | | | 12/20/12 | | | | — | | | | (519,142 | ) |
| | | Credit Suisse International | | Sell | | | 1,060 | | | | 3.500 | | | | 6/20/12 | | | | — | | | | (520,039 | ) |
| | | Credit Suisse International | | Sell | | | 1,120 | | | | 5.200 | | | | 12/20/12 | | | | — | | | | (540,957 | ) |
| | | Credit Suisse International | | Sell | | | 550 | | | | 6.250 | | | | 12/20/12 | | | | — | | | | (257,698 | ) |
| | | Morgan Stanley Capital Services, Inc. | | Sell | | | 530 | | | | 7.400 | | | | 12/20/12 | | | | — | | | | (239,936 | ) |
| | | Morgan Stanley Capital Services, Inc. | | Sell | | | 550 | | | | 7.150 | | | | 12/20/12 | | | | — | | | | (250,883 | ) |
| | | | | | | | | | | | | | | | | | | | |
| | | | | Total | | | 9,990 | | | | | | | | | | | | 44,800 | | | | (4,535,620 | ) |
| CDX North America High Yield Index, Series 10: | | | | | | | | | | | | | | | | | | | | |
| | | JPMorgan Chase Bank NA, NY Branch | | Sell | | | 2,720 | | | | 5.000 | | | | 6/20/13 | | | | 243,289 | | | | (423,713 | ) |
| | | JPMorgan Chase Bank NA, NY Branch | | Sell | | | 2,275 | | | | 5.000 | | | | 6/20/13 | | | | 211,701 | | | | (354,392 | ) |
| | | UBS AG | | Sell | | | 2,720 | | | | 5.000 | | | | 6/20/13 | | | | 243,289 | | | | (423,713 | ) |
| | | UBS AG | | Sell | | | 1,515 | | | | 5.000 | | | | 6/20/13 | | | | 140,979 | | | | (236,002 | ) |
| | | | | | | | | | | | | | | | | | | | |
| | | | | Total | | | 9,230 | | | | | | | | | | | | 839,258 | | | | (1,437,820 | ) |
| Cemex SAB de CV | | Deutsche Bank AG | | Sell | | | 190 | | | | 2.000 | | | | 3/20/09 | | | | — | | | | (2,779 | ) |
| | | | | | | | | | | | | | | | | | | | |
| | | | | Total | | | 190 | | | | | | | | | | | | — | | | | (2,779 | ) |
| Charter Communications Holdings LLC/Charter Communications Holdings Capital: | | | | | | | | | | | | | | | | | | | | |
| | | Credit Suisse International | | Sell | | | 175 | | | | 5.000 | | | | 9/20/17 | | | | 35,000 | | | | (95,730 | ) |
| | | Credit Suisse International | | Sell | | | 635 | | | | 5.000 | | | | 9/20/17 | | | | 127,000 | | | | (347,363 | ) |
| | | | | | | | | | | | | | | | | | | | |
| | | | | Total | | | 810 | | | | | | | | | | | | 162,000 | | | | (443,093 | ) |
F8 | OPPENHEIMER HIGH INCOME FUND/VA
Credit Default Swaps: Continued
| | | | | | | | | | | | | | | | | | | | | | | | | | | |
| | | | | | | | | | | | | | | | | | | | | Upfront | | | | |
| | | | | | | | | Notional | | | Pay/ | | | | | | | Payment | | | | |
| | | | | Buy/Sell Credit | | | Amount | | | Receive | | | Termination | | | Received/ | | | | |
| Swap Reference Entity | | Counterparty | | Protection | | | (000s) | | | Fixed Rate | | | Date | | | (Paid) | | | Value | |
| |
| CIT Group, Inc. | | Barclays Bank plc | | Sell | | $ | 75 | | | | 10.500 | % | | | 6/20/09 | | | $ | — | | | $ | 991 | |
| | | | | | | | | | | | | | | | | | | | |
| | | | | Total | | | 75 | | | | | | | | | | | | — | | | | 991 | |
| CMBX.3.AJ Index: | | | | | | | | | | | | | | | | | | | | | | | | |
| | | JPMorgan Chase Bank NA, NY Branch | | Sell | | | 1,000 | | | | 1.470 | | | | 12/13/49 | | | | 119,886 | | | | (575,856 | ) |
| | | Morgan Stanley Capital Services, Inc. | | Sell | | | 2,190 | | | | 1.470 | | | | 12/13/49 | | | | 365,209 | | | | (1,261,125 | ) |
| | | Morgan Stanley Capital Services, Inc. | | Sell | | | 2,500 | | | | 1.470 | | | | 12/13/49 | | | | 328,412 | | | | (1,439,641 | ) |
| | | | | | | | | | | | | | | | | | | | |
| | | | | Total | | | 5,690 | | | | | | | | | | | | 813,507 | | | | (3,276,622 | ) |
| CMBX.4.AJ Index: | | | | | | | | | | | | | | | | | | | | | | | | |
| | | JPMorgan Chase Bank NA, NY Branch | | Sell | | | 1,000 | | | | 0.960 | | | | 2/17/51 | | | | 169,360 | | | | (622,020 | ) |
| | | Morgan Stanley Capital Services, Inc. | | Sell | | | 2,190 | | | | 0.960 | | | | 2/17/51 | | | | 450,444 | | | | (1,362,225 | ) |
| | | | | | | | | | | | | | | | | | | | |
| | | | | Total | | | 3,190 | | | | | | | | | | | | 619,804 | | | | (1,984,245 | ) |
| Constellation Brands, Inc. JPMorgan Chase Bank NA, NY Branch | | Sell | | | 475 | | | | 3.970 | | | | 9/20/13 | | | | — | | | | (19,221 | ) |
| | | | | | | | | | | | | | | | | | | | |
| | | | | Total | | | 475 | | | | | | | | | | | | — | | | | (19,221 | ) |
| Dean Foods Co.: | | | | | | | | | | | | | | | | | | | | | | | | |
| | | JPMorgan Chase Bank NA, NY Branch | | Sell | | | 930 | | | | 1.030 | | | | 6/20/11 | | | | — | | | | (73,511 | ) |
| | | JPMorgan Chase Bank NA, NY Branch | | Sell | | | 930 | | | | 1.060 | | | | 6/20/11 | | | | — | | | | (72,880 | ) |
| | | JPMorgan Chase Bank NA, NY Branch | | Sell | | | 460 | | | | 1.050 | | | | 6/20/11 | | | | — | | | | (36,152 | ) |
| | | JPMorgan Chase Bank NA, NY Branch | | Sell | | | 1,200 | | | | 1.080 | | | | 6/20/11 | | | | — | | | | (93,496 | ) |
| | | | | | | | | | | | | | | | | | | | |
| | | | | Total | | | 3,520 | | | | | | | | | | | | — | | | | (276,039 | ) |
| Eastman Kodak Co.: | | | | | | | | | | | | | | | | | | | | | | | | |
| | | Credit Suisse International | | Buy | | | 905 | | | | 3.700 | | | | 12/20/18 | | | | — | | | | 170,107 | |
| | | Credit Suisse International | | Buy | | | 405 | | | | 4.050 | | | | 12/20/18 | | | | — | | | | 68,441 | |
| | | Credit Suisse International | | Buy | | | 385 | | | | 4.010 | | | | 12/20/18 | | | | — | | | | 65,896 | |
| | | | | | | | | | | | | | | | | | | | |
| | | | | Total | | | 1,695 | | | | | | | | | | | | — | | | | 304,444 | |
| | | | | | | | | | | | | | | | | | | | |
| | | Barclays Bank plc | | Sell | | | 405 | | | | 4.000 | | | | 12/20/13 | | | | — | | | | (53,028 | ) |
| | | Barclays Bank plc | | Sell | | | 385 | | | | 3.960 | | | | 12/20/13 | | | | — | | | | (50,963 | ) |
| | | Credit Suisse International | | Sell | | | 905 | | | | 3.650 | | | | 12/20/13 | | | | — | | | | (129,882 | ) |
| | | | | | | | | | | | | | | | | | | | |
| | | | | Total | | | 1,695 | | | | | | | | | | | | — | | | | (233,873 | ) |
| El Paso Corp.: | | | | | | | | | | | | | | | | | | | | | | | | |
| | | Credit Suisse International | | Sell | | | 505 | | | | 2.800 | | | | 3/20/18 | | | | — | | | | (133,067 | ) |
| | | Merrill Lynch International | | Sell | | | 530 | | | | 2.900 | | | | 3/20/18 | | | | — | | | | (137,046 | ) |
| | | Merrill Lynch International | | Sell | | | 1,345 | | | | 2.890 | | | | 3/20/18 | | | | — | | | | (348,449 | ) |
| | | | | | | | | | | | | | | | | | | | |
| | | | | Total | | | 2,380 | | | | | | | | | | | | — | | | | (618,562 | ) |
| Energy Future Holdings Corp.: | | | | | | | | | | | | | | | | | | | | | | | | |
| | | Credit Suisse International | | Sell | | | 925 | | | | 1.530 | | | | 6/20/11 | | | | — | | | | (276,670 | ) |
| | | Credit Suisse International | | Sell | | | 410 | | | | 1.610 | | | | 6/20/11 | | | | — | | | | (122,068 | ) |
| | | Credit Suisse International | | Sell | | | 125 | | | | 5.910 | | | | 12/20/12 | | | | — | | | | (34,307 | ) |
| | | Credit Suisse International | | Sell | | | 115 | | | | 6.050 | | | | 12/20/12 | | | | — | | | | (31,191 | ) |
| | | Credit Suisse International | | Sell | | | 125 | | | | 6.000 | | | | 12/20/12 | | | | — | | | | (34,048 | ) |
| | | Merrill Lynch International | | Sell | | | 925 | | | | 1.590 | | | | 6/20/11 | | | | — | | | | (275,715 | ) |
| | | Merrill Lynch International | | Sell | | | 1,150 | | | | 1.620 | | | | 6/20/11 | | | | — | | | | (342,188 | ) |
| | | Merrill Lynch International | | Sell | | | 1,310 | | | | 2.060 | | | | 6/20/11 | | | | — | | | | (379,885 | ) |
| | | | | | | | | | | | | | | | | | | | |
| | | | | Total | | | 5,085 | | | | | | | | | | | | — | | | | (1,496,072 | ) |
| Ford Motor Co.: | | | | | | | | | | | | | | | | | | | | | | | | |
| | | Deutsche Bank AG | | Sell | | | 2,750 | | | | 5.800 | | | | 12/20/16 | | | | — | | | | (1,837,943 | ) |
| | | Deutsche Bank AG | | Sell | | | 550 | | | | 8.200 | | | | 3/20/18 | | | | — | | | | (373,631 | ) |
| | | Deutsche Bank AG | | Sell | | | 25 | | | | 5.000 | | | | 12/20/18 | | | | 13,500 | | | | (17,657 | ) |
| | | JPMorgan Chase Bank NA, NY Branch | | Sell | | | 2,335 | | | | 6.000 | | | | 12/20/16 | | | | — | | | | (1,556,836 | ) |
| | | Merrill Lynch International | | Sell | | | 2,070 | | | | 5.300 | | | | 12/20/12 | | | | — | | | | (1,311,510 | ) |
| | | Morgan Stanley Capital Services, Inc. | | Sell | | | 2,335 | | | | 6.150 | | | | 12/20/16 | | | | — | | | | (1,554,026 | ) |
| | | Morgan Stanley Capital Services, Inc. | | Sell | | | 150 | | | | 5.900 | | | | 12/20/16 | | | | — | | | | (100,131 | ) |
| | | | | | | | | | | | | | | | | | | | |
| | | | | Total | | | 10,215 | | | | | | | | | | | | 13,500 | | | | (6,751,734 | ) |
| Ford Motor Credit Co. LLC: | | | | | | | | | | | | | | | | | | | | | | | | |
| | | Citibank NA, New York | | Sell | | | 1,700 | | | | 2.320 | | | | 3/20/12 | | | | — | | | | (271,573 | ) |
| | | Credit Suisse International | | Sell | | | 3,280 | | | | 2.385 | | | | 3/20/12 | | | | — | | | | (523,512 | ) |
| | | Credit Suisse International | | Sell | | | 875 | | | | 2.550 | | | | 3/20/12 | | | | — | | | | (139,342 | ) |
| | | | | | | | | | | | | | | | | | | | |
| | | | | Total | | | 5,855 | | | | | | | | | | | | — | | | | (934,427 | ) |
F9 | OPPENHEIMER HIGH INCOME FUND/VA
STATEMENT OF INVESTMENTS Continued
Footnotes to Statement of Investments Continued
Credit Default Swaps: Continued
| | | | | | | | | | | | | | | | | | | | | | | | | | | |
| | | | | | | | | | | | | | | | | | | | | Upfront | | | | |
| | | | | | | | | Notional | | | Pay/ | | | | | | | Payment | | | | |
| | | | | Buy/Sell Credit | | | Amount | | | Receive | | | Termination | | | Received/ | | | | |
| Swap Reference Entity | | Counterparty | | Protection | | | (000s) | | | Fixed Rate | | | Date | | | (Paid) | | | Value | |
| |
| General Electric Capital Corp.: | | | | | | | | | | | | | | | | | | | | | | | | |
| | | Barclays Bank plc | | Sell | | $ | 910 | | | | 8.000 | % | | | 12/20/09 | | | $ | — | | | $ | 26,811 | |
| | | Credit Suisse International | | Sell | | | 865 | | | | 8.000 | | | | 12/20/09 | | | | — | | | | 25,486 | |
| | | | | | | | | | | | | | | | | | | | |
| | | | | Total | | | 1,775 | | | | | | | | | | | | — | | | | 52,297 | |
| General Motors Corp.: | | | | | | | | | | | | | | | | | | | | | | | | |
| | | Goldman Sachs Bank USA | | Sell | | | 1,865 | | | | 4.950 | | | | 12/20/16 | | | | — | | | | (1,488,977 | ) |
| | | Goldman Sachs International | | Sell | | | 500 | | | | 5.950 | | | | 12/20/17 | | | | — | | | | (394,876 | ) |
| | | JPMorgan Chase Bank NA, NY Branch | | Sell | | | 2,760 | | | | 4.750 | | | | 12/20/16 | | | | — | | | | (2,208,315 | ) |
| | | Merrill Lynch International | | Sell | | | 2,550 | | | | 4.050 | | | | 12/20/12 | | | | — | | | | (2,039,010 | ) |
| | | Morgan Stanley Capital Services, Inc. | | Sell | | | 1,865 | | | | 4.900 | | | | 12/20/16 | | | | — | | | | (1,489,786 | ) |
| | | Morgan Stanley Capital Services, Inc. | | Sell | | | 120 | | | | 4.620 | | | | 12/20/16 | | | | — | | | | (96,149 | ) |
| | | | | | | | | | | | | | | | | | | | |
| | | | | Total | | | 9,660 | | | | | | | | | | | | — | | | | (7,717,113 | ) |
| GMAC LLC: | | | | | | | | | | | | | | | | | | | | | | | | |
| | | Credit Suisse International | | Sell | | | 1,915 | | | | 5.000 | | | | 3/20/09 | | | | 277,675 | | | | (224,875 | ) |
| | | Goldman Sachs International | | Sell | | | 1,095 | | | | 1.390 | | | | 3/20/17 | | | | — | | | | (321,494 | ) |
| | | Goldman Sachs International | | Sell | | | 1,030 | | | | 1.370 | | | | 3/20/17 | | | | — | | | | (302,677 | ) |
| | | | | | | | | | | | | | | | | | | | |
| | | | | Total | | | 4,040 | | | | | | | | | | | | 277,675 | | | | (849,046 | ) |
| Goldman Sachs Group, Inc. (The): | | | | | | | | | | | | | | | | | | | | | | | | |
| | | Barclays Bank plc | | Sell | | | 355 | | | | 5.750 | | | | 12/20/09 | | | | — | | | | 7,235 | |
| | | Deutsche Bank AG | | Sell | | | 360 | | | | 5.500 | | | | 12/20/09 | | | | — | | | | 6,462 | |
| | | Deutsche Bank AG | | Sell | | | 285 | | | | 5.450 | | | | 12/20/09 | | | | — | | | | 4,978 | |
| | | | | | | | | | | | | | | | | | | | |
| | | | | Total | | | 1,000 | | | | | | | | | | | | — | | | | 18,675 | |
| Harrah’s Operating Co., Inc. | | Credit Suisse International | | Sell | | | 1,160 | | | | 5.000 | | | | 3/20/10 | | | | 73,950 | | | | (265,191 | ) |
| | | | | | | | | | | | | | | | | | | | |
| | | | | Total | | | 1,160 | | | | | | | | | | | | 73,950 | | | | (265,191 | ) |
Hartford Financial Services
Group, Inc. | | Morgan Stanley Capital Services, Inc. | | Sell | | | 195 | | | | 2.400 | | | | 3/20/09 | | | | — | | | | (1,948 | ) |
| | | | | | | | | | | | | | | | | | | | |
| | | | | Total | | | 195 | | | | | | | | | | | | — | | | | (1,948 | ) |
| HCP, Inc. | | Barclays Bank plc | | Sell | | | 285 | | | | 4.600 | | | | 3/20/09 | | | | — | | | | 327 | |
| | | | | | | | | | | | | | | | | | | | |
| | | | | Total | | | 285 | | | | | | | | | | | | — | | | | 327 | |
| Idearc, Inc.: | | | | | | | | | | | | | | | | | | | | | | | | |
| | | Credit Suisse International | | Sell | | | 25 | | | | 5.000 | | | | 12/20/09 | | | | 5,125 | | | | (18,085 | ) |
| | | Goldman Sachs International | | Sell | | | 620 | | | | 5.000 | | | | 9/20/09 | | | | 201,075 | | | | (452,480 | ) |
| | | JPMorgan Chase Bank NA, NY Branch | | Sell | | | 280 | | | | 5.000 | | | | 9/20/09 | | | | 36,400 | | | | (204,346 | ) |
| | | | | | | | | | | | | | | | | | | | |
| | | | | Total | | | 925 | | | | | | | | | | | | 242,600 | | | | (674,911 | ) |
| Intelsat Ltd.: | | | | | | | | | | | | | | | | | | | | | | | | |
| | | Citibank NA, New York | | Sell | | | 545 | | | | 5.000 | | | | 3/20/09 | | | | — | | | | 980 | |
| | | Credit Suisse International | | Sell | | | 555 | | | | 4.400 | | | | 3/20/09 | | | | — | | | | 867 | |
| | | Credit Suisse International | | Sell | | | 55 | | | | 5.750 | | | | 3/20/09 | | | | — | | | | 115 | |
| | | Deutsche Bank AG | | Sell | | | 220 | | | | 4.400 | | | | 3/20/09 | | | | — | | | | 344 | |
| | | Deutsche Bank AG | | Sell | | | 550 | | | | 4.750 | | | | 3/20/09 | | | | — | | | | 936 | |
| | | Deutsche Bank AG | | Sell | | | 325 | | | | 5.000 | | | | 3/20/09 | | | | — | | | | 585 | |
| | | | | | | | | | | | | | | | | | | | |
| | | | | Total | | | 2,250 | | | | | | | | | | | | — | | | | 3,827 | |
| iStar Financial, Inc.: | | | | | | | | | | | | | | | | | | | | | | | | |
| | | Barclays Bank plc | | Sell | | | 345 | | | | 4.400 | | | | 12/20/12 | | | | — | | | | (187,051 | ) |
| | | Credit Suisse International | | Sell | | | 135 | | | | 4.000 | | | | 12/20/12 | | | | — | | | | (73,534 | ) |
| | | Credit Suisse International | | Sell | | | 845 | | | | 4.150 | | | | 12/20/12 | | | | — | | | | (459,469 | ) |
| | | Credit Suisse International | | Sell | | | 185 | | | | 12.000 | | | | 3/20/09 | | | | — | | | | (20,230 | ) |
| | | Deutsche Bank AG | | Sell | | | 1,035 | | | | 4.000 | | | | 12/20/12 | | | | — | | | | (563,759 | ) |
| | | Deutsche Bank AG | | Sell | | | 460 | | | | 12.000 | | | | 3/20/09 | | | | — | | | | (50,303 | ) |
| | | Goldman Sachs International | | Sell | | | 2,310 | | | | 3.950 | | | | 12/20/12 | | | | — | | | | (1,258,971 | ) |
| | | UBS AG | | Sell | | | 550 | | | | 4.560 | | | | 12/20/12 | | | | — | | | | (297,644 | ) |
| | | | | | | | | | | | | | | | | | | | |
| | | | | Total | | | 5,865 | | | | | | | | | | | | — | | | | (2,910,961 | ) |
F10 | OPPENHEIMER HIGH INCOME FUND/VA
Credit Default Swaps: Continued
| | | | | | | | | | | | | | | | | | | | | | | | | | | |
| | | | | | | | | | | | | | | | | | | | | Upfront | | | | |
| | | | | | | | | Notional | | | Pay/ | | | | | | | Payment | | | | |
| | | | | Buy/Sell Credit | | | Amount | | | Receive | | | Termination | | | Received/ | | | | |
| Swap Reference Entity | | Counterparty | | Protection | | | (000s) | | | Fixed Rate | | | Date | | | (Paid) | | | Value | |
| |
| J.C. Penney Corp., Inc.: | | | | | | | | | | | | | | | | | | | | | | | | |
| | | Morgan Stanley Capital Services, Inc. | | Sell | | $ | 370 | | | | 1.070 | % | | | 12/20/17 | | | $ | — | | | $ | (72,072 | ) |
| | | Morgan Stanley Capital Services, Inc. | | Sell | | | 385 | | | | 1.300 | | | | 12/20/17 | | | | — | | | | (69,505 | ) |
| | | | | | | | | | | | | | | | | | | | |
| | | | | Total | | | 755 | | | | | | | | | | | | — | | | | (141,577 | ) |
| Jefferson Smurfit Corp. US: | | | | | | | | | | | | | | | | | | | | | | | | |
| | | Citibank NA, New York | | Sell | | | 145 | | | | 8.000 | | | | 12/20/13 | | | | — | | | | (104,566 | ) |
| | | Merrill Lynch International | | Sell | | | 495 | | | | 6.700 | | | | 6/20/13 | | | | — | | | | (362,382 | ) |
| | | Merrill Lynch International | | Sell | | | 710 | | | | 6.800 | | | | 6/20/13 | | | | — | | | | (519,172 | ) |
| | | Merrill Lynch International | | Sell | | | 360 | | | | 7.950 | | | | 12/20/13 | | | | — | | | | (259,768 | ) |
| | | | | | | | | | | | | | | | | | | | |
| | | | | Total | | | 1,710 | | | | | | | | | | | | — | | | | (1,245,888 | ) |
| Jones Apparel Group, Inc.: | | | | | | | | | | | | | | | | | | | | | | | | |
| | | Deutsche Bank AG | | Buy | | | 210 | | | | 2.635 | | | | 6/20/18 | | | | — | | | | 46,901 | |
| | | Morgan Stanley Capital Services, Inc. | | Buy | | | 425 | | | | 2.970 | | | | 6/20/18 | | | | — | | | | 87,185 | |
| | | | | | | | | | | | | | | | | | | | |
| | | | | Total | | | 635 | | | | | | | | | | | | — | | | | 134,086 | |
| | | | | | | | | | | | | | | | | | | | |
| | | Deutsche Bank AG | | Sell | | | 210 | | | | 2.720 | | | | 6/20/13 | | | | — | | | | (41,646 | ) |
| | | Morgan Stanley Capital Services, Inc. | | Sell | | | 425 | | | | 3.200 | | | | 6/20/13 | | | | — | | | | (77,745 | ) |
| | | | | | | | | | | | | | | | | | | | |
| | | | | Total | | | 635 | | | | | | | | | | | | — | | | | (119,391 | ) |
| Kohl’s Corp.: | | | | | | | | | | | | | | | | | | | | | | | | |
| | | Barclays Bank plc | | Buy | | | 210 | | | | 1.180 | | | | 6/20/18 | | | | — | | | | 18,748 | |
| | | Barclays Bank plc | | Buy | | | 205 | | | | 1.040 | | | | 6/20/18 | | | | — | | | | 20,389 | |
| | | Deutsche Bank AG | | Buy | | | 205 | | | | 1.300 | | | | 6/20/18 | | | | — | | | | 16,513 | |
| | | Morgan Stanley Capital Services, Inc. | | Buy | | | 555 | | | | 0.660 | | | | 12/20/17 | | | | — | | | | 67,702 | |
| | | Morgan Stanley Capital Services, Inc. | | Buy | | | 575 | | | | 0.870 | | | | 12/20/17 | | | | — | | | | 61,695 | |
| | | | | | | | | | | | | | | | | | | | |
| | | | | Total | | | 1,750 | | | | | | | | | | | | — | | | | 185,047 | |
| | | | | | | | | | | | | | | | | | | | |
| | | Barclays Bank plc | | Sell | | | 210 | | | | 1.080 | | | | 6/20/13 | | | | — | | | | (14,128 | ) |
| | | Barclays Bank plc | | Sell | | | 205 | | | | 0.900 | | | | 6/20/13 | | | | — | | | | (15,253 | ) |
| | | Deutsche Bank AG | | Sell | | | 205 | | | | 1.180 | | | | 6/20/13 | | | | — | | | | (12,980 | ) |
| | | | | | | | | | | | | | | | | | | | |
| | | | | Total | | | 620 | | | | | | | | | | | | — | | | | (42,361 | ) |
| Liz Claiborne, Inc.: | | | | | | | | | | | | | | | | | | | | | | | | |
| | | Morgan Stanley Capital Services, Inc. | | Buy | | | 415 | | | | 2.900 | | | | 6/20/18 | | | | — | | | | 128,494 | |
| | | | | | | | | | | | | | | | | | | | |
| | | | | Total | | | 415 | | | | | | | | | | | | — | | | | 128,494 | |
| | | | | | | | | | | | | | | | | | | | |
| | | Deutsche Bank AG | | Sell | | | 765 | | | | 3.250 | | | | 6/20/09 | | | | — | | | | (22,462 | ) |
| | | Morgan Stanley Capital Services, Inc. | | Sell | | | 415 | | | | 3.100 | | | | 6/20/13 | | | | — | | | | (110,158 | ) |
| | | | | | | | | | | | | | | | | | | | |
| | | | | Total | | | 1,180 | | | | | | | | | | | | — | | | | (132,620 | ) |
| Louisiana-Pacific Corp. | | Morgan Stanley Capital Services, Inc. | | Sell | | | 375 | | | | 6.250 | | | | 9/20/09 | | | | — | | | | (32,043 | ) |
| | | | | | | | | | | | | | | | | | | | |
| | | | | Total | | | 375 | | | | | | | | | | | | — | | | | (32,043 | ) |
| Massey Energy Co.: | | | | | | | | | | | | | | | | | | | | | | | | |
| | | Credit Suisse International | | Sell | | | 460 | | | | 5.000 | | | | 3/20/13 | | | | — | | | | (31,994 | ) |
| | | Credit Suisse International | | Sell | | | 210 | | | | 5.000 | | | | 3/20/13 | | | | — | | | | (14,606 | ) |
| | | Morgan Stanley Capital Services, Inc. | | Sell | | | 690 | | | | 5.100 | | | | 9/20/12 | | | | — | | | | (47,257 | ) |
| | | UBS AG | | Sell | | | 375 | | | | 5.050 | | | | 9/20/12 | | | | — | | | | (26,237 | ) |
| | | UBS AG | | Sell | | | 430 | | | | 5.100 | | | | 9/20/12 | | | | — | | | | (29,450 | ) |
| | | | | | | | | | | | | | | | | | | | |
| | | | | Total | | | 2,165 | | | | | | | | | | | | — | | | | (149,544 | ) |
| MGM Mirage: | | | | | | | | | | | | | | | | | | | | | | | | |
| | | Citibank NA, New York | | Sell | | | 440 | | | | 5.000 | | | | 12/20/13 | | | | 145,200 | | | | (161,435 | ) |
| | | Credit Suisse International | | Sell | | | 440 | | | | 8.400 | | | | 12/20/13 | | | | — | | | | (126,620 | ) |
| | | Credit Suisse International | | Sell | | | 675 | | | | 5.000 | | | | 12/20/13 | | | | 168,750 | | | | (247,655 | ) |
| | | Goldman Sachs International | | Sell | | | 725 | | | | 8.400 | | | | 12/20/13 | | | | — | | | | (208,636 | ) |
| | | | | | | | | | | | | | | | | | | | |
| | | | | Total | | | 2,280 | | | | | | | | | | | | 313,950 | | | | (744,346 | ) |
| Morgan Stanley: | | | | | | | | | | | | | | | | | | | | | | | | |
| | | Citibank NA, New York | | Sell | | | 1,555 | | | | 7.800 | | | | 12/20/13 | | | | — | | | | 232,584 | |
| | | Credit Suisse International | | Sell | | | 495 | | | | 7.800 | | | | 12/20/13 | | | | — | | | | 74,038 | |
| | | JPMorgan Chase Bank NA, NY Branch | | Sell | | | 1,830 | | | | 7.800 | | | | 12/20/13 | | | | — | | | | 273,717 | |
| | | | | | | | | | | | | | | | | | | | |
| | | | | Total | | | 3,880 | | | | | | | | | | | | — | | | | 580,339 | |
F11 | OPPENHEIMER HIGH INCOME FUND/VA
STATEMENT OF INVESTMENTS Continued
Footnotes to Statement of Investments Continued
Credit Default Swaps: Continued
| | | | | | | | | | | | | | | | | | | | | | | | | | | |
| | | | | | | | | | | | | | | | | | | | | Upfront | | | | |
| | | | | | | | | Notional | | | Pay/ | | | | | | | Payment | | | | |
| | | | | Buy/Sell Credit | | | Amount | | | Receive | | | Termination | | | Received/ | | | | |
| Swap Reference Entity | | Counterparty | | Protection | | | (000s) | | | Fixed Rate | | | Date | | | (Paid) | | | Value | |
| |
| Nalco Co.: | | | | | | | | | | | | | | | | | | | | | | | | |
| | | Barclays Bank plc | | Sell | | $ | 420 | | | | 4.500 | % | | | 9/20/13 | | | $ | — | | | $ | (41,815 | ) |
| | | Citibank NA, New York | | Sell | | | 435 | | | | 3.600 | | | | 9/20/12 | | | | — | | | | (43,331 | ) |
| | | Citibank NA, New York | | Sell | | | 455 | | | | 4.170 | | | | 9/20/13 | | | | — | | | | (50,570 | ) |
| | | Credit Suisse International | | Sell | | | 860 | | | | 3.400 | | | | 9/20/12 | | | | — | | | | (90,815 | ) |
| | | Credit Suisse International | | Sell | | | 425 | | | | 3.600 | | | | 9/20/12 | | | | — | | | | (42,335 | ) |
| | | Goldman Sachs Bank USA | | Sell | | | 455 | | | | 4.250 | | | | 9/20/13 | | | | — | | | | (49,292 | ) |
| | | Goldman Sachs International | | Sell | | | 465 | | | | 3.700 | | | | 9/20/12 | | | | — | | | | (44,927 | ) |
| | | Goldman Sachs International | | Sell | | | 425 | | | | 4.700 | | | | 9/20/13 | | | | — | | | | (39,329 | ) |
| | | Goldman Sachs International | | Sell | | | 760 | | | | 4.700 | | | | 9/20/13 | | | | — | | | | (70,330 | ) |
| | | JPMorgan Chase Bank NA, NY Branch | | Sell | | | 425 | | | | 4.650 | | | | 9/20/13 | | | | — | | | | (40,075 | ) |
| | | | | | | | | | | | | | | | | | | | |
| | | | | Total | | | 5,125 | | | | | | | | | | | | — | | | | (512,819 | ) |
| Owens-Illinois, Inc.: | | | | | | | | | | | | | | | | | | | | | | | | |
| | | Citibank NA, New York | | Sell | | | 500 | | | | 2.500 | | | | 6/20/13 | | | | — | | | | (24,265 | ) |
| | | Credit Suisse International | | Sell | | | 290 | | | | 2.500 | | | | 6/20/13 | | | | — | | | | (14,074 | ) |
| | | Deutsche Bank AG | | Sell | | | 140 | | | | 2.500 | | | | 6/20/13 | | | | — | | | | (6,794 | ) |
| | | | | | | | | | | | | | | | | | | | |
| | | | | Total | | | 930 | | | | | | | | | | | | — | | | | (45,133 | ) |
| Reliant Energy, Inc.: | | | | | | | | | | | | | | | | | | | | | | | | |
| | | Citibank NA, New York | | Sell | | | 465 | | | | 2.450 | | | | 9/20/11 | | | | — | | | | (67,758 | ) |
| | | Citibank NA, New York | | Sell | | | 1,070 | | | | 2.600 | | | | 9/20/11 | | | | — | | | | (152,324 | ) |
| | | Citibank NA, New York | | Sell | | | 1,035 | | | | 3.900 | | | | 9/20/11 | | | | — | | | | (117,233 | ) |
| | | Credit Suisse International | | Sell | | | 175 | | | | 9.000 | | | | 12/20/09 | | | | — | | | | (4,392 | ) |
| | | Credit Suisse International | | Sell | | | 175 | | | | 9.000 | | | | 12/20/09 | | | | — | | | | (4,392 | ) |
| | | Merrill Lynch International | | Sell | | | 420 | | | | 2.050 | | | | 9/20/11 | | | | — | | | | (64,960 | ) |
| | | | | | | | | | | | | | | | | | | | |
| | | | | Total | | | 3,340 | | | | | | | | | | | | — | | | | (411,059 | ) |
| RH Donnelley Corp.: | | | | | | | | | | | | | | | | | | | | | | | | |
| | | Barclays Bank plc | | Sell | | | 450 | | | | 5.000 | | | | 9/20/10 | | | | 81,000 | | | | (202,946 | ) |
| | | Goldman Sachs International | | Sell | | | 430 | | | | 9.000 | | | | 3/20/09 | | | | — | | | | (18,540 | ) |
| | | Goldman Sachs International | | Sell | | | 650 | | | | 5.000 | | | | 9/20/10 | | | | 143,000 | | | | (293,145 | ) |
| | | Morgan Stanley Capital Services, Inc. | | Sell | | | 270 | | | | 5.000 | | | | 9/20/10 | | | | 48,600 | | | | (121,768 | ) |
| | | | | | | | | | | | | | | | | | | | |
| | | | | Total | | | 1,800 | | | | | | | | | | | | 272,600 | | | | (636,399 | ) |
| Rite Aid Corp.: | | | | | | | | | | | | | | | | | | | | | | | | |
| | | Credit Suisse International | | Sell | | | 395 | | | | 7.500 | | | | 3/20/09 | | | | — | | | | (20,213 | ) |
| | | Goldman Sachs International | | Sell | | | 715 | | | | 8.060 | | | | 3/20/09 | | | | — | | | | (35,661 | ) |
| | | Goldman Sachs International | | Sell | | | 350 | | | | 5.000 | | | | 12/20/09 | | | | 99,038 | | | | (79,753 | ) |
| | | | | | | | | | | | | | | | | | | | |
| | | | | Total | | | 1,460 | | | | | | | | | | | | 99,038 | | | | (135,627 | ) |
| SLM Corp. | | Deutsche Bank AG | | Sell | | | 580 | | | | 2.010 | | | | 9/20/09 | | | | — | | | | (49,205 | ) |
| | | | | | | | | | | | | | | | | | | | |
| | | | | Total | | | 580 | | | | | | | | | | | | — | | | | (49,205 | ) |
| Sprint Nextel Corp.: | | | | | | | | | | | | | | | | | | | | | | | | |
| | | Credit Suisse International | | Sell | | | 825 | | | | 6.300 | | | | 3/20/09 | | | | — | | | | (11,489 | ) |
| | | Goldman Sachs International | | Sell | | | 295 | | | | 6.300 | | | | 3/20/09 | | | | — | | | | (4,108 | ) |
| | | | | | | | | | | | | | | | | | | | |
| | | | | Total | | | 1,120 | | | | | | | | | | | | — | | | | (15,597 | ) |
| Station Casinos, Inc.: | | | | | | | | | | | | | | | | | | | | | | | | |
| | | Barclays Bank plc | | Sell | | | 505 | | | | 5.000 | | | | 6/20/13 | | | | 90,900 | | | | (399,943 | ) |
| | | Goldman Sachs International | | Sell | | | 315 | | | | 5.000 | | | | 6/20/13 | | | | 55,519 | | | | (247,729 | ) |
| | | | | | | | | | | | | | | | | | | | |
| | | | | Total | | | 820 | | | | | | | | | | | | 146,419 | | | | (647,672 | ) |
| Temple-Inland, Inc. | | Deutsche Bank AG | | Sell | | | 95 | | | | 3.000 | | | | 9/20/09 | | | | — | | | | (5,648 | ) |
| | | | | | | | | | | | | | | | | | | | |
| | | | | Total | | | 95 | | | | | | | | | | | | — | | | | (5,648 | ) |
| Tribune Co.: | | | | | | | | | | | | | | | | | | | | | | | | |
| | | Citibank NA, New York | | Sell | | | 525 | | | | 5.000 | | | | 1/16/09 | | | | 168,000 | | | | (492,252 | ) |
| | | Citibank NA, New York | | Sell | | | 540 | | | | 5.000 | | | | 1/16/09 | | | | 176,850 | | | | (506,316 | ) |
| | | Citibank NA, New York | | Sell | | | 540 | | | | 5.000 | | | | 1/16/09 | | | | 178,200 | | | | (506,316 | ) |
| | | Citibank NA, New York | | Sell | | | 555 | | | | 5.000 | | | | 1/16/09 | | | | 194,250 | | | | (520,380 | ) |
| | | Credit Suisse International | | Sell | | | 545 | | | | 6.350 | | | | 1/16/09 | | | | — | | | | (511,004 | ) |
| | | Credit Suisse International | | Sell | | | 40 | | | | 5.000 | | | | 1/16/09 | | | | 8,800 | | | | (37,505 | ) |
F12 | OPPENHEIMER HIGH INCOME FUND/VA
Credit Default Swaps: Continued
| | | | | | | | | | | | | | | | | | | | | | | | | | | |
| | | | | | | | | | | | | | | | | | | | | Upfront | | | | |
| | | | | | | | | Notional | | | Pay/ | | | | | | | Payment | | | | |
| | | | | Buy/Sell Credit | | Amount | | | Receive | | | Termination | | | Received/ | | | | |
| Swap Reference Entity | | Counterparty | | Protection | | (000s) | | | Fixed Rate | | | Date | | | (Paid) | | | Value | |
| |
| Tribune Co. Continued: | | | | | | | | | | | | | | | | | | | | | | | | |
| | | Credit Suisse International | | Sell | | $ | 170 | | | | 5.000 | % | | | 1/16/09 | | | $ | 39,100 | | | $ | (159,396 | ) |
| | | JPMorgan Chase Bank NA, NY Branch | | Sell | | | 260 | | | | 5.000 | | | | 1/16/09 | | | | 62,400 | | | | (243,782 | ) |
| | | | | | | | | | | | | | | | | | | | |
| | | | | Total | | | 3,175 | | | | | | | | | | | | 827,600 | | | | (2,976,951 | ) |
| Univision Communications, Inc.: | | | | | | | | | | | | | | | | | | | | | | | | |
| | | Citibank NA, New York | | Sell | | | 435 | | | | 5.000 | | | | 12/20/09 | | | | 30,450 | | | | (149,384 | ) |
| | | Credit Suisse International | | Sell | | | 1,265 | | | | 14.600 | | | | 3/20/09 | | | | — | | | | (91,428 | ) |
| | | Goldman Sachs International | | Sell | | | 980 | | | | 5.000 | | | | 6/20/09 | | | | 98,000 | | | | (323,982 | ) |
| | | Goldman Sachs International | | Sell | | | 270 | | | | 5.000 | | | | 6/20/09 | | | | 29,700 | | | | (89,260 | ) |
| | | Goldman Sachs International | | Sell | | | 465 | | | | 5.000 | | | | 6/20/09 | | | | 27,900 | | | | (153,726 | ) |
| | | JPMorgan Chase Bank NA, NY Branch | | Sell | | | 750 | | | | 5.000 | | | | 6/20/09 | | | | 97,500 | | | | (247,946 | ) |
| | | UBS AG | | Sell | | | 450 | | | | 5.000 | | | | 6/20/09 | | | | 40,500 | | | | (148,767 | ) |
| | | | | | | | | | | | | | | | | | | | |
| | | | | Total | | | 4,615 | | | | | | | | | | | | 324,050 | | | | (1,204,493 | ) |
| Vale Overseas: | | | | | | | | | | | | | | | | | | | | | | | | |
| | | Deutsche Bank AG | | Buy | | | 840 | | | | 0.630 | | | | 3/20/17 | | | | — | | | | 137,722 | |
| | | | | | | | | | | | | | | | | | | | |
| | | | | Total | | | 840 | | | | | | | | | | | | — | | | | 137,722 | |
| | | | | | | | | | | | | | | | | | | | |
| | | Deutsche Bank AG | | Sell | | | 840 | | | | 1.050 | | | | 3/20/17 | | | | — | | | | (113,254 | ) |
| | | | | | | | | | | | | | | | | | | | |
| | | | | Total | | | 840 | | | | | | | | | | | | — | | | | (113,254 | ) |
| Vornado Realty LP: | | | | | | | | | | | | | | | | | | | | | | | | |
| | | Credit Suisse International | | Sell | | | 190 | | | | 3.600 | | | | 3/20/09 | | | | — | | | | (1,651 | ) |
| | | Deutsche Bank AG | | Sell | | | 385 | | | | 3.875 | | | | 6/20/09 | | | | — | | | | (3,087 | ) |
| | | | | | | | | | | | | | | | | | | | |
| | | | | Total | | | 575 | | | | | | | | | | | | — | | | | (4,738 | ) |
| XL Capital Ltd.: | | | | | | | | | | | | | | | | | | | | | | | | |
| | | Barclays Bank plc | | Sell | | | 425 | | | | 3.550 | | | | 9/20/09 | | | | — | | | | (31,542 | ) |
| | | Deutsche Bank AG | | Sell | | | 485 | | | | 3.550 | | | | 9/20/09 | | | | — | | | | (35,995 | ) |
| | | | | | | | | | | | | | | | | | | | |
| | | | | Total | | | 910 | | | | | | | | | | | | — | | | | (67,537 | ) |
| | | | | | | | | | | | | | | | | | | | |
| | | | | Grand Total Buys | | | 5,335 | | | | | | | | | | | | — | | | | 889,793 | |
| | | | | Grand Total Sells | | | 130,260 | | | | | | | | | | | | 6,535,674 | | | | (45,779,923 | ) |
| | | | | | | | | | | | | | | | | | | | | |
| | | | | Total Credit Default Swaps | | | | | | | | | | | | | | $ | 6,535,674 | | | $ | (44,890,130 | ) |
| | | | | | | | | | | | | | | | | | | | | |
The table that follows shows the undiscounted maximum potential payment by the Fund related to selling credit protection in credit default swaps:
| | | | | | | | | | | | | |
| Type of Reference Asset | | Total Maximum Potential | | | | | | | | |
| on which the Fund | | Payments for Selling Credit | | | | | | | Reference Asset | |
| Sold Protection | | Protection (Undiscounted) | | | Amount Recoverable* | | | Rating Range** | |
| |
| Asset-Backed Indexes | | $ | 2,870,000 | | | $ | — | | | AA |
| CMBS Indexes | | | 8,880,000 | | | | — | | | AAA |
| High Yield Indexes | | | 9,230,000 | | | | — | | | | B | |
| Single Name Corporate Debt | | | 28,720,000 | | | | 620,000 | | | AAA to BBB- |
| Single Name Corporate Debt | | | 80,560,000 | | | | 2,745,000 | | | BB+ to D |
| | | | | | | |
| Total | | $ | 130,260,000 | | | $ | 3,365,000 | | | | | |
| | | | | | | |
| | |
| * | | Amounts recoverable includes potential payments from related purchased protection for instances where the Fund is the seller of protection. In addition, the Fund has no recourse provisions under the credit derivatives and holds no collateral which can offset or reduce potential payments under a triggering event. |
| |
| ** | | The reference asset security rating, as rated by any rating organization, are included in the equivalent Standard & Poor’s rating category. The reference asset rating represents the likelihood of a potential payment by the Fund if the reference asset experiences a credit event as of period end. |
F13 | OPPENHEIMER HIGH INCOME FUND/VA
STATEMENT OF INVESTMENTS Continued
Footnotes to Statement of Investments Continued
Interest Rate Swap Contracts as of December 31, 2008 are as follows:
| | | | | | | | | | | | | | | | | | | | | |
| | | Notional | | | | | | | | | | | | | |
| Reference Entity/ | | Amount | | | Paid by | | | Received by | | | Termination | | | | |
| Swap Counterparty | | (000’s) | | | the Fund | | | the Fund | | | Date | | | Value | |
| |
USD BBA LIBOR: | | | | | | | | | | | | | | | | | | | | |
| Credit Suisse International | | $ | 3,710 | | | | 4.353 | % | | Three-Month USD BBA LIBOR | | | | 10/21/16 | | | $ | (530,278 | ) |
| Credit Suisse International | | | 2,740 | | | | 2.225 | | | Three-Month USD BBA LIBOR | | | | 11/20/10 | | | | (38,743 | ) |
| Goldman Sachs Group, Inc. (The) | | | 17,000 | | | | 4.488 | | | Three-Month USD BBA LIBOR | | | | 10/17/16 | | | | (2,592,016 | ) |
| Goldman Sachs Group, Inc. (The) | | | 20,000 | | | | 2.820 | | | Three-Month USD BBA LIBOR | | | | 10/29/10 | | | | (456,066 | ) |
| Goldman Sachs International | | | 4,000 | | | | 4.820 | | | Three-Month USD BBA LIBOR | | | | 8/22/28 | | | | (1,335,612 | ) |
| UBS AG | | | 3,620 | | | | 2.230 | | | Three-Month USD BBA LIBOR | | | | 11/20/10 | | | | (51,543 | ) |
| | | | | | | | | | | | | | | | | | | |
| Total where Fund pays a fixed rate | | | 51,070 | | | | | | | | | | | | | | | | (5,004,258 | ) |
| | | | | | | | | | | | | | | | | | | |
| Credit Suisse International | | | 9,000 | | | Three-Month USD BBA LIBOR | | | | 3.173 | % | | | 11/28/28 | | | | 668,925 | |
| Goldman Sachs International | | | 10,000 | | | Three-Month USD BBA LIBOR | | | | 4.519 | | | | 8/22/18 | | | | 1,919,770 | |
| | | | | | | | | | | | | | | | | | | |
| Total where Fund pays a variable rate | | | 19,000 | | | | | | | | | | | | | | | | 2,588,695 | |
| | | | | | | | | | | | | | | | | | | | |
| Total Interest Rate Swaps | | | | | | | | | | | | | | | | | | $ | (2,415,563 | ) |
| | | | | | | | | | | | | | | | | | | | |
Abbreviation is as follows:
BBA LIBOR British Bankers’ Association London-Interbank Offered Rate
Total Return Swap Contracts as of December 31, 2008 are as follows:
| | | | | | | | | | | | | | | | | | | | | |
| | | Notional | | | | | | | | | | | | | |
| Reference Entity/ | | Amount | | | Paid by | | | Received by | | | Termination | | | | |
| Swap Counterparty | | (000’s) | | | the Fund | | | the Fund | | | Date | | | Value | |
| |
Banc of America Securities LLC AAA
10 yr. CMBS Daily Index*: | | | | | | | | | | | | | | | | | | | | |
| Goldman Sachs Group, Inc. (The) | | $ | 47,110 | | | | A | | | | D | | | | 3/31/09 | | | $ | 10,147,886 | ) |
| Goldman Sachs Group, Inc. (The) | | | 45,430 | | | | B | | | | C | | | | 1/31/09 | | | | (10,793,032 | ) |
| Morgan Stanley | | | 6,240 | | | | B | | | | C | | | | 3/31/09 | | | | (1,539,668 | ) |
| | | | | | | | | | | | | | | | | | | | |
| | | | | | | | | | | | | | | Reference Entity Total | | | | (2,184,814 | ) |
| | | | | | | | | | | | | | | | | | | | | |
Barclays Capital U.S. CMBS AAA Index*: | | | | | | | | | | | | | | | | | | | | |
| Citibank NA | | | 19,800 | | | | A | | | | D | | | | 2/1/09 | | | | 2,163,413 | ) |
| Citibank NA | | | 11,500 | | | | A | | | | D | | | | 2/1/09 | | | | 1,264,038 | ) |
| Morgan Stanley | | | 2,200 | | | | A | | | | D | | | | 2/1/09 | | | | 240,644 | ) |
| Morgan Stanley | | | 3,800 | | | | A | | | | D | | | | 3/1/09 | | | | 416,408 | ) |
| | | | | | | | | | | | | | | | | | | | |
| | | | | | | | | | | | | | | Reference Entity Total | | | | 4,084,503 | ) |
| | | | | | | | | | | | | | | | | | | | | |
Barclays Capital U.S. CMBS AAA 8.5+ Index*: | | | | | | | | | | | | | | | | | | | | |
| Barclays Bank plc | | | 7,820 | | | | B | | | | C | | | | 4/1/09 | | | | (1,484,675 | ) |
| Goldman Sachs Group, Inc. (The) | | | 10,800 | | | | A | | | | D | | | | 3/1/09 | | | | 1,850,682 | |
| Goldman Sachs Group, Inc. (The) | | | 4,200 | | | | A | | | | D | | | | 3/1/09 | | | | 709,686 | |
| | | | | | | | | | | | | | | | | | | | |
| | | | | | | | | | | | | | | Reference Entity Total | | | | 1,075,693 | |
| | | | | | | | | | | | | | | | | | | | |
| | | | | | | | | | | | | | | Total of Total Return Swaps | | | $ | 2,975,382 | |
| | | | | | | | | | | | | | | | | | | | |
| | |
| * | | The CMBS Indexes are representative indexes of segments of the commercial mortgage backed securities market. These indexes are measured by movements in the credit spreads of the underlying holdings. As the credit market perceives an improvement in the credit quality of an Index’s underlying holdings and reduced probability of default, the spread of an index narrows. As the credit market perceives a decrease in credit quality and an increased probability of default on an Index’s underlying holdings, the spread widens. |
Abbreviation is as follows:
CMBS Commercial Mortgage Backed Securities
A—The Fund makes periodic payments when credit spreads, as represented by the Reference Entity, widen.
B—The Fund makes periodic payments when credit spreads, as represented by the Reference Entity, narrow.
C—The Fund receives periodic payments when credit spreads, as represented by the Reference Entity, widen.
D—The Fund receives periodic payments when credit spreads, as represented by the Reference Entity, narrow.
F14 | OPPENHEIMER HIGH INCOME FUND/VA
Footnotes to Statement of Investments Continued
The following table aggregates, as of period end, the amount receivable from/(payable to) each counterparty with whom the Fund has entered into a swap agreement. Swaps are individually disclosed in the preceding tables.
Swap Summary as of December 31, 2008 are as follows:
| | | | | | | | | | | |
| | | | | Notional | | | | |
| | | Swap Type from | | Amount | | | | |
| Swap Counterparty | | Fund Perspective | | (000’s) | | | Value | |
| |
| Barclays Bank plc: | | | | | | | | | | |
| | | Credit Default Buy Protection | | $ | 415 | | | $ | 39,137 | |
| | | Credit Default Sell Protection | | | 7,465 | | | | (2,584,048 | ) |
| | | Total Return | | | 7,820 | | | | (1,484,675 | ) |
| | | | | | | | | | |
| | | | | | | | | | (4,029,586 | ) |
| Citibank NA, New York | | Credit Default Sell Protection | | | 17,120 | | | | (5,600,199 | ) |
| Citibank NA | | Total Return | | | 31,300 | | | | 3,427,451 | |
| Credit Suisse International: | | | | | | | | | | |
| | | Credit Default Buy Protection | | | 1,695 | | | | 304,444 | |
| | | Credit Default Sell Protection | | | 24,945 | | | | (5,572,997 | ) |
| | | Interest Rate | | | 15,450 | | | | 99,904 | |
| | | | | | | | | | |
| | | | | | | | | | (5,168,649 | ) |
| Deutsche Bank AG: | | | | | | | | | | |
| | | Credit Default Buy Protection | | | 1,255 | | | | 201,136 | |
| | | Credit Default Sell Protection | | | 10,780 | | | | (3,124,958 | ) |
| | | | | | | | | | |
| | | | | | | | | | (2,923,822 | ) |
| Goldman Sachs Bank USA | | Credit Default Sell Protection | | | 2,320 | | | | (1,538,269 | ) |
| Goldman Sachs Group, Inc. (The): | | | | | | | | | | |
| | | Interest Rate | | | 37,000 | | | | (3,048,082 | ) |
| | | Total Return | | | 107,540 | | | | 1,915,222 | |
| | | | | | | | | | |
| | | | | | | | | | (1,132,860 | ) |
| Goldman Sachs International: | | | | | | | | | | |
| | | Credit Default Sell Protection | | | 12,400 | | | | (4,339,624 | ) |
| | | Interest Rate | | | 14,000 | | | | 584,158 | |
| | | | | | | | | | |
| | | | | | | | | | (3,755,466 | ) |
| JPMorgan Chase Bank NA, NY Branch | | Credit Default Sell Protection | | | 19,630 | | | | (6,498,824 | ) |
| Merrill Lynch International | | Credit Default Sell Protection | | | 11,865 | | | | (6,040,085 | ) |
| Morgan Stanley Capital Services, Inc.: | | | | | | | | | | |
| | | Credit Default Buy Protection | | | 1,970 | | | | 345,076 | |
| | | Credit Default Sell Protection | | | 17,695 | | | | (9,319,106 | ) |
| | | | | | | | | | |
| | | | | | | | | | (8,974,030 | ) |
| Morgan Stanley | | Total Return | | | 12,240 | | | | (882,616 | ) |
| UBS AG: | | | | | | | | | | |
| | | Credit Default Sell Protection | | | 6,040 | | | | (1,161,813 | ) |
| | | Interest Rate | | | 3,620 | | | | (51,543 | ) |
| | | | | | | | | | |
| | | | | | | | | | (1,213,356 | ) |
| | | | | | | | | | |
| | | | | Total Swaps | | | $ | (44,330,311 | ) |
| | | | | | | | | | |
See accompanying Notes to Financial Statements.
F15 | OPPENHEIMER HIGH INCOME FUND/VA
STATEMENT OF ASSETS AND LIABILITIES December 31, 2008
| | | | | |
Assets | | | | |
| |
| Investments, at value—see accompanying statement of investments: | | | | |
| Unaffiliated companies (cost $214,922,051) | | $ | 118,976,163 | |
| Affiliated companies (cost $76,839,590) | | | 76,839,590 | |
| | | | |
| | | | 195,815,753 | |
| Cash | | | 7,688,751 | |
| Swaps, at value (upfront payment received $376,713) | | | 20,623,073 | |
| Receivables and other assets: | | | | |
| Interest, dividends and principal paydowns | | | 4,014,143 | |
| Investments sold | | | 707,969 | |
| Shares of beneficial interest sold | | | 592,220 | |
| Due from Manager | | | 211 | |
| Other | | | 12,586 | |
| | | | |
| Total assets | | | 229,454,706 | |
| |
Liabilities | | | | |
| | | | | |
| Swaps, at value (upfront payment received $6,158,961) | | | 64,953,384 | |
| Payables and other liabilities: | | | | |
| Terminated investment contracts | | | 4,164,301 | |
| Shareholder communications | | | 44,656 | |
| Shares of beneficial interest redeemed | | | 35,260 | |
| Distribution and service plan fees | | | 31,474 | |
| Trustees’ compensation | | | 6,357 | |
| Transfer and shareholder servicing agent fees | | | 2,726 | |
| Other | | | 52,225 | |
| | | | |
| Total liabilities | | | 69,290,383 | |
| | | | | |
Net Assets | | $ | 160,164,323 | |
| | | | |
| | | | | |
Composition of Net Assets | | | | |
| |
| Par value of shares of beneficial interest | | $ | 101,322 | |
| Additional paid-in capital | | | 488,096,558 | |
| Accumulated net investment income | | | 35,234,239 | |
| Accumulated net realized loss on investments and foreign currency transactions | | | (229,527,271 | ) |
| Net unrealized depreciation on investments and translation of assets and liabilities denominated in foreign currencies | | | (133,740,525 | ) |
| | | | |
Net Assets | | $ | 160,164,323 | |
| | | | |
| | | | | |
Net Asset Value Per Share | | | | |
| |
| Non-Service Shares: | | | | |
| Net asset value, redemption price per share and offering price per share (based on net assets of $111,040,118 and 70,203,241 shares of beneficial interest outstanding) | | $ | 1.58 | |
| Service Shares: | | | | |
| Net asset value, redemption price per share and offering price per share (based on net assets of $43,374,578 and 27,493,189 shares of beneficial interest outstanding) | | $ | 1.58 | |
| Class 3 Shares: | | | | |
| Net asset value, redemption price per share and offering price per share (based on net assets of $1,582,575 and 1,008,930 shares of beneficial interest outstanding) | | $ | 1.57 | |
| Class 4 Shares: | | | | |
| Net asset value, redemption price per share and offering price per share (based on net assets of $4,167,052 and 2,616,813 shares of beneficial interest outstanding) | | $ | 1.59 | |
See accompanying Notes to Financial Statements.
F16 | OPPENHEIMER HIGH INCOME FUND/VA
STATEMENT OF OPERATIONS For the Year Ended December 31, 2008
| | | | | |
Investment Income | | | | |
| |
| Interest | | $ | 33,736,606 | |
| Dividends: | | | | |
| Unaffiliated companies (net of foreign withholding taxes of $3,460) | | | 570,689 | |
| Affiliated companies | | | 371,423 | |
| Fee income | | | 20,238 | |
| | | | |
| Total investment income | | | 34,698,956 | |
| | | | | |
Expenses | | | | |
| |
| Management fees | | | 2,529,797 | |
| Distribution and service plan fees: | | | | |
| Service shares | | | 287,674 | |
| Class 4 shares | | | 24,493 | |
| Transfer and shareholder servicing agent fees: | | | | |
| Non-Service shares | | | 9,994 | |
| Service shares | | | 9,994 | |
| Class 3 shares | | | 255 | |
| Class 4 shares | | | 5,210 | |
| Shareholder communications: | | | | |
| Non-Service shares | | | 80,297 | |
| Service shares | | | 43,899 | |
| Class 3 shares | | | 1,953 | |
| Class 4 shares | | | 3,811 | |
| Trustees’ compensation | | | 12,928 | |
| Custodian fees and expenses | | | 2,512 | |
| Other | | | 62,841 | |
| | | | |
| Total expenses | | | 3,075,658 | |
| Less reduction to custodian expenses | | | (2,129 | ) |
| Less waivers and reimbursements of expenses | | | (81,045 | ) |
| | | | |
| Net expenses | | | 2,992,484 | |
| | | | | |
Net Investment Income | | | 31,706,472 | |
| |
Realized and Unrealized Gain (Loss) | | | | |
| |
| Net realized gain (loss) on: | | | | |
| Investments from unaffiliated companies | | | (85,561,562 | ) |
| Closing and expiration of futures contracts | | | 2,278,201 | |
| Foreign currency transactions | | | 402,036 | |
| Short positions | | | (76,620 | ) |
| Swap contracts | | | (158,865,141 | ) |
| | | | |
| Net realized loss | | | (241,823,086 | ) |
| Net change in unrealized appreciation (depreciation) on: | | | | |
| Investments | | | (76,156,186 | ) |
| Translation of assets and liabilities denominated in foreign currencies | | | (606,244 | ) |
| Futures contracts | | | (346,624 | ) |
| Short positions | | | 23,908 | |
| Swap contracts | | | (24,813,985 | ) |
| | | | |
| Net change in unrealized depreciation | | | (101,899,131 | ) |
| |
Net Decrease in Net Assets Resulting from Operations | | $ | (312,015,745 | ) |
| | | | |
See accompanying Notes to Financial Statements.
F17 | OPPENHEIMER HIGH INCOME FUND/VA
STATEMENTS OF CHANGES IN NET ASSETS
| | | | | | | | | |
| Year Ended December 31, | | 2008 | | | 2007 | |
| |
Operations | | | | | | | | |
| | | | | | | | | |
| Net investment income | | $ | 31,706,472 | | | $ | 35,258,258 | |
| Net realized gain (loss) | | | (241,823,086 | ) | | | 2,744,711 | |
| Net change in unrealized depreciation | | | (101,899,131 | ) | | | (38,060,297 | ) |
| | | | | | | |
| Net decrease in net assets resulting from operations | | | (312,015,745 | ) | | | (57,328 | ) |
| | | | | | | | | |
Dividends and/or Distributions to Shareholders | | | | | | | | |
| | | | | | | | | |
| Dividends from net investment income: | | | | | | | | |
| Non-Service shares | | | (16,471,157 | ) | | | (24,967,707 | ) |
| Service shares | | | (8,570,925 | ) | | | (11,831,305 | ) |
| Class 3 shares | | | (292,606 | ) | | | — | |
| Class 4 shares | | | (611,268 | ) | | | — | |
| | | | | | | |
| | | | (25,945,956 | ) | | | (36,799,012 | ) |
| | | | | | | | | |
Beneficial Interest Transactions | | | | | | | | |
| | | | | | | | | |
| Net increase (decrease) in net assets resulting from beneficial interest transactions: | | | | | | | | |
| Non-Service shares | | | 19,699,234 | | | | (42,430,203 | ) |
| Service shares | | | 5,209,593 | | | | (3,835,518 | ) |
| Class 3 shares | | | 1,808,854 | | | | 5,091,701 | |
| Class 4 shares | | | 4,859,490 | | | | 9,835,657 | |
| | | | | | | |
| | | | 31,577,171 | | | | (31,338,363 | ) |
| | | | | | | | | |
Net Assets | | | | | | | | |
| | | | | | | | | |
| Total decrease | | | (306,384,530 | ) | | | (68,194,703 | ) |
| Beginning of period | | | 466,548,853 | | | | 534,743,556 | |
| | | | | | | |
| End of period (including accumulated net investment income of $35,234,239 and $38,507,913, respectively) | | $ | 160,164,323 | | | $ | 466,548,853 | |
| | | | | | | |
See accompanying Notes to Financial Statements.
F18 | OPPENHEIMER HIGH INCOME FUND/VA
FINANCIAL HIGHLIGHTS
| | | | | | | | | | | | | | | | | | | | | |
| Non-Service Shares Year Ended December 31, | | 2008 | | | 2007 | | | 2006 | | | 2005 | | | 2004 | |
| |
Per Share Operating Data | | | | | | | | | | | | | | | | | | | | |
| |
| Net asset value, beginning of period | | $ | 7.95 | | | $ | 8.55 | | | $ | 8.44 | | | $ | 8.80 | | | $ | 8.61 | |
| Income (loss) from investment operations: | | | | | | | | | | | | | | | | | | | | |
Net investment income1 | | | .54 | | | | .57 | | | | .58 | | | | .57 | | | | .58 | |
| Net realized and unrealized gain (loss) | | | (6.44 | ) | | | (.56 | ) | | | .17 | | | | (.37 | ) | | | .15 | |
| | | |
| Total from investment operations | | | (5.90 | ) | | | .01 | | | | .75 | | | | .20 | | | | .73 | |
| Dividends and/or distributions to shareholders: | | | | | | | | | | | | | | | | | | | | |
| Dividends from net investment income | | | (.47 | ) | | | (.61 | ) | | | (.64 | ) | | | (.56 | ) | | | (.54 | ) |
| Net asset value, end of period | | $ | 1.58 | | | $ | 7.95 | | | $ | 8.55 | | | $ | 8.44 | | | $ | 8.80 | |
| | | |
| | | | | | | | | | | | | | | | | | | | | |
Total Return, at Net Asset Value2 | | | (78.67 | )% | | | (0.10 | )% | | | 9.42 | % | | | 2.31 | % | | | 8.97 | % |
| | | | | | | | | | | | | | | | | | | | | |
Ratios/Supplemental Data | | | | | | | | | | | | | | | | | | | | |
| Net assets, end of period (in thousands) | | $ | 111,040 | | | $ | 294,819 | | | $ | 361,445 | | | $ | 384,726 | | | $ | 479,405 | |
| Average net assets (in thousands) | | $ | 211,186 | | | $ | 335,702 | | | $ | 365,154 | | | $ | 444,477 | | | $ | 460,877 | |
Ratios to average net assets:3 | | | | | | | | | | | | | | | | | | | | |
| Net investment income | | | 9.30 | % | | | 6.96 | % | | | 7.05 | % | | | 6.79 | % | | | 6.91 | % |
| Total expenses | | | 0.80 | %4 | | | 0.75 | %4 | | | 0.74 | %4 | | | 0.75 | % | | | 0.75 | % |
| Expenses after payments, waivers and/or reimbursements and reduction to custodian expenses | | | 0.78 | % | | | 0.74 | % | | | 0.74 | % | | | 0.75 | % | | | 0.75 | % |
| |
| Portfolio turnover rate | | | 53 | %5 | | | 67 | %5 | | | 57 | % | | | 64 | | | | 51 | % |
| | |
| 1. | | Per share amounts calculated based on the average shares outstanding during the period. |
| |
| 2. | | Assumes an investment on the business day before the first day of the fiscal period, with all dividends and distributions reinvested in additional shares on the reinvestment date, and redemption at the net asset value calculated on the last business day of the fiscal period. Total returns are not annualized for periods less than one full year. Total return information does not reflect expenses that apply at the separate account level or to related insurance products. Inclusion of these charges would reduce the total return figures for all periods shown. Returns do not reflect the deduction of taxes that a shareholder would pay on fund distributions or the redemption of fund shares. |
| |
| 3. | | Annualized for periods less than one full year. |
| |
| 4. | | Total expenses including indirect expenses from affiliated fund were as follows: |
| | | | | |
| Year Ended December 31, 2008 | | | 0.80 | % |
| Year Ended December 31, 2007 | | | 0.76 | % |
| Year Ended December 31, 2006 | | | 0.74 | % |
| | |
| 5. | | The portfolio turnover rate excludes purchase and sale transactions of To Be Announced (TBA) mortgage-related securities as follows: |
| | | | | | | | | |
| | | Purchase Transactions | | | Sale Transactions | |
| Year Ended December 31, 2008 | | $ | 40,240,084 | | | $ | 41,196,921 | |
| Year Ended December 31, 2007 | | $ | 30,798,147 | | | $ | 24,096,458 | |
See accompanying Notes to Financial Statements.
F19 | OPPENHEIMER HIGH INCOME FUND/VA
FINANCIAL HIGHLIGHTS Continued
| | | | | | | | | | | | | | | | | | | | | |
| Service Shares Year Ended December 31, | | 2008 | | | 2007 | | | 2006 | | | 2005 | | | 2004 | |
| |
Per Share Operating Data | | | | | | | | | | | | | | | | | | | | |
| Net asset value, beginning of period | | $ | 7.89 | | | $ | 8.50 | | | $ | 8.39 | | | $ | 8.76 | | | $ | 8.58 | |
| Income (loss) from investment operations: | | | | | | | | | | | | | | | | | | | | |
Net investment income1 | | | .54 | | | | .55 | | | | .56 | | | | .55 | | | | .56 | |
| Net realized and unrealized gain (loss) | | | (6.40 | ) | | | (.57 | ) | | | .17 | | | | (.38 | ) | | | .15 | |
| | | |
| Total from investment operations | | | (5.86 | ) | | | (.02 | ) | | | .73 | | | | .17 | | | | .71 | |
| Dividends and/or distributions to shareholders: | | | | | | | | | | | | | | | | | | | | |
| Dividends from net investment income | | | (.45 | ) | | | (.59 | ) | | | (.62 | ) | | | (.54 | ) | | | (.53 | ) |
| Net asset value, end of period | | $ | 1.58 | | | $ | 7.89 | | | $ | 8.50 | | | $ | 8.39 | | | $ | 8.76 | |
| | | |
| | | | | | | | | | | | | | | | | | | | | |
Total Return, at Net Asset Value2 | | | (78.57 | )% | | | (0.47 | )% | | | 9.23 | % | | | 2.01 | % | | | 8.73 | % |
| | | | | | | | | | | | | | | | | | | | | |
Ratios/Supplemental Data | | | | | | | | | | | | | | | | | | | | |
| Net assets, end of period (in thousands) | | $ | 43,375 | | | $ | 157,333 | | | $ | 173,299 | | | $ | 155,617 | | | $ | 134,013 | |
| Average net assets (in thousands) | | $ | 116,236 | | | $ | 169,569 | | | $ | 160,703 | | | $ | 141,287 | | | $ | 101,464 | |
Ratios to average net assets:3 | | | | | | | | | | | | | | | | | | | | |
| Net investment income | | | 9.13 | % | | | 6.71 | % | | | 6.80 | % | | | 6.54 | % | | | 6.63 | % |
| Total expenses | | | 1.05 | %4 | | | 1.01 | %4 | | | 1.00 | %4 | | | 1.00 | % | | | 1.01 | % |
| Expenses after payments, waivers and/or reimbursements and reduction to custodian expenses | | | 1.03 | % | | | 1.00 | % | | | 1.00 | % | | | 1.00 | % | | | 1.01 | % |
| Portfolio turnover rate | | | 53 | %5 | | | 67 | %5 | | | 57 | % | | | 64 | % | | | 51 | % |
| | |
| 1. | | Per share amounts calculated based on the average shares outstanding during the period. |
| |
| 2. | | Assumes an investment on the business day before the first day of the fiscal period, with all dividends and distributions reinvested in additional shares on the reinvestment date, and redemption at the net asset value calculated on the last business day of the fiscal period. Total returns are not annualized for periods less than one full year. Total return information does not reflect expenses that apply at the separate account level or to related insurance products. Inclusion of these charges would reduce the total return figures for all periods shown. Returns do not reflect the deduction of taxes that a shareholder would pay on fund distributions or the redemption of fund shares. |
| |
| 3. | | Annualized for periods less than one full year. |
| |
| 4. | | Total expenses including indirect expenses from affiliated fund were as follows: |
| | | | | |
| Year Ended December 31, 2008 | | | 1.05 | % |
| Year Ended December 31, 2007 | | | 1.02 | % |
| Year Ended December 31, 2006 | | | 1.00 | % |
| | |
| 5. | | The portfolio turnover rate excludes purchase and sale transactions of To Be Announced (TBA) mortgage-related securities as follows: |
| | | | | | | | | |
| | | Purchase Transactions | | | Sale Transactions | |
| |
| Year Ended December 31, 2008 | | $ | 40,240,084 | | | $ | 41,196,921 | |
| Year Ended December 31, 2007 | | $ | 30,798,147 | | | $ | 24,096,458 | |
See accompanying Notes to Financial Statements.
F20 | OPPENHEIMER HIGH INCOME FUND/VA
| | | | | | | | | |
| Class 3 Shares Year Ended December 31, | | 2008 | | | 20071 | |
Per Share Operating Data | | | | | | | | |
| |
| Net asset value, beginning of period | | $ | 7.98 | | | $ | 8.26 | |
| Income (loss) from investment operations: | | | | | | | | |
Net investment income2 | | | .56 | | | | .37 | |
| Net realized and unrealized loss | | | (6.50 | ) | | | (.65 | ) |
| | | | | | | |
| Total from investment operations | | | (5.94 | ) | | | (.28 | ) |
| Dividends and/or distributions to shareholders: | | | | | | | | |
| Dividends from net investment income | | | (.47 | ) | | | — | |
| Net asset value, end of period | | $ | 1.57 | | | $ | 7.98 | |
| | | | | | | |
| | | | | | | | | |
Total Return, at Net Asset Value3 | | | (78.89 | )% | | | (3.39 | )% |
| | | | | | | | | |
Ratios/Supplemental Data | | | | | | | | |
| |
| Net assets, end of period (in thousands) | | $ | 1,582 | | | $ | 4,921 | |
| Average net assets (in thousands) | | $ | 5,292 | | | $ | 3,750 | |
Ratios to average net assets:4 | | | | | | | | |
| Net investment income | | | 9.29 | % | | | 6.90 | % |
Total expenses5 | | | 0.80 | % | | | 0.76 | % |
| Expenses after payments, waivers and/or reimbursements and reduction to custodian expenses | | | 0.78 | % | | | 0.75 | % |
Portfolio turnover rate6 | | | 53 | % | | | 67 | % |
| | |
| 1. | | For the period from May 1, 2007 (inception of offering) to December 31, 2007. |
| |
| 2. | | Per share amounts calculated based on the average shares outstanding during the period. |
| |
| 3. | | Assumes an investment on the business day before the first day of the fiscal period, with all dividends and distributions reinvested in additional shares on the reinvestment date, and redemption at the net asset value calculated on the last business day of the fiscal period. Total returns are not annualized for periods less than one full year. Total return information does not reflect expenses that apply at the separate account level or to related insurance products. Inclusion of these charges would reduce the total return figures for all periods shown. Returns do not reflect the deduction of taxes that a shareholder would pay on fund distributions or the redemption of fund shares. |
| |
| 4. | | Annualized for periods less than one full year. |
| |
| 5. | | Total expenses including indirect expenses from affiliated fund were as follows: |
| | | | | |
| Year Ended December 31, 2008 | | | 0.80 | % |
| Period Ended December 31, 2007 | | | 0.77 | % |
| | |
| 6. | | The portfolio turnover rate excludes purchase and sale transactions of To Be Announced (TBA) mortgage-related securities as follows: |
| | | | | | | | | |
| | | Purchase Transactions | | | Sale Transactions | |
| |
| Year Ended December 31, 2008 | | $ | 40,240,084 | | | $ | 41,196,921 | |
| Period Ended December 31, 2007 | | $ | 30,798,147 | | | $ | 24,096,458 | |
See accompanying Notes to Financial Statements.
F21 | OPPENHEIMER HIGH INCOME FUND/VA
FINANCIAL HIGHLIGHTS Continued
| | | | | | | | | |
| Class 4 Shares Year Ended December 31, | | 2008 | | | 20071 | |
| |
Per Share Operating Data | | | | | | | | |
| |
| Net asset value, beginning of period | | $ | 7.97 | | | $ | 8.26 | |
| Income (loss) from investment operations: | | | | | | | | |
Net investment income2 | | | .54 | | | | .36 | |
| Net realized and unrealized loss | | | (6.46 | ) | | | (.65 | ) |
| | | |
| Total from investment operations | | | (5.92 | ) | | | (.29 | ) |
| Dividends and/or distributions to shareholders: | | | | | | | | |
| Dividends from net investment income | | | (.46 | ) | | | — | |
| Net asset value, end of period | | $ | 1.59 | | | $ | 7.97 | |
| | | |
| | | | | | | | | |
Total Return, at Net Asset Value3 | | | (78.63 | )% | | | (3.51 | )% |
| | | | | | | | | |
Ratios/Supplemental Data | | | | | | | | |
| Net assets, end of period (in thousands) | | $ | 4,167 | | | $ | 9,476 | |
| Average net assets (in thousands) | | $ | 10,658 | | | $ | 7,201 | |
Ratios to average net assets:4 | | | | | | | | |
| Net investment income | | | 9.00 | % | | | 6.61 | % |
Total expenses5 | | | 1.07 | % | | | 1.05 | % |
| Expenses after payments, waivers and/or reimbursements and reduction to custodian expenses | | | 1.05 | % | | | 1.04 | % |
Portfolio turnover rate6 | | | 53 | % | | | 67 | % |
| | |
| 1. | | For the period from May 1, 2007 (inception of offering) to December 31, 2007. |
| |
| 2. | | Per share amounts calculated based on the average shares outstanding during the period. |
| |
| 3. | | Assumes an investment on the business day before the first day of the fiscal period, with all dividends and distributions reinvested in additional shares on the reinvestment date, and redemption at the net asset value calculated on the last business day of the fiscal period. Total returns are not annualized for periods less than one full year. Total return information does not reflect expenses that apply at the separate account level or to related insurance products. Inclusion of these charges would reduce the total return figures for all periods shown. Returns do not reflect the deduction of taxes that a shareholder would pay on fund distributions or the redemption of fund shares. |
| |
| 4. | | Annualized for periods less than one full year. |
| |
| 5. | | Total expenses including indirect expenses from affiliated fund were as follows: |
| | | | | |
| Year Ended December 31, 2008 | | | 1.07 | % |
| Period Ended December 31, 2007 | | | 1.06 | % |
| | |
| 6. | | The portfolio turnover rate excludes purchase and sale transactions of To Be Announced (TBA) mortgage-related securities as follows: |
| | | | | | | | | |
| | | Purchase Transactions | | | Sale Transactions | |
| |
| Year Ended December 31, 2008 | | $ | 40,240,084 | | | $ | 41,196,921 | |
| Period Ended December 31, 2007 | | $ | 30,798,147 | | | $ | 24,096,458 | |
See accompanying Notes to Financial Statements.
F22 | OPPENHEIMER HIGH INCOME FUND/VA
NOTES TO FINANCIAL STATEMENTS
1. Significant Accounting Policies
Oppenheimer High Income Fund/VA (the “Fund”) is a separate series of Oppenheimer Variable Account Funds, an open-end management investment company registered under the Investment Company Act of 1940, as amended. The Fund’s investment objective is to seek a high level of current income by investing mainly in a diversified portfolio of high-yield, lower-grade, fixed-income securities that the Fund’s investment manager, OppenheimerFunds, Inc. (the “Manager”), believes does not involve undue risk. On December 17, 2008, the Manager purchased Non-Service Shares of the Fund for $50,000,000. As of December 31, 2008, 47% of the shares outstanding of Non-Service Shares were owned by the Manager.
The Fund offers Non-Service, Service, Class 3 and Class 4 shares. All classes are sold at their offering price, which is the net asset value per share, to separate investment accounts of participating insurance companies as an underlying investment for variable life insurance policies, variable annuity contracts or other investment products. The class of shares being designated as Service shares and Class 4 shares are subject to a distribution and service plan. All classes of shares have identical rights and voting privileges with respect to the Fund in general and exclusive voting rights on matters that affect that class alone. Earnings, net assets and net asset value per share may differ due to each class having its own expenses, such as transfer and shareholder servicing agent fees and shareholder communications, directly attributable to that class. The Fund assesses a 1% fee on the proceeds of Class 3 and Class 4 shares that are redeemed (either by selling or exchanging to another Oppenheimer fund or other investment option offered through your variable life insurance or variable annuity contract) within 60 days of their purchase. The fee, which is retained by the Fund, is accounted for as an addition to paid-in capital.
The following is a summary of significant accounting policies consistently followed by the Fund.
Securities Valuation. The Fund calculates the net asset value of its shares as of the close of the New York Stock Exchange (the “Exchange”), normally 4:00 P.M. Eastern time, on each day the Exchange is open for trading.
Effective for fiscal periods beginning after November 15, 2007, FASB Statement of Financial Accounting Standards No. 157, Fair Value Measurements, establishes a hierarchy for measuring fair value of assets and liabilities. As required by the standard, each investment asset or liability of the Fund is assigned a level at measurement date based on the significance and source of the inputs to its valuation. Quoted prices in active markets for identical securities are classified as “Level 1”, inputs other than quoted prices for an asset that are observable are classified as “Level 2” and unobservable inputs, including the Manager’s judgment about the assumptions that a market participant would use in pricing an asset or liability are classified as “Level 3”. The inputs used for valuing securities are not necessarily an indication of the risks associated with investing in those securities. A table summarizing the Fund’s investments under these levels of classification is included following the Statement of Investments.
Securities are valued using quoted market prices, when available, as supplied primarily either by portfolio pricing services approved by the Board of Trustees or dealers. These securities are typically classified within Level 1 or 2; however, they may be designated as Level 3 if the dealer or portfolio pricing service values a security through an internal model with significant unobservable market data inputs.
Securities traded on a registered U.S. securities exchange are valued based on the last sale price of the security reported on the principal exchange on which traded, prior to the time when the Fund’s assets are valued. Securities whose principal exchange is NASDAQ® are valued based on the official closing prices reported by NASDAQ prior to the time when the Fund’s assets are valued. In the absence of a sale, the security is valued at the last sale price on the prior trading day, if it is within the spread of the current day’s closing “bid” and “asked” prices, and if not, at the current day’s closing bid price. A foreign security traded on a foreign exchange is valued based on the last sale price on the principal exchange on which the security is traded, as identified by the portfolio pricing service used by the Manager, prior to the time when the Fund’s assets are valued. In the absence of a sale, the security is valued at the most recent official closing price on the principal exchange on which it is traded.
Shares of a registered investment company that are not traded on an exchange are valued at that investment company’s net asset value per share.
F23 | OPPENHEIMER HIGH INCOME FUND/VA
NOTES TO FINANCIAL STATEMENTS Continued
1. Significant Accounting Policies Continued
Corporate, government and municipal debt instruments having a remaining maturity in excess of sixty days and all mortgage-backed securities, collateralized mortgage obligations and other asset-backed securities are valued at the mean between the “bid” and “asked” prices.
“Money market-type” debt instruments with remaining maturities of sixty days or less are valued at cost adjusted by the amortization of discount or premium to maturity (amortized cost), which approximates market value. These securities are typically designated as Level 2.
In the absence of a readily available quoted market price, including for securities whose values have been materially affected by what the Manager identifies as a significant event occurring before the Fund’s assets are valued but after the close of the securities’ respective exchanges, the Manager, acting through its internal valuation committee, in good faith determines the fair valuation of that asset using consistently applied procedures under the supervision of the Board of Trustees (which reviews those fair valuations by the Manager). Those procedures include certain standardized methodologies to fair value securities. Such methodologies include, but are not limited to, pricing securities initially at cost and subsequently adjusting the value based on: changes in company specific fundamentals, changes in an appropriate securities index, or changes in the value of similar securities which may be adjusted for any discounts related to resale restrictions. When possible, such methodologies use observable market inputs such as quoted prices of similar securities, observable interest rates, currency rates and yield curves. The methodologies used for valuing securities are not necessarily an indication of the risks associated with investing in those securities.
Fair valued securities may be classified as “Level 3” if the valuation primarily reflects the Manager’s own assumptions about the inputs that market participants would use in valuing such securities.
There have been no significant changes to the fair valuation methodologies during the period.
Securities on a When-Issued or Delayed Delivery Basis. The Fund may purchase securities on a “when-issued” basis, and may purchase or sell securities on a “delayed delivery” basis. “When-issued” or “delayed delivery” refers to securities whose terms and indenture are available and for which a market exists, but which are not available for immediate delivery. Delivery and payment for securities that have been purchased by the Fund on a when-issued basis normally takes place within six months and possibly as long as two years or more after the trade date. During this period, such securities do not earn interest, are subject to market fluctuation and may increase or decrease in value prior to their delivery. The purchase of securities on a when-issued basis may increase the volatility of the Fund’s net asset value to the extent the Fund executes such transactions while remaining substantially fully invested. When the Fund engages in when-issued or delayed delivery transactions, it relies on the buyer or seller, as the case may be, to complete the transaction. Their failure to do so may cause the Fund to lose the opportunity to obtain or dispose of the security at a price and yield it considers advantageous. The Fund maintains internally designated assets with a market value equal to or greater than the amount of its purchase commitments. The Fund may also sell securities that it purchased on a when-issued basis or forward commitment prior to settlement of the original purchase.
As of December 31, 2008, the Fund had no purchased securities issued on a when-issued or delayed delivery basis and no sold securities issued on a delayed delivery basis.
The Fund may enter into “forward roll” transactions with respect to mortgage-related securities. In this type of transaction, the Fund sells a mortgage-related security to a buyer and simultaneously agrees to repurchase a similar security (same type, coupon and maturity) at a later date at a set price. During the period between the sale and the repurchase, the Fund will not be entitled to receive interest and principal payments on the securities that have been sold. The Fund records the incremental difference between the forward purchase and sale of each forward roll as realized gain (loss) on investments or as fee income in the case of such transactions that have an associated fee in lieu of a difference in the forward purchase and sale price.
Risks of entering into forward roll transactions include the potential inability of the counterparty to meet the terms of the agreement; the potential of the Fund to receive inferior securities at redelivery as compared to the securities
F24 | OPPENHEIMER HIGH INCOME FUND/VA
sold to the counterparty; counterparty credit risk. To assure its future payment of the purchase price, the Fund maintains internally designated assets with a market value equal to or greater than the payment obligation under the roll.
Securities Sold Short. The Fund may short sell when-issued securities for future settlement. The value of the open short position is recorded as a liability, and the Fund records an unrealized gain or loss for the change in value of the open short position. The Fund records a realized gain or loss when the short position is closed out.
As of December 31, 2008, the Fund had no securities sold short.
Credit Risk. The Fund invests in high-yield, non-investment-grade bonds, which may be subject to a greater degree of credit risk. Credit risk relates to the ability of the issuer to meet interest or principal payments or both as they become due. The Fund may acquire securities in default, and is not obligated to dispose of securities whose issuers subsequently default. As of December 31, 2008, securities with an aggregate market value of $606,546, representing 0.38% of the Fund’s net assets, were in default.
Foreign Currency Translation. The Fund’s accounting records are maintained in U.S. dollars. The values of securities denominated in foreign currencies and amounts related to the purchase and sale of foreign securities and foreign investment income are translated into U.S. dollars as of the close of the Exchange, normally 4:00 P.M. Eastern time, on each day the Exchange is open for trading. Foreign exchange rates may be valued primarily using a reliable bank, dealer or service authorized by the Board of Trustees.
Reported net realized gains and losses from foreign currency transactions arise from sales of portfolio securities, sales and maturities of short-term securities, sales of foreign currencies, exchange rate fluctuations between the trade and settlement dates on securities transactions, and the difference between the amounts of dividends, interest, and foreign withholding taxes recorded on the Fund’s books and the U.S. dollar equivalent of the amounts actually received or paid. Net unrealized appreciation and depreciation on the translation of assets and liabilities denominated in foreign currencies arise from changes in the values of assets and liabilities, including investments in securities at fiscal period end, resulting from changes in exchange rates.
The effect of changes in foreign currency exchange rates on investments is separately identified from the fluctuations arising from changes in market values of securities held and reported with all other foreign currency gains and losses in the Fund’s Statement of Operations.
Investment in Oppenheimer Institutional Money Market Fund. The Fund is permitted to invest daily available cash balances in an affiliated money market fund. The Fund may invest the available cash in Class E shares of Oppenheimer Institutional Money Market Fund (“IMMF”) to seek current income while preserving liquidity. IMMF is a registered open-end management investment company, regulated as a money market fund under the Investment Company Act of 1940, as amended. The Manager is also the investment adviser of IMMF. The Fund’s investment in IMMF is included in the Statement of Investments. As a shareholder, the Fund is subject to its proportional share of IMMF’s Class E expenses, including its management fee. The Manager will waive fees and/or reimburse Fund expenses in an amount equal to the indirect management fees incurred through the Fund’s investment in IMMF.
Investments With Off-Balance Sheet Market Risk. The Fund enters into financial instrument transactions (such as swaps, futures, options and other derivatives) that may have off-balance sheet market risk. Off-balance sheet market risk exists when the maximum potential loss on a particular financial instrument is greater than the value of such financial instrument, as reflected in the Fund’s Statement of Assets and Liabilities.
Allocation of Income, Expenses, Gains and Losses. Income, expenses (other than those attributable to a specific class), gains and losses are allocated on a daily basis to each class of shares based upon the relative proportion of net assets represented by such class. Operating expenses directly attributable to a specific class are charged against the operations of that class.
F25 | OPPENHEIMER HIGH INCOME FUND/VA
NOTES TO FINANCIAL STATEMENTS Continued
1. Significant Accounting Policies Continued
Federal Taxes. The Fund intends to comply with provisions of the Internal Revenue Code applicable to regulated investment companies and to distribute substantially all of its investment company taxable income, including any net realized gain on investments not offset by capital loss carryforwards, if any, to shareholders. Therefore, no federal income or excise tax provision is required. The Fund files income tax returns in U.S. federal and applicable state jurisdictions. The statute of limitations on the Fund’s tax return filings generally remain open for the three preceding fiscal reporting period ends.
The tax components of capital shown in the following table represent distribution requirements the Fund must satisfy under the income tax regulations, losses the Fund may be able to offset against income and gains realized in future years and unrealized appreciation or depreciation of securities and other investments for federal income tax purposes.
| | | | | | | | | | | | | |
| | | | | | | | | | | Net Unrealized | |
| | | | | | | | | | | Depreciation | |
| | | | | | | | | | | Based on Cost of | |
| | | | | | | | | | | Securities and | |
| Undistributed | | Undistributed | | | Accumulated | | | Other Investments | |
| Net Investment | | Long-Term | | | Loss | | | for Federal Income | |
| Income | | Gain | | | Carryforward1,2,3,4,5 | | | Tax Purposes | |
| |
| $ — | | $ | — | | | $ | 229,873,294 | | | $ | 98,153,945 | |
| | |
| 1. | | As of December 31, 2008, the Fund had $135,987,641 of net capital loss carryforwards available to offset future realized capital gains, if any, and thereby reduce future taxable gain distributions. As of December 31, 2008, details of the capital loss carryforwards were as follows: |
| | | | | |
| Expiring | | | | |
| |
| 2009 | | $ | 22,696,701 | |
| 2010 | | | 56,061,391 | |
| 2011 | | | 8,529,303 | |
| 2012 | | | 128,504 | |
| 2016 | | | 48,571,742 | |
| | | | |
| Total | | $ | 135,987,641 | |
| | | | |
| | |
| 2. | | As of December 31, 2008, the Fund had $93,885,653 of post-October losses available to offset future realized capital gains, if any. Such losses, if unutilized, will expire in 2017. |
| |
| 3. | | During the fiscal year ended December 31, 2008, the Fund did not utilize any capital loss carryforward. |
| |
| 4. | | During the fiscal year ended December 31, 2007, the Fund utilized $4,768,054 of capital loss carryforward to offset capital gains realized in that fiscal year. |
| |
| 5. | | During the fiscal year ended December 31, 2008, $9,779,664 of unused capital loss carryforward expired. |
Net investment income (loss) and net realized gain (loss) may differ for financial statement and tax purposes. The character of dividends and distributions made during the fiscal year from net investment income or net realized gains may differ from their ultimate characterization for federal income tax purposes. Also, due to timing of dividends and distributions, the fiscal year in which amounts are distributed may differ from the fiscal year in which the income or net realized gain was recorded by the Fund.
Accordingly, the following amounts have been reclassified for December 31, 2008. Net assets of the Fund were unaffected by the reclassifications.
| | | | | | | | | |
| | | | | | | Reduction to | |
| | | Reduction to | | | Accumulated Net | |
| Reduction to Paid-in | | Accumulated Net | | | Realized Loss on | |
| Capital | | Investment Income | | | Investments | |
| |
| $107,447,213 | | $ | 9,034,190 | | | $ | 116,481,403 | |
The tax character of distributions paid during the years ended December 31, 2008 and December 31, 2007 was as follows:
| | | | | | | | | |
| | | Year Ended | | | Year Ended | |
| | | December 31, 2008 | | | December 31, 2007 | |
| |
| Distributions paid from: | | | | | | | | |
| Ordinary income | | $ | 25,945,956 | | | $ | 36,799,012 | |
F26 | OPPENHEIMER HIGH INCOME FUND/ VA
The aggregate cost of securities and other investments and the composition of unrealized appreciation and depreciation of securities and other investments for federal income tax purposes as of December 31, 2008 are noted in the following table. The primary difference between book and tax appreciation or depreciation of securities and other investments, if applicable, is attributable to the tax deferral of losses or tax realization of financial statement unrealized gain or loss.
| | | | | |
| Federal tax cost of securities | | $ | 291,496,007 | |
| Federal tax cost of other investments | | | (41,856,620 | ) |
| | | | |
| Total federal tax cost | | $ | 249,639,387 | |
| | | | |
| | | | | |
| Gross unrealized appreciation | | $ | 2,609,753 | |
| Gross unrealized depreciation | | | (100,763,698 | ) |
| | | | |
| Net unrealized depreciation | | $ | (98,153,945 | ) |
| | | | |
Trustees’ Compensation. The Board of Trustees has adopted a compensation deferral plan for independent trustees that enables trustees to elect to defer receipt of all or a portion of the annual compensation they are entitled to receive from the Fund. For purposes of determining the amount owed to the Trustee under the plan, deferred amounts are treated as though equal dollar amounts had been invested in shares of the Fund or in other Oppenheimer funds selected by the Trustee. The Fund purchases shares of the funds selected for deferral by the Trustee in amounts equal to his or her deemed investment, resulting in a Fund asset equal to the deferred compensation liability. Such assets are included as a component of “Other” within the asset section of the Statement of Assets and Liabilities. Deferral of trustees’ fees under the plan will not affect the net assets of the Fund, and will not materially affect the Fund’s assets, liabilities or net investment income per share. Amounts will be deferred until distributed in accordance to the compensation deferral plan.
Dividends and Distributions to Shareholders. Dividends and distributions to shareholders, which are determined in accordance with income tax regulations and may differ from U.S. generally accepted accounting principles, are recorded on the ex-dividend date. Income and capital gain distributions, if any, are declared and paid annually or at other times as deemed necessary by the Manager.
Investment Income. Dividend income is recorded on the ex-dividend date or upon ex-dividend notification in the case of certain foreign dividends where the ex-dividend date may have passed. Non-cash dividends included in dividend income, if any, are recorded at the fair market value of the securities received. Interest income is recognized on an accrual basis. Discount and premium, which are included in interest income on the Statement of Operations, are amortized or accreted daily.
Custodian Fees. “Custodian fees and expenses” in the Statement of Operations may include interest expense incurred by the Fund on any cash overdrafts of its custodian account during the period. Such cash overdrafts may result from the effects of failed trades in portfolio securities and from cash outflows resulting from unanticipated shareholder redemption activity. The Fund pays interest to its custodian on such cash overdrafts, to the extent they are not offset by positive cash balances maintained by the Fund, at a rate equal to the Federal Funds Rate plus 0.50%. The “Reduction to custodian expenses” line item, if applicable, represents earnings on cash balances maintained by the Fund during the period. Such interest expense and other custodian fees may be paid with these earnings.
Security Transactions. Security transactions are recorded on the trade date. Realized gains and losses on securities sold are determined on the basis of identified cost.
Indemnifications. The Fund’s organizational documents provide current and former trustees and officers with a limited indemnification against liabilities arising in connection with the performance of their duties to the Fund. In the normal course of business, the Fund may also enter into contracts that provide general indemnifications. The Fund’s maximum exposure under these arrangements is unknown as this would be dependent on future claims that may be made against the Fund. The risk of material loss from such claims is considered remote.
F27 | OPPENHEIMER HIGH INCOME FUND/VA
NOTES TO FINANCIAL STATEMENTS Continued
1. Significant Accounting Policies Continued
Other. The preparation of financial statements in conformity with accounting principles generally accepted in the United States of America requires management to make estimates and assumptions that affect the reported amounts of assets and liabilities and disclosure of contingent assets and liabilities at the date of the financial statements and the reported amounts of increases and decreases in net assets from operations during the reporting period. Actual results could differ from those estimates.
2. Shares of Beneficial Interest
The Fund has authorized an unlimited number of $0.001 par value shares of beneficial interest of each class. Transactions in shares of beneficial interest were as follows:
| | | | | | | | | | | | | | | | | |
| | | Year Ended December 31, 2008 | | | Year Ended December 31, 20071 | |
| | | Shares | | | Amount | | | Shares | | | Amount | |
| |
Non-Service Shares | | | | | | | | | | | | | | | | |
| Sold | | | 46,686,845 | | | $ | 99,443,229 | | | | 6,787,194 | | | $ | 55,828,051 | |
| Dividends and/or distributions reinvested | | | 2,553,668 | | | | 16,471,157 | | | | 3,059,768 | | | | 24,967,707 | |
| Redeemed | | | (16,133,552 | ) | | | (96,215,152 | ) | | | (15,007,275 | ) | | | (123,225,961 | ) |
| | | |
| Net increase (decrease) | | | 33,106,961 | | | $ | 19,699,234 | | | | (5,160,313 | ) | | $ | (42,430,203 | ) |
| | | |
| | | | | | | | | | | | | | | | | |
Service Shares | | | | | | | | | | | | | | | | |
| Sold | | | 11,108,688 | | | $ | 27,272,759 | | | | 3,742,971 | | | $ | 30,663,500 | |
| Dividends and/or distributions reinvested | | | 1,335,035 | | | | 8,570,925 | | | | 1,457,057 | | | | 11,831,305 | |
| Redeemed | | | (4,887,160 | ) | | | (30,634,091 | ) | | | (5,655,204 | ) | | | (46,330,323 | ) |
| | | |
| Net increase (decrease) | | | 7,556,563 | | | $ | 5,209,593 | | | | (455,176 | ) | | $ | (3,835,518 | ) |
| | | |
| | | | | | | | | | | | | | | | | |
Class 3 Shares | | | | | | | | | | | | | | | | |
| Sold | | | 1,353,807 | | | $ | 7,210,645 | | | | 881,563 | | | $ | 7,225,930 | |
| Dividends and/or distributions reinvested | | | 45,225 | | | | 292,606 | | | | — | | | | — | |
| Redeemed | | | (1,006,838 | ) | | | (5,694,397 | )2 | | | (264,827 | ) | | | (2,134,229 | )3 |
| | | |
| Net increase | | | 392,194 | | | $ | 1,808,854 | | | | 616,736 | | | $ | 5,091,701 | |
| | | |
| | | | | | | | | | | | | | | | | |
Class 4 Shares | | | | | | | | | | | | | | | | |
| Sold | | | 2,743,234 | | | $ | 12,307,065 | | | | 1,978,987 | | | $ | 16,140,299 | |
| Dividends and/or distributions reinvested | | | 94,331 | | | | 611,268 | | | | — | | | | — | |
| Redeemed | | | (1,409,411 | ) | | | (8,058,843 | )2 | | | (790,328 | ) | | | (6,304,642 | )3 |
| | | |
| Net increase | | | 1,428,154 | | | $ | 4,859,490 | | | | 1,188,659 | | | $ | 9,835,657 | |
| | | |
| | |
| 1. | | For the year ended December 31, 2007, for non-service and service shares, and for the period from May 1, 2007 (inception of offering) to December 31, 2007 for Class 3 and Class 4 shares. |
| |
| 2. | | Net of redemption fees of $3,056 and $11,199 for Class 3 and Class 4 shares, respectively. |
| |
| 3. | | Net of redemption fees of $10,660 and $30,654 for Class 3 and Class 4 shares, respectively. |
3. Purchases and Sales of Securities
The aggregate cost of purchases and proceeds from sales of securities, other than short-term obligations and investments in Oppenheimer Institutional Money Market Fund and OFI Liquid Assets Fund, LLC for the year ended December 31, 2008, were as follows:
| | | | | | | | | |
| | | Purchases | | | Sales | |
| |
| Investment securities | | $ | 156,305,813 | | | $ | 346,254,575 | |
| To Be Announced (TBA) mortgage- related securities | | | 40,240,084 | | | | 41,196,921 | |
F28 | OPPENHEIMER HIGH INCOME FUND/VA
4. Fees and Other Transactions with Affiliates
Management Fees. Under the investment advisory agreement, the Fund pays the Manager a management fee based on the daily net assets of the Fund at an annual rate as shown in the following table:
| | | | | |
| Fee Schedule | | | | |
| Up to $200 million | | | 0.75 | % |
| Next $200 million | | | 0.72 | |
| Next $200 million | | | 0.69 | |
| Next $200 million | | | 0.66 | |
| Next $200 million | | | 0.60 | |
| Over $1 billion | | | 0.50 | |
Transfer Agent Fees. OppenheimerFunds Services (“OFS”), a division of the Manager, acts as the transfer and shareholder servicing agent for the Fund. The Fund pays OFS a per account fee. For the year ended December 31, 2008, the Fund paid $26,163 to OFS for services to the Fund.
Additionally, funds offered in variable annuity separate accounts are subject to minimum fees of $10,000 per class, for class level assets of $10 million or more. Each class is subject to the minimum fee in the event that the per account fee does not equal or exceed the applicable minimum fee.
Distribution and Service Plan for Service Shares and Class 4 Shares. The Fund has adopted a Distribution and Service Plan (the “Plan”) in accordance with Rule 12b-1 under the Investment Company Act of 1940 for Service shares and Class 4 shares to pay OppenheimerFunds Distributor, Inc. (the “Distributor”), for distribution related services, personal service and account maintenance for the Fund’s Service shares and Class 4 shares. Under the Plan, payments are made periodically at an annual rate of up to 0.25% of the average annual net assets of Service shares and Class 4 shares of the Fund. The Distributor currently uses all of those fees to compensate sponsor(s) of the insurance product that offers Fund shares, for providing personal service and maintenance of accounts of their variable contract owners that hold Service shares and Class 4 shares. These fees are paid out of the Fund’s assets on an on-going basis and increase operating expenses of the Service shares and Class 4 shares, which results in lower performance compared to the Fund’s shares that are not subject to a service fee. Fees incurred by the Fund under the Plan are detailed in the Statement of Operations.
Waivers and Reimbursements of Expenses. Effective September 1, 2008 through August 31, 2009 (the “waiver period”), the Manager has voluntarily agreed to reduce its advisory fee rate by 0.10% of the Fund’s average daily net assets if the Fund’s trailing one-year total return performance is in the fifth quintile of the Fund’s Lipper peer group and by 0.05% of the Fund’s average daily net assets if the Fund’s trailing one-year total return performance is in the fourth quintile of the Fund’s Lipper peer group as of August 31, 2008. However, if the Fund’s trailing one-year total return performance, as measured at the end of any calendar quarter during the waiver period, improves from the fifth quintile to the fourth quintile, the advisory fee waiver for subsequent quarters during the waiver period will be reduced only by an annualized rate of 0.05% of the Fund’s average daily net assets, and if the Fund’s trailing one-year total return performance at the end of any calendar quarter during the waiver period improves to the third or higher quintile of the Fund’s Lipper peer group, the advisory fee reduction will be terminated effective the following business day. During the year ended December 31, 2008, OFI waived $67,380. The advisory fee reduction is a voluntary undertaking and may be terminated by the Manager at any time.
OFS has voluntarily agreed to limit transfer and shareholder servicing agent fees for all classes to 0.35% of average annual net assets per class. This undertaking may be amended or withdrawn at any time.
The Manager will waive fees and/or reimburse Fund expenses in an amount equal to the indirect management fees incurred through the Fund’s investment in IMMF. During the year ended December 31, 2008, the Manager waived $13,665 for IMMF management fees.
F29 | OPPENHEIMER HIGH INCOME FUND/VA
NOTES TO FINANCIAL STATEMENTS Continued
5. Futures Contracts
A futures contract is a commitment to buy or sell a specific amount of a financial instrument at a negotiated price on a stipulated future date. The Fund may buy and sell futures contracts and may also buy or write put or call options on these futures contracts.
Futures contracts traded on a commodities or futures exchange will be valued at the final settlement price or official closing price on the principal exchange as reported by such principal exchange at its trading session ending at, or most recently prior to, the time when the Fund’s assets are valued.
Upon entering into a futures contract, the Fund is required to deposit either cash or securities (initial margin) in an amount equal to a certain percentage of the contract value. Subsequent payments (variation margin) are made or received by the Fund each day. The variation margin payments are equal to the daily changes in the contract value and are recorded as unrealized gains and losses.
Futures contracts are reported on a schedule following the Statement of Investments. Securities held in collateralized accounts to cover initial margin requirements on open futures contracts are noted in the Statement of Investments. Cash held by the broker to cover initial margin requirements on open futures contracts and the receivable and/or payable for the daily mark to market for the variation margin are noted in the Statement of Assets and Liabilities. The net change in unrealized appreciation and depreciation is reported in the Statement of Operations. Realized gains (losses) are reported in the Statement of Operations at the closing or expiration of futures contracts.
Risks of entering into futures contracts (and related options) include the possibility that there may be an illiquid market where the Fund is unable to liquidate the contract or enter into an offsetting position and, if used for hedging purposes, the risk that the price of the contract will correlate imperfectly with the prices of the Fund’s securities.
As of December 31, 2008, the Fund had no outstanding futures contracts.
6. Swap Contracts
The Fund may enter into privately negotiated agreements with a counterparty to exchange or “swap” payments at specified future intervals based on the return of an asset (such as a stock, bond or currency) or non-asset reference (such as an interest rate or index). The swap agreement will specify the “notional” amount of the asset or non-asset reference to which the contract relates. As derivative contracts, swaps typically do not have an associated cost at contract inception. At initiation, contract terms are typically set at market value such that the value of the swap is $0. If a counterparty specifies terms that would result in the contract having a value other than $0 at initiation, one counter-party will pay the other an upfront payment to equalize the contract. Subsequent changes in market value are calculated based upon changes in the performance of the asset or non-asset reference multiplied by the notional value of the contract. Contract types may include credit default, interest rate, total return, and currency swaps.
Swaps are marked to market daily using quotations primarily from pricing services, counterparties or brokers. Swap contracts are reported on a schedule following the Statement of Investments. The value of the contracts is separately disclosed on the Statement of Assets and Liabilities. The unrealized appreciation (depreciation) is comprised of the change in the valuation of the swap combined with the accrued interest due to (owed by) the Fund at termination or settlement. The net change in this amount during the period is included on the Statement of Operations. Any payment received or paid to initiate a contract is recorded as a cost of the swap in the Statement of Assets and Liabilities and as a component of unrealized gain or loss on the Statement of Operations until contract termination; upon contract termination, this amount is recorded as realized gain or loss on the Statement of Operations. Excluding amounts paid at contract initiation as described above, the Fund also records any periodic payments received from (paid to) the counterparty, including at termination, as realized gain (loss) on the Statement of Operations.
Risks of entering into swap contracts include credit, market and liquidity risk. Credit risk arises from the possibility that the counterparty fails to make a payment when due or otherwise defaults under the terms of the contract. If the
F30 | OPPENHEIMER HIGH INCOME FUND/VA
counterparty defaults, the Fund’s loss will consist of the net amount of contractual payments that the Fund has not yet received. Market risk is the risk that the value of the contract will depreciate due to unfavorable changes in the performance of the asset or non-asset reference. Liquidity risk is the risk that the Fund may be unable to close the contract prior to its termination.
Credit Default Swap Contracts. A credit default swap is a bilateral contract that enables an investor to buy or sell protection on a debt security against a defined-issuer credit event, such as the issuer’s failure to make timely payments of interest or principal on the debt security, bankruptcy or restructuring. The Fund may enter into credit default swaps either by buying or selling protection on a single security or a basket of securities (the “reference asset”).
The buyer of protection pays a periodic fee to the seller of protection based on the notional amount of debt securities underlying the swap contract. The seller of protection agrees to compensate the buyer of protection for future potential losses as a result of a credit event on the reference asset. The contract effectively transfers the credit event risk of the reference asset from the buyer of protection to the seller of protection.
The ongoing value of the contract will fluctuate throughout the term of the contract based primarily on the credit risk of the reference asset. If the credit quality of the reference asset improves relative to the credit quality at contract initiation, the buyer of protection may have an unrealized loss greater than the anticipated periodic fee owed. This unrealized loss would be the result of current credit protection being cheaper than the cost of credit protection at contract initiation. If the buyer elects to terminate the contract prior to its maturity, and there has been no credit event, this unrealized loss will become realized. If the contract is held to maturity, and there has been no credit event, the realized loss will be equal to the periodic fee paid over the life of the contract.
If there is a credit event, the buyer of protection can exercise its rights under the contract and receive a payment from the seller of protection equal to the notional amount of the reference asset less the market value of the reference asset. Upon exercise of the contract the difference between the value of the underlying reference asset and the notional amount is recorded as realized gain (loss) and is included on the Statement of Operations.
Risks of credit default swaps include credit, market and liquidity risk. Additional risks include but are not limited to: the cost of paying for credit protection if there are no credit events or the cost of selling protection when a credit event occurs (paying the notional amount to the protection buyer); and pricing transparency when assessing the value of a credit default swap.
As of the period end, the Fund has sold credit protection through credit default swaps to gain exposure to the credit risk of individual securities and/or indexes that are either unavailable or considered to be less attractively priced in the bond market. The Fund has also engaged in pairs trades by purchasing protection through a credit default swap referenced to the debt of an issuer, and simultaneously selling protection through a credit default swap referenced to the debt of a different issuer with the intent to realize gains from the pricing differences of the two issuers who are expected to have similar market risks. Pairs trades attempt to gain exposure to credit risk while hedging or offsetting the effects of overall market movements. In addition, the Fund has engaged in spread curve trades by simultaneously purchasing and selling protection through credit default swaps referenced to the same issuer but with different maturities. Spread curve trades attempt to gain exposure to credit risk on a forward basis by realizing gains on the expected differences in spreads.
Interest Rate Swap Contracts. An interest rate swap is an agreement between counterparties to exchange periodic payments based on interest rates. One cash flow stream will typically be a floating rate payment based upon a specified interest rate while the other is typically a fixed interest rate.
Risks of interest rate swaps include credit, market and liquidity risk. Additional risks include but are not limited to, interest rate risk. There is a risk, based on future movements of interest rates that the payments made by the Fund under a swap agreement will be greater than the payments it received.
F31 | OPPENHEIMER HIGH INCOME FUND/VA
NOTES TO FINANCIAL STATEMENTS Continued
6. Swap Contracts Continued
Total Return Swap Contracts. A total return swap is an agreement between counterparties to exchange periodic payments based on asset or non-asset references. One cash flow is typically based on a non-asset reference (such as an interest rate or index) and the other on the total return of a reference asset (such as a security or a basket of securities). The total return of the reference asset typically includes appreciation or depreciation on the reference asset, plus any interest or dividend payments.
Risks of total return swaps include credit, market and liquidity risk.
7. Illiquid Securities
As of December 31, 2008, investments in securities included issues that are illiquid. Investments may be illiquid because they do not have an active trading market, making it difficult to value them or dispose of them promptly at an acceptable price. The Fund will not invest more than 15% of its net assets (determined at the time of purchase and reviewed periodically) in illiquid securities. Securities that are illiquid are marked with an applicable footnote on the Statement of Investments.
8. Recent Accounting Pronouncement
In March 2008, the Financial Accounting Standards Board (“FASB”) issued Statement on Financial Accounting Standards (“SFAS”) No. 161, Disclosures about Derivative Instruments and Hedging Activities. This standard requires enhanced disclosures about derivative and hedging activities, including qualitative disclosures about how and why the Fund uses derivative instruments, how these activities are accounted for, and their effect on the Fund’s financial position, financial performance and cash flows. SFAS No. 161 is effective for financial statements issued for fiscal years and interim periods beginning after November 15, 2008. At this time, management is evaluating the implications of SFAS No. 161 and its impact on the Fund’s financial statements and related disclosures.
9. Change In Independent Registered Public Accounting Firm (Unaudited)
At a meeting held on August 20, 2008, the Board of Trustees of the Fund appointed KPMG LLP as the independent registered public accounting firm to the Fund for fiscal year 2009, replacing the firm of Deloitte & Touche LLP, effective at the conclusion of the fiscal 2008 audit. During the two most recent fiscal years the audit reports of Deloitte & Touche LLP contained no adverse opinion or disclaimer of opinion and were not qualified or modified as to uncertainty, audit scope or accounting principles. Further, there were no disagreements between the Fund and Deloitte & Touche LLP on accounting principles, financial statement disclosure or audit scope, which if not resolved to the satisfaction of Deloitte & Touche LLP would have caused it to make reference to the disagreements in connection with its reports.
F32 | OPPENHEIMER HIGH INCOME FUND/VA
REPORT OF INDEPENDENT REGISTERED PUBLIC ACCOUNTING FIRM
To the Board of Trustees and Shareholders of Oppenheimer High Income Fund/VA:
We have audited the accompanying statement of assets and liabilities of Oppenheimer High Income Fund/VA (the “Fund”), a series of Oppenheimer Variable Account Funds, including the statement of investments, as of December 31, 2008, and the related statement of operations for the year then ended, the statements of changes in net assets for each of the two years in the period then ended, and the financial highlights for each of the five years in the period then ended. These financial statements and financial highlights are the responsibility of the Fund’s management. Our responsibility is to express an opinion on these financial statements and financial highlights based on our audits.
We conducted our audits in accordance with the standards of the Public Company Accounting Oversight Board (United States). Those standards require that we plan and perform the audit to obtain reasonable assurance about whether the financial statements and financial highlights are free of material misstatement. The Fund is not required to have, nor were we engaged to perform, an audit of its internal control over financial reporting. Our audits included consideration of internal control over financial reporting as a basis for designing audit procedures that are appropriate in the circumstances, but not for the purpose of expressing an opinion on the effectiveness of the Fund’s internal control over financial reporting. Accordingly, we express no such opinion. An audit also includes examining, on a test basis, evidence supporting the amounts and disclosures in the financial statements, assessing the accounting principles used and significant estimates made by management, as well as evaluating the overall financial statement presentation. Our procedures included confirmation of securities owned as of December 31, 2008, by correspondence with the custodian and brokers; where replies were not received from brokers, we performed other auditing procedures. We believe that our audits provide a reasonable basis for our opinion.
In our opinion, the financial statements and financial highlights referred to above present fairly, in all material respects, the financial position of the Fund as of December 31, 2008, the results of its operations for the year then ended, the changes in its net assets for each of the two years in the period then ended, and the financial highlights for each of the five years in the period then ended, in conformity with accounting principles generally accepted in the United States of America.
Deloitte & Touche LLP
Denver, Colorado
February 11, 2009
F33 | OPPENHEIMER HIGH INCOME FUND/VA
THIS PAGE INTENTIONALLY LEFT BLANK.
F34 | OPPENHEIMER HIGH INCOME FUND/VA
FEDERAL INCOME TAX INFORMATION Unaudited
In early 2009, if applicable, shareholders of record received information regarding all dividends and distributions paid to them by the Fund during calendar year 2008. Regulations of the U.S. Treasury Department require the Fund to report this information to the Internal Revenue Service.
The foregoing information is presented to assist shareholders in reporting distributions received from the Fund to the Internal Revenue Service. Because of the complexity of the federal regulations which may affect your individual tax return and the many variations in state and local tax regulations, we recommend that you consult your tax advisor for specific guidance.
9 | OPPENHEIMER HIGH INCOME FUND/VA
BOARD APPROVAL OF THE FUND’S INVESTMENT ADVISORY AGREEMENT Unaudited
Each year, the Board of Trustees (the “Board”), including a majority of the independent Trustees, is required to determine whether to renew the Fund’s investment advisory agreement (the “Agreement”). The Investment Company Act of 1940, as amended, requires that the Board request and evaluate, and that the Manager provide, such information as may be reasonably necessary to evaluate the terms of the Agreement. The Board employs an independent consultant to prepare a report that provides information, including comparative information, the Board requests for that purpose. In addition, the Board receives information throughout the year regarding Fund services, fees, expenses and performance.
The Manager and the independent consultant provided information to the Board on the following factors: (i) the nature, quality and extent of the Manager’s services, (ii) the investment performance of the Fund and the Manager, (iii) the fees and expenses of the Fund, including comparative expense information, (iv) the profitability of the Manager and its affiliates, including an analysis of the cost of providing services, (v) whether economies of scale are realized as the Fund grows and whether fee levels reflect these economies of scale for Fund investors and (vi) other benefits to the Manager from its relationship with the Fund. The Board was aware that there are alternatives to retaining the Manager.
Outlined below is a summary of the principal information considered by the Board as well as the Board’s conclusions.
Nature, Quality and Extent of Services. The Board considered information about the nature, quality and extent of the services provided to the Fund and information regarding the Manager’s key personnel who provide such services. The Manager’s duties include providing the Fund with the services of the portfolio managers and the Manager’s investment team, who provide research, analysis and other advisory services in regard to the Fund’s investments; securities trading services; oversight of third party service providers; monitoring compliance with applicable Fund policies and procedures and adherence to the Fund’s investment restrictions. The Manager is responsible for providing certain administrative services to the Fund as well. Those services include providing and supervising all administrative and clerical personnel who are necessary in order to provide effective corporate administration for the Fund; compiling and maintaining records with respect to the Fund’s operations; preparing and filing reports required by the Securities and Exchange Commission; preparing periodic reports regarding the operations of the Fund for its shareholders; preparing proxy materials for shareholder meetings; and preparing the registration statements required by Federal and state securities laws for the sale of the Fund’s shares. The Manager also provides the Fund with office space, facilities and equipment.
The Board also considered the quality of the services provided and the quality of the Manager’s resources that are available to the Fund. The Board took account of the fact that the Manager has had over forty years of experience as an investment adviser and that its assets under management rank it among the top mutual fund managers in the United States. The Board evaluated the Manager’s advisory, administrative, accounting, legal and compliance services, and information the Board has received regarding the experience and professional qualifications of the Manager’s key personnel and the size and functions of its staff. In its evaluation of the quality of the portfolio management services provided, the Board considered the experience of Angelo Manioudakis, Antulio Bomfim, Geoffrey Caan, Benjamin Gord and Thomas Swaney, the portfolio managers for the Fund, and the Manager’s investment team and analysts. The Board members also considered the totality of their experiences with the Manager as Directors or Trustees of the Fund and other funds advised by the Manager. The Board considered information regarding the quality of services provided by affiliates of the Manager, which its members have become knowledgeable about in connection with the renewal of the Fund’s service agreements. The Board concluded that, in light of the Manager’s experience, reputation, personnel, operations and resources, the Fund benefits from the services provided under the Agreement.
10 | OPPENHEIMER HIGH INCOME FUND/VA
Investment Performance of the Manager and the Fund. Throughout the year, the Manager provided information on the investment performance of the Fund and the Manager, including comparative performance information. The Board also reviewed information, prepared by the Manager and by the independent consultant, comparing the Fund’s historical performance to relevant market indices and to the performance of other high current yield funds underlying variable insurance products. The Board considered that the Fund underperformed its performance universe median during the one-, three-, five-, and ten-year periods. The Board considered that the Fund’s underperformance in 2007 reflected a combination of a severe downturn and lack of liquidity in the fixed income markets as well as the under-performance of certain types of securities in the Fund’s portfolio. The Board also considered that the Fund’s performance improved in more recent periods, and the Fund was ranked #1 overall by Lipper for the month of April 2008. The Board also considered that a new management team had been put in place in 2006 and that year-to-date through May 31, 2008, the Fund was in the third quintile.
Costs of Services by the Manager. The Board reviewed the fees paid to the Manager and the other expenses borne by the Fund. The Board also considered the comparability of the fees charged and the services provided to the Fund to the fees and services for other clients or accounts advised by the Manager. The independent consultant provided comparative data in regard to the fees and expenses of the Fund and high current yield funds underlying variable insurance products with comparable asset levels and distribution features. The Board considered that the Fund’s actual management fees and total expenses were higher than its expense group median. The Board also considered that, effective September 1, 2008, the Manager voluntarily undertook to waive .10% of its management fee if the Fund’s trailing one-year total return performance is in the fifth quintile of the Fund’s Lipper peer group and by .05% of its management fee if the Fund’s trailing one-year total return performance is in the fourth quintile of the Fund’s Lipper peer group. However, if the Fund’s trailing one-year total return performance, as measured at the end of any calendar quarter, improves to the third or higher quintile of the Fund’s Lipper peer group, the advisory fee reduction will be terminated. In reviewing the fees and expenses charged to the VA Funds, the Board considered the Manager’s assertion that, because of the disparity among VA funds in how insurance companies may be compensated for the services they provide to shareholders, when comparing the expenses of the various VA funds it is most appropriate to focus on the total expenses rather than on the management fees. Accordingly, while the Board reviewed and considered all expenses in its consideration of the Advisory Agreement, it paid particular attention to total expenses.
Economies of Scale and Profits Realized by the Manager. The Board considered information regarding the Manager’s costs in serving as the Fund’s investment adviser, including the costs associated with the personnel and systems necessary to manage the Fund, and information regarding the Manager’s profitability from its relationship with the Fund. The Board reviewed whether the Manager may realize economies of scale in managing and supporting the Fund. The Board noted that the Fund currently has management fee breakpoints, which are intended to share with Fund shareholders economies of scale that may exist as the Fund’s assets grow.
Other Benefits to the Manager. In addition to considering the profits realized by the Manager, the Board considered information that was provided regarding the direct and indirect benefits the Manager receives as a result of its relationship with the Fund, including compensation paid to the Manager’s affiliates. The Board also considered that the Manager must be able to pay and retain experienced professional personnel at competitive rates to provide quality services to the Fund and that maintaining the financial viability of the Manager is important in order for the Manager to continue to provide significant services to the Fund and its shareholders.
11 | OPPENHEIMER HIGH INCOME FUND/VA
BOARD APPROVAL OF THE FUND’S INVESTMENT ADVISORY AGREEMENT Unaudited / Continued
Conclusions. These factors were also considered by the independent Trustees meeting separately from the full Board, assisted by experienced counsel to the Fund and to the independent Trustees. Fund counsel and the independent Trustees’ counsel are independent of the Manager within the meaning and intent of the Securities and Exchange Commission Rules.
Based on its review of the information it received and its evaluations described above, the Board, including a majority of the independent Trustees, decided to continue the Agreement for another year. In arriving at this decision, the Board did not single out any factor or factors as being more important than others, but considered all of the above information, and considered the terms and conditions of the Agreement, including the management fee, in light of all of the surrounding circumstances.
12 | OPPENHEIMER HIGH INCOME FUND/VA
PORTFOLIO PROXY VOTING POLICIES AND PROCEDURES; UPDATES TO STATEMENTS OF INVESTMENTS Unaudited
The Fund has adopted Portfolio Proxy Voting Policies and Procedures under which the Fund votes proxies relating to securities (“portfolio proxies”) held by the Fund. A description of the Fund’s Portfolio Proxy Voting Policies and Procedures is available (i) without charge, upon request, by calling the Fund toll-free at 1.800.525.7048, (ii) on the Fund’s website at www.oppenheimerfunds.com, and (iii) on the SEC’s website at www.sec.gov. In addition, the Fund is required to file Form N-PX, with its complete proxy voting record for the 12 months ended June 30th, no later than August 31st of each year. The Fund’s voting record is available (i) without charge, upon request, by calling the Fund toll-free at 1.800.525.7048, and (ii) in the Form N-PX filing on the SEC’s website at www.sec.gov.
The Fund files its complete schedule of portfolio holdings with the SEC for the first quarter and the third quarter of each fiscal year on Form N-Q. The Fund’s Form N-Q filings are available on the SEC’s website at http://www.sec.gov. Those forms may be reviewed and copied at the SEC’s Public Reference Room in Washington, D.C. Information on the operation of the Public Reference Room may be obtained by calling 1-800-SEC-0330.
13 | OPPENHEIMER HIGH INCOME FUND/VA
TRUSTEES AND OFFICERS Unaudited
| | | |
Name, Position(s) Held with
the Funds, Length of Service,
Age | | Principal Occupation(s) During the Past 5 Years; Other Trusteeships/Directorships Held; Number of Portfolios in the Funds Complex Currently Overseen |
| | | |
INDEPENDENT
TRUSTEES | | The address of each Trustee in the chart below is 6803 S. Tucson Way, Centennial, Colorado 80112-3924. Each Trustee serves for an indefinite term, or until his or her resignation, retirement, death or removal. |
| | | |
William L. Armstrong,
Chairman of the Board of
Trustees (since 2003),
Trustee (since 1999)
Age: 71 | | President, Colorado Christian University (since 2006); Chairman, Cherry Creek Mortgage Company (since 1991), Chairman, Centennial State Mortgage Company (since 1994), Chairman, The El Paso Mortgage Company (since 1993); Chairman, Ambassador Media Corporation (since 1984); Chairman, Broadway Ventures (since 1984); Director of Helmerich & Payne, Inc. (oil and gas drilling/production company) (since 1992), Campus Crusade for Christ (non-profit) (since 1991); Former Director, The Lynde and Harry Bradley Foundation, Inc. (non-profit organization) (2002-2006); former Chairman of: Transland Financial Services, Inc. (private mortgage banking company) (1997-2003), Great Frontier Insurance (1995-2000), Frontier Real Estate, Inc. (residential real estate brokerage) (1994-2000) and Frontier Title (title insurance agency) (1995-2000); former Director of the following: UNUMProvident (insurance company) (1991-2004), Storage Technology Corporation (computer equipment company) (1991-2003) and International Family Entertainment (television channel) (1992-1997); U.S. Senator (January 1979-January 1991). Oversees 41 portfolios in the OppenheimerFunds complex. |
| | | |
George C. Bowen,
Trustee (since 1999)
Age: 72 | | Assistant Secretary and Director of Centennial Asset Management Corporation (December 1991-April 1999); President, Treasurer and Director of Centennial Capital Corporation (June 1989-April 1999); Chief Executive Officer and Director of MultiSource Services, Inc. (March 1996-April 1999); Mr. Bowen held several positions with the Manager and with subsidiary or affiliated companies of the Manager (September 1987-April 1999). Oversees 41 portfolios in the OppenheimerFunds complex. |
| | | |
Edward L. Cameron,
Trustee (since 1999)
Age: 70 | | Member of The Life Guard of Mount Vernon (George Washington historical site) (June 2000-June 2006); Partner of PricewaterhouseCoopers LLP (accounting firm) (July 1974-June 1999); Chairman of Price Waterhouse LLP Global Investment Management Industry Services Group (accounting firm) (July 1994-June 1998). Oversees 41 portfolios in the OppenheimerFunds complex. |
| | | |
Jon S. Fossel,
Trustee (since 1990)
Age: 66 | | Director of UNUMProvident (insurance company) (since June 2002); Director of Northwestern Energy Corp. (public utility corporation) (since November 2004); Director of P.R. Pharmaceuticals (October 1999-October 2003); Director of Rocky Mountain Elk Foundation (non-profit organization) (February 1998-February 2003 and February 2005-February 2007); Chairman and Director (until October 1996) and President and Chief Executive Officer (until October 1995) of the Manager; President, Chief Executive Officer and Director of the following: Oppenheimer Acquisition Corp. (“OAC”) (parent holding company of the Manager), Shareholders Services, Inc. and Shareholder Financial Services, Inc. (until October 1995). Oversees 41 portfolios in the OppenheimerFunds complex. |
| | | |
Sam Freedman,
Trustee (since 1996)
Age: 68 | | Director of Colorado UpLIFT (charitable organization) (since September 1984). Mr. Freedman held several posi- tions with the Manager and with subsidiary or affiliated companies of the Manager (until October 1994). Oversees 41 portfolios in the OppenheimerFunds complex. |
| | | |
Beverly L. Hamilton,
Trustee (since 2002)
Age: 62 | | Trustee of Monterey Institute for International Studies (educational organization) (since February 2000); Board Member of Middlebury College (educational organization) (since December 2005); Director of The California Endowment (philanthropic organization) (since April 2002); Director (February 2002-2005) and Chairman of Trustees (2006-2007) of the Community Hospital of Monterey Peninsula; Director (October 1991-2005) and Vice Chairman (since 2006) of American Funds’ Emerging Markets Growth Fund, Inc. (mutual fund); President of ARCO Investment Management Company (February 1991-April 2000); Member of the investment commit- tees of The Rockefeller Foundation (2001-2006) and The University of Michigan (since 2000); Advisor at Credit Suisse First Boston’s Sprout venture capital unit (venture capital fund) (1994-January 2005); Trustee of MassMutual Institutional Funds (investment company) (1996-June 2004); Trustee of MML Series Investment Fund (investment company) (April 1989-June 2004); Member of the investment committee of Hartford Hospital (2000-2003); and Advisor to Unilever (Holland) pension fund (2000-2003). Oversees 41 portfolios in the OppenheimerFunds complex. |
14 | OPPENHEIMER HIGH INCOME FUND/VA
| | | |
| | | |
Robert J. Malone,
Trustee (since 2002)
Age: 64 | | Board of Directors of Opera Colorado Foundation (non-profit organization) (since March 2008); Director of Jones Knowledge, Inc. (since 2006); Director of Jones International University (educational organization) (since August 2005); Chairman, Chief Executive Officer and Director of Steele Street Bank & Trust (commercial banking) (since August 2003); Director of Colorado UpLIFT (charitable organization) (since 1986); Trustee of the Gallagher Family Foundation (non-profit organization) (since 2000); Former Chairman of U.S. Bank-Colorado (subsidiary of U.S. Bancorp and formerly Colorado National Bank) (July 1996-April 1999); Director of Commercial Assets, Inc. (real estate investment trust) (1993-2000); Director of Jones Knowledge, Inc. (2001-July 2004); and Director of U.S. Exploration, Inc. (oil and gas exploration) (1997-February 2004). Oversees 41 portfolios in the OppenheimerFunds complex. |
| | | |
F. William Marshall, Jr.,
Trustee (since 2000)
Age: 66 | | Trustee Emeritas of Worcester Polytech Institute (WPI) (private university) (since 2009); Trustee of MassMutual Select Funds (formerly MassMutual Institutional Funds) (investment company) (since 1996) and MML Series Investment Fund (investment company) (since 1996); President and Treasurer of the SIS Funds (private charitable fund) (since January 1999); Former Trustee of WPI (1985-2008); Former Chairman of the Board (2004-2006) and Former Chairman of the Investment Committee of WPI (1994-2008); Chairman of SIS & Family Bank, F.S.B. (formerly SIS Bank) (commercial bank) (January 1999-July 1999); Executive Vice President of Peoples Heritage Financial Group, Inc. (commercial bank) (January 1999-July 1999); and Former President and Chief Executive Officer of SIS Bancorp. (1993-1999). Oversees 43 portfolios in the OppenheimerFunds complex. |
| | | |
INTERESTED TRUSTEE
AND OFFICER | | The address of Mr. Murphy is Two World Financial Center, 225 Liberty Street, 11th Floor, New York, New York 10281- 1008. Mr. Murphy serves as a Trustee for an indefinite term, or until his resignation, retirement, death or removal and as an Officer for an indefinite term, or until his resignation, retirement, death or removal. Mr. Murphy is an interested Trustee due to his positions with OppenheimerFunds, Inc. and its affiliates. |
| | | |
John V. Murphy,
Trustee, President and
Principal Executive Officer
(since 2001)
Age: 59 | | Chairman and Director of the Manager (since June 2001); Chief Executive Officer of the Manager (June 2001- December 2008); President of the Manager (September 2000-February 2007); President and director or trustee of other Oppenheimer funds; President and Director of Oppenheimer Acquisition Corp. (“OAC”) (the Manager’s parent holding company) and of Oppenheimer Partnership Holdings, Inc. (holding company subsidiary of the Manager) (since July 2001); Director of OppenheimerFunds Distributor, Inc. (subsidiary of the Manager) (November 2001-December 2006); Chairman and Director of Shareholder Services, Inc. and of Shareholder Financial Services, Inc. (transfer agent subsidiaries of the Manager) (since July 2001); President and Director of OppenheimerFunds Legacy Program (charitable trust program established by the Manager) (since July 2001); Director of the following investment advisory subsidiaries of the Manager: OFI Institutional Asset Management, Inc., Centennial Asset Management Corporation, Trinity Investment Management Corporation and Tremont Capital Management, Inc. (since November 2001), HarbourView Asset Management Corporation and OFI Private Investments, Inc. (since July 2001); President (since November 2001) and Director (since July 2001) of Oppenheimer Real Asset Management, Inc.; Executive Vice President of Massachusetts Mutual Life Insurance Company (OAC’s parent company) (since February 1997); Director of DLB Acquisition Corporation (holding company parent of Babson Capital Management LLC) (since June 1995); Chairman (since October 2007) and Member of the Investment Company Institute’s Board of Governors (since October 2003). Oversees 105 portfolios in the OppenheimerFunds complex. |
| | | |
OTHER OFFICERS OF
THE FUND | | The addresses of the Officers in the chart below are as follows: for Mr. Zack, Two World Financial Center, 225 Liberty Street, New York, New York 10281-1008, for Messrs. Vandehey and Wixted, 6803 S. Tucson Way, Centennial, Colorado 80112-3924; for Messrs. Bomfim, Caan, Gord and Swaney, 470 Atlantic Avenue, 11th Floor, Boston, Massachusetts 02210. Each Officer serves for an indefinite term or until his or her resignation, retirement, death or removal. |
| | | |
Antulio N. Bomfim,
Vice President and Portfolio
Manager (since 2006)
Age: 41 | | Vice President of the Manager (since October 2003); Senior Economist at the Board of Governors of the Federal Reserve System (June 1992-October 2003). A portfolio manager and officer of 11 portfolios in the OppenheimerFunds complex. |
| | | |
Geoffrey Caan,
Vice President and Portfolio
Manager (since 2006)
Age: 39 | | Vice President of the Manager (since August 2003); Vice President of ABN AMRO NA, Inc. (June 2002-August 2003); Vice President of Zurich Scudder Investments (January 1999-June 2002). A portfolio manager and officer of 11 portfolios in the OppenheimerFunds complex. |
15 | OPPENHEIMER HIGH INCOME FUND/VA
TRUSTEES AND OFFICERS Unaudited / Continued
| | | |
| | | |
Benjamin J. Gord,
Vice President and Portfolio
Manager (since 2006)
Age: 46 | | Vice President of the Manager (since April 2002) of HarbourView Asset Management Corporation (since April 2002) and of OFI Institutional Asset Management, Inc. (as of June 2002); Executive Director and senior fixed income analyst at Miller Anderson & Sherrerd, a division of Morgan Stanley Investment Management (April 1992-March 2002). A portfolio manager and officer of 11 portfolios in the OppenheimerFunds complex. |
| | | |
Thomas Swaney,
Vice President and Portfolio
Manager (since 2006)
Age: 36 | | Vice President of the Manager (since April 2006); senior analyst, high grade investment team (June 2002- March 2006); senior fixed income analyst at Miller Anderson & Sherrerd, a division of Morgan Stanley Investment Management (May 1998-May 2002). A portfolio manager and officer of 11 portfolios in the OppenheimerFunds complex. |
| | | |
Mark S. Vandehey,
Vice President and Chief
Compliance Officer
(since 2004)
Age: 58 | | Senior Vice President and Chief Compliance Officer of the Manager (since March 2004); Chief Compliance Officer of OppenheimerFunds Distributor, Inc., Centennial Asset Management and Shareholder Services, Inc. (since March 2004); Vice President of OppenheimerFunds Distributor, Inc., Centennial Asset Management Corporation and Shareholder Services, Inc. (since June 1983); Former Vice President and Director of Internal Audit of the Manager (1997-February 2004). An officer of 105 portfolios in the OppenheimerFunds complex. |
| | | |
Brian W. Wixted,
Treasurer and Principal
Financial & Accounting
Officer (since 1999)
Age: 49 | | Senior Vice President and Treasurer of the Manager (since March 1999); Treasurer of the following: HarbourView Asset Management Corporation, Shareholder Financial Services, Inc., Shareholder Services, Inc., Oppenheimer Real Asset Management, Inc. and Oppenheimer Partnership Holdings, Inc. (since March 1999), OFI Private Investments, Inc. (since March 2000), OppenheimerFunds International Ltd. and OppenheimerFunds plc (since May 2000), OFI Institutional Asset Management, Inc. (since November 2000), and OppenheimerFunds Legacy Program (charitable trust program established by the Manager) (since June 2003); Treasurer and Chief Financial Officer of OFI Trust Company (trust company subsidiary of the Manager) (since May 2000); Assistant Treasurer of the following: |
| | | OAC (since March 1999), Centennial Asset Management Corporation (March 1999- October 2003) and OppenheimerFunds Legacy Program (April 2000-June 2003). An officer of 105 portfolios in the OppenheimerFunds complex. |
| | | |
Robert G. Zack,
Vice President and Secretary
(since 2001)
Age: 60 | | Executive Vice President (since January 2004) and General Counsel (since March 2002) of the Manager; General Counsel and Director of the Distributor (since December 2001); General Counsel of Centennial Asset Management Corporation (since December 2001); Senior Vice President and General Counsel of HarbourView Asset Management Corporation (since December 2001); Secretary and General Counsel of OAC (since November 2001); Assistant Secretary (since September 1997) and Director (since November 2001) of OppenheimerFunds International Ltd. and OppenheimerFunds plc; Vice President and Director of Oppenheimer Partnership Holdings, Inc. (since December 2002); Director of Oppenheimer Real Asset Management, Inc. (since November 2001); Senior Vice President, General Counsel and Director of Shareholder Financial Services, Inc. and Shareholder Services, Inc. (since December 2001); Senior Vice President, General Counsel and Director of OFI Private Investments, Inc. and OFI Trust Company (since November 2001); Vice President of OppenheimerFunds Legacy Program (since June 2003); Senior Vice President and General Counsel of OFI Institutional Asset Management, Inc. (since November 2001); Director of OppenheimerFunds International Distributor Limited (since December 2003); Senior Vice President (May 1985-December 2003). An officer of 105 portfolios in the OppenheimerFunds complex. |
The Fund’s Statement of Additional Information contains additional information about the Fund’s Trustees and Officers and is available without charge, upon request, by calling 1.800.981.2871.
16 | OPPENHEIMER HIGH INCOME FUND/VA
| December 31, 2008 Oppenheimer Management Main Street Fund®/VA Commentaries and A Series of Oppenheimer Variable Account Funds Annual Report M A N A G E M E N T C O M M E N T A R I E S Listing of Top Holdings A N N U A L R E P O RT Fund Performance Discussion Listing of Investments Financial Statements 1234 |
FUND PERFORMANCE DISCUSSION
Management’s Discussion of Fund Performance. For the 12-month period ended December 31, 2008, Oppenheimer Main Street Fund/VA’s Non-Service shares produced a total return of –38.47% while the S&P 500 Index returned –36.99%. We attribute the Fund’s underperformance primarily to its overweight exposure to mid-cap stocks, which were hurt by broad-based market weakness in the second half of the year, as a worsening recession and an intensifying financial crisis took their toll.
Economic and Market Overview. Like most asset classes, U.S. stocks declined sharply when a credit crunch that began in 2007 developed into a full-blown global financial crisis over the summer of 2008. Turmoil spread from the sub-prime mortgage sector of the U.S. bond market to other financial markets, including stocks, as investors became increasingly risk-averse. Declining asset prices compelled major financial institutions to write down or write off a significant portion of their value, creating losses that led to the insolvency of several major commercial banks, investment banks, mortgage agencies and insurers.
After Lehman Brothers declared bankruptcy in September 2008, banks and other lenders grew vastly more reluctant to extend credit, nearly leading to the collapse of the global banking system and reducing the availability of credit for businesses and consumers. Governments and central banks responded to the crisis with massive injections of liquidity, lower short-term interest rates and rescue packages for troubled industries. While these measures helped stabilize the crisis, credit markets remained fragile through the end of the year and business conditions continued to deteriorate.
Meanwhile, a U.S. economic slowdown that began in late 2007 was exacerbated by the financial crisis, leading to a surge in job losses and additional pressure on slumping home prices. Cash-strapped consumers and anxious businesses curtailed spending, adding fuel to the downturn. The U.S. recession quickly spread to overseas markets, reducing previously robust demand for energy and building materials. Consequently, commodity prices that had reached record highs over the first half of the year plummeted over the second half.
Many investors worried about these developments engaged in a “flight to safety,” selling riskier assets, such as stocks, in favor of U.S. Treasury securities. Selling pressure appeared to be indiscriminate as investors rushed for the exits, punishing stocks of fundamentally sound companies along with less healthy ones. Although the financial institutions at the epicenter of the crisis were mainly very large companies, the flight to quality was particularly damaging for medium-size businesses, which historically have been more volatile than their larger counterparts. Not surprisingly, the bear market was especially severe for traditionally economically-sensitive sectors, such as industrials and information technology, while areas whose fortunes rise and fall with commodity prices, such as energy and basic materials producers, also were hard hit. Conversely, the historically defensive consumer staples and health care sectors held up relatively well.
Fund Strategy. We invested the Fund’s assets in accordance with the signals generated by our multifactor quantitative models, including a newly developed model designed to consider unusually volatile market conditions. Beginning in the spring of 2008, our market-capitalization models began to suggest that mid-cap stocks were more likely to advance than mega-cap stocks. Therefore, we gradually began to reduce the Fund’s average market capitalization toward the smaller end of the spectrum. This shift helped support the Fund’s relative performance in the second quarter of the year, but detracted in the third and fourth quarters as the financial crisis intensified. A rally over the final weeks of the year was especially pronounced among mid-cap stocks, helping to offset a portion of the previous decline.
Our security selection models produced mixed results in 2008. Not surprisingly, the financials sector ranked as the S&P 500 Index’s worst performing area due to the effects of the financial crisis on major financial institutions. Our models assigned relatively low rankings to large financial institutions, resulting in underweight exposure that helped cushion the Fund’s losses in the sector. By summer, the Fund held few of the major securities at the epicenter of the financial crisis, and we mitigated losses by selling our position in firms such as Lehman Brothers before it declared bankruptcy in September 2008. Instead, we emphasized smaller companies, such as property-and-casualty insurers, which held up relatively well.
Strong results compared to the benchmark in the financials sector were more than offset by shortfalls in other areas. An overweight position in the consumer discretionary sector and an emphasis on smaller stocks detracted from relative performance. Underweight exposure to the traditionally defensive health care sector also hampered results, as did a focus on managed care companies. What we believe to be generally sound stock selections in the consumer staples area could not make up for underweight exposure to what was the benchmark’s top performing sector.
As of year-end, our models have continued to indicate that smaller-capitalization stocks generally are better positioned than very large ones in the current market environment. However, to remain consistent with the Fund’s large-cap mandate, we are unlikely to further reduce the Fund’s average market capitalization. Our models recently have assigned higher rankings to stocks in the information technology, energy, industrials, materials and consumer discretionary sectors, suggesting to us that low expectations for these economically sensitive sectors in 2009 are already reflected in their stock prices.
3 | OPPENHEIMER MAIN STREET FUND/VA
FUND PERFORMANCE DISCUSSION
Conversely, our models have found relatively few opportunities in the consumer staples, health care, financials and utilities sectors. Finally, as always, the Fund has remained fully invested and broadly diversified.
Comparing the Fund’s Performance to the Market. The graphs that follow show the performance of a hypothetical $10,000 investment in each share class of the Fund held until December 31, 2008. In the case of Non-Service shares, performance is measured over a ten fiscal-year period. In the case of Service shares, performance is measured from inception of the Class on July 13, 2000. Performance information does not reflect charges that apply to separate accounts investing in the Fund. If these charges were taken into account, performance would be lower. The graphs assume that all dividends and capital gains distributions were reinvested in additional shares. Past performance cannot guarantee future results.
The Fund’s performance is compared to the performance of the S&P 500 Index, an unmanaged index of U.S. securities. The index performance includes reinvestment of income but does not reflect transaction costs, fees or expenses. The Fund’s performance reflects the effects of the Fund’s business and operating expenses. While index comparisons may be useful to provide a benchmark for the Fund’s performance, it must be noted that the Fund’s investments are not limited to the investments in the index.
4 | OPPENHEIMER MAIN STREET FUND/VA
Non-Service Shares
Comparison of Change in Value of $10,000 Hypothetical Investments in: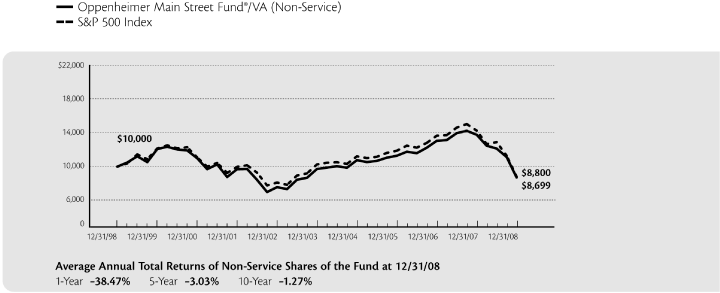
Service Shares
Comparison of Change in Value of $10,000 Hypothetical Investments in: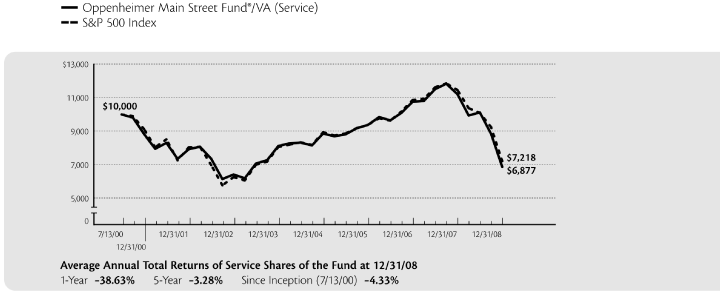
The performance data quoted represents past performance, which does not guarantee future results. The investment return and principal value of an investment in the Fund will fluctuate so that an investor’s shares, when redeemed, may be worth more or less than their original cost. Current performance may be lower or higher than the performance quoted. For performance data current to the most recent month end, call us at 1.800.981.2871. The Fund’s total returns should not be expected to be the same as the returns of other funds, whether or not both funds have the same portfolio managers and/or similar names. The Fund’s total returns do not include the charges associated with the separate account products that offer this Fund. Such performance would have been lower if such charges were taken into account.
5 | OPPENHEIMER MAIN STREET FUND/VA
FUND EXPENSES
Fund Expenses. As a shareholder of the Fund, you incur two types of costs: (1) transaction costs, which may include redemption fees (if applicable); and (2) ongoing costs, including management fees; distribution and service fees; and other Fund expenses. These examples are intended to help you understand your ongoing costs (in dollars) of investing in the Fund and to compare these costs with the ongoing costs of investing in other mutual funds.
The examples are based on an investment of $1,000.00 invested at the beginning of the period and held for the entire 6-month period ended December 31, 2008.
Actual Expenses. The first section of the table provides information about actual account values and actual expenses. You may use the information in this section for the class of shares you hold, together with the amount you invested, to estimate the expense that you paid over the period. Simply divide your account value by $1,000.00 (for example, an $8,600.00 account value divided by $1,000.00 = 8.60), then multiply the result by the number in the first section under the heading entitled “Expenses Paid During Period” to estimate the expenses you paid on your account during this period.
Hypothetical Example for Comparison Purposes. The second section of the table provides information about hypothetical account values and hypothetical expenses based on the Fund’s actual expense ratio for each class of shares, and an assumed rate of return of 5% per year for each class before expenses, which is not the actual return. The hypothetical account values and expenses may not be used to estimate the actual ending account balance or expenses you paid for the period. You may use this information to compare the ongoing costs of investing in the Fund and other funds. To do so, compare this 5% hypothetical example for the class of shares you hold with the 5% hypothetical examples that appear in the shareholder reports of the other funds.
Please note that the expenses shown in the table are meant to highlight your ongoing costs only and do not reflect any charges associated with the separate accounts that offer this Fund. Therefore, the “hypothetical” lines of the table are useful in comparing ongoing costs only, and will not help you determine the relative total costs of owning different funds. In addition, if these separate account charges were included your costs would have been higher.
| | | | | | | | | | | | | |
| | | Beginning | | Ending | | Expenses |
| | | Account | | Account | | Paid During |
| | | Value | | Value | | 6 Months Ended |
| | | July 1, 2008 | | December 31, 2008 | | December 31, 2008 |
| |
Actual | | | | | | | | | | | | |
| Non-Service Shares | | $ | 1,000.00 | | | $ | 680.40 | | | $ | 2.84 | |
| Service Shares | | | 1,000.00 | | | | 679.50 | | | | 3.89 | |
| | | | | | | | | | | | | |
Hypothetical | | | | | | | | | | | | |
| (5% return before expenses) | | | | | | | | | | | | |
| Non-Service Shares | | | 1,000.00 | | | | 1,021.77 | | | | 3.41 | |
| Service Shares | | | 1,000.00 | | | | 1,020.51 | | | | 4.68 | |
Expenses are equal to the Fund’s annualized expense ratio for that class, multiplied by the average account value over the period, multiplied by 184/366 (to reflect the one-half year period). Those annualized expense ratios, excluding indirect expenses from affiliated fund, based on the 6-month period ended December 31, 2008 are as follows:
| | | | | |
| Class | | Expense Ratios |
| |
| Non-Service Shares | | | 0.67 | % |
| Service Shares | | | 0.92 | |
The expense ratios reflect reduction to custodian expenses and voluntary waivers or reimbursements of expenses by the Fund’s Manager that can be terminated at any time, without advance notice. The “Financial Highlights” tables in the Fund’s financial statements, included in this report, also show the gross expense ratios, without such waivers or reimbursements and reduction to custodian expenses, if applicable.
6 | OPPENHEIMER MAIN STREET FUND/VA
STATEMENT OF INVESTMENTS December 31, 2008
| | | | | | | | | |
| | | Shares | | | Value | |
| |
Common Stocks—99.2% | | | | | | | | |
Consumer Discretionary—9.5% | | | | | | | | |
Auto Components—0.5% | | | | | | | | |
ArvinMeritor, Inc.1 | | | 56,400 | | | $ | 160,740 | |
| Autoliv, Inc. | | | 52,500 | | | | 1,126,650 | |
BorgWarner, Inc.1 | | | 44,000 | | | | 957,880 | |
Exide Technologies2 | | | 5,300 | | | | 28,037 | |
Federal-Mogul Corp.2 | | | 500 | | | | 2,115 | |
| Gentex Corp. | | | 54,400 | | | | 480,352 | |
Goodyear Tire & Rubber Co. (The)2 | | | 130,700 | | | | 780,279 | |
| Johnson Controls, Inc. | | | 136,500 | | | | 2,478,840 | |
Lear Corp.2 | | | 63,500 | | | | 89,535 | |
TRW Automotive Holdings Corp.2 | | | 100,700 | | | | 362,520 | |
| WABCO Holdings, Inc. | | | 62,400 | | | | 985,296 | |
| | | | | | | | |
| | | | | | | | 7,452,244 | |
Automobiles—0.0% | | | | | | | | |
Thor Industries, Inc.1 | | | 45,000 | | | | 593,100 | |
Distributors—0.0% | | | | | | | | |
LKQ Corp.1,2 | | | 17,100 | | | | 199,386 | |
Diversified Consumer Services—0.2% | | | | | | | | |
Brink’s Home Security Holdings, Inc.2 | | | 11,100 | | | | 243,312 | |
Career Education Corp.1,2 | | | 44,631 | | | | 800,680 | |
Corinthian Colleges, Inc.2 | | | 22,200 | | | | 363,414 | |
| Hillenbrand, Inc. | | | 2,700 | | | | 45,036 | |
| Regis Corp. | | | 14,000 | | | | 203,420 | |
Service Corp. International1 | | | 92,800 | | | | 461,216 | |
| | | | | | | | |
| | | | | | | | 2,117,078 | |
Hotels, Restaurants & Leisure—0.9% | | | | | | | | |
Ameristar Casinos, Inc.1 | | | 8,800 | | | | 76,032 | |
Bally Technologies, Inc.2 | | | 8,200 | | | | 197,046 | |
| Bob Evans Farms, Inc. | | | 23,600 | | | | 482,148 | |
Boyd Gaming Corp.1 | | | 90,700 | | | | 429,011 | |
Brinker International, Inc.1 | | | 76,500 | | | | 806,310 | |
| Carnival Corp. | | | 70,400 | | | | 1,712,128 | |
CEC Entertainment, Inc.2 | | | 37,400 | | | | 906,950 | |
Chipotle Mexican Grill, Inc., Cl. B2 | | | 619 | | | | 35,463 | |
| International Speedway Corp., Cl. A | | | 16,300 | | | | 468,299 | |
Interval Leisure Group, Inc.2 | | | 16,840 | | | | 90,768 | |
Jack in the Box, Inc.2 | | | 48,400 | | | | 1,069,156 | |
Life Time Fitness, Inc.1,2 | | | 16,400 | | | | 212,380 | |
| McDonald’s Corp. | | | 37,800 | | | | 2,350,782 | |
Panera Bread Co., Cl. A1,2 | | | 14,500 | | | | 757,480 | |
Papa John’s International, Inc.2 | | | 5,900 | | | | 108,737 | |
Sonic Corp.2 | | | 20,000 | | | | 243,400 | |
| Speedway Motorsports, Inc. | | | 13,000 | | | | 209,430 | |
Vail Resorts, Inc.1,2 | | | 20,800 | | | | 553,280 | |
WMS Industries, Inc.1,2 | | | 38,700 | | | | 1,041,030 | |
| Wyndham Worldwide Corp. | | | 109,700 | | | | 718,535 | |
| | | | | | | | |
| | | | | | | | 12,468,365 | |
| | | | | | | | | |
Household Durables—0.4% | | | | | | | | |
| American Greetings Corp., Cl. A | | | 36,577 | | | | 276,888 | |
Centex Corp.1 | | | 45,900 | | | | 488,376 | |
| Harman International Industries, Inc. | | | 54,300 | | | | 908,439 | |
Jarden Corp.2 | | | 8,800 | | | | 101,200 | |
| KB Home | | | 21,300 | | | | 290,106 | |
Lennar Corp., Cl. A1 | | | 72,800 | | | | 631,176 | |
| MDC Holdings, Inc. | | | 5,900 | | | | 178,770 | |
Meritage Homes Corp.2 | | | 10,600 | | | | 129,002 | |
| Pulte Homes, Inc. | | | 7,900 | | | | 86,347 | |
| Ryland Group, Inc. (The) | | | 29,000 | | | | 512,430 | |
| Snap-On, Inc. | | | 28,000 | | | | 1,102,640 | |
| Stanley Works (The) | | | 25,100 | | | | 855,910 | |
Tempur-Pedic International, Inc.1 | | | 71,100 | | | | 504,099 | |
| | | | | | | | |
| | | | | | | | 6,065,383 | |
| | | | | | | | | |
Internet & Catalog Retail—0.3% | | | | | | | | |
Expedia, Inc.2 | | | 114,600 | | | | 944,304 | |
HSN, Inc.2 | | | 16,840 | | | | 122,427 | |
Liberty Media Corp.-Interactive, Series A2 | | | 201,500 | | | | 628,680 | |
NetFlix.com, Inc.1,2 | | | 48,500 | | | | 1,449,665 | |
Priceline.com, Inc.1,2 | | | 17,100 | | | | 1,259,415 | |
Ticketmaster Entertainment, Inc.2 | | | 16,840 | | | | 108,113 | |
| | | | | | | | |
| | | | | | | | 4,512,604 | |
| | | | | | | | | |
Leisure Equipment & Products—0.1% | | | | | | | | |
Brunswick Corp.1 | | | 97,100 | | | | 408,791 | |
| Callaway Golf Co. | | | 71,100 | | | | 660,519 | |
Polaris Industries, Inc.1 | | | 20,700 | | | | 593,055 | |
| Pool Corp. | | | 7,852 | | | | 141,100 | |
| | | | | | | | |
| | | | | | | | 1,803,465 | |
| | | | | | | | | |
Media—3.4% | | | | | | | | |
| Arbitron, Inc. | | | 6,100 | | | | 81,008 | |
| Cablevision Systems Corp. New York Group, Cl. A | | | 63,200 | | | | 1,064,288 | |
CBS Corp., Cl. B1 | | | 816,600 | | | | 6,687,954 | |
Central European Media Enterprises Ltd., Cl. A1,2 | | | 4,200 | | | | 91,224 | |
| Cinemark Holdings, Inc. | | | 700 | | | | 5,201 | |
Clear Channel Outdoor Holdings, Inc., Cl. A1,2 | | | 25,200 | | | | 154,980 | |
F1 | OPPENHEIMER MAIN STREET FUND/VA
STATEMENT OF INVESTMENTS Continued
| | | | | | | | | |
| | | Shares | | | Value | |
| |
Media Continued | | | | | | | | |
Cox Radio, Inc., Cl. A1,2 | | | 20,196 | | | $ | 121,378 | |
DirecTV Group, Inc. (The)2 | | | 148,300 | | | | 3,397,553 | |
Dish Network Corp., Cl. A2 | | | 88,400 | | | | 980,356 | |
DreamWorks Animation SKG, Inc., Cl. A2 | | | 47,800 | | | | 1,207,428 | |
Gannett Co., Inc.1 | | | 84,300 | | | | 674,400 | |
| Harte-Hanks, Inc. | | | 15,800 | | | | 98,592 | |
| Hearst-Argyle Television, Inc. | | | 2,700 | | | | 16,362 | |
Lamar Advertising Co., Cl. A1,2 | | | 48,500 | | | | 609,160 | |
Liberty Media Corp.-Entertainment, Series A2 | | | 54,400 | | | | 950,912 | |
Liberty Media Holding Corp.-Capital, Series A2 | | | 16,900 | | | | 79,599 | |
| McGraw-Hill Cos., Inc. (The) | | | 113,400 | | | | 2,629,746 | |
Mediacom Communications Corp.2 | | | 1,300 | | | | 5,590 | |
Meredith Corp.1 | | | 54,300 | | | | 929,616 | |
| News Corp., Inc., Cl. A | | | 690,669 | | | | 6,278,181 | |
| Scholastic Corp. | | | 28,200 | | | | 382,956 | |
| Time Warner, Inc. | | | 1,569,400 | | | | 15,788,164 | |
Viacom, Inc., Cl. B2 | | | 90,173 | | | | 1,718,697 | |
| Walt Disney Co. (The) | | | 250,600 | | | | 5,686,114 | |
| Warner Music Group Corp. | | | 31,200 | | | | 94,224 | |
| | | | | | | | |
| | | | | | | | 49,733,683 | |
| | | | | | | | | |
Multiline Retail—0.4% | | | | | | | | |
Big Lots, Inc.1,2 | | | 56,600 | | | | 820,134 | |
Dillard’s, Inc., Cl. A1 | | | 96,400 | | | | 382,708 | |
Dollar Tree, Inc.2 | | | 36,300 | | | | 1,517,340 | |
Kohl’s Corp.2 | | | 49,600 | | | | 1,795,520 | |
| Macy’s, Inc. | | | 112,800 | | | | 1,167,480 | |
Nordstrom, Inc.1 | | | 55,000 | | | | 732,050 | |
| | | | | | | | |
| | | | | | | | 6,415,232 | |
| | | | | | | | | |
Specialty Retail—2.7% | | | | | | | | |
| Aaron Rents, Inc. | | | 14,800 | | | | 393,976 | |
Abercrombie & Fitch Co., Cl. A1 | | | 46,800 | | | | 1,079,676 | |
Aeropostale, Inc.2 | | | 83,300 | | | | 1,341,130 | |
| American Eagle Outfitters, Inc. | | | 91,100 | | | | 852,696 | |
AnnTaylor Stores Corp.2 | | | 107,700 | | | | 621,429 | |
AutoNation, Inc.1,2 | | | 127,400 | | | | 1,258,712 | |
Barnes & Noble, Inc.1 | | | 55,500 | | | | 832,500 | |
| bebe stores, inc. | | | 34,400 | | | | 256,968 | |
Best Buy Co., Inc.1 | | | 300,500 | | | | 8,447,055 | |
Buckle, Inc. (The)1 | | | 32,100 | | | | 700,422 | |
Chico’s FAS, Inc.2 | | | 7,500 | | | | 31,350 | |
Children’s Place Retail Stores, Inc.1,2 | | | 43,800 | | | | 949,584 | |
Dress Barn, Inc. (The)1,2 | | | 62,200 | | | | 668,028 | |
| Foot Locker, Inc. | | | 74,400 | | | | 546,096 | |
| Gap, Inc. (The) | | | 493,300 | | | | 6,605,287 | |
| Guess?, Inc. | | | 31,100 | | | | 477,385 | |
Gymboree Corp.2 | | | 13,600 | | | | 354,824 | |
| Home Depot, Inc. (The) | | | 90,400 | | | | 2,081,008 | |
J. Crew Group, Inc.2 | | | 3,800 | | | | 46,360 | |
| Limited Brands, Inc. | | | 115,200 | | | | 1,156,608 | |
| Lowe’s Cos., Inc. | | | 26,000 | | | | 559,520 | |
Men’s Wearhouse, Inc. (The)1 | | | 51,500 | | | | 697,310 | |
Office Depot, Inc.2 | | | 192,500 | | | | 573,650 | |
| OfficeMax, Inc. | | | 11,300 | | | | 86,332 | |
Penske Automotive Group, Inc.1 | | | 35,600 | | | | 273,408 | |
| RadioShack Corp. | | | 67,200 | | | | 802,368 | |
Rent-A-Center, Inc.2 | | | 47,300 | | | | 834,845 | |
| Ross Stores, Inc. | | | 16,300 | | | | 484,599 | |
Sally Beauty Holdings, Inc.1,2 | | | 63,600 | | | | 361,884 | |
| Sherwin-Williams Co. | | | 20,100 | | | | 1,200,975 | |
| Signet Jewelers Ltd. | | | 1,000 | | | | 8,670 | |
Talbots, Inc. (The)1 | | | 36,600 | | | | 87,474 | |
| TJX Cos., Inc. (The) | | | 82,600 | | | | 1,699,082 | |
Tractor Supply Co.1,2 | | | 31,600 | | | | 1,142,024 | |
Urban Outfitters, Inc.2 | | | 17,200 | | | | 257,656 | |
| Williams-Sonoma, Inc. | | | 116,300 | | | | 914,118 | |
Zale Corp.1,2 | | | 39,804 | | | | 132,547 | |
| | | | | | | | |
| | | | | | | | 38,817,556 | |
| | | | | | | | | |
Textiles, Apparel & Luxury Goods—0.6% | | | | | | | | |
Carter’s, Inc.2 | | | 28,100 | | | | 541,206 | |
Coach, Inc.2 | | | 79,200 | | | | 1,644,984 | |
Fossil, Inc.2 | | | 39,300 | | | | 656,310 | |
| Jones Apparel Group, Inc. | | | 81,300 | | | | 476,418 | |
Liz Claiborne, Inc.1 | | | 155,500 | | | | 404,300 | |
| Phillips/Van Heusen Corp. | | | 42,202 | | | | 849,526 | |
| Polo Ralph Lauren Corp., Cl. A | | | 18,500 | | | | 840,085 | |
Quicksilver, Inc.2 | | | 67,800 | | | | 124,752 | |
Skechers USA, Inc., Cl. A2 | | | 20,000 | | | | 256,400 | |
Timberland Co., Cl. A2 | | | 49,000 | | | | 565,950 | |
| UniFirst Corp. | | | 4,600 | | | | 136,574 | |
Warnaco Group, Inc. (The)2 | | | 63,900 | | | | 1,254,357 | |
| Wolverine World Wide, Inc. | | | 37,700 | | | | 793,208 | |
| | | | | | | | |
| | | | | | | | 8,544,070 | |
| | | | | | | | | |
Consumer Staples—5.4% | | | | | | | | |
Beverages—0.9% | | | | | | | | |
| Coca-Cola Co. (The) | | | 162,200 | | | | 7,342,794 | |
| PepsiCo, Inc. | | | 96,250 | | | | 5,271,613 | |
| | | | | | | | |
| | | | | | | | 12,614,407 | |
F2 | OPPENHEIMER MAIN STREET FUND/VA
| | | | | | | | | |
| | | Shares | | | Value | |
| |
Food & Staples Retailing—1.9% | | | | | | | | |
| Casey’s General Stores, Inc. | | | 22,800 | | | $ | 519,156 | |
| CVS Caremark Corp. | | | 59,000 | | | | 1,695,660 | |
| Kroger Co. (The) | | | 156,700 | | | | 4,138,447 | |
| Safeway, Inc. | | | 413,600 | | | | 9,831,272 | |
| SUPERVALU, Inc. | | | 27,800 | | | | 405,880 | |
| Wal-Mart Stores, Inc. | | | 205,300 | | | | 11,509,118 | |
| Weis Markets, Inc. | | | 2,400 | | | | 80,712 | |
Winn-Dixie Stores, Inc.2 | | | 4,100 | | | | 66,010 | |
| | | | | | | | |
| | | | | | | | 28,246,255 | |
| | | | | | | | | |
Food Products—0.1% | | | | | | | | |
| Bunge Ltd. | | | 4,700 | | | | 243,319 | |
Darling International, Inc.2 | | | 15,600 | | | | 85,644 | |
| Del Monte Foods Co. | | | 24,100 | | | | 172,074 | |
Fresh Del Monte Produce, Inc.2 | | | 5,600 | | | | 125,552 | |
Ralcorp Holdings, Inc.2 | | | 6,200 | | | | 362,080 | |
| | | | | | | | |
| | | | | | | | 988,669 | |
| | | | | | | | | |
Household Products—1.4% | | | | | | | | |
| Procter & Gamble Co. (The) | | | 341,299 | | | | 21,099,104 | |
| | | | | | | | | |
Personal Products—0.2% | | | | | | | | |
Chattem, Inc.1,2 | | | 7,700 | | | | 550,781 | |
| Herbalife Ltd. | | | 53,400 | | | | 1,157,712 | |
NBTY, Inc.2 | | | 53,200 | | | | 832,580 | |
| Nu Skin Asia Pacific, Inc., Cl. A | | | 16,600 | | | | 173,138 | |
Revlon, Inc., Cl. A2 | | | 3,000 | | | | 20,010 | |
| | | | | | | | |
| | | | | | | | 2,734,221 | |
| | | | | | | | | |
Tobacco—0.9% | | | | | | | | |
| Altria Group, Inc. | | | 91,000 | | | | 1,370,460 | |
| Philip Morris International, Inc. | | | 250,200 | | | | 10,886,202 | |
Universal Corp.1 | | | 12,200 | | | | 364,414 | |
| | | | | | | | |
| | | | | | | | 12,621,076 | |
| | | | | | | | | |
Energy—20.0% | | | | | | | | |
Energy Equipment & Services—3.2% | | | | | | | | |
| Baker Hughes, Inc. | | | 147,100 | | | | 4,717,497 | |
Basic Energy Services, Inc.2 | | | 15,400 | | | | 200,816 | |
| BJ Services Co. | | | 69,500 | | | | 811,065 | |
Complete Production Services, Inc.2 | | | 75,100 | | | | 612,065 | |
Diamond Offshore Drilling, Inc.1 | | | 29,900 | | | | 1,762,306 | |
Dresser-Rand Group, Inc.2 | | | 50,860 | | | | 877,335 | |
Dril-Quip, Inc.2 | | | 12,800 | | | | 262,528 | |
| ENSCO International, Inc. | | | 35,200 | | | | 999,328 | |
Exterran Holdings, Inc.1,2 | | | 23,300 | | | | 496,290 | |
Gulfmark Offshore, Inc.2 | | | 10,600 | | | | 252,174 | |
| Halliburton Co. | | | 226,400 | | | | 4,115,952 | |
Helix Energy Solutions Group, Inc.2 | | | 33,049 | | | | 239,275 | |
| Helmerich & Payne, Inc. | | | 26,200 | | | | 596,050 | |
Hercules Offshore, Inc.1,2 | | | 3,800 | | | | 18,050 | |
Hornbeck Offshore Services, Inc.2 | | | 1,300 | | | | 21,242 | |
ION Geophysical Corp.2 | | | 3,600 | | | | 12,348 | |
Key Energy Services, Inc.2 | | | 137,500 | | | | 606,375 | |
| Lufkin Industries, Inc. | | | 6,800 | | | | 234,600 | |
Nabors Industries Ltd.2 | | | 65,300 | | | | 781,641 | |
National Oilwell Varco, Inc.2 | �� | | 123,200 | | | | 3,011,008 | |
| Noble Corp. | | | 308,700 | | | | 6,819,183 | |
Oceaneering International, Inc.2 | | | 24,800 | | | | 722,672 | |
Oil States International, Inc.1,2 | | | 56,745 | | | | 1,060,564 | |
Parker Drilling Co.2 | | | 70,200 | | | | 203,580 | |
| Patterson-UTI Energy, Inc. | | | 65,200 | | | | 750,452 | |
Pioneer Drilling Co.2 | | | 3,300 | | | | 18,381 | |
Precision Drilling Trust1 | | | 5,763 | | | | 47,697 | |
Pride International, Inc.2 | | | 45,900 | | | | 733,482 | |
| Schlumberger Ltd. | | | 137,000 | | | | 5,799,210 | |
Seacor Holdings, Inc.1,2 | | | 15,900 | | | | 1,059,735 | |
| Smith International, Inc. | | | 6,100 | | | | 139,629 | |
Superior Energy Services, Inc.2 | | | 51,600 | | | | 821,988 | |
Tetra Technologies, Inc.2 | | | 10,400 | | | | 50,544 | |
| Tidewater, Inc. | | | 20,400 | | | | 821,508 | |
Transocean Ltd.2 | | | 70,000 | | | | 3,307,500 | |
Unit Corp.2 | | | 35,855 | | | | 958,046 | |
Weatherford International Ltd.2 | | | 221,400 | | | | 2,395,548 | |
| | | | | | | | |
| | | | | | | | 46,337,664 | |
| | | | | | | | | |
Oil, Gas & Consumable Fuels—16.8% | | | | | | | | |
| Anadarko Petroleum Corp. | | | 337,900 | | | | 13,026,045 | |
| Apache Corp. | | | 205,000 | | | | 15,278,650 | |
Arena Resources, Inc.2 | | | 8,000 | | | | 224,720 | |
| Berry Petroleum Co., Cl. A | | | 44,600 | | | | 337,176 | |
Bill Barrett Corp.2 | | | 26,200 | | | | 553,606 | |
BPZ Resources, Inc.2 | | | 2,100 | | | | 13,440 | |
Carrizo Oil & Gas, Inc.2 | | | 14,100 | | | | 227,010 | |
Chesapeake Energy Corp.1 | | | 116,500 | | | | 1,883,805 | |
| Chevron Corp. | | | 437,326 | | | | 32,349,004 | |
| Cimarex Energy Co. | | | 29,300 | | | | 784,654 | |
| ConocoPhillips | | | 445,483 | | | | 23,076,019 | |
Contango Oil & Gas Co.2 | | | 1,000 | | | | 56,300 | |
CVR Energy, Inc.2 | | | 14,000 | | | | 56,000 | |
Delta Petroleum Corp.1,2 | | | 22,000 | | | | 104,720 | |
Denbury Resources, Inc.2 | | | 71,100 | | | | 776,412 | |
| Devon Energy Corp. | | | 84,500 | | | | 5,552,495 | |
Encore Acquisition Co.2 | | | 24,500 | | | | 625,240 | |
F3 | OPPENHEIMER MAIN STREET FUND/VA
STATEMENT OF INVESTMENTS Continued
| | | | | | | | | |
| | | Shares | | | Value | |
| |
Oil, Gas & Consumable Fuels Continued | | | | | | | | |
| Exxon Mobil Corp. | | | 827,456 | | | $ | 66,055,812 | |
| Foundation Coal Holdings, Inc. | | | 64,400 | | | | 902,888 | |
| Frontier Oil Corp. | | | 83,900 | | | | 1,059,657 | |
Frontline Ltd.1 | | | 21,200 | | | | 627,732 | |
Hess Corp.1 | | | 176,800 | | | | 9,483,552 | |
| Holly Corp. | | | 19,400 | | | | 353,662 | |
International Coal Group, Inc.2 | | | 6,200 | | | | 14,260 | |
| Marathon Oil Corp. | | | 355,800 | | | | 9,734,688 | |
Mariner Energy, Inc.2 | | | 89,200 | | | | 909,840 | |
| Massey Energy Co. | | | 49,700 | | | | 685,363 | |
McMoRan Exploration Co.2 | | | 18,400 | | | | 180,320 | |
| Murphy Oil Corp. | | | 159,600 | | | | 7,078,260 | |
| Noble Energy, Inc. | | | 139,300 | | | | 6,856,346 | |
| Nordic American Tanker Shipping Ltd. | | | 400 | | | | 13,500 | |
| Occidental Petroleum Corp. | | | 361,800 | | | | 21,704,382 | |
| Overseas Shipholding Group, Inc. | | | 26,400 | | | | 1,111,704 | |
| Pioneer Natural Resources Co. | | | 21,800 | | | | 352,724 | |
Plains Exploration & Production Co.2 | | | 40,700 | | | | 945,868 | |
Quicksilver Resources, Inc.2 | | | 61,600 | | | | 343,112 | |
Rosetta Resources, Inc.2 | | | 35,400 | | | | 250,632 | |
| St. Mary Land & Exploration Co. | | | 10,200 | | | | 207,162 | |
Stone Energy Corp.2 | | | 64,245 | | | | 707,980 | |
Sunoco, Inc.1 | | | 32,300 | | | | 1,403,758 | |
Swift Energy Co.2 | | | 39,400 | | | | 662,314 | |
| Tesoro Corp. | | | 133,200 | | | | 1,754,244 | |
| Valero Energy Corp. | | | 477,900 | | | | 10,341,756 | |
| W&T Offshore, Inc. | | | 66,700 | | | | 955,144 | |
| Walter Industries, Inc. | | | 14,300 | | | | 250,393 | |
Whiting Petroleum Corp.2 | | | 6,400 | | | | 214,144 | |
Williams (Clayton) Energy, Inc.2 | | | 2,100 | | | | 95,424 | |
| World Fuel Services Corp. | | | 700 | | | | 25,900 | |
| XTO Energy, Inc. | | | 109,600 | | | | 3,865,592 | |
| | | | | | | | |
| | | | | | | | 244,073,409 | |
| | | | | | | | | |
Financials—8.9% | | | | | | | | |
Capital Markets—1.6% | | | | | | | | |
Affiliated Managers Group, Inc.2 | | | 5,700 | | | | 238,944 | |
| Ameriprise Financial, Inc. | | | 47,600 | | | | 1,111,936 | |
BlackRock, Inc.1 | | | 10,400 | | | | 1,395,160 | |
| Cohen & Steers, Inc. | | | 800 | | | | 8,792 | |
E*TRADE Financial Corp.1,2 | | | 274,400 | | | | 315,560 | |
| Franklin Resources, Inc. | | | 49,600 | | | | 3,163,488 | |
| GAMCO Investors, Inc., Cl. A | | | 3,500 | | | | 95,620 | |
| GLG Partners, Inc. | | | 1,600 | | | | 3,632 | |
Goldman Sachs Group, Inc. (The)1 | | | 57,000 | | | | 4,810,230 | |
Greenhill & Co., Inc.1 | | | 9,000 | | | | 627,930 | |
Investment Technology Group, Inc.2 | | | 11,600 | | | | 263,552 | |
| Janus Capital Group, Inc. | | | 65,500 | | | | 525,965 | |
| Jefferies Group, Inc. | | | 15,900 | | | | 223,554 | |
KBW, Inc.1,2 | | | 12,600 | | | | 289,800 | |
Knight Capital Group, Inc., Cl. A2 | | | 52,700 | | | | 851,105 | |
| Lazard Ltd., Cl. A | | | 13,500 | | | | 401,490 | |
| Legg Mason, Inc. | | | 48,300 | | | | 1,058,253 | |
Piper Jaffray Cos., Inc.2 | | | 17,800 | | | | 707,728 | |
| SEI Investments Co. | | | 28,900 | | | | 454,019 | |
Stifel Financial Corp.2 | | | 13,000 | | | | 596,050 | |
T. Rowe Price Group, Inc.1 | | | 84,700 | | | | 3,001,768 | |
TD Ameritrade Holding Corp.2 | | | 178,800 | | | | 2,547,900 | |
| Waddell & Reed Financial, Inc., Cl. A | | | 4,800 | | | | 74,208 | |
| | | | | | | | |
| | | | | | | | 22,766,684 | |
| | | | | | | | | |
Commercial Banks—1.6% | | | | | | | | |
Cathay Bancorp, Inc.1 | | | 17,400 | | | | 413,250 | |
Colonial BancGroup, Inc. (The)1 | | | 118,400 | | | | 245,088 | |
| East West Bancorp, Inc. | | | 54,700 | | | | 873,559 | |
| First BanCorp | | | 16,100 | | | | 179,354 | |
| First Citizens BancShares, Inc., Cl. A | | | 200 | | | | 30,560 | |
| First Commonwealth Financial Corp. | | | 700 | | | | 8,666 | |
| First Horizon National Corp. | | | 150,618 | | | | 1,592,032 | |
First Midwest Bancorp, Inc.1 | | | 20,600 | | | | 411,382 | |
| FirstMerit Corp. | | | 17,100 | | | | 352,089 | |
Hancock Holding Co.1 | | | 6,800 | | | | 309,128 | |
| International Bancshares Corp. | | | 14,400 | | | | 314,352 | |
National Penn Bancshares, Inc.1 | | | 33,300 | | | | 483,183 | |
Old National Bancorp1 | | | 30,300 | | | | 550,248 | |
| Pacific Capital Bancorp | | | 56,600 | | | | 955,408 | |
PacWest Bancorp1 | | | 24,411 | | | | 656,656 | |
Park National Corp.1 | | | 1,900 | | | | 136,325 | |
Popular, Inc.1 | | | 148,000 | | | | 763,680 | |
| Regions Financial Corp. | | | 163,900 | | | | 1,304,644 | |
Sterling Financial Corp., Western US1 | | | 13,000 | | | | 114,400 | |
Susquehanna Bancshares, Inc.1 | | | 35,900 | | | | 571,169 | |
Trustmark Corp.1 | | | 14,700 | | | | 317,373 | |
| U.S. Bancorp | | | 182,000 | | | | 4,551,820 | |
F4 | OPPENHEIMER MAIN STREET FUND/VA
| | | | | | | | | |
| | | Shares | | | Value | |
| |
Commercial Banks Continued | | | | | | | | |
| UCBH Holdings, Inc. | | | 55,500 | | | $ | 381,840 | |
Umpqua Holdings Corp.1 | | | 19,600 | | | | 283,612 | |
United Community Banks, Inc.1 | | | 11,430 | | | | 155,219 | |
| Webster Financial Corp. | | | 55,000 | | | | 757,900 | |
| Wells Fargo & Co. | | | 197,200 | | | | 5,813,456 | |
| Whitney Holding Corp. | | | 10,000 | | | | 159,900 | |
| Wintrust Financial Corp. | | | 2,400 | | | | 49,368 | |
| Zions Bancorp | | | 17,500 | | | | 428,925 | |
| | | | | | | | |
| | | | | | | | 23,164,586 | |
| | | | | | | | | |
Consumer Finance—0.3% | | | | | | | | |
AmeriCredit Corp.1,2 | | | 71,900 | | | | 549,316 | |
| Capital One Financial Corp. | | | 23,800 | | | | 758,982 | |
| Cash America International, Inc. | | | 33,500 | | | | 916,225 | |
| Discover Financial Services | | | 150,300 | | | | 1,432,359 | |
EZCORP, Inc., Cl. A2 | | | 8,100 | | | | 123,201 | |
| Nelnet, Inc., Cl. A | | | 11,700 | | | | 167,661 | |
| Student Loan Corp. (The) | | | 2,700 | | | | 110,700 | |
| | | | | | | | |
| | | | | | | | 4,058,444 | |
| | | | | | | | | |
Diversified Financial Services—1.6% | | | | | | | | |
| Bank of America Corp. | | | 589,109 | | | | 8,294,655 | |
| CIT Group, Inc. | | | 163,200 | | | | 740,928 | |
Interactive Brokers Group, Inc., Cl. A2 | | | 39,200 | | | | 701,288 | |
| JPMorgan Chase & Co. | | | 349,444 | | | | 11,017,969 | |
| NYSE Euronext | | | 93,500 | | | | 2,560,030 | |
PHH Corp.1,2 | | | 24,400 | | | | 310,612 | |
Pico Holdings, Inc.2 | | | 400 | | | | 10,632 | |
| | | | | | | | |
| | | | | | | | 23,636,114 | |
| | | | | | | | | |
Insurance—3.7% | | | | | | | | |
| Allied World Assurance Holdings Ltd. | | | 24,900 | | | | 1,010,940 | |
| Allstate Corp. | | | 44,400 | | | | 1,454,544 | |
| American Financial Group, Inc. | | | 55,200 | | | | 1,262,976 | |
| American National Insurance Co. | | | 500 | | | | 36,865 | |
| AmTrust Financial Services, Inc. | | | 3,200 | | | | 37,120 | |
Arch Capital Group Ltd.2 | | | 10,000 | | | | 701,000 | |
| Aspen Insurance Holdings Ltd. | | | 46,100 | | | | 1,117,925 | |
Assured Guaranty Ltd.1 | | | 23,000 | | | | 262,200 | |
| Axis Capital Holdings Ltd. | | | 45,300 | | | | 1,319,136 | |
| Berkley (W.R.) Corp. | | | 53,200 | | | | 1,649,200 | |
Berkshire Hathaway, Inc., Cl. B2 | | | 1,664 | | | | 5,348,096 | |
| Brown & Brown, Inc. | | | 61,200 | | | | 1,279,080 | |
Chubb Corp.1 | | | 114,900 | | | | 5,859,900 | |
| Cincinnati Financial Corp. | | | 25,056 | | | | 728,378 | |
| CNA Financial Corp. | | | 55,600 | | | | 914,064 | |
CNA Surety Corp.2 | | | 4,600 | | | | 88,320 | |
Conseco, Inc.2 | | | 35,800 | | | | 185,444 | |
| Delphi Financial Group, Inc., Cl. A | | | 33,300 | | | | 614,052 | |
| Employers Holdings, Inc. | | | 27,200 | | | | 448,800 | |
| Endurance Specialty Holdings Ltd. | | | 19,300 | | | | 589,229 | |
| FBL Financial Group, Inc., Cl. A | | | 1,500 | | | | 23,175 | |
| Fidelity National Title Group, Inc., Cl. A | | | 22,500 | | | | 399,375 | |
| First American Corp. | | | 5,700 | | | | 164,673 | |
| Flagstone Reinsurance Holdings Ltd. | | | 2,000 | | | | 19,540 | |
| Genworth Financial, Inc., Cl. A | | | 126,500 | | | | 357,995 | |
| Hanover Insurance Group, Inc. | | | 20,000 | | | | 859,400 | |
| Harleysville Group, Inc. | | | 9,600 | | | | 333,408 | |
| Hartford Financial Services Group, Inc. (The) | | | 31,100 | | | | 510,662 | |
| HCC Insurance Holdings, Inc. | | | 30,200 | | | | 807,850 | |
| Infinity Property & Casualty Corp. | | | 1,100 | | | | 51,403 | |
| IPC Holdings Ltd. | | | 35,100 | | | | 1,049,490 | |
| Lincoln National Corp. | | | 52,800 | | | | 994,752 | |
| Loews Corp. | | | 170,933 | | | | 4,828,857 | |
| Max Capital Group Ltd. | | | 37,700 | | | | 667,290 | |
| Montpelier Re Holdings Ltd. | | | 15,700 | | | | 263,603 | |
| Nationwide Financial Services, Inc., Cl. A | | | 8,100 | | | | 422,901 | |
Navigators Group, Inc. (The)2 | | | 4,900 | | | | 269,059 | |
| Odyssey Re Holdings Corp. | | | 24,600 | | | | 1,274,526 | |
| Old Republic International Corp. | | | 39,300 | | | | 468,456 | |
| OneBeacon Insurance Group Ltd. | | | 11,700 | | | | 122,148 | |
| Partnerre Holdings Ltd. | | | 14,800 | | | | 1,054,796 | |
| Phoenix Cos., Inc. (The) | | | 32,600 | | | | 106,602 | |
| Platinum Underwriters Holdings Ltd. | | | 34,700 | | | | 1,251,976 | |
ProAssurance Corp.2 | | | 14,300 | | | | 754,754 | |
| Protective Life Corp. | | | 73,100 | | | | 1,048,985 | |
| Prudential Financial, Inc. | | | 128,000 | | | | 3,873,280 | |
| RLI Corp. | | | 10,800 | | | | 660,528 | |
| Selective Insurance Group, Inc. | | | 24,500 | | | | 561,785 | |
| StanCorp Financial Group, Inc. | | | 25,700 | | | | 1,073,489 | |
| State Auto Financial Corp. | | | 2,400 | | | | 72,144 | |
| Transatlantic Holdings, Inc. | | | 6,400 | | | | 256,384 | |
| Travelers Cos., Inc. (The) | | | 86,100 | | | | 3,891,720 | |
| United Fire & Casualty Co. | | | 4,700 | | | | 146,029 | |
| Unitrin, Inc. | | | 31,400 | | | | 500,516 | |
F5 | OPPENHEIMER MAIN STREET FUND/VA
STATEMENT OF INVESTMENTS Continued
| | | | | | | | | |
| | | Shares | | | Value | |
| |
Insurance Continued | | | | | | | | |
| Validus Holdings Ltd. | | | 2,000 | | | $ | 52,320 | |
XL Capital Ltd., Cl. A1 | | | 53,100 | | | | 196,470 | |
| Zenith National Insurance Corp. | | | 11,700 | | | | 369,369 | |
| | | | | | | | |
| | | | | | | | 54,666,979 | |
| | | | | | | | | |
Real Estate Management & Development—0.0% | | | | | | | | |
CB Richard Ellis Group, Inc., Cl. A2 | | | 59,500 | | | | 257,040 | |
Forest City Enterprises, Inc., Cl. A1 | | | 31,700 | | | | 212,390 | |
| Jones Lang LaSalle, Inc. | | | 8,100 | | | | 224,370 | |
| | | | | | | | |
| | | | | | | | 693,800 | |
| | | | | | | | | |
Thrifts & Mortgage Finance—0.1% | | | | | | | | |
| MGIC Investment Corp. | | | 64,500 | | | | 224,460 | |
| NewAlliance Bancshares, Inc. | | | 15,200 | | | | 200,184 | |
| Northwest Bancorp, Inc. | | | 800 | | | | 17,104 | |
| Provident Financial Services, Inc. | | | 20,700 | | | | 316,710 | |
Tree.com, Inc.2 | | | 2,806 | | | | 7,296 | |
| | | | | | | | |
| | | | | | | | 765,754 | |
| | | | | | | | | |
Health Care—9.1% | | | | | | | | |
Biotechnology—1.1% | | | | | | | | |
Amgen, Inc.2 | | | 151,000 | | | | 8,720,250 | |
Celera Corp.2 | | | 600 | | | | 6,678 | |
Cubist Pharmaceuticals, Inc.2 | | | 24,100 | | | | 582,256 | |
Facet Biotech Corp.2 | | | 17,040 | | | | 163,414 | |
Genentech, Inc.2 | | | 57,600 | �� | | | 4,775,616 | |
Martek Biosciences Corp.1 | | | 17,000 | | | | 515,270 | |
| PDL BioPharma, Inc. | | | 85,200 | | | | 526,536 | |
| | | | | | | | |
| | | | | | | | 15,290,020 | |
| | | | | | | | | |
Health Care Equipment & Supplies—0.3% | | | | | | | | |
American Medical Systems Holdings, Inc.2 | | | 3,300 | | | | 29,667 | |
| Analogic Corp. | | | 6,700 | | | | 182,776 | |
Hill-Rom Holdings, Inc.1 | | | 23,200 | | | | 381,872 | |
Inverness Medical Innovations, Inc.2 | | | 11,100 | | | | 209,901 | |
| Medtronic, Inc. | | | 32,000 | | | | 1,005,440 | |
Sirona Dental Systems, Inc.1,2 | | | 14,500 | | | | 152,250 | |
| Steris Corp. | | | 10,300 | | | | 246,067 | |
Zimmer Holdings, Inc.2 | | | 52,500 | | | | 2,122,050 | |
| | | | | | | | |
| | | | | | | | 4,330,023 | |
| | | | | | | | | |
Health Care Providers & Services—2.7% | | | | | | | | |
| Aetna, Inc. | | | 465,300 | | | | 13,261,050 | |
AMERIGROUP Corp.1,2 | | | 48,700 | | | | 1,437,624 | |
Brookdale Senior Living, Inc.1 | | | 38,300 | | | | 213,714 | |
| Cardinal Health, Inc. | | | 12,700 | | | | 437,769 | |
Catalyst Health Solutions, Inc.2 | | | 12,500 | | | | 304,375 | |
Centene Corp.2 | | | 51,500 | | | | 1,015,065 | |
| Chemed Corp. | | | 22,300 | | | | 886,871 | |
| CIGNA Corp. | | | 81,700 | | | | 1,376,645 | |
Community Health Systems, Inc.2 | | | 13,200 | | | | 192,456 | |
Coventry Health Care, Inc.2 | | | 46,000 | | | | 684,480 | |
Emergency Medical Services LP, Cl. A1,2 | | | 5,300 | | | | 194,033 | |
Health Net, Inc.2 | | | 78,000 | | | | 849,420 | |
Healthspring, Inc.2 | | | 23,000 | | | | 459,310 | |
Kindred Healthcare, Inc.2 | | | 31,200 | | | | 406,224 | |
LifePoint Hospitals, Inc.1,2 | | | 42,753 | | | | 976,479 | |
Lincare Holdings, Inc.1,2 | | | 29,100 | | | | 783,663 | |
Magellan Health Services, Inc.2 | | | 7,200 | | | | 281,952 | |
Molina Healthcare, Inc.1,2 | | | 5,200 | | | | 91,572 | |
| Omnicare, Inc. | | | 25,300 | | | | 702,328 | |
| Owens & Minor, Inc. | | | 5,200 | | | | 195,780 | |
Pediatrix Medical Group, Inc.2 | | | 13,800 | | | | 437,460 | |
PharMerica Corp.1,2 | | | 1,000 | | | | 15,670 | |
Universal American Corp.2 | | | 15,400 | | | | 135,828 | |
| Universal Health Services, Inc., Cl. B | | | 21,300 | | | | 800,241 | |
VCA Antech, Inc.2 | | | 1,200 | | | | 23,856 | |
WellCare Health Plans, Inc.2 | | | 23,300 | | | | 299,638 | |
WellPoint, Inc.2 | | | 307,600 | | | | 12,959,188 | |
| | | | | | | | |
| | | | | | | | 39,422,691 | |
| | | | | | | | | |
Health Care Technology—0.0% | | | | | | | | |
| Allscripts-Misys Healthcare Solutions, Inc. | | | 11,700 | | | | 116,064 | |
| IMS Health, Inc. | | | 11,800 | | | | 178,888 | |
| | | | | | | | |
| | | | | | | | 294,952 | |
| | | | | | | | | |
Life Sciences Tools & Services—0.1% | | | | | | | | |
Thermo Fisher Scientific, Inc.2 | | | 19,500 | | | | 664,365 | |
Varian, Inc.2 | | | 8,200 | | | | 274,782 | |
| | | | | | | | |
| | | | | | | | 939,147 | |
| | | | | | | | | |
Pharmaceuticals—4.9% | | | | | | | | |
| Abbott Laboratories | | | 61,200 | | | | 3,266,244 | |
Eli Lilly & Co.1 | | | 172,500 | | | | 6,946,575 | |
Endo Pharmaceuticals Holdings, Inc.1,2 | | | 41,600 | | | | 1,076,608 | |
Forest Laboratories, Inc.2 | | | 71,160 | | | | 1,812,445 | |
| Johnson & Johnson | | | 376,706 | | | | 22,538,320 | |
K-V Pharmaceutical Co., Cl. A1,2 | | | 2,900 | | | | 8,352 | |
F6 | OPPENHEIMER MAIN STREET FUND/VA
| | | | | | | | | |
| | | Shares | | | Value | |
| |
Pharmaceuticals Continued | | | | | | | | |
King Pharmaceuticals, Inc.1,2 | | | 149,700 | | | $ | 1,589,814 | |
Medicis Pharmaceutical Corp., Cl. A1 | | | 72,000 | | | | 1,000,800 | |
| Merck & Co., Inc. | | | 317,900 | | | | 9,664,160 | |
| Pfizer, Inc. | | | 1,185,200 | | | | 20,989,892 | |
Sepracor, Inc.2 | | | 44,700 | | | | 490,806 | |
Warner Chilcott Ltd., Cl. A2 | | | 2,400 | | | | 34,800 | |
Watson Pharmaceuticals, Inc.2 | | | 29,700 | | | | 789,129 | |
| Wyeth | | | 34,125 | | | | 1,280,029 | |
| | | | | | | | |
| | | | | | | | 71,487,974 | |
| | | | | | | | | |
Industrials—14.1% | | | | | | | | |
Aerospace & Defense—3.7% | | | | | | | | |
BE Aerospace, Inc.2 | | | 82,800 | | | | 636,732 | |
| Boeing Co. | | | 155,700 | | | | 6,643,719 | |
Ceradyne, Inc.2 | | | 38,400 | | | | 779,904 | |
| Cubic Corp. | | | 8,500 | | | | 231,200 | |
DynCorp International, Inc., Cl. A2 | | | 1,500 | | | | 22,755 | |
Esterline Technologies Corp.2 | | | 32,500 | | | | 1,231,425 | |
| General Dynamics Corp. | | | 87,500 | | | | 5,039,125 | |
| Goodrich Corp. | | | 32,200 | | | | 1,192,044 | |
| Honeywell International, Inc. | | | 166,500 | | | | 5,466,195 | |
| L-3 Communications Holdings, Inc. | | | 52,900 | | | | 3,902,962 | |
| Lockheed Martin Corp. | | | 18,400 | | | | 1,547,072 | |
| Northrop Grumman Corp. | | | 250,700 | | | | 11,291,528 | |
Orbital Sciences Corp.2 | | | 19,500 | | | | 380,835 | |
| Precision Castparts Corp. | | | 47,400 | | | | 2,819,352 | |
| Raytheon Co. | | | 112,700 | | | | 5,752,208 | |
Spirit Aerosystems Holdings, Inc., Cl. A2 | | | 29,100 | | | | 295,947 | |
| Triumph Group, Inc. | | | 18,502 | | | | 785,595 | |
| United Technologies Corp. | | | 109,197 | | | | 5,852,959 | |
| | | | | | | | |
| | | | | | | | 53,871,557 | |
| | | | | | | | | |
Air Freight & Logistics—0.1% | | | | | | | | |
Hub Group, Inc., Cl. A2 | | | 17,400 | | | | 461,622 | |
| Pacer International, Inc. | | | 9,700 | | | | 101,171 | |
| UTi Worldwide, Inc. | | | 17,200 | | | | 246,648 | |
| | | | | | | | |
| | | | | | | | 809,441 | |
| | | | | | | | | |
Airlines—0.3% | | | | | | | | |
Alaska Air Group, Inc.2 | | | 16,800 | | | | 491,400 | |
Continental Airlines, Inc., Cl. B1,2 | | | 61,700 | | | | 1,114,302 | |
| SkyWest, Inc. | | | 41,500 | | | | 771,900 | |
| UAL Corp. | | | 87,600 | | | | 965,352 | |
US Airways Group, Inc.2 | | | 80,592 | | | | 622,976 | |
| | | | | | | | |
| | | | | | | | 3,965,930 | |
| | | | | | | | | |
Building Products—0.2% | | | | | | | | |
| Ameron International Corp. | | | 700 | | | | 44,044 | |
| Armstrong World Industries, Inc. | | | 23,700 | | | | 512,394 | |
| Lennox International, Inc. | | | 34,600 | | | | 1,117,234 | |
Owens Corning, Inc.2 | | | 43,900 | | | | 759,470 | |
| Simpson Manufacturing Co., Inc. | | | 5,400 | | | | 149,904 | |
| | | | | | | | |
| | | | | | | | 2,583,046 | |
| | | | | | | | | |
Commercial Services & Supplies—1.3% | | | | | | | | |
| Administaff, Inc. | | | 16,200 | | | | 351,216 | |
American Reprographics Co.2 | | | 4,200 | | | | 28,980 | |
| Brink’s Co. (The) | | | 20,000 | | | | 537,600 | |
Clean Harbors, Inc.2 | | | 6,000 | | | | 380,640 | |
Copart, Inc.2 | | | 18,600 | | | | 505,734 | |
| Corporate Executive Board Co. (The) | | | 18,900 | | | | 416,934 | |
CoStar Group, Inc.1,2 | | | 13,000 | | | | 428,220 | |
| Deluxe Corp. | | | 68,700 | | | | 1,027,752 | |
| EnergySolutions, Inc. | | | 2,600 | | | | 14,690 | |
| Equifax, Inc. | | | 37,800 | | | | 1,002,456 | |
First Advantage Corp., Cl. A2 | | | 4,394 | | | | 62,175 | |
HNI Corp.1 | | | 47,571 | | | | 753,525 | |
| Interface, Inc., Cl. A | | | 40,100 | | | | 186,064 | |
Korn-Ferry International2 | | | 60,900 | | | | 695,478 | |
M&F Worldwide Corp.2 | | | 1,000 | | | | 15,450 | |
| Manpower, Inc. | | | 34,300 | | | | 1,165,857 | |
| Miller (Herman), Inc. | | | 42,900 | | | | 558,987 | |
Monster Worldwide, Inc.1,2 | | | 109,700 | | | | 1,326,273 | |
MPS Group, Inc.1,2 | | | 124,800 | | | | 939,744 | |
Navigant Consulting, Inc.1,2 | | | 7,800 | | | | 123,786 | |
| Pitney Bowes, Inc. | | | 49,500 | | | | 1,261,260 | |
| R.R. Donnelley & Sons Co. | | | 73,100 | | | | 992,698 | |
Resources Connection, Inc.2 | | | 39,064 | | | | 639,868 | |
| Robert Half International, Inc. | | | 71,200 | | | | 1,482,384 | |
| Steelcase, Inc., Cl. A | | | 120,400 | | | | 676,648 | |
Sykes Enterprises, Inc.2 | | | 10,100 | | | | 193,112 | |
TrueBlue, Inc.2 | | | 21,800 | | | | 208,626 | |
United Stationers, Inc.2 | | | 8,800 | | | | 294,712 | |
| Viad Corp. | | | 5,200 | | | | 128,648 | |
| Waste Management, Inc. | | | 56,200 | | | | 1,862,468 | |
| Watson Wyatt & Co. Holdings | | | 21,100 | | | | 1,009,002 | |
| | | | | | | |
| | | | | | | | 19,270,987 | |
F7 | OPPENHEIMER MAIN STREET FUND/VA
STATEMENT OF INVESTMENTS Continued
| | | | | | | | | |
| | | Shares | | | Value | |
| |
Construction & Engineering—0.7% | | | | | | | | |
Aecom Technology Corp.2 | | | 1,218 | | | $ | 37,429 | |
| Chicago Bridge & Iron Co. NV | | | 70,200 | | | | 705,510 | |
EMCOR Group, Inc.2 | | | 70,300 | | | | 1,576,829 | |
Fluor Corp.1 | | | 85,700 | | | | 3,845,359 | |
| Granite Construction, Inc. | | | 26,800 | | | | 1,177,324 | |
| KBR, Inc. | | | 19,100 | | | | 290,320 | |
MasTec, Inc.2 | | | 41,800 | | | | 484,044 | |
Perini Corp.2 | | | 52,100 | | | | 1,218,098 | |
Shaw Group, Inc. (The)2 | | | 29,500 | | | | 603,865 | |
| | | | | | | | |
| | | | | | | | 9,938,778 | |
| | | | | | | | | |
Electrical Equipment—1.1% | | | | | | | | |
Acuity Brands, Inc.1 | | | 38,400 | | | | 1,340,544 | |
| Baldor Electric Co. | | | 60,900 | | | | 1,087,065 | |
| Belden, Inc. | | | 55,000 | | | | 1,148,400 | |
| Brady Corp., Cl. A | | | 12,400 | | | | 296,980 | |
| Cooper Industries Ltd., Cl. A | | | 22,700 | | | | 663,521 | |
| Emerson Electric Co. | | | 145,400 | | | | 5,323,094 | |
GrafTech International Ltd.2 | | | 152,400 | | | | 1,267,968 | |
| Hubbell, Inc., Cl. B | | | 22,500 | | | | 735,300 | |
Regal-Beloit Corp.1 | | | 5,200 | | | | 197,548 | |
| Rockwell Automation, Inc. | | | 35,300 | | | | 1,138,072 | |
| Roper Industries, Inc. | | | 9,700 | | | | 421,077 | |
| Smith (A.O.) Corp. | | | 21,600 | | | | 637,632 | |
Thomas & Betts Corp.2 | | | 35,700 | | | | 857,514 | |
| Woodward Governor Co. | | | 39,600 | | | | 911,592 | |
| | | | | | | | |
| | | | | | | | 16,026,307 | |
| | | | | | | | | |
Industrial Conglomerates—1.8% | | | | | | | | |
| 3M Co. | | | 77,200 | | | | 4,442,088 | |
| Carlisle Cos., Inc. | | | 4,800 | | | | 99,360 | |
| General Electric Co. | | | 1,278,500 | | | | 20,711,700 | |
McDermott International, Inc.2 | | | 14,700 | | | | 145,236 | |
| Tyco International Ltd. | | | 23,475 | | | | 507,060 | |
| | | | | | | | |
| | | | | | | | 25,905,444 | |
| | | | | | | | | |
Machinery—3.9% | | | | | | | | |
| Actuant Corp., Cl. A | | | 22,900 | | | | 435,558 | |
AGCO Corp.2 | | | 5,400 | | | | 127,386 | |
| Barnes Group, Inc. | | | 15,400 | | | | 223,300 | |
Briggs & Stratton Corp.1 | | | 27,700 | | | | 487,243 | |
| Bucyrus International, Inc., Cl. A | | | 42,600 | | | | 788,952 | |
| Caterpillar, Inc. | | | 216,500 | | | | 9,671,055 | |
Chart Industries, Inc.2 | | | 9,900 | | | | 105,237 | |
| CIRCOR International, Inc. | | | 15,500 | | | | 426,250 | |
| Crane Co. | | | 35,500 | | | | 612,020 | |
Cummins, Inc.1 | | | 213,875 | | | | 5,716,879 | |
| Deere & Co. | | | 43,100 | | | | 1,651,592 | |
| Dover Corp. | | | 51,900 | | | | 1,708,548 | |
| Eaton Corp. | | | 2,200 | | | | 109,362 | |
EnPro Industries, Inc.2 | | | 22,652 | | | | 487,924 | |
| Flowserve Corp. | | | 4,500 | | | | 231,750 | |
Gardner Denver, Inc.2 | | | 49,985 | | | | 1,166,650 | |
| Graco, Inc. | | | 29,300 | | | | 695,289 | |
| Harsco Corp. | | | 39,100 | | | | 1,082,288 | |
| IDEX Corp. | | | 40,700 | | | | 982,905 | |
| Illinois Tool Works, Inc. | | | 122,800 | | | | 4,304,140 | |
| Ingersoll-Rand Co. Ltd., Cl. A | | | 243,500 | | | | 4,224,725 | |
| Joy Global, Inc. | | | 34,000 | | | | 778,260 | |
| Kennametal, Inc. | | | 66,200 | | | | 1,468,978 | |
Lincoln Electric Holdings, Inc.1 | | | 22,300 | | | | 1,135,739 | |
| Manitowoc Co., Inc. (The) | | | 106,500 | | | | 922,290 | |
| Mueller Industries, Inc. | | | 34,400 | | | | 862,752 | |
Mueller Water Products, Inc., Cl. A1 | | | 58,900 | | | | 494,760 | |
Navistar International Corp.2 | | | 23,100 | | | | 493,878 | |
Nordson Corp.1 | | | 23,700 | | | | 765,273 | |
| Oshkosh Corp. | | | 80,300 | | | | 713,867 | |
| Parker-Hannifin Corp. | | | 203,800 | | | | 8,669,652 | |
| Robbins & Myers, Inc. | | | 35,200 | | | | 569,184 | |
| Sauer-Danfoss, Inc. | | | 1,700 | | | | 14,875 | |
Terex Corp.2 | | | 26,200 | | | | 453,784 | |
| Timken Co. | | | 76,600 | | | | 1,503,658 | |
Titan International, Inc.1 | | | 40,800 | | | | 336,600 | |
Toro Co. (The)1 | | | 36,600 | | | | 1,207,800 | |
Trinity Industries, Inc.1 | | | 59,900 | | | | 944,024 | |
| Wabtec Corp. | | | 1,700 | | | | 67,575 | |
Watts Water Technologies, Inc., Cl. A1 | | | 29,000 | | | | 724,130 | |
| | | | | | | | |
| | | | | | | | 57,366,132 | |
| | | | | | | | | |
Marine—0.1% | | | | | | | | |
Alexander & Baldwin, Inc.1 | | | 12,900 | | | | 323,274 | |
Excel Maritime Carriers Ltd.1 | | | 6,700 | | | | 47,168 | |
Genco Shipping & Trading Ltd.1 | | | 34,300 | | | | 507,640 | |
Kirby Corp.2 | | | 7,600 | | | | 207,936 | |
TBS International Ltd., Cl. A1,2 | | | 1,600 | | | | 16,048 | |
| | | | | | | | |
| | | | | | | | 1,102,066 | |
| | | | | | | | | |
Road & Rail—0.6% | | | | | | | | |
Amerco1,2 | | | 1,600 | | | | 55,248 | |
Arkansas Best Corp.1 | | | 35,100 | | | | 1,056,861 | |
F8 | OPPENHEIMER MAIN STREET FUND/VA
| | | | | | | | | |
| | | Shares | | | Value | |
| |
Road & Rail Continued | | | | | | | | |
Avis Budget Group, Inc.2 | | | 52,800 | | | $ | 36,960 | |
| CSX Corp. | | | 37,700 | | | | 1,224,119 | |
| Heartland Express, Inc. | | | 18,500 | | | | 291,560 | |
Hertz Global Holdings, Inc.1,2 | | | 139,800 | | | | 708,786 | |
Norfolk Southern Corp.1 | | | 108,800 | | | | 5,119,040 | |
Old Dominion Freight Line, Inc.2 | | | 1,200 | | | | 34,152 | |
| Ryder Systems, Inc. | | | 2,400 | | | | 93,072 | |
| Werner Enterprises, Inc. | | | 54,700 | | | | 948,498 | |
YRC Worldwide, Inc.1,2 | | | 28,300 | | | | 81,221 | |
| | | | | | | | |
| | | | | | | | 9,649,517 | |
| | | | | | | | | |
Trading Companies & Distributors—0.3% | | | | | | | | |
| Applied Industrial Technologies, Inc. | | | 27,900 | | | | 527,868 | |
| GATX Corp. | | | 12,700 | | | | 393,319 | |
MSC Industrial Direct Co., Inc., Cl. A1 | | | 26,800 | | | | 987,044 | |
RSC Holdings, Inc.2 | | | 10,700 | | | | 91,164 | |
| Textainer Group Holdings Ltd. | | | 5,200 | | | | 55,120 | |
United Rentals, Inc.1,2 | | | 100,412 | | | | 915,757 | |
Watsco, Inc.1 | | | 12,900 | | | | 495,360 | |
WESCO International, Inc.2 | | | 56,900 | | | | 1,094,187 | |
| | | | | | | | |
| | | | | | | | 4,559,819 | |
| | | | | | | | | |
Information Technology—22.8% | | | | | | | | |
Communications Equipment—3.2% | | | | | | | | |
3Com Corp.2 | | | 227,800 | | | | 519,384 | |
| ADTRAN, Inc. | | | 54,700 | | | | 813,936 | |
Avocent Corp.2 | | | 57,000 | | | | 1,020,870 | |
Brocade Communications Systems, Inc.2 | | | 315,100 | | | | 882,280 | |
Ciena Corp.1,2 | | | 93,300 | | | | 625,110 | |
Cisco Systems, Inc.2 | | | 1,400,100 | | | | 22,821,630 | |
CommScope, Inc.2 | | | 68,500 | | | | 1,064,490 | |
Comtech Telecommunications Corp.2 | | | 6,700 | | | | 306,994 | |
| Corning, Inc. | | | 210,300 | | | | 2,004,159 | |
EchoStar Holding Corp.1,2 | | | 31,660 | | | | 470,784 | |
Emulex Corp.2 | | | 128,200 | | | | 894,836 | |
F5 Networks, Inc.2 | | | 66,900 | | | | 1,529,334 | |
| Harris Corp. | | | 33,600 | | | | 1,278,480 | |
InterDigital, Inc.2 | | | 37,600 | | | | 1,034,000 | |
JDS Uniphase Corp.2 | | | 293,700 | | | | 1,072,005 | |
| Plantronics, Inc. | | | 69,400 | | | | 916,080 | |
Polycom, Inc.1,2 | | | 49,700 | | | | 671,447 | |
| QUALCOMM, Inc. | | | 183,800 | | | | 6,585,554 | |
Sonus Networks, Inc.2 | | | 4,400 | | | | 6,952 | |
Starent Networks Corp.2 | | | 6,700 | | | | 79,931 | |
Tekelec, Inc.2 | | | 50,700 | | | | 676,338 | |
Tellabs, Inc.2 | | | 322,300 | | | | 1,327,876 | |
ViaSat, Inc.2 | | | 3,800 | | | | 91,504 | |
| | | | | | | | |
| | | | | | | | 46,693,974 | |
| | | | | | | | | |
Computers & Peripherals—5.0% | | | | | | | | |
Apple, Inc.2 | | | 98,300 | | | | 8,389,905 | |
Avid Technology, Inc.2 | | | 15,700 | | | | 171,287 | |
Dell, Inc.2 | | | 80,900 | | | | 828,416 | |
Electronics for Imaging, Inc.2 | | | 22,300 | | | | 213,188 | |
EMC Corp.2 | | | 309,400 | | | | 3,239,418 | |
| Hewlett-Packard Co. | | | 670,700 | | | | 24,339,703 | |
Intermec, Inc.2 | | | 18,800 | | | | 249,664 | |
| International Business Machines Corp. | | | 295,500 | | | | 24,869,280 | |
Lexmark International, Inc., Cl. A1,2 | | | 48,300 | | | | 1,299,270 | |
NCR Corp.2 | | | 75,300 | | | | 1,064,742 | |
NetApp, Inc.2 | | | 46,300 | | | | 646,811 | |
QLogic Corp.2 | | | 114,000 | | | | 1,532,160 | |
SanDisk Corp.2 | | | 90,800 | | | | 871,680 | |
| Seagate Technology | | | 426,600 | | | | 1,889,838 | |
Sun Microsystems, Inc.2 | | | 236,300 | | | | 902,666 | |
Synaptics, Inc.1,2 | | | 44,500 | | | | 736,920 | |
Teradata Corp.2 | | | 52,900 | | | | 784,507 | |
Western Digital Corp.2 | | | 76,300 | | | | 873,635 | |
| | | | | | | | |
| | | | | | | | 72,903,090 | |
| | | | | | | | | |
Electronic Equipment & Instruments—1.2% | | | | | | | | |
Agilent Technologies, Inc.2 | | | 117,400 | | | | 1,834,962 | |
| Amphenol Corp., Cl. A | | | 34,700 | | | | 832,106 | |
Anixter International, Inc.1,2 | | | 26,100 | | | | 786,132 | |
Arrow Electronics, Inc.2 | | | 60,800 | | | | 1,145,472 | |
Avnet, Inc.2 | | | 67,200 | | | | 1,223,712 | |
| AVX Corp. | | | 28,200 | | | | 223,908 | |
Benchmark Electronics, Inc.2 | | | 83,200 | | | | 1,062,464 | |
Cogent, Inc.1,2 | | | 35,400 | | | | 480,378 | |
| Cognex Corp. | | | 11,500 | | | | 170,200 | |
Coherent, Inc.2 | | | 15,367 | | | | 329,776 | |
Dolby Laboratories, Inc., Cl. A2 | | | 23,300 | | | | 763,308 | |
Ingram Micro, Inc., Cl. A2 | | | 92,000 | | | | 1,231,880 | |
Itron, Inc.1,2 | | | 9,300 | | | | 592,782 | |
| Jabil Circuit, Inc. | | | 125,500 | | | | 847,125 | |
L-1 Identity Solutions, Inc.2 | | | 10,000 | | | | 67,400 | |
Littlefuse, Inc.2 | | | 500 | | | | 8,300 | |
| Molex, Inc. | | | 73,100 | | | | 1,059,219 | |
F9 | OPPENHEIMER MAIN STREET FUND/VA
STATEMENT OF INVESTMENTS Continued
| | | | | | | | | |
| | | Shares | | | Value | |
| |
Electronic Equipment & Instruments Continued | | | | | | | | |
| MTS Systems Corp. | | | 1,200 | | | $ | 31,968 | |
| National Instruments Corp. | | | 29,100 | | | | 708,876 | |
Plexus Corp.2 | | | 19,500 | | | | 330,525 | |
Rofin-Sinar Technologies, Inc.2 | | | 12,100 | | | | 249,018 | |
ScanSource, Inc.2 | | | 2,800 | | | | 53,956 | |
SYNNEX Corp.1,2 | | | 14,100 | | | | 159,753 | |
Tech Data Corp.2 | | | 18,975 | | | | 338,514 | |
| Technitrol, Inc. | | | 5,700 | | | | 19,836 | |
Trimble Navigation Ltd.2 | | | 53,800 | | | | 1,162,618 | |
| Tyco Electronics Ltd. | | | 78,200 | | | | 1,267,622 | |
Vishay Intertechnology, Inc.2 | | | 190,100 | | | | 650,142 | |
| | | | | | | | |
| | | | | | | | 17,631,952 | |
| | | | | | | | | |
Internet Software & Services—0.9% | | | | | | | | |
Akamai Technologies, Inc.1,2 | | | 67,100 | | | | 1,012,539 | |
Digital River, Inc.2 | | | 43,200 | | | | 1,071,360 | |
EarthLink, Inc.2 | | | 95,900 | | | | 648,284 | |
eBay, Inc.2 | | | 162,700 | | | | 2,271,292 | |
Google, Inc., Cl. A2 | | | 12,500 | | | | 3,845,625 | |
IAC/InterActiveCorp2 | | | 1,325 | | | | 20,842 | |
j2 Global Communications, Inc.1,2 | | | 57,800 | | | | 1,158,312 | |
Open Text Corp.1,2 | | | 22,400 | | | | 674,912 | |
RealNetworks, Inc.2 | | | 8,500 | | | | 30,005 | |
Sohu.com, Inc.2 | | | 16,200 | | | | 766,908 | |
ValueClick, Inc.2 | | | 94,900 | | | | 649,116 | |
VeriSign, Inc.2 | | | 51,400 | | | | 980,712 | |
VistaPrint Ltd.1,2 | | | 12,500 | | | | 232,625 | |
WebMD Health Corp., Cl. A2 | | | 300 | | | | 7,077 | |
| | | | | | | | |
| | | | | | | | 13,369,609 | |
| | | | | | | | | |
IT Services—0.9% | | | | | | | | |
| Acxiom Corp. | | | 87,900 | | | | 712,869 | |
Affiliated Computer Services, Inc., Cl. A2 | | | 5,200 | | | | 238,940 | |
| Broadridge Financial Solutions, Inc. | | | 69,400 | | | | 870,276 | |
Computer Sciences Corp.1,2 | | | 44,900 | | | | 1,577,786 | |
Convergys Corp.2 | | | 155,100 | | | | 994,191 | |
CSG Systems International, Inc.2 | | | 25,300 | | | | 441,991 | |
DST Systems, Inc.1,2 | | | 18,200 | | | | 691,236 | |
Euronet Worldwide, Inc.1,2 | | | 1,100 | | | | 12,771 | |
| Fidelity National Information Services, Inc. | | | 24,600 | | | | 400,242 | |
Gartner, Inc.1,2 | | | 37,600 | | | | 670,408 | |
Heartland Payment Systems, Inc.1 | | | 6,700 | | | | 117,250 | |
Hewitt Associates, Inc.2 | | | 28,700 | | | | 814,506 | |
NeuStar, Inc., Cl. A2 | | | 38,400 | | | | 734,592 | |
Perot Systems Corp., Cl. A2 | | | 68,900 | | | | 941,863 | |
Sapient Corp.2 | | | 85,100 | | | | 377,844 | |
| Syntel, Inc. | | | 3,500 | | | | 80,920 | |
TeleTech Holdings, Inc.2 | | | 47,100 | | | | 393,285 | |
| Total System Services, Inc. | | | 60,500 | | | | 847,000 | |
Unisys Corp.2 | | | 110,400 | | | | 93,840 | |
| Western Union Co. | | | 161,800 | | | | 2,320,212 | |
| | | | | | | | |
| | | | | | | | 13,332,022 | |
| | | | | | | | | |
Office Electronics—0.7% | | | | | | | | |
| Xerox Corp. | | | 1,147,200 | | | | 9,143,184 | |
Zebra Technologies Corp., Cl. A2 | | | 50,200 | | | | 1,017,052 | |
| | | | | | | | |
| | | | | | | | 10,160,236 | |
| | | | | | | | | |
Semiconductors & Semiconductor Equipment—5.0% | | | | | | | | |
Advanced Micro Devices, Inc.1,2 | | | 21,600 | | | | 46,656 | |
Altera Corp.1 | | | 103,800 | | | | 1,734,498 | |
Amkor Technology, Inc.2 | | | 197,172 | | | | 429,835 | |
| Analog Devices, Inc. | | | 81,300 | | | | 1,546,326 | |
| Applied Materials, Inc. | | | 886,100 | | | | 8,976,193 | |
Atheros Communications, Inc.1,2 | | | 48,900 | | | | 699,759 | |
Atmel Corp.2 | | | 167,700 | | | | 524,901 | |
Broadcom Corp., Cl. A2 | | | 109,700 | | | | 1,861,609 | |
Cabot Microelectronics Corp.1,2 | | | 13,300 | | | | 346,731 | |
Cymer, Inc.2 | | | 24,276 | | | | 531,887 | |
Entegris, Inc.2 | | | 31,300 | | | | 68,547 | |
Fairchild Semiconductor International, Inc., Cl. A2 | | | 163,200 | | | | 798,048 | |
FEI Co.2 | | | 7,500 | | | | 141,450 | |
Integrated Device Technology, Inc.2 | | | 189,200 | | | | 1,061,412 | |
| Intel Corp. | | | 1,632,500 | | | | 23,932,450 | |
International Rectifier Corp.2 | | | 30,100 | | | | 406,350 | |
| Intersil Corp., Cl. A | | | 97,600 | | | | 896,944 | |
| KLA-Tencor Corp. | | | 56,600 | | | | 1,233,314 | |
LSI Corp.2 | | | 303,600 | | | | 998,844 | |
Marvell Technology Group Ltd.2 | | | 161,600 | | | | 1,077,872 | |
MEMC Electronic Materials, Inc.2 | | | 70,900 | | | | 1,012,452 | |
Microsemi Corp.2 | | | 18,100 | | | | 228,784 | |
MKS Instruments, Inc.2 | | | 60,400 | | | | 893,316 | |
| National Semiconductor Corp. | | | 70,500 | | | | 709,935 | |
Novellus Systems, Inc.2 | | | 80,200 | | | | 989,668 | |
NVIDIA Corp.2 | | | 137,800 | | | | 1,112,046 | |
ON Semiconductor Corp.2 | | | 72,800 | | | | 247,520 | |
PMC-Sierra, Inc.2 | | | 167,600 | | | | 814,536 | |
| Power Integrations, Inc. | | | 4,200 | | | | 83,496 | |
F10 | OPPENHEIMER MAIN STREET FUND/VA
| | | | | | | | | |
| | | Shares | | | Value | |
| |
Semiconductors & Semiconductor Equipment Continued | | | | | | | | |
RF Micro Devices, Inc.2 | | | 76,800 | | | $ | 59,904 | |
Semtech Corp.2 | | | 81,700 | | | | 920,759 | |
Silicon Laboratories, Inc.1,2 | | | 43,600 | | | | 1,080,408 | |
Skyworks Solutions, Inc.1,2 | | | 82,900 | | | | 459,266 | |
Teradyne, Inc.2 | | | 237,100 | | | | 1,000,562 | |
Tessera Technologies, Inc.2 | | | 18,500 | | | | 219,780 | |
| Texas Instruments, Inc. | | | 861,700 | | | | 13,373,584 | |
Varian Semiconductor Equipment Associates, Inc.2 | | | 33,500 | | | | 607,020 | |
Verigy Ltd.2 | | | 39,000 | | | | 375,180 | |
| Xilinx, Inc. | | | 70,200 | | | | 1,250,964 | |
| | | | | | | | |
| | | | | | | | 72,752,806 | |
| | | | | | | | | |
Software—5.9% | | | | | | | | |
Adobe Systems, Inc.2 | | | 25,400 | | | | 540,766 | |
Advent Software, Inc.1,2 | | | 3,300 | | | | 65,901 | |
Amdocs Ltd.2 | | | 71,200 | | | | 1,302,248 | |
Ansys, Inc.2 | | | 24,900 | | | | 694,461 | |
Autodesk, Inc.2 | | | 67,900 | | | | 1,334,235 | |
| Blackbaud, Inc. | | | 600 | | | | 8,100 | |
BMC Software, Inc.2 | | | 18,400 | | | | 495,144 | |
CA, Inc.1 | | | 181,900 | | | | 3,370,607 | |
Cadence Design Systems, Inc.2 | | | 210,700 | | | | 771,162 | |
Check Point Software Technologies Ltd.2 | | | 30,000 | | | | 569,700 | |
Citrix Systems, Inc.2 | | | 47,500 | | | | 1,119,575 | |
Compuware Corp.2 | | | 180,500 | | | | 1,218,375 | |
Concur Technologies, Inc.1,2 | | | 11,700 | | | | 383,994 | |
FactSet Research Systems, Inc.1 | | | 18,800 | | | | 831,712 | |
| Fair Isaac Corp. | | | 65,100 | | | | 1,097,586 | |
| Henry (Jack) & Associates, Inc. | | | 23,600 | | | | 458,076 | |
Informatica Corp.2 | | | 34,300 | | | | 470,939 | |
Lawson Software, Inc.2 | | | 48,800 | | | | 231,312 | |
Mentor Graphics Corp.2 | | | 37,100 | | | | 191,807 | |
MICROS Systems, Inc.2 | | | 33,400 | | | | 545,088 | |
| Microsoft Corp. | | | 1,673,700 | | | | 32,536,728 | |
MicroStrategy, Inc., Cl. A2 | | | 2,200 | | | | 81,686 | |
Net 1 UEPS Technologies, Inc.2 | | | 35,900 | | | | 491,830 | |
Nuance Communications, Inc.2 | | | 79,200 | | | | 820,512 | |
Oracle Corp.2 | | | 813,267 | | | | 14,419,224 | |
Parametric Technology Corp.2 | | | 88,400 | | | | 1,118,260 | |
Progress Software Corp.2 | | | 18,100 | | | | 348,606 | |
Quest Software, Inc.2 | | | 66,200 | | | | 833,458 | |
Solera Holdings, Inc.2 | | | 12,300 | | | | 296,430 | |
Sybase, Inc.2 | | | 50,000 | | | | 1,238,500 | |
Symantec Corp.1,2 | | | 1,007,800 | | | | 13,625,456 | |
Synopsys, Inc.2 | | | 61,500 | | | | 1,138,980 | |
| Take-Two Interactive Software, Inc. | | | 65,800 | | | | 497,448 | |
THQ, Inc.2 | | | 15,900 | | | | 66,621 | |
TIBCO Software, Inc.2 | | | 218,400 | | | | 1,133,496 | |
Wind River Systems, Inc.2 | | | 76,700 | | | | 692,601 | |
| | | | | | | | |
| | | | | | | | 85,040,624 | |
| | | | | | | | | |
Materials—5.5% | | | | | | | | |
Chemicals—1.7% | | | | | | | | |
| Air Products & Chemicals, Inc. | | | 8,900 | | | | 447,403 | |
| Ashland, Inc. | | | 90,258 | | | | 948,612 | |
| Cabot Corp. | | | 8,000 | | | | 122,400 | |
| Celanese Corp., Series A | | | 52,500 | | | | 652,575 | |
| CF Industries Holdings, Inc. | | | 18,700 | | | | 919,292 | |
| Chemtura Corp. | | | 161,700 | | | | 226,380 | |
| Cytec Industries, Inc. | | | 25,100 | | | | 532,622 | |
| Dow Chemical Co. (The) | | | 66,500 | | | | 1,003,485 | |
| E.I. du Pont de Nemours & Co. | | | 27,900 | | | | 705,870 | |
| Eastman Chemical Co. | | | 23,000 | | | | 729,330 | |
| Ferro Corp. | | | 28,200 | | | | 198,810 | |
| Fuller (H.B.) Co. | | | 46,600 | | | | 750,726 | |
| Koppers Holdings, Inc. | | | 9,300 | | | | 201,066 | |
| Minerals Technologies, Inc. | | | 15,800 | | | | 646,220 | |
| Monsanto Co. | | | 67,700 | | | | 4,762,695 | |
| Mosaic Co. (The) | | | 197,900 | | | | 6,847,340 | |
Nalco Holding Co.1 | | | 51,600 | | | | 595,464 | |
| NewMarket Corp. | | | 10,000 | | | | 349,100 | |
| NOVA Chemicals Corp. | | | 56,200 | | | | 268,074 | |
| Olin Corp. | | | 28,700 | | | | 518,896 | |
OM Group, Inc.2 | | | 1,200 | | | | 25,332 | |
Rockwood Holdings, Inc.2 | | | 24,000 | | | | 259,200 | |
| RPM International, Inc. | | | 56,000 | | | | 744,240 | |
| Scotts Miracle-Gro Co. (The), Cl. A | | | 15,700 | | | | 466,604 | |
| Terra Industries, Inc. | | | 55,300 | | | | 921,851 | |
Valhi, Inc.1 | | | 3,000 | | | | 32,100 | |
| Valspar Corp. (The) | | | 42,000 | | | | 759,780 | |
W.R. Grace & Co.2 | | | 6,400 | | | | 38,208 | |
Westlake Chemical Corp.1 | | | 20,200 | | | | 329,058 | |
| | | | | | | | |
| | | | | | | | 25,002,733 | |
| | | | | | | | | |
Containers & Packaging—0.4% | | | | | | | | |
Owens-Illinois, Inc.2 | | | 53,800 | | | | 1,470,354 | |
| Packaging Corp. of America | | | 25,700 | | | | 345,922 | |
| Rock-Tenn Co., Cl. A | | | 17,900 | | | | 611,822 | |
| Sealed Air Corp. | | | 64,900 | | | | 969,606 | |
F11 | OPPENHEIMER MAIN STREET FUND/VA
STATEMENT OF INVESTMENTS Continued
| | | | | | | | | |
| | | Shares | | | Value | |
| |
Containers & Packaging Continued | | | | | | | | |
Smurfit-Stone Container Corp.2 | | | 123,300 | | | $ | 31,442 | |
| Sonoco Products Co. | | | 43,000 | | | | 995,880 | |
Temple-Inland, Inc.1 | | | 161,300 | | | | 774,240 | |
| | | | | | | | |
| | | | | | | | 5,199,266 | |
| | | | | | | | | |
Metals & Mining—3.2% | | | | | | | | |
| AK Steel Holding Corp. | | | 112,900 | | | | 1,052,228 | |
Alcoa, Inc.1 | | | 714,800 | | | | 8,048,648 | |
| Allegheny Technologies, Inc. | | | 34,200 | | | | 873,126 | |
| Carpenter Technology Corp. | | | 56,600 | | | | 1,162,564 | |
Century Aluminum Co.1,2 | | | 62,200 | | | | 622,000 | |
| Commercial Metals Co. | | | 77,400 | | | | 918,738 | |
| Compass Minerals International, Inc. | | | 4,900 | | | | 287,434 | |
Freeport-McMoRan Copper & Gold, Inc., Cl. B1 | | | 292,900 | | | | 7,158,476 | |
| Kaiser Aluminum Corp. | | | 9,000 | | | | 202,680 | |
| Nucor Corp. | | | 239,000 | | | | 11,041,800 | |
| Olympic Steel, Inc. | | | 2,500 | | | | 50,925 | |
| Reliance Steel & Aluminum Co. | | | 43,200 | | | | 861,408 | |
RTI International Metals, Inc.1,2 | | | 1,700 | | | | 24,327 | |
Schnitzer Steel Industries, Inc.1 | | | 32,600 | | | | 1,227,390 | |
Southern Copper Corp.1 | | | 669,500 | | | | 10,752,170 | |
| United States Steel Corp. | | | 39,600 | | | | 1,473,120 | |
Worthington Industries, Inc.1 | | | 47,400 | | | | 522,348 | |
| | | | | | | | |
| | | | | | | | 46,279,382 | |
| | | | | | | | | |
Paper & Forest Products—0.2% | | | | | | | | |
Domtar Corp.2 | | | 369,000 | | | | 616,230 | |
| International Paper Co. | | | 148,900 | | | | 1,757,020 | |
| Louisiana-Pacific Corp. | | | 28,900 | | | | 45,084 | |
| MeadWestvaco Corp. | | | 31,100 | | | | 348,009 | |
| | | | | | | | |
| | | | | | | | 2,766,343 | |
| | | | | | | | | |
Telecommunication Services—3.3% | | | | | | | | |
Diversified Telecommunication Services—2.9% | | | | | | | | |
| AT&T, Inc. | | | 866,128 | | | | 24,684,648 | |
Cincinnati Bell, Inc.2 | | | 108,300 | | | | 209,019 | |
| Embarq Corp. | | | 50,200 | | | | 1,805,192 | |
Global Crossing Ltd.2 | | | 7,800 | | | | 61,932 | |
| NTELOS Holdings Corp. | | | 25,000 | | | | 616,500 | |
Premiere Global Services, Inc.2 | | | 30,500 | | | | 262,605 | |
Qwest Communications International, Inc.1 | | | 375,200 | | | | 1,365,728 | |
tw telecom, Inc.2 | | | 107,800 | | | | 913,066 | |
| Verizon Communications, Inc. | | | 334,656 | | | | 11,344,838 | |
| Windstream Corp. | | | 122,100 | | | | 1,123,320 | |
| | | | | | | | |
| | | | | | | | 42,386,848 | |
| | | | | | | | | |
Wireless Telecommunication Services—0.4% | | | | | | | | |
Centennial Communications Corp.2 | | | 35,800 | | | | 288,548 | |
NII Holdings, Inc.2 | | | 44,500 | | | | 809,010 | |
Sprint Nextel Corp.2 | | | 951,023 | | | | 1,740,372 | |
Syniverse Holdings, Inc.2 | | | 49,000 | | | | 585,060 | |
| Telephone & Data Systems, Inc. | | | 42,300 | | | | 1,343,025 | |
United States Cellular Corp.2 | | | 16,800 | | | | 726,432 | |
| | | | | | | | |
| | | | | | | | 5,492,447 | |
| | | | | | | | | |
Utilities—0.6% | | | | | | | | |
Electric Utilities—0.3% | | | | | | | | |
| Duke Energy Corp. | | | 269,500 | | | | 4,045,195 | |
| UniSource Energy Corp. | | | 17,400 | | | | 510,864 | |
| | | | | | | | |
| | | | | | | | 4,556,059 | |
| | | | | | | | | |
Energy Traders—0.1% | | | | | | | | |
Mirant Corp.2 | | | 40,900 | | | | 771,783 | |
Reliant Energy, Inc.2 | | | 104,400 | | | | 603,432 | |
| | | | | | | | |
| | | | | | | | 1,375,215 | |
| | | | | | | | | |
Gas Utilities—0.1% | | | | | | | | |
| Laclede Group, Inc. (The) | | | 10,900 | | | | 510,556 | |
| South Jersey Industries, Inc. | | | 300 | | | | 11,955 | |
| Southwest Gas Corp. | | | 9,700 | | | | 244,634 | |
| WGL Holdings, Inc. | | | 10,900 | | | | 356,321 | |
| | | | | | | | |
| | | | | | | | 1,123,466 | |
| | | | | | | | | |
Multi-Utilities—0.1% | | | | | | | | |
| Avista Corp. | | | 37,000 | | | | 717,060 | |
| CH Energy Group, Inc. | | | 2,700 | | | | 138,753 | |
| Integrys Energy Group, Inc. | | | 8,100 | | | | 348,139 | |
| | | | | | | | |
| | | | | | | | 1,203,952 | |
| | | | | | | | |
Total Common Stocks
(Cost $1,817,887,648) | | | | | | | 1,441,273,187 | |
| | | | | | | | | |
Other Securities—0.0% | | | | | | | | |
Seagate Technology International, Inc.2,3,4 (Cost $0) | | | 31,000 | | | | 3,100 | |
| | | | | | | | | |
Preferred Stocks—0.0% | | | | | | | | |
Wachovia Corp., Dividend Equalization Preferred Shares2,3 (Cost $0) | | | 6,000 | | | | 8 | |
| | | | | | | | | |
| | | Units | | | | | |
| |
Rights, Warrants and Certificates—0.0% | | | | | | | | |
Dime Bancorp, Inc. Wts., Strike Price $1, Exp. 1/2/102 | | | 31,900 | | | | 638 | |
Progress Energy, Inc., Contingent Value Obligation2,3 | | | 32,000 | | | | 10,560 | |
| | | | | | | | |
| Total Rights, Warrants and Certificates (Cost $0) | | | | | | | 11,198 | |
F12 | OPPENHEIMER MAIN STREET FUND/VA
| | | | | | | | | |
| | | Shares | | | Value | |
| |
Investment Company—0.5% | | | | | | | | |
Oppenheimer Institutional Money Market Fund, Cl. E, 1.96%5,6 (Cost $7,043,996) | | | 7,043,996 | | | $ | 7,043,996 | |
| Total Investments, at Value (excluding Investments Purchased with Cash Collateral from Securities Loaned) (Cost $1,824,931,644) | | | | | | | 1,448,331,489 | |
| |
| | | Principal | | | | |
| | | Amount/Shares | | | | |
| |
Investments Purchased with Cash Collateral from Securities Loaned—7.2%7 | | | | | | | | |
| ANZ National (Int’l) Ltd., 0.34%, 3/6/09 | | $ | 4,000,000 | | | | 3,999,064 | |
| CAM US Finance SA Unipersonal, 3.24%, 2/2/09 | | | 4,500,000 | | | | 4,493,547 | |
| CC USA, Inc., 0.35%, 2/13/09 | | | 1,500,000 | | | | 1,492,944 | |
| GSAA Home Equity Trust, Series 2005-15, Cl. 2A1, 0.56%, 1/26/09 | | | 510,456 | | | | 451,277 | |
OFI Liquid Assets Fund, LLC, 1.71% 5,6 | | | 93,229,008 | | | | 93,229,008 | |
| | | | | | | | |
| | | | | | | | | |
Total Investments Purchased with Cash Collateral from Securities Loaned
(Cost $103,739,160) | | | | | | | 103,665,840 | |
| | | | | | | | | |
Total Investments, at Value (Cost $1,928,670,804) | | | 106.9 | % | | | 1,551,997,329 | |
Liabilities in Excess of Other Assets | | | (6.9 | ) | | | (99,534,290 | ) |
| | | |
Net Assets | | | 100.0 | % | | $ | 1,452,463,039 | |
| | | |
Industry classifications are unaudited.
| | |
| |
| Footnotes to Statement of Investments |
| |
| 1. | | Partial or fully-loaned security. See Note 6 of accompanying Notes.
|
| |
| 2. | | Non-income producing security. |
| |
| 3. | | Illiquid security. The aggregate value of illiquid securities as of December 31, 2008 was $13,668, which represents less than 0.005% of the Fund’s net assets. See Note 5 of accompanying Notes. |
| |
| 4. | | Escrow shares received as the result of issuer reorganization. |
| |
| 5. | | Is or was an affiliate, as defined in the Investment Company Act of 1940, at or during the period ended December 31, 2008, by virtue of the Fund owning at least 5% of the voting securities of the issuer or as a result of the Fund and the issuer having the same investment adviser. Transactions during the period in which the issuer was an affiliate are as follows: |
| | | | | | | | | | | | | | | | | |
| | | Shares | | | Gross | | | Gross | | | Shares | |
| | | December 31, 2007 | | | Additions | | | Reductions | | | December 31, 2008 | |
| |
| OFI Liquid Assets Fund, LLC | | | — | | | | 880,960,875 | | | | 787,731,867 | | | | 93,229,008 | |
| Oppenheimer Institutional Money Market Fund, Cl. E | | | 15,628,720 | | | | 535,769,480 | | | | 544,354,204 | | | | 7,043,996 | |
| |
| | | | | | | | | | | Value | | | Income | |
| |
| OFI Liquid Assets Fund, LLC | | | | | | | | | | $ | 93,229,008 | | | $ | 855,830 | a |
| Oppenheimer Institutional Money Market Fund, Cl. E | | | | | | | | | | | 7,043,996 | | | | 363,249 | |
| | | | | | | | | | | |
| | | | | | | | | | | $ | 100,273,004 | | | $ | 1,219,079 | |
| | | | | | | | | | | |
| | |
| |
| a. | | Net of compensation to the securities lending agent and rebates paid to the borrowing counterparties. |
| |
| 6. | | Rate shown is the 7-day yield as of December 31, 2008. |
| |
| 7. | | The security/securities have been segregated to satisfy the forward commitment to return the cash collateral received in securities lending transactions upon the borrower’s return of the securities loaned. See Note 6 of accompanying Notes. |
F13 | OPPENHEIMER MAIN STREET FUND/VA
STATEMENT OF INVESTMENTS Continued
Valuation Inputs
Various data inputs are used in determining the value of each of the Fund’s investments as of the reporting period end. These data inputs are categorized in the following hierarchy under applicable financial accounting standards:
1) Level 1—quoted prices in active markets for identical assets or liabilities (including securities actively traded on a securities exchange)
2) Level 2—inputs other than quoted prices that are observable for the asset (such as quoted prices for similar assets and market corroborated inputs such as interest rates, prepayment speeds, credit risks, etc.)
3) Level 3—unobservable inputs (including the Manager’s own judgments about assumptions that market participants would use in pricing the asset).
The market value of the Fund’s investments was determined based on the following inputs as of December 31, 2008:
| | | | | | | | | |
| | | Investments in | | | Other Financial | |
| Valuation Description | | Securities | | | Instruments* | |
| |
| Level 1—Quoted Prices | | $ | 1,541,546,199 | | | $ | — | |
| Level 2—Other Significant Observable Inputs | | | 10,451,130 | | | | — | |
| Level 3—Significant Unobservable Inputs | | | — | | | | — | |
| | | |
| Total | | $ | 1,551,997,329 | | | $ | — | |
| | | |
| | |
| * | | Other financial instruments include options written, currency contracts, futures, forwards and swap contracts. Currency contracts and forwards are reported at their unrealized appreciation/depreciation at measurement date, which represents the change in the contract’s value from trade date. Futures are reported at their variation margin at measurement date, which represents the amount due to/from the Fund at that date. Options written and swaps are reported at their market value at measurement date. |
See the accompanying Notes for further discussion of the methods used in determining value of the Fund’s investments, and a summary of changes to the valuation techniques, if any, during the reporting period.
See accompanying Notes to Financial Statements.
F14 | OPPENHEIMER MAIN STREET FUND/VA
STATEMENT OF ASSETS AND LIABILITIES December 31, 2008
| | | | | |
Assets | | | | |
| Investments, at value—see accompanying statement of investments: | | | | |
| Unaffiliated companies (cost $1,828,397,800) | | $ | 1,451,724,325 | |
| Affiliated companies (cost $100,273,004) | | | 100,273,004 | |
| | | | |
| | | | 1,551,997,329 | |
| Cash | | | 1,934,570 | |
| Receivables and other assets: | | | | |
| Dividends | | | 2,240,977 | |
| Investments sold | | | 1,155,974 | |
| Due from Manager | | | 19 | |
| Other | | | 236,560 | |
| | | | |
| Total assets | | | 1,557,565,429 | |
| | | | | |
Liabilities | | | | |
| Return of collateral for securities loaned | | | 103,600,720 | |
| Payables and other liabilities: | | | | |
| Shares of beneficial interest redeemed | | | 721,396 | |
| Distribution and service plan fees | | | 597,492 | |
| Shareholder communications | | | 86,063 | |
| Investments purchased | | | 32,123 | |
| Trustees’ compensation | | | 13,276 | |
| Transfer and shareholder servicing agent fees | | | 1,720 | |
| Other | | | 49,600 | |
| | | | |
| Total liabilities | | | 105,102,390 | |
| | | | | |
Net Assets | | $ | 1,452,463,039 | |
| | | | |
| | | | | |
Composition of Net Assets | | | | |
| Par value of shares of beneficial interest | | $ | 100,405 | |
| Additional paid-in capital | | | 2,086,211,841 | |
| Accumulated net investment income | | | 24,769,636 | |
| Accumulated net realized loss on investments | | | (281,945,368 | ) |
| Net unrealized depreciation on investments | | | (376,673,475 | ) |
| | | | |
Net Assets | | $ | 1,452,463,039 | |
| | | | |
| | | | | |
Net Asset Value Per Share | | | | |
| Non-Service Shares: | | | | |
| Net asset value, redemption price per share and offering price per share (based on net assets of $432,360,158 and 29,686,094 shares of beneficial interest outstanding) | | $ | 14.56 | |
| Service Shares: | | | | |
| Net asset value, redemption price per share and offering price per share (based on net assets of $1,020,102,881 and 70,718,803 shares of beneficial interest outstanding) | | $ | 14.42 | |
See accompanying Notes to Financial Statements.
F15 | OPPENHEIMER MAIN STREET FUND/VA
STATEMENT OF OPERATIONS For the Year Ended December 31, 2008
| | | | | |
Investment Income | | | | |
| Dividends: | | | | |
| Unaffiliated companies (net of foreign withholding taxes of $2,950) | | $ | 38,981,517 | |
| Affiliated companies | | | 363,249 | |
| Income from investment of securities lending cash collateral, net: | | | | |
| Unaffiliated companies | | | 527,756 | |
| Affiliated companies | | | 855,830 | |
| Interest | | | 26,476 | |
| | | | |
| Total investment income | | | 40,754,828 | |
| | | | | |
Expenses | | | | |
| Management fees | | | 12,491,552 | |
| Distribution and service plan fees—Service shares | | | 3,174,088 | |
| Transfer and shareholder servicing agent fees: | | | | |
| Non-Service shares | | | 9,994 | |
| Service shares | | | 9,994 | |
| Shareholder communications: | | | | |
| Non-Service shares | | | 53,996 | |
| Service shares | | | 112,985 | |
| Trustees’ compensation | | | 46,079 | |
| Custodian fees and expenses | | | 11,848 | |
| Other | | | 83,054 | |
| | | | |
| Total expenses | | | 15,993,590 | |
| Less reduction to custodian expenses | | | (857 | ) |
| Less waivers and reimbursements of expenses | | | (11,091 | ) |
| | | | |
| Net expenses | | | 15,981,642 | |
| | | | | |
Net Investment Income | | | 24,773,186 | |
| | | | | |
Realized and Unrealized Loss | | | | |
| Net realized loss on investments from unaffiliated companies | | | (267,651,680 | ) |
| Net change in unrealized depreciation on investments | | | (632,729,270 | ) |
| | | | | |
Net Decrease in Net Assets Resulting from Operations | | $ | (875,607,764 | ) |
| | | | |
See accompanying Notes to Financial Statements.
F16 | OPPENHEIMER MAIN STREET FUND/VA
STATEMENTS OF CHANGES IN NET ASSETS
| | | | | | | | | |
| Year Ended December 31, | | 2008 | | | 2007 | |
| |
Operations | | | | | | | | |
| Net investment income | | $ | 24,773,186 | | | $ | 26,378,059 | |
| Net realized gain (loss) | | | (267,651,680 | ) | | | 194,658,587 | |
| Net change in unrealized appreciation (depreciation) | | | (632,729,270 | ) | | | (129,622,213 | ) |
| | | |
| Net increase (decrease) in net assets resulting from operations | | | (875,607,764 | ) | | | 91,414,433 | |
| | | | | | | | | |
Dividends and/or Distributions to Shareholders | | | | | | | | |
| Dividends from net investment income: | | | | | | | | |
| Non-Service shares | | | (10,725,797 | ) | | | (10,356,753 | ) |
| Service shares | | | (15,635,174 | ) | | | (9,852,371 | ) |
| | | |
| | | | (26,360,971 | ) | | | (20,209,124 | ) |
| Distributions from net realized gain: | | | | | | | | |
| Non-Service shares | | | (46,604,473 | ) | | | — | |
| Service shares | | | (82,181,746 | ) | | | — | |
| | | |
| | | | (128,786,219 | ) | | | — | |
| | | | | | | | | |
Beneficial Interest Transactions | | | | | | | | |
| Net increase (decrease) in net assets resulting from beneficial interest transactions: | | | | | | | | |
| Non-Service shares | | | (112,358,225 | ) | | | (175,658,859 | ) |
| Service shares | | | 223,159,438 | | | | 331,431,603 | |
| | | |
| | | | 110,801,213 | | | | 155,772,744 | |
| | | | | | | | | |
Net Assets | | | | | | | | |
| Total increase (decrease) | | | (919,953,741 | ) | | | 226,978,053 | |
| Beginning of period | | | 2,372,416,780 | | | | 2,145,438,727 | |
| | | |
| End of period (including accumulated net investment income of $24,769,636 and $26,296,748, respectively) | | $ | 1,452,463,039 | | | $ | 2,372,416,780 | |
| | | |
See accompanying Notes to Financial Statements.
F17 | OPPENHEIMER MAIN STREET FUND/VA
FINANCIAL HIGHLIGHTS
| | | | | | | | | | | | | | | | | | | | | |
| Non-Service Shares Year Ended December 31, | | 2008 | | | 2007 | | | 2006 | | | 2005 | | | 2004 | |
| |
Per Share Operating Data | | | | | | | | | | | | | | | | | | | | |
| Net asset value, beginning of period | | $ | 25.61 | | | $ | 24.78 | | | $ | 21.79 | | | $ | 20.84 | | | $ | 19.20 | |
| Income (loss) from investment operations: | | | | | | | | | | | | | | | | | | | | |
Net investment income1 | | | .29 | | | | .33 | | | | .27 | | | | .26 | | | | .27 | |
| Net realized and unrealized gain (Loss) | | | (9.64 | ) | | | .75 | | | | 2.98 | | | | .97 | | | | 1.53 | |
| | | |
| Total from investment operations | | | (9.35 | ) | | | 1.08 | | | | 3.25 | | | | 1.23 | | | | 1.80 | |
| Dividends and/or distributions to shareholders: | | | | | | | | | | | | | | | | | | | | |
| Dividends from net investment income | | | (.32 | ) | | | (.25 | ) | | | (.26 | ) | | | (.28 | ) | | | (.16 | ) |
| Distributions from net realized gain | | | (1.38 | ) | | | — | | | | — | | | | — | | | | — | |
| | | |
| Total dividends and/or distributions to shareholders | | (1.70 | ) | | | (.25 | ) | | | (.26 | ) | | | (.28 | ) | | | (.16 | ) |
| Net asset value, end of period | | $ | 14.56 | | | $ | 25.61 | | | $ | 24.78 | | | $ | 21.79 | | | $ | 20.84 | |
| | | |
| | | | | | | | | | | | | | | | | | | | | |
Total Return, at Net Asset Value2 | | | (38.47 | )% | | | 4.43 | % | | | 15.03 | % | | | 5.98 | % | | | 9.46 | % |
| | | | | | | | | | | | | | | | | | | | | |
Ratios/Supplemental Data | | | | | | | | | | | | | | | | | | | | |
| Net assets, end of period (in thousands) | | $ | 432,360 | | | $ | 907,727 | | | $ | 1,046,146 | | | $ | 1,121,476 | | | $ | 1,238,948 | |
| Average net assets (in thousands) | | $ | 670,994 | | | $ | 1,006,655 | | | $ | 1,054,522 | | | $ | 1,156,299 | | | $ | 1,216,081 | |
Ratios to average net assets:3 | | | | | | | | | | | | | | | | | | | | |
| Net investment income | | | 1.42 | % | | | 1.28 | % | | | 1.19 | % | | | 1.26 | % | | | 1.39 | % |
| Total expenses | | | 0.66 | %4,5,6 | | | 0.65 | %4,5,6 | | | 0.66 | %4,5 | | | 0.67 | %6 | | | 0.67 | %6 |
| Portfolio turnover rate | | | 132 | % | | | 111 | % | | | 100 | % | | | 88 | % | | | 82 | % |
| | |
| 1. | | Per share amounts calculated based on the average shares outstanding during the period. |
| |
| 2. | | Assumes an investment on the business day before the first day of the fiscal period, with all dividends and distributions reinvested in additional shares on the reinvestment date, and redemption at the net asset value calculated on the last business day of the fiscal period. Total returns are not annualized for periods less than one full year. Total return information does not reflect expenses that apply at the separate account level or to related insurance products. Inclusion of these charges would reduce the total return figures for all periods shown. Returns do not reflect the deduction of taxes that a shareholder would pay on fund distributions or the redemption of fund shares. |
| |
| 3. | | Annualized for periods less than one full year. |
| |
| 4. | | Total expenses including indirect expenses from affiliated fund were as follows: |
| | | | | |
| Year Ended December 31, 2008 | | | 0.66 | % |
| Year Ended December 31, 2007 | | | 0.65 | % |
| Year Ended December 31, 2006 | | | 0.66 | % |
| 5. | | Waiver or reimbursement of indirect management fees less than 0.005%. |
| |
| 6. | | Reduction to custodian expenses less than 0.005%. |
See accompanying Notes to Financial Statements.
F18 | OPPENHEIMER MAIN STREET FUND/VA
| | | | | | | | | | | | | | | | | | | | | |
| Service Shares Year Ended December 31, | | 2008 | | | 2007 | | | 2006 | | | 2005 | | | 2004 | |
| |
Per Share Operating Data | | | | | | | | | | | | | | | | | | | | |
| Net asset value, beginning of period | | $ | 25.38 | | | $ | 24.58 | | | $ | 21.63 | | | $ | 20.70 | | | $ | 19.10 | |
| Income (loss) from investment operations: | | | | | | | | | | | | | | | | | | | | |
Net investment income1 | | | .24 | | | | .26 | | | | .22 | | | | .21 | | | | .25 | |
| Net realized and unrealized gain (loss) | | | (9.56 | ) | | | .75 | | | | 2.95 | | | | .96 | | | | 1.49 | |
| | | |
| Total from investment operations | | | (9.32 | ) | | | 1.01 | | | | 3.17 | | | | 1.17 | | | | 1.74 | |
| Dividends and/or distributions to shareholders: | | | | | | | | | | | | | | | | | | | | |
| Dividends from net investment income | | | (.26 | ) | | | (.21 | ) | | | (.22 | ) | | | (.24 | ) | | | (.14 | ) |
| Distributions from net realized gain | | | (1.38 | ) | | | — | | | | — | | | | — | | | | — | |
| | | |
| Total dividends and/or distributions to shareholders | | (1.64 | ) | | | (.21 | ) | | | (.22 | ) | | | (.24 | ) | | | (.14 | ) |
| Net asset value, end of period | | $ | 14.42 | | | $ | 25.38 | | | $ | 24.58 | | | $ | 21.63 | | | $ | 20.70 | |
| | | |
| | | | | | | | | | | | | | | | | | | | | |
Total Return, at Net Asset Value2 | | | (38.63 | )% | | | 4.15 | % | | | 14.76 | % | | | 5.74 | % | | | 9.15 | % |
| | | | | | | | | | | | | | | | | | | | | |
Ratios/Supplemental Data | | | | | | | | | | | | | | | | | | | | |
| Net assets, end of period (in thousands) | | $ | 1,020,103 | | | $ | 1,464,690 | | | $ | 1,099,293 | | | $ | 598,348 | | | $ | 372,845 | |
| Average net assets (in thousands) | | $ | 1,268,430 | | | $ | 1,315,488 | | | $ | 810,181 | | | $ | 462,272 | | | $ | 262,660 | |
Ratios to average net assets:3 | | | | | | | | | | | | | | | | | | | | |
| Net investment income | | | 1.20 | % | | | 1.03 | % | | | 0.95 | % | | | 1.02 | % | | | 1.30 | % |
| Total expenses | | | 0.91 | %4,5,6 | | | 0.90 | %4,5,6 | | | 0.91 | %4,5 | | | 0.91 | %6 | | | 0.92 | %6 |
| Portfolio turnover rate | | | 132 | % | | | 111 | % | | | 100 | % | | | 88 | % | | | 82 | % |
| | |
| 1. | | Per share amounts calculated based on the average shares outstanding during the period. |
| |
| 2. | | Assumes an investment on the business day before the first day of the fiscal period, with all dividends and distributions reinvested in additional shares on the reinvestment date, and redemption at the net asset value calculated on the last business day of the fiscal period. Total returns are not annualized for periods less than one full year. Total return information does not reflect expenses that apply at the separate account level or to related insurance products. Inclusion of these charges would reduce the total return figures for all periods shown. Returns do not reflect the deduction of taxes that a shareholder would pay on fund distributions or the redemption of fund shares. |
| |
| 3. | | Annualized for periods less than one full year. |
| |
| 4. | | Total expenses including indirect expenses from affiliated fund were as follows: |
| | | | | |
| Year Ended December 31, 2008 | | | 0.91 | % |
| Year Ended December 31, 2007 | | | 0.90 | % |
| Year Ended December 31, 2006 | | | 0.91 | % |
| 5. | | Waiver or reimbursement of indirect management fees less than 0.005%. |
| |
| 6. | | Reduction to custodian expenses less than 0.005%. |
See accompanying Notes to Financial Statements.
F19 | OPPENHEIMER MAIN STREET FUND/VA
NOTES TO FINANCIAL STATEMENTS
1. Significant Accounting Policies
Oppenheimer Main Street Fund/VA (the “Fund”), is a separate series of Oppenheimer Variable Account Funds, an open-end management investment company registered under the Investment Company Act of 1940, as amended. The Fund’s investment objective is to seek high total return. The Fund’s investment adviser is OppenheimerFunds, Inc. (the “Manager”).
The Fund offers two classes of shares. Both classes are sold at their offering price, which is the net asset value per share, to separate investment accounts of participating insurance companies as an underlying investment for variable life insurance policies, variable annuity contracts or other investment products. The class of shares designated as Service shares is subject to a distribution and service plan. Both classes of shares have identical rights and voting privileges with respect to the Fund in general and exclusive voting rights on matters that affect that class alone. Earnings, net assets and net asset value per share may differ due to each class having its own expenses, such as transfer and shareholder servicing agent fees and shareholder communications, directly attributable to that class.
The following is a summary of significant accounting policies consistently followed by the Fund.
Securities Valuation. The Fund calculates the net asset value of its shares as of the close of the New York Stock Exchange (the “Exchange”), normally 4:00 P.M. Eastern time, on each day the Exchange is open for trading.
Effective for fiscal periods beginning after November 15, 2007, FASB Statement of Financial Accounting Standards No. 157, Fair Value Measurements, establishes a hierarchy for measuring fair value of assets and liabilities. As required by the standard, each investment asset or liability of the Fund is assigned a level at measurement date based on the significance and source of the inputs to its valuation. Quoted prices in active markets for identical securities are classified as “Level 1”, inputs other than quoted prices for an asset that are observable are classified as “Level 2” and unobservable inputs, including the Manager’s judgment about the assumptions that a market participant would use in pricing an asset or liability are classified as “Level 3”. The inputs used for valuing securities are not necessarily an indication of the risks associated with investing in those securities. A table summarizing the Fund’s investments under these levels of classification is included following the Statement of Investments.
Securities are valued using quoted market prices, when available, as supplied primarily either by portfolio pricing services approved by the Board of Trustees or dealers. These securities are typically classified within Level 1 or 2; however, they may be designated as Level 3 if the dealer or portfolio pricing service values a security through an internal model with significant unobservable market data inputs.
Securities traded on a registered U.S. securities exchange are valued based on the last sale price of the security reported on the principal exchange on which traded, prior to the time when the Fund’s assets are valued. Securities whose principal exchange is NASDAQ® are valued based on the official closing prices reported by NASDAQ prior to the time when the Fund’s assets are valued. In the absence of a sale, the security is valued at the last sale price on the prior trading day, if it is within the spread of the current day’s closing “bid” and “asked” prices, and if not, at the current day’s closing bid price. A foreign security traded on a foreign exchange is valued based on the last sale price on the principal exchange on which the security is traded, as identified by the portfolio pricing service used by the Manager, prior to the time when the Fund’s assets are valued. In the absence of a sale, the security is valued at the most recent official closing price on the principal exchange on which it is traded.
Shares of a registered investment company that are not traded on an exchange are valued at that investment company’s net asset value per share.
Corporate, government and municipal debt instruments having a remaining maturity in excess of sixty days and all mortgage-backed securities, collateralized mortgage obligations and other asset-backed securities are valued at the mean between the “bid” and “asked” prices.
“Money market-type” debt instruments with remaining maturities of sixty days or less are valued at cost adjusted by the amortization of discount or premium to maturity (amortized cost), which approximates market value. These securities are typically designated as Level 2.
F20 | OPPENHEIMER MAIN STREET FUND/VA
In the absence of a readily available quoted market price, including for securities whose values have been materially affected by what the Manager identifies as a significant event occurring before the Fund’s assets are valued but after the close of the securities’ respective exchanges, the Manager, acting through its internal valuation committee, in good faith determines the fair valuation of that asset using consistently applied procedures under the supervision of the Board of Trustees (which reviews those fair valuations by the Manager). Those procedures include certain standardized methodologies to fair value securities. Such methodologies include, but are not limited to, pricing securities initially at cost and subsequently adjusting the value based on: changes in company specific fundamentals, changes in an appropriate securities index, or changes in the value of similar securities which may be adjusted for any discounts related to resale restrictions. When possible, such methodologies use observable market inputs such as quoted prices of similar securities, observable interest rates, currency rates and yield curves. The methodologies used for valuing securities are not necessarily an indication of the risks associated with investing in those securities.
Fair valued securities may be classified as “Level 3” if the valuation primarily reflects the Manager’s own assumptions about the inputs that market participants would use in valuing such securities.
There have been no significant changes to the fair valuation methodologies during the period.
Foreign Currency Translation. The Fund’s accounting records are maintained in U.S. dollars. The values of securities denominated in foreign currencies and amounts related to the purchase and sale of foreign securities and foreign investment income are translated into U.S. dollars as of the close of the Exchange, normally 4:00 P.M. Eastern time, on each day the Exchange is open for trading. Foreign exchange rates may be valued primarily using a reliable bank, dealer or service authorized by the Board of Trustees.
Reported net realized gains and losses from foreign currency transactions arise from sales of portfolio securities, sales and maturities of short-term securities, sales of foreign currencies, exchange rate fluctuations between the trade and settlement dates on securities transactions, and the difference between the amounts of dividends, interest, and foreign withholding taxes recorded on the Fund’s books and the U.S. dollar equivalent of the amounts actually received or paid. Net unrealized appreciation and depreciation on the translation of assets and liabilities denominated in foreign currencies arise from changes in the values of assets and liabilities, including investments in securities at fiscal period end, resulting from changes in exchange rates.
The effect of changes in foreign currency exchange rates on investments is separately identified from the fluctuations arising from changes in market values of securities held and reported with all other foreign currency gains and losses in the Fund’s Statement of Operations.
Investment in Oppenheimer Institutional Money Market Fund. The Fund is permitted to invest daily available cash balances in an affiliated money market fund. The Fund may invest the available cash in Class E shares of Oppenheimer Institutional Money Market Fund (“IMMF”) to seek current income while preserving liquidity. IMMF is a registered open-end management investment company, regulated as a money market fund under the Investment Company Act of 1940, as amended. The Manager is also the investment adviser of IMMF. The Fund’s investment in IMMF is included in the Statement of Investments. As a shareholder, the Fund is subject to its proportional share of IMMF’s Class E expenses, including its management fee. The Manager will waive fees and/or reimburse Fund expenses in an amount equal to the indirect management fees incurred through the Fund’s investment in IMMF.
Investments in OFI Liquid Assets Fund, LLC. The Fund is permitted to invest cash collateral received in connection with its securities lending activities. Pursuant to the Fund’s Securities Lending Procedures, the Fund may invest cash collateral in, among other investments, an affiliated money market fund. OFI Liquid Assets Fund, LLC (“LAF”) is a limited liability company whose investment objective is to seek current income and stability of principal. The Manager is also the investment adviser of LAF. LAF is not registered under the Investment Company Act of 1940. However, LAF does comply with the investment restrictions applicable to registered money market funds set forth in Rule 2a-7 adopted under the Investment Company Act. The Fund’s investment in LAF is included in the Statement of Investments. As a shareholder, the Fund is subject to its proportional share of LAF’s expenses, including its management fee of 0.08%.
F21 | OPPENHEIMER MAIN STREET FUND/VA
NOTES TO FINANCIAL STATEMENTS Continued
1. Significant Accounting Policies Continued
Allocation of Income, Expenses, Gains and Losses. Income, expenses (other than those attributable to a specific class), gains and losses are allocated on a daily basis to each class of shares based upon the relative proportion of net assets represented by such class. Operating expenses directly attributable to a specific class are charged against the operations of that class.
Federal Taxes. The Fund intends to comply with provisions of the Internal Revenue Code applicable to regulated investment companies and to distribute substantially all of its investment company taxable income, including any net realized gain on investments not offset by capital loss carryforwards, if any, to shareholders. Therefore, no federal income or excise tax provision is required. The Fund files income tax returns in U.S. federal and applicable state jurisdictions. The statute of limitations on the Fund’s tax return filings generally remain open for the three preceding fiscal reporting period ends.
The tax components of capital shown in the following table represent distribution requirements the Fund must satisfy under the income tax regulations, losses the Fund may be able to offset against income and gains realized in future years and unrealized appreciation or depreciation of securities and other investments for federal income tax purposes.
| | | | | | | | | | | | | |
| | | | | | | | | | | Net Unrealized | |
| | | | | | | | | | | Depreciation | |
| | | | | | | | | | | Based on Cost | |
| Undistributed | | Undistributed | | | Accumulated | | | of Securities and Other | |
| Net Investment | | Long-Term | | | Loss | | | Investments for Federal | |
| Income | | Gain | | | Carryforward1,2,3,4 | | | Income Tax Purposes | |
| |
| $24,782,907 | | $ | — | | | $ | 248,263,528 | | | $ | 410,355,317 | |
| | |
| 1. | | As of December 31, 2008, the Fund had $217,993,206 of net capital loss carryforwards available to offset future realized capital gains, if any, and thereby reduce future taxable gain distributions. As of December 31, 2008, details of the capital loss carryforward were as follows: |
| | | | | |
| Expiring | |
| |
| 2016 | | $ | 217,993,206 | |
| 2. | | As of December 31, 2008, the Fund had $30,270,322 of post-October losses available to offset future realized capital gains, if any. Such losses, if unutilized, will expire in 2017. |
| |
| 3. | | During the fiscal year ended December 31, 2008, the Fund did not utilize any capital loss carryforward. |
| |
| 4. | | During the fiscal year ended December 31, 2007, the Fund utilized $51,195,980 of capital loss carryforward to offset capital gains realized in that fiscal year. |
Net investment income (loss) and net realized gain (loss) may differ for financial statement and tax purposes. The character of dividends and distributions made during the fiscal year from net investment income or net realized gains may differ from their ultimate characterization for federal income tax purposes. Also, due to timing of dividends and distributions, the fiscal year in which amounts are distributed may differ from the fiscal year in which the income or net realized gain was recorded by the Fund.
Accordingly, the following amounts have been reclassified for December 31, 2008. Net assets of the Fund were unaffected by the reclassifications.
| | | | | |
| | | Increase | |
| Increase | | to Accumulated | |
| to Accumulated | | Net Realized Loss | |
| Net Investment Income | | on Investments | |
| | |
| $60,673 | | $ | 60,673 | |
F22 | OPPENHEIMER MAIN STREET FUND/VA
The tax character of distributions paid during the years ended December 31, 2008 and December 31, 2007 was as follows:
| | | | | | | | | |
| | | Year Ended | | | Year Ended | |
| | | December 31, 2008 | | | December 31, 2007 | |
| |
| Distributions paid from: | | | | | | | | |
| Ordinary income | | $ | 48,772,351 | | | $ | 20,209,124 | |
| Long-term capital gain | | | 106,374,839 | | | | — | |
| | | |
| Total | | $ | 155,147,190 | | | $ | 20,209,124 | |
| | | |
The aggregate cost of securities and other investments and the composition of unrealized appreciation and depreciation of securities and other investments for federal income tax purposes as of December 31, 2008 are noted in the following table. The primary difference between book and tax appreciation or depreciation of securities and other investments, if applicable, is attributable to the tax deferral of losses or tax realization of financial statement unrealized gain or loss.
| | | | | |
| Federal tax cost of securities | | $ | 1,962,352,646 | |
| Federal tax cost of other investments | | | (69,838 | ) |
| | | | |
| Total federal tax cost | | $ | 1,962,282,808 | |
| | | | |
| | | | | |
| Gross unrealized appreciation | | $ | 98,174,535 | |
| Gross unrealized depreciation | | | (508,529,852 | ) |
| | | | |
| Net unrealized depreciation | | $ | (410,355,317 | ) |
| | | | |
Trustees’ Compensation. The Board of Trustees has adopted a compensation deferral plan for independent trustees that enables trustees to elect to defer receipt of all or a portion of the annual compensation they are entitled to receive from the Fund. For purposes of determining the amount owed to the Trustee under the plan, deferred amounts are treated as though equal dollar amounts had been invested in shares of the Fund or in other Oppenheimer funds selected by the Trustee. The Fund purchases shares of the funds selected for deferral by the Trustee in amounts equal to his or her deemed investment, resulting in a Fund asset equal to the deferred compensation liability. Such assets are included as a component of “Other” within the asset section of the Statement of Assets and Liabilities. Deferral of trustees’ fees under the plan will not affect the net assets of the Fund, and will not materially affect the Fund’s assets, liabilities or net investment income per share. Amounts will be deferred until distributed in accordance to the compensation deferral plan.
Dividends and Distributions to Shareholders. Dividends and distributions to shareholders, which are determined in accordance with income tax regulations and may differ from U.S. generally accepted accounting principles, are recorded on the ex-dividend date. Income and capital gain distributions, if any, are declared and paid annually or at other times as deemed necessary by the Manager.
Investment Income. Dividend income is recorded on the ex-dividend date or upon ex-dividend notification in the case of certain foreign dividends where the ex-dividend date may have passed. Non-cash dividends included in dividend income, if any, are recorded at the fair market value of the securities received. Interest income is recognized on an accrual basis. Discount and premium, which are included in interest income on the Statement of Operations, are amortized or accreted daily.
Custodian Fees. “Custodian fees and expenses” in the Statement of Operations may include interest expense incurred by the Fund on any cash overdrafts of its custodian account during the period. Such cash overdrafts may result from the effects of failed trades in portfolio securities and from cash outflows resulting from unanticipated shareholder redemption activity. The Fund pays interest to its custodian on such cash overdrafts, to the extent they are not offset by positive cash balances maintained by the Fund, at a rate equal to the Federal Funds Rate plus 0.50%. The “Reduction to custodian expenses” line item, if applicable, represents earnings on cash balances maintained by the Fund during the period. Such interest expense and other custodian fees may be paid with these earnings.
F23 | OPPENHEIMER MAIN STREET FUND/VA
NOTES TO FINANCIAL STATEMENTS Continued
1. Significant Accounting Policies Continued
Security Transactions. Security transactions are recorded on the trade date. Realized gains and losses on securities sold are determined on the basis of identified cost.
Indemnifications. The Fund’s organizational documents provide current and former trustees and officers with a limited indemnification against liabilities arising in connection with the performance of their duties to the Fund. In the normal course of business, the Fund may also enter into contracts that provide general indemnifications. The Fund’s maximum exposure under these arrangements is unknown as this would be dependent on future claims that may be made against the Fund. The risk of material loss from such claims is considered remote.
Other. The preparation of financial statements in conformity with accounting principles generally accepted in the United States of America requires management to make estimates and assumptions that affect the reported amounts of assets and liabilities and disclosure of contingent assets and liabilities at the date of the financial statements and the reported amounts of increases and decreases in net assets from operations during the reporting period. Actual results could differ from those estimates.
2. Shares of Beneficial Interest
The Fund has authorized an unlimited number of $0.001 par value shares of beneficial interest of each class. Transactions in shares of beneficial interest were as follows:
| | | | | | | | | | | | | | | | | |
| | | Year Ended December 31, 2008 | | | Year Ended December 31, 2007 | |
| | | Shares | | | Amount | | | Shares | | | Amount | |
| |
Non-Service Shares | | | | | | | | | | | | | | | | |
| Sold | | | 4,118,231 | | | $ | 80,935,200 | | | | 2,948,386 | | | $ | 76,016,214 | |
| Dividends and/or distributions reinvested | | | 2,774,941 | | | | 57,330,270 | | | | 425,853 | | | | 10,356,753 | |
| Redeemed | | | (12,645,946 | ) | | | (250,623,695 | ) | | | (10,151,162 | ) | | | (262,031,826 | ) |
| | | |
| Net decrease | | | (5,752,774 | ) | | $ | (112,358,225 | ) | | | (6,776,923 | ) | | $ | (175,658,859 | ) |
| | | |
| | | | | | | | | | | | | | | | | |
Service Shares | | | | | | | | | | | | | | | | |
| Sold | | | 17,273,881 | | | $ | 299,271,029 | | | | 18,707,352 | | | $ | 478,137,931 | |
| Dividends and/or distributions reinvested | | | 4,768,240 | | | | 97,748,917 | | | | 407,708 | | | | 9,846,137 | |
| Redeemed | | | (9,024,762 | ) | | | (173,860,508 | ) | | | (6,139,866 | ) | | | (156,552,465 | ) |
| | | |
| Net increase | | | 13,017,359 | | | $ | 223,159,438 | | | | 12,975,194 | | | $ | 331,431,603 | |
| | | |
3. Purchases and Sales of Securities
The aggregate cost of purchases and proceeds from sales of securities, other than short-term obligations and investments in Oppenheimer Institutional Money Market Fund and OFI Liquid Assets Fund, LLC, for the year ended December 31, 2008, were as follows:
| | | | | | | | | |
| | | Purchases | | | Sales | |
| |
| Investment securities | | $ | 2,588,552,424 | | | $ | 2,601,405,624 | |
4. Fees and Other Transactions with Affiliates
Management Fees. Under the investment advisory agreement, the Fund pays the Manager a management fee based on the daily net assets of the Fund at an annual rate as shown in the following table:
| | | | | |
| Fee Schedule | | | | |
| |
| Up to $200 million | | | 0.75 | % |
| Next $200 million | | | 0.72 | |
| Next $200 million | | | 0.69 | |
| Next $200 million | | | 0.66 | |
| Over $800 million | | | 0.60 | |
F24 | OPPENHEIMER MAIN STREET FUND/VA
Transfer Agent Fees. OppenheimerFunds Services (“OFS”), a division of the Manager, acts as the transfer and shareholder servicing agent for the Fund. The Fund pays OFS a per account fee. For the year ended December 31, 2008, the Fund paid $20,065 to OFS for services to the Fund.
Additionally, funds offered in variable annuity separate accounts are subject to minimum fees of $10,000 per class, for class level assets of $10 million or more. Each class is subject to the minimum fee in the event that the per account fee does not equal or exceed the applicable minimum fee.
Distribution and Service Plan for Service Shares. The Fund has adopted a Distribution and Service Plan (the “Plan”) in accordance with Rule 12b-1 under the Investment Company Act of 1940 for Service shares to pay OppenheimerFunds Distributor, Inc. (the “Distributor”), for distribution related services, personal service and account maintenance for the Fund’s Service shares. Under the Plan, payments are made periodically at an annual rate of up to 0.25% of the average annual net assets of Service shares of the Fund. The Distributor currently uses all of those fees to compensate sponsor(s) of the insurance product that offers Fund shares, for providing personal service and maintenance of accounts of their variable contract owners that hold Service shares. These fees are paid out of the Fund’s assets on an on-going basis and increase operating expenses of the Service shares, which results in lower performance compared to the Fund’s shares that are not subject to a service fee. Fees incurred by the Fund under the Plan are detailed in the Statement of Operations.
Waivers and Reimbursements of Expenses. OFS has voluntarily agreed to limit transfer and shareholder servicing agent fees for all classes to 0.35% of average annual net assets per class. This undertaking may be amended or withdrawn at any time.
The Manager will waive fees and/or reimburse Fund expenses in an amount equal to the indirect management fees incurred through the Fund’s investment in IMMF. During the year ended December 31, 2008, the Manager waived $11,091 for IMMF management fees.
5. Illiquid Securities
As of December 31, 2008, investments in securities included issues that are illiquid. Investments may be illiquid because they do not have an active trading market, making it difficult to value them or dispose of them promptly at an acceptable price. The Fund will not invest more than 15% of its net assets (determined at the time of purchase and reviewed periodically) in illiquid securities. Securities that are illiquid are marked with an applicable footnote on the Statement of Investments.
6. Securities Lending
The Fund lends portfolio securities from time to time in order to earn additional income in the form of fees or interest on securities received as collateral or the investment of any cash received as collateral. The loans are secured by collateral (either securities, letters of credit, or cash) in an amount not less than 100% of the market value of the loaned securities during the period of the loan. The market value of the loaned securities is determined at the close of each business day and any additional required collateral is delivered to the Fund on the next business day. If the borrower defaults on its obligation to return the securities loaned because of insolvency or other reasons, the Fund could experience delays and cost in recovering the securities loaned or in gaining access to the collateral. The Fund continues to receive the economic benefit of interest or dividends paid on the securities loaned in the form of a substitute payment received from the borrower and recognizes the gain or loss in the fair value of the securities loaned that may occur during the term of the loan. The Fund has the right under the lending agreement to recover the securities from the borrower on demand. As of December 31, 2008, the Fund had on loan securities valued at $103,659,542. Collateral of $103,600,720 was received for the loans, all of which was received in cash and subsequently invested in approved instruments or held as cash.
F25 | OPPENHEIMER MAIN STREET FUND/VA
NOTES TO FINANCIAL STATEMENTS Continued
7. Recent Accounting Pronouncement
In March 2008, the Financial Accounting Standards Board (“FASB”) issued Statement on Financial Accounting Standards (“SFAS”) No. 161, Disclosures about Derivative Instruments and Hedging Activities. This standard requires enhanced disclosures about derivative and hedging activities, including qualitative disclosures about how and why the Fund uses derivative instruments, how these activities are accounted for, and their effect on the Fund’s financial position, financial performance and cash flows. SFAS No. 161 is effective for financial statements issued for fiscal years and interim periods beginning after November 15, 2008. At this time, management is evaluating the implications of SFAS No. 161 and its impact on the Fund’s financial statements and related disclosures.
8. Change In Independent Registered Public Accounting Firm (Unaudited)
At a meeting held on August 20, 2008, the Board of Trustees of the Fund appointed KPMG LLP as the independent registered public accounting firm to the Fund for fiscal year 2009, replacing the firm of Deloitte & Touche LLP, effective at the conclusion of the fiscal 2008 audit. During the two most recent fiscal years the audit reports of Deloitte & Touche LLP contained no adverse opinion or disclaimer of opinion and were not qualified or modified as to uncertainty, audit scope or accounting principles. Further, there were no disagreements between the Fund and Deloitte & Touche LLP on accounting principles, financial statement disclosure or audit scope, which if not resolved to the satisfaction of Deloitte & Touche LLP would have caused it to make reference to the disagreements in connection with its reports.
F26 | OPPENHEIMER MAIN STREET FUND/VA
REPORT OF INDEPENDENT REGISTERED PUBLIC ACCOUNTING FIRM
To the Board of Trustees and Shareholders of Oppenheimer Main Street Fund/VA:
We have audited the accompanying statement of assets and liabilities of Oppenheimer Main Street Fund/VA (the “Fund”), a series of Oppenheimer Variable Account Funds, including the statement of investments, as of December 31, 2008, and the related statement of operations for the year then ended, the statements of changes in net assets for each of the two years in the period then ended, and the financial highlights for each of the five years in the period then ended. These financial statements and financial highlights are the responsibility of the Fund’s management. Our responsibility is to express an opinion on these financial statements and financial highlights based on our audits.
We conducted our audits in accordance with the standards of the Public Company Accounting Oversight Board (United States). Those standards require that we plan and perform the audit to obtain reasonable assurance about whether the financial statements and financial highlights are free of material misstatement. The Fund is not required to have, nor were we engaged to perform, an audit of its internal control over financial reporting. Our audits included consideration of internal control over financial reporting as a basis for designing audit procedures that are appropriate in the circumstances, but not for the purpose of expressing an opinion on the effectiveness of the Fund’s internal control over financial reporting. Accordingly, we express no such opinion. An audit also includes examining, on a test basis, evidence supporting the amounts and disclosures in the financial statements, assessing the accounting principles used and significant estimates made by management, as well as evaluating the overall financial statement presentation. Our procedures included confirmation of securities owned as of December 31, 2008, by correspondence with the custodian and brokers; where replies were not received from brokers, we performed other auditing procedures. We believe that our audits provide a reasonable basis for our opinion.
In our opinion, the financial statements and financial highlights referred to above present fairly, in all material respects, the financial position of the Fund as of December 31, 2008, the results of its operations for the year then ended, the changes in its net assets for each of the two years in the period then ended, and the financial highlights for each of the five years in the period then ended, in conformity with accounting principles generally accepted in the United States of America.
Deloitte & Touche LLP
Denver, Colorado
February 11, 2009
F27 | OPPENHEIMER MAIN STREET FUND/VA
FEDERAL INCOME TAX INFORMATION Unaudited
In early 2009, if applicable, shareholders of record received information regarding all dividends and distributions paid to them by the Fund during calendar year 2008. Regulations of the U.S. Treasury Department require the Fund to report this information to the Internal Revenue Service.
Capital gain distributions of $1.1414 per share were paid to Non-Service and Service shareholders, respectively, on March 10, 2008. Whether received in stock or in cash, the capital gain distribution should be treated by shareholders as a gain from the sale of the capital assets held for more than one year (long-term capital gains).
Dividends, if any, paid by the Fund during the fiscal year ended December 31, 2008 which are not designated as capital gain distributions should be multiplied by 100% to arrive at the amount eligible for the corporate dividend-received deduction.
The foregoing information is presented to assist shareholders in reporting distributions received from the Fund to the Internal Revenue Service. Because of the complexity of the federal regulations which may affect your individual tax return and the many variations in state and local tax regulations, we recommend that you consult your tax advisor for specific guidance.
F28 | OPPENHEIMER MAIN STREET FUND/VA
BOARD APPROVAL OF THE FUND’S INVESTMENT ADVISORY AGREEMENT Unaudited
Each year, the Board of Trustees (the “Board”), including a majority of the independent Trustees, is required to determine whether to renew the Fund’s investment advisory agreement (the “Agreement”). The Investment Company Act of 1940, as amended, requires that the Board request and evaluate, and that the Manager provide, such information as may be reasonably necessary to evaluate the terms of the Agreement. The Board employs an independent consultant to prepare a report that provides information, including comparative information, the Board requests for that purpose. In addition, the Board receives information throughout the year regarding Fund services, fees, expenses and performance.
The Manager and the independent consultant provided information to the Board on the following factors: (i) the nature, quality and extent of the Manager’s services, (ii) the investment performance of the Fund and the Manager, (iii) the fees and expenses of the Fund, including comparative expense information, (iv) the profitability of the Manager and its affiliates, including an analysis of the cost of providing services, (v) whether economies of scale are realized as the Fund grows and whether fee levels reflect these economies of scale for Fund investors and (vi) other benefits to the Manager from its relationship with the Fund. The Board was aware that there are alternatives to retaining the Manager.
Outlined below is a summary of the principal information considered by the Board as well as the Board’s conclusions.
Nature, Quality and Extent of Services. The Board considered information about the nature, quality and extent of the services provided to the Fund and information regarding the Manager’s key personnel who provide such services. The Manager’s duties include providing the Fund with the services of the portfolio managers and the Manager’s investment team, who provide research, analysis and other advisory services in regard to the Fund’s investments; securities trading services; oversight of third party service providers; monitoring compliance with applicable Fund policies and procedures and adherence to the Fund’s investment restrictions. The Manager is responsible for providing certain administrative services to the Fund as well. Those services include providing and supervising all administrative and clerical personnel who are necessary in order to provide effective corporate administration for the Fund; compiling and maintaining records with respect to the Fund’s operations; preparing and filing reports required by the Securities and Exchange Commission; preparing periodic reports regarding the operations of the Fund for its shareholders; preparing proxy materials for shareholder meetings; and preparing the registration statements required by Federal and state securities laws for the sale of the Fund’s shares. The Manager also provides the Fund with office space, facilities and equipment.
The Board also considered the quality of the services provided and the quality of the Manager’s resources that are available to the Fund. The Board took account of the fact that the Manager has had over forty years of experience as an investment adviser and that its assets under management rank it among the top mutual fund managers in the United States. The Board evaluated the Manager’s advisory, administrative, accounting, legal and compliance services, and information the Board has received regarding the experience and professional qualifications of the Manager’s key personnel and the size and functions of its staff. In its evaluation of the quality of the portfolio management services provided, the Board considered the experience of Mark Zavanelli, Marc Reinganum and Wentong Alex Zhou, the portfolio managers for the Fund, and the Manager’s investment team and analysts. The Board members also considered the totality of their experiences with the Manager as Directors or Trustees of the Fund and other funds advised by the Manager. The Board considered information regarding the quality of services provided by affiliates of the Manager, which its members have become knowledgeable about in connection with the renewal of the Fund’s service agreements. The Board concluded that, in light of the Manager’s experience, reputation, personnel, operations and resources, the Fund benefits from the services provided under the Agreement.
Investment Performance of the Manager and the Fund. Throughout the year, the Manager provided information on the investment performance of the Fund and the Manager, including comparative performance information. The Board also reviewed information, prepared by the Manager and by the independent consultant, comparing the Fund’s historical
7 | OPPENHEIMER MAIN STREET FUND/VA
BOARD APPROVAL OF THE FUND’S INVESTMENT ADVISORY AGREEMENT Unaudited / Continued
performance to relevant market indices and to the performance of other large-cap core funds underlying variable insurance products. The Board considered that the Fund underperformed its performance universe median during the one-, three-, five- and ten-year periods. The Board considered the Manager’s assertion that poor stock selection and over-weighting in the financials and technology sectors contributed to the Fund’s underperformance in 2007.
Costs of Services by the Manager. The Board reviewed the fees paid to the Manager and the other expenses borne by the Fund. The Board also considered the comparability of the fees charged and the services provided to the Fund to the fees and services for other clients or accounts advised by the Manager. The independent consultant provided comparative data in regard to the fees and expenses of the Fund and large-cap core funds underlying variable insurance products with comparable asset levels and distribution features. The Board considered that the Fund’s total expenses were competitive vis-à-vis its expense group median. In reviewing the fees and expenses charged to the VA Funds, the Board considered the Manager’s assertion that, because of the disparity among VA funds in how insurance companies may be compensated for the services they provide to shareholders, when comparing the expenses of the various VA funds it is most appropriate to focus on the total expenses rather than on the management fees. Accordingly, while the Board reviewed and considered all expenses in its consideration of the Advisory Agreement, it paid particular attention to total expenses.
Economies of Scale and Profits Realized by the Manager. The Board considered information regarding the Manager’s costs in serving as the Fund’s investment adviser, including the costs associated with the personnel and systems necessary to manage the Fund, and information regarding the Manager’s profitability from its relationship with the Fund. The Board reviewed whether the Manager may realize economies of scale in managing and supporting the Fund. The Board noted that the Fund currently has management fee breakpoints, which are intended to share with Fund shareholders economies of scale that may exist as the Fund’s assets grow.
Other Benefits to the Manager. In addition to considering the profits realized by the Manager, the Board considered information that was provided regarding the direct and indirect benefits the Manager receives as a result of its relationship with the Fund, including compensation paid to the Manager’s affiliates and research provided to the Manager in connection with permissible brokerage arrangements (soft dollar arrangements). The Board also considered that the Manager must be able to pay and retain experienced professional personnel at competitive rates to provide quality services to the Fund and that maintaining the financial viability of the Manager is important in order for the Manager to continue to provide significant services to the Fund and its shareholders.
Conclusions. These factors were also considered by the independent Trustees meeting separately from the full Board, assisted by experienced counsel to the Fund and to the independent Trustees. Fund counsel and the independent Trustees’ counsel are independent of the Manager within the meaning and intent of the Securities and Exchange Commission Rules.
Based on its review of the information it received and its evaluations described above, the Board, including a majority of the independent Trustees, decided to continue the Agreement for another year. In arriving at this decision, the Board did not single out any factor or factors as being more important than others, but considered all of the above information, and considered the terms and conditions of the Agreement, including the management fee, in light of all of the surrounding circumstances.
8 | OPPENHEIMER MAIN STREET FUND/VA
SHAREHOLDER MEETING Unaudited
The Fund has adopted Portfolio Proxy Voting Policies and Procedures under which the Fund votes proxies relating to securities (“portfolio proxies”) held by the Fund. A description of the Fund’s Portfolio Proxy Voting Policies and Procedures is available (i) without charge, upon request, by calling the Fund toll-free at 1.800.525.7048, (ii) on the Fund’s website at www.oppenheimerfunds.com, and (iii) on the SEC’s website at www.sec.gov. In addition, the Fund is required to file Form N-PX, with its complete proxy voting record for the 12 months ended June 30th, no later than August 31st of each year. The Fund’s voting record is available (i) without charge, upon request, by calling the Fund toll-free at 1.800.525.7048, and (ii) in the Form N-PX filing on the SEC’s website at www.sec.gov.
The Fund files its complete schedule of portfolio holdings with the SEC for the first quarter and the third quarter of each fiscal year on Form N-Q. The Fund’s Form N-Q filings are available on the SEC’s website at http://www.sec.gov. Those forms may be reviewed and copied at the SEC’s Public Reference Room in Washington, D.C. Information on the operation of the Public Reference Room may be obtained by calling 1-800-SEC-0330.
9 | OPPENHEIMER MAIN STREET FUND/VA
TRUSTEES AND OFFICERS Unaudited
| | | |
Name, Position(s) Held with the
Funds, Length of Service, Age | | Principal Occupation(s) During the Past 5 Years; Other Trusteeships/Directorships Held; Number of Portfolios in the Funds Complex Currently Overseen |
| |
INDEPENDENT
TRUSTEES | | The address of each Trustee in the chart below is 6803 S. Tucson Way, Centennial, Colorado 80112-3924. Each Trustee serves for an indefinite term, or until his or her resignation, retirement, death or removal. |
| | | |
William L. Armstrong,
Chairman of the Board
of Trustees (since 2003),
Trustee (since 1999)
Age: 71 | | President, Colorado Christian University (since 2006); Chairman, Cherry Creek Mortgage Company (since 1991), Chairman, Centennial State Mortgage Company (since 1994), Chairman, The El Paso Mortgage Company (since 1993); Chairman, Ambassador Media Corporation (since 1984); Chairman, Broadway Ventures (since 1984); Director of Helmerich & Payne, Inc. (oil and gas drilling/production company) (since 1992), Campus Crusade for Christ (non-profit) (since 1991); Former Director, The Lynde and Harry Bradley Foundation, Inc. (non-profit organization) (2002-2006); former Chairman of: Transland Financial Services, Inc. (private mortgage banking company) (1997-2003), Great Frontier Insurance (1995-2000), Frontier Real Estate, Inc. (residential real estate brokerage) (1994-2000) and Frontier Title (title insurance agency) (1995-2000); former Director of the following: UNUMProvident (insurance company) (1991-2004), Storage Technology Corporation (computer equipment company) (1991-2003) and International Family Entertainment (television channel) (1992-1997); U.S. Senator (January 1979-January 1991). Oversees 41 portfolios in the OppenheimerFunds complex. |
| | | |
George C. Bowen,
Trustee (since 1999)
Age: 72 | | Assistant Secretary and Director of Centennial Asset Management Corporation (December 1991-April 1999); President, Treasurer and Director of Centennial Capital Corporation (June 1989-April 1999); Chief Executive Officer and Director of MultiSource Services, Inc. (March 1996-April 1999); Mr. Bowen held several positions with the Manager and with subsidiary or affiliated companies of the Manager (September 1987-April 1999). Oversees 41 portfolios in the OppenheimerFunds complex. |
| | | |
Edward L. Cameron,
Trustee (since 1999)
Age: 70 | | Member of The Life Guard of Mount Vernon (George Washington historical site) (June 2000-June 2006); Partner of PricewaterhouseCoopers LLP (accounting firm) (July 1974-June 1999); Chairman of Price Waterhouse LLP Global Investment Management Industry Services Group (accounting firm) (July 1994-June 1998). Oversees 41 portfolios in the OppenheimerFunds complex. |
| | | |
Jon S. Fossel,
Trustee (since 1995)
Age: 66 | | Director of UNUMProvident (insurance company) (since June 2002); Director of Northwestern Energy Corp. (public utility corporation) (since November 2004); Director of P.R. Pharmaceuticals (October 1999-October 2003); Director of Rocky Mountain Elk Foundation (non-profit organization) (February 1998-February 2003 and February 2005-February 2007); Chairman and Director (until October 1996) and President and Chief Executive Officer (until October 1995) of the Manager; President, Chief Executive Officer and Director of the following: Oppenheimer Acquisition Corp. (“OAC”) (parent holding company of the Manager), Shareholders Services, Inc. and Shareholder Financial Services, Inc. (until October 1995). Oversees 41 portfolios in the OppenheimerFunds complex. |
| | | |
Sam Freedman,
Trustee (since 1996)
Age: 68 | | Director of Colorado UpLIFT (charitable organization) (since September 1984). Mr. Freedman held several positions with the Manager and with subsidiary or affiliated companies of the Manager (until October 1994). Oversees 41 portfolios in the OppenheimerFunds complex. |
| | | |
Beverly L. Hamilton,
Trustee (since 2002)
Age: 62 | | Trustee of Monterey Institute for International Studies (educational organization) (since February 2000); Board Member of Middlebury College (educational organization) (since December 2005); Director of The California Endowment (philanthropic organization) (since April 2002); Director (February 2002-2005) and Chairman of Trustees (2006-2007) of the Community Hospital of Monterey Peninsula; Director (October 1991-2005) and Vice Chairman (since 2006) of American Funds’ Emerging Markets Growth Fund, Inc. (mutual fund); President of ARCO Investment Management Company (February 1991-April 2000); Member of the investment commit- tees of The Rockefeller Foundation (2001-2006) and The University of Michigan (since 2000); Advisor at Credit Suisse First Boston’s Sprout venture capital unit (venture capital fund) (1994-January 2005); Trustee of MassMutual Institutional Funds (investment company) (1996-June 2004); Trustee of MML Series Investment Fund (investment company) (April 1989-June 2004); Member of the investment committee of Hartford Hospital (2000-2003); and Advisor to Unilever (Holland) pension fund (2000-2003). Oversees 41 portfolios in the OppenheimerFunds complex. |
| | | |
Robert J. Malone,
Trustee (since 2002)
Age: 64 | | Board of Directors of Opera Colorado Foundation (non-profit organization) (since March 2008); Director of Jones Knowledge, Inc. (since 2006); Director of Jones International University (educational organization) (since August 2005); Chairman, Chief Executive Officer and Director of Steele Street Bank & Trust (commercial banking) |
10 | OPPENHEIMER MAIN STREET FUND/VA
| | | |
Robert J. Malone,
Continued | | (since August 2003); Director of Colorado UpLIFT (charitable organization) (since 1986); Trustee of the Gallagher Family Foundation (non-profit organization) (since 2000); Former Chairman of U.S. Bank-Colorado (subsidiary of U.S. Bancorp and formerly Colorado National Bank) (July 1996-April 1999); Director of Commercial Assets, Inc. (real estate investment trust) (1993-2000); Director of Jones Knowledge, Inc. (2001-July 2004); and Director of U.S. Exploration, Inc. (oil and gas exploration) (1997-February 2004). Oversees 41 portfolios in the OppenheimerFunds complex. |
| | | |
F. William Marshall, Jr.,
Trustee (since 2000)
Age: 66 | | Trustee Emeritas of Worcester Polytech Institute (WPI) (private university) (since 2009); Trustee of MassMutual Select Funds (formerly MassMutual Institutional Funds) (investment company) (since 1996) and MML Series Investment Fund (investment company) (since 1996); President and Treasurer of the SIS Funds (private charitable fund) (since January 1999); Former Trustee of WPI (1985-2008); Former Chairman of the Board (2004-2006) and Former Chairman of the Investment Committee of WPI (1994-2008); Chairman of SIS & Family Bank, F.S.B. (formerly SIS Bank) (commercial bank) (January 1999-July 1999); Executive Vice President of Peoples Heritage Financial Group, Inc. (commercial bank) (January 1999-July 1999); and Former President and Chief Executive Officer of SIS Bancorp. (1993-1999). Oversees 43 portfolios in the OppenheimerFunds complex. |
| | | |
INTERESTED TRUSTEE
AND OFFICER | | The address of Mr. Murphy is Two World Financial Center, 225 Liberty Street, 11th Floor, New York, New York 10281- 1008. Mr. Murphy serves as a Trustee for an indefinite term, or until his resignation, retirement, death or removal and as an Officer for an indefinite term, or until his resignation, retirement, death or removal. Mr. Murphy is an interested Trustee due to his positions with OppenheimerFunds, Inc. and its affiliates. |
| | | |
John V. Murphy,
Trustee, President and
Principal Executive Officer
(since 2001)
Age: 59 | | Chairman and Director of the Manager (since June 2001); Chief Executive Officer of the Manager (June 2001-December 2008); President of the Manager (September 2000-February 2007); President and director or trustee of other Oppenheimer funds; President and Director of Oppenheimer Acquisition Corp. (“OAC”) (the Manager’s parent holding company) and of Oppenheimer Partnership Holdings, Inc. (holding company subsidiary of the Manager) (since July 2001); Director of OppenheimerFunds Distributor, Inc. (subsidiary of the Manager) (November 2001-December 2006); Chairman and Director of Shareholder Services, Inc. and of Shareholder Financial Services, Inc. (transfer agent subsidiaries of the Manager) (since July 2001); President and Director of OppenheimerFunds Legacy Program (charitable trust program established by the Manager) (since July 2001); Director of the following investment advisory subsidiaries of the Manager: OFI Institutional Asset Management, Inc., Centennial Asset Management Corporation, Trinity Investment Management Corporation and Tremont Capital Management, Inc. (since November 2001), HarbourView Asset Management Corporation and OFI Private Investments, Inc. (since July 2001); President (since November 2001) and Director (since July 2001) of Oppenheimer Real Asset Management, Inc.; Executive Vice President of Massachusetts Mutual Life Insurance Company (OAC’s parent company) (since February 1997); Director of DLB Acquisition Corporation (holding company parent of Babson Capital Management LLC) (since June 1995); Chairman (since October 2007) and Member of the Investment Company Institute’s Board of Governors (since October 2003). Oversees 105 portfolios in the OppenheimerFunds complex. |
| | | |
OTHER OFFICERS OF
THE FUND | | The addresses of the Officers in the chart below are as follows: for Messrs. Reinganum, Zavanelli, Zhou and Zack, Two World Financial Center, 225 Liberty Street, New York, New York 10281-1008, for Messrs. Vandehey and Wixted, 6803 S. Tucson Way, Centennial, Colorado 80112-3924. Each Officer serves for an indefinite term or until his or her resignation, retirement, death or removal. |
| | | |
Dr. Marc Reinganum,
Vice President and Portfolio
Manager (since 2003)
Age: 55 | | Vice President of the Manager (since September 2002); Director of Quantitative Research and Portfolio Strategist for Equities; the Mary Jo Vaughn Rauscher Chair in Financial Investments at Southern Methodist University (1995-2002). Director of the Finance Institute, Chairman of the Finance Department, President of the Faculty at the Cox School of Business and member of the Board of Trustee Investment Committee while at Southern Methodist University. A portfolio manager and officer of 6 portfolios in the OppenheimerFunds complex. |
| | | |
Mark Zavanelli,
Vice President and Portfolio
Manager (since 2008)
Age: 38 | | Vice President of the Manager (since November 2000); a Chartered Financial Analyst. A portfolio manager and officer of 6 portfolios in the OppenheimerFunds complex. |
11 | OPPENHEIMER MAIN STREET FUND/VA
TRUSTEES AND OFFICERS Unaudited / Continued
| | | |
Dr. Wentong Alex Zhou,
Vice President and Portfolio
Manager (since 2008)
Age: 42 | | Senior quantitative analyst of the Manager (since June 1999), assisting in the management and maintenance of the quantitative models for the Main Street Funds. A portfolio manager of the Manager (since January 2007) and an Assistant Vice President of the Manager (since 2001). A portfolio manager and officer of 3 portfolios in the OppenheimerFunds complex. |
| | | |
Mark S. Vandehey,
Vice President and Chief
Compliance Officer
(since 2004)
Age: 58 | | Senior Vice President and Chief Compliance Officer of the Manager (since March 2004); Chief Compliance Officer of OppenheimerFunds Distributor, Inc., Centennial Asset Management and Shareholder Services, Inc. (since March 2004); Vice President of OppenheimerFunds Distributor, Inc., Centennial Asset Management Corporation and Shareholder Services, Inc. (since June 1983); Former Vice President and Director of Internal Audit of the Manager (1997-February 2004). An officer of 105 portfolios in the OppenheimerFunds complex. |
| | | |
Brian W. Wixted,
Treasurer and Principal
Financial & Accounting
Officer (since 1999)
Age: 49 | | Senior Vice President and Treasurer of the Manager (since March 1999); Treasurer of the following: HarbourView Asset Management Corporation, Shareholder Financial Services, Inc., Shareholder Services, Inc., Oppenheimer Real Asset Management, Inc. and Oppenheimer Partnership Holdings, Inc. (since March 1999), OFI Private Investments, Inc. (since March 2000), OppenheimerFunds International Ltd. and OppenheimerFunds plc (since May 2000), OFI Institutional Asset Management, Inc. (since November 2000), and OppenheimerFunds Legacy Program (charitable trust program established by the Manager) (since June 2003); Treasurer and Chief Financial Officer of OFI Trust Company (trust company subsidiary of the Manager) (since May 2000); Assistant Treasurer of the following: OAC (since March 1999), Centennial Asset Management Corporation (March 1999- October 2003) and OppenheimerFunds Legacy Program (April 2000-June 2003). An officer of 105 portfolios in the OppenheimerFunds complex. |
| | | |
Robert G. Zack,
Vice President and Secretary
(since 2001)
Age: 60 | | Executive Vice President (since January 2004) and General Counsel (since March 2002) of the Manager; General Counsel and Director of the Distributor (since December 2001); General Counsel of Centennial Asset Management Corporation (since December 2001); Senior Vice President and General Counsel of HarbourView Asset Management Corporation (since December 2001); Secretary and General Counsel of OAC (since November 2001); Assistant Secretary (since September 1997) and Director (since November 2001) of OppenheimerFunds International Ltd. and OppenheimerFunds plc; Vice President and Director of Oppenheimer Partnership Holdings, Inc. (since December 2002); Director of Oppenheimer Real Asset Management, Inc. (since November 2001); Senior Vice President, General Counsel and Director of Shareholder Financial Services, Inc. and Shareholder Services, Inc. (since December 2001); Senior Vice President, General Counsel and Director of OFI Private Investments, Inc. and OFI Trust Company (since November 2001); Vice President of OppenheimerFunds Legacy Program (since June 2003); Senior Vice President and General Counsel of OFI Institutional Asset Management, Inc. (since November 2001); Director of OppenheimerFunds International Distributor Limited (since December 2003); Senior Vice President (May 1985-December 2003). An officer of 105 portfolios in the OppenheimerFunds complex. |
The Fund’s Statement of Additional Information contains additional information about the Fund’s Trustees and Officers and is available without charge, upon request, by calling 1.800.981.2871.
12 | OPPENHEIMER MAIN STREET FUND/VA
| December 31, 2008 Oppenheimer Management Main Street Small Cap Commentaries Fund®/VA and Annual Report A Series of Oppenheimer Variable Account Funds M A N A G E M E N T C O M M E N TA R I E S Listing of Top Holdings A N N U A L R E P O RT Fund Performance Discussion Listing of Investments Financial Statements |
FUND PERFORMANCE DISCUSSION
Management’s Discussion of Fund Performance. For the 12-month period ended December 31, 2008, Oppenheimer Main Street Small Cap Fund/VA’s Non-Service shares produced a total return of -37.83%, while the Russell 2000 Index returned -33.79%. We attribute the Fund’s underperformance primarily to a mild emphasis on mid-cap stocks, which generally underperformed their smaller counterparts, and overweight positions in the hard-hit consumer discretionary, information technology and materials sectors.
Economic and Market Overview. Like most other asset classes, U.S. stocks declined sharply when a credit crunch that began in 2007 developed into a full-blown global financial crisis over the summer of 2008. Turmoil spread from the sub-prime mortgage sector of the U.S. bond market to other financial markets, including stocks, as investors became increasingly risk-averse. Declining asset prices compelled major financial institutions to write down or write off a significant portion of their investments’ value, contributing to massive losses that led to the insolvency of several major commercial banks, investment banks, mortgage agencies and insurers.
After Lehman Brothers declared bankruptcy in September 2008, banks and other lenders grew reluctant to extend credit, nearly leading to the collapse of the global banking system and sharply limiting the availability of credit for businesses and consumers. Governments and central banks responded to the crisis with enormous injections of liquidity, lower short-term interest rates and rescue packages for troubled industries. While these measures helped stabilize the crisis, credit markets remained fragile through the end of the year and business conditions continued to deteriorate.
Meanwhile, a U.S. economic slowdown that began in late 2007 was exacerbated by the financial crisis, leading to a surge in job losses and additional pressure on slumping home prices. Cash-strapped consumers and anxious businesses curtailed spending, adding fuel to the downturn. The U.S. recession quickly spread to overseas markets, reducing previously robust demand for energy and building materials. Consequently, commodity prices that had reached record highs over the first half of the year plummeted over the second half.
Investors worried about these developments engaged in a “flight to safety,” selling riskier assets, such as small-cap stocks, in favor of U.S. Treasury securities. Selling pressure appeared to be indiscriminate as investors rushed for the exits, punishing stocks of fundamentally sound companies along with less healthy ones. Although the financial institutions at the epicenter of the crisis were mainly very large companies, the flight to quality was also damaging for smaller businesses, which historically have been more volatile than their larger counterparts. The bear market was especially severe for traditionally economically-sensitive sectors, such as the consumer discretionary and information technology sectors, while sectors whose fortunes rise and fall with commodity prices, such as energy and basic materials producers, also were hard hit. Conversely, the historically defensive consumer staples and utilities sectors held up relatively well. Fund Strategy. As always, we invested the Fund’s assets in accordance with the signals generated by our multi-factor quantitative models, including a newly developed model designed to consider unusually volatile market conditions. Our process worked relatively well over the first half of 2008, when the Fund generally produced higher returns than the Russell 2000 Index. Our market capitalization model indicated that companies toward the larger end of the small-cap range, including a number of mid-cap companies, were likely to fare better than micro-cap and other smaller stocks. In addition, our stock selection model found a number of opportunities in the materials sector, leading to an overweight position that benefited relative performance as commodity prices soared to record highs. Conversely, we identified relatively few highly ranked stocks in the financial sector, which was hurt by the credit crisis, and the health care sector, where managed care companies struggled with rising costs. On the other hand, an underweight position in the energy sector, a relatively small component of the index, detracted from relative performance over the first half of the year.
The positions that benefited the Fund’s results during the first half of the year were detractors over the second half of the year, when extreme volatility roiled equity markets. Midcap stocks, many of which had been removed from the Russell 2000 Index when it rebalanced at mid-year, fell sharply in the wake of the banking crisis, adversely affecting the Fund to a greater extent than the index. Although we reduced the Fund’s exposure to mid-cap stocks over the second half of 2008, it was not enough to offset the capitalization range’s poor performance. In addition, the Fund’s overweight positions in the materials, consumer discretionary and information technology sectors fared poorly in the deepening recession that dominated the final six months of 2008.
3 | OPPENHEIMER MAIN STREET SMALL CAP FUND/ VA
FUND PERFORMANCE DISCUSSION
As of year-end, our models have indicated that small-cap stocks generally are better positioned than mid-cap stocks in the current market environment, which was reflected in a modestly underweighted position in mid-cap stocks and mildly overweight exposure to small and micro-cap stocks. In addition, the Fund ended the reporting period with an emphasis on the information technology, industrials, energy and materials sector, where a number of companies appear to have been punished too severely during the downturn and may be poised to rebound strongly in an eventual recovery. Conversely, we have found relatively few opportunities in the health care, financials, utilities and consumer staples sectors. Finally, the Fund has remained fully invested and broadly diversified.
Comparing the Fund’s Performance to the Market. The graphs that follow show the performance of a hypothetical $10,000 investment in each share class of the Fund held until December 31, 2008. In the case of Non-Service shares, performance is measured over a ten fiscal year period. In the case of Service shares, performance is measured from inception of the Class on July 16, 2001. Performance information does not reflect charges that apply to separate accounts investing in the Fund. If these charges were taken into account, performance would be lower. The graphs assume that all dividends and capital gains distributions were reinvested in additional shares. Past performance cannot guarantee future results.
The Fund’s performance is compared to the performance of the Russell 2000 Index, an unmanaged index of equity securities of small capitalization companies that is a measure of the small company market. The index performance includes reinvestment of income but does not reflect transaction costs, fees or expenses. The Fund’s performance reflects the effects of the Fund’s business and operating expenses. While index comparisons may be useful to provide a benchmark for the Fund’s performance, it must be noted that the Fund’s investments are not limited to the investments in the index.
4 | OPPENHEIMER MAIN STREET SMALL CAP FUND/ VA
Non-Service Shares
Comparison of Change in Value of $10,000 Hypothetical Investments in:
Service Shares
Comparison of Change in Value of $10,000 Hypothetical Investments in:
The performance data quoted represents past performance, which does not guarantee future results. The investment return and principal value of an investment in the Fund will fluctuate so that an investor’s shares, when redeemed, may be worth more or less than their original cost. Current performance may be lower or higher than the performance quoted. For performance data current to the most recent month end, call us at 1.800.981.2871. The Fund’s total returns should not be expected to be the same as the returns of other funds, whether or not both funds have the same portfolio managers and/or similar names. The Fund’s total returns do not include the charges associated with the separate account products that offer this Fund. Such performance would have been lower if such charges were taken into account.
5 | OPPENHEIMER MAIN STREET SMALL CAP FUND/ VA
FUND EXPENSES
Fund Expenses. As a shareholder of the Fund, you incur two types of costs: (1) transaction costs, which may include redemption fees (if applicable); and (2) ongoing costs, including management fees; distribution and service fees; and other Fund expenses. These examples are intended to help you understand your ongoing costs (in dollars) of investing in the Fund and to compare these costs with the ongoing costs of investing in other mutual funds.
The examples are based on an investment of $1,000.00 invested at the beginning of the period and held for the entire 6-month period ended December 31, 2008.
Actual Expenses. The first section of the table provides information about actual account values and actual expenses. You may use the information in this section for the class of shares you hold, together with the amount you invested, to estimate the expense that you paid over the period. Simply divide your account value by $1,000.00 (for example, an $8,600.00 account value divided by $1,000.00 = 8.60), then multiply the result by the number in the first section under the heading entitled “Expenses Paid During Period” to estimate the expenses you paid on your account during this period.
Hypothetical Example for Comparison Purposes. The second section of the table provides information about hypothetical account values and hypothetical expenses based on the Fund’s actual expense ratio for each class of shares, and an assumed rate of return of 5% per year for each class before expenses, which is not the actual return. The hypothetical account values and expenses may not be used to estimate the actual ending account balance or expenses you paid for the period. You may use this information to compare the ongoing costs of investing in the Fund and other funds. To do so, compare this 5% hypothetical example for the class of shares you hold with the 5% hypothetical examples that appear in the shareholder reports of the other funds.
Please note that the expenses shown in the table are meant to highlight your ongoing costs only and do not reflect any charges associated with the separate accounts that offer this Fund. Therefore, the “hypothetical” lines of the table are useful in comparing ongoing costs only, and will not help you determine the relative total costs of owning different funds. In addition, if these separate account charges were included your costs would have been higher.
| | | | | | | | | | | | | |
| | | Beginning | | | Ending | | | Expenses | |
| | | Account | | | Account | | | Paid During | |
| | | Value | | | Value | | | 6 Months Ended | |
| Actual | | July 1, 2008 | | | December 31, 2008 | | | December 31, 2008 | |
| Non-Service shares | | $ | 1,000.00 | | | $ | 683.60 | | | $ | 3.35 | |
| Service Shares | | | 1,000.00 | | | | 682.60 | | | | 4.33 | |
| | | | | | | | | | | | | |
Hypothetical | | | | | | | | | | | | |
| (5% return before expenses) | | | | | | | | | | | | |
| Non-Service Shares | | | 1,000.00 | | | | 1,021.17 | | | | 4.02 | |
| Service Shares | | | 1,000.00 | | | | 1,020.01 | | | | 5.19 | |
Expenses are equal to the Fund’s annualized expense ratio for that class, multiplied by the average account value over the period, multiplied by 184/366 (to reflect the one-half year period). Those annualized expense ratios, excluding indirect expenses from affiliated fund, based on the 6-month period ended December 31, 2008 are as follows:
| | | | | |
| Class | | Expense Ratios |
| Non-Service Shares | | | 0.79 | % |
| Service Shares | | | 1.02 | |
The expense ratios reflect reduction to custodian expenses and voluntary waivers or reimbursements of expenses by the Fund’s Manager that can be terminated at any time, without advance notice. The “Financial Highlights” tables in the Fund’s financial statements, included in this report, also show the gross expense ratios, without such waivers or reimbursements and reduction to custodian expenses, if applicable.
6 | OPPENHEIMER MAIN STREET SMALL CAP FUND/ VA
STATEMENT OF INVESTMENTS December 31, 2008
| | | | | | | | | |
| | | Shares | | | Value | |
Common Stocks—98.2% | | | | | | | | |
Consumer Discretionary—16.3% | | | | | | | | |
Auto Components—1.0% | | | | | | | | |
American Axle & Manufacturing Holdings, Inc.1 | | | 137,800 | | | $ | 398,242 | |
Amerigon, Inc.1,2 | | | 2,800 | | | | 9,128 | |
ArvinMeritor, Inc.1 | | | 140,271 | | | | 399,772 | |
| Autoliv, Inc. | | | 57,800 | | | | 1,240,388 | |
| Cooper Tire & Rubber Co. | | | 116,476 | | | | 717,492 | |
Drew Industries, Inc.2 | | | 34,800 | | | | 417,600 | |
Exide Technologies2 | | | 42,200 | | | | 223,238 | |
Fuel Systems Solutions, Inc.2 | | | 579 | | | | 18,968 | |
Goodyear Tire & Rubber Co. (The)2 | | | 30,500 | | | | 182,085 | |
Hayes Lemmerz International, Inc.2 | | | 7,500 | | | | 3,375 | |
Lear Corp.2 | | | 146,400 | | | | 206,424 | |
| Modine Manufacturing Co. | | | 28,374 | | | | 138,181 | |
| Shiloh Industries, Inc. | | | 2,700 | | | | 8,100 | |
Stoneridge, Inc.2 | | | 44,487 | | | | 202,861 | |
Superior Industries International, Inc.1 | | | 32,100 | | | | 337,692 | |
Tenneco, Inc.1,2 | | | 145,900 | | | | 430,405 | |
TRW Automotive Holdings Corp.2 | | | 168,600 | | | | 606,960 | |
Visteon Corp.2 | | | 15,700 | | | | 5,495 | |
| WABCO Holdings, Inc. | | | 42,500 | | | | 671,075 | |
| | | | | | | | |
| | | | | | | | 6,217,481 | |
| | | | | | | | | |
Automobiles—0.2% | | | | | | | | |
Thor Industries, Inc.1 | | | 66,000 | | | | 869,880 | |
| Winnebago Industries, Inc. | | | 31,500 | | | | 189,945 | |
| | | | | | | | |
| | | | | | | | 1,059,825 | |
| | | | | | | | | |
Distributors—0.0% | | | | | | | | |
Core-Mark Holding Co., Inc.2 | | | 4,900 | | | | 105,448 | |
Diversified Consumer Services—0.6% | | | | | | | | |
Career Education Corp.1,2 | | | 41,700 | | | | 748,098 | |
Coinstar, Inc.2 | | | 3,000 | | | | 58,530 | |
Noah Education Holdings Ltd., ADR1 | | | 19,500 | | | | 61,425 | |
Pre-Paid Legal Services, Inc.1,2 | | | 7,105 | | | | 264,945 | |
| Regis Corp. | | | 66,800 | | | | 970,604 | |
| Service Corp. International | | | 38,600 | | | | 191,842 | |
Steiner Leisure Ltd.2 | | | 23,738 | | | | 700,746 | |
Stewart Enterprises, Inc.1 | | | 97,800 | | | | 294,378 | |
Universal Technical Institute, Inc.2 | | | 19,400 | | | | 333,098 | |
| | | | | | | | |
| | | | | | | | 3,623,666 | |
| | | | | | | | | |
Hotels, Restaurants & Leisure—2.5% | | | | | | | | |
AFC Enterprises, Inc.2 | | | 5,200 | | | | 24,388 | |
Ameristar Casinos, Inc.1 | | | 19,900 | | | | 171,936 | |
Bally Technologies, Inc.2 | | | 15,400 | | | | 370,062 | |
BJ’s Restaurants, Inc.2 | | | 9,100 | | | | 98,007 | |
| Bob Evans Farms, Inc. | | | 69,014 | | | | 1,409,956 | |
Boyd Gaming Corp.1 | | | 115,617 | | | | 546,868 | |
Brinker International, Inc.1 | | | 110,920 | | | | 1,169,097 | |
California Pizza Kitchen, Inc.2 | | | 39,200 | | | | 420,224 | |
CEC Entertainment, Inc.2 | | | 53,070 | | | | 1,286,948 | |
Cheesecake Factory, Inc. (The)2 | | | 37,042 | | | | 374,124 | |
| Churchill Downs, Inc. | | | 4,100 | | | | 165,722 | |
| CKE Restaurants, Inc. | | | 74,000 | | | | 642,320 | |
Cracker Barrel Old Country Store, Inc.1 | | | 41,550 | | | | 855,515 | |
Denny’s Corp.2 | | | 186,300 | | | | 370,737 | |
DineEquity, Inc.1 | | | 13,400 | | | | 154,904 | |
Domino’s Pizza, Inc.2 | | | 6,200 | | | | 29,202 | |
| Dover Downs Gaming & Entertainment, Inc. | | | 2,100 | | | | 6,678 | |
| International Speedway Corp., Cl. A | | | 21,200 | | | | 609,076 | |
Interval Leisure Group, Inc.2 | | | 14,720 | | | | 79,341 | |
Isle of Capri Casinos, Inc.1,2 | | | 16,500 | | | | 52,800 | |
Jack in the Box, Inc.2 | | | 46,000 | | | | 1,016,140 | |
Krispy Kreme Doughnuts, Inc.1,2 | | | 57,700 | | | | 96,936 | |
Life Time Fitness, Inc.1,2 | | | 16,821 | | | | 217,832 | |
| Marcus Corp. (The) | | | 19,500 | | | | 316,485 | |
Morgans Hotel Group Co.2 | | | 3,500 | | | | 16,310 | |
| O’Charley’s, Inc. | | | 5,400 | | | | 10,800 | |
Orient-Express Hotel Ltd., Cl. A1 | | | 25,600 | | | | 196,096 | |
Panera Bread Co., Cl. A1,2 | | | 14,800 | | | | 773,152 | |
Peet’s Coffee & Tea, Inc.2 | | | 3,900 | | | | 90,675 | |
Pinnacle Entertainment, Inc.1,2 | | | 36,100 | | | | 277,248 | |
Red Robin Gourmet Burgers, Inc.2 | | | 16,500 | | | | 277,695 | |
Riviera Holdings Corp.2 | | | 700 | | | | 2,100 | |
Ruby Tuesday, Inc.2 | | | 52,000 | | | | 81,120 | |
Shuffle Master, Inc.2 | | | 20,096 | | | | 99,676 | |
Sonic Corp.2 | | | 13,600 | | | | 165,512 | |
| Speedway Motorsports, Inc. | | | 25,479 | | | | 410,467 | |
Steak n Shake Co. (The)1,2 | | | 20,800 | | | | 123,760 | |
Town Sports International Holdings, Inc.2 | | | 9,300 | | | | 29,667 | |
Vail Resorts, Inc.1,2 | | | 19,500 | | | | 518,700 | |
WMS Industries, Inc.1,2 | | | 49,314 | | | | 1,326,547 | |
| Wyndham Worldwide Corp. | | | 72,643 | | | | 475,812 | |
| | | | | | | | |
| | | | | | | | 15,360,635 | |
| | | | | | | | | |
Household Durables—1.6% | | | | | | | | |
American Greetings Corp., Cl. A1 | | | 99,355 | | | | 752,117 | |
Beazer Homes USA, Inc.2 | | | 78,000 | | | | 123,240 | |
F1 | OPPENHEIMER MAIN STREET SMALL CAP FUND/ VA
STATEMENT OF INVESTMENTS Continued
| | | | | | | | | |
| | | Shares | | | Value | |
Household Durables Continued | | | | | | | | |
| Blyth, Inc. | | | 66,080 | | | $ | 518,067 | |
| Brookfield Homes Corp. | | | 3,300 | | | | 14,256 | |
Cavco Industries, Inc.1,2 | | | 3,900 | | | | 104,871 | |
Centex Corp.1 | | | 43,000 | | | | 457,520 | |
Champion Enterprises, Inc.2 | | | 132,900 | | | | 74,424 | |
CSS Industries, Inc.1 | | | 12,350 | | | | 219,089 | |
Ethan Allen Interiors, Inc.1 | | | 26,800 | | | | 385,116 | |
Furniture Brands International, Inc.1 | | | 81,300 | | | | 179,673 | |
| Harman International Industries, Inc. | | | 46,700 | | | | 781,291 | |
Helen of Troy Ltd.2 | | | 44,710 | | | | 776,166 | |
Hooker Furniture Corp.1 | | | 20,210 | | | | 154,809 | |
Hovnanian Enterprises, Inc., Cl. A1,2 | | | 164,798 | | | | 283,453 | |
Jarden Corp.2 | | | 10,300 | | | | 118,450 | |
KB Home1 | | | 31,200 | | | | 424,944 | |
La-Z-Boy, Inc.1 | | | 98,749 | | | | 214,285 | |
Lennar Corp., Cl. A1 | | | 123,900 | | | | 1,074,213 | |
| M/I Homes, Inc. | | | 29,836 | | | | 314,471 | |
| MDC Holdings, Inc. | | | 3,600 | | | | 109,080 | |
Meritage Homes Corp.2 | | | 44,400 | | | | 540,348 | |
| National Presto Industries, Inc. | | | 8,100 | | | | 623,700 | |
Palm Harbor Homes, Inc.1,2 | | | 6,600 | | | | 32,868 | |
Ryland Group, Inc. (The)1 | | | 49,900 | | | | 881,733 | |
| Sealy Corp. | | | 59,220 | | | | 148,642 | |
Standard Pacific Corp.2 | | | 27,900 | | | | 49,662 | |
Tempur-Pedic International, Inc.1 | | | 75,500 | | | | 535,295 | |
Universal Electronics, Inc.2 | | | 300 | | | | 4,866 | |
| | | | | | | | |
| | | | | | | | 9,896,649 | |
| | | | | | | | | |
Internet & Catalog Retail—0.9% | | | | | | | | |
1-800-FLOWERS.com, Inc.2 | | | 68,600 | | | | 262,052 | |
Bidz.com, Inc.1,2 | | | 4,100 | | | | 18,860 | |
Blue Nile, Inc.1,2 | | | 10,400 | | | | 254,696 | |
Expedia, Inc.2 | | | 43,400 | | | | 357,616 | |
Gaiam, Inc.2 | | | 8,300 | | | | 38,346 | |
HSN, Inc.2 | | | 13,420 | | | | 97,563 | |
Liberty Media Corp.-Interactive, Series A2 | | | 71,700 | | | | 223,704 | |
NetFlix.com, Inc.1,2 | | | 57,700 | | | | 1,724,653 | |
NutriSystem, Inc.1 | | | 51,050 | | | | 744,820 | |
Orbitz Worldwide, Inc.2 | | | 32,500 | | | | 126,100 | |
Overstock.com, Inc.2 | | | 25,789 | | | | 278,005 | |
PetMed Express, Inc.1,2 | | | 32,800 | | | | 578,264 | |
Priceline.com, Inc.1,2 | | | 2,700 | | | | 198,855 | |
Shutterfly, Inc.2 | | | 9,300 | | | | 65,007 | |
Stamps.com, Inc.2 | | | 36,083 | | | | 354,696 | |
Ticketmaster Entertainment, Inc.2 | | | 20,220 | | | | 129,812 | |
| | | | | | | | |
| | | | | | | | 5,453,049 | |
| | | | | | | | | |
Leisure Equipment & Products—0.8% | | | | | | | | |
Brunswick Corp.1 | | | 230,000 | | | | 968,300 | |
Callaway Golf Co.1 | | | 165,300 | | | | 1,535,637 | |
JAKKS Pacific, Inc.1,2 | | | 40,700 | | | | 839,641 | |
Leapfrog Enterprises, Inc.1,2 | | | 70,700 | | | | 247,450 | |
Polaris Industries, Inc.1 | | | 25,800 | | | | 739,170 | |
| Pool Corp. | | | 8,700 | | | | 156,339 | |
RC2 Corp.2 | | | 14,000 | | | | 149,380 | |
Steinway Musical Instruments, Inc.2 | | | 10,627 | | | | 186,079 | |
| | | | | | | | |
| | | | | | | | 4,821,996 | |
| | | | | | | | | |
Media—1.2% | | | | | | | | |
| Arbitron, Inc. | | | 8,000 | | | | 106,240 | |
Ascent Media Corp., Cl. A2 | | | 1,900 | | | | 41,496 | |
| Belo Corp., Cl. A | | | 139,600 | | | | 217,776 | |
| Cablevision Systems Corp. New York Group, Cl. A | | | 9,800 | | | | 165,032 | |
| CBS Corp., Cl. B | | | 22,400 | | | | 183,456 | |
Central European Media Enterprises Ltd., Cl. A1,2 | | | 4,500 | | | | 97,740 | |
Charter Communications, Inc., Cl. A2 | | | 358,100 | | | | 29,293 | |
Clear Channel Outdoor Holdings, Inc., Cl. A2 | | | 10,200 | | | | 62,730 | |
Cox Radio, Inc., Cl. A1,2 | | | 50,585 | | | | 304,016 | |
CTC Media, Inc.2 | | | 3,900 | | | | 18,720 | |
Cumulus Media, Inc., Cl. A2 | | | 24,100 | | | | 60,009 | |
Dish Network Corp., Cl. A2 | | | 21,100 | | | | 233,999 | |
| Entercom Communications Corp. | | | 10,300 | | | | 12,669 | |
Entravision Communications Corp.2 | | | 133,515 | | | | 208,283 | |
| EW Scripps Co. (The), Cl. A | | | 60,700 | | | | 134,147 | |
| Fisher Communications, Inc. | | | 900 | | | | 18,576 | |
Gannett Co., Inc.1 | | | 13,600 | | | | 108,800 | |
Global Sources Ltd.1,2 | | | 46,536 | | | | 253,621 | |
Harte-Hanks, Inc.1 | | | 34,300 | | | | 214,032 | |
Hearst-Argyle Television, Inc.1 | | | 4,100 | | | | 24,846 | |
| Journal Communications, Inc. | | | 22,100 | | | | 54,145 | |
Knology, Inc.2 | | | 16,600 | | | | 85,656 | |
Lamar Advertising Co., Cl. A1,2 | | | 38,800 | | | | 487,328 | |
Liberty Media Holding Corp.-Capital, Series A2 | | | 8,600 | | | | 40,506 | |
Lin TV Corp., Cl. A2 | | | 27,500 | | | | 29,975 | |
McClatchy Co., Cl. A1 | | | 71,300 | | | | 57,040 | |
F2 | OPPENHEIMER MAIN STREET SMALL CAP FUND/ VA
| | | | | | | | | |
| | | Shares | | | Value | |
Media Continued | | | | | | | | |
| McGraw-Hill Cos., Inc. (The) | | | 12,100 | | | $ | 280,599 | |
Media General, Inc., Cl. A1 | | | 21,400 | | | | 37,450 | |
Mediacom Communications Corp.2 | | | 59,400 | | | | 255,420 | |
Meredith Corp.1 | | | 83,300 | | | | 1,426,096 | |
| National CineMedia, Inc. | | | 35,510 | | | | 360,071 | |
RCN Corp.2 | | | 3,300 | | | | 19,470 | |
| Scholastic Corp. | | | 66,600 | | | | 904,428 | |
Sinclair Broadcast Group, Inc., Cl. A1 | | | 111,099 | | | | 344,407 | |
Valassis Communications, Inc.2 | | | 9,000 | | | | 11,880 | |
| Warner Music Group Corp. | | | 75,500 | | | | 228,010 | |
| | | | | | | | |
| | | | | | | | 7,117,962 | |
| | | | | | | | | |
Multiline Retail—0.5% | | | | | | | | |
Big Lots, Inc.1,2 | | | 81,700 | | | | 1,183,833 | |
Dillard’s, Inc., Cl. A1 | | | 174,986 | | | | 694,694 | |
| Fred’s, Inc. | | | 84,798 | | | | 912,426 | |
| Macy’s, Inc. | | | 19,200 | | | | 198,720 | |
Nordstrom, Inc.1 | | | 10,800 | | | | 143,748 | |
Retail Ventures, Inc.2 | | | 2,500 | | | | 8,675 | |
| | | | | | | | |
| | | | | | | | 3,142,096 | |
| | | | | | | | | |
Specialty Retail—5.3% | | | | | | | | |
Abercrombie & Fitch Co., Cl. A1 | | | 15,400 | | | | 355,278 | |
Aeropostale, Inc.2 | | | 101,400 | | | | 1,632,540 | |
America’s Car-Mart, Inc.1,2 | | | 19,530 | | | | 269,709 | |
| American Eagle Outfitters, Inc. | | | 13,900 | | | | 130,104 | |
AnnTaylor Stores Corp.2 | | | 164,500 | | | | 949,165 | |
Asbury Automotive Group, Inc.1 | | | 61,400 | | | | 280,598 | |
AutoNation, Inc.1,2 | | | 134,600 | | | | 1,329,848 | |
Barnes & Noble, Inc.1 | | | 62,500 | | | | 937,500 | |
| bebe stores, inc. | | | 61,300 | | | | 457,911 | |
| Big 5 Sporting Goods Corp. | | | 2,826 | | | | 14,723 | |
Blockbuster, Inc., Cl. A1,2 | | | 180,600 | | | | 222,138 | |
| Books-A-Million, Inc. | | | 3,100 | | | | 7,905 | |
Borders Group, Inc.2 | | | 69,792 | | | | 27,917 | |
Brown Shoe Co., Inc.1 | | | 107,375 | | | | 909,466 | |
Buckle, Inc. (The)1 | | | 61,500 | | | | 1,341,930 | |
| Cato Corp., Cl. A | | | 36,200 | | | | 546,620 | |
Charlotte Russe Holding, Inc.2 | | | 29,300 | | | | 190,157 | |
Charming Shoppes, Inc.1,2 | | | 104,127 | | | | 254,070 | |
Chico’s FAS, Inc.2 | | | 52,800 | | | | 220,704 | |
Children’s Place Retail Stores, Inc.2 | | | 61,600 | | | | 1,335,488 | |
| Christopher & Banks Corp. | | | 41,300 | | | | 231,280 | |
Citi Trends, Inc.1,2 | | | 37,527 | | | | 552,397 | |
Coldwater Creek, Inc.2 | | | 78,600 | | | | 224,010 | |
Conn’s, Inc.1,2 | | | 18,197 | | | | 154,311 | |
Dress Barn, Inc. (The)1,2 | | | 124,704 | | | | 1,339,321 | |
| Finish Line, Inc. (The), Cl. A | | | 122,100 | | | | 683,760 | |
| Foot Locker, Inc. | | | 52,300 | | | | 383,882 | |
Genesco, Inc.1,2 | | | 37,600 | | | | 636,192 | |
Group 1 Automotive, Inc.1 | | | 42,600 | | | | 458,802 | |
| Guess?, Inc. | | | 7,700 | | | | 118,195 | |
Gymboree Corp.1,2 | | | 13,100 | | | | 341,779 | |
Haverty Furniture Cos., Inc.1 | | | 52,400 | | | | 488,892 | |
hhgregg, Inc.2 | | | 2,300 | | | | 19,964 | |
Hibbett Sports, Inc.1,2 | | | 28,000 | | | | 439,880 | |
Hot Topic, Inc.2 | | | 89,220 | | | | 827,069 | |
J. Crew Group, Inc.2 | | | 4,400 | | | | 53,680 | |
Jo-Ann Stores, Inc.2 | | | 59,317 | | | | 918,820 | |
| Limited Brands, Inc. | | | 21,700 | | | | 217,868 | |
Lumber Liquidators, Inc.1,2 | | | 14,300 | | | | 151,008 | |
Men’s Wearhouse, Inc. (The)1 | | | 65,400 | | | | 885,516 | |
| Monro Muffler Brake, Inc. | | | 5,180 | | | | 132,090 | |
New York & Co., Inc.2 | | | 69,200 | | | | 160,544 | |
Office Depot, Inc.2 | | | 263,900 | | | | 786,422 | |
| OfficeMax, Inc. | | | 117,700 | | | | 899,228 | |
Pacific Sunwear of California, Inc.2 | | | 122,000 | | | | 193,980 | |
Penske Automotive Group, Inc.1 | | | 89,700 | | | | 688,896 | |
Pep Boys-Manny, Moe & Jack1 | | | 71,988 | | | | 297,310 | |
Pier 1 Imports, Inc.2 | | | 16,000 | | | | 5,920 | |
| RadioShack Corp. | | | 60,400 | | | | 721,176 | |
Rent-A-Center, Inc.2 | | | 103,100 | | | | 1,819,715 | |
Sally Beauty Holdings, Inc.1,2 | | | 122,300 | | | | 695,887 | |
Sonic Automotive, Inc.1 | | | 56,300 | | | | 224,074 | |
| Stage Stores, Inc. | | | 71,400 | | | | 589,050 | |
Systemax, Inc.1 | | | 34,600 | | | | 372,642 | |
Talbots, Inc. (The)1 | | | 88,200 | | | | 210,798 | |
Tractor Supply Co.1,2 | | | 54,505 | | | | 1,969,811 | |
Tween Brands, Inc.2 | | | 45,600 | | | | 196,992 | |
Wet Seal, Inc., Cl. A2 | | | 164,800 | | | | 489,456 | |
Williams-Sonoma, Inc.1 | | | 140,100 | | | | 1,101,186 | |
Zale Corp.1,2 | | | 74,400 | | | | 247,752 | |
Zumiez, Inc.2 | | | 17,300 | | | | 128,885 | |
| | | | | | | | |
| | | | | | | | 32,472,211 | |
| | | | | | | | | |
Textiles, Apparel & Luxury Goods—1.7% | | | | | | | | |
American Apparel, Inc.2 | | | 11,500 | | | | 22,885 | |
Coach, Inc.2 | | | 15,800 | | | | 328,166 | |
Crocs, Inc.1,2 | | | 36,900 | | | | 45,756 | |
FGX International Holdings Ltd.2 | | | 3,500 | | | | 48,090 | |
| Jones Apparel Group, Inc. | | | 169,400 | | | | 992,684 | |
| K-Swiss, Inc., Cl. A | | | 7,100 | | | | 80,940 | |
F3 | OPPENHEIMER MAIN STREET SMALL CAP FUND/ VA
STATEMENT OF INVESTMENTS Continued
| | | | | | | | | |
| | | Shares | | | Value | |
Textiles, Apparel & Luxury Goods Continued | | | | | | | | |
| Kenneth Cole Productions, Inc., Cl. A | | | 11,200 | | | $ | 79,296 | |
Liz Claiborne, Inc.1 | | | 308,903 | | | | 803,148 | |
Maidenform Brands, Inc.2 | | | 26,500 | | | | 268,975 | |
| Movado Group, Inc. | | | 9,300 | | | | 87,327 | |
| Oxford Industries, Inc. | | | 25,300 | | | | 221,881 | |
Perry Ellis International, Inc.2 | | | 35,100 | | | | 222,534 | |
| Phillips/Van Heusen Corp. | | | 49,000 | | | | 986,370 | |
| Polo Ralph Lauren Corp., Cl. A | | | 3,500 | | | | 158,935 | |
Quicksilver, Inc.2 | | | 249,800 | | | | 459,632 | |
Steven Madden Ltd.2 | | | 35,000 | | | | 746,200 | |
Timberland Co., Cl. A2 | | | 71,800 | | | | 829,290 | |
True Religion Apparel, Inc.1,2 | | | 30,900 | | | | 384,396 | |
Unifi, Inc.2 | | | 58,100 | | | | 163,842 | |
| UniFirst Corp. | | | 15,754 | | | | 467,736 | |
Volcom, Inc.2 | | | 2,700 | | | | 29,430 | |
Warnaco Group, Inc. (The)2 | | | 72,104 | | | | 1,415,402 | |
| Wolverine World Wide, Inc. | | | 65,450 | | | | 1,377,068 | |
| | | | | | | | |
| | | | | | | | 10,219,983 | |
| | | | | | | | | |
Consumer Staples—2.1% | | | | | | | | |
Beverages—0.0% | | | | | | | | |
Boston Beer Co., Inc., Cl. A1,2 | | | 6,400 | | | | 181,760 | |
| Coca-Cola Bottling Co. Consolidated | | | 600 | | | | 27,576 | |
| | | | | | | | |
| | | | | | | | 209,336 | |
| | | | | | | | | |
Food & Staples Retailing—0.5% | | | | | | | | |
| Andersons, Inc. (The) | | | 1,600 | | | | 26,368 | |
| Arden Group, Inc., Cl. A | | | 1,405 | | | | 177,030 | |
| Casey’s General Stores, Inc. | | | 8,100 | | | | 184,437 | |
| Ingles Markets, Inc., Cl. A | | | 8,100 | | | | 142,479 | |
Nash Finch Co.1 | | | 19,800 | | | | 888,822 | |
Pantry, Inc. (The)2 | | | 46,700 | | | | 1,001,715 | |
| Spartan Stores, Inc. | | | 19,400 | | | | 451,050 | |
| SUPERVALU, Inc. | | | 11,700 | | | | 170,820 | |
Winn-Dixie Stores, Inc.2 | | | 1,100 | | | | 17,710 | |
| | | | | | | | |
| | | | | | | | 3,060,431 | |
| | | | | | | | | |
Food Products—0.5% | | | | | | | | |
Agria Corp., ADR2 | | | 965 | | | | 1,438 | |
| B&G Foods, Inc., Cl. A | | | 4,100 | | | | 22,140 | |
| Bunge Ltd. | | | 1,900 | | | | 98,363 | |
Chiquita Brands International, Inc.1,2 | | | 48,300 | | | | 713,874 | |
Darling International, Inc.2 | | | 166,000 | | | | 911,340 | |
| Del Monte Foods Co. | | | 31,400 | | | | 224,196 | |
| Diamond Foods, Inc. | | | 23,200 | | | | 467,480 | |
| J&J Snack Foods Corp. | | | 1,600 | | | | 57,408 | |
Omega Protein Corp.2 | | | 36,622 | | | | 146,854 | |
Ralcorp Holdings, Inc.2 | | | 5,000 | | | | 292,000 | |
| Reddy Ice Holdings, Inc. | | | 5,400 | | | | 7,776 | |
| | | | | | | | |
| | | | | | | | 2,942,869 | |
| | | | | | | | | |
Household Products—0.1% | | | | | | | | |
Central Garden & Pet Co., Cl. A2 | | | 39,663 | | | | 234,012 | |
| WD-40 Co. | | | 16,886 | | | | 477,705 | |
| | | | | | | | |
| | | | | | | | 711,717 | |
| | | | | | | | | |
Personal Products—0.8% | | | | | | | | |
American Oriental Bioengineering, Inc.1,2 | | | 138,700 | | | | 941,773 | |
Bare Escentuals, Inc.2 | | | 34,800 | | | | 182,004 | |
Elizabeth Arden, Inc.2 | | | 25,335 | | | | 319,474 | |
| Herbalife Ltd. | | | 50,900 | | | | 1,103,512 | |
| Inter Parfums, Inc. | | | 27,450 | | | | 210,816 | |
NBTY, Inc.2 | | | 77,300 | | | | 1,209,745 | |
| Nu Skin Asia Pacific, Inc., Cl. A | | | 20,400 | | | | 212,772 | |
Prestige Brands Holdings, Inc.2 | | | 71,300 | | | | 752,215 | |
Revlon, Inc., Cl. A2 | | | 1,888 | | | | 12,593 | |
| | | | | | | | |
| | | | | | | | 4,944,904 | |
| | | | | | | | | |
Tobacco—0.2% | | | | | | | | |
Universal Corp.1 | | | 32,000 | | | | 955,840 | |
Energy—6.4% | | | | | | | | |
Energy Equipment & Services—2.9% | | | | | | | | |
Allis-Chalmers Energy, Inc.1,2 | | | 51,400 | | | | 282,700 | |
Basic Energy Services, Inc.1,2 | | | 53,100 | | | | 692,424 | |
| BJ Services Co. | | | 24,300 | | | | 283,581 | |
Bronco Drilling Co., Inc.2 | | | 7,834 | | | | 50,608 | |
Complete Production Services, Inc.2 | | | 108,000 | | | | 880,200 | |
Dawson Geophysical Co.1,2 | | | 11,200 | | | | 199,472 | |
Dresser-Rand Group, Inc.2 | | | 24,300 | | | | 419,175 | |
Dril-Quip, Inc.2 | | | 14,600 | | | | 299,446 | |
ENGlobal Corp.2 | | | 37,100 | | | | 120,575 | |
| ENSCO International, Inc. | | | 13,465 | | | | 382,271 | |
Exterran Holdings, Inc.1,2 | | | 28,500 | | | | 607,050 | |
Forbes Energy Services Ltd.2 | | | 23,600 | | | | 29,871 | |
Forbes Energy Services Ltd., Legend Shares2,3 | | | 101,800 | | | | 128,850 | |
Global Industries Ltd.2 | | | 36,300 | | | | 126,687 | |
| Gulf Island Fabrication, Inc. | | | 35,874 | | | | 516,944 | |
Gulfmark Offshore, Inc.2 | | | 26,900 | | | | 639,951 | |
Helix Energy Solutions Group, Inc.2 | | | 36,400 | | | | 263,536 | |
| Helmerich & Payne, Inc. | | | 3,700 | | | | 84,175 | |
F4 | OPPENHEIMER MAIN STREET SMALL CAP FUND/ VA
| | | | | | | | | |
| | | Shares | | | Value | |
Energy Equipment & Services Continued | | | | | | | | |
Hercules Offshore, Inc.1,2 | | | 55,358 | | | $ | 262,951 | |
Hornbeck Offshore Services, Inc.2 | | | 22,000 | | | | 359,480 | |
ION Geophysical Corp.1,2 | | | 54,600 | | | | 187,278 | |
Key Energy Services, Inc.2 | | | 187,700 | | | | 827,757 | |
Matrix Service Co.2 | | | 15,600 | | | | 119,652 | |
Nabors Industries Ltd.2 | | | 33,400 | | | | 399,798 | |
NATCO Group, Inc., Cl. A2 | | | 10,128 | | | | 153,743 | |
Natural Gas Services Group2 | | | 17,200 | | | | 174,236 | |
Newpark Resources, Inc.2 | | | 117,097 | | | | 433,259 | |
| Noble Corp. | | | 11,200 | | | | 247,408 | |
North American Energy Partners, Inc.2 | | | 18,900 | | | | 63,126 | |
Oceaneering International, Inc.2 | | | 9,200 | | | | 268,088 | |
Oil States International, Inc.1,2 | | | 89,400 | | | | 1,670,886 | |
Parker Drilling Co.2 | | | 202,800 | | | | 588,120 | |
| Patterson-UTI Energy, Inc. | | | 58,900 | | | | 677,939 | |
Pioneer Drilling Co.2 | | | 58,900 | | | | 328,073 | |
Precision Drilling Trust1 | | | 57,868 | | | | 478,944 | |
Pride International, Inc.2 | | | 15,700 | | | | 250,886 | |
Seacor Holdings, Inc.1,2 | | | 21,800 | | | | 1,452,970 | |
| Smith International, Inc. | | | 2,500 | | | | 57,225 | |
Superior Energy Services, Inc.2 | | | 21,900 | | | | 348,867 | |
T-3 Energy Services, Inc.2 | | | 600 | | | | 5,664 | |
Technicoil Corp.2 | | | 126,700 | | | | 41,914 | |
Technicoil Corp., Legend Shares2 | | | 7,100 | | | | 2,349 | |
Tetra Technologies, Inc.2 | | | 76,350 | | | | 371,061 | |
| Tidewater, Inc. | | | 4,400 | | | | 177,188 | |
Union Drilling, Inc.2 | | | 30,948 | | | | 160,620 | |
Unit Corp.2 | | | 33,900 | | | | 905,808 | |
Weatherford International Ltd.2 | | | 23,800 | | | | 257,516 | |
Willbros Group, Inc.2 | | | 30,650 | | | | 259,606 | |
| | | | | | | | |
| | | | | | | | 17,539,928 | |
| | | | | | | | | |
Oil, Gas & Consumable Fuels—3.5% | | | | | | | | |
Abraxas Petroleum Corp.2 | | | 14,300 | | | | 10,296 | |
Alberta Clipper Energy, Inc.2 | | | 3,287 | | | | 1,216 | |
Alon USA Energy, Inc.1 | | | 3,300 | | | | 30,195 | |
Alpha Natural Resources, Inc.2 | | | 8,000 | | | | 129,520 | |
Arena Resources, Inc.2 | | | 4,600 | | | | 129,214 | |
ATP Oil & Gas Corp.1,2 | | | 66,300 | | | | 387,855 | |
| Berry Petroleum Co., Cl. A | | | 106,900 | | | | 808,164 | |
Bill Barrett Corp.2 | | | 45,200 | | | | 955,076 | |
BPZ Resources, Inc.1,2 | | | 14,800 | | | | 94,720 | |
Brigham Exploration Co.2 | | | 75,900 | | | | 242,880 | |
Callon Petroleum Co.2 | | | 49,004 | | | | 127,410 | |
Cano Petroleum, Inc.2 | | | 6,500 | | | | 2,860 | |
Carrizo Oil & Gas, Inc.2 | | | 7,600 | | | | 122,360 | |
Celtic Exploration Ltd., Legend Shares2 | | | 2,800 | | | | 29,019 | |
Cimarex Energy Co.1 | | | 30,700 | | | | 822,146 | |
Contango Oil & Gas Co.2 | | | 1,100 | | | | 61,930 | |
| Crosstex Energy, Inc. | | | 10,000 | | | | 39,000 | |
CVR Energy, Inc.2 | | | 67,800 | | | | 271,200 | |
| Delek US Holdings, Inc. | | | 40,022 | | | | 211,716 | |
Delphi Energy Corp., Legend Shares2 | | | 3,700 | | | | 3,011 | |
Denbury Resources, Inc.2 | | | 34,700 | | | | 378,924 | |
| DHT Maritime, Inc. | | | 2,100 | | | | 11,634 | |
Enbridge Energy Management LLC2 | | | 419 | | | | 10,245 | |
Encore Acquisition Co.2 | | | 9,800 | | | | 250,096 | |
Energy Partners Ltd.2 | | | 64,732 | | | | 87,388 | |
| Foundation Coal Holdings, Inc. | | | 93,500 | | | | 1,310,870 | |
| Frontier Oil Corp. | | | 79,500 | | | | 1,004,085 | |
Frontline Ltd.1 | | | 3,800 | | | | 112,518 | |
Galleon Energy, Inc., Cl. A2 | | | 14,350 | | | | 60,150 | |
Galleon Energy, Inc., Subscription Receipts, Legend Shares2 | | | 11,250 | | | | 47,156 | |
Gasco Energy, Inc.2 | | | 89,600 | | | | 34,944 | |
General Maritime Corp.1 | | | 41,086 | | | | 443,729 | |
GeoResources, Inc.2 | | | 8,400 | | | | 72,996 | |
Great Plains Exploration, Inc.2 | | | 32,360 | | | | 7,447 | |
Gulfport Energy Corp.2 | | | 8,624 | | | | 34,065 | |
| Holly Corp. | | | 23,600 | | | | 430,228 | |
| Houston American Energy Corp. | | | 1,600 | | | | 5,408 | |
International Coal Group, Inc.1,2 | | | 26,100 | | | | 60,030 | |
Jura Energy Corp., Legend Shares2 | | | 110,300 | | | | 8,612 | |
Knightsbridge Tankers Ltd.1 | | | 29,300 | | | | 429,245 | |
Mariner Energy, Inc.2 | | | 130,500 | | | | 1,331,100 | |
| Massey Energy Co. | | | 32,900 | | | | 453,691 | |
McMoRan Exploration Co.2 | | | 28,200 | | | | 276,360 | |
Meridian Resource Corp. (The)2 | | | 44,200 | | | | 25,194 | |
Midnight Oil Exploration Ltd.2 | | | 45,050 | | | | 27,770 | |
Overseas Shipholding Group, Inc.1 | | | 18,503 | | | | 779,161 | |
Paramount Resources Ltd., Cl. A2 | | | 4,500 | | | | 25,409 | |
PetroQuest Energy, Inc.2 | | | 73,300 | | | | 495,508 | |
| Pioneer Natural Resources Co. | | | 7,400 | | | | 119,732 | |
Plains Exploration & Production Co.2 | | | 18,700 | | | | 434,588 | |
Quicksilver Resources, Inc.2 | | | 56,500 | | | | 314,705 | |
Rentech, Inc.2 | | | 11,700 | | | | 7,956 | |
Rosetta Resources, Inc.2 | | | 105,300 | | | | 745,524 | |
| St. Mary Land & Exploration Co. | | | 5,900 | | | | 119,829 | |
Stone Energy Corp.2 | | | 95,284 | | | | 1,050,030 | |
Sunoco, Inc.1 | | | 6,600 | | | | 286,836 | |
Swift Energy Co.2 | | | 60,800 | | | | 1,022,048 | |
Teekay Tankers Ltd., Cl. A1 | | | 25,600 | | | | 325,120 | |
F5 | OPPENHEIMER MAIN STREET SMALL CAP FUND/ VA
STATEMENT OF INVESTMENTS Continued
| | | | | | | | | |
| | | Shares | | | Value | |
Oil, Gas & Consumable Fuels Continued | | | | | | | | |
| Tesoro Corp. | | | 78,121 | | | $ | 1,028,854 | |
Tristar Oil & Gas Ltd.2 | | | 4,800 | | | | 45,014 | |
Tusk Energy Corp.2 | | | 38,312 | | | | 28,969 | |
Tusk Energy Corp., Legend Shares2,4 | | | 21,300 | | | | 16,106 | |
Tusk Energy Corp., Legend Shares2 | | | 77,900 | | | | 58,904 | |
VAALCO Energy, Inc.2 | | | 127,200 | | | | 946,368 | |
Venoco, Inc.1,2 | | | 7,500 | | | | 20,325 | |
Vero Energy, Inc.2 | | | 22,282 | | | | 99,625 | |
| W&T Offshore, Inc. | | | 78,900 | | | | 1,129,848 | |
| Walter Industries, Inc. | | | 11,700 | | | | 204,867 | |
Warren Resources, Inc.2 | | | 25,700 | | | | 51,143 | |
Western Refining, Inc.1 | | | 54,500 | | | | 422,920 | |
Westmoreland Coal Co.2 | | | 3,800 | | | | 42,180 | |
Williams (Clayton) Energy, Inc.2 | | | 2,400 | | | | 109,056 | |
| World Fuel Services Corp. | | | 3,400 | | | | 125,800 | |
| | | | | | | | |
| | | | | | | | 21,450,098 | |
| | | | | | | | | |
Financials—15.9% | | | | | | | | |
Capital Markets—1.2% | | | | | | | | |
Affiliated Managers Group, Inc.2 | | | 4,700 | | | | 197,024 | |
| Ameriprise Financial, Inc. | | | 12,400 | | | | 289,664 | |
| BGC Partners, Inc., Cl. A | | | 7,000 | | | | 19,320 | |
Cohen & Steers, Inc.1 | | | 6,518 | | | | 71,633 | |
E*TRADE Financial Corp.1,2 | | | 461,200 | | | | 530,380 | |
| GAMCO Investors, Inc., Cl. A | | | 7,840 | | | | 214,189 | |
| GFI Group, Inc. | | | 8,800 | | | | 31,152 | |
Investment Technology Group, Inc.2 | | | 13,000 | | | | 295,360 | |
| Janus Capital Group, Inc. | | | 54,400 | | | | 436,832 | |
KBW, Inc.1,2 | | | 10,000 | | | | 230,000 | |
Knight Capital Group, Inc., Cl. A2 | | | 40,342 | | | | 651,523 | |
LaBranche & Co., Inc.2 | | | 124,900 | | | | 598,271 | |
| Legg Mason, Inc. | | | 8,700 | | | | 190,617 | |
| NGP Capital Resources Co. | | | 4,600 | | | | 38,502 | |
Penson Worldwide, Inc.2 | | | 22,900 | | | | 174,498 | |
Piper Jaffray Cos., Inc.2 | | | 21,000 | | | | 834,960 | |
| Sanders Morris Harris Group, Inc. | | | 5,700 | | | | 34,143 | |
| SEI Investments Co. | | | 2,800 | | | | 43,988 | |
Stifel Financial Corp.2 | | | 24,150 | | | | 1,107,278 | |
| SWS Group, Inc. | | | 56,556 | | | | 1,071,736 | |
TD Ameritrade Holding Corp.2 | | | 200 | | | | 2,850 | |
thinkorswim Group, Inc.2 | | | 23,300 | | | | 130,946 | |
Thomas Weisel Partners Group, Inc.2 | | | 4,600 | | | | 21,712 | |
Tradestation Group, Inc.2 | | | 14,900 | | | | 96,105 | |
| U.S. Global Investors, Inc., Cl. A | | | 1,200 | | | | 5,868 | |
| Waddell & Reed Financial, Inc., Cl. A | | | 20,500 | | | | 316,930 | |
| | | | | | | | |
| | | | | | | | 7,635,481 | |
Commercial Banks—4.5% | | | | | | | | |
| 1st Source Corp. | | | 2,964 | | | | 70,039 | |
| Amcore Financial, Inc. | | | 6,534 | | | | 23,653 | |
| BancFirst Corp. | | | 3,800 | | | | 201,096 | |
| Banco Latinoamericano de Exportaciones SA, Cl. E | | | 12,900 | | | | 185,244 | |
Boston Private Financial Holdings, Inc.1 | | | 39,678 | | | | 271,398 | |
Capitol Bancorp Ltd.1 | | | 2,860 | | | | 22,308 | |
Cascade Bancorp1 | | | 6,900 | | | | 46,575 | |
Cathay Bancorp, Inc.1 | | | 26,200 | | | | 622,250 | |
Central Pacific Financial Corp.1 | | | 52,900 | | | | 531,116 | |
| Chemical Financial Corp. | | | 10,700 | | | | 298,316 | |
| Citizens Republic Bancorp, Inc. | | | 43,500 | | | | 129,630 | |
| City Bank Lynnwood, WA | | | 4,100 | | | | 21,320 | |
| City Holding Co. | | | 21,500 | | | | 747,770 | |
CoBiz Financial, Inc.1 | | | 9,500 | | | | 92,530 | |
Colonial BancGroup, Inc. (The)1 | | | 157,600 | | | | 326,232 | |
| Columbia Banking System, Inc. | | | 7,900 | | | | 94,247 | |
| Community Bank System, Inc. | | | 35,600 | | | | 868,284 | |
| Community Trust Bancorp, Inc. | | | 13,800 | | | | 507,150 | |
| East West Bancorp, Inc. | | | 77,018 | | | | 1,229,977 | |
| F.N.B. Corp. | | | 3,700 | | | | 48,840 | |
First Community Bancshares, Inc.1 | | | 5,800 | | | | 202,246 | |
| First Financial Bancorp | | | 15,800 | | | | 195,762 | |
First Horizon National Corp.1 | | | 162,415 | | | | 1,716,727 | |
| First Merchants Corp. | | | 18,100 | | | | 402,001 | |
First Midwest Bancorp, Inc.1 | | | 30,700 | | | | 613,079 | |
First Security Group, Inc.1 | | | 14,300 | | | | 66,066 | |
Frontier Financial Corp.1 | | | 53,070 | | | | 231,385 | |
| Glacier Bancorp, Inc. | | | 2,500 | | | | 47,550 | |
Greene Bankshares, Inc.1 | | | 7,550 | | | | 102,227 | |
Guaranty Bancorp2 | | | 11,100 | | | | 22,200 | |
Hancock Holding Co.1 | | | 1,700 | | | | 77,282 | |
| Hanmi Financial Corp. | | | 16,100 | | | | 33,166 | |
| Huntington Bancshares, Inc. | | | 45,100 | | | | 345,466 | |
| IBERIABANK Corp. | | | 5,000 | | | | 240,000 | |
| Independent Bank Corp. | | | 4,800 | | | | 125,568 | |
| International Bancshares Corp. | | | 15,000 | | | | 327,450 | |
| MainSource Financial Group, Inc. | | | 8,700 | | | | 134,850 | |
MB Financial, Inc.1 | | | 3,700 | | | | 103,415 | |
National Penn Bancshares, Inc.1 | | | 80,700 | | | | 1,170,957 | |
NBT Bancorp, Inc.1 | | | 17,400 | | | | 486,504 | |
Old National Bancorp1 | | | 32,390 | | | | 588,202 | |
| Old Second Bancorp, Inc. | | | 600 | | | | 6,960 | |
| Oriental Financial Group, Inc. | | | 31,100 | | | | 188,155 | |
Pacific Capital Bancorp1 | | | 90,300 | | | | 1,524,264 | |
PacWest Bancorp1 | | | 32,200 | | | | 866,180 | |
F6 | OPPENHEIMER MAIN STREET SMALL CAP FUND/ VA
| | | | | | | | | |
| | | Shares | | | Value | |
Commercial Banks Continued | | | | | | | | |
Park National Corp.1 | | | 2,700 | | | $ | 193,725 | |
Popular, Inc.1 | | | 161,900 | | | | 835,404 | |
| Porter Bancorp, Inc. | | | 2,520 | | | | 38,682 | |
| Prosperity Bancshares, Inc. | | | 6,100 | | | | 180,499 | |
Provident Bankshares Corp.1 | | | 76,100 | | | | 735,126 | |
| Regions Financial Corp. | | | 42,400 | | | | 337,504 | |
| Renasant Corp. | | | 5,900 | | | | 100,477 | |
Republic Bancorp, Inc., Cl. A1 | | | 4,700 | | | | 127,840 | |
Sandy Spring Bancorp, Inc.1 | | | 7,100 | | | | 154,993 | |
Santander BanCorp1 | | | 8,600 | | | | 107,414 | |
Signature Bank2 | | | 1,800 | | | | 51,642 | |
| Simmons First National Corp. | | | 9,600 | | | | 282,912 | |
| South Financial Group, Inc. (The) | | | 75,000 | | | | 324,000 | |
| Southside Bancshares, Inc. | | | 8,400 | | | | 197,400 | |
| Southwest Bancorp, Inc. | | | 400 | | | | 5,184 | |
| Sterling Bancorp | | | 34,300 | | | | 481,229 | |
| Sterling Financial Corp., Western US | | | 32,700 | | | | 287,760 | |
Susquehanna Bancshares, Inc.1 | | | 106,800 | | | | 1,699,188 | |
Tompkins Financial Corp.1 | | | 8,830 | | | | 511,699 | |
| TowneBank | | | 700 | | | | 17,353 | |
| Trustmark Corp. | | | 4,200 | | | | 90,678 | |
| UCBH Holdings, Inc. | | | 84,700 | | | | 582,736 | |
| UMB Financial Corp. | | | 3,900 | | | | 191,646 | |
Umpqua Holdings Corp.1 | | | 25,200 | | | | 364,644 | |
| United Bankshares, Inc. | | | 1,200 | | | | 39,864 | |
United Community Banks, Inc.1 | | | 34,296 | | | | 465,740 | |
Webster Financial Corp.1 | | | 87,000 | | | | 1,198,860 | |
| WesBanco, Inc. | | | 18,800 | | | | 511,548 | |
| West Coast Bancorp | | | 4,208 | | | | 27,731 | |
| Westamerica Bancorp | | | 1,800 | | | | 92,070 | |
Western Alliance Bancorp1,2 | | | 15,808 | | | | 159,503 | |
Whitney Holding Corp.1 | | | 37,900 | | | | 606,021 | |
Wintrust Financial Corp.1 | | | 25,000 | | | | 514,250 | |
| | | | | | | | |
| | | | | | | | 27,670,959 | |
| | | | | | | | | |
Consumer Finance—0.8% | | | | | | | | |
| Advance America Cash Advance Centers, Inc. | | | 3,500 | | | | 6,615 | |
| Advanta Corp., Cl. B | | | 38,250 | | | | 79,943 | |
AmeriCredit Corp.1,2 | | | 131,200 | | | | 1,002,368 | |
| Cash America International, Inc. | | | 48,682 | | | | 1,331,453 | |
| Discover Financial Services | | | 42,200 | | | | 402,166 | |
Dollar Financial Corp.2 | | | 3,085 | | | | 31,776 | |
EZCORP, Inc., Cl. A2 | | | 27,590 | | | | 419,644 | |
First Cash Financial Services, Inc.2 | | | 37,500 | | | | 714,750 | |
First Marblehead Corp. (The)1,2 | | | 42,200 | | | | 54,438 | |
| Nelnet, Inc., Cl. A | | | 19,400 | | | | 278,002 | |
| Student Loan Corp. (The) | | | 1,100 | | | | 45,100 | |
World Acceptance Corp.1,2 | | | 30,500 | | | | 602,680 | |
| | | | | | | | |
| | | | | | | | 4,968,935 | |
| | | | | | | | | |
Diversified Financial Services—0.7% | | | | | | | | |
Asset Acceptance Capital Corp.1,2 | | | 23,000 | | | | 117,530 | |
| CIT Group, Inc. | | | 144,100 | | | | 654,214 | |
Encore Capital Group, Inc.1,2 | | | 4,600 | | | | 33,120 | |
Financial Federal Corp.1 | | | 38,586 | | | | 897,896 | |
Interactive Brokers Group, Inc., Cl. A2 | | | 38,800 | | | | 694,132 | |
Life Partners Holdings, Inc.1 | | | 1,700 | | | | 74,188 | |
MarketAxess Holdings, Inc.2 | | | 16,900 | | | | 137,904 | |
NewStar Financial, Inc.2 | | | 3,500 | | | | 13,965 | |
| NYSE Euronext | | | 10,100 | | | | 276,538 | |
PHH Corp.1,2 | | | 88,800 | | | | 1,130,424 | |
Pico Holdings, Inc.2 | | | 4,200 | | | | 111,636 | |
| | | | | | | | |
| | | | | | | | 4,141,547 | |
| | | | | | | | | |
Insurance—4.8% | | | | | | | | |
| Allied World Assurance Holdings Ltd. | | | 24,340 | | | | 988,204 | |
American Equity Investment Life Holding Co.1 | | | 64,800 | | | | 453,600 | |
| American Financial Group, Inc. | | | 11,700 | | | | 267,696 | |
| American Physicians Capital, Inc. | | | 21,150 | | | | 1,017,315 | |
Amerisafe, Inc.2 | | | 42,900 | | | | 880,737 | |
| AmTrust Financial Services, Inc. | | | 57,500 | | | | 667,000 | |
| Aspen Insurance Holdings Ltd. | | | 72,800 | | | | 1,765,400 | |
| Assured Guaranty Ltd. | | | 6,400 | | | | 72,960 | |
| Axis Capital Holdings Ltd. | | | 6,200 | | | | 180,544 | |
Citizens, Inc.1,2 | | | 5,300 | | | | 51,410 | |
| CNA Financial Corp. | | | 20,700 | | | | 340,308 | |
CNA Surety Corp.2 | | | 31,100 | | | | 597,120 | |
Conseco, Inc.2 | | | 218,900 | | | | 1,133,902 | |
| Delphi Financial Group, Inc., Cl. A | | | 48,950 | | | | 902,638 | |
| Donegal Group, Inc., Cl. A | | | 1,066 | | | | 17,877 | |
eHealth, Inc.2 | | | 2,400 | | | | 31,872 | |
| EMC Insurance Group, Inc. | | | 1,492 | | | | 38,270 | |
| Employers Holdings, Inc. | | | 47,900 | | | | 790,350 | |
| Endurance Specialty Holdings Ltd. | | | 10,300 | | | | 314,459 | |
| FBL Financial Group, Inc., Cl. A | | | 27,510 | | | | 425,030 | |
First Mercury Financial Corp.2 | | | 3,100 | | | | 44,206 | |
FPIC Insurance Group, Inc.2 | | | 16,900 | | | | 739,882 | |
| Genworth Financial, Inc., Cl. A | | | 85,700 | | | | 242,531 | |
Hallmark Financial Services, Inc.2 | | | 7,400 | | | | 64,898 | |
| Harleysville Group, Inc. | | | 19,000 | | | | 659,870 | |
F7 | OPPENHEIMER MAIN STREET SMALL CAP FUND/ VA
STATEMENT OF INVESTMENTS Continued
| | | | | | | | | |
| | | Shares | | | Value | |
Insurance Continued | | | | | | | | |
| Horace Mann Educators Corp. | | | 45,707 | | | $ | 420,047 | |
| Infinity Property & Casualty Corp. | | | 16,200 | | | | 757,026 | |
| IPC Holdings Ltd. | | | 54,500 | | | | 1,629,550 | |
| Lincoln National Corp. | | | 9,700 | | | | 182,748 | |
| Maiden Holdings Ltd. | | | 2,200 | | | | 6,886 | |
Max Capital Group Ltd.1 | | | 103,500 | | | | 1,831,950 | |
| Meadowbrook Insurance Group, Inc. | | | 39,405 | | | | 253,768 | |
| National Financial Partners Corp. | | | 27,000 | | | | 82,080 | |
National Interstate Corp.1 | | | 10,000 | | | | 178,700 | |
| National Western Life Insurance Co., Cl. A | | | 500 | | | | 84,585 | |
| Nationwide Financial Services, Inc., Cl. A | | | 13,600 | | | | 710,056 | |
Navigators Group, Inc. (The)2 | | | 12,200 | | | | 669,902 | |
| NYMAGIC, Inc. | | | 500 | | | | 9,525 | |
| Old Republic International Corp. | | | 4,200 | | | | 50,064 | |
| OneBeacon Insurance Group Ltd. | | | 18,880 | | | | 197,107 | |
Phoenix Cos., Inc. (The)1 | | | 86,994 | | | | 284,470 | |
| Platinum Underwriters Holdings Ltd. | | | 45,200 | | | | 1,630,816 | |
PMA Capital Corp., Cl. A2 | | | 12,500 | | | | 88,500 | |
| Presidential Life Corp. | | | 6,083 | | | | 60,161 | |
ProAssurance Corp.1,2 | | | 25,300 | | | | 1,335,334 | |
| Protective Life Corp. | | | 68,700 | | | | 985,845 | |
RLI Corp.1 | | | 13,700 | | | | 837,892 | |
| Safety Insurance Group, Inc. | | | 15,300 | | | | 582,318 | |
Seabright Insurance Holdings, Inc.2 | | | 21,000 | | | | 246,540 | |
Selective Insurance Group, Inc.1 | | | 43,272 | | | | 992,227 | |
| StanCorp Financial Group, Inc. | | | 6,500 | | | | 271,505 | |
| State Auto Financial Corp. | | | 2,800 | | | | 84,168 | |
| Stewart Information Services Corp. | | | 7,574 | | | | 177,913 | |
| Transatlantic Holdings, Inc. | | | 3,200 | | | | 128,192 | |
United America Indemnity Ltd., Cl. A2 | | | 31,973 | | | | 409,574 | |
| United Fire & Casualty Co. | | | 6,700 | | | | 208,169 | |
| Unitrin, Inc. | | | 44,500 | | | | 709,330 | |
| UnumProvident Corp. | | | 21,400 | | | | 398,040 | |
| Zenith National Insurance Corp. | | | 4,276 | | | | 134,993 | |
| | | | | | | | |
| | | | | | | | 29,318,060 | |
| | | | | | | | | |
Real Estate Investment Trusts—2.9% | | | | | | | | |
| Acadia Realty Trust | | | 2,400 | | | | 34,248 | |
| Agree Realty Corp. | | | 9,000 | | | | 163,170 | |
Alexander’s, Inc.1 | | | 300 | | | | 76,470 | |
| Alexandria Real Estate Equities, Inc. | | | 10,600 | | | | 639,604 | |
| American Campus Communities, Inc. | | | 4,300 | | | | 88,064 | |
Arbor Realty Trust, Inc.1 | | | 3,800 | | | | 11,210 | |
| Ashford Hospitality Trust | | | 48,200 | | | | 55,430 | |
| Associated Estates Realty Corp. | | | 5,700 | | | | 52,041 | |
| BioMed Realty Trust, Inc. | | | 49,430 | | | | 579,320 | |
Brandywine Realty Trust1 | | | 22,814 | | | | 175,896 | |
Capital Lease Funding, Inc.1 | | | 16,900 | | | | 29,237 | |
| CBL & Associates Properties, Inc. | | | 18,400 | | | | 119,600 | |
| Cedar Shopping Centers, Inc. | | | 10,400 | | | | 73,632 | |
Colonial Properties Trust1 | | | 9,800 | | | | 81,634 | |
Corporate Office Properties Trust1 | | | 13,110 | | | | 402,477 | |
| DCT Industrial Trust, Inc. | | | 11,400 | | | | 57,684 | |
| DiamondRock Hospitality Co. | | | 86,200 | | | | 437,034 | |
Digital Realty Trust, Inc.1 | | | 17,800 | | | | 584,730 | |
| EastGroup Properties, Inc. | | | 13,600 | | | | 483,888 | |
| Entertainment Properties Trust | | | 21,340 | | | | 635,932 | |
| Equity Lifestyle Properties, Inc. | | | 4,600 | | | | 176,456 | |
Equity One, Inc.1 | | | 3,700 | | | | 65,490 | |
| Extra Space Storage, Inc. | | | 26,900 | | | | 277,608 | |
| FelCor Lodging Trust, Inc. | | | 71,500 | | | | 131,560 | |
First Industrial Realty Trust, Inc.1 | | | 43,800 | | | | 330,690 | |
| First Potomac Realty Trust | | | 4,900 | | | | 45,570 | |
| Glimcher Realty Trust | | | 4,800 | | | | 13,488 | |
| Gramercy Capital Corp. | | | 5,800 | | | | 7,424 | |
| Healthcare Realty Trust, Inc. | | | 15,900 | | | | 373,332 | |
| Hersha Hospitality Trust | | | 10,300 | | | | 30,900 | |
| Highwoods Properties, Inc. | | | 31,000 | | | | 848,160 | |
Home Properties of New York, Inc.1 | | | 15,400 | | | | 625,240 | |
| Inland Real Estate Corp. | | | 39,200 | | | | 508,816 | |
| Investors Real Estate Trust | | | 1,900 | | | | 20,349 | |
| Kite Realty Group Trust | | | 21,900 | | | | 121,764 | |
LaSalle Hotel Properties1 | | | 19,800 | | | | 218,790 | |
Lexington Realty Trust1 | | | 32,000 | | | | 160,000 | |
| LTC Properties, Inc. | | | 14,800 | | | | 300,144 | |
Medical Properties Trust, Inc.1 | | | 30,400 | | | | 191,824 | |
| Mid-America Apartment Communities, Inc. | | | 16,600 | | | | 616,856 | |
| National Health Investors, Inc. | | | 8,300 | | | | 227,669 | |
| National Retail Properties, Inc. | | | 50,900 | | | | 874,971 | |
| Nationwide Health Properties, Inc. | | | 29,400 | | | | 844,368 | |
| Omega Healthcare Investors, Inc. | | | 50,240 | | | | 802,333 | |
| Parkway Properties, Inc. | | | 12,300 | | | | 221,400 | |
Pennsylvania Real Estate Investment Trust1 | | | 23,400 | | | | 174,330 | |
| Post Properties, Inc. | | | 4,900 | | | | 80,850 | |
| Potlatch Corp. | | | 14,210 | | | | 369,602 | |
| PS Business Parks, Inc. | | | 6,500 | | | | 290,290 | |
| Ramco-Gershenson Properties Trust | | | 7,400 | | | | 45,732 | |
F8 | OPPENHEIMER MAIN STREET SMALL CAP FUND/ VA
| | | | | | | | | |
| | | Shares | | | Value | |
Real Estate Investment Trusts Continued | | | | | | | | |
Realty Income Corp.1 | | | 23,900 | | | $ | 553,285 | |
| Saul Centers, Inc. | | | 3,200 | | | | 126,400 | |
Senior Housing Properties Trust1 | | | 64,900 | | | | 1,163,008 | |
| SL Green Realty Corp. | | | 13,300 | | | | 344,470 | |
| Sovran Self Storage, Inc. | | | 4,900 | | | | 176,400 | |
| Strategic Hotels & Resorts, Inc. | | | 39,700 | | | | 66,696 | |
| Sunstone Hotel Investors, Inc. | | | 35,179 | | | | 217,758 | |
| Tanger Factory Outlet Centers, Inc. | | | 9,700 | | | | 364,914 | |
| Taubman Centers, Inc. | | | 10,300 | | | | 262,238 | |
| Universal Health Realty Income Trust | | | 500 | | | | 16,455 | |
| Urstadt Biddle Properties, Inc., Cl. A | | | 1,200 | | | | 19,116 | |
| Washington Real Estate Investment Trust | | | 14,100 | | | | 399,030 | |
| | | | | | | | |
| | | | | | | | 17,487,077 | |
| | | | | | | | | |
Real Estate Management & Development—0.1% | | | | | | | | |
Avatar Holdings, Inc.2 | | | 2,446 | | | | 64,868 | |
CB Richard Ellis Group, Inc., Cl. A2 | | | 40,700 | | | | 175,824 | |
| Consolidated-Tomoka Land Co. | | | 400 | | | | 15,276 | |
Forest City Enterprises, Inc., Cl. A1 | | | 22,100 | | | | 148,070 | |
Forestar Group, Inc.2 | | | 2,600 | | | | 24,752 | |
| Jones Lang LaSalle, Inc. | | | 9,400 | | | | 260,380 | |
Tejon Ranch Co.2 | | | 100 | | | | 2,474 | |
| | | | | | | | |
| | | | | | | | 691,644 | |
| | | | | | | | | |
Thrifts & Mortgage Finance—0.9% | | | | | | | | |
Anchor BanCorp Wisconsin, Inc.1 | | | 10,500 | | | | 28,980 | |
| Bank Mutual Corp. | | | 33,100 | | | | 381,974 | |
| BankFinancial Corp. | | | 2,684 | | | | 27,350 | |
Corus Bankshares, Inc.1 | | | 4,000 | | | | 4,440 | |
| Dime Community Bancshares, Inc. | | | 49,200 | | | | 654,360 | |
Doral Financial Corp.2 | | | 800 | | | | 6,000 | |
Encore Bancshares, Inc.2 | | | 8,400 | | | | 92,400 | |
| First Niagara Financial Group, Inc. | | | 5,000 | | | | 80,850 | |
| First Place Financial Corp. | | | 4,648 | | | | 17,802 | |
Flagstar Bancorp, Inc.2 | | | 15,900 | | | | 11,289 | |
| Flushing Financial Corp. | | | 26,800 | | | | 320,528 | |
MGIC Investment Corp.1 | | | 227,599 | | | | 792,045 | |
| NewAlliance Bancshares, Inc. | | | 11,000 | | | | 144,870 | |
| OceanFirst Financial Corp. | | | 4,800 | | | | 79,680 | |
Ocwen Financial Corp.1,2 | | | 54,200 | | | | 497,556 | |
| PMI Group, Inc. (The) | | | 164,500 | | | | 320,775 | |
Provident Financial Services, Inc.1 | | | 39,500 | | | | 604,350 | |
| Provident New York Bancorp | | | 34,100 | | | | 422,840 | |
Radian Group, Inc.1 | | | 157,100 | | | | 578,128 | |
| TierOne Corp. | | | 8,100 | | | | 30,375 | |
Tree.com, Inc.2 | | | 1,386 | | | | 3,604 | |
| Trustco Bank Corp. NY | | | 3,100 | | | | 29,481 | |
| WSFS Financial Corp. | | | 4,100 | | | | 196,759 | |
| | | | | | | | |
| | | | | | | | 5,326,436 | |
| | | | | | | | | |
Health Care—7.5% | | | | | | | | |
Biotechnology—1.3% | | | | | | | | |
Acorda Therapeutics, Inc.2 | | | 10,500 | | | | 215,355 | |
Alexion Pharmaceuticals, Inc.1,2 | | | 11,900 | | | | 430,661 | |
Allos Therapeutics, Inc.2 | | | 33,870 | | | | 207,284 | |
Alnylam Pharmaceuticals, Inc.1,2 | | | 4,300 | | | | 106,339 | |
Array BioPharma, Inc.2 | | | 5,300 | | | | 21,465 | |
Celldex Therapeutics, Inc.2 | | | 9,375 | | | | 74,250 | |
Cepheid, Inc.2 | | | 7,900 | | | | 82,002 | |
Cubist Pharmaceuticals, Inc.2 | | | 46,800 | | | | 1,130,688 | |
CV Therapeutics, Inc.2 | | | 38,900 | | | | 358,269 | |
Dendreon Corp.2 | | | 48,700 | | | | 223,046 | |
Emergent Biosolutions, Inc.2 | | | 31,910 | | | | 833,170 | |
Enzon Pharmaceuticals, Inc.1,2 | | | 72,400 | | | | 422,092 | |
Facet Biotech Corp.2 | | | 23,120 | | | | 221,721 | |
Geron Corp.1,2 | | | 17,200 | | | | 80,324 | |
GTx, Inc.1,2 | | | 11,400 | | | | 191,976 | |
Halozyme Therapeutics, Inc.2 | | | 4,500 | | | | 25,200 | |
Human Genome Sciences, Inc.2 | | | 50,400 | | | | 106,848 | |
Incyte Corp.2 | | | 25,300 | | | | 95,887 | |
Isis Pharmaceuticals, Inc.2 | | | 4,900 | | | | 69,482 | |
Ligand Pharmaceuticals, Inc., Cl. B2 | | | 8,400 | | | | 23,016 | |
MannKind Corp.1,2 | | | 29,592 | | | | 101,501 | |
Martek Biosciences Corp.1 | | | 19,019 | | | | 576,466 | |
Momenta Pharmaceuticals, Inc.1,2 | | | 43,300 | | | | 502,280 | |
Myriad Genetics, Inc.2 | | | 7,400 | | | | 490,324 | |
Nabi Biopharmaceuticals, Inc.2 | | | 7,800 | | | | 26,130 | |
NPS Pharmaceuticals, Inc.2 | | | 9,000 | | | | 55,890 | |
OSI Pharmaceuticals, Inc.2 | | | 2,400 | | | | 93,720 | |
Osiris Therapeutics, Inc.1,2 | | | 5,500 | | | | 105,380 | |
| PDL BioPharma, Inc. | | | 115,600 | | | | 714,408 | |
Progenics Pharmaceuticals, Inc.1,2 | | | 23,589 | | | | 243,203 | |
Rigel Pharmaceuticals, Inc.2 | | | 10,600 | | | | 84,800 | |
RXi Pharmaceuticals Corp.1,2 | | | 3,885 | | | | 22,339 | |
Savient Pharmaceuticals, Inc.1,2 | | | 50,185 | | | | 290,571 | |
ZymoGenetics, Inc.1,2 | | | 8,200 | | | | 24,600 | |
| | | | | | | | |
| | | | | | | | 8,250,687 | |
| | | | | | | | | |
Health Care Equipment & Supplies—1.6% | | | | | | | | |
Abaxis, Inc.2 | | | 7,690 | | | | 123,271 | |
Advanced Medical Optics, Inc.2 | | | 32,512 | | | | 214,904 | |
Align Technology, Inc.1,2 | | | 35,300 | | | | 308,875 | |
F9 | OPPENHEIMER MAIN STREET SMALL CAP FUND/ VA
STATEMENT OF INVESTMENTS Continued
| | | | | | | | | |
| | | Shares | | | Value | |
Health Care Equipment & Supplies Continued | | | | | | | | |
American Medical Systems Holdings, Inc.2 | | | 7,900 | | | $ | 71,021 | |
| Analogic Corp. | | | 30,900 | | | | 842,952 | |
AngioDynamics, Inc.2 | | | 12,200 | | | | 167,018 | |
Cardiac Science Corp.2 | | | 1,398 | | | | 10,485 | |
ConMed Corp.2 | | | 23,700 | | | | 567,378 | |
CryoLife, Inc.2 | | | 42,800 | | | | 415,588 | |
Cyberonics, Inc.1,2 | | | 42,403 | | | | 702,618 | |
| Datascope Corp. | | | 13,900 | | | | 726,136 | |
Exactech, Inc.2 | | | 11,100 | | | | 186,924 | |
Invacare Corp.1 | | | 5,200 | | | | 80,704 | |
Inverness Medical Innovations, Inc.2 | | | 6,500 | | | | 122,915 | |
IRIS International, Inc.2 | | | 8,600 | | | | 119,884 | |
Kensey Nash Corp.2 | | | 26,700 | | | | 518,247 | |
Merit Medical Systems, Inc.2 | | | 38,800 | | | | 695,684 | |
Natus Medical, Inc.2 | | | 27,000 | | | | 349,650 | |
Neogen Corp.2 | | | 1,910 | | | | 47,712 | |
Orthofix International NV2 | | | 7,500 | | | | 114,975 | |
Palomar Medical Technologies, Inc.2 | | | 11,000 | | | | 126,830 | |
Quidel Corp.2 | | | 42,200 | | | | 551,554 | |
Sirona Dental Systems, Inc.1,2 | | | 7,000 | | | | 73,500 | |
Somanetics Corp.2 | | | 24,000 | | | | 396,240 | |
SonoSite, Inc.1,2 | | | 14,417 | | | | 275,076 | |
Spectranetics Corp. (The)2 | | | 1,700 | | | | 4,437 | |
Stereotaxis, Inc.1,2 | | | 4,900 | | | | 21,560 | |
| Steris Corp. | | | 19,800 | | | | 473,022 | |
Symmetry Medical, Inc.2 | | | 13,900 | | | | 110,783 | |
Synovis Life Technologies, Inc.2 | | | 15,300 | | | | 286,722 | |
VNUS Medical Technologies, Inc.2 | | | 15,460 | | | | 250,761 | |
Volcano Corp.2 | | | 5,600 | | | | 84,000 | |
Zoll Medical Corp.2 | | | 31,700 | | | | 598,813 | |
| | | | | | | | |
| | | | | | | | 9,640,239 | |
| | | | | | | | | |
Health Care Providers & Services—3.2% | | | | | | | | |
Air Methods Corp.2 | | | 2,000 | | | | 31,980 | |
Alliance Imaging, Inc.2 | | | 42,900 | | | | 341,913 | |
Almost Family, Inc.1,2 | | | 4,200 | | | | 188,916 | |
AMERIGROUP Corp.2 | | | 70,500 | | | | 2,081,160 | |
AMN Healthcare Services, Inc.2 | | | 36,400 | | | | 307,944 | |
Assisted Living Concepts, Inc.1,2 | | | 11,600 | | | | 48,140 | |
athenahealth, Inc.2 | | | 1,800 | | | | 67,716 | |
Brookdale Senior Living, Inc.1 | | | 44,300 | | | | 247,194 | |
Catalyst Health Solutions, Inc.2 | | | 25,448 | | | | 619,659 | |
Centene Corp.2 | | | 87,100 | | | | 1,716,741 | |
| Chemed Corp. | | | 25,360 | | | | 1,008,567 | |
Chindex International, Inc.1,2 | | | 4,750 | | | | 37,763 | |
| CIGNA Corp. | | | 18,300 | | | | 308,355 | |
Community Health Systems, Inc.2 | | | 7,700 | | | | 112,266 | |
CorVel Corp.2 | | | 5,900 | | | | 129,682 | |
Coventry Health Care, Inc.2 | | | 7,900 | | | | 117,552 | |
Cross Country Healthcare, Inc.2 | | | 25,700 | | | | 225,903 | |
| Enstar Group, Inc. (The) | | | 2,300 | | | | 38,502 | |
Gentiva Health Services, Inc.2 | | | 9,500 | | | | 277,970 | |
Hanger Orthopedic Group, Inc.2 | | | 45,800 | | | | 664,558 | |
Health Management Associates, Inc., Cl. A2 | | | 31,900 | | | | 57,101 | |
Health Net, Inc.2 | | | 43,400 | | | | 472,626 | |
HEALTHSOUTH Corp.2 | | | 3,700 | | | | 40,552 | |
Healthspring, Inc.2 | | | 70,700 | | | | 1,411,879 | |
Healthways, Inc.2 | | | 24,137 | | | | 277,093 | |
InVentiv Health, Inc.2 | | | 20,582 | | | | 237,516 | |
Kindred Healthcare, Inc.2 | | | 59,700 | | | | 777,294 | |
| Landauer, Inc. | | | 13,200 | | | | 967,560 | |
LifePoint Hospitals, Inc.1,2 | | | 76,800 | | | | 1,754,112 | |
Lincare Holdings, Inc.1,2 | | | 31,100 | | | | 837,523 | |
MedCath Corp.2 | | | 10,800 | | | | 112,752 | |
Molina Healthcare, Inc.1,2 | | | 36,200 | | | | 637,482 | |
Odyssey Healthcare, Inc.2 | | | 18,700 | | | | 172,975 | |
| Owens & Minor, Inc. | | | 1,100 | | | | 41,415 | |
Pediatrix Medical Group, Inc.2 | | | 9,700 | | | | 307,490 | |
PharMerica Corp.1,2 | | | 43,900 | | | | 687,913 | |
Providence Service Corp.2 | | | 4,400 | | | | 6,380 | |
RehabCare Group, Inc.2 | | | 37,500 | | | | 568,500 | |
Res-Care, Inc.2 | | | 23,156 | | | | 347,803 | |
Skilled Healthcare Group, Inc., Cl. A2 | | | 7,300 | | | | 61,612 | |
Sun Healthcare Group, Inc.2 | | | 7,792 | | | | 68,959 | |
Universal American Corp.2 | | | 26,507 | | | | 233,792 | |
WellCare Health Plans, Inc.2 | | | 48,440 | | | | 622,938 | |
| | | | | | | | |
| | | | | | | | 19,275,748 | |
| | | | | | | | | |
Health Care Technology—0.1% | | | | | | | | |
| Allscripts-Misys Healthcare Solutions, Inc. | | | 26,200 | | | | 259,904 | |
| Computer Programs & Systems, Inc. | | | 7,100 | | | | 190,280 | |
| IMS Health, Inc. | | | 4,600 | | | | 69,736 | |
Omnicell, Inc.2 | | | 23,187 | | | | 283,113 | |
| | | | | | | | |
| | | | | | | | 803,033 | |
| | | | | | | | | |
Life Sciences Tools & Services—0.6% | | | | | | | | |
Albany Molecular Research, Inc.2 | | | 38,600 | | | | 375,964 | |
Bio-Rad Laboratories, Inc., Cl. A2 | | | 3,700 | | | | 278,647 | |
Bruker Corp.2 | | | 6,100 | | | | 24,644 | |
F10 | OPPENHEIMER MAIN STREET SMALL CAP FUND/ VA
| | | | | | | | | |
| | | Shares | | | Value | |
Life Sciences Tools & Services Continued | | | | | | | | |
Dionex Corp.2 | | | 900 | | | $ | 40,365 | |
Enzo Biochem, Inc.2 | | | 2,300 | | | | 11,247 | |
eResearch Technology, Inc.2 | | | 65,800 | | | | 436,254 | |
Kendle International, Inc.2 | | | 3,700 | | | | 95,164 | |
Life Sciences Research, Inc.2 | | | 6,600 | | | | 62,040 | |
Luminex Corp.1,2 | | | 24,600 | | | | 525,456 | |
Medivation, Inc.1,2 | | | 20,300 | | | | 295,771 | |
Nektar Therapeutics2 | | | 36,000 | | | | 200,160 | |
Parexel International Corp.2 | | | 53,600 | | | | 520,456 | |
Sequenom, Inc.2 | | | 8,700 | | | | 172,608 | |
Varian, Inc.2 | | | 10,900 | | | | 365,259 | |
| | | | | | | | |
| | | | | | | | 3,404,035 | |
| | | | | | | | | |
Pharmaceuticals—0.7% | | | | | | | | |
Adolor Corp.2 | | | 47,440 | | | | 78,750 | |
Auxilium Pharmaceuticals, Inc.2 | | | 14,100 | | | | 401,004 | |
BioMimetic Therapeutics, Inc.1,2 | | | 4,500 | | | | 41,490 | |
CPEX Pharmaceuticals, Inc.2 | | | 350 | | | | 3,413 | |
Cypress Bioscience, Inc.2 | | | 9,800 | | | | 67,032 | |
Durect Corp.2 | | | 4,298 | | | | 14,570 | |
Forest Laboratories, Inc.2 | | | 11,710 | | | | 298,254 | |
K-V Pharmaceutical Co., Cl. A2 | | | 7,313 | | | | 21,061 | |
King Pharmaceuticals, Inc.1,2 | | | 35,700 | | | | 379,134 | |
Medicis Pharmaceutical Corp., Cl. A1 | | | 106,400 | | | | 1,478,960 | |
MiddleBrook Pharmaceuticals, Inc.1,2 | | | 20,000 | | | | 30,000 | |
Noven Pharmaceuticals, Inc.2 | | | 32,877 | | | | 361,647 | |
Optimer Pharmaceuticals, Inc.2 | | | 2,400 | | | | 29,064 | |
Pain Therapeutics, Inc.1,2 | | | 30,001 | | | | 177,606 | |
Par Pharmaceutical Cos., Inc.2 | | | 21,700 | | | | 290,997 | |
Pozen, Inc.1,2 | | | 16,800 | | | | 84,672 | |
Questcor Pharmaceuticals, Inc.2 | | | 4,900 | | | | 45,619 | |
Salix Pharmaceuticals Ltd.1,2 | | | 20,600 | | | | 181,898 | |
Valeant Pharmaceuticals International, Inc.2 | | | 3,700 | | | | 84,730 | |
ViroPharma, Inc.2 | | | 5,500 | | | | 71,610 | |
Vivus, Inc.1,2 | | | 43,000 | | | | 228,760 | |
| | | | | | | | |
| | | | | | | | 4,370,271 | |
| | | | | | | | | |
Industrials—21.0% | | | | | | | | |
Aerospace & Defense—1.5% | | | | | | | | |
Aerovironment, Inc.1,2 | | | 9,268 | | | | 341,155 | |
| American Science & Engineering, Inc. | | | 1,600 | | | | 118,336 | |
| Applied Signal Technology, Inc. | | | 1,000 | | | | 17,940 | |
Argon ST, Inc.2 | | | 12,700 | | | | 239,522 | |
Astronics Corp., Cl. B2 | | | 812 | | | | 6,975 | |
Axsys Technologies, Inc.2 | | | 3,113 | | | | 170,779 | |
BE Aerospace, Inc.2 | | | 98,700 | | | | 759,003 | |
Ceradyne, Inc.1,2 | | | 57,240 | | | | 1,162,544 | |
| Cubic Corp. | | | 41,030 | | | | 1,116,016 | |
| Ducommun, Inc. | | | 30,400 | | | | 507,680 | |
DynCorp International, Inc., Cl. A2 | | | 46,800 | | | | 709,956 | |
Esterline Technologies Corp.2 | | | 45,500 | | | | 1,723,995 | |
Gencorp, Inc.1,2 | | | 56,000 | | | | 206,080 | |
| Goodrich Corp. | | | 6,400 | | | | 236,928 | |
Herley Industries, Inc.2 | | | 3,000 | | | | 36,840 | |
Ladish Co., Inc.2 | | | 6,900 | | | | 95,565 | |
| Precision Castparts Corp. | | | 5,300 | | | | 315,244 | |
Taser International, Inc.2 | | | 21,444 | | | | 113,224 | |
Triumph Group, Inc.1 | | | 23,600 | | | | 1,002,056 | |
| | | | | | | | |
| | | | | | | | 8,879,838 | |
| | | | | | | | | |
Air Freight & Logistics—0.3% | | | | | | | | |
Air Transport Services Group, Inc.2 | | | 11,100 | | | | 1,998 | |
Atlas Air Worldwide Holdings, Inc.2 | | | 30,000 | | | | 567,000 | |
Hub Group, Inc., Cl. A2 | | | 8,844 | | | | 234,631 | |
| Pacer International, Inc. | | | 86,200 | | | | 899,066 | |
| | | | | | | | |
| | | | | | | | 1,702,695 | |
| | | | | | | | | |
Airlines—0.8% | | | | | | | | |
Continental Airlines, Inc., Cl. B1,2 | | | 23,310 | | | | 420,979 | |
Hawaiian Holdings, Inc.2 | | | 86,900 | | | | 554,422 | |
Republic Airways Holdings, Inc.2 | | | 70,500 | | | | 752,235 | |
| SkyWest, Inc. | | | 77,000 | | | | 1,432,200 | |
| UAL Corp. | | | 72,900 | | | | 803,358 | |
US Airways Group, Inc.2 | | | 158,500 | | | | 1,225,205 | |
| | | | | | | | |
| | | | | | | | 5,188,399 | |
| | | | | | | | | |
Building Products—1.3% | | | | | | | | |
| Aaon, Inc. | | | 29,500 | | | | 615,960 | |
American Woodmark Corp.1 | | | 10,835 | | | | 197,522 | |
| Ameron International Corp. | | | 16,614 | | | | 1,045,353 | |
| Apogee Enterprises, Inc. | | | 44,600 | | | | 462,056 | |
| Armstrong World Industries, Inc. | | | 27,700 | | | | 598,874 | |
| Gibraltar Industries, Inc. | | | 61,100 | | | | 729,534 | |
Griffon Corp.1,2 | | | 51,119 | | | | 476,940 | |
Insteel Industries, Inc.1 | | | 53,600 | | | | 605,144 | |
| Lennox International, Inc. | | | 9,100 | | | | 293,839 | |
NCI Building Systems, Inc.1,2 | | | 49,600 | | | | 808,480 | |
| Quanex Building Products Corp. | | | 71,730 | | | | 672,110 | |
Trex Co., Inc.1,2 | | | 31,460 | | | | 517,832 | |
Universal Forest Products, Inc.1 | | | 31,920 | | | | 858,967 | |
| | | | | | | | |
| | | | | | | | 7,882,611 | |
F11 | OPPENHEIMER MAIN STREET SMALL CAP FUND/ VA
STATEMENT OF INVESTMENTS Continued
| | | | | | | | | |
| | | Shares | | | Value | |
Commercial Services & Supplies—5.3% | | | | | | | | |
Acco Brands Corp.2 | | | 38,513 | | | $ | 132,870 | |
| Administaff, Inc. | | | 55,800 | | | | 1,209,744 | |
Advisory Board Co. (The)2 | | | 2,100 | | | | 46,830 | |
| American Ecology Corp. | | | 30,700 | | | | 621,061 | |
American Reprographics Co.2 | | | 50,300 | | | | 347,070 | |
AMREP Corp.1,2 | | | 1,676 | | | | 52,425 | |
ATC Technology Corp.2 | | | 25,500 | | | | 373,065 | |
| Bowne & Co., Inc. | | | 41,600 | | | | 244,608 | |
| Brink’s Co. (The) | | | 10,100 | | | | 271,488 | |
Casella Waste Systems, Inc., Cl. A2 | | | 10,475 | | | | 42,738 | |
CBIZ, Inc.1,2 | | | 90,600 | | | | 783,690 | |
| CDI Corp. | | | 48,187 | | | | 623,540 | |
Cenveo, Inc.1,2 | | | 40,300 | | | | 179,335 | |
Clean Harbors, Inc.2 | | | 3,700 | | | | 234,728 | |
Comfort Systems USA, Inc.1 | | | 86,700 | | | | 924,222 | |
COMSYS IT Partners, Inc.2 | | | 9,500 | | | | 21,280 | |
Consolidated Graphics, Inc.2 | | | 28,900 | | | | 654,296 | |
Copart, Inc.2 | | | 2,000 | | | | 54,380 | |
Cornell Corrections, Inc.2 | | | 25,900 | | | | 481,481 | |
| Corporate Executive Board Co. (The) | | | 23,800 | | | | 525,028 | |
CoStar Group, Inc.2 | | | 17,100 | | | | 563,274 | |
| Courier Corp. | | | 4,424 | | | | 79,190 | |
CRA International, Inc.2 | | | 21,500 | | | | 578,995 | |
| Deluxe Corp. | | | 124,000 | | | | 1,855,040 | |
| EnergySolutions, Inc. | | | 39,600 | | | | 223,740 | |
| Ennis, Inc. | | | 19,700 | | | | 238,567 | |
| Equifax, Inc. | | | 7,300 | | | | 193,596 | |
Exponent, Inc.2 | | | 32,880 | | | | 989,030 | |
First Advantage Corp., Cl. A2 | | | 13,300 | | | | 188,195 | |
| G&K Services, Inc., Cl. A | | | 23,000 | | | | 465,060 | |
Heidrick & Struggles International, Inc.1 | | | 26,600 | | | | 572,964 | |
Hill International, Inc.2 | | | 41,000 | | | | 288,640 | |
HNI Corp.1 | | | 73,400 | | | | 1,162,656 | |
Hudson Highland Group, Inc.2 | | | 29,000 | | | | 97,150 | |
ICF International, Inc.2 | | | 17,600 | | | | 432,432 | |
| Interface, Inc., Cl. A | | | 128,800 | | | | 597,632 | |
| Kelly Services, Inc., Cl. A | | | 37,585 | | | | 488,981 | |
Kforce, Inc.2 | | | 22,026 | | | | 169,160 | |
| Kimball International, Inc., Cl. B | | | 22,400 | | | | 192,864 | |
| Knoll, Inc. | | | 61,478 | | | | 554,532 | |
Korn-Ferry International2 | | | 102,300 | | | | 1,168,266 | |
M&F Worldwide Corp.2 | | | 3,541 | | | | 54,708 | |
| Manpower, Inc. | | | 11,400 | | | | 387,486 | |
| McGrath Rentcorp | | | 12,800 | | | | 273,408 | |
Metalico, Inc.1,2 | | | 37,700 | | | | 58,435 | |
| Miller (Herman), Inc. | | | 101,300 | | | | 1,319,939 | |
Monster Worldwide, Inc.1,2 | | | 125,940 | | | | 1,522,615 | |
MPS Group, Inc.2 | | | 204,700 | | | | 1,541,391 | |
On Assignment, Inc.2 | | | 35,200 | | | | 199,584 | |
PRG-Schultz International, Inc.2 | | | 1,300 | | | | 5,304 | |
| R.R. Donnelley & Sons Co. | | | 33,600 | | | | 456,288 | |
Resources Connection, Inc.2 | | | 79,900 | | | | 1,308,762 | |
| Schawk, Inc. | | | 27,300 | | | | 312,858 | |
School Specialty, Inc.2 | | | 22,300 | | | | 426,376 | |
Spherion Corp.2 | | | 53,700 | | | | 118,677 | |
Standard Parking Corp.2 | | | 6,200 | | | | 119,908 | |
| Standard Register Co. (The) | | | 43,710 | | | | 390,330 | |
| Steelcase, Inc., Cl. A | | | 185,400 | | | | 1,041,948 | |
Sykes Enterprises, Inc.2 | | | 23,100 | | | | 441,672 | |
Team, Inc.1,2 | | | 18,834 | | | | 521,702 | |
TrueBlue, Inc.2 | | | 105,700 | | | | 1,011,549 | |
United Stationers, Inc.2 | | | 24,788 | | | | 830,150 | |
| Viad Corp. | | | 42,900 | | | | 1,061,346 | |
Waste Services, Inc.2 | | | 13,300 | | | | 87,514 | |
| | | | | | | | |
| | | | | | | | 32,415,793 | |
| | | | | | | | | |
Construction & Engineering—1.9% | | | | | | | | |
Baker (Michael) Corp.2 | | | 14,800 | | | | 546,268 | |
Chicago Bridge & Iron Co. NV1 | | | 80,180 | | | | 805,809 | |
Dycom Industries, Inc.2 | | | 103,700 | | | | 852,414 | |
EMCOR Group, Inc.2 | | | 114,900 | | | | 2,577,207 | |
Fluor Corp.1 | | | 6,800 | | | | 305,116 | |
Furmanite Corp.2 | | | 7,800 | | | | 42,042 | |
Granite Construction, Inc.1 | | | 22,766 | | | | 1,000,110 | |
Insituform Technologies, Inc., Cl. A1,2 | | | 38,600 | | | | 760,034 | |
Integrated Electrical Services, Inc.1,2 | | | 16,186 | | | | 141,789 | |
| KBR, Inc. | | | 1,300 | | | | 19,760 | |
Layne Christensen Co.2 | | | 3,970 | | | | 95,320 | |
MasTec, Inc.2 | | | 92,000 | | | | 1,065,360 | |
Northwest Pipe Co.1,2 | | | 14,700 | | | | 626,367 | |
Orion Marine Group, Inc.2 | | | 1,200 | | | | 11,592 | |
Perini Corp.2 | | | 80,171 | | | | 1,874,398 | |
Pike Electric Corp.2 | | | 35,406 | | | | 435,494 | |
Shaw Group, Inc. (The)1,2 | | | 16,400 | | | | 335,708 | |
| | | | | | | | |
| | | | | | | | 11,494,788 | |
| | | | | | | | | |
Electrical Equipment—2.0% | | | | | | | | |
Acuity Brands, Inc.1 | | | 54,600 | | | | 1,906,086 | |
Advanced Battery Technologies, Inc.1,2 | | | 7,000 | | | | 18,620 | |
F12 | OPPENHEIMER MAIN STREET SMALL CAP FUND/ VA
| | | | | | | | | |
| | | Shares | | | Value | |
Electrical Equipment Continued | | | | | | | | |
AZZ, Inc.1,2 | | | 23,200 | | | $ | 582,320 | |
Baldor Electric Co.1 | | | 81,290 | | | | 1,451,027 | |
| Belden, Inc. | | | 84,900 | | | | 1,772,712 | |
| Brady Corp., Cl. A | | | 13,100 | | | | 313,745 | |
C&D Technologies, Inc.1,2 | | | 19,000 | | | | 59,470 | |
Day4 Energy, Inc., Legend Shares2 | | | 82,300 | | | | 58,849 | |
Encore Wire Corp.1 | | | 44,300 | | | | 839,928 | |
EnerSys, Inc.2 | | | 12,200 | | | | 134,200 | |
FuelCell Energy, Inc.2 | | | 7,300 | | | | 28,324 | |
Fushi Copperweld, Inc.2 | | | 2,100 | | | | 11,067 | |
GrafTech International Ltd.1,2 | | | 230,100 | | | | 1,914,432 | |
| Hubbell, Inc., Cl. B | | | 4,000 | | | | 130,720 | |
II-VI, Inc.2 | | | 5,100 | | | | 97,359 | |
| LSI Industries, Inc. | | | 14,900 | | | | 102,363 | |
Plug Power, Inc.2 | | | 3,900 | | | | 3,978 | |
Polypore International, Inc.2 | | | 5,534 | | | | 41,837 | |
Powell Industries, Inc.2 | | | 19,300 | | | | 560,086 | |
Regal-Beloit Corp.1 | | | 1,500 | | | | 56,985 | |
| Rockwell Automation, Inc. | | | 7,400 | | | | 238,576 | |
| Smith (A.O.) Corp. | | | 43,000 | | | | 1,269,360 | |
Valence Technology, Inc.1,2 | | | 50,000 | | | | 91,000 | |
| Vicor Corp. | | | 17,370 | | | | 114,816 | |
| Woodward Governor Co. | | | 12,200 | | | | 280,844 | |
| | | | | | | | |
| | | | | | | | 12,078,704 | |
| | | | | | | | | |
Industrial Conglomerates—0.3% | | | | | | | | |
McDermott International, Inc.2 | | | 6,100 | | | | 60,268 | |
| Raven Industries, Inc. | | | 20,300 | | | | 489,230 | |
| Standex International Corp. | | | 11,000 | | | | 218,240 | |
| Tredegar Corp. | | | 44,127 | | | | 802,229 | |
| | | | | | | | |
| | | | | | | | 1,569,967 | |
| | | | | | | | | |
Machinery—5.2% | | | | | | | | |
3D Systems Corp.2 | | | 600 | | | | 4,764 | |
Actuant Corp., Cl. A1 | | | 65,239 | | | | 1,240,846 | |
AGCO Corp.2 | | | 2,100 | | | | 49,539 | |
| Albany International Corp., Cl. A | | | 2,100 | | | | 26,964 | |
Altra Holdings, Inc.2 | | | 31,950 | | | | 252,725 | |
| American Railcar Industries, Inc. | | | 3,100 | | | | 32,643 | |
| Ampco-Pittsburgh Corp. | | | 26,100 | | | | 566,370 | |
Astec Industries, Inc.2 | | | 1,480 | | | | 46,368 | |
Badger Meter, Inc.1 | | | 26,720 | | | | 775,414 | |
Barnes Group, Inc.1 | | | 77,700 | | | | 1,126,650 | |
Blount International, Inc.2 | | | 70,100 | | | | 664,548 | |
Briggs & Stratton Corp.1 | | | 33,100 | | | | 582,229 | |
| Bucyrus International, Inc., Cl. A | | | 17,900 | | | | 331,508 | |
| Cascade Corp. | | | 4,946 | | | | 147,688 | |
Chart Industries, Inc.2 | | | 61,800 | | | | 656,934 | |
| CIRCOR International, Inc. | | | 35,699 | | | | 981,723 | |
Colfax Corp.2 | | | 11,400 | | | | 118,446 | |
Columbus McKinnon Corp.2 | | | 42,570 | | | | 581,081 | |
Commercial Vehicle Group, Inc.2 | | | 3,600 | | | | 3,348 | |
| Crane Co. | | | 37,200 | | | | 641,328 | |
Cummins, Inc.1 | | | 17,100 | | | | 457,083 | |
| Dover Corp. | | | 12,900 | | | | 424,668 | |
| Dynamic Materials Corp. | | | 5,400 | | | | 104,274 | |
EnPro Industries, Inc.2 | | | 53,400 | | | | 1,150,236 | |
| Federal Signal Corp. | | | 86,400 | | | | 709,344 | |
| Flowserve Corp. | | | 1,200 | | | | 61,800 | |
Gardner Denver, Inc.2 | | | 84,000 | | | | 1,960,560 | |
Gorman-Rupp Co. (The)1 | | | 29,843 | | | | 928,714 | |
| Graco, Inc. | | | 28,300 | | | | 671,559 | |
Graham Corp.1 | | | 12,500 | | | | 135,250 | |
Greenbrier Cos., Inc.1 | | | 6,000 | | | | 41,220 | |
| Harsco Corp. | | | 11,800 | | | | 326,624 | |
Hurco Cos., Inc.1,2 | | | 5,076 | | | | 60,912 | |
| IDEX Corp. | | | 7,100 | | | | 171,465 | |
| Ingersoll-Rand Co. Ltd., Cl. A | | | 44,000 | | | | 763,400 | |
| John Bean Technologies Corp. | | | 15,513 | | | | 126,741 | |
| Joy Global, Inc. | | | 6,400 | | | | 146,496 | |
K-Tron International, Inc.2 | | | 1,000 | | | | 79,900 | |
Kadant, Inc.2 | | | 31,500 | | | | 424,620 | |
| Kennametal, Inc. | | | 47,700 | | | | 1,058,463 | |
L.B. Foster Co., Cl. A2 | | | 11,700 | | | | 365,976 | |
| Lincoln Electric Holdings, Inc. | | | 4,200 | | | | 213,906 | |
Lydall, Inc.2 | | | 16,100 | | | | 92,575 | |
| Manitowoc Co., Inc. (The) | | | 97,178 | | | | 841,561 | |
McCoy Corp., Legend Shares3 | | | 46,600 | | | | 51,705 | |
| Met-Pro Corp. | | | 2,100 | | | | 27,972 | |
| Mueller Industries, Inc. | | | 57,200 | | | | 1,434,576 | |
Mueller Water Products, Inc., Cl. A1 | | | 94,400 | | | | 792,960 | |
| NACCO Industries, Inc., Cl. A | | | 3,200 | | | | 119,712 | |
Navistar International Corp.2 | | | 9,700 | | | | 207,386 | |
| NN, Inc. | | | 11,000 | | | | 25,190 | |
| Nordson Corp. | | | 2,600 | | | | 83,954 | |
| Oshkosh Corp. | | | 143,200 | | | | 1,273,048 | |
| Parker-Hannifin Corp. | | | 4,800 | | | | 204,192 | |
RBC Bearings, Inc.2 | | | 4,200 | | | | 85,176 | |
| Robbins & Myers, Inc. | | | 46,549 | | | | 752,697 | |
| Sauer-Danfoss, Inc. | | | 19,437 | | | | 170,074 | |
Sun Hydraulics Corp.1 | | | 32,750 | | | | 617,010 | |
F13 | OPPENHEIMER MAIN STREET SMALL CAP FUND/ VA
STATEMENT OF INVESTMENTS Continued
| | | | | | | | | |
| | | Shares | | | Value | |
Machinery Continued | | | | | | | | |
Tecumseh Products Co., Cl. A2 | | | 40,500 | | | $ | 387,990 | |
| Tennant Co. | | | 11,100 | | | | 170,940 | |
Terex Corp.2 | | | 20,240 | | | | 350,557 | |
Thermadyne Holdings Corp.2 | | | 5,800 | | | | 39,846 | |
| Timken Co. | | | 75,745 | | | | 1,486,874 | |
Titan International, Inc.1 | | | 91,849 | | | | 757,754 | |
Toro Co. (The)1 | | | 55,900 | | | | 1,844,700 | |
TriMas Corp.2 | | | 600 | | | | 828 | |
Trinity Industries, Inc.1 | | | 31,500 | | | | 496,440 | |
| Twin Disc, Inc. | | | 4,400 | | | | 30,316 | |
| Wabash National Corp. | | | 41,000 | | | | 184,500 | |
| Watts Water Technologies, Inc., Cl. A | | | 1,513 | | | | 37,780 | |
Xerium Technologies, Inc.2 | | | 34,952 | | | | 23,068 | |
| | | | | | | | |
| | | | | | | | 31,805,708 | |
| | | | | | | | | |
Marine—0.4% | | | | | | | | |
| Alexander & Baldwin, Inc. | | | 2,800 | | | | 70,168 | |
American Commercial Lines, Inc.1,2 | | | 71,800 | | | | 351,820 | |
Excel Maritime Carriers Ltd.1 | | | 18,000 | | | | 126,720 | |
Genco Shipping & Trading Ltd.1 | | | 49,600 | | | | 734,080 | |
| Horizon Lines, Inc., Cl. A | | | 11,700 | | | | 40,833 | |
Kirby Corp.2 | | | 9,100 | | | | 248,976 | |
Safe Bulkers, Inc.1 | | | 54,100 | | | | 361,388 | |
Star Bulk Carriers Corp.1 | | | 56,694 | | | | 145,704 | |
TBS International Ltd., Cl. A1,2 | | | 50,900 | | | | 510,527 | |
Ultrapetrol Ltd. (Bahamas)2 | | | 2,500 | | | | 7,975 | |
| | | | | | | | |
| | | | | | | | 2,598,191 | |
| | | | | | | | | |
Road & Rail—0.8% | | | | | | | | |
Amerco2 | | | 3,800 | | | | 131,214 | |
Arkansas Best Corp.1 | | | 51,100 | | | | 1,538,621 | |
Avis Budget Group, Inc.2 | | | 220,400 | | | | 154,280 | |
Celadon Group, Inc.2 | | | 14,200 | | | | 121,126 | |
Hertz Global Holdings, Inc.1,2 | | | 70,400 | | | | 356,928 | |
Marten Transport Ltd.2 | | | 35,400 | | | | 671,184 | |
Werner Enterprises, Inc.1 | | | 80,100 | | | | 1,388,934 | |
YRC Worldwide, Inc.1,2 | | | 128,700 | | | | 369,369 | |
| | | | | | | | |
| | | | | | | | 4,731,656 | |
| | | | | | | | | |
Trading Companies & Distributors—1.2% | | | | | | | | |
| Applied Industrial Technologies, Inc. | | | 64,675 | | | | 1,223,651 | |
Beacon Roofing Supply, Inc.1,2 | | | 38,300 | | | | 531,604 | |
BlueLinx Holdings, Inc.2 | | | 3,600 | | | | 6,804 | |
DXP Enterprises, Inc.2 | | | 6,500 | | | | 94,965 | |
| GATX Corp. | | | 20,428 | | | | 632,655 | |
H&E Equipment Services, Inc.2 | | | 25,867 | | | | 199,435 | |
Houston Wire & Cable Co.1 | | | 40,000 | | | | 372,400 | |
Interline Brands, Inc.2 | | | 10,100 | | | | 107,363 | |
MSC Industrial Direct Co., Inc., Cl. A1 | | | 6,200 | | | | 228,346 | |
RSC Holdings, Inc.2 | | | 12,000 | | | | 102,240 | |
Rush Enterprises, Inc., Cl. A2 | | | 54,200 | | | | 464,494 | |
| TAL International Group, Inc. | | | 9,511 | | | | 134,105 | |
| Textainer Group Holdings Ltd. | | | 12,568 | | | | 133,221 | |
United Rentals, Inc.1,2 | | | 149,643 | | | | 1,364,744 | |
| Watsco, Inc. | | | 3,000 | | | | 115,200 | |
WESCO International, Inc.2 | | | 89,800 | | | | 1,726,854 | |
| | | | | | | | |
| | | | | | | | 7,438,081 | |
| | | | | | | | | |
Transportation Infrastructure—0.0% | | | | | | | | |
CAI International, Inc.2 | | | 33,400 | | | | 105,878 | |
Information Technology—21.0% | | | | | | | | |
Communications Equipment—3.1% | | | | | | | | |
3Com Corp.2 | | | 324,830 | | | | 740,612 | |
Acme Packet, Inc.2 | | | 26,900 | | | | 141,494 | |
| ADTRAN, Inc. | | | 60,000 | | | | 892,800 | |
Avocent Corp.2 | | | 97,900 | | | | 1,753,389 | |
| Bel Fuse, Inc., Cl. A | | | 4,800 | | | | 86,592 | |
BigBand Networks, Inc.2 | | | 19,500 | | | | 107,640 | |
| Black Box Corp. | | | 16,320 | | | | 426,278 | |
Brocade Communications Systems, Inc.2 | | | 356,800 | | | | 999,040 | |
Ciena Corp.1,2 | | | 119,600 | | | | 801,320 | |
CommScope, Inc.2 | | | 56,400 | | | | 876,456 | |
Comtech Telecommunications Corp.2 | | | 6,300 | | | | 288,666 | |
DG Fastchannel, Inc.1,2 | | | 1,300 | | | | 16,224 | |
Digi International, Inc.2 | | | 15,400 | | | | 124,894 | |
EchoStar Holding Corp.1,2 | | | 8,900 | | | | 132,343 | |
EMS Technologies, Inc.2 | | | 22,100 | | | | 571,727 | |
Emulex Corp.2 | | | 189,938 | | | | 1,325,767 | |
Extreme Networks, Inc.2 | | | 21,620 | | | | 50,591 | |
F5 Networks, Inc.2 | | | 8,700 | | | | 198,882 | |
Finisar Corp.2 | | | 102,000 | | | | 38,760 | |
Harris Stratex Networks, Inc., Cl. A2 | | | 10,800 | | | | 55,728 | |
Hughes Communications, Inc.2 | | | 4,300 | | | | 68,542 | |
InterDigital, Inc.2 | | | 46,206 | | | | 1,270,665 | |
Ixia2 | | | 63,100 | | | | 364,718 | |
JDS Uniphase Corp.2 | | | 358,314 | | | | 1,307,846 | |
Loral Space & Communications Ltd.2 | | | 400 | | | | 5,812 | |
Netgear, Inc.2 | | | 14,700 | | | | 167,727 | |
Oplink Communications, Inc.2 | | | 6,664 | | | | 57,310 | |
ParkerVision, Inc.1,2 | | | 15,500 | | | | 38,285 | |
Performance Technologies, Inc.2 | | | 3,200 | | | | 10,688 | |
Plantronics, Inc.1 | | | 117,800 | | | | 1,554,960 | |
F14 | OPPENHEIMER MAIN STREET SMALL CAP FUND/ VA
| | | | | | | | | |
| | | Shares | | | Value | |
Communications Equipment Continued | | | | | | | | |
Polycom, Inc.2 | | | 33,000 | | | $ | 445,830 | |
Powerwave Technologies, Inc.2 | | | 230,900 | | | | 115,450 | |
SeaChange International, Inc.2 | | | 33,855 | | | | 244,095 | |
ShoreTel, Inc.1,2 | | | 13,600 | | | | 61,064 | |
Sonus Networks, Inc.2 | | | 33,300 | | | | 52,614 | |
Starent Networks Corp.2 | | | 8,000 | | | | 95,440 | |
Symmetricom, Inc.2 | | | 5,300 | | | | 20,935 | |
Tekelec, Inc.1,2 | | | 81,953 | | | | 1,093,253 | |
Tellabs, Inc.2 | | | 392,066 | | | | 1,615,312 | |
UTStarcom, Inc.2 | | | 123,192 | | | | 227,905 | |
ViaSat, Inc.2 | | | 22,800 | | | | 549,024 | |
| | | | | | | | |
| | | | | | | | 18,996,678 | |
| | | | | | | | | |
Computers & Peripherals—1.6% | | | | | | | | |
3PAR, Inc.1,2 | | | 27,250 | | | | 207,918 | |
Adaptec, Inc.2 | | | 127,100 | | | | 419,430 | |
Avid Technology, Inc.1,2 | | | 45,200 | | | | 493,132 | |
Compellent Technologies, Inc.2 | | | 3,400 | | | | 33,082 | |
Electronics for Imaging, Inc.2 | | | 73,200 | | | | 699,792 | |
Hutchinson Technology, Inc.1,2 | | | 14,900 | | | | 51,852 | |
Hypercom Corp.2 | | | 1,900 | | | | 2,052 | |
| Imation Corp. | | | 44,500 | | | | 603,865 | |
Intermec, Inc.2 | | | 12,800 | | | | 169,984 | |
Lexmark International, Inc., Cl. A1,2 | | | 12,600 | | | | 338,940 | |
NCR Corp.2 | | | 23,500 | | | | 332,290 | |
NetApp, Inc.2 | | | 5,100 | | | | 71,247 | |
Netezza Corp.2 | | | 49,000 | | | | 325,360 | |
Palm, Inc.1,2 | | | 56,700 | | | | 174,069 | |
QLogic Corp.2 | | | 171,050 | | | | 2,298,912 | |
Rackable Systems, Inc.2 | | | 10,400 | | | | 40,976 | |
| Seagate Technology | | | 91,600 | | | | 405,788 | |
STEC, Inc.1,2 | | | 90,700 | | | | 386,382 | |
Stratasys, Inc.2 | | | 4,400 | | | | 47,300 | |
Sun Microsystems, Inc.2 | | | 61,900 | | | | 236,458 | |
Synaptics, Inc.1,2 | | | 79,550 | | | | 1,317,348 | |
Teradata Corp.2 | | | 9,700 | | | | 143,851 | |
Western Digital Corp.2 | | | 68,100 | | | | 779,745 | |
Xyratex Ltd.2 | | | 14,200 | | | | 41,890 | |
| | | | | | | | |
| | | | | | | | 9,621,663 | |
| | | | | | | | | |
Electronic Equipment & Instruments—3.1% | | | | | | | | |
Acacia Research Corp.2 | | | 16,300 | | | | 49,552 | |
Agilent Technologies, Inc.2 | | | 21,700 | | | | 339,171 | |
| Agilysys, Inc. | | | 4,734 | | | | 20,309 | |
| Amphenol Corp., Cl. A | | | 15,500 | | | | 371,690 | |
Anixter International, Inc.1,2 | | | 16,200 | | | | 487,944 | |
Arrow Electronics, Inc.2 | | | 49,100 | | | | 925,044 | |
Avnet, Inc.2 | | | 10,400 | | | | 189,384 | |
Benchmark Electronics, Inc.2 | | | 138,209 | | | | 1,764,929 | |
Brightpoint, Inc.2 | | | 57,500 | | | | 250,125 | |
Cogent, Inc.1,2 | | | 24,450 | | | | 331,787 | |
| Cognex Corp. | | | 37,000 | | | | 547,600 | |
Coherent, Inc.2 | | | 26,300 | | | | 564,398 | |
CPI International, Inc.2 | | | 100 | | | | 866 | |
| CTS Corp. | | | 69,700 | | | | 384,047 | |
Daktronics, Inc.1 | | | 18,000 | | | | 168,480 | |
DTS, Inc.1,2 | | | 30,400 | | | | 557,840 | |
| Electro Rent Corp. | | | 500 | | | | 5,580 | |
Electro Scientific Industries, Inc.2 | | | 26,900 | | | | 182,651 | |
Gerber Scientific, Inc.2 | | | 9,700 | | | | 49,567 | |
Ingram Micro, Inc., Cl. A2 | | | 23,800 | | | | 318,682 | |
Insight Enterprises, Inc.2 | | | 52,800 | | | | 364,320 | |
Itron, Inc.1,2 | | | 2,500 | | | | 159,350 | |
| Jabil Circuit, Inc. | | | 19,700 | | | | 132,975 | |
L-1 Identity Solutions, Inc.2 | | | 2,812 | | | | 18,953 | |
Littlefuse, Inc.2 | | | 31,263 | | | | 518,966 | |
Measurement Specialties, Inc.2 | | | 300 | | | | 2,085 | |
| Methode Electronics, Inc. | | | 76,090 | | | | 512,847 | |
| Molex, Inc. | | | 20,200 | | | | 292,698 | |
| MTS Systems Corp. | | | 19,800 | | | | 527,472 | |
Multi-Fineline Electronix, Inc.2 | | | 42,234 | | | | 493,715 | |
| NAM TAI Electronics, Inc. | | | 16,200 | | | | 89,100 | |
| National Instruments Corp. | | | 5,300 | | | | 129,108 | |
Newport Corp.2 | | | 28,000 | | | | 189,840 | |
OSI Systems, Inc.2 | | | 18,000 | | | | 249,300 | |
| Park Electrochemical Corp. | | | 24,000 | | | | 455,040 | |
PC Connection, Inc.2 | | | 7,100 | | | | 36,352 | |
Plexus Corp.2 | | | 62,190 | | | | 1,054,121 | |
RadiSys Corp.2 | | | 800 | | | | 4,424 | |
Rofin-Sinar Technologies, Inc.1,2 | | | 56,000 | | | | 1,152,480 | |
Rogers Corp.2 | | | 19,200 | | | | 533,184 | |
Sanmina-SCI Corp.2 | | | 369,600 | | | | 173,712 | |
ScanSource, Inc.2 | | | 26,010 | | | | 501,213 | |
SYNNEX Corp.1,2 | | | 59,500 | | | | 674,135 | |
Tech Data Corp.2 | | | 56,168 | | | | 1,002,037 | |
| Technitrol, Inc. | | | 58,900 | | | | 204,972 | |
Trimble Navigation Ltd.2 | | | 16,800 | | | | 363,048 | |
TTM Technologies, Inc.1,2 | | | 92,500 | | | | 481,925 | |
Universal Display Corp.2 | | | 2,600 | | | | 24,570 | |
Vishay Intertechnology, Inc.2 | | | 314,740 | | | | 1,076,411 | |
Zygo Corp.2 | | | 1,500 | | | | 10,365 | |
| | | | | | | | |
| | | | | | | | 18,938,364 | |
F15 | OPPENHEIMER MAIN STREET SMALL CAP FUND/ VA
STATEMENT OF INVESTMENTS Continued
| | | | | | | | | |
| | | Shares | | | Value | |
Internet Software & Services—2.0% | | | | | | | | |
Akamai Technologies, Inc.1,2 | | | 7,100 | | | $ | 107,139 | |
Art Technology Group, Inc.2 | | | 54,200 | | | | 104,606 | |
AsiaInfo Holdings, Inc.2 | | | 59,000 | | | | 698,560 | |
Digital River, Inc.2 | | | 63,300 | | | | 1,569,840 | |
EarthLink, Inc.1,2 | | | 126,364 | | | | 854,221 | |
Imergent, Inc.1 | | | 12,700 | | | | 52,705 | |
Interwoven, Inc.2 | | | 25,390 | | | | 319,914 | |
j2 Global Communications, Inc.2 | | | 86,100 | | | | 1,725,444 | |
Knot, Inc. (The)2 | | | 13,000 | | | | 108,160 | |
Limelight Networks, Inc.2 | | | 1,300 | | | | 3,185 | |
LoopNet, Inc.1,2 | | | 34,400 | | | | 234,608 | |
| Marchex, Inc., Cl. B | | | 37,037 | | | | 215,926 | |
ModusLink Global Solutions, Inc.2 | | | 32,210 | | | | 93,087 | |
Move, Inc.2 | | | 11,900 | | | | 19,040 | |
National Information Consortium, Inc.1 | | | 39,800 | | | | 183,080 | |
NaviSite, Inc.2 | | | 11,700 | | | | 4,680 | |
Open Text Corp.1,2 | | | 52,600 | | | | 1,584,838 | |
Perficient, Inc.2 | | | 6,900 | | | | 32,982 | |
RealNetworks, Inc.2 | | | 44,672 | | | | 157,692 | |
S1 Corp.2 | | | 113,800 | | | | 897,882 | |
Sohu.com, Inc.2 | | | 5,000 | | | | 236,700 | |
SonicWALL, Inc.2 | | | 65,860 | | | | 262,123 | |
SoundBite Communications, Inc.1,2 | | | 17,200 | | | | 22,188 | |
Switch & Data Facilities Co.2 | | | 9,892 | | | | 73,102 | |
TheStreet.com, Inc.1 | | | 16,150 | | | | 46,835 | |
| United Online, Inc. | | | 107,742 | | | | 653,994 | |
ValueClick, Inc.2 | | | 145,400 | | | | 994,536 | |
VeriSign, Inc.2 | | | 9,900 | | | | 188,892 | |
Vignette Corp.2 | | | 54,240 | | | | 510,398 | |
VistaPrint Ltd.2 | | | 12,550 | | | | 233,556 | |
Vocus, Inc.2 | | | 17,000 | | | | 309,570 | |
Zix Corp.1,2 | | | 12,600 | | | | 14,994 | |
| | | | | | | | |
| | | | | | | | 12,514,477 | |
| | | | | | | | | |
IT Services—2.1% | | | | | | | | |
| Acxiom Corp. | | | 156,400 | | | | 1,268,404 | |
| Cass Information Systems, Inc. | | | 200 | | | | 6,092 | |
CIBER, Inc.2 | | | 138,373 | | | | 665,574 | |
Computer Sciences Corp.2 | | | 9,600 | | | | 337,344 | |
Convergys Corp.2 | | | 227,567 | | | | 1,458,704 | |
CSG Systems International, Inc.1,2 | | | 71,900 | | | | 1,256,093 | |
DST Systems, Inc.1,2 | | | 3,300 | | | | 125,334 | |
Euronet Worldwide, Inc.2 | | | 10,589 | | | | 122,938 | |
Exlservice Holdings, Inc.2 | | | 12,900 | | | | 110,553 | |
Forrester Research, Inc.2 | | | 19,374 | | | | 546,541 | |
Gartner, Inc.1,2 | | | 25,900 | | | | 461,797 | |
Global Cash Access, Inc.2 | | | 56,312 | | | | 125,013 | |
Hackett Group, Inc. (The)2 | | | 3,700 | | | | 10,804 | |
Heartland Payment Systems, Inc.1 | | | 13,300 | | | | 232,750 | |
Hewitt Associates, Inc.2 | | | 9,700 | | | | 275,286 | |
iGate Corp.2 | | | 31,656 | | | | 206,081 | |
| infoGROUP, Inc. | | | 16,300 | | | | 77,262 | |
Integral Systems, Inc.1,2 | | | 36,154 | | | | 435,656 | |
Mastech Holdings, Inc.2 | | | 540 | | | | 1,285 | |
| Maximus, Inc. | | | 5,600 | | | | 196,616 | |
NCI, Inc., Cl. A2 | | | 7,100 | | | | 213,923 | |
Ness Technologies, Inc.2 | | | 19,500 | | | | 83,460 | |
NeuStar, Inc., Cl. A2 | | | 43,200 | | | | 826,416 | |
Online Resources & Communications Corp.2 | | | 1,000 | | | | 4,740 | |
Perot Systems Corp., Cl. A2 | | | 89,800 | | | | 1,227,566 | |
RightNow Technologies, Inc.2 | | | 45,470 | | | | 351,483 | |
Sapient Corp.2 | | | 176,800 | | | | 784,992 | |
| Syntel, Inc. | | | 5,700 | | | | 131,784 | |
TeleTech Holdings, Inc.2 | | | 82,500 | | | | 688,875 | |
TNS, Inc.2 | | | 400 | | | | 3,756 | |
| Total System Services, Inc. | | | 11,000 | | | | 154,000 | |
Unisys Corp.2 | | | 252,700 | | | | 214,795 | |
Wright Express Corp.2 | | | 9,600 | | | | 120,960 | |
| | | | | | | | |
| | | | | | | | 12,726,877 | |
| | | | | | | | | |
Office Electronics—0.2% | | | | | | | | |
| Xerox Corp. | | | 41,400 | | | | 329,958 | |
Zebra Technologies Corp., Cl. A2 | | | 47,400 | | | | 960,324 | |
| | | | | | | | |
| | | | | | | | 1,290,282 | |
| | | | | | | | | |
Semiconductors & Semiconductor Equipment—5.6% | | | | | | | | |
Actel Corp.2 | | | 46,840 | | | | 548,965 | |
Advanced Analogic Technologies, Inc.2 | | | 2,300 | | | | 6,946 | |
Advanced Energy Industries, Inc.2 | | | 70,700 | | | | 703,465 | |
Advanced Micro Devices, Inc.1,2 | | | 25,000 | | | | 54,000 | |
Amkor Technology, Inc.2 | | | 366,600 | | | | 799,188 | |
| Analog Devices, Inc. | | | 21,000 | | | | 399,420 | |
Applied Micro Circuits Corp.2 | | | 83,400 | | | | 327,762 | |
Atheros Communications, Inc.2 | | | 25,160 | | | | 360,040 | |
Atmel Corp.2 | | | 536,800 | | | | 1,680,184 | |
ATMI, Inc.2 | | | 51,200 | | | | 790,016 | |
Broadcom Corp., Cl. A2 | | | 23,000 | | | | 390,310 | |
Brooks Automation, Inc.2 | | | 97,291 | | | | 565,261 | |
Cabot Microelectronics Corp.1,2 | | | 36,000 | | | | 938,520 | |
Cirrus Logic, Inc.2 | | | 106,129 | | | | 284,426 | |
| Cohu, Inc. | | | 19,200 | | | | 233,280 | |
F16 | OPPENHEIMER MAIN STREET SMALL CAP FUND/ VA
| | | | | | | | | |
| | | Shares | | | Value | |
Semiconductors & Semiconductor Equipment Continued | | | | | | | | |
Conexant Systems, Inc.2 | | | 16,820 | | | $ | 11,522 | |
Cymer, Inc.1,2 | | | 34,900 | | | | 764,659 | |
DSP Group, Inc.2 | | | 17,801 | | | | 142,764 | |
Entegris, Inc.2 | | | 279,000 | | | | 611,010 | |
Exar Corp.2 | | | 38,000 | | | | 253,460 | |
Fairchild Semiconductor International, Inc., Cl. A2 | | | 258,400 | | | | 1,263,576 | |
FEI Co.2 | | | 15,100 | | | | 284,786 | |
Integrated Device Technology, Inc.2 | | | 301,600 | | | | 1,691,976 | |
Intellon Corp.2 | | | 17,600 | | | | 44,176 | |
International Rectifier Corp.2 | | | 35,000 | | | | 472,500 | |
| Intersil Corp., Cl. A | | | 76,600 | | | | 703,954 | |
| IXYS Corp. | | | 19,800 | | | | 163,548 | |
| KLA-Tencor Corp. | | | 9,300 | | | | 202,647 | |
Kulicke & Soffa Industries, Inc.2 | | | 19,600 | | | | 33,320 | |
Lattice Semiconductor Corp.2 | | | 199,389 | | | | 301,077 | |
LSI Corp.2 | | | 186,100 | | | | 612,269 | |
Marvell Technology Group Ltd.2 | | | 64,000 | | | | 426,880 | |
Mattson Technology, Inc.2 | | | 10,700 | | | | 15,087 | |
MEMC Electronic Materials, Inc.2 | | | 15,100 | | | | 215,628 | |
Micrel, Inc.1 | | | 119,900 | | | | 876,469 | |
Microtune, Inc.2 | | | 15,500 | | | | 31,620 | |
MKS Instruments, Inc.2 | | | 94,000 | | | | 1,390,260 | |
Monolithic Power Systems, Inc.2 | | | 59,100 | | | | 745,251 | |
| National Semiconductor Corp. | | | 13,400 | | | | 134,938 | |
Netlogic Microsystems, Inc.2 | | | 31,000 | | | | 682,310 | |
Novellus Systems, Inc.2 | | | 66,500 | | | | 820,610 | |
NVIDIA Corp.2 | | | 29,000 | | | | 234,030 | |
OmniVision Technologies, Inc.1,2 | | | 68,500 | | | | 359,625 | |
ON Semiconductor Corp.2 | | | 66,800 | | | | 227,120 | |
Pericom Semiconductor Corp.2 | | | 68,808 | | | | 377,068 | |
PMC-Sierra, Inc.2 | | | 268,300 | | | | 1,303,938 | |
RF Micro Devices, Inc.2 | | | 273,500 | | | | 213,330 | |
Rudolph Technologies, Inc.2 | | | 5,200 | | | | 18,356 | |
Semtech Corp.2 | | | 115,900 | | | | 1,306,193 | |
Silicon Image, Inc.2 | | | 173,300 | | | | 727,860 | |
Silicon Laboratories, Inc.1,2 | | | 56,600 | | | | 1,402,548 | |
Silicon Storage Technology, Inc.2 | | | 60,800 | | | | 139,232 | |
Skyworks Solutions, Inc.1,2 | | | 225,200 | | | | 1,247,608 | |
Spansion, Inc., Cl. A2 | | | 9,800 | | | | 1,855 | |
Standard Microsystems Corp.2 | | | 26,500 | | | | 433,010 | |
Supertex, Inc.2 | | | 19,666 | | | | 472,181 | |
Techwell, Inc.2 | | | 6,200 | | | | 40,300 | |
Teradyne, Inc.2 | | | 305,496 | | | | 1,289,193 | |
Tessera Technologies, Inc.2 | | | 4,500 | | | | 53,460 | |
TriQuint Semiconductor, Inc.2 | | | 74,400 | | | | 255,936 | |
Ultra Clean Holdings, Inc.2 | | | 4,100 | | | | 8,241 | |
Ultratech, Inc.1,2 | | | 45,475 | | | | 543,881 | |
Varian Semiconductor Equipment Associates, Inc.2 | | | 37,400 | | | | 677,688 | |
Veeco Instruments, Inc.1,2 | | | 71,100 | | | | 450,774 | |
Verigy Ltd.2 | | | 49,000 | | | | 471,380 | |
Volterra Semiconductor Corp.1,2 | | | 60,000 | | | | 429,000 | |
Zoran Corp.2 | | | 37,736 | | | | 257,737 | |
| | | | | | | | |
| | | | | | | | 33,919,624 | |
| | | | | | | | | |
Software—3.3% | | | | | | | | |
Actuate Corp.2 | | | 2,421 | | | | 7,166 | |
Advent Software, Inc.1,2 | | | 6,800 | | | | 135,796 | |
ArcSight, Inc.2 | | | 1,600 | | | | 12,816 | |
Aspen Technology, Inc.2 | | | 96,400 | | | | 715,288 | |
Autodesk, Inc.2 | | | 17,700 | | | | 347,805 | |
| Blackbaud, Inc. | | | 7,300 | | | | 98,550 | |
Bottomline Technologies, Inc.2 | | | 9,300 | | | | 66,030 | |
Cadence Design Systems, Inc.2 | | | 269,674 | | | | 987,007 | |
Commvault Systems, Inc.2 | | | 6,410 | | | | 85,958 | |
Compuware Corp.2 | | | 64,700 | | | | 436,725 | |
DemandTec, Inc.2 | | | 2,800 | | | | 22,596 | |
Double-Take Software, Inc.2 | | | 5,820 | | | | 52,205 | |
EPIQ Systems, Inc.1,2 | | | 27,476 | | | | 459,124 | |
FactSet Research Systems, Inc.1 | | | 3,300 | | | | 145,992 | |
| Fair Isaac Corp. | | | 101,100 | | | | 1,704,546 | |
FalconStor Software, Inc.2 | | | 12,500 | | | | 34,750 | |
Henry (Jack) & Associates, Inc.1 | | | 8,200 | | | | 159,162 | |
i2 Technologies, Inc.1,2 | | | 5,700 | | | | 36,423 | |
Interactive Intelligence, Inc.1,2 | | | 12,400 | | | | 79,484 | |
JDA Software Group, Inc.2 | | | 55,300 | | | | 726,089 | |
Kenexa Corp.2 | | | 22,900 | | | | 182,742 | |
Lawson Software, Inc.2 | | | 30,819 | | | | 146,082 | |
Manhattan Associates, Inc.2 | | | 46,740 | | | | 738,959 | |
Mentor Graphics Corp.1,2 | | | 88,400 | | | | 457,028 | |
MICROS Systems, Inc.2 | | | 17,100 | | | | 279,072 | |
MicroStrategy, Inc., Cl. A2 | | | 16,400 | | | | 608,932 | |
MSC.Software Corp.2 | | | 11,200 | | | | 74,816 | |
Net 1 UEPS Technologies, Inc.2 | | | 77,500 | | | | 1,061,750 | |
NetScout Systems, Inc.2 | | | 27,500 | | | | 237,050 | |
Nuance Communications, Inc.2 | | | 4,100 | | | | 42,476 | |
Parametric Technology Corp.2 | | | 117,200 | | | | 1,482,580 | |
Pegasystems, Inc.1 | | | 8,800 | | | | 108,768 | |
Phoenix Technologies Ltd.2 | | | 3,800 | | | | 13,300 | |
Progress Software Corp.2 | | | 29,500 | | | | 568,170 | |
F17 | OPPENHEIMER MAIN STREET SMALL CAP FUND/ VA
STATEMENT OF INVESTMENTS Continued
| | | | | | | | | |
| | | Shares | | | Value | |
Software Continued | | | | | | | | |
PROS Holdings, Inc.2 | | | 3,250 | | | $ | 18,688 | |
Quest Software, Inc.2 | | | 109,400 | | | | 1,377,346 | |
Radiant Systems, Inc.2 | | | 36,300 | | | | 122,331 | |
| Renaissance Learning, Inc. | | | 400 | | | | 3,596 | |
Smith Micro Software, Inc.2 | | | 15,600 | | | | 86,736 | |
Solera Holdings, Inc.2 | | | 3,000 | | | | 72,300 | |
SPSS, Inc.2 | | | 21,800 | | | | 587,728 | |
Sybase, Inc.2 | | | 13,600 | | | | 336,872 | |
Symyx Technologies, Inc.2 | | | 6,900 | | | | 40,986 | |
Synchronoss Technologies, Inc.1,2 | | | 22,700 | | | | 241,982 | |
Synopsys, Inc.2 | | | 9,000 | | | | 166,680 | |
| Take-Two Interactive Software, Inc. | | | 71,100 | | | | 537,516 | |
Taleo Corp., Cl. A2 | | | 28,340 | | | | 221,902 | |
The9 Ltd., ADR2 | | | 2,700 | | | | 35,964 | |
TIBCO Software, Inc.2 | | | 350,900 | | | | 1,821,171 | |
Tyler Technologies, Inc.1,2 | | | 41,400 | | | | 495,972 | |
Ultimate Software Group, Inc. (The)2 | | | 7,500 | | | | 109,500 | |
Wind River Systems, Inc.2 | | | 140,100 | | | | 1,265,103 | |
| | | | | | | | |
| | | | | | | | 19,857,610 | |
| | | | | | | | | |
Materials—5.6% | | | | | | | | |
Chemicals—2.7% | | | | | | | | |
| American Vanguard Corp. | | | 6,600 | | | | 77,220 | |
| Arch Chemicals, Inc. | | | 300 | | | | 7,821 | |
| Ashland, Inc. | | | 115,159 | | | | 1,210,321 | |
| Balchem Corp. | | | 10,430 | | | | 259,811 | |
| Cabot Corp. | | | 8,200 | | | | 125,460 | |
Calgon Carbon Corp.2 | | | 29,180 | | | | 448,205 | |
| Celanese Corp., Series A | | | 4,400 | | | | 54,692 | |
| CF Industries Holdings, Inc. | | | 7,100 | | | | 349,036 | |
| Chemtura Corp. | | | 419,800 | | | | 587,720 | |
| Cytec Industries, Inc. | | | 15,600 | | | | 331,032 | |
| Eastman Chemical Co. | | | 4,500 | | | | 142,695 | |
Ferro Corp.1 | | | 76,438 | | | | 538,888 | |
| Fuller (H.B.) Co. | | | 73,300 | | | | 1,180,863 | |
GenTek, Inc.1,2 | | | 2,600 | | | | 39,130 | |
ICO, Inc.1,2 | | | 32,600 | | | | 103,016 | |
| Innophos Holdings, Inc. | | | 35,900 | | | | 711,179 | |
| Innospec, Inc. | | | 37,888 | | | | 223,160 | |
| Koppers Holdings, Inc. | | | 48,600 | | | | 1,050,732 | |
Landec Corp.2 | | | 21,200 | | | | 139,496 | |
LSB Industries, Inc.1,2 | | | 18,700 | | | | 155,584 | |
| Minerals Technologies, Inc. | | | 17,800 | | | | 728,020 | |
NewMarket Corp.1 | | | 18,000 | | | | 628,380 | |
| NOVA Chemicals Corp. | | | 97,500 | | | | 465,075 | |
| Olin Corp. | | | 70,300 | | | | 1,271,024 | |
OM Group, Inc.1,2 | | | 35,140 | | | | 741,805 | |
Penford Corp.1 | | | 1,500 | | | | 15,180 | |
PolyOne Corp.2 | | | 147,300 | | | | 463,995 | |
| Quaker Chemical Corp. | | | 15,300 | | | | 251,685 | |
Rockwood Holdings, Inc.2 | | | 34,300 | | | | 370,440 | |
| Schulman (A.), Inc. | | | 40,111 | | | | 681,887 | |
ShengdaTech, Inc.1,2 | | | 5,882 | | | | 20,705 | |
| Spartech Corp. | | | 39,800 | | | | 249,148 | |
| Stepan Co. | | | 10,400 | | | | 488,696 | |
| Terra Industries, Inc. | | | 32,300 | | | | 538,441 | |
| Valhi, Inc. | | | 1,200 | | | | 12,840 | |
| Valspar Corp. (The) | | | 36,400 | | | | 658,476 | |
W.R. Grace & Co.2 | | | 8,400 | | | | 50,148 | |
| Zep, Inc. | | | 39,300 | | | | 758,883 | |
Zoltek Cos., Inc.1,2 | | | 23,400 | | | | 210,366 | |
| | | | | | | | |
| | | | | | | | 16,341,255 | |
| | | | | | | | | |
Construction Materials—0.1% | | | | | | | | |
Headwaters, Inc.1,2 | | | 94,100 | | | | 635,175 | |
Containers & Packaging—0.4% | | | | | | | | |
| Myers Industries, Inc. | | | 42,200 | | | | 337,600 | |
| Packaging Corp. of America | | | 1,500 | | | | 20,190 | |
| Rock-Tenn Co., Cl. A | | | 21,600 | | | | 738,288 | |
| Sealed Air Corp. | | | 8,500 | | | | 126,990 | |
Smurfit-Stone Container Corp.2 | | | 246,900 | | | | 62,960 | |
| Sonoco Products Co. | | | 9,700 | | | | 224,652 | |
Temple-Inland, Inc.1 | | | 230,843 | | | | 1,108,046 | |
| | | | | | | | |
| | | | | | | | 2,618,726 | |
| | | | | | | | | |
Metals & Mining—1.9% | | | | | | | | |
| A. M. Castle & Co. | | | 33,827 | | | | 366,346 | |
| AK Steel Holding Corp. | | | 112,800 | | | | 1,051,296 | |
| Allegheny Technologies, Inc. | | | 8,400 | | | | 214,452 | |
| Amerigo Resources Ltd. | | | 118,700 | | | | 37,072 | |
Brush Engineered Materials, Inc.2 | | | 29,600 | | | | 376,512 | |
| Carpenter Technology Corp. | | | 75,900 | | | | 1,558,986 | |
Century Aluminum Co.1,2 | | | 100,800 | | | | 1,008,000 | |
Farallon Resources Ltd.2 | | | 156,700 | | | | 19,319 | |
General Steel Holdings, Inc.1,2 | | | 13,700 | | | | 53,978 | |
Haynes International, Inc.2 | | | 18,900 | | | | 465,318 | |
Hecla Mining Co.1,2 | | | 133,800 | | | | 374,640 | |
| Kaiser Aluminum Corp. | | | 11,543 | | | | 259,948 | |
Olympic Steel, Inc.1 | | | 26,200 | | | | 533,694 | |
Redcorp Ventures Ltd., Legend Shares2,3 | | | 666,400 | | | | 21,908 | |
F18 | OPPENHEIMER MAIN STREET SMALL CAP FUND/ VA
| | | | | | | | | |
| | | Shares | | | Value | |
Metals & Mining Continued | | | | | | | | |
| Reliance Steel & Aluminum Co. | | | 30,700 | | | $ | 612,158 | |
RTI International Metals, Inc.1,2 | | | 62,400 | | | | 892,944 | |
Schnitzer Steel Industries, Inc.1 | | | 47,800 | | | | 1,799,670 | |
| Sims Metal Management Ltd., Sponsored ADR | | | 65,825 | | | | 817,547 | |
Stillwater Mining Co.2 | | | 26,042 | | | | 128,647 | |
Sutor Technology Group Ltd.2 | | | 1,400 | | | | 3,234 | |
| United States Steel Corp. | | | 5,600 | | | | 208,320 | |
Universal Stainless & Alloy Products, Inc.2 | | | 4,700 | | | | 68,103 | |
Worthington Industries, Inc.1 | | | 56,398 | | | | 621,506 | |
| Yamana Gold, Inc. | | | 2,011 | | | | 15,619 | |
| | | | | | | | |
| | | | | | | | 11,509,217 | |
| | | | | | | | | |
Paper & Forest Products—0.5% | | | | | | | | |
Buckeye Technologies, Inc.2 | | | 47,027 | | | | 171,178 | |
Clearwater Paper Corp.2 | | | 4,060 | | | | 34,063 | |
| Deltic Timber Corp. | | | 3,300 | | | | 150,975 | |
Domtar Corp.2 | | | 208,300 | | | | 347,861 | |
| Glatfelter | | | 54,000 | | | | 502,200 | |
| International Paper Co. | | | 27,000 | | | | 318,600 | |
| Louisiana-Pacific Corp. | | | 83,000 | | | | 129,480 | |
| MeadWestvaco Corp. | | | 7,700 | | | | 86,163 | |
Mercer International, Inc.2 | | | 12,300 | | | | 23,616 | |
| Neenah Paper, Inc. | | | 11,800 | | | | 104,312 | |
| Schweitzer-Mauduit International, Inc. | | | 12,850 | | | | 257,257 | |
| Verso Paper Corp. | | | 3,700 | | | | 3,811 | |
| Wausau Paper Corp. | | | 73,100 | | | | 836,264 | |
| | | | | | | | |
| | | | | | | | 2,965,780 | |
| | | | | | | | | |
Telecommunication Services—1.9% | | | | | | | | |
Diversified Telecommunication Services—1.4% | | | | | | | | |
Alaska Communications Systems Group, Inc.1 | | | 31,100 | | | | 291,718 | |
| Atlantic Tele-Network, Inc. | | | 16,400 | | | | 435,420 | |
Cbeyond, Inc.1,2 | | | 21,500 | | | | 343,570 | |
Cincinnati Bell, Inc.2 | | | 434,500 | | | | 838,585 | |
Cogent Communications Group, Inc.1,2 | | | 38,478 | | | | 251,261 | |
| Embarq Corp. | | | 19,700 | | | | 708,412 | |
General Communication, Inc., Cl. A2 | | | 16,200 | | | | 131,058 | |
Global Crossing Ltd.2 | | | 20,644 | | | | 163,913 | |
Iowa Telecommunications Services, Inc.1 | | | 48,337 | | | | 690,252 | |
| NTELOS Holdings Corp. | | | 63,000 | | | | 1,553,580 | |
PAETEC Holding Corp.2 | | | 9,600 | | | | 13,824 | |
Premiere Global Services, Inc.2 | | | 160,300 | | | | 1,380,183 | |
| Qwest Communications International, Inc. | | | 87,500 | | | | 318,500 | |
tw telecom, Inc.2 | | | 154,000 | | | | 1,304,380 | |
| | | | | | | | |
| | | | | | | | 8,424,656 | |
| | | | | | | | | |
Wireless Telecommunication Services—0.5% | | | | | | | | |
Centennial Communications Corp.2 | | | 179,900 | | | | 1,449,994 | |
ICO Global Communication Holdings Ltd.2 | | | 8,200 | | | | 9,266 | |
iPCS, Inc.1,2 | | | 17,534 | | | | 120,283 | |
NII Holdings, Inc.2 | | | 8,400 | | | | 152,712 | |
Syniverse Holdings, Inc.2 | | | 68,600 | | | | 819,084 | |
| Telephone & Data Systems, Inc. | | | 6,400 | | | | 203,200 | |
United States Cellular Corp.2 | | | 6,600 | | | | 285,384 | |
| USA Mobility, Inc. | | | 33,300 | | | | 385,281 | |
| | | | | | | | |
| | | | | | | | 3,425,204 | |
| | | | | | | | | |
Utilities—0.5% | | | | | | | | |
Energy Traders—0.1% | | | | | | | | |
Canadian Hydro Developers, Inc., Legend Shares2 | | | 14,000 | | | | 34,289 | |
Mirant Corp.2 | | | 10,500 | | | | 198,135 | |
| | | | | | | | |
| | | | | | | | 232,424 | |
| | | | | | | | | |
Gas Utilities—0.1% | | | | | | | | |
| Laclede Group, Inc. (The) | | | 5,000 | | | | 234,200 | |
| Northwest Natural Gas Co. | | | 1,080 | | | | 47,768 | |
| WGL Holdings, Inc. | | | 15,500 | | | | 506,695 | |
| | | | | | | | |
| | | | | | | | 788,663 | |
| | | | | | | | | |
Multi-Utilities—0.2% | | | | | | | | |
| Avista Corp. | | | 42,200 | | | | 817,836 | |
| CH Energy Group, Inc. | | | 9,848 | | | | 506,089 | |
| | | | | | | | |
| | | | | | | | 1,323,925 | |
| | | | | | | | | |
Water Utilities—0.1% | | | | | | | | |
| Cascal NV | | | 46,800 | | | | 188,136 | |
| SJW Corp. | | | 14,700 | | | | 440,115 | |
| | | | | | | | |
| | | | | | | | 628,251 | |
| | | | | | | | |
| Total Common Stocks (Cost $836,165,654) | | | | | | | 598,941,436 | |
| | | | | | | | | |
| | | | | | | | | |
| | | Units | | | | | |
Rights, Warrants and Certificates—0.0% | | | | | | | | |
Redcorp Ventures Ltd. Wts., Strike Price 0.65CAD, Exp. 7/5/092,4 (Cost $0) | | | 333,200 | | | | — | |
F19 | OPPENHEIMER MAIN STREET SMALL CAP FUND/ VA
STATEMENT OF INVESTMENTS Continued
| | | | | | | | | |
| | | Shares | | | Value | |
Investment Companies—1.0% | | | | | | | | |
| Capital Southwest Corp. | | | 200 | | | $ | 21,632 | |
Oppenheimer Institutional Money Market Fund, Cl. E, 1.96%5,6 | | | 6,344,806 | | | | 6,344,806 | |
| | | | | | | | |
| | | | | | | | | |
| Total Investment Companies (Cost $6,370,123) | | | | | | | 6,366,438 | |
| | | | | | | | | |
| Total Investments, at Value (excluding Investments Purchased with Cash Collateral from Securities Loaned) (Cost $842,535,777) | | | | | | | 605,307,874 | |
| |
| | | Principal | | | | | |
| | | Amount/Shares | | | | | |
Investments Purchased with Cash Collateral from Securities Loaned—18.4%7 | | | | | | | | |
| American General Finance Corp., 4.34%, 1/9/09 | | $ | 6,500,000 | | | | 6,465,927 | |
| American Honda Finance Corp., 2.25%, 3/9/09 | | | 6,500,000 | | | | 6,493,039 | |
| ANZ National (Int’l) Ltd., 0.34%, 3/6/09 | | | 8,000,000 | | | | 7,998,128 | |
| Beta Finance, Inc., 0.35%, 2/17/09 | | | 5,000,000 | | | | 4,974,015 | |
| |
| CAM US Finance SA Unipersonal, 3.24%, 2/2/09 | | $ | 6,000,000 | | | $ | 5,991,396 | |
| CC USA, Inc., 0.35%, 2/13/09 | | | 4,500,000 | | | | 4,478,832 | |
| GSAA Home Equity Trust, Series 2005-15, Cl. 2A1, 0.56%, 1/26/09 | | | 510,456 | | | | 451,277 | |
| MBIA Global Funding LLC, 0.37%, 3/13/09 | | | 4,000,000 | | | | 3,950,512 | |
OFI Liquid Assets Fund, LLC, 1.71%5,6 | | | 65,710,173 | | | | 65,710,173 | |
| Wachovia Bank NA, 0.36%, 2/23/09 | | | 6,000,000 | | | | 5,962,992 | |
| | | | | | | | |
| | | | | | | | | |
| Total Investments Purchased with Cash Collateral from Securities Loaned (Cost $112,720,343) | | | | | | | 112,476,291 | |
| | | | | | | | | |
Total Investments, at Value (Cost $955,256,120) | | | 117.6 | % | | | 717,784,165 | |
Liabilities in Excess of Other Assets | | | (17.6 | ) | | | (107,661,684 | ) |
| | | |
| | | | | | | | | |
Net Assets | | | 100.0 | % | | $ | 610,122,481 | |
| | | |
Industry classifications are unaudited.
Footnotes to Statement of Investments
Strike Price is reported in U.S. Dollars, except for those denoted in the following currency:
CAD Canadian Dollar
| | | |
| 1. | | Partial or fully-loaned security. See Note 7 of accompanying Notes.
|
| |
| 2. | | Non-income producing security. |
| |
| 3. | | Represents securities sold under Rule 144A, which are exempt from registration under the Securities Act of 1933, as amended. These securities have been determined to be liquid under guidelines established by the Board of Trustees. These securities amount to $202,463 or 0.03% of the Fund’s net assets as of December 31, 2008. |
| |
| 4. | | Illiquid or restricted security. The aggregate value of illiquid or restricted securities as of December 31, 2008 was $16,106, which represents less than 0.005% of the Fund’s net assets, all of which is considered restricted. See Note 6 of accompanying Notes. Information concerning restricted securities is as follows: |
| | | | | | | | | | | | | | | | | |
| | | Acquisition | | | | | | | | | | | Unrealized | |
| Security | | Date | | | Cost | | | Value | | | Depreciation | |
| Tusk Energy Corp., Legend Shares | | | 11/15/04 | | | $ | 38,148 | | | $ | 16,106 | | | $ | 22,042 | |
| | | |
| 5. | | Is or was an affiliate, as defined in the Investment Company Act of 1940, at or during the period ended December 31, 2008, by virtue of the Fund owning at least 5% of the voting securities of the issuer or as a result of the Fund and the issuer having the same investment adviser. Transactions during the period in which the issuer was an affiliate are as follows: |
| | | | | | | | | | | | | | | | | |
| | | Shares | | | Gross | | | Gross | | | Shares | |
| | | December 31, 2007 | | | Additions | | | Reductions | | | December 31, 2008 | |
| OFI Liquid Assets Fund, LLC | | | — | | | | 439,699,213 | | | | 373,989,040 | | | | 65,710,173 | |
| Oppenheimer Institutional Money Market Fund, Cl. E | | | 10,327,619 | | | | 290,890,004 | | | | 294,872,817 | | | | 6,344,806 | |
| | | | | | | | | |
| | | Value | | | Income | |
| OFI Liquid Assets Fund, LLC | | $ | 65,710,173 | | | $ | 1,425,660 | a |
| Oppenheimer Institutional Money Market Fund, Cl. E | | | 6,344,806 | | | | 241,632 | |
| | | |
| | | $ | 72,054,979 | | | $ | 1,667,292 | |
| | | |
a. Net of compensation to the securities lending agent and rebates paid to the borrowing counterparties.
| | | |
| 6. | | Rate shown is the 7-day yield as of December 31, 2008. |
| |
| 7. | | The security/securities have been segregated to satisfy the forward commitment to return the cash collateral received in securities lending transactions upon the borrower’s return of the securities loaned. See Note 7 of accompanying Notes. |
F20 | OPPENHEIMER MAIN STREET SMALL CAP FUND/ VA
Valuation Inputs
Various data inputs are used in determining the value of each of the Fund’s investments as of the reporting period end. These data inputs are categorized in the following hierarchy under applicable financial accounting standards:
1) Level 1—quoted prices in active markets for identical assets or liabilities (including securities actively traded on a securities exchange)
2) Level 2—inputs other than quoted prices that are observable for the asset (such as quoted prices for similar assets and market corroborated inputs such as interest rates, prepayment speeds, credit risks, etc.)
3) Level 3—unobservable inputs (including the Manager’s own judgments about assumptions that market participants would use in pricing the asset).
The market value of the Fund’s investments was determined based on the following inputs as of December 31, 2008:
| | | | | | | | | |
| | | Investments in | | | Other Financial | |
| Valuation Description | | Securities | | | Instruments* | |
| Level 1—Quoted Prices | | $ | 671,016,762 | | | $ | — | |
| Level 2—Other Significant Observable Inputs | | | 46,767,403 | | | | — | |
| Level 3—Significant Unobservable Inputs | | | — | | | | — | |
| | | |
| Total | | $ | 717,784,165 | | | $ | — | |
| | | | | | | |
| | |
| * | | Other financial instruments include options written, currency contracts, futures, forwards and swap contracts. Currency contracts and forwards are reported at their unrealized appreciation/depreciation at measurement date, which represents the change in the contract’s value from trade date. Futures are reported at their variation margin at measurement date, which represents the amount due to/from the Fund at that date. Options written and swaps are reported at their market value at measurement date. |
See the accompanying Notes for further discussion of the methods used in determining value of the Fund’s investments, and a summary of changes to the valuation techniques, if any, during the reporting period.
See accompanying Notes to Financial Statements.
F21 | OPPENHEIMER MAIN STREET SMALL CAP FUND/ VA
STATEMENT OF ASSETS AND LIABILITIES December 31, 2008
| | | | | |
Assets | | | | |
| Investments, at value—see accompanying statement of investments: | | | | |
| Unaffiliated companies (cost $883,201,141) | | $ | 645,729,186 | |
| Affiliated companies (cost $72,054,979) | | | 72,054,979 | |
| | | | |
| | | | 717,784,165 | |
| Cash | | | 3,527,345 | |
| Receivables and other assets: | | | | |
| Dividends and interest | | | 674,171 | |
| Investments sold | | | 627,153 | |
| Shares of beneficial interest sold | | | 452,800 | |
| Due from Manager | | | 17 | |
| Other | | | 325,250 | |
| | | | |
| Total assets | | | 723,390,901 | |
| | | | | |
Liabilities | | | | |
| Return of collateral for securities loaned | | | 112,509,871 | |
| Payables and other liabilities: | | | | |
| Distribution and service plan fees | | | 338,590 | |
| Shares of beneficial interest redeemed | | | 233,823 | |
| Shareholder communications | | | 87,648 | |
| Investments purchased | | | 35,138 | |
| Trustees’ compensation | | | 4,337 | |
| Transfer and shareholder servicing agent fees | | | 1,720 | |
| Other | | | 57,293 | |
| | | | |
| Total liabilities | | | 113,268,420 | |
| | | | | |
Net Assets | | $ | 610,122,481 | |
| | | | |
| | | | | |
Composition of Net Assets | | | | |
| Par value of shares of beneficial interest | | $ | 57,827 | |
| Additional paid-in capital | | | 977,246,157 | |
| Accumulated net investment income | | | 4,880,816 | |
| Accumulated net realized loss on investments and foreign currency transactions | | | (134,590,364 | ) |
| Net unrealized depreciation on investments and translation of assets and liabilities denominated in foreign currencies | | | (237,471,955 | ) |
| | | | |
Net Assets | | $ | 610,122,481 | |
| | | | |
| |
Net Asset Value Per Share | | | | |
| Non-Service Shares: | | | | |
| Net asset value, redemption price per share and offering price per share (based on net assets of $58,478,295 and 5,491,620 shares of beneficial interest outstanding) | | $ | 10.65 | |
| Service Shares: | | | | |
| Net asset value, redemption price per share and offering price per share (based on net assets of $551,644,186 and 52,335,848 shares of beneficial interest outstanding) | | $ | 10.54 | |
See accompanying Notes to Financial Statements.
F22 | OPPENHEIMER MAIN STREET SMALL CAP FUND/ VA
STATEMENT OF OPERATIONS For the Year Ended December 31, 2008
| | | | | |
Investment Income | | | | |
| Dividends: | | | | |
| Unaffiliated companies (net of foreign withholding taxes of $10,042) | | $ | 10,073,374 | |
| Affiliated companies | | | 241,632 | |
| Income from investment of securities lending cash collateral, net: | | | | |
| Unaffiliated companies | | | 1,086,082 | |
| Affiliated companies | | | 1,425,660 | |
| Interest | | | 14,692 | |
| | | | |
| Total investment income | | | 12,841,440 | |
| | | | | |
Expenses | | | | |
| Management fees | | | 5,909,561 | |
| Distribution and service plan fees - Service shares | | | 1,924,705 | |
| Transfer and shareholder servicing agent fees: | | | | |
| Non-Service shares | | | 9,994 | |
| Service shares | | | 9,994 | |
| Shareholder communications: | | | | |
| Non-Service shares | | | 23,257 | |
| Service shares | | | 219,530 | |
| Trustees’ compensation | | | 21,873 | |
| Custodian fees and expenses | | | 5,592 | |
| Other | | | 78,911 | |
| | | | |
| Total expenses | | | 8,203,417 | |
| Less reduction to custodian expenses | | | (1,682 | ) |
| Less waivers and reimbursements of expenses | | | (7,346 | ) |
| | | | |
| Net expenses | | | 8,194,389 | |
| | | | | |
Net Investment Income | | | 4,647,051 | |
| | | | | |
Realized and Unrealized Gain (Loss) | | | | |
| Net realized gain (loss) on: | | | | |
| Investments from unaffiliated companies | | | (131,278,404 | ) |
| Foreign currency transactions | | | 18,140 | |
| | | | |
| Net realized loss | | | (131,260,264 | ) |
| Net change in unrealized depreciation on: | | | | |
| Investments | | | (252,024,252 | ) |
| Translation of assets and liabilities denominated in foreign currencies | | | (701,011 | ) |
| | | | |
| Net change in unrealized depreciation | | | (252,725,263 | ) |
| |
Net Decrease in Net Assets Resulting from Operations | | $ | (379,338,476 | ) |
| | | | |
See accompanying Notes to Financial Statements.
F23 | OPPENHEIMER MAIN STREET SMALL CAP FUND/ VA
STATEMENTS OF CHANGES IN NET ASSETS
| | | | | | | | | |
| Year Ended December 31, | | 2008 | | | 2007 | |
Operations | | | | | | | | |
| Net investment income | | $ | 4,647,051 | | | $ | 2,253,546 | |
| Net realized gain (loss) | | | (131,260,264 | ) | | | 50,386,224 | |
| Net change in unrealized appreciation (depreciation) | | | (252,725,263 | ) | | | (75,276,464 | ) |
| | | |
| Net decrease in net assets resulting from operations | | | (379,338,476 | ) | | | (22,636,694 | ) |
| | | | | | | | | |
Dividends and/or Distributions to Shareholders | | | | | | | | |
| Dividends from net investment income: | | | | | | | | |
| Non-Service shares | | | (406,564 | ) | | | (284,891 | ) |
| Service shares | | | (2,093,583 | ) | | | (1,096,034 | ) |
| | | |
| | | | (2,500,147 | ) | | | (1,380,925 | ) |
| | | | | | | | | |
| Distributions from net realized gain: | | | | | | | | |
| Non-Service shares | | | (4,514,393 | ) | | | (3,038,041 | ) |
| Service shares | | | (43,539,151 | ) | | | (23,704,364 | ) |
| | | |
| | | | (48,053,544 | ) | | | (26,742,405 | ) |
| | | | | | | | | |
Beneficial Interest Transactions | | | | | | | | |
| Net increase in net assets resulting from beneficial interest transactions: | | | | | | | | |
| Non-Service shares | | | 5,447,779 | | | | 17,695,373 | |
| Service shares | | | 118,985,953 | | | | 230,810,116 | |
| | | |
| | | | 124,433,732 | | | | 248,505,489 | |
| | | | | | | | | |
Net Assets | | | | | | | | |
| Total increase (decrease) | | | (305,458,435 | ) | | | 197,745,465 | |
| Beginning of period | | | 915,580,916 | | | | 717,835,451 | |
| | | |
| End of period (including accumulated net investment income of $4,880,816 and $2,449,399, respectively) | | $ | 610,122,481 | | | $ | 915,580,916 | |
| | | |
See accompanying Notes to Financial Statements.
F24 | OPPENHEIMER MAIN STREET SMALL CAP FUND/ VA
FINANCIAL HIGHLIGHTS
| | | | | | | | | | | | | | | | | | | | | |
| Non-Service Shares Year Ended December 31, | | 2008 | | | 2007 | | | 2006 | | | 2005 | | | 2004 | |
| |
Per Share Operating Data | | | | | | | | | | | | | | | | | | | | |
| Net asset value, beginning of period | | $ | 18.20 | | | $ | 19.15 | | | $ | 17.18 | | | $ | 16.05 | | | $ | 13.44 | |
| Income (loss) from investment operations: | | | | | | | | | | | | | | | | | | | | |
Net investment income1 | | | .12 | | | | .09 | | | | .08 | | | | .04 | | | | .01 | |
| Net realized and unrealized gain (loss) | | | (6.73 | ) | | | (.30 | ) | | | 2.46 | | | | 1.51 | | | | 2.60 | |
| | | |
| Total from investment operations | | | (6.61 | ) | | | (.21 | ) | | | 2.54 | | | | 1.55 | | | | 2.61 | |
| Dividends and/or distributions to shareholders: | | | | | | | | | | | | | | | | | | | | |
| Dividends from net investment income | | | (.08 | ) | | | (.06 | ) | | | (.03 | ) | | | — | | | | — | |
| Distributions from net realized gain | | | (.86 | ) | | | (.68 | ) | | | (.54 | ) | | | (.42 | ) | | | — | |
| | | |
| Total dividends and/or distributions to shareholders | | | (.94 | ) | | | (.74 | ) | | | (.57 | ) | | | (.42 | ) | | | — | |
| Net asset value, end of period | | $ | 10.65 | | | $ | 18.20 | | | $ | 19.15 | | | $ | 17.18 | | | $ | 16.05 | |
| | | |
| | | | | | | | | | | | | | | | | | | | | |
Total Return, at Net Asset Value2 | | | (37.83 | )% | | | (1.21 | )% | | | 15.00 | % | | | 9.92 | % | | | 19.42 | % |
| | | | | | | | | | | | | | | | | | | | | |
Ratios/Supplemental Data | | | | | | | | | | | | | | | | | | | | |
| Net assets, end of period (in thousands) | | $ | 58,478 | | | $ | 93,939 | | | $ | 81,405 | | | $ | 44,820 | | | $ | 38,636 | |
| Average net assets (in thousands) | | $ | 80,406 | | | $ | 94,815 | | | $ | 62,659 | | | $ | 39,708 | | | $ | 30,871 | |
Ratios to average net assets:3 | | | | | | | | | | | | | | | | | | | | |
| Net investment income | | | 0.80 | % | | | 0.48 | % | | | 0.46 | % | | | 0.23 | % | | | 0.06 | % |
| Total expenses | | | 0.75 | %4,5,6 | | | 0.73 | %4,5,6 | | | 0.77 | %4,5 | | | 0.81 | %6 | | | 0.83 | %6 |
| Portfolio turnover rate | | | 130 | % | | | 115 | % | | | 110 | % | | | 110 | % | | | 147 | % |
| 1. | | Per share amounts calculated based on the average shares outstanding during the period. |
| |
| 2. | | Assumes an investment on the business day before the first day of the fiscal period, with all dividends and distributions reinvested in additional shares on the reinvestment date, and redemption at the net asset value calculated on the last business day of the fiscal period. Total returns are not annualized for periods less than one full year. Total return information does not reflect expenses that apply at the separate account level or to related insurance products. Inclusion of these charges would reduce the total return figures for all periods shown. Returns do not reflect the deduction of taxes that a shareholder would pay on fund distributions or the redemption of fund shares. |
| |
| 3. | | Annualized for periods less than one full year. |
| |
| 4. | | Total Expenses including indirect expenses from affiliated fund were as follows: |
| | | | | |
| Year Ended December 31, 2008 | | | 0.75 | % |
| Year Ended December 31, 2007 | | | 0.73 | % |
| Year Ended December 31, 2006 | | | 0.77 | % |
| 5. | | Waiver or reimbursement of indirect management fees less than 0.005%. |
| |
| 6. | | Reduction to custodian expenses less than 0.005%. |
See accompanying Notes to Financial Statements.
F25 | OPPENHEIMER MAIN STREET SMALL CAP FUND/ VA
FINANCIAL HIGHLIGHTS Continued
| | | | | | | | | | | | | | | | | | | | | |
| Service Shares Year Ended December 31, | | 2008 | | | 2007 | | | 2006 | | | 2005 | | | 2004 | |
| |
Per Share Operating Data | | | | | | | | | | | | | | | | | | | | |
| Net asset value, beginning of period | | $ | 18.03 | | | $ | 18.98 | | | $ | 17.06 | | | $ | 15.97 | | | $ | 13.40 | |
| Income (loss) from investment operations: | | | | | | | | | | | | | | | | | | | | |
Net investment income (loss)1 | | | .08 | | | | .05 | | | | .04 | | | | — | 2 | | | (.02 | ) |
| Net realized and unrealized gain (loss) | | | (6.67 | ) | | | (.29 | ) | | | 2.42 | | | | 1.51 | | | | 2.59 | |
| | | |
| Total from investment operations | | | (6.59 | ) | | | (.24 | ) | | | 2.46 | | | | 1.51 | | | | 2.57 | |
| Dividends and/or distributions to shareholders: | | | | | | | | | | | | | | | | | | | | |
| Dividends from net investment income | | | (.04 | ) | | | (.03 | ) | | | — | 2 | | | — | | | | — | |
| Distributions from net realized gain | | | (.86 | ) | | | (.68 | ) | | | (.54 | ) | | | (.42 | ) | | | — | |
| | | |
| Total dividends and/or distributions to shareholders | | | (.90 | ) | | | (.71 | ) | | | (.54 | ) | | | (.42 | ) | | | — | |
| Net asset value, end of period | | $ | 10.54 | | | $ | 18.03 | | | $ | 18.98 | | | $ | 17.06 | | | $ | 15.97 | |
| | | |
| | | | | | | | | | | | | | | | | | | | | |
Total Return, at Net Asset Value3 | | | (38.00 | )% | | | (1.39 | )% | | | 14.66 | % | | | 9.71 | % | | | 19.18 | % |
| | | | | | | | | | | | | | | | | | | | | |
Ratios/Supplemental Data | | | | | | | | | | | | | | | | | | | | |
| Net assets, end of period (in thousands) | | $ | 551,644 | | | $ | 821,642 | | | $ | 636,430 | | | $ | 314,868 | | | $ | 173,612 | |
| Average net assets (in thousands) | | $ | 769,150 | | | $ | 766,102 | | | $ | 479,456 | | | $ | 221,324 | | | $ | 112,279 | |
Ratios to average net assets:4 | | | | | | | | | | | | | | | | | | | | |
| Net investment income (loss) | | | 0.52 | % | | | 0.23 | % | | | 0.23 | % | | | 0.02 | % | | | (0.14 | )% |
| Total expenses | | | 0.99 | %5,6,7 | | | 0.97 | %5,6,7 | | | 1.00 | %5,6 | | | 1.04 | %7 | | | 1.06 | %7 |
| Portfolio turnover rate | | | 130 | % | | | 115 | % | | | 110 | % | | | 110 | % | | | 147 | % |
| 1. | | Per share amounts calculated based on the average shares outstanding during the period. |
| |
| 2. | | Less than $0.005 per share. |
| |
| 3. | | Assumes an investment on the business day before the first day of the fiscal period, with all dividends and distributions reinvested in additional shares on the reinvestment date, and redemption at the net asset value calculated on the last business day of the fiscal period. Total returns are not annualized for periods less than one full year. Total return information does not reflect expenses that apply at the separate account level or to related insurance products. Inclusion of these charges would reduce the total return figures for all periods shown. Returns do not reflect the deduction of taxes that a shareholder would pay on fund distributions or the redemption of fund shares. |
| |
| 4. | | Annualized for periods less than one full year. |
| |
| 5. | | Total expenses including indirect expenses from affiliated fund were as follows: |
| | | | | |
| Year Ended December 31, 2008 | | | 0.99 | % |
| Year Ended December 31, 2007 | | | 0.97 | % |
| Year Ended December 31, 2006 | | | 1.00 | % |
| 6. | | Waiver or reimbursement of indirect management fees less than 0.005%. |
| |
| 7. | | Reduction to custodian expenses less than 0.005%. |
See accompanying Notes to Financial Statements.
F26 | OPPENHEIMER MAIN STREET SMALL CAP FUND/ VA
NOTES TO FINANCIAL STATEMENTS
1. Significant Accounting Policies
Oppenheimer Main Street Small Cap Fund/VA (the “Fund”) is a separate series of Oppenheimer Variable Account Funds, an open-end management investment company registered under the Investment Company Act of 1940, as amended. The Fund’s investment objective is to seek capital appreciation. The Fund’s investment adviser is OppenheimerFunds, Inc. (the “Manager”).
The Fund offers two classes of shares. Both classes are sold at their offering price, which is the net asset value per share, to separate investment accounts of participating insurance companies as an underlying investment for variable life insurance policies, variable annuity contracts or other investment products. The class of shares designated as Service shares is subject to a distribution and service plan. Both classes of shares have identical rights and voting privileges with respect to the Fund in general and exclusive voting rights on matters that affect that class alone. Earnings, net assets and net asset value per share may differ due to each class having its own expenses, such as transfer and shareholder servicing agent fees and shareholder communications, directly attributable to that class.
The following is a summary of significant accounting policies consistently followed by the Fund.
Securities Valuation. The Fund calculates the net asset value of its shares as of the close of the New York Stock Exchange (the “Exchange”), normally 4:00 P.M. Eastern time, on each day the Exchange is open for trading.
Effective for fiscal periods beginning after November 15, 2007, FASB Statement of Financial Accounting Standards No. 157, Fair Value Measurements, establishes a hierarchy for measuring fair value of assets and liabilities. As required by the standard, each investment asset or liability of the Fund is assigned a level at measurement date based on the significance and source of the inputs to its valuation. Quoted prices in active markets for identical securities are classified as “Level 1”, inputs other than quoted prices for an asset that are observable are classified as “Level 2” and unobservable inputs, including the Manager’s judgment about the assumptions that a market participant would use in pricing an asset or liability are classified as “Level 3”. The inputs used for valuing securities are not necessarily an indication of the risks associated with investing in those securities. A table summarizing the Fund’s investments under these levels of classification is included following the Statement of Investments.
Securities are valued using quoted market prices, when available, as supplied primarily either by portfolio pricing services approved by the Board of Trustees or dealers. These securities are typically classified within Level 1 or 2; however, they may be designated as Level 3 if the dealer or portfolio pricing service values a security through an internal model with significant unobservable market data inputs.
Securities traded on a registered U.S. securities exchange are valued based on the last sale price of the security reported on the principal exchange on which traded, prior to the time when the Fund’s assets are valued. Securities whose principal exchange is NASDAQ® are valued based on the official closing prices reported by NASDAQ prior to the time when the Fund’s assets are valued. In the absence of a sale, the security is valued at the last sale price on the prior trading day, if it is within the spread of the current day’s closing “bid” and “asked” prices, and if not, at the current day’s closing bid price. A foreign security traded on a foreign exchange is valued based on the last sale price on the principal exchange on which the security is traded, as identified by the portfolio pricing service used by the Manager, prior to the time when the Fund’s assets are valued. In the absence of a sale, the security is valued at the most recent official closing price on the principal exchange on which it is traded.
Shares of a registered investment company that are not traded on an exchange are valued at that investment company’s net asset value per share.
Corporate, government and municipal debt instruments having a remaining maturity in excess of sixty days and all mortgage-backed securities, collateralized mortgage obligations and other asset-backed securities are valued at the mean between the “bid” and “asked” prices.
“Money market-type” debt instruments with remaining maturities of sixty days or less are valued at cost adjusted by the amortization of discount or premium to maturity (amortized cost), which approximates market value. These securities are typically designated as Level 2.
F27 | OPPENHEIMER MAIN STREET SMALL CAP FUND/ VA
NOTES TO FINANCIAL STATEMENTS Continued
1. Significant Accounting Policies Continued
In the absence of a readily available quoted market price, including for securities whose values have been materially affected by what the Manager identifies as a significant event occurring before the Fund’s assets are valued but after the close of the securities’ respective exchanges, the Manager, acting through its internal valuation committee, in good faith determines the fair valuation of that asset using consistently applied procedures under the supervision of the Board of Trustees (which reviews those fair valuations by the Manager). Those procedures include certain standardized methodologies to fair value securities. Such methodologies include, but are not limited to, pricing securities initially at cost and subsequently adjusting the value based on: changes in company specific fundamentals, changes in an appropriate securities index, or changes in the value of similar securities which may be adjusted for any discounts related to resale restrictions. When possible, such methodologies use observable market inputs such as quoted prices of similar securities, observable interest rates, currency rates and yield curves. The methodologies used for valuing securities are not necessarily an indication of the risks associated with investing in those securities.
Fair valued securities may be classified as “Level 3” if the valuation primarily reflects the Manager’s own assumptions about the inputs that market participants would use in valuing such securities.
There have been no significant changes to the fair valuation methodologies during the period.
Concentration of Risks. The Fund from time to time may have elements of concentration risk due to the value of certain securities held compared to the overall net investments value of the Fund. Such concentrations may subject the Fund to additional risks.
Foreign Currency Translation. The Fund’s accounting records are maintained in U.S. dollars. The values of securities denominated in foreign currencies and amounts related to the purchase and sale of foreign securities and foreign investment income are translated into U.S. dollars as of the close of the Exchange, normally 4:00 P.M. Eastern time, on each day the Exchange is open for trading. Foreign exchange rates may be valued primarily using a reliable bank, dealer or service authorized by the Board of Trustees.
Reported net realized gains and losses from foreign currency transactions arise from sales of portfolio securities, sales and maturities of short-term securities, sales of foreign currencies, exchange rate fluctuations between the trade and settlement dates on securities transactions, and the difference between the amounts of dividends, interest, and foreign withholding taxes recorded on the Fund’s books and the U.S. dollar equivalent of the amounts actually received or paid. Net unrealized appreciation and depreciation on the translation of assets and liabilities denominated in foreign currencies arise from changes in the values of assets and liabilities, including investments in securities at fiscal period end, resulting from changes in exchange rates.
The effect of changes in foreign currency exchange rates on investments is separately identified from the fluctuations arising from changes in market values of securities held and reported with all other foreign currency gains and losses in the Fund’s Statement of Operations.
Investment in Oppenheimer Institutional Money Market Fund. The Fund is permitted to invest daily available cash balances in an affiliated money market fund. The Fund may invest the available cash in Class E shares of Oppenheimer Institutional Money Market Fund (“IMMF”) to seek current income while preserving liquidity. IMMF is a registered open-end management investment company, regulated as a money market fund under the Investment Company Act of 1940, as amended. The Manager is also the investment adviser of IMMF. The Fund’s investment in IMMF is included in the Statement of Investments. As a shareholder, the Fund is subject to its proportional share of IMMF’s Class E expenses, including its management fee. The Manager will waive fees and/or reimburse Fund expenses in an amount equal to the indirect management fees incurred through the Fund’s investment in IMMF.
Investments in OFI Liquid Assets Fund, LLC. The Fund is permitted to invest cash collateral received in connection with its securities lending activities. Pursuant to the Fund’s Securities Lending Procedures, the Fund may invest cash collateral in, among other investments, an affiliated money market fund. OFI Liquid Assets Fund, LLC (“LAF”) is a limited
F28 | OPPENHEIMER MAIN STREET SMALL CAP FUND/ VA
liability company whose investment objective is to seek current income and stability of principal. The Manager is also the investment adviser of LAF. LAF is not registered under the Investment Company Act of 1940. However, LAF does comply with the investment restrictions applicable to registered money market funds set forth in Rule 2a-7 adopted under the Investment Company Act. The Fund’s investment in LAF is included in the Statement of Investments. As a shareholder, the Fund is subject to its proportional share of LAF’s expenses, including its management fee of 0.08%.
Investments With Off-Balance Sheet Market Risk. The Fund enters into financial instrument transactions (such as swaps, futures, options and other derivatives) that may have off-balance sheet market risk. Off-balance sheet market risk exists when the maximum potential loss on a particular financial instrument is greater than the value of such financial instrument, as reflected in the Fund’s Statement of Assets and Liabilities.
Allocation of Income, Expenses, Gains and Losses Income, expenses (other than those attributable to a specific class), gains and losses are allocated on a daily basis to each class of shares based upon the relative proportion of net assets represented by such class. Operating expenses directly attributable to a specific class are charged against the operations of that class.
Federal Taxes. The Fund intends to comply with provisions of the Internal Revenue Code applicable to regulated investment companies and to distribute substantially all of its investment company taxable income, including any net realized gain on investments not offset by capital loss carryforwards, if any, to shareholders. Therefore, no federal income or excise tax provision is required. The Fund files income tax returns in U.S. federal and applicable state jurisdictions. The statute of limitations on the Fund’s tax return filings generally remain open for the three preceding fiscal reporting period ends.
The tax components of capital shown in the following table represent distribution requirements the Fund must satisfy under the income tax regulations, losses the Fund may be able to offset against income and gains realized in future years and unrealized appreciation or depreciation of securities and other investments for federal income tax purposes.
| | | | | | | | | | | | | |
| | | | | | | | | | | Net Unrealized | |
| | | | | | | | | | | Depreciation Based | |
| | | | | | | | | | | on Cost of Securities | |
| Undistributed | | Undistributed | | | Accumulated | | | and Other Investments | |
| Net Investment | | Long-Term | | | Loss | | | for Federal Income | |
| Income | | Gain | | | Carryforward1,2,3,4,5,6 | | | Tax Purposes | |
| |
| $4,877,031 | | $ | — | | | $ | 113,847,637 | | | $ | 258,206,559 | |
| | | |
| 1. | | As of December 31, 2008, the Fund had $91,820,783 of net capital loss carryforwards available to offset future realized capital gains, if any, and thereby reduce future taxable gain distributions. As of December 31, 2008, details of the capital loss carryforward were as follows: |
| | | | | |
| Expiring | | | | |
| 2016 | | $ | 91,820,783 | |
2. As of December 31, 2008, the Fund had $22,025,415 of post-October losses available to offset future realized capital gains, if any. Such losses, if unutilized, will expire in 2017.
3. The Fund had $57 of post-October foreign currency losses which were deferred.
4. The Fund had $1,382 of post-October passive foreign investment company losses which were deferred.
5. During the fiscal year ended December 31, 2008, the Fund did not utilize any capital loss carryforward.
6. During the fiscal year ended December 31, 2007, the Fund did not utilize any capital loss carryforward.
Net investment income (loss) and net realized gain (loss) may differ for financial statement and tax purposes. The character of dividends and distributions made during the fiscal year from net investment income or net realized gains may differ from their ultimate characterization for federal income tax purposes. Also, due to timing of dividends and distributions, the fiscal year in which amounts are distributed may differ from the fiscal year in which the income or net realized gain was recorded by the Fund.
F29 | OPPENHEIMER MAIN STREET SMALL CAP FUND/ VA
NOTES TO FINANCIAL STATEMENTS Continued
1. Significant Accounting Policies Continued
Accordingly, the following amounts have been reclassified for December 31, 2008. Net assets of the Fund were unaffected by the reclassifications.
| | | | | |
| | | Increase |
| Increase | | to Accumulated Net |
| to Accumulated Net | | Realized Loss |
| Investment Income | | on Investments |
| |
| $284,513 | | | $284,513 |
The tax character of distributions paid during the years ended December 31, 2008 and December 31, 2007 was as follows:
| | | | | | | | | |
| | | Year Ended | | | Year Ended | |
| | | December 31, 2008 | | | December 31, 2007 | |
| |
| Distributions paid from: | | | | | | | | |
| Ordinary income | | $ | 7,557,183 | | | $ | 2,813,251 | |
| Long-term capital gain | | | 42,996,508 | | | | 25,310,079 | |
| | | |
| Total | | $ | 50,553,691 | | | $ | 28,123,330 | |
| | | |
The aggregate cost of securities and other investments and the composition of unrealized appreciation and depreciation of securities and other investments for federal income tax purposes as of December 31, 2008 are noted in the following table. The primary difference between book and tax appreciation or depreciation of securities and other investments, if applicable, is attributable to the tax deferral of losses or tax realization of financial statement unrealized gain or loss.
| | | | | |
| Federal tax cost of securities | | $ | 975,990,724 | |
| Federal tax cost of other investments | | | (781,938 | ) |
| | | | |
| Total federal tax cost | | $ | 975,208,786 | |
| | | | |
| | | | | |
| Gross unrealized appreciation | | $ | 24,051,648 | |
| Gross unrealized depreciation | | | (282,258,207 | ) |
| | | | |
| Net unrealized depreciation | | $ | (258,206,559 | ) |
| | | | |
Trustees’ Compensation. The Board of Trustees has adopted a compensation deferral plan for independent trustees that enables trustees to elect to defer receipt of all or a portion of the annual compensation they are entitled to receive from the Fund. For purposes of determining the amount owed to the Trustee under the plan, deferred amounts are treated as though equal dollar amounts had been invested in shares of the Fund or in other Oppenheimer funds selected by the Trustee. The Fund purchases shares of the funds selected for deferral by the Trustee in amounts equal to his or her deemed investment, resulting in a Fund asset equal to the deferred compensation liability. Such assets are included as a component of “Other” within the asset section of the Statement of Assets and Liabilities. Deferral of trustees’ fees under the plan will not affect the net assets of the Fund, and will not materially affect the Fund’s assets, liabilities or net investment income per share. Amounts will be deferred until distributed in accordance to the compensation deferral plan.
Dividends and Distributions to Shareholders. Dividends and distributions to shareholders, which are determined in accordance with income tax regulations and may differ from U.S. generally accepted accounting principles, are recorded on the ex-dividend date. Income and capital gain distributions, if any, are declared and paid annually or at other times as deemed necessary by the Manager.
Investment Income. Dividend income is recorded on the ex-dividend date or upon ex-dividend notification in the case of certain foreign dividends where the ex-dividend date may have passed. Non-cash dividends included in dividend income, if any, are recorded at the fair market value of the securities received. Interest income is recognized on an accrual basis. Discount and premium, which are included in interest income on the Statement of Operations, are amortized or accreted daily.
F30 | OPPENHEIMER MAIN STREET SMALL CAP FUND/ VA
Custodian Fees. “Custodian fees and expenses” in the Statement of Operations may include interest expense incurred by the Fund on any cash overdrafts of its custodian account during the period. Such cash overdrafts may result from the effects of failed trades in portfolio securities and from cash outflows resulting from unanticipated shareholder redemption activity. The Fund pays interest to its custodian on such cash overdrafts, to the extent they are not offset by positive cash balances maintained by the Fund, at a rate equal to the Federal Funds Rate plus 0.50%. The “Reduction to custodian expenses” line item, if applicable, represents earnings on cash balances maintained by the Fund during the period. Such interest expense and other custodian fees may be paid with these earnings.
Security Transactions. Security transactions are recorded on the trade date. Realized gains and losses on securities sold are determined on the basis of identified cost.
Indemnifications. The Fund’s organizational documents provide current and former trustees and officers with a limited indemnification against liabilities arising in connection with the performance of their duties to the Fund. In the normal course of business, the Fund may also enter into contracts that provide general indemnifications. The Fund’s maximum exposure under these arrangements is unknown as this would be dependent on future claims that may be made against the Fund. The risk of material loss from such claims is considered remote.
Other. The preparation of financial statements in conformity with accounting principles generally accepted in the United States of America requires management to make estimates and assumptions that affect the reported amounts of assets and liabilities and disclosure of contingent assets and liabilities at the date of the financial statements and the reported amounts of increases and decreases in net assets from operations during the reporting period. Actual results could differ from those estimates.
2. Shares of Beneficial Interest
The Fund has authorized an unlimited number of $0.001 par value shares of beneficial interest of each class. Transactions in shares of beneficial interest were as follows:
| | | | | | | | | | | | | | | | | |
| | | Year Ended December 31, 2008 | | | Year Ended December 31, 2007 | |
| | | Shares | | | Amount | | | Shares | | | Amount | |
| |
Non-Service Shares | | | | | | | | | | | | | | | | |
| Sold | | | 1,628,830 | | | $ | 24,176,255 | | | | 1,931,787 | | | $ | 37,725,561 | |
| Dividends and/or distributions reinvested | | | 326,974 | | | | 4,920,957 | | | | 177,034 | | | | 3,322,932 | |
| Redeemed | | | (1,624,446 | ) | | | (23,649,433 | ) | | | (1,200,537 | ) | | | (23,353,120 | ) |
| | | |
| Net increase | | | 331,358 | | | $ | 5,447,779 | | | | 908,284 | | | $ | 17,695,373 | |
| | | |
| | | | | | | | | | | | | | | | | |
Service Shares | | | | | | | | | | | | | | | | |
| Sold | | | 14,415,062 | | | $ | 222,143,048 | | | | 15,587,096 | | | $ | 300,314,601 | |
| Dividends and/or distributions reinvested | | | 3,047,035 | | | | 45,492,232 | | | | 1,328,184 | | | | 24,744,065 | |
| Redeemed | | | (10,696,966 | ) | | | (148,649,327 | ) | | | (4,874,156 | ) | | | (94,248,550 | ) |
| | | |
| Net increase | | | 6,765,131 | | | $ | 118,985,953 | | | | 12,041,124 | | | $ | 230,810,116 | |
| | | |
3. Purchases and Sales of Securities
The aggregate cost of purchases and proceeds from sales of securities, other than short-term obligations and investments in Oppenheimer Institutional Money Market Fund and OFI Liquid Assets Fund, LLC, for the year ended December 31, 2008, were as follows:
| | | | | | | | | |
| | | Purchases | | | Sales | |
| |
| Investment securities | | $ | 1,177,910,057 | | | $ | 1,100,973,230 | |
F31 | OPPENHEIMER MAIN STREET SMALL CAP FUND/ VA
NOTES TO FINANCIAL STATEMENTS Continued
4. Fees and Other Transactions with Affiliates
Management Fees. Under the investment advisory agreement, the Fund pays the Manager a management fee based on the daily net assets of the Fund at an annual rate as shown in the following table:
| | | | | |
| Fee Schedule | | | | |
| |
| Up to $200 million | | | 0.75 | % |
| Next $200 million | | | 0.72 | |
| Next $200 million | | | 0.69 | |
| Next $200 million | | | 0.66 | |
| Over $800 million | | | 0.60 | |
Transfer Agent Fees. OppenheimerFunds Services (“OFS”), a division of the Manager, acts as the transfer and shareholder servicing agent for the Fund. The Fund pays OFS a per account fee. For the year ended December 31, 2008, the Fund paid $20,063 to OFS for services to the Fund.
Additionally, funds offered in variable annuity separate accounts are subject to minimum fees of $10,000 per class, for class level assets of $10 million or more. Each class is subject to the minimum fee in the event that the per account fee does not equal or exceed the applicable minimum fee.
Distribution and Service Plan for Service Shares. The Fund has adopted a Distribution and Service Plan (the “Plan”) in accordance with Rule 12b-1 under the Investment Company Act of 1940 for Service shares to pay OppenheimerFunds Distributor, Inc. (the “Distributor”), for distribution related services, personal service and account maintenance for the Fund’s Service shares. Under the Plan, payments are made periodically at an annual rate of up to 0.25% of the average annual net assets of Service shares of the Fund. The Distributor currently uses all of those fees to compensate sponsor(s) of the insurance product that offers Fund shares, for providing personal service and maintenance of accounts of their variable contract owners that hold Service shares. These fees are paid out of the Fund’s assets on an on-going basis and increase operating expenses of the Service shares, which results in lower performance compared to the Fund’s shares that are not subject to a service fee. Fees incurred by the Fund under the Plan are detailed in the Statement of Operations.
Waivers and Reimbursements of Expenses. OFS has voluntarily agreed to limit transfer and shareholder servicing agent fees for all classes to 0.35% of average annual net assets per class. This undertaking may be amended or withdrawn at any time.
The Manager will waive fees and/or reimburse Fund expenses in an amount equal to the indirect management fees incurred through the Fund’s investment in IMMF. During the year ended December 31, 2008, the Manager waived $7,346 for IMMF management fees.
5. Foreign Currency Exchange Contracts
The Fund may enter into foreign currency exchange contracts (“forward contracts”) for the purchase or sale of a foreign currency at a negotiated rate at a future date.
Forward contracts are reported on a schedule following the Statement of Investments. Forward contracts will be valued daily based upon the closing prices of the forward currency rates determined at the close of the Exchange as provided by a bank, dealer or pricing service. The resulting unrealized appreciation (depreciation) is reported in the Statement of Assets and Liabilities as a receivable or payable and in the Statement of Operations within the change in unrealized appreciation (depreciation). At contract close, the difference between the original cost of the contract and the value at the close date is recorded as a realized gain (loss) in the Statement of Operations.
Risks to the Fund include both market and credit risk. Market risk is the risk that the value of the forward contract will depreciate due to unfavorable changes in the exchange rates. Credit risk arises from the possibility that the counterparty will default. If the counterparty defaults, the Fund’s loss will consist of the net amount of contractual payments that the Fund has not yet received.
As of December 31, 2008, the Fund had no outstanding forward contracts.
F32 | OPPENHEIMER MAIN STREET SMALL CAP FUND/ VA
6. Illiquid or Restricted Securities
As of December 31, 2008, investments in securities included issues that are illiquid or restricted. Investments may be illiquid because they do not have an active trading market, making it difficult to value them or dispose of them promptly at an acceptable price. A restricted security may have a contractual restriction on its resale and is valued under methods approved by the Board of Trustees as reflecting fair value. The Fund will not invest more than 10% of its net assets (determined at the time of purchase and reviewed periodically) in illiquid and restricted securities. Certain restricted securities, eligible for resale to qualified institutional purchasers, may not be subject to that limitation. Securities that are illiquid or restricted are marked with an applicable footnote on the Statement of Investments. Restricted securities are reported on a schedule following the Statement of Investments.
7. Securities Lending
The Fund lends portfolio securities from time to time in order to earn additional income in the form of fees or interest on securities received as collateral or the investment of any cash received as collateral. The loans are secured by collateral (either securities, letters of credit, or cash) in an amount not less than 100% of the market value of the loaned securities during the period of the loan. The market value of the loaned securities is determined at the close of each business day and any additional required collateral is delivered to the Fund on the next business day. If the borrower defaults on its obligation to return the securities loaned because of insolvency or other reasons, the Fund could experience delays and cost in recovering the securities loaned or in gaining access to the collateral. The Fund continues to receive the economic benefit of interest or dividends paid on the securities loaned in the form of a substitute payment received from the borrower and recognizes the gain or loss in the fair value of the securities loaned that may occur during the term of the loan. The Fund has the right under the lending agreement to recover the securities from the borrower on demand. As of December 31, 2008, the Fund had on loan securities valued at $112,421,328. Collateral of $112,509,871 was received for the loans, all of which was received in cash and subsequently invested in approved instruments or held as cash.
8. Recent Accounting Pronouncement
In March 2008, the Financial Accounting Standards Board (“FASB”) issued Statement on Financial Accounting Standards (“SFAS”) No. 161, Disclosures about Derivative Instruments and Hedging Activities. This standard requires enhanced disclosures about derivative and hedging activities, including qualitative disclosures about how and why the Fund uses derivative instruments, how these activities are accounted for, and their effect on the Fund’s financial position, financial performance and cash flows. SFAS No. 161 is effective for financial statements issued for fiscal years and interim periods beginning after November 15, 2008. At this time, management is evaluating the implications of SFAS No. 161 and its impact on the Fund’s financial statements and related disclosures.
9. Change In Independent Registered Public Accounting Firm (Unaudited)
At a meeting held on August 20, 2008, the Board of Trustees of the Fund appointed KPMG LLP as the independent registered public accounting firm to the Fund for fiscal year 2009, replacing the firm of Deloitte & Touche LLP, effective at the conclusion of the fiscal 2008 audit. During the two most recent fiscal years the audit reports of Deloitte & Touche LLP contained no adverse opinion or disclaimer of opinion and were not qualified or modified as to uncertainty, audit scope or accounting principles. Further, there were no disagreements between the Fund and Deloitte & Touche LLP on accounting principles, financial statement disclosure or audit scope, which if not resolved to the satisfaction of Deloitte & Touche LLP would have caused it to make reference to the disagreements in connection with its reports.
F33 | OPPENHEIMER MAIN STREET SMALL CAP FUND/ VA
REPORT OF INDEPENDENT REGISTERED PUBLIC ACCOUNTING FIRM
To the Board of Trustees and Shareholders of Oppenheimer Main Street Small Cap Fund/VA:
We have audited the accompanying statement of assets and liabilities of Oppenheimer Main Street Small Cap Fund/VA (the “Fund”), a series of Oppenheimer Variable Account Funds, including the statement of investments, as of December 31, 2008, and the related statement of operations for the year then ended, the statements of changes in net assets for each of the two years in the period then ended, and the financial highlights for each of the five years in the period then ended. These financial statements and financial highlights are the responsibility of the Fund’s management. Our responsibility is to express an opinion on these financial statements and financial highlights based on our audits.
We conducted our audits in accordance with the standards of the Public Company Accounting Oversight Board (United States). Those standards require that we plan and perform the audit to obtain reasonable assurance about whether the financial statements and financial highlights are free of material misstatement. The Fund is not required to have, nor were we engaged to perform, an audit of its internal control over financial reporting. Our audits included consideration of internal control over financial reporting as a basis for designing audit procedures that are appropriate in the circumstances, but not for the purpose of expressing an opinion on the effectiveness of the Fund’s internal control over financial reporting. Accordingly, we express no such opinion. An audit also includes examining, on a test basis, evidence supporting the amounts and disclosures in the financial statements, assessing the accounting principles used and significant estimates made by management, as well as evaluating the overall financial statement presentation. Our procedures included confirmation of securities owned as of December 31, 2008, by correspondence with the custodian and brokers; where replies were not received from brokers, we performed other auditing procedures. We believe that our audits provide a reasonable basis for our opinion.
In our opinion, the financial statements and financial highlights referred to above present fairly, in all material respects, the financial position of the Fund as of December 31, 2008, the results of its operations for the year then ended, the changes in its net assets for each of the two years in the period then ended, and the financial highlights for each of the five years in the period then ended, in conformity with accounting principles generally accepted in the United States of America.
Deloitte & Touche LLP
Denver, Colorado
February 11, 2009
F34 | OPPENHEIMER MAIN STREET SMALL CAP FUND/ VA
FEDERAL INCOME TAX INFORMATION Unaudited
In early 2009, if applicable, shareholders of record received information regarding all dividends and distributions paid to them by the Fund during calendar year 2008. Regulations of the U.S. Treasury Department require the Fund to report this information to the Internal Revenue Service.
Capital gain distributions of $0.7717 per share were paid to Non-Service and Service shareholders, respectively, on March 10, 2008. Whether received in stock or in cash, the capital gain distribution should be treated by shareholders as a gain from the sale of the capital assets held for more than one year (long-term capital gains).
Dividends, if any, paid by the Fund during the fiscal year ended December 31, 2008 which are not designated as capital gain distributions should be multiplied by 100% to arrive at the amount eligible for the corporate dividend-received deduction.
The foregoing information is presented to assist shareholders in reporting distributions received from the Fund to the Internal Revenue Service. Because of the complexity of the federal regulations which may affect your individual tax return and the many variations in state and local tax regulations, we recommend that you consult your tax advisor for specific guidance.
7 | OPPENHEIMER MAIN STREET SMALL CAP FUND/ VA
BOARD APPROVAL OF THE FUND’S INVESTMENT ADVISORY AGREEMENT Unaudited
Each year, the Board of Trustees (the “Board”), including a majority of the independent Trustees, is required to determine whether to renew the Fund’s investment advisory agreement (the “Agreement”). The Investment Company Act of 1940, as amended, requires that the Board request and evaluate, and that the Manager provide, such information as may be reasonably necessary to evaluate the terms of the Agreement. The Board employs an independent consultant to prepare a report that provides information, including comparative information, the Board requests for that purpose. In addition, the Board receives information throughout the year regarding Fund services, fees, expenses and performance.
The Manager and the independent consultant provided information to the Board on the following factors: (i) the nature, quality and extent of the Manager’s services, (ii) the investment performance of the Fund and the Manager, (iii) the fees and expenses of the Fund, including comparative expense information, (iv) the profitability of the Manager and its affiliates, including an analysis of the cost of providing services, (v) whether economies of scale are realized as the Fund grows and whether fee levels reflect these economies of scale for Fund investors and (vi) other benefits to the Manager from its relationship with the Fund. The Board was aware that there are alternatives to retaining the Manager.
Outlined below is a summary of the principal information considered by the Board as well as the Board’s conclusions.
Nature, Quality and Extent of Services. The Board considered information about the nature, quality and extent of the services provided to the Fund and information regarding the Manager’s key personnel who provide such services. The Manager’s duties include providing the Fund with the services of the portfolio managers and the Manager’s investment team, who provide research, analysis and other advisory services in regard to the Fund’s investments; securities trading services; oversight of third party service providers; monitoring compliance with applicable Fund policies and procedures and adherence to the Fund’s investment restrictions. The Manager is responsible for providing certain administrative services to the Fund as well. Those services include providing and supervising all administrative and clerical personnel who are necessary in order to provide effective corporate administration for the Fund; compiling and maintaining records with respect to the Fund’s operations; preparing and filing reports required by the Securities and Exchange Commission; preparing periodic reports regarding the operations of the Fund for its shareholders; preparing proxy materials for shareholder meetings; and preparing the registration statements required by Federal and state securities laws for the sale of the Fund’s shares. The Manager also provides the Fund with office space, facilities and equipment.
The Board also considered the quality of the services provided and the quality of the Manager’s resources that are available to the Fund. The Board took account of the fact that the Manager has had over forty years of experience as an investment adviser and that its assets under management rank it among the top mutual fund managers in the United States. The Board evaluated the Manager’s advisory, administrative, accounting, legal and compliance services, and information the Board has received regarding the experience and professional qualifications of the Manager’s key personnel and the size and functions of its staff. In its evaluation of the quality of the portfolio management services provided, the Board considered the experience of Mark Zavanelli and Marc Reinganum, the portfolio managers for the Fund, and the Manager’s investment team and analysts. The Board members also considered the totality of their experiences with the Manager as Directors or Trustees of the Fund and other funds advised by the Manager. The Board considered information regarding the quality of services provided by affiliates of the Manager, which its members have become knowledgeable about in connection with the renewal of the Fund’s service agreements. The Board concluded that, in light of the Manager’s experience, reputation, personnel, operations and resources, the Fund benefits from the services provided under the Agreement.
8 | OPPENHEIMER MAIN STREET SMALL CAP FUND/ VA
Investment Performance of the Manager and the Fund. Throughout the year, the Manager provided information on the investment performance of the Fund and the Manager, including comparative performance information. The Board also reviewed information, prepared by the Manager and by the independent consultant, comparing the Fund’s historical performance to relevant market indices and to the performance of other small-cap core funds underlying variable insurance products. The Board considered that the Fund outperformed its performance universe median during the one-, three-, five- and ten-year periods.
Costs of Services by the Manager. The Board reviewed the fees paid to the Manager and the other expenses borne by the Fund. The Board also considered the comparability of the fees charged and the services provided to the Fund to the fees and services for other clients or accounts advised by the Manager. The independent consultant provided comparative data in regard to the fees and expenses of the Fund and small-cap core funds underlying variable insurance products with comparable asset levels and distribution features. The Board considered that the Fund’s total expenses were lower than its expense group median. In reviewing the fees and expenses charged to the VA Funds, the Board considered the Manager’s assertion that, because of the disparity among VA funds in how insurance companies may be compensated for the services they provide to shareholders, when comparing the expenses of the various VA funds it is most appropriate to focus on the total expenses rather than on the management fees. Accordingly, while the Board reviewed and considered all expenses in its consideration of the Advisory Agreement, it paid particular attention to total expenses.
Economies of Scale and Profits Realized by the Manager. The Board considered information regarding the Manager’s costs in serving as the Fund’s investment adviser, including the costs associated with the personnel and systems necessary to manage the Fund, and information regarding the Manager’s profitability from its relationship with the Fund. The Board reviewed whether the Manager may realize economies of scale in managing and supporting the Fund. The Board noted that the Fund currently has management fee breakpoints, which are intended to share with Fund shareholders economies of scale that may exist as the Fund’s assets grow.
Other Benefits to the Manager. In addition to considering the profits realized by the Manager, the Board considered information that was provided regarding the direct and indirect benefits the Manager receives as a result of its relationship with the Fund, including compensation paid to the Manager’s affiliates and research provided to the Manager in connection with permissible brokerage arrangements (soft dollar arrangements). The Board also considered that the Manager must be able to pay and retain experienced professional personnel at competitive rates to provide quality services to the Fund and that maintaining the financial viability of the Manager is important in order for the Manager to continue to provide significant services to the Fund and its shareholders.
Conclusions. These factors were also considered by the independent Trustees meeting separately from the full Board, assisted by experienced counsel to the Fund and to the independent Trustees. Fund counsel and the independent Trustees’ counsel are independent of the Manager within the meaning and intent of the Securities and Exchange Commission Rules.
Based on its review of the information it received and its evaluations described above, the Board, including a majority of the independent Trustees, decided to continue the Agreement for another year. In arriving at this decision, the Board did not single out any factor or factors as being more important than others, but considered all of the above information, and considered the terms and conditions of the Agreement, including the management fee, in light of all of the surrounding circumstances.
9 | OPPENHEIMER MAIN STREET SMALL CAP FUND/ VA
PORTFOLIO PROXY VOTING POLICIES AND PROCEDURES; UPDATES TO STATEMENTS OF INVESTMENTS Unaudited
The Fund has adopted Portfolio Proxy Voting Policies and Procedures under which the Fund votes proxies relating to securities (“portfolio proxies”) held by the Fund. A description of the Fund’s Portfolio Proxy Voting Policies and Procedures is available (i) without charge, upon request, by calling the Fund toll-free at 1.800.525.7048, (ii) on the Fund’s website at www.oppenheimerfunds.com, and (iii) on the SEC’s website at www.sec.gov. In addition, the Fund is required to file Form N-PX, with its complete proxy voting record for the 12 months ended June 30th, no later than August 31st of each year. The Fund’s voting record is available (i) without charge, upon request, by calling the Fund toll-free at 1.800.525.7048, and (ii) in the Form N-PX filing on the SEC’s website at www.sec.gov.
The Fund files its complete schedule of portfolio holdings with the SEC for the first quarter and the third quarter of each fiscal year on Form N-Q. The Fund’s Form N-Q filings are available on the SEC’s website at http://www.sec.gov. Those forms may be reviewed and copied at the SEC’s Public Reference Room in Washington, D.C. Information on the operation of the Public Reference Room may be obtained by calling 1-800-SEC-0330.
10 | OPPENHEIMER MAIN STREET SMALL CAP FUND/ VA
TRUSTEES AND OFFICERS Unaudited
| | | |
| Name, Position(s) Held with the | | Principal Occupation(s) During the Past 5 Years; Other Trusteeships/Directorships Held; Number of Portfolios in |
| Funds, Length of Service, Age | | the Funds Complex Currently Overseen |
| | | |
INDEPENDENT
TRUSTEES | | The address of each Trustee in the chart below is 6803 S. Tucson Way, Centennial, Colorado 80112-3924. Each Trustee serves for an indefinite term, or until his or her resignation, retirement, death or removal. |
| | | |
William L. Armstrong,
Chairman of the Board of
Trustees (since 2003),
Trustee (since 1999)
Age: 71 | | President, Colorado Christian University (since 2006); Chairman, Cherry Creek Mortgage Company (since 1991), Chairman, Centennial State Mortgage Company (since 1994), Chairman, The El Paso Mortgage Company (since 1993); Chairman, Ambassador Media Corporation (since 1984); Chairman, Broadway Ventures (since 1984); Director of Helmerich & Payne, Inc. (oil and gas drilling/production company) (since 1992), Campus Crusade for Christ (non-profit) (since 1991); Former Director, The Lynde and Harry Bradley Foundation, Inc. (non-profit organization) (2002-2006); former Chairman of: Transland Financial Services, Inc. (private mortgage banking company) (1997-2003), Great Frontier Insurance (1995-2000), Frontier Real Estate, Inc. (residential real estate brokerage) (1994-2000) and Frontier Title (title insurance agency) (1995-2000); former Director of the following: UNUMProvident (insurance company) (1991-2004), Storage Technology Corporation (computer equipment company) (1991-2003) and International Family Entertainment (television channel) (1992-1997); U.S. Senator (January 1979-January 1991). Oversees 41 portfolios in the OppenheimerFunds complex. |
| | | |
George C. Bowen,
Trustee (since 1999)
Age: 72 | | Assistant Secretary and Director of Centennial Asset Management Corporation (December 1991-April 1999); President, Treasurer and Director of Centennial Capital Corporation (June 1989-April 1999); Chief Executive Officer and Director of MultiSource Services, Inc. (March 1996-April 1999); Mr. Bowen held several positions with the Manager and with subsidiary or affiliated companies of the Manager (September 1987-April 1999). Oversees 41 portfolios in the OppenheimerFunds complex. |
| | | |
Edward L. Cameron,
Trustee (since 1999)
Age: 70 | | Member of The Life Guard of Mount Vernon (George Washington historical site) (June 2000 – June 2006); Partner of PricewaterhouseCoopers LLP (accounting firm) (July 1974-June 1999); Chairman of Price Waterhouse LLP Global Investment Management Industry Services Group (accounting firm) (July 1994-June 1998). Oversees 41 portfolios in the OppenheimerFunds complex. |
| | | |
Jon S. Fossel,
Trustee (since 1998)
Age: 66 | | Director of UNUMProvident (insurance company) (since June 2002); Director of Northwestern Energy Corp. (public utility corporation) (since November 2004); Director of P.R. Pharmaceuticals (October 1999-October 2003); Director of Rocky Mountain Elk Foundation (non-profit organization) (February 1998-February 2003 and February 2005-February 2007); Chairman and Director (until October 1996) and President and Chief Executive Officer (until October 1995) of the Manager; President, Chief Executive Officer and Director of the following: Oppenheimer Acquisition Corp. (“OAC”) (parent holding company of the Manager), Shareholders Services, Inc. and Shareholder Financial Services, Inc. (until October 1995). Oversees 41 portfolios in the OppenheimerFunds complex. |
| | | |
Sam Freedman,
Trustee (since 1998)
Age: 68 | | Director of Colorado UpLIFT (charitable organization) (since September 1984). Mr. Freedman held several positions with the Manager and with subsidiary or affiliated companies of the Manager (until October 1994). Oversees 41 portfolios in the OppenheimerFunds complex. |
| | | |
Beverly L. Hamilton,
Trustee (since 2002)
Age: 62 | | Trustee of Monterey Institute for International Studies (educational organization) (since February 2000); Board Member of Middlebury College (educational organization) (since December 2005); Director of The California Endowment (philanthropic organization) (since April 2002); Director (February 2002-2005) and Chairman of Trustees (2006-2007) of the Community Hospital of Monterey Peninsula; Director (October 1991-2005) and Vice Chairman (since 2006) of American Funds’ Emerging Markets Growth Fund, Inc. (mutual fund); President of ARCO Investment Management Company (February 1991-April 2000); Member of the investment commit- tees of The Rockefeller Foundation (2001-2006) and The University of Michigan (since 2000); Advisor at Credit Suisse First Boston’s Sprout venture capital unit (venture capital fund) (1994-January 2005); Trustee of MassMutual Institutional Funds (investment company) (1996-June 2004); Trustee of MML Series Investment Fund (investment company) (April 1989-June 2004); Member of the investment committee of Hartford Hospital (2000-2003); and Advisor to Unilever (Holland) pension fund (2000-2003). Oversees 41 portfolios in the OppenheimerFunds complex. |
11 | OPPENHEIMER MAIN STREET SMALL CAP FUND/ VA
TRUSTEES AND OFFICERS Unaudited / Continued
| | | |
| | | |
Robert J. Malone,
Trustee (since 2002)
Age: 64 | | Board of Directors of Opera Colorado Foundation (non-profit organization) (since March 2008); Director of Jones Knowledge, Inc. (since 2006); Director of Jones International University (educational organization) (since August 2005); Chairman, Chief Executive Officer and Director of Steele Street Bank & Trust (commercial banking) (since August 2003); Director of Colorado UpLIFT (charitable organization) (since 1986); Trustee of the Gallagher Family Foundation (non-profit organization) (since 2000); Former Chairman of U.S. Bank-Colorado (subsidiary of U.S. Bancorp and formerly Colorado National Bank) (July 1996-April 1999); Director of Commercial Assets, Inc. (real estate investment trust) (1993-2000); Director of Jones Knowledge, Inc. (2001-July 2004); and Director of U.S. Exploration, Inc. (oil and gas exploration) (1997-February 2004). Oversees 41 portfolios in the OppenheimerFunds complex. |
| | | |
F. William Marshall, Jr.,
Trustee (since 2000)
Age: 66 | | Trustee Emeritas of Worcester Polytech Institute (WPI) (private university) (since 2009); Trustee of MassMutual Select Funds (formerly MassMutual Institutional Funds) (investment company) (since 1996) and MML Series Investment Fund (investment company) (since 1996); President and Treasurer of the SIS Funds (private charitable fund) (since January 1999); Former Trustee of WPI (1985-2008); Former Chairman of the Board (2004-2006) and Former Chairman of the Investment Committee of WPI (1994-2008); Chairman of SIS & Family Bank, F.S.B. (formerly SIS Bank) (commercial bank) (January 1999-July 1999); Executive Vice President of Peoples Heritage Financial Group, Inc. (commercial bank) (January 1999-July 1999); and Former President and Chief Executive Officer of SIS Bancorp. (1993-1999). Oversees 43 portfolios in the OppenheimerFunds complex. |
| | | |
INTERESTED TRUSTEE
AND OFFICER | | The address of Mr. Murphy is Two World Financial Center, 225 Liberty Street, 11th Floor, New York, New York 10281- 1008. Mr. Murphy serves as a Trustee for an indefinite term, or until his resignation, retirement, death or removal and as an Officer for an indefinite term, or until his resignation, retirement, death or removal. Mr. Murphy is an interested Trustee due to his positions with OppenheimerFunds, Inc. and its affiliates. |
| | | |
John V. Murphy,
Trustee, President and
Principal Executive Officer
(since 2001)
Age: 59 | | Chairman and Director of the Manager (since June 2001); Chief Executive Officer of the Manager (June 2001- December 2008); President of the Manager (September 2000-February 2007); President and director or trustee of other Oppenheimer funds; President and Director of Oppenheimer Acquisition Corp. (“OAC”) (the Manager’s parent holding company) and of Oppenheimer Partnership Holdings, Inc. (holding company subsidiary of the Manager) (since July 2001); Director of OppenheimerFunds Distributor, Inc. (subsidiary of the Manager) (November 2001-December 2006); Chairman and Director of Shareholder Services, Inc. and of Shareholder Financial Services, Inc. (transfer agent subsidiaries of the Manager) (since July 2001); President and Director of OppenheimerFunds Legacy Program (charitable trust program established by the Manager) (since July 2001); Director of the following investment advisory subsidiaries of the Manager: OFI Institutional Asset Management, Inc., Centennial Asset Management Corporation, Trinity Investment Management Corporation and Tremont Capital Management, Inc. (since November 2001), HarbourView Asset Management Corporation and OFI Private Investments, Inc. (since July 2001); President (since November 2001) and Director (since July 2001) of Oppenheimer Real Asset Management, Inc.; Executive Vice President of Massachusetts Mutual Life Insurance Company (OAC’s parent company) (since February 1997); Director of DLB Acquisition Corporation (holding company parent of Babson Capital Management LLC) (since June 1995); Chairman (since October 2007) and Member of the Investment Company Institute’s Board of Governors (since October 2003). Oversees 105 portfolios in the OppenheimerFunds complex. |
| | | |
OTHER OFFICERS OF
THE FUND | | The addresses of the Officers in the chart below are as follows: for Messrs. Zavanelli, Reinganum and Zack, Two World Financial Center, 225 Liberty Street, New York, New York 10281-1008, for Messrs. Vandehey and Wixted, 6803 S. Tucson Way, Centennial, Colorado 80112-3924. Each Officer serves for an indefinite or until his or her resignation, retirement, death or removal. |
| | | |
Mark Zavanelli,
Vice President and
Portfolio Manager
(since 2001)
Age: 38 | | Vice President of the Manager (since November 2000); a Chartered Financial Analyst. Prior to joining the Manager in May 1998, President of Waterside Capital Management, a registered investment advisor (August 1995-April 1998). A portfolio manager and officer of 6 portfolios in the OppenheimerFunds complex. |
| | | |
Dr. Marc Reinganum,
Vice President and
Portfolio Manager
(since 2008)
Age: 55 | | Vice President of the Manager (since September 2002); Director of Quantitative Research and Portfolio Strategist for Equities; the Mary Jo Vaughn Rauscher Chair in Financial Investments at Southern Methodist University (1995-2002) where he also served as the Director of the Finance Institute, Chairman of the Finance Department, President of the Faculty at the Cox School of Business and member of the Board of Trustee Investment Committee. A portfolio manager and officer of 6 portfolios in the OppenheimerFunds complex. |
12 | OPPENHEIMER MAIN STREET SMALL CAP FUND/ VA
| | | |
| | | |
Mark S. Vandehey,
Vice President and Chief
Compliance Officer
(since 2004)
Age: 58 | | Senior Vice President and Chief Compliance Officer of the Manager (since March 2004); Chief Compliance Officer of OppenheimerFunds Distributor, Inc., Centennial Asset Management and Shareholder Services, Inc. (since March 2004); Vice President of OppenheimerFunds Distributor, Inc., Centennial Asset Management Corporation and Shareholder Services, Inc. (since June 1983); Former Vice President and Director of Internal Audit of the Manager (1997-February 2004). An officer of 105 portfolios in the OppenheimerFunds complex. |
| | | |
Brian W. Wixted,
Treasurer and Principal
Financial & Accounting
Officer (since 1999)
Age: 49 | | Senior Vice President and Treasurer of the Manager (since March 1999); Treasurer of the following:
HarbourView Asset Management Corporation, Shareholder Financial Services, Inc., Shareholder Services, Inc., Oppenheimer Real Asset Management, Inc. and Oppenheimer Partnership Holdings, Inc. (since March 1999), OFI Private Investments, Inc. (since March 2000), OppenheimerFunds International Ltd. and OppenheimerFunds plc (since May 2000), OFI Institutional Asset Management, Inc. (since November 2000), and OppenheimerFunds Legacy Program (charitable trust program established by the Manager) (since June 2003); Treasurer and Chief Financial Officer of OFI Trust Company (trust company subsidiary of the Manager) (since May 2000); Assistant Treasurer of the following: OAC (since March 1999), Centennial Asset Management Corporation (March 1999- October 2003) and OppenheimerFunds Legacy Program (April 2000-June 2003). An officer of 105 portfolios in the OppenheimerFunds complex. |
| | | |
Robert G. Zack,
Vice President and Secretary
(since 2001)
Age: 60 | | Executive Vice President (since January 2004) and General Counsel (since March 2002) of the Manager; General Counsel and Director of the Distributor (since December 2001); General Counsel of Centennial Asset Management Corporation (since December 2001); Senior Vice President and General Counsel of HarbourView Asset Management Corporation (since December 2001); Secretary and General Counsel of OAC (since November 2001); Assistant Secretary (since September 1997) and Director (since November 2001) of OppenheimerFunds International Ltd. and OppenheimerFunds plc; Vice President and Director of Oppenheimer Partnership Holdings, Inc. (since December 2002); Director of Oppenheimer Real Asset Management, Inc. (since November 2001); Senior Vice President, General Counsel and Director of Shareholder Financial Services, Inc. and Shareholder Services, Inc. (since December 2001); Senior Vice President, General Counsel and Director of OFI Private Investments, Inc. and OFI Trust Company (since November 2001); Vice President of OppenheimerFunds Legacy Program (since June 2003); Senior Vice President and General Counsel of OFI Institutional Asset Management, Inc. (since November 2001); Director of OppenheimerFunds International Distributor Limited (since December 2003); Senior Vice President (May 1985-December 2003). An officer of 105 portfolios in the OppenheimerFunds complex. |
The Fund’s Statement of Additional Information contains additional information about the Fund’s Trustees and Officers and is available without charge, upon request, by calling 1.800.981.2871.
13 | OPPENHEIMER MAIN STREET SMALL CAP FUND/ VA
FUND EXPENSES
Fund Expenses. As a shareholder of the Fund, you incur ongoing costs, including management fees; service fees; and other Fund expenses. These examples are intended to help you understand your ongoing costs (in dollars) of investing in the Fund and to compare these costs with the ongoing costs of investing in other mutual funds.
The examples are based on an investment of $1,000.00 invested at the beginning of the period and held for the entire 6-month period ended December 31, 2008.
Actual Expenses. The first section of the table provides information about actual account values and actual expenses. You may use the information in this section, together with the amount you invested, to estimate the expense that you paid over the period. Simply divide your account value by $1,000.00 (for example, an $8,600.00 account value divided by $1,000.00 = 8.60), then multiply the result by the number in the first section under the heading entitled “Expenses Paid During Period” to estimate the expenses you paid on your account during this period.
Hypothetical Example for Comparison Purposes. The second section of the table provides information about hypothetical account values and hypothetical expenses based on the Fund’s actual expense ratio, and an assumed rate of return of 5% per year before expenses, which is not the actual return. The hypothetical account values and expenses may not be used to estimate the actual ending account balance or expenses you paid for the period. You may use this information to compare the ongoing costs of investing in the Fund and other funds. To do so, compare this 5% hypothetical example with the 5% hypothetical examples that appear in the shareholder reports of the other funds.
Please note that the expenses shown in the table are meant to highlight your ongoing costs only and do not reflect any charges associated with the separate accounts that offer this Fund. Therefore, the “hypothetical” lines of the table are useful in comparing ongoing costs only, and will not help you determine the relative total costs of owning different funds. In addition, if these separate account charges were included your costs would have been higher.
| | | | | | | | | | | | | |
| | | Beginning | | | Ending | | | Expenses | |
| | | Account | | | Account | | | Paid During | |
| | | Value | | | Value | | | 6 Months Ended | |
| Actual | | July 1, 2008 | | | December 31, 2008 | | | December 31, 2008 | |
| |
| | | $ | 1,000.00 | | | $ | 1,012.30 | | | $ | 2.58 | |
| |
Hypothetical | | | | | | | | | | | | |
| (5% return before expenses) | | | | | | | | | | | | |
| |
| | | | 1,000.00 | | | | 1,022.57 | | | | 2.60 | |
Expenses are equal to the Fund’s annualized expense ratio, multiplied by the average account value over the period, multiplied by 184/366 (to reflect the one-half year period). The annualized expense ratio based on the 6-month period ended December 31, 2008 is as follows:
The “Financial Highlights” table in the Fund’s financial statements, included in this report, also show the gross expense ratio, without such waivers or reimbursements and reduction to custodian expenses, if applicable.
5 | OPPENHEIMER MONEY FUND/VA
THIS PAGE INTENTIONALLY LEFT BLANK.
6 | OPPENHEIMER MONEY FUND/VA
STATEMENT OF INVESTMENTS December 31, 2008
| | | | | | | | | |
| | | Principal | | | | |
| | | Amount | | | Value | |
| |
Certificates of Deposit—22.9% | | | | | | | | |
Domestic Certificates of Deposit—3.7% | | | | | | | | |
| Citibank NA: | | | | | | | | |
| 1.40%, 3/20/09 | | $ | 3,000,000 | | | $ | 3,000,000 | |
| 1.45%, 3/20/09 | | | 3,000,000 | | | | 3,000,000 | |
| 1.65%, 1/8/09 | | | 1,000,000 | | | | 1,000,000 | |
| 1.85%, 3/12/09 | | | 2,000,000 | | | | 2,000,000 | |
| | | | | | | | |
| | | | | | | | 9,000,000 | |
| | | | | | | | | |
Yankee Certificates of Deposit—19.2% | | | | | | | | |
| Bank of Nova Scotia, Houston, TX: | | | | | | | | |
2.46%, 9/4/091 | | | 3,000,000 | | | | 3,000,000 | |
2.501%, 9/8/091 | | | 3,000,000 | | | | 3,000,000 | |
| BNP Paribas, New York: | | | | | | | | |
| 1.97%, 2/12/09 | | | 6,000,000 | | | | 6,000,000 | |
| 2.12%, 3/6/09 | | | 1,500,000 | | | | 1,500,000 | |
| 2.29%, 2/10/09 | | | 2,000,000 | | | | 2,000,552 | |
| 3.10%, 2/27/09 | | | 1,800,000 | | | | 1,800,000 | |
| Lloyds TSB Bank plc: | | | | | | | | |
| 0.33%, 1/22/09 | | | 3,000,000 | | | | 3,000,000 | |
| 3.50%, 1/23/09 | | | 3,000,000 | | | | 3,001,089 | |
| Rabobank Nederland NV, New York: | | | | | | | | |
| 0.75%, 6/24/09 | | | 2,000,000 | | | | 2,000,000 | |
| 1.25%, 6/16/09 | | | 4,000,000 | | | | 4,000,000 | |
| Royal Bank of Canada, New York, | | | | | | | | |
2.71%, 8/7/091 | | | 5,000,000 | | | | 5,000,000 | |
| Societe Generale: | | | | | | | | |
| 4%, 1/16/09 | | | 5,000,000 | | | | 5,000,000 | |
| 4%, 1/20/09 | | | 2,000,000 | | | | 2,000,000 | |
| Toronto Dominion Bank, New York: | | | | | | | | |
| 3.03%, 2/5/09 | | | 3,000,000 | | | | 3,000,000 | |
| 3.13%, 1/30/09 | | | 2,500,000 | | | | 2,500,000 | |
| | | | | | | | |
| | | | | | | | 46,801,641 | |
| |
| | | | | | | | |
| Total Certificates of Deposit (Cost $55,801,641) | | | | | | | 55,801,641 | |
| | | | | | | | | |
Direct Bank Obligations—15.6% | | | | | | | | |
| Bank of America NA, 2.18%, 2/27/09 | | | 5,000,000 | | | | 4,999,849 | |
| Barclays US Funding LLC, 1.55%, 1/5/09 | | | 1,000,000 | | | | 999,828 | |
| Calyon North America, Inc.: | | | | | | | | |
| 0.44%, 1/21/09 | | | 1,500,000 | | | | 1,499,633 | |
| 0.45%, 1/12/09 | | | 1,000,000 | | | | 999,704 | |
| Danske Corp.: | | | | | | | | |
1.285%, 3/30/092 | | | 2,000,000 | | | | 1,993,718 | |
1.79%, 3/12/092 | | | 1,000,000 | | | | 995,975 | |
1.80%, 1/5/092 | | | 2,000,000 | | | | 1,999,600 | |
2.03%, 3/9/092 | | | 2,000,000 | | | | 1,992,444 | |
2.03%, 3/10/092 | | | 2,000,000 | | | | 1,992,331 | |
| Deutsche Bank Financial LLC, | | | | | | | | |
| 0.39%, 1/13/09 | | | 1,000,000 | | | | 999,870 | |
HSBC Bank USA NA, 2.53%, 8/14/091 | | | 3,000,000 | | | | 2,970,267 | |
| National Australia Funding (Delaware), Inc.: | | | | | | | | |
0.69%, 3/18/092 | | $ | 2,000,000 | | | $ | 1,997,087 | |
1.25%, 3/2/092 | | | 3,000,000 | | | | 2,993,750 | |
1.75%, 2/11/092 | | | 1,000,000 | | | | 998,007 | |
| Nordea North America, Inc.: | | | | | | | | |
| 1.02%, 3/17/09 | | | 2,500,000 | | | | 2,494,688 | |
| 2.04%, 3/11/09 | | | 2,000,000 | | | | 1,992,180 | |
| Rabobank USA Financial Corp., | | | | | | | | |
| 1.30%, 2/4/09 | | | 3,000,000 | | | | 2,996,317 | |
Royal Bank of Canada, 4.95%, 7/15/091 | | | 3,000,000 | | | | 3,000,000 | |
| | | | | | | | |
| Total Direct Bank Obligations (Cost $37,915,248) | | | | | | | 37,915,248 | |
| | | | | | | | | |
Short-Term Notes—58.9% | | | | | | | | |
Air Freight & Couriers—0.8% | | | | | | | | |
| United Parcel Service, Inc., | | | | | | | | |
| 0.40%, 1/8/09 | | | 2,000,000 | | | | 1,999,844 | |
Automobiles—2.9% | | | | | | | | |
BMW US Capital LLC, 2%, 1/8/092 | | | 7,000,000 | | | | 6,997,278 | |
Building Products—0.8% | | | | | | | | |
| Illinois Tool Works, Inc., 1.20%, 2/2/09 | | | 2,000,000 | | | | 1,997,867 | |
Capital Markets—2.1% | | | | | | | | |
| Banc of America Securities LLC, | | | | | | | | |
0.19%, 1/1/091 | | | 5,000,000 | | | | 5,000,000 | |
Chemicals—0.4% | | | | | | | | |
| BASF AG, 1.47%, 1/7/09 | | | 1,000,000 | | | | 999,755 | |
Commercial Finance—0.8% | | | | | | | | |
| Private Export Funding Corp., | | | | | | | | |
0.80%, 1/13/092 | | | 2,000,000 | | | | 1,999,467 | |
Diversified Financial Services—4.6% | | | | | | | | |
| General Electric Capital Corp.: | | | | | | | | |
| 2.60%, 1/29/09 | | | 4,300,000 | | | | 4,291,304 | |
| 3%, 1/27/09 | | | 5,000,000 | | | | 4,989,167 | |
| 3.10%, 1/23/09 | | | 2,000,000 | | | | 1,996,211 | |
| | | | | | | | |
| | | | | | | | 11,276,682 | |
| | | | | | | | | |
| Diversified Telecommunication Services—0.8% | | | | |
| AT&T, Inc., 1.15%, 1/30/09 | | | 2,000,000 | | | | 1,998,147 | |
Food Products—1.0% | | | | | | | | |
| Nestle Capital Corp.: | | | | | | | | |
2.395%, 3/13/092 | | | 1,500,000 | | | | 1,492,915 | |
2.40%, 3/6/092 | | | 1,000,000 | | | | 995,733 | |
| | | | | | | | |
| | | | | | | | 2,488,648 | |
| | | | | | | | | |
Insurance—5.3% | | | | | | | | |
| Jackson National Life Global Funding, | | | | | | | | |
Series 2004-6, 1.29%, 8/15/091,3 | | | 2,500,000 | | | | 2,500,000 | |
| Jackson National Life Global Funding, | | | | | | | | |
Series 2008-1, 2.69%, 2/10/091,4 | | | 1,000,000 | | | | 1,000,000 | |
| MetLife Funding, Inc.: | | | | | | | | |
| 0.40%, 1/28/09 | | | 4,500,000 | | | | 4,498,650 | |
| 1%, 1/14/09 | | | 1,000,000 | | | | 999,639 | |
F1 | OPPENHEIMER MONEY FUND/VA
STATEMENT OF INVESTMENTS Continued
| | | | | | | | | |
| | | Principal | | | | |
| | | Amount | | | Value | |
| |
Insurance Continued | | | | | | | | |
Security Life of Denver, 2.13%, 9/8/091,3 | | $ | 2,000,000 | | | $ | 2,000,000 | |
| United of Omaha Life Insurance Co., | | | | | | | | |
1.64%, 12/28/091 | | | 2,000,000 | | | | 2,000,000 | |
| | | | | | | | |
| | | | | | | | 12,998,289 | |
| | | | | | | | | |
Leasing & Factoring—6.3% | | | | | | | | |
| American Honda Finance Corp.: | | | | | | | | |
1.998%, 9/18/091,4 | | | 1,000,000 | | | | 1,000,000 | |
2.989%, 5/5/091,4 | | | 3,000,000 | | | | 3,000,000 | |
| Toyota Motor Credit Corp.: | | | | | | | | |
| 1.25%, 3/23/09 | | | 3,000,000 | | | | 2,991,563 | |
| 2.50%, 2/2/09 | | | 2,900,000 | | | | 2,892,009 | |
| 2.65%, 1/26/09 | | | 2,400,000 | | | | 2,395,583 | |
| 3.55%, 1/22/09 | | | 3,000,000 | | | | 2,993,788 | |
| | | | | | | | |
| | | | | | | | 15,272,943 | |
| | | | | | | | | |
Municipal—1.9% | | | | | | | | |
| Alta Mira LLC, Series 2004, | | | | | | | | |
2.29%, 1/2/091 | | | 2,205,000 | | | | 2,205,000 | |
| Hayward, CA Multifamily Housing | | | | | | | | |
| Revenue Bonds, Lord Tennyson Apts. | | | | | | | | |
Project, Series A-T, 1.75%, 1/2/091 | | | 710,000 | | | | 710,000 | |
| St. Johns Cnty., FL Industrial | | | | | | | | |
| Development Authority Revenue Bonds, | | | | | | | | |
| Presbyterian Retirement Communities | | | | | | | | |
Project, Series 2004B, 3.38%, 1/7/091 | | | 1,000,000 | | | | 1,000,000 | |
| Taxable Adjustable Demand | | | | | | | | |
| Health Care Revenue Bonds, | | | | | | | | |
| SFO Associates Project, Series 1994, | | | | | | | | |
10%, 1/1/091 | | | 785,000 | | | | 785,000 | |
| | | | | | | | |
| | | | | | | | 4,700,000 | |
| | | | | | | | | |
Oil, Gas & Consumable Fuels—2.1% | | | | | | | | |
| BP Capital Markets plc, 1.15%, 3/2/09 | | | 2,000,000 | | | | 1,996,167 | |
| Shell International Finance BV, | | | | | | | | |
0.40%, 4/3/092 | | | 1,000,000 | | | | 998,978 | |
Total Capital, 1.10%, 1/5/092 | | | 2,000,000 | | | | 1,999,733 | |
| | | | | | | | |
| | | | | | | | 4,994,878 | |
| |
Personal Products—2.9% | | | | | | | | |
| Kimberly-Clark Worldwide, | | | | | | | | |
0.45%, 2/9/092 | | | 1,000,000 | | | | 999,513 | |
Procter & Gamble Co., 1%, 1/21/092 | | | 2,000,000 | | | | 1,998,889 | |
| Reckitt Benckiser Treasury Services plc: | | | | | | | | |
2.27%, 2/13/092 | | | 2,000,000 | | | | 1,994,577 | |
2.30%, 3/3/092 | | | 2,000,000 | | | | 1,992,206 | |
| | | | | | | | |
| | | | | | | | 6,985,185 | |
| | | | | | | | | |
Pharmaceuticals—2.1% | | | | | | | | |
| Johnson & Johnson, 0.50%, 1/27/09 | | $ | 2,000,000 | | | $ | 1,999,278 | |
| Merck & Co., Inc., 0.15%, 2/5/09 | | | 1,000,000 | | | | 999,854 | |
Pfizer, Inc., 0.85%, 2/2/092 | | | 2,000,000 | | | | 1,998,489 | |
| | | | | | | | |
| | | | | | | | 4,997,621 | |
| | | | | | | | | |
Receivables Finance—23.5% | | | | | | | | |
| Amsterdam Funding Corp., | | | | | | | | |
3.08%, 3/5/092 | | | 3,000,000 | | | | 2,983,830 | |
Barton Capital Corp., 1.10%, 1/15/092 | | | 1,000,000 | | | | 999,572 | |
Chariot Funding LLC, 1.40%, 1/2/094 | | | 1,500,000 | | | | 1,499,942 | |
| Falcon Asset Securitization Co. LLC: | | | | | | | | |
1.40%, 1/28/092 | | | 5,000,000 | | | | 4,994,750 | |
1.40%, 2/9/092 | | | 5,000,000 | | | | 4,992,417 | |
| Gemini Securitization Corp.: | | | | | | | | |
0.75%, 3/19/092 | | | 6,000,000 | | | | 5,990,375 | |
3.25%, 1/27/092 | | | 2,000,000 | | | | 1,995,306 | |
4.35%, 1/15/092 | | | 1,600,000 | | | | 1,597,293 | |
4.35%, 1/16/092 | | | 2,000,000 | | | | 1,996,375 | |
| Legacy Capital LLC, 2.70%, 1/12/09 | | | 5,000,000 | | | | 4,995,875 | |
| Lexington Parker Capital Co. LLC: | | | | | | | | |
2.50%, 1/9/092 | | | 9,000,000 | | | | 8,995,000 | |
3.10%, 1/6/092 | | | 2,000,000 | | | | 1,999,139 | |
| Old Line Funding Corp., | | | | | | | | |
0.50%, 1/22/092 | | | 1,000,000 | | | | 999,708 | |
| Park Avenue Receivables Co. LLC, | | | | | | | | |
| 1.40%, 1/6/09 | | | 3,000,000 | | | | 2,999,417 | |
| Ranger Funding Co. LLC, | | | | | | | | |
1.55%, 1/5/094 | | | 4,150,000 | | | | 4,149,354 | |
| Sheffield Receivables Corp., | | | | | | | | |
0.60%, 1/13/092 | | | 1,000,000 | | | | 999,800 | |
| Thunder Bay Funding LLC, | | | | | | | | |
3%, 1/23/094 | | | 3,000,000 | | | | 2,994,500 | |
| Windmill Funding Corp., | | | | | | | | |
3.10%, 1/7/092 | | | 2,000,000 | | | | 1,998,967 | |
| | | | | | | | |
| | | | | | | | 57,181,620 | |
| | | | | | | | | |
Special Purpose Financial—0.6% | | | | | | | | |
| Ticonderoga Funding LLC, | | | | | | | | |
| 0.35%, 1/22/09 | | | 1,500,000 | | | | 1,499,694 | |
| | | | | | | | |
| |
Total Short-Term Notes
(Cost $143,387,918) | | | | | | | 143,387,918 | |
| |
U.S. Government Agencies—2.5% | | | | | | | | |
| Federal Home Loan Bank, | | | | | | | | |
| 2.75%, 4/27/09 | | | 4,000,000 | | | | 3,964,551 | |
| Federal Home Loan Mortgage Corp., | | | | | | | | |
| 0.12%, 2/2/09 | | | 1,000,000 | | | | 999,893 | |
F2 | OPPENHEIMER MONEY FUND/VA
| | | | | | | | | |
| | | Principal | | | | |
| | | Amount | | | Value | |
| |
U.S. Government Agencies Continued | | | | | | | | |
| Federal National Mortgage Assn., | | | | | | | | |
| 0.10%, 2/2/09 | | $ | 1,000,000 | | | $ | 999,911 | |
| | | | | | | | |
| | | | | | | | | |
Total U.S. Government Agencies
(Cost $5,964,355) | | | | | | | 5,964,355 | |
| |
Total Investments, at Value
(Cost $243,069,162) | | | 99.9 | % | | | 243,069,162 | |
| | | | | | | | | |
Other Assets Net of Liabilities | | | 0.1 | | | | 287,222 | |
| | | |
| |
Net Assets | | | 100.0 | % | | $ | 243,356,384 | |
| | | |
Industry classifications are unaudited.
Footnotes to Statement of Investments
Short-term notes and direct bank obligations are generally traded on a discount basis; the interest rate shown is the discount rate received by the Fund at the time of purchase. Other securities normally bear interest at the rates shown.
1. Represents the current interest rate for a variable or increasing rate security.
2. Security issued in an exempt transaction without registration under the Securities Act of 1933. Such securities amount to $78,973,222, or 32.45% of the Fund’s net assets, and have been determined to be liquid pursuant to guidelines adopted by the Board of Trustees.
3. Illiquid security. The aggregate value of illiquid securities as of December 31, 2008 was $4,500,000, which represents 1.85% of the Fund’s net assets. See Note 4 of accompanying Notes.
4. Represents securities sold under Rule 144A, which are exempt from registration under the Securities Act of 1933, as amended. These securities have been determined to be liquid under guidelines established by the Board of Trustees. These securities amount to $13,643,796 or 5.61% of the Fund’s net assets as of December 31, 2008.
Valuation Inputs
Various data inputs are used in determining the value of each of the Fund’s investments as of the reporting period end. These data inputs are categorized in the following hierarchy under applicable financial accounting standards:
1) Level 1–quoted prices in active markets for identical assets or liabilities (including securities actively traded on a securities exchange)
2) Level 2–inputs other than quoted prices that are observable for the asset (such as quoted prices for similar assets and market corroborated inputs such as interest rates, prepayment speeds, credit risks, etc.)
3) Level 3–unobservable inputs (including the Manager’s own judgments about assumptions that market participants would use in pricing the asset).
The market value of the Fund’s investments was determined based on the following inputs as of December 31, 2008:
| | | | | | | | | |
| | | Investments | | | Other Financial | |
| Valuation Description | | in Securities | | | Instruments* | |
| |
| Level 1—Quoted Prices | | $ | — | | | $ | — | |
| Level 2—Other Significant Observable Inputs | | | 243,069,162 | | | | — | |
| Level 3—Significant Unobservable Inputs | | | — | | | | — | |
| | | |
| Total | | $ | 243,069,162 | | | $ | — | |
| | | |
| | |
| * | | Other financial instruments include options written, currency contracts, futures, forwards and swap contracts. Currency contracts and forwards are reported at their unrealized appreciation/depreciation at measurement date, which represents the change in the contract’s value from trade date. Futures are reported at their variation margin at measurement date, which represents the amount due to/from the Fund at that date. Options written and swaps are reported at their market value at measurement date. |
See the accompanying Notes for further discussion of the methods used in determining value of the Fund’s investments, and a summary of changes to the valuation techniques, if any, during the reporting period.
See accompanying Notes to Financial Statements.
F3 | OPPENHEIMER MONEY FUND/VA
STATEMENT OF ASSETS AND LIABILITIES December 31, 2008
| | | | | |
Assets | | | | |
| Investments, at value (cost $243,069,162)—see accompanying statement of investments | | $ | 243,069,162 | |
| Cash | | | 491,436 | |
| Receivables and other assets: | | | | |
| Interest | | | 337,885 | |
| Shares of beneficial interest sold | | | 20,525 | |
| Other | | | 34,425 | |
| | | | |
| Total assets | | | 243,953,433 | |
| | | | | |
Liabilities | | | | |
| Payables and other liabilities: | | | | |
| Shares of beneficial interest redeemed | | | 449,341 | |
| Dividends | | | 103,648 | |
| Shareholder communications | | | 12,874 | |
| Trustees’ compensation | | | 2,460 | |
| Transfer and shareholder servicing agent fees | | | 860 | |
| Other | | | 27,866 | |
| | | | |
| Total liabilities | | | 597,049 | |
| | | | | |
Net Assets | | $ | 243,356,384 | |
| | | | |
| | | | | |
Composition of Net Assets | | | | |
| Par value of shares of beneficial interest | | $ | 243,331 | |
| Additional paid-in capital | | | 243,113,801 | |
| Accumulated net investment loss | | | (1,067 | ) |
| Accumulated net realized gain on investments | | | 319 | |
| | | | |
Net Assets—applicable to 243,331,044 shares of beneficial interest outstanding | | $ | 243,356,384 | |
| | | | |
| | | | | |
Net Asset Value, Redemption Price Per Share and Offering Price Per Share | | $ | 1.00 | |
See accompanying Notes to Financial Statements.
F4 | OPPENHEIMER MONEY FUND/VA
STATEMENT OF OPERATIONS For the Year Ended December 31, 2008
| | | | | |
Investment Income | | | | |
| Interest | | $ | 6,843,139 | |
| | | | | |
Expenses | | | | |
| Management fees | | | 955,875 | |
| Shareholder communications | | | 24,894 | |
| Insurance expense | | | 23,373 | |
| Transfer and shareholder servicing agent fees | | | 9,994 | |
| Trustees’ compensation | | | 6,792 | |
| Custodian fees and expenses | | | 1,257 | |
| Other | | | 33,803 | |
| | | | |
| Total expenses | | | 1,055,988 | |
| | | | | |
Net Investment Income | | | 5,787,151 | |
| | | | | |
Net Realized Gain on Investments | | | 321 | |
| | | | | |
Net Increase in Net Assets Resulting from Operations | | $ | 5,787,472 | |
| | | | |
See accompanying Notes to Financial Statements.
F5 | OPPENHEIMER MONEY FUND/VA
STATEMENTS OF CHANGES IN NET ASSETS
| | | | | | | | | |
| Year Ended December 31, | | 2008 | | | 2007 | |
| |
Operations | | | | | | | | |
| Net investment income | | $ | 5,787,151 | | | $ | 8,813,949 | |
| Net realized gain (loss) | | | 321 | | | | (2 | ) |
| | | |
| Net increase in net assets resulting from operations | | | 5,787,472 | | | | 8,813,947 | |
| | | | | | | | | |
Dividends and/or Distributions to Shareholders | | | | | | | | |
| Dividends from net investment income | | | (5,787,153 | ) | | | (8,813,949 | ) |
| Distributions from net realized gain | | | — | | | | (3,645 | ) |
| | | | | | | | | |
Beneficial Interest Transactions | | | | | | | | |
| Net increase in net assets resulting from beneficial interest transactions | | | 53,607,490 | | | | 18,231,526 | |
| | | | | | | | | |
Net Assets | | | | | | | | |
| Total increase | | | 53,607,809 | | | | 18,227,879 | |
| Beginning of period | | | 189,748,575 | | | | 171,520,696 | |
| | | |
| End of period (including accumulated net investment loss of $1,067 and $1,065, respectively) | | $ | 243,356,384 | | | $ | 189,748,575 | |
| | | |
See accompanying Notes to Financial Statements.
F6 | OPPENHEIMER MONEY FUND/VA
FINANCIAL HIGHLIGHTS
| | | | | | | | | | | | | | | | | | | | | |
| Year Ended December 31, | | 2008 | | | 2007 | | | 2006 | | | 2005 | | | 2004 | |
| |
Per Share Operating Data | | | | | | | | | | | | | | | | | | | | |
| Net asset value, beginning of period | | $ | 1.00 | | | $ | 1.00 | | | $ | 1.00 | | | $ | 1.00 | | | $ | 1.00 | |
| |
Income from investment operations–net investment income and net realized gain1 | | | .03 | | | | .05 | | | | .05 | | | | .03 | | | | .01 | |
| |
| Dividends and/or distributions to shareholders: | | | | | | | | | | | | | | | | | | | | |
| Dividends from net investment income | | | (.03 | ) | | | (.05 | ) | | | (.05 | ) | | | (.03 | ) | | | (.01 | ) |
| |
| Distributions from net realized gain | | | — | | | | — | 2 | | | — | 2 | | | — | | | | — | |
| | | |
| Total dividends and/or distributions to shareholders | | | (.03 | ) | | | (.05 | ) | | | (.05 | ) | | | (.03 | ) | | | (.01 | ) |
| |
| Net asset value, end of period | | $ | 1.00 | | | $ | 1.00 | | | $ | 1.00 | | | $ | 1.00 | | | $ | 1.00 | |
| | | |
| | | | | | | | | | | | | | | | | | | | | |
| |
Total Return3 | | | 2.78 | % | | | 4.98 | % | | | 4.71 | % | | | 2.86 | % | | | 0.98 | % |
| | | | | | | | | | | | | | | | | | | | | |
| |
Ratios/Supplemental Data | | | | | | | | | | | | | | | | | | | | |
| Net assets, end of period (in thousands) | | $ | 243,356 | | | $ | 189,749 | | | $ | 171,521 | | | $ | 173,162 | | | $ | 196,503 | |
| |
| Average net assets (in thousands) | | $ | 212,564 | | | $ | 181,271 | | | $ | 171,118 | | | $ | 186,453 | | | $ | 218,243 | |
| |
Ratios to average net assets:4 | | | | | | | | | | | | | | | | | | | | |
| Net investment income | | | 2.72 | % | | | 4.86 | % | | | 4.61 | % | | | 2.80 | % | | | 0.97 | % |
| Total expenses | | | 0.50 | % | | | 0.50 | %5 | | | 0.49 | % | | | 0.48 | %5 | | | 0.48 | %5 |
| | |
| 1. | | Per share amounts calculated based on the average shares outstanding during the period. |
| |
| 2. | | Less than $0.005 per share. |
| |
| 3. | | Assumes an investment on the business day before the first day of the fiscal period, with all dividends and distributions reinvested in additional shares on the reinvestment date, and redemption at the net asset value calculated on the last business day of the fiscal period. Total returns are not annualized for periods less than one full year. Total return information does not reflect expenses that apply at the separate account level or to related insurance products. Inclusion of these charges would reduce the total return figures for all periods shown. Returns do not reflect the deduction of taxes that a shareholder would pay on fund distributions or the redemption of fund shares. |
| |
| 4. | | Annualized for periods less than one full year. |
| |
| 5. | | Reduction to custodian expenses less than 0.005%.
|
See accompanying Notes to Financial Statements.
F7 | OPPENHEIMER MONEY FUND/VA
NOTES TO FINANCIAL STATEMENTS
1. Significant Accounting Policies
Oppenheimer Money Fund/VA (the “Fund”) is a separate series of Oppenheimer Variable Account Funds, an open-end management investment company registered under the Investment Company Act of 1940, as amended. The Fund’s investment objective is to seek maximum current income from investments in “money market” securities consistent with low capital risk and the maintenance of liquidity. The Fund’s investment adviser is OppenheimerFunds, Inc. (the “Manager”).
The following is a summary of significant accounting policies consistently followed by the Fund.
Securities Valuation. Securities are valued at cost adjusted by the amortization of discount or premium to maturity (amortized cost), which approximates market value. If amortized cost is determined not to approximate market value, the fair value of the portfolio securities will be determined under procedures approved by the Fund’s Board of Trustees.
Effective for fiscal periods beginning after November 15, 2007, FASB Statement of Financial Accounting Standards No. 157, Fair Value Measurements, establishes a hierarchy for measuring fair value of assets and liabilities. As required by the standard, each investment asset or liability of the Fund is assigned a level at measurement date based on the significance and source of the inputs to its valuation. Quoted prices in active markets for identical securities are classified as “Level 1”, inputs other than quoted prices for an asset that are observable are classified as “Level 2” and unobservable inputs, including the Manager’s judgment about the assumptions that a market participant would use in pricing an asset or liability are classified as “Level 3”. The inputs used for valuing securities are not necessarily an indication of the risks associated with investing in those securities. A table summarizing the Fund’s investments under these levels of classification is included following the Statement of Investments.
“Money market-type” instruments are typically designated as Level 2.
In the absence of a readily available quoted market price, including for securities whose values have been materially affected by what the Manager identifies as a significant event occurring before the Fund’s assets are valued but after the close of the securities’ respective exchanges, the Manager, acting through its internal valuation committee, in good faith determines the fair valuation of that asset using consistently applied procedures under the supervision of the Board of Trustees (which reviews those fair valuations by the Manager). Those procedures include certain standardized methodologies to fair value securities. Such methodologies include, but are not limited to, pricing securities initially at cost and subsequently adjusting the value based on: changes in company specific fundamentals, changes in an appropriate securities index, or changes in the value of similar securities which may be adjusted for any discounts related to resale restrictions. When possible, such methodologies use observable market inputs such as quoted prices of similar securities, observable interest rates, currency rates and yield curves. The methodologies used for valuing securities are not necessarily an indication of the risks associated with investing in those securities.
Fair valued securities may be classified as “Level 3” if the valuation primarily reflects the Manager’s own assumptions about the inputs that market participants would use in valuing such securities.
There have been no significant changes to the fair valuation methodologies during the period.
Federal Taxes. The Fund intends to comply with provisions of the Internal Revenue Code applicable to regulated investment companies and to distribute substantially all of its investment company taxable income to shareholders. Therefore, no federal income or excise tax provision is required. The Fund files income tax returns in U.S. federal and applicable state jurisdictions. The statute of limitations on the Fund’s tax return filings generally remain open for the three preceding fiscal reporting period ends.
F8 | OPPENHEIMER MONEY FUND/VA
The tax components of capital shown in the following table represent distribution requirements the Fund must satisfy under the income tax regulations, losses the Fund may be able to offset against income and gains realized in future years for federal income tax purposes.
| | | | | | | | | |
| Undistributed Net | | Undistributed | | | Accumulated Loss | |
| Investment Income | | Long-Term Gains | | | Carryforward1,2 | |
| |
| $152,499 | | | $— | | | | $— | |
| | |
| 1. | | During the fiscal year ended December 31, 2008, the Fund utilized $2 of capital loss carryforward to offset capital gains realized in that fiscal year. |
| |
| 2. | | During the fiscal year ended December 31, 2007, the Fund did not utilize any capital loss carryforwards. |
Net investment income (loss) and net realized gain (loss) may differ for financial statement and tax purposes. The character of dividends and distributions made during the fiscal year from net investment income or net realized gains may differ from their ultimate characterization for federal income tax purposes. Also, due to timing of dividends and distributions, the fiscal year in which amounts are distributed may differ from the fiscal year in which the income or net realized gain was recorded by the Fund.
The tax character of distributions paid during the years ended December 31, 2008 and December 31, 2007 was as follows:
| | | | | | | | | |
| | | Year Ended | | | Year Ended | |
| | | December 31, 2008 | | | December 31, 2007 | |
| |
| Distributions paid from: | | | | | | | | |
| Ordinary income | | | $5,787,153 | | | | $8,817,594 | |
Trustees’ Compensation. The Board of Trustees has adopted a compensation deferral plan for independent trustees that enables trustees to elect to defer receipt of all or a portion of the annual compensation they are entitled to receive from the Fund. For purposes of determining the amount owed to the Trustee under the plan, deferred amounts are treated as though equal dollar amounts had been invested in shares of the Fund or in other Oppenheimer funds selected by the Trustee. The Fund purchases shares of the funds selected for deferral by the Trustee in amounts equal to his or her deemed investment, resulting in a Fund asset equal to the deferred compensation liability. Such assets are included as a component of “Other” within the asset section of the Statement of Assets and Liabilities. Deferral of trustees’ fees under the plan will not affect the net assets of the Fund, and will not materially affect the Fund’s assets, liabilities or net investment income per share. Amounts will be deferred until distributed in accordance to the compensation deferral plan.
Dividends and Distributions to Shareholders. Dividends and distributions to shareholders, which are determined in accordance with income tax regulations and may differ from U.S. generally accepted accounting principles, are recorded on the ex-dividend date. Income distributions, if any, are declared daily and paid monthly. Capital gain distributions, if any, are declared and paid annually but may be paid at other times to maintain the net asset value per share at $1.00.
Investment Income. Interest income is recognized on an accrual basis. Discount and premium, which are included in interest income on the Statement of Operations, are amortized or accreted daily.
Custodian Fees. “Custodian fees and expenses” in the Statement of Operations may include interest expense incurred by the Fund on any cash overdrafts of its custodian account during the period. Such cash overdrafts may result from the effects of failed trades in portfolio securities and from cash outflows resulting from unanticipated shareholder redemption activity. The Fund pays interest to its custodian on such cash overdrafts, to the extent they are not offset by positive cash balances maintained by the Fund, at a rate equal to the Federal Funds Rate plus 0.50%. The “Reduction to custodian expenses” line item, if applicable, represents earnings on cash balances maintained by the Fund during the period. Such interest expense and other custodian fees may be paid with these earnings.
F9 | OPPENHEIMER MONEY FUND/VA
NOTES TO FINANCIAL STATEMENTS Continued
1. Significant Accounting Policies Continued
Security Transactions. Security transactions are recorded on the trade date. Realized gains and losses on securities sold are determined on the basis of identified cost.
Indemnifications. The Fund’s organizational documents provide current and former trustees and officers with a limited indemnification against liabilities arising in connection with the performance of their duties to the Fund. In the normal course of business, the Fund may also enter into contracts that provide general indemnifications. The Fund’s maximum exposure under these arrangements is unknown as this would be dependent on future claims that may be made against the Fund. The risk of material loss from such claims is considered remote.
Other. The preparation of financial statements in conformity with accounting principles generally accepted in the United States of America requires management to make estimates and assumptions that affect the reported amounts of assets and liabilities and disclosure of contingent assets and liabilities at the date of the financial statements and the reported amounts of increases and decreases in net assets from operations during the reporting period. Actual results could differ from those estimates.
2. Shares of Beneficial Interest
The Fund has authorized an unlimited number of $0.001 par value shares of beneficial interest. Transactions in shares of beneficial interest were as follows:
| | | | | | | | | | | | | | | | | |
| | | Year Ended December 31, 2008 | | | Year Ended December 31, 2007 | |
| | | Shares | | | Amount | | | Shares | | | Amount | |
| |
| Sold | | | 163,835,502 | | | $ | 163,835,502 | | | | 142,287,227 | | | $ | 142,287,227 | |
| Dividends and/or distributions reinvested | | | 5,787,153 | | | | 5,787,153 | | | | 8,817,594 | | | | 8,817,594 | |
| Redeemed | | | (116,015,165 | ) | | | (116,015,165 | ) | | | (132,873,295 | ) | | | (132,873,295 | ) |
| | | |
| Net increase | | | 53,607,490 | | | $ | 53,607,490 | | | | 18,231,526 | | | $ | 18,231,526 | |
| | | |
3. Fees and Other Transactions with Affiliates
Management Fees. Under the investment advisory agreement, the Fund pays the Manager a management fee based on the daily net assets of the Fund at an annual rate as shown in the following table:
| | | | | |
| Fee Schedule | | | | |
| |
| Up to $500 million | | | 0.450 | % |
| Next $500 million | | | 0.425 | |
| Next $500 million | | | 0.400 | |
| Over $1.5 billion | | | 0.375 | |
Transfer Agent Fees. OppenheimerFunds Services (“OFS”), a division of the Manager, acts as the transfer and shareholder servicing agent for the Fund. The Fund pays OFS a per account fee. For the year ended December 31, 2008, the Fund paid $10,017 to OFS for services to the Fund.
Additionally, funds offered in variable annuity separate accounts are subject to minimum fees of $10,000 for assets of $10 million or more. The Fund is subject to the minimum fee in the event that the per account fee does not equal or exceed the applicable minimum fee.
Waivers and Reimbursements of Expenses. The Manager has voluntarily undertaken to waive fees to the extent necessary to assist the Fund in attempting to maintain a positive yield. There is no guarantee that the Fund will maintain a positive yield. That undertaking may be amended or withdrawn at any time.
OFS has voluntarily agreed to limit transfer and shareholder servicing agent fees to 0.35% of average annual net assets of the Fund. This undertaking may be amended or withdrawn at any time.
F10 | OPPENHEIMER MONEY FUND/VA
4. Illiquid Securities
As of December 31, 2008, investments in securities included issues that are illiquid. Investments may be illiquid because they do not have an active trading market, making it difficult to value them or dispose of them promptly at an acceptable price. The Fund will not invest more than 10% of its net assets (determined at the time of purchase and reviewed periodically) in illiquid securities. Securities that are illiquid are marked with an applicable footnote on the Statement of Investments.
5. Recent Accounting Pronouncement
In March 2008, the Financial Accounting Standards Board (“FASB”) issued Statement on Financial Accounting Standards (“SFAS”) No. 161, Disclosures about Derivative Instruments and Hedging Activities. This standard requires enhanced disclosures about derivative and hedging activities, including qualitative disclosures about how and why the Fund uses derivative instruments, how these activities are accounted for, and their effect on the Fund’s financial position, financial performance and cash flows. SFAS No. 161 is effective for financial statements issued for fiscal years and interim periods beginning after November 15, 2008. At this time, management is evaluating the implications of SFAS No. 161 and its impact on the Fund’s financial statements and related disclosures.
6. Temporary Guarantee Program for Money Market Funds
The Fund’s Board of Trustees has elected for the Fund to participate in the Temporary Guarantee Program for Money Market Funds (the “Program”) established by the U.S. Treasury Department. The Treasury Department has accepted the Fund’s application to participate in the Program and entered into a Guarantee Agreement with the Fund dated as of September 19, 2008. The Fund has also notified the Treasury Department of its intent to continue its participation in the Program through April 30, 2009.
Under the Program, shareholders of the Fund as of the close of business on September 19, 2008 may be guaranteed against loss in the event that the Fund’s net asset value falls below $0.995. The Program applies only to shareholders of record as of the close of business on September 19, 2008. The number of shares covered by the Program will be the lesser of (a) the number of shares of the Fund owned by the shareholder on September 19, 2008 or (b) the number of shares owned by the shareholder on the date the Fund’s net asset value falls below $0.995. If the number of shares of the Fund a shareholder holds after September 19, 2008 fluctuates during the Program period due to purchases or redemptions of shares, any shares in excess of the amount held as of the close of business on September 19, 2008 will not be covered.
The Fund has paid a fee to participate in the Program’s initial term in the amount equal to 0.01% of the Fund’s net assets as of the close of business on September 19, 2008. The Fund has paid an additional fee to continue its participation in the Program through April 30, 2009 in the amount of 0.015% of the Fund’s net assets as of the close of business on September 19, 2008. Fees paid by the Fund to participate in the Program are shown as insurance expense on the Statement of Operations. Participation in any further extension of the Program would require payment of an additional fee.
7. Change In Independent Registered Public Accounting Firm (Unaudited)
At a meeting held on August 20, 2008, the Board of Trustees of the Fund appointed KPMG LLP as the independent registered public accounting firm to the Fund for fiscal year 2009, replacing the firm of Deloitte & Touche LLP, effective at the conclusion of the fiscal 2008 audit. During the two most recent fiscal years the audit reports of Deloitte & Touche LLP contained no adverse opinion or disclaimer of opinion and were not qualified or modified as to uncertainty, audit scope or accounting principles. Further, there were no disagreements between the Fund and Deloitte & Touche LLP on accounting principles, financial statement disclosure or audit scope, which if not resolved to the satisfaction of Deloitte & Touche LLP would have caused it to make reference to the disagreements in connection with its reports.
F11 | OPPENHEIMER MONEY FUND/VA
REPORT OF INDEPENDENT REGISTERED PUBLIC ACCOUNTING FIRM
To the Board of Trustees and Shareholders of Oppenheimer Money Fund/VA:
We have audited the accompanying statement of assets and liabilities of Oppenheimer Money Fund/VA (the “Fund”), a series of Oppenheimer Variable Account Funds, including the statement of investments, as of December 31, 2008, and the related statement of operations for the year then ended, the statements of changes in net assets for each of the two years in the period then ended, and the financial highlights for each of the five years in the period then ended. These financial statements and financial highlights are the responsibility of the Fund’s management. Our responsibility is to express an opinion on these financial statements and financial highlights based on our audits.
We conducted our audits in accordance with the standards of the Public Company Accounting Oversight Board (United States). Those standards require that we plan and perform the audit to obtain reasonable assurance about whether the financial statements and financial highlights are free of material misstatement. The Fund is not required to have, nor were we engaged to perform, an audit of its internal control over financial reporting. Our audits included consideration of internal control over financial reporting as a basis for designing audit procedures that are appropriate in the circumstances, but not for the purpose of expressing an opinion on the effectiveness of the Fund’s internal control over financial reporting. Accordingly, we express no such opinion. An audit also includes examining, on a test basis, evidence supporting the amounts and disclosures in the financial statements, assessing the accounting principles used and significant estimates made by management, as well as evaluating the overall financial statement presentation. Our procedures included confirmation of securities owned as of December 31, 2008, by correspondence with the custodian and brokers. We believe that our audits provide a reasonable basis for our opinion.
In our opinion, the financial statements and financial highlights referred to above present fairly, in all material respects, the financial position of the Fund as of December 31, 2008, the results of its operations for the year then ended, the changes in its net assets for each of the two years in the period then ended, and the financial highlights for each of the five years in the period then ended, in conformity with accounting principles generally accepted in the United States of America.
Deloitte & Touche LLP
Denver, Colorado
February 11, 2009
F12 | OPPENHEIMER MONEY FUND/VA
FEDERAL INCOME TAX INFORMATION Unaudited
In early 2009, if applicable, shareholders of record received information regarding all dividends and distributions paid to them by the Fund during calendar year 2008. Regulations of the U.S. Treasury Department require the Fund to report this information to the Internal Revenue Service.
The foregoing information is presented to assist shareholders in reporting distributions received from the Fund to the Internal Revenue Service. Because of the complexity of the federal regulations which may affect your individual tax return and the many variations in state and local tax regulations, we recommend that you consult your tax advisor for specific guidance.
7 | OPPENHEIMER MONEY FUND/VA
BOARD APPROVAL OF THE FUND’S INVESTMENT ADVISORY AGREEMENT Unaudited
Each year, the Board of Trustees (the “Board”), including a majority of the independent Trustees, is required to determine whether to renew the Fund’s investment advisory agreement (the “Agreement”). The Investment Company Act of 1940, as amended, requires that the Board request and evaluate, and that the Manager provide, such information as may be reasonably necessary to evaluate the terms of the Agreement. The Board employs an independent consultant to prepare a report that provides information, including comparative information, the Board requests for that purpose. In addition, the Board receives information throughout the year regarding Fund services, fees, expenses and performance.
The Manager and the independent consultant provided information to the Board on the following factors: (i) the nature, quality and extent of the Manager’s services, (ii) the investment performance of the Fund and the Manager, (iii) the fees and expenses of the Fund, including comparative expense information, (iv) the profitability of the Manager and its affiliates, including an analysis of the cost of providing services, (v) whether economies of scale are realized as the Fund grows and whether fee levels reflect these economies of scale for Fund investors and (vi) other benefits to the Manager from its relationship with the Fund. The Board was aware that there are alternatives to retaining the Manager.
Outlined below is a summary of the principal information considered by the Board as well as the Board’s conclusions.
Nature, Quality and Extent of Services. The Board considered information about the nature, quality and extent of the services provided to the Fund and information regarding the Manager’s key personnel who provide such services. The Manager’s duties include providing the Fund with the services of the portfolio manager and the Manager’s investment team, who provide research, analysis and other advisory services in regard to the Fund’s investments; securities trading services; oversight of third party service providers; monitoring compliance with applicable Fund policies and procedures and adherence to the Fund’s investment restrictions. The Manager is responsible for providing certain administrative services to the Fund as well. Those services include providing and supervising all administrative and clerical personnel who are necessary in order to provide effective corporate administration for the Fund; compiling and maintaining records with respect to the Fund’s operations; preparing and filing reports required by the Securities and Exchange Commission; preparing periodic reports regarding the operations of the Fund for its shareholders; preparing proxy materials for shareholder meetings; and preparing the registration statements required by Federal and state securities laws for the sale of the Fund’s shares. The Manager also provides the Fund with office space, facilities and equipment.
The Board also considered the quality of the services provided and the quality of the Manager’s resources that are available to the Fund. The Board took account of the fact that the Manager has had over forty years of experience as an investment adviser and that its assets under management rank it among the top mutual fund managers in the United States. The Board evaluated the Manager’s advisory, administrative, accounting, legal and compliance services, and information the Board has received regarding the experience and professional qualifications of the Manager’s key personnel and the size and functions of its staff. In its evaluation of the quality of the portfolio management services provided, the Board considered the experience of Carol Wolf, the portfolio manager for the Fund, and the Manager’s investment team and analysts. The Board members also considered the totality of their experiences with the Manager as Directors or Trustees of the Fund and other funds advised by the Manager. The Board considered information regarding the quality of services provided by affiliates of the Manager, which its members have become knowledgeable about in connection with the renewal of the Fund’s service agreements. The Board concluded that, in light of the Manager’s experience, reputation, personnel, operations and resources, the Fund benefits from the services provided under the Agreement.
8 | OPPENHEIMER MONEY FUND/VA
Investment Performance of the Manager and the Fund. Throughout the year, the Manager provided information on the investment performance of the Fund and the Manager, including comparative performance information. The Board also reviewed information, prepared by the Manager and by the independent consultant, comparing the Fund’s historical performance to relevant market indices and to the performance of other money market funds underlying variable insurance products. The Board considered that the Fund outperformed its performance universe median during the one-, three-, five-, and ten-year periods.
Costs of Services by the Manager. The Board reviewed the fees paid to the Manager and the other expenses borne by the Fund. The Board also considered the comparability of the fees charged and the services provided to the Fund to the fees and services for other clients or accounts advised by the Manager. The independent consultant provided comparative data in regard to the fees and expenses of the Fund and money market funds underlying variable insurance products with comparable asset levels and distribution features. The Board considered that the Fund’s actual management fees and total expenses were competitive vis-à-vis its expense group median. In reviewing the fees and expenses charged to the VA Funds, the Board considered the Manager’s assertion that, because of the disparity among VA funds in how insurance companies may be compensated for the services they provide to shareholders, when comparing the expenses of the various VA funds it is most appropriate to focus on the total expenses rather than on the management fees. Accordingly, while the Board reviewed and considered all expenses in its consideration of the Advisory Agreement, it paid particular attention to total expenses.
Economies of Scale and Profits Realized by the Manager. The Board considered information regarding the Manager’s costs in serving as the Fund’s investment adviser, including the costs associated with the personnel and systems necessary to manage the Fund, and information regarding the Manager’s profitability from its relationship with the Fund. The Board reviewed whether the Manager may realize economies of scale in managing and supporting the Fund. The Board noted that the Fund currently has management fee breakpoints, which are intended to share with Fund shareholders economies of scale that may exist as the Fund’s assets grow.
Other Benefits to the Manager. In addition to considering the profits realized by the Manager, the Board considered information that was provided regarding the direct and indirect benefits the Manager receives as a result of its relationship with the Fund, including compensation paid to the Manager’s affiliates. The Board also considered that the Manager must be able to pay and retain experienced professional personnel at competitive rates to provide quality services to the Fund and that maintaining the financial viability of the Manager is important in order for the Manager to continue to provide significant services to the Fund and its shareholders.
Conclusions. These factors were also considered by the independent Trustees meeting separately from the full Board, assisted by experienced counsel to the Fund and to the independent Trustees. Fund counsel and the independent Trustees’ counsel are independent of the Manager within the meaning and intent of the Securities and Exchange Commission Rules.
Based on its review of the information it received and its evaluations described above, the Board, including a majority of the independent Trustees, decided to continue the Agreement for another year. In arriving at this decision, the Board did not single out any factor or factors as being more important than others, but considered all of the above information, and considered the terms and conditions of the Agreement, including the management fee, in light of all of the surrounding circumstances.
9 | OPPENHEIMER MONEY FUND/VA
PORTFOLIO PROXY VOTING POLICIES AND PROCEDURES; UPDATES TO STATEMENTS OF INVESTMENTS Unaudited
The Fund has adopted Portfolio Proxy Voting Policies and Procedures under which the Fund votes proxies relating to securities (“portfolio proxies”) held by the Fund. A description of the Fund’s Portfolio Proxy Voting Policies and Procedures is available (i) without charge, upon request, by calling the Fund toll-free at 1.800.525.7048, (ii) on the Fund’s website at www.oppenheimerfunds.com, and (iii) on the SEC’s website at www.sec.gov. In addition, the Fund is required to file Form N-PX, with its complete proxy voting record for the 12 months ended June 30th, no later than August 31st of each year. The Fund’s voting record is available (i) without charge, upon request, by calling the Fund toll-free at 1.800.525.7048, and (ii) in the Form N-PX filing on the SEC’s website at www.sec.gov.
The Fund files its complete schedule of portfolio holdings with the SEC for the first quarter and the third quarter of each fiscal year on Form N-Q. The Fund’s Form N-Q filings are available on the SEC’s website at www.sec.gov. Those forms may be reviewed and copied at the SEC’s Public Reference Room in Washington, D.C. Information on the operation of the Public Reference Room may be obtained by calling 1-800-SEC-0330.
10 | OPPENHEIMER MONEY FUND/VA
TRUSTEES AND OFFICERS Unaudited
| | | |
Name, Position(s) Held with
the Funds, Length of
Service, Age | | Principal Occupation(s) During the Past 5 Years; Other Trusteeships/Directorships Held; Number of Portfolios in the Funds Complex Currently Overseen |
INDEPENDENT
TRUSTEES | | The address of each Trustee in the chart below is 6803 S. Tucson Way, Centennial, Colorado 80112-3924. Each Trustee serves for an indefinite term, or until his or her resignation, retirement, death or removal. |
| | | |
William L. Armstrong,
Chairman of the Board of Trustees (since 2003),
Trustee (since 1999)
Age: 71 | | President, Colorado Christian University (since 2006); Chairman, Cherry Creek Mortgage Company (since 1991), Chairman, Centennial State Mortgage Company (since 1994), Chairman, The El Paso Mortgage Company (since 1993); Chairman, Ambassador Media Corporation (since 1984); Chairman, Broadway Ventures (since 1984); Director of Helmerich & Payne, Inc. (oil and gas drilling/production company) (since 1992), Campus Crusade for Christ (non-profit) (since 1991); Former Director, The Lynde and Harry Bradley Foundation, Inc. (non-profit organization) (2002-2006); former Chairman of: Transland Financial Services, Inc. (private mortgage banking company) (1997-2003), Great Frontier Insurance (1995-2000), Frontier Real Estate, Inc. (residential real estate bro- kerage) (1994-2000) and Frontier Title (title insurance agency) (1995-2000); former Director of the following: UNUMProvident (insurance company) (1991-2004), Storage Technology Corporation (computer equipment company) (1991-2003) and International Family Entertainment (television channel) (1992-1997); U.S. Senator (January 1979-January 1991). Oversees 41 portfolios in the OppenheimerFunds complex. |
| | | |
George C. Bowen,
Trustee (since 1999)
Age: 72 | | Assistant Secretary and Director of Centennial Asset Management Corporation (December 1991-April 1999); President, Treasurer and Director of Centennial Capital Corporation (June 1989-April 1999); Chief Executive Officer and Director of MultiSource Services, Inc. (March 1996-April 1999); Mr. Bowen held several positions with the Manager and with subsidiary or affiliated companies of the Manager (September 1987-April 1999). Oversees 41 portfolios in the OppenheimerFunds complex. |
| | | |
Edward L. Cameron,
Trustee (since 1999)
Age: 70 | | Member of The Life Guard of Mount Vernon (George Washington historical site) (June 2000-June 2006); Partner of PricewaterhouseCoopers LLP (accounting firm) (July 1974-June 1999); Chairman of Price Waterhouse LLP Global Investment Management Industry Services Group (accounting firm) (July 1994-June 1998). Oversees 41 portfolios in the OppenheimerFunds complex. |
| | | |
Jon S. Fossel,
Trustee (since 1990)
Age: 66 | | Director of UNUMProvident (insurance company) (since June 2002); Director of Northwestern Energy Corp. (public utility corporation) (since November 2004); Director of P.R. Pharmaceuticals (October 1999-October 2003); Director of Rocky Mountain Elk Foundation (non-profit organization) (February 1998-February 2003 and February 2005-February 2007); Chairman and Director (until October 1996) and President and Chief Executive Officer (until October 1995) of the Manager; President, Chief Executive Officer and Director of the following: Oppenheimer Acquisition Corp. (“OAC”) (parent holding company of the Manager), Shareholders Services, Inc. and Shareholder Financial Services, Inc. (until October 1995). Oversees 41 portfolios in the OppenheimerFunds complex. |
| | | |
Sam Freedman,
Trustee (since 1996)
Age: 68 | | Director of Colorado UpLIFT (charitable organization) (since September 1984). Mr. Freedman held several posi- tions with the Manager and with subsidiary or affiliated companies of the Manager (until October 1994). Oversees 41 portfolios in the OppenheimerFunds complex. |
| | | |
Beverly L. Hamilton,
Trustee (since 2002)
Age: 62 | | Trustee of Monterey Institute for International Studies (educational organization) (since February 2000); Board Member of Middlebury College (educational organization) (since December 2005); Director of The California Endowment (philanthropic organization) (since April 2002); Director (February 2002-2005) and Chairman of Trustees (2006-2007) of the Community Hospital of Monterey Peninsula; Director (October 1991-2005) and Vice Chairman (since 2006) of American Funds’ Emerging Markets Growth Fund, Inc. (mutual fund); President of ARCO Investment Management Company (February 1991-April 2000); Member of the investment commit- tees of The Rockefeller Foundation (2001-2006) and The University of Michigan (since 2000); Advisor at Credit Suisse First Boston’s Sprout venture capital unit (venture capital fund) (1994-January 2005); Trustee of MassMutual Institutional Funds (investment company) (1996-June 2004); Trustee of MML Series Investment Fund (investment company) (April 1989-June 2004); Member of the investment committee of Hartford Hospital (2000-2003); and Advisor to Unilever (Holland) pension fund (2000-2003). Oversees 41 portfolios in the OppenheimerFunds complex. |
11 | OPPENHEIMER MONEY FUND/VA
TRUSTEES AND OFFICERS Unaudited / Continued
| | | |
Robert J. Malone,
Trustee (since 2002)
Age: 64 | | Board of Directors of Opera Colorado Foundation (non-profit organization) (since March 2008); Director of Jones Knowledge, Inc. (since 2006); Director of Jones International University (educational organization) (since August 2005); Chairman, Chief Executive Officer and Director of Steele Street Bank & Trust (commercial banking) (since August 2003); Director of Colorado UpLIFT (charitable organization) (since 1986); Trustee of the Gallagher Family Foundation (non-profit organization) (since 2000); Former Chairman of U.S. Bank-Colorado (subsidiary of U.S. Bancorp and formerly Colorado National Bank) (July 1996-April 1999); Director of Commercial Assets, Inc. (real estate investment trust) (1993-2000); Director of Jones Knowledge, Inc. (2001-July 2004); and Director of U.S. Exploration, Inc. (oil and gas exploration) (1997-February 2004). Oversees 41 portfolios in the OppenheimerFunds complex. |
| | | |
F. William Marshall, Jr.,
Trustee (since 2000)
Age: 66 | | Trustee Emeritas of Worcester Polytech Institute (WPI) (private university) (since 2009); Trustee of MassMutual Select Funds (formerly MassMutual Institutional Funds) (investment company) (since 1996) and MML Series Investment Fund (investment company) (since 1996); President and Treasurer of the SIS Funds (private charitable fund) (since January 1999); Former Trustee of WPI (1985-2008); Former Chairman of the Board (2004-2006) and Former Chairman of the Investment Committee of WPI (1994-2008); Chairman of SIS & Family Bank, F.S.B. (formerly SIS Bank) (commercial bank) (January 1999-July 1999); Executive Vice President of Peoples Heritage Financial Group, Inc. (commercial bank) (January 1999-July 1999); and Former President and Chief Executive Officer of SIS Bancorp. (1993-1999). Oversees 43 portfolios in the OppenheimerFunds complex. |
| | | |
INTERESTED TRUSTEE
AND OFFICER | | The address of Mr. Murphy is Two World Financial Center, 225 Liberty Street, 11th Floor, New York, New York 10281-1008. Mr. Murphy serves as a Trustee for an indefinite term, or until his resignation, retirement, death or removal and as an Officer for an indefinite term, or until his resignation, retirement, death or removal. Mr. Murphy is an interested Trustee due to his positions with OppenheimerFunds, Inc. and its affiliates. |
| | | |
John V. Murphy,
Trustee, President and
Principal Executive Officer
(since 2001)
Age: 59 | | Chairman and Director of the Manager (since June 2001); Chief Executive Officer of the Manager (June 2001- December 2008); President of the Manager (September 2000-February 2007); President and director or trustee of other Oppenheimer funds; President and Director of Oppenheimer Acquisition Corp. (“OAC”) (the Manager’s parent holding company) and of Oppenheimer Partnership Holdings, Inc. (holding company subsidiary of the Manager) (since July 2001); Director of OppenheimerFunds Distributor, Inc. (subsidiary of the Manager) (November 2001-December 2006); Chairman and Director of Shareholder Services, Inc. and of Shareholder Financial Services, Inc. (transfer agent subsidiaries of the Manager) (since July 2001); President and Director of OppenheimerFunds Legacy Program (charitable trust program established by the Manager) (since July 2001); Director of the following investment advisory subsidiaries of the Manager: OFI Institutional Asset Management, Inc., Centennial Asset Management Corporation, Trinity Investment Management Corporation and Tremont Capital Management, Inc. (since November 2001), HarbourView Asset Management Corporation and OFI Private Investments, Inc. (since July 2001); President (since November 2001) and Director (since July 2001) of Oppenheimer Real Asset Management, Inc.; Executive Vice President of Massachusetts Mutual Life Insurance Company (OAC’s parent company) (since February 1997); Director of DLB Acquisition Corporation (holding company parent of Babson Capital Management LLC) (since June 1995); Chairman (since October 2007) and Member of the Investment Company Institute’s Board of Governors (since October 2003). Oversees 105 portfolios in the OppenheimerFunds complex. |
| | | |
OTHER OFFICERS
OF THE FUND | | The addresses of the Officers in the chart below are as follows: for Mr. Zack, Two World Financial Center, 225 Liberty Street, New York, New York 10281-1008, for Messrs. Vandehey, Wixted and Ms. Wolf, 6803 S. Tucson Way, Centennial, Colorado 80112-3924. Each Officer serves for an indefinite term or until his or her resignation, retire- ment, death or removal. |
| | | |
Carol E. Wolf,
Vice President and Portfolio
Manager (since 1998)
Age: 57 | | Senior Vice President of the Manager (since June 2000) and of HarbourView Asset Management Corporation (since June 2003); formerly Vice President of the Manager (June 1990-June 2000). An officer of 6 portfolios in the OppenheimerFunds complex. |
| | | |
Mark S. Vandehey,
Vice President and Chief
Compliance Officer
(since 2004)
Age: 58 | | Senior Vice President and Chief Compliance Officer of the Manager (since March 2004); Chief Compliance Officer of OppenheimerFunds Distributor, Inc., Centennial Asset Management and Shareholder Services, Inc. (since March 2004); Vice President of OppenheimerFunds Distributor, Inc., Centennial Asset Management Corporation and Shareholder Services, Inc. (since June 1983); Former Vice President and Director of Internal Audit of the Manager (1997-February 2004). An officer of 105 portfolios in the OppenheimerFunds complex. |
12 | OPPENHEIMER MONEY FUND/VA
| | | |
Brian W. Wixted,
Treasurer and Principal
| | Senior Vice President and Treasurer of the Manager (since March 1999); Treasurer of the
following: |
Financial & Accounting
Officer (since 1999)
Age: 49 | | HarbourView Asset Management Corporation, Shareholder Financial Services, Inc., Shareholder Services, Inc., Oppenheimer Real Asset Management, Inc. and Oppenheimer Partnership Holdings, Inc. (since March 1999), OFI Private Investments, Inc. (since March 2000), OppenheimerFunds International Ltd. and OppenheimerFunds plc (since May 2000), OFI Institutional Asset Management, Inc. (since November 2000), and OppenheimerFunds Legacy Program (charitable trust program established by the Manager) (since June 2003); Treasurer and Chief Financial Officer of OFI Trust Company (trust company subsidiary of the Manager) (since May 2000); Assistant Treasurer of the following: OAC (since March 1999), Centennial Asset Management Corporation (March 1999- October 2003) and OppenheimerFunds Legacy Program (April 2000-June 2003). An officer of 105 portfolios in the OppenheimerFunds complex. |
| | | |
Robert G. Zack,
Vice President and Secretary
(since 2001)
Age: 60 | | Executive Vice President (since January 2004) and General Counsel (since March 2002) of the Manager; General Counsel and Director of the Distributor (since December 2001); General Counsel of Centennial Asset Management Corporation (since December 2001); Senior Vice President and General Counsel of HarbourView Asset Management Corporation (since December 2001); Secretary and General Counsel of OAC (since November 2001); Assistant Secretary (since September 1997) and Director (since November 2001) of OppenheimerFunds International Ltd. and OppenheimerFunds plc; Vice President and Director of Oppenheimer Partnership Holdings, Inc. (since December 2002); Director of Oppenheimer Real Asset Management, Inc. (since November 2001); Senior Vice President, General Counsel and Director of Shareholder Financial Services, Inc. and Shareholder Services, Inc. (since December 2001); Senior Vice President, General Counsel and Director of OFI Private Investments, Inc. and OFI Trust Company (since November 2001); Vice President of OppenheimerFunds Legacy Program (since June 2003); Senior Vice President and General Counsel of OFI Institutional Asset Management, Inc. (since November 2001); Director of OppenheimerFunds International Distributor Limited (since December 2003); Senior Vice President (May 1985-December 2003). An officer of 105 portfolios in the OppenheimerFunds complex. |
The Fund’s Statement of Additional Information contains additional information about the Fund’s Trustees and Officers and is available without charge, upon request, by calling 1.800.981.2871.
13 | OPPENHEIMER MONEY FUND/VA
FUND PERFORMANCE DISCUSSION
Management’s Discussion of Fund Performance. For the 12-month period ended December 31, 2008, Oppenheimer Strategic Bond Fund/VA’s Non-Service shares provided a total return of –14.21%. In comparison, the Fund’s benchmarks, the Citigroup World Government Bond Index and the Barclays Capital Aggregate Bond Index provided total returns of 10.89% and 5.24%, respectively.
An intensifying global credit crisis and economic downturn roiled the financial markets in 2008, hurting the higher-yielding segments of U.S. and international fixed-income markets. The Fund’s results lagged its benchmarks primarily due to its relatively heavy allocation to emerging-market investments and its security selection strategy among high-yield corporate bonds.
Economic and Market Overview
Like most asset classes, foreign bonds and currencies and U.S. high yield corporate securities declined substantially when a U.S. credit crunch developed into a full-blown global financial crisis over the summer of 2008, stemming from the turmoil that had originated in 2007 in the U.S. sub-prime mortgage sector. Investors grew increasingly risk-averse in the face of uncertainty regarding the impact the sub-prime mortgage debacle would have on complex financial instruments held by highly leveraged banks and institutional investors throughout the world. As the value of these instruments fell, major financial institutions were compelled to write down or write off a significant portion of their value, creating losses that led to the failure of several major commercial banks, investment banks, mortgage agencies and insurers.
After Lehman Brothers declared bankruptcy in September 2008, banks and other lenders grew vastly more reluctant to extend credit, even to other banks, nearly leading to the collapse of the global banking system. Governments and central banks responded to the crisis with massive injections of liquidity into the banking system, lower short-term interest rates and rescue packages for troubled industries. Even normally staid money market funds were adversely affected, prompting the U.S. Treasury Department to offer a guarantee on the share price of eligible funds. While these measures helped stabilize the credit markets, weakness persisted through the end of the year.
Meanwhile, a U.S. economic slowdown that began in late 2007 was exacerbated by the financial crisis, leading to a surge in job losses and additional pressure on slumping home prices. Cash-strapped consumers and anxious businesses curtailed spending, adding fuel to the downturn. The U.S. recession quickly spread to overseas markets, especially those that depend on exports to the United States and Europe, reducing previously robust demand for energy and building materials. Consequently, commodity prices that had reached record highs over the first half of the year plummeted over the second half.
These dramatic developments sparked a “flight to quality” among investors, who sold riskier assets in favor of the sovereign debt of developed nations, particularly U.S. Treasury securities. Selling pressure appeared to be indiscriminate as investors rushed for the exits, punishing fundamentally sound investments along with less creditworthy ones. As selling pressure intensified, hedge funds and other highly leveraged institutional investors were forced to sell their more liquid holdings to raise cash for margin calls and redemption requests, further depressing prices of financial assets irrespective of their credit profiles. The flight to quality was particularly damaging for securities issued by developing nations, which historically have been volatile. Currencies of emerging markets also suffered as investors flocked toward the traditional safe haven of the U.S. dollar, which reversed course in 2008 and gained value relative to most other currencies.
Portfolio Strategy
The Fund proved to be vulnerable to the credit and economic crises due to its longstanding emphasis on bonds and investments linked to the currencies of emerging markets, such as Brazil, Mexico, Turkey and Russia. In fact, because we believed that real interest rates in these markets were attractive relative to other nations and their central banks had room to reduce short-term rates, we increased the Fund’s exposure to the emerging markets in the spring of 2008. However, the timing of this move proved to be unfortunate when the financial crisis intensified over the summer. Some of the markets that previously had been most supportive of the Fund’s returns, such as Brazil and Russia, became some of the harder hit areas during the ensuing market turbulence. On the other hand, Mexico’s debt and currency held up relatively well due to its proactive monetary policy, and Turkey benefited from lower oil prices as commodity prices moderated over the second half of the year. In the summer, we attempted to manage risks more
3 | OPPENHEIMER STRATEGIC BOND FUND/ VA
FUND PERFORMANCE DISCUSSION
effectively by shifting some assets from emerging markets to European bonds and investments linked to the Japanese yen, which fared relatively well.
Despite the benefits that derived from underweight exposure to high yield bonds, the Fund’s results in the sector suffered due to our security selection strategy, which emphasized mortgage-backed securities and corporate bonds from issuers in the financials sector. An overweight position in commercial mortgage-backed securities (CMBS) proved especially detrimental when these securities declined sharply in the fall amid economic concerns. The unprecedented and unanticipated widening of credit spreads of mortgage-backed securities over Treasury securities, which accelerated during the month of November, and had a negative impact on the Fund’s positions in total return swaps in the CMBS sector. The Fund’s performance also was hindered by an underweight position in U.S. government securities.
As of year-end, we have maintained the Fund’s underweight exposure to high-yield bonds and a corresponding emphasis on international bonds and investments linked to foreign currencies, especially those from emerging markets, where we believe local interest rates have plenty of room to fall. Indeed, we have found a number of opportunities where, in our analysis, local bonds and currencies have been punished too severely given relatively sound economic fundamentals. Similar value-oriented opportunities appear to be available in the U.S. high-yield bond market, where default rates have remained below historical averages. On the other hand, U.S. Treasury securities seem overvalued to us and offer meager opportunities for income.
While we expect economic weakness and volatility in global credit markets to persist, we have maintained an investment posture that seeks to earn high levels of current income and participate as fully as we deem prudent in an eventual market rebound. In our view, remaining disciplined and keeping an eye on potential opportunities are key to what makes Oppenheimer Strategic Bond/VA part of The Right Way to Invest.
Comparing the Fund’s Performance to the Market. The graphs that follow show the performance of a hypothetical $10,000 investment in each share class of the Fund held until December 31, 2008. In the case of Non-Service shares, performance is measured over a ten fiscal year period. In the case of Service shares, performance is measured from inception of the Class on March 19, 2001. Performance information does not reflect charges that apply to separate accounts investing in the Fund. If these charges were taken into account, performance would be lower. The graphs assumed that all dividends and capital gains distributions were reinvested in additional shares. Past performance cannot guarantee future results.
The Fund’s performance is compared to the performance of the Barclays Capital (formerly the Lehman Brothers) Aggregate Bond Index, an unmanaged index of U.S. corporate and government bonds, and to the Citigroup World Government Bond Index, an unmanaged index of debt securities of major foreign governments. The indices performance includes reinvestment of income but does not reflect transaction costs, fees or expenses. The Fund’s performance reflects the effects of the Fund’s business and operating expenses. While index comparisons may be useful to provide a benchmark for the Fund’s performance, it must be noted that the Fund’s investments are not limited to the investments in the index.
4 | OPPENHEIMER STRATEGIC BOND FUND/ VA
FUND PERFORMANCE DISCUSSION
Non-Service Shares
Comparison of Change in Value of $10,000 Hypothetical Investments in:
Service Shares
Comparison of Change in Value of $10,000 Hypothetical Investments in:
The performance data quoted represents past performance, which does not guarantee future results.
The investment return and principal value of an investment in the Fund will fluctuate so that an investor’s shares, when redeemed, may be worth more or less than their original cost. Current performance may be lower or higher than the performance quoted. For performance data current to the most recent month end, call us at 1.800.981.2871. The Fund’s total returns should not be expected to be the same as the returns of other funds, whether or not both funds have the same portfolio managers and/or similar names. The Fund’s total returns do not include the charges associated with the separate account products that offer this Fund. Such performance would have been lower if such charges were taken into account.
5 | OPPENHEIMER STRATEGIC BOND FUND/ VA
FUND EXPENSES
Fund Expenses. As a shareholder of the Fund, you incur two types of costs: (1) transaction costs, which may include redemption fees (if applicable); and (2) ongoing costs, including management fees; distribution and service fees; and other Fund expenses. These examples are intended to help you understand your ongoing costs (in dollars) of investing in the Fund and to compare these costs with the ongoing costs of investing in other mutual funds.
The examples are based on an investment of $1,000.00 invested at the beginning of the period and held for the entire 6-month period ended December 31, 2008.
Actual Expenses. The first section of the table provides information about actual account values and actual expenses. You may use the information in this section for the class of shares you hold, together with the amount you invested, to estimate the expense that you paid over the period. Simply divide your account value by $1,000.00 (for example, an $8,600.00 account value divided by $1,000.00 = 8.60), then multiply the result by the number in the first section under the heading entitled “Expenses Paid During Period” to estimate the expenses you paid on your account during this period.
Hypothetical Example for Comparison Purposes. The second section of the table provides information about hypothetical account values and hypothetical expenses based on the Fund’s actual expense ratio for each class of shares, and an assumed rate of return of 5% per year for each class before expenses, which is not the actual return. The hypothetical account values and expenses may not be used to estimate the actual ending account balance or expenses you paid for the period. You may use this information to compare the ongoing costs of investing in the Fund and other funds. To do so, compare this 5% hypothetical example for the class of shares you hold with the 5% hypothetical examples that appear in the shareholder reports of the other funds.
Please note that the expenses shown in the table are meant to highlight your ongoing costs only and do not reflect any charges associated with the separate accounts that offer this Fund. Therefore, the “hypothetical” lines of the table are useful in comparing ongoing costs only, and will not help you determine the relative total costs of owning different funds. In addition, if these separate account charges were included your costs would have been higher.
| | | | | | | | | | | | | |
| | | Beginning | | Ending | | Expenses |
| | | Account | | Account | | Paid During |
| | | Value | | Value | | 6 Months Ended |
| | | July 1, 2008 | | December 31, 2008 | | December 31, 2008 |
| |
Actual | | | | | | | | | | | | |
| Non-Service Shares | | $ | 1,000.00 | | | $ | 839.20 | | | $ | 2.69 | |
| Service Shares | | | 1,000.00 | | | | 839.80 | | | | 3.85 | |
| | | | | | | | | | | | | |
Hypothetical
(5% return before expenses) | | | | | | | | | | | | |
| Non-Service Shares | | | 1,000.00 | | | | 1,022.22 | | | | 2.95 | |
| Service Shares | | | 1,000.00 | | | | 1,020.96 | | | | 4.23 | |
Expenses are equal to the Fund’s annualized expense ratio for that class, multiplied by the average account value over the period, multiplied by 184/366 (to reflect the one-half year period). Those annualized expense ratios, excluding indirect expenses from affiliated fund, based on the 6-month period ended December 31, 2008 are as follows:
| | | | | |
| Class | | Expense Ratios |
| |
| Non-Service Shares | | | 0.58 | % |
| Service Shares | | | 0.83 | |
The expense ratios reflect reduction to custodian expenses and voluntary waivers or reimbursements of expenses by the Fund’s Manager that can be terminated at any time, without advance notice. The “Financial Highlights” tables in the Fund’s financial statements, included in this report, also show the gross expense ratios, without such waivers or reimbursements and reduction to custodian expenses, if applicable.
6 | OPPENHEIMER STRATEGIC BOND FUND/ VA
STATEMENT OF INVESTMENTS December 31, 2008
| | | | | | | | | |
| | | Principal | | | | |
| | | Amount | | | Value | |
| |
Asset-Backed Securities—1.4% | | | | | | | | |
Ace Securities Corp. Home Equity Loan Trust, Asset-Backed Pass-Through Certificates, Series 2005-HE7, Cl. A2B, 0.651%, 11/25/351 | | $ | 3,298 | | | $ | 3,267 | |
AmeriCredit Prime Automobile Receivables Trust 2007-1, Automobile Receivables Nts., Series 2007-1, Cl. D, 5.62%, 9/8/142 | | | 1,319,000 | | | | 854,053 | |
Argent Securities Trust 2004-W8, Asset-Backed Pass-Through Certificates, Series 2004-W8, Cl. A2, 0.951%, 5/25/341 | | | 924,857 | | | | 714,313 | |
Argent Securities Trust 2006-M3, Asset-Backed Pass-Through Certificates, Series 2006-M3, Cl. A2B, 0.571%, 9/25/361 | | | 530,000 | | | | 424,829 | |
Argent Securities Trust 2006-W5, Asset-Backed Pass-Through Certificates, Series 2006-W5, Cl. A2B, 0.571%, 5/26/361 | | | 418,823 | | | | 382,802 | |
| Capital Auto Receivables Asset Trust 2007-1, Automobile Asset-Backed Securities, Series 2007-1, Cl. B, 5.15%, 9/17/12 | | | 262,000 | | | | 200,549 | |
| Capital Auto Receivables Asset Trust 2008-2, Automobile Asset-Backed Securities, Series 2008-2, Cl. A2A, 3.74%, 3/15/11 | | | 2,950,000 | | | | 2,889,639 | |
Capital One Auto Finance Trust, Automobile Receivables, Series 2006-C, Cl. A4, 1.225%, 5/15/131 | | | 1,312,000 | | | | 912,432 | |
Capital One Prime Auto Receivables Trust, Automobile Asset-Backed Certificates, Series 2005-1, Cl. A4, 1.215%, 4/15/111 | | | 5,278,299 | | | | 5,124,536 | |
Centex Home Equity Loan Trust 2006-A, Asset-Backed Certificates, Series 2006-A, Cl. AV2, 0.571%, 5/16/361 | | | 460,392 | | | | 441,089 | |
Citigroup Mortgage Loan Trust, Inc. 2006-WFH3, Asset-Backed Pass-Through Certificates, Series 2006-WFH3, Cl. A2, 0.571%, 10/31/361 | | | 603,989 | | | | 554,084 | |
| Countrywide Home Loans, Asset-Backed Certificates: | | | | | | | | |
Series 2005-16, Cl. 2AF2, 5.382%, 5/25/361 | | | 1,530,000 | | | | 1,223,613 | |
Series 2005-17, Cl. 1AF2, 5.363%, 5/25/361 | | | 233,158 | | | | 201,064 | |
CWABS, Inc. Asset-Backed Certificates Trust, Asset-Backed Certificates, Series 2006-25, Cl. 2A2, 0.591%, 12/5/291 | | | 1,050,000 | | | | 807,320 | |
| CWHEQ Revolving Home Equity Loan Trust, Asset-Backed Certificates: | | | | | | | | |
Series 2005-G, Cl. 2A, 1.425%, 12/15/351 | | | 269,812 | | | | 105,890 | |
Series 2006-H, Cl. 2A1A, 1.345%, 11/15/361 | | | 96,537 | | | | 25,010 | |
| DaimlerChrysler Auto Trust, Automobile Loan Pass-Through Certificates, Series 2008-B, Cl. A2A, 3.81%, 6/8/11 | | | 2,950,000 | | | | 2,887,528 | |
Embarcadero Aircraft Securitization Trust, Airplane Receivable Nts., Series 2000-A, Cl. B, 8/15/252,3,4 | | | 1,820,063 | | | | 13,650 | |
First Franklin Mortgage Loan Trust 2005-FF10, Mtg. Pass-Through Certificates, Series 2005-FF10, Cl. A3, 0.681%, 11/25/351 | | | 112,308 | | | | 110,855 | |
First Franklin Mortgage Loan Trust 2006-FF10, Mtg. Pass-Through Certificates, Series 2006-FF10, Cl. A3, 0.561%, 7/25/361 | | | 1,000,000 | | | | 867,049 | |
First Franklin Mortgage Loan Trust 2006-FF9, Mtg. Pass-Through Certificates, Series 2006-FF9, Cl. 2A2, 0.581%, 7/7/361 | | | 430,000 | | | | 366,527 | |
| First Franklin Mortgage Loan | | | | | | | | |
Trust 2006-FFA, Mtg. Pass-Through Certificates, Series 2006-FFA, Cl. A3, 0.591%, 9/25/361 | | | 1,027,653 | | | | 240,410 | |
| Harley-Davidson Motorcycle | | | | | | | | |
Trust, Motorcycle Receivable Nts., Series 2007-3, Cl. A3, 1.545%, 6/15/121 | | | 8,340,000 | | | | 7,983,594 | |
| Home Equity Mortgage Trust 2005-1, Mtg. Pass-Through Certificates, Series 2005-1, Cl. M6, 5.363%, 6/1/35 | | | 1,046,000 | | | | 332,257 | |
| Home Equity Mortgage Trust 2006-5, Mtg. Pass-Through Certificates, Series 2006-5, Cl. A1, 5.50%, 1/25/37 | | | 443,748 | | | | 104,160 | |
F1 | OPPENHEIMER STRATEGIC BOND FUND/ VA
STATEMENT OF INVESTMENTS Continued
| | | | | | | | | |
| | | Principal | | | | |
| | | Amount | | | Value | |
| |
Asset-Backed Securities Continued | | | | | | | | |
HSBC Home Equity Loan Trust 2005-3, Closed-End Home Equity Loan Asset-Backed Nts., Series 2005-3, Cl. A1, 0.768%, 1/20/351 | | $ | 235,534 | | | $ | 167,442 | |
HSBC Home Equity Loan Trust 2006-4, Closed-End Home Equity Loan Asset-Backed Certificates, Series 2006-4, Cl. A2V, 0.618%, 3/20/361 | | | 440,000 | | | | 368,666 | |
| Hyundai Auto Receivables Trust 2008-A, Asset-Backed Automobile Securities, Series 2008-A, Cl. A2, 4.16%, 5/16/11 | | | 4,160,000 | | | | 4,085,053 | |
| Ice Em CLO, Collateralized Loan Obligations: | | | | | | | | |
Series 2007-1A, Cl. B, 4.795%, 8/15/221,2 | | | 7,870,000 | | | | 3,541,500 | |
Series 2007-1A, Cl. C, 6.095%, 8/15/221,2 | | | 5,270,000 | | | | 1,224,748 | |
Series 2007-1A, Cl. D, 8.095%, 8/15/221,2 | | | 5,270,000 | | | | 909,602 | |
| Lehman XS Trust, Mtg. Pass-Through Certificates: | | | | | | | | |
Series 2005-2, Cl. 2A1B, 5.18%, 8/25/351 | | | 74,150 | | | | 72,760 | |
| Series 2005-4, Cl. 2A1B, 5.17%, 10/25/35 | | | 101,682 | | | | 92,689 | |
Mastr Asset-Backed Securities Trust 2006-WMC3, Mtg. Pass-Through Certificates, Series 2006-WMC3, Cl. A3, 0.571%, 8/25/361 | | | 1,310,000 | | | | 390,146 | |
NC Finance Trust, CMO Pass-Through Certificates, Series 1999-I, Cl. ECFD, 6.368%, 1/25/291,2 | | | 66,744 | | | | 8,510 | |
Option One Mortgage Loan Trust, Asset-Backed Certificates, Series 2006-2, Cl. 2A2, 0.571%, 7/1/361 | | | 2,879,098 | | | | 2,537,112 | |
Popular ABS Mortgage Pass-Through Trust 2005-6, Mtg. Pass-Through Certificates, Series 2005-6, Cl. A3, 5.68%, 1/25/361 | | | 394,533 | | | | 358,623 | |
RAMP Series 2006-RS4 Trust, Mtg. Asset-Backed Pass-Through Certificates, Series 2006-RS4, Cl. A1, 0.551%, 7/25/361 | | | 42,744 | | | | 42,341 | |
RASC Series 2006-KS7 Trust, Home Equity Mtg. Asset-Backed Pass-Through Certificates, Series 2006-KS7, Cl. A2, 0.571%, 9/25/361 | | | 1,097,501 | | | | 998,574 | |
Securitized Asset-Backed Receivables LLC Trust 2007-BR2, Asset-Backed Securities, Series 2007-BR2, Cl. A2, 0.701%, 2/25/371 | | | 786,579 | | | | 365,811 | |
SLM Student Loan Trust, Student Loan Receivables, Series 2005-B, Cl. B, 2.396%, 6/15/391 | | | 2,487,000 | | | | 722,984 | |
| Specialty Underwriting & Residential Finance Trust, Home Equity Asset-Backed Obligations: | | | | | | | | |
Series 2005-BC3, Cl. A2B, 0.721%, 6/25/361 | | | 7,489 | | | | 7,421 | |
Series 2006-BC1, Cl. A2B, 0.621%, 12/25/361 | | | 960,290 | | | | 918,516 | |
Start CLO Ltd., Asset-Backed Credit Linked Securities, Series 2006-3A, Cl. F, 19.193%, 6/7/111,2 | | | 1,630,000 | | | | 1,075,800 | |
Taganka Car Loan Finance plc, Automobile Asset-Backed Certificates, Series 2006-1A, Cl. C, 4.739%, 11/14/131,2 | | | 503,102 | | | | 457,823 | |
Terwin Mortgage Trust, Home Equity Asset-Backed Securities, Series 2006-4SL, Cl. A1, 4.50%, 5/1/37 | | | 217,897 | | | | 56,554 | |
Wells Fargo Home Equity Asset-Backed Securities 2006-2 Trust, Home Equity Asset-Backed Certificates, Series 2006-2, Cl. A2, 0.571%, 7/25/361 | | | 839,051 | | | | 791,865 | |
| | | | | | | | |
| Total Asset-Backed Securities (Cost $66,300,323) | | | | | | | 46,965,060 | |
| | | | | | | | | |
Mortgage-Backed Obligations—27.5% | | | | | | | | |
Government Agency—15.1% | | | | | | | | |
FHLMC/FNMA/Sponsored—14.8% | | | | | | | | |
| Federal Home Loan Mortgage Corp.: | | | | | | | | |
| 4.50%, 12/15/18-5/15/19 | | | 1,409,950 | | | | 1,451,275 | |
| 5%, 8/15/33-9/15/33 | | | 4,030,980 | | | | 4,130,036 | |
| 6%, 5/15/18-3/15/33 | | | 2,706,039 | | | | 2,805,117 | |
| 6.50%, 3/15/18-6/15/35 | | | 5,673,041 | | | | 5,927,302 | |
| 7%, 12/1/23-10/1/31 | | | 376,154 | | | | 395,682 | |
| 7.50%, 4/25/36 | | | 1,250,923 | | | | 1,320,646 | |
| Federal Home Loan Mortgage Corp., Gtd. Real Estate Mtg. Investment Conduit Multiclass Participation Certificates, Series 1897, Cl. K, 7%, 9/15/26 | | | 2,894,861 | | | | 3,105,296 | |
F2 | OPPENHEIMER STRATEGIC BOND FUND/ VA
| | | | | | | | | |
| | | Principal | | | | |
| | | Amount | | | Value | |
| |
FHLMC/FNMA/Sponsored Continued | | | | | | | | |
| Federal Home Loan Mortgage Corp., Gtd. Real Estate Mtg. Investment Conduit Multiclass Pass-Through Certificates: | | | | | | | | |
| Series 1360, Cl. PZ, 7.50%, 9/15/22 | | $ | 1,525,940 | | | $ | 1,645,370 | |
| Series 151, Cl. F, 9%, 5/15/21 | | | 39,507 | | | | 39,495 | |
| Series 1674, Cl. Z, 6.75%, 2/15/24 | | | 1,161,700 | | | | 1,237,551 | |
Series 2006-11, Cl. PS, 22.839%, 3/25/361 | | | 709,683 | | | | 809,089 | |
| Series 2043, Cl. ZP, 6.50%, 4/15/28 | | | 854,683 | | | | 891,040 | |
Series 2106, Cl. FG, 1.645%, 12/15/281 | | | 2,033,041 | | | | 1,904,899 | |
Series 2122, Cl. F, 1.645%, 2/15/291 | | | 66,133 | | | | 62,467 | |
| Series 2135, Cl. OH, 6.50%, 3/15/29 | | | 1,141,881 | | | | 1,195,930 | |
| Series 2148, Cl. ZA, 6%, 4/15/29 | | | 1,958,086 | | | | 2,027,023 | |
| Series 2173, Cl. Z, 6.50%, 7/15/29 | | | 725,872 | | | | 752,313 | |
| Series 2195, Cl. LH, 6.50%, 10/15/29 | | | 869,205 | | | | 912,782 | |
| Series 2326, Cl. ZP, 6.50%, 6/15/31 | | | 141,676 | | | | 148,349 | |
Series 2344, Cl. FP, 2.145%, 8/15/311 | | | 613,095 | | | | 597,326 | |
| Series 2351, Cl. PZ, 6.50%, 8/15/31 | | | 1,216,486 | | | | 1,279,087 | |
| Series 2368, Cl. PR, 6.50%, 10/15/31 | | | 583,773 | | | | 611,665 | |
Series 2410, Cl. PF, 2.175%, 2/15/321 | | | 2,936,062 | | | | 2,864,436 | |
Series 2412, Cl. GF, 2.145%, 2/15/321 | | | 1,431,199 | | | | 1,396,539 | |
| Series 2415, Cl. ZA, 6.50%, 2/15/32 | | | 1,660,399 | | | | 1,739,055 | |
| Series 2435, Cl. EQ, 6%, 5/15/31 | | | 1,167,194 | | | | 1,183,899 | |
Series 2449, Cl. FL, 1.745%, 1/15/321 | | | 800,029 | | | | 778,460 | |
Series 2451, Cl. FD, 2.195%, 3/15/321 | | | 451,300 | | | | 440,214 | |
| Series 2453, Cl. BD, 6%, 5/15/17 | | | 239,763 | | | | 251,377 | |
| Series 2461, Cl. PZ, 6.50%, 6/15/32 | | | 1,767,878 | | | | 1,865,446 | |
Series 2464, Cl. FI, 2.195%, 2/15/321 | | | 467,954 | | | | 456,308 | |
Series 2470, Cl. AF, 2.195%, 3/15/321 | | | 774,589 | | | | 765,985 | |
Series 2470, Cl. LF, 2.195%, 2/15/321 | | | 478,884 | | | | 459,586 | |
Series 2471, Cl. FD, 2.195%, 3/15/321 | | | 870,843 | | | | 829,863 | |
Series 2477, Cl. FZ, 1.745%, 6/15/311 | | | 1,765,378 | | | | 1,714,782 | |
Series 2500, Cl. FD, 1.695%, 3/15/321 | | | 45,676 | | | | 44,219 | |
Series 2517, Cl. GF, 2.195%, 2/15/321 | | | 416,365 | | | | 400,642 | |
Series 2526, Cl. FE, 1.595%, 6/15/291 | | | 65,532 | | | | 63,207 | |
Series 2551, Cl. FD, 1.595%, 1/15/331 | | | 50,652 | | | | 49,290 | |
| Series 2641, Cl. CE, 3.50%, 9/15/25 | | | 524,202 | | | | 523,789 | |
| Series 2676, Cl. KY, 5%, 9/15/23 | | | 3,843,000 | | | | 3,860,902 | |
| Series 2727, Cl. UA, 3.50%, 10/15/22 | | | 141,251 | | | | 141,184 | |
| Series 2736, Cl. DB, 3.30%, 11/15/26 | | | 2,527,797 | | | | 2,522,031 | |
| Series 2750, Cl. XG, 5%, 2/1/34 | | | 6,037,000 | | | | 6,243,903 | |
| Series 2777, Cl. PJ, 4%, 5/15/24 | | | 158,227 | | | | 158,301 | |
| Series 2857, Cl. MG, 5%, 9/1/34 | | | 2,045,000 | | | | 2,101,682 | |
| Series 2890, Cl. PE, 5%, 11/1/34 | | | 6,120,000 | | | | 6,283,610 | |
| Series 2934, Cl. NA, 5%, 4/15/24 | | | 697,933 | | | | 702,854 | |
| Series 2936, Cl. PE, 5%, 2/1/35 | | | 4,858,000 | | | | 4,975,906 | |
| Series 2939, Cl. PE, 5%, 2/15/35 | | | 1,585,000 | | | | 1,626,874 | |
| Series 2947, Cl. HE, 5%, 3/1/35 | | | 1,650,000 | | | | 1,689,966 | |
| Series 2991, Cl. QG, 5%, 8/1/34 | | | 2,430,000 | | | | 2,501,430 | |
| Series 3015, Cl. GM, 5%, 8/1/35 | | | 3,480,000 | | | | 3,552,410 | |
| Series 3022, Cl. HU, 5%, 8/1/35 | | | 3,300,000 | | | | 3,369,499 | |
Series 3025, Cl. SJ, 20.368%, 8/15/351 | | | 867,796 | | | | 992,159 | |
| Series 3035, Cl. DM, 5.50%, 11/15/25 | | | 2,353,082 | | | | 2,385,515 | |
Series 3094, Cl. HS, 20.002%, 6/15/341 | | | 482,047 | | | | 536,911 | |
| Series 3105, Cl. BD, 5.50%, 1/15/26 | | | 1,500,000 | | | | 1,572,224 | |
| Federal Home Loan Mortgage Corp., Interest-Only Stripped Mtg.-Backed Security: | | | | | | | | |
Series 177, Cl. IO, 3.886%, 7/1/265 | | | 167,410 | | | | 33,807 | |
Series 192, Cl. IO, 4.761%, 2/1/285 | | | 43,815 | | | | 6,190 | |
Series 200, Cl. IO, 4.398%, 1/1/295 | | | 54,033 | | | | 9,215 | |
Series 2003-13, Cl. IO, 0.349%, 3/25/335 | | | 980,301 | | | | 173,874 | |
Series 2003-26, Cl. DI, 1.332%, 4/25/335 | | | 757,832 | | | | 130,904 | |
Series 205, Cl. IO, 0.467%, 9/1/295 | | | 226,100 | | | | 50,485 | |
Series 2074, Cl. S, 37.242%, 7/17/285 | | | 56,766 | | | | 6,807 | |
Series 2079, Cl. S, 43.579%, 7/17/285 | | | 90,719 | | | | 10,722 | |
Series 208, Cl. IO, (26.473)%, 6/1/305 | | | 251,734 | | | | 43,292 | |
Series 2136, Cl. SG, 77.287%, 3/15/295 | | | 2,479,485 | | | | 231,093 | |
Series 216, Cl. IO, 2.681%, 12/1/315 | | | 252,209 | | | | 31,897 | |
F3 | OPPENHEIMER STRATEGIC BOND FUND/ VA
STATEMENT OF INVESTMENTS Continued
| | | | | | | | | |
| | | Principal | | | | |
| | | Amount | | | Value | |
| |
FHLMC/FNMA/Sponsored Continued | | | | | | | | |
| Federal Home Loan Mortgage Corp., Interest-Only Stripped Mtg.-Backed Security: Continued | | | | | | | | |
Series 2177, Cl. S, 70.604%, 8/15/295 | | $ | 2,723,238 | | | $ | 278,234 | |
Series 224, Cl. IO, 0.314%, 3/1/335 | | | 1,695,804 | | | | 252,829 | |
Series 2399, Cl. SG, 57.918%, 12/15/265 | | | 1,475,093 | | | | 145,661 | |
Series 243, Cl. 6, 15.224%, 12/15/325 | | | 723,034 | | | | 94,556 | |
Series 2437, Cl. SB, 77.883%, 4/15/325 | | | 4,280,534 | | | | 404,536 | |
Series 2526, Cl. SE, 30.034%, 6/15/295 | | | 122,517 | | | | 16,682 | |
Series 2802, Cl. AS, 99.999%, 4/15/335 | | | 1,151,660 | | | | 109,571 | |
Series 2920, Cl. S, 54.415%, 1/15/355 | | | 989,338 | | | | 97,233 | |
Series 2989, Cl. TS, 77.854%, 6/15/255 | | | 22,612,207 | | | | 1,667,234 | |
Series 3000, Cl. SE, 99.999%, 7/15/255 | | | 1,156,231 | | | | 92,509 | |
Series 3110, Cl. SL, 99.999%, 2/15/265 | | | 657,294 | | | | 47,251 | |
Federal Home Loan Mortgage Corp., Principal-Only Stripped Mtg.-Backed Security, Series 192, Cl. PO, 8.464%, 2/1/286 | | | 43,815 | | | | 39,381 | |
| Federal National Mortgage Assn.: | | | | | | | | |
| 4.50%, 5/25/18-6/1/20 | | | 22,163,053 | | | | 22,746,584 | |
4.50%, 1/1/227 | | | 1,385,000 | | | | 1,415,730 | |
| 5%, 12/1/17-11/1/33 | | | 92,630,489 | | | | 95,262,023 | |
5%, 1/1/397 | | | 11,486,000 | | | | 11,728,286 | |
5.296%, 10/1/36 | | | 22,978,570 | | | | 23,266,379 | |
| 5.50%, 4/25/21-7/1/33 | | | 71,470,489 | | | | 73,520,615 | |
5.50%, 1/1/24-1/1/397 | | | 6,320,000 | | | | 6,487,752 | |
| 6%, 10/25/16-4/1/35 | | | 35,722,870 | | | | 36,951,546 | |
6%, 1/1/247 | | | 11,081,000 | | | | 11,491,341 | |
| 6.50%, 3/25/17-1/1/34 | | | 11,665,312 | | | | 12,157,761 | |
6.50%, 1/1/397 | | | 17,211,000 | | | | 17,875,241 | |
| 7%, 11/1/17-6/25/34 | | | 9,755,061 | | | | 10,320,358 | |
7%, 1/1/397 | | | 1,160,000 | | | | 1,214,738 | |
| 7.50%, 2/25/27-3/25/33 | | | 4,503,559 | | | | 4,776,206 | |
| 8.50%, 7/1/32 | | | 6,995 | | | | 7,607 | |
| Federal National Mortgage Assn., Gtd. Real Estate Mtg. Investment Conduit Pass-Through Certificates: | | | | | | | | |
| Trust 1999-54, Cl. LH, 6.50%, 11/25/29 | | | 889,222 | | | | 920,052 | |
| Trust 2001-44, Cl. QC, 6%, 9/25/16 | | | 1,682,087 | | | | 1,760,238 | |
| Trust 2001-51, Cl. OD, 6.50%, 10/25/31 | | | 453,875 | | | | 477,724 | |
Trust 2001-69, Cl. PF, 1.471%, 12/25/311 | | | 1,057,081 | | | | 1,030,468 | |
| Trust 2001-70, Cl. LR, 6%, 9/25/30 | | | 3,711 | | | | 3,704 | |
| Trust 2001-74, Cl. QE, 6%, 12/25/31 | | | 5,476,298 | | | | 5,671,183 | |
| Trust 2001-80, Cl. ZB, 6%, 1/25/32 | | | 1,134,985 | | | | 1,175,699 | |
| Trust 2002-12, Cl. PG, 6%, 3/25/17 | | | 724,894 | | | | 759,222 | |
Trust 2002-29, Cl. F, 1.471%, 4/25/321 | | | 512,730 | | | | 499,710 | |
| Trust 2002-56, Cl. KW, 6%, 4/25/23 | | | 3,432,792 | | | | 3,493,134 | |
Trust 2002-60, Cl. FH, 1.471%, 8/25/321 | | | 1,075,119 | | | | 1,047,635 | |
Trust 2002-64, Cl. FJ, 1.471%, 4/25/321 | | | 157,886 | | | | 152,988 | |
Trust 2002-66, Cl. FG, 1.471%, 9/25/321 | | | 2,107,148 | | | | 2,053,255 | |
Trust 2002-68, Cl. FH, 1.384%, 10/18/321 | | | 357,276 | | | | 346,602 | |
| Trust 2002-71, Cl. UB, 5%, 11/25/15 | | | 2,028,560 | | | | 2,045,921 | |
Trust 2002-84, Cl. FB, 1.471%, 12/25/321 | | | 2,107,091 | | | | 1,983,182 | |
| Trust 2002-9, Cl. PC, 6%, 3/25/17 | | | 746,746 | | | | 782,112 | |
| Trust 2002-9, Cl. PR, 6%, 3/25/17 | | | 914,355 | | | | 957,658 | |
Trust 2002-90, Cl. FH, 0.971%, 9/25/321 | | | 1,178,923 | | | | 1,140,384 | |
Trust 2003-11, Cl. FA, 1.471%, 9/25/321 | | | 2,107,139 | | | | 2,004,003 | |
Trust 2003-116, Cl. FA, 0.871%, 11/25/331 | | | 130,250 | | | | 126,657 | |
Trust 2003-130, Cl. CS, 13.158%, 12/25/331 | | | 2,819,037 | | | | 2,832,597 | |
| Trust 2003-17, Cl. EQ, 5.50%, 3/25/23 | | | 1,452,000 | | | | 1,514,020 | |
| Trust 2003-23, Cl. EQ, 5.50%, 4/25/23 | | | 2,883,000 | | | | 2,983,746 | |
Trust 2003-73, Cl. HF, 0.921%, 1/25/311 | | | 7,222,409 | | | | 7,051,647 | |
| Trust 2003-81, Cl. PW, 4%, 3/25/25 | | | 524,999 | | | | 525,151 | |
| Trust 2004-101, Cl. BG, 5%, 1/25/20 | | | 1,825,000 | | | | 1,850,602 | |
| Trust 2004-52, Cl. JR, 4.50%, 7/25/24 | | | 827,070 | | | | 827,872 | |
| Trust 2005-100, Cl. BQ, 5.50%, 11/25/25 | | | 571,000 | | | | 584,471 | |
| Trust 2005-109, Cl. AH, 5.50%, 12/25/25 | | | 2,160,000 | | | | 2,213,721 | |
Trust 2005-25, Cl. PS, 26.087%, 4/25/351 | | | 742,013 | | | | 876,789 | |
F4 | OPPENHEIMER STRATEGIC BOND FUND/ VA
| | | | | | | | | |
| | | Principal | | | | |
| | | Amount | | | Value | |
| |
FHLMC/FNMA/Sponsored Continued | | | | | | | | |
| Federal National Mortgage Assn., Gtd. Real Estate Mtg. Investment Conduit Pass-Through Certificates: Continued | | | | | | | | |
| Trust 2005-31, Cl. PB, 5.50%, 4/25/35 | | $ | 560,000 | | | $ | 577,243 | |
| Trust 2005-71, Cl. DB, 4.50%, 8/25/25 | | | 480,000 | | | | 477,512 | |
| Trust 2006-29, Cl. PA, 5.50%, 8/25/26 | | | 4,037,216 | | | | 4,091,608 | |
Trust 2006-46, Cl. SW, 22.471%, 6/25/361 | | | 1,218,794 | | | | 1,362,048 | |
Trust 2006-50, Cl. KS, 22.472%, 6/25/361 | | | 523,586 | | | | 588,421 | |
| Trust 2007-79, Cl. ME, 5.50%, 8/1/37 | | | 4,155,000 | | | | 4,205,404 | |
| Federal National Mortgage Assn., Interest-Only Stripped Mtg.-Backed Security: | | | | | | | | |
Trust 2001-61, Cl. SH, 41.60%, 11/18/315 | | | 582,527 | | | | 78,586 | |
Trust 2001-63, Cl. SD, 28.236%, 12/18/315 | | | 134,828 | | | | 19,106 | |
Trust 2001-68, Cl. SC, 22.655%, 11/25/315 | | | 93,596 | | | | 12,893 | |
Trust 2001-81, Cl. S, 25.023%, 1/25/325 | | | 106,304 | | | | 15,002 | |
Trust 2002-28, Cl. SA, 26.929%, 4/25/325 | | | 63,664 | | | | 8,447 | |
Trust 2002-38, Cl. IO, 39.536%, 4/25/325 | | | 308,450 | | | | 33,345 | |
Trust 2002-48, Cl. S, 24.46%, 7/25/325 | | | 101,573 | | | | 14,097 | |
Trust 2002-52, Cl. SL, 25.018%, 9/25/325 | | | 63,972 | | | | 8,755 | |
Trust 2002-56, Cl. SN, 27.036%, 7/25/325 | | | 139,574 | | | | 19,266 | |
Trust 2002-77, Cl. IS, 32.064%, 12/18/325 | | | 525,507 | | | | 72,717 | |
Trust 2002-77, Cl. SH, 29.712%, 12/18/325 | | | 140,087 | | | | 17,604 | |
Trust 2002-9, Cl. MS, 23.565%, 3/25/325 | | | 135,265 | | | | 17,030 | |
Trust 2003-117, Cl. KS, 42.312%, 8/25/335 | | | 10,763,425 | | | | 966,465 | |
Trust 2003-118, Cl. S, 32.829%, 12/25/335 | | | 1,222,012 | | | | 147,602 | |
Trust 2003-33, Cl. SP, 22.276%, 5/25/335 | | | 974,184 | | | | 129,398 | |
Trust 2003-38, Cl. SA, 32.155%, 3/25/235 | | | 1,772,110 | | | | 191,154 | |
Trust 2003-4, Cl. S, 37.988%, 2/25/335 | | | 294,688 | | | | 37,799 | |
Trust 2005-105, Cl. S, 95.971%, 12/25/355 | | | 2,843,627 | | | | 242,790 | |
Trust 2005-40, Cl. SA, 55.764%, 5/25/355 | | | 2,820,267 | | | | 289,503 | |
Trust 2005-40, Cl. SB, 88.518%, 5/25/355 | | | 4,507,788 | | | | 444,182 | |
Trust 2005-63, Cl. SA, 88.04%, 10/25/315 | | | 220,428 | | | | 22,604 | |
Trust 2005-71, Cl. SA, 73.09%, 8/25/255 | | | 731,570 | | | | 54,853 | |
Trust 2005-83, Cl. SL, 91.42%, 10/25/355 | | | 4,149,656 | | | | 357,360 | |
Trust 2005-85, Cl. SA, 99.999%, 10/25/355 | | | 11,172,208 | | | | 860,528 | |
Trust 2005-87, Cl. SE, 99.999%, 10/25/355 | | | 11,012,981 | | | | 781,884 | |
Trust 2005-87, Cl. SG, 98.88%, 10/25/355 | | | 2,956,356 | | | | 250,580 | |
Trust 2006-119, Cl. MS, 93.23%, 12/25/365 | | | 2,268,516 | | | | 196,561 | |
Trust 2006-33, Cl. SP, 65.426%, 5/25/365 | | | 2,728,083 | | | | 284,226 | |
Trust 2006-34, Cl. SK, 64.101%, 5/25/365 | | | 4,974,373 | | | | 525,733 | |
Trust 2006-42, Cl. CI, 26.305%, 6/25/365 | | | 7,263,196 | | | | 844,126 | |
Trust 2006-48, Cl. QA, 28.061%, 6/25/365 | | | 5,434,825 | | | | 626,428 | |
Trust 2006-90, Cl. SX, 99.999%, 9/25/365 | | | 2,723,625 | | | | 311,039 | |
Trust 214, Cl. 2, 17.299%, 3/1/235 | | | 685,768 | | | | 154,573 | |
Trust 221, Cl. 2, 13.048%, 5/1/235 | | | 75,389 | | | | 17,110 | |
Trust 240, Cl. 2, 15.05%, 9/1/235 | | | 145,978 | | | | 22,654 | |
Trust 254, Cl. 2, 7.227%, 1/1/245 | | | 1,206,632 | | | | 275,472 | |
Trust 2682, Cl. TQ, 99.999%, 10/15/335 | | | 1,066,707 | | | | 121,362 | |
Trust 2981, Cl. BS, 99.999%, 5/15/355 | | | 1,935,685 | | | | 190,509 | |
Trust 301, Cl. 2, (6.448)%, 4/1/295 | | | 317,378 | | | | 63,814 | |
Trust 302, Cl. 2, (9.691)%, 6/1/295 | | | 1,200,842 | | | | 169,872 | |
Trust 313, Cl. 2, 19.507%, 6/1/315 | | | 3,578,530 | | | | 479,166 | |
Trust 319, Cl. 2, (1.244)%, 2/1/325 | | | 103,187 | | | | 14,546 | |
Trust 321, Cl. 2, (1.40)%, 4/1/325 | | | 460,403 | | | | 64,028 | |
| Trust 324, Cl. 2, (6.999)%, 7/1/325 | | | 798,261 | | | | 113,018 | |
Trust 328, Cl. 2, (10.302)%, 12/1/325 | | | 7,458,311 | | | | 1,097,060 | |
Trust 331, Cl. 5, 15.597%, 2/1/335 | | | 1,774,652 | | | | 244,032 | |
Trust 332, Cl. 2, (8.02)%, 3/1/335 | | | 5,898,199 | | | | 851,996 | |
Trust 333, Cl. 2, (12.058)%, 4/1/335 | | | 5,077,803 | | | | 621,018 | |
Trust 334, Cl. 12, 11.559%, 2/1/335 | | | 1,519,559 | | | | 199,444 | |
Trust 334, Cl. 3, 13.538%, 7/1/335 | | | 905,613 | | | | 101,609 | |
Trust 334, Cl. 5, 13.586%, 5/1/335 | | | 1,065,235 | | | | 121,458 | |
Trust 338, Cl. 2, (13.036)%, 7/1/335 | | | 1,163,300 | | | | 140,405 | |
Trust 339, Cl. 15, 18.711%, 7/1/335 | | | 3,938,661 | | | | 479,246 | |
Trust 339, Cl. 7, 11.479%, 7/1/335 | | | 7,345,028 | | | | 813,156 | |
Trust 339, Cl. 8, 12.211%, 8/1/335 | | | 499,871 | | | | 56,097 | |
Trust 342, Cl. 2, (3.295)%, 9/1/335 | | | 124,764 | | | | 17,840 | |
Trust 344, Cl. 2, (3.987)%, 12/1/335 | | | 4,341,032 | | | | 621,658 | |
F5 | OPPENHEIMER STRATEGIC BOND FUND/ VA
STATEMENT OF INVESTMENTS Continued
| | | | | | | | | |
| | | Principal | | | | |
| | | Amount | | | Value | |
| |
FHLMC/FNMA/Sponsored Continued | | | | | | | | |
| Federal National Mortgage Assn., Interest-Only Stripped Mtg.-Backed Security: Continued | | | | | | | | |
Trust 345, Cl. 9, 13.498%, 1/1/345 | | $ | 1,901,595 | | | $ | 207,692 | |
Trust 346, Cl. 2, (12.874)%, 12/1/335 | | | 1,219,327 | | | | 146,474 | |
Trust 351, Cl. 10, 14.256%, 4/1/345 | | | 835,327 | | | | 90,509 | |
Trust 351, Cl. 11, 12.86%, 11/1/345 | | | 442,843 | | | | 49,168 | |
Trust 351, Cl. 8, 12.789%, 4/1/345 | | | 1,335,155 | | | | 144,652 | |
Trust 351, Cl. 9, 11.821%, 10/1/345 | | | 16,506,254 | | | | 1,812,205 | |
Trust 356, Cl. 10, 13.15%, 6/1/355 | | | 1,186,202 | | | | 130,243 | |
Trust 356, Cl. 12, 13.355%, 2/1/355 | | | 614,150 | | | | 66,393 | |
Trust 362, Cl. 12, 12.982%, 8/1/355 | | | 1,127,114 | | | | 150,168 | |
Trust 362, Cl. 13, 12.967%, 8/1/355 | | | 671,170 | | | | 89,328 | |
| Federal National Mortgage Assn., Principal-Only Stripped Mtg.-Backed Security: | | | | | | | | |
Trust 322, Cl. 1, 9.641%, 4/1/326 | | | 5,834,820 | | | | 5,112,614 | |
Trust 324, Cl. 1, 9.911%, 7/1/326 | | | 199,332 | | | | 178,158 | |
| | | | | | | | |
| | | | | | | | 511,595,121 | |
| | | | | | | | | |
GNMA/Guaranteed—0.3% | | | | | | | | |
| Government National Mortgage Assn.: | | | | | | | | |
5.125%, 12/9/251 | | | 6,999 | | | | 6,903 | |
| 7%, 3/29/28-7/29/28 | | | 369,707 | | | | 391,554 | |
7.50%, 3/1/27 | | | 22,913 | | | | 24,288 | |
| 8%, 11/29/25-5/29/26 | | | 102,404 | | | | 108,997 | |
| Government National Mortgage Assn., Gtd. Real Estate Mtg. Investment Conduit Pass-Through Certificates: | | | | | | | | |
| Series 1999-32, Cl. ZB, 8%, 9/16/29 | | | 1,427,484 | | | | 1,567,336 | |
| Series 2000-12, Cl. ZA, 8%, 2/16/30 | | | 3,392,499 | | | | 3,728,756 | |
| Series 2001-62, Cl. KZ, 6.50%, 12/16/31 | | | 2,932,808 | | | | 3,072,529 | |
| Government National Mortgage Assn., Interest-Only Stripped Mtg.-Backed Security: | | | | | | | | |
Series 1998-19, Cl. SB, 33.215%, 7/16/285 | | | 182,671 | | | | 24,857 | |
Series 1998-6, Cl. SA, 52.99%, 3/16/285 | | | 114,064 | | | | 17,923 | |
Series 2001-21, Cl. SB, 66.977%, 1/16/275 | | | 860,271 | | | | 123,346 | |
Series 2006-47, Cl. SA, 69.726%, 8/16/365 | | | 4,372,439 | | | | 524,199 | |
| | | | | | | | |
| | | | | | | | 9,590,688 | |
| | | | | | | | | |
Non-Agency—12.4% | | | | | | | | |
Commercial—4.6% | | | | | | | | |
| Banc of America Commercial Mortgage, Inc., Commercial Mtg. Pass-Through Certificates: | | | | | | | | |
| Series 2006-5, Cl. A2, 5.317%, 10/10/11 | | | 3,160,000 | | | | 2,682,880 | |
| Series 2007-1, Cl. AMFX, 5.482%, 1/1/49 | | | 3,900,000 | | | | 1,799,958 | |
Series 2008-1, Cl. A4, 6.158%, 12/1/171 | | | 3,670,000 | | | | 2,843,766 | |
Series 2008-1, Cl. AJ, 6.201%, 1/1/181 | | | 940,000 | | | | 262,950 | |
Series 2008-1, Cl. AM, 6.201%, 1/1/181 | | | 2,920,000 | | | | 1,371,131 | |
| Banc of America Funding Corp., Mtg. Pass-Through Certificates, Series 2004-2, Cl. 2A1, 6.50%, 7/20/32 | | | 284,215 | | | | 272,117 | |
| Bear Stearns Commercial Mortgage Securities Trust 2006-PW13, Commercial Mtg. Pass-Through Certificates, Series PW13, Cl. A4, 5.54%, 9/1/41 | | | 5,760,000 | | | | 4,535,937 | |
| ChaseFlex Trust 2006-2, Multiclass Mtg. Pass-Through Certificates, Series 2006-2, Cl. A1B, 1.495%, 9/25/361 | | | 141,158 | | | | 135,246 | |
| CHL Mortgage Pass-Through Trust 2005-17, Mtg. Pass-Through Certificates, Series 2005-17, Cl. 1A8, 5.50%, 9/1/35 | | | 3,740,000 | | | | 2,826,575 | |
CHL Mortgage Pass-Through Trust 2005-HYB8, Mtg. Pass-Through Certificates, Series 2005-HYB8, Cl. 4A1, 5.563%, 12/20/351 | | | 214,205 | | | | 120,659 | |
Citigroup Commercial Mortgage Trust 2006-C4, Commercial Mtg. Pass-Through Certificates, Series 2006-C4, Cl. A3, 5.724%, 3/1/491 | | | 2,940,000 | | | | 2,314,640 | |
| Citigroup Mortgage Loan Trust, Inc. 2006-WF1, Asset-Backed Pass-Through Certificates, Series 2006-WF1, Cl. A2B, 5.536%, 3/1/36 | | | 29,882 | | | | 29,635 | |
| Citigroup/Deutsche Bank 2007-CD4 Commercial Mortgage Trust, Commercial Mtg. Pass-Through Certificates: | | | | | | | | |
| Series 2007-CD4, Cl. A2B, 5.205%, 12/11/49 | | | 9,170,000 | | | | 7,628,443 | |
| Series 2007-CD4, Cl. AJ, 5.398%, 12/1/49 | | | 2,680,000 | | | | 686,722 | |
CitiMortgage Alternative Loan Trust 2006-A5, Real Estate Mtg. Investment Conduit Pass-Through Certificates, Series 2006-A5, Cl. 1A13, 0.921%, 10/25/361 | | | 2,451,010 | | | | 1,001,393 | |
F6 | OPPENHEIMER STRATEGIC BOND FUND/ VA
| | | | | | | | | |
| | | Principal | | | | |
| | | Amount | | | Value | |
| |
Commercial Continued | | | | | | | | |
Credit Suisse Commercial Mortgage Trust, Commercial Mtg. Pass-Through Certificates, Series 2007-C3, Cl. A4, 5.723%, 6/1/391 | | $ | 1,560,000 | | | $ | 995,246 | |
CWABS, Inc. Asset-Backed Certificates Trust 2006-8, Asset-Backed Certificates, Series 2006-8, Cl. 2A1, 0.501%, 1/25/461 | | | 180,569 | | | | 178,725 | |
| CWALT Alternative Loan Trust 2007-8CB, Mtg. Pass-Through Certificates, Series 2007-8CB, Cl. A1, 5.50%, 5/25/37 | | | 4,974,109 | | | | 4,401,491 | |
| Deutsche Alt-A Securities Mortgage Loan Trust, Mtg. Pass-Through Certificates: | | | | | | | | |
| Series 2006-AB1, Cl. A2A, 5.50%, 2/25/36 | | | 784,112 | | | | 761,790 | |
| Series 2006-AB2, Cl. A1, 5.888%, 6/25/36 | | | 1,327,246 | | | | 1,069,485 | |
| Series 2006-AB2, Cl. A7, 5.961%, 6/25/36 | | | 268,944 | | | | 247,545 | |
| Series 2006-AB3, Cl. A7, 6.36%, 7/1/36 | | | 114,365 | | | | 110,222 | |
| Series 2006-AB4, Cl. A1A, 6.005%, 10/25/36 | | | 1,777,912 | | | | 1,424,531 | |
Series 2007-RS1, Cl. A2, 0.971%, 1/27/371,2 | | | 1,661,504 | | | | 492,220 | |
| First Horizon Alternative Mortgage Securities Trust 2007-FA2, Mtg. Pass-Through Certificates, Series 2007-FA2, Cl. 1A1, 5.50%, 4/25/37 | | | 1,129,157 | | | | 1,061,539 | |
First Horizon Mortgage Pass-Through Trust 2007-AR3, Mtg. Pass-Through Certificates, Series 2007-AR3, Cl. 1A1, 6.132%, 11/1/371 | | | 5,673,742 | | | | 3,780,385 | |
| GE Capital Commercial Mortgage Corp., Commercial Mtg. Obligations, Series 2004-C3, Cl. A2, 4.433%, 7/10/39 | | | 2,135,000 | | | | 2,101,586 | |
GMAC Commercial Mortgage Securities, Inc., Commercial Mtg. Pass-Through Certificates, Series 1998-C1, Cl. F, 6.987%, 5/15/301 | | | 1,567,000 | | | | 1,562,299 | |
| Greenwich Capital Commercial Funding Corp., Commercial Mtg. Pass-Through Certificates, Series 2007-GG9, Cl. A2, 5.381%, 3/10/39 | | | 1,990,000 | | | | 1,574,147 | |
| Greenwich Capital Commercial Mortgage 2007-GG11, Commercial Mtg. Pass-Through Certificates, Series 2007-GG11, Cl. A4, 5.736%, 8/1/17 | | | 7,325,000 | | | | 5,491,435 | |
| GS Mortgage Securities Corp. II, Commercial Mtg. Obligations, Series 2006-GG8, Cl. A4, 5.56%, 11/1/39 | | | 1,960,000 | | | | 1,560,627 | |
| GSR Mortgage Loan Trust 2005-4F, Mtg. Pass-Through Certificates, Series 2005-4F, Cl. 6A1, 6.50%, 2/25/35 | | | 3,149,724 | | | | 2,596,855 | |
Indymac Index Mortgage Loan Trust 2005-AR31, Mtg. Pass-Through Certificates, Series 2005-AR31, Cl. 2 A2, 5.315%, 1/1/361 | | | 603,797 | | | | 194,526 | |
| JPMorgan Chase Commercial Mortgage Securities Corp., Commercial Mtg. Pass-Through Certificates: | | | | | | | | |
Series 2007-CB15, Cl. AJ, 5.502%, 6/1/47 | | | 630,000 | | | | 164,850 | |
| Series 2007-CB18, Cl. A4, 5.44%, 6/1/47 | | | 5,600,000 | | | | 4,058,180 | |
| Series 2007-CB18, Cl. AM, 5.466%, 6/1/47 | | | 6,380,000 | | | | 2,941,707 | |
| Series 2008-C2, Cl. A4, 6.068%, 2/1/51 | | | 8,390,000 | | | | 5,971,217 | |
| Series 2008-C2, Cl. AJ, 6.579%, 2/1/511 | | | 3,210,000 | | | | 873,400 | |
| Series 2008-C2, Cl. AM, 6.579%, 2/1/51 | | | 4,990,000 | | | | 2,389,482 | |
| JPMorgan Chase Commercial Mortgage Securities Trust 2007-LDPX, Commercial Mtg. Pass-Through Certificates, Series 2007-LDPX, Cl. A3, 5.42%, 1/15/49 | | | 4,410,000 | | | | 3,131,400 | |
| JPMorgan Chase Commercial Mortgage Securities Trust, Commercial Mtg. Pass-Through Certificates: | | | | | | | | |
Series 2007-LD11, Cl. A2, 5.804%, 6/15/491 | | | 5,390,000 | | | | 4,136,691 | |
| Series 2007-LD12, Cl. A2, 5.827%, 2/15/51 | | | 5,682,000 | | | | 4,447,080 | |
| Series 2007-LDPX, Cl. A2S, 5.305%, 1/15/49 | | | 2,380,000 | | | | 1,881,445 | |
| JPMorgan Commercial Mortgage Finance Corp., Mtg. Pass-Through Certificates, Series 2000-C9, Cl. A2, 7.77%, 10/15/32 | | | 2,080,804 | | | | 2,081,892 | |
F7 | OPPENHEIMER STRATEGIC BOND FUND/ VA
STATEMENT OF INVESTMENTS Continued
| | | | | | | | | |
| | | Principal | | | | |
| | | Amount | | | Value | |
| |
Commercial Continued | | | | | | | | |
JPMorgan Mortgage Trust 2006-A2, Mtg. Pass-Through Certificates, Series 2006-A2, Cl. 3A4, 5.678%, 4/1/361 | | $ | 2,853,741 | | | $ | 959,358 | |
JPMorgan Mortgage Trust 2006-A7, Mtg. Pass-Through Certificates, Series 2006-A7, Cl. 2A2, 5.793%, 1/1/371 | | | 1,087,383 | | | | 798,668 | |
| LB-UBS Commercial Mortgage Trust 2006-C1, Commercial Mtg. Pass-Through Certificates, Series 2006-C1, Cl. A2, 5.084%, 2/11/31 | | | 1,650,000 | | | | 1,440,966 | |
| LB-UBS Commercial Mortgage Trust 2007-C1, Commercial Mtg. Pass-Through Certificates, Series 2007-C1, Cl. A2, 5.318%, 1/15/12 | | | 8,330,000 | | | | 6,664,892 | |
LB-UBS Commercial Mortgage Trust 2008-C1, Commercial Mtg. Pass-Through Certificates, Series 2008-C1, Cl. AM, 6.15%, 4/11/411 | | | 2,610,000 | | | | 1,207,298 | |
| Mastr Alternative Loan Trust 2004-6, Mtg. Pass-Through Certificates, Series 2004-6, Cl. 10A1, 6%, 7/25/34 | | | 415,749 | | | | 303,965 | |
Mastr Asset Securitization Trust 2006-3, Mtg. Pass-Through Certificates, Series 2006-3, Cl. 2A1, 0.921%, 10/25/361 | | | 6,433,152 | | | | 4,055,539 | |
Merrill Lynch Mortgage Investors Trust 2005-A9, Mtg. Asset-Backed Certificates, Series 2005-A9, Cl. 4A1, 5.492%, 12/1/351 | | | 3,185,002 | | | | 2,083,083 | |
Merrill Lynch Mortgage Trust 2006-C1, Commercial Mtg. Pass-Through Certificates, Series 2006-C1, Cl. AJ, 5.657%, 5/1/391 | | | 1,175,000 | | | | 370,501 | |
| Morgan Stanley Capital I Trust, Commercial Mtg. Pass-Through Certificates, Series 2007-IQ16, Cl. A4, 5.809%, 12/1/49 | | | 3,420,000 | | | | 2,571,563 | |
| Nomura Asset Securities Corp., Commercial Mtg. Pass-Through Certificates, Series 1998-D6, Cl. A1B, 6.59%, 3/15/30 | | | 329,712 | | | | 329,273 | |
| Prudential Mortgage Capital Co. II LLC, Commercial Mtg. Pass-Through Certificates, Series PRU-HTG 2000-C1, Cl. A2, 7.306%, 10/6/15 | | | 556,000 | | | | 484,416 | |
| RALI Series 2005-QA4 Trust, Mtg. Asset-Backed Pass-Through Certificates, Series 2005-QA4, Cl. A32, 5.376%, 4/25/351 | | | 164,706 | | | | 41,644 | |
| RALI Series 2007-QS6 Trust, Mtg. Asset-Backed Pass-Through Certificates, Series 2007-QS6, Cl. A114, 5.75%, 4/25/37 | | | 1,583,844 | | | | 691,645 | |
| Residential Asset Securitization Trust 2006-A9CB, Mtg. Pass-Through Certificates, Series 2006-A9CB, Cl. A5, 6%, 9/25/36 | | | 1,025,649 | | | | 501,747 | |
| Residential Asset Securitization Trust, Mtg. Pass-Through Certificates, Series 2006-A12, Cl. 1A, 6.25%, 11/1/36 | | | 1,172,311 | | | | 668,095 | |
STARM Mortgage Loan Trust 2007-1, Mtg. Pass-Through Certificates, Series 2007-1, Cl. 2A1, 5.827%, 2/1/371 | | | 14,105,693 | | | | 8,098,627 | |
STARM Mortgage Loan Trust 2007-3, Mtg. Pass-Through Certificates, Series 2007-3, Cl. 1A1, 5.66%, 6/1/371,2 | | | 3,006,838 | | | | 1,503,419 | |
Structured Asset Mortgage Investments, Inc., Mtg. Pass-Through Certificates, Series 2002-AR3, Cl. A2, 1.081%, 9/19/321,2 | | | 670,350 | | | | 375,396 | |
| Wachovia Bank Commercial Mortgage Trust 2006-C29, Commercial Mtg. Pass-Through Certificates, Series 2006-C29, Cl. A2, 5.272%, 11/15/48 | | | 2,997,000 | | | | 2,459,679 | |
Wachovia Bank Commercial Mortgage Trust 2007-C33, Commercial Mtg. Pass-Through Certificates, Series 2007-C33, Cl. A4, 5.903%, 2/1/511 | | | 5,790,000 | | | | 4,202,974 | |
Wachovia Bank Commercial Mortgage Trust, Commercial Mtg. Pass-Through Certificates, Series 2007-C34, Cl. AJ, 5.952%, 5/1/461 | | | 2,610,000 | | | | 693,763 | |
Wachovia Mortgage Loan Trust LLC, Mtg. Pass-Through Certificates, Series 2007-A, Cl. 1A1, 5.981%, 3/1/371 | | | 4,295,579 | | | | 2,317,376 | |
WaMu Mortgage Pass-Through Certificates 2006-AR14 Trust, Mtg. Pass-Through Certificates, Series 2006-AR14, Cl. 1A7, 5.631%, 11/1/361 | | | 1,704,637 | | | | 553,593 | |
F8 | OPPENHEIMER STRATEGIC BOND FUND/ VA
| | | | | | | | | |
| | | Principal | | | | |
| | | Amount | | | Value | |
| |
Commercial Continued | | | | | | | | |
WaMu Mortgage Pass-Through Certificates 2006-AR15 Trust, Mtg. Pass-Through Certificates, Series 2006-AR15, Cl. 1A, 3.096%, 11/1/461,2 | | $ | 1,563,095 | | | $ | 578,345 | |
WaMu Mortgage Pass-Through Certificates 2006-AR8 Trust, Mtg. Pass-Through Certificates, Series 2006-AR8, Cl. 1A4, 5.871%, 8/1/461 | | | 7,588,474 | | | | 4,224,206 | |
| WaMu Mortgage Pass-Through Certificates 2007-HY1 Trust, Mtg. Pass-Through Certificates: | | | | | | | | |
Series 2007-HY1, Cl. 1A2, 5.706%, 2/25/371,2 | | | 2,669,186 | | | | 613,913 | |
Series 2007-HY1, Cl. 2A4, 5.863%, 2/1/371 | | | 665,623 | | | | 286,161 | |
WaMu Mortgage Pass-Through Certificates 2007-HY3 Trust, Mtg. Pass-Through Certificates, Series 2007-HY3, Cl. 2A2, 5.668%, 3/1/371 | | | 3,865,607 | | | | 999,094 | |
WaMu Mortgage Pass-Through Certificates 2007-HY4 Trust, Mtg. Pass-Through Certificates, Series 2007-HY4, Cl. 5A1, 5.548%, 11/1/361 | | | 734,477 | | | | 482,663 | |
WaMu Mortgage Pass-Through Certificates 2007-HY5 Trust, Mtg. Pass-Through Certificates, Series 2007-HY5, Cl. 2A3, 5.647%, 5/1/371 | | | 772,564 | | | | 494,025 | |
WaMu Mortgage Pass-Through Certificates 2007-OA3 Trust, Mtg. Pass-Through Certificates, Series 2007-OA3, Cl. 5A, 4.019%, 4/1/471,2 | | | 1,080,095 | | | | 356,431 | |
Wells Fargo Mortgage-Backed Securities 2004-EE Trust, Mtg. Pass-Through Certificates, Series 2004-EE, Cl. 3A2, 4.388%, 12/1/341 | | | 6,051,866 | | | | 4,575,895 | |
Wells Fargo Mortgage-Backed Securities 2004-U Trust, Mtg. Pass-Through Certificates, Series 2004-U, Cl. A1, 5.245%, 10/1/341 | | | 1,157,231 | | | | 988,099 | |
Wells Fargo Mortgage-Backed Securities 2004-V Trust, Mtg. Pass-Through Certificates, Series 2004-V, Cl. 1A1, 3.986%, 10/1/341 | | | 3,699,864 | | | | 3,396,692 | |
Wells Fargo Mortgage-Backed Securities 2004-W Trust, Mtg. Pass-Through Certificates, Series 2004-W, Cl. B2, 4.543%, 11/1/341 | | | 1,284,021 | | | | 782,787 | |
Wells Fargo Mortgage-Backed Securities 2005-AR1 Trust, Mtg. Asset-Backed Pass-Through Certificates, Series 2005-AR1, Cl. 1A1, 4.542%, 2/1/351 | | | 6,439,032 | | | | 4,069,086 | |
Wells Fargo Mortgage-Backed Securities 2006-AR8 Trust, Mtg. Pass-Through Certificates, Series 2006-AR8, Cl. 1A3, 5.205%, 4/25/361 | | | 3,895,387 | | | | 2,560,537 | |
| | | | | | | | |
| | | | | | | | 157,979,464 | |
| | | | | | | | | |
Manufactured Housing—0.1% | | | | | | | | |
Wells Fargo Mortgage-Backed Securities 2006-AR12 Trust, Mtg. Pass-Through Certificates, Series 2006-AR12, Cl. 2A1, 6.099%, 9/25/361 | | | 6,541,337 | | | | 4,205,075 | |
Wells Fargo Mortgage-Backed Securities 2006-AR2 Trust, Mtg. Pass-Through Certificates, Series 2006-AR2, Cl. 2A5, 5.093%, 3/25/361 | | | 1,891,134 | | | | 1,177,194 | |
| | | | | | | | |
| | | | | | | | 5,382,269 | |
| | | | | | | | | |
Multifamily—0.6% | | | | | | | | |
Banc of America Mortgage Securities, Inc., Mtg. Pass-Through Certificates, Series 2003-E, Cl. 2A2, 4.71%, 6/25/331 | | | 2,572,909 | | | | 2,033,592 | |
Bear Stearns ARM Trust 2006-4, Mtg. Pass-Through Certificates, Series 2006-4, Cl. 2A1, 5.779%, 10/25/361 | | | 2,627,276 | | | | 1,270,650 | |
CHL Mortgage Pass-Through Trust 2003-46, Mtg. Pass-Through Certificates, Series 2003-46, Cl. 1A2, 5.15%, 1/19/341 | | | 4,046,645 | | | | 3,413,059 | |
CHL Mortgage Pass-Through Trust 2007-HY1, Mtg. Pass-Through Certificates, Series 2007-HY1, Cl. 1A1, 5.68%, 4/25/371 | | | 6,412,236 | | | | 3,498,748 | |
Merrill Lynch Mortgage Investors Trust 2005-A2, Mtg. Pass-Through Certificates, Series 2005-A2, Cl. A2, 4.487%, 2/1/351 | | | 1,465,115 | | | | 893,824 | |
F9 | OPPENHEIMER STRATEGIC BOND FUND/ VA
STATEMENT OF INVESTMENTS Continued
| | | | | | | | | |
| | | Principal | | | | |
| | | Amount | | | Value | |
| |
Multifamily Continued | | | | | | | | |
Wells Fargo Mortgage-Backed Securities 2006-AR10 Trust, Mtg. Pass-Through Certificates, Series 2006-AR10, Cl. 2A1, 5.628%, 7/25/361 | | $ | 1,510,283 | | | $ | 809,030 | |
Wells Fargo Mortgage-Backed Securities 2006-AR5 Trust, Mtg. Pass-Through Certificates, Series 2006-AR5, Cl. 2A1, 5.545%, 4/1/361 | | | 10,267,993 | | | | 5,746,905 | |
Wells Fargo Mortgage-Backed Securities 2006-AR6 Trust, Mtg. Pass-Through Certificates, Series 2006-AR6, Cl. 3A1, 5.093%, 3/25/361 | | | 2,746,287 | | | | 1,972,396 | |
| | | | | | | | |
| | | | | | | | 19,638,204 | |
| | | | | | | | | |
Other—0.0% | | | | | | | | |
JPMorgan Mortgage Trust 2005-S2, Mtg. Pass-Through Certificates, Series 2005-S2, Cl. 3A1, 6.719%, 2/25/321 | | | 1,542,685 | | | | 1,151,707 | |
Residential—7.1% | | | | | | | | |
Banc of America Commercial Mortgage, Inc., Commercial Mtg. Pass-Through Certificates, Series 2007-4, Cl. AM, 5.812%, 8/1/171 | | | 6,560,000 | | | | 3,040,754 | |
Bear Stearns ARM Trust 2004-2, Mtg. Pass-Through Certificates, Series 2004-2, Cl. 12A2, 4.404%, 5/1/341,2 | | | 5,564,397 | | | | 3,755,968 | |
Bear Stearns ARM Trust 2004-9, Mtg. Pass-Through Certificates, Series 2004-9, Cl. 23A1, 5.028%, 11/1/341 | | | 3,683,947 | | | | 2,845,586 | |
| Chase Mortgage Finance Trust 2006-S3, Multiclass Mtg. Pass-Through Certificates, Series 2006-S3, Cl. 1A2, 6%, 11/1/36 | | | 4,210,000 | | | | 1,971,551 | |
Chase Mortgage Finance Trust 2007-A1, Multiclass Mtg. Pass-Through Certificates, Series 2007-A1, Cl. 9A1, 4.567%, 2/1/371 | | | 3,956,944 | | | | 3,221,943 | |
| CHL Mortgage Pass-Through Trust 2005-26, Mtg. Pass-Through Certificates, Series 2005-26, Cl. 1A8, 5.50%, 11/1/35 | | | 3,698,833 | | | | 3,432,466 | |
| CHL Mortgage Pass-Through Trust 2005-27, Mtg. Pass-Through Certificates, Series 2005-27, Cl. 2A1, 5.50%, 12/1/35 | | | 3,312,369 | | | | 2,078,949 | |
CHL Mortgage Pass-Through Trust 2005-31, Mtg. Pass-Through Certificates, Series 2005-31, Cl. 2A4, 5.471%, 1/1/361,2 | | | 1,434,223 | | | | 372,898 | |
| CHL Mortgage Pass-Through Trust 2005-J4, Mtg. Pass-Through Certificates, Series 2005-J4, Cl. A7, 5.50%, 11/1/35 | | | 2,110,000 | | | | 1,489,689 | |
CHL Mortgage Pass-Through Trust 2007-HY3, Mtg. Pass-Through Certificates, Series 2007-HY3, Cl. 1A1, 5.617%, 6/1/471,2 | | | 3,220,515 | | | | 1,674,668 | |
| CHL Mortgage Pass-Through Trust 2007-HY4, Mtg. Pass-Through Certificates: | | | | | | | | |
Series 2007-HY4, Cl. 1A1, 6.086%, 9/1/471 | | | 18,149,299 | | | | 9,327,059 | |
| Series 2007-HY4, Cl. 1A2, 6.086%, 9/1/471,2 | | | 3,914,900 | | | | 782,980 | |
Series 2007-HY4, Cl. 2A2, 6.232%, 11/1/371,2 | | | 866,388 | | | | 173,278 | |
Series 2007-HY4, Cl. 3A2, 6.388%, 11/1/371,2 | | | 917,681 | | | | 183,536 | |
| CHL Mortgage Pass-Through Trust 2007-HY5, Mtg. Pass-Through Certificates: | | | | | | | | |
Series 2007-HY5, Cl. 1A2, 5.93%, 9/1/371,2 | | | 4,311,384 | | | | 1,336,529 | |
Series 2007-HY5, Cl. 2A2, 6.001%, 9/1/371,2 | | | 1,103,806 | | | | 342,180 | |
Series 2007-HY5, Cl. 3A2, 6.201%, 9/1/371,2 | | | 2,760,486 | | | | 855,751 | |
| Citigroup Commercial Mortgage Trust 2007-C6, Commercial Mtg. Pass-Through Certificates: | | | | | | | | |
Series 2007-C6, Cl. A2, 5.70%, 8/1/121 | | | 1,110,000 | | | | 864,813 | |
Series 2007-C6, Cl. A4, 5.70%, 12/1/491 | | | 6,170,000 | | | | 4,670,085 | |
Citigroup Commercial Mortgage Trust 2008-C7, Commercial Mtg. Pass-Through Certificates, Series 2008-C7, Cl. A4, 6.096%, 12/1/491 | | | 3,800,000 | | | | 2,946,019 | |
Citigroup Mortgage Loan Trust, Inc. 2005-2, Mtg. Pass-Through Certificates, Series 2005-2, Cl. 1A3, 4.951%, 5/1/351,2 | | | 4,180,613 | | | | 2,704,007 | |
Citigroup Mortgage Loan Trust, Inc. 2005-3, Mtg. Pass-Through Certificates, Series 2005-3, Cl. 2A4, 5.199%, 8/1/351 | | | 8,250,741 | | | | 4,686,525 | |
F10 | OPPENHEIMER STRATEGIC BOND FUND/ VA
| | | | | | | | | |
| | | Principal | | | | |
| | | Amount | | | Value | |
| |
Residential Continued | | | | | | | | |
Citigroup Mortgage Loan Trust, Inc. 2006-AR1, Asset-Backed Pass-Through Certificates, Series 2006-AR1, Cl. 3A2, 5.50%, 3/1/361,2 | | $ | 4,368,582 | | | $ | 1,092,146 | |
| Citigroup Mortgage Loan Trust, Inc. 2006-AR2, Asset-Backed Pass-Through Certificates: | | | | | | | | |
Series 2006-AR2, Cl. 1A2, 5.523%, 3/1/361 | | | 9,148,567 | | | | 4,937,452 | |
Series 2006-AR2, Cl. 1AB, 5.591%, 3/1/362 | | | 3,946,659 | | | | 986,665 | |
| Citigroup/Deutsche Bank 2007-CD4 Commercial Mortgage Trust, Commercial Mtg. Pass-Through Certificates, Series 2007-CD4, Cl. AMFX, 5.366%, 12/1/49 | | | 5,680,000 | | | | 2,565,222 | |
| CitiMortgage Alternative Loan Trust 2006-A5, Real Estate Mtg. Investment Conduit Pass-Through Certificates, Series 2006-A5, Cl. 2A1, 5.50%, 10/1/21 | | | 3,148,890 | | | | 2,304,221 | |
| CitiMortgage Alternative Loan Trust 2007-A2, Real Estate Mtg. Investment Conduit Pass-Through Certificates, Series 2007-A2, Cl. 1A5, 6%, 2/25/37 | | | 5,438,071 | | | | 3,228,340 | |
COMM 2007-C9 Mortgage Trust, Commercial Mtg. Pass-Through Certificates, Series 2007-C9, Cl. A4, 5.816%, 7/1/171 | | | 5,160,000 | | | | 3,928,849 | |
| CWALT Alternative Loan Trust 2005-J1, Mtg. Pass-Through Certificates, Series 2005-J1, Cl. 3A1, 6.50%, 8/25/32 | | | 4,940,616 | | | | 3,164,347 | |
CWALT Alternative Loan Trust 2006-43CB, Mtg. Pass-Through Certificates, Series 2006-43CB, Cl. 1A10, 6%, 2/1/372 | | | 15,350,647 | | | | 7,577,080 | |
GSR Mortgage Loan Trust 2004-5, Mtg. Pass-Through Certificates, Series 2004-5, Cl. 2A1, 4.506%, 5/1/341 | | | 3,943,742 | | | | 2,720,198 | |
| GSR Mortgage Loan Trust 2005-AR6, Mtg. Pass-Through Certificates: | | | | | | | | |
Series 2005-AR6, Cl. 1A4, 4.586%, 9/1/351 | | | 10,350,399 | | | | 7,960,402 | |
Series 2005-AR6, Cl. 3A1, 4.56%, 9/25/351 | | | 4,877,866 | | | | 3,121,048 | |
GSR Mortgage Loan Trust 2005-AR7, Mtg. Pass-Through Certificates, Series 2005-AR7, Cl. 4A1, 5.346%, 11/25/351 | | | 5,195,288 | | | | 3,224,831 | |
| GSR Mortgage Loan Trust 2007-AR1, Mtg. Pass-Through Certificates: | | | | | | | | |
Series 2007-AR1, Cl. 2A1, 5.999%, 3/1/371 | | | 20,242,291 | | | | 10,760,136 | |
Series 2007-AR1, Cl. 4A1, 5.826%, 3/1/371,2 | | | 3,784,523 | | | | 1,892,261 | |
JPMorgan Mortgage Trust 2007-A1, Mtg. Pass-Through Certificates, Series 2007-A1, Cl. 7A1, 5.298%, 7/1/351,2 | | | 6,365,009 | | | | 4,264,556 | |
JPMorgan Mortgage Trust 2007-A3, Mtg. Pass-Through Certificates, Series 2007-A3, Cl. 3A3, 6.009%, 5/1/371,2 | | | 1,849,813 | | | | 347,210 | |
LB-UBS Commercial Mortgage Trust 2007-C7, Commercial Mtg. Pass-Through Certificates, Series 2007-C7, Cl. AM, 6.166%, 9/11/451 | | | 10,430,000 | | | | 4,933,973 | |
| Lehman XS Trust, Mtg. Pass-Through Certificates, Series 2005-10, Cl. 2A3B, 5.55%, 1/25/36 | | | 261,515 | | | | 241,019 | |
Mastr Adjustable Rate Mortgages Trust 2006-2, Mtg. Pass-Through Certificates, Series 2006-2, Cl. 1A1, 5.036%, 4/1/361 | | | 3,416,847 | | | | 2,441,709 | |
Merrill Lynch Mortgage Investors Trust 2006-3, Mtg. Pass-Through Certificates, Series 2006-3, Cl. 2A1, 6.076%, 10/25/361 | | | 6,258,839 | | | | 4,661,527 | |
Merrill Lynch Mortgage Investors Trust 2007-3, Mtg. Pass-Through Certificates, Series 2007-3, Cl. 1A1, 5.801%, 9/1/371 | | | 2,650,364 | | | | 2,257,624 | |
| RALI Series 2006-QS13 Trust: | | | | | | | | |
| Mtg. Asset-Backed Pass-Through | | | | | | | | |
| Certificates, Series 2006-QS13, Cl. 1A5, 6%, 9/25/36 | | | 3,585,512 | | | | 2,424,855 | |
| Mtg. Asset-Backed Pass-Through Certificates, Series 2006-QS13, Cl. 1A8, 6%, 9/25/36 | | | 598,223 | | | | 575,781 | |
| RALI Series 2006-QS5 Trust, Mtg. Asset-Backed Pass-Through Certificates, Series 2006-QS5, Cl. 2A2, 6%, 5/1/36 | | | 242,833 | | | | 237,441 | |
| RALI Series 2007-QS6 Trust, Mtg. Asset-Backed Pass-Through Certificates, Series 2007-QS6, Cl. A28, 5.75%, 4/25/37 | | | 1,492,027 | | | | 702,935 | |
| Residential Asset Securitization Trust 2005-A14, Mtg. Pass-Through Certificates, Series 2005-A14, Cl. A1, 5.50%, 12/1/35 | | | 3,720,000 | | | | 1,461,315 | |
F11 | OPPENHEIMER STRATEGIC BOND FUND/ VA
STATEMENT OF INVESTMENTS Continued
| | | | | | | | | |
| | | Principal | | | | |
| | | Amount | | | Value | |
| |
Residential Continued | | | | | | | | |
| Residential Asset Securitization Trust 2005-A6CB, Mtg. Pass-Through Certificates, Series 2005-A6CB, Cl. A7, 6%, 6/1/35 | | $ | 6,096,850 | | | $ | 4,153,555 | |
Residential Funding Mortgage Securities I, Inc., Mtg. Pass-Through Certificates, 5.764%, 7/1/371,2 | | | 3,191,978 | | | | 414,319 | |
WaMu Asset-Backed Certificates 2005-AR12 Trust, Mtg. Asset-Backed Certificates, Series 2007-AR12, Cl. 1A8, 4.834%, 10/1/351 | | | 3,837,785 | | | | 2,808,274 | |
WaMu Mortgage Pass-Through Certificates 2003-AR9 Trust, Mtg. Pass-Through Certificates, Series 2003-AR9, Cl. 2A, 4.491%, 9/25/331 | | | 1,615,691 | | | | 1,393,290 | |
WaMu Mortgage Pass-Through Certificates 2005-AR14 Trust, Mtg. Pass-Through Certificates, Series 2005-AR14, Cl. 1A1, 5.048%, 12/1/351 | | | 4,112,750 | | | | 3,316,314 | |
WaMu Mortgage Pass-Through Certificates 2006-AR10 Trust, Mtg. Pass-Through Certificates, Series 2006-AR10, Cl. 1A2, 5.929%, 9/1/361 | | | 4,631,471 | | | | 3,933,647 | |
WaMu Mortgage Pass-Through Certificates 2006-AR12 Trust, Mtg. Pass-Through Certificates, Series 2006-AR12, Cl. 2A1, 5.75%, 10/25/361 | | | 4,787,396 | | | | 2,714,085 | |
WaMu Mortgage Pass-Through Certificates 2006-AR14 Trust, Mtg. Pass-Through Certificates, Series 2006-AR14, Cl. 2A4, 5.752%, 11/1/361,2 | | | 521,923 | | | | 130,481 | |
| WaMu Mortgage Pass-Through Certificates 2007-HY1 Trust, Mtg. Pass-Through Certificates: | | | | | | | | |
Series 2007-HY1, Cl. 4A1, 5.449%, 2/1/371 | | | 19,311,771 | | | | 11,536,240 | |
Series 2007-HY1, Cl. 5A1, 5.762%, 2/1/371 | | | 11,197,735 | | | | 6,998,897 | |
| WaMu Mortgage Pass-Through Certificates 2007-HY2 Trust, Mtg. Pass-Through Certificates: | | | | | | | | |
Series 2007-HY2, Cl. 1A1, 5.606%, 12/1/361 | | | 12,984,526 | | | | 6,462,853 | |
Series 2007-HY2, Cl. 1A2, 5.606%, 12/1/361,2 | | | 1,550,884 | | | | 248,141 | |
WaMu Mortgage Pass-Through Certificates 2007-HY3 Trust, Mtg. Pass-Through Certificates, Series 2007-HY3, Cl. 4A1, 5.347%, 3/1/371 | | | 12,491,694 | | | | 7,161,692 | |
WaMu Mortgage Pass-Through Certificates 2007-HY4 Trust, Mtg. Pass-Through Certificates, Series 2007-HY4, Cl. 4A1, 5.506%, 9/25/361 | | | 11,231,639 | | | | 7,877,913 | |
WaMu Mortgage Pass-Through Certificates 2007-HY6 Trust, Mtg. Pass-Through Certificates, Series 2007-HY6, Cl. 2A1, 5.688%, 6/25/371 | | | 5,796,955 | | | | 2,847,176 | |
WaMu Mortgage Pass-Through Certificates 2007-HY7 Trust, Mtg. Pass-Through Certificates, Series 2007-HY7, Cl. 2A1, 5.859%, 7/1/371 | | | 3,144,264 | | | | 1,673,951 | |
| Washington Mutual Mortgage Pass-Through Certificates, Mtg. Pass-Through Certificates, Series 2007-1, Cl. 1A8, 6%, 2/25/37 | | | 4,958,706 | | | | 4,338,196 | |
Wells Fargo Mortgage-Backed Securities 2004-EE Trust, Mtg. Pass-Through Certificates, Series 2004-EE, Cl. 3A1, 4.388%, 12/1/341 | | | 2,523,704 | | | | 1,967,235 | |
Wells Fargo Mortgage-Backed Securities 2004-R Trust, Mtg. Pass-Through Certificates, Series 2004-R, Cl. 2A1, 4.368%, 9/1/341 | | | 402,603 | | | | 288,219 | |
Wells Fargo Mortgage-Backed Securities 2005-AR12 Trust, Mtg. Pass-Through Certificates, Series 2005-AR12, Cl. 2A6, 4.359%, 7/1/351 | | | 2,190,422 | | | | 1,499,291 | |
Wells Fargo Mortgage-Backed Securities 2005-AR16 Trust, Mtg. Pass-Through Certificates, Series 2005-AR16, Cl. 2A1, 4.876%, 10/1/351 | | | 2,483,796 | | | | 1,668,342 | |
| Wells Fargo Mortgage-Backed Securities 2006-12 Trust, Mtg. Pass-Through Certificates, Series 2006-12, Cl. A1, 6%, 10/25/36 | | | 1,753,273 | | | | 1,605,292 | |
| Wells Fargo Mortgage-Backed Securities 2006-AR10 Trust, Mtg. Pass-Through Certificates: | | | | | | | | |
Series 2006-AR10, Cl. 2A2, 5.628%, 7/1/361,2 | | | 2,368,921 | | | | 592,230 | |
F12 | OPPENHEIMER STRATEGIC BOND FUND/ VA
| | | | | | | | | |
| | | Principal | | | | |
| | | Amount | | | Value | |
| |
Residential Continued | | | | | | | | |
| Wells Fargo Mortgage-Backed Securities 2006-AR10 Trust, Mtg. Pass-Through Certificates: Continued | | | | | | | | |
Series 2006-AR10, Cl. 3A2, 4.818%, 7/1/361,2 | | $ | 968,614 | | | $ | 242,154 | |
Series 2006-AR10, Cl. 4A2, 5.557%, 7/1/361,2 | | | 3,468,106 | | | | 867,026 | |
Series 2006-AR10, Cl. 5A3, 5.594%, 7/1/361 | | | 1,733,849 | | | | 988,251 | |
Series 2006-AR10, Cl. 5A6, 5.594%, 7/1/361 | | | 17,318,280 | | | | 9,551,293 | |
| Wells Fargo Mortgage-Backed Securities 2006-AR13 Trust, Mtg. Pass-Through Certificates: | | | | | | | | |
Series 2006-AR13, Cl. A2, 5.75%, 9/1/361 | | | 20,083,874 | | | | 13,537,395 | |
Series 2006-AR13, Cl. A4, 5.75%, 9/1/361 | | | 11,440,000 | | | | 6,149,967 | |
Wells Fargo Mortgage-Backed Securities 2006-AR8 Trust, Mtg. Pass-Through Certificates, Series 2006-AR8, Cl. 2A1, 5.24%, 4/1/361 | | | 2,666,235 | | | | 1,359,871 | |
| | | | | | | | |
| | | | | | | | 245,095,967 | |
| | | | | | | | |
| | | | | | | | | |
| Total Mortgage-Backed Obligations (Cost $1,137,444,785) | | | | | | | 950,433,420 | |
| | | | | | | | | |
U.S. Government Obligations—11.1% | | | | | | | | |
Federal Home Loan Bank Unsec. Bonds, 3.625%, 10/18/138 | | | 10,695,000 | | | | 11,263,407 | |
| Federal Home Loan Mortgage Corp. Unsec. Nts.: | | | | | | | | |
3.75%, 6/28/138 | | | 4,400,000 | | | | 4,690,418 | |
4.125%, 9/27/138 | | | 18,280,000 | | | | 19,718,471 | |
5.25%, 5/21/098 | | | 6,940,000 | | | | 7,068,064 | |
| Federal National Mortgage Assn. Sr. Unsec. Nts.: | | | | | | | | |
4.375%, 9/13/108 | | | 37,160,000 | | | | 39,243,487 | |
4.875%, 5/18/128 | | | 28,970,000 | | | | 31,572,201 | |
| Federal National Mortgage Assn. Unsec. Nts.: | | | | | | | | |
3.25%, 4/9/138 | | | 19,165,000 | | | | 19,989,842 | |
3.875%, 7/12/138 | | | 11,457,000 | | | | 12,170,783 | |
4.625%, 10/15/148,9 | | | 9,070,000 | | | | 10,083,600 | |
Resolution Funding Corp. Bonds, Residual Funding STRIPS, 5.155%, 1/15/2110 | | | 5,667,000 | | | | 3,572,397 | |
| U.S. Treasury Bonds: | | | | | | | | |
STRIPS, 4.201%, 2/15/1110 | | | 900,000 | | | | 885,758 | |
STRIPS, 4.808%, 2/15/1610 | | | 4,491,000 | | | | 3,726,313 | |
U.S. Treasury Inflationary Index Nts., 0.64%, 4/15/1311,12 | | | 222,620,000 | | | | 218,159,431 | |
| | | | | | | | |
| | | | | | | | | |
| Total U.S. Government Obligations (Cost $364,603,908) | | | | | | | 382,144,172 | |
| | | | | | | | | |
Foreign Government Obligations—22.7% | | | | | | | | |
Argentina—0.1% | | | | | | | | |
| Argentina (Republic of) Bonds: | | | | | | | | |
3.127%, 8/3/121 | | | 571,500 | | | | 307,969 | |
Series GDP, 1.626%, 12/15/351 | | | 8,600,000 | | | | 258,000 | |
| Series V, 7%, 3/28/11 | | | 2,320,000 | | | | 898,968 | |
| Series VII, 7%, 9/12/13 | | | 3,035,000 | | | | 975,499 | |
| | | | | | | | |
| | | | | | | | 2,440,436 | |
| | | | | | | | | |
Australia—0.1% | | | | | | | | |
| New South Wales Treasury Corp. Sr. Bonds, | | | | | | | | |
| Series 12RG, 6%, 5/1/12 | | 1,115,000 | AUD | | | 825,707 | |
| New South Wales Treasury Corp. Sr. Unsec. Bonds, Series 14RG, 5.50%, 8/1/14 | | 1,625,000 | AUD | | | 1,191,305 | |
| | | | | | | | |
| | | | | | | | 2,017,012 | |
| | | | | | | | | |
Belgium—0.1% | | | | | | | | |
| Belgium (Kingdom of) Bonds, Series 44, 5%, 3/28/35 | | 2,235,000 | EUR | | | 3,549,640 | |
| | | | | | | | | |
Brazil—2.7% | | | | | | | | |
Banco Nacional de Desenvolvimento Economico e Social Nts., 6.369%, 6/16/1813 | | | 5,340,000 | | | | 5,099,700 | |
| Brazil (Federal Republic of) Bonds: | | | | | | | | |
| 6%, 1/17/17 | | | 11,870,000 | | | | 12,315,125 | |
| 8%, 1/15/18 | | | 11,545,000 | | | | 12,988,125 | |
| 8.75%, 2/4/25 | | | 2,950,000 | | | | 3,643,250 | |
| 8.875%, 10/14/19 | | | 4,610,000 | | | | 5,647,250 | |
| 10.50%, 7/14/14 | | | 6,288,000 | | | | 7,922,880 | |
| Brazil (Federal Republic of) Nota Do Tesouro Nacional Nts.: | | | | | | | | |
| 10%, 1/10/10 | | 18,216,000 | BRR | | | 7,978,599 | |
| 10%, 1/1/12 | | 36,251,000 | BRR | | | 15,405,096 | |
| 10%, 1/1/17 | | 54,018,000 | BRR | | | 20,703,486 | |
| Brazil (Federal Republic of) Nts., 7.875%, 3/7/15 | | | 130,000 | | | | 148,200 | |
| | | | | | | | |
| | | | | | | | 91,851,711 | |
| | | | | | | | | |
Bulgaria—0.0% | | | | | | | | |
| Bulgaria (Republic of) Bonds: | | | | | | | | |
| 8.25%, 1/15/15 | | | 740,000 | | | | 725,200 | |
8.25%, 1/15/1513 | | | 710,000 | | | | 695,800 | |
| | | | | | | | |
| | | | | | | | 1,421,000 | |
| | | | | | | | | |
Canada—0.2% | | | | | | | | |
| Canada (Government of) Bonds: | | | | | | | | |
| 3.50%, 6/1/13 | | 2,380,000 | CAD | | | 2,105,264 | |
| 5%, 6/1/37 | | 2,500,000 | CAD | | | 2,627,599 | |
| Canada (Government of) Nts.: | | | | | | | | |
| 3.75%, 6/1/10 | | 1,785,000 | CAD | | | 1,524,094 | |
| 4.25%, 6/1/18 | | 1,090,000 | CAD | | | 1,011,209 | |
| | | | | | | | |
| | | | | | | | 7,268,166 | |
F13 | OPPENHEIMER STRATEGIC BOND FUND/ VA
STATEMENT OF INVESTMENTS Continued
| | | | | | | | | |
| | | Principal | | | | |
| | | Amount | | | Value | |
| |
Colombia—0.6% | | | | | | | | |
Bogota Distrio Capital Sr. Bonds, 9.75%, 7/26/2813 | | 3,058,000,000 | COP | | $ | 1,126,925 | |
| Colombia (Republic of) Bonds: | | | | | | | | |
| 7.375%, 9/18/37 | | | 3,805,000 | | | | 3,747,925 | |
| 10.75%, 1/15/13 | | | 750,000 | | | | 877,500 | |
| 12%, 10/22/15 | | 17,234,000,000 | COP | | | 8,437,500 | |
| Colombia (Republic of) Nts., 8.25%, 12/22/14 | | | 2,394,000 | | | | 2,591,505 | |
| Colombia (Republic of) Unsec. Nts., 7.375%, 1/27/17 | | | 960,000 | | | | 1,003,200 | |
EEB International Ltd. Sr. Unsec. Bonds, 8.75%, 10/31/1413 | | | 3,330,000 | | | | 3,105,225 | |
| | | | | | | | |
| | | | | | | | 20,889,780 | |
| | | | | | | | | |
Denmark—0.1% | | | | | | | | |
| Denmark (Kingdom of) Bonds, 5%, 11/15/13 | | 15,195,000 | DKK | | | 3,109,446 | |
| | | | | | | | | |
Egypt—0.2% | | | | | | | | |
| Egypt (The Arab Republic of) Treasury Bills: | | | | | | | | |
Series 182, 11.021%, 1/6/0910 | | 11,600,000 | EGP | | | 2,106,464 | |
Series 364, 8.371%, 1/6/0910 | | 9,800,000 | EGP | | | 1,778,173 | |
Egypt (The Arab Republic of) Unsec. Unsub. Bonds, 8.75%, 7/15/1213 | | 22,870,000 | EGP | | | 3,441,083 | |
| | | | | | | | |
| | | | | | | | 7,325,720 | |
| | | | | | | | | |
France—1.2% | | | | | | | | |
| France (Government of) Obligations Assimilables du Tresor Bonds, 4%, 10/25/38 | | 13,150,000 | EUR | | | 19,215,877 | |
| France (Government of) Treasury Nts.: | | | | | | | | |
| 3.75%, 1/12/13 | | 11,770,000 | EUR | | | 17,116,288 | |
| 4.50%, 7/12/12 | | 4,660,000 | EUR | | | 6,934,123 | |
| | | | | | | | |
| | | | | | | | 43,266,288 | |
| | | | | | | | | |
Germany—2.3% | | | | | | | | |
| Germany (Federal Republic of) Bonds: | | | | | | | | |
| 5.50%, 1/4/31 | | 7,260,000 | EUR | | | 12,631,450 | |
| Series 03, 3.75%, 7/4/13 | | 26,250,000 | EUR | | | 38,843,012 | |
| Series 05, 4%, 1/4/37 | | 18,125,000 | EUR | | | 27,190,410 | |
| | | | | | | | |
| | | | | | | | 78,664,872 | |
| | | | | | | | | |
Greece—0.2% | | | | | | | | |
| Greece (Republic of) Bonds, 4.60%, 5/20/13 | | 5,200,000 | EUR | | | 7,197,365 | |
| | | | | | | | | |
Hungary—0.3% | | | | | | | | |
| Hungary (Republic of) Bonds: | | | | | | | | |
| Series 12/C, 6%, 10/24/12 | | 1,609,000,000 | HUF | | | 7,650,463 | |
| Series 14/C, 5.50%, 2/12/14 | | 503,700,000 | HUF | | | 2,288,413 | |
| | | | | | | | |
| | | | | | | | 9,938,876 | |
| | | | | | | | | |
Indonesia—0.6% | | | | | | | | |
| Indonesia (Republic of) Nts.: | | | | | | | | |
6.75%, 3/10/1413 | | | 7,620,000 | | | | 6,819,900 | |
6.875%, 1/17/1813 | | | 4,490,000 | | | | 3,872,670 | |
7.25%, 4/20/1513 | | | 4,870,000 | | | | 4,358,650 | |
Indonesia (Republic of) Sr. Unsec. Nts., 7.75%, 1/17/3813 | | | 605,000 | | | | 505,175 | |
Indonesia (Republic of) Unsec. Nts., 8.50%, 10/12/3513 | | | 6,700,000 | | | | 5,728,500 | |
| | | | | | | | |
| | | | | | | | 21,284,895 | |
| | | | | | | | | |
Israel—0.4% | | | | | | | | |
| Israel (State of) Bonds: | | | | | | | | |
| 5.50%, 2/28/17 | | 24,370,000 | ILS | | | 7,072,458 | |
| Series 2682, 7.50%, 3/31/14 | | 25,080,000 | ILS | | | 7,780,692 | |
| | | | | | | | |
| | | | | | | | 14,853,150 | |
| | | | | | | | | |
Italy—0.3% | | | | | | | | |
Italy (Republic of) Nts., Certificati di Credito del Tesoro, 4.70%, 7/1/091 | | 6,945,000 | EUR | | | 9,702,991 | |
| | | | | | | | | |
Japan—4.6% | | | | | | | | |
| Japan (Government of) Bonds: | | | | | | | | |
| 2 yr., Series 269, 0.90%, 6/15/10 | | 4,006,000,000 | JPY | | | 44,507,027 | |
| 5 yr., Series 72, 1.50%, 6/20/13 | | 4,596,000,000 | JPY | | | 52,556,111 | |
| 10 yr., Series 279, 2%, 3/20/16 | | 748,000,000 | JPY | | | 8,970,091 | |
| 10 yr., Series 282, 1.70%, 9/20/16 | | 2,095,000,000 | JPY | | | 24,431,814 | |
| 20 yr., Series 61, 1%, 3/20/23 | | 1,245,000,000 | JPY | | | 12,771,039 | |
| 20 yr., Series 73, 2%, 12/20/24 | | 933,000,000 | JPY | | | 10,827,750 | |
| 20 yr., Series 75, 2.10%, 3/20/25 | | 520,000,000 | JPY | | | 6,112,312 | |
| | | | | | | | |
| | | | | | | | 160,176,144 | |
| | | | | | | | | |
Malaysia—0.1% | | | | | | | | |
Johor Corp. Malaysia (Government of) Bonds, Series P3, 1%, 7/31/122 | | 7,980,000 | MYR | | | 2,350,787 | |
| | | | | | | | | |
Mexico—1.6% | | | | | | | | |
| United Mexican States Bonds: | | | | | | | | |
| 8.375%, 1/14/11 | | | 11,650,000 | | | | 12,640,250 | |
| Series A, 6.375%, 1/16/13 | | | 3,800,000 | | | | 4,009,000 | |
| Series MI10, 8%, 12/19/13 | | 126,490,000 | MXN | | | 9,307,110 | |
Series M20, 10%, 12/5/241 | | 125,300,000 | MXN | | | 10,540,263 | |
United Mexican States Treasury Bills, Series BI, 8.15%, 4/2/0910 | | 255,600,000 | MXN | | | 18,264,107 | |
| | | | | | | | |
| | | | | | | | 54,760,730 | |
| | | | | | | | | |
Nigeria—0.6% | | | | | | | | |
| Nigeria (Federal Republic of) Promissory Nts., Series RC, 5.092%, 1/5/10 | | | 61,631 | | | | 57,601 | |
| Nigeria (Federal Republic of) Treasury Bills: | | | | | | | | |
Series 364, 9.186%, 1/8/0910 | | 773,700,000 | NGN | | | 5,538,296 | |
F14 | OPPENHEIMER STRATEGIC BOND FUND/ VA
| | | | | | | | | |
| | | Principal | | | | |
| | | Amount | | | Value | |
| |
Nigeria Continued | | | | | | | | |
| Nigeria (Federal Republic of) Treasury Bills: Continued | | | | | | | | |
Series 364, 9.17%, 2/5/0910 | | $605,400,000 | NGN | | $ | 4,331,405 | |
Series 364, 9.30%, 4/9/0910 | | 175,100,000 | NGN | | | 1,240,866 | |
| Nigeria (Federal Republic of) Treasury Bonds: | | | | | | | | |
| Series 3 yr., 9.23%, 5/25/12 | | 278,300,000 | NGN | | | 1,885,547 | |
| Series 3Y2S, 12.50%, 2/24/09 | | 60,500,000 | NGN | | | 437,402 | |
| Series 3Y1S, 15%, 1/27/09 | | 116,700,000 | NGN | | | 839,538 | |
| Series 5 yr., 9.50%, 2/23/12 | | 278,300,000 | NGN | | | 1,892,520 | |
| Series 10 yr., 9.35%, 8/31/17 | | 600,000,000 | NGN | | | 3,697,924 | |
| | | | | | | | |
| | | | | | | | 19,921,099 | |
| | | | | | | | | |
Norway—0.0% | | | | | | | | |
| Norway (Kingdom of) Bonds, 6.50%, 5/15/13 | | 8,165,000 | NOK | | | 1,331,058 | |
Panama—0.5% | | | | | | | | |
| Panama (Republic of) Bonds: | | | | | | | | |
| 6.70%, 1/26/36 | | | 7,190,000 | | | | 6,506,950 | |
| 7.25%, 3/15/15 | | | 6,230,000 | | | | 6,385,750 | |
| 8.875%, 9/30/27 | | | 1,375,000 | | | | 1,409,375 | |
| 9.375%, 4/1/29 | | | 655,000 | | | | 723,775 | |
| Panama (Republic of) Unsec. Bonds, 7.125%, 1/29/26 | | | 2,760,000 | | | | 2,615,100 | |
| | | | | | | | |
| | | | | | | | 17,640,950 | |
| | | | | | | | | |
Peru—1.5% | | | | | | | | |
| Peru (Republic of) Bonds: | | | | | | | | |
| 7.84%, 8/12/20 | | 28,080,000 | PEN | | | 9,108,598 | |
| 9.91%, 5/5/15 | | 10,351,000 | PEN | | | 3,711,566 | |
| Series 7, 8.60%, 8/12/17 | | 27,250,000 | PEN | | | 9,280,214 | |
| Series 8-1, 12.25%, 8/10/11 | | 52,015,000 | PEN | | | 18,627,991 | |
| Peru (Republic of) Certificates of Deposit: | | | | | | | | |
4.066%, 4/13/0910 | | 604,000 | PEN | | | 188,061 | |
5.713%, 1/5/0910 | | 28,800,000 | PEN | | | 9,174,562 | |
Peru (Republic of) Sr. Nts., 4.533%, 2/28/1610 | | | 363,871 | | | | 245,358 | |
| | | | | | | | |
| | | | | | | | 50,336,350 | |
| | | | | | | | | |
Philippines—0.2% | | | | | | | | |
| Philippines (Republic of the) Unsec. Bonds: | | | | | | | | |
| 7.75%, 1/14/31 | | | 510,000 | | | | 517,650 | |
| 9%, 2/15/13 | | | 7,625,000 | | | | 8,120,625 | |
| | | | | | | | |
| | | | | | | | 8,638,275 | |
| | | | | | | | | |
Poland—0.1% | | | | | | | | |
| Poland (Republic of) Bonds: | | | | | | | | |
| Series WS0922, 5.75%, 9/23/22 | | 1,000,000 | PLZ | | | 346,169 | |
| Series 0413, 5.25%, 4/25/13 | | 11,430,000 | PLZ | | | 3,847,593 | |
| | | | | | | | |
| | | | | | | | 4,193,762 | |
| | | | | | | | | |
Sweden—0.1% | | | | | | | | |
| Sweden (Kingdom of) Bonds, | | | | | | | | |
| Series 1049, 4.50%, 8/12/15 | | 24,395,000 | SEK | | | 3,554,911 | |
Turkey—2.8% | | | | | | | | |
| Turkey (Republic of) Bonds: | | | | | | | | |
| 6.75%, 4/3/18 | | | 10,035,000 | | | | 9,583,425 | |
| 7%, 9/26/16 | | | 6,560,000 | | | | 6,428,800 | |
| 7%, 3/11/19 | | | 1,285,000 | | | | 1,249,444 | |
14%, 1/19/111 | | 15,250,000 | TRY | | | 9,406,889 | |
15.861%, 10/7/0910 | | 18,240,000 | TRY | | | 10,518,459 | |
15.935%, 6/23/1010 | | 6,200,000 | TRY | | | 3,206,251 | |
16%, 3/7/121 | | 50,110,000 | TRY | | | 31,959,153 | |
18.141%, 1/13/1010 | | 28,520,000 | TRY | | | 15,797,692 | |
Series CPI, 10%, 2/15/121 | | 6,810,000 | TRY | | | 4,830,691 | |
Series CPI, 12%, 8/14/131 | | 1,455,000 | TRY | | | 872,165 | |
| Turkey (Republic of) Nts., 7.25%, 3/15/15 | | | 4,115,000 | | | | 4,115,000 | |
| | | | | | | | |
| | | | | | | | 97,967,969 | |
| | | | | | | | | |
United Kingdom—0.6% | | | | | | | | |
| United Kingdom Gilt Bonds: | | | | | | | | |
| 4.75%, 6/7/10 | | 2,675,000 | GBP | | | 4,106,745 | |
| 5%, 3/7/12 | | 2,440,000 | GBP | | | 3,859,454 | |
| United Kingdom Treasury Bonds: | | | | | | | | |
| 4.75%, 12/7/38 | | 5,215,000 | GBP | | | 9,046,592 | |
| 5%, 3/7/18 | | 2,605,000 | GBP | | | 4,399,393 | |
| | | | | | | | |
| | | | | | | | 21,412,184 | |
| | | | | | | | | |
Uruguay—0.4% | | | | | | | | |
| Uruguay (Oriental Republic of) Bonds: | | | | | | | | |
| 4.25%, 4/5/27 | | 48,300,000 | UYU | | | 1,118,340 | |
| 7.625%, 3/21/36 | | | 3,525,000 | | | | 2,978,625 | |
| Uruguay (Oriental Republic of) Unsec. Bonds: | | | | | | | | |
| 5%, 9/14/18 | | 54,110,000 | UYU | | | 1,771,167 | |
| 8%, 11/18/22 | | | 7,030,000 | | | | 6,537,900 | |
| | | | | | | | |
| | | | | | | | 12,406,032 | |
| | | | | | | | | |
Venezuela—0.2% | | | | | | | | |
| Venezuela (Republic of) Bonds, 9%, 5/7/23 | | | 3,495,000 | | | | 1,502,850 | |
| Venezuela (Republic of) Nts., 10.75%, 9/19/13 | | | 2,385,000 | | | | 1,574,100 | |
| Venezuela (Republic of) Unsec. Bonds, 7.65%, 4/21/25 | | | 7,445,000 | | | | 3,043,144 | |
| | | | | | | | |
| | | | | | | | 6,120,094 | |
| | | | | | | | |
| | | | | | | | | |
| Total Foreign Government Obligations (Cost $815,484,092) | | | | | | | 785,591,693 | |
| | | | | | | | | |
Loan Participations—1.3% | | | | | | | | |
Bayerische Hypo-und Vereinsbank AG for the City of Kiev, Ukraine, 8.625% Nts., 7/15/1113 | | | 8,210,000 | | | | 3,284,000 | |
F15 | OPPENHEIMER STRATEGIC BOND FUND/ VA
STATEMENT OF INVESTMENTS Continued
| | | | | | | | | |
| | | Principal | | | | |
| | | Amount | | | Value | |
| |
Loan Participations Continued | | | | | | | | |
Credit Suisse First Boston International, Export-Import Bank of Ukraine, 8.40% Sec. Nts., 2/9/162 | | $ | 4,340,000 | | | $ | 781,200 | |
| Dali Capital plc/Bank of Moscow, 7.25% Sec. Nts., Series 28, Tranche 1, 11/25/09 | | 37,000,000 | RUR | | | 817,819 | |
| Dali Capital SA (ROSBANK), 8% Sec. Nts., Series 23, Tranche 1, 9/30/09 | | 36,400,000 | RUR | | | 866,446 | |
| Gaz Capital SA: | | | | | | | | |
7.288% Sr. Sec. Nts., 8/16/3713 | | | 13,510,000 | | | | 7,970,900 | |
7.51% Sr. Sec. Nts., 7/31/1313 | | | 5,970,000 | | | | 4,537,200 | |
8.625% Sr. Sec. Nts., 4/28/3413 | | | 3,590,000 | | | | 2,692,500 | |
RSHB Capital SA/OJSC Russian Agricultural Bank, 7.75% Nts., 5/29/1813 | | | 2,010,000 | | | | 1,306,500 | |
Steel Capital SA for OAO Severstal, 9.75% Sec. Nts., 7/29/1313 | | | 5,310,000 | | | | 2,840,850 | |
TransCapitalInvest Ltd. for OJSC AK Transneft, 5.67% Sec. Bonds, 3/5/142,7 | | | 1,070,000 | | | | 693,681 | |
VIP Finance Ireland Ltd., 9.125% Bonds, 4/30/1813 | | | 6,680,000 | | | | 3,640,600 | |
| VTB Capital SA: | | | | | | | | |
| 6.315% Sub. Unsec. Nts., 2/4/15 | | | 16,280,000 | | | | 10,300,421 | |
6.875% Sr. Sec. Nts., 5/29/1813 | | | 6,940,000 | | | | 4,580,400 | |
| | | | | | | | |
| | | | | | | | | |
| Total Loan Participations (Cost $75,307,101) | | | | | | | 44,312,517 | |
| | | | | | | | | |
Corporate Bonds and Notes—15.0% | | | | | | | | |
AAC Group Holding Corp., 0%/10.25% Sr. Unsec. Nts., 10/1/1214 | | | 100,000 | | | | 66,500 | |
AES Dominicana Energia Finance SA, 11% Sr. Nts., 12/13/1513 | | | 1,245,000 | | | | 491,775 | |
AES Panama SA, 6.35% Sr. Nts., 12/21/1613 | | | 615,000 | | | | 493,936 | |
| Albertson’s, Inc., 8% Sr. Unsec. Debs., 5/1/31 | | | 4,210,000 | | | | 2,547,050 | |
| Alcoa, Inc., 6.75% Sr. Unsec. Unsub. Nts., 7/15/18 | | | 2,060,000 | | | | 1,688,131 | |
| Allbritton Communications Co., 7.75% Sr. Unsec. Sub. Nts., 12/15/12 | | | 890,000 | | | | 441,663 | |
| Allied Waste North America, Inc., 7.375% Sr. Sec. Nts., Series B, 4/15/14 | | | 3,070,000 | | | | 2,904,251 | |
| Allstate Life Global Funding Trust, 5.375% Nts., 4/30/13 | | | 206,000 | | | | 202,979 | |
Alrosa Finance SA, 8.875% Nts., 11/17/1413 | | | 13,025,000 | | | | 7,880,125 | |
AmBev International Finance Co. Ltd., 9.50% Bonds, 7/24/1713 | | 4,470,000 | BRR | | | 1,390,538 | |
| AMC Entertainment, Inc., 8% Sr. Unsec. Sub. Nts., 3/1/14 | | | 895,000 | | | | 554,900 | |
| America Movil SAB de CV, 8.46% Sr. Unsec. Unsub. Bonds, 12/18/36 | | 52,700,000 | MXN | | | 2,891,301 | |
| American Express Credit Corp., 5.875% Sr. Unsec. Nts., 5/2/13 | | | 661,000 | | | | 635,136 | |
American International Group, Inc., 8.25% Sr. Nts., 8/15/1813 | | | 500,000 | | | | 366,500 | |
| American Media Operations, Inc.: | | | | | | | | |
8.875% Sr. Unsec. Sub. Nts., 1/15/112 | | | 5,454 | | | | 1,309 | |
| 8.875% Sr. Unsec. Sub. Nts., 1/15/11 | | | 145,000 | | | | 29,906 | |
| American Tower Corp., 7.50% Sr. Nts., 5/1/12 | | | 1,715,000 | | | | 1,697,850 | |
| Anheuser-Busch Cos., Inc., 5.50% Nts., 1/15/18 | | | 1,321,000 | | | | 1,202,802 | |
| AT&T Wireless Services, Inc., 8.125% Sr. Unsec. Nts., 5/1/12 | | | 1,747,000 | | | | 1,874,791 | |
Atlas Energy Resources LLC, 10.75% Sr. Nts., 2/1/1813 | | | 3,870,000 | | | | 2,380,050 | |
| Atlas Pipeline Partners LP, 8.125% Sr. Unsec. Nts., 12/15/15 | | | 2,530,000 | | | | 1,720,400 | |
Autopistas del Nordeste Cayman Ltd., 9.39% Nts., 1/15/2613 | | | 4,551,750 | | | | 1,957,253 | |
| Avis Budget Car Rental LLC, 7.625% Sr. Unsec. Unsub. Nts., 5/15/14 | | | 7,055,000 | | | | 2,081,225 | |
| BA Covered Bond Issuer, 4.25% Sec. Nts., 4/5/17 | | 2,520,000 | EUR | | | 3,345,512 | |
| Banco Bilbao Vizcaya Argentaria SA, 4.25% Sec. Bonds, 7/15/14 | | 1,895,000 | EUR | | | 2,663,964 | |
Banco BMG SA, 9.15% Nts., 1/15/1613 | | | 3,520,000 | | | | 2,129,600 | |
Banco de Credito del Peru, 6.95% Sub. Nts., 11/7/211,13 | | | 1,345,000 | | | | 1,143,250 | |
Banco Hipotecario SA, 9.75% Sr. Unsec. Nts., 4/27/1613 | | | 1,585,000 | | | | 499,275 | |
Banco Invex SA, 26.951% Mtg.-Backed Certificates, Series 062U, 3/13/341,12 | | 4,830,734 | MXN | | | 1,281,755 | |
| Bank of America Corp.: | | | | | | | | |
| 4.90% Sr. Unsec. Nts., 5/1/13 | | | 2,750,000 | | | | 2,726,504 | |
F16 | OPPENHEIMER STRATEGIC BOND FUND/ VA
| | | | | | | | | |
| | | Principal | | | | |
| | | Amount | | | Value | |
| |
Corporate Bonds and Notes Continued | | | | | | | | |
8% Unsec. Perpetual Bonds, Series K15 | | $ | 3,875,000 | | | $ | 2,791,240 | |
8.125% Perpetual Bonds, Series M15 | | | 2,470,000 | | | | 1,850,648 | |
| Bank of Scotland plc: | | | | | | | | |
| 4.375% Sr. Sec. Nts., 7/13/16 | | 8,545,000 | EUR | | | 11,250,937 | |
| 4.50% Sr. Sec. Nts., 7/13/21 | | 4,784,000 | EUR | | | 5,975,545 | |
Barclays Bank plc, 6.278% Perpetual Bonds15 | | | 12,320,000 | | | | 7,131,678 | |
Bausch & Lomb, Inc., 9.875% Sr. Unsec. Nts., 11/1/1513 | | | 1,095,000 | | | | 823,988 | |
| BE Aerospace, Inc., 8.50% Sr. Unsec. Nts., 7/1/18 | | | 950,000 | | | | 857,375 | |
| BellSouth Corp., 5.20% Sr. Unsec. Nts., 12/15/16 | | | 1,488,000 | | | | 1,429,480 | |
| Berry Petroleum Co., 8.25% Sr. Sub. Nts., 11/1/16 | | | 905,000 | | | | 493,225 | |
| Berry Plastics Holding Corp., 8.875% Sr. Sec. Nts., 9/15/14 | | | 4,905,000 | | | | 2,158,200 | |
| Biomet, Inc., 10% Sr. Unsec. Bonds, 10/15/17 | | | 895,000 | | | | 863,675 | |
Braskem Finance Ltd., 7.25% Sr. Unsec. Nts., 6/5/1813 | | | 5,350,000 | | | | 3,825,250 | |
C10 Capital SPV Ltd., 6.722% Unsec. Perpetual Debs.13,15 | | | 3,070,000 | | | | 1,463,414 | |
| Case New Holland, Inc., 7.125% Sr. Unsec. Nts., 3/1/14 | | | 5,910,000 | | | | 4,225,650 | |
Catalent Pharma Solutions, Inc., 9.50% Sr. Unsec. Nts., 4/15/1516 | | | 4,045,000 | | | | 1,557,325 | |
| Caterpillar Financial Services Corp., 5.45% Sr. Unsec. Nts., 4/15/18 | | | 2,750,000 | | | | 2,579,363 | |
| CBS Corp., 5.625% Sr. Unsec. Nts., 8/15/12 | | | 1,486,000 | | | | 1,223,942 | |
| CCH I LLC/CCH I Capital Corp., 11% Sr. Sec. Nts., 10/1/15 | | | 3,955,000 | | | | 711,900 | |
CCM Merger, Inc., 8% Unsec. Nts., 8/1/1313 | | | 1,335,000 | | | | 694,200 | |
| Centex Corp., 5.80% Sr. Unsec. Nts., 9/15/09 | | | 2,410,000 | | | | 2,301,550 | |
Cinemark, Inc., 0%/9.75% Sr. Unsec. Nts., 3/15/1414 | | | 2,110,000 | | | | 1,717,013 | |
| CIT Group, Inc., 7.625% Sr. Unsec. Nts., Series A, 11/30/12 | | | 967,000 | | | | 816,964 | |
| Citigroup, Inc.: | | | | | | | | |
| 5.50% Sr. Unsec. Nts., 4/11/13 | | | 6,884,000 | | | | 6,709,105 | |
| 6.50% Sr. Nts., 8/19/13 | | | 2,753,000 | | | | 2,780,756 | |
8.40% Perpetual Bonds, Series E15 | | | 6,895,000 | | | | 4,561,318 | |
| Citizens Communications Co., 6.25% Sr. Nts., 1/15/13 | | | 5,040,000 | | | | 4,309,200 | |
| Claire’s Stores, Inc., 10.50% Sr. Unsec. Sub. Nts., 6/1/17 | | | 10,715,000 | | | | 1,875,125 | |
Cloverie plc, 5.775% Sec. Nts., Series 2005-93, 12/20/101,2 | | | 1,100,000 | | | | 703,230 | |
| Comcast Corp., 5.70% Unsec. Unsub. Nts., 5/15/18 | | | 3,302,000 | | | | 3,102,123 | |
| Community Health Systems, Inc., 8.875% Sr. Unsec. Nts., 7/15/15 | | | 2,025,000 | | | | 1,873,125 | |
Copano Energy LLC/Copano Energy Finance Corp., 7.75% Sr. Nts., 6/1/1813 | | | 2,705,000 | | | | 1,839,400 | |
| Coriolanus Ltd.: | | | | | | | | |
3.359% Pass-Through Sec. Nts., 12/31/172,10 | | 23,130,000 | BRR | | | 6,865,548 | |
| 10.62% Sec. Nts., 8/10/102 | | | 3,300,000 | | | | 216,150 | |
| Cox Communications, Inc., 4.625% Unsec. Nts., 1/15/10 | | | 593,000 | | | | 573,936 | |
| Credit Suisse New York, 5% Sr. Unsec. Nts., 5/15/13 | | | 2,754,000 | | | | 2,653,085 | |
| Crown Americas, Inc., 7.75% Sr. Nts., 11/15/15 | | | 2,740,000 | | | | 2,740,000 | |
| CSC Holdings, Inc., 7.625% Sr. Unsec. Unsub. Nts., Series B, 4/1/11 | | | 1,265,000 | | | | 1,198,588 | |
| CSX Corp., 6.25% Sr. Unsec. Unsub. Nts., 4/1/15 | | | 1,376,000 | | | | 1,352,414 | |
| DaVita, Inc., 6.625% Sr. Unsec. Nts., 3/15/13 | | | 2,160,000 | | | | 2,062,800 | |
| Delhaize America, Inc., 9% Unsub. Debs., 4/15/31 | | | 3,395,000 | | | | 3,441,705 | |
| Denbury Resources, Inc., 7.50% Sr. Sub. Nts., 12/15/15 | | | 3,560,000 | | | | 2,545,400 | |
| Depfa ACS Bank, 3.875% Sec. Nts., 11/14/16 | | 485,000 | EUR | | | 583,078 | |
| DJO Finance LLC/DJO Finance Corp., 10.875% Sr. Unsec. Nts., 11/15/14 | | | 2,415,000 | | | | 1,750,875 | |
| Dole Food Co., Inc.: | | | | | | | | |
| 7.25% Sr. Unsec. Nts., 6/15/10 | | | 100,000 | | | | 70,250 | |
| 8.625% Sr. Nts., 5/1/09 | | | 306,000 | | | | 278,460 | |
| 8.875% Sr. Unsec. Nts., 3/15/11 | | | 71,000 | | | | 44,730 | |
| E.I. du Pont de Nemours & Co., 6% Sr. Unsec. Unsub. Nts., 7/15/18 | | | 897,000 | | | | 943,818 | |
| EchoStar DBS Corp., 6.375% Sr. Unsec. Nts., 10/1/11 | | | 2,795,000 | | | | 2,606,338 | |
F17 | OPPENHEIMER STRATEGIC BOND FUND/ VA
STATEMENT OF INVESTMENTS Continued
| | | | | | | | | |
| | | Principal | | | | |
| | | Amount | | | Value | |
| |
Corporate Bonds and Notes Continued | | | | | | | | |
| Eirles Two Ltd.: | | | | | | | | |
5.13% Sec. Nts., Series 335, 4/30/121,2 | | $ | 6,300,000 | | | $ | 2,197,440 | |
7.379% Sec. Nts., Series 324, 4/30/121,2 | | | 4,100,000 | | | | 1,593,260 | |
Eletropaulo Metropolitana SA, 19.125% Nts., 6/28/1013 | | 1,115,000 | BRR | | | 487,767 | |
| Elizabeth Arden, Inc., 7.75% Sr. Unsec. Sub. Nts., 1/15/14 | | | 2,370,000 | | | | 1,552,350 | |
Enterprise Products Operating LP, 8.375% Jr. Sub. Nts., 8/1/661 | | | 7,465,000 | | | | 4,110,438 | |
Exodus Communications, Inc., 10.75% Sr. Nts., 12/15/092,3,4 | | 337,947 | EUR | | | — | |
| FairPoint Communications, Inc., 13.125% Sr. Nts., 4/1/18 | | | 5,015,000 | | | | 2,432,275 | |
Ferrellgas Partners LP, 6.75% Sr. Nts., 5/1/1413 | | | 600,000 | | | | 417,000 | |
| Forest Oil Corp., 7.75% Sr. Nts., 5/1/14 | | | 605,000 | | | | 511,225 | |
| Freeport-McMoRan Copper & Gold, Inc., 8.375% Sr. Nts., 4/1/17 | | | 6,274,000 | | | | 5,151,807 | |
| Fresenius Medical Care Capital Trust IV, 7.875% Sr. Sub. Nts., 6/15/11 | | | 885,000 | | | | 845,175 | |
| GameStop Corp., 8% Sr. Unsec. Nts., 10/1/12 | | | 1,870,000 | | | | 1,748,450 | |
Gaz Capital SA, 8.146% Sr. Sec. Nts., 4/11/1813 | | | 3,220,000 | | | | 2,125,200 | |
Gazprom International SA, 7.201% Unsec. Unsub. Bonds, 2/1/2013 | | | 1,851,520 | | | | 1,360,867 | |
| General Electric Capital Corp., 5.40% Sr. Unsec. Nts., Series A, 9/20/13 | | | 2,755,000 | | | | 2,761,810 | |
| General Mills, Inc., 5.25% Sr. Unsec. Nts., 8/15/13 | | | 550,000 | | | | 553,876 | |
| General Motors Acceptance Corp., 8% Bonds, 11/1/31 | | | 8,220,000 | | | | 4,818,243 | |
| GlaxosmithKline Capital, Inc., 6.375% Sr. Unsec. Nts., 5/15/38 | | | 413,000 | | | | 468,271 | |
| Goldman Sachs Capital, Inc. (The), 6.345% Sub. Bonds, 2/15/34 | | | 5,345,000 | | | | 3,888,739 | |
| Goldman Sachs Group, Inc. (The), 6.15% Sr. Unsec. Nts., 4/1/18 | | | 5,492,000 | | | | 5,286,720 | |
| Goodyear Tire & Rubber Co. (The): | | | | | | | | |
| 7.857% Nts., 8/15/11 | | | 1,290,000 | | | | 1,077,150 | |
| 9% Sr. Unsec. Nts., 7/1/15 | | | 845,000 | | | | 684,450 | |
| Graham Packaging Co., Inc., 9.875% Sr. Unsec. Sub. Nts., 10/15/14 | | | 3,045,000 | | | | 1,887,900 | |
| Graphic Packaging International Corp., 8.50% Sr. Nts., 8/15/11 | | | 3,045,000 | | | | 2,557,800 | |
Greektown Holdings, Inc., 10.75% Sr. Nts., 12/1/133,4,13 | | | 2,510,000 | | | | 602,400 | |
GTL Trade Finance, Inc., 7.25% Sr. Unsec. Nts., 10/20/1713 | | | 5,620,000 | | | | 4,721,609 | |
Harrah’s Operating Co., Inc., 10.75% Sr. Unsec. Nts., 2/1/1613 | | | 5,845,000 | | | | 1,695,050 | |
HBOS plc, 6.413% Sub. Perpetual Bonds, Series A13,15 | | | 14,615,000 | | | | 5,677,431 | |
| HCA, Inc.: | | | | | | | | |
| 6.375% Nts., 1/15/15 | | | 4,670,000 | | | | 2,872,050 | |
| 9.25% Sr. Sec. Nts., 11/15/16 | | | 1,230,000 | | | | 1,131,600 | |
| HealthSouth Corp., 10.75% Sr. Unsec. Nts., 6/15/16 | | | 1,785,000 | | | | 1,646,663 | |
Helix Energy Solutions Group, Inc., 9.50% Sr. Unsec. Nts., 1/15/1613 | | | 3,380,000 | | | | 1,808,300 | |
| Hertz Corp.: | | | | | | | | |
| 8.875% Sr. Unsec. Nts., 1/1/14 | | | 610,000 | | | | 378,200 | |
| 10.50% Sr. Unsec. Sub. Nts., 1/1/16 | | | 1,135,000 | | | | 523,519 | |
| Home Depot, Inc. (The), 5.875% Sr. Unsec. Unsub. Nts., 12/16/36 | | | 2,203,000 | | | | 1,732,532 | |
| HSBC Bank plc: | | | | | | | | |
11.601% Sr. Unsec. Nts., 1/12/1010 | | | 2,510,000 | | | | 1,959,306 | |
12.278% Sr. Unsec. Nts., 3/9/0910 | | | 1,960,000 | | | | 1,786,736 | |
9.751% Sr. Unsec. Nts., 7/8/0910 | | | 1,960,000 | | | | 1,777,720 | |
HSBC Finance Capital Trust IX, 5.911% Nts., 11/30/351 | | | 12,600,000 | | | | 5,277,787 | |
| HSBK Europe BV: | | | | | | | | |
7.25% Unsec. Unsub. Nts., 5/3/1713 | | | 1,360,000 | | | | 741,200 | |
9.25% Sr. Nts., 10/16/1313 | | | 15,930,000 | | | | 11,708,550 | |
ICICI Bank Ltd., 6.375% Bonds, 4/30/221,13 | | | 6,960,000 | | | | 3,664,530 | |
| Idearc, Inc., 8% Sr. Unsec. Nts., 11/15/16 | | | 2,770,000 | | | | 221,600 | |
IIRSA Norte Finance Ltd., 8.75% Sr. Nts., 5/30/2413 | | | 8,340,652 | | | | 6,046,973 | |
| Inter-American Development Bank: | | | | | | | | |
6.26% Nts., 12/8/091 | | 920,000 | BRR | | | 371,657 | |
11.108% Nts., 1/25/121 | | 618,500,012 | COP | | | 268,140 | |
| International Business Machines Corp. (IBM), 8% Sr. Unsec. Unsub. Nts., 10/15/38 | | | 4,136,000 | | | | 5,524,559 | |
| International Paper Co., 7.40% Sr. Unsec. Nts., 6/15/14 | | | 1,485,000 | | | | 1,218,552 | |
| Iron Mountain, Inc., 8.625% Sr. Unsec. Sub. Nts., 4/1/13 | | | 1,765,000 | | | | 1,667,925 | |
| ISA Capital do Brasil SA: | | | | | | | | |
7.875% Sr. Nts., 1/30/1213 | | | 510,000 | | | | 484,500 | |
8.80% Sr. Nts., 1/30/1713 | | | 1,410,000 | | | | 1,247,850 | |
F18 | OPPENHEIMER STRATEGIC BOND FUND/ VA
| | | | | | | | | |
| | | Principal | | | | |
| | | Amount | | | Value | |
| |
Corporate Bonds and Notes Continued | | | | | | | | |
| Isle of Capri Casinos, Inc., 7% Sr. Unsec. Sub. Nts., 3/1/14 | | $ | 7,270,000 | | | $ | 3,126,100 | |
| Ispat Inland ULC, 9.75% Sr. Sec. Nts., 4/1/14 | | | 2,570,000 | | | | 2,199,827 | |
Israel Electric Corp. Ltd., 7.25% Nts., 1/15/1913 | | | 8,015,000 | | | | 7,488,102 | |
iStar Financial, Inc., 2.471% Sr. Unsec. Nts., 3/16/091 | | | 1,595,000 | | | | 1,150,394 | |
| Jarden Corp., 7.50% Sr. Unsec. Sub. Nts., 5/1/17 | | | 2,300,000 | | | | 1,581,250 | |
| Johnson & Johnson, 5.85% Sr. Unsec. Nts., 7/15/38 | | | 1,495,000 | | | | 1,813,130 | |
| JPMorgan Chase & Co.: | | | | | | | | |
| 6.40% Sr. Unsec. Nts., 5/15/38 | | | 5,500,000 | | | | 6,529,771 | |
7.90% Perpetual Bonds, Series 115 | | | 6,780,000 | | | | 5,654,696 | |
| JPMorgan Hipotecaria su Casita: | | | | | | | | |
6.47% Sec. Nts., 8/26/352 | | 5,923,219 | MXN | | | 362,431 | |
24.791% Mtg.-Backed Certificates, Series 06U, 9/25/351 | | 2,661,229 | MXN | | | 557,259 | |
JSC Astana Finance, 9.16% Nts., 3/14/122 | | | 7,200,000 | | | | 3,333,547 | |
| K. Hovnanian Enterprises, Inc.: | | | | | | | | |
| 7.75% Sr. Unsec. Sub. Nts., 5/15/13 | | | 410,000 | | | | 92,250 | |
| 8.875% Sr. Sub. Nts., 4/1/12 | | | 975,000 | | | | 287,625 | |
Kazmunaigaz Finance Sub BV, 9.125% Nts., 7/2/1813 | | | 14,880,000 | | | | 9,746,400 | |
| Key Energy Services, Inc., 8.375% Sr. Unsec. Nts., 12/1/14 | | | 2,060,000 | | | | 1,369,900 | |
| Kinder Morgan Energy Partners LP, 7.30% Sr. Unsec. Nts., 8/15/33 | | | 1,166,000 | | | | 970,338 | |
| Kraft Foods, Inc., 6.125% Sr. Unsec. Nts., 8/23/18 | | | 256,000 | | | | 252,837 | |
| L-3 Communications Corp.: | | | | | | | | |
| 5.875% Sr. Sub. Nts., 1/15/15 | | | 2,905,000 | | | | 2,629,025 | |
| 6.375% Sr. Unsec. Sub. Nts., Series B, 10/15/15 | | | 1,185,000 | | | | 1,113,900 | |
| Lamar Media Corp., 7.25% Sr. Unsec. Sub. Nts., 1/1/13 | | | 3,030,000 | | | | 2,431,575 | |
| Lear Corp., 8.75% Sr. Unsec. Nts., Series B, 12/1/16 | | | 10,135,000 | | | | 2,989,825 | |
Lehman Brothers Holdings, Inc., 7.50% Sub. Nts., 5/11/384 | | | 4,656,000 | | | | 466 | |
| Leslie’s Poolmart, Inc., 7.75% Sr. Unsec. Nts., 2/1/13 | | | 1,430,000 | | | | 1,151,150 | |
| Levi Strauss & Co., 9.75% Sr. Unsec. Unsub. Nts., 1/15/15 | | | 3,655,000 | | | | 2,722,975 | |
| Lin Television Corp., 6.50% Sr. Sub. Nts., 5/15/13 | | | 3,885,000 | | | | 1,874,513 | |
| Majapahit Holding BV: | | | | | | | | |
7.25% Nts., 10/17/1113 | | | 1,990,000 | | | | 1,522,350 | |
7.75% Nts., 10/17/1613 | | | 4,230,000 | | | | 2,432,250 | |
Marquee Holdings, Inc., 9.505% Sr. Nts., 8/15/141 | | | 2,010,000 | | | | 1,035,150 | |
Mashantucket Pequot Tribe, 8.50% Bonds, Series A, 11/15/1513 | | | 6,615,000 | | | | 2,629,463 | |
| MediaNews Group, Inc.: | | | | | | | | |
| 6.375% Sr. Sub. Nts., 4/1/14 | | | 1,330,000 | | | | 91,438 | |
| 6.875% Sr. Unsec. Sub. Nts., 10/1/13 | | | 2,870,000 | | | | 197,313 | |
| MGM Mirage, Inc., 8.375% Sr. Unsec. Sub. Nts., 2/1/11 | | | 2,965,000 | | | | 1,779,000 | |
MHP SA, 10.25% Sr. Sec. Sub. Bonds, 11/30/1113 | | | 1,360,000 | | | | 605,200 | |
| Mohegan Tribal Gaming Authority: | | | | | | | | |
| 6.125% Sr. Unsec. Sub. Nts., 2/15/13 | | | 1,770,000 | | | | 1,123,950 | |
| 8% Sr. Sub. Nts., 4/1/12 | | | 3,770,000 | | | | 2,318,550 | |
| Momentive Performance Materials, Inc., 11.50% Sr. Unsec. Sub. Nts., 12/1/16 | | | 4,245,000 | | | | 1,273,500 | |
| Morgan Stanley, 6% Sr. Unsec. Unsub. Nts., Series F, 4/28/15 | | | 8,262,000 | | | | 7,136,856 | |
| National Power Corp., 5.875% Unsec. Unsub. Bonds, 12/19/16 | | 109,600,000 | PHP | | | 1,961,263 | |
| NewPage Corp., 10% Sr. Sec. Nts., 5/1/12 | | | 3,730,000 | | | | 1,659,850 | |
| News America, Inc., 6.15% Sr. Unsec. Unsub. Nts., 3/1/37 | | | 1,749,000 | | | | 1,637,108 | |
| Nextel Communications, Inc., 7.375% Sr. Nts., Series D, 8/1/15 | | | 4,590,000 | | | | 1,928,677 | |
| Nortek, Inc., 8.50% Sr. Unsec. Unsub. Nts., 9/1/14 | | | 2,620,000 | | | | 615,700 | |
NorthPoint Communications Group, Inc., 12.875% Nts., 2/15/102,3,4 | | | 200,173 | | | | — | |
Novelis, Inc., 7.25% Sr. Unsec. Nts., 2/15/151 | | | 2,780,000 | | | | 1,626,300 | |
NTK Holdings, Inc., 0%/10.75% Sr. Unsec. Nts., 3/1/1414 | | | 6,170,000 | | | | 1,357,400 | |
| NTL Cable plc, 9.125% Sr. Nts., 8/15/16 | | | 2,735,000 | | | | 2,037,575 | |
Ongko International Finance Co. BV, 10.50% Sec. Nts., 3/29/102,3,4 | | | 90,000 | | | | — | |
| Oracle Corp., 5.75% Sr. Unsec. Unsub. Nts., 4/15/18 | | | 2,001,000 | | | | 2,096,746 | |
Orion Network Systems, Inc., 12.50% Sr. Unsub. Nts., 1/15/072,3,4 | | | 675,000 | | | | 7 | |
Panama Canal Railway Co., 7% Sr. Sec. Nts., 11/1/2613 | | | 3,665,000 | | | | 2,034,075 | |
| Park Place Entertainment Corp., 7.875% Sr. Sub. Nts., 3/15/10 | | | 5,275,000 | | | | 3,507,875 | |
F19 | OPPENHEIMER STRATEGIC BOND FUND/ VA
STATEMENT OF INVESTMENTS Continued
| | | | | | | | | |
| | | Principal | | | | |
| | | Amount | | | Value | |
| |
Corporate Bonds and Notes Continued | | | | | | | | |
| PECO Energy Co., 5.35% Sec. Nts., 3/1/18 | | $ | 892,000 | | | $ | 853,055 | |
Pemex Project Funding Master Trust, 6.625% Nts., 6/15/3813 | | | 6,680,000 | | | | 5,594,500 | |
| Petrobras International Finance Co., 5.785% Sr. Unsec. Nts., 3/1/18 | | | 10,040,000 | | | | 9,076,160 | |
Petroleum Export Ltd. Cayman SPV, 5.265% Sr. Nts., Cl. A3, 6/15/1113 | | | 2,394,239 | | | | 2,223,649 | |
| Philip Morris International, Inc., 5.65% Sr. Unsec. Unsub. Nts., 5/16/18 | | | 917,000 | | | | 910,686 | |
| Pinnacle Entertainment, Inc., 8.25% Sr. Unsec. Sub. Nts., 3/15/12 | | | 3,230,000 | | | | 2,470,950 | |
| Pinnacle Foods Finance LLC/ Pinnacle Foods Finance Corp., 10.625% Sr. Sub. Nts., 4/1/17 | | | 2,985,000 | | | | 1,626,825 | |
Pokagon Gaming Authority, 10.375% Sr. Nts., 6/15/1413 | | | 1,345,000 | | | | 1,163,425 | |
Premier Cruise Ltd., 11% Sr. Nts., 3/15/082,3,4 | | | 250,000 | | | | — | |
| Quicksilver Resources, Inc.: | | | | | | | | |
| 7.125% Sr. Sub. Nts., 4/1/16 | | | 2,740,000 | | | | 1,479,600 | |
| 8.25% Sr. Unsec. Nts., 8/1/15 | | | 1,330,000 | | | | 851,200 | |
| Qwest Corp., 8.875% Unsec. Unsub. Nts., 3/15/12 | | | 4,925,000 | | | | 4,580,250 | |
| R.H. Donnelley Corp.: | | | | | | | | |
| 6.875% Sr. Nts., 1/15/13 | | | 860,000 | | | | 120,400 | |
| 6.875% Sr. Nts., Series A-2, 1/15/13 | | | 1,865,000 | | | | 261,100 | |
| Radio One, Inc., 8.875% Sr. Unsec. Sub. Nts., Series B, 7/1/11 | | | 1,630,000 | | | | 810,925 | |
Rainbow National Services LLC, 8.75% Sr. Nts., 9/1/1213 | | | 2,020,000 | | | | 1,828,100 | |
Real Time Data Co., 11% Nts., 5/31/092,3,4,16 | | | 142,981 | | | | — | |
| Sabine Pass LNG LP: | | | | | | | | |
| 7.25% Sr. Sec. Nts., 11/30/13 | | | 710,000 | | | | 521,850 | |
| 7.50% Sr. Sec. Nts., 11/30/16 | | | 1,470,000 | | | | 1,065,750 | |
Salisbury International Investments Ltd., 8.653% Sec. Nts., Series 2006-003, Tranche E, 7/20/111,2 | | | 1,100,000 | | | | 468,490 | |
| Sally Holdings LLC: | | | | | | | | |
| 9.25% Sr. Unsec. Nts., 11/15/14 | | | 1,725,000 | | | | 1,492,125 | |
| 10.50% Sr. Unsec. Sub. Nts., 11/15/16 | | | 1,315,000 | | | | 900,775 | |
| Select Medical Corp., 7.625% Sr. Unsec. Sub. Nts., 2/1/15 | | | 2,265,000 | | | | 1,211,775 | |
| Service Corp. International, 6.75% Sr. Unsec. Nts., 4/1/15 | | | 1,080,000 | | | | 858,600 | |
| Sinclair Broadcast Group, Inc., 8% Sr. Unsec. Sub. Nts., 3/15/12 | | | 3,095,000 | | | | 2,336,725 | |
| SLM Corp., 4.50% Nts., Series A, 7/26/10 | | | 4,245,000 | | | | 3,685,381 | |
| Smithfield Foods, Inc., 7% Sr. Nts., 8/1/11 | | | 1,350,000 | | | | 965,250 | |
| Sprint Capital Corp., 8.75% Nts., 3/15/32 | | | 9,555,000 | | | | 6,461,769 | |
| Station Casinos, Inc., 6.50% Sr. Unsec. Sub. Nts., 2/1/14 | | | 7,485,000 | | | | 467,813 | |
| Steel Dynamics, Inc., 7.375% Sr. Unsec. Unsub. Nts., 11/1/12 | | | 2,295,000 | | | | 1,686,825 | |
Telefonica del Peru SA, 8% Sr. Unsec. Bonds, 4/11/1613 | | 3,290,100 | PEN | | | 956,223 | |
Teligent, Inc., 11.50% Sr. Nts., 12/1/082,3,4 | | | 500,000 | | | | — | |
Tengizchevroil LLP, 6.124% Nts., 11/15/1413 | | | 1,819,990 | | | | 1,392,292 | |
| Tesoro Corp., 6.625% Sr. Unsec. Nts., 11/1/15 | | | 2,375,000 | | | | 1,389,375 | |
TGI International Ltd., 9.50% Nts., 10/3/1713 | | | 6,100,000 | | | | 5,581,500 | |
Tiers-BSP, 0%/8.60% Collateralized Trust, Cl. A, 6/15/9714 | | | 2,695,000 | | | | 889,350 | |
| Time Warner Cable, Inc., 6.20% Sr. Unsec. Nts., 7/1/13 | | | 1,926,000 | | | | 1,823,535 | |
| Toll Corp., 8.25% Sr. Sub. Nts., 12/1/11 | | | 1,000,000 | | | | 915,000 | |
| Travelport LLC, 11.875% Sr. Unsec. Sub. Nts., 9/1/16 | | | 545,000 | | | | 155,325 | |
| Trump Entertainment Resorts, Inc., 8.50% Sec. Nts., 6/1/15 | | | 1,240,000 | | | | 170,500 | |
| Union Pacific Corp., 7.875% Sr. Unsec. Nts., 1/15/19 | | | 1,376,000 | | | | 1,574,778 | |
| United Parcel Service, Inc., 5.50% Sr. Unsec. Nts., 1/15/18 | | | 1,183,000 | | | | 1,265,862 | |
| United Rentals, Inc., 7% Sr. Sub. Nts., 2/15/14 | | | 3,905,000 | | | | 2,401,575 | |
| United Technologies Corp., 6.125% Sr. Unsec. Nts., 7/15/38 | | | 825,000 | | | | 899,785 | |
Universal Hospital Services, Inc., 8.50% Sr. Sec. Nts., 6/1/1516 | | | 1,965,000 | | | | 1,404,975 | |
US Oncology Holdings, Inc., 8.334% Sr. Unsec. Nts., 3/15/121,16 | | | 1,319,000 | | | | 837,565 | |
| US Oncology, Inc., 9% Sr. Unsec. Nts., 8/15/12 | | | 1,945,000 | | | | 1,779,675 | |
Vanguard Health Holding Co. I LLC, 0%/11.25% Sr. Nts., 10/1/1514 | | | 2,770,000 | | | | 2,188,300 | |
F20 | OPPENHEIMER STRATEGIC BOND FUND/ VA
| | | | | | | | | |
| | | Principal | | | | |
| | | Amount | | | Value | |
| |
Corporate Bonds and Notes Continued | | | | | | | | |
Vedanta Resources plc, 9.50% Sr. Unsec. Nts., 7/18/1813 | | $ | 11,010,000 | | | $ | 5,780,250 | |
| Verizon Communications, Inc., 6.90% Sr. Unsec. Unsub. Bonds, 4/15/38 | | | 1,377,000 | | | | 1,554,672 | |
Videotron Ltd., 9.125% Sr. Nts., 4/15/1813 | | | 1,765,000 | | | | 1,650,275 | |
| Virgin Media Finance plc, 8.75% Sr. Unsec. Nts., 4/15/14 | | | 1,820,000 | | | | 1,374,100 | |
| Wal-Mart Stores, Inc., 5.80% Sr. Unsec. Unsub. Nts., 2/15/18 | | | 2,477,000 | | | | 2,745,834 | |
| Walt Disney Co. (The), 4.50% Sr. Unsec. Unsub. Nts., Series D, 12/15/13 | | | 689,000 | | | | 694,307 | |
| Warner Music Group Corp., 7.375% Sr. Sub. Bonds, 4/15/14 | | | 500,000 | | | | 295,000 | |
| Wells Fargo & Co., 5.25% Sr. Unsec. Unsub. Nts., 10/23/12 | | | 5,608,000 | | | | 5,716,823 | |
| William Lyon Homes, Inc.: | | | | | | | | |
| 7.50% Sr. Unsec. Nts., 2/15/14 | | | 160,000 | | | | 39,200 | |
| 10.75% Sr. Nts., 4/1/13 | | | 1,390,000 | | | | 354,450 | |
| Windstream Corp.: | | | | | | | | |
| 8.125% Sr. Unsec. Unsub. Nts., 8/1/13 | | | 2,900,000 | | | | 2,682,500 | |
| 8.625% Sr. Unsec. Unsub. Nts., 8/1/16 | | | 1,970,000 | | | | 1,753,300 | |
Winstar Communications, Inc., 12.75% Sr. Nts., 4/15/102,3,4 | | | 250,000 | | | | — | |
| WM Covered Bond Program: | | | | | | | | |
| 3.875% Sec. Nts., Series 1, 9/27/11 | | 8,725,000 | EUR | | | 11,222,278 | |
| 4% Sec. Mtg. Nts., Series 2, 9/27/16 | | 10,485,000 | EUR | | | 12,654,226 | |
WMG Holdings Corp., 0%/9.50% Sr. Nts., 12/15/1414 | | | 2,030,000 | | | | 761,250 | |
| Wynn Las Vegas LLC/Wynn Las Vegas Capital Corp., 6.625% Nts., 12/1/14 | | | 4,615,000 | | | | 3,507,400 | |
| XTO Energy, Inc., 6.50% Sr. Unsec. Unsub. Nts., 12/15/18 | | | 1,954,000 | | | | 1,894,917 | |
| | | | | | | | |
| | | | | | | | | |
| Total Corporate Bonds and Notes (Cost $694,267,395) | | | | | | | 519,305,734 | |
| | | | | | | | | |
| | | Shares | | | Value | |
| |
Preferred Stocks—0.0% | | | | | | | | |
AmeriKing, Inc., 13% Cum. Sr. Exchangeable, Non-Vtg.2,3,16 | | | 4,253 | | | | — | |
Eagle-Picher Holdings, Inc., 11.75% Cum. Exchangeable, Series B, Non-Vtg.2,3 | | | 5,000 | | | | — | |
| Fannie Mae, 8.25% Non-Cum. Sub., Series S, Non-Vtg. | | | 148,310 | | | | 123,097 | |
ICG Holdings, Inc., 14.25% Exchangeable, Non-Vtg.2,3,16 | | | 151 | | | | — | |
Sovereign Real Estate Investment Trust, 12% Non-Cum., Series A2 | | | 250 | | | | 208,125 | |
| | | | | | | | |
| | | | | | | | | |
| Total Preferred Stocks (Cost $4,486,155) | | | | | | | 331,222 | |
| | | | | | | | | |
Common Stocks—0.0% | | | | | | | | |
Arco Capital Corp. Ltd.2,3 | | | 690,638 | | | | 690,638 | |
Global Aero Logistics, Inc.2,3 | | | 2,168 | | | | 2,168 | |
National Maintenance Group, Inc.3 | | | 9,420 | | | | 47 | |
Revlon, Inc., Cl. A3 | | | 134,166 | | | | 894,887 | |
| | | | | | | | |
| | | | | | | | | |
| Total Common Stocks (Cost $12,158,364) | | | | | | | 1,587,740 | |
| | | | | | | | | |
| | | Units | | | | | |
| Rights, Warrants and Certificates—0.0% |
Global Aero Logistics, Inc. Wts., Strike Price $10, Exp. 2/28/112,3 | | | 266 | | | | 3 | |
MHP SA, GDR Wts., Strike Price 0.01UAH, Exp. 5/8/093 | | | 56,610 | | | | 183,982 | |
| | | | | | | | |
| | | | | | | | | |
| Total Rights, Warrants and Certificates (Cost $2,025) | | | | | | | 183,985 | |
| | | | | | | | | |
| | | Principal
| | | | | |
| | | Amount | | | | | |
| |
Structured Securities—5.0% | | | | | | | | |
| Barclays Bank plc: | | | | | | | | |
Custom Basket of African Currencies Cv. Unsec. Unsub. Nts., 10.25%, 5/15/092 | | $ | 3,030,000 | | | | 2,650,038 | |
Custom Basket of African Currencies Cv. Unsec. Unsub. Nts., 10.25%, 5/7/092 | | | 3,030,000 | | | | 2,639,130 | |
| Citibank NA, New York: | | | | | | | | |
Dominican Republic Credit Linked Nts., 12%, 2/22/112 | | 22,200,000 | DOP | | | 509,623 | |
Dominican Republic Credit Linked Nts., 14.218%, 5/11/0910 | | 61,180,000 | DOP | | | 1,596,580 | |
Citigroup Funding, Inc., Custom Basket of African Currencies Credit Linked Nts., (0.055)%, 4/29/0910 | | | 6,070,000 | | | | 5,358,900 | |
| Citigroup Global Markets Holdings, Inc.: | | | | | | | | |
Brazil (Federal Republic of) Credit Linked Nts., 9.762%, 1/3/172 | | 8,850,000 | BRR | | | 3,216,765 | |
Brazil (Federal Republic of) Unsec. Credit Linked Nts., 14.809%, 1/5/1010 | | 2,480,096 | BRR | | | 954,499 | |
| Colombia (Republic of) Credit Linked Bonds, 11.25%, 10/25/18 | | 3,255,000,000 | COP | | | 1,497,713 | |
F21 | OPPENHEIMER STRATEGIC BOND FUND/ VA
STATEMENT OF INVESTMENTS Continued
| | | | | | | | | |
| | | Principal | | | | |
| | | Amount | | | Value | |
| |
Structured Securities Continued | | | | | | | | |
| Citigroup Global Markets Holdings, Inc.: Continued | | | | | | | | |
Colombia (Republic of) Credit Linked Nts., 12.710%, 2/26/152,12 | | 2,199,000,000 | COP | | $ | 1,908,265 | |
Colombia (Republic of) Credit Linked Nts., Series 01, 12.710%, 2/26/152,12 | | 811,000,000 | COP | | | 703,776 | |
Colombia (Republic of) Credit Linked Nts., Series 02, 12.710% 12/26/152,12 | | 1,345,000,000 | COP | | | 1,167,174 | |
| Colombia (Republic of) Credit Linked Nts., Series II, 15%, 4/27/12 | | 552,359,546 | COP | | | 280,057 | |
| Colombia (Republic of) Unsec. Credit Linked Nts., 15%, 4/27/12 | | 1,034,000,000 | COP | | | 524,257 | |
Colombia (Republic of) Unsec. Credit Linked Nts., 15%, 4/27/122 | | 1,200,000,000 | COP | | | 608,422 | |
| Colombia (Republic of) Unsec. Credit Linked Nts., 15%, 4/27/12 | | 927,000,000 | COP | | | 470,006 | |
Dominican Republic Unsec. Credit Linked Nts., 13.182%, 2/23/0910 | | 90,800,000 | DOP | | | 2,481,906 | |
| Dominican Republic Unsec. Credit Linked Nts., 15%, 3/12/12 | | 49,300,000 | DOP | | | 1,104,595 | |
| Egypt (The Arab Republic of) Credit Linked Nts., 5.765%, 2/5/0910 | | 18,110,000 | EGP | | | 3,256,520 | |
| Egypt (The Arab Republic of) Credit Linked Nts., 6.089%, 3/5/0910 | | 12,920,000 | EGP | | | 2,302,282 | |
Egypt (The Arab Republic of) Credit Linked Nts., 6.267%, 3/26/0910 | | 17,610,000 | EGP | | | 3,116,948 | |
Egypt (The Arab Republic of) Credit Linked Nts., 6.641%, 2/19/0910 | | 17,850,000 | EGP | | | 3,195,194 | |
Egypt (The Arab Republic of) Credit Linked Nts., 7.812%, 4/16/0910 | | 7,100,000 | EGP | | | 1,248,300 | |
Egypt (The Arab Republic of) Unsec. Credit Linked Nts., 6.529%, 3/26/0910 | | 17,690,000 | EGP | | | 3,131,108 | |
| Ghana (Republic of) Credit Linked Nts., 13.50%, 4/2/10 | | 2,990,000 | GHS | | | 2,057,695 | |
Nigeria (Federal Republic of) Credit Linked Nts., 14.50%, 3/1/111,2 | | 347,000,000 | NGN | | | 2,527,660 | |
| Ukraine Hryvnia Unsec. Credit Linked Nts., 11.94%, 1/2/10 | | 880,000 | UAH | | | 94,532 | |
Zambia (Republic of) Credit Linked Nts., 10.717%, 3/4/0910 | | 3,850,000,000 | ZMK | | | 764,722 | |
Zambia (Republic of) Credit Linked Nts., 10.793%, 2/25/0910 | | 3,850,000,000 | ZMK | | | 761,985 | |
Zambia (Republic of) Credit Linked Nts., 11.399%, 6/11/0910 | | 2,165,000,000 | ZMK | | $ | 404,530 | |
| Credit Suisse First Boston International: | | | | | | | | |
Boryspil Airport Total Return Linked Nts., 10%, 4/19/101 | | 4,840,000 | UAH | | | 257,777 | |
| Indonesia (Republic of) Total Return Linked Nts., 12%, 9/16/11 | | 14,800,000,000 | IDR | | | 1,362,046 | |
Moitk Total Return Linked Nts., 8.966%, 3/26/111,2 | | 59,900,000 | RUR | | | 659,954 | |
| NAK Naftogaz of Ukraine Credit Linked Nts., 5%, 1/20/09 | | | 3,890,000 | | | | 3,720,007 | |
Oreniz Total Return Linked Nts., 9.24%, 2/21/121,2 | | 116,835,000 | RUR | | | 1,609,051 | |
RuRail Total Return Linked Nts., 6.67%, 1/22/091,2 | | 49,210,000 | RUR | | | 1,206,342 | |
Ukraine (Republic of) Credit Linked Nts., Series EMG 13, 11.94%, 12/30/092 | | 2,195,000 | UAH | | | 192,132 | |
Vietnam Shipping Industry Group Total Return Linked Nts., 10.50%, 1/19/172 | | 14,609,000,000 | VND | | | 510,687 | |
| Credit Suisse First Boston, Inc. (Nassau Branch): | | | | | | | | |
Russian Specialized Construction and Installation Administration Credit Linked Nts., 5/20/101,2 | | 97,250,000 | RUR | | | 267,865 | |
Ukraine (Republic of) Credit Linked Nts., 11.94%, 12/30/092 | | 5,650,000 | UAH | | | 494,554 | |
| Ukraine (Republic of) Credit Linked Nts., Series EMG 11, 11.94%, 12/30/09 | | 661,000 | UAH | | | 57,858 | |
Ukraine (Republic of) Credit Linked Nts., Series NPC 12, 11.94%, 12/30/092 | | 4,170,000 | UAH | | | 365,007 | |
Credit Suisse Group, Russian Moscoblgaz Finance Total Return Linked Nts., 9.25%, 6/24/122 | | 106,500,000 | RUR | | | 1,466,718 | |
| Deutsche Bank AG: | | | | | | | | |
Arrendadora Capita Corp. SA de CV/Capita Corp. (The) de Mexico SA de CV Credit Linked Nts., 9.09%, 1/5/112 | | 9,127,796 | MXN | | | 618,495 | |
Arrendadora Capita Corp. SA de CV/Capita Corp. (The) de Mexico SA de CV Credit Linked Nts., 9.65%, 1/5/112 | | 6,053,427 | MXN | | | 410,178 | |
Brazil Real Credit Linked Nts., 13.882%, 3/3/1010 | | 4,580,760 | BRR | | | 1,746,067 | |
| Brazil Real Total Return Linked Nts., 6%, 8/18/10 | | 2,065,000 | BRR | | | 1,588,966 | |
F22 | OPPENHEIMER STRATEGIC BOND FUND/ VA
| | | | | | | | | |
| | | Principal | | | | |
| | | Amount | | | Value | |
| |
Structured Securities Continued | | | | | | | | |
| Deutsche Bank AG: Continued | | | | | | | | |
| Colombia (Republic of) Credit Linked Nts., 13.50%, 9/16/14 | | $2,002,000,000 | COP | | $ | 995,524 | |
Coriolanus Ltd. Sec. Credit Linked Nts., Series 109, (0.196)%, 3/25/092 | | | 2,190,000 | | | | 2,168,100 | |
Coriolanus Ltd. Sec. Credit Linked Nts., Series 110, (2.256)%, 12/22/112 | | | 900,000 | | | | 900,000 | |
Coriolanus Ltd. Sec. Credit Linked Nts., Series 112, 0.004%, 12/7/092 | | | 650,000 | | | | 638,950 | |
Coriolanus Ltd. Sec. Credit Linked Nts., Series 113, (2.186)%, 4/26/112 | | | 655,000 | | | | 586,225 | |
European Investment Bank, Russian Federation Credit Linked Nts., 5.502%, 1/19/102,10 | | | 705,000 | | | | 563,859 | |
Grupo TMM SA Credit Linked Nts., 6%, 9/7/122 | | | 2,069,512 | | | | 1,138,232 | |
| Indonesia (Republic of) Credit Linked Nts., 9.50%, 6/22/15 | | | 820,000 | | | | 617,343 | |
| Indonesia (Republic of) Credit Linked Nts., Series 02, 12.80%, 6/22/21 | | 29,700,000,000 | IDR | | | 2,869,237 | |
| Indonesia (Republic of) Credit Linked Nts., Series III, 14.25%, 6/22/13 | | | 873,600 | | | | 814,931 | |
| Nigeria (Federal Republic of) Credit Linked Nts., 12.50%, 2/24/09 | | 67,900,000 | NGN | | | 508,788 | |
| Nigeria (Federal Republic of) Credit Linked Nts., 15%, 1/27/09 | | 91,000,000 | NGN | | | 695,039 | |
Opic Reforma I Credit Linked Nts., Cl. 1A, 10.75%, 9/24/141,2 | | 14,850,000 | MXN | | | 1,081,967 | |
Opic Reforma I Credit Linked Nts., Cl. 1B, 10.75%, 9/24/141,2 | | 2,970,000 | MXN | | | 216,393 | |
Opic Reforma I Credit Linked Nts., Cl. 1C, 10.75%, 9/24/141,2 | | 4,950,000 | MXN | | | 360,656 | |
Opic Reforma I Credit Linked Nts., Cl. 2A, 12.25%, 5/22/151,2 | | 1,417,014 | MXN | | | 103,243 | |
Opic Reforma I Credit Linked Nts., Cl. 2B, 12.25%, 5/22/151,2 | | 2,479,100 | MXN | | | 180,627 | |
Opic Reforma I Credit Linked Nts., Cl. 2C, 12.25%, 5/22/151,2 | | 37,378,810 | MXN | | | 2,723,411 | |
Opic Reforma I Credit Linked Nts., Cl. 2D, 12.25%, 5/22/151,2 | | 2,724,116 | MXN | | | 198,478 | |
Opic Reforma I Credit Linked Nts., Cl. 2E, 12.25%, 5/22/151,2 | | 1,979,122 | MXN | | | 144,198 | |
Opic Reforma I Credit Linked Nts., Cl. 2F, 12.25%, 5/22/151,2 | | 1,263,966 | MXN | | | 92,092 | |
Opic Reforma I Credit Linked Nts., Cl. 2G, 12.25%, 5/22/151,2 | | 232,771 | MXN | | | 16,960 | |
| Ukraine (Republic of) 5 yr. Credit Linked Nts., 4.05%, 8/27/10 | | | 885,000 | | | | 500,078 | |
| Ukraine (Republic of) 5.5 yr. Credit Linked Nts., 4.05%, 3/1/11 | | | 885,000 | | | | 448,031 | |
| Ukraine (Republic of) 6 yr. Credit Linked Nts., 4.05%, 8/29/11 | | | 885,000 | | | | 406,392 | |
| Ukraine (Republic of) 6.5 yr. Credit Linked Nts., 4.05%, 2/29/12 | | | 885,000 | | | | 377,709 | |
| Ukraine (Republic of) 7 yr. Credit Linked Nts., 4.05%, 8/30/12 | | | 885,000 | | | | 359,089 | |
United Mexican States Credit Linked Nts., 9.52%, 1/5/112 | | 6,045,360 | MXN | | | 409,631 | |
| Videocon International Ltd. Credit Linked Nts., 6.26%, 12/29/09 | | | 1,630,000 | | | | 1,785,421 | |
| Deutsche Bank AG, Singapore, Vietnam Shipping Industry Group Total Return Linked Nts., 9%, 4/20/17 | | 36,800,000,000 | VND | | | 893,323 | |
Dresdner Bank AG, Lukoil Credit Linked Nts., Series 3, 7.04%, 12/12/111,2 | | 34,190,000 | RUR | | | 964,600 | |
Goldman Sachs & Co., Turkey (Republic of) Credit Linked Nts., 14.802%, 3/29/172,10 | | 21,980,000 | TRY | | | 3,099,030 | |
Goldman Sachs Capital Markets LP, Colombia (Republic of) Credit Linked Nts., 10.476%, 2/8/372,10 | | 63,720,800,000 | COP | | | 416,572 | |
Goldman Sachs International, Rosselkhozbank Total Return Linked Nts., 8%, 5/13/091 | | 84,500,000 | RUR | | | 2,592,669 | |
Hallertau SPC, Philippines (Republic of) Credit Linked Nts., Series 2007-01, 3.914%, 12/20/171,2 | | | 14,290,000 | | | | 10,410,265 | |
Hallertau SPC Credit Linked Nts., Series 2008-2A, 8.636%, 9/17/131,2 | | | 19,430,000 | | | | 19,676,761 | |
Hallertau SPC Segregated Portfolio, Brazil (Federal Republic of) Credit Linked Nts., Series 2008-01, 9.888%, 8/2/102,4,10 | | 14,337,604 | BRR | | | 1,256,283 | |
ING Bank NV, Ukraine (Republic of) Credit Linked Nts., Series 725, 11.89%, 12/30/092 | | 4,689,000 | UAH | | | 378,615 | |
| JPMorgan Chase Bank NA: | | | | | | | | |
Brazil (Federal Republic of) Credit Linked Nts., 10.564%, 5/16/452 | | 1,445,000 | BRR | | | 934,552 | |
Brazil (Federal Republic of) Credit Linked Nts., 15.326%, 1/2/1510 | | 10,948,600 | BRR | | | 2,237,855 | |
Brazil (Federal Republic of) Credit Linked Nts., Series III, 12.184%, 1/2/152,10 | | 5,245,000 | BRR | | | 1,072,059 | |
Colombia (Republic of) Credit Linked Bonds, 10.19%, 1/5/162,10 | | 20,100,000,000 | COP | | | 4,329,146 | |
Colombia (Republic of) Credit Linked Bonds, 10.218%, 10/31/162,10 | | 12,177,000,000 | COP | | | 2,406,070 | |
F23 | OPPENHEIMER STRATEGIC BOND FUND/ VA
STATEMENT OF INVESTMENTS Continued
| | | | | | | | | |
| | | Principal | | | | |
| | | Amount | | | Value | |
| |
Structured Securities Continued | | | | | | | | |
| JPMorgan Chase Bank NA: Continued | | | | | | | | |
Colombia (Republic of) Credit Linked Bonds, Series A, 10.218%, 10/31/162,10 | | 12,125,000,000 | COP | | $ | 2,395,795 | |
Peru (Republic of) Credit Linked Nts., 8.115%, 9/2/152,10 | | 3,470,000 | PEN | | | 592,485 | |
Swaziland (Kingdom of) Credit Linked Nts., 7.25%, 6/20/102 | | | 1,120,000 | | | | 1,185,408 | |
JPMorgan Chase Bank NA London Branch, Indonesia (Republic of) Credit Linked Nts., 12.80%, 6/17/212 | | 25,490,000,000 | IDR | | | 2,438,706 | |
| Lehman Brothers Treasury Co. BV: | | | | | | | | |
Brazil (Federal Republic of) Credit Linked Nts., 6.357%, 4/20/114,10,13 | | 13,157,420 | BRR | | | 1,249,955 | |
Microvest Capital Management LLC Credit Linked Nts., 7.55%, 5/24/122 | | | 7,541,026 | | | | 6,811,054 | |
Merrill Lynch, Colombia (Republic of) Credit Linked Nts., 10%, 11/17/162 | | 1,784,000,000 | COP | | | 743,168 | |
| Morgan Stanley: | | | | | | | | |
Peru (Republic of) Credit Linked Nts., 6.25%, 3/23/172 | | 4,885,000 | PEN | | | 947,545 | |
| Russian Federation Total Return Linked Bonds, Series 007, Cl. VR, 5%, 8/22/34 | | 93,152,901 | RUR | | | 1,621,714 | |
Morgan Stanley & Co. International Ltd./Red Arrow International Leasing plc Total Return Linked Nts., Series A, 8.375%, 7/9/122 | | 20,420,042 | RUR | | | 562,450 | |
| Morgan Stanley Capital Services, Inc.: | | | | | | | | |
Brazil (Federal Republic of) Credit Linked Nts., 12.551%, 1/5/222,10 | | 28,914,000 | BRR | | | 287,329 | |
Brazil (Federal Republic of) Credit Linked Nts., 14.40%, 8/4/162 | | 5,793,682 | BRR | | | 1,900,938 | |
Ukraine (Republic of) Credit Linked Nts., 6.176%, 10/15/171,2 | | | 8,300,000 | | | | 2,075,000 | |
Ukraine (Republic of) Credit Linked Nts., Series 2, 7.046%, 10/15/171,2 | | | 6,800,000 | | | | 1,700,000 | |
United Mexican States Credit Linked Nts., 5.64%, 11/20/152 | | | 2,000,000 | | | | 1,800,000 | |
WTI Trading Ltd. Total Return Linked Nts., Series A, 15%, 3/8/122 | | | 4,440,493 | | | | 2,729,127 | |
WTI Trading Ltd. Total Return Linked Nts., Series C, 15%, 3/8/122 | | | 5,934,498 | | | | 3,669,300 | |
UBS AG, Ghana (Republic of) Credit Linked Nts., 14.47%, 12/28/112 | | 1,222,052 | GHS | | | 621,505 | |
| | | | | | | | |
| | | | | | | | | |
| Total Structured Securities (Cost $243,160,515) | | | | | | | 172,966,769 | |
| | | | | | | | | |
Event-Linked Bonds—1.4% | | | | | | | | |
Aiolos Ltd. Catastrophe Linked Nts., 10.095%, 4/8/091,13 | | 2,050,000 | EUR | | | 2,823,579 | |
Akibare Ltd. Catastrophe Linked Nts., Cl. A, 5.103%, 5/22/121,13 | | | 1,888,000 | | | | 1,831,077 | |
Calabash Re Ltd. Catastrophe Linked Nts., Cl. A-1, 10.653%, 6/1/091,13 | | | 2,750,000 | | | | 2,756,463 | |
Cascadia Ltd. Catastrophe Linked Nts., 6.203%, 8/31/091,13 | | | 1,130,000 | | | | 1,123,559 | |
Cat-Mex Ltd. Catastrophe Linked Nts., Cl. A, 4.585%, 5/19/091,13 | | | 3,200,000 | | | | 3,130,880 | |
Champlain Ltd. Catastrophe Linked Nts., Series A, 17.084%, 1/7/091,13 | | | 2,190,000 | | | | 2,184,416 | |
Eurus Ltd. Catastrophe Linked Nts., 9.758%, 4/8/091,13 | | | 1,400,000 | | | | 1,379,210 | |
Fhu-Jin Ltd. Catastrophe Linked Nts., Cl. B, 7.093%, 8/10/111,13 | | | 2,880,000 | | | | 2,781,216 | |
Foundation Re II Ltd. Catastrophe Linked Nts., 11.841%, 1/8/091,13 | | | 926,000 | | | | 923,569 | |
Fusion 2007 Ltd. Catastrophe Linked Nts., 8.239%, 5/19/091,13 | | | 3,350,000 | | | | 3,318,678 | |
Lakeside Re Ltd. Catastrophe Linked Nts., 7.959%, 12/31/091,13 | | | 4,100,000 | | | | 4,073,350 | |
Medquake Ltd. Catastrophe Linked Nts., 7.249%, 5/31/101,13 | | | 1,500,000 | | | | 1,467,450 | |
Midori Ltd. Catastrophe Linked Nts., 7.503%, 10/24/121,13 | | | 1,850,000 | | | | 1,791,910 | |
Muteki Ltd. Catastrophe Linked Nts., 6.549%, 5/24/111,13 | | | 2,100,000 | | | | 1,993,950 | |
Nelson Re Ltd. Catastrophe Linked Nts., Series 2007-I, Cl. A, 14.049%, 6/21/101,13 | | | 3,340,000 | | | | 3,222,432 | |
Osiris Capital plc Catastrophe Linked Combined Mortality Index Nts., Series D, 9.753%, 1/15/101,13 | | | 890,000 | | | | 870,865 | |
| Residential Reinsurance 2007 Ltd. Catastrophe Linked Nts.: | | | | | | | | |
Series CL2, 13.703%, 6/6/111,13 | | | 2,590,000 | | | | 2,499,674 | |
Series CL3, 14.453%, 6/7/101,13 | | | 1,000,000 | | | | 966,400 | |
VASCO Re 2006 Ltd. Catastrophe Linked Nts., 10.701%, 6/5/091,13 | | | 3,550,000 | | | | 3,563,668 | |
Vega Capital Ltd. Catastrophe Linked Nts., Series D, 0%, 6/24/112,10 | | | 4,205,000 | | | | 4,310,125 | |
Willow Re Ltd. Catastrophe Linked Nts., 8.545%, 6/16/101,13 | | | 2,480,000 | | | | 1,494,820 | |
| | | | | | | | |
| | | | | | | | | |
| Total Event-Linked Bonds (Cost $49,914,507) | | | | | | | 48,507,291 | |
F24 | OPPENHEIMER STRATEGIC BOND FUND/ VA
| | | | | | | | | | | | | |
| | | Expiration | | | Notional | | | | |
| | | Date | | | Amount | | | Value | |
| |
Swaptions Purchased—0.0% | | | | | | | | | | | | |
J Aron & Co., Swap Counterparty, Interest Rate Swap call option; Swap Terms-Receive fixed rate of 9.32% and pay floating rate based on 28 day MXN TIIE BANXICO; terminating 5/31/213,17 (Cost $333,398) | | | 6/11/09 | | | 117,625,000 | MXN | | $ | 632,280 | |
| | | | | | | | | | | | | |
| | | | | | | Principal | | | | | |
| | | | | | | Amount | | | | | |
| |
Short-Term Notes—5.3% | | | | | | | | | | | | |
| Federal Home Loan Mortgage Corp.: | | | | | | | | | | | | |
2.74%, 2/26/098,18 | | | | | | $ | 60,000,000 | | | | 59,748,000 | |
| Federal National Mortgage Assn.: | | | | | | | | | | | | |
2.67%, 2/23/098,19 | | | | | | | 63,830,000 | | | | 63,579,095 | |
2.76%, 2/25/098,20 | | | | | | | 60,000,000 | | | | 59,750,667 | |
| | | | | | | | | | | | |
| | | | | | | | | | | | | |
| Total Short-Term Notes (Cost $183,077,762) | | | | | | | | | | | 183,077,762 | |
| | | | | | | | | | | | | |
| | | | | | | Shares | | | | |
| |
Investment Companies—12.4% | | | | | | | | | | | | |
Oppenheimer Institutional Money Market Fund, Cl. E, 1.96%21,22 | | | | | | | 314,416,821 | | | | 314,416,821 | |
Oppenheimer Master Event-Linked Bond Fund, LLC 21 | | | | | | | 1,404,749 | | | $ | 13,761,909 | |
Oppenheimer Master Loan Fund, LLC21 | | | | | | | 14,194,313 | | | | 102,098,787 | |
| | | | | | | | | | | | |
| | | | | | | | | | | | | |
| Total Investment Companies (Cost $477,509,586) | | | | | | | | | | | 430,277,517 | |
| | | | | | | | | | | | | |
| Total Investments, at Value (excluding Investments Purchased with Cash Collateral from Securities Loaned) (Cost $4,124,049,916) | | | | | | | | | | | 3,566,317,162 | |
Investments Purchased with Cash Collateral from Securities Loaned—9.4%23 | | | | | | | | | | | | |
OFI Liquid Assets Fund, LLC, 1.71%21,22 (Cost $325,265,870) | | | | | | | 325,265,870 | | | | 325,265,870 | |
| | | | | | | | | | | | | |
Total Investments, at Value (Cost $4,449,315,786) | | | | | | | 112.5 | % | | | 3,891,583,032 | |
Liabilities in Excess of Other Assets | | | | | | | (12.5 | ) | | | (432,698,291 | ) |
| | | | | | | |
Net Assets | | | | | | | 100.0 | % | | $ | 3,458,884,741 | |
| | | | | | | |
Industry classifications are unaudited.
Footnotes to Statement of Investments
Principal/notional amount and strike price are reported in U.S. Dollars, except for those denoted in the following currencies:
| | | |
| AUD | | Australian Dollar |
| BRR | | Brazilian Real |
| CAD | | Canadian Dollar |
| COP | | Colombian Peso |
| DKK | | Danish Krone |
| DOP | | Dominican Republic Peso |
| EGP | | Egyptian Pounds |
| EUR | | Euro |
| GBP | | British Pound Sterling |
| GHS | | Ghana Cedi |
| HUF | | Hungarian Forint |
| IDR | | Indonesia Rupiah |
| ILS | | Israeli Shekel |
| JPY | | Japanese Yen |
| MXN | | Mexican Nuevo Peso |
| MYR | | Malaysian Ringgit |
| NGN | | Nigeria Naira |
| NOK | | Norwegian Krone |
| PEN | | Peruvian New Sol |
| PHP | | Philippines Peso |
| PLZ | | Polish Zloty |
| RUR | | Russian Ruble |
| SEK | | Swedish Krona |
| TRY | | New Turkish Lira |
| UAH | | Ukraine Hryvnia |
| UYU | | Uruguay Peso |
| VND | | Vietnam Dong |
| ZMK | | Zambian Kwacha |
Swaption Purchased abbreviation is as follows:
MXN-TIIE-BANXICO Mexican Nuevo Peso-Interbank Equilibrium Interest Rate-Banco de Mexico
F25 | OPPENHEIMER STRATEGIC BOND FUND/ VA
STATEMENT OF INVESTMENTS Continued
Footnotes to Statement of Investments Continued
| | |
| |
| 1. | | Represents the current interest rate for a variable or increasing rate security. |
| |
| 2. | | Illiquid or restricted security. The aggregate value of illiquid or restricted securities as of December 31, 2008 was $178,278,234, which represents 5.15% of the Fund’s net assets, of which $5,118,025 is considered restricted. See Note 9 of accompanying Notes. Information concerning restricted securities is as follows: |
| | | | | | | | | | | | | | | | | |
| | | Acquisition | | | | | | | | | | | Unrealized | |
| Security | | Date | | | Cost | | | Value | | | Depreciation | |
| |
| Deutsche Bank AG, Opic Reforma I Credit Linked Nts., Cl. 1A, 10.75%, 9/24/14 | | | 12/27/07 | | | $ | 1,364,764 | | | $ | 1,081,967 | | | $ | 282,797 | |
| Deutsche Bank AG, Opic Reforma I Credit Linked Nts., Cl. 1B, 10.75%, 9/24/14 | | | 6/12/08 | | | | 286,334 | | | | 216,393 | | | | 69,941 | |
| Deutsche Bank AG, Opic Reforma I Credit Linked Nts., Cl. 1C, 10.75%, 9/24/14 | | | 8/12/08 | | | | 487,085 | | | | 360,656 | | | | 126,429 | |
| Deutsche Bank AG, Opic Reforma I Credit Linked Nts., Cl. 2A, 12.25%, 5/22/15 | | | 5/21/08 | | | | 136,622 | | | | 103,243 | | | | 33,379 | |
| Deutsche Bank AG, Opic Reforma I Credit Linked Nts., Cl. 2B, 12.25%, 5/22/15 | | | 6/12/08 | | | | 239,007 | | | | 180,627 | | | | 58,380 | |
| Deutsche Bank AG, Opic Reforma I Credit Linked Nts., Cl. 2C, 12.25%, 5/22/15 | | | 6/18/08 | | | | 3,626,317 | | | | 2,723,411 | | | | 902,906 | |
| Deutsche Bank AG, Opic Reforma I Credit Linked Nts., Cl. 2D, 12.25%, 5/22/15 | | | 7/8/08 | | | | 264,086 | | | | 198,478 | | | | 65,608 | |
| Deutsche Bank AG, Opic Reforma I Credit Linked Nts., Cl. 2E, 12.25%, 5/22/15 | | | 7/15/08 | | | | 192,185 | | | | 144,198 | | | | 47,987 | |
| Deutsche Bank AG, Opic Reforma I Credit Linked Nts., Cl. 2F, 12.25%, 5/22/15 | | | 8/8/08 | | | | 124,426 | | | | 92,092 | | | | 32,334 | |
| Deutsche Bank AG, Opic Reforma I Credit Linked Nts., Cl. 2G, 12.25%, 5/22/15 | | | 8/22/08 | | | | 22,959 | | | | 16,960 | | | | 5,999 | |
| | | | | | | |
| | | | | | | $ | 6,743,785 | | | $ | 5,118,025 | | | $ | 1,625,760 | |
| | | | | | | |
| | |
| 3. | | Non-income producing security. |
| |
| 4. | | Issue is in default. See Note 1 of accompanying Notes. |
| |
| 5. | | Interest-Only Strips represent the right to receive the monthly interest payments on an underlying pool of mortgage loans. These securities typically decline in price as interest rates decline. Most other fixed income securities increase in price when interest rates decline. The principal amount of the underlying pool represents the notional amount on which current interest is calculated. The price of these securities is typically more sensitive to changes in prepayment rates than traditional mortgage-backed securities (for example, GNMA pass-throughs). Interest rates disclosed represent current yields based upon the current cost basis and estimated timing and amount of future cash flows. These securities amount to $22,444,545 or 0.65% of the Fund’s net assets as of December 31, 2008. |
| |
| 6. | | Principal-Only Strips represent the right to receive the monthly principal payments on an underlying pool of mortgage loans. The value of these securities generally increases as interest rates decline and prepayment rates rise. The price of these securities is typically more volatile than that of coupon-bearing bonds of the same maturity. Interest rates disclosed represent current yields based upon the current cost basis and estimated timing of future cash flows. These securities amount to $5,330,153 or 0.15% of the Fund’s net assets as of December 31, 2008. |
| |
| 7. | | When-issued security or delayed delivery to be delivered and settled after December 31, 2008. See Note 1 of accompanying Notes. |
| |
| 8. | | Partial or fully-loaned security. See Note 10 of accompanying Notes. |
| |
| 9. | | A sufficient amount of liquid assets has been designated to cover outstanding written put options. See Note 7 of accompanying Notes. |
| |
| 10. | | Zero coupon bond reflects effective yield on the date of purchase. |
| |
| 11. | | All or a portion of the security is held in collateralized accounts to cover initial margin requirements on open futures contracts. The aggregate market value of such securities is $45,907,536. See Note 6 of accompanying Notes. |
| |
| 12. | | Denotes an inflation-indexed security: coupon and principal are indexed to the consumer price index. |
| |
| 13. | | Represents securities sold under Rule 144A, which are exempt from registration under the Securities Act of 1933, as amended. These securities have been determined to be liquid under guidelines established by the Board of Trustees. These securities amount to $233,849,534 or 6.76% of the Fund’s net assets as of December 31, 2008. |
| |
| 14. | | Denotes a step bond: a zero coupon bond that converts to a fixed or variable interest rate at a designated future date. |
| |
| 15. | | This bond has no contractual maturity date, is not redeemable and contractually pays an indefinite stream of interest. Rate reported represents the current interest rate for this variable rate security. |
| |
| 16. | | Interest or dividend is paid-in-kind, when applicable. |
| |
| 17. | | Swap contract terms if the option was exercised on exercise date. |
| |
| 18. | | All or a portion of the security was segregated by the Fund in the amount of $3,562,000, which represented 97.43% of the market value of securities sold short. See Note 1 of accompanying Notes. |
| |
| 19. | | A sufficient amount of securities has been designated to cover outstanding foreign currency exchange contracts. See Note 5 of accompanying Notes. |
| |
| 20. | | A sufficient amount of liquid assets has been designated to cover outstanding written call options. See Note 7 of accompanying Notes. |
F26 | OPPENHEIMER STRATEGIC BOND FUND/ VA
| | |
| 21. | | Is or was an affiliate, as defined in the Investment Company Act of 1940, at or during the period ended December 31, 2008, by virtue of the Fund owning at least 5% of the voting securities of the issuer or as a result of the Fund and the issuer having the same investment adviser. Transactions during the period in which the issuer was an affiliate are as follows: |
| | | | | | | | | | | | | | | | | |
| | | Shares | | | Gross | | | Gross | | | Shares | |
| | | December 31, 2007 | | | Additions | | | Reductions | | | December 31, 2008 | |
| |
| OFI Liquid Assets Fund, LLC | | | — | | | | 429,325,708 | | | | 104,059,838 | | | | 325,265,870 | |
| Oppenheimer Institutional Money Market Fund, Cl. E | | | 587,306,313 | | | | 4,222,709,843 | | | | 4,495,599,335 | | | | 314,416,821 | |
| Oppenheimer Master Event-Linked Bond Fund, LLC | | | — | | | | 1,404,749 | | | | — | | | | 1,404,749 | |
| Oppenheimer Master Loan Fund, LLC | | | 14,194,313 | | | | — | | | | — | | | | 14,194,313 | |
| | | | | | | | | | | | | | | | | |
| | | | | | | | | | | | | | | Realized | |
| | | | | | | Value | | | Income | | | Gain/(Loss) | |
| |
| OFI Liquid Assets Fund, LLC | | | | | | $ | 325,265,870 | | | $ | 1,405,615 | a | | $ | — | |
| Oppenheimer Institutional Money Market Fund, Cl. E | | | | | | | 314,416,821 | | | | 16,462,436 | | | | — | |
| Oppenheimer Master Event-Linked Bond Fund, LLC | | | | | | | 13,761,909 | | | | 503,808 | b | | | 178,059 | b |
| Oppenheimer Master Loan Fund, LLC | | | | | | | 102,098,787 | | | | 11,532,172 | c | | | (4,315,961 | )c |
| | | | | | | |
| | | | | | | $ | 755,543,387 | | | $ | 29,904,031 | | | $ | (4,137,902 | ) |
| | | | | | | |
| | a. | | Net of compensation to the securities lending agent and rebates paid to the borrowing counterparties. |
| |
| | b. | | Represents the amount allocated to the Fund from Oppenheimer Master Event-Linked Bond Fund, LLC. |
| |
| | c. | | Represents the amount allocated to the Fund from Oppenheimer Master Loan Fund, LLC. |
| | |
| 22. | | Rate shown is the 7-day yield as of December 31, 2008. |
| |
| 23. | | The security/securities have been segregated to satisfy the forward commitment to return the cash collateral received in securities lending transactions upon the borrower’s return of the securities loaned. See Note 10 of accompanying Notes. |
| | | | | | | | | |
| | | Principal | | | | |
| | | Amount | | | | |
| | | Sold Short | | | Value | |
| |
Mortgage-Backed Obligations Sold Short—(0.1)% | | | | | | | | |
Federal National Mortgage Assn., 5%, 1/1/247
| | $ | (3,562,000 | ) | | $ | (3,656,058 | ) |
| (Proceeds $3,628,788) | | | | | | | | |
Valuation Inputs
Various data inputs are used in determining the value of each of the Fund’s investments as of the reporting period end. These data inputs are categorized in the following hierarchy under applicable financial accounting standards:
1) Level 1—quoted prices in active markets for identical assets or liabilities (including securities activelytraded on a securities exchange)
2) Level 2—inputs other than quoted prices that are observable for the asset (such as quoted prices forsimilar assets and market corroborated inputs such as interest rates, prepayment speeds, credit risks, etc.)
3) Level 3—unobservable inputs (including the Manager’s own judgments about assumptions that market participants would use in pricing the asset).
The market value of the Fund’s investments was determined based on the following inputs as of December 31, 2008:
| | | | | | | | | |
| | | Investments in | | | Other Financial | |
| Valuation Description | | Securities | | | Instruments* | |
| |
| Level 1—Quoted Prices | | $ | 756,438,321 | | | $ | (4,080,437 | ) |
| Level 2—Other Significant Observable Inputs | | | 3,134,767,144 | | | | (53,323,121 | ) |
| Level 3—Significant Unobservable Inputs | | | 377,567 | | | | — | |
| | | |
| Total | | $ | 3,891,583,032 | | | $ | (57,403,558 | ) |
| | | |
| | |
| * | | Other financial instruments include options written, currency contracts, futures, forwards, swap contracts, short contracts and unfunded loan commitments. Currency contracts, forwards and unfunded loan commitments are reported at their unrealized appreciation/depreciation at measurement date, which represents the change in the contract’s value from trade date. Futures are reported at their variation margin at measurement date, which represents the amount due to/from the Fund at that date. Options written, swaps and short contracts are reported at their market value at measurement date. |
See the accompanying Notes for further discussion of the methods used in determining value of the Fund’s investments, and a summary of changes to the valuation techniques, if any, during the reporting period.
F27 | OPPENHEIMER STRATEGIC BOND FUND/ VA
STATEMENT OF INVESTMENTS Continued
Footnotes to Statement of Investments Continued
Foreign Currency Exchange Contracts as of December 31, 2008 are as follows:
| | | | | | | | | | | | | | | | | | | | | | | | | |
| | | | | | | Contracts | | | | | | | | | | | | | | |
| | | | | | | Amount | | | Expiration | | | | | | | Unrealized | | | Unrealized | |
| Contract Description | | Buy/Sell | | | (000s) | | | Date | | | Value | | | Appreciation | | | Depreciation | |
| |
| Argentine Peso (ARP) | | Buy | | 22,800 | ARP | | | 2/3/09 | | | $ | 6,267,404 | | | $ | 679,168 | | | $ | — | |
| Australian Dollar (AUD) | | Sell | | 17,965 | AUD | | | 1/9/09-1/27/09 | | | | 12,752,407 | | | | — | | | | 798,928 | |
| Australian Dollar (AUD) | | Buy | | 28,035 | AUD | | | 1/16/09-2/3/09 | | | | 19,855,125 | | | | 1,131,925 | | | | — | |
| Brazilian Real (BRR) | | Sell | | 15,740 | BRR | | | 2/3/09 | | | | 6,731,205 | | | | — | | | | 276,417 | |
| Brazilian Real (BRR) | | Buy | | 112,958 | BRR | | | 2/3/09-1/5/10 | | | | 48,066,940 | | | | 3,556,527 | | | | 280,132 | |
| British Pound Sterling (GBP) | | Sell | | 16,875 | GBP | | | 1/9/09-2/5/09 | | | | 24,595,247 | | | | 6,827,231 | | | | — | |
| British Pound Sterling (GBP) | | Buy | | 16,810 | GBP | | | 1/16/09-2/3/09 | | | | 24,495,688 | | | | 36,364 | | | | 908,278 | |
| Canadian Dollar (CAD) | | Sell | | 52,585 | CAD | | | 1/9/09-2/9/09 | | | | 43,206,232 | | | | 1,078,951 | | | | 1,357,828 | |
| Canadian Dollar (CAD) | | Buy | | 4,420 | CAD | | | 1/16/09 | | | | 3,631,695 | | | | 154,118 | | | | — | |
| Chinese Renminbi (Yuan) (CNY) | | Buy | | 167,350 | CNY | | | 5/13/09-12/17/09 | | | | 23,996,852 | | | | 66,865 | | | | 858,090 | |
| Colombian Peso (COP) | | Sell | | 21,229,000 | COP | | | 1/21/09-4/2/09 | | | | 9,361,003 | | | | 12,628 | | | | 367,710 | |
| Czech Koruna (CZK) | | Sell | | 274,303 | CZK | | | 2/9/09-12/31/09 | | | | 14,244,197 | | | | 26,026 | | | | 632,351 | |
| Euro (EUR) | | Sell | | 94,305 | EUR | | | 1/9/09-3/3/09 | | | | 131,530,414 | | | | 2,783,968 | | | | 7,130,922 | |
| Euro (EUR) | | Buy | | 40,710 | EUR | | | 1/9/09-1/16/09 | | | | 56,821,566 | | | | 2,092,409 | | | | 2,506,521 | |
| Hong Kong Dollar (HKD) | | Sell | | 51,100 | HKD | | | 2/4/09 | | | | 6,595,067 | | | | 151 | | | | — | |
| Hungarian Forint (HUF) | | Sell | | 1,337,906 | HUF | | | 2/2/09-12/31/09 | | | | 7,042,153 | | | | 6,364 | | | | 487,866 | |
| Hungarian Forint (HUF) | | Buy | | 4,495,000 | HUF | | | 2/2/09 | | | | 23,664,489 | | | | 19,190 | | | | 466,627 | |
| Indian Rupee (INR) | | Sell | | 802,000 | INR | | | 2/3/09-3/9/09 | | | | 16,288,830 | | | | — | | | | 666,361 | |
| Indian Rupee (INR) | | Buy | | 324,000 | INR | | | 1/30/09 | | | | 6,612,245 | | | | 295,224 | | | | — | |
| Indonesia Rupiah (IDR) | | Buy | | 43,750,000 | IDR | | | 2/17/09-2/19/09 | | | | 3,852,595 | | | | 2,147 | | | | 28,857 | |
| Israeli Shekel (ILS) | | Sell | | 51,660 | ILS | | | 1/30/09-2/9/09 | | | | 13,642,344 | | | | 13,307 | | | | 401,415 | |
| Japanese Yen (JPY) | | Sell | | 7,740,000 | JPY | | | 1/16/09-2/5/09 | | | | 85,368,279 | | | | 160,555 | | | | 3,890,591 | |
| Japanese Yen (JPY) | | Buy | | 11,963,000 | JPY | | | 1/9/09-3/3/09 | | | | 131,928,005 | | | | 4,196,667 | | | | 26,797 | |
| Malaysian Ringgit (MYR) | | Sell | | 36,255 | MYR | | | 1/9/09-2/18/09 | | | | 10,435,435 | | | | — | | | | 113,812 | |
| Malaysian Ringgit (MYR) | | Buy | | 18,030 | MYR | | | 1/9/09-2/17/09 | | | | 5,181,918 | | | | 8,864 | | | | — | |
| Mexican Nuevo Peso (MXN) | | Sell | | 37,410 | MXN | | | 2/18/09 | | | | 2,683,640 | | | | 17,443 | | | | — | |
| Mexican Nuevo Peso (MXN) | | Buy | | 223,025 | MXN | | | 1/21/09-2/18/09 | | | | 16,071,076 | | | | — | | | | 260,518 | |
| New Taiwan Dollar (TWD) | | Sell | | 413,000 | TWD | | | 3/2/09 | | | | 12,611,137 | | | | — | | | | 196,805 | |
| New Turkish Lira (TRY) | | Sell | | 51,835 | TRY | | | 1/20/09-2/13/09 | | | | 33,220,797 | | | | — | | | | 1,005,366 | |
| New Turkish Lira (TRY) | | Buy | | 10,775 | TRY | | | 1/26/09 | | | | 6,920,666 | | | | 209,194 | | | | — | |
| New Zealand Dollar (NZD) | | Sell | | 4,305 | NZD | | | 1/27/09 | | | | 2,519,979 | | | | — | | | | 36,747 | |
| New Zealand Dollar (NZD) | | Buy | | 25,675 | NZD | | | 1/16/09 | | | | 15,054,656 | | | | — | | | | 3,753,397 | |
| Norwegian Krone (NOK) | | Sell | | 208,800 | NOK | | | 1/9/09 | | | | 30,035,420 | | | | — | | | | 191,927 | |
| Norwegian Krone (NOK) | | Buy | | 103,805 | NOK | | | 1/9/09-1/16/09 | | | | 14,926,519 | | | | 53,196 | | | | 3,338,659 | |
| Peruvian New Sol (PEN) | | Sell | | 70,534 | PEN | | | 1/7/09-2/26/09 | | | | 22,390,003 | | | | 410,732 | | | | — | |
| Philippines Peso (PHP) | | Sell | | 92,900 | PHP | | | 2/17/09 | | | | 1,932,214 | | | | — | | | | 125,138 | |
| Philippines Peso (PHP) | | Buy | | 325,000 | PHP | | | 1/26/09 | | | | 6,792,587 | | | | 413,784 | | | | — | |
| Polish Zloty (PLZ) | | Sell | | 90,218 | PLZ | | | 1/9/09-12/31/09 | | | | 30,286,191 | | | | 2,626,488 | | | | 144,496 | |
| Polish Zloty (PLZ) | | Buy | | 50,390 | PLZ | | | 1/9/09-2/3/09 | | | | 16,895,884 | | | | 12,699 | | | | 218,463 | |
| Russian Ruble (RUR) | | Sell | | 603,290 | RUR | | | 9/18/09-11/18/09 | | | | 17,277,621 | | | | 3,318,461 | | | | — | |
| Russian Ruble (RUR) | | Buy | | 222,470 | RUR | | | 2/11/09 | | | | 7,207,394 | | | | — | | | | 318,655 | |
| Singapore Dollar (SGD) | | Sell | | 9,900 | SGD | | | 1/30/09 | | | | 6,904,488 | | | | — | | | | 337,324 | |
| Singapore Dollar (SGD) | | Buy | | 2,060 | SGD | | | 1/9/09 | | | | 1,437,639 | | | | 28,610 | | | | — | |
| South African Rand (ZAR) | | Sell | | 176,355 | ZAR | | | 1/20/09 | | | | 18,644,512 | | | | — | | | | 2,225,002 | |
| South African Rand (ZAR) | | Buy | | 3,872 | ZAR | | | 12/31/09 | | | | 384,503 | | | | — | | | | 90,284 | |
| South Korean Won (KRW) | | Sell | | 9,610,000 | KRW | | | 1/30/09 | | | | 7,294,118 | | | | — | | | | 810,293 | |
| Swedish Krona (SEK) | | Sell | | 85,080 | SEK | | | 1/16/09 | | | | 10,865,402 | | | | 2,178,743 | | | | 110,588 | |
| Swiss Franc (CHF) | | Sell | | 91,405 | CHF | | | 1/9/09-2/4/09 | | | | 85,757,178 | | | | — | | | | 7,629,825 | |
| Swiss Franc (CHF) | | Buy | | 34,713 | CHF | | | 1/9/09-2/3/09 | | | | 32,561,136 | | | | 2,959,676 | | | | — | |
| Ukraine Hryvnia (UAH) | | Sell | | 12,850 | UAH | | | 1/28/09 | | | | 1,417,165 | | | | 343,107 | | | | — | |
| Ukraine Hryvnia (UAH) | | Buy | | 12,850 | UAH | | | 1/28/09 | | | | 1,417,165 | | | | — | | | | 1,048,769 | |
| | | | | | | | | | | | | | | | | | | |
| Total unrealized appreciation and depreciation | | | | | | | | | | | | | | | | | | $ | 35,720,782 | | | $ | 43,041,759 | |
| | | | | | | | | | | | | | | | | | | |
F28 | OPPENHEIMER STRATEGIC BOND FUND/ VA
Futures Contracts as of December 31, 2008 are as follows:
| | | | | | | | | | | | | | | | | | | | | |
| | | | | | | | | | | | | | | | | | | Unrealized | |
| | | | | | | Number of | | | Expiration | | | | | | | Appreciation | |
| Contract Description | | Buy/Sell | | | Contracts | | | Date | | | Value | | | (Depreciation) | |
| |
| Amsterdam Exchange Index | | Buy | | | 51 | | | | 1/16/09 | | | $ | 3,509,586 | | | $ | (49,843 | ) |
| CAC 40 10 Euro Index | | Sell | | | 143 | | | | 1/16/09 | | | | 6,433,242 | | | | (52,155 | ) |
| Canadian Bond, 10 yr. | | Buy | | | 241 | | | | 3/20/09 | | | | 25,108,211 | | | | 1,507,181 | |
| DAX Index | | Sell | | | 99 | | | | 3/20/09 | | | | 16,712,057 | | | | (535,972 | ) |
| DAX Index | | Buy | | | 36 | | | | 3/20/09 | | | | 6,077,112 | | | | 194,868 | |
| Euro-Bundesobligation, 5 yr. | | Buy | | | 2,065 | | | | 3/6/09 | | | | 335,171,195 | | | | 3,138,810 | |
| Euro-Bundesobligation, 10 yr. | | Buy | | | 2,276 | | | | 3/6/09 | | | | 396,852,525 | | | | 2,268,948 | |
| Euro-Bundesobligation, 10 yr. | | Sell | | | 68 | | | | 3/6/09 | | | | 11,856,754 | | | | (26,969 | ) |
| Euro-Schatz | | Buy | | | 591 | | | | 3/6/09 | | | | 88,711,079 | | | | 372,065 | |
| FTSE 100 Index | | Sell | | | 181 | | | | 3/20/09 | | | | 11,589,095 | | | | (388,718 | ) |
| FTSE 100 Index | | Buy | | | 17 | | | | 3/20/09 | | | | 1,088,479 | | | | 36,495 | |
| H Shares Index | | Sell | | | 70 | | | | 1/29/09 | | | | 3,566,295 | | | | (149,944 | ) |
| Japan (Government of) Bonds, 10 yr. | | Sell | | | 49 | | | | 3/11/09 | | | | 75,682,099 | | | | (590,489 | ) |
| Japan (Government of) Mini Bonds, 10 yr. | | Buy | | | 38 | | | | 3/10/09 | | | | 5,853,726 | | | | 30,151 | |
| Mexican Bolsa Index | | Sell | | | 215 | | | | 3/20/09 | | | | 3,581,140 | | | | (363,682 | ) |
| MSCI Taiwan Stock Index | | Buy | | | 182 | | | | 1/20/09 | | | | 3,174,080 | | | | 214,458 | |
| NASDAQ 100 E-Mini Index | | Sell | | | 468 | | | | 3/20/09 | | | | 11,349,000 | | | | 98,445 | |
| Nikkei 225 Index | | Sell | | | 99 | | | | 3/12/09 | | | | 9,635,913 | | | | (497,018 | ) |
| Nikkei 225 Index | | Buy | | | 38 | | | | 3/12/09 | | | | 3,698,633 | | | | 190,713 | |
| OMXS30 Index | | Sell | | | 711 | | | | 1/23/09 | | | | 5,985,705 | | | | 37,763 | |
| SGX CNX Nifty Index | | Sell | | | 568 | | | | 1/29/09 | | | | 3,368,240 | | | | 156,869 | |
| Standard & Poor’s 500 E-Mini | | Sell | | | 965 | | | | 3/20/09 | | | | 43,425,000 | | | | (712,762 | ) |
| Standard & Poor’s 500 E-Mini | | Buy | | | 154 | | | | 3/20/09 | | | | 6,930,000 | | | | 113,190 | |
| Standard & Poor’s/MIB Index, 10 yr. | | Buy | | | 27 | | | | 3/20/09 | | | | 3,662,105 | | | | 19,974 | |
| Standard & Poor’s/Toronto Stock Exchange 60 Index | | Buy | | | 67 | | | | 3/19/09 | | | | 5,946,133 | | | | 282,172 | |
| U.S. Treasury Bonds, 10 yr. | | Sell | | | 767 | | | | 3/20/09 | | | | 96,450,250 | | | | (4,342,008 | ) |
| U.S. Treasury Bonds, 10 yr. | | Buy | | | 1,327 | | | | 3/20/09 | | | | 166,870,250 | | | | 896,638 | |
| U.S. Treasury Bonds, 20 yr. | | Buy | | | 1,293 | | | | 3/20/09 | | | | 178,494,609 | | | | 13,693,696 | |
| U.S. Treasury Bonds, 20 yr. | | Sell | | | 121 | | | | 3/20/09 | | | | 16,703,672 | | | | (555,617 | ) |
| U.S. Treasury Bonds, 20 yr. | | Sell | | | 3,109 | | | | 3/31/09 | | | | 370,141,025 | | | | (8,911,488 | ) |
| U.S. Treasury Bonds, 20 yr. | | Buy | | | 583 | | | | 3/31/09 | | | | 69,408,883 | | | | 1,280,613 | |
| U.S. Treasury Nts., 2 yr. | | Sell | | | 1,335 | | | | 3/31/09 | | | | 291,113,438 | | | | (1,447,421 | ) |
| United Kingdom Long Gilt | | Sell | | | 8 | | | | 3/27/09 | | | | 1,440,648 | | | | (47,064 | ) |
| | | | | | | | | | | | | | | | | | | | |
| | | | | | | | | | | | | | | | | | | $ | 5,861,899 | |
| | | | | | | | | | | | | | | | | | | | |
Written Options as of December 31, 2008 are as follows:
| | | | | | | | | | | | | | | | | | | | | | | | | |
| | | | | | | Number of | | | Exercise | | | Expiration | | | Premiums | | | | |
| Description | | Type | | | Contracts | | | Price | | | Date | | | Received | | | Value | |
| |
| Euro (EUR) | | Call | | | 2,485,000 | | | $ | 1.411 | | | | 1/6/09 | | | $ | 40,673 | | | $ | (17,093 | ) |
| Euro (EUR) | | Call | | | 2,460,000 | | | | 1.392 | | | | 1/7/09 | | | | 37,847 | | | | (43,652 | ) |
| Euro (EUR) | | Put | | | 2,485,000 | | | | 1.411 | | | | 1/6/09 | | | | 40,673 | | | | (53,647 | ) |
| Euro (EUR) | | Put | | | 2,460,000 | | | | 1.392 | | | | 1/7/09 | | | | 37,847 | | | | (29,925 | ) |
| | | | | | | | | | | | | | | | | | | |
| | | | | | | | | | | | | | | | | | | $ | 157,040 | | | $ | (144,317 | ) |
| | | | | | | | | | | | | | | | | | | |
Credit Default Swap Contracts as of December 31, 2008 are as follows:
| | | | | | | | | | | | | | | | | | | | | | | | | | | | | |
| | | | | | | | | | | | | | | Pay/ | | | | | | | Upfront | | | | |
| | | | | | | Buy/Sell | | | Notional | | | Receive | | | | | | | Payment | | | | |
| | | | | | | Credit | | | Amount | | | Fixed | | | Termination | | | Received/ | | | | |
| Swap Reference Entity | | | Counterparty | | Protection | | | (000s) | | | Rate | | | Date | | | (Paid) | | | Value | |
| |
| ABX.HE.AA.06-2 Index: | | | | | | | | | | | | | | | | | | | | | | | | | | |
| | | | | Barclays Bank plc | | Sell | | $ | 1,630 | | | | 0.170 | % | | | 5/25/46 | | | $ | 1,260,997 | | | $ | (1,431,546 | ) |
| | | | | Deutsche Bank AG | | Sell | | | 720 | | | | 0.170 | | | | 5/25/46 | | | | 86,393 | | | | (632,339 | ) |
| | | | | Goldman Sachs International | | Sell | | | 240 | | | | 0.170 | | | | 5/25/46 | | | | 19,774 | | | | (210,780 | ) |
| | | | | Goldman Sachs International | | Sell | | | 970 | | | | 0.170 | | | | 5/25/46 | | | | 383,127 | | | | (851,902 | ) |
| | | | | Morgan Stanley Capital Services, Inc. | | Sell | | | 240 | | | | 0.170 | | | | 5/25/46 | | | | 19,174 | | | | (210,780 | ) |
| | | | | Morgan Stanley Capital Services, Inc. | | Sell | | | 480 | | | | 0.170 | | | | 5/25/46 | | | | 47,998 | | | | (421,560 | ) |
| | | | | | | | | | | | | | | | | | | | | | |
| | | | | | | Total | | | 4,280 | | | | | | | | | | | | 1,817,463 | | | | (3,758,907 | ) |
| | | | | | | | | | | | | | | | | | | | | | | | | | | | | |
| ABX-HE-AAA 06-2 Index: | | | | | | | | | | | | | | | | | | | | | | | | | | |
| | | | | Deutsche Bank AG | | Sell | | | 1,720 | | | | 0.110 | | | | 5/25/46 | | | | 85,989 | | | | (875,955 | ) |
| | | | | Deutsche Bank AG | | Sell | | | 1,720 | | | | 0.110 | | | | 5/25/46 | | | | 85,974 | | | | (875,955 | ) |
| | | | | Goldman Sachs International | | Sell | | | 1,000 | | | | 0.110 | | | | 5/25/46 | | | | 110,607 | | | | (509,276 | ) |
F29 | OPPENHEIMER STRATEGIC BOND FUND/ VA
STATEMENT OF INVESTMENTS Continued
Footnotes to Statement of Investments Continued
Credit Default Swap: Continued
| | | | | | | | | | | | | | | | | | | | | | | | | | | |
| | | | | | | | | | | | | Pay/ | | | | | | | Upfront | | | | |
| | | | | Buy/Sell | | | Notional | | | Receive | | | | | | | Payment | | | | |
| | | | | Credit | | | Amount | | | Fixed | | | Termination | | | Received/ | | | | |
| Swap Reference Entity | | Counterparty | | Protection | | | (000s) | | | Rate | | | Date | | | (Paid) | | | Value | |
| |
| ABX-HE-AAA 06-2 Index: Continued | | | | | | | | | | | | | | | | | | | | | | | | |
| | | Morgan Stanley Capital Services, Inc. | | Sell | | $ | 1,535 | | | | 0.110 | % | | | 5/25/46 | | | $ | 475,770 | | | $ | (781,739 | ) |
| | | UBS AG | | Sell | | | 1,035 | | | | 0.110 | | | | 5/25/46 | | | | 323,384 | | | | (527,101 | ) |
| | | | | | | | | | | | | | | | | | | | |
| | | | | Total | | | 7,010 | | | | | | | | | | | | 1,081,724 | | | | (3,570,026 | ) |
| | | | | | | | | | | | | | | | | | | | | | | | | | | |
| ARAMARK Corp.: | | | | | | | | | | | | | | | | | | | | | | | | | | |
| | | Credit Suisse International | | Sell | | | 690 | | | | 6.000 | | | | 3/20/13 | | | | — | | | | (12,360 | ) |
| | | Credit Suisse International | | Sell | | | 550 | | | | 4.750 | | | | 12/20/13 | | | | — | | | | (37,108 | ) |
| | | Morgan Stanley Capital Services, Inc. | | Sell | | | 750 | | | | 5.920 | | | | 3/20/13 | | | | — | | | | (15,430 | ) |
| | | | | | | | | | | | | | | | | | | | |
| | | | | Total | | | 1,990 | | | | | | | | | | | | — | | | | (64,898 | ) |
| | | | | | | | | | | | | | | | | | | | | | | | | | | |
| Bolivarian Republic of Venezuela | | Goldman Sachs International | | Sell | | | 645 | | | | 6.350 | | | | 5/20/13 | | | | — | | | | (318,048 | ) |
| | | | | | | | | | | | | | | | | | | | |
| | | | | Total | | | 645 | | | | | | | | | | | | — | | | | (318,048 | ) |
| | | | | | | | | | | | | | | | | | | | | | | | | | | |
| Cablevision Systems Corp. | | Citibank NA, New York | | Sell | | | 100 | | | | 3.100 | | | | 12/20/10 | | | | — | | | | (9,517 | ) |
| | | | | | | | | | | | | | | | | | | | |
| | | | | Total | | | 100 | | | | | | | | | | | | — | | | | (9,517 | ) |
| | | | | | | | | | | | | | | | | | | | | | | | | | | |
| Capmark Financial Group, Inc.: | | | | | | | | | | | | | | | | | | | | | | | | | | |
| | | Citibank NA, New York | | Sell | | | 2,480 | | | | 7.125 | | | | 12/20/12 | | | | — | | | | (1,132,110 | ) |
| | | Citibank NA, New York | | Sell | | | 1,620 | | | | 9.700 | | | | 12/20/12 | | | | — | | | | (682,095 | ) |
| | | Citibank NA, New York | | Sell | | | 1,350 | | | | 9.750 | | | | 12/20/12 | | | | — | | | | (567,483 | ) |
| | | Credit Suisse International | | Sell | | | 790 | | | | 5.200 | | | | 12/20/12 | | | | — | | | | (381,568 | ) |
| | | Credit Suisse International | | Sell | | | 415 | | | | 6.250 | | | | 12/20/12 | | | | — | | | | (194,445 | ) |
| | | Morgan Stanley Capital Services, Inc. | | Sell | | | 460 | | | | 7.400 | | | | 12/20/12 | | | | — | | | | (208,247 | ) |
| | | Morgan Stanley Capital Services, Inc. | | Sell | | | 415 | | | | 7.150 | | | | 12/20/12 | | | | — | | | | (189,303 | ) |
| | | | | | | | | | | | | | | | | | | | |
| | | | | Total | | | 7,530 | | | | | | | | | | | | — | | | | (3,355,251 | ) |
| | | | | | | | | | | | | | | | | | | | | | | | | | | |
| CDX North America High Yield Index, Series 7: | | | | | | | | | | | | | | | | | | | | | | | | |
| | | Credit Suisse International | | Sell | | | 1,254 | | | | 3.250 | | | | 12/20/11 | | | | (47,467 | ) | | | (125,935 | ) |
| | | Deutsche Bank AG | | Sell | | | 3,543 | | | | 3.250 | | | | 12/20/11 | | | | (134,056 | ) | | | (355,667 | ) |
| | | | | | | | | | | | | | | | | | | | |
| | | | | Total | | | 4,797 | | | | | | | | | | | | (181,523 | ) | | | (481,602 | ) |
| | | | | | | | | | | | | | | | | | | | | | | | | | | |
| CDX North America High Yield Index, Series 8: | | | | | | | | | | | | | | | | | | | | | | | | |
| | | Credit Suisse International | | Sell | | | 2,847 | | | | 2.750 | | | | 6/20/12 | | | | 144,826 | | | | (418,106 | ) |
| | | JPMorgan Chase Bank NA, NY Branch | | Sell | | | 3,425 | | | | 2.750 | | | | 6/20/12 | | | | 174,240 | | | | (503,023 | ) |
| | | | | | | | | | | | | | | | | | | | |
| | | | | Total | | | 6,272 | | | | | | | | | | | | 319,066 | | | | (921,129 | ) |
| | | | | | | | | | | | | | | | | | | | | | | | | | | |
| CDX North America High Yield Index, Series 9: | | | | | | | | | | | | | | | | | | | | | | | | |
| | | Deutsche Bank AG | | Sell | | | 7,512 | | | | 3.750 | | | | 12/20/12 | | | | (15,170 | ) | | | (1,399,706 | ) |
| | | JPMorgan Chase Bank NA, NY Branch | | Sell | | | 6,326 | | | | 3.750 | | | | 12/20/12 | | | | 6,724 | | | | (1,178,748 | ) |
| | | Morgan Stanley Capital Services, Inc. | | Sell | | | 5,767 | | | | 3.750 | | | | 12/20/12 | | | | 31,264 | | | | (1,074,660 | ) |
| | | | | | | | | | | | | | | | | | | | |
| | | | | Total | | | 19,605 | | | | | | | | | | | | 22,818 | | | | (3,653,114 | ) |
| | | | | | | | | | | | | | | | | | | | | | | | | | | |
| CDX North America High Yield Index, Series 10: | | | | | | | | | | | | | | | | | | | | | | | | |
| | | Credit Suisse International | | Sell | | | 11,050 | | | | 5.000 | | | | 6/20/13 | | | | 593,170 | | | | (1,732,118 | ) |
| | | Deutsche Bank AG | | Sell | | | 15,840 | | | | 5.000 | | | | 6/20/13 | | | | 508,200 | | | | (2,482,963 | ) |
| | | Deutsche Bank AG | | Sell | | | 12,740 | | | | 5.000 | | | | 6/20/13 | | | | 744,051 | | | | (1,997,030 | ) |
| | | Deutsche Bank AG | | Sell | | | 11,110 | | | | 5.000 | | | | 6/20/13 | | | | 738,352 | | | | (1,741,523 | ) |
| | | Deutsche Bank AG | | Sell | | | 5,495 | | | | 5.000 | | | | 6/20/13 | | | | 491,497 | | | | (855,994 | ) |
| | | Deutsche Bank AG | | Sell | | | 8,235 | | | | 5.000 | | | | 6/20/13 | | | | 766,312 | | | | (1,282,823 | ) |
| | | Goldman Sachs International | | Sell | | | 15,800 | | | | 5.000 | | | | 6/20/13 | | | | 459,736 | | | | (2,476,693 | ) |
| | | JPMorgan Chase Bank NA, NY Branch | | Sell | | | 15,840 | | | | 5.000 | | | | 6/20/13 | | | | 528,000 | | | | (2,482,963 | ) |
| | | JPMorgan Chase Bank NA, NY Branch | | Sell | | | 3,385 | | | | 5.000 | | | | 6/20/13 | | | | 302,769 | | | | (527,305 | ) |
| | | JPMorgan Chase Bank NA, NY Branch | | Sell | | | 4,125 | | | | 5.000 | | | | 6/20/13 | | | | 383,854 | | | | (642,580 | ) |
| | | Morgan Stanley Capital Services, Inc. | | Sell | | | 15,780 | | | | 5.000 | | | | 6/20/13 | | | | 543,533 | | | | (2,473,558 | ) |
| | | UBS AG | | Sell | | | 15,850 | | | | 5.000 | | | | 6/20/13 | | | | 516,226 | | | | (2,484,531 | ) |
| | | UBS AG | | Sell | | | 3,385 | | | | 5.000 | | | | 6/20/13 | | | | 302,769 | | | | (527,305 | ) |
| | | UBS AG | | Sell | | | 2,750 | | | | 5.000 | | | | 6/20/13 | | | | 255,903 | | | | (428,386 | ) |
| | | | | | | | | | | | | | | | | | | | |
| | | | | Total | | | 141,385 | | | | | | | | | | | | 7,134,372 | | | | (22,135,772 | ) |
F30 | OPPENHEIMER STRATEGIC BOND FUND/ VA
Credit Default Swap: Continued
| | | | | | | | | | | | | | | | | | | | | | | | | | | |
| | | | | | | | | | | | | Pay/ | | | | | | | Upfront | | | | |
| | | | | Buy/Sell | | | Notional | | | Receive | | | | | | | Payment | | | | |
| | | | | Credit | | | Amount | | | Fixed | | | Termination | | | Received/ | | | | |
| Swap Reference Entity | | Counterparty | | Protection | | | (000s) | | | Rate | | | Date | | | (Paid) | | | Value | |
| |
| CDX North America High Yield Index, Series 11: | | | | | | | | | | | | | | | | | | | | | | | | |
| | | Barclays Bank plc | | Sell | | $ | 8,275 | | | | 5.000 | % | | | 12/20/13 | | | $ | 1,553,861 | | | $ | (1,640,580 | ) |
| | | Barclays Bank plc | | Sell | | | 9,460 | | | | 5.000 | | | | 12/20/13 | | | | 1,776,378 | | | | (1,875,515 | ) |
| | | Barclays Bank plc | | Sell | | | 555 | | | | 5.000 | | | | 12/20/13 | | | | 99,823 | | | | (110,033 | ) |
| | | Barclays Bank plc | | Sell | | | 2,745 | | | | 5.000 | | | | 12/20/13 | | | | 493,719 | | | | (544,217 | ) |
| | | Barclays Bank plc | | Sell | | | 2,380 | | | | 5.000 | | | | 12/20/13 | | | | 409,889 | | | | (471,853 | ) |
| | | Barclays Bank plc | | Sell | | | 975 | | | | 5.000 | | | | 12/20/13 | | | | 171,437 | | | | (193,301 | ) |
| | | Barclays Bank plc | | Sell | | | 4,645 | | | | 5.000 | | | | 12/20/13 | | | | 905,130 | | | | (920,906 | ) |
| | | Barclays Bank plc | | Sell | | | 3,690 | | | | 5.000 | | | | 12/20/13 | | | | 750,813 | | | | (731,570 | ) |
| | | Barclays Bank plc | | Sell | | | 6,390 | | | | 5.000 | | | | 12/20/13 | | | | 1,267,350 | | | | (1,266,865 | ) |
| | | Barclays Bank plc | | Sell | | | 6,390 | | | | 5.000 | | | | 12/20/13 | | | | 1,299,300 | | | | (1,266,865 | ) |
| | | Credit Suisse International | | Sell | | | 8,275 | | | | 5.000 | | | | 12/20/13 | | | | 1,522,830 | | | | (1,640,580 | ) |
| | | Credit Suisse International | | Sell | | | 8,075 | | | | 5.000 | | | | 12/20/13 | | | | 1,529,764 | | | | (1,600,929 | ) |
| | | Credit Suisse International | | Sell | | | 2,815 | | | | 5.000 | | | | 12/20/13 | | | | 568,865 | | | | (558,095 | ) |
| | | Deutsche Bank AG | | Sell | | | 13,420 | | | | 5.000 | | | | 12/20/13 | | | | 2,566,575 | | | | (2,660,615 | ) |
| | | Merrill Lynch International | | Sell | | | 1,605 | | | | 5.000 | | | | 12/20/13 | | | | 276,194 | | | | (318,203 | ) |
| | | Morgan Stanley Capital Services, Inc. | | Sell | | | 8,050 | | | | 5.000 | | | | 12/20/13 | | | | 1,549,625 | | | | (1,595,972 | ) |
| | | Morgan Stanley Capital Services, Inc. | | Sell | | | 8,055 | | | | 5.000 | | | | 12/20/13 | | | | 1,690,431 | | | | (1,596,964 | ) |
| | | Morgan Stanley Capital Services, Inc. | | Sell | | | 8,275 | | | | 5.000 | | | | 12/20/13 | | | | 1,595,236 | | | | (1,640,580 | ) |
| | | UBS AG | | Sell | | | 8,060 | | | | 5.000 | | | | 12/20/13 | | | | 1,561,625 | | | | (1,597,955 | ) |
| | | | | | | | | | | | | | | | | | | | | | | | | | |
| | | | | | | | | | | | | | | | | | | | | |
| | | | | Total | | | 112,135 | | | | | | | | | | | | 21,588,845 | | | | (22,231,598 | ) |
| | | | | | | | | | | | | | | | | | | | | | | | | | | |
| CDX North America Investment Grade Index, Series 10: | | | | | | | | | | | | | | | | | | | | | |
| | | Barclays Bank plc | | Sell | | | 12,986 | | | | 1.550 | | | | 6/20/13 | | | | (268,597 | ) | | | (215,244 | ) |
| | | Barclays Bank plc | | Sell | | | 5,192 | | | | 1.550 | | | | 6/20/13 | | | | (118,435 | ) | | | (86,065 | ) |
| | | Barclays Bank plc | | Sell | | | 3,894 | | | | 1.550 | | | | 6/20/13 | | | | (22,848 | ) | | | (64,549 | ) |
| | | Morgan Stanley Capital Services, Inc. | | Sell | | | 12,986 | | | | 1.550 | | | | 6/20/13 | | | | (278,443 | ) | | | (215,244 | ) |
| | | Morgan Stanley Capital Services, Inc. | | Sell | | | 7,793 | | | | 1.550 | | | | 6/20/13 | | | | (146,662 | ) | | | (129,179 | ) |
| | | Morgan Stanley Capital Services, Inc. | | Sell | | | 3,894 | | | | 1.550 | | | | 6/20/13 | | | | (57,383 | ) | | | (64,549 | ) |
| | | | | | | | | | | | | | | | | | | | |
| | | | | Total | | | 46,745 | | | | | | | | | | | | (892,368 | ) | | | (774,830 | ) |
| | | | | | | | | | | | | | | | | | | | | | | | | | | |
| Cemex SAB de CV: | | | | | | | | | | | | | | | | | | | | | | | | |
| | | UBS AG | | Buy | | | 1,535 | | | | 5.300 | | | | 10/20/13 | | | | — | | | | 101,681 | |
| | | UBS AG | | Buy | | | 1,535 | | | | 5.300 | | | | 10/20/13 | | | | — | | | | 101,681 | |
| | | | | | | | | | | | | | | | | | | | |
| | | | | Total | | | 3,070 | | | | | | | | | | | | — | | | | 203,362 | |
| | | | | | | | | | | | | | | | | | | | | | | | | | | |
Charter Communications Holdings
LLC/Charter Communications
Holdings Capital: | | | | | | | | | | | | | | | | | | | | | | | | |
| | | Credit Suisse International | | Sell | | | 235 | | | | 5.000 | | | | 9/20/17 | | | | 47,000 | | | | (128,552 | ) |
| | | Credit Suisse International | | Sell | | | 285 | | | | 5.000 | | | | 9/20/17 | | | | 57,000 | | | | (155,903 | ) |
| | | | | | | | | | | | | | | | | | | | |
| | | | | Total | | | 520 | | | | | | | | | | | | 104,000 | | | | (284,455 | ) |
| | | | | | | | | | | | | | | | | | | | | | | | | | | |
| CMBX.3.AJ Index: | | | | | | | | | | | | | | | | | | | | | | | | |
| | | Goldman Sachs Bank USA | | Sell | | | 1,500 | | | | 1.470 | | | | 12/13/49 | | | | 184,417 | | | | (863,784 | ) |
| | | JPMorgan Chase Bank NA, NY Branch | | Sell | | | 700 | | | | 1.470 | | | | 12/13/49 | | | | 83,920 | | | | (403,099 | ) |
| | | JPMorgan Chase Bank NA, NY Branch | | Sell | | | 5,800 | | | | 1.470 | | | | 12/13/49 | | | | 1,282,806 | | | | (3,339,966 | ) |
| | | Morgan Stanley Capital Services, Inc. | | Sell | | | 2,050 | | | | 1.470 | | | | 12/13/49 | | | | 269,298 | | | | (1,180,505 | ) |
| | | | | | | | | | | | | | | | | | | | |
| | | | | Total | | | 10,050 | | | | | | | | | | | | 1,820,441 | | | | (5,787,354 | ) |
| | | | | | | | | | | | | | | | | | | | | | | | | | | |
| CMBX.4.AJ Index: | | | | | | | | | | | | | | | | | | | | | | | | |
| | | JPMorgan Chase Bank NA, NY Branch | | Sell | | | 700 | | | | 0.960 | | | | 2/17/51 | | | | 118,552 | | | | (435,414 | ) |
| | | Morgan Stanley Capital Services, Inc. | | Sell | | | 3,260 | | | | 0.960 | | | | 2/17/51 | | | | 670,524 | | | | (2,027,787 | ) |
| | | Morgan Stanley Capital Services, Inc. | | Sell | | | 2,050 | | | | 0.960 | | | | 2/17/51 | | | | 348,319 | | | | (1,280,858 | ) |
| | | | | | | | | | | | | | | | | | | | |
| | | | | Total | | | 6,010 | | | | | | | | | | | | 1,137,395 | | | | (3,744,059 | ) |
| | | | | | | | | | | | | | | | | | | | | | | | | | | |
| CMBX.AAA.4 Index: | | | | | | | | | | | | | | | | | | | | | | | | | | |
| | | Credit Suisse International | | Buy | | | 6,250 | | | | 0.350 | | | | 2/17/51 | | | | (2,037,952 | ) | | | 1,904,199 | |
| | | JPMorgan Chase Bank NA, NY Branch | | Buy | | | 12,500 | | | | 0.350 | | | | 2/17/51 | | | | (4,075,903 | ) | | | 3,808,398 | |
| | | Morgan Stanley Capital Services, Inc. | | Buy | | | 14,100 | | | | 0.350 | | | | 2/17/51 | | | | (4,496,814 | ) | | | 4,295,873 | |
| | | Morgan Stanley Capital Services, Inc. | | Buy | | | 12,500 | | | | 0.350 | | | | 2/17/51 | | | | (3,866,610 | ) | | | 3,808,398 | |
| | | | | | | | | | | | | | | | | | | | |
| | | | | Total | | | 45,350 | | | | | | | | | | | | (14,477,279 | ) | | | 13,816,868 | |
F31 | OPPENHEIMER STRATEGIC BOND FUND/ VA
STATEMENT OF INVESTMENTS Continued
Footnotes to Statement of Investments Continued
Credit Default Swap: Continued
| | | | | | | | | | | | | | | | | | | | | | | | | | | |
| | | | | | | | | | | | | Pay/ | | | | | | | Upfront | | | | |
| | | | | Buy/Sell | | | Notional | | | Receive | | | | | | | Payment | | | | |
| | | | | Credit | | | Amount | | | Fixed | | | Termination | | | Received/ | | | | |
| Swap Reference Entity | | Counterparty | | Protection | | | (000s) | | | Rate | | | Date | | | (Paid) | | | Value | |
| |
| Constellation Brands, Inc. JPMorgan Chase Bank NA, NY Branch | | Sell | | $ | 525 | | | | 3.970 | % | | | 9/20/13 | | | $ | — | | | $ | (21,244 | ) |
| | | | | | | | | | | | | | | | | | | | |
| | | | | Total | | | 525 | | | | | | | | | | | | — | | | | (21,244 | ) |
| | | | | | | | | | | | | | | | | | | | | | | | | | | |
| Dean Foods Co.: | | | | | | | | | | | | | | | | | | | | | | | | | | |
| | | JPMorgan Chase Bank NA, NY Branch | | Sell | | | 915 | | | | 1.030 | | | | 6/20/11 | | | | — | | | | (72,325 | ) |
| | | JPMorgan Chase Bank NA, NY Branch | | Sell | | | 915 | | | | 1.060 | | | | 6/20/11 | | | | — | | | | (71,704 | ) |
| | | JPMorgan Chase Bank NA, NY Branch | | Sell | | | 500 | | | | 1.050 | | | | 6/20/11 | | | | — | | | | (39,296 | ) |
| | | JPMorgan Chase Bank NA, NY Branch | | Sell | | | 975 | | | | 1.080 | | | | 6/20/11 | | | | — | | | | (75,965 | ) |
| | | | | | | | | | | | | | | | | | | | |
| | | | | Total | | | 3,305 | | | | | | | | | | | | — | | | | (259,290 | ) |
| | | | | | | | | | | | | | | | | | | | | | | | | | | |
| Development Bank of Kazakhstan JSC Credit Suisse International | | Sell | | | 8,170 | | | | 3.750 | | | | 2/20/13 | | | | — | | | | (1,608,114 | ) |
| | | | | | | | | | | | | | | | | | | | |
| | | | | Total | | | 8,170 | | | | | | | | | | | | — | | | | (1,608,114 | ) |
| | | | | | | | | | | | | | | | | | | | | | | | | | | |
| Eastman Kodak Co.: | | | | | | | | | | | | | | | | | | | | | | | | | | |
| | | Credit Suisse International | | Buy | | | 625 | | | | 4.050 | | | | 12/20/18 | | | | — | | | | 105,619 | |
| | | Credit Suisse International | | Buy | | | 665 | | | | 4.010 | | | | 12/20/18 | | | | — | | | | 113,821 | |
| | | Credit Suisse International | | Buy | | | 1,110 | | | | 3.700 | | | | 12/20/18 | | | | — | | | | 208,640 | |
| | | | | | | | | | | | | | | | | | | | |
| | | | | Total | | | 2,400 | | | | | | | | | | | | — | | | | 428,080 | |
| | | | | | | | | | | | | | | | | | | | |
| | | Barclays Bank plc | | Sell | | | 625 | | | | 4.000 | | | | 12/20/13 | | | | — | | | | (81,833 | ) |
| | | Barclays Bank plc | | Sell | | | 665 | | | | 3.960 | | | | 12/20/13 | | | | — | | | | (88,027 | ) |
| | | Credit Suisse International | | Sell | | | 1,110 | | | | 3.650 | | | | 12/20/13 | | | | — | | | | (159,302 | ) |
| | | | | | | | | | | | | | | | | | | | |
| | | | | Total | | | 2,400 | | | | | | | | | | | | — | | | | (329,162 | ) |
| | | | | | | | | | | | | | | | | | | | | | | | | | | |
| El Paso Corp.: | | | | | | | | | | | | | | | | | | | | | | | | | | |
| | | Credit Suisse International | | Sell | | | 435 | | | | 2.800 | | | | 3/20/18 | | | | — | | | | (114,622 | ) |
| | | Merrill Lynch International | | Sell | | | 460 | | | | 2.900 | | | | 3/20/18 | | | | — | | | | (118,946 | ) |
| | | Merrill Lynch International | | Sell | | | 1,175 | | | | 2.890 | | | | 3/20/18 | | | | — | | | | (304,407 | ) |
| | | | | | | | | | | | | | | | | | | | |
| | | | | Total | | | 2,070 | | | | | | | | | | | | — | | | | (537,975 | ) |
| | | | | | | | | | | | | | | | | | | | | | | | | | | |
| Energy Future Holdings Corp.: | | | | | | | | | | | | | | | | | | | | | | | | | | |
| | | Credit Suisse International | | Sell | | | 940 | | | | 1.530 | | | | 6/20/11 | | | | — | | | | (281,156 | ) |
| | | Credit Suisse International | | Sell | | | 490 | | | | 1.610 | | | | 6/20/11 | | | | — | | | | (145,886 | ) |
| | | Merrill Lynch International | | Sell | | | 935 | | | | 1.530 | | | | 6/20/11 | | | | — | | | | (279,661 | ) |
| | | Merrill Lynch International | | Sell | | | 960 | | | | 1.580 | | | | 6/20/11 | | | | — | | | | (286,313 | ) |
| | | Merrill Lynch International | | Sell | | | 960 | | | | 1.590 | | | | 6/20/11 | | | | — | | | | (286,148 | ) |
| | | Merrill Lynch International | | Sell | | | 1,210 | | | | 1.620 | | | | 6/20/11 | | | | — | | | | (360,041 | ) |
| | | Merrill Lynch International | | Sell | | | 1,405 | | | | 2.060 | | | | 6/20/11 | | | | — | | | | (407,433 | ) |
| | | | | | | | | | | | | | | | | | | | |
| | | | | Total | | | 6,900 | | | | | | | | | | | | — | | | | (2,046,638 | ) |
| | | | | | | | | | | | | | | | | | | | | | | | | | | |
| Federative Republic of Brazil | | | | | | | | | | | | | | | | | | | | | | | | | | |
| | | Citibank NA, New York | | Sell | | | 3,250 | | | | 4.250 | | | | 12/20/13 | | | | — | | | | 183,797 | |
| | | | | | | | | | | | | | | | | | | | |
| | | | | Total | | | 3,250 | | | | | | | | | | | | — | | | | 183,797 | |
| | | | | | | | | | | | | | | | | | | | | | | | | | | |
| Ford Motor Co.: | | | | | | | | | | | | | | | | | | | | | | | | | | |
| | | Deutsche Bank AG | | Sell | | | 720 | | | | 5.000 | | | | 12/20/18 | | | | 388,800 | | | | (508,518 | ) |
| | | Deutsche Bank AG | | Sell | | | 2,065 | | | | 6.000 | | | | 12/20/16 | | | | — | | | | (1,376,816 | ) |
| | | Deutsche Bank AG | | Sell | | | 3,180 | | | | 5.850 | | | | 12/20/16 | | | | — | | | | (2,124,056 | ) |
| | | Deutsche Bank AG | | Sell | | | 2,540 | | | | 5.800 | | | | 12/20/16 | | | | — | | | | (1,697,591 | ) |
| | | JPMorgan Chase Bank NA, NY Branch | | Sell | | | 2,065 | | | | 6.000 | | | | 12/20/16 | | | | — | | | | (1,376,816 | ) |
| | | Merrill Lynch International | | Sell | | | 2,450 | | | | 5.300 | | | | 12/20/12 | | | | — | | | | (1,552,270 | ) |
| | | Morgan Stanley Capital Services, Inc. | | Sell | | | 2,065 | | | | 6.150 | | | | 12/20/16 | | | | — | | | | (1,374,332 | ) |
| | | Morgan Stanley Capital Services, Inc. | | Sell | | | 1,690 | | | | 5.000 | | | | 12/20/13 | | | | 929,500 | | | | (1,145,006 | ) |
| | | Morgan Stanley Capital Services, Inc. | | Sell | | | 520 | | | | 5.900 | | | | 12/20/16 | | | | — | | | | (347,121 | ) |
| | | | | | | | | | | | | | | | | | | | |
| | | | | Total | | | 17,295 | | | | | | | | | | | | 1,318,300 | | | | (11,502,526 | ) |
F32 | OPPENHEIMER STRATEGIC BOND FUND/ VA
Credit Default Swap: Continued
| | | | | | | | | | | | | | | | | | | | | | | | | | | |
| | | | | | | | | | | | | Pay/ | | | | | | | Upfront | | | | |
| | | | | Buy/Sell | | | Notional | | | Receive | | | | | | | Payment | | | | |
| | | | | Credit | | | Amount | | | Fixed | | | Termination | | | Received/ | | | | |
| Swap Reference Entity | | Counterparty | | Protection | | | (000s) | | | Rate | | | Date | | | (Paid) | | | Value | |
| |
| Ford Motor Credit Co. LLC: | | | | | | | | | | | | | | | | | | | | | | | | |
| | | Citibank NA, New York | | Sell | | $ | 1,800 | | | | 2.320 | % | | | 3/20/12 | | | $ | — | | | $ | (287,548 | ) |
| | | Credit Suisse International | | Sell | | | 3,425 | | | | 2.385 | | | | 3/20/12 | | | | — | | | | (546,655 | ) |
| | | Credit Suisse International | | Sell | | | 1,150 | | | | 2.550 | | | | 3/20/12 | | | | — | | | | (183,135 | ) |
| | | Deutsche Bank AG | | Sell | | | 2,760 | | | | 2.390 | | | | 3/20/12 | | | | — | | | | (440,486 | ) |
| | | | | | | | | | | | | | | | | | | | |
| | | | | Total | | | 9,135 | | | | | | | | | | | | — | | | | (1,457,824 | ) |
| | | | | | | | | | | | | | | | | | | | | | | | | | | |
| General Electric Capital Corp.: | | | | | | | | | | | | | | | | | | | | | | | | |
| | | Barclays Bank plc | | Sell | | | 1,064 | | | | 8.000 | | | | 12/20/09 | | | | — | | | | 31,349 | |
| | | Barclays Bank plc | | Sell | | | 1,745 | | | | 5.750 | | | | 12/20/09 | | | | — | | | | 13,658 | |
| | | Credit Suisse International | | Sell | | | 936 | | | | 8.000 | | | | 12/20/09 | | | | — | | | | 27,577 | |
| | | | | | | | | | | | | | | | | | | | |
| | | | | Total | | | 3,745 | | | | | | | | | | | | — | | | | 72,584 | |
| | | | | | | | | | | | | | | | | | | | | | | | | | | |
| General Motors Corp.: | | | | | | | | | | | | | | | | | | | | | | | | | | |
| | | Deutsche Bank AG | | Sell | | | 3,465 | | | | 5.000 | | | | 12/20/13 | | | | 2,217,600 | | | | (2,742,500 | ) |
| | | Deutsche Bank AG | | Sell | | | 3,220 | | | | 5.000 | | | | 12/20/18 | | | | 2,157,400 | | | | (2,549,307 | ) |
| | | Deutsche Bank AG | | Sell | | | 1,650 | | | | 4.750 | | | | 12/20/16 | | | | — | | | | (1,320,188 | ) |
| | | Deutsche Bank AG | | Sell | | | 2,035 | | | | 4.680 | | | | 12/20/16 | | | | — | | | | (1,629,468 | ) |
| | | Goldman Sachs Bank USA | | Sell | | | 1,650 | | | | 4.950 | | | | 12/20/16 | | | | — | | | | (1,317,326 | ) |
| | | JPMorgan Chase Bank NA, NY Branch | | Sell | | | 2,545 | | | | 4.750 | | | | 12/20/16 | | | | — | | | | (2,036,291 | ) |
| | | Merrill Lynch International | | Sell | | | 1,635 | | | | 4.050 | | | | 12/20/12 | | | | — | | | | (1,307,365 | ) |
| | | Morgan Stanley Capital Services, Inc. | | Sell | | | 1,650 | | | | 4.900 | | | | 12/20/16 | | | | — | | | | (1,318,041 | ) |
| | | Morgan Stanley Capital Services, Inc. | | Sell | | | 420 | | | | 4.620 | | | | 12/20/16 | | | | — | | | | (336,522 | ) |
| | | | | | | | | | | | | | | | | | | | |
| | | | | Total | | | 18,270 | | | | | | | | | | | | 4,375,000 | | | | (14,557,008 | ) |
| | | | | | | | | | | | | | | | | | | | | | | | | | | |
| Gisad Dis Ticaret AS | | Morgan Stanley Capital Services, Inc. | | Sell | | 6,386 EUR | | | 3.000 | | | | 3/23/13 | | | | — | | | | (847,671 | ) |
| | | | | | | | | | | | | | | | | | | | |
| | | | | Total | | 6,386 EUR | | | | | | | | | | | — | | | | (847,671 | ) |
| | | | | | | | | | | | | | | | | | | | | | | | | | | |
| GMAC LLC: | | | | | | | | | | | | | | | | | | | | | | | | | | |
| | | Credit Suisse International | | Sell | | | 1,690 | | | | 1.390 | | | | 3/20/17 | | | | — | | | | (496,187 | ) |
| | | Credit Suisse International | | Sell | | | 3,205 | | | | 5.000 | | | | 3/20/09 | | | | 464,725 | | | | (376,357 | ) |
| | | Goldman Sachs International | | Sell | | | 1,040 | | | | 1.390 | | | | 3/20/17 | | | | — | | | | (305,346 | ) |
| | | Goldman Sachs International | | Sell | | | 1,200 | | | | 1.370 | | | | 3/20/17 | | | | — | | | | (352,634 | ) |
| | | | | | | | | | | | | | | | | | | | |
| | | | | Total | | | 7,135 | | | | | | | | | | | | 464,725 | | | | (1,530,524 | ) |
| | | | | | | | | | | | | | | | | | | | | | | | | | | |
| Harrah’s Operating Co., Inc. Credit Suisse International | | Sell | | | 1,275 | | | | 5.000 | | | | 3/20/10 | | | | 81,281 | | | | (291,481 | ) |
| | | | | | | | | | | | | | | | | | | | |
| | | | | Total | | | 1,275 | | | | | | | | | | | | 81,281 | | | | (291,481 | ) |
| | | | | | | | | | | | | | | | | | | | | | | | | | | |
| HSBK Europe BV: | | | | | | | | | | | | | | | | | | | | | | | | | | |
| | | Credit Suisse International | | Sell | | | 1,600 | | | | 4.950 | | | | 3/20/13 | | | | — | | | | (258,177 | ) |
| | | Morgan Stanley Capital Services, Inc. | | Sell | | | 3,200 | | | | 4.780 | | | | 3/20/13 | | | | — | | | | (532,357 | ) |
| | | Morgan Stanley Capital Services, Inc. | | Sell | | | 3,200 | | | | 4.880 | | | | 3/20/13 | | | | — | | | | (522,943 | ) |
| | | | | | | | | | | | | | | | | | | | |
| | | | | Total | | | 8,000 | | | | | | | | | | | | — | | | | (1,313,477 | ) |
| | | | | | | | | | | | | | | | | | | | | | | | | | | |
| Idearc, Inc.: | | | | | | | | | | | | | | | | | | | | | | | | | | |
| | | Credit Suisse International | | Sell | | | 35 | | | | 5.000 | | | | 12/20/09 | | | | 7,175 | | | | (25,319 | ) |
| | | Goldman Sachs International | | Sell | | | 1,560 | | | | 5.000 | | | | 9/20/09 | | | | 213,150 | | | | (1,138,498 | ) |
| | | JPMorgan Chase Bank NA, NY Branch | | Sell | | | 315 | | | | 5.000 | | | | 9/20/09 | | | | 40,950 | | | | (229,889 | ) |
| | | | | | | | | | | | | | | | | | | | |
| | | | | Total | | | 1,910 | | | | | | | | | | | | 261,275 | | | | (1,393,706 | ) |
| | | | | | | | | | | | | | | | | | | | | | | | | | | |
| Intelsat Ltd.: | | | | | | | | | | | | | | | | | | | | | | | | | | |
| | | Citibank NA, New York | | Sell | | | 430 | | | | 5.000 | | | | 3/20/09 | | | | — | | | | 774 | |
| | | Credit Suisse International | | Sell | | | 425 | | | | 4.400 | | | | 3/20/09 | | | | — | | | | 664 | |
| | | Credit Suisse International | | Sell | | | 50 | | | | 5.750 | | | | 3/20/09 | | | | — | | | | 105 | |
| | | Deutsche Bank AG | | Sell | | | 175 | | | | 4.400 | | | | 3/20/09 | | | | — | | | | 274 | |
| | | Deutsche Bank AG | | Sell | | | 430 | | | | 4.750 | | | | 3/20/09 | | | | — | | | | 731 | |
| | | Deutsche Bank AG | | Sell | | | 260 | | | | 5.000 | | | | 3/20/09 | | | | — | | | | 468 | |
| | | | | | | | | | | | | | | | | | | | |
| | | | | Total | | | 1,770 | | | | | | | | | | | | — | | | | 3,016 | |
F33 | OPPENHEIMER STRATEGIC BOND FUND/ VA
STATEMENT OF INVESTMENTS Continued
Footnotes to Statement of Investments Continued
Credit Default Swap: Continued
| | | | | | | | | | | | | | | | | | | | | | | | | | | |
| | | | | | | | | | | | | Pay/ | | | | | | | Upfront | | | | |
| | | | | Buy/Sell | | | Notional | | | Receive | | | | | | | Payment | | | | |
| | | | | Credit | | | Amount | | | Fixed | | | Termination | | | Received/ | | | | |
| Swap Reference Entity | | Counterparty | | Protection | | | (000s) | | | Rate | | | Date | | | (Paid) | | | Value | |
| |
| Islamic Republic of Pakistan Citibank NA, New York | | Sell | | $ | 1,570 | | | | 5.100 | % | | | 3/20/13 | | | $ | — | | | $ | (680,019 | ) |
| | | | | | | | | | | | | | | | | | | | |
| | | | | Total | | | 1,570 | | | | | | | | | | | | — | | | | (680,019 | ) |
| | | | | | | | | | | | | | | | | | | | | | | | | | | |
| Istanbul Bond Company SA | | Morgan Stanley Capital Services, Inc. | | Sell | | | 5,180 | | | | 1.300 | | | | 3/24/13 | | | | — | | | | (950,334 | ) |
| | | | | | | | | | | | | | | | | | | | |
| | | | | Total | | | 5,180 | | | | | | | | | | | | — | | | | (950,334 | ) |
| | | | | | | | | | | | | | | | | | | | | | | | | | | |
| iStar Financial, Inc.: | | | | | | | | | | | | | | | | | | | | | | | | | | |
| | | Credit Suisse International | | Sell | | | 100 | | | | 4.000 | | | | 12/20/12 | | | | — | | | | (54,469 | ) |
| | | Credit Suisse International | | Sell | | | 765 | | | | 4.150 | | | | 12/20/12 | | | | — | | | | (415,969 | ) |
| | | Credit Suisse International | | Sell | | | 410 | | | | 12.000 | | | | 3/20/09 | | | | — | | | | (44,835 | ) |
| | | Deutsche Bank AG | | Sell | | | 560 | | | | 4.320 | | | | 12/20/12 | | | | — | | | | (303,901 | ) |
| | | Deutsche Bank AG | | Sell | | | 770 | | | | 4.500 | | | | 12/20/12 | | | | — | | | | (416,992 | ) |
| | | Deutsche Bank AG | | Sell | | | 935 | | | | 4.000 | | | | 12/20/12 | | | | — | | | | (509,289 | ) |
| | | Deutsche Bank AG | | Sell | | | 1,015 | | | | 12.000 | | | | 3/20/09 | | | | — | | | | (110,994 | ) |
| | | Goldman Sachs International | | Sell | | | 2,060 | | | | 3.950 | | | | 12/20/12 | | | | — | | | | (1,122,719 | ) |
| | | Morgan Stanley Capital Services, Inc. | | Sell | | | 450 | | | | 4.860 | | | | 12/20/12 | | | | — | | | | (242,677 | ) |
| | | UBS AG | | Sell | | | 410 | | | | 4.560 | | | | 12/20/12 | | | | — | | | | (221,880 | ) |
| | | | | | | | | | | | | | | | | | | | |
| | | | | Total | | | 7,475 | | | | | | | | | | | | — | | | | (3,443,725 | ) |
| | | | | | | | | | | | | | | | | | | | | | | | | | | |
| Jefferson Smurfit Corp. US: | | | | | | | | | | | | | | | | | | | | | | | | | | |
| | | Citibank NA, New York | | Sell | | | 275 | | | | 8.000 | | | | 12/20/13 | | | | — | | | | (198,315 | ) |
| | | Merrill Lynch International | | Sell | | | 515 | | | | 6.700 | | | | 6/20/13 | | | | — | | | | (377,023 | ) |
| | | Merrill Lynch International | | Sell | | | 640 | | | | 6.800 | | | | 6/20/13 | | | | — | | | | (467,986 | ) |
| | | Merrill Lynch International | | Sell | | | 685 | | | | 7.950 | | | | 12/20/13 | | | | — | | | | (494,281 | ) |
| | | | | | | | | | | | | | | | | | | | |
| | | | | Total | | | 2,115 | | | | | | | | | | | | — | | | | (1,537,605 | ) |
| | | | | | | | | | | | | | | | | | | | | | | | | | | |
| Massey Energy Co.: | | | | | | | | | | | | | | | | | | | | | | | | | | |
| | | Credit Suisse International | | Sell | | | 605 | | | | 5.000 | | | | 3/20/13 | | | | — | | | | (42,079 | ) |
| | | Credit Suisse International | | Sell | | | 215 | | | | 5.000 | | | | 3/20/13 | | | | — | | | | (14,954 | ) |
| | | UBS AG | | Sell | | | 360 | | | | 5.050 | | | | 9/20/12 | | | | — | | | | (25,187 | ) |
| | | UBS AG | | Sell | | | 600 | | | | 5.100 | | | | 9/20/12 | | | | — | | | | (41,093 | ) |
| | | | | | | | | | | | | | | | | | | | |
| | | | | Total | | | 1,780 | | | | | | | | | | | | — | | | | (123,313 | ) |
| | | | | | | | | | | | | | | | | | | | | | | | | | | |
| MGM Mirage: | | | | | | | | | | | | | | | | | | | | | | | | | | |
| | | Citibank NA, New York | | Sell | | | 1,465 | | | | 5.000 | | | | 12/20/13 | | | | 483,450 | | | | (537,504 | ) |
| | | Credit Suisse International | | Sell | | | 1,565 | | | | 5.000 | | | | 12/20/13 | | | | 391,250 | | | | (574,193 | ) |
| | | Credit Suisse International | | Sell | | | 545 | | | | 8.400 | | | | 12/20/13 | | | | — | | | | (156,837 | ) |
| | | Goldman Sachs International | | Sell | | | 905 | | | | 8.400 | | | | 12/20/13 | | | | — | | | | (260,435 | ) |
| | | | | | | | | | | | | | | | | | | | |
| | | | | Total | | | 4,480 | | | | | | | | | | | | 874,700 | | | | (1,528,969 | ) |
| | | | | | | | | | | | | | | | | | | | | | | | | | | |
| Morgan Stanley: | | | | | | | | | | | | | | | | | | | | | | | | | | |
| | | Citibank NA, New York | | Sell | | | 1,910 | | | | 7.800 | | | | 12/20/13 | | | | — | | | | 285,683 | |
| | | JPMorgan Chase Bank NA, NY Branch | | Sell | | | 2,250 | | | | 7.800 | | | | 12/20/13 | | | | — | | | | 336,537 | |
| | | | | | | | | | | | | | | | | | | | |
| | | | | Total | | | 4,160 | | | | | | | | | | | | — | | | | 622,220 | |
| | | | | | | | | | | | | | | | | | | | | | | | | | | |
| Nalco Co.: | | | | | | | | | | | | | | | | | | | | | | | | | | |
| | | Barclays Bank plc | | Sell | | | 575 | | | | 4.500 | | | | 9/20/13 | | | | — | | | | (57,247 | ) |
| | | Citibank NA, New York | | Sell | | | 595 | | | | 3.600 | | | | 9/20/12 | | | | — | | | | (59,269 | ) |
| | | Citibank NA, New York | | Sell | | | 555 | | | | 4.170 | | | | 9/20/13 | | | | — | | | | (61,684 | ) |
| | | Goldman Sachs Bank USA | | Sell | | | 555 | | | | 4.250 | | | | 9/20/13 | | | | — | | | | (60,126 | ) |
| | | Goldman Sachs International | | Sell | | | 660 | | | | 3.700 | | | | 9/20/12 | | | | — | | | | (63,767 | ) |
| | | Goldman Sachs International | | Sell | | | 590 | | | | 4.700 | | | | 9/20/13 | | | | — | | | | (54,598 | ) |
| | | Goldman Sachs International | | Sell | | | 1,070 | | | | 4.700 | | | | 9/20/13 | | | | — | | | | (99,017 | ) |
| | | JPMorgan Chase Bank NA, NY Branch | | Sell | | | 590 | | | | 4.650 | | | | 9/20/13 | | | | — | | | | (55,634 | ) |
| | | | | | | | | | | | | | | | | | | | |
| | | | | Total | | | 5,190 | | | | | | | | | | | | — | | | | (511,342 | ) |
F34 | OPPENHEIMER STRATEGIC BOND FUND/ VA
Credit Default Swap: Continued
| | | | | | | | | | | | | | | | | | | | | | | | | | | |
| | | | | | | | | | | | | Pay/ | | | | | | | Upfront | | | | |
| | | | | Buy/Sell | | | Notional | | | Receive | | | | | | | Payment | | | | |
| | | | | Credit | | | Amount | | | Fixed | | | Termination | | | Received/ | | | | |
| Swap Reference Entity | | Counterparty | | Protection | | | (000s) | | | Rate | | | Date | | | (Paid) | | | Value | |
| |
| Owens-Illinois, Inc.: | | | | | | | | | | | | | | | | | | | | | | | | |
| | | Citibank NA, New York | | Sell | | $ | 520 | | | | 2.500 | % | | | 6/20/13 | | | $ | — | | | $ | (25,236 | ) |
| | | Credit Suisse International | | Sell | | | 305 | | | | 2.500 | | | | 6/20/13 | | | | — | | | | (14,802 | ) |
| | | Deutsche Bank AG | | Sell | | | 145 | | | | 2.500 | | | | 6/20/13 | | | | — | | | | (7,037 | ) |
| | | | | | | | | | | | | | | | | | | | |
| | | | | Total | | | 970 | | | | | | | | | | | | — | | | | (47,075 | ) |
| | | | | | | | | | | | | | | | | | | | | | | | | | | |
| PEMEX Project Funding Master | | Goldman Sachs International | | Buy | | | 1,005 | | | | 3.450 | | | | 11/20/13 | | | | — | | | | (16,121 | ) |
| | | | | | | | | | | | | | | | | | | | |
| | | | | Total | | | 1,005 | | | | | | | | | | | | — | | | | (16,121 | ) |
| | | | | | | | | | | | | | | | | | | | | | | | | | | |
| Reliant Energy, Inc.: | | | | | | | | | | | | | | | | | | | | | | | | | | |
| | | Citibank NA, New York | | Sell | | | 500 | | | | 2.450 | | | | 9/20/11 | | | | — | | | | (72,858 | ) |
| | | Citibank NA, New York | | Sell | | | 1,200 | | | | 2.600 | | | | 9/20/11 | | | | — | | | | (170,831 | ) |
| | | Credit Suisse International | | Sell | | | 970 | | | | 5.750 | | | | 12/20/13 | | | | — | | | | (147,183 | ) |
| | | Merrill Lynch International | | Sell | | | 595 | | | | 2.050 | | | | 9/20/11 | | | | — | | | | (92,027 | ) |
| | | | | | | | | | | | | | | | | | | | |
| | | | | Total | | | 3,265 | | | | | | | | | | | | — | | | | (482,899 | ) |
| | | | | | | | | | | | | | | | | | | | | | | | | | | |
| Republic of Peru | | Deutsche Bank AG | | Buy | | | 1,900 | | | | 1.710 | | | | 12/20/16 | | | | — | | | | 224,755 | |
| | | | | | | | | | | | | | | | | | | | |
| | | | | Total | | | 1,900 | | | | | | | | | | | | — | | | | 224,755 | |
| | | | | | | | | | | | | | | | | | | | | | | | | | | |
| Republic of the Philippines: | | | | | | | | | | | | | | | | | | | | | | | | | | |
| | | UBS AG | | Sell | | | 3,095 | | | | 1.450 | | | | 6/20/17 | | | | — | | | | (479,516 | ) |
| | | UBS AG | | Sell | | | 1,870 | | | | 2.500 | | | | 6/20/17 | | | | — | | | | (170,893 | ) |
| | | | | | | | | | | | | | | | | | | | |
| | | | | Total | | | 4,965 | | | | | | | | | | | | — | | | | (650,409 | ) |
| | | | | | | | | | | | | | | | | | | | | | | | | | | |
| Republic of Turkey: | | | | | | | | | | | | | | | | | | | | | | | | | | |
| | | Citibank NA, New York | | Buy | | | 3,250 | | | | 5.250 | | | | 12/20/13 | | | | — | | | | (122,621 | ) |
| | | Goldman Sachs International | | Buy | | | 6,500 | | | | 5.290 | | | | 12/20/13 | | | | — | | | | (255,809 | ) |
| | | Morgan Stanley Capital Services, Inc. | | Buy | | | 3,230 | | | | 2.670 | | | | 9/20/13 | | | | — | | | | 186,067 | |
| | | | | | | | | | | | | | | | | | | | |
| | | | | Total | | | 12,980 | | | | | | | | | | | | — | | | | (192,363 | ) |
| | | | | | | | | | | | | | | | | | | | |
| | | JPMorgan Chase Bank NA, NY Branch | | Sell | | | 940 | | | | 2.640 | | | | 8/20/13 | | | | — | | | | (52,118 | ) |
| | | JPMorgan Chase Bank NA, NY Branch | | Sell | | | 1,285 | | | | 2.680 | | | | 9/20/13 | | | | — | | | | (73,489 | ) |
| | | | | | | | | | | | | | | | | | | | |
| | | | | Total | | | 2,225 | | | | | | | | | | | | — | | | | (125,607 | ) |
| | | | | | | | | | | | | | | | | | | | | | | | | | | |
| R.H. Donnelley Corp.: | | | | | | | | | | | | | | | | | | | | | | | | | | |
| | | Barclays Bank plc | | Sell | | | 535 | | | | 5.000 | | | | 9/20/10 | | | | 96,300 | | | | (241,281 | ) |
| | | Goldman Sachs International | | Sell | | | 745 | | | | 5.000 | | | | 9/20/10 | | | | 163,900 | | | | (335,989 | ) |
| | | Morgan Stanley Capital Services, Inc. | | Sell | | | 325 | | | | 5.000 | | | | 9/20/10 | | | | 58,500 | | | | (146,572 | ) |
| | | | | | | | | | | | | | | | | | | | |
| | | | | Total | | | 1,605 | | | | | | | | | | | | 318,700 | | | | (723,842 | ) |
| | | | | | | | | | | | | | | | | | | | | | | | | | | |
| Rite Aid Corp.: | | | | | | | | | | | | | | | | | | | | | | | | | | |
| | | Credit Suisse International | | Sell | | | 10 | | | | 7.500 | | | | 3/20/09 | | | | — | | | | (512 | ) |
| | | Goldman Sachs International | | Sell | | | 55 | | | | 8.060 | | | | 3/20/09 | | | | — | | | | (2,743 | ) |
| | | Goldman Sachs International | | Sell | | | 2,600 | | | | 5.000 | | | | 12/20/09 | | | | 185,250 | | | | (592,454 | ) |
| | | | | | | | | | | | | | | | | | | | |
| | | | | Total | | | 2,665 | | | | | | | | | | | | 185,250 | | | | (595,709 | ) |
| | | | | | | | | | | | | | | | | | | | | | | | | | | |
| Russian Federation | | Citibank NA, New York | | Sell | | | 10,000 | | | | 0.360 | | | | 1/20/11 | | | | — | | | | (1,325,541 | ) |
| | | | | | | | | | | | | | | | | | | | |
| | | | | Total | | | 10,000 | | | | | | | | | | | | — | | | | (1,325,541 | ) |
| | | | | | | | | | | | | | | | | | | | | | | | | | | |
| Standard Bank London Holdings | | | | | | | | | | | | | | | | | | | | | | | | | | |
| PLC for NAK Naftogaz Ukrainy | | Credit Suisse International | | Sell | | | 2,570 | | | | 3.250 | | | | 4/20/11 | | | | — | | | | (1,043,967 | ) |
| | | | | | | | | | | | | | | | | | | | |
| | | | | Total | | | 2,570 | | | | | | | | | | | | — | | | | (1,043,967 | ) |
| | | | | | | | | | | | | | | | | | | | | | | | | | | |
| Station Casinos, Inc.: | | | | | | | | | | | | | | | | | | | | | | | | | | |
| | | Barclays Bank plc | | Sell | | | 500 | | | | 5.000 | | | | 6/20/13 | | | | 90,000 | | | | (395,983 | ) |
| | | Goldman Sachs International | | Sell | | | 295 | | | | 5.000 | | | | 6/20/13 | | | | 51,994 | | | | (232,000 | ) |
| | | | | | | | | | | | | | | | | | | | |
| | | | | Total | | | 795 | | | | | | | | | | | | 141,994 | | | | (627,983 | ) |
| | | | | | | | | | | | | | | | | | | | | | | | | | | |
| Tribune Co.: | | | | | | | | | | | | | | | | | | | | | | | | | | |
| | | Citibank NA, New York | | Sell | | | 435 | | | | 5.000 | | | | 1/16/09 | | | | 139,200 | | | | (407,866 | ) |
| | | Citibank NA, New York | | Sell | | | 460 | | | | 5.000 | | | | 1/16/09 | | | | 150,650 | | | | (431,306 | ) |
| | | Citibank NA, New York | | Sell | | | 520 | | | | 5.000 | % | | | 1/16/09 | | | | 171,600 | | | | (487,563 | ) |
| | | Citibank NA, New York | | Sell | | | 475 | | | | 5.000 | | | | 1/16/09 | | | | 166,250 | | | | (445,370 | ) |
| | | Credit Suisse International | | Sell | | | 370 | | | | 6.350 | | | | 1/16/09 | | | | — | | | | (346,920 | ) |
| | | Credit Suisse International | | Sell | | | 70 | | | | 5.000 | | | | 1/16/09 | | | | 15,400 | | | | (65,634 | ) |
F35 | OPPENHEIMER STRATEGIC BOND FUND/ VA
STATEMENT OF INVESTMENTS Continued
Footnotes to Statement of Investments Continued
Credit Default Swap: Continued
| | | | | | | | | | | | | | | | | | | | | | | | | | | |
| | | | | | | | | | | | | Pay/ | | | | | | | Upfront | | | | |
| | | | | Buy/Sell | | | Notional | | | Receive | | | | | | | Payment | | | | |
| | | | | Credit | | | Amount | | | Fixed | | | Termination | | | Received/ | | | | |
| Swap Reference Entity | | Counterparty | | Protection | | | (000s) | | | Rate | | | Date | | | (Paid) | | | Value | |
| |
| Tribune Co.: Continued Credit Suisse International | | Sell | | $ | 315 | | | | 5.000 | | | | 1/16/09 | | | $ | 72,450 | | | $ | (295,351 | ) |
| | | JPMorgan Chase Bank NA, NY Branch | | Sell | | | 520 | | | | 5.000 | | | | 1/16/09 | | | | 124,800 | | | | (487,563 | ) |
| | | | | | | | | | | | | | | | | | | | |
| | | | | Total | | | 3,165 | | | | | | | | | | | | 840,350 | | | | (2,967,573 | ) |
| | | | | | | | | | | | | | | | | | | | | | | | | | | |
| Troy Capital SA for Yasar Holdings SA: | | | | | | | | | | | | | | | | | | | | | | | | |
| | | Morgan Stanley Capital Services, Inc. | | Sell | | | 1,340 | | | | 8.750 | | | | 6/20/10 | | | | — | | | | (227,909 | ) |
| | | Morgan Stanley Capital Services, Inc. | | Sell | | | 1,340 | | | | 8.500 | | | | 10/20/09 | | | | — | | | | (149,551 | ) |
| | | | | | | | | | | | | | | | | | | | |
| | | | | Total | | | 2,680 | | | | | | | | | | | | — | | | | (377,460 | ) |
| | | | | | | | | | | | | | | | | | | | | | | | | | | |
| Ukraine: | | | | | | | | | | | | | | | | | | | | | | | | | | |
| | | Citibank NA, New York | | Buy | | | 1,660 | | | | 4.180 | | | | 8/20/13 | | | | — | | | | 908,306 | |
| | | Citibank NA, New York | | Buy | | | 2,340 | | | | 6.650 | | | | 10/20/13 | | | | — | | | | 1,248,168 | |
| | | Goldman Sachs International | | Buy | | | 7,580 | | | | 4.220 | | | | 8/20/13 | | | | — | | | | 4,144,509 | |
| | | Merrill Lynch International | | Buy | | | 7,580 | | | | 4.300 | | | | 8/20/13 | | | | — | | | | 4,138,415 | |
| | | UBS AG | | Buy | | | 3,350 | | | | 4.180 | | | | 8/20/13 | | | | — | | | | 1,833,026 | |
| | | | | | | | | | | | | | | | | | | | |
| | | | | Total | | | 22,510 | | | | | | | | | | | | — | | | | 12,272,424 | |
| | | | | | | | | | | | | | | | | | | | | | | | | | | |
| Univision Communications, Inc.: | | | | | | | | | | | | | | | | | | | | | | | | | | |
| | | Citibank NA, New York | | Sell | | | 670 | | | | 5.000 | | | | 12/20/09 | | | | 46,900 | | | | (230,086 | ) |
| | | Credit Suisse International | | Sell | | | 535 | | | | 14.600 | | | | 3/20/09 | | | | — | | | | (38,667 | ) |
| | | Goldman Sachs International | | Sell | | | 510 | | | | 5.000 | | | | 6/20/09 | | | | 51,000 | | | | (168,603 | ) |
| | | Goldman Sachs International | | Sell | | | 125 | | | | 5.000 | | | | 6/20/09 | | | | 13,750 | | | | (41,324 | ) |
| | | Goldman Sachs International | | Sell | | | 105 | | | | 5.000 | | | | 6/20/09 | | | | 6,300 | | | | (34,712 | ) |
| | | JPMorgan Chase Bank NA, NY Branch | | Sell | | | 340 | | | | 5.000 | | | | 6/20/09 | | | | 44,200 | | | | (112,402 | ) |
| | | UBS AG | | Sell | | | 235 | | | | 5.000 | | | | 6/20/09 | | | | 21,150 | | | | (77,690 | ) |
| | | | | | | | | | | | | | | | | | | | |
| | | | | Total | | | 2,520 | | | | | | | | | | | | 183,300 | | | | (703,484 | ) |
| | | | | | | | | | | | | | | | | | | | | | | | | | | |
| Vale Overseas: | | | | | | | | | | | | | | | | | | | | | | | | | | |
| | | Deutsche Bank AG | | Buy | | | 995 | | | | 0.630 | | | | 3/20/17 | | | | — | | | | 163,135 | |
| | | | | | | | | | | | | | | | | | | | |
| | | | | Total | | | 995 | | | | | | | | | | | | — | | | | 163,135 | |
| | | | | | | | | | | | | | | | | | | | |
| | | Deutsche Bank AG | | Sell | | | 995 | | | | 1.050 | | | | 3/20/17 | | | | — | | | | (134,152 | ) |
| | | | | | | | | | | | | | | | | | | | |
| | | | | Total | | | 995 | | | | | | | | | | | | — | | | | (134,152 | ) |
| | | | | | | | | | | | | | | | | | | | | | | | | | | |
| | | | | | | | | | | | | | | | | | | | |
| VTB Capital SA | | Goldman Sachs International | | Buy | | | 3,300 | | | | 7.400 | | | | 5/28/13 | | | | — | | | | 407,923 | |
| | | | | | | | | | | | | | | | | | | | |
| | | | | Total | | | 3,300 | | | | | | | | | | | | — | | | | 407,923 | |
| | | | | | | | | | | | | | | | | | | | | |
| Grand Total Buys | | | | (14,477,279 | ) | | | 27,308,063 | |
| Grand Total Sells | | | | 42,997,108 | | | | (126,486,591 | ) |
| | | | | | | | | | | | | | | | | | | | | |
| Total Credit Default Swaps | | | $ | 28,519,829 | | | $ | (99,178,528 | ) |
| | | | | | | | | | | | | | | | | | | | | |
The table that follows shows the undiscounted maximum potential payment by the Fund related to selling credit protection in credit default swaps.
| | | | | | | | | | | | | |
| Type of Reference | | Total Maximum Potential | | | | | | | | |
| Asset on which the | | Payments for Selling Credit | | | | | | | Reference Asset | |
| Fund Sold Protection | | Protection (Undiscounted) | | | Amount Recoverable* | | | Rating Range** | |
| |
| Asset-Backed Indexes | | $ | 11,290,000 | | | $ | — | | | AAA to AA |
| CMBS Indexes | | | 16,060,000 | | | | — | | | AAA |
| Investment Grade Corporate Debt Indexes | | | 53,131,520 | | | | — | | | A to A- |
| Non-Investment Grade Corporate Debt Indexes | | | 284,194,000 | | | | — | | | | B- |
| Single Name Corporate Debt | | | 32,075,000 | | | | — | | | AAA to BBB- |
| Single Name Corporate Debt | | | 104,750,000 | | | | 2,400,000 | | | BB+ to D |
| Sovereign Debt | | | 10,000,000 | | | | — | | | BBB |
| Sovereign Debt | | | 29,485,000 | | | | — | | | BB+ to CCC+ |
| | | | | | | |
| Total | | $ | 540,985,520 | | | $ | 2,400,000 | | | | | |
| | | | | | | |
| | |
| * | | Amounts recoverable includes potential payments from related purchased protection for instances where the Fund is the seller of protection. In addition, the Fund has no recourse provisions under the credit derivatives and holds no collateral which can offset or reduce potential payments under a triggering event. |
| |
| ** | | The reference asset security rating, as rated by any rating organization, are included in the equivalent Standard & Poor’s rating category. The reference asset rating represents the likelihood of a potential payment by the Fund if the reference asset experiences a credit event as of period end. |
F36 | OPPENHEIMER STRATEGIC BOND FUND/ VA
Interest Rate Swap Contracts as of December 31, 2008 are as follows:
| | | | | | | | | | | | | | | | | | | | | |
| | | Notional | | | | | | | | | | | | | |
| Reference Entity/ | | Amount | | | Paid by | | | Received by | | | Termination | | | | |
| Swap Counterparty | | (000’s) | | | the Fund | | | the Fund | | | Date | | | Value | |
| |
AUD BBR BBSW | | | | | | | | | | | | | | | | | | | | |
| | | | | | | Six-Month | | | | | | | | | | | | |
| Westpac Banking Corp. | | 25,500 AUD | | AUD BBR BBSW | | | 4.880 | % | | | 12/3/18 | | | $ | 696,838 | |
| | | | | | | | | | | | | | | | | | | | | |
BZDI: | | | | | | | | | | | | | | | | | | | | |
| Banco Santander Central Hispano SA | | 56,000 BRR | | BZDI | | | 12.290 | | | | 1/4/10 | | | | 866,506 | |
| Banco Santander Central Hispano SA | | 4,420 BRR | | BZDI | | | 14.000 | | | | 1/3/12 | | | | 101,628 | |
| Banco Santander SA, Inc. | | 32,480 BRR | | BZDI | | | 14.900 | | | | 1/2/12 | | | | 567,828 | |
| Banco Santander SA, Inc. | | 8,490 BRR | | BZDI | | | 13.550 | | | | 1/2/17 | | | | 159,393 | |
| Goldman Sachs Capital Markets LP | | 21,000 BRR | | BZDI | | | 14.550 | | | | 1/4/10 | | | | 410,455 | |
| Goldman Sachs International | | 2,640 BRR | | BZDI | | | 14.100 | | | | 1/2/17 | | | | 45,150 | |
| Goldman Sachs International | | 17,000 BRR | | BZDI | | | 13.900 | | | | 1/2/17 | | | | 224,897 | |
| J Aron & Co. | | 43,800 BRR | | BZDI | | | 10.670 | | | | 1/2/12 | | | | (1,178,550 | ) |
| J Aron & Co. | | 8,745 BRR | | BZDI | | | 14.160 | | | | 1/2/17 | | | | 226,932 | |
| J Aron & Co. | | 8,790 BRR | | BZDI | | | 12.920 | | | | 1/2/14 | | | | 12,028 | |
| J Aron & Co. | | 4,390 BRR | | BZDI | | | 12.870 | | | | 1/2/14 | | | | 3,003 | |
| J Aron & Co. | | 8,750 BRR | | BZDI | | | 12.710 | | | | 1/4/10 | | | | 63,448 | |
| J Aron & Co. | | 15,140 BRR | | BZDI | | | 12.610 | | | | 1/4/10 | | | | 103,570 | |
| J Aron & Co. | | 19,400 BRR | | BZDI | | | 12.390 | | | | 1/2/12 | | | | (39,416 | ) |
| J Aron & Co. | | 25,560 BRR | | BZDI | | | 14.890 | | | | 1/4/10 | | | | 772,929 | |
| J Aron & Co. | | 6,910 BRR | | BZDI | | | 12.260 | | | | 1/2/15 | | | | (90,244 | ) |
| J Aron & Co. | | 3,160 BRR | | BZDI | | | 12.290 | | | | 1/2/15 | | | | (40,361 | ) |
| J Aron & Co. | | 4,420 BRR | | BZDI | | | 14.050 | | | | 1/2/12 | | | | 102,656 | |
| J Aron & Co. | | 13,000 BRR | | BZDI | | | 14.300 | | | | 1/2/17 | | | | 394,263 | |
| J Aron & Co. | | 8,550 BRR | | BZDI | | | 13.670 | | | | 1/2/17 | | | | 160,527 | |
| J Aron & Co. | | 10,360 BRR | | BZDI | | | 13.100 | | | | 1/2/17 | | | | (5,559 | ) |
| JPMorgan Chase Bank NA | | 19,400 BRR | | BZDI | | | 12.380 | | | | 1/2/12 | | | | (39,814 | ) |
| JPMorgan Chase Bank NA | | 17,080 BRR | | BZDI | | | 13.900 | | | | 1/2/17 | | | | 226,073 | |
| JPMorgan Chase Bank NA | | 8,750 BRR | | BZDI | | | 13.910 | | | | 1/2/12 | | | | 201,970 | |
| JPMorgan Chase Bank NA | | 15,800 BRR | | BZDI | | | 13.900 | | | | 1/2/17 | | | | 325,710 | |
| Morgan Stanley | | 12,860 BRR | | BZDI | | | 14.950 | | | | 1/2/17 | | | | 493,892 | |
| Morgan Stanley | | 12,860 BRR | | BZDI | | | 15.000 | | | | 1/2/17 | | | | 496,976 | |
| Morgan Stanley | | 8,540 BRR | | BZDI | | | 14.800 | | | | 1/2/17 | | | | 259,052 | |
| Morgan Stanley | | 32,000 BRR | | BZDI | | | 13.900 | | | | 1/2/17 | | | | 659,665 | |
| Morgan Stanley | | 8,540 BRR | | BZDI | | | 14.860 | | | | 1/2/17 | | | | 259,049 | |
| Morgan Stanley Capital Services, Inc. | | 5,590 BRR | | BZDI | | | 13.930 | | | | 1/2/17 | | | | 104,917 | |
| UBS AG | | 9,100 BRR | | BZDI | | | 14.340 | | | | 1/2/17 | | | | 276,039 | |
| | | | | | | | | | | | | | | | | | |
| Reference Entity Total | | 473,525 BRR | | | | | | | | | | | | | | | 6,124,612 | |
| | | | | | | | | | | | | | | | | | | | | |
CNY CFXSREPOFIX01 | | | | | | | | | | | | | | | | | | | | |
| | | | | | | | | | | CNY | | | | | | | | |
| | | | | | | | | | | CFXSREPOFIX | | | | | | | | |
| Goldman Sachs International | | 18,300 cny | | | 4.00 | % | | | 01 | | | | 2/16/17 | | | | (199,593 | ) |
| |
CZK PRIBOR PRBO: | | | | | | | | | | | | | | | | | | | | |
| | | | | | | | | | | | | | | | | | | | | |
| | | | | | | Six-Month CZK | | | | | | | | | | | | |
| Citibank NA, New York | | 297,000 CZK | | PRIBOR PRBO | | | 3.560 | | | | 9/27/10 | | | | 327,625 | |
| | | | | | | Six-Month CZK | | 2.76% times | | | | | | | | |
| Goldman Sachs Group, Inc. (The) | | 338,000 CZK | | PRIBOR PRBO | | UDI | | | 12/5/10 | | | | 102,350 | |
| | | | | | | Six-Month CZK | | | | | | | | | | | | |
| Goldman Sachs Group, Inc. (The) | | 142,000 CZK | | PRIBOR PRBO | | | 3.760 | | | | 10/6/18 | | | | 354,415 | |
| | | | | | | Six-Month CZK | | | | | | | | | | | | |
| JPMorgan Chase Bank NA | | 338,000 CZK | | PRIBOR PRBO | | | 2.750 | | | | 12/5/10 | | | | 100,135 | |
| | | | | | | Six-Month CZK | | | | | | | | | | | | |
| JPMorgan Chase Bank NA | | 294,700 CZK | | PRIBOR PRBO | | | 3.470 | | | | 9/18/10 | | | | 298,233 | |
| | | | | | | Six-Month CZK | | | | | | | | | | | | |
| JPMorgan Chase Bank NA | | 240,000 CZK | | PRIBOR PRBO | | | 3.560 | | | | 9/12/10 | | | | 267,393 | |
| | | | | | | Six-Month CZK | | | | | | | | | | | | |
| JPMorgan Chase Bank NA | | 326,000 CZK | | PRIBOR PRBO | | | 3.300 | | | | 10/17/10 | | | | 298,591 | |
| | | | | | | Six-Month CZK | | | | | | | | | | | | |
| Morgan Stanley | | 140,800 CZK | | PRIBOR PRBO | | | 3.830 | | | | 10/3/18 | | | | 396,999 | |
| Reference Entity Total | | 2,116,500 CZK | | | | | | | | | | | | | | | 2,145,741 | |
F37 | OPPENHEIMER STRATEGIC BOND FUND/ VA
STATEMENT OF INVESTMENTS Continued
Footnotes to Statement of Investments Continued
Interest Rate Swap Contracts: Continued
| | | | | | | | | | | | | | | | | | | | | |
| | | Notional | | | | | | | | | | | | | |
| Reference Entity/ | | Amount | | | Paid by | | | Received by | | | Termination | | | | |
| Swap Counterparty | | (000’s) | | | the Fund | | | the Fund | | | Date | | | Value | |
| |
HUF BUBOR Reuters: | | | | | | | | | | | | | | | | | | | | |
| | | | | | | Six-Month HUF | | | | | | | | | | | | |
| Barclays Bank plc | | 1,433,000 HUF | | BUBOR Reuters | | | 7.820 | % | | | 9/19/13 | | | $ | (36,212 | ) |
| | | | | | | Six-Month HUF | | | | | | | | | | | | |
| Barclays Bank plc | | 866,000 HUF | | BUBOR Reuters | | | 7.180 | | | | 10/8/18 | | | | (133,134 | ) |
| | | | | | | Six-Month HUF | | | | | | | | | | | | |
| Citibank NA | | 852,000 HUF | | BUBOR Reuters | | | 7.200 | | | | 10/8/18 | | | | (79,424 | ) |
| | | | | | | Six-Month HUF | | | | | | | | | | | | |
| Citibank NA | | 853,000 HUF | | BUBOR Reuters | | | 7.180 | | | | 10/3/18 | | | | (132,447 | ) |
| | | | | | | Six-Month HUF | | | | | | | | | | | | |
| JPMorgan Chase Bank NA | | 866,000 HUF | | BUBOR Reuters | | | 7.200 | | | | 10/6/18 | | | | (80,729 | ) |
| | | | | | | Six-Month HUF | | | | | | | | | | | | |
| JPMorgan Chase Bank NA | | 1,905,000 HUF | | BUBOR Reuters | | | 8.600 | | | | 12/17/10 | | | | 53,169 | |
| | | | | | | Six-Month HUF | | | | | | | | | | | | |
| JPMorgan Chase Bank NA | | 666,000 HUF | | BUBOR Reuters | | | 7.890 | | | | 9/12/13 | | | | (8,590 | ) |
| | | | | | | Six-Month HUF | | | | | | | | | | | | |
| JPMorgan Chase Bank NA | | 1,142,000 HUF | | BUBOR Reuters | | | 8.480 | | | | 6/6/13 | | | | 365,682 | |
| | | | | | | Six-Month HUF | | | | | | | | | | | | |
| JPMorgan Chase Bank NA | | 753,000 HUF | | BUBOR Reuters | | | 7.880 | | | | 8/12/13 | | | | (14,794 | ) |
| | | | | | | | | | | | | | | | | | | |
| Reference Entity Total | | 9,336,000 HUF | | | | | | | | | | | | | | | (66,479 | ) |
| | | | | | | | | | | | | | | | | | | | | |
ILS TELBOR01 Reuters: | | | | | | | | | | | | | | | | | | | | |
| | | | | | | Three-Month ILS | | | | | | | | | | | | |
| Credit Suisse International | | 6,220 ILS | | TELBOR01 Reuters | | | 4.650 | | | | 12/22/18 | | | | 24,296 | |
| | | | | | | Three-Month ILS | | | | | | | | | | | | |
| Credit Suisse International | | 6,640 ILS | | TELBOR01 Reuters | | | 4.940 | | | | 12/15/18 | | | | 57,670 | |
| | | | | | | Three-Month ILS | | | | | | | | | | | | |
| UBS AG | | 15,300 ILS | | | TELBOR01 | | | | 5.880 | | | | 8/28/10 | | | | 485,654 | |
| | | | | | | Three-Month ILS | | | | | | | | | | | | |
| UBS AG | | 15,550 ILS | | | TELBOR01 | | | | 5.850 | | | | 9/4/18 | | | | 482,001 | |
| | | | | | | Three-Month ILS | | | | | | | | | | | | |
| UBS AG | | 16,930 ILS | | TELBOR01 Reuters | | | 5.036 | | | | 12/12/18 | | | | 149,638 | |
| | | | | | | | | | | | | | | | | | | |
| Reference Entity Total | | 60,640 ILS | | | | | | | | | | | | | | | 1,199,259 | |
| | | | | | | | | | | | | | | | | | | | | |
MXN TIIE BANXICO: | | | | | | | | | | | | | | | | | | | | |
| Banco Santander SA, Inc. | | 90,600 MXN | | MXN TIIE BANXICO | | | 8.540 | | | | 9/27/13 | | | | 128,840 | |
| Banco Santander SA, Inc. | | 28,100 MXN | | MXN TIIE BANXICO | | | 8.645 | | | | 5/17/18 | | | | 41,078 | |
| Banco Santander SA, Inc. | | 31,310 MXN | | MXN TIIE BANXICO | | | 8.570 | | | | 5/3/18 | | | | 34,214 | |
| Citibank NA | | 175,200 MXN | | MXN TIIE BANXICO | | | 8.920 | | | | 11/24/11 | | | | 348,498 | |
| Credit Suisse International | | 35,800 MXN | | MXN TIIE BANXICO | | | 8.560 | | | | 9/27/13 | | | | 52,115 | |
| Credit Suisse International | | 22,480 MXN | | MXN TIIE | | | 8.300 | | | | 12/17/26 | | | | (39,725 | ) |
| Goldman Sachs Capital Markets LP | | 62,900 MXN | | MXN TIIE | | | 8.140 | | | | 1/10/18 | | | | (62,148 | ) |
| Goldman Sachs Group, Inc. (The) | | 54,800 MXN | | MXN TIIE BANXICO | | | 8.540 | | | | 9/27/13 | | | | 77,930 | |
| Goldman Sachs Group, Inc. (The) | | 174,000 MXN | | MXN TIIE BANXICO | | | 9.350 | | | | 11/18/11 | | | | 473,800 | |
| Goldman Sachs Group, Inc. (The) | | 563,000 MXN | | MXN TIIE BANXICO | | | 10.000 | | | | 11/11/11 | | | | 626,909 | |
| Goldman Sachs Group, Inc. (The) | | 212,800 MXN | | MXN TIIE BANXICO | | | 9.270 | | | | 11/21/11 | | | | 551,637 | |
| Goldman Sachs Group, Inc. (The) | | 211,300 MXN | | MXN TIIE BANXICO | | | 9.080 | | | | 11/22/11 | | | | 469,571 | |
| J Aron & Co. | | 22,300 MXN | | MXN TIIE | | | 9.150 | | | | 8/27/26 | | | | 100,170 | |
| | | | | | | One-Month MXN | | | | | | | | | | | | |
| J Aron & Co. | | 9,700 MXN | | TIIE BANXICO | | | 9.330 | | | | 9/16/26 | | | | 56,119 | |
| | | | | | | One-Month MXN | | | | | | | | | | | | |
| JPMorgan Chase Bank NA | | 224,300 MXN | | TIIE BANXICO | | | 9.580 | | | | 10/23/18 | | | | 1,447,385 | |
| JPMorgan Chase Bank NA | | 560,000 MXN | | MXN TIIE BANXICO | | | 10.000 | | | | 11/11/11 | | | | 623,569 | |
| JPMorgan Chase Bank NA | | 171,100 MXN | | MXN TIIE BANXICO | | | 8.920 | | | | 11/24/11 | | | | 340,343 | |
| JPMorgan Chase Bank NA | | 27,055 MXN | | MXN TIIE BANXICO | | | 9.320 | | | | 6/1/18 | | | | 121,672 | |
| Merrill Lynch Capital Services, Inc. | | 36,370 MXN | | MXN TIIE BANXICO | | | 8.570 | | | | 5/11/18 | | | | 40,143 | |
| | | | | | | One-Month MXN | | | | | | | | | | | | |
| Morgan Stanley | | 67,300 MXN | | TIIE BANXICO | | | 9.070 | | | | 11/26/18 | | | | 240,451 | |
| | | | | | | | | | | | | | | | | | | |
| Reference Entity Total | | 2,780,415 MXN | | | | | | | | | | | | | | | 5,672,571 | |
F38 | OPPENHEIMER STRATEGIC BOND FUND/ VA
Interest Rate Swap Contracts: Continued
| | | | | | | | | | | | | | | | | | | | | |
| | | Notional | | | | | | | | | | | | | |
| Reference Entity/ | | Amount | | | Paid by | | | Received by | | | Termination | | | | |
| Swap Counterparty | | (000’s) | | | the Fund | | | the Fund | | | Date | | | Value | |
| |
PLZ WIBOR WIBO: | | | | | | | | | | | | | | | | | | | | |
| | | | | | | Six-Month PLZ | | | | | | | | | | | | |
| Goldman Sachs Group, Inc. (The) | | 21,640 PLZ | | WIBOR WIBO | | | 5.330 | % | | | 10/6/18 | | | $ | 508,035 | |
| | | | | | | Six-Month PLZ | | | | | | | | | | | | |
| Goldman Sachs Group, Inc. (The) | | 21,700 PLZ | | WIBOR WIBO | | | 5.320 | | | | 10/3/18 | | | | 507,851 | |
| | | | | | | Six-Month PLZ | | | | | | | | | | | | |
| Goldman Sachs International | | 23,970 PLZ | | WIBOR WIBO | | | 6.140 | | | | 8/26/10 | | | | 212,618 | |
| | | | | | | Six-Month PLZ | | | | | | | | | | | | |
| JPMorgan Chase Bank NA | | 15,840 PLZ | | WIBOR WIBO | | | 6.040 | | | | 8/8/13 | | | | 393,362 | |
| | | | | | | | | | | | | | | | | | | |
| Reference Entity Total | | 83,150 PLZ | | | | | | | | | | | | | | | 1,621,866 | |
| | | | | | | | | | | | | | | | | | | | | |
SEK STIBOR SIDE: | | | | | | | | | | | | | | | | | | | | |
| | | | | | | | | | | Three-Month SEK | | | | | | | | |
| Barclays Bank plc | | 40,595 SEK | | | 3.14 | % | | STIBOR SIDE | | | 12/9/18 | | | | 14,718 | |
| | | | | | | | | | | Three-Month SEK | | | | | | | | |
| Barclays Bank plc | | 30,400 SEK | | | 3.22 | | | STIBOR SIDE | | | 12/22/18 | | | | (3,785 | ) |
| | | | | | | | | | | Three-Month SEK | | | | | | | | |
| Barclays Bank plc | | 50,700 SEK | | | 3.52 | | | STIBOR SIDE | | | 12/15/18 | | | | (195,662 | ) |
| | | | | | | | | | | Three-Month SEK | | | | | | | | |
| Deutsche Bank AG, London | | 10,150 SEK | | | 3.13 | | | STIBOR SIDE | | | 12/09/18 | | | | 24,436 | |
| | | | | | | | | | | | | | | | | | | |
| Total where Fund pays a fixed rate | | 131,845 SEK | | | | | | | | | | | | | | | (160,293 | ) |
| | | | | | | | | | | | | | | | | | | |
| | | | | | | Three-Month SEK | | | | | | | | | | | | |
| Deutsche Bank AG | | 59,900 SEK | | STIBOR SIDE | | | 5.110 | | | | 7/16/18 | | | | 1,357,549 | |
| | | | | | | Three-Month SEK | | | | | | | | | | | | |
| Goldman Sachs International | | 59,900 SEK | | STIBOR SIDE | | | 5.080 | | | | 7/17/18 | | | | 1,337,339 | |
| | | | | | | Three-Month SEK | | | | | | | | | | | | |
| Goldman Sachs International | | 44,200 SEK | | STIBOR SIDE | | | 4.840 | | | | 8/21/18 | | | | 851,459 | |
| | | | | | | | | | | | | | | | | | | |
| Total where Fund pays a variable rate | | 164,000 SEK | | | | | | | | | | | | | | | 3,546,347 | |
| | | | | | | | | | | | | | | | | | | |
| Reference Entity Total | | 295,845 SEK | | | | | | | | | | | | | | | 3,386,054 | |
| | | | | | | | | | | | | | | | | | | | | |
ZAR JIBAR SAFEX: | | | | | | | | | | | | | | | | | | | | |
| | | | | | | | | | | Three-Month ZAR | | | | | | | | |
| JPMorgan Chase Bank NA | | 85,400 ZAR | | | 8.93 | | | JIBAR SAFEX | | | 11/3/18 | | | | (680,757 | ) |
| | | | | | | | | | | Three-Month ZAR | | | | | | | | |
| UBS AG | | 85,400 ZAR | | | 8.92 | | | JIBAR SAFEX | | | 11/3/18 | | | | (681,438 | ) |
| | | | | | | | | | | | | | | | | | | |
| Reference Entity Total | | 170,800 ZAR | | | | | | | | | | | | | | | (1,362,195 | ) |
| | | | | | | | | | | | | | | | | | | | |
Total Interest Rate Swaps
| | $ | 19,218,674 | |
| | | | | | | | | | | | | | | | | | | | |
Notional amount is reported in U.S. Dollars (USD), except for those denoted in the following currencies:
| | | |
| AUD | | Australian Dollar |
| BRR | | Brazilian Real |
| CNY | | Chinese Renminbi (Yuan) |
| CZK | | Czech Koruna |
| HUF | | Hungarian Forint |
| ILS | | Israeli Shekel |
| MXN | | Mexican Nuevo Peso |
| PLZ | | Polish Zloty |
| SEK | | Swedish Krona |
| ZAR | | South African Rand |
| | | |
| Abbreviations/Definitions are as follows: |
| BANXICO | | Banco de Mexico |
| BBR BBSW | | Bank Bill Swap Reference Rate (Australian financial market) |
| BUBOR Reuters | | Budapest Interbank Offered Rate |
| BZDI | | Brazil Interbank Deposit Rate |
| CFXSREPOFIX01 | | Chinese Renminbi 7 Days Repurchase Fixing Rates |
| JIBAR | | South African Rand-Johannesburg Interbank Agreed Rate |
| | | |
| PRIBOR PRBO | | Prague Interbank Offering Rate |
| SAFEX | | South African Futures Exchange |
| STIBOR-SIDE | | Stockholm Interbank Offered Rate |
| TELBOR01 | | Tel Aviv Interbank Offered Rate 1 Month |
| TIIE | | Interbank Equilibrium Interest Rate |
| UDI | | Unidad de Inversion (Unit of Investment) |
| WIBOR-WIBO | | Poland Warsaw Interbank Offer Bid Rate |
F39 | OPPENHEIMER STRATEGIC BOND FUND/ VA
STATEMENT OF INVESTMENTS Continued
Footnotes to Statement of Investments Continued
Total Return Swap Contracts as of December 31, 2008 are as follows:
| | | | | | | | | | | | | | | | | | | | | | | | | |
| | | Notional | | | | | | | | | | | | | | | Upfront | | | | |
| Reference Entity/ | | Amount | | | Paid by | | | Received by | | | Termination | | | Payment | | | | |
| Swap Counterparty | | (000’s) | | | the Fund | | | the Fund | | | Date | | | Received/(Paid) | | | Value | |
| |
Banc of America Securities LLC | | | | | | | | | | | | | | | | | | | | | | | | |
AAA 10 yr. CMBS Daily Index*: | | | | | | | | | | | | | | | | | | | | | | | | |
| Goldman Sachs Group, Inc. (The) | | $ | 49,660 | | | | A | | | | D | | | | 3/31/09 | | | $ | — | | | $ | 10,697,178 | |
| Morgan Stanley | | | 15,320 | | | | B | | | | C | | | | 3/31/09 | | | | — | | | | 3,767,316 | |
| | | | | | | | | | | | | | | | | | | |
| | | | | | | | | | | | | | | Reference Entity Total | | | — | | | | 14,464,494 | |
| | | | | | | | | | | | | | | | | | | | | | | | | |
Barclays Capital U.S. | | | | | | | | | | | | | | | | | | | | | | | | |
CMBS AAA Index*: | | | | | | | | | | | | | | | | | | | | | | | | |
| Citibank NA | | | 15,700 | | | | A | | | | D | | | | 2/1/09 | | | | — | | | | 1,715,434 | |
| Citibank NA | | | 7,800 | | | | A | | | | D | | | | 2/1/09 | | | | — | | | | 857,347 | |
| Morgan Stanley | | | 28,300 | | | | A | | | | D | | | | 3/1/09 | | | | — | | | | 3,101,147 | |
| | | | | | | | | | | | | | | | | | | |
| | | | | | | | | | | | | | | Reference Entity Total | | | — | | | | 5,673,928 | |
| | | | | | | | | | | | | | | | | | | | | | | | | |
Barclays Capital U.S. | | | | | | | | | | | | | | | | | | | | | | | | |
CMBS AAA 8.5+ Index*: | | | | | | | | | | | | | | | | | | | | | | | | |
| Goldman Sachs Group, Inc. (The) | | | 11,540 | | | | A | | | | D | | | | 3/1/09 | | | | — | | | | 1,957,376 | |
| Goldman Sachs Group, Inc. (The) | | | 6,830 | | | | A | | | | D | | | | 1/1/09 | | | | — | | | | 1,166,789 | |
| Goldman Sachs Group, Inc. (The) | | | 24,720 | | | | A | | | | D | | | | 2/1/09 | | | | — | | | | 4,220,835 | |
| JPMorgan Chase | | | 6,520 | | | | A | | | | D | | | | 2/1/09 | | | | — | | | | 1,103,750 | |
| Morgan Stanley | | | 5,110 | | | | A | | | | D | | | | 3/1/09 | | | | — | | | | 871,329 | |
| Morgan Stanley | | | 5,280 | | | | A | | | | D | | | | 2/1/09 | | | | — | | | | 888,941 | |
| Morgan Stanley | | | 5,280 | | | | A | | | | D | | | | 2/1/09 | | | | — | | | | 898,522 | |
| Morgan Stanley | | | 12,530 | | | | A | | | | D | | | | 1/1/09 | | | | — | | | | 2,134,377 | |
| Morgan Stanley | | | 9,120 | | | | A | | | | D | | | | 2/1/09 | | | | — | | | | 1,559,164 | |
| Morgan Stanley | | | 11,490 | | | | A | | | | D | | | | 2/1/09 | | | | — | | | | 1,948,895 | |
| | | | | | | | | | | | | | | | | | | |
| | | | | | | | | | | | | | | Reference Entity Total | | | — | | | | 16,749,978 | |
| | | | | | | | | | | | | | | | | | | | | | | | | |
BOVESPA Index | | | | | | | | | | | | | | | | | | | | | | | | |
| | | | | | | | | | | If negative, the absolute | | | | | | | | | | | | |
| | | | | | | If positive, the | | value of the Total | | | | | | | | | | | | |
| | | | | | | Total Return of the | | Return of the | | | | | | | | | | | | |
| Citibank NA | | 8,844 BRR | | BOVESPA Index | | BOVESPA Index | | | 2/20/09 | | | | — | | | | 213,901 | |
Constant Maturity Option Price: | | | | | | | | | | | | | | | | | | | | | | | | |
| | | | | | | | | | | The Constant Maturity | | | | | | | | | | | | |
| | | | | | | | | | | Option Price divided | | | | | | | | | | | | |
| Merrill Lynch | | | 54,700 | | | | 4.66 | % | | by 10,000 | | | 6/11/17 | | | | (1,823,698 | ) | | | (3,066,091 | ) |
| | | | | | | | | | | The Constant Maturity | | | | | | | | | | | | |
| | | | | | | | | | | Option Price divided | | | | | | | | | | | | |
| Merrill Lynch | | | 15,380 | | | | 5.33 | | | by 10,000 | | | 8/13/17 | | | | 91,511 | | | | (2,032,151 | ) |
| | | | | | | | | | | | | | | | | | | |
| | | | | | | | | | | | | | | Reference Entity Total | | | (1,732,187 | ) | | | (5,098,242 | ) |
| | | | | | | | | | | | | | | | | | | | | | | | | |
Custom basket of securities: | | | | | | | | | | | | | | | | | | | | | | | | |
| | | | | | | One-Month USD BBA | | | | | | | | | | | | | | | | |
| | | | | | | LIBOR plus 20 basis | | | | | | | | | | | | | | | | |
| | | | | | | points and if negative, | | | | | | | | | | | | | | | | |
| | | | | | | the absolute value of the | | If positive, the Total | | | | | | | | | | | | |
| | | | | | | Total Return of a custom | | Return of a custom | | | | | | | | | | | | |
| Deutsche Bank AG, London | | | 8,408 | | | equity basket | | equity basket | | | 10/5/09 | | | | — | | | | 317,946 | |
| | | | | | | One-Month EUR BBA | | | | | | | | | | | | | | | | |
| | | | | | | LIBOR plus 25 basis | | | | | | | | | | | | | | | | |
| | | | | | | points and if negative, | | | | | | | | | | | | | | | | |
| | | | | | | the absolute value of the | | If positive, the Total | | | | | | | | | | | | |
| | | | | | | Total Return of a custom | | Return of a custom | | | | | | | | | | | | |
| Morgan Stanley | | 5,365 EUR | | basket of securities | | basket of securities | | | 3/6/09 | | | | — | | | | 522,105 | |
| | | | | | | One-Month EUR BBA | | | | | | | | | | | | | | | | |
| | | | | | | LIBOR plus 30 basis | | | | | | | | | | | | | | | | |
| | | | | | | points and if negative, | | | | | | | | | | | | | | | | |
| | | | | | | the absolute value of the | | If positive, the Total | | | | | | | | | | | | |
| | | | | | | Total Return of a custom | | Return of a custom | | | | | | | | | | | | |
| Morgan Stanley International | | 5,208 EUR | | basket of securities | | basket of securities | | | 10/7/08 | | | | — | | | | 298,665 | |
| | | | | | | | | | | | | | | | | | | |
| | | | | | | | | | | | | | | Reference Entity Total | | | — | | | | 1,138,716 | |
F40 | OPPENHEIMER STRATEGIC BOND FUND/ VA
Total Return Swap Contracts: Continued
| | | | | | | | | | | | | | | | | | | | | | | | | |
| | | Notional | | | | | | | | | | | | | | | Upfront | | | | |
| Reference Entity/ | | Amount | | | Paid by | | | Received by | | | Termination | | | Payment | | | | |
| Swap Counterparty | | (000’s) | | | the Fund | | | the Fund | | | Date | | | Received/(Paid) | | | Value | |
| |
Custom basket of securities traded on the London Stock Exchange | | | | | | One-Month GBP BBA
| | | | | | | | | | | | | | | | |
| | | | | | | LIBOR plus 35 basis
| | | | | | | | | | | | | | | | |
| | | | | | | points and if negative,
| | | | | | | | | | | | | | | | |
| | | | | | | the absolute value of the
| | If positive, the Total
| | | | | | | | | | | | |
| | | | | | | Total Return of a custom
| | Return of a custom
| | | | | | | | | | | | |
| Citibank NA, New York | | 6,530 | GBP | | basket of securities
| | basket of securities
| | | 5/8/09 | | | $ | — | | | $ | (94,244 | ) |
Custom basket of securities traded on the New York Stock Exchange | | | | | | One-Month USD BBA
| | | | | | | | | | | | | | | | |
| | | | | | | LIBOR plus 30 basis
| | | | | | | | | | | | | | | | |
| | | | | | | points and if negative,
| | | | | | | | | | | | | | | | |
| | | | | | | the absolute value of the
| | If positive, the Total
| | | | | | | | | | | | |
| | | | | | | Total Return of a custom
| | Return of a custom
| | | | | | | | | | | | |
| Goldman Sachs International | | | 34,457 | | | equity basket | | equity basket | | | 6/8/09 | | | | — | | | | 5,191,739 | |
Custom basket of securities traded on the Tokyo Stock Exchange, Inc. | | | | | | One-Month JPY BBA
| | | | | | | | | | | | | | | | |
| | | | | | | LIBOR plus 40 basis
| | | | | | | | | | | | | | | | |
| | | | | | | points and if negative,
| | | | | | | | | | | | | | | | |
| | | | | | | the absolute value of the
| | If positive, the Total
| | | | | | | | | | | | |
| | | | | | | Total Return of a custom
| | Return of a custom
| | | | | | | | | | | | |
| Citibank NA, New York | | 902,674 | JPY | | basket of securities
| | basket of securities
| | | 4/14/09 | | | | — | | | | 1,383,993 | |
Each of JSC “Rushydro” (Open Joint Stock Company, Federal Hydrogeneration Company) and OJSC Saratovskaya HPP and any Successor(s) to these Reference Entities | | | | | | | | | | 7.75% from debt | | | | | | | | | | | | |
| | | | | | | | | | | obligations of JSC | | | | | | | | | | | | |
| Morgan Stanley | | | | | | Three-Month USD | | Rushydro and OJSC | | | | | | | | | | | | |
| Capital Services, Inc. | | 271,430 | RUR | | BBA LIBOR | | Saratovskaya HPP | | | 12/26/13 | | | | — | | | | (4,693,128 | ) |
EURX/EURX SMI INDEX | | | | | | If negative, the absolute | | | | | | | | | | | | | | | | |
| | | | | | | value of the Total | | If positive, the Total | | | | | | | | | | | | |
| Goldman Sachs Group, | | | | | | Return of the | | Return of the | | | | | | | | | | | | |
| Inc. (The) | | 3,812 | CHF | | EURX SMI Index | | EURX SMI Index | | | 3/24/09 | | | | — | | | | (19,934 | ) |
MSCI DAILY TR NET BELGIUM | | | | | | One-Month USD BBA | | | | | | | | | | | | | | | | |
| | | | | | | LIBOR and if negative, | | If positive, the Total | | | | | | | | | | | | |
| | | | | | | the absolute value MSCI | | Return of the MSCI | | | | | | | | | | | | |
| | | | | | | Daily of the Net Belgium | | Daily Net Belgium | | | | | | | | | | | | |
| Citibank NA | | | 989 | | | USD Market Index | | USD Market Index | | | 10/7/09 | | | | — | | | | 102,593 | |
MSCI DAILY TR NET BELGIUM | | | | | | One-Month USD BBA | | | | | | | | | | | | | | | | |
| | | | | | | LIBOR and if negative, | | If positive, the Total | | | | | | | | | | | | |
| | | | | | | the absolute value MSCI | | Return of the MSCI | | | | | | | | | | | | |
| | | | | | | Daily of the Net Belgium | | Daily Net Belgium | | | | | | | | | | | | |
| Citibank NA | | | 4,234 | | | USD Market Index | | USD Market Index | | | 10/7/09 | | | | — | | | | 291,811 | |
MXN TIIE BANXICO: | | | | | | | | | | | | | | | | | | | | | | | | |
| Deutsche Bank AG | | | 1,620 | | | Six-Month USD BBA LIBOR | | 5.46% times UDI | | | 5/13/15 | | | | — | | | | 62,682 | |
| Deutsche Bank AG | | | 930 | | | Six-Month USD LIBOR | | 5.25% times UDI | | | 6/23/15 | | | | — | | | | 10,549 | |
| Goldman Sachs Group, Inc. (The) | | | 920 | | | Six-Month USD BBA LIBOR | | 5.10% times UDI | | | 1/14/15 | | | | — | | | | 43,550 | |
| Goldman Sachs Group, Inc. (The) | | | 920 | | | Six-Month BBA LIBOR | | 5.08% times UDI | | | 1/20/15 | | | | — | | | | 51,815 | |
| | | | | | | | | | | | | | | | | | | |
| | | | | | | | | | | | | | | Reference Entity Total | | | — | | | | 168,596 | |
| | | | | | | | | | | | | | | | | | | |
| | | | | | | | | | | | | | | Total of Total Return Swaps | | $ | (1,732,187 | ) | | $ | 35,474,201 | |
| | | | | | | | | | | | | | | | | | | |
| | |
| * | | The CMBS Indexes are representative indexes of segments of the commercial mortgage backed securities market. These indexes are measured by movements in the credit spreads of the underlying holdings. As the credit market perceives an improvement in the credit quality of an Index’s underlying holdings and reduced probability of default, the spread of an index narrows. As the credit market perceives a decrease in credit quality and an increased probability of default on an Index’s underlying holdings, the spread widens. |
F41 | OPPENHEIMER STRATEGIC BOND FUND/ VA
STATEMENT OF INVESTMENTS Continued
Footnotes to Statement of Investments Continued
Notional amount is reported in U.S. Dollars (USD), except for those denoted in the following currencies:
| | | |
| BRR | | Brazilian Real |
| CHF | | Swiss Franc |
| EUR | | Euro |
| GBP | | British Pound Sterling |
| JPY | | Japanese Yen |
| RUR | | Russian Ruble |
| |
| Abbreviations/Definitions are as follows: |
| BANXICO | | Banco de Mexico |
| BBA LIBOR | | British Bankers’ Association London-Interbank Offered Rate |
| BOVESPA | | Bovespa Index that trades on the Sao Paulo Stock Exchange |
| CMBS | | Commercial Mortgage Backed Securities |
| EURX | | Euro Index |
| LIBOR | | London Interbank Offered Rate |
| MSCI | | Morgan Stanley Capital International |
| MXN-TIIE | | Mexican Nuevo Peso-Interbank Equilibrium Interest Rate |
| SMI | | Swiss Market Index |
| UDI | | Unidad de Inversion (Unit of Investment) |
A — The Fund makes periodic payments when credit spreads, as represented by the Reference Entity, widen.
B — The Fund makes periodic payments when credit spreads, as represented by the Reference Entity, narrow.
C — The Fund receives periodic payments when credit spreads, as represented by the Reference Entity, widen.
D — The Fund receives periodic payments when credit spreads, as represented by the Reference Entity, narrow.
Currency Swaps as of December 31, 2008 are as follows:
| | | | | | | | | | | | | | | | | | | | | | | |
| | | | | Notional | | | | | | | | | | | | | |
| | | Swap | | Amount | | | Paid by | | | Received by | | | Termination | | | | |
| Reference Entity | | Counterparty | | (000’s) | | | the Fund | | | the Fund | | | Date | | | Value | |
| |
| USD BBA LIBOR: | | | | | | | | | | | | | | | | | | | | | | |
| | | | | | | | | Three Month USD
| | | | | | | | | | | | |
| | | Credit Suisse International | | 3,170 TRY | | BBA LIBOR | | | 16.75 | % | | | 2/26/12 | | | $ | 158,012 | |
| | | | | | | | | Three Month USD
| | | | | | | | | | | | |
| | | Credit Suisse International | | 1,255 TRY | | BBA LIBOR | | | 17.25 | | | | 2/7/12 | | | | 84,253 | |
| | | | | | | | | Three Month USD
| | | | | | | | | | | | |
| | | Credit Suisse International | | 1,890 TRY | | BBA LIBOR | | | 17.30 | | | | 2/9/12 | | | | 125,319 | |
| | | | | | | | | Three Month BBA
| | | | | | | | | | | | |
| | | Merrill Lynch International | | 1,960 TRY | | LIBOR | | | 17.10 | | | | 2/6/12 | | | | 197,343 | |
| | | | | | | | | | | | | | | | | | | | | | |
| | | | | | | | | | | | | | | | | Reference Entity Total
| | | 564,927 | |
| | | | | | | | | | | | | | | | | | | | | | |
| | | | | | | | | | | | | | | | | Total Currency Swaps
| | $ | 564,927 | |
| | | | | | | | | | | | | | | | | | | | | | |
Notional amount is reported in U.S. Dollars (USD), except for those denoted in the following currency: TRY New Turkish Lira
Abbreviation is as follows:
BBA LIBOR British Bankers’ Association London-Interbank Offered Rate
Swap Summary as of December 31, 2008 is as follows:
The following table aggregates, as of period end, the amount receivable from/(payable to) each counterparty with whom the Fund has entered into a swap agreement. Swaps are individually disclosed in the preceding tables.
| | | | | | | | | | | | | |
| | | | | Notional | | | | | | |
| | | Swap Type from | | Amount | | | | | | |
| Swap Counterparty | | Fund Perspective | | (000’s) | | | | | Value | |
| |
| Banco Santander Central Hispano SA | | Interest Rate | | | 60,420 | | | BRR | | $ | 968,134 | |
| Banco Santander SA, Inc.: | | | | | | | | | | | | |
| | | Interest Rate | | | 40,970 | | | BRR | | | 727,221 | |
| | | Interest Rate | | | 150,010 | | | MXN | | | 204,132 | |
| | | | | | | | | | | | |
| | | | | | | | | | | | 931,353 | |
| Barclays Bank plc: | | | | | | | | | | | | |
| | | Credit Default Sell Protection | | | 74,916 | | | | | | (11,638,473 | ) |
| | | Interest Rate | | | 2,299,000 | | | HUF | | | (169,346 | ) |
| | | Interest Rate | | | 121,695 | | | SEK | | | (184,729 | ) |
| | | | | | | | | | | | |
| | | | | | | | | | | | (11,992,548 | ) |
F42 | OPPENHEIMER STRATEGIC BOND FUND/ VA
Swap Summary: Continued
| | | | | | | | | | | | | |
| | | | | Notional | | | | | | |
| | | Swap Type from | | Amount | | | | | | |
| Swap Counterparty | | Fund Perspective | | (000’s) | | | | | Value | |
| |
| Citibank NA: | | | | | | | | | | | | |
| | | Interest Rate | | | 1,705,000 | | | HUF | | $ | (211,871 | ) |
| | | Interest Rate | | | 175,200 | | | MXN | | | 348,498 | |
| | | Total Return | | | 28,723 | | | | | | 2,967,185 | |
| | | Total Return | | | 8,844 | | | BRR | | | 213,901 | |
| | | | | | | | | | | | |
| | | | | | | | | | | | 3,317,713 | |
| Citibank NA, New York: | | | | | | | | | | | | |
| | | Credit Default Buy Protection | | | 7,250 | | | | | | 2,033,853 | |
| | | Credit Default Sell Protection | | | 32,180 | | | | | | (7,341,947 | ) |
| | | Interest Rate | | | 297,000 | | | CZK | | | 327,625 | |
| | | Total Return | | | 6,530 | | | GBP | | | (94,244 | ) |
| | | Total Return | | | 902,674 | | | JPY | | | 1,383,993 | |
| | | | | | | | | | | | |
| | | | | | | | | | | | (3,690,720 | ) |
| Credit Suisse International: | | | | | | | | | | | | |
| | | Credit Default Buy Protection | | | 8,650 | | | | | | 2,332,279 | |
| | | Credit Default Sell Protection | | | 71,567 | | | | | | (14,700,116 | ) |
| | | Currency | | | 6,315 | | | TRY | | | 367,584 | |
| | | Interest Rate | | | 12,860 | | | ILS | | | 81,966 | |
| | | Interest Rate | | | 58,280 | | | MXN | | | 12,390 | |
| | | | | | | | | | | | |
| | | | | | | | | | | | (11,905,897 | ) |
| Deutsche Bank AG: | | | | | | | | | | | | |
| | | Credit Default Buy Protection | | | 2,895 | | | | | | 387,890 | |
| | | Credit Default Sell Protection | | | 108,974 | | | | | | (31,030,392 | ) |
| | | Interest Rate | | | 59,900 | | | SEK | | | 1,357,549 | |
| | | Total Return | | | 2,550 | | | | | | 73,231 | |
| | | | | | | | | | | | |
| | | | | | | | | | | | (29,211,722 | ) |
| Deutsche Bank AG, London: | | | | | | | | | | | | |
| | | Interest Rate | | | 10,150 | | | SEK | | | 24,436 | |
| | | Total Return | | | 8,408 | | | | | | 317,946 | |
| | | | | | | | | | | | |
| | | | | | | | | | | | 342,382 | |
| Goldman Sachs Bank USA | | Credit Default Sell Protection | | | 3,705 | | | | | | (2,241,236 | ) |
| Goldman Sachs Capital Markets LP: | | | | | | | | | | | | |
| | | Interest Rate | | | 21,000 | | | BRR | | | 410,455 | |
| | | Interest Rate | | | 62,900 | | | MXN | | | (62,148 | ) |
| | | | | | | | | | | | |
| | | | | | | | | | | | 348,307 | |
| Goldman Sachs Group, Inc. (The): | | | | | | | | | | | | |
| | | Interest Rate | | | 480,000 | | | CZK | | | 456,765 | |
| | | Interest Rate | | | 1,215,900 | | | MXN | | | 2,199,847 | |
| | | Interest Rate | | | 43,340 | | | PLZ | | | 1,015,886 | |
| | | Total Return | | | 94,590 | | | | | | 18,137,543 | |
| | | Total Return | | | 3,812 | | | CHF | | | (19,934 | ) |
| | | | | | | | | | | | |
| | | | | | | | | | | | 21,790,107 | |
| Goldman Sachs International: | | | | | | | | | | | | |
| | | Credit Default Buy Protection | | | 18,385 | | | | | | 4,280,502 | |
| | | Credit Default Sell Protection | | | 32,175 | | | | | | (9,171,538 | ) |
| | | Interest Rate | | | 19,640 | | | BRR | | | 270,047 | |
| | | Interest Rate | | | 18,300 | | | CNY | | | (199,593 | ) |
| | | Interest Rate | | | 23,970 | | | PLZ | | | 212,618 | |
| | | Interest Rate | | | 104,100 | | | SEK | | | 2,188,798 | |
| | | Total Return | | | 34,457 | | | | | | 5,191,739 | |
| | | | | | | | | | | | |
| | | | | | | | | | | | 2,772,573 | |
| J Aron & Co.: | | | | | | | | | | | | |
| | | Interest Rate | | | 180,975 | | | BRR | | | 485,226 | |
| | | Interest Rate | | | 32,000 | | | MXN | | | 156,289 | |
| | | | | | | | | | | | |
| | | | | | | | | | | | 641,515 | |
| JPMorgan Chase | | Total Return | | | 6,520 | | | | | | 1,103,750 | |
F43 | OPPENHEIMER STRATEGIC BOND FUND/ VA
STATEMENT OF INVESTMENTS Continued
Footnotes to Statement of Investments Continued
Swap Summary: Continued
| | | | | | | | | | | | | |
| | | | | Notional | | | | | | |
| | | Swap Type from | | Amount | | | | | | |
| Swap Counterparty | | Fund Perspective | | (000’s) | | | | | Value | |
| |
| JPMorgan Chase Bank NA: | | | | | | | | | | | | |
| | | Interest Rate | | | 61,030 | | | BRR | | $ | 713,939 | |
| | | Interest Rate | | | 1,198,700 | | | CZK | | | 964,352 | |
| | | Interest Rate | | | 5,332,000 | | | HUF | | | 314,738 | |
| | | Interest Rate | | | 982,455 | | | MXN | | | 2,532,969 | |
| | | Interest Rate | | | 15,840 | | | PLZ | | | 393,362 | |
| | | Interest Rate | | | 85,400 | | | ZAR | | | (680,757 | ) |
| | | | | | | | | | | | |
| | | | | | | | | | | | 4,238,603 | |
| JPMorgan Chase Bank NA, NY Branch: | | | | | | | | | | | | |
| | | Credit Default Buy Protection | | | 12,500 | | | | | | 3,808,398 | |
| | | Credit Default Sell Protection | | | 54,981 | | | | | | (13,881,297 | ) |
| | | | | | | | | | | | |
| | | | | | | | | | | | (10,072,899 | ) |
| Merrill Lynch | | Total Return | | | 70,080 | | | | | | (5,098,242 | ) |
| Merrill Lynch Capital Services, Inc. | | Interest Rate | | | 36,370 | | | MXN | | | 40,143 | |
| Merrill Lynch International: | | | | | | | | | | | | |
| | | Credit Default Buy Protection | | | 7,580 | | | | | | 4,138,415 | |
| | | Credit Default Sell Protection | | | 15,230 | | | | | | (6,652,104 | ) |
| | | Currency | | | 1,960 | | | TRY | | | 197,343 | |
| | | | | | | | | | | | |
| | | | | | | | | | | | (2,316,346 | ) |
| Morgan Stanley: | | | | | | | | | | | | |
| | | Interest Rate | | | 74,800 | | | BRR | | | 2,168,634 | |
| | | Interest Rate | | | 140,800 | | | CZK | | | 396,999 | |
| | | Interest Rate | | | 67,300 | | | MXN | | | 240,451 | |
| | | Total Return | | | 92,430 | | | | | | 15,169,691 | |
| | | Total Return | | | 5,365 | | | EUR | | | 522,105 | |
| | | | | | | | | | | | |
| | | | | | | | | | | | 18,497,880 | |
| Morgan Stanley Capital Services, Inc.: | | | | | | | | | | | | |
| | | Credit Default Buy Protection | | | 29,830 | | | | | | 8,290,338 | |
| | | Credit Default Sell Protection | | | 103,221 | | | | | | (22,400,280 | ) |
| | | Credit Default Sell Protection | | | 6,386 | | | EUR | | | (847,671 | ) |
| | | Interest Rate | | | 5,590 | | | BRR | | | 104,917 | |
| | | Total Return | | | 271,430 | | | RUR | | | (4,693,128 | ) |
| | | | | | | | | | | | |
| | | | | | | | | | | | (19,545,824 | ) |
| Morgan Stanley International | | Total Return | | | 5,208 | | | EUR | | | 298,665 | |
| UBS AG: | | | | | | | | | | | | |
| | | Credit Default Buy Protection | | | 6,420 | | | | | | 2,036,388 | |
| | | Credit Default Sell Protection | | | 37,650 | | | | | | (6,581,537 | ) |
| | | Interest Rate | | | 9,100 | | | BRR | | | 276,039 | |
| | | Interest Rate | | | 47,780 | | | ILS | | | 1,117,293 | |
| | | Interest Rate | | | 85,400 | | | ZAR | | | (681,438 | ) |
| | | | | | | | | | | | |
| | | | | | | | | | | | (3,833,255 | ) |
| Westpac Banking Corp. | | Interest Rate | | | 25,500 | | | AUD | | | 696,838 | |
| | | | | | | | | | | | |
| | | | | Total Swaps | | | | $ | (43,920,726 | ) |
| | | | | | | | | | | | |
Notional amount is reported in U.S. Dollars (USD), except for those denoted in the following currencies:
| | | |
| AUD | | Australian Dollar |
| BRR | | Brazilian Real |
| CHF | | Swiss Franc |
| CNY | | Chinese Renminbi (Yuan) |
| CZK | | Czech Koruna |
| EUR | | Euro |
| GBP | | British Pound Sterling |
| HUF | | Hungarian Forint |
| ILS | | Israeli Shekel |
| JPY | | Japanese Yen |
| MXN | | Mexican Nuevo Peso |
| PLZ | | Polish Zloty |
| RUR | | Russian Ruble |
| SEK | | Swedish Krona |
| TRY | | New Turkish Lira |
| ZAR | | South African Rand |
F44 | OPPENHEIMER STRATEGIC BOND FUND/ VA
STATEMENT OF ASSETS AND LIABILITIES December 31, 2008
| | | | | |
Assets | | | | |
| Investments, at value—see accompanying statement of investments: | | | | |
| Unaffiliated companies (cost $3,646,540,330) | | $ | 3,136,039,645 | |
| Affiliated companies (cost $802,775,456) | | | 755,543,387 | |
| | | | |
| | | | 3,891,583,032 | |
| Cash | | | 21,028,099 | |
| Cash—foreign currencies (cost $716,523) | | | 711,182 | |
| Unrealized appreciation on foreign currency exchange contracts | | | 35,720,782 | |
| Swaps, at value (upfront payments received $6,041,484) | | | 77,876,379 | |
| Unrealized appreciation on unfunded loan commitments | | | 1,718,957 | |
| Receivables and other assets: | | | | |
| Interest, dividends and principal paydowns | | | 45,560,981 | |
| Closed foreign currency contracts | | | 35,028,779 | |
| Investments sold (including $26,790,819 sold on a when-issued or delayed delivery basis) | | | 27,223,240 | |
| Shares of beneficial interest sold | | | 392,382 | |
| Due from Manager | | | 861 | |
| Other | | | 424,643 | |
| | | | |
| Total assets | | | 4,137,269,317 | |
Liabilities | | | | |
| Short positions, at value (proceeds of $3,628,788)—see accompanying statement of investments | | | 3,656,058 | |
| Options written, at value (premiums received $157,040)—see accompanying statement of investments | | | 144,317 | |
| Return of collateral for securities loaned | | | 325,265,870 | |
| Unrealized depreciation on foreign currency exchange contracts | | | 43,041,759 | |
| Swaps, at value (net upfront payments received $20,746,158) | | | 121,797,105 | |
| Payables and other liabilities: | | | | |
| Investments purchased (including $72,960,143 purchased on a when-issued or delayed delivery basis) | | | 110,038,691 | |
| Closed foreign currency contracts | | | 35,220,680 | |
| Shares of beneficial interest redeemed | | | 17,920,869 | |
| Futures margins | | | 4,080,437 | |
| Distribution and service plan fees | | | 1,767,335 | |
| Shareholder communications | | | 223,613 | |
| Trustees’ compensation | | | 11,710 | |
| Transfer and shareholder servicing agent fees | | | 1,720 | |
| Terminated investment contracts | | | 14,926,192 | |
| Other | | | 288,220 | |
| | | | |
| Total liabilities | | | 678,384,576 | |
Net Assets | | $ | 3,458,884,741 | |
| | | | |
Composition of Net Assets | | | | |
| Par value of shares of beneficial interest | | $ | 760,749 | |
| Additional paid-in capital | | | 4,016,806,288 | |
| Accumulated net investment income | | | 54,184,535 | |
| Accumulated net realized loss on investments and foreign currency transactions | | | (37,509,630 | ) |
| Net unrealized depreciation on investments and translation of assets and liabilities denominated in foreign currencies | | | (575,357,201 | ) |
| | | | |
Net Assets | | $ | 3,458,884,741 | |
| | | | |
Net Asset Value Per Share | | | | |
| Non-Service Shares: | | | | |
| Net asset value, redemption price per share and offering price per share (based on net assets of $648,570,029 and 144,352,029 shares of beneficial interest outstanding) | | $ | 4.49 | |
| Service Shares: | | | | |
| Net asset value, redemption price per share and offering price per share (based on net assets of $2,810,314,712 and 616,397,008 shares of beneficial interest outstanding) | | $ | 4.56 | |
See accompanying Notes to Financial Statements.
F45 | OPPENHEIMER STRATEGIC BOND FUND/ VA
STATEMENT OF OPERATIONS For the Year Ended December 31, 2008
| | | | | |
Allocation of Income and Expenses from Master Funds1 | | | | |
| Net investment income allocated from Oppenheimer Master Event-Linked Bond Fund: | | | | |
| Interest | | $ | 499,946 | |
| Dividends | | | 3,862 | |
Expenses2 | | | (34,605 | ) |
| | | | |
| Net investment income from Oppenheimer Master Event-Linked Bond Fund, LLC | | | 469,203 | |
| Net investment income allocated from Oppenheimer Master Loan Fund, LLC: | | | | |
| Interest | | | 11,145,892 | |
| Dividends | | | 386,280 | |
Expenses3 | | | (513,160 | ) |
| | | | |
| Net investment income from Oppenheimer Master Loan Fund, LLC | | | 11,019,012 | |
Investment Income | | | | |
| Interest (net of foreign withholding taxes of $66,874) | | | 216,600,047 | |
| Dividends: | | | | |
| Unaffiliated companies (net of foreign withholding taxes of $8,406) | | | 608,546 | |
| Affiliated companies | | | 16,462,436 | |
| Fee income | | | 1,045,297 | |
| Income from investment of securities lending cash collateral, net: | | | | |
| Unaffiliated companies | | | 156,398 | |
| Affiliated companies | | | 1,405,615 | |
| | | | |
| Total investment income | | | 236,278,339 | |
Expenses | | | | |
| Management fees | | | 21,372,387 | |
| Distribution and service plan fees—Service shares | | | 7,876,236 | |
| Transfer and shareholder servicing agent fees: | | | | |
| Non-Service shares | | | 9,994 | |
| Service shares | | | 9,994 | |
| Shareholder communications: | | | | |
| Non-Service shares | | | 135,876 | |
| Service shares | | | 582,180 | |
| Custodian fees and expenses | | | 270,995 | |
| Trustees’ compensation | | | 57,498 | |
| Other | | | 234,583 | |
| | | | |
| Total expenses | | | 30,549,743 | |
| Less reduction to custodian expenses | | | (2,127 | ) |
| Less waivers and reimbursements of expenses | | | (936,254 | ) |
| | | | |
| Net expenses | | | 29,611,362 | |
Net Investment Income | | | 218,155,192 | |
F46 | OPPENHEIMER STRATEGIC BOND FUND/ VA
STATEMENT OF OPERATIONS Continued
Realized and Unrealized Gain (Loss)
| | | | | |
| Net realized gain (loss) on: | | | | |
| Investments from unaffiliated companies (including premiums on options exercised) | | $ | (42,357,137 | ) |
| Closing and expiration of option contracts written | | | 10,315,924 | |
| Closing and expiration of futures contracts | | | 79,749,778 | |
| Foreign currency transactions | | | (5,229,231 | ) |
| Short positions | | | (896,457 | ) |
| Swap contracts | | | (234,962,614 | ) |
| Allocated from Oppenheimer Master Event-Linked Bond Fund, LLC | | | 178,059 | |
| Allocated from Oppenheimer Master Loan Fund, LLC | | | (4,315,961 | ) |
| | | | |
| Net realized loss | | | (197,517,639 | ) |
| Net change in unrealized appreciation (depreciation) on: | | | | |
| Investments | | | (462,371,211 | ) |
| Translation of assets and liabilities denominated in foreign currencies | | | (132,606,093 | ) |
| Futures contracts | | | 8,034,576 | |
| Option contracts written | | | (290,527 | ) |
| Short positions | | | 412,795 | |
| Swap contracts | | | (12,546,395 | ) |
| Unfunded loan commitments | | | 1,718,957 | |
| Allocated from Oppenheimer Master Event-Linked Bond Fund, LLC | | | (838,725 | ) |
| Allocated from Oppenheimer Master Loan Fund, LLC | | | (45,192,707 | ) |
| | | | |
| Net change in unrealized depreciation | | | (643,679,330 | ) |
Net Decrease in Net Assets Resulting from Operations | | $ | (623,041,777 | ) |
| | | | |
| | |
| 1. | | The fund invests in certain affiliated mutual funds that expect to be treated as partnerships for tax purposes. See Note 1 of accompanying Notes. |
| |
| 2. | | Net of expense waivers and/or reimbursements of $147. |
| |
| 3. | | Net of expense waivers and/or reimbursements of $10,253. |
See accompanying Notes to Financial Statements.
F47 | OPPENHEIMER STRATEGIC BOND FUND/ VA
STATEMENTS OF CHANGES IN NET ASSETS
| | | | | | | | | |
| Year Ended December 31, | | 2008 | | | 2007 | |
| |
Operations | | | | | | | | |
| Net investment income | | $ | 218,155,192 | | | $ | 140,904,592 | |
| Net realized gain (loss) | | | (197,517,639 | ) | | | 93,909,628 | |
| Net change in unrealized appreciation (depreciation) | | | (643,679,330 | ) | | | 19,532,851 | |
| | | |
| Net increase (decrease) in net assets resulting from operations | | | (623,041,777 | ) | | | 254,347,071 | |
| | | | | | | | | |
Dividends and/or Distributions to Shareholders | | | | | | | | |
| Dividends from net investment income: | | | | | | | | |
| Non-Service shares | | | (36,989,595 | ) | | | (22,674,018 | ) |
| Service shares | | | (140,242,199 | ) | | | (53,839,537 | ) |
| | | |
| | | | (177,231,794 | ) | | | (76,513,555 | ) |
| Distributions from net realized gain: | | | | | | | | |
| Non-Service shares | | | (8,547,484 | ) | | | — | |
| Service shares | | | (33,595,865 | ) | | | — | |
| | | |
| | | | | | | | | |
| | | | (42,143,349 | ) | | | — | |
Beneficial Interest Transactions | | | | | | | | |
| Net increase in net assets resulting from beneficial interest transactions: | | | | | | | | |
| Non-Service shares | | | 73,339,965 | | | | 88,509,398 | |
| Service shares | | | 617,334,287 | | | | 1,341,464,972 | |
| | | |
| | | | 690,674,252 | | | | 1,429,974,370 | |
| | | | | | | | | |
Net Assets | | | | | | | | |
| Total increase (decrease) | | | (151,742,668 | ) | | | 1,607,807,886 | |
| Beginning of period | | | 3,610,627,409 | | | | 2,002,819,523 | |
| | | |
| End of period (including accumulated net investment income of $54,184,535 and $174,553,620, respectively) | | $ | 3,458,884,741 | | | $ | 3,610,627,409 | |
| | | |
See accompanying Notes to Financial Statements.
F48 | OPPENHEIMER STRATEGIC BOND FUND/ VA
FINANCIAL HIGHLIGHTS
| | | | | | | | | | | | | | | | | | | | | |
| Non-Service Shares Year Ended December 31, | | 2008 | | | 2007 | | | 2006 | | | 2005 | | | 2004 | |
| |
Per Share Operating Data | | | | | | | | | | | | | | | | | | | | |
| Net asset value, beginning of period | | $ | 5.56 | | | $ | 5.26 | | | $ | 5.11 | | | $ | 5.21 | | | $ | 5.05 | |
| |
| Income (loss) from investment operations: | | | | | | | | | | | | | | | | | | | | |
Net investment income1 | | | .30 | | | | .28 | | | | .26 | | | | .25 | | | | .22 | |
| Net realized and unrealized gain (loss) | | | (1.04 | ) | | | .21 | | | | .11 | | | | (.12 | ) | | | .20 | |
| | | |
| Total from investment operations | | | (.74 | ) | | | .49 | | | | .37 | | | | .13 | | | | .42 | |
| |
| Dividends and/or distributions to shareholders: | | | | | | | | | | | | | | | | | | | | |
| Dividends from net investment income | | | (.27 | ) | | | (.19 | ) | | | (.22 | ) | | | (.23 | ) | | | (.26 | ) |
| Distributions from net realized gain | | | (.06 | ) | | | — | | | | — | | | | — | | | | — | |
| | | |
| Total dividends and distributions to shareholders | | | (.33 | ) | | | (.19 | ) | | | (.22 | ) | | | (.23 | ) | | | (.26 | ) |
| |
| Net asset value, end of period | | $ | 4.49 | | | $ | 5.56 | | | $ | 5.26 | | | $ | 5.11 | | | $ | 5.21 | |
| | | |
Total Return, at Net Asset Value2 | | | (14.21 | )% | | | 9.69 | % | | | 7.49 | % | | | 2.67 | % | | | 8.67 | % |
Ratios/Supplemental Data | | | | | | | | | | | | | | | | | | | | |
| Net assets, end of period (in thousands) | | $ | 648,570 | | | $ | 734,611 | | | $ | 606,632 | | | $ | 538,141 | | | $ | 614,915 | |
| |
| Average net assets (in thousands) | | $ | 753,062 | | | $ | 664,668 | | | $ | 564,248 | | | $ | 550,201 | | | $ | 584,878 | |
| |
Ratios to average net assets:3,4 | | | | | | | | | | | | | | | | | | | | |
| Net investment income | | | 5.78 | % | | | 5.34 | % | | | 5.05 | % | | | 4.91 | % | | | 4.50 | % |
| Total expenses | | | 0.59 | %5 | | | 0.59 | %5 | | | 0.64 | %5 | | | 0.71 | % | | | 0.74 | % |
| Expenses after payments, waivers and/or reimbursements and reduction to custodian expenses | | | 0.57 | % | | | 0.57 | % | | | 0.63 | % | | | 0.71 | % | | | 0.74 | % |
| |
Portfolio turnover rate6 | | | 86 | % | | | 76 | % | | | 93 | % | | | 98 | % | | | 88 | % |
| | |
| 1. | | Per share amounts calculated based on the average shares outstanding during the period. |
| |
| 2. | | Assumes an investment on the business day before the first day of the fiscal period, with all dividends and distributions reinvested in additional shares on the reinvestment date, and redemption at the net asset value calculated on the last business day of the fiscal period. Total returns are not annualized for periods less than one full year. Total return information does not reflect expenses that apply at the separate account level or to related insurance products. Inclusion of these charges would reduce the total return figures for all periods shown. Returns do not reflect the deduction of taxes that a shareholder would pay on fund distributions or the redemption of fund shares. |
| |
| 3. | | Annualized for periods less than one full year. |
| |
| 4. | | Includes the Fund’s share of the Master Funds’ allocated expenses and/or net investment income. |
| |
| 5. | | Total expenses including indirect expenses from Oppenheimer Institutional Money Market Fund and OFI Liquid Assets Fund, LLC were as follows: |
| | | | | |
| Year Ended December 31, 2008 | | | 0.60 | % |
| Year Ended December 31, 2007 | | | 0.61 | % |
| Year Ended December 31, 2006 | | | 0.64 | % |
| | |
| |
| 6. | | The portfolio turnover rate excludes purchase and sale transactions of To Be Announced (TBA) mortgage-related securities as follows: |
| | | | | | | | | |
| | | Purchase Transactions | | | Sale Transactions | |
| |
| Year Ended December 31, 2008 | | $ | 634,319,548 | | | $ | 594,845,589 | |
| Year Ended December 31, 2007 | | $ | 1,061,009,472 | | | $ | 1,120,098,096 | |
| Year Ended December 31, 2006 | | $ | 742,785,501 | | | $ | 749,719,239 | |
| Year Ended December 31, 2005 | | $ | 890,029,144 | | | $ | 873,786,459 | |
| Year Ended December 31, 2004 | | $ | 959,649,113 | | | $ | 973,488,511 | |
See accompanying Notes to Financial Statements.
F49 | OPPENHEIMER STRATEGIC BOND FUND/ VA
FINANCIAL HIGHLIGHTS Continued
| | | | | | | | | | | | | | | | | | | | | |
| Service Shares Year Ended December 31, | | 2008 | | | 2007 | | | 2006 | | | 2005 | | | 2004 | |
| |
Per Share Operating Data | | | | | | | | | | | | | | | | | | | | |
| Net asset value, beginning of period | | $ | 5.65 | | | $ | 5.34 | | | $ | 5.19 | | | $ | 5.29 | | | $ | 5.13 | |
| |
| Income (loss) from investment operations: | | | | | | | | | | | | | | | | | | | | |
Net investment income1 | | | .29 | | | | .28 | | | | .25 | | | | .21 | | | | .19 | |
| Net realized and unrealized gain (loss) | | | (1.06 | ) | | | .22 | | | | .11 | | | | (.08 | ) | | | .22 | |
| | | |
| Total from investment operations | | | (.77 | ) | | | .50 | | | | .36 | | | | .13 | | | | .41 | |
| |
| Dividends and/or distributions to shareholders: | | | | | | | | | | | | | | | | | | | | |
| Dividends from net investment income | | | (.26 | ) | | | (.19 | ) | | | (.21 | ) | | | (.23 | ) | | | (.25 | ) |
| Distributions from net realized gain | | | (.06 | ) | | | — | | | | — | | | | — | | | | — | |
| | | |
| Total dividends and distributions to shareholders | | | (.32 | ) | | | (.19 | ) | | | (.21 | ) | | | (.23 | ) | | | (.25 | ) |
| |
| Net asset value, end of period | | $ | 4.56 | | | $ | 5.65 | | | $ | 5.34 | | | $ | 5.19 | | | $ | 5.29 | |
| | | |
Total Return, at Net Asset Value2 | | | (14.49 | )% | | | 9.55 | % | | | 7.23 | % | | | 2.48 | % | | | 8.43 | % |
Ratios/Supplemental Data | | | | | | | | | | | | | | | | | | | | |
| Net assets, end of period (in thousands) | | $ | 2,810,315 | | | $ | 2,876,016 | | | $ | 1,396,188 | | | $ | 658,107 | | | $ | 242,705 | |
| |
| Average net assets (in thousands) | | $ | 3,152,967 | | | $ | 2,075,028 | | | $ | 1,016,582 | | | $ | 408,515 | | | $ | 150,040 | |
| |
Ratios to average net assets:3,4 | | | | | | | | | | | | | | | | | | | | |
| Net investment income | | | 5.54 | % | | | 5.08 | % | | | 4.83 | % | | | 4.20 | % | | | 3.82 | % |
| Total expenses | | | 0.84 | %5 | | | 0.84 | %5 | | | 0.89 | %5 | | | 0.96 | % | | | 0.99 | % |
| Expenses after payments, waivers and/or reimbursements and reduction to custodian expenses | | | 0.82 | % | | | 0.82 | % | | | 0.88 | % | | | 0.96 | % | | | 0.99 | % |
| |
Portfolio turnover rate6 | | | 86 | % | | | 76 | % | | | 93 | % | | | 98 | % | | | 88 | % |
| | |
| 1. | | Per share amounts calculated based on the average shares outstanding during the period. |
| |
| 2. | | Assumes an investment on the business day before the first day of the fiscal period, with all dividends and distributions reinvested in additional shares on the reinvestment date, and redemption at the net asset value calculated on the last business day of the fiscal period. Total returns are not annualized for periods less than one full year. Total return information does not reflect expenses that apply at the separate account level or to related insurance products. Inclusion of these charges would reduce the total return figures for all periods shown. Returns do not reflect the deduction of taxes that a shareholder would pay on fund distributions or the redemption of fund shares. |
| |
| 3. | | Annualized for periods less than one full year. |
| |
| 4. | | Includes the Fund’s share of the Master Funds’ allocated expenses and/or net investment income. |
| |
| 5. | | Total expenses including indirect expenses from Oppenheimer Institutional Money Market Fund and OFI Liquid Assets Fund, LLC were as follows: |
| | | | | |
| Year Ended December 31, 2008 | | | 0.85 | % |
| Year Ended December 31, 2007 | | | 0.86 | % |
| Year Ended December 31, 2006 | | | 0.89 | % |
| | |
| 6. | | The portfolio turnover rate excludes purchases and sales of To Be Announced (TBA) mortgage-related securities as follows: |
| | | | | | | | | |
| | | Purchase Transactions | | | Sale Transactions | |
| |
| Year Ended December 31, 2008 | | $ | 634,319,548 | | | $ | 594,845,589 | |
| Year Ended December 31, 2007 | | $ | 1,061,009,472 | | | $ | 1,120,098,096 | |
| Year Ended December 31, 2006 | | $ | 742,785,501 | | | $ | 749,719,239 | |
| Year Ended December 31, 2005 | | $ | 890,029,144 | | | $ | 873,786,459 | |
| Year Ended December 31, 2004 | | $ | 959,649,113 | | | $ | 973,488,511 | |
See accompanying Notes to Financial Statements.
F50 | OPPENHEIMER STRATEGIC BOND FUND/ VA
NOTES TO FINANCIAL STATEMENTS
1. Significant Accounting Policies
Oppenheimer Strategic Bond Fund/VA (the “Fund”) is a separate series of Oppenheimer Variable Account Funds, an open-end management investment company registered under the Investment Company Act of 1940, as amended. The Fund’s investment objective is to seek a high level of current income principally derived from interest on debt securities. The Fund’s investment adviser is OppenheimerFunds, Inc. (the “Manager”).
The Fund offers two classes of shares. Both classes are sold at their offering price, which is the net asset value per share, to separate investment accounts of participating insurance companies as an underlying investment for variable life insurance policies, variable annuity contracts or other investment products. The class of shares designated as Service shares is subject to a distribution and service plan. Both classes of shares have identical rights and voting privileges with respect to the Fund in general and exclusive voting rights on matters that affect that class alone. Earnings, net assets and net asset value per share may differ due to each class having its own expenses, such as transfer and shareholder servicing agent fees and shareholder communications, directly attributable to that class.
The following is a summary of significant accounting policies consistently followed by the Fund.
Securities Valuation. The Fund calculates the net asset value of its shares as of the close of the New York Stock Exchange (the “Exchange”), normally 4:00 P.M. Eastern time, on each day the Exchange is open for trading.
Effective for fiscal periods beginning after November 15, 2007, FASB Statement of Financial Accounting Standards No. 157, Fair Value Measurements, establishes a hierarchy for measuring fair value of assets and liabilities. As required by the standard, each investment asset or liability of the Fund is assigned a level at measurement date based on the significance and source of the inputs to its valuation. Quoted prices in active markets for identical securities are classified as “Level 1”, inputs other than quoted prices for an asset that are observable are classified as “Level 2” and unobservable inputs, including the Manager’s judgment about the assumptions that a market participant would use in pricing an asset or liability are classified as “Level 3”. The inputs used for valuing securities are not necessarily an indication of the risks associated with investing in those securities. A table summarizing the Fund’s investments under these levels of classification is included following the Statement of Investments.
Securities are valued using quoted market prices, when available, as supplied primarily either by portfolio pricing services approved by the Board of Trustees or dealers. These securities are typically classified within Level 1 or 2; however, they may be designated as Level 3 if the dealer or portfolio pricing service values a security through an internal model with significant unobservable market data inputs.
Securities traded on a registered U.S. securities exchange are valued based on the last sale price of the security reported on the principal exchange on which traded, prior to the time when the Fund’s assets are valued. Securities whose principal exchange is NASDAQ® are valued based on the official closing prices reported by NASDAQ prior to the time when the Fund’s assets are valued. In the absence of a sale, the security is valued at the last sale price on the prior trading day, if it is within the spread of the current day’s closing “bid” and “asked” prices, and if not, at the current day’s closing bid price. A foreign security traded on a foreign exchange is valued based on the last sale price on the principal exchange on which the security is traded, as identified by the portfolio pricing service used by the Manager, prior to the time when the Fund’s assets are valued. In the absence of a sale, the security is valued at the most recent official closing price on the principal exchange on which it is traded.
Shares of a registered investment company that are not traded on an exchange are valued at that investment company’s net asset value per share.
Corporate, government and municipal debt instruments having a remaining maturity in excess of sixty days and all mortgage-backed securities, collateralized mortgage obligations and other asset-backed securities are valued at the mean between the “bid” and “asked” prices.
“Money market-type” debt instruments with remaining maturities of sixty days or less are valued at cost adjusted by the amortization of discount or premium to maturity (amortized cost), which approximates market value. These securities are typically designated as Level 2.
F51 | OPPENHEIMER STRATEGIC BOND FUND/ VA
NOTES TO FINANCIAL STATEMENTS Continued
1. Significant Accounting Policies Continued
In the absence of a readily available quoted market price, including for securities whose values have been materially affected by what the Manager identifies as a significant event occurring before the Fund’s assets are valued but after the close of the securities’ respective exchanges, the Manager, acting through its internal valuation committee, in good faith determines the fair valuation of that asset using consistently applied procedures under the supervision of the Board of Trustees (which reviews those fair valuations by the Manager). Those procedures include certain standardized methodologies to fair value securities. Such methodologies include, but are not limited to, pricing securities initially at cost and subsequently adjusting the value based on: changes in company specific fundamentals, changes in an appropriate securities index, or changes in the value of similar securities which may be adjusted for any discounts related to resale restrictions. When possible, such methodologies use observable market inputs such as quoted prices of similar securities, observable interest rates, currency rates and yield curves. The methodologies used for valuing securities are not necessarily an indication of the risks associated with investing in those securities.
Fair valued securities may be classified as “Level 3” if the valuation primarily reflects the Manager’s own assumptions about the inputs that market participants would use in valuing such securities.
There have been no significant changes to the fair valuation methodologies during the period.
Structured Securities. The Fund invests in structured securities whose market values, interest rates and/or redemption prices are linked to the performance of underlying foreign currencies, interest rate spreads, stock market indices, prices of individual securities, commodities or other financial instruments or the occurrence of other specific events. The structured securities are often leveraged, increasing the volatility of each note’s market value relative to the change in the underlying linked financial element or event. Fluctuations in value of these securities are recorded as unrealized gains and losses in the accompanying Statement of Operations. The Fund records a realized gain or loss when a structured security is sold or matures.
Event-Linked Bonds. The Fund may invest in “event-linked” bonds. Event-linked bonds, which are sometimes referred to as “catastrophe” bonds, are fixed income securities for which the return of principal and payment of interest is contingent on the non-occurrence of a specific trigger event, such as a hurricane, earthquake, or other occurrence that leads to physical or economic loss. If the trigger event occurs prior to maturity, the Fund may lose all or a portion of its principal in addition to interest otherwise due from the security. Event-linked bonds may expose the Fund to certain other risks, including issuer default, adverse regulatory or jurisdictional interpretations, liquidity risk and adverse tax consequences. The Fund records the net change in market value of event-linked bonds on the Statement of Operations as a change in unrealized appreciation or depreciation on investments. The Fund records a realized gain or loss on the Statement of Operations upon the sale or maturity of such securities.
Securities on a When-Issued or Delayed Delivery Basis. The Fund may purchase securities on a “when-issued” basis, and may purchase or sell securities on a “delayed delivery” basis. “When-issued” or “delayed delivery” refers to securities whose terms and indenture are available and for which a market exists, but which are not available for immediate delivery. Delivery and payment for securities that have been purchased by the Fund on a when-issued basis normally takes place within six months and possibly as long as two years or more after the trade date. During this period, such securities do not earn interest, are subject to market fluctuation and may increase or decrease in value prior to their delivery. The purchase of securities on a when-issued basis may increase the volatility of the Fund’s net asset value to the extent the Fund executes such transactions while remaining substantially fully invested. When the Fund engages in when-issued or delayed delivery transactions, it relies on the buyer or seller, as the case may be, to complete the transaction. Their failure to do so may cause the Fund to lose the opportunity to obtain or dispose of the security at a price and yield it considers advantageous. The Fund maintains internally designated assets with a market value equal to or greater than the amount of its purchase commitments. The Fund may also sell securities that it purchased on a when-issued basis or forward commitment prior to settlement of the original purchase.
F52 | OPPENHEIMER STRATEGIC BOND FUND/ VA
As of December 31, 2008, the Fund had purchased securities issued on a when-issued or delayed delivery basis and sold securities issued on a delayed delivery basis as follows:
| | | | | |
| | | When-Issued or Delayed | |
| | | Delivery Basis Transactions | |
| |
| Purchased securities | | $ | 72,960,143 | |
| Sold securities | | | 26,790,819 | |
The Fund may enter into “forward roll” transactions with respect to mortgage-related securities. In this type of transaction, the Fund sells a mortgage-related security to a buyer and simultaneously agrees to repurchase a similar security (same type, coupon and maturity) at a later date at a set price. During the period between the sale and the repurchase, the Fund will not be entitled to receive interest and principal payments on the securities that have been sold. The Fund records the incremental difference between the forward purchase and sale of each forward roll as realized gain (loss) on investments or as fee income in the case of such transactions that have an associated fee in lieu of a difference in the forward purchase and sale price.
Risks of entering into forward roll transactions include the potential inability of the counterparty to meet the terms of the agreement; the potential of the Fund to receive inferior securities at redelivery as compared to the securities sold to the counterparty; counterparty credit risk. To assure its future payment of the purchase price, the Fund maintains internally designated assets with a market value equal to or greater than the payment obligation under the roll.
Securities Sold Short. The Fund may short sell when-issued securities for future settlement. The value of the open short position is recorded as a liability, and the Fund records an unrealized gain or loss for the change in value of the open short position. The Fund records a realized gain or loss when the short position is closed out.
Credit Risk. The Fund invests in high-yield, non-investment-grade bonds, which may be subject to a greater degree of credit risk. Credit risk relates to the ability of the issuer to meet interest or principal payments or both as they become due. The Fund may acquire securities in default, and is not obligated to dispose of securities whose issuers subsequently default. As of December 31, 2008, securities with an aggregate market value of $3,122,761, representing 0.09% of the Fund’s net assets, were in default.
Foreign Currency Translation. The Fund’s accounting records are maintained in U.S. dollars. The values of securities denominated in foreign currencies and amounts related to the purchase and sale of foreign securities and foreign investment income are translated into U.S. dollars as of the close of the Exchange, normally 4:00 P.M. Eastern time, on each day the Exchange is open for trading. Foreign exchange rates may be valued primarily using a reliable bank, dealer or service authorized by the Board of Trustees.
Reported net realized gains and losses from foreign currency transactions arise from sales of portfolio securities, sales and maturities of short-term securities, sales of foreign currencies, exchange rate fluctuations between the trade and settlement dates on securities transactions, and the difference between the amounts of dividends, interest, and foreign withholding taxes recorded on the Fund’s books and the U.S. dollar equivalent of the amounts actually received or paid. Net unrealized appreciation and depreciation on the translation of assets and liabilities denominated in foreign currencies arise from changes in the values of assets and liabilities, including investments in securities at fiscal period end, resulting from changes in exchange rates.
The effect of changes in foreign currency exchange rates on investments is separately identified from the fluctuations arising from changes in market values of securities held and reported with all other foreign currency gains and losses in the Fund’s Statement of Operations.
Investment in Oppenheimer Institutional Money Market Fund. The Fund is permitted to invest daily available cash balances in an affiliated money market fund. The Fund may invest the available cash in Class E shares of Oppenheimer Institutional Money Market Fund (“IMMF”) to seek current income while preserving liquidity. IMMF is a registered open-end management investment company, regulated as a money market fund under the Investment Company Act of 1940, as amended. The Manager is also the investment adviser of IMMF. The Fund’s investment in IMMF is included
F53 | OPPENHEIMER STRATEGIC BOND FUND/ VA
NOTES TO FINANCIAL STATEMENTS Continued
1. Significant Accounting Policies Continued in the Statement of Investments. As a shareholder, the Fund is subject to its proportional share of IMMF’s Class E expenses, including its management fee. The Manager will waive fees and/or reimburse Fund expenses in an amount equal to the indirect management fees incurred through the Fund’s investment in IMMF.
Investments in OFI Liquid Assets Fund, LLC. The Fund is permitted to invest cash collateral received in connection with its securities lending activities. Pursuant to the Fund’s Securities Lending Procedures, the Fund may invest cash collateral in, among other investments, an affiliated money market fund. OFI Liquid Assets Fund, LLC (“LAF”) is a limited liability company whose investment objective is to seek current income and stability of principal. The Manager is also the investment adviser of LAF. LAF is not registered under the Investment Company Act of 1940. However, LAF does comply with the investment restrictions applicable to registered money market funds set forth in Rule 2a-7 adopted under the Investment Company Act. The Fund’s investment in LAF is included in the Statement of Investments. As a shareholder, the Fund is subject to its proportional share of LAF’s expenses, including its management fee of 0.08%.
Investments in Oppenheimer Master Funds. The Fund is permitted to invest in entities sponsored and/or advised by the Manager or an affiliate. Certain of these entities in which the Fund invests are mutual funds registered under the Investment Company Act of 1940 that expect to be treated as partnerships for tax purposes, specifically Oppenheimer Master Loan Fund, LLC and Oppenheimer Master Event-Linked Bond Fund, LLC (the “Master Funds”). Each master fund has its own investment risks, and those risks can affect the value of the Fund’s investments and therefore the value of the Fund’s shares. To the extent that the Fund invests more of its assets in one master fund than in another, the Fund will have greater exposure to the risks of that master fund.
The investment objective of Oppenheimer Master Loan Fund, LLC is to seek as high a level of current income and preservation of capital as is consistent with investing primarily in loans and other debt securities. The investment objective of Oppenheimer Master Event-Linked Bond Fund, LLC is to seek a high level of current income principally derived from interest on debt securities. The Fund’s investments in the master funds are included in the Statement of Investments. The Fund recognizes income and gain/(loss) on its investments in each master fund according to its allocated pro-rata share, based on its relative proportion of total outstanding master fund shares held, of the total net income earned and the net gain/(loss) realized on investments sold by the master funds. As a shareholder, the Fund is subject to its proportional share of master funds’s expenses, including its management fee. The Manager will waive fees and/or reimburse Fund expenses in an amount equal to the indirect management fees incurred through the Fund’s investment in the master funds.
Investments With Off-Balance Sheet Market Risk. The Fund enters into financial instrument transactions (such as swaps, futures, options and other derivatives) that may have off-balance sheet market risk. Off-balance sheet market risk exists when the maximum potential loss on a particular financial instrument is greater than the value of such financial instrument, as reflected in the Fund’s Statement of Assets and Liabilities.
Allocation of Income, Expenses, Gains and Losses. Income, expenses (other than those attributable to a specific class), gains and losses are allocated on a daily basis to each class of shares based upon the relative proportion of net assets represented by such class. Operating expenses directly attributable to a specific class are charged against the operations of that class.
Federal Taxes. The Fund intends to comply with provisions of the Internal Revenue Code applicable to regulated investment companies and to distribute substantially all of its investment company taxable income, including any net realized gain on investments not offset by capital loss carryforwards, if any, to shareholders. Therefore, no federal income or excise tax provision is required. The Fund files income tax returns in U.S. federal and applicable state jurisdictions. The statute of limitations on the Fund’s tax return filings generally remain open for the three preceding fiscal reporting period ends.
F54 | OPPENHEIMER STRATEGIC BOND FUND/ VA
The tax components of capital shown in the following table represent distribution requirements the Fund must satisfy under the income tax regulations, losses the Fund may be able to offset against income and gains realized in future years and unrealized appreciation or depreciation of securities and other investments for federal income tax purposes.
| | | | | | | | | | | | | |
| | | | | | | | | | | Net Unrealized | |
| | | | | | | | | | | Depreciation | |
| | | | | | | | | | | Based on Cost of | |
| | | | | | | | | | | Securities and | |
| Undistributed | | Undistributed | | | Accumulated | | | Other Investments | |
| Net Investment | | Long-Term | | | Loss | | | for Federal Income | |
| Income | | Gain | | | Carryforward1,2,3,4,5,6 | | | Tax Purposes | |
| |
| $13,516,297 | | $ | — | | | $ | 34,364,903 | | | $ | 537,299,769 | |
| | |
| 1. | | As of December 31, 2008, the Fund had $4,149,094 of post-October losses available to offset future realized capital gains, if any. Such losses, if unutilized, will expire in 2017. |
| |
| 2. | | The Fund had $29,563,300 of post-October foreign currency losses which were deferred. |
| |
| 3. | | The Fund had $66,312 of post-October passive foreign investment company losses which were deferred. |
| |
| 4. | | The Fund had $586,197 of straddle losses which were deferred. |
| |
| 5. | | During the fiscal year ended December 31, 2008, the Fund did not utilize any capital loss carryforward. |
| |
| 6. | | During the fiscal year ended December 31, 2007, the Fund utilized $13,349,869 of capital loss carryforward to offset capital gains realized in that fiscal year. |
| |
| | | Net investment income (loss) and net realized gain (loss) may differ for financial statement and tax purposes. The character of dividends and distributions made during the fiscal year from net investment income or net realized gains may differ from their ultimate characterization for federal income tax purposes. Also, due to timing of dividends and distributions, the fiscal year in which amounts are distributed may differ from the fiscal year in which the income or net realized gain was recorded by the Fund. |
| |
| | | Accordingly, the following amounts have been reclassified for December 31, 2008. Net assets of the Fund were unaffected by the reclassifications. |
| | | | | | | | | |
| | | Reduction to | | | Reduction to | |
| | | Accumulated | | | Accumulated Net | |
| Increase | | Net Investment | | | Realized Loss | |
| to Paid-in Capital | | Income | | | on Investments7 | |
| |
| $241,246 | | $ | 161,292,483 | | | $ | 161,051,237 | |
| | |
| 7. | | $241,246 was distributed in connection with Fund share redemptions. |
The tax character of distributions paid during the years ended December 31, 2008 and December 31, 2007 was as follows:
| | | | | | | | | |
| | | Year Ended | | | Year Ended | |
| | | December 31, 2008 | | | December 31, 2007 | |
| |
| Distributions paid from: | | | | | | | | |
| Ordinary income | | $ | 184,452,300 | | | $ | 76,513,555 | |
| Long-term capital gain | | | 34,922,843 | | | | — | |
| | | |
| Total | | $ | 219,375,143 | | | $ | 76,513,555 | |
| | | |
The aggregate cost of securities and other investments and the composition of unrealized appreciation and depreciation of securities and other investments for federal income tax purposes as of December 31, 2008 are noted in the following table. The primary difference between book and tax appreciation or depreciation of securities and other investments, if applicable, is attributable to the tax deferral of losses or tax realization of financial statement unrealized gain or loss.
| | | | | |
| Federal tax cost of securities | | $ | 4,450,823,896 | |
| Federal tax cost of other investments | | | 62,378,815 | |
| | | | |
| Total federal tax cost | | $ | 4,513,202,711 | |
| | | | |
| | | | | |
| Gross unrealized appreciation | | $ | 228,283,863 | |
| Gross unrealized depreciation | | | (765,583,632 | ) |
| | | | |
| Net unrealized depreciation | | $ | (537,299,769 | ) |
| | | | |
F55 | OPPENHEIMER STRATEGIC BOND FUND/ VA
NOTES TO FINANCIAL STATEMENTS Continued
1. Significant Accounting Policies Continued
Trustees’ Compensation. The Board of Trustees has adopted a compensation deferral plan for independent trustees that enables trustees to elect to defer receipt of all or a portion of the annual compensation they are entitled to receive from the Fund. For purposes of determining the amount owed to the Trustee under the plan, deferred amounts are treated as though equal dollar amounts had been invested in shares of the Fund or in other Oppenheimer funds selected by the Trustee. The Fund purchases shares of the funds selected for deferral by the Trustee in amounts equal to his or her deemed investment, resulting in a Fund asset equal to the deferred compensation liability. Such assets are included as a component of “Other” within the asset section of the Statement of Assets and Liabilities. Deferral of trustees’ fees under the plan will not affect the net assets of the Fund, and will not materially affect the Fund’s assets, liabilities or net investment income per share. Amounts will be deferred until distributed in accordance to the compensation deferral plan.
Dividends and Distributions to Shareholders. Dividends and distributions to shareholders, which are determined in accordance with income tax regulations and may differ from U.S. generally accepted accounting principles, are recorded on the ex-dividend date. Income and capital gain distributions, if any, are declared and paid annually or at other times as deemed necessary by the Manager.
Investment Income. Dividend income is recorded on the ex-dividend date or upon ex-dividend notification in the case of certain foreign dividends where the ex-dividend date may have passed. Non-cash dividends included in dividend income, if any, are recorded at the fair market value of the securities received. Interest income is recognized on an accrual basis. Discount and premium, which are included in interest income on the Statement of Operations, are amortized or accreted daily.
Custodian Fees. “Custodian fees and expenses” in the Statement of Operations may include interest expense incurred by the Fund on any cash overdrafts of its custodian account during the period. Such cash overdrafts may result from the effects of failed trades in portfolio securities and from cash outflows resulting from unanticipated shareholder redemption activity. The Fund pays interest to its custodian on such cash overdrafts, to the extent they are not offset by positive cash balances maintained by the Fund, at a rate equal to the Federal Funds Rate plus 0.50%. The “Reduction to custodian expenses” line item, if applicable, represents earnings on cash balances maintained by the Fund during the period. Such interest expense and other custodian fees may be paid with these earnings.
Security Transactions. Security transactions are recorded on the trade date. Realized gains and losses on securities sold are determined on the basis of identified cost.
Indemnifications. The Fund’s organizational documents provide current and former trustees and officers with a limited indemnification against liabilities arising in connection with the performance of their duties to the Fund. In the normal course of business, the Fund may also enter into contracts that provide general indemnifications. The Fund’s maximum exposure under these arrangements is unknown as this would be dependent on future claims that may be made against the Fund. The risk of material loss from such claims is considered remote.
Other. The preparation of financial statements in conformity with accounting principles generally accepted in the United States of America requires management to make estimates and assumptions that affect the reported amounts of assets and liabilities and disclosure of contingent assets and liabilities at the date of the financial statements and the reported amounts of increases and decreases in net assets from operations during the reporting period. Actual results could differ from those estimates.
F56 | OPPENHEIMER STRATEGIC BOND FUND/ VA
2. Shares of Beneficial Interest
The Fund has authorized an unlimited number of $0.001 par value shares of beneficial interest of each class. Transactions in shares of beneficial interest were as follows:
| | | | | | | | | | | | | | | | | |
| | | Year Ended December 31, 2008 | | | Year Ended December 31, 2007 | |
| | | Shares | | | Amount | | | Shares | | | Amount | |
| |
Non-Service Shares | | | | | | | | | | | | | | | | |
| Sold | | | 44,736,337 | | | $ | 230,966,547 | | | | 27,845,638 | | | $ | 149,207,278 | |
| Dividends and/or distributions reinvested | | | 8,575,721 | | | | 45,537,079 | | | | 4,394,189 | | | | 22,674,018 | |
| Redeemed | | | (40,970,673 | ) | | | (203,163,661 | ) | | | (15,524,784 | ) | | | (83,371,898 | ) |
| | | |
| Net increase | | | 12,341,385 | | | $ | 73,339,965 | | | | 16,715,043 | | | $ | 88,509,398 | |
| | | |
| | | | | | | | | | | | | | | | | |
Service Shares | | | | | | | | | | | | | | | | |
| Sold | | | 147,318,126 | | | $ | 805,889,322 | | | | 244,861,091 | | | $ | 1,327,141,100 | |
| Dividends and/or distributions reinvested | | | 32,192,234 | | | | 173,838,064 | | | | 10,255,150 | | | | 53,839,537 | |
| Redeemed | | | (72,462,189 | ) | | | (362,393,099 | ) | | | (7,224,289 | ) | | | (39,515,665 | ) |
| | | |
| Net increase | | | 107,048,171 | | | $ | 617,334,287 | | | | 247,891,952 | | | $ | 1,341,464,972 | |
| | | |
3. Purchases and Sales of Securities
The aggregate cost of purchases and proceeds from sales of securities, other than short-term obligations and investments in Oppenheimer Institutional Money Market Fund, OFI Liquid Assets Fund, LLC and the Master Funds, for the year ended December 31, 2008, were as follows:
| | | | | | | | | |
| | | Purchases | | | Sales | |
| |
| Investment securities | | $ | 1,943,814,933 | | | $ | 1,746,455,568 | |
| U.S. government and government agency obligations | | | 607,453,670 | | | | 435,933,647 | |
| To Be Announced (TBA) mortgage-related securities | | | 634,319,548 | | | | 594,845,589 | |
4. Fees and Other Transactions with Affiliates
Management Fees. Under the investment advisory agreement, the Fund pays the Manager a management fee based on the daily net assets of the Fund at an annual rate as shown in the following table:
| | | | | |
| Fee Schedule | | | | |
| |
| Up to $200 million | | | 0.75 | % |
| Next $200 million | | | 0.72 | |
| Next $200 million | | | 0.69 | |
| Next $200 million | | | 0.66 | |
| Next $200 million | | | 0.60 | |
| Over $1 billion | | | 0.50 | |
Transfer Agent Fees. OppenheimerFunds Services (“OFS”), a division of the Manager, acts as the transfer and shareholder servicing agent for the Fund. The Fund pays OFS a per account fee. For the year ended December 31, 2008, the Fund paid $20,020 to OFS for services to the Fund.
Additionally, funds offered in variable annuity separate accounts are subject to minimum fees of $10,000 per class, for class level assets of $10 million or more. Each class is subject to the minimum fee in the event that the per account fee does not equal or exceed the applicable minimum fee.
Distribution and Service Plan for Service Shares. The Fund has adopted a Distribution and Service Plan (the “Plan”) in accordance with Rule 12b-1 under the Investment Company Act of 1940 for Service shares to pay OppenheimerFunds Distributor, Inc. (the “Distributor”), for distribution related services, personal service and account maintenance for the Fund’s Service shares. Under the Plan, payments are made periodically at an annual rate of up to 0.25% of the average annual net assets of Service shares of the Fund. The Distributor currently uses all of those fees to compensate sponsor(s)
F57 | OPPENHEIMER STRATEGIC BOND FUND/ VA
NOTES TO FINANCIAL STATEMENTS Continued
4. Fees and Other Transactions with Affiliates Continued of the insurance product that offers Fund shares, for providing personal service and maintenance of accounts of their variable contract owners that hold Service shares. These fees are paid out of the Fund’s assets on an on-going basis and increase operating expenses of the Service shares, which results in lower performance compared to the Fund’s shares that are not subject to a service fee. Fees incurred by the Fund under the Plan are detailed in the Statement of Operations.
Waivers and Reimbursements of Expenses. OFS has voluntarily agreed to limit transfer and shareholder servicing agent fees for all classes to 0.35% of average annual net assets per class. This undertaking may be amended or withdrawn at any time.
The Manager will waive fees and/or reimburse Fund expenses in an amount equal to the indirect management fees incurred through the Fund’s investments in IMMF and the Master Funds. During the year ended December 31, 2008, the Manager waived $936,254 for management fees.
5. Foreign Currency Exchange Contracts
The Fund may enter into foreign currency exchange contracts (“forward contracts”) for the purchase or sale of a foreign currency at a negotiated rate at a future date.
Forward contracts are reported on a schedule following the Statement of Investments. Forward contracts will be valued daily based upon the closing prices of the forward currency rates determined at the close of the Exchange as provided by a bank, dealer or pricing service. The resulting unrealized appreciation (depreciation) is reported in the Statement of Assets and Liabilities as a receivable or payable and in the Statement of Operations within the change in unrealized appreciation (depreciation). At contract close, the difference between the original cost of the contract and the value at the close date is recorded as a realized gain (loss) in the Statement of Operations.
Risks to the Fund include both market and credit risk. Market risk is the risk that the value of the forward contract will depreciate due to unfavorable changes in the exchange rates. Credit risk arises from the possibility that the counterparty will default. If the counterparty defaults, the Fund’s loss will consist of the net amount of contractual payments that the Fund has not yet received.
6. Futures Contracts
A futures contract is a commitment to buy or sell a specific amount of a financial instrument at a negotiated price on a stipulated future date. The Fund may buy and sell futures contracts and may also buy or write put or call options on these futures contracts.
Futures contracts traded on a commodities or futures exchange will be valued at the final settlement price or official closing price on the principal exchange as reported by such principal exchange at its trading session ending at, or most recently prior to, the time when the Fund’s assets are valued.
Upon entering into a futures contract, the Fund is required to deposit either cash or securities (initial margin) in an amount equal to a certain percentage of the contract value. Subsequent payments (variation margin) are made or received by the Fund each day. The variation margin payments are equal to the daily changes in the contract value and are recorded as unrealized gains and losses.
Futures contracts are reported on a schedule following the Statement of Investments. Securities held in collateralized accounts to cover initial margin requirements on open futures contracts are noted in the Statement of Investments. Cash held by the broker to cover initial margin requirements on open futures contracts and the receivable and/or payable for the daily mark to market for the variation margin are noted in the Statement of Assets and Liabilities. The net change in unrealized appreciation and depreciation is reported in the Statement of Operations. Realized gains (losses) are reported in the Statement of Operations at the closing or expiration of futures contracts.
F58 | OPPENHEIMER STRATEGIC BOND FUND/ VA
Risks of entering into futures contracts (and related options) include the possibility that there may be an illiquid market where the Fund is unable to liquidate the contract or enter into an offsetting position and, if used for hedging purposes, the risk that the price of the contract will correlate imperfectly with the prices of the Fund’s securities.
7. Option Activity
The Fund may buy and sell put and call options, or write put and covered call options. When an option is written, the Fund receives a premium and becomes obligated to sell or purchase the underlying security at a fixed price, upon exercise of the option.
Options are valued daily based upon the last sale price on the principal exchange on which the option is traded. The difference between the premium received or paid, and market value of the option, is recorded as unrealized appreciation or depreciation. The net change in unrealized appreciation or depreciation is reported in the Statement of Operations. When an option is exercised, the cost of the security purchased or the proceeds of the security sale are adjusted by the amount of premium received or paid. Upon the expiration or closing of the option transaction, a gain or loss is reported in the Statement of Operations.
Securities designated to cover outstanding call or put options are noted in the Statement of Investments where applicable. Options written are reported in a schedule following the Statement of Investments and as a liability in the Statement of Assets and Liabilities.
The risk in writing a call option is that the Fund gives up the opportunity for profit if the market price of the security increases and the option is exercised. The risk in writing a put option is that the Fund may incur a loss if the market price of the security decreases and the option is exercised. The risk in buying an option is that the Fund pays a premium whether or not the option is exercised. The Fund also has the additional risk that there may be an illiquid market where the Fund is unable to close the contract.
Written option activity for the year ended December 31, 2008 was as following:
| | | | | | | | | | | | | | | | | |
| | | Call Options | | | Put Options | |
| | | Number of | | | Amount of | | | Number of | | | Amount of | |
| | | Contracts | | | Premiums | | | Contracts | | | Premiums | |
| |
| Options outstanding as of December 31, 2007 | | | 2,878,960,000 | | | $ | 384,268 | | | | 6,960,000 | | | $ | 52,511 | |
| Options written | | | 29,120,540,000 | | | | 9,814,468 | | | | 29,271,190,000 | | | | 10,018,159 | |
| Options closed or expired | | | (14,995,360,000 | ) | | | (5,562,707 | ) | | | (17,435,710,000 | ) | | | (4,923,106 | ) |
| Options exercised | | | (16,999,195,000 | ) | | | (4,557,509 | ) | | | (11,837,495,000 | ) | | | (5,069,044 | ) |
| | | |
| Options outstanding as of December 31, 2008 | | | 4,945,000 | | | $ | 78,520 | | | | 4,945,000 | | | $ | 78,520 | |
| | | |
8. Swap Contracts
The Fund may enter into privately negotiated agreements with a counterparty to exchange or “swap” payments at specified future intervals based on the return of an asset (such as a stock, bond or currency) or non-asset reference (such as an interest rate or index). The swap agreement will specify the “notional” amount of the asset or non-asset reference to which the contract relates. As derivative contracts, swaps typically do not have an associated cost at contract inception. At initiation, contract terms are typically set at market value such that the value of the swap is $0. If a counterparty specifies terms that would result in the contract having a value other than $0 at initiation, one counterparty will pay the other an upfront payment to equalize the contract. Subsequent changes in market value are calculated based upon changes in the performance of the asset or non-asset reference multiplied by the notional value of the contract. Contract types may include credit default, interest rate, total return, and currency swaps.
Swaps are marked to market daily using quotations primarily from pricing services, counterparties or brokers. Swap contracts are reported on a schedule following the Statement of Investments. The value of the contracts is separately disclosed on the Statement of Assets and Liabilities. The unrealized appreciation (depreciation) is comprised of the change in the valuation of the swap combined with the accrued interest due to (owed by) the Fund at termination or settlement
F59 | OPPENHEIMER STRATEGIC BOND FUND/ VA
NOTES TO FINANCIAL STATEMENTS Continued
8. Swap Contracts Continued
The net change in this amount during the period is included on the Statement of Operations. Any payment received or paid to initiate a contract is recorded as a cost of the swap in the Statement of Assets and Liabilities and as a component of unrealized gain or loss on the Statement of Operations until contract termination; upon contract termination, this amount is recorded as realized gain or loss on the Statement of Operations. Excluding amounts paid at contract initiation as described above, the Fund also records any periodic payments received from (paid to) the counterparty, including at termination, as realized gain (loss) on the Statement of Operations.
Risks of entering into swap contracts include credit, market and liquidity risk. Credit risk arises from the possibility that the counterparty fails to make a payment when due or otherwise defaults under the terms of the contract. If the counterparty defaults, the Fund’s loss will consist of the net amount of contractual payments that the Fund has not yet received. Market risk is the risk that the value of the contract will depreciate due to unfavorable changes in the performance of the asset or non-asset reference. Liquidity risk is the risk that the Fund may be unable to close the contract prior to its termination.
Credit Default Swap Contracts. A credit default swap is a bilateral contract that enables an investor to buy or sell protection on a debt security against a defined-issuer credit event, such as the issuer’s failure to make timely payments of interest or principal on the debt security, bankruptcy or restructuring. The Fund may enter into credit default swaps either by buying or selling protection on a single security or a basket of securities (the “reference asset”).
The buyer of protection pays a periodic fee to the seller of protection based on the notional amount of debt securities underlying the swap contract. The seller of protection agrees to compensate the buyer of protection for future potential losses as a result of a credit event on the reference asset. The contract effectively transfers the credit event risk of the reference asset from the buyer of protection to the seller of protection.
The ongoing value of the contract will fluctuate throughout the term of the contract based primarily on the credit risk of the reference asset. If the credit quality of the reference asset improves relative to the credit quality at contract initiation, the buyer of protection may have an unrealized loss greater than the anticipated periodic fee owed. This unrealized loss would be the result of current credit protection being cheaper than the cost of credit protection at contract initiation. If the buyer elects to terminate the contract prior to its maturity, and there has been no credit event, this unrealized loss will become realized. If the contract is held to maturity, and there has been no credit event, the realized loss will be equal to the periodic fee paid over the life of the contract.
If there is a credit event, the buyer of protection can exercise its rights under the contract and receive a payment from the seller of protection equal to the notional amount of the reference asset less the market value of the reference asset. Upon exercise of the contract the difference between the value of the underlying reference asset and the notional amount is recorded as realized gain (loss) and is included on the Statement of Operations.
Risks of credit default swaps include credit, market and liquidity risk. Additional risks include but are not limited to: the cost of paying for credit protection if there are no credit events or the cost of selling protection when a credit event occurs (paying the notional amount to the protection buyer); and pricing transparency when assessing the value of a credit default swap.
As of the period end, the Fund has sold credit protection through credit default swaps to gain exposure to the credit risk of individual securities and/or indexes that are either unavailable or considered to be less attractively priced in the bond market. The Fund has also engaged in pairs trades by purchasing protection through a credit default swap referenced to the debt of an issuer, and simultaneously selling protection through a credit default swap referenced to the debt of a different issuer with the intent to realize gains from the pricing differences of the two issuers who are expected to have similar market risks. Pairs trades attempt to gain exposure to credit risk while hedging or offsetting the effects of
F60 | OPPENHEIMER STRATEGIC BOND FUND/ VA
overall market movements. In addition, the Fund has engaged in spread curve trades by simultaneously purchasing and selling protection through credit default swaps referenced to the same issuer but with different maturities. Spread curve trades attempt to gain exposure to credit risk on a forward basis by realizing gains on the expected differences in spreads.
Interest Rate Swap Contracts. An interest rate swap is an agreement between counterparties to exchange periodic payments based on interest rates. One cash flow stream will typically be a floating rate payment based upon a specified interest rate while the other is typically a fixed interest rate.
Risks of interest rate swaps include credit, market and liquidity risk. Additional risks include but are not limited to, interest rate risk. There is a risk, based on future movements of interest rates that the payments made by the Fund under a swap agreement will be greater than the payments it received.
Total Return Swap Contracts. A total return swap is an agreement between counterparties to exchange periodic payments based on asset or non-asset references. One cash flow is typically based on a non-asset reference (such as an interest rate or index) and the other on the total return of a reference asset (such as a security or a basket of securities). The total return of the reference asset typically includes appreciation or depreciation on the reference asset, plus any interest or dividend payments.
Risks of total return swaps include credit, market and liquidity risk.
Currency Swaps. A currency swap is an agreement between counterparties to exchange different currencies equivalent to the notional value at contract inception and reverse the exchange of the same notional values of those currencies at contract termination. The contract may also include periodic exchanges of cash flows based on a specified index or interest rate.
Risks of currency swaps include credit, market and liquidity risk. Additional risks of currency swaps include, but are not limited to, exchange rate risk. Due to the exchange of currency at contract termination, changes in currency exchange rates may result in the Fund paying an amount greater than the amount received. There is also a risk, based on movements of interest rates or indexes that periodic payments made by the Fund will be greater than the payments received.
Swaption Transactions. The Fund may enter into a swaption contract which grants the purchaser the right, but not the obligation, to enter into an interest rate swap at a preset rate within a specified period of time. The purchaser pays a premium to the swaption writer who bears the risk of unfavorable changes in the preset rate on the underlying interest rate swap.
Swaptions are marked to market daily using primarily quotations from counterparties and brokers. Written swap-tions are reported on a schedule following the Statement of Investments. Written swaptions are reported as a liability in the Statement of Assets and Liabilities. The difference between the premium received or paid, and market value of the swaption, is recorded as unrealized appreciation or depreciation. The net change in unrealized appreciation or depreciation is reported in the Statement of Operations. When a swaption is exercised, the cost of the swap is adjusted by the amount of premium paid or received. Upon the expiration or closing of an unexercised swaption contract, a gain or loss is reported in the Statement of Operations for the amount of the premium paid or received.
Swaption contracts written by the Fund do not give rise to counterparty credit risk as they obligate the Fund, not its counterparty, to perform. The Fund generally will incur a greater risk when it writes a swaption than when it purchases a swaption. When the Fund purchases a swaption it risks losing only the amount of the premium they have paid if the option expires unexercised. When the Fund writes a swaption it will become obligated, upon exercise of the option, according to the terms of the underlying agreement.
F61 | OPPENHEIMER STRATEGIC BOND FUND/ VA
NOTES TO FINANCIAL STATEMENTS Continued
9. Illiquid or Restricted Securities
As of December 31, 2008, investments in securities included issues that are illiquid or restricted. Investments may be illiquid because they do not have an active trading market, making it difficult to value them or dispose of them promptly at an acceptable price. A restricted security may have a contractual restriction on its resale and is valued under methods approved by the Board of Trustees as reflecting fair value. The Fund will not invest more than 15% of its net assets (determined at the time of purchase and reviewed periodically) in illiquid and restricted securities. Certain restricted securities, eligible for resale to qualified institutional purchasers, may not be subject to that limitation. Securities that are illiquid or restricted are marked with an applicable footnote on the Statement of Investments. Restricted securities are reported on a schedule following the Statement of Investments.
10. Securities Lending
The Fund lends portfolio securities from time to time in order to earn additional income in the form of fees or interest on securities received as collateral or the investment of any cash received as collateral. The loans are secured by collateral (either securities, letters of credit, or cash) in an amount not less than 100% of the market value of the loaned securities during the period of the loan. The market value of the loaned securities is determined at the close of each business day and any additional required collateral is delivered to the Fund on the next business day. If the borrower defaults on its obligation to return the securities loaned because of insolvency or other reasons, the Fund could experience delays and cost in recovering the securities loaned or in gaining access to the collateral. The Fund continues to receive the economic benefit of interest or dividends paid on the securities loaned in the form of a substitute payment received from the borrower and recognizes the gain or loss in the fair value of the securities loaned that may occur during the term of the loan. The Fund has the right under the lending agreement to recover the securities from the borrower on demand. As of December 31, 2008, the Fund had on loan securities valued at $318,788,944. Collateral of $325,265,870 was received for the loans, of which all was received in cash and subsequently invested in approved instruments.
11. Unfunded Purchase Commitments
Pursuant to the terms of certain indenture agreements, the Fund has unfunded purchase commitments of $21,735,999 at December 31, 2008. The Fund generally will maintain with its custodian, liquid investments having an aggregate value at least equal to the amount of unfunded purchase loan commitments. The following commitments are subject to funding based on the borrower’s discretion. The Fund is obligated to fund these commitments at the time of the request by the borrower. These commitments have been excluded from the Statement of Investments.
F62 | OPPENHEIMER STRATEGIC BOND FUND/ VA
As of December 31, 2008, the Fund had unfunded purchase commitments as follows:
| | | | | | | | | |
| | | Commitment | | | | |
| | | Termination | | | Unfunded | |
| | | Date | | | Amount | |
| |
| Deutsche Bank AG, Opic Reforma I Credit Linked Nts. | | | 10/23/13 | | | $ | 9,735,999 | |
| | | | | | | | | | | | | | | | | |
| | | | | | | Commitment | | | | | | | |
| | | Interest | | | Termination | | | Unfunded | | | Unrealized | |
| | | Rate | | | Date | | | Amount | | | Appreciation | |
| |
| Deutsche Bank AG; An unfunded commitment that the Fund receives 0.125% quarterly; and will pay out, upon request, up to 12,000,000 USD to a Peruvian Trust through Deutsche Bank’s Global Note Program. Upon funding requests, the unfunded portion decreases and new structured securities will be created and held by the fund to maintain a consistent exposure level. | | | 0.50 | % | | | 9/20/10 | | | $ | 12,000,000 | | | $ | 1,718,957 | |
12. Recent Accounting Pronouncement
In March 2008, the Financial Accounting Standards Board (“FASB”) issued Statement on Financial Accounting Standards (“SFAS”) No. 161, Disclosures about Derivative Instruments and Hedging Activities. This standard requires enhanced disclosures about derivative and hedging activities, including qualitative disclosures about how and why the Fund uses derivative instruments, how these activities are accounted for, and their effect on the Fund’s financial position, financial performance and cash flows. SFAS No. 161 is effective for financial statements issued for fiscal years and interim periods beginning after November 15, 2008. At this time, management is evaluating the implications of SFAS No. 161 and its impact on the Fund’s financial statements and related disclosures.
13. Change In Independent Registered Public Accounting Firm (Unaudited)
At a meeting held on August 20, 2008, the Board of Trustees of the Fund appointed KPMG LLP as the independent registered public accounting firm to the Fund for fiscal year 2009, replacing the firm of Deloitte & Touche LLP, effective at the conclusion of the fiscal 2008 audit. During the two most recent fiscal years the audit reports of Deloitte & Touche LLP contained no adverse opinion or disclaimer of opinion and were not qualified or modified as to uncertainty, audit scope or accounting principles. Further, there were no disagreements between the Fund and Deloitte & Touche LLP on accounting principles, financial statement disclosure or audit scope, which if not resolved to the satisfaction of Deloitte & Touche LLP would have caused it to make reference to the disagreements in connection with its reports.
F63 | OPPENHEIMER STRATEGIC BOND FUND/ VA
REPORT OF INDEPENDENT REGISTERED PUBLIC ACCOUNTING FIRM
To the Board of Trustees and Shareholders of Oppenheimer Strategic Bond Fund/VA:
We have audited the accompanying statement of assets and liabilities of Oppenheimer Strategic Bond Fund/VA (the “Fund”), a series of Oppenheimer Variable Account Funds, including the statement of investments, as of December 31, 2008, and the related statement of operations for the year then ended, the statements of changes in net assets for each of the two years in the period then ended, and the financial highlights for each of the five years in the period then ended. These financial statements and financial highlights are the responsibility of the Fund’s management. Our responsibility is to express an opinion on these financial statements and financial highlights based on our audits.
We conducted our audits in accordance with the standards of the Public Company Accounting Oversight Board (United States). Those standards require that we plan and perform the audit to obtain reasonable assurance about whether the financial statements and financial highlights are free of material misstatement. The Fund is not required to have, nor were we engaged to perform, an audit of its internal control over financial reporting. Our audits included consideration of internal control over financial reporting as a basis for designing audit procedures that are appropriate in the circumstances, but not for the purpose of expressing an opinion on the effectiveness of the Fund’s internal control over financial reporting. Accordingly, we express no such opinion. An audit also includes examining, on a test basis, evidence supporting the amounts and disclosures in the financial statements, assessing the accounting principles used and significant estimates made by management, as well as evaluating the overall financial statement presentation. Our procedures included confirmation of securities owned as of December 31, 2008, by correspondence with the custodian and brokers; where replies were not received from brokers, we performed other auditing procedures. We believe that our audits provide a reasonable basis for our opinion.
In our opinion, the financial statements and financial highlights referred to above present fairly, in all material respects, the financial position of the Fund as of December 31, 2008, the results of its operations for the year then ended, the changes in its net assets for each of the two years in the period then ended, and the financial highlights for each of the five years in the period then ended, in conformity with accounting principles generally accepted in the United States of America.
Deloitte & Touche LLP
Denver, Colorado
February 11, 2009
F64 | OPPENHEIMER STRATEGIC BOND FUND/ VA
FEDERAL INCOME TAX INFORMATION Unaudited
In early 2009, if applicable, shareholders of record received information regarding all dividends and distributions paid to them by the Fund during calendar year 2008. Regulations of the U.S. Treasury Department require the Fund to report this information to the Internal Revenue Service.
Capital gain distributions of $0.0515 per share were paid to Non-Service and Service shareholders, respectively, on March 10, 2008. Whether received in stock or in cash, the capital gain distribution should be treated by shareholders as a gain from the sale of the capital assets held for more than one year (long-term capital gains).
Dividends, if any, paid by the Fund during the fiscal year ended December 31, 2008 which are not designated as capital gain distributions should be multiplied by 3.83% to arrive at the amount eligible for the corporate dividend-received deduction.
The foregoing information is presented to assist shareholders in reporting distributions received from the Fund to the Internal Revenue Service. Because of the complexity of the federal regulations which may affect your individual tax return and the many variations in state and local tax regulations, we recommend that you consult your tax advisor for specific guidance.
7 | OPPENHEIMER STRATEGIC BOND FUND/ VA
BOARD APPROVAL OF THE FUND’S INVESTMENT ADVISORY AGREEMENT Unaudited
Each year, the Board of Trustees (the “Board”), including a majority of the independent Trustees, is required to determine whether to renew the Fund’s investment advisory agreement (the “Agreement”). The Investment Company Act of 1940, as amended, requires that the Board request and evaluate, and that the Manager provide, such information as may be reasonably necessary to evaluate the terms of the Agreement. The Board employs an independent consultant to prepare a report that provides information, including comparative information, the Board requests for that purpose. In addition, the Board receives information throughout the year regarding Fund services, fees, expenses and performance.
The Manager and the independent consultant provided information to the Board on the following factors: (i) the nature, quality and extent of the Manager’s services, (ii) the investment performance of the Fund and the Manager, (iii) the fees and expenses of the Fund, including comparative expense information, (iv) the profitability of the Manager and its affiliates, including an analysis of the cost of providing services, (v) whether economies of scale are realized as the Fund grows and whether fee levels reflect these economies of scale for Fund investors and (vi) other benefits to the Manager from its relationship with the Fund. The Board was aware that there are alternatives to retaining the Manager.
Outlined below is a summary of the principal information considered by the Board as well as the Board’s conclusions.
Nature, Quality and Extent of Services. The Board considered information about the nature, quality and extent of the services provided to the Fund and information regarding the Manager’s key personnel who provide such services. The Manager’s duties include providing the Fund with the services of the portfolio manager and the Manager’s investment team, who provide research, analysis and other advisory services in regard to the Fund’s investments; securities trading services; oversight of third party service providers; monitoring compliance with applicable Fund policies and procedures and adherence to the Fund’s investment restrictions. The Manager is responsible for providing certain administrative services to the Fund as well. Those services include providing and supervising all administrative and clerical personnel who are necessary in order to provide effective corporate administration for the Fund; compiling and maintaining records with respect to the Fund’s operations; preparing and filing reports required by the Securities and Exchange Commission; preparing periodic reports regarding the operations of the Fund for its shareholders; preparing proxy materials for shareholder meetings; and preparing the registration statements required by Federal and state securities laws for the sale of the Fund’s shares. The Manager also provides the Fund with office space, facilities and equipment.
The Board also considered the quality of the services provided and the quality of the Manager’s resources that are available to the Fund. The Board took account of the fact that the Manager has had over forty years of experience as an investment adviser and that its assets under management rank it among the top mutual fund managers in the United States. The Board evaluated the Manager’s advisory, administrative, accounting, legal and compliance services, and information the Board has received regarding the experience and professional qualifications of the Manager’s key personnel and the size and functions of its staff. In its evaluation of the quality of the portfolio management services provided, the Board considered the experience of Arthur Steinmetz, the portfolio manager for the Fund, and the Manager’s investment team and analysts. The Board members also considered the totality of their experiences with the Manager as Directors or Trustees of the Fund and other funds advised by the Manager. The Board considered information regarding the quality of services provided by affiliates of the Manager, which its members have become knowledgeable about in connection with the renewal of the Fund’s service agreements. The Board concluded that, in light of the Manager’s experience, reputation, personnel, operations and resources, the Fund benefits from the services provided under the Agreement.
Investment Performance of the Manager and the Fund. Throughout the year, the Manager provided information on the investment performance of the Fund and the Manager, including comparative performance information. The Board also reviewed information, prepared by the Manager and by the independent consultant, comparing the Fund’s
8 | OPPENHEIMER STRATEGIC BOND FUND/ VA
historical performance to relevant market indices and to the performance of other general bond funds underlying variable insurance products. The Board considered that the Fund outperformed its performance universe median during the one-, three-, five-, and ten-year periods.
Costs of Services by the Manager. The Board reviewed the fees paid to the Manager and the other expenses borne by the Fund. The Board also considered the comparability of the fees charged and the services provided to the Fund to the fees and services for other clients or accounts advised by the Manager. The independent consultant provided comparative data in regard to the fees and expenses of the Fund and general bond funds underlying variable insurance products with comparable asset levels and distribution features. The Board considered that the Fund’s total expenses were lower than its expense group median, although its actual management fees were higher than the expense group median. In reviewing the fees and expenses charged to the VA Funds, the Board considered the Manager’s assertion that, because of the disparity among VA funds in how insurance companies may be compensated for the services they provide to shareholders, when comparing the expenses of the various VA funds it is most appropriate to focus on the total expenses rather than on the management fees. Accordingly, while the Board reviewed and considered all expenses in its consideration of the Advisory Agreement, it paid particular attention to total expenses.
Economies of Scale and Profits Realized by the Manager. The Board considered information regarding the
Manager’s costs in serving as the Fund’s investment adviser, including the costs associated with the personnel and systems necessary to manage the Fund, and information regarding the Manager’s profitability from its relationship with the Fund. The Board reviewed whether the Manager may realize economies of scale in managing and supporting the Fund. The Board noted that the Fund currently has management fee breakpoints, which are intended to share with Fund shareholders economies of scale that may exist as the Fund’s assets grow.
Other Benefits to the Manager. In addition to considering the profits realized by the Manager, the Board considered information that was provided regarding the direct and indirect benefits the Manager receives as a result of its relationship with the Fund, including compensation paid to the Manager’s affiliates. The Board also considered that the Manager must be able to pay and retain experienced professional personnel at competitive rates to provide quality services to the Fund and that maintaining the financial viability of the Manager is important in order for the Manager to continue to provide significant services to the Fund and its shareholders.
Conclusions. These factors were also considered by the independent Trustees meeting separately from the full Board, assisted by experienced counsel to the Fund and to the independent Trustees. Fund counsel and the independent Trustees’ counsel are independent of the Manager within the meaning and intent of the Securities and Exchange Commission Rules.
Based on its review of the information it received and its evaluations described above, the Board, including a majority of the independent Trustees, decided to continue the Agreement for another year. In arriving at this decision, the Board did not single out any factor or factors as being more important than others, but considered all of the above information, and considered the terms and conditions of the Agreement, including the management fee, in light of all of the surrounding circumstances.
9 | OPPENHEIMER STRATEGIC BOND FUND/ VA
PORTFOLIO PROXY VOTING POLICIES AND PROCEDURES; UPDATES TO STATEMENTS OF INVESTMENTS Unaudited
The Fund has adopted Portfolio Proxy Voting Policies and Procedures under which the Fund votes proxies relating to securities (“portfolio proxies”) held by the Fund. A description of the Fund’s Portfolio Proxy Voting Policies and Procedures is available (i) without charge, upon request, by calling the Fund toll-free at 1.800.525.7048, (ii) on the Fund’s website at www.oppenheimerfunds.com, and (iii) on the SEC’s website at www.sec.gov. In addition, the Fund is required to file Form N-PX, with its complete proxy voting record for the 12 months ended June 30th, no later than August 31st of each year. The Fund’s voting record is available (i) without charge, upon request, by calling the Fund toll-free at 1.800.525.7048, and (ii) in the Form N-PX filing on the SEC’s website at www.sec.gov.
The Fund files its complete schedule of portfolio holdings with the SEC for the first quarter and the third quarter of each fiscal year on Form N-Q. The Fund’s Form N-Q filings are available on the SEC’s website at http://www.sec.gov. Those forms may be reviewed and copied at the SEC’s Public Reference Room in Washington, D.C. Information on the operation of the Public Reference Room may be obtained by calling 1-800-SEC-0330.
10 | OPPENHEIMER STRATEGIC BOND FUND/ VA
TRUSTEES AND OFFICERS Unaudited
| | | |
| Name, Position(s) Held with | | |
| the Funds, Length of Service, | | Principal Occupation(s) During the Past 5 Years; Other Trusteeships/Directorships Held; Number of Portfolios in |
| Age | | the Fund Complex Currently Overseen |
INDEPENDENT TRUSTEES | | The address of each Trustee in the chart below is 6803 S. Tucson Way, Centennial, Colorado 80112-3924. Each Trustee serves for an indefinite term, or until his or her resignation, retirement, death or removal. |
| | | |
William L. Armstrong,
Chairman of the Board of Trustees (since 2003),
Trustee (since 1999)
Age: 71 | | President, Colorado Christian University (since 2006); Chairman, Cherry Creek Mortgage Company (since 1991), Chairman, Centennial State Mortgage Company (since 1994), Chairman, The El Paso Mortgage Company (since 1993); Chairman, Ambassador Media Corporation (since 1984); Chairman, Broadway Ventures (since 1984); Director of Helmerich & Payne, Inc. (oil and gas drilling/production company) (since 1992), Campus Crusade for Christ (non-profit) (since 1991); Former Director, The Lynde and Harry Bradley Foundation, Inc. (non-profit organization) (2002-2006); former Chairman of: Transland Financial Services, Inc. (private mortgage banking company) (1997-2003), Great Frontier Insurance (1995-2000), Frontier Real Estate, Inc. (residential real estate brokerage) (1994-2000) and Frontier Title (title insurance agency) (1995-2000); former Director of the following: UNUMProvident (insurance company) (1991-2004), Storage Technology Corporation (computer equipment company) (1991-2003) and International Family Entertainment (television channel) (1992-1997); U.S. Senator (January 1979-January 1991). Oversees 41 portfolios in the OppenheimerFunds complex. |
| | | |
George C. Bowen,
Trustee (since 1999)
Age: 72 | | Assistant Secretary and Director of Centennial Asset Management Corporation (December 1991-April 1999); President, Treasurer and Director of Centennial Capital Corporation (June 1989-April 1999); Chief Executive Officer and Director of MultiSource Services, Inc. (March 1996-April 1999); Mr. Bowen held several positions with the Manager and with subsidiary or affiliated companies of the Manager (September 1987-April 1999). Oversees 41 portfolios in the OppenheimerFunds complex. |
| | | |
Edward L. Cameron,
Trustee (since 1999)
Age: 70 | | Member of The Life Guard of Mount Vernon (George Washington historical site) (June 2000-June 2006); Partner of PricewaterhouseCoopers LLP (accounting firm) (July 1974-June 1999); Chairman of Price Waterhouse LLP Global Investment Management Industry Services Group (accounting firm) (July 1994-June 1998). Oversees 41 portfolios in the OppenheimerFunds complex. |
| | | |
Jon S. Fossel,
Trustee (since 1993)
Age: 66 | | Director of UNUMProvident (insurance company) (since June 2002); Director of Northwestern Energy Corp. (public utility corporation) (since November 2004); Director of P.R. Pharmaceuticals (October 1999-October 2003); Director of Rocky Mountain Elk Foundation (non-profit organization) (February 1998-February 2003 and February 2005-February 2007); Chairman and Director (until October 1996) and President and Chief Executive Officer (until October 1995) of the Manager; President, Chief Executive Officer and Director of the following: Oppenheimer Acquisition Corp. (“OAC”) (parent holding company of the Manager), Shareholders Services, Inc. and Shareholder Financial Services, Inc. (until October 1995). Oversees 41 portfolios in the OppenheimerFunds complex. |
| | | |
Sam Freedman,
Trustee (since 1996)
Age: 68 | | Director of Colorado UpLIFT (charitable organization) (since September 1984). Mr. Freedman held several positions with the Manager and with subsidiary or affiliated companies of the Manager (until October 1994). Oversees 41 portfolios in the OppenheimerFunds complex. |
| | | |
Beverly L. Hamilton,
Trustee (since 2002)
Age: 62 | | Trustee of Monterey Institute for International Studies (educational organization) (since February 2000); Board Member of Middlebury College (educational organization) (since December 2005); Director of The California Endowment (philanthropic organization) (since April 2002); Director (February 2002-2005) and Chairman of Trustees (2006-2007) of the Community Hospital of Monterey Peninsula; Director (October 1991-2005) and Vice Chairman (since 2006) of American Funds’ Emerging Markets Growth Fund, Inc. (mutual fund); President of ARCO Investment Management Company (February 1991-April 2000); Member of the investment commit- tees of The Rockefeller Foundation (2001-2006) and The University of Michigan (since 2000); Advisor at Credit Suisse First Boston’s Sprout venture capital unit (venture capital fund) (1994-January 2005); Trustee of MassMutual Institutional Funds (investment company) (1996-June 2004); Trustee of MML Series Investment Fund (investment company) (April 1989-June 2004); Member of the investment committee of Hartford Hospital (2000-2003); and Advisor to Unilever (Holland) pension fund (2000-2003). Oversees 41 portfolios in the OppenheimerFunds complex. |
11 | OPPENHEIMER STRATEGIC BOND FUND/ VA
TRUSTEES AND OFFICERS Unaudited/Continued
| | | |
Robert J. Malone,
Trustee (since 2002)
Age: 64 | | Board of Directors of Opera Colorado Foundation (non-profit organization) (since March 2008); Director of Jones Knowledge, Inc. (since 2006); Director of Jones International University (educational organization) (since August 2005); Chairman, Chief Executive Officer and Director of Steele Street Bank & Trust (commercial banking) (since August 2003); Director of Colorado UpLIFT (charitable organization) (since 1986); Trustee of the Gallagher Family Foundation (non-profit organization) (since 2000); Former Chairman of U.S. Bank-Colorado (subsidiary of U.S. Bancorp and formerly Colorado National Bank) (July 1996-April 1999); Director of Commercial Assets, Inc. (real estate investment trust) (1993-2000); Director of Jones Knowledge, Inc. (2001-July 2004); and Director of U.S. Exploration, Inc. (oil and gas exploration) (1997-February 2004). Oversees 41 portfolios in the OppenheimerFunds complex. |
| | | |
F. William Marshall, Jr.,
Trustee (since 2000)
Age: 66 | | Trustee Emeritas of Worcester Polytech Institute (WPI) (private university) (since 2009); Trustee of MassMutual Select Funds (formerly MassMutual Institutional Funds) (investment company) (since 1996) and MML Series Investment Fund (investment company) (since 1996); President and Treasurer of the SIS Funds (private charitable fund) (since January 1999); Former Trustee of WPI (1985-2008); Former Chairman of the Board (2004-2006) and Former Chairman of the Investment Committee of WPI (1994-2008); Chairman of SIS & Family Bank, F.S.B. (formerly SIS Bank) (commercial bank) (January 1999-July 1999); Executive Vice President of Peoples Heritage Financial Group, Inc. (commercial bank) (January 1999-July 1999); and Former President and Chief Executive Officer of SIS Bancorp. (1993-1999). Oversees 43 portfolios in the OppenheimerFunds complex. |
| | | |
INTERESTED TRUSTEE AND OFFICER | | The address of Mr. Murphy is Two World Financial Center, 225 Liberty Street, 11th Floor, New York, New York 10281-1008. Mr. Murphy serves as a Trustee for an indefinite term, or until his resignation, retirement, death or removal and as an Officer for an indefinite term, or until his resignation, retirement, death or removal. Mr. Murphy is an interested Trustee due to his positions with OppenheimerFunds, Inc. and its affiliates. |
| | | |
John V. Murphy,
Trustee, President and Principal Executive Officer (since 2001)
Age: 59 | | Chairman and Director of the Manager (since June 2001); Chief Executive Officer of the Manager (June 2001- December 2008); President of the Manager (September 2000-February 2007); President and director or trustee of other Oppenheimer funds; President and Director of Oppenheimer Acquisition Corp. (“OAC”) (the Manager’s parent holding company) and of Oppenheimer Partnership Holdings, Inc. (holding company subsidiary of the Manager) (since July 2001); Director of OppenheimerFunds Distributor, Inc. (subsidiary of the Manager) (November 2001-December 2006); Chairman and Director of Shareholder Services, Inc. and of Shareholder Financial Services, Inc. (transfer agent subsidiaries of the Manager) (since July 2001); President and Director of OppenheimerFunds Legacy Program (charitable trust program established by the Manager) (since July 2001); Director of the following investment advisory subsidiaries of the Manager: OFI Institutional Asset Management, Inc., Centennial Asset Management Corporation, Trinity Investment Management Corporation and Tremont Capital Management, Inc. (since November 2001), HarbourView Asset Management Corporation and OFI Private Investments, Inc. (since July 2001); President (since November 2001) and Director (since July 2001) of Oppenheimer Real Asset Management, Inc.; Executive Vice President of Massachusetts Mutual Life Insurance Company (OAC’s parent company) (since February 1997); Director of DLB Acquisition Corporation (holding company parent of Babson Capital Management LLC) (since June 1995); Chairman (since October 2007) and Member of the Investment Company Institute’s Board of Governors (since October 2003). Oversees 105 portfolios in the OppenheimerFunds complex. |
| | | |
OTHER OFFICERS OF THE FUND | | The addresses of the Officers in the chart below are as follows: for Messrs. Steinmetz and Zack, Two World Financial Center, 225 Liberty Street, New York, New York 10281-1008, for Messrs. Vandehey and Wixted, 6803 S. Tucson Way, Centennial, Colorado 80112-3924. Each Officer serves for an indefinite term or until his or her resignation, retirement, death or removal. |
| | | |
Arthur P. Steinmetz,
Vice President and Portfolio Manager (since 1993)
Age: 50 | | Senior Vice President of the Manager (since March 1993) and of HarbourView Asset Management Corporation (since March 2000). A portfolio manager and officer of 5 portfolios in the OppenheimerFunds complex. |
| | | |
Mark S. Vandehey,
Vice President and Chief Compliance Officer (since 2004)
Age: 58 | | Senior Vice President and Chief Compliance Officer of the Manager (since March 2004); Chief Compliance Officer of OppenheimerFunds Distributor, Inc., Centennial Asset Management and Shareholder Services, Inc. (since March 2004); Vice President of OppenheimerFunds Distributor, Inc., Centennial Asset Management Corporation and Shareholder Services, Inc. (since June 1983); Former Vice President and Director of Internal Audit of the Manager (1997-February 2004). An officer of 105 portfolios in the OppenheimerFunds complex. |
12 | OPPENHEIMER STRATEGIC BOND FUND/ VA
| | | |
Brian W. Wixted,
| | Senior Vice President and Treasurer of the Manager (since March 1999); Treasurer of the following: |
Treasurer and Principal Financial & Accounting Officer (since 1999)
Age: 49 | | HarbourView Asset Management Corporation, Shareholder Financial Services, Inc., Shareholder Services, Inc., Oppenheimer Real Asset Management, Inc. and Oppenheimer Partnership Holdings, Inc. (since March 1999), OFI Private Investments, Inc. (since March 2000), OppenheimerFunds International Ltd. and OppenheimerFunds plc (since May 2000), OFI Institutional Asset Management, Inc. (since November 2000), and OppenheimerFunds Legacy Program (charitable trust program established by the Manager) (since June 2003); Treasurer and Chief Financial Officer of OFI Trust Company (trust company subsidiary of the Manager) (since May 2000); Assistant Treasurer of the following: OAC (since March 1999), Centennial Asset Management Corporation (March 1999-October 2003) and OppenheimerFunds Legacy Program (April 2000-June 2003). An officer of 105 portfolios in the OppenheimerFunds complex. |
| | | |
Robert G. Zack,
Vice President and Secretary (since 2001)
Age: 60 | | Executive Vice President (since January 2004) and General Counsel (since March 2002) of the Manager; General Counsel and Director of the Distributor (since December 2001); General Counsel of Centennial Asset Management Corporation (since December 2001); Senior Vice President and General Counsel of HarbourView Asset Management Corporation (since December 2001); Secretary and General Counsel of OAC (since November 2001); Assistant Secretary (since September 1997) and Director (since November 2001) of OppenheimerFunds International Ltd. and OppenheimerFunds plc; Vice President and Director of Oppenheimer Partnership Holdings, Inc. (since December 2002); Director of Oppenheimer Real Asset Management, Inc. (since November 2001); Senior Vice President, General Counsel and Director of Shareholder Financial Services, Inc. and Shareholder Services, Inc. (since December 2001); Senior Vice President, General Counsel and Director of OFI Private Investments, Inc. and OFI Trust Company (since November 2001); Vice President of OppenheimerFunds Legacy Program (since June 2003); Senior Vice President and General Counsel of OFI Institutional Asset Management, Inc. (since November 2001); Director of OppenheimerFunds International Distributor Limited (since December 2003); Senior Vice President (May 1985-December 2003). An officer of 105 portfolios in the OppenheimerFunds complex. |
The Fund’s Statement of Additional Information contains additional information about the Fund’s Trustees and Officers and is available without charge, upon request, by calling 1.800.981.2871.
13 | OPPENHEIMER STRATEGIC BOND FUND/ VA
FUND PERFORMANCE DISCUSSION
Management’s Discussion of Fund Performance. The reporting period marked an extremely difficult market environment in which credit markets froze and the broad domestic equity market, as measured by the S&P 500 Index, had one of its worst years on record. The Fund’s Non-Service shares returned –36.43% for the 12-months ended December 31, 2008, performing in line with the returns of the Russell 1000 Value Index, which returned –36.85% and the S&P 500 Index, which returned –36.99%. Relative to the Russell 1000 Value Index, the Fund had good relative performance in the utilities, materials and consumer staples sectors. On the other hand, results in the financials, consumer discretionary and energy sectors detracted the most from relative performance. We do, however, remain confident that the investment team’s consistent and unwavering focus on identifying companies with strong long-term earnings prospects at discounted prices will continue to serve us well in the long term.
In terms of individual stock contributors, within the materials sector, the Fund gained performance by exiting its position in FMC Corp. before the stock price declined significantly later in the reporting period. During the reporting period, we built up a position in another materials stock, Mosaic Co., whose stock weathered the credit market storm and economic downturn relatively well. Mosaic is one of the world’s leading producers and marketers of potash and phosphate fertilizers. Within information technology, we exited our position in Take-Two Interactive Software, Inc. The company was involved in a take-over bid from rival Electronic Arts, which ultimately was unsuccessful. Within consumer staples, our position in Philip Morris International, Inc. fared relatively well during the reporting period.
The sectors that most hindered the Fund’s performance were energy and financials. Most financial stocks were hard hit during the reporting period due to continued credit and mortgage related problems. Julius Baer Holding AG, Morgan Stanley, National Financial Partners Corp and UBS AG were significant detractors from Fund performance. We exited our positions in UBS. Energy stocks also tumbled during the reporting period as oil prices plummeted. In particular, relative Fund performance in the energy sector was hurt by underweighting supermajors (the largest, non-state owned energy companies) as well as owning positions in Hess Corp. (which we exited) and Petroleo Brasileiro SA. In the consumer discretionary sector, Liberty Global, Inc., a U.S.-based cable company with international cable assets, detracted from Fund performance. Within industrials, Siemens AG’s stock price declined as investors became concerned about the macroeconomic headwinds facing the company.
Effective January 1, 2009, Mitch Williams and John Damian are the Fund’s new portfolio managers. Regardless of the broader market environment, we aim to follow a consistent investment strategy. We are long-term investors in nature and do not in general rebalance due to current market conditions. We focus on companies that exhibit leadership within their market sector. Specifically, by employing a disciplined, research- driven stock selection process, we seek to find value in companies with a competitive edge within their marketplace.
Comparing the Fund’s Performance to the Market. The graphs that follow show the performance of a hypothetical $10,000 investment in each share class of the Fund held until December 31, 2008. In the case of Non-Service shares, performance is measured from inception of the class on January 2, 2003. In the case of Service shares, performance is measured from inception of the class on September 18, 2006. Performance information does not reflect charges that apply to separate accounts investing in the Fund. If these charges were taken into account, performance would be lower. The graphs assume that all dividends and capital gains distributions were reinvested in additional shares. Past performance cannot guarantee future results.
The Fund’s performance is compared to the performance of the Russell 1000 Value Index, an unmanaged index of equity securities of large capitalization value companies. The index performance includes reinvestment of income but does not reflect transaction costs, fees or expenses. The Fund’s performance reflects the effects of the Fund’s business and operating expenses. While index comparisons may be useful to provide a benchmark for the Fund’s performance, it must be noted that the Fund’s investments are not limited to the investments in the index.
3 | OPPENHEIMER VALUE FUND/VA
FUND PERFORMANCE DISCUSSION
Non-Service Shares
Comparison of Change in Value of $10,000 Hypothetical Investments in:
Service Shares
Comparison of Change in Value of $10,000 Hypothetical Investments in:
The performance data quoted represents past performance, which does not guarantee future results.
The investment return and principal value of an investment in the Fund will fluctuate so that an investor’s shares, when redeemed, may be worth more or less than their original cost. Current performance may be lower or higher than the performance quoted. For performance data current to the most recent month end, call us at 1.800.981.2871. The Fund’s total returns should not be expected to be the same as the returns of other funds, whether or not both funds have the same portfolio managers and/or similar names. The Fund’s total returns do not include the charges associated with the separate account products that offer this Fund. Such performance would have been lower if such charges were taken into account.
4 | OPPENHEIMER VALUE FUND/VA
FUND EXPENSES
Fund Expenses. As a shareholder of the Fund, you incur two types of costs: (1) transaction costs, which may include redemption fees (if applicable); and (2) ongoing costs, including management fees; distribution and service fees; and other Fund expenses. These examples are intended to help you understand your ongoing costs (in dollars) of investing in the Fund and to compare these costs with the ongoing costs of investing in other mutual funds.
The examples are based on an investment of $1,000.00 invested at the beginning of the period and held for the entire 6-month period ended December 31, 2008.
Actual Expenses. The first section of the table provides information about actual account values and actual expenses. You may use the information in this section for the class of shares you hold, together with the amount you invested, to estimate the expense that you paid over the period. Simply divide your account value by $1,000.00 (for example, an $8,600.00 account value divided by $1,000.00 = 8.60), then multiply the result by the number in the first section under the heading entitled “Expenses Paid During Period” to estimate the expenses you paid on your account during this period.
Hypothetical Example for Comparison Purposes. The second section of the table provides information about hypothetical account values and hypothetical expenses based on the Fund’s actual expense ratio for each class of shares, and an assumed rate of return of 5% per year for each class before expenses, which is not the actual return. The hypothetical account values and expenses may not be used to estimate the actual ending account balance or expenses you paid for the period. You may use this information to compare the ongoing costs of investing in the Fund and other funds. To do so, compare this 5% hypothetical example for the class of shares you hold with the 5% hypothetical examples that appear in the shareholder reports of the other funds.
Please note that the expenses shown in the table are meant to highlight your ongoing costs only and do not reflect any charges associated with the separate accounts that offer this Fund. Therefore, the “hypothetical” lines of the table are useful in comparing ongoing costs only, and will not help you determine the relative total costs of owning different funds. In addition, if these separate account charges were included your costs would have been higher.
| | | | | | | | | | | | | |
| | | Beginning | | Ending | | Expenses |
| | | Account | | Account | | Paid During |
| | | Value | | Value | | 6 Months Ended |
| Actual | | July 1, 2008 | | December 31, 2008 | | December 31, 2008 |
| |
| Non-Service shares | | $ | 1,000.00 | | | $ | 714.30 | | | $ | 5.36 | |
| Service shares | | | 1,000.00 | | | | 656.50 | | | | 6.23 | |
| | | | | | | | | | | | | |
Hypothetical | | | | | | | | | | | | |
| (5% return before expenses) | | | | | | | | | | | | |
| Non-Service shares | | | 1,000.00 | | | | 1,018.90 | | | | 6.31 | |
| Service shares | | | 1,000.00 | | | | 1,017.65 | | | | 7.58 | |
Expenses are equal to the Fund’s annualized expense ratio for that class, multiplied by the average account value over the period, multiplied by 184/366 (to reflect the one-half year period). Those annualized expense ratios, excluding indirect expenses from affiliated fund, based on the 6-month period ended December 31, 2008 are as follows:
| | | | | |
| Class | | Expense Ratios |
| |
| Non-Service shares | | | 1.24 | % |
| Service shares | | | 1.49 | |
The expense ratios reflect reduction to custodian expenses and voluntary waivers or reimbursements of expenses by the Fund’s Manager and Transfer Agent that can be terminated at any time, without advance notice. The “Financial Highlights” tables in the Fund’s financial statements, included in this report, also show the gross expense ratios, without such waivers or reimbursements and reduction to custodian expenses, if applicable.
5 | OPPENHEIMER VALUE FUND/VA
THIS PAGE INTENTIONALLY LEFT BLANK.
6 | OPPENHEIMER VALUE FUND/VA
STATEMENT OF INVESTMENTS December 31, 2008
| | | | | | | | | |
| | | Shares | | | Value | |
| |
Common Stocks—92.2% | | | | | | | | |
Consumer Discretionary—6.7% | | | | | | | | |
Media—6.7% | | | | | | | | |
| Cablevision Systems Corp. New York Group, Cl. A | | | 1,380 | | | $ | 23,239 | |
| Cinemark Holdings, Inc. | | | 5,400 | | | | 40,122 | |
Liberty Global, Inc., Series C1 | | | 3,198 | | | | 48,546 | |
| News Corp., Inc., Cl. A | | | 15,142 | | | | 137,641 | |
Time Warner Cable, Inc., Cl. A1 | | | 3,120 | | | | 66,924 | |
| | | | | | | | |
| | | | | | | | 316,472 | |
| | | | | | | | | |
Consumer Staples—9.0% | | | | | | | | |
Beverages—2.6% | | | | | | | | |
| Molson Coors Brewing Co., Cl. B | | | 720 | | | | 35,222 | |
| PepsiCo, Inc. | | | 1,560 | | | | 85,441 | |
| | | | | | | | |
| | | | | | | | 120,663 | |
| | | | | | | | | |
Food & Staples Retailing—2.9% | | | | | | | | |
| Kroger Co. (The) | | | 5,200 | | | | 137,332 | |
Food Products—1.2% | | | | | | | | |
| Campbell Soup Co. | | | 1,830 | | | | 54,918 | |
Tobacco—2.3% | | | | | | | | |
| Philip Morris International, Inc. | | | 2,481 | | | | 107,948 | |
Energy—8.8% | | | | | | | | |
Oil, Gas & Consumable Fuels—8.8% | | | | | | | | |
| Chevron Corp. | | | 3,300 | | | | 244,101 | |
| Devon Energy Corp. | | | 2,580 | | | | 169,532 | |
| | | | | | | | |
| | | | | | | | 413,633 | |
| | | | | | | | | |
Financials—18.3% | | | | | | | | |
Capital Markets—7.7% | | | | | | | | |
| Credit Suisse Group AG, ADR | | | 3,640 | | | | 102,866 | |
| Julius Baer Holding AG | | | 4,129 | | | | 158,558 | |
| Morgan Stanley | | | 6,210 | | | | 99,608 | |
| | | | | | | | |
| | | | | | | | 361,032 | |
| | | | | | | | | |
Consumer Finance—2.3% | | | | | | | | |
SLM Corp.1 | | | 12,240 | | | | 108,936 | |
Diversified Financial Services—3.2% | | | | | | | | |
| Bank of America Corp. | | | 5,810 | | | | 81,805 | |
| JPMorgan Chase & Co. | | | 2,070 | | | | 65,267 | |
| | | | | | | | |
| | | | | | | | 147,072 | |
| | | | | | | | | |
Insurance—5.1% | | | | | | | | |
| Assurant, Inc. | | | 790 | | | | 23,700 | |
| Everest Re Group Ltd. | | | 2,697 | | | | 205,350 | |
| National Financial Partners Corp. | | | 3,730 | | | | 11,339 | |
| | | | | | | | |
| | | | | | | | 240,389 | |
| |
Health Care—15.1% | | | | | | | | |
Health Care Providers & Services—5.1% | | | | | | | | |
| Aetna, Inc. | | | 4,330 | | | | 123,405 | |
WellPoint, Inc.1 | | | 2,820 | | | | 118,807 | |
| | | | | | | | |
| | | | | | | | 242,212 | |
| | | | | | | | | |
Life Sciences Tools & Services—0.9% | | | | | | | | |
Thermo Fisher Scientific, Inc.1 | | | 1,220 | | | | 41,565 | |
Pharmaceuticals—9.1% | | | | | | | | |
| Abbott Laboratories | | | 2,560 | | | | 136,627 | |
| Schering-Plough Corp. | | | 8,650 | | | | 147,310 | |
| Wyeth | | | 3,780 | | | | 141,788 | |
| | | | | | | | |
| | | | | | | | 425,725 | |
| | | | | | | | | |
Industrials—9.6% | | | | | | | | |
Aerospace & Defense—1.7% | | | | | | | | |
| Goodrich Corp. | | | 2,160 | | | | 79,963 | |
Air Freight & Logistics—1.0% | | | | | | | | |
| United Parcel Service, Inc., Cl. B | | | 850 | | | | 46,886 | |
Industrial Conglomerates—4.4% | | | | | | | | |
| Siemens AG, Sponsored ADR | | | 554 | | | | 41,966 | |
| Tyco International Ltd. | | | 7,550 | | | | 163,080 | |
| | | | | | | | |
| | | | | | | | 205,046 | |
| | | | | | | | | |
Machinery—1.9% | | | | | | | | |
Navistar International Corp.1 | | | 4,103 | | | | 87,722 | |
Trading Companies & Distributors—0.6% | | | | | | | | |
| Aircastle Ltd. | | | 6,020 | | | | 28,776 | |
Information Technology—5.8% | | | | | | | | |
Communications Equipment—4.8% | | | | | | | | |
| QUALCOMM, Inc. | | | 3,540 | | | | 126,838 | |
Research in Motion Ltd.1 | | | 2,390 | | | | 96,986 | |
| | | | | | | | |
| | | | | | | | 223,824 | |
| | | | | | | | | |
Semiconductors & Semiconductor Equipment—1.0% | | | | | | | | |
Lam Research Corp.1 | | | 810 | | | | 17,237 | |
| Varian Semiconductor | | | | | | | | |
Equipment Associates, Inc.1 | | | 1,780 | | | | 32,254 | |
| | | | | | | | |
| | | | | | | | 49,491 | |
| | | | | | | | | |
Materials—6.7% | | | | | | | | |
Chemicals—6.7% | | | | | | | | |
| Lubrizol Corp. (The) | | | 5,897 | | | | 214,592 | |
| Mosaic Co. (The) | | | 2,950 | | | | 102,070 | |
| | | | | | | | |
| | | | | | | | 316,662 | |
| | | | | | | | | |
Telecommunication Services—3.9% | | | | | | | | |
Diversified Telecommunication Services—3.9% | | | | | | | | |
| AT&T, Inc. | | | 6,440 | | | | 183,540 | |
F1 | OPPENHEIMER VALUE FUND/VA
STATEMENT OF INVESTMENTS Continued
| | | | | | | | | |
| | | Shares | | | Value | |
| |
Utilities—8.3% | | | | | | | | |
Electric Utilities—4.9% | | | | | | | | |
| American Electric Power Co., Inc. | | | 3,600 | | | $ | 119,808 | |
| Exelon Corp. | | | 1,976 | | | | 109,885 | |
| | | | | | | | |
| | | | | | | | 229,693 | |
| | | | | | | | | |
Multi-Utilities—3.4% | | | | | | | | |
| PG&E Corp. | | | 4,120 | | | | 159,485 | |
| | | | | | | | |
| Total Common Stocks (Cost $5,092,221) | | | | | | | 4,328,985 | |
| | | | | | | | | |
Preferred Stocks—2.7% | | | | | | | | |
| Petroleo Brasileiro SA, Sponsored ADR (Cost $206,305) | | | 6,290 | | | | 128,379 | |
Investment Company—14.2% | | | | | | | | |
Oppenheimer Institutional Money Market Fund, Cl. E, 1.96%2,3 (Cost $664,973) | | | 664,973 | | | | 664,973 | |
| | | | | | | | | |
Total Investments, at Value (Cost $5,963,499) | | | 109.1 | % | | | 5,122,337 | |
Liabilities in Excess of Other Assets | | | (9.1 | ) | | | (426,193 | ) |
| | | |
Net Assets | | | 100.0 | % | | $ | 4,696,144 | |
| | | |
Industry classifications are unaudited.
Footnotes to Statement of Investments
| | |
| 1. | | Non-income producing security. |
| |
| 2. | | Is or was an affiliate, as defined in the Investment Company Act of 1940, at or during the period ended December 31, 2008, by virtue of the Fund owning at least 5% of the voting securities of the issuer or as a result of the Fund and the issuer having the same investment adviser. Transactions during the period in which the issuer was an affiliate are as follows: |
| | | | | | | | | | | | | | | | | |
| | | Shares | | | Gross | | | Gross | | | Shares | |
| | | December 31, 2007 | | | Additions | | | Reductions | | | December 31, 2008 | |
| |
| Oppenheimer Institutional Money Market Fund, Cl. E | | | 177,433 | | | | 5,896,250 | | | | 5,408,710 | | | | 664,973 | |
| | | | | | | | | |
| | | Value | | | Income | |
| |
| Oppenheimer Institutional Money Market Fund, Cl. E | | $ | 664,973 | | | $ | 8,029 | |
| | |
| 3. | | Rate shown is the 7-day yield as of December 31, 2008. |
Valuation Inputs
Various data inputs are used in determining the value of each of the Fund’s investments as of the reporting period end. These data inputs are categorized in the following hierarchy under applicable financial accounting standards:
1) Level 1—quoted prices in active markets for identical assets or liabilities (including securities actively traded on a securities exchange)
2) Level 2—inputs other than quoted prices that are observable for the asset (such as quoted prices for similar assets and market corroborated inputs such as interest rates, prepayment speeds, credit risks, etc.)
3) Level 3—unobservable inputs (including the Manager’s own judgments about assumptions that market participants would use in pricing the asset).
The market value of the Fund’s investments was determined based on the following inputs as of December 31, 2008:
| | | | | | | | | |
| | | Investments in | | | Other Financial | |
| Valuation Description | | Securities | | | Instruments* | |
| |
| Level 1—Quoted Prices | | $ | 4,963,779 | | | $ | — | |
| Level 2—Other Significant Observable Inputs | | | 158,558 | | | | — | |
| Level 3—Significant Unobservable Inputs | | | — | | | | — | |
| | | |
| Total | | $ | 5,122,337 | | | $ | — | |
| | | |
| | |
| * | | Other financial instruments include options written, currency contracts, futures, forwards and swap contracts. Currency contracts and forwards are reported at their unrealized appreciation/depreciation at measurement date, which represents the change in the contract’s value from trade date. Futures are reported at their variation margin at measurement date, which represents the amount due to/from the Fund at that date. Options written and swaps are reported at their market value at measurement date. |
See the accompanying Notes for further discussion of the methods used in determining value of the Fund’s investments, and a summary of changes to the valuation techniques, if any, during the reporting period.
See accompanying Notes to Financial Statements.
F2 | OPPENHEIMER VALUE FUND/VA
STATEMENT OF ASSETS AND LIABILITIES December 31, 2008
| | | | | |
Assets | | | | |
| Investments, at value—see accompanying statement of investments: | | | | |
| Unaffiliated companies (cost $5,298,526) | | $ | 4,457,364 | |
| Affiliated companies (cost $664,973) | | | 664,973 | |
| | | | |
| | | | 5,122,337 | |
| Cash | | | 33,965 | |
| Receivables and other assets: | | | | |
| Investments sold | | | 135,001 | |
| Shares of beneficial interest sold | | | 20,958 | |
| Dividends | | | 11,030 | |
| Due from Manager | | | 15 | |
| Other | | | 5,105 | |
| | | | |
| Total assets | | | 5,328,411 | |
| | | | | |
Liabilities | | | | |
| Payables and other liabilities: | | | | |
| Investments purchased | | | 578,768 | |
| Shareholder communications | | | 9,467 | |
| Shares of beneficial interest redeemed | | | 7,240 | |
| Distribution and service plan fees | | | 3,984 | |
| Trustees’ compensation | | | 1,780 | |
| Transfer and shareholder servicing agent fees | | | 9 | |
| Other | | | 31,019 | |
| | | | |
| Total liabilities | | | 632,267 | |
| | | | | |
Net Assets | | $ | 4,696,144 | |
| | | | |
| | | | | |
Composition of Net Assets | | | | |
| Par value of shares of beneficial interest | | $ | 692 | |
| Additional paid-in capital | | | 7,763,131 | |
| Accumulated net investment income | | | 2,584 | |
| Accumulated net realized loss on investments and foreign currency transactions | | | (2,229,198 | ) |
| Net unrealized depreciation on investments and translation of assets and liabilities denominated in foreign currencies | | | (841,065 | ) |
| | | | |
Net Assets | | $ | 4,696,144 | |
| | | | |
| | | | | |
Net Asset Value Per Share | | | | |
| Non-Service Shares: | | | | |
| Net asset value, redemption price per share and offering price per share (based on net assets of $6,215 and 1,246 shares of beneficial interest outstanding) | | $ | 4.99 | |
| Service Shares: | | | | |
| Net asset value, redemption price per share and offering price per share (based on net assets of $4,689,929 and 690,778 shares of beneficial interest outstanding) | | $ | 6.79 | |
See accompanying Notes to Financial Statements.
F3 | OPPENHEIMER VALUE FUND/VA
STATEMENT OF OPERATIONS For the Year Ended December 31, 2008
| | | | | |
Investment Income | | | | |
| Dividends: | | | | |
| Unaffiliated companies (net of foreign withholding taxes of $4,734) | | $ | 141,789 | |
| Affiliated companies | | | 8,029 | |
| Interest | | | 87 | |
| | | | |
| Total investment income | | | 149,905 | |
| | | | | |
Expenses | | | | |
| Management fees | | | 48,203 | |
| Distribution and service plan fees—Service shares | | | 11,571 | |
| Transfer and shareholder servicing agent fees: | | | | |
| Non-Service shares | | | 22 | |
| Service shares | | | 84 | |
| Shareholder communications: | | | | |
| Non-Service shares | | | 2,014 | |
| Service shares | | | 23,599 | |
| Legal, auditing and other professional fees | | | 30,845 | |
| Trustees’ compensation | | | 6,062 | |
| Custodian fees and expenses | | | 49 | |
| Other | | | 8,464 | |
| | | | |
| Total expenses | | | 130,913 | |
| Less reduction to custodian expenses | | | (41 | ) |
| Less waivers and reimbursements of expenses | | | (37,020 | ) |
| | | | |
| Net expenses | | | 93,852 | |
| | | | | |
Net Investment Income | | | 56,053 | |
| | | | | |
Realized and Unrealized Loss | | | | |
| Net realized loss on: | | | | |
| Investments from unaffiliated companies | | | (1,910,920 | ) |
| Foreign currency transactions | | | (16,477 | ) |
| | | | |
| Net realized loss | | | (1,927,397 | ) |
| Net change in unrealized depreciation on: | | | | |
| Investments | | | (1,269,415 | ) |
| Translation of assets and liabilities denominated in foreign currencies | | | (3,599 | ) |
| | | | |
| Net change in unrealized depreciation | | | (1,273,014 | ) |
| | | | | |
Net Decrease in Net Assets Resulting from Operations | | $ | (3,144,358 | ) |
| | | | |
See accompanying Notes to Financial Statements.
F4 | OPPENHEIMER VALUE FUND/VA
STATEMENTS OF CHANGES IN NET ASSETS
| | | | | | | | | |
| Year Ended December 31, | | 2008 | | | 2007 | |
| |
Operations | | | | | | | | |
| Net investment income | | $ | 56,053 | | | $ | 39,402 | |
| Net realized loss | | | (1,927,397 | ) | | | (87,194 | ) |
| Net change in unrealized appreciation (depreciation) | | | (1,273,014 | ) | | | 7,138 | |
| | | |
| Net decrease in net assets resulting from operations | | | (3,144,358 | ) | | | (40,654 | ) |
| | | | | | | | | |
Dividends and/or Distributions to Shareholders | | | | | | | | |
| Dividends from net investment income: | | | | | | | | |
| Non-Service shares | | | (2,000 | ) | | | (14,051 | ) |
| Service shares | | | (47,216 | ) | | | (22,582 | ) |
| | | |
| | | | (49,216 | ) | | | (36,633 | ) |
| Distributions from net realized gain: | | | | | | | | |
| Non-Service shares | | | — | | | | (64,829 | ) |
| Service shares | | | — | | | | (232,359 | ) |
| | | |
| | | | — | | | | (297,188 | ) |
| | | | | | | | | |
Beneficial Interest Transactions | | | | | | | | |
| Net increase (decrease) in net assets resulting from beneficial interest transactions: | | | | | | | | |
| Non-Service shares | | | (1,475,254 | ) | | | (1,050,500 | ) |
| Service shares | | | 1,155,875 | | | | 6,521,885 | |
| | | |
| | | | (319,379 | ) | | | 5,471,385 | |
| | | | | | | | | |
Net Assets | | | | | | | | |
| Total increase (decrease) | | | (3,512,953 | ) | | | 5,096,910 | |
| Beginning of period | | | 8,209,097 | | | | 3,112,187 | |
| | | |
| End of period (including accumulated net investment income (loss) of $2,584 and $(2,761), respectively) | | $ | 4,696,144 | | | $ | 8,209,097 | |
| | | |
See accompanying Notes to Financial Statements.
F5 | OPPENHEIMER VALUE FUND/VA
FINANCIAL HIGHLIGHTS
| | | | | | | | | | | | | | | | | | | | | |
| Non-Service Shares Year Ended December 31, | | 2008 | | | 2007 | | | 2006 | | | 2005 | | | 2004 | |
| |
Per Share Operating Data | | | | | | | | | | | | | | | | | | | | |
| Net asset value, beginning of period | | $ | 11.73 | | | $ | 11.58 | | | $ | 11.16 | | | $ | 12.26 | | | $ | 12.90 | |
| |
| Income (loss) from investment operations: | | | | | | | | | | | | | | | | | | | | |
Net investment income (loss)1 | | | .12 | | | | .10 | | | | (.03 | ) | | | .02 | | | | (.01 | ) |
| Net realized and unrealized gain (loss) | | | (4.44 | ) | | | .59 | | | | 1.61 | | | | .71 | | | | 1.82 | |
| | | |
| Total from investment operations | | | (4.32 | ) | | | .69 | | | | 1.58 | | | | .73 | | | | 1.81 | |
| Dividends and/or distributions to shareholders: | | | | | | | | | | | | | | | | | | | | |
| Dividends from net investment income | | | (2.42 | ) | | | (.10 | ) | | | (.01 | ) | | | (.02 | ) | | | (.03 | ) |
| Distributions from net realized gain | | | — | | | | (.44 | ) | | | (1.15 | ) | | | (1.81 | ) | | | (2.42 | ) |
| | | |
| Total dividends and/or distributions to shareholders | | | (2.42 | ) | | | (.54 | ) | | | (1.16 | ) | | | (1.83 | ) | | | (2.45 | ) |
| |
| Net asset value, end of period | | $ | 4.99 | | | $ | 11.73 | | | $ | 11.58 | | | $ | 11.16 | | | $ | 12.26 | |
| | | |
| | | | | | | | | | | | | | | | | | | | | |
Total Return, at Net Asset Value2 | | | (36.43 | )% | | | 5.89 | % | | | 14.03 | % | | | 5.88 | % | | | 14.50 | % |
| | | | | | | | | | | | | | | | | | | | | |
Ratios/Supplemental Data | | | | | | | | | | | | | | | | | | | | |
| Net assets, end of period (in thousands) | | $ | 6 | | | $ | 1,728 | | | $ | 2,657 | | | $ | 2,562 | | | $ | 2,815 | |
| |
| Average net assets (in thousands) | | $ | 857 | | | $ | 2,753 | | | $ | 2,695 | | | $ | 2,878 | | | $ | 3,370 | |
| |
Ratios to average net assets:3 | | | | | | | | | | | | | | | | | | | | |
| Net investment income (loss) | | | 1.07 | % | | | 0.80 | % | | | (0.29 | )% | | | 0.15 | % | | | (0.08 | )% |
| Total expenses | | | 1.48 | %4 | | | 1.49 | %4 | | | 2.14 | %4 | | | 1.78 | % | | | 1.82 | % |
| Expenses after payments, waivers and/or reimbursements and reduction to custodian expenses | | | 1.25 | % | | | 1.25 | % | | | 2.14 | % | | | 1.78 | % | | | 1.82 | % |
| |
| Portfolio turnover rate | | | 175 | % | | | 142 | % | | | 124 | % | | | 86 | % | | | 100 | % |
| | |
| 1. | | Per share amounts calculated based on the average shares outstanding during the period. |
| |
| 2. | | Assumes an investment on the business day before the first day of the fiscal period, with all dividends and distributions reinvested in additional shares on the reinvestment date, and redemption at the net asset value calculated on the last business day of the fiscal period. Total returns are not annualized for periods less than one full year. Total return information does not reflect expenses that apply at the separate account level or to related insurance products. Inclusion of these charges would reduce the total return figures for all periods shown. Returns do not reflect the deduction of taxes that a shareholder would pay on fund distributions or the redemption of fund shares. |
| |
| 3. | | Annualized for periods less than one full year. |
| |
| 4. | | Total expenses including indirect expenses from affiliated fund were as follows: |
| | | | | |
| Year Ended December 31, 2008 | | | 1.48 | % |
| Year Ended December 31, 2007 | | | 1.49 | % |
| Year Ended December 31, 2006 | | | 2.14 | % |
See accompanying Notes to Financial Statements.
F6 | OPPENHEIMER VALUE FUND/VA
| | | | | | | | | | | | | |
| Service Shares Year Ended December 31, | | 2008 | | | 2007 | | | 20061 | |
| |
Per Share Operating Data | | | | | | | | | | | | |
| Net asset value, beginning of period | | $ | 11.75 | | | $ | 11.57 | | | $ | 11.89 | |
| |
| Income (loss) from investment operations: | | | | | | | | | | | | |
Net investment income (loss)2 | | | .08 | | | | .06 | | | | (.05 | ) |
| Net realized and unrealized gain (loss) | | | (4.97 | ) | | | .60 | | | | .88 | |
| | | |
| Total from investment operations | | | (4.89 | ) | | | .66 | | | | .83 | |
| |
| Dividends and/or distributions to shareholders: | | | | | | | | | | | | |
| Dividends from net investment income | | | (.07 | ) | | | (.04 | ) | | | — | |
| Distributions from net realized gain | | | — | | | | (.44 | ) | | | (1.15 | ) |
| | | |
| Total dividends and/or distributions to shareholders | | | (.07 | ) | | | (.48 | ) | | | (1.15 | ) |
| Net asset value, end of period | | $ | 6.79 | | | $ | 11.75 | | | $ | 11.57 | |
| | | |
| | | | | | | | | | | | | |
Total Return, at Net Asset Value3 | | | (41.62 | )% | | | 5.70 | % | | | 6.81 | % |
| | | | | | | | | | | | | |
Ratios/Supplemental Data | | | | | | | | | | | | |
| Net assets, end of period (in thousands) | | $ | 4,690 | | | $ | 6,481 | | | $ | 455 | |
| |
| Average net assets (in thousands) | | $ | 5,561 | | | $ | 3,527 | | | $ | 268 | |
| |
Ratios to average net assets:4 | | | | | | | | | | | | |
| Net investment income (loss) | | | 0.84 | % | | | 0.49 | % | | | (1.30 | )% |
Total expenses5 | | | 2.13 | % | | | 1.63 | % | | | 2.89 | % |
| Expenses after payments, waivers and/or reimbursements and reduction to custodian expenses | | | 1.50 | % | | | 1.50 | % | | | 2.88 | % |
| |
| Portfolio turnover rate | | | 175 | % | | | 142 | % | | | 124 | % |
| | |
| 1. | | For the period from September 18, 2006 (inception of offering) to December 31, 2006. |
| |
| 2. | | Per share amounts calculated based on the average shares outstanding during the period. |
| |
| 3. | | Assumes an investment on the business day before the first day of the fiscal period, with all dividends and distributions reinvested in additional shares on the reinvestment date and redemption at the net asset value calculated on the last business day of the fiscal period. Total returns are not annualized for periods less than one full year. Total return information does not reflect expenses that apply at the separate account level or to related insurance products. Inclusion of these charges would reduce the total return figures for all periods shown. Returns do not reflect the deduction of taxes that a shareholder would pay on fund distributions or the redemption of fund shares. |
| |
| 4. | | Annualized for periods less than one full year. |
| |
| 5. | | Total expenses including indirect expenses from affiliated fund were as follows: |
| | | | | |
| Year Ended December 31, 2008 | | | 2.13 | % |
| Year Ended December 31, 2007 | | | 1.63 | % |
| Period Ended December 31, 2006 | | | 2.89 | % |
See accompanying Notes to Financial Statements.
F7 | OPPENHEIMER VALUE FUND/VA
NOTES TO FINANCIAL STATEMENTS
1. Significant Accounting Policies
Oppenheimer Value Fund/VA (the “Fund”) is a separate series of Oppenheimer Variable Account Funds, an open-end management investment company registered under the Investment Company Act of 1940, as amended. The Fund’s investment objective is to seek long-term growth of capital by investing primarily in common stocks with low price-earnings ratios and better-than-anticipated earnings. Realization of current income is a secondary consideration. The Fund’s investment adviser is OppenheimerFunds, Inc. (the “Manager”).
The Fund offers two classes of shares. Both classes are sold at their offering price, which is the net asset value per share, to separate investment accounts of participating insurance companies as an underlying investment for variable life insurance policies, variable annuity contracts or other investment products. The class of shares designated as Service shares is subject to a distribution and service plan. Both classes of shares have identical rights and voting privileges with respect to the Fund in general and exclusive voting rights on matters that affect that class alone. Earnings, net assets and net asset value per share may differ due to each class having its own expenses, such as transfer and shareholder servicing agent fees and shareholder communications, directly attributable to that class.
The following is a summary of significant accounting policies consistently followed by the Fund.
Securities Valuation. The Fund calculates the net asset value of its shares as of the close of the New York Stock Exchange (the “Exchange”), normally 4:00 P.M. Eastern time, on each day the Exchange is open for trading.
Effective for fiscal periods beginning after November 15, 2007, FASB Statement of Financial Accounting Standards No. 157, Fair Value Measurements, establishes a hierarchy for measuring fair value of assets and liabilities. As required by the standard, each investment asset or liability of the Fund is assigned a level at measurement date based on the significance and source of the inputs to its valuation. Quoted prices in active markets for identical securities are classified as “Level 1”, inputs other than quoted prices for an asset that are observable are classified as “Level 2” and unobservable inputs, including the Manager’s judgment about the assumptions that a market participant would use in pricing an asset or liability are classified as “Level 3”. The inputs used for valuing securities are not necessarily an indication of the risks associated with investing in those securities. A table summarizing the Fund’s investments under these levels of classification is included following the Statement of Investments.
Securities are valued using quoted market prices, when available, as supplied primarily either by portfolio pricing services approved by the Board of Trustees or dealers. These securities are typically classified within Level 1 or 2; however, they may be designated as Level 3 if the dealer or portfolio pricing service values a security through an internal model with significant unobservable market data inputs.
Securities traded on a registered U.S. securities exchange are valued based on the last sale price of the security reported on the principal exchange on which traded, prior to the time when the Fund’s assets are valued. Securities whose principal exchange is NASDAQ® are valued based on the official closing prices reported by NASDAQ prior to the time when the Fund’s assets are valued. In the absence of a sale, the security is valued at the last sale price on the prior trading day, if it is within the spread of the current day’s closing “bid” and “asked” prices, and if not, at the current day’s closing bid price. A foreign security traded on a foreign exchange is valued based on the last sale price on the principal exchange on which the security is traded, as identified by the portfolio pricing service used by the Manager, prior to the time when the Fund’s assets are valued. In the absence of a sale, the security is valued at the most recent official closing price on the principal exchange on which it is traded.
Shares of a registered investment company that are not traded on an exchange are valued at that investment company’s net asset value per share.
Corporate, government and municipal debt instruments having a remaining maturity in excess of sixty days and all mortgage-backed securities, collateralized mortgage obligations and other asset-backed securities are valued at the mean between the “bid” and “asked” prices.
F8 | OPPENHEIMER VALUE FUND/VA
“Money market-type” debt instruments with remaining maturities of sixty days or less are valued at cost adjusted by the amortization of discount or premium to maturity (amortized cost), which approximates market value. These securities are typically designated as Level 2.
In the absence of a readily available quoted market price, including for securities whose values have been materially affected by what the Manager identifies as a significant event occurring before the Fund’s assets are valued but after the close of the securities’ respective exchanges, the Manager, acting through its internal valuation committee, in good faith determines the fair valuation of that asset using consistently applied procedures under the supervision of the Board of Trustees (which reviews those fair valuations by the Manager). Those procedures include certain standardized methodologies to fair value securities. Such methodologies include, but are not limited to, pricing securities initially at cost and subsequently adjusting the value based on: changes in company specific fundamentals, changes in an appropriate securities index, or changes in the value of similar securities which may be adjusted for any discounts related to resale restrictions. When possible, such methodologies use observable market inputs such as quoted prices of similar securities, observable interest rates, currency rates and yield curves. The methodologies used for valuing securities are not necessarily an indication of the risks associated with investing in those securities.
Fair valued securities may be classified as “Level 3” if the valuation primarily reflects the Manager’s own assumptions about the inputs that market participants would use in valuing such securities.
There have been no significant changes to the fair valuation methodologies during the period.
Foreign Currency Translation. The Fund’s accounting records are maintained in U.S. dollars. The values of securities denominated in foreign currencies and amounts related to the purchase and sale of foreign securities and foreign investment income are translated into U.S. dollars as of the close of the Exchange, normally 4:00 P.M. Eastern time, on each day the Exchange is open for trading. Foreign exchange rates may be valued primarily using a reliable bank, dealer or service authorized by the Board of Trustees.
Reported net realized gains and losses from foreign currency transactions arise from sales of portfolio securities, sales and maturities of short-term securities, sales of foreign currencies, exchange rate fluctuations between the trade and settlement dates on securities transactions, and the difference between the amounts of dividends, interest, and foreign withholding taxes recorded on the Fund’s books and the U.S. dollar equivalent of the amounts actually received or paid. Net unrealized appreciation and depreciation on the translation of assets and liabilities denominated in foreign currencies arise from changes in the values of assets and liabilities, including investments in securities at fiscal period end, resulting from changes in exchange rates.
The effect of changes in foreign currency exchange rates on investments is separately identified from the fluctuations arising from changes in market values of securities held and reported with all other foreign currency gains and losses in the Fund’s Statement of Operations.
Investment in Oppenheimer Institutional Money Market Fund. The Fund is permitted to invest daily available cash balances in an affiliated money market fund. The Fund may invest the available cash in Class E shares of Oppenheimer Institutional Money Market Fund (“IMMF”) to seek current income while preserving liquidity. IMMF is a registered open-end management investment company, regulated as a money market fund under the Investment Company Act of 1940, as amended. The Manager is also the investment adviser of IMMF. The Fund’s investment in IMMF is included in the Statement of Investments. As a shareholder, the Fund is subject to its proportional share of IMMF’s Class E expenses, including its management fee. The Manager will waive fees and/or reimburse Fund expenses in an amount equal to the indirect management fees incurred through the Fund’s investment in IMMF.
Investments With Off-Balance Sheet Market Risk. The Fund enters into financial instrument transactions (such as swaps, futures, options and other derivatives) that may have off-balance sheet market risk. Off-balance sheet market risk exists when the maximum potential loss on a particular financial instrument is greater than the value of such financial instrument, as reflected in the Fund’s Statement of Assets and Liabilities.
F9 | OPPENHEIMER VALUE FUND/VA
NOTES TO FINANCIAL STATEMENTS Continued
1. Significant Accounting Policies Continued
Allocation of Income, Expenses, Gains and Losses. Income, expenses (other than those attributable to a specific class), gains and losses are allocated on a daily basis to each class of shares based upon the relative proportion of net assets represented by such class. Operating expenses directly attributable to a specific class are charged against the operations of that class.
Federal Taxes. The Fund intends to comply with provisions of the Internal Revenue Code applicable to regulated investment companies and to distribute substantially all of its investment company taxable income, including any net realized gain on investments not offset by capital loss carryforwards, if any, to shareholders. Therefore, no federal income or excise tax provision is required. The Fund files income tax returns in U.S. federal and applicable state jurisdictions. The statute of limitations on the Fund’s tax return filings generally remain open for the three preceding fiscal reporting period ends.
The tax components of capital shown in the following table represent distribution requirements the Fund must satisfy under the income tax regulations, losses the Fund may be able to offset against income and gains realized in future years and unrealized appreciation or depreciation of securities and other investments for federal income tax purposes.
| | | | | | | | | | | | | |
| | | | | | | | | | | Net Unrealized | |
| | | | | | | | | | | Depreciation | |
| | | | | | | | | | | Based on Cost of | |
| | | | | | | | | | | Securities and | |
| Undistributed | | Undistributed | | | Accumulated | | | Other Investments | |
| Net Investment | | Long-Term | | | Loss | | | for Federal Income | |
| Income | | Gain | | | Carryforward1,2,3,4 | | | Tax Purposes | |
| |
| $4,364 | | $ | — | | | $ | 2,053,476 | | | $ | 1,016,789 | |
| | |
1. | | As of December 31, 2008, the Fund had $1,303,597 of net capital loss carryforwards available to offset future realized capital gains, if any, and thereby reduce future taxable gain distributions. As of December 31, 2008, details of the capital loss carryforward was as follows: |
| | | |
2. | | As of December 31, 2008, the Fund had $749,879 of post-October losses available to offset future realized capital gains, if any. Such losses, if unutilized, will expire in 2017. |
| | | |
3. | | During the fiscal year ended December 31, 2008, the Fund did not utilize any capital loss carryforward. |
| | | |
4. | | During the fiscal year ended December 31, 2007, the Fund did not utilize any capital loss carryforward. |
Net investment income (loss) and net realized gain (loss) may differ for financial statement and tax purposes. The character of dividends and distributions made during the fiscal year from net investment income or net realized gains may differ from their ultimate characterization for federal income tax purposes. Also, due to timing of dividends and distributions, the fiscal year in which amounts are distributed may differ from the fiscal year in which the income or net realized gain was recorded by the Fund.
Accordingly, the following amounts have been reclassified for December 31, 2008. Net assets of the Fund were unaffected by the reclassifications.
| | | | | |
| | | Reduction to | |
| Reduction to | | Accumulated Net | |
| Accumulated Net | | Realized Loss on | |
| Investment Income | | Investments | |
| |
| $1,492 | | $ | 1,492 | |
The tax character of distributions paid during the years ended December 31, 2008 and December 31, 2007 was as follows:
| | | | | | | | | |
| | | Year Ended | | | Year Ended | |
| | | December 31, 2008 | | | December 31, 2007 | |
| |
| Distributions paid from: | | | | | | | | |
| Ordinary income | | $ | 49,216 | | | $ | 113,473 | |
| Long-term capital gain | | | — | | | | 220,348 | |
| | | |
| Total | | $ | 49,216 | | | $ | 333,821 | |
| | | |
F10 | OPPENHEIMER VALUE FUND/VA
The aggregate cost of securities and other investments and the composition of unrealized appreciation and depreciation of securities and other investments for federal income tax purposes as of December 31, 2008 are noted in the following table. The primary difference between book and tax appreciation or depreciation of securities and other investments, if applicable, is attributable to the tax deferral of losses or tax realization of financial statement unrealized gain or loss.
| | | | | |
| Federal tax cost of securities | | $ | 6,139,223 | |
| Federal tax cost of other investments | | | 375 | |
| | | | |
| Total federal tax cost | | $ | 6,139,598 | |
| | | | |
| |
| Gross unrealized appreciation | | $ | 98,017 | |
| Gross unrealized depreciation | | | (1,114,806 | ) |
| | | | |
| Net unrealized depreciation | | $ | (1,016,789 | ) |
| | | | |
Trustees’ Compensation. The Board of Trustees has adopted a compensation deferral plan for independent trustees that enables trustees to elect to defer receipt of all or a portion of the annual compensation they are entitled to receive from the Fund. For purposes of determining the amount owed to the Trustee under the plan, deferred amounts are treated as though equal dollar amounts had been invested in shares of the Fund or in other Oppenheimer funds selected by the Trustee. The Fund purchases shares of the funds selected for deferral by the Trustee in amounts equal to his or her deemed investment, resulting in a Fund asset equal to the deferred compensation liability. Such assets are included as a component of “Other” within the asset section of the Statement of Assets and Liabilities. Deferral of trustees’ fees under the plan will not affect the net assets of the Fund, and will not materially affect the Fund’s assets, liabilities or net investment income per share. Amounts will be deferred until distributed in accordance to the compensation deferral plan.
Dividends and Distributions to Shareholders. Dividends and distributions to shareholders, which are determined in accordance with income tax regulations and may differ from U.S. generally accepted accounting principles, are recorded on the ex-dividend date. Income and capital gain distributions, if any, are declared and paid annually or at other times as deemed necessary by the Manager.
Investment Income. Dividend income is recorded on the ex-dividend date or upon ex-dividend notification in the case of certain foreign dividends where the ex-dividend date may have passed. Non-cash dividends included in dividend income, if any, are recorded at the fair market value of the securities received. Interest income is recognized on an accrual basis. Discount and premium, which are included in interest income on the Statement of Operations, are amortized or accreted daily.
Custodian Fees. “Custodian fees and expenses” in the Statement of Operations may include interest expense incurred by the Fund on any cash overdrafts of its custodian account during the period. Such cash overdrafts may result from the effects of failed trades in portfolio securities and from cash outflows resulting from unanticipated shareholder redemption activity. The Fund pays interest to its custodian on such cash overdrafts, to the extent they are not offset by positive cash balances maintained by the Fund, at a rate equal to the Federal Funds Rate plus 0.50%. The “Reduction to custodian expenses” line item, if applicable, represents earnings on cash balances maintained by the Fund during the period. Such interest expense and other custodian fees may be paid with these earnings.
Security Transactions. Security transactions are recorded on the trade date. Realized gains and losses on securities sold are determined on the basis of identified cost.
Indemnifications. The Fund’s organizational documents provide current and former trustees and officers with a limited indemnification against liabilities arising in connection with the performance of their duties to the Fund. In the normal course of business, the Fund may also enter into contracts that provide general indemnifications. The Fund’s maximum exposure under these arrangements is unknown as this would be dependent on future claims that may be made against the Fund. The risk of material loss from such claims is considered remote.
F11 | OPPENHEIMER VALUE FUND/VA
NOTES TO FINANCIAL STATEMENTS Continued
1. Significant Accounting Policies Continued
Other. The preparation of financial statements in conformity with accounting principles generally accepted in the United States of America requires management to make estimates and assumptions that affect the reported amounts of assets and liabilities and disclosure of contingent assets and liabilities at the date of the financial statements and the reported amounts of increases and decreases in net assets from operations during the reporting period. Actual results could differ from those estimates.
2. Shares of Beneficial Interest
The Fund has authorized an unlimited number of $0.001 par value shares of beneficial interest of each class. Transactions in shares of beneficial interest were as follows:
| | | | | | | | | | | | | | | | | |
| | | Year Ended December 31, 2008 | | | Year Ended December 31, 2007 | |
| | | Shares | | | Amount | | | Shares | | | Amount | |
| |
Non-Service Shares | | | | | | | | | | | | | | | | |
| Sold | | | 957 | | | $ | 8,036 | | | | — | | | $ | — | |
| Dividends and/or distributions reinvested | | | 409 | | | | 2,000 | | | | — | | | | — | |
| Redeemed | | | (147,464 | ) | | | (1,485,290 | ) | | | (82,215 | ) | | | (1,050,500 | ) |
| | | |
| Net decrease | | | (146,098 | ) | | $ | (1,475,254 | ) | | | (82,215 | ) | | $ | (1,050,500 | ) |
| | | |
| | | | | | | | | | | | | | | | | |
Service Shares | | | | | | | | | | | | | | | | |
| Sold | | | 461,846 | | | $ | 4,322,028 | | | | 525,491 | | | $ | 6,694,320 | |
| Dividends and/or distributions reinvested | | | 7,057 | | | | 47,216 | | | | 21,569 | | | | 254,941 | |
| Redeemed | | | (329,902 | ) | | | (3,213,369 | ) | | | (34,566 | ) | | | (427,376 | ) |
| | | |
| Net increase | | | 139,001 | | | $ | 1,155,875 | | | | 512,494 | | | $ | 6,521,885 | |
| | | |
3. Purchases and Sales of Securities
The aggregate cost of purchases and proceeds from sales of securities, other than short-term obligations and investments in Oppenheimer Institutional Money Market Fund and OFI Liquid Assets Fund, LLC, for the year ended December 31, 2008, were as follows:
| | | | | | | | | |
| | | Purchases | | | Sales | |
| |
| Investment securities | | $ | 10,970,714 | | | $ | 11,375,242 | |
4. Fees and Other Transactions with Affiliates
Management Fees. Under the investment advisory agreement, the Fund pays the Manager a management fee based on the daily net assets of the Fund at an annual rate as shown in the following table:
| | | | | |
| Fee Schedule | | | | |
| |
| Up to $200 million | | | 0.75 | % |
| Next $200 million | | | 0.72 | |
| Next $200 million | | | 0.69 | |
| Next $200 million | | | 0.66 | |
| Over $800 million | | | 0.60 | |
Transfer Agent Fees. OppenheimerFunds Services (“OFS”), a division of the Manager, acts as the transfer and shareholder servicing agent for the Fund. The Fund pays OFS a per account fee. For the year ended December 31, 2008, the Fund paid $91 to OFS for services to the Fund.
Additionally, funds offered in variable annuity separate accounts are subject to minimum fees of $10,000 per class, for class level assets of $10 million or more. Each class is subject to the minimum fee in the event that the per account fee does not equal or exceed the applicable minimum fee.
F12 | OPPENHEIMER VALUE FUND/VA
Distribution and Service Plan for Service Shares. The Fund has adopted a Distribution and Service Plan (the “Plan”) in accordance with Rule 12b-1 under the Investment Company Act of 1940 for Service shares to pay OppenheimerFunds Distributor, Inc. (the “Distributor”), for distribution related services, personal service and account maintenance for the Fund’s Service shares. Under the Plan, payments are made periodically at an annual rate of up to 0.25% of the average annual net assets of Service shares of the Fund. The Distributor currently uses all of those fees to compensate sponsor(s) of the insurance product that offers Fund shares, for providing personal service and maintenance of accounts of their variable contract owners that hold Service shares. These fees are paid out of the Fund’s assets on an on-going basis and increase operating expenses of the Service shares, which results in lower performance compared to the Fund’s shares that are not subject to a service fee. Fees incurred by the Fund under the Plan are detailed in the Statement of Operations.
Waivers and Reimbursements of Expenses. Effective January 1, 2007, the Manager voluntarily agreed to an expense waiver of any “Total expenses” over 1.25% of average annual net assets for Non-Service shares and 1.50% of average annual net assets for Service shares. During the year ended December 31, 2008, OFS waived $1,987 and $34,759 for Non-Service and Service shares, respectively. The expense waiver is a voluntary undertaking and may be terminated by the Manager at any time.
OFS has voluntarily agreed to limit transfer and shareholder servicing agent fees for all classes to 0.35% of average annual net assets per class. During the year ended December 31, 2008, OFS waived $6 for Non-Service shares. This undertaking may be amended or withdrawn at any time.
The Manager will waive fees and/or reimburse Fund expenses in an amount equal to the indirect management fees incurred through the Fund’s investment in IMMF. During the year ended December 31, 2008, the Manager waived $268 for IMMF management fees.
5. Foreign Currency Exchange Contracts
The Fund may enter into foreign currency exchange contracts (“forward contracts”) for the purchase or sale of a foreign currency at a negotiated rate at a future date.
Forward contracts are reported on a schedule following the Statement of Investments. Forward contracts will be valued daily based upon the closing prices of the forward currency rates determined at the close of the Exchange as provided by a bank, dealer or pricing service. The resulting unrealized appreciation (depreciation) is reported in the Statement of Assets and Liabilities as a receivable or payable and in the Statement of Operations within the change in unrealized appreciation (depreciation). At contract close, the difference between the original cost of the contract and the value at the close date is recorded as a realized gain (loss) in the Statement of Operations.
Risks to the Fund include both market and credit risk. Market risk is the risk that the value of the forward contract will depreciate due to unfavorable changes in the exchange rates. Credit risk arises from the possibility that the counterparty will default. If the counterparty defaults, the Fund’s loss will consist of the net amount of contractual payments that the Fund has not yet received.
As of December 31, 2008, the Fund had no outstanding forward contracts.
6. Recent Accounting Pronouncement
In March 2008, the Financial Accounting Standards Board (“FASB”) issued Statement on Financial Accounting Standards (“SFAS”) No. 161, Disclosures about Derivative Instruments and Hedging Activities. This standard requires enhanced disclosures about derivative and hedging activities, including qualitative disclosures about how and why the Fund uses derivative instruments, how these activities are accounted for, and their effect on the Fund’s financial position, financial performance and cash flows. SFAS No. 161 is effective for financial statements issued for fiscal years and interim periods beginning after November 15, 2008. At this time, management is evaluating the implications of SFAS No. 161 and its impact on the Fund’s financial statements and related disclosures.
F13 | OPPENHEIMER VALUE FUND/VA
NOTES TO FINANCIAL STATEMENTS Continued
7. Change In Independent Registered Public Accounting Firm (Unaudited)
At a meeting held on August 20, 2008, the Board of Trustees of the Fund appointed KPMG LLP as the independent registered public accounting firm to the Fund for fiscal year 2009, replacing the firm of Deloitte & Touche LLP, effective at the conclusion of the fiscal 2008 audit. During the two most recent fiscal years the audit reports of Deloitte & Touche LLP contained no adverse opinion or disclaimer of opinion and were not qualified or modified as to uncertainty, audit scope or accounting principles. Further, there were no disagreements between the Fund and Deloitte & Touche LLP on accounting principles, financial statement disclosure or audit scope, which if not resolved to the satisfaction of Deloitte & Touche LLP would have caused it to make reference to the disagreements in connection with its reports.
F14 | OPPENHEIMER VALUE FUND/VA
REPORT OF INDEPENDENT REGISTERED PUBLIC ACCOUNTING FIRM
To the Board of Trustees and Shareholders of Oppenheimer Value Fund/VA:
We have audited the accompanying statement of assets and liabilities of Oppenheimer Value Fund/VA (the “Fund”), a series of Oppenheimer Variable Account Funds, including the statement of investments, as of December 31, 2008, and the related statement of operations for the year then ended, the statements of changes in net assets for each of the two years in the period then ended, and the financial highlights for each of the five years in the period then ended. These financial statements and financial highlights are the responsibility of the Fund’s management. Our responsibility is to express an opinion on these financial statements and financial highlights based on our audits.
We conducted our audits in accordance with the standards of the Public Company Accounting Oversight Board (United States). Those standards require that we plan and perform the audit to obtain reasonable assurance about whether the financial statements and financial highlights are free of material misstatement. The Fund is not required to have, nor were we engaged to perform, an audit of its internal control over financial reporting. Our audits included consideration of internal control over financial reporting as a basis for designing audit procedures that are appropriate in the circumstances, but not for the purpose of expressing an opinion on the effectiveness of the Fund’s internal control over financial reporting. Accordingly, we express no such opinion. An audit also includes examining, on a test basis, evidence supporting the amounts and disclosures in the financial statements, assessing the accounting principles used and significant estimates made by management, as well as evaluating the overall financial statement presentation. Our procedures included confirmation of securities owned as of December 31, 2008, by correspondence with the custodian and brokers; where replies were not received from brokers, we performed other auditing procedures. We believe that our audits provide a reasonable basis for our opinion.
In our opinion, the financial statements and financial highlights referred to above present fairly, in all material respects, the financial position of the Fund as of December 31, 2008, the results of its operations for the year then ended, the changes in its net assets for each of the two years in the period then ended, and the financial highlights for each of the five years in the period then ended, in conformity with accounting principles generally accepted in the United States of America.
Deloitte & Touche LLP
Denver, Colorado
February 11, 2009
F15 | OPPENHEIMER VALUE FUND/VA
THIS PAGE INTENTIONALLY LEFT BLANK.
F16 | OPPENHEIMER VALUE FUND/VA
FEDERAL INCOME TAX INFORMATION Unaudited
In early 2009, if applicable, shareholders of record received information regarding all dividends and distributions paid to them by the Fund during calendar year 2008. Regulations of the U.S. Treasury Department require the Fund to report this information to the Internal Revenue Service.
Dividends, if any, paid by the Fund during the fiscal year ended December 31, 2008 which are not designated as capital gain distributions should be multiplied by 100% to arrive at the amount eligible for the corporate dividend-received deduction.
The foregoing information is presented to assist shareholders in reporting distributions received from the Fund to the Internal Revenue Service. Because of the complexity of the federal regulations which may affect your individual tax return and the many variations in state and local tax regulations, we recommend that you consult your tax advisor for specific guidance.
7 | OPPENHEIMER VALUE FUND/VA
BOARD APPROVAL OF THE FUND’S INVESTMENT ADVISORY AGREEMENT Unaudited
Each year, the Board of Trustees (the “Board”), including a majority of the independent Trustees, is required to determine whether to renew the Fund’s investment advisory agreement (the “Agreement”). The Investment Company Act of 1940, as amended, requires that the Board request and evaluate, and that the Manager provide, such information as may be reasonably necessary to evaluate the terms of the Agreement. The Board employs an independent consultant to prepare a report that provides information, including comparative information, the Board requests for that purpose. In addition, the Board receives information throughout the year regarding Fund services, fees, expenses and performance.
The Manager and the independent consultant provided information to the Board on the following factors: (i) the nature, quality and extent of the Manager’s services, (ii) the investment performance of the Fund and the Manager, (iii) the fees and expenses of the Fund, including comparative expense information, (iv) the profitability of the Manager and its affiliates, including an analysis of the cost of providing services, (v) whether economies of scale are realized as the Fund grows and whether fee levels reflect these economies of scale for Fund investors and (vi) other benefits to the Manager from its relationship with the Fund. The Board was aware that there are alternatives to retaining the Manager.
Outlined below is a summary of the principal information considered by the Board as well as the Board’s conclusions.
Nature, Quality and Extent of Services. The Board considered information about the nature, quality and extent of the services provided to the Fund and information regarding the Manager’s key personnel who provide such services. The Manager’s duties include providing the Fund with the services of the portfolio manager and the Manager’s investment team, who provide research, analysis and other advisory services in regard to the Fund’s investments; securities trading services; oversight of third party service providers; monitoring compliance with applicable Fund policies and procedures and adherence to the Fund’s investment restrictions. The Manager is responsible for providing certain administrative services to the Fund as well. Those services include providing and supervising all administrative and clerical personnel who are necessary in order to provide effective corporate administration for the Fund; compiling and maintaining records with respect to the Fund’s operations; preparing and filing reports required by the Securities and Exchange Commission; preparing periodic reports regarding the operations of the Fund for its shareholders; preparing proxy materials for shareholder meetings; and preparing the registration statements required by Federal and state securities laws for the sale of the Fund’s shares. The Manager also provides the Fund with office space, facilities and equipment.
The Board also considered the quality of the services provided and the quality of the Manager’s resources that are available to the Fund. The Board took account of the fact that the Manager has had over forty years of experience as an investment adviser and that its assets under management rank it among the top mutual fund managers in the United States. The Board evaluated the Manager’s advisory, administrative, accounting, legal and compliance services, and information the Board has received regarding the experience and professional qualifications of the Manager’s key personnel and the size and functions of its staff. In its evaluation of the quality of the portfolio management services provided, the Board considered the experience of Chris Leavy, the portfolio manager for the Fund, and the Manager’s investment team and analysts. The Board members also considered the totality of their experiences with the Manager as Directors or Trustees of the Fund and other funds advised by the Manager. The Board considered information regarding the quality of services provided by affiliates of the Manager, which its members have become knowledgeable about in connection with the renewal of the Fund’s service agreements. The Board concluded that in light of the Manager’s experience, reputation, personnel, operations and resources, the Fund benefits from the services provided under the Agreement.
Investment Performance of the Manager and the Fund. Throughout the year, the Manager provided information on the investment performance of the Fund and the Manager, including comparative performance information. The
8 | OPPENHEIMER VALUE FUND/VA
Board also reviewed information, prepared by the Manager and by the independent consultant, comparing the Fund’s historical performance to relevant market indices and to the performance of other multi-cap value funds underlying variable insurance products. The Board considered that the Fund outperformed its performance universe median during the one- and three-year periods.
Costs of Services by the Manager. The Board reviewed the fees paid to the Manager and the other expenses borne by the Fund. The Board also considered the comparability of the fees charged and the services provided to the Fund to the fees and services for other clients or accounts advised by the Manager. The independent consultant provided comparative data in regard to the fees and expenses of the Fund and multi-cap value funds underlying variable insurance products with comparable asset levels and distribution features. The Board considered that the Fund’s total expenses were higher than its expense group median. The Board considered the Manager’s assertion that the Fund has the smallest size among its peers. The Board further considered that, effective January 1, 2007, the Manager implemented a voluntary cap of 1.25% for the total expenses for Non-Service shares and 1.50% for Service shares and that this waiver allowed the total expenses for Non-Service shares to drop almost 90 basis points for 2007 as compared to 2006. In reviewing the fees and expenses charged to the VA Funds, the Board considered the Manager’s assertion that, because of the disparity among VA funds in how insurance companies may be compensated for the services they provide to shareholders, when comparing the expenses of the various VA funds it is most appropriate to focus on the total expenses rather than on the management fees. Accordingly, while the Board reviewed and considered all expenses in its consideration of the Advisory Agreement, it paid particular attention to total expenses.
Economies of Scale and Profits Realized by the Manager. The Board considered information regarding the Manager’s costs in serving as the Fund’s investment adviser, including the costs associated with the personnel and systems necessary to manage the Fund, and information regarding the Manager’s profitability from its relationship with the Fund. The Board reviewed whether the Manager may realize economies of scale in managing and supporting the Fund. The Board noted that the Fund currently has management fee breakpoints, which are intended to share with Fund shareholders economies of scale that may exist as the Fund’s assets grow.
Other Benefits to the Manager. In addition to considering the profits realized by the Manager, the Board considered information that was provided regarding the direct and indirect benefits the Manager receives as a result of its relationship with the Fund, including compensation paid to the Manager’s affiliates and research provided to the Manager in connection with permissible brokerage arrangements (soft dollar arrangements). The Board also considered that the Manager must be able to pay and retain experienced professional personnel at competitive rates to provide quality services to the Fund and that maintaining the financial viability of the Manager is important in order for the Manager to continue to provide significant services to the Fund and its shareholders.
Conclusions. These factors were also considered by the independent Trustees meeting separately from the full Board, assisted by experienced counsel to the Fund and to the independent Trustees. Fund counsel and the independent Trustees’ counsel are independent of the Manager within the meaning and intent of the Securities and Exchange Commission Rules.
Based on its review of the information it received and its evaluations described above, the Board, including a majority of the independent Trustees, decided to continue the Agreement for another year. In arriving at this decision, the Board did not single out any factor or factors as being more important than others, but considered all of the above information, and considered the terms and conditions of the Agreement, including the management fee, in light of all of the surrounding circumstances.
9 | OPPENHEIMER VALUE FUND/VA
PORTFOLIO PROXY VOTING POLICIES AND PROCEDURES; UPDATES TO STATEMENTS OF INVESTMENTS Unaudited
The Fund has adopted Portfolio Proxy Voting Policies and Procedures under which the Fund votes proxies relating to securities (“portfolio proxies”) held by the Fund. A description of the Fund’s Portfolio Proxy Voting Policies and Procedures is available (i) without charge, upon request, by calling the Fund toll-free at 1.800.525.7048, (ii) on the Fund’s website at www.oppenheimerfunds.com, and (iii) on the SEC’s website at www.sec.gov. In addition, the Fund is required to file Form N-PX, with its complete proxy voting record for the 12 months ended June 30th, no later than August 31st of each year. The Fund’s voting record is available (i) without charge, upon request, by calling the Fund toll-free at 1.800.525.7048, and (ii) in the Form N-PX filing on the SEC’s website at www.sec.gov.
The Fund files its complete schedule of portfolio holdings with the SEC for the first quarter and the third quarter of each fiscal year on Form N-Q. The Fund’s Form N-Q filings are available on the SEC’s website at http://www.sec.gov. Those forms may be reviewed and copied at the SEC’s Public Reference Room in Washington, D.C. Information on the operation of the Public Reference Room may be obtained by calling 1-800-SEC-0330.
10 | OPPENHEIMER VALUE FUND/VA
TRUSTEES AND OFFICERS Unaudited
| | | |
| Name, Position(s) Held with the | | Principal Occupation(s) During the Past 5 Years; Other Trusteeships/Directorships Held; Number of Portfolios in |
| Funds, Length of Service, Age | | the Funds Complex Currently Overseen |
| | | |
INDEPENDENT TRUSTEES | | The address of each Trustee in the chart below is 6803 S. Tucson Way, Centennial, Colorado 80112-3924. Each Trustee serves for an indefinite term, or until his or her resignation, retirement, death or removal. |
| | | |
William L. Armstrong,
Chairman of the Board
of Trustees and Trustee
(since 2003)
Age: 71 | | President, Colorado Christian University (since 2006); Chairman, Cherry Creek Mortgage Company (since 1991), Chairman, Centennial State Mortgage Company (since 1994), Chairman, The El Paso Mortgage Company (since 1993); Chairman, Ambassador Media Corporation (since 1984); Chairman, Broadway Ventures (since 1984); Director of Helmerich & Payne, Inc. (oil and gas drilling/production company) (since 1992), Campus Crusade for Christ (non-profit) (since 1991); Former Director, The Lynde and Harry Bradley Foundation, Inc. (non-profit organization) (2002-2006); former Chairman of: Transland Financial Services, Inc. (private mortgage banking company) (1997-2003), Great Frontier Insurance (1995-2000), Frontier Real Estate, Inc. (residential real estate brokerage) (1994-2000) and Frontier Title (title insurance agency) (1995-2000); former Director of the following: UNUMProvident (insurance company) (1991-2004), Storage Technology Corporation (computer equipment company) (1991-2003) and International Family Entertainment (television channel) (1992-1997); U.S Senator (January 1979-January 1991). Oversees 41 portfolios in the OppenheimerFunds complex. |
| | | |
George C. Bowen,
Trustee (since 2003)
Age: 72 | | Assistant Secretary and Director of Centennial Asset Management Corporation (December 1991-April 1999); President, Treasurer and Director of Centennial Capital Corporation (June 1989-April 1999); Chief Executive Officer and Director of MultiSource Services, Inc. (March 1996-April 1999); Mr. Bowen held several positions with the Manager and with subsidiary or affiliated companies of the Manager (September 1987-April 1999). Oversees 41 portfolios in the OppenheimerFunds complex. |
| | | |
Edward L. Cameron,
Trustee (since 2003)
Age: 70 | | Member of The Life Guard of Mount Vernon (George Washington historical site) (June 2000 – June 2006); Partner of PricewaterhouseCoopers LLP (accounting firm) (July 1974-June 1999); Chairman of Price Waterhouse LLP Global Investment Management Industry Services Group (accounting firm) (July 1994-June 1998). Oversees 41 portfolios in the OppenheimerFunds complex. |
| | | |
Jon S. Fossel,
Trustee (since 2003)
Age: 66 | | Director of UNUMProvident (insurance company) (since June 2002); Director of Northwestern Energy Corp. (public utility corporation) (since November 2004); Director of P.R. Pharmaceuticals (October 1999-October 2003); Director of Rocky Mountain Elk Foundation (non-profit organization) (February 1998-February 2003 and February 2005-February 2007); Chairman and Director (until October 1996) and President and Chief Executive Officer (until October 1995) of the Manager; President, Chief Executive Officer and Director of the following: Oppenheimer Acquisition Corp. (“OAC”) (parent holding company of the Manager), Shareholders Services, Inc. and Shareholder Financial Services, Inc. (until October 1995). Oversees 41 portfolios in the OppenheimerFunds complex. |
| | | |
Sam Freedman,
Trustee (since 2003)
Age: 68 | | Director of Colorado UpLIFT (charitable organization) (since September 1984). Mr. Freedman held several positions with the Manager and with subsidiary or affiliated companies of the Manager (until October 1994). Oversees 41 portfolios in the OppenheimerFunds complex. |
| | | |
Beverly L. Hamilton,
Trustee (since 2003)
Age: 62 | | Trustee of Monterey Institute for International Studies (educational organization) (since February 2000); Board Member of Middlebury College (educational organization) (since December 2005); Director of The California Endowment (philanthropic organization) (since April 2002); Director (February 2002-2005) and Chairman of Trustees (2006-2007) of the Community Hospital of Monterey Peninsula; Director (October 1991-2005) and Vice Chairman (since 2006) of American Funds’ Emerging Markets Growth Fund, Inc. (mutual fund); President of ARCO Investment Management Company (February 1991-April 2000); Member of the investment commit- tees of The Rockefeller Foundation (2001-2006) and The University of Michigan (since 2000); Advisor at Credit Suisse First Boston’s Sprout venture capital unit (venture capital fund) (1994-January 2005); Trustee of MassMutual Institutional Funds (investment company) (1996-June 2004); Trustee of MML Series Investment Fund (investment company) (April 1989-June 2004); Member of the investment committee of Hartford Hospital (2000-2003); and Advisor to Unilever (Holland) pension fund (2000-2003). Oversees 41 portfolios in the OppenheimerFunds complex. |
11 | OPPENHEIMER VALUE FUND/VA
TRUSTEES AND OFFICERS Unaudited / Continued
| | | |
| | | |
Robert J. Malone,
Trustee (since 2003)
Age: 64 | | Board of Directors of Opera Colorado Foundation (non-profit organization) (since March 2008); Director of Jones Knowledge, Inc. (since 2006); Director of Jones International University (educational organization) (since August 2005); Chairman, Chief Executive Officer and Director of Steele Street Bank & Trust (commercial banking) (since August 2003); Director of Colorado UpLIFT (charitable organization) (since 1986); Trustee of the Gallagher Family Foundation (non-profit organization) (since 2000); Former Chairman of U.S. Bank-Colorado (subsidiary of U.S. Bancorp and formerly Colorado National Bank) (July 1996-April 1999); Director of Commercial Assets, Inc. (real estate investment trust) (1993-2000); Director of Jones Knowledge, Inc. (2001-July 2004); and Director of U.S. Exploration, Inc. (oil and gas exploration) (1997-February 2004). Oversees 41 portfolios in the OppenheimerFunds complex. |
| | | |
F. William Marshall, Jr.,
Trustee (since 2003)
Age: 66 | | Trustee Emeritas of Worcester Polytech Institute (WPI) (private university) (since 2009); Trustee of MassMutual Select Funds (formerly MassMutual Institutional Funds) (investment company) (since 1996) and MML Series Investment Fund (investment company) (since 1996); President and Treasurer of the SIS Funds (private charitable fund) (since January 1999); Former Trustee of WPI (1985-2008); Former Chairman of the Board (2004-2006) and Former Chairman of the Investment Committee of WPI (1994-2008); Chairman of SIS & Family Bank, F.S.B. (formerly SIS Bank) (commercial bank) (January 1999-July 1999); Executive Vice President of Peoples Heritage Financial Group, Inc. (commercial bank) (January 1999-July 1999); and Former President and Chief Executive Officer of SIS Bancorp. (1993-1999). Oversees 43 portfolios in the OppenheimerFunds complex. |
| | | |
INTERESTED TRUSTEE AND OFFICER
John V. Murphy, Trustee (since 2003), President and Principal Executive Officer (since 2001)
Age: 59 | | The address of Mr. Murphy is Two World Financial Center, 225 Liberty Street, 11th Floor, New York, New York 10281-1008. Mr. Murphy serves as a Trustee for an indefinite term, or until his resignation, retirement, death or removal and as an Officer for an indefinite term, or until his resignation, retirement, death or removal. Mr. Murphy is an interested Trustee due to his positions with OppenheimerFunds, Inc. and its affiliates.
Chairman and Director of the Manager (since June 2001); Chief Executive Officer of the Manager (June 2001- December 2008); President of the Manager (September 2000-February 2007); President and director or trustee of other Oppenheimer funds; President and Director of Oppenheimer Acquisition Corp. (“OAC”) (the Manager’s parent holding company) and of Oppenheimer Partnership Holdings, Inc. (holding company subsidiary of the Manager) (since July 2001); Director of OppenheimerFunds Distributor, Inc. (subsidiary of the Manager) (November 2001-December 2006); Chairman and Director of Shareholder Services, Inc. and of Shareholder Financial Services, Inc. (transfer agent subsidiaries of the Manager) (since July 2001); President and Director of OppenheimerFunds Legacy Program (charitable trust program established by the Manager) (since July 2001); Director of the following investment advisory subsidiaries of the Manager: OFI Institutional Asset Management, Inc., Centennial Asset Management Corporation, Trinity Investment Management Corporation and Tremont Capital Management, Inc. (since November 2001), HarbourView Asset Management Corporation and OFI Private Investments, Inc. (since July 2001); President (since November 2001) and Director (since July 2001) of Oppenheimer Real Asset Management, Inc.; Executive Vice President of Massachusetts Mutual Life Insurance Company (OAC’s parent company) (since February 1997); Director of DLB Acquisition Corporation (holding company parent of Babson Capital Management LLC) (since June 1995); Chairman (since October 2007) and Member of the Investment Company Institute’s Board of Governors (since October 2003). Oversees 105 portfolios in the OppenheimerFunds complex. |
| | | |
OTHER OFFICERS OF THE FUND | | The addresses of the Officers in the chart below are as follows: for Mr. Zack, Two World Financial Center, 225 Liberty Street, New York, New York 10281-1008, for Messrs. Vandehey and Wixted, 6803 S. Tucson Way, Centennial, Colorado 80112-3924. Each Officer serves for an indefinite term or until his or her resignation, retirement, death or removal. |
| | | |
Mark S. Vandehey,
Vice President and Chief Compliance Officer
(since 2004)
Age: 58 | | Senior Vice President and Chief Compliance Officer of the Manager (since March 2004); Chief Compliance Officer of OppenheimerFunds Distributor, Inc., Centennial Asset Management and Shareholder Services, Inc. (since March 2004); Vice President of OppenheimerFunds Distributor, Inc., Centennial Asset Management Corporation and Shareholder Services, Inc. (since June 1983); Former Vice President and Director of Internal Audit of the Manager (1997-February 2004). An officer of 105 portfolios in the OppenheimerFunds complex. |
| | | |
Brian W. Wixted,
Treasurer and Principal Financial & Accounting Officer (since 2003)
Age: 49 | | Senior Vice President and Treasurer of the Manager (since March 1999); Treasurer of the following: HarbourView Asset Management Corporation, Shareholder Financial Services, Inc., Shareholder Services, Inc., Oppenheimer Real Asset Management, Inc. and Oppenheimer Partnership Holdings, Inc. (since March 1999), OFI Private Investments, Inc. (since March 2000), OppenheimerFunds International Ltd. and OppenheimerFunds plc (since May 2000), OFI Institutional Asset Management, Inc. (since November 2000), and OppenheimerFunds Legacy Program (charitable trust program established by the Manager) (since June 2003); Treasurer and Chief Financial |
12 | OPPENHEIMER VALUE FUND/VA
| | | |
| | | |
Brian W. Wixted,
Continued | | Officer of OFI Trust Company (trust company subsidiary of the Manager) (since May 2000); Assistant Treasurer of the following: OAC (since March 1999), Centennial Asset Management Corporation (March 1999-October 2003) and OppenheimerFunds Legacy Program (April 2000-June 2003). An officer of 105 portfolios in the OppenheimerFunds complex. |
| | | |
Robert G. Zack,
Vice President and Secretary (since 2003)
Age: 60 | | Executive Vice President (since January 2004) and General Counsel (since March 2002) of the Manager; General Counsel and Director of the Distributor (since December 2001); General Counsel of Centennial Asset Management Corporation (since December 2001); Senior Vice President and General Counsel of HarbourView Asset Management Corporation (since December 2001); Secretary and General Counsel of OAC (since November 2001); Assistant Secretary (since September 1997) and Director (since November 2001) of OppenheimerFunds International Ltd. and OppenheimerFunds plc; Vice President and Director of Oppenheimer Partnership Holdings, Inc. (since December 2002); Director of Oppenheimer Real Asset Management, Inc. (since November 2001); Senior Vice President, General Counsel and Director of Shareholder Financial Services, Inc. and Shareholder Services, Inc. (since December 2001); Senior Vice President, General Counsel and Director of OFI Private Investments, Inc. and OFI Trust Company (since November 2001); Vice President of OppenheimerFunds Legacy Program (since June 2003); Senior Vice President and General Counsel of OFI Institutional Asset Management, Inc. (since November 2001); Director of OppenheimerFunds International Distributor Limited (since December 2003); Senior Vice President (May 1985-December 2003). An officer of 105 portfolios in the OppenheimerFunds complex. |
The Fund’s Statement of Additional Information contains additional information about the Fund’s Trustees and Officers and is available without charge, upon request, by calling 1.800.981.2871.
13 | OPPENHEIMER VALUE FUND/VA
Item 2. Code of Ethics.
The registrant has adopted a code of ethics that applies to the registrant’s principal executive officer, principal financial officer, principal accounting officer or controller or persons performing similar functions.
Item 3. Audit Committee Financial Expert.
The Board of Trustees of the registrant has determined that George C. Bowen, the Chairman of the Board’s Audit Committee, and Edward L. Cameron, a member of the Board’s Audit Committee, are audit committee financial experts and that Messrs. Bowen and Cameron are “independent” for purposes of this Item 3.
Item 4. Principal Accountant Fees and Services.
(a) Audit Fees
The principal accountant for the audit of the registrant’s annual financial statements billed $329,125 in fiscal 2008 and $317,675 in fiscal 2007.
(b) Audit-Related Fees
The principal accountant for the audit of the registrant’s annual financial statements billed no such fees during the last two fiscal years.
The principal accountant for the audit of the registrant’s annual financial statements billed $3,640 in fiscal 2008 and no such fees in fiscal 2007 to the registrant’s investment adviser or any entity controlling, controlled by, or under common control with the adviser that provides ongoing services to the registrant.
(c) Tax Fees
The principal accountant for the audit of the registrant’s annual financial statements billed no such fees to the registrant during the last two fiscal years.
The principal accountant for the audit of the registrant’s annual financial statements billed no such fees to the registrant during the last two fiscal years to the registrant’s investment adviser or any entity controlling, controlled by, or under common control with the adviser that provides ongoing services to the registrant.
(d) All Other Fees
The principal accountant for the audit of the registrant’s annual financial statements billed $286 in fiscal 2008 and $12,075 in fiscal 2007.
The principal accountant for the audit of the registrant’s annual financial statements billed no such fees fiscal 2008 and $32,732 in fiscal 2007 to the registrant’s investment adviser or any entity controlling, controlled by, or under common control with the adviser that provides ongoing services to the registrant.
Such fees would include the cost to the principal accountant of attending audit committee meetings, compliance review and professional services for 22c-2 program.
| (e) | | (1) During its regularly scheduled periodic meetings, the registrant’s audit committee will pre-approve all audit, audit-related, tax and other services to be provided by the principal accountants of the registrant. |
| | | The audit committee has delegated pre-approval authority to its Chairman for any subsequent new engagements that arise between regularly scheduled meeting dates provided that any fees such pre-approved are presented to the audit committee at its next regularly scheduled meeting. |
| |
| | | Under applicable laws, pre-approval of non-audit services maybe waived provided that: 1) the aggregate amount of all such services provided constitutes no more than five percent of the total amount of fees paid by the registrant to it principal accountant during the fiscal year in which services are provided 2) such services were not recognized by the registrant at the time of engagement as non-audit services and 3) such services are promptly brought to the attention of the audit committee of the registrant and approved prior to the completion of the audit. |
| |
| | | (2) 100% |
| |
| (f) | | Not applicable as less than 50%. |
| |
| (g) | | The principal accountant for the audit of the registrant’s annual financial statements billed $3,926 in fiscal 2008 and $44,807 in fiscal 2007 to the registrant and the registrant’s investment adviser or any entity controlling, controlled by, or under common control with the adviser that provides ongoing services to the registrant related to non-audit fees. Those billings did not include any prohibited non-audit services as defined by the Securities Exchange Act of 1934. |
| |
| (h) | | The registrant’s audit committee of the board of trustees has considered whether the provision of non-audit services that were rendered to the registrant’s investment adviser, and any entity controlling, controlled by, or under common control with the investment adviser that provides ongoing services to the registrant that were not pre-approved pursuant to paragraph (c)(7)(ii) of Rule 2-01 of Regulation S-X is compatible with maintaining the principal accountant’s independence. No such services were rendered. |
Item 5. Audit Committee of Listed Registrants
Not applicable.
Item 6. Schedule of Investments.
a) Not applicable.
b) Not applicable.
Item 7. Disclosure of Proxy Voting Policies and Procedures for Closed-End Management Investment Companies.
Not applicable.
Item 8. Portfolio Managers of Closed-End Management Investment Companies.
Not applicable.
Item 9. Purchases of Equity Securities by Closed-End Management Investment Company and Affiliated Purchasers.
Not applicable.
Item 10. Submission of Matters to a Vote of Security Holders.
The Fund’s Governance Committee Provisions with Respect to Nominations of Directors/Trustees to the Respective Boards
| 1. | | The Fund’s Governance Committee (the “Committee”) will evaluate potential Board candidates to assess their qualifications. The Committee shall have the authority, upon approval of the Board, to retain an executive search firm to assist in this effort. The Committee may consider recommendations by business and personal contacts of current Board members and by executive search firms which the Committee may engage from time to time and may also consider shareholder recommendations. The Committee may consider the advice and recommendation of the Funds’ investment manager and its affiliates in making the selection. |
| |
| 2. | | The Committee shall screen candidates for Board membership. The Committee has not established specific qualifications that it believes must be met by a trustee nominee. In evaluating trustee nominees, the Committee considers, among other things, an individual’s background, skills, and experience; whether the individual is an “interested person” as defined in the Investment Company Act of 1940; and whether the individual would be deemed an “audit committee financial expert” within the meaning of applicable SEC rules. The Committee also considers whether the individual’s background, skills, and experience will complement the background, skills, and experience of other nominees and will contribute to the Board. There are no differences in the manner in which the Committee evaluates nominees for trustees based on whether the nominee is recommended by a shareholder. |
| |
| 3. | | The Committee may consider nominations from shareholders for the Board at such times as the Committee meets to consider new nominees for the Board. The Committee shall have the sole discretion to determine the candidates to present to the Board and, in such cases where required, to shareholders. Recommendations for trustee nominees should, at a minimum, be accompanied by the following: |
| | • | | the name, address, and business, educational, and/or other pertinent background of the person being recommended; |
| |
| | • | | a statement concerning whether the person is an “interested person” as defined in the Investment Company Act of 1940; |
| |
| | • | | any other information that the Funds would be required to include in a proxy statement concerning the person if he or she was nominated; and |
| |
| | • | | the name and address of the person submitting the recommendation and, if that person is a shareholder, the period for which that person held Fund shares. |
| | | The recommendation also can include any additional information which the person submitting it believes would assist the Committee in evaluating the recommendation. |
| |
| 4. | | Shareholders should note that a person who owns securities issued by Massachusetts Mutual Life Insurance Company (the parent company of the Funds’ investment adviser) would be deemed an “interested person” under the Investment Company Act of 1940. In addition, certain other relationships with Massachusetts Mutual Life Insurance Company or its subsidiaries, with registered broker-dealers, or with the Funds’ outside legal counsel may cause a person to be deemed an “interested person.” |
| |
| 5. | | Before the Committee decides to nominate an individual as a trustee, Committee members and other directors customarily interview the individual in person. In addition, the individual customarily is asked to complete a detailed questionnaire which is designed to elicit information which must be disclosed under SEC and stock exchange rules and to determine whether the individual is subject to any statutory disqualification from serving as a trustee of a registered investment company. |
Item 11. Controls and Procedures.
Based on their evaluation of the registrant’s disclosure controls and procedures (as defined in rule 30a-3(c) under the Investment Company Act of 1940 (17 CFR 270.30a-3(c)) as of 12/31/2008, the registrant’s principal executive officer and principal financial officer found the registrant’s disclosure controls and procedures to provide reasonable assurances that information required to be disclosed by the registrant in the reports that it files under the Securities Exchange Act of 1934 (a) is accumulated and communicated to registrant’s management, including its principal executive officer and principal financial officer, to allow timely decisions regarding required disclosure, and (b) is recorded, processed, summarized and reported, within the time periods specified in the rules and forms adopted by the U.S. Securities and Exchange Commission.
There have been no changes in the registrant’s internal controls over financial reporting that occurred during the registrant’s second fiscal quarter of the period covered by this report that have materially affected, or are reasonably likely to materially affect, the registrant’s internal control over financial reporting.
Item 12. Exhibits.
| (a) | | (1) Exhibit attached hereto. |
| |
| | | (2) Exhibits attached hereto. |
| |
| | | (3) Not applicable. |
| |
| (b) | | Exhibit attached hereto. |
SIGNATURES
Pursuant to the requirements of the Securities Exchange Act of 1934 and the Investment Company Act of 1940, the registrant has duly caused this report to be signed on its behalf by the undersigned, thereunto duly authorized.
Oppenheimer Variable Account Funds
| | | | | |
| By: | | /s/ John V. Murphy John V. Murphy | | |
| | | Principal Executive Officer | | |
| |
| Date: | | 02/11/2009 | | |
Pursuant to the requirements of the Securities Exchange Act of 1934 and the Investment Company Act of 1940, this report has been signed below by the following persons on behalf of the registrant and in the capacities and on the dates indicated.
| | | | | |
| By: | | /s/ John V. Murphy John V. Murphy | | |
| | | Principal Executive Officer | | |
| |
| Date: | | 02/11/2009 | | |
| | | | | |
| By: | | /s/ Brian W. Wixted Brian W. Wixted | | |
| | | Principal Financial Officer | | |
| |
| Date: | | 02/11/2009 | | |