UNITED STATES
SECURITIES AND EXCHANGE COMMISSION
Washington, D.C. 20549
FORM 20-F
[ ] REGISTRATION STATEMENT PURSUANT TO SECTION 12(b) OR (g) OF THE SECURITIES EXCHANGE ACT OF 1934 OR
[X] ANNUAL REPORT PURSUANT TO SECTION 13 OR 15(d) OF THE SECURITIES EXCHANGE ACT OF 1934
For the fiscal year endedJuly 31, 2011
OR
[ ] TRANSITION REPORT PURSUANT TO SECTION 13 OR 15(d) OF THE SECURITIES EXCHANGE ACT OF 1934 OR
[ ] SHELL COMPANY REPORT PURSUANT TO SECTION 13 OR 15(d) OF THE SECURITIES EXCHANGE ACT OF 1934
Date of event requiring this shell company report……………
Commission File Number0-14884

SAND TECHNOLOGY INC.
(Exact name of registrant as specified in its charter)
Canada
(Jurisdiction of incorporation or organization)
4115 Sherbrooke St. West, Suite 500
Westmount, Quebec, Canada H3Z 1B1
(Address of principal executive offices)
Mr. Tony J. Giuliano
(514) 939-3477
tony.giuliano@sand.com
4115 Sherbrooke St. West, Suite 500
Westmount, Quebec, Canada H3Z 1B1
(Name, Telephone, Email and/or Facsimile number and Address of Company Contact Person)
Securities registered or to be registered pursuant to Section 12(b) of the Act
| Title of each class | Name of each exchange on which registered |
| None | N/A |
Securities registered pursuant to Section 12(g) of the Act.
Class A Common Shares
Securities for which there is a reporting obligation pursuant to Section 15(d) of the Act.
None
Indicate the number of outstanding shares of each of the issuer’s classes of capital or common stock as of the close of the period covered by the annual report.
19,116,636 Class “A” Common Shares
Indicate by check mark if the registrant is a well-known seasoned issuer, as defined in Rule 405 of the Securities Act
[ ] Yes [X] No
If this report is an annual or transition report, indicate by check mark if the registrant is not required to file reports pursuant to Section 13 or 15 (d) of the Securities Exchange Act of 1934.
[ ] Yes [X] No
Indicate by check mark whether the registrant (1) has filed all reports required to be filed by Section 13 or 15(d) of the Securities Exchange Act of 1934 during the preceding 12 months (or for such shorter period that the registrant was required to file such reports), and (2) has been subject to such filing requirements for the past 90 days.
[X] Yes [ ] No
Indicate by check make whether the registration has submitted electronically and posted on its corporate Web site, if any, every Interactive Data File required to be submitted and posted pursuant to Rule 405 of Regulation S-T (§232.405 of this chapter)during the preceding 12 months (or for such shorter period that registrant was required to submit and pos such files):
[ ] Yes [X] No
Indicate by check mark whether the registrant is a large accelerated filer, an accelerated filer, or a non-accelerated filer. See definition of "accelerated filer and large accelerated filer" in Rule 12b-2 of the Exchange Act. (Check one):
| Large accelerated filer [ ] | Accelerated filer [ ] | Non-accelerated filer [X] |
Indicate by check mark which basis of accounting the registrant has used to prepare the financial statements included in this filing:
| U.S. GAAP [ ] | International Financial Reporting Standards as issued | Other [X] |
| | By the International Accounting Standards Board [ ] | |
Indicate by check mark which financial statement item the registrant has elected to follow.
Item 17 [ ] Item 18 [X]
If this is an annual report, indicate by check mark whether the registrant is a shell company (as defined in Rule 12b-2 of the Exchange Act).
[ ] Yes [X] No
- ii -
(APPLICABLE ONLY TO ISSUERS INVOLVED IN BANKRUPTCY PROCEEDINGS DURING THE PAST FIVE YEARS)
Indicate by check mark whether the registrant has filed all documents and reports required to be filed by Sections 12, 13 or 15(d) of theSecurities Exchange Act of 1934 subsequent to the distribution of securities under a plan confirmed by a court.
[ ] Yes [X] No
- iii -
SAND TECHNOLOGY INC.
TABLE OF CONTENTS
- i -
- ii -
In this Annual Report on Form 20-F (the "Report"), unless we indicate otherwise or the context otherwise requires, “we”, “our”, “us”, “SAND” and the “Company” refer to SAND Technology Inc. and its consolidated subsidiaries and “shares” and “common shares” refer to our Class A Common Shares. References in this Report to a fiscal year means one of our fiscal years ending July 31.
Except where otherwise indicated, all dollar amounts stated in this Annual Report on Form 20-F are Canadian dollars.
ITEM 1. IDENTITY OF DIRECTORS, SENIOR MANAGEMENT AND ADVISERS
Not applicable.
ITEM 2. OFFER STATISTICS AND EXPECTED TIMETABLE
Not applicable.
ITEM 3. KEY INFORMATION
A. Selected Financial Data
The following table sets forth selected consolidated financial information with respect to SAND for the five (5) years ended July 31, 2011 and is extracted in part from the consolidated financial statements that have been audited by our auditors, Raymond Chabot Grant Thornton LLP for the fiscal years ended July 31, 2011 (included herein at Item 18), July 31, 2010, July 31, 2009, July 31, 2008 and July 31, 2007. The information set forth below is not necessarily indicative of the results of future operations and should be read in conjunction with and is qualified in its entirety by the consolidated financial statements included in Item 18.
This selected financial data has been prepared in accordance with Canadian generally accepted accounting principles ("Canadian GAAP") which differs in certain respects from generally accepted accounting principles in the United States ("U.S. GAAP"). A discussion of the differences between Canadian GAAP and U.S. GAAP is contained in Note 19 to the audited Consolidated Financial Statements included in Item 18. Any monetary figure included in this Report is presented consistent with Canadian GAAP except where otherwise indicated.
- 3 -
The selected financial data set forth below is stated in thousands of Canadian dollars (except per share amounts).
FIVE YEAR COMPARATIVE SUMMARY OF SELECTED FINANCIAL DATA
(expressed in thousands of Canadian dollars unless otherwise indicated)
(In accordance with Canadian GAAP) |
| Years ended July 31 | 2011 | 2010 | 2009 | 2008 | 2007 |
Operating results |
|
|
|
|
|
| Revenue | $6,872 | $6,562 | $7,049 | $6,998 | 6,729 |
| Cost of Sales and Product Support | ($1,235) | ($1,195) | ($1,396) | ($1,470) | ($1,667) |
| Research and Development Costs | ($1,866) | ($1,458) | ($1,960) | ($1,972) | ($2,215) |
| Selling, General and Administrative Expenses | ($5,400) | ($4,225) | ($4,372) | ($4,403) | ($5,079) |
| Amortization | ($41) | ($53) | ($64) | ($187) | ($201) |
| Loss from Operations | ($1,670) | ($369) | ($743) | ($1,034) | ($2,433) |
| | | | | | |
| Other Income (Expense) | ($442) | ($377) | ($449) | ($238) | ($93) |
| | | | | | |
| Net Income (Loss) | ($2,112) | ($746) | ($1,192) | ($1,272) | ($2,526) |
Financial position |
|
|
|
|
|
| Working Capital (Deficiency) | ($1,248) | ($983) | ($1,910) | ($1,055) | ($1,096) |
| Total Assets | $2,215 | $2,117 | $2,740 | $2,803 | $2,357 |
| Total Liabilities | $5,110 | $4,568 | $5,113 | $4,063 | $3,239 |
| Capital Stock | $39,707 | $38,976 | $38,530 | $38,530 | $38,530 |
| Shareholders' Equity (Deficit) | ($2,895) | ($2,451) | ($2,373) | ($1,260) | ($882) |
| Basic and Diluted Weighted Average Number of Shares Outstanding | 17,009,173 | 15,467,702 | 14,318,189 | 14,318,189 | 13,094,288 |
Per share data (in dollars per share) |
|
|
|
|
|
| Net Loss Per Share (Basic and dilutive) | ($0.12) | ($0.05) | ($0.08) | ($0.09) | ($0.19) |
| Loss from Operations Per Share (Basic and dilutive) | ($0.09) | ($0.02) | ($0.05) | ($0.07) | ($0.19) |
- 4 -
The same data, presented in conformity with U.S. GAAP, is shown in the following table:
FIVE YEAR COMPARATIVE SUMMARY OF SELECTED FINANCIAL DATA
(expressed in thousands of Canadian dollars unless otherwise indicated)
(In accordance with U.S. GAAP) |
| Years ended July 31 | 2011 | 2010 | 2009 | 2008 | 2007 |
Operating results |
|
|
|
|
|
| Revenue | $6,872 | $6,562 | $7,049 | $6,998 | 6,729 |
| Cost of Sales and Product Support | ($1,235) | ($1,195) | ($1,396) | ($1,470) | ($1,667) |
| Research and Development Costs | ($1,866) | ($1,458) | ($1,960) | ($1,972) | ($2,215) |
| Selling, General and Administrative Expenses | ($5,871) | ($3,561) | ($3,668) | ($4,731) | ($5,477) |
| Amortization | ($41) | ($53) | ($64) | ($187) | ($201) |
| Loss from Operations | ($2,141) | $295 | ($39) | ($1,362) | ($2,831) |
| | | | | | |
| Other Income (Expense) | ($397) | ($334) | ($407) | ($196) | ($93) |
| | | | | | |
| Net Income (Loss) | ($2,538) | ($39) | ($446) | ($1,558) | ($2,924) |
| | | | | | |
| Financial position | | | | | |
| Working Capital (Deficiency) | ($2,191) | ($1,955) | ($3,280) | ($2,558) | ($1,408) |
| Total Assets | $2,215 | $2,117 | $2,740 | $2,803 | $2,357 |
| Total Liabilities | $5,770 | $5,277 | $6,264 | $5,387 | $3,550 |
| Capital Stock | $39,707 | $38,976 | $38,530 | 38,530 | 38,530 |
| Shareholders' Equity (Deficit) | ($3,556) | ($2,314) | ($2,944) | ($2,584) | ($1,193) |
| Basic and Diluted Weighted Average | 17,009,173 | 15,467,702 | 14,318,189 | 14,318,189 | 13,094,288 |
| Number of Shares Outstanding | | | | | |
Per share data (in dollars per share) |
|
|
|
|
|
| Net Loss Per Share (Basic and dilutive) | ($0.12) | $0.00 | ($0.03) | ($0.11) | ($0.22) |
| Income (Loss) from Operations Per Share (Basic) | ($0.09) | $0.02 | ($0.00) | ($0.10) | ($0.22) |
Summary of Differences between Canadian and U.S. GAAP
A reconciliation of the differences between generally accepted accounting principles in the United States and Canada is presented in Note 19 of the audited Consolidated Financial Statements included in Item 18.
Issued and Outstanding Class “A” Common Shares
As of October 21, 2011, the Company had 19,116,636 Class “A” Common Shares issued and outstanding. Each common share entitles its holder to one vote.
Authorized Class “B” Common Shares
The Company also has authorized Class “B”, Series A Common Shares of which none are issued and outstanding as of October 21, 2011.
- 5 -
Disclosure of U.S. Exchange Rates against Canadian Financial Reporting Currency
Foreign exchange rate U.S.
to Canadian Dollar: | Fiscal
2011 | Fiscal
2010 | Fiscal
2009 | Fiscal
2008 | Fiscal
2007 |
| Average | 0.9943 | 1.0491 | 1.1754 | 1.0352 | 1.1258 |
| High | 1.0535 | 1.1072 | 1.2633 | 1.0755 | 1.1853 |
| Low | 0.9428 | 0.9988 | 1.0547 | 0.7695 | 1.0372 |
| Month Ended | High | Low | Close |
| July 31, 2011 | 0.9690 | 0.9428 | 0.9555 |
| June 30, 2011 | 0.9870 | 0.9645 | 0.9645 |
| May 31, 2011 | 0.9787 | 0.9508 | 0.9686 |
| April 30, 2011 | 0.9675 | 0.9464 | 0.9464 |
| March 31, 2011 | 0.9918 | 0.9687 | 0.9696 |
| February 28, 2011 | 0.9958 | 0.9714 | 0.9714 |
| January 31, 2011 | 1.0015 | 0.9869 | 1.0015 |
| December 31, 2010 | 1.0175 | 0.9946 | 0.9946 |
| November 30, 2010 | 1.0266 | 1.0000 | 1.0266 |
| October 31, 2010 | 1.0319 | 1.0048 | 1.0202 |
| September 30, 2010 | 1.0535 | 1.0256 | 1.0290 |
| August 31, 2010 | 1.0166 | 1.0665 | 1.0665 |
| Month | Monthly Average |
| July 2011 | 0.9558 |
| June 2011 | 0.9773 |
| May 2011 | 0.9678 |
| April 2011 | 0.9578 |
| March 2011 | 0.9766 |
| February 2011 | 0.9875 |
| January 2011 | 0.9942 |
| December 2010 | 1.0080 |
| November 2010 | 1.0132 |
| October 2010 | 1.0185 |
| September 2010 | 1.0336 |
| August 2010 | 1.0418 |
On October 21, 2011, the noon rate for U.S.$1.00 was CDN.$1.0091 and the closing rate was CDN.$1.0087.
- 6 -
B. Capitalization and Indebtedness
Not applicable.
C. Reasons for the Offer and Use of Proceeds
Not applicable.
D. Risk factors
Our business and an investment in our securities are subject to a variety of risks. The following risk factors describe the most significant events, facts or circumstances that could have a material adverse effect upon our business, financial condition, results of operations, ability to implement our business plan and the market price for our securities. Many of these events are outside of our control. These risks and uncertainties are not the only ones we face. Additional risks not presently known or currently considered insignificant may also have a material adverse effect upon our business, financial condition, results of operations, ability to implement our business plan and the market price for our securities.
RISKS ASSOCIATED WITH OUR BUSINESS:
We have a history of losses.
We have not experienced a profitable year since fiscal year 2003, when we had a gain from the sale of a subsidiary. On July 31, 2011 we had a working capital deficiency of $1,248,354 and an accumulated deficit of $45,039,165. Our funds on hand are currently sufficient to sustain operations for the next year as a result of the sale of a product line described in Item 8.B. Significant Changes. In order to become profitable, we will need to generate significant additional revenues to offset our cost of revenues, sales and marketing, research and development and selling, general and administrative expenses. We may not achieve or sustain our revenue or profit objectives and our losses may continue or increase in the future in which case you might lose your entire investment. If we are not able to fund our operations through product sales in the immediate future, we will have to cease operations.
We may not be able to obtain additional financing when needed or on acceptable terms.
There is no assurance that additional financing, when required, will be available or, if it is, whether it will be available on acceptable terms. Our inability to obtain additional financing when required, or the terms on which it may be available, could have a material adverse effect on our business and require us to suspend or cease our operations. If we are required to cease our operations, you could lose your entire investment.
We have incurred substantial debt which could affect our ability to obtain additional financing and may increase our vulnerability to economic and/or business downturns.
On April 18, 2008, the Company issued secured convertible debentures ("Convertible Debentures") on a private placement and received gross proceeds of $1,009,819 (U.S.$1,002,600) representing a total of 1,114 units. Each unit consists of one 8% Convertible Debenture due December 31, 2017, having a nominal value of U.S.$900, redeemable at the option of the Company if the bid price of the common share has been above U.S.$1.50 for 60 consecutive trading days, and convertible at the option of the holder into class "A" common shares at U.S.$0.45 per share, and 1,000 share purchase warrants of the Company. Each warrant entitles the holder to purchase one additional common share (warrant share) of the Company at a price of U.S.$0.70 per warrant share at any time until the earlier of the close of business day which is either thirty six
- 7 -
(36) months from April 18, 2008 or the bid price of the stock has been above U.S.$1.50 for sixty (60) consecutive trading days. Interest is calculated at the rate of 8% per annum, payable in common shares at a rate of U.S.$0.45 per share. Before the warrants expired on April 18, 2011, certain holders exercised 613,000 warrants and 501,000 warrants expired. The interest is due on each conversion date (date when the principal amount is being converted) subsequent to January 1, 2009 or on the maturity date. The financing is secured by a first rank hypothec on all of the Company’s property and assets, movable and immovable, corporeal and incorporeal, present and future, for the principal accrued interest amounts. The proceeds from the private placement were used for marketing and advertising and for expansion of the business.
During fiscal year 2009, the Company formalized the conditions pertaining to a loan obtained from a significant shareholder. The loan originated from amounts owed by the Company to the shareholder by virtue of his previous employment contracts as President and Chief Executive Officer. The significant shareholder ceased to be President and Chief Executive Officer on October 31, 2009. The total amount owing under the loan agreement at October 31, 2009 was $1,466,677. Under the terms of the loan agreement, the loan is repayable in three (3) principal annual instalments of $488,892 over 3 years on January 1, 2011, 2012 and 2013. The loan bears interest at 15% that is payable semi-annually on January 1 and June 30 of each year. The amount may be prepaid at any time by the Company without penalty. In the event of default to pay an amount when due, the significant shareholder shall have the right to convert all outstanding amounts owing to him hereunder into common shares of the Company based on the average closing price of the shares on the OTC Bulletin Board for the month immediately preceding the month in which such right is exercised. In addition and also upon default, the significant shareholder shall have the right to require the Company to purchase all common shares in the capital stock of the Company owned directly or indirectly by the significant shareholder at a purchase price per share equal to the greater of:
| | i) | the average closing price of the shares on the OTC Bulletin Board over the previous 30-day period plus 15%, or |
| | | |
| | ii) | the book value of the shares as determined by the auditors of the Company. |
As at July 31, 2011, an amount of $1,685,411, including accrued interest of $481,751, was outstanding under the loan agreement.
As at July 31, 2011, the Company was in default as it did not make its January 1, 2011 installment. However, a Standstill Agreement was signed between the Company and the significant shareholder, effective February 1, 2011, and the default was cured subsequent to the year end as the Company paid the significant shareholder the amounts due.
As a result, we are subject to the risks associated with substantial indebtedness, including:
| - | we are required to use a portion of our cash flow to pay debt service costs; |
| | |
| - | it may be more difficult and expensive for us to obtain additional funds through financing, if available at all; |
| | |
| - | we are more vulnerable to economic downturns and fluctuations in interest rates, less able to withstand competitive pressures and less flexible in reacting to changes in our industry and general economic conditions; and |
| | |
| - | if we default under any of our existing indebtedness or if our creditors demand payment of a portion or all of our indebtedness, we may not have sufficient funds to make such payments. |
- 8 -
If we default under our Convertible Debentures, we may have to forfeit our rights to our assets.
We have pledged all of our assets, including the assets of our subsidiaries, as security to holders of our Convertible Debentures. A default under our Convertible Debentures, if not waived or cured, would permit the holders of our Convertible Debentures to foreclose on the collateral and we could lose all our rights in the collateral, which would have a materially adverse effect on our business. As a result, we could have to suspend or cease our operations and you could lose your entire investment.
We may not be able to develop or manage our internal growth.
If we are successful in growing our existing businesses, such growth may strain our management, human resources and information systems. To manage our growth successfully, we will have to add managers and employees and update our operating, financial and other systems, procedures and controls.
We are highly dependent on our executive management and other key employees.
We rely heavily on our executive management and key employees for providing services and for continued business development. We have employment agreements which contain non-competition and non-solicitation provisions with certain key executive managers and other key employees. Our business could be materially adversely affected if a number of our executive managers and other key employees were to leave us and if we were unable to enforce the non-competition and non-solicitation agreements or to attract and retain qualified replacements.
If we cannot deliver the features and functionality our customers demand, we will be unable to attract customers, and that will result in a loss of income and eventually a termination of our operations.
As a provider of business intelligence management information technology, our future success depends largely upon our ability to determine the features and functionality our customers demand and to design and implement products that meet their needs in a cost efficient manner. Although we have often been a leader in introducing new products and technologies, maintaining that leadership while responding to downward pressures on price is an ongoing challenge. There is no assurance that we will be able to successfully determine customer requirements or that our current or future products and services will adequately satisfy customer demands. If we cannot meet our customers' demands, we will not generate revenues from this business and we may have to cease or suspend key operations.
Our business depends on the protection of our intellectual property and proprietary information.
We rely on a combination of trade secrets, confidentiality procedures, contractual provisions and patent laws to protect our proprietary rights in our products and technology. These measures may not be adequate to protect our trade secrets and proprietary technology. As a result, unauthorized third parties may copy or otherwise obtain and use our products or technology. To enforce and defend our intellectual property rights and our proprietary rights, we may have to engage in litigation, either domestically or in other countries, and we could face substantial costs and diversion of resources, including management’s attention, regardless of the outcome of that litigation. Our attempts to enforce our intellectual property rights may not be successful, may result in royalties that are less than the cost of such enforcement efforts or may result in the loss of the intellectual property altogether. Furthermore, we may not have adequate funds available to prosecute actions to protect or defend our proprietary rights, in which case those using our proprietary rights may continue to do so in the future. Even if we succeeded in protecting our intellectual property, others may independently develop similar technologies or products that do not infringe on our intellectual property.
- 9 -
Third parties may claim that our current or future products or services infringe their proprietary rights or assert other claims against us.
Any claims filed against us alleging that we infringe third-party proprietary rights could result in significant expenses or restrictions on our ability to provide our products and services. As the number of entrants into our market increases, the possibility of an intellectual property or other claim against us grows. Any intellectual property or other claim, with or without merit, would be time-consuming and expensive to litigate or settle and could divert management’s attention from focusing on our core business. As a result of such a dispute, we may have to pay damages, incur substantial legal fees, develop costly non-infringing technology, if possible, or enter into license agreements, which may not be available on terms acceptable to us, if at all. As a result, our business and operating results could be materially adversely affected. No such claims have been filed against us at this time.
Competitive conditions could materially adversely affect our businesses.
The markets in which we do, and intend to do business are highly competitive. Our ability to execute our business strategy depends, in part, upon our ability to develop and commercialize efficient and effective products based on our technologies. We compete against established companies as well as numerous independently owned small businesses. Many of our competitors are capable of developing products based on similar technology, have developed and are capable of continuing to develop products based on other technologies, which are or may be competitive with our products and technologies. There are many competitors in all market segments in which we operate, some of which have significantly greater resources or capital than us, or have better reputations among potential customers in the delivery of particular services or products. Our competitors may succeed in developing competing products and technologies that are more effective than our products and technologies, which may render our existing and new products or technology uncompetitive, uneconomical or obsolete.
We may be exposed to liability claims.
We have general liability insurance coverage for $5,000,000. However, if a judgment is rendered against us in excess of the amount of our coverage, we may have to cease operations. If we are sued for any reason, we will have to rely on our liability insurance to pay any judgment rendered against us. Although we maintain a general liability insurance of $5,000,000, there is no assurance that:
- our insurance will provide adequate coverage against potential liabilities if a product or a service we provide causes harm or fails to perform as promised;
- adequate liability insurance will continue to be available in the future; or
- our insurance can be maintained on acceptable terms.
The obligation to pay any liability claim in excess of whatever insurance we are able to obtain would increase our expenses and could greatly reduce our assets or cause us to cease operations. If a judgment is rendered against us for any amount over our coverage of $5,000,000, we may have to cease operations.
Fluctuations in the value of foreign currencies could result in decreased revenues and increased operating expenses.
While our functional currency is the Canadian dollar and we report our results in Canadian dollars, we have revenues and operating expenses outside of Canada. Fluctuations in the value of the Canadian dollar
- 10 -
are difficult to predict and can cause us to incur currency exchange costs. Although, we cannot predict the effect of exchange rate fluctuations on our future operating results, any material changes could cause our operating results to be materially adversely affected.
The sales cycle for our products is lengthy.
The purchase of our products often requires significant, executive-level investment and system design decisions by our customers. Sales may take a long time to conclude because we must provide a significant level of education about the use and benefits of our products. Accordingly, the sales cycle associated with the purchase of our products is typically between six to twelve months in length. During this period, a potential sale may be subject to a number of significant risks over which we have little or no control, including customers' budgeting constraints and internal acceptance review procedures including, in some instances, approval by the board of directors of the customer.
Our existing shareholders can exercise effective control over us.
Our major shareholders own approximately 33.5% of our Class A Common Shares. Arthur G. Ritchie our former Chairman of the Board beneficially owns approximately 18.8% of SAND’s Class A Common Shares. Thomas O’Donnell, Chief Executive Officer of SAND and a director of SAND, beneficially owns approximately 9.2% of SAND’s Class A Common Shares. Carol Shattner, the wife of the late Jerome Shattner (Jerome Shattner was the late Executive Vice President of the Company), beneficially owns 5.5% of our Class A Common Shares. These shareholders may, as a practical matter, continue to be able to control the election of a majority of the directors of SAND and the determination of many corporate actions. This concentration of ownership could also have the effect of delaying or preventing a change in control of SAND.
Our ability to issue Class “B” Shares could make it more difficult for a third party to acquire us to the detriment of holders of Class “A” Common Shares.
Our articles of incorporation provide for an unlimited number of Class “B” Shares which, if ever they are issued, may make it difficult for a third party to acquire control of us, even if a change in control would be beneficial to our shareholders. Our board has the authority to attach special rights, including voting or dividend rights, to the Class “B” Shares. However, the voting rights of a Class “B” Share cannot exceed those of a Class “A” Common Share. Class “B” shareholders who possess these rights could make it more difficult for a third party to acquire our Company.
RISKS ASSOCIATED WITH OUR COMMON SHARES:
The market for our common shares is limited.
The market for our common shares is limited and you may not be able to resell your common shares. There is currently only a limited trading market for our common stock. Our common shares trade on the OTC Bulletin Board operated by the National Association of Securities Dealers, Inc. under the symbol "SNDTF". Trading volume of OTC Bulletin Board stocks has been historically lower and more volatile than stocks traded on an exchange. As a result, you may not be able to resell your securities in open market transactions.
- 11 -
There are a large number of outstanding stock options and warrants issued that if exercised may be available for future sale and the sale of these shares may depress the market price of our common stock.
As of October 21, 2011, 19,116,636 shares of our common stock were outstanding and 8,019,183 shares are issuable upon conversion or exercise of our outstanding Convertible Debentures, warrants and stock options. The entry of this substantial number of shares into the public market, or the mere expectation of the entry of those shares into the market could adversely affect the market price of our common shares and could impair our ability to obtain capital through securities offerings.
Our common shares are subject to penny stock rules which restricts the liquidity of your investment.
Our common shares are now and may continue to be in the future subject to the penny stock rules under the Securities Exchange Act of 1934, as amended (“Exchange Act”). These rules regulate broker/dealer practices for transactions in "penny stocks". Penny stocks are generally equity securities with a price of less than $5.00, subject to certain exceptions. The penny stock rules require broker/dealers to deliver a standardized risk disclosure document that provides information about penny stocks and the nature and level of risks in the penny stock market. The broker/dealer must also provide the customer with current bid and offer quotations for the penny stock, the compensation of the broker/dealer and its salesperson and monthly account statements showing the market value of each penny stock held in the customer's account. The bid and offer quotations and the broker/dealer and salesperson compensation information must be given to the customer orally or in writing prior to completing the transaction and must be given to the customer in writing before or with the customer's confirmation. In addition, the penny stock rules require that prior to a transaction, the broker and/or dealer must make a special written determination that the penny stock is a suitable investment for the purchaser and receive the purchaser's written agreement to the transaction. These additional penny stock disclosure requirements are burdensome, discourage investor interest, and may reduce the trading activity in the market for our common stock. As long as the common stock is subject to the penny stock rules, holders of our common stock may find it more difficult to sell their securities.
Our operating results have and may continue to vary from quarter to quarter, and as a result, we may fail to meet the expectations of our investors and analysts, which may cause our stock price to fluctuate or decline.
As a software vendor, our contract flow is sometimes unpredictable, and to the extent that we do not generate new business upon completion of existing contracts, our revenue will decline. Due to these factors, our revenue and operating results have fluctuated and may continue to fluctuate from quarter to quarter. Due to these risks, you should not rely on period-to-period comparisons of our results of operations as an indication of future performance.
Ineffective internal controls could have a material adverse effect on our business and operating results and stockholders could lose confidence in our financial reporting.
Our internal controls over financial reporting may not prevent or detect mistatements because of their inherent limitations, including the possibility of human error, the circumvention or overriding of controls, or fraud. Even effective internal controls can only provide reasonable assurance with respect to the preparation and fair presentation of financial statements. If we fail to maintain the adequacy of our
- 12 -
internal controls, including the failure to implement required new or improved controls, or if we experience difficulties in their implementation, our business and operating results could be harmed and we could fail to meet our financial reporting obligations, which could cause investors to lose confidence in our reported financial information and have a material adverse effect on our stock price.
ITEM 4. INFORMATION ON THE COMPANY
A. History and Development of the Company
SAND Technology Inc. was incorporated on December 10, 1982 under the Canada Business Corporations Act ("CBCA") and carried on business under the name Sand Technology Systems (Canada) Inc. until 1988. From 1988 until 1999, we used the name Sand Technology Systems International Inc. On January 1, 2000, we changed our name to SAND Technology Inc. Our principal place of business is located at 4115 Sherbrooke St. West, Suite 500, Westmount, Quebec, Canada H3Z 1B1 and our phone number is (514) 939-3477.
Until 1999, an important part of our business was the sale and service of mainframe peripheral products manufactured by Hitachi, Ltd. of Japan, through Hitachi Data Systems Inc. ("HDS Canada"). HDS Canada marketed a broad range of information processing solutions, including enterprise servers, storage subsystems, peripheral products and professional services. SAND was the legal and beneficial owner of 40% of the issued and outstanding shares of HDS Canada. Hitachi Data Systems Company ("HDSC") of Santa Clara, California was the legal and beneficial owner of the remaining 60%. In August 1999, SAND sold its interest in HDS Canada to HDSC and withdrew from the mainframe computer market and the peripheral hardware market.
We then fully shifted and have since maintained our focus on the design, development, marketing and support of software products, collectively known as the SAND Product Suite, that enable users to retrieve usable business information from large amounts of data and on providing specialized systems integration services in connection with those products.
Initially, SAND offered products mainly as part of a systems integration model. At the end of the 2002 fiscal year, we consolidated the systems integration portion of our business which had been growing in importance and subsequently re-branded it with the name ClarityBlue. ClarityBlue Limited (previously named Sand Technology (U.K.) Limited) ("ClarityBlue") concentrated on developing a strong competitive practice utilizing the SAND/DNA Analytics precursor product as an engine for its Customer Analytic offering, and was able to attract high profile customers particularly in the telecommunications and financial services markets in the United Kingdom. ClarityBlue was sold on July 31, 2003 to a group of investors which included members of the senior management of ClarityBlue.
We now focus our resources around intelligent information management and consultative “best practices” leveraging the latest developments in our SAND CDBMS platforms.
B. Business Overview
1)Business Description
SAND is one of the leading sources of business intelligence management information technology. SAND is involved in the design, development, marketing and support of software products and services that deliver usable business information from Big Data. The software products, collectively known as the
- 13 -
SAND Analytic Platform, are designed to provide an efficient and cost effective way for business users to make fast and easy inquiries of large data sets without the intervention of specialist information technology professionals.
Our revenues consist of license fees for software products and fees for a range of associated services, including software maintenance and support, training and system implementation consulting. Our plans to achieve profitability in the future will continue to require us to devote substantial financial resources to grow our work force, improve our infrastructure, continue the development, marketing and the distribution of our products, and generally support our expanding operations.
2)Products and Services
The SAND Analytic Platform is based on our patented tokenized columnar database engine. It is an enterprise platform technology that enables organizations to maximize the business value of corporate information by supporting better business decisions through intuitive interactive data access which allows keeping more data available for analysis. Our products permit more timely and accurate decisions across an entire organization making "business intelligence" a key component of operational excellence.
SAND Analytic Platform
SAND Analytic Platform is substantially faster than any traditional relational database and can be searched directly by business users using standard business intelligence tools. This is a breakthrough technology and has particular impact on the current information technology environment where volumes of corporate data are growing at an exponential rate.
During fiscal 2011, a focus of the R&D work was associated with enhancing in-database analytics, performance enhancements and scalability with the introduction of the Massively Parallel Processing (“MPP”) architecture. The support of the PMML (Predictive Model Markup Language) standard enables processing complex statistical and mathematical models inside the database engine. The MPP architecture enables the SAND database to scale to many TBs and still deliver great performance.
i) SAND - Converting Data into Key Decisions
The SAND Analytic Platform facilitates the use of data mining, query, reporting and other classes of online analytical applications, thereby enabling more effective management of customer relationships, supply chains and other critical business processes.
Our Analytic Platform product incorporates a number of advanced technologies. Its development has required substantial investment in research and development:
a) During fiscal 2002, important advancements were made in the ability to quickly and efficiently load even larger volumes of data into the SAND product and in its ability to support an even wider variety of applications by more efficient interfacing with industry-standard applications and data extraction tools.
b) During fiscal 2004, we made available Release 3.2 of our high-performance SAND Analytic Server. Release 3.2 augmented the proven scalability and query speed of previous versions of the Nucleus data management technology on which it is based by significantly enhancing the speed of loading and
- 14 -
updating data for analysis as well as adding further support for open industry-standard business intelligence tools through more flexible open database connectivity.
c) During fiscal 2005, we released a significant update to Version 4 incorporating many features to allow high-performance scalability for multiple users and huge amounts of data.
d) During fiscal 2008, SAND made available Release 5.1 of SAND/DNA Analytics which was designed to provide superior analytic capabilities and performance for extremely large (multi-terabyte) databases by enabling implementation of a distributed architecture. Features included support for federated databases, virtual tables, UNION operators in nested table expressions, unstructured free text searches, advanced statistical aggregate functions and triganometric math functions, snapshots, and Eastern European language and hexadecimal characters.
e) During fiscal 2009, SAND made available Release 5.2 of SAND/DNA Analytics. This new version introduced three major functionalities. A text search engine has been incorporated into the product to enable complex text analytics. A data federation layer has been integrated to the core product to enable a distributed architecture facilitating the interoperability. MOLAP functionalities have been added to the SQL language enabling more complex analytics.
During fiscal 2010, SAND introduced the support of advanced data privacy protection. The new functionality is based on internal database encryption and strict data access mechanism. That type of functionality is required by organizations that need to comply with industry standards or government regulations, like PCI standards in the retail and financial market and HIPPA regulations for the health care market. The performance of the product has been enhanced at different levels to take advantage of a new underline algorithm associated with “join” operations, extending the use of multithread and distributed processing. The SQL functionalities have been extended to introduce new mathematical functions. The manageability of the product has also been improved with the extension of the background database housekeeping task.
ii) SAND Platform - Empowering the Users
We have developed unique data storage and manipulation architecture which allows user-driven queries on large amounts of data to be performed efficiently and cost-effectively. This patented breakthrough in the storage and integration of data, and in the speed and flexibility at which data can be analyzed by business users, represents the “next step” in the drive to empower managers across an organization by providing them with the data they need when and how they need it to perform business operations more effectively at a lower cost.
During fiscal 2010, SAND introduced a new deployment architecture based on a private cloud computing. The new architecture enables high availability, active disaster recovery and on demand processing resource allocation. The new architecture also provides economies of scale and a dynamic and agile hardware deployment.
3) Key Business Segments and Uses of Our Software Solutions
Our customers in Canada, the United States and Europe use SAND’s solutions for:
a) Analytical and operational purposes, including market segmentation, CRM analytics, Web analytics, Business Performance Management and strategic planning, and
- 15 -
b) Regulatory and compliance applications, including efficient storage and retrieval of large amounts of historical data.
In particular, the SAND Analytics Platform is used to provide fast measurable business benefits in the retail, finance, healthcare, transportation, telecommunication, manufacturing, government and insurance sectors. Customers, often at the recommendation of systems integrators or platform partners, use our products in support of strategic corporate initiatives including e-business, customer relationship management, reporting, supply chain management, risk analysis and management, product trend and profitability analysis, fraud detection, emerging markets, information lifecycle management, competitive analysis and quality control. Increasingly as organizations shift the competitive landscape from operations to intelligence, these information-intensive decisions are not stand-alone, but a core part of an integrated information management infrastructure.
4) Business Locations
a) Our corporate headquarters are located in Westmount, Canada, where we also have development and sales resources. We have offices in Kenilworth, New Jersey and Pasadena, California, through our wholly-owned subsidiary Sand Technology Corporation, to provide for the development, sales, marketing and distribution of the SAND/Analytic Platform in the United States.
b) Our offices in the United Kingdom are located in Chiswick Park, near London, where we operate through our wholly-owned subsidiary Sand Technology Limited.
c) Our offices in Germany are located in Hamburg where we operate through our wholly-owned subsidiary Sand Technology Deutschland GmbH.
d) Our offices in Australia are located in Melbourne where we operate through our wholly-owned subsidiary Sand Technology Pty Ltd.
5) Key partners
We now have marketing, sales and technical arrangements in place with a number of recognized systems integration partners who have trained personnel in the marketing and deployment of our products.
6) Company Strategy
Our long term direction for our high performance analytical and intelligent information management products has always been to ensure that these products become a recognized platform for advanced analytical applications and for managing large data volumes.
SAND’s vision is “to be the dominant leader in delivering its products and best practices to customers around the world, in order to provide them with all the data they need, when and how they need it”.
We have a four-pillar strategy to achieve SAND’s vision.It focuses on:
| | i. | Implementing a best practices and service offering approach to delivering solutions. |
| | | |
| | ii. | Becoming the preferred partner of choice with systems integrators and application vendors delivering the solutions. |
- 16 -
| | iii. | Implementing a TEAM SAND approach to delivering the solutions worldwide. |
| | | |
| | iv. | Implementing a continuous improvement approach to our internal operations. |
7) Competition
We compete in the highly competitive computer software industry. The market in which we operate is still developing and is intensively competitive, highly fragmented, and characterized by rapidly changing technology and evolving standards. Our current and potential competitors offer a variety of solutions and generally fall within several categories:
vendors that offer data warehouse appliances which operate specifically with their proprietary platform such as IBM / Netezza, Teradata and Oracle;
other companies that may in the future announce offerings of enterprise information management solutions.
Our competitive position in our market is uncertain and changing due principally to the variety of current and potential competitors and the emerging nature of the market. We expect additional competition as other established and emerging companies enter into the intelligent information management software market and new products and technologies are introduced. Increased competition could result in price reductions, fewer customer orders, reduced gross margins, longer sales cycles, and loss of market share.
We compete primarily on the basis of product features, lower total cost of ownership, return on investment , time to market, ease of use, product performance, product quality, user scalability, open architecture, customer support and price. While we believe we presently compete favourably with respect to each of these factors, our market is evolving at a rapid pace.
8) Proprietary Rights
We currently rely primarily on a combination of copyright and trademark laws, patents, trade secrets, confidentiality procedures and contractual provisions to protect our proprietary rights. We seek to protect our software, documentation and other written materials under trade secret and copyright laws, which afford only limited protection. We currently have nine United States patents and thirty-two foreign patents.
In 1994, SAND acquired all the rights, title and interest in the Nucleus Database Engine Subsystem in addition to trademarks, trade names and other proprietary rights, their interests included patents related to bit vector compression and Boolean operation processing capability.
In October 1997, SAND acquired the Advanced Technology Group of XDB Systems, Inc. as well as the rights to the source code of Quantum Leap. Quantum Leap was designed to provide a more flexible architecture for customization and incorporation of new technology quickly and effectively using small footprint engines.
The Company has been issued nine United States patents and thirty-two foreign patents which provide protection for the SAND Analytic Server and the SAND Searchable Archive which incorporate the Nucleus database engine and other Nucleus derived products.
The Company has also filed applications in accordance with the Patent Cooperation Treaty (the "PCT"). The PCT is a multilateral treaty that was concluded in Washington in 1970 and entered into force in 1978.
- 17 -
It is administered by the International Bureau of the World Intellectual Property Organization (the "WIPO"), headquartered in Geneva, Switzerland. The PCT facilitates the obtaining of protection for inventions where such protection is sought in any or all of the PCT contracting states. It provides for the filing of one patent application (the "international application"), with effect in several contracting states, instead of filing several separate national and/or regional patent applications. At the present time, an international application may include designation for regional patents in respect of contracting states party to regional patent treaties. The PCT does not eliminate the necessity of prosecuting the international application in the national phase of processing before the national or regional offices, but it does facilitate such prosecution in several important respects by virtue of the procedures carried out first on all international applications during the international phase of processing under the PCT. The formalities check, the international search and (optionally) the international preliminary examination carried out during the international phase, as well as the automatic deferral or national processing which is entailed, give the applicant more time and better basis for deciding whether and in what countries to further pursue the application.
The Company holds registered trademarks and trademarks. SAND Technology, N-Vector, Sandonline and Nucleus are registered trademarks, and SAN DNA Analytics, SAND Analytic Server, and all related SAND − and Nucleus-based marks and designs are trademarks of the Company.
9) Seasonality
The Company's operations are not seasonal and its operations are carried out year round.
10) Impact of Governmental Regulations
Other than government regulations of general application, no government body has specific authority to regulate the business of the Company.
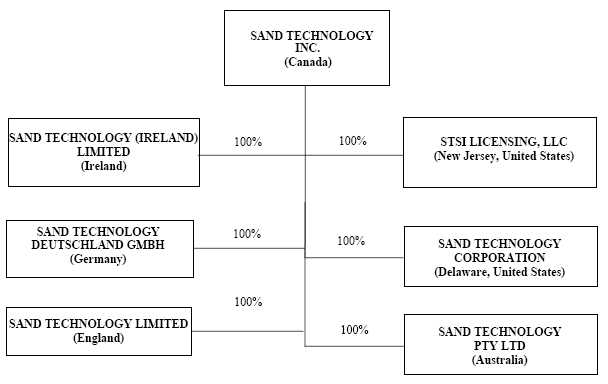
C. Organizational Structure
SAND has six wholly-owned subsidiaries: (i) Sand Technology (Ireland) Limited; (ii) STSI Licensing, LLC; (iii) Sand Technology Corp.; (iv) Sand Technology Deutschland GmbH; (v) Sand Technology Limited; and (vi) Sand Technology Pty Ltd.
Subsidiary
|
Jurisdiction of Incorporation
| Percentage of voting
securities held
|
| Sand Technology Corp. | Delaware | 100% |
| STSI Licensing, LLC | New Jersey | 100% |
| Sand Technology (Ireland) Limited | Ireland | 100% |
| Sand Technology Deutschland Gmbh | Germany | 100% |
| Sand Technology Limited | England | 100% |
| Sand Technology Pty Ltd | Australia | 100% |
- 18 -
The following chart illustrates the principal subsidiaries of SAND, together with the jurisdiction of incorporation:
D. Property, Plant and Equipment
As at July 31, 2011, we leased a total of approximately 7,668 square feet of office space in two cities across North America, 215 square feet in London, England and 2,561 square feet in Hamburg, Germany. The weighted average annualized cost per square foot of the total of 16,850 square feet occupied is $22.67 including real estate taxes and operating expenses. No lease extends beyond November 30, 2021.
ITEM 4A. UNRESOLVED STAFF COMMENTS
Not Applicable.
- 19 -
ITEM 5. OPERATING AND FINANCIAL REVIEW AND PROSPECTS
A. OPERATING RESULTS
1) Financial Condition
Total assets of $2,215,227 as of July 31, 2011 were 4.6% higher than the previous year total of $2,117,443. The increase is attributable to the Cash balance of $810,745 as of July 31, 2011 being 40.0% higher than the previous year balance of $579,270, to the Accounts Receivable balance of $541,959 as of July 31, 2011 being 26.7% lower than the previous year balance of $739,144 ,to the Research and Development Tax Credits Receivable balance of $663,857 as of July 31, 2011 being 0.6% higher than the previous year balance of $660,000 , to the Prepaid Expenses balance of $117,305 as of July 31, 2011 being 57.4% higher than the previous year balance of $74,541 and to the net Capital Assets balance of $81,361 as of July 31, 2011 being 26.2% higher than the previous year balance of $64,488. Total liabilities of $5,110,058 as of July 31, 2011 were 11.9% higher than the previous year balance of $4,568,107. The increase is mainly attributable to the Accounts Payable and Accrued Liabilities balance of $776,623 as of July 31, 2011 being 21.1% lower than the previous year balance of $984,149, to the Deferred Revenues balance (short-term and long-term) of $1,875,927 as of July 31, 2011 being 51.1% higher than the previous year balance of $1,241,938, to the Due to Shareholders (short-term and long-term) balance of $1,914,837 as of July 31, 2011 being 2.2% higher than the previous year balance of $1,874,153 and to the Convertible Debentures balance of $542,671 as of July 31, 2011 being 21.1% higher than the previous year balance of $448,309.
2) Operations
Revenue – Total and Variation
The following table provides a summary of the revenue growth for fiscal years 2011, 2010, 2009 and 2008:
| | | Year ended | | | Year ended | | | Year ended | | | Year ended | |
| | | July 31, | | | July 31, | | | July 31, | | | July 31, | |
| Revenue - Total and Variation | | 2010 | | | 2010 | | | 2009 | | | 2008 | |
| Revenue | | | | | | | | | | | | |
| Revenue | $ | 6,871,671 | | $ | 6,562,411 | | $ | 7,049,237 | | $ | 6,998,472 | |
| Year-over-year variation | | 4.7% | | | -6.9% | | | 0.7% | | | 4.0% | |
Sales were negatively impacted during fiscal 2011 by the strengthening of the Canadian dollar against three of the foreign currencies in which the Company invoices its customers outside of Canada, the U.S. dollar, the U.K. pound and the Euro (the Company only commenced operations in Australia in April 2011). Comparing the average rates of fiscal 2011 and fiscal 2010, the Canadian dollar increased against the U.S. dollar, the U.K. pound and the Euro by 6.7%, 7.0% and 9.8%, respectively.
Revenue growth in fiscal year 2011 was lower than expected due to (a) customers’ cut in IT spending due to the slowdown in the economy, and (b) a cautious attitude of customers towards investing in long-term solutions.
- 20 -
Revenue – Segment and Variation
The Company has four geographical segments. The Canadian, United States, European and Australian segments market the SAND/DNA Product Suite. The following table provides a summary of the revenue growth by geographical segments for fiscal years 2011, 2010 and 2009:
| | | | | | Canada | | | | |
| | | Year ended | | | Year ended | | | Year ended | |
| | | July 31, | | | July 31, | | | July 31, | |
| Revenue - Segment and Variation | | 2011 | | | 2010 | | | 2009 | |
| Revenue | | | | | | | | | |
| Revenue | $ | 909,206 | | $ | 1,131,633 | | $ | 1,716,902 | |
| Year-over-year variation | | -19.7% | | | -34.1% | | | 37.7% | |
| | | | | | | | | | |
| | | | | | United States | | | | |
| | | Year ended | | | Year ended | | | Year ended | |
| | | July 31, | | | July 31, | | | July 31, | |
| Revenue - Segment and Variation | | 2011 | | | 2010 | | | 2009 | |
| Revenue | | | | | | | | | |
| Revenue | $ | 914,020 | | $ | 812,620 | | $ | 971,777 | |
| Year-over-year variation | | 12.5% | | | -16.4% | | | -16.4% | |
| | | | | | | | | | |
| | | | | | Europe | | | | |
| | | Year ended | | | Year ended | | | Year ended | |
| | | July 31, | | | July 31, | | | July 31, | |
| Revenue - Segment and Variation | | 2011 | | | 2010 | | | 2009 | |
| Revenue | | | | | | | | | |
| Revenue | $ | 4,824,667 | | $ | 4,618,158 | | $ | 4,360,558 | |
| Year-over-year variation | | 4.5% | | | 5.9% | | | -5.0% | |
| | | | | | | | | | |
| | | | | | Australia | | | | |
| | | Year ended | | | Year ended | | | Year ended | |
| | | July 31, | | | July 31, | | | July 31, | |
| Revenue - Segment and Variation | | 2011 | | | 2010 | | | 2009 | |
| Revenue | | | | | | | | | |
| Revenue | $ | 223,778 | | $ | - | | $ | - | |
| Year-over-year variation | | N/A | | | N/A | | | N/A | |
Operating Expenses
The following table provides a summary of the operating expenses for the fiscal years 2011, 2010, 2009 and 2008:
- 21 -
| | | Year ended | | | Year ended | | | Year ended | | | Year ended | |
| | | July 31, | | | July 31, | | | July 31, | | | July 31, | |
| Operating Expenses | | 2011 | | | 2010 | | | 2009 | | | 2008 | |
| | | | | | | | | | | | | |
| Cost of sales and product support | $ | 1,235,328 | | $ | 1,194,674 | | $ | 1,396,224 | | $ | 1,470,215 | |
| Year-over-year variation | | 3.4% | | | -14.4% | | | -5.0% | | | -11.8% | |
| Percentage of revenues | | 18.0% | | | 18.2% | | | 19.8% | | | 21.0% | |
| | | | | | | | | | | | | |
| Research and development costs, net | | 1,866,244 | | | 1,458,392 | | | 1,960,295 | | | 1,971,813 | |
| Year-over-year variation | | 28.0% | | | -25.6% | | | -0.6% | | | -11.0% | |
| Percentage of revenues | | 27.2% | | | 22.2% | | | 27.8% | | | 28.2% | |
| | | | | | | | | | | | | |
| Amortization of capital assets and other assets | | 40,597 | | | 53,298 | | | 63,643 | | | 187,517 | |
| Year-over-year variation | | -23.8% | | | -16.3% | | | -66.1% | | | -6.8% | |
| Percentage of revenues | | 0.6% | | | 0.8% | | | 0.9% | | | 2.7% | |
| | | | | | | | | | | | | |
| Selling, general and administrative expenses | | 5,399,512 | | | 4,224,677 | | | 4,372,067 | | | 4,402,613 | |
| Year-over-year variation | | 27.8% | | | -3.4% | | | -0.7% | | | -13.3% | |
| Percentage of revenues | | 78.6% | | | 64.4% | | | 62.0% | | | 62.9% | |
Cost of Sales and Product Support
Cost of sales and product support consists mainly of costs related to providing customer implementation and support services and the costs related to the sale of third-party software, including certain license fees and royalties.
Research and Development Costs
Research and development costs consist mainly of salaries and other personnel-related costs of technical and engineering personnel associated with our research and product development activities, including the enhancement and localization of existing products, quality assurance, and testing.
Amortization of Capital Assets and Other Assets
Amortization of capital assets and other assets consists of the depreciation of furniture and equipment, computer equipment, research and development equipment and leasehold improvements costs over their estimated useful lives.
Selling, General and Administrative Expenses
Selling, General and Administrative expenses include salaries, commissions and other personnel-related costs, travel expenses, advertising programs and other promotional activities associated with the selling and marketing of our products. It excludes foreign exchange gains and losses and interest expense.
Our cost of sales for fiscal year 2011 showed a slight increase of 3.4% compared to fiscal year 2010 in line with the increase in sales.
Research and Development costs increased by 28.0%, or $407,852, as a result of a decrease in government sponsored investment tax credits from the previous year in the amount of $380,838, the previous year’s amount including a catch-up amount representing two years of investment tax credits.
- 22 -
The reduction in Amortization of Capital Assets in fiscal year 2011 from the amortization in fiscal year 2010 was due to the lower value of capital assets and minimal capital expenditures.
Selling, General and Administrative expenses of $5,399,512 for fiscal 2011 was 27.8% higher than the previous year amount of $4,224,677. The increase was largely attributable to a significant increase in stock-based compensation from $79,605 in fiscal year 2010 to $741,847 in fiscal year 2011, representing the issuance of a significant number of stock options to employees, Officers and Directors of the Company. The Company also invested heavily in additional sales staff and marketing expenditures in an effort to boost sales in future periods.
Interest expense of $370,313 for fiscal year 2011 was 25.1% higher than the previous year amount of $295,941 as a result of increased interest costs related to the loan from a significant shareholder.
The foreign exchange loss of $72,146 for fiscal 2011 was 10.9% lower than the previous year amount of $80,978.
Net Losses – Total and Variation
The following table provides a summary of the net losses for fiscal years 2011, 2010, 2009 and 2008:
| | | Year ended | | | Year ended | | | Year ended | | | Year ended | |
| | | July 31, | | | July 31, | | | July 31, | | | July 31, | |
| Net Loss - Total and Variation | | 2011 | | | 2010 | | | 2009 | | | 2008 | |
| | | | | | | | | | | | | |
| Net Loss | $ | (2,112,469 | ) | $ | (745,549 | ) | $ | (1,191,695 | ) | $ | (1,271,950 | ) |
| Year-over-year variation | | -183.3% | | | 37.4% | | | -6.3% | | | -49.7% | |
There was an increase of 183.3% in our net loss from $745,549 in fiscal 2010 to $2,112,469 in fiscal 2011. The increase in total expenses described above was only partially offset by the increase in total revenues from $6,562,411 for fiscal 2010 to $6,871,671 for fiscal 2011.
Inflation
Inflation has no material impact on the Company's operations.
Impact of Foreign Currency
Since we currently earn revenues and incur expenses in United States dollars, British pounds, Euros, Australian Dollars and Canadian dollars, exchange rates for these and other local currencies in countries where we may operate in the future may fluctuate in relation to the Canadian dollar and such fluctuations may have an adverse effect on our earnings or assets when United States dollars, British pounds, Euros, Australian dollars or local currencies are exchanged for Canadian dollars. We have not entered into forward foreign exchange contracts. Gains and losses resulting from the translation of revenue and expenses denominated in United States dollars, British pounds, Euros and Australian dollars into Canadian dollars have been included in our results of operations in to the audited consolidated financial statements.
Changes in foreign exchange rates had a negative impact on our results of operations for fiscal year 2011. Comparing the average rates of fiscal 2011 and fiscal 2010, the Canadian dollar increased against the U.S. dollar, the U.K. pound and the Euro by 6.7%, 7.0% and 9.8%, respectively (the Company only commenced operations in Australia in April 2011).
- 23 -
Summary of Quarterly Results
The following tables set forth the unaudited statements of operations for each of the quarters of fiscal years 2011, 2010, 2009 and 2008. The quarterly results, in management’s opinion, have been prepared on a basis consistent with the audited consolidated financial statements and include the adjustments necessary for a fair presentation of the information.
| | | Year Ended July 31, 2011 | | | Year Ended July 31, 2010 | |
| QUARTERLYRESULTS | | Q4 | | | Q3 | | | Q2 | | | Q1 | | | Q4 | | | Q3 | | | Q2 | | | Q1 | |
| | | | | | | | | | | | | | | | | | | | | | | | | |
| Revenue | $ | 1,456,584 | | $ | 1,002,596 | | $ | 2,443,712 | | $ | 1,968,779 | | $ | 1,186,041 | | $ | 966,654 | | $ | 1,924,251 | | $ | 2,485,465 | |
| Quarter-over-quarter variation | | 45.3% | | | -59.0% | | | 24.1% | | | 66.0% | | | 22.7% | | | -49.8% | | | -22.6% | | | 109.6% | |
| | | | | | | | | | | | | | | | | | | | | | | | | |
| Cost of sales and product support | | 341,155 | | | 284,470 | | | 283,520 | | | 326,184 | | | 215,100 | | | 331,920 | | | 340,533 | | | 307,120 | |
| Quarter-over-quarter variation | | 19.9% | | | 0.3% | | | -13.1% | | | 51.6% | | | -35.2% | | | -2.5% | | | 10.9% | | | 4.8% | |
| | | | | | | | | | | | | | | | | | | | | | | | | |
| Gross margin | | 76.6% | | | 71.6% | | | 88.4% | | | 83.4% | | | 81.9% | | | 65.7% | | | 82.3% | | | 87.6% | |
| | | | | | | | | | | | | | | | | | | | | | | | | |
| Totalotheroperatingexpenses | | 2,034,629 | | | 2,012,402 | | | 2,024,450 | | | 1,677,330 | | | 944,600 | | | 1,809,963 | | | 1,611,669 | | | 1,747,055 | |
| Quarter-over-quarter variation | | 1.1% | | | -0.6% | | | 20.7% | | | 77.6% | | | -47.8% | | | 12.3% | | | -7.7% | | | 85.0% | |
| | | | | | | | | | | | | | | | | | | | | | | | | |
| Profitability | | | | | | | | | | | | | | | | | | | | | | | | |
| Net income (loss) | | (919,200 | ) | | (1,294,276 | ) | | 135,742 | | | (34,735 | ) | | 26,341 | | | (1,175,229 | ) | | (27,951 | ) | | 431,290 | |
| Quarter-over-quarter variation in net income (loss) | | -29.0% | | | -1053.5% | | | -490.8% | | | -231.9% | | | -102.2% | | | 4104.6% | | | -106.5% | | | #DIV/0! | |
| Basic and diluted loss per common share | | -0.05 | | | -0.08 | | | 0.01 | | | 0.00 | | | 0.00 | | | -0.08 | | | 0.00 | | | 0.03 | |
| | | | | | | | | | | | | | | | | | | | | | | | | |
| Weightedaveragenumberofsharesoutstanding | | 17,009,173 | | | 16,204,842 | | | 15,889,620 | | | 15,889,620 | | | 15,467,702 | | | 15,071,615 | | | 14,688,444 | | | 14,318,189 | |
| | | Year Ended July 31, 2009 | | | Year Ended July 31, 2008 | |
| QUARTERLYRESULTS | | Q4 | | | Q3 | | | Q2 | | | Q1 | | | Q4 | | | Q3 | | | Q2 | | | Q1 | |
| | | | | | | | | | | | | | | | | | | | | | | | | |
| Revenue | $ | 1,706,293 | | $ | 2,371,632 | | $ | 1,747,384 | | $ | 1,223,928 | | $ | 1,888,042 | | $ | 1,905,984 | | $ | 1,419,521 | | $ | 1,784,925 | |
| Quarter-over-quarter variation | | -28.1% | | | 35.7% | | | 42.8% | | | -35.0% | | | -0.9% | | | 34.3% | | | -20.5% | | | -5.5% | |
| | | | | | | | | | | | | | | | | | | | | | | | | |
| Cost of sales and product support | | 319,612 | | | 349,592 | | | 405,632 | | | 321,388 | | | 336,960 | | | 333,900 | | | 387,191 | | | 412,164 | |
| Quarter-over-quarter variation | | -8.6% | | | -13.8% | | | 26.2% | | | -4.6% | | | 0.9% | | | -13.8% | | | -6.1% | | | 22.3% | |
| | | | | | | | | | | | | | | | | | | | | | | | | |
| Gross margin | | 81.3% | | | 85.3% | | | 76.8% | | | 73.7% | | | 82.2% | | | 82.5% | | | 72.7% | | | 76.9% | |
| | | | | | | | | | | | | | | | | | | | | | | | | |
| Totalotheroperatingexpenses | | 1,761,806 | | | 1,721,343 | | | 1,469,167 | | | 1,892,392 | | | 2,035,210 | | | 1,563,643 | | | 1,523,673 | | | 1,677,681 | |
| Quarter-over-quarter variation | | 2.4% | | | 17.2% | | | -22.4% | | | -7.0% | | | 30.2% | | | 2.6% | | | -9.2% | | | -17.6% | |
| | | | | | | | | | | | | | | | | | | | | | | | | |
| Profitability | | | | | | | | | | | | | | | | | | | | | | | | |
| Net income (loss) | | (375,127 | ) | | 300,697 | | | (127,415 | ) | | (989,850 | ) | | (484,128 | ) | | 8,441 | | | (491,343 | ) | | (304,920 | ) |
| Quarter-over-quarter variation in net income (loss) | | -224.8% | | | -336.0% | | | -87.1% | | | 104.0% | | | -5835.4% | | | -101.7% | | | 61.1% | | | -37.0% | |
| Basic and diluted loss per common share | | -0.03 | | | 0.02 | | | -0.01 | | | -0.07 | | | -0.03 | | | 0.00 | | | -0.03 | | | -0.02 | |
| | | | | | | | | | | | | | | | | | | | | | | | | |
| Weightedaveragenumberofsharesoutstanding | | 14,318,189 | | | 14,318,189 | | | 14,318,189 | | | 14,318,189 | | | 14,318,189 | | | 14,318,189 | | | 14,318,189 | | | 14,318,189 | |
Sales of the Company's products and services are not subject to seasonal variations. Historically, the Company’s operating results have fluctuated on a quarterly basis. The Company’s revenues, expenses and operating results may vary significantly from quarter-to-quarter because of a number of factors. These factors may include the timing of product sales and the length of the sales cycle. As a result, period-to-period comparisons may not be meaningful comparisons of the Company’s results nor are they necessarily indicative of the future results of the Company.
- 24 -
B. Liquidity and Capital Resources
Our cash balance as at July 31, 2011 was $810,745 compared to $579,270 as at July 31, 2010 and $1,065,572 at July 31, 2009.
We generated a negative cash flow of $178,8263 from operating activities in fiscal 2011 as compared to a negative cash flow of $573,567 from operating activities in fiscal 2010, representing an increase in cash flow of $394,7414 in fiscal 2011 as compared to a decrease in cash flow from operating activities in fiscal 2010 of $59,096. For fiscal 2011, the increase in the net loss over fiscal year 2010 by $1,366,920 was partially offset by an increase of $662,245 in stock-based compensation, representing a non-cash expense.
Investing activities represent additions to capital assets which amounted to $57,436 in fiscal 2011 as compared to $34,334 in fiscal 2010 and $24,781 in fiscal 2009.
Financing activities represent funds provided by shareholders and private investors and the issuance of share capital. The Company generated a positive cash flow of $514,076 from financing activities in fiscal 2011 as compared to a positive cash flow of $254,867 from financing activities in fiscal 2010, representing an increase of $259,209 in fiscal year 2011 as compared to a decrease in fiscal year 2010 of $494,157. For fiscal 2011, the increase is mainly attributable to a private placement of $775,073 (U.S.$750,000) involving investors and the Chief Executive Officer, and to a reduction in repayments of a shareholder loan.
At July 31, 2011, we had a working capital deficiency of $1,248,354 compared to a working capital deficiency of $982,935 as at July 31, 2010, representing an increase of $265,419 in working capital deficiency in fiscal 2011 as compared to a decrease in working capital deficiency in fiscal 2010 of $927,123. Working capital has been calculated as the difference between current assets and current liabilities.
As of July 31, 2011, the Company’s long-term debt consisted of the following:
| | a) | Convertible debentures consisting of 1,114 Units issued as part of a private placement transaction on April 18, 2008. Each unit consists of one 8% Convertible Debenture due December 31, 2017, having a nominal value of U.S.$900, redeemable at the option of the Company if the bid price of the common share has been above $1.50 for 60 consecutive trading days, and convertible at the option of the holder into class "A" common shares at U.S.$0.45 per share, and 1,000 share purchase warrants of the Company. Each warrant entitles the holder to purchase one additional common share (warrant share) of the Company at a price of U.S.$0.70 per warrant share at any time until the earlier of the close of business day which is either thirty six (36) months from April 18, 2008 or the bid price of the stock has been above U.S.$1.50 for sixty (60) consecutive trading days. Interest is calculated at the rate of 8% per annum, payable in common shares at a rate of U.S.$0.45 per share. Before the warrants expired on April 18, 2011, certain holders exercised 613,000 warrants and 501,000 warrants expired. The interest is due on each conversion date (date when the principal amount is being converted) subsequent to January 1, 2009 or on the maturity date. The financing is secured by a first rank hypothec on all of the Company’s property and assets, movable and immovable, corporeal and incorporeal, present and future, for the principal accrued interest amounts. The redemption value of the convertible debentures on the maturity date, December 31, 2017, is U.S.$1,777,944. |
- 25 -
| | b) | During fiscal year 2009, the Company formalized the conditions pertaining to a loan obtained from a significant shareholder. The loan originated from amounts owed by the Company to the shareholder by virtue of his previous employment contracts as President and Chief Executive Officer. The significant shareholder ceased to be President and Chief Executive Officer on October 31, 2009. The total amount owing under the loan agreement at October 31, 2009 was $1,466,677. Under the terms of the loan agreement, the loan is repayable in three (3) principal annual instalments of $488,892 over 3 years on January 1, 2011, 2012 and 2013. The loan bears interest at 15% that is payable semi-annually on January 1 and June 30 of each year. The amount may be prepaid at any time by the Company without penalty. In the event of default to pay an amount when due, the significant shareholder shall have the right to convert all outstanding amounts owing to him hereunder into common shares of the Company based on the average closing price of the shares on the OTC Bulletin Board for the month immediately preceding the month in which such right is exercised. In addition and also upon default, the significant shareholder shall have the right to require the Company to purchase all common shares in the capital stock of the Company owned directly or indirectly by the significant shareholder at a purchase price per share equal to the greater of: |
| | | | |
| | | i) | the average closing price of the shares on the OTC Bulletin Board over the previous 30-day period plus 15%, or |
| | | | |
| | | ii) | the book value of the shares as determined by the auditors of the Company. |
As at July 31, 2011, an amount of $1,685,411 (July 31, 2010 - $1,407,874), including accrued interest of $481,751 (July 31, 2010 - $204,214), was outstanding under the loan agreement.
The following table provides a summary of the contractual commitments for the next five years and thereafter:
| 2012 | $ | 314,073 | |
| 2013 | | 268,030 | |
| 2014 | | 267,546 | |
| 2015 | | 222,985 | |
| 2016 | | 200,704 | |
| Thereafter | | 1,038,165 | |
| | | | |
| | $ | 2,311,503 | |
C. Research and Development, Patents and Licenses
Our research and development activities focus on enhancing its current products to exceed customer expectations and to develop new products to maintain our competitive advantage in the market.
Our research and development activities are central to fueling its existing and potential business. We engage in research and development activities relating to the introduction of new features, enhancements and new packaged products. We focus on SAND/DNA Analytics.
We maintain our main research and development facility in Westmount, Canada. We also have a network of research and development technologists in the United States, the United Kingdom, Germany and Australia. As of October 21, 2011, there are 20 technologists. After research and development tax credits, SAND spent $1.87 million in 2011, $1.46 million in 2010 and $1.96 million in 2009 on research and development.
- 26 -
We will continue to focus on research and development efforts that are key to responding to changing technology.
Research and development expenses consist mainly of salaries and other personnel-related costs of technical and engineering personnel associated with our research and product development activities, including the enhancement and localization of existing products, quality assurance, and testing.
Research and development expenses, before research and development tax credits, remained stable in the fiscal year ended on July 31, 2011 as compared to the fiscal year ended on July 31, 2010.
D. Trend Information
Revenue growth in fiscal year 2011 was lower than expected due to (a) customers’ cut in IT spending due to the slowdown in the economy, and (b) a cautious attitude of customers towards investing in long-term solutions. We will continue to monitor these trends and factors in the current fiscal year ending July 31, 2012.
E. Off-balance Sheet Arrangements
None.
F. Disclosure of contractual obligations
The following table provides a summary of the contractual commitments as of July 31, 2011 for the next five years and thereafter.
| 2012 | $ | 314,073 | |
| 2013 | | 268,030 | |
| 2014 | | 267,546 | |
| 2015 | | 222,985 | |
| 2016 | | 200,704 | |
| Thereafter | | 1,038,165 | |
| | | | |
| | $ | 2,311,503 | |
- 27 -
The following table provides a summary of the material financial obligations as of July 31, 2011:
| | | Payments due by period | |
| | | Less than | 1 - 3 | 3 - 5 | |
| | Total | 1 year | years | years | More than 5 years |
| | | | | | |
| Debt Component of | $ 542,671 | - | - | - | $1,777,944 |
| Convertible | | | | | |
| Debentures(U.S.$) (1) | | | | | |
| | | | | | |
| Due to a significant | $1,914,837 | $937,053 | $977,784 | - | - |
| shareholder (CDN.$)(2) | | | | | |
| | (1) | - The amount represents the redemption value of the convertible debentures on the maturity date, December 31, 2017. Reference should be made to the audited consolidated financial statements for the book value as at July 31, 2011. |
| | | |
| | (2) | –The amount represents the payment obligations under a Repayment Agreement with Mr. Arthur G. Ritchie, the former President and Chief Executive Officer of SAND Technology Inc. |
G. Safe Harbor
Certain statements contained in this Report are "forward-looking statements" within the meaning of the United States Securities Act of 1934 and of the Exchange Act. The forward-looking statements are intended to be subject to the safe harbour protection provided by these Acts. We have based these forward-looking statements on our current expectations and projections about future results, levels of activity, events, trends or plans. Such forward-looking statements are not guarantees and are subject to known and unknown risks, uncertainties and other factors which may cause the actual results, performance or achievements to be materially different from any future results, performance or achievements expressed or implied by such forward-looking statements. In some cases, you can identify forward-looking statements by terminology such as "guidance", "may", "will", "should", "could", "would", "expect", "plan", "anticipate", "believe", "estimate", "continue", or the negative of such terms or other similar expressions. All forward-looking statements included in this discussion are based on current expectations and on information available to us on the date of this Annual Report on Form 20-F. For a more detailed discussion of these risks and uncertainties and other business risks, seeItem 3.G. - "Risk Factors". Although the Company has attempted to identify important risks and factors that could cause actual actions, events or results to differ materially from those described in forward-looking statements, there may be other factors and risks that cause actions, events or results not to be as anticipated, estimated or intended. Readers are cautioned not to place undue reliance on these forward-looking statements, which speak only as of the date made. Except as required by applicable laws, we undertake no obligation to publicly release the result of any revision of these forward-looking statements to reflect events or circumstances after the date they are made or to reflect the occurrence of unanticipated events
ITEM6. DIRECTORS, SENIOR MANAGEMENT AND EMPLOYEES
A. Directors and Senior Management
Directors
The following table sets forth certain information concerning our directors, including their beneficial ownership of shares of the Company as of October 21, 2011. Unless otherwise indicated, each nominee holds sole voting and investment power over his shares.
- 28 -
Name, Residence and
Office Held | Director
Since | Principal Occupation | Number and
Percentage of
Common Shares
Beneficially Owned or
Controlled |
P. Wayne Musselman(1)
Toronto, Ontario, Canada
Director | 2007 | Accountant and Business Consultant. | 232,788
(1.2%) |
Thomas M. O'Donnell
Woodstock, Illinois, United States
President and Chief Executive
Officer and Director | 2008 | Current Chief Executive Officer of
SAND
Chief Executive Officer of Edge
Specialists LLC | 4,086,468
(19.1%) |
Duncan Painter(2)
Letchworth, Herts, United
Kingdom
Director | 2010 | Executive and Business Consultant | 772,858
(3.9%) |
Daniel Benn(1)
Pointe Claire, Quebec, Canada
Director | 2010 | Executive and Business Consultant | 100,000
(0.5%) |
Michael Pesner(1)
Montreal, Quebec, Canada
Director | 2010 | Accountant and Business Consultant | 100,000
(0.5) |
George Wicker(2)
Palm Beach Gardens, Florida,
United States
Director | 1996 | Attorney and Business Consultant | 477,738
(2.5%) |
Notes:
| (1) | Member of the Audit Committee. |
| (2) | Member of the Governance, Nomination, Human Resources and Compensation Committee. |
As of October 21, 2011, the directors of the Company as a group beneficially owned 5,769,852 Common Shares representing approximately 26.0% of the outstanding Common Shares of the Company excluding Common Shares subject to exercise of share purchase warrants or to conversion of convertible debentures. The information as to Common Shares beneficially owned or over which control or direction is exercised, not being within the knowledge of the Company, has been furnished by the respective directors and officers individually.
Mr. P. Wayne Musselman, BCom (Hon), FCA, retired as a partner of Deloitte & Touche LLP in 2003 after a career of nearly forty years during which he served clients in the banking, securities, international trade and distribution industries. He directed the Japanese Service Group of Deloitte Canada and served on the Board of Deloitte’s Global Japanese Services Group. He is currently the Chairman of the Board of FaithLife Financial and a director and the Chairman of the Audit Committee of State Bank of India (Canada). Mr. P. Wayne Musselman is the Chairman of the Audit Committee of SAND.
Mr. Thomas M. O'Donnell has an extensive career in the software and financial markets. He is Chief Executive Officer, founder and majority owner of Edge Specialists LLC, which is an independent software vendor with extensive United States patent protection providing derivative trading tools including options, stocks and futures trading. He is a co-inventor of two extensive trading software
- 29 -
patents, a C.P.A. and a graduate of Harvard Business School. In addition, Mr. O'Donnell was a Designated Primary Market Maker on the Chicago Board of Options Exchange and has extensive experience in the financial markets. Effective November 1, 2009, Thomas M. O’Donnell was appointed President and Chief Executive Officer of SAND, as Arthur G. Ritchie retired. In connection with our sale of the Convertible Debentures, we entered into a Voting Agreement dated 18, 2008, with Arthur G. Ritchie and Bradley G. Griffith on behalf of the subscribers of the Convertible Debentures, whereby Mr. Ritchie agreed to vote his shares in favour of the election of a director nominated by the holders of such Convertible Debentures holding a majority of the aggregate principal amount of the Convertible Debentures outstanding.Mr. O’Donnell was elected as a director in connection with this agreement and the sale of the Convertible Debentures.
Mr. Daniel Benn was the founder and former Chief Executive Officer of a technology company. He is skilled and experienced in setting strategic direction, business and tactical planning and execution, initiating and driving growth strategies, managing bottom-line profitability, acquisitions and divestitures, direct and channel sales and marketing, research and product development, project management and operational infrastructure.
Mr. Duncan Painter most recently led both the U.K. Marketing Services and Global Marketing Services Consulting and Delivery businesses at Experian Plc. He has extensive experience with SAND Technology, having headed up the Company’s European operations for a number of years.
Mr. Michael Pesner has extensive experience in financial advisory services and investment banking, including mergers and acquisitions, restructuring, divestitures and debt and equity financing. He spent 26 years with KPMG, was Chairman of Thorne Ernst & Whinney Inc. and served on the Board of Directors of Peat Marwick Thorne. Mr. Michael Pesner serves on the Board of Directors of five other reporting issuers (or the equivalent) as described in Item 6.C. Board Practices - Directorships.
Mr. George Wicker held executive level positions in general management, program management and finance with Lockheed Martin Corporation and its predecessor corporations during a thirty-three year career. Mr. Wicker holds a B.A. in Political Sciences, an MBA in Financial Management from the University of Santa Clara and a Juris Doctor degree from Pepperdine University. Mr. George Wicker is the Chairman of the Compensation Committee of SAND.
Mr. Arthur G. Ritchie resigned from the Board of Directors on August 2, 2011. He had served as Chairman of the Board of Directors.
- 30 -
Senior Management
The following table shows certain information with respect to our executive and other officers:
Name
|
Office
| Year
appointed
to Office | Other Positions and Business
Experience |
| Thomas M. O’Donnell | Chief Executive Officer | 2009(5) | CEO of Edge Specialists LLC |
| Michael Pilcher | President and Chief Operating Officer | 2010(4) | Senior executive at multiple large companies and start-up companies |
| Tony J. Giuliano | Vice-President, Finance and Administration and Chief Financial Officer and Corporate Secretary | 2010(2)(3) | Chief Financial Officer at multiple companies |
| Richard Grondin | Chief Technology Officer | 2009(1) | - |
Notes:
| (1) | Richard Grondin was appointed Chief Technology Officer on November 1, 2009. |
| | |
| (2) | Mr. Tony J. Giuliano was appointed as Vice-President, Finance and Administration of the Company on October 4, 2010. |
| | |
| (3) | Mr. Tony J. Giuliano was appointed as Corporate Secretary of the Company on November 16, 2010. |
| | |
| (4) | Mr. Pilcher was appointed Chief Operating Officer of the Company on April 1, 2010 and President on July 12, 2011. |
| | |
| (5) | Thomas M. O’Donnell was appointed President and Chief Executive Officer of the Company on November 1st, 2009 and relinguished the role of President on July 12, 2011. |
Michael Pilcher was previously Sales Director Hiring Solutions, EMEA at LinkedIn Corporation, the largest professional network in the world. Prior to LinkedIn, he worked at Oracle Corporation where he led the U.K. insurance group, at Sybase where he ran U.K. Financial Services and at Tenfold Corporation where, as world-wide Vice-President Sales, he completed a highly successful IPO. He brings the experience of working in large public companies and dynamic start-ups from across multiple industries and geographic sectors.
Tony Giuliano was previously Director, Financial Management at Unisource Canada Inc. Previously, he was Chief Financial Officer at Avensys Corporations, a U.S. public company involved in high-tech manufacturing, and Chief Financial Officer at Starlink Aviation Inc, involved in the private aviation business. He holds a Graduate Diploma in Accountancy from McGill University in Montreal together with a Bachelor of Commerce from Concordia University in Montreal. He is a member of the Quebec Institute of Chartered Accountants.
Richard Grondin has been with SAND Technology Inc. since April 2, 1997 and has worked in various roles before becoming Chief Technology Officer on November 1, 2009.
There are no family relationships between any directors and executive officers of the Company.
- 31 -
B. Compensation
Compensation of Directors
For the period from August 1, 2009 to December 31, 2009, P. Wayne Musselman, George Wicker and former directors Martin Shindler and Douglas S. Pryde were paid an annual retainer of $15,000 for serving as a directorAll non-management directors are currently compensated with stock options from the 2010 Stock Incentive Plan. Each non-management director is entitled to receive 50,000 stock options per calendar year with the Chairman of the Audit Committee and Chairman of the Compensation Committee entitled to receive an additional 15,000 stock options per calendar year.
Executive Compensation Analysis
General Principles of Executive Compensation
Although the Company has not adopted a formal compensation program, remuneration plays an important role to attract, motivate and retain key members of the management team required for its success and to drive strategic growth. Compensation is designed to reward for services provided and to provide an incentive for the executive management team to implement strategies aimed at increasing share value and creating economic value. The compensation is also established according to the duties and responsibilities that rest on the individuals and their own level of performance. The total compensation package is designed in a manner that takes into account the constraints under which the Company operates and that it is a technology company without a history of earnings.
Determining Compensation
The compensation of the Named Executive Officers identified in “Compensation of Executive Management” below is established by the Board, upon the recommendation of the Governance, Nomination, Human Resources and Compensation Committee (“Compensation Committee”) (please refer to section C – Board Practices for more details on the role and responsibility of this committee). The compensation of the Named Executive Officers, with the exception of the Chief Executive Officer, is proposed by the Chief Executive Officer to the Compensation Committee, which recommends the adoption by the Board of Directors. The compensation of the Chief Executive Officer is established by the Compensation Committee which recommends adoption to the Board of Directors.
Components of Overall Compensation
When assessing total direct annual compensation, the Company focuses on four key components which are intended to collectively make up most of an executive total compensation opportunity. There are two fixed components – base salary and participation in the collective insurance plans. There are two variable components – incentive bonus and the grant of common share stock options or common share awards of the Company.
Base Salary
The Named Executive Officers receive a base salary which is based primarily on the level of responsibility of the position, the qualifications and experience of the officer and market conditions. The base salary may be paid to the Named Executive Officer in the form of cash, a consulting fee or in shares.
- 32 -
Incentive Bonus
The amount of bonus is based on factors relating to both corporate and individual performance, including business development and profitability.
Option-Based or Share-Base Award Plans
The stock option or share plans are the only long-term incentive plans (LTIP) of the Company. Stock options or share awards ensure that the Named Executive Officers are motivated to achieve long-term growth of the Company and increases in shareholder value, and provide capital accumulation linked directly to the Company’s performance. Stock options or share awards are made by the Board of Directors, after recommendation by the Compensation Committee. Stock options or share awards are established, among other things, according to the role and responsibilities associated with the participant’s position and his or her influence over appreciation in shareholder value. The terms of the plans are described below under section E – Share Ownership.
Other Compensation
The Named Executive Officers have the right to receive the benefits from any collective insurance plans in force of the Company.
Compensation of Executive Management
The following table sets forth information concerning the compensation paid to the Company's Chief Executive Officer and named executive officers (the "Named Executive Officers") as required disclosure in accordance with applicable Canadian securities regulations during the Company's three fiscal years ended July 31, 2011:
"Named Executive Officers" or "NEOs" means the following individuals:
| | (a) | each Chief Executive Officer; |
| | | |
| | (b) | each President and Chief Operating Officer; |
| | | |
| | (c) | each Chief Financial Oficer; and |
| | | |
| | (d) | each Chief Technology Officer. |
As at July 31, 2011, the end of the most recently completed financial year of the Company, the Company had four Named Executive Officers, whose names and positions held within the Company are set out in the summary compensation table below:
- 33 -
Summary Compensation Table
Name andPrincipal
Position | Year | Annual Compensation | Long-Term Compensation | |
| Awards | Payouts |
Salary
($)
| Bonus
($)
| Other
($)
| Share-
Based
Awards ($) | Option-
Based
Awards ($) | LTIP
Payouts
($) | All Other
Compensation
($) |
Thomas M. O’Donnell(2)
Chief Executive
Officer | 2011
2010
2009 | 39,772
-
- | -
-
- | -
-
- | -
-
- | 294,458
-
- | -
-
- | -
-
- |
Michael Pilcher(4)
President and
Chief Operating Officer | 2011
2010
2009 | 238,290
82,555
- | -
-
- | -
-
- | -
-
- | 87,729
-
- | -
-
- | -
-
- |
Arthur G. Ritchie(3)
Former President and Chief
Executive Officer | 2010
2009
| 54,538
212,153
| 12,500
50,000
| 11,804
80,772
| -
-
| -
-
| -
-
| -
-
|
Tony J. Giuliano(6)
Vice-President, Finance and Chief
Financial Officer and Corporate Secretary |
2011
|
120,000
|
-
|
-
|
-
|
19,991
|
-
|
-
|
Zainab A. Schwartz(1)
Former Vice-
President, Finance
and Administration and Chief Financial Officer |
2010
2009
|
120,000
120,000
|
10,000
10,000
|
-
-
|
-
-
|
-
-
|
-
-
|
-
-
|
Richard Grondin(5)
Chief Technology Officer | 2011
2010 | 235,000
167,351 | 34,768
18,122 | 18,400
8,077 |
| 123,942
- |
|
|
Notes:
| (1) | Ms. Zainab Schwartz resigned on September 15, 2010. |
| | |
| (2) | Mr. Thomas O’Donnell became President and Chief Executive Officer of SAND on November 1, 2009. Mr. O’Donnell relinguished his role as President on July 12, 2011. For his service during the period from November 1, 2009 to January 31, 2011, Mr. O’Donnell received stock options from the 2010 Stock Incentive Plan in the amount of 50,000 stock options per month. Commencing February 1, 2011, Mr. O’Donnell is entitled to receive 10,000 stock options per month. |
| | |
| (3) | Mr. Ritchie retired as President and Chief Executive Officer on October 31, 2009. |
| | |
| (4) | Mr. Pilcher became Chief Operating Officer on April 1, 2010 and President and Chief Operating Officer on July 12, 2011. Mr. Pilcher received 219,426 stock options from the 2010 Stock Incentive Plan on April 1, 2010 and is entitled to receive 315,242 stock options on each of July 31, 2012 and July 31, 2013. |
- 34 -
| (3) | Mr. Richard Grondin became Chief Technology Officer on November 1, 2009. Mr. Grondin received 310,000 stock options from the 2010 Stock Incentive Plan on April 1, 2010 and is entitled to receive 50,000 stock options on July 31, 2012. |
| | |
| (4) | Mr. Tony Giuliano became Chief Financial Officer on October 4, 2010 and Corporate Secretary on November 16, 2010. Mr. Giuliano received 50,000 stock options from the 2010 Stock Incentive Plan on April 1, 2010 and is entitled to receive 50,000 stock options on December 31, 2011. |
Outstanding Option-Based Awards
As at July 31, 2011, stock options held by the Named Executive Officers are indicated below under section E – Share Ownership.
Pension Plan Benefits
The Company has no pension or retirement benefit plans have been instituted and none are proposed at this time.
Securities Authorized for Issuance under Equity Compensation Plans
The following tables summarize as of October 21, 2011, the equity compensation plans pursuant to which equity securities of the Company may be issued:
Stock-Option Plans Information
Plan Category |
Number of Common
Shares to be Issued Upon
Exercise of Outstanding
Vested and Unvested
Stock Options |
Weighted Average
Exercise Price of
Outstanding Options | Number of Common
Shares Remaining
Available for Future
Issuance Under the
Equity Compensation
Plans |
| Equity Compensation Plans of the Company approved by the shareholders | 3,483,583 | 1.00 | 2,516,417 |
| Equity Compensation Plans of the Company not approved by the shareholders | 0 | N/A | 3,000,000 |
| Total: | 3,483,583 | | 5,516,417 |
Share Award Plan Information
Plan Category |
Number of Common
Shares to be Issued Upon
Exercise of Outstanding
Share Awards |
Weighted Average
Exercise Price of
Outstanding Options | Number of Common
Shares Remaining
Available for Future
Issuance Under the
Equity Compensation
Plans |
| Equity Compensation Plans of the Company approved by the shareholders | 0 | 0 | 1,000,000 |
| Equity Compensation Plans of the Company not approved by the shareholders | N/A | N/A | N/A |
| Total: | 0 | - | 1,000,000 |
- 35 -
Directors and Officers Liability Insurance
The Company maintains Directors and Officers liability insurance. The policy contains standard industry exclusions, and no claims have been made thereunder to date. The policy provides coverage with a limit of U.S.$5,000,000 per loss per policy period, subject to a deductible of U.S.$100,000 per securities claim and U.S.$100,000 per other claim. The current annual premium is paid entirely by SAND and amounts to U.S.$90,000. SAND has entered into an indemnification agreement with each of its directors and senior officers.
C. Board Practices
Date of expiration of current term of office
Pursuant to the CBCA, directors of the Company hold office until the close of the next annual meeting of shareholders and until their successors are elected and qualified or until their earlier resignation or removal. The CBCA requires that twenty-five percent (25%) of the members of the Board of Directors must be resident Canadians. In addition, the Board may not transact business at a meeting unless one-quarter of the directors participating in the meeting are Canadian residents. Officers serve at the pleasure of the Board of Directors, subject to the terms of employment agreements, if any, and applicable employment laws.
SAND has entered into the following arrangements with its directors mentioned above:
| | (a) | On April 18, 2008, we entered into a Voting Agreement with Arthur G. Ritchie and Bradley G. Griffith on behalf of the subscribers of the Convertible Debentures issued pursuant to a private placement on April 24, 2008 for aggregate proceeds of US$1,002,600. Under the terms of the Voting Agreement, Mr. Ritchie agreed to vote his shares in favour of the election of a director nominated by the holders of such Convertible Debentures holding a majority of the aggregate principal amount of the Convertible Debentures outstanding.Mr. O’Donnell was elected as a director in connection with this agreement and the sale of the Convertible Debentures. |
| | | |
| | (b) | Effective November 1, 2009, Arthur G. Ritchie, SAND and Jerart Financial Services Limited (a company wholly-owned by Arthur G. Ritchie) (“Jerart”) entered into a Marketing and Sales Assistance Agreement. Jerart agreed to provide SAND with partner services such as identifying potential customers, leading the sale through establishing the primary relationship to the influencers and decision makers, submitting proposals and developing the business case. The fees are based on a percentage of the sales. The percentage is based on the type of level of partner services as defined in the contract; |
| | | |
| | (c) | On August 1, 2007, a Consulting Agreement was entered by and between Arthur G. Ritchie, SAND and Jerart. Jerart agreed to provide SAND with corporate management services through the person of Arthur G. Ritchie himself and which provides that Arthur G. Ritchie shall act as President and Chief Executive Officer of SAND. Effective October 31, 2009, Arthur G. Ritchie retired as President and Chief Executive Officer of SAND and a new ‘Consulting Agreement’ was entered into between Arthur G. Ritchie, SAND and Jerart as part of his retirement package. Jerart agreed to provide SAND with corporate management services through the person of Arthur G. Ritchie himself. The agreement commenced on November 1, 2009 and will continue for a term of two years. The Company is required to pay Jerart an annual consulting fee in the amount of $250,000 payable on the first business day of every month in monthly instalments of $20,833 plus all applicable taxes. If the agreement is terminated by the Company for any reason |
- 36 -
| | | whatsoever prior to the expriry of the term, the remaining unpaid balance of the consulting fee will become immediately due and payable to Jerart; |
| | | |
| | (d) | Certain loan agreements between Arthur G. Ritchie, SAND and Jerart, prior to November 1, 2009, were replaced on such date by a Repayment Agreement. Pursuant to such Repayment Agreement, the amounts owed by SAND to Arthur G. Ritchie will be repaid in equal instalments over three (3) years commencing January 1, 2011. The amounts due under the Repayment Agreement continue to bear interest at 15% per annum and are payable on a semi-annual basis. Please see Item 7B – Related Party Transactions for more details; and |
| | | |
| | (e) | On October 31, 2009, Arthur G. Ritchie, Jerart and Bradley G. Griffith entered into a Priority Agreement whereby Bradley G. Griffith asfondé de pouvoirfor the holders of the Convertible Debentures agreed that the security in interest granted to Arthur G. Ritchie shall rank concurrently andpari passuwith the security granted to the holders of the Convertible Debentures. |
Officers’ Services Contract
During the fiscal year ended July 31, 2011, the Company had a Consulting Agreement with Thomas M. O’Donnell, as Chief Executive Officer, and Employment Agreements with Michael Pilcher, as President and Chief Operating Officer, Tony J. Giuliano, as Vice President, Finance and Administration and Chief Financial Officer and Richard Grondin, as Chief Technology Officer.
Effective November 1, 2009, Thomas M. O’Donnell became President and Chief Executive Officer. For the period from November 1, 2009 to January 31, 2011, Mr. O’Donnell received 50,000 stock options per month while serving as Chief Executive Officer. Effective February 1, 2011, Mr. O’Donnell is entitled to a monthly salary amount based on performance and cashflow position tests and bonuses as may from time to time be payable pursuant to any bonus program which is offered to senior officers or as may from time to time be payable at the discretion of the Board of Directors. Mr. O’Donnell shall also be compensated with 10,000 stock options per month from the 2010 Stock Incentive Plan. Mr. O’Donnell relinguished his role as President on July 12, 2011.
Michael Pilcher was appointed Chief Operating Officer effective April 1, 2010 and President and Chief Operating Officer on July 12, 2011. The Employment Agreement of Michael Pilcher provides that he is entitled to an annual base salary and bonuses as may from time to time be payable pursuant to any bonus program which is offered to senior officers or as may from time to time be payable at the discretion of the Board of Directors. Mr. Pilcher shall also be compensated with 849,910 stock options from the 2010 Stock Incentive Plan.
Tony J. Giuliano was appointed Vice President, Finance and Administration and Chief Financial Officer effective October 4, 2010. The Employment Agreement of Tony J. Giuliano provides that he would be paid an annual base salary and bonuses as may from time to time be payable pursuant to any bonus program which is offered to senior officers or as may from time to time be payable at the discretion of the Board of Directors. Tony J. Giuliano shall also be compensated with 100,000 stock options from the 2010 Stock Incentive Plan.
Richard Grondin was appointed Chief Technology Officer effective November 1, 2009. The Employment Agreement of Richard Grondin provides that he would be paid an annual base salary and bonuses as may from time to time be payable pursuant to any bonus program which is offered to senior officers or as may from time to time be payable at the discretion of the Board of Directors. Richard Grondin shall also be compensated with 360,000 stock options from the 2010 Stock Incentive Plan.
- 37 -
Audit Committee
Audit Committee Charter
The Audit Committee of the Board of Directors of SAND (the "Audit Committee") has a formal charter setting out its mandate and responsibilities that has been reviewed and adopted as amended on June 14, 2005.
Composition of Audit Committee
| Name | Independent | Financially Literate |
| P. Wayne Musselman | Yes | Yes |
| Daniel Benn | Yes | Yes |
| Michael Pesner | Yes | Yes |
The Audit Committee is comprised of three directors, all of whom are independent under applicable Canadian requirements and the rules of the United States Securities and Exchange Commission (the "SEC"). Based on their profiles (please see Item 6A – Directors, for more details), the education and experience of each Audit Committee member is relevant to the performance of his responsibilities as a Committee member. All the members of the Committee are "financially literate" and have the ability to read and understand a set of financial statements. P. Wayne Musselman is the Chairman of the Audit Committee.
Audit Committee Meetings
The Audit Committee meets on a quarterly basis and holds special meetings as circumstances require. During the year ended on July 31, 2011, the Audit Committee held four meetings. All members attended the four meetings of the Audit Committee held during the last fiscal year.
Audit Committee Responsibilities
The Audit Committee assists the Board in its oversight functions as they relate to the accounting, financial reporting, auditing, risk management and internal controls of the Company. The Audit Committee has the following duties and responsibilities:
| | (a) | Reviewing the audited financial statements of the Company and recommending whether such statements should be approved by the Board; |
| | | |
| | (b) | Reviewing and approving the unaudited interim financial statements of the Company; |
| | | |
| | (c) | Recommending to the Board the firm of independent auditors to be nominated for appointment by shareholders at each annual general meeting of the Company and, where necessary, the removal of the independent auditors of the Company; |
| | | |
| | (d) | Reviewing the scope and adequacy of audits to be conducted by the independent auditors of the Company; |
- 38 -
| | (e) | Adopting and annually reassessing formal terms of reference for the independent auditors of the Company; |
| | | |
| | (f) | Monitoring and evaluating the independence and performance of the independent auditors of the Company; |
| | | |
| | (g) | Pre-approving all non-audit services to be provided to the Company by its independent auditors prior to the commencement of such services; |
| | | |
| | (h) | Reviewing all post-audit management letters containing the recommendations of the independent auditors of the Company and the response or follow-up thereto from management; |
| | | |
| | (i) | Reviewing and monitoring the integrity, adequacy and timeliness of the financial reporting and disclosure practices of the Company; |
| | | |
| | (j) | Reviewing and, if deemed advisable, approving all related party transactions as defined in the governing legislation of the Company; |
| | | |
| | (k) | Monitoring the compliance of the Company with legal and regulatory requirements related to financial reporting and disclosure; |
| | | |
| | (l) | Monitoring and evaluating the adequacy of the internal accounting and audit procedures of the Company; |
| | | |
| | (m) | Reviewing and ensuring the acceptability of the accounting principles of the Company; |
| | | |
| | (n) | Identifying the principal financial risks of the Company; |
| | | |
| | (o) | Overseeing reporting on internal controls of management and ensuring that management has designed and implemented an effective system of internal controls; |
| | | |
| | (p) | Annually reviewing and reassessing the adequacy of the duties and responsibilities of the Audit Committee; and |
| | | |
| | (q) | Any other matters that the Audit Committee feels are important to its mandate or that the Board chooses to delegate to it. |
The Audit Committee has established procedures for the receipt, retention and treatment of complaints regarding accounting, internal accounting controls or auditing matters and the confidential, anonymous submission by employees of complaints or concerns regarding questionable accounting or auditing matters. Any employee of the Company or its affiliates may submit a good faith complaint regarding accounting or auditing matters to the management of the Company without fear of dismissal or retaliation of any kind.
It is the responsibility of the Audit Committee to maintain an open avenue of communication between itself, the Auditor and Management of the Company. In performing its role, the Audit Committee is empowered to investigate any matter brought to its attention, with full access to all books, records, accounts, facilities and personnel of the Company. The Audit Committee is also empowered to instruct and retain outside counsel or other experts as necessary.
- 39 -
Governance, Nomination, Human Resources and Compensation Committee
Charter of the Governance, Nomination, Human Resources and Compensation Committee
The Governance, Nomination, Human Resources and Compensation Committee of the Board ("Governance Committee") is governed by a formal charter that details its mandate.
Composition of the Governance Committee
The Governance Committee is composed of Duncan Painter, George Wicker and Daniel Benn, all of whom were non-management and independent directors during the fiscal year ended July 31, 2011 and satisfy the current requirements of The NASDAQ Stock Market relating to independence. Duncan Painter is the Chairman of the Governance Committee.
Governance Committee Meetings
During the year ended July 31, 2011, the Compensation Committee met numerous times.
Governance Committee Responsibilities
The Governance Committee has the following duties and responsibilities:
| | (a) | Developing, monitoring and ensuring the effectiveness of the corporate governance policies and practices of the Company; |
| | | |
| | (b) | Identifying and selecting nominees for election of the Board of Directors of the Company and identifying and proposing to the Board of Directors candidates to fill in the vacancies on the Board of Directors; |
| | | |
| | (c) | Ensuring the independence of the Board of Directors; |
| | | |
| | (d) | Evaluating the effectiveness and performance of individual directors, the Board of Directors and its committees; |
| | | |
| | (e) | Assisting the Board in setting the objectives for the Chief Executive Officer of the Company and evaluating his performance; |
| | | |
| | (f) | Establishing human resources policies and practices, including compensation and recruitment policies and practices for senior management, as well as establishing levels of salary, bonus, benefits and incentives provided to executive officers of the Company and its affiliates; and |
| | | |
| | (g) | Various other matters related to the foregoing as set out in the Charter of the Committee. |
Statement of Corporate Governance Practices
The Company has reviewed its corporate governance practices in light of the guidelines contained inRegulation 58-101 respecting Disclosure of Corporate Governance Practice("Regulation 58-101") of the Canadian Securities Administrators. A description of the Company’s corporate governance practices is set out below in response to the requirements of Regulation 58-101.
- 40 -
Board of Directors Delegation
The Board has delegated to the Chief Executive Officer and senior management the responsibility for day-to-day management of the business of the Company, subject to compliance with the plans approved from time to time by the Board of Directors. In addition to those matters, which must by law or by the Articles of the Company be approved by the Board, the Board retains responsibility for significant changes in the Company’s affairs such as approval of major capital expenditures, debt and equity financing arrangements and significant acquisitions and divestitures.
The Board oversees the identification of the principal risks of the Company's business and the implementation by management of appropriate systems to manage such risks. The Board reviews from time to time organizational matters such as succession planning.
During the fiscal year ended July 31, 2011, the following directors are "independent" pursuant to National Policy 58-201Corporate Governance Guidelines ("NP 58-201") as they qualify as "independent" directors, as such term is defined inRegulation 52-110 respecting Audit Committees: Wayne Musselman, Michael Pesner, Daniel Benn, Duncan Painter and George Wicker.
Effective November 1, 2009, Thomas M. O’Donnell became Chief Executive Officer and is no longer independent.
Directorships
Michael Pesner is presently a director of five other issuers that are reporting issuers (or the equivalent in any jurisdiction), Richmont Mines Inc., Questrare Minerals Ltd., Mint Technology Corp., Bitumen Capital Inc. and Unite Capital Corp..
Orientation and Continuing Education
The Board of Directors of the Company takes the following steps to ensure that all new directors receive orientation regarding the role of the Board, its committees and its directors, and the nature and operation of the Company.
The first step is to assess a new director's set of skills and professional background. This allows the orientation to be customized to that director's needs since different information regarding the nature and operations of the Company's business will be necessary and relevant to each new director. Once determined, one or more existing directors, who may be assisted by the Company's management, provide the new director with the appropriate orientation through a series of meetings, telephone calls and other correspondence.
Orientation and education of directors is an ongoing matter. As such, ongoing informal discussions between management and members of the Board are encouraged and visits to the Company’s operations are organized.
Ethical Business Conduct
The Company is committed to promote the highest standard of ethic and integrity in the pursuance of all of its activities. Furthermore, the directors, officers and employees of the Company are expected to act and to hold their office within the best interests of the Company. The Company expects all directors to act in compliance of all laws and regulations applicable to their office as director of the Company.
- 41 -
In the event any transactions or agreements occur in respect of which a director or executive officer has a material interest, the matter must be initially reviewed by the Audit Committee and is then submitted to the Board of Directors. The Board may implement any measures that it finds necessary in order to ensure the exercise of independent judgment. In the event a director has a material interest in any transaction or agreement, such director will abstain from voting in that regard.
Nomination of Directors
The Board of Directors of the Company does not feel it is necessary to increase the number of directors on the Board at this time. Also with the current absence of a Chairman, the Board of Directors, under the Canada Business Corporations Act, is not mandated to have a Chairman of the Board of Directors but is currently in the process of determining whether a replacement will be nominated. A Chairman of the Board, under the Canada Business Corporations Act, does not have any inherent extra powers over other members of the Board.
The Governance Committee seeks qualified candidates to be considered for nomination as directors. Proposed nominations are subject to review and approval by the Board.
Any new appointees or nominees to the Board of Directors must have a favourable track record in general business management, special expertise in areas of strategic interest to the Company, the ability to devote the time required and a willingness to serve as a director.
Compensation
The Governance Committee evaluates the adequacy of compensation of the directors and the Company’s management. After sufficient review and analysis, the Governance Committee recommends the compensation of the directors and the Company’s management to the Board for approval.
Other Board Committees
As of the date hereof, the Audit Committee and the Governance Committee are the only Board committees created by the Board of Directors.
Assessments
The Governance Committee is responsible for assessing the individual and collective effectiveness of the Board and selecting new directors.
D. Employees
On July 31, 2011, the Company had 44 employees, including 24 full-time employees with SAND Canada, 5 full-time employees and 1 part-time employee with Sand U.S., 5 full-time employees and 1 part-time employee with Sand U.K., 5 full-time employees and 1 part-time employee with Sand Germany and 2 full-time employees with Sand Australia.
On July 31, 2010, the Company had 44 employees, including 23 full-time employees and 1 part-time employee with SAND Canada, and 6 full-time employees and 1 part-time employee with Sand USA, 3 full-time employees and 1 part-time employee with Sand UK and 8 full-time employees and 1 part-time employee with Sand Germany.
- 42 -
On July 31, 2009, the Company had 44 employees, including 25 full-time employees and 1 part-time employee with SAND, and 5 full-time employees with Sand Technology Company ("Sand USA"), 3 full-time employees with Sand Technology Limited ("Sand UK") and 9 full-time employees and 1 part-time employee with Sand Technology Deutschland GmbH ("Sand Germany").
No employee of the Company is represented by a labour union or is covered by a collective bargaining agreement. Since inception, the Company has not suffered any disruptions as a result of labour problems or employee disputes.
E. Share Ownership
The shareholdings of the directors and officers of the Company as at October 21, 2011 are as follows:
Name
| Position Held
| Number and Percentage
of Outstanding Common
Shares Owned | Number of Vested and
Unvested Stock Options
Held |
| Thomas M. O'Donnell | Chief Executive Officer and Director | 1,761,843 (9.2%) | 760,000 vested – 60,000 unvested |
| Duncan Painter | Director | 428,572 (2.2%) | 97,500 vested – 32,500 unvested |
| George Wicker | Director | 377,738 (2.0%) | 75,000 vested – 25,000 unvested |
| P. Wayne Musselman | Director | 102,788 (0.5%) | 97,500 vested – 32,500 unvested |
| Michael Pesner | Director | Nil | 75,000 vested – 25,000 unvested |
| Daniel Benn | Director | Nil | 75,000 vested – 25,000 unvested |
| Michael Pilcher | President and Chief Operating Officer | Nil | 219,426 vested – 630,484 unvested |
| Tony J. Giuliano | Vice-President, Finance and Administration and Chief Financial Officer and Corporate Secretary | 50,000 (0.003%) | Nil vested – 50,000 unvested |
| Richard Grondin | Chief Technology Officer | 6,500 (0.0003%) | 310,000 vested – 50,000 unvested |
| Total Common Shares held by Directors andOfficers and Total Vested and Unvested StockOptions | 2,727,441 (14.3%) | 1,709,426vested–930,484 unvested |
Arrangements Involving the Employees in the Capital of the Company
The Company has an informal employee compensation plan, which also applies to management, pursuant to which, if employees fulfil stated goals with respect to sales revenue, new account penetration, profit contribution and other criteria, their incomes will increase proportionately above the guaranteed base until the specified target income is earned or exceeded. The informal employee compensation plan is not based upon a mathematical formula in the case of management, but is rather subject to individual discussio.
- 43 -
1996 Stock Incentive Plan
On July 8, 1996, the Board of Directors adopted the 1996 Stock Incentive Plan (the "Incentive Plan") pursuant to which the beneficiaries selected by a committee of the Board of Directors may be granted options to subscribe for Common Shares. The Incentive Plan was confirmed, approved and ratified by the shareholders of the Company at the annual and special meeting of the shareholders held on December 17, 1996. On November 9, 1999, by resolution, the directors of the Company amended the Incentive Plan to increase the maximum aggregate number of options to purchase Common Shares which may be granted under the Incentive Plan. This resolution of the directors was confirmed, approved and ratified by the shareholders of the Company at the annual and special meeting of the shareholders held on December 17, 1999. The total number of Common Shares of the Company authorized for grants of options is 1,100,000 (as adjusted to reflect the share subdivision on a two-for-one basis on December 31, 1996) subject to adjustment to take into account changes in the capital structure of the Company.
On November 21, 2005, the Board of Directors approved an amendment to the 1996 Stock Incentive Plan to extend the life of the Incentive Plan for an additional period of ten (10) years. This amendment was confirmed, approved and ratified by the shareholders of the Company at the annual and special meeting of the shareholders held on December 15, 2005. On October 3, 2006, the Board of Directors provided for the amendment of each Stock Incentive Agreement between an optionee and the Company whereby the options granted and outstanding thereunder became exercisable for a period of ten (10) years from July 7, 2006 with immediate vesting for all those outstanding options which have vested on or prior to July 7, 2006.
The Incentive Plan is administered by the Governance Committee of the Board of Directors. The former Options Committee has been dissolved.
The term and number of Common Shares covered by each option, as well as the permitted frequency of exercise of such options, are determined by the Governance Committee at the time the options are granted to the recipients. The number of Common Shares which may be subject to option in favour of a single recipient may not exceed 5% of the outstanding Common Shares of the Company. The exercise price of each option for Common Shares may not be less than the closing price of the Common Shares on the trading day prior to the day the option is granted or, if there was no transaction on that day, the average of the bid and ask prices on that day, less any discount as decided by the Board of Directors within the extent permitted by the applicable regulatory provisions. Options granted under the Incentive Plan may not be assigned or pledged. No financial assistance is available to recipients in connection with the exercise of an option. The Company may terminate the Incentive Plan at any time, subject to vested rights.
During the fiscal year ended July 31, 2011, no stock options were granted, no stock options expired, no stock options were forfeited and no stock options were exercised under the 1996 Stock Incentive Plan.
During the period August 1, 2011 to October 21, 2011, no stock options were granted, expired, forfeited or exercised under the 1996 Stock Incentive Plan.
1996 Stock Option Plan
On July 8, 1996, the Board of Directors adopted the 1996 Stock Option Plan ("Option Plan") pursuant to which the beneficiaries selected by a committee of the Board of Directors may be granted options to subscribe for Common Shares in the Company. The Option Plan was confirmed, approved and ratified by the shareholders of the Company at the annual and special meeting of the shareholders held on December 17, 1996. On November 9, 1999, by resolution, the directors of the Company amended the Option Plan to
- 44 -
increase the maximum aggregate number of options to purchase Common Shares, which may be granted under the Option Plan. This resolution of the directors was confirmed, approved and ratified by the shareholders of the Company at the annual and special meeting of the shareholders held on December 17, 1999. The total number of Common Shares of the Company authorized for grants of options is 900,000 (as adjusted to reflect the share subdivision on a two-for-one basis on December 31, 1996), subject to adjustment to take into account changes in the capital structure of the Company.
On November 21, 2005, the Board of Directors approved an amendment to the Option Plan to extend the life of the Option Plan and of the options granted and outstanding under the Option Plan for an additional period of ten (10) years. This amendment was confirmed, approved and ratified by the shareholders of the Company at the annual and special meeting of the shareholders held on December 15, 2005. On October 3, 2006, the Board of Directors provided for the amendment of each Stock Option Agreement between an optionee and the Company whereby the options granted and outstanding thereunder became exercisable for a period of ten (10) years from July 7, 2006 with immediate vesting for all those outstanding options which had vested on or prior to July 7, 2006.
The Option Plan is administered by the Governnace Committee of the Board of Directors.
The term and number of Common Shares covered by each option, as well as the permitted frequency of exercise of such options, are determined by the Compensation Committee at the time the options are granted to the recipients. The number of Common Shares which may be subject to option in favour of a single recipient may not exceed 5% of the outstanding Common Shares of the Company. The exercise price of each option for Common Shares may not be less than the price of the Common Shares as determined by the Governance Committee within the extent permitted by the applicable regulatory provisions. Options granted under the Option Plan may not be assigned or pledged. No financial assistance is available to recipients in connection with the exercise of an option. Options which expire or are terminated or surrendered or unexercised are thereafter available for the granting of other options. The Company may terminate the Option Plan at any time subject to vested rights.
As at October 21, 2011, 357,000 options had been granted and remained outstanding under the Option Plan and the Incentive Plan and 1,643,000 options remained available for grant under both plans.
During the fiscal year ended July 31, 2011, no stock options were granted, no stock options expired, no stock options were forfeited and no stock options were exercised under the 1996 Stock Option Plan
During the period August 1, 2011 to October 21, 2011, no stock options were granted, expired, forfeited or exercised under the 1996 Stock Option Plan.
Share Award Plan
On November 2, 2006, the Board of Directors of SAND established a Share Award Plan pursuant to which up to 1,000,000 Common Shares of the Company are issuable through direct and immediate issuances without any intervening option grants. Each such share issuance shall be evidenced by a Share Award Agreement that complies with the terms and conditions of the Share Award Plan, and which state the number of Common Shares being awarded, the restrictions imposed on the shares awarded under such Share Award Agreement and such other representations, agreements, terms or conditions as may be required or desirable by the Board of Directors of the Company. The award recipient shall obtain the rights and obligations of a shareholder of the Company with respect to the Common Shares of the Company award under the Share Award Agreement only upon vesting of the award.
On August 28, 2007, the Board of Directors of the Company authorized the award of up to 665,000 Common Shares. On September 30, 2007, the Company granted 402,500 share awards which are
- 45 -
dependant on the award recipients achieving certain defined objectives including continued employment with the Company for a period of 3 years. As of September 30, 2010, following the 3-year employment period and after taking into account terminations and resignations, 277,500 share awards became eligible for issuance to recipients. On December 17, 2010, in lieu of issuing common shares for such share awards, the Board of Directors issued 277,500 stock options from the 2010 Stock Incentive Plan.
2010 Stock Incentive Plan
On November 16, 2010,the Board of Directors of SAND established the 2010 Stock Incentive Plan ("2010 Incentive Plan") pursuant to which the beneficiaries selected by a committee of the Board of Directors may be granted stock options or share awards in the Company. The 2010 Incentive Plan was approved and ratified by the shareholders of the Company at a special meeting of the shareholders held on January 25, 2011. The maximum number of Common Shares of the Company that may be issued resulting from stock options or share awards granted under the 2010 Incentive Plan is 4,000,000 subject to adjustment to take into account changes in the capital structure of the Company.
The 2010 Incentive Plan is administered by the Governance Committee of the Board of Directors.
The term and number of Common Shares covered by each stock option or share award, as well as the permitted frequency of exercise of such stock options or share awards, will be determined by the Compensation Committee at the time the stock options or share awards are granted to the recipients. The number of Common Shares which may be subject to stock options or share awards in favour of a single recipient may not exceed 5% of the outstanding Common Shares of the Company. Stock options or share awards granted under the 2010 Incentive Plan may not be assigned or pledged. No financial assistance is available to recipients in connection with the exercise of a stock option or share award. Stock options or share awards which expire or are terminated or surrendered or unexercised are thereafter available for the granting of other stock options or share awards. The Company may terminate the Incentive Plan at any time subject to vested rights.
As at October 21, 2011, 3,473,583 options had been granted and remained outstanding under the 2010 Incentive Plan and 526,417 options remained available for grant under that plan.
During the fiscal year ended July 31, 2011, 3,295,756 stock options were granted, 27,310 stock options expired, 91,863 stock options were forfeited and 60,000 stock options were exercised under the 2010 Incentive Plan.
During the period from August 1, 2011 to October 2011, zero stock options were granted, zero stock options expired, zero stock options were forfeited and 25,000 stock options were exercised under the 2010 Incentive Plan.
ITEM 7. MAJOR SHAREHOLDERS AND RELATED PARTY TRANSACTIONS
As of October 21, 2011, the Company had 19,116,636 Class “A” Common Shares outstanding. Each Class “A” Common Share entitles its holder to one vote.
- 46 -
A. Major Shareholders
The following are the only persons who, to our knowledge, beneficially own or exercise control or direction over shares carrying more than five percent (5%) of the votes attached to Class A Common Shares of the Company at October 21, 2011:
| Approximate Number of Class A
Common Shares Owned,
Controlled or Directed, Directly
or Indirectly | Percentage of Class A
Common Shares Owned,
Controlled or Directed
|
| Arthur G. Ritchie | 3,598,388 | 18.8% |
| Thomas M. O'Donnell | 1,761,843 | 9.2% |
| Carol Shattner | 1,058,600 | 5.5% |
| Total Common Shares Owned,Controlled or Directed, Directly orIndirectlyby theMajorShareholders | 6,418,831 | 33.5% |
The voting rights of the Class A Common Shares held by the persons identified or referred to above are the same as the voting rights of the Class A Common Shares held by all other shareholders.
To our knowledge, as of October 21, 2011, 14,383,282 Class A Common Shares were held of record by persons whose registered addresses were in the United States. Many of our Class A Common Shares are held in the name of intermediaries.
Except as set forth above, to our knowledge, the Company is not directly or indirectly owned or controlled by another company, by any foreign government or by any other national or legal person severally or jointly.
There are no known contractual arrangements which may result in a change of control of the Company at a subsequent date.
B. Related Party Transactions
1) Arthur G. Ritchie
The Company has entered into the following agreements with Arthur G. Ritchie, a major shareholder and its former Chairmanand former President and Chief Executive Officer, as follows:
| | (a) | During fiscal year 2009, the Company formalized the conditions pertaining to a loan obtained from Arthur G. Ritchie. The loan originated from amounts owed by the Company to Arthur G. Ritchie by virtue of his previous employment contracts as President and Chief Executive Officer. Arthur G. Ritchie ceased to be President and Chief Executive Officer on October 31, 2009. The total amount owing under the loan agreement as at October 31, 2009 was $1,466,677. Under the terms of the loan agreement, the loan is repayable in three (3) principal annual instalments of $488,892 over 3 years on January 1, 2011, 2012 and 2013. The loan bears interest at 15% that is payable semi-annually on January 1 and June 30 of each year. The amount may be prepaid at any time by the Company without penalty. In the event of default to pay an amount when due, Arthur G. Ritchie has the right to convert all outstanding amounts owed to him hereunder into common |
- 47 -
shares of the Company based on the average closing price of the shares on the OTC Bulletin Board for the month immediately preceding the month in which such right is exercised. In addition and also upon default, the significant shareholder shall have the right to require the Company to purchase all common shares in the capital stock of the Company owned directly or indirectly by Arthur G. Ritchie at a purchase price per share equal to the greater of:
| | i) | the average closing price of the shares on the OTC Bulletin Board over the previous 30-day period plus 15%, or |
| | | |
| | ii) | the book value of the shares as determined by the auditors of the Company. |
As at July 31, 2011, an amount of $1,685,411 (July 31, 2010 - $1,407,874), including accrued interest of $481,751 (July 31, 2010 - $204,214), was outstanding under the loan agreement.
As at July 31, 2011, the Company was in default as it did not make its January 1, 2011 installment. However, a Standstill Agreement was signed between the Company and Arthur G. Ritchie, effective February 1, 2011, and the default was cured subsequent to the year end as the Company paid the significant shareholder the amounts due as described in Item 18., Financial Statements (Note 20).
In conjunction with the original loan agreement, the Company also issued 103,061 warrants to Arthur G. Ritchie, with each warrant entitling the holder to purchase one Class "A" Common Share of the Company at a price of US$0.44 per share and each warrant being valid for the term of the agreement. The residual valuation method was used to allocate the proceeds between the debt and equity components of the shareholder loan. It was determined that the value of the debt component would comprise the entire face value of the loan since the loan had no maturity date. Hence, the value of the equity component was determined to be nil. These warrants expired during the fiscal year 2010.
| | (b) | The Company, effective November 1, 2009, also signed a Consulting Agreement and a Marketing and Sales Assistance Agreement with Arthur G. Ritchie. The Consulting Agreement provides for a fixed payment on the first of each month in the amount of $21,013 and expires on October 31, 2011. Payments made under the consulting agreement during fiscal year 2011 amounted to $210,130 (2010 - $188,937) with a balance owing at July 31, 2011 of $42,026 (July 31, 2010 – Nil). |
| | | |
| | | Under the Marketing and Sales Assistance Agreement, the Company and Arthur G. Ritchie may identify prospective customers for the Company`s products and agree to designate such prospects as a registered opportunity. The Marketing and Sales Assistance Agreement provides for the payment of funds based on a percentage of sales proceeds received from a registered opportunity and which were received within a stipulated period following the date of registration of the opportunity. The Marketing and Sales Assistance Agreement expired on October 31, 2010. There were no payments made under the marketing and sales assistance agreement during fiscal year 2011 or fiscal year 2010. |
| | | |
| | (c) | Arthur G. Ritchie was entitled to, under his previous employment contracts, bonuses based on the achievement of gross revenues resulting from the licensing, sale or other disposition of the Company’s Nucleus software products. The bonuses terminated effective October 31, 2009 when he ceased to be the President and Chief Executive Officer. As at July 31, 2011 and 2010, bonuses payable amounted to $165,386 and $165,386, respectively. |
- 48 -
During fiscal year 2008, an Inter-Creditor Priority Agreement was signed between Arthur G. Ritchie (loans disclosed under a), b) and c) above) and the holders of the Convertible Debentures (collectively the “parties”), at the time when the Company issued the Convertible Debentures. The parties agreed that the sums owing under the Convertible Debentures will be paid by the Company to the Convertible Debenture holders in priority to the sums owed by the Company to Arthur G. Ritchie. Specifically, for every $2 paid to the Convertible Debenture holders, the Company shall remit $1 to Arthur G. Ritchie, representing the repayment of principal only. The Inter-Creditor Priority Agreement was amended on October 31, 2009 pursuant to which the parties agreed that the sums owing under the Convertible Debentures will be paid by the Company to the holders of the Convertible Debentures pari passu to the sums owing by the Company to Arthur G. Ritchie such that for every $1 paid to the Convertible Debenture holders, the Company shall remit $1 to Arthur G. Ritchie.
2) Thomas M. O’Donnell
During fiscal year 2011 and fiscal year 2010, we obtained various loans from the Chief Executive Officer, who is also a shareholder, in the form of Promissory Notes for a total amount of $341,621 (U.S.$325,000) (2011: $41,728 (U.S.$40,000); 2010: 299,893 (U.S.$285,000)). Under the terms of the Promissory Notes, the amounts are repayable within 30 days of receipt of a written demand from the noteholder. The Promissory Notes bear interest at 10% payable on the last business day of each calendar month. As at July 31, 2010, an amount of $300,893 (U.S.$287,847), including accrued interest of $2,927 (U.S.$2,847), was outstanding on the Promissory Notes. During the year ended July 31, 2011, a private placement was completed which converted the principal value amounting to $341,621 (U.S.$325,000) of the Promissory Notes. As at July 31, 2011, an amount of accrued interest of $22,014 (U.S.$23,040) was outstanding.
3) Private Placements
In May 2007, the Company completed a non-brokered private placement where the Company issued 1,500,000 Common Shares at a price of US$0.40 share for total cash proceeds of $675,795. In addition, the Company issued 750,000 share purchase warrants entitling two shareholders to purchase up to 750,000 shares of the Company at a price of US$0.60 for three years. One of these shareholders is Arthur G. Ritchie, the former Chairman and former President and Chief Executive Officer of the Company.
In April 2008, the Company issued secured convertible debentures ("Convertible Debentures") on a private placement basis and received gross proceeds of $1,009,819 (U.S.$1,002,600) to investors, one of whom is Thomas M. O’Donnell, the Chief Executive Officer of the Company, representing a total of 1,114 units. Each unit consists of one 8% Convertible Debenture due December 31, 2017 and 1,000 share purchase warrants of the Company. Each warrant entitles the holder to purchase one additional common share (“Warrant Share”) of the Company at a price of U.S.$0.70 per share. Interest is calculated at the rate of 8% per annum, payable in common shares at a rate of U.S.$0.45 per share. The financing is secured by a first rank hypothec on all of the Company’s property and assets, movable and immovable, corporeal and incorporeal, present and future, for the principal accrued interest amounts.
In November 2009, the Company completed a non-brokered private placement where the Company issued 785,715 units for U.S.$0.70 per unit, for total gross proceeds of $587,835 (U.S.$550,000) to investors, one of whom is Thomas M. O’Donnell, the Chief Executive Officer of the Company. Each unit consists of two Class A Common Shares and one warrant to purchase one Class A Common Share for an exercise price of U.S.$0.50 per share.
- 49 -
In March 2011, the Company completed a non-brokered private placement where the Company issued 1,071,432 units for U.S.$0.70 per unit, for total gross proceeds of $775,073 (U.S.$750,000) to investors, one of whom is Thomas M. O’Donnell, the Chief Executive Officer of the Company. Each unit consists of two Class A Common Shares and one warrant to purchase one Class A Common Share for an exercise price of U.S.$0.50 per share.
C. Interests of Experts and Counsels
Not applicable.
ITEM8. FINANCIAL INFORMATION
A. Consolidated Statements and Other Financial Information
Consolidated Financial Statements
The Company’s consolidated financial statements are set out under Item 18.
Legal Proceedings
There are no on-going legal proceedings.
Dividend Record and Policy
The Company has never paid any dividend on its Common Shares. The Company’s present policy is to retain any earnings to finance future growth. Dividends on the Common Shares paid to non-residents of Canada would generally be subject to withholding tax under theIncome Tax Act (Canada) at the rate of 25%. Such rate may be subject to reduction under the provisions of a tax treaty between Canada and the country in which the recipient is resident. The Canada-U.S. Income Tax Convention (1980) (the "Convention") provides for a general reduction in the rate of withholding tax to 15% on dividends paid on shares of a Company resident in Canada (such as the Company) to a resident of the United States, and also provides for a further reduction to 5% where the beneficial owner of the dividend is a Company, resident in the United States, which owns at least 10% of the voting shares of the Company paying the dividend.
B. Significant Changes
Subsequent to July 31, 2011, the Company had the following significant events:
| | a) | On September 7, 2011, the Company completed a bridge loan in the amount of $1,000,000 from a group of investors. The bridge loan has a maturity date of November 30, 2011 with interest at 15% and warrants valued at $500,000 at a price of U.S.$0.50 per warrant Interest was prepaid from the proceeds of the bridge loan. |
| | | |
| | b) | On October 4, 2011, the Company completed the sale of its SAP Information Lifecycle Management (ILM) Product Line to a third party for a consideration of U.S.$8,000,000. After deductions for earn-out milestones, customers’ consent holdback, an escrow amount relating to representations and warranties and other amounts, the Company received initial proceeds of U.S.$4,172,465. The Company anticipates it will be able to meet all its obligations under the |
- 50 -
| | | Asset Purchase Agreement governing this transaction to collect the remaining amount due from the sale. |
| | | |
| | c) | Further to a settlement agreement signed on September 6, 2011 with a significant shareholder referred to in Note 8, the initial proceeds received on the above-mentioned sale were used to pay a pro-rata amount owed to the significant shareholder in the amount of $1,329,781. |
ITEM 9. THE OFFER AND LISTING
A. Offer and listing details
The following tables sets forth the price ranges and volume of Common Shares during the periods indicated on the OTCBB, and before August 5, 2005, on the Nasdaq SmallCap Market System.
| Quarter Ended | | High | | Low | | Volume |
| July 31, 2011 | | 0.63 | | 0.37 | | 305,486 |
| April 30, 2011 | | 0.62 | | 0.34 | | 383,984 |
| January 31, 2011 | | 0.42 | | 0.28 | | 335,877 |
| October 31, 2010 | | 0.46 | | 0.25 | | 215,699 |
| July 31, 2010 | | 0.56 | | 0.26 | | 174,174 |
| April 30, 2010 | | 0.53 | | 0.32 | | 305,235 |
| January 31, 2010 | | 0.50 | | 0.29 | | 234,468 |
| October 31, 2009 | | 0.50 | | 0.25 | | 216,644 |
| July 31, 2009 | | 0.45 | | 0.30 | | 312,065 |
| April 30, 2009 | | 0.40 | | 0.26 | | 273,716 |
| January 31, 2009 | | 0.57 | | 0.28 | | 642,333 |
| October 31, 2008 | | 0.81 | | 0.48 | | 345,400 |
| July 31, 2008 | | 0.85 | | 0.70 | | 539,300 |
| April 30, 2008 | | 0.55 | | 0.31 | | 648,500 |
| January 31, 2008 | | 0.50 | | 0.31 | | 578,400 |
| October 31, 2007 | | 0.55 | | 0.40 | | 599,400 |
| July 31, 2007 | | 0.58 | | 0.35 | | 667,400 |
| April 30, 2007 | | 0.65 | | 0.40 | | 361,600 |
| January 31, 2007 | | 0.70 | | 0.40 | | 460,900 |
| October 31, 2006 | | 0.48 | | 0.38 | | 348,500 |
- 51 -
| Fiscal Year Ended(1) | | High | | Low | | Volume |
| July 2011 | | 0.63 | | 0.25 | | 1,241,046 |
| July 2010 | | 0.56 | | 0.25 | | 930,521 |
| July 2009 | | 0.81 | | 0.26 | | 1,573,394 |
| July 2008 | | 0.85 | | 0.31 | | 2,365,600 |
| July 2007 | | 0.70 | | 0.35 | | 1,838,400 |
B. Plan of Distribution
Not applicable.
C. Markets
The Company’s Common Shares have been traded in the United States on the OTCBB since August 9, 2005, under the symbol "SNDTF". Before August 9, 2005, the Company's Common Shares were listed on the Nasdaq SmallCap Market System.
In 2008, the management of SAND had learned that its Common Shares had been listed for trading on the Berlin-Bremen Stock Exchange (the "Berlin Exchange") under the symbol "SD1A", without the Company's prior knowledge, consent or authorization. Any authorized broker may list a company on the Berling Exchange by filing an application with the administration of the exchange for a permit to trade a company's stock already listed on and regulated by other markets. SAND does not anticipate that this will materially affect the price of its Common Shares.
On January 30, 2008, SAND applied to theAutorité des marchés financiers (the "AMF"), the securities regulatory authority in the Province of Québec in Canada to become reporting issuer in the Province of Québec in order to allow its securities to be freely tradeable in the province (subject to applicable resale restriction periods). On April 15, 2008, the application was granted and SAND became a reporting issuer in the Province of Québec and is now subject to the disclosure requirements of the AMF.
D. Selling Shareholders
Not applicable.
E. Dilution
Not applicable.
F. Expenses of the issue
Not applicable.
- 52 -
ITEM 10. ADDITIONAL INFORMATION
A. Share Capital
Not applicable.
B. Memorandum and Articles of Association
SAND was incorporated on December 10, 1982 under the provisions of the CBCA. The articles of the Company place no restrictions upon the Company's objects and purposes.
Directors’ Powers
Pursuant to the articles and the by-laws of the Company and the requirements of the CBCA, the board of directors must consist of not fewer than three (3) and not more than eleven (11) directors. A majority of the number of directors appointed constitutes a quorum at any meeting of directors, provided, however, that no business may be transacted at a meeting of directors unless at least one-quarter of the directors present are resident Canadians. The duty of the directors is to manage or supervise the management of the business of the Company.
There is no provision in the by-laws that imposes a requirement in respect of a director’s power to vote on a proposal, arrangement or contract in which the director is materially interested. The CBCA provides that a director must disclose to the Company, in writing or by requesting to have it entered in the minutes of meetings of directors or of meetings of committees of directors, the nature and extent of any interest that he or she has in a material contract or material transaction, whether made or proposed, with the Company, if the director (a) is a party to the contract or transaction; (b) is a director, or an individual acting in a similar capacity of a party to the contract or transaction; or (c) has a material interest in a party to the contract or transaction.
The by-laws of the Company state that the directors may fix the remuneration of the directors and that the directors shall be paid such remuneration for their services as the board may from time to time determine. The directors are also entitled to be reimbursed for travel and other expenses properly incurred by them in attending meetings of the board or any committee of the board of directors. Nothing in the by-laws precludes any director from serving the Company in any other capacity and receiving remuneration for such services.
The articles of the Company state that without limiting the borrowing powers of the Company as set forth in the CBCA, the board may from time to time on behalf of the Company without authorization of the shareholders (a) borrow money upon the credit of the Company; (b) issue, reissue, sell or pledge debt obligations of the Company; (c) to the extent permitted by the CBCA, give a guarantee on behalf of the Company to secure performance of an obligation of any person; and (d) mortgage, hypothecate, pledge or otherwise create a security interest in all or any property of the Company owned or subsequently acquired to secure any obligation of the Company.
The directors may, by resolution, make, amend or repeal any by-laws that regulate the business or affairs of the Company. Any resolution making, amending or repealing any by-laws of the Company must be submitted to the next following shareholders meeting for ratification by the shareholders who may by ordinary resolution confirm, reject or amend the by-law, amendment or repeal.
The powers of the directors set forth in the articles of the Company may be amended by special resolution. A special resolution is a resolution passed by a majority of not less than two-thirds (2/3) of the
- 53 -
votes cast by shareholders of the Company who being entitled to do so, vote in person or by proxy at an annual or special meeting of shareholders of the Company. Under the CBCA, an ordinary resolution of shareholders requires approval by a majority of the votes cast at a meeting of shareholders, present in person or represented by proxy.
Election and Qualifications of Directors
The directors of the Company stand for election at the annual meeting of shareholders and there are no staggered terms. There is no cumulative voting for directors of the Company. There is no provision in the articles or by-laws that imposes a requirement for retirement or non-retirement of directors.
There is no provision in the Company’s articles or by-laws that a director be required to hold a share in the capital of the Company as a qualification for his office, but he must be qualified to become or act as a director as required by the CBCA. The CBCA provides that no person is qualified to act as a director if that person is less than 18 years of age; is a person who has been found to be a person of unsound mind by a court in Canada; a person who is not an individual; or is a person who has the status of bankrupt.
The CBCA provides that a director of a Company may be removed if the shareholders by ordinary resolution at a special meeting vote to remove a director or directors from office.
Meetings
The CBCA provides that the Company must call an annual meeting of its shareholders not later than 15 months after holding the last preceding annual meeting but no later than 6 months after the end of the Company's preceding financial year. The Company must give notice of any meeting to its shareholders entitled to receive notice not more than 60 days prior to and not less than 21 days before the date of meeting. The CBCA requires the directors of a company to provide with the notice of a general meeting a form of proxy for use by every member entitled to vote at such meeting as well as an information circular containing prescribed information regarding the matters to be dealt with and the conduct of the meeting.
Under the CBCA, the directors of the Company may call a meeting of shareholders and one or more shareholders holding not less than 5% of the issued voting shares of the Company may give notice to the directors requiring them to call and hold a meeting.
Limitations on Ownership of Securities
Except as described below under "Exchange Controls", there are no limitations on the right to own securities imposed by foreign law to the Company’s knowledge or by the articles of the Company.
Change in Control of Company
There are no provisions in the Company’s articles or by-laws that would have the effect of delaying, deferring, or preventing a change in control of the Company and that would operate only with respect to a merger, acquisition or corporate restructuring of the Company or its subsidiaries.
Ownership Threshold
There are no provisions in the articles or by-laws governing the ownership threshold above which shareholder ownership must be disclosed.
- 54 -
Description of Share Capital
The authorized share capital of the Company consists of an unlimited number of Class A Common Shares, all without par value, and an unlimited number of Class B Shares, issuable in series, all without par value, of which Class B, Series A Shares have been authorized.
Class A Common Shares
The Class A Common Shares of the Company have the following rights, privileges, restrictions and conditions:
Dividends: Subject to the prior rights of the holders of the Class B Shares and any other shares ranking senior to the Class A Common Shares with respect to priority in the payment of dividends, the holders of Class A Common Shares are entitled to receive dividends and the Company must pay dividends thereon, as and when declared by the Board of Directors of the Company out of moneys properly applicable to the payment of dividends, in such amount and in such form as the Board of Directors of the Company may from time to time determine and all dividends which the Board of Directors of the Company may declare on the Class A Common Shares must be declared and paid in equal amounts per share on all Class A Common Shares at the time outstanding.
Dissolution: In the event of the dissolution, liquidation or winding-up of the Company, whether voluntary or involuntary, or any other distribution of assets of the Company among its shareholders for the purpose of winding-up its affairs, subject to the prior rights of the holders of the Class B Shares and any other shares ranking senior to the Class A Common Shares with respect to priority in the distribution of assets upon dissolution, liquidation, winding-up or distribution for the purpose of winding-up, the holders of the Class A Common Shares are entitled to receive the remaining property and assets of the Company.
Voting Rights: The holders of the Class A Common Shares are entitled to receive notice of and to attend all meetings of the shareholders of the Company and have one vote for each Class A Common Share held at all meetings of the shareholders of the Company, except meetings at which only holders of another specified class or series of shares of the Company are entitled to vote separately as a class or series.
There are no redemption or sinking fund provisions relating to the Class A Common Shares and the Class A Common Shares are fully paid and non-assessable.
Class B Shares
The Class B Shares, as a class, have the following rights, privileges, restrictions and conditions:
- Directors' Authority to Issue in One or More Series: The Board of Directors of the Company may issue the Class B Shares at any time and from time to time in one or more series. Before the first shares of a particular series are issued, the Board of Directors of the Company must fix the limited or unlimited number of shares in such series and must determine, subject to the limitations set out in the articles, the designation, rights, privileges, restrictions and conditions to be attached to the shares of such series including, without limitation, the rate or rates, amount or method or methods of calculation of dividends thereon, the time and place of payment of dividends, whether cumulative or non-cumulative or partially cumulative and
- 55 -
whether such rate, amount or method of calculation shall be subject to change or adjustment in the future, the currency or currencies of payment of dividends, the consideration and the terms and conditions of any purchase for cancellation, retraction or redemption rights (if any) (but in no event shall the voting rights attributable to a Class B Share exceed those attributable to a Class A Common Share), the conversion or exchange rights attached thereto (if any), the voting rights attached thereto (if any), and the terms and conditions of any share purchase plan or sinking fund with respect thereto. Before the issue of the first shares of a series, the Board of Directors of the Company shall send to the Director (as defined in the CBCA) articles of amendment containing a description of such series including the designation, rights, privileges, restrictions and conditions determined by the Board of Directors of the Company.
- Ranking of Class B Shares: No rights, privileges, restrictions or conditions attached to a series of Class B Shares may confer upon a series a priority in respect of dividends or return of capital over any other series of Class B Shares then outstanding. The Class B Shares are entitled to priority over the Common Shares of the Company and over any other shares of the Company ranking junior to the Class B Shares with respect to priority in the payment of dividends and the distribution of assets in the event of the liquidation, dissolution or winding-up of the Company, whether voluntary or involuntary, or any other distribution of the assets of the Company among its shareholders for the purpose of winding-up its affairs. If any cumulative dividends or amounts payable on a return of capital in respect of a series of Class B Shares are not paid in full, the Class B Shares of all series must participate rateably in respect of such dividends, including accumulations, if any, in accordance with the sums that would be payable on such shares if all such dividends were declared and paid in full, and in respect of any repayment of capital in accordance with the sums that would be payable on such repayment of capital if all sums so payable were paid in full; provided however, that in the event of there being insufficient assets to satisfy in full all such claims to dividends and return of capital, the claims of the holders of the Class B Shares with respect to repayment of capital must first be paid and satisfied and any assets remaining thereafter must be applied towards the payment and satisfaction of claims in respect of dividends. The Class B Shares of any series may also be given such other preferences over the Common Shares and over any other shares ranking junior to the Class B Shares as may be determined in the case of such series of Class B Shares.
- Voting Rights: Except as otherwise required by law or in accordance with any voting rights which may from time to time be attached to any series of Class B Shares, the holders of the Class B Shares as a class are not entitled as such to receive notice of, to attend or to vote at any meeting of the shareholders of the Company.
- Approval of Holders of Class B Shares: The rights, privileges, restrictions and conditions attaching to the Class B Shares as a class may be added to, changed or removed but only with the approval of the holders of the Class B Shares given as hereinafter specified.
The approval of the holders of Class B Shares to add to, change or remove any right, privilege, restriction or condition attaching to the Class B Shares as a class or to any other matter requiring the consent of the holders of the Class B Shares as a class may be given in such manner as may then be required by law, subject to a minimum requirement that such approval shall be given by resolution passed by the affirmative vote of at least two-thirds of the votes cast at a meeting of the holders of Class B Shares duly called for that purpose. The formalities to be observed in respect of the giving of notice of any such meeting or any adjourned meeting and the conduct thereof shall be those from time to time required by the CBCA (as from time to time amended, varied or replaced) and prescribed in the by-laws of the
- 56 -
Company with respect to meetings of shareholders. On every poll taken at a meeting of holders of Class B Shares as a class, each holder entitled to vote thereat shall have one vote in respect of each Class B Share held by him.
Class B, Series A Shares
The first series of the Class B Shares of the Company consists of 20,000,000 shares and no more and is designated as the Class B, Series A Shares (the "Class B, Series A Shares") and in addition to the preferences, rights, privileges, restrictions and conditions attaching to all of the Class B Shares as a class, the rights, privileges, restrictions and conditions attaching to the Series A Shares are as follows:
Voting Rights
Each holder of Class B, Series A Shares shall be entitled to receive notice of and to attend all meetings of shareholders of the Company, except meetings at which only holders of other classes or series of shares are entitled to attend, and at all such meetings shall be entitled to a number of votes equal to the number of Class A Common Shares of the Company then issuable upon the conversion of the Class B, Series A Shares into Class A Common Shares and to vote together with the holders of Class A Common Shares of the Company.
Cumulative Dividends
The holders of the Class B, Series A Shares shall be entitled to receive and the Company shall pay to them, always in preference and priority to any payment of dividends on the Class A Common Shares of the Company and any other Shares of the Company ranking junior to the Class B, Series A Shares, as and when declared by the Board of Directors of the Company out of moneys of the Company properly applicable to the payment of dividends, fixed, cumulative cash dividends at the annual rate per share of 7% of the amount equal to the amount recorded in the stated capital account maintained in respect of the Class B, Series A Shares outstanding payable quarterly, by cheque of the Company or in kind. Such dividend on any particular Class B, Series A Share shall accrue and be cumulative from the date of issue of such Class B, Series A Share. In the event the price of the Common Shares of the Company is more than 200% of the conversion price of the Class B, Series A Shares for thirty (30) consecutive trading days, and provided that a Registration Statement has been declared effective by the the S.E.C. or 365 days have passed since the initial issue of the Class B, Series A Shares, the Company shall cease paying dividends.
Liquidation, Dissolution or Winding-Up
In the event of the liquidation, dissolution or winding-up of the Company, whether voluntary or involuntary, or any other distribution of assets of the Company among its shareholders for the purpose of winding-up its affairs, the holders of the Class B, Series A Shares shall be entitled to receive the amount received by the Company upon initial issue in respect of each Class B, Series A Share plus all accrued and unpaid cumulative dividends before any amount shall be paid to the holders of the Common Shares or any other shares ranking junior to the Class B, Series A Shares. Except as provided above, the holders of the Class B, Series A Shares shall not be entitled to any further participation in the assets of the Company.
Modification Procedure
The rights, privileges, restrictions and conditions attached to the Class B, Series A Shares may be added to, changed or removed only with the prior approval of the holders of the Class B, Series A Shares given
- 57 -
as specified herein, in addition to any vote or authorization required by law or the articles of the Company.
Any approval of the holders of Class B, Series A Shares with respect to the modification of the rights, privileges, restrictions and conditions attached to the Class B, Series A Shares or to any other matter requiring the consent of the holders of the Class B, Series A Shares shall be given in such manner as may then be required by law, subject to a minimum requirement that such approval be given by resolution passed by the affirmative vote of at least two-thirds of the votes cast by the holders of Class B, Series A Shares who voted in respect of that resolution at a meeting of the holders of the Class B, Series A Shares duly called for that purpose at which the holders of at least fifty per cent (50%) of the outstanding Class B, Series A Shares are present in person or represented by proxy, or, if such quorum is not present at such meeting, at an adjournment thereof at which the holders of twenty-five per cent (25%) Class B, Series A Shares then present in person or represented by proxy shall constitute a quorum for all purposes. The formalities to be observed with respect to proxies, the giving of notice and the conduct of any such meeting or any adjourned meeting shall be those from time to time prescribed by the articles and by-laws of the Company or otherwise prescribed by law with respect to meetings of shareholders. On every poll taken at every meeting of holders of Class B, Series A Shares, each holder entitled to vote thereat shall be entitled to one vote for each Class B, Series A Share held by such holder.
Conversion Rights
The holders of the Class B, Series A Shares shall have the right at any time to convert the Class B, Series A Shares into a number of Class A Common Shares of the Company equal to the amount received by the Company upon the initial issue of each Class B, Series A Share plus all accrued and unpaid cumulative dividends divided by the conversion price of $0.40 per Class B, Series A Share (the "Conversion Price").
The conversion privilege herein provided for may be exercised by notice in writing given to the Company at its registered office, accompanied by the certificate or certificates representing the Class B, Series A Shares in respect of which the holder thereof desires to exercise such right of conversion. Such notice shall be signed by such holder or his duly authorized attorney and shall specify the number of Class B, Series A Shares which the holder desires to have converted. If less than all the Class B, Series A Shares represented by a certificate or certificates accompanying any such notice are to be converted, the holder shall be entitled to receive, at the expense of the Company, a new certificate representing the number of Class B, Series A Shares comprised in the certificate or certificates surrendered as aforesaid which are not to be converted.
On any conversion of Class B, Series A Shares the share certificates for Common Shares of the Company resulting therefrom shall be issued in the name of the registered holder of the Class B, Series A Shares converted or in such name or names as such registered holder may direct in writing, provided that such registered holder shall pay any applicable security transfer taxes. In either instance the transfer form on the back of the certificates in question shall be endorsed by the registered holder of the Class B, Series A Shares or his duly authorized attorney, with signature guaranteed in a manner satisfactory to the Company, provided that the Company may wave the requirement for any such guarantee.
In the event that the Company issues Class A Common Shares, Class B Shares or other securities at a price which is less than the then current conversion price of the Class B, Series A Shares, the conversion price of the Class B, Series A Shares shall be reduced to the price at which the Class A Common Shares, Class B Shares or other securities are issued. The following issuances of securities shall not bring about the foregoing reduction in the conversion price: (i) securities issued upon the conversion of any Class B, Series A Shares; (ii) securities issued upon the conversion of any debenture, warrant, option or other convertible security; and (iii) Class A Common Shares of the Company (or options or rights or purchase
- 58 -
such Class A Common Shares) issued or issuable to employees, directors, officers or consultants pursuant a plan approved by the Board of Directors of the Company.
Change of Rights of Shareholders
The CBCA requires the consent by special resolution of a majority of not less than two thirds (2/3) of the votes cast by the shareholders entitled to vote in order to change the rights of holders of shares, including the designation of all or any shares, and any addition, change or removal of rights, privileges, restrictions and conditions, including rights to accrued dividends, in respect of all or any shares, whether issued or unissued.
C. Material Contracts
The material contracts concluded by the Company for the two years immediately preceding publication of this Report are as follows:
The Company is a party to the Asset Purchase Agreement dated October 4, 2011 (the "Asset Purchase Agreement") among the Company, STSI Licensing, LLC, Sand Technology Corporation, Sand Technology Limited, Sand Technology (Ireland) Limited, Sand Technology Deutschland GMB, Sand Technology Australia Pty Ltd, and Informatica Software, Limited. Under the terms of the Asset Purchase Agreement, the Company and its subsidiaries sold certain of their assets relating to their Nearline and SAP Nearline lines of business for consideration of up to US$8 million. After deductions for earn-out milestones, customers’ consent holdback, an escrow amount relating to representations and warranties and other amounts, the Company received initial proceeds of U.S.$4,172,465 at the closing of this transaction. In connection with this transaction, the Company entered into a Restricted Covenants Agreement dated October 4, 2011 (the "Restrictive Covenants Agreement") pursuant to which the Company agreed to not, and to ensure that its affiliates do not, engage in certain activities competitive with the business sold under the Asset Purchase Agreement for a period of two years after the date of the Restricted Covenants Agreement.
On September 7, 2011, the Company completed a bridge loan financing in the amount of $1,000,000 from a group of investors. The bridge loan has a term of three months with interest at 15% and is entirely repayable at its maturity date of November 30, 2011. Interest was prepaid from the proceeds of the bridge loan.
In March 2011, the Company completed a non-brokered private placement where the Company issued 1,071,432 units for U.S.$0.70 per unit, for total gross proceeds of U.S.$750,000 to investors, one of whom is Thomas M. O’Donnell, the Chief Executive Officer of the Company. Each unit consists of two Class A Common Shares and one warrant to purchase one Class A Common Share for an exercise price of U.S.$0.50 per share.
- Please see Item Item 6B - Compensation and Item 7B - Related Party Transactions for contracts entered into by SAND with its directors and officers.
D. Exchange Controls
Other than as provided in theInvestment Canada Act (Canada) (the "Investment Act"), there are currently no limitations imposed by Canadian laws, decrees or regulations that restrict the import or export of
- 59 -
capital, including foreign exchange controls, or that affect the remittance of dividends to non-resident holders of the Company’s securities. However, any such remittances of dividends paid to United States residents are subject to withholding tax at a rate equal to a maximum of 15% of the amount paid (see Section E – Taxation under Item 10 – Additional Information).
The following discussion summarises the material features of the Investment Act, in its present form, for a non-resident of Canada who proposes to acquire Common Shares of the Company. The Investment Act regulates the acquisition of control of a Canadian business by a non-Canadian as defined under the Investment Act. With respect to the Company, an acquisition of control is considered to be the acquisition of the majority of its Common Shares. However, if a non-Canadian acquires more than one-third of the voting shares of the Company, but less than a majority, there is a presumed acquisition of control unless it can be established that the Company is not controlled in fact by the acquirer. All acquisitions of control of a Canadian business are notifiable (which requires that a notification form be submitted to Investment Canada within thirty days after the implementation of the investment) unless the investment is reviewable. If the investment is reviewable, the investment may not be implemented until the Minister responsible for the Investment Act is, or has been deemed to be, satisfied that the investment is likely to be of net benefit to Canada.
Where either the acquirer is, or the Company is presently controlled by, a WTO investor (as that term is defined in the Investment Act), a direct acquisition of control of the Company will only be reviewable if the value of the Company’s assets, as shown on its audited financial statements for the most recently completed fiscal year, is equal to or greater than $223 million. This amount varies each year based on the rate of growth in Canadian gross domestic product. Other direct acquisitions of control are reviewable if the value of the assets of the Company, as calculated above, is equal to or greater than $5 million. The $5 million threshold for review also applies with respect to the acquisition of control of any Canadian business that provides any financial services or transportation services, is a cultural business, or is engaged in the production of uranium and owns an interest in or producing uranium property in Canada.
Indirect acquisitions of control (acquisitions of control of an entity which in turn controls the Company) are not reviewable under the Investment Act if the acquirer is a WTO investor or if the Company is controlled by a WTO investor. Otherwise, an indirect acquisition will be reviewable if the value of the Company’s assets is $50 million or more, or if the value of the Company’s assets acquired in the total transaction are in Canada or the acquisition is not effected through the acquisition of control of a foreign Company.
Certain types of transactions are exempt from application of the Investment Act including acquisitions of control of the Company:
| | (a) | by the acquisition of voting shares or the voting interests by any person in the ordinary course of that person’s business as a trader or dealer in securities; |
| | | |
| | (b) | in connection with the realization of security granted for a loan or other financial assistance and not for any purpose related to the Investment Act; |
| | | |
| | (c) | for facilitating its financing and not for any purpose related to the Investment Act on the condition that the acquirer divest control within two years after control was acquired; and |
| | | |
| | (d) | by reason of an amalgamation, merger, consolidation or corporate reorganization following which the ultimate or indirect control in fact of the Company through the ownership of voting interests remains unchanged. |
- 60 -
There are currently no limitations on the right of foreign or non-resident owners of Common Shares to hold or vote such securities imposed by Canadian law or the Company’s charter or other constituent documents.
E. Taxation
Certain Canadian Federal Income Tax Consequences
The discussion under this heading summarises the material Canadian federal income tax consequences of acquiring, holding and disposing of Common Shares of the Company for a shareholder of the Company who is not resident in Canada but is resident in the United States who benefits from the provisions of the Convention and who will acquire and hold Common Shares of the Company as capital property for the purpose of theIncome Tax Act (Canada) (the "Tax Act"). This summary does not apply to a shareholder who carries on business in Canada through a "permanent establishment" situated in Canada or who has a fixed tax base regularly available to him through which he or she performs independent personal services in Canada if the shareholder’s holding in the Company is effectively connected with such permanent establishment or fixed base. This summary is based on the provisions of the Tax Act and the regulations thereunder and on the Company’s understanding of the administrative practices of the Canada Revenue Agency and takes into account all specific proposals to amend the Tax Act or regulations made by the Minister of Finance of Canada to November 16, 2010. It has been assumed that there will be no other relevant amendment of any governing law although no assurance can be given in this respect. This discussion is general only and is not a substitute for independent advice from a shareholder’s own Canadian and U.S. tax advisors.
The provisions of the Tax Act are subject to income tax treaties to which Canada is a party, including the Convention and the Protocols to the Convention.
Dividends on Common Shares
Under the Tax Act, a non-resident of Canada is generally subject to Canadian withholding tax at the rate of 25% on dividends paid or deemed to have been paid to him by a Company resident in Canada. The Convention limits the rate to 15% if the shareholder is resident in the United States and the dividends are beneficially owned by and paid to him, and to 5% if the shareholder is a company that beneficially owns at least 10% of the voting shares of the payer company. The Convention generally exempts from Canadian income tax dividends paid to a religious, scientific, literary, educational or charitable organisation or to an organisation constituted and operated exclusively to administer a pension, retirement or employee benefit fund or plan, if the organisation is resident in the United States and is exempt from income tax under the laws of the United States.
Disposition of Common Shares
Under the Tax Act, a taxpayer’s capital gain or capital loss from a disposition of Common Shares of the Company is the amount, if any, by which his proceeds of disposition exceed (or are exceeded by, respectively) the aggregate of his adjusted cost base of the share and reasonable expenses of disposition. One-half of a capital gain (the "taxable capital gain") is included in income, and one-half of a capital loss in a year (the "allowable capital loss") is deductible from taxable capital gains realized in the same year. The amount by which a shareholder’s allowable capital loss exceeds the taxable capital gain in a year may be deducted from a taxable capital gain realized by the shareholder in the year or in the three previous or any subsequent year, subject to certain restrictions in the case of a corporate shareholder.
- 61 -
In the case of a shareholder that is a company, the amount of any capital loss otherwise determined may be reduced, in certain circumstances, by the amount of dividends previously received in respect of the shares disposed of, unless the company owned the shares for at least 365 days prior to sustaining the loss and (together with companies, persons and other entities with whom the company was not dealing at arm’s length) did not, at the time the dividends were received, own more than 5% of the shares of any class of the capital stock of the company from which the dividend was received. These loss limitation rules may also apply where a company is a member of a partnership or a beneficiary of a trust that owned the shares disposed of.
A non-resident of Canada is not subject to tax under the Tax Act in respect of a capital gain realized upon the disposition of shares unless the shares represent "taxable Canadian property". Common shares of the Company will not generally constitute taxable Canadian property. Common shares of the Company will constitute taxable Canadian property of a shareholder at a particular time if the shareholder used or held the shares in carrying on a business in Canada, or if more than 50% of the fair market value of the shares was derived directly or indirectly from one or any combination of:
| | a) | Real or immovable property in Canada |
| | b) | Canadian resource properties |
| | c) | Timber resource properties; and |
| | d) | Options in respect of any property described in a) to c). |
Where a United States resident realises a capital gain on a disposition of shares that constitute "taxable Canadian property", the Convention relieves the United States resident from liability for Canadian tax on such capital gains unless:
| | (a) | the value of the shares is derived principally from "real property" in Canada, including the right to explore for or exploit natural resources and rights to amounts computed by reference to production, |
| | | |
| | (b) | the shareholder was resident in Canada for 120 months during any period of 20 consecutive years preceding the disposition, was resident in Canada at any time during the 10 years immediately preceding the disposition, the shares were owned by him when he ceased to be resident in Canada and the shares were not property that the shareholders was treated as having alienated by reason of ceasing to be a resident of Canada, or |
| | | |
| | (c) | the shares formed part of the business property of a "permanent establishment" that the shareholder has or had in Canada within the 12 months preceding the disposition. |
Notwithstanding the potential exemption from Canadian tax provided under the Convention, where a nonresident of Canada disposes of Common Shares of the Company that are "taxable Canadian property", the non-resident is required to file a Canadian income tax return in respect of any such dispositions.
Certain United States Federal Income Tax Considerations
The following discussion summarises the material United States federal income tax consequences to certain U.S. Holders (as defined below) of the acquisition, ownership and disposition of the Company’s Common Shares. This discussion assumes such holders hold the Common Shares as capital assets for United States Federal income tax purposes. This discussion does not address consequences peculiar to persons subject to special provisions of federal income tax law, such as tax-exempt organisations, qualified retirement plans, financial institutions, life insurance companies, real estate investment trusts, regulated investment companies, broker-dealers, non-resident alien individuals or foreign companies,
- 62 -
shareholders actually or constructively owning Common Shares representing 10% of the vote and value of the Company, a person that holds shares as part of a straddle or hedging or conversion transaction, or a person liable for alternative minimum tax. In addition, this discussion does not address any state, local or foreign tax consequences.
The following discussion is based upon the Internal Revenue Code of 1986, as amended (the "Code"), final, temporary and proposed Treasury Regulations promulgated thereunder, published Internal Revenue Service ("IRS") rulings, published administrative positions of the IRS and court decisions that are currently applicable, any or all of which could be materially and adversely changed, possibly on a retroactive basis. In addition, this discussion does not consider the potential effects, both adverse and beneficial of recently proposed legislation which, if enacted, could be applied, possibly on a retroactive basis, at any time. The following discussion is for general information only and is not intended to be, nor should it be construed to be, legal or tax advice to any holder or prospective holder of the Company’s Common Shares and no opinion or representation with respect to the United States federal income tax consequences, to any such holder or prospective holders is made. Accordingly, holders and prospective holders of the Company’s Common Shares should consult their own tax advisors about the federal, state, local foreign tax consequences of purchasing, owning and disposing of shares of Common Shares of the Company.
U.S. Holders
As used in this Report, the term "U.S. Holder" means a beneficial owner of Common Shares that is (i) a citizen or resident individual of the United States, (ii) a corporation or partnership created or organised under the laws of the United States, or any political subdivision thereof, (iii) an estate the income of which is subject to United States federal income tax regardless of source, or (iv) a trust subject to the primary supervision of a United States court and which has one or more United States persons who have the authority to control all substantial decisions of the trust.
Distributions on Common Shares
Dividends (without reduction for Canadian income tax withheld) paid to a noncorporate U.S. Holder in taxable years beginning before January 1, 2011 that constitute qualified dividend income will be taxable to such holder at a maximum tax rate of 15% provided that the noncorporate U.S. Holder holds shares for more than 60 days during the 121 day period beginning 60 days before the ex-dividend date and meets other holding period requirements. A U.S. Holder must include the dividend in its taxable income when the holder receives the dividend, actually or constructively. The dividend will not be eligible for the dividends-received deduction generally allowed to U.S. corporations in respect of dividends received from other U.S. corporations. The amount of the dividend distribution that a U.S. Holder must include in its income will be the U.S. dollar value of the payments made, determined at the spot rate on the date of the dividend distribution, regardless of whether the payment is in fact converted into U.S. dollars. Generally, any gain or loss resulting from currency exchange fluctuations during the period from the date the U.S. Holder includes the dividend payment in income to the date it converts the payment into U.S. dollars will be treated as ordinary income or loss and will not be eligible for the special tax rate applicable to qualified dividend income. The gain or loss generally will be income or loss from sources within the U.S. for foreign tax credit limitation purposes. Distributions in excess of current and accumulated earnings and profits, as determined for U.S. federal income tax purposes, will be treated as a non-taxable return of capital to the extent of U.S. Holder’s basis in the shares and thereafter as capital gain.
Subject to certain limitations, the Canadian tax withheld will be creditable against a U.S. Holder’s United States federal income tax liability. Special rules apply in determining the foreign tax credit limitation with respect to dividends that are subject to the maximum 15% tax rate. To the extent a refund of the tax
- 63 -
withheld is available to a U.S. Holder, the amount of tax withheld that is refundable will not be eligible for credit against the U.S. Holder United States federal income tax liability.
Disposition of Common Shares
A U.S. Holder will recognize United States source gain or loss upon the sale of Common Shares equal to the difference, if any, between (i) the amount of cash plus the fair market value of any property received, and (ii) the shareholder’s tax basis in the Common Shares. This gain or loss will be capital gain or loss if the shares are a capital asset in the hands of the U.S. Holder, and such gain or loss will be long-term capital gain or loss if the U.S. Holder has held the Common Shares for more than one year. Gains and losses are netted and combined according to special rules in arriving at the overall capital gain or loss for a particular tax year. Deductions for net capital losses are subject to significant limitations.
Other Considerations
In the following circumstance, the above discussion may not describe the United States federal income tax consequences resulting from the holding and disposition of the Company’s Common Shares:
Passive Foreign Investment Company
Special rules are applicable to U.S. Holders owning shares in a passive foreign investment company (a "PFIC"). A foreign company will be classified as a PFIC if at least 75% of its gross income for the taxable year is passive income or if the value of assets held by it during the taxable year which produce passive income represents at least 50% of the value of its assets. In determining whether a foreign company is a PFIC, if the foreign company owns 25% or more (by value) of the stock of another company, the foreign company is treated as if it (i) held its proportionate share of the assets of such other company, and (ii) received directly its proportionate share of the income of such other company.
Based on the nature of the income, assets and activities of the Company, it is not certain whether the Company could be classified as a PFIC for any taxable year. While the Company believes that it presently not a PFIC, there can be no assurance that the Internal Revenue Service will not successfully challenge our position or that we will not become a PFIC in a future taxable year, as PFIC status is tested each year and depends on our assets and income in such year.
If the Company was treated as a PFIC at any time during a U.S. Holder’s holding period for the Common Shares, such U.S. Holder might be subject to additional tax as well as certain interest charges in respect of the deferral of tax for the period during which such Common Shares were held. Any such additional tax and interest charges would apply to the disposition of the Common Shares or the receipt of certain dividends that are considered "excess distributions" under the Code. Additionally, any gain realized on the disposition of such Common Shares would be treated as ordinary income rather than as capital gain and the tax basis of the Common Shares held by a U.S. Holder generally would not be stepped up to fair market value at death. U.S. Holders and prospective holders of Common Shares should consult their own tax advisors regarding the possible application of the PFIC rules to the Company.
New Reporting Requirements
U.S. federal income tax legislation enacted in 2010 generally requires a U.S. individual to report to the IRS certain interests owned by such individual in stock or securities issued by a non-U.S. person (such as our Class “A” Common Shares) if the aggregate value of all such interests exceeds U.S.$50,000. The failure to report the information required under this legislation could result in substantial penalties. U.S Holders should consult their tax advisors with respect to their obligations under this new legislation.
- 64 -
Backup Withholding
Certain non-corporate U.S. Holders may be subject to backup withholding at a rate of 28% on taxable distributions with respect to the Common Shares and the proceeds of a disposition of the Common Shares. Backup withholding will apply only if the U.S. Holder (i) fails to furnish its Taxpayer Identification Number ("TIN") which, in the case of an individual, would be his or her social security number, (ii) furnishes an incorrect TIN, (iii) is notified by the IRS that it has failed to properly report payments of interest or dividends or (iv) under certain circumstances, fails to certify, under the penalty of perjury, that it has furnished a correct TIN and has not been notified by the IRS that it is subject to backup withholding. Under newly issued U.S. Treasury regulations, in the case of interest paid after December 31, 1999, a U.S. Holder generally will be subject to backup withholding at a 28% rate unless certain IRS certification procedures are complied with, directly or through an intermediary. U.S. Holders should consult their tax advisors regarding their qualification for exemption from backup withholding and the procedure for obtaining such an exemption if applicable.
F. Dividends and paying agents
Not applicable.
G. Statements by experts
Not applicable.
H. Documents on Display
The Company is subject to certain of the information requirements of the Securities Exchange Act of 1934, as amended (the “Exchange Act”), and in accordance therewith, files reports and other information with the United States Securities and Exchange Commission (“SEC). As a foreign private issuer, the Company is exempt from the rules under the Exchange Act prescribing the furnishing and content of proxy statements, and its officers, directors and principal shareholders are exempt from the reporting and short-swing profit recovery provisions contained in Section 16 of the Exchange Act. As a foreign private issuer, the Company is not required to publish financial statements as frequently or as promptly as United States companies.
We file annual reports and other information with the SEC. You may read and copy any of these documents at the SEC's Public Reference Room at Judiciary Plaza, 100 F Street N.E., Washington, D.C. 20549. You may obtain information on the operation of the Public Reference Room by calling the SEC at (800) SEC-0330. The SEC maintains an internet site that contains reports, proxy and information statements and other information regarding issuers that file electronically with the SEC. The address of that site is http://www.sec.gov.
Any shareholder may also inspect any of the documents or Exhibits referred to in this Report or any other disclosure by making a request to the Company in writing.
- 65 -
I. Subsidiary Information
Information relating to the Company’s subsidiaries is described in – Information on the Company – particularly under "Organizational Structure" in Item 4 and in "Exhibit 8.1" to this Annual Report on Form 20-F.
ITEM 11. QUANTITATIVE AND QUALITATIVE DISCLOSURES ABOUT MARKET RISK
We are subject to credit risk as a result of our cash and accounts receivable balance. We minimize this risk by placing our cash with major banks that are considered to be at low risk of loss and we sell software licenses, maintenance and consulting with short credit terms. On a regular basis, we also monitor the financial condition of our customers.
We are subject to currency risk as we are an international company. Since we currently earn revenues and incur expenses in United States dollars, British pounds, Euros and Canadian dollars, exchange rates for these and other local currencies in countries where we may operate in the future may fluctuate in relation to the Canadian dollar and such fluctuations may have an adverse effect on our earnings or assets when United States dollars, British pounds, Euros or local currencies are exchanged for Canadian dollars. We have not entered into forward foreign exchange contracts. Losses and gains resulting from the translation of revenue and expenses denominated in United States dollars, British pounds, or Euros into Canadian dollars have been included in our results of operations. We minimize this risk by paying the expenditures incurred in the local operations using the monies received in the local currency.
We are subject to liquidity risk, the risk that we may not be able to meet our financial obligations as they fall due. We manage this risk by regulary evaluating the liquid resources available to fund the current and long-term obligations in a cost-effecitve manner using budgets and cash flow estimates.
We are not subject to fluctuations in cash flow due to interest rate risk, as a majority of the company’s debt is at fixed rates.
Please see Note 17 in the audited consolidated financial statements for more details on each of the risks above.
ITEM 12. DESCRIPTION OF SECURITIES OTHER THAN EQUITY SECURITIES
Not applicable.
PART II
ITEM 13. DEFAULTS, DIVIDEND ARREARAGES AND DELINQUENCIES
None.
ITEM 14. MATERIAL MODIFICATIONS TO THE RIGHT OF SECURITY HOLDERS AND USE OF PROCEEDS
None.
- 66 -
ITEM 15. CONTROLS AND PROCEDURES
A. Disclosure Controls and Procedures
As of July 31, 2011, an evaluation was carried out, under the supervision of and with the participation of management, including Chief Executive Officer ("CEO") and the Vice-President Finance and Administration and Chief Financial Officer ("CFO"), of the effectiveness of the Company’s disclosure controls and procedures as defined in National Instrument 52-109 - Certification of Disclosure in Issuers' Annual and Interim Filing and in Rule 13a-15 or 15d-15 under the Exchange Act.
Based upon that evaluation, our CEO and our CFO concluded that our disclosure controls and procedures were effective in ensuring that information required to be disclosed by the Company in the reports that it files or submits under the Exchange Act is recorded, processed, summarized and reported within the time periods specified in the SEC’s rules and forms, and that information required to be disclosed by the Company in the reports that it files or submits under the Exchange Act is accumulated and communicated to the Company’s management, including its CEO and CFO, or persons performing similar functions, as appropriate to allow timely decisions regarding required disclosure.
B. Management’s Annual Report on Internal Control over Financial Reporting
Our management is responsible for establishing and maintaining adequate internal control over financial reporting for the Company. Internal control over financial reporting is a process designed to provide reasonable assurance regarding the reliability of our financial reporting for external purposes in accordance with Canadian generally accepted accounting principles. Internal control over financial reporting includes maintaining records that in reasonable detail accurately and fairly reflect the transactions and disposition of our assets; providing reasonable assurance that transactions are recorded as necessary for preparation of our financial statements; providing reasonable assurance that receipts and expenditures of the Company are made in accordance with management authorization; and providing reasonable assurance that unauthorized acquisition, use or disposition of Company assets that could have a material effect on our financial statements would be prevented or detected on a timely basis. Because of its inherent limitations, internal control over financial reporting is not intended to provide absolute assurance that a misstatement of our financial statements would be prevented or detected. Also, projections of any evaluation of effectiveness to future periods are subject to the risk that controls may become inadequate because of changes in conditions, or that the degree of compliance with the policies or procedures may deteriorate.
Management conducted an evaluation of the effectiveness of our internal control over financial reporting based on the framework in Internal Control - Integrated Framework issued by the Committee of Sponsoring Organizations of the Treadway Commission. Based on this evaluation, management concluded that the Company's internal control over financial reporting was effective as of July 31, 2011.
There have been no changes in our internal control over financial reporting during the fiscal year ended July 31, 2011 that have materially affected, or are reasonably likely to materially affect our internal control over financial reporting.
- 67 -
ITEM 16A. AUDIT COMMITTEE FINANCIAL EXPERT
P. Wayne Musselman, Michael Pesner and Daniel Benn, all of whom are non-management and unrelated directors, currently comprise the Audit Committee of the Board of Directors of the Company. P. Wayne Musselman is the Chairman of the Audit Committee.
Based on the qualifications summarized in his profile in Item 6A – Directors, the Board of Directors of SAND has determined that Mr. Musselman qualifies as an "audit committee financial expert". P. Wayne Musselman is independent as defined underRegulation 52-110 respectingAudit Committees and under the rules of the NASDAQ Stock Market.
ITEM 16B. CODE OF ETHICS
As part of its stewardship responsibilities, the Board of Directors has approved formal "Standards of Ethical Conduct" that govern the behaviour of the directors, officers and employees of the Company. The Board monitors compliance with these standards and is responsible for the granting of any waivers from these standards to directors or officers. Disclosure will be made by the Company of any waiver from these standards granted to the directors or officers of the Company in the quarterly report of the Comany that immediately follows the grant of such waiver. No waiver has been granted to date. A copy of the "Standards of Ethical Conduct" is filed as an exhibit to this Report.
ITEM 16C. PRINCIPAL ACCOUNTANT FEES AND SERVICES
(a) Audit Fees
The aggregate fees billed for professional services rendered by Raymond Chabot Grant Thornton LLP, the principal accountant for the Company, for the audit of the Company’s annual financial statements and services normally provided by such accountants in connection with the Company’s statutory and regulatory filings for the Company’s fiscal year ended July 31, 2011, were $95,000 ($95,000 in the fiscal year ended July 31, 2010).
(b) Audit-Related Fees
There were zero fees billed for assurance and related services by Raymond Chabot Grant Thornton LLP that are reasonably related to the performance of the audit or review of the Company’s financial statements for the Company’s fiscal year ended July 31, 2011 ($4,500 in the fiscal year ended July 31, 2010).
(c) Tax Fees
The aggregate fees billed for products and services rendered by Deloitte & Touche LLP for tax compliance, tax advice and tax planning for the Company’s fiscal ended July 31, 2011 were $63,480 ($10,000 in the fiscal year ended July 31, 2010).
There were zero fees billed for tax services by Raymond Chabot Grant Thornton LLP.
- 68 -
(d) All Other Fees
There were no fees billed for professional services rendered by Raymond Chabot Grant Thornton LLP other than the fees reported in this Item 16C. above during the Company’s two fiscal years ended July 31, 2011.
(e) Audit Committee’s Pre-Approval Policies
The Audit Committee approves the engagement terms for all audit and non-audit services to be provided by the Company’s accountants before such services are provided to the Company or any of its subsidiaries.
The Audit Committee approved one hundred percent (100%) of the services provided to the Company and its subsidiaries described in Items 16C (a) through 16C (d) above.
(f) Auditors Use of Non-Permanent Employees
None of the hours expended by Raymond Chabot Grant Thornton LLP on its engagement to audit the Company’s financial statements for the fiscal year ended July 31, 2011, were performed by persons other than full-time permanent employees of Raymond Chabot Grant Thornton LLP.
Interest of Auditors
Raymond Chabot Grant Thornton LLP are the Independent Registered Chartered Accountants of the Company and are independent within the meaning of the Code of Ethics of theOrdre des comptables agréés du Québec.
ITEM 16D. EXEMPTIONS FROM THE LISTING STANDARDS FOR AUDIT COMMITTEES
None.
ITEM 16E. PURCHASES OF EQUITY SECURITIES BY THE ISSUER AND AFFILIATED PURCHASERS
None.
ITEM 16F. CHANGE IN REGISTRANT’S CERTIFYING ACCOUNTANT
Not applicable.
ITEM 16G. CORPORATE GOVERNANCE
Not applicable, as the securities of SAND are not listed on a national securities exchange.
- 69 -
PART III
ITEM 17. FINANCIAL STATEMENTS
Not applicable.
ITEM 18. FINANCIAL STATEMENTS
The Audited Consolidated Financial Statements of the Company are included in this Report beginning on page F-1.
These financial statements were prepared in accordance with generally accepted accounting principles in Canada and are expressed in Canadian dollars. Such financial statements have been reconciled to U.S. GAAP in Note 19. For a history of the exchange rates which were used for Canadian dollars against U.S. dollars, see Section A– Selected Financial Data under Item 3 "Key Information" of this Report.
- 70 -
SAND Technology Inc.
Consolidated Financial Statements
July 31, 2011, 2010 and 2009

Independent Auditor’s Report of
Registered Public Accounting Firm
To the Shareholders of
SAND Technology Inc. | Raymond Chabot Grant Thornton LLP |
| Suite 2000 |
| National Bank Tower |
| 600 De La Gauchetière Street West |
| Montréal, Québec H3B 4L8 |
| |
| Telephone: 514-878-2691 |
| Fax: 514-878-2127 |
| www.rcgt.com |
We have audited the accompanying consolidated financial statements of SAND Technology Inc. which comprise the consolidated balance sheets as at July 31, 2011 and 2010, and the consolidated statements of operations and comprehensive loss, shareholders’ deficiency and cash flows for each of the years in the three year period ended July 31, 2011, and a summary of significant accounting policies and other explanatory information.
Management’s responsibility for the consolidated financial statements
Management is responsible for the preparation and fair presentation of these consolidated financial statements in accordance with Canadian generally accepted accounting principles and for such internal control as management determines is necessary to enable the preparation of consolidated financial statements that are free from material misstatement, whether due to fraud or error.
Auditor’s responsibility
Our responsibility is to express an opinion on these consolidated financial statements based on our audits. We conducted our audits in accordance with Canadian generally accepted auditing standards and the standards of the Public Company Accounting Oversight Board (United States). Those standards require that we comply with ethical requirements and plan and perform the audit to obtain reasonable assurance about whether the consolidated financial statements are free from material misstatement.
An audit involves performing procedures to obtain audit evidence about the amounts and disclosures in the consolidated financial statements. The procedures selected depend on the auditor's judgment, including the assessment of the risks of material misstatement of the consolidated financial statements, whether due to fraud or error. In making those risk assessments, the auditor considers internal control relevant to the entity's preparation and fair presentation of the consolidated financial statements in order to design audit procedures that are appropriate in the circumstances, but not for the purpose of expressing an opinion on the effectiveness of the entity's internal control. An audit also includes evaluating the appropriateness of accounting policies used and the reasonableness of accounting estimates made by management, as well as evaluating the overall presentation of the consolidated financial statements.
We believe that the audit evidence we have obtained in our audits is sufficient and appropriate to provide a basis for our audit opinion.
Opinion
In our opinion, the consolidated financial statements present fairly, in all material respects, the financial position of SAND Technology Inc. as at July 31, 2011 and 2010, and the results of its operations and its cash flows for each of the years in the three-year period ended July 31, 2011 in accordance with Canadian generally accepted accounting principles.
Other matter
SAND Technology Inc. is not required to have, nor were we engaged to perform, audits of its internal control over financial reporting. Our audits included consideration of internal control over financial reporting as a basis for designing audit procedures that are appropriate in the circumstances, but not for the purpose of expressing an opinion on the effectiveness of SAND Technology Inc.’s internal control over financial reporting. Accordingly, we express no such opinion.

Montréal, Canada
November 7, 2011
_______________________________
1 Chartered accountant auditor permit no. 20518
Chartered Accountants
Member of Grant Thornton International Ltd
F-1
Independent Auditor’s Consent | Raymond Chabot Grant Thornton LLP |
| Suite 2000 |
| National Bank Tower |
| 600 De La Gauchetière Street West |
| Montréal, Québec H3B 4L8 |
| |
| Telephone: 514-878-2691 |
| Fax: 514-878-2127 |
| www.rcgt.com |
SAND Technology Inc.
We consent to the use of our audit report dated November 7, 2011 to the shareholders of SAND Technology Inc. (hereinafter the "Company") on the consolidated financial statements of the Company, that is, the consolidated balance sheets as at July 31, 2011 and 2010 and the consolidated statements of operations and comprehensive loss, shareholders’ deficiency and cash flows for each of the years in the three-year period ended July 31, 2011, in connection with filing with the securities regulatory authorities on November 7, 2011 and with the publication on SEDAR of the annual report containing these financial statements and our auditor’s report (hereinafter the "filing").
We have not performed any procedures subsequent to the date of this consent.
This consent is provided to the Company for use solely in connection with the above filing of these consolidated financial statements pursuant to the continuous disclosure provisions of applicable securities legislation of Québec. Accordingly, we do not consent to any use other than this filing, or to the release (as such term is defined in Section 225.3 of the Securities Act (Quebec)), by the Company or any other person, of our audit report.
If the filing is not made within five business days of this consent, our consent will be withdrawn.
Montreal, Canada
November 11, 2011
______________________________
1Chartered accountant auditor permit no. 20518
Chartered Accountants
Member of Grant Thornton International Ltd
F-2
SAND Technology Inc.
Consolidated Balance Sheets
July 31, 2011 and 2010
(Expressed in Canadian Dollars, unless otherwise stated)
| | | As at July 31, | | | As at July 31, | |
| | | 2011 | | | 2010 | |
| | | | | | | |
| ASSETS | | | | | | |
| Current Assets | | | | | | |
| Cash | $ | 810,745 | | $ | 579,270 | |
| Accounts receivable | | 541,959 | | | 739,144 | |
| Research and development tax credits receivable (Note 12) | | 663,857 | | | 660,000 | |
| Prepaid expenses | | 117,305 | | | 74,541 | |
| | | 2,133,866 | | | 2,052,955 | |
| | | | | | | |
| Capital assets, net (Note 5) | | 81,361 | | | 64,488 | |
| | | | | | | |
| | | 2,215,227 | | | 2,117,443 | |
| | | | | | | |
| LIABILITIES | | | | | | |
| Current Liabilities | | | | | | |
| Accounts payable and accrued liabilities (Note 6) | | 776,623 | | | 984,149 | |
| Deferred revenue | | 1,179,652 | | | 1,135,814 | |
| Deferred lease inducements | | - | | | 19,558 | |
| Due to shareholders (Note 7) | | 1,425,945 | | | 896,369 | |
| | | 3,382,220 | | | 3,035,890 | |
| | | | | | | |
| Deferred revenue | | 696,275 | | | 106,124 | |
| Due to shareholders (Note 7) | | 488,892 | | | 977,784 | |
| Convertible debentures (Note 8) | | 542,671 | | | 448,309 | |
| | | 5,110,058 | | | 4,568,107 | |
| | | | | | | |
| SHAREHOLDERS' DEFICIENCY | | | | | | |
| Share capital (Note 10) | | | | | | |
Authorized
An unlimited number of class "A" common shares, without par value
An unlimited number of class "B" common shares, without par value
Issued and outstanding
19,116,636 class "A" common shares
(July 31, 2010 - 15,889,620 shares) | | 39,706,665 | | | 38,976,108 | |
| Equity component of convertible debentures (Note 8) | | 446,027 | | | 446,027 | |
| Contributed surplus | | 1,991,642 | | | 1,053,897 | |
| Deficit | | (45,039,165 | ) | | (42,926,696 | ) |
| | | (2,894,831 | ) | | (2,450,664 | ) |
| | | | | | | |
| | | 2,215,227 | | | 2,117,443 | |
The accompanying notes are an integral part of the consolidated financial statements.
On behalf of the Board,
| | | |
| George Wicker, Director | | P. Wayne Musselman, Director |
F-3
SAND Technology Inc.
Consolidated Statement of Operations and Comprehensive Loss
Years ended July 31, 2011, 2010 and 2009
(Expressed in Canadian Dollars, unless otherwise stated)
| | | Year ended | | | Year ended | | | Year ended | |
| | | July 31, | | | July 31, | | | July 31, | |
| | | 2011 | | | 2010 | | | 2009 | |
| | | | | | | | | | |
| Revenue | $ | 6,871,671 | | $ | 6,562,411 | | $ | 7,049,237 | |
| | | | | | | | | | |
| Cost of sales and product support | | 1,235,328 | | | 1,194,674 | | | 1,396,224 | |
| | | | | | | | | | |
| Gross profit | | 5,636,343 | | | 5,367,737 | | | 5,653,013 | |
| | | | | | | | | | |
| Operating expenses | | | | | | | | | |
| Research and development costs, net (Note 12) | | 1,866,244 | | | 1,458,392 | | | 1,960,295 | |
| Amortization of capital assets | | 40,597 | | | 53,298 | | | 63,643 | |
| Sellling, general and administrative | | 5,399,512 | | | 4,224,677 | | | 4,372,067 | |
| | | 7,306,353 | | | 5,736,367 | | | 6,396,005 | |
| | | | | | | | | | |
| Loss from operations before the undernoted items | | (1,670,010 | ) | | (368,630 | ) | | (742,992 | ) |
| | | | | | | | | | |
| Foreign exchange loss | | 72,146 | | | 80,978 | | | 135,051 | |
| Interest expense (Note 4) | | 370,313 | | | 295,941 | | | 313,652 | |
| | | 442,459 | | | 376,919 | | | 448,703 | |
| | | | | | | | | | |
| Net loss and comprehensive loss | $ | (2,112,469 | ) | $ | (745,549 | ) | $ | (1,191,695 | ) |
| | | | | | | | | | |
| Basic and diluted loss per share | $ | (0.12 | ) | $ | (0.05 | ) | $ | (0.08 | ) |
| | | | | | | | | | |
| Basic and diluted weighted average number of common shares | | 17,009,173 | | | 15,467,702 | | | 14,318,189 | |
The accompanying notes are an integral part of the consolidated financial statements.
F-4
SAND Technology Inc.
Consolidated Statement of Shareholders’ Deficiency
Years ended July 31, 2011, 2010 and 2009
(Expressed in Canadian Dollars, unless otherwise stated)
| | | Share Capital | | | | | | | | | | | | | |
| | | | | | | | | Equity | | | | | | | | | | |
| | | Number of | | | | | | component of | | | | | | | | | | |
| | | class"A" | | | | | | convertible | | | Contributed | | | | | | Shareholders' | |
| | | common shares | | | Amount | | | debentures | | | surplus | | | Deficit | | | deficiency | |
| | | | | | | | | | | | | | | | | | | |
| Balance as at July 31, 2008 | | 14,318,189 | | $ | 38,530,441 | | $ | 446,027 | | $ | 752,525 | | $ | (40,989,452 | ) | $ | (1,260,459 | ) |
| Net loss | | | | | | | | | | | | | | (1,191,695 | ) | | (1,191,695 | ) |
| Stock-based compensation | | | | | | | | | | | 79,599 | | | | | | 79,599 | |
| | | | | | | | | | | | | | | | | | | |
| Balance as at July 31, 2009 | | 14,318,189 | | | 38,530,441 | | | 446,027 | | | 832,124 | | | (42,181,147 | ) | | (2,372,555 | ) |
| | | | | | | | | | | | | | | | | | | |
| Net loss | | | | | | | | | | | | | | (745,549 | ) | | (745,549 | ) |
| Stock-based compensation | | | | | | | | | | | 79,605 | | | | | | 79,605 | |
Common shares issued as part of
private placement (Note 9) | | 1,571,431 | | | 445,667 | | | | | | | | | | | | 445,667 | |
Warrants issuance as part of
private placement (Note 9) | | | | | | | | | | | 142,168 | | | | | | 142,168 | |
| | | | | | | | | | | | | | | | | | | |
| Balance as at July 31, 2010 | | 15,889,620 | | | 38,976,108 | | | 446,027 | | | 1,053,897 | | | (42,926,696 | ) | | (2,450,664 | ) |
| | | | | | | | | | | | | | | | | | | |
| Net loss | | | | | | | | | | | | | | (2,112,469 | ) | | (2,112,469 | ) |
| Stock-based compensation | | | | | | | | | | | 741,847 | | | | | | 741,847 | |
Common shares issued as part of
private placement (Note 9) | | 2,142,864 | | | 579,175 | | | | | | | | | | | | 579,175 | |
Warrants issuance as part of
private placement (Note 9) | | | | | | | | | | | 195,898 | | | | | | 195,898 | |
Common shares issued in
settlement of debt | | 411,152 | | | 143,903 | | | | | | | | | | | | 143,903 | |
| Warrants exercised | | 613,000 | | | 6,879 | | | | | | | | | | | | 6,879 | |
| Stock options exercised | | 60,000 | | | 600 | | | | | | | | | | | | 600 | |
| | | | | | | | | | | | | | | | | | | |
| Balance as at July 31, 2011 | | 19,116,636 | | $ | 39,706,665 | | $ | 446,027 | | $ | 1,991,642 | | $ | (45,039,165 | ) | $ | (2,894,831 | ) |
The accompanying notes are an integral part of the consolidated financial statements.
F-5
SAND Technology Inc.
Consolidated Statement of Cash Flows
Years ended July 31, 2011, 2010 and 2009
(Expressed in Canadian Dollars, unless otherwise stated)
| | | Year Ended | | | Year Ended | | | Year Ended | |
| | | July 31, | | | July 31, | | | July 31, | |
| | | 2011 | | | 2010 | | | 2009 | |
| | | | | | | | | | |
| | | | | | | | | | |
| OPERATING ACTIVITIES | | | | | | | | | |
| Net loss | $ | (2,112,469 | ) | $ | (745,549 | ) | $ | (1,191,695 | ) |
| Non-cash items | | | | | | | | | |
| Amortization of capital assets | | 40,597 | | | 53,298 | | | 63,643 | |
| Stock-based compensation | | 741,847 | | | 79,605 | | | 79,599 | |
| Accretion of debt component of convertible debentures | | 94,362 | | | 86,087 | | | 83,879 | |
| Amortization of deferred lease inducement | | (19,558 | ) | | (29,337 | ) | | (29,337 | ) |
| Changes in working capital items | | | | | | | | | |
| Accounts receivable | | 208,105 | | | 524,935 | | | 354,310 | |
| Research and development tax credits receivable | | (3,858 | ) | | (500,000 | ) | | (160,000 | ) |
| Unbilled receivable | | - | | | 112,515 | | | 142,445 | |
| Prepaid expenses | | (42,078 | ) | | 26,545 | | | (10,096 | ) |
| Accounts payable and accrued liabilities | | 265,333 | | | 198,380 | | | (316,566 | ) |
| Deferred revenue | | 648,893 | | | (380,046 | ) | | 578,761 | |
| Cash flows from operating activities (a) | | (178,826 | ) | | (573,567 | ) | | (405,057 | ) |
| | | | | | | | | | |
| INVESTING ACTIVITIES | | | | | | | | | |
| Purchase of capital assets | | (57,436 | ) | | (34,334 | ) | | (24,781 | ) |
| Cash flows from investing activities | | (57,436 | ) | | (34,334 | ) | | (24,781 | ) |
| | | | | | | | | | |
| FINANCING ACTIVITIES | | | | | | | | | |
| Due to shareholders | | 362,067 | | | 299,893 | | | 749,024 | |
| Repayments of due to shareholders | | (304,028 | ) | | (659,484 | ) | | - | |
| Advance from a private investor | | - | | | 26,623 | | | - | |
| Stock options exercised | | 600 | | | - | | | - | |
| Warrants exercised | | 6,879 | | | - | | | - | |
| Issuance of units related to private placements | | 448,558 | | | 587,835 | | | - | |
| Cash flows from financing activities | | 514,076 | | | 254,867 | | | 749,024 | |
| | | | | | | | | | |
| Effect of exchange rate changes on cash | | (46,339 | ) | | (133,268 | ) | | (29,057 | ) |
| | | | | | | | | | |
| Net increase (decrease) in cash | | 231,475 | | | (486,302 | ) | | 290,129 | |
| | | | | | | | | | |
| Cash, beginning of year | | 579,270 | | | 1,065,572 | | | 775,443 | |
| | | | | | | | | | |
| Cash, end of year | $ | 810,745 | | $ | 579,270 | | $ | 1,065,572 | |
| | | | | | | | | |
| (a) Additional information | | | | | | | | | |
| Interest paid | $ | 69,642 | | $ | 300,977 | | $ | 37,171 | |
The accompanying notes are an integral part of the consolidated financial statements.
F-6
SAND Technology Inc.
Notes to Consolidated Financial Statements
July 31, 2011
(Expressed in Canadian Dollars, unless otherwise stated)
1 -NATURE OF BUSINESS
SAND Technology Inc. (the “Company”) is incorporated under the Canada Business Corporations Act. The Company’s common shares are listed on the Over-the-Counter (“OTC”) Bulletin Board in the United States. SAND Technology Inc. and its wholly-owned subsidiaries are involved in the design, development, marketing and support of software products and services that reduce large amounts of data into a small footprint and enable users to retrieve usable business information from large amounts of data. The software products, collectively known as the SAND/DNA Product Suite, are designed to provide an efficient and cost effective way for business users to make fast, easy and efficient inquiries of large databases without the intervention of specialist information technology professionals.
2-SUMMARY OF SIGNIFICANT ACCOUNTINGPOLICIES
This summary of significant accounting policies is provided to assist the reader in understanding the Company’s consolidated financial statements. The consolidated financial statements and notes thereto are the representations of the Company’s management. The Company’s management is responsible for their integrity and objectivity. These accounting policies conform to Canadian generally accepted accounting principles (“Canadian GAAP”) and have been consistently applied in the preparation of the consolidated financial statements.
Basis of Presentation
These consolidated financial statements and related notes are presented in accordance with Canadian GAAP and are expressed in Canadian Dollars. Certain Canadian GAAP principles used in these consolidated financial statements differ from accounting principles generally accepted in the United States of America (“U.S. GAAP”) as described in Note 19. The Company’s fiscal year-end is July 31.
Basis of Consolidation
The consolidated financial statements include the accounts of the Company and its wholly-owned subsidiaries, Sand Technology Deutschland GmbH, located in Germany, Sand Technology Limited, located in the United Kingdom, Sand Technology Ireland Limited, located in Ireland, and Sand Technology Corp. and STSI Licensing, LLC, located in the United States and Sand Technology Pty Ltd, located in Australia. All intercompany transactions and accounts have been eliminated on consolidation.
Accounting Estimates
The preparation of the consolidated financial statements in conformity with Canadian GAAP requires management to make certain estimates and assumptions that affect the reported amounts of assets and liabilities at the date of the financial statements and the reported amounts of revenues and expenses during the reporting year. The most significant estimates relate to the establishment of the fair values of the components of the convertible debentures, the accounting for stock options, share awards, warrants and the evaluation of the research and development tax credits. Actual results may differ from these estimates.
F-7
SAND Technology Inc.
Notes to Consolidated Financial Statements
July 31, 2011
(Expressed in Canadian Dollars, unless otherwise stated)
Cash and Cash Equivalents
For purposes of the statement of cash flows, the Company considers all highly liquid investments, with a maturity of three months or less, to be cash equivalents. There were no cash equivalents as of July 31, 2011 and 2010.
Allowance for Doubtful Accounts
Management of the Company makes judgements as to its ability to collect outstanding receivables and provide allowances for the portion of receivables when collection becomes doubtful. Provisions are made based upon a specific review of all outstanding invoices. As of July 31, 2011, the allowance for doubtful accounts was nil (nil as at July 31, 2010).
Capital Assets
Capital assets are recorded at cost less accumulated amortization and provisions for write-downs. Amortization is calculated using the straight-line method over the estimated useful lives of the assets as follows:
| Furniture and equipment | 5 years |
| Computer equipment | 3 years |
| Research and development equipment | 3 years |
| Leasehold improvements | Lease term of 10 years |
Impairment of Long-Lived Assets
Capital assets are tested for recoverability when events or changes in circumstances indicate that their carrying amount may not be recoverable. The carrying amount of a long-lived asset is not recoverable when it exceeds the sum of the undiscounted cash flows expected from its use and eventual disposal. In such a case, an impairment is recognized and is calculated as the excess of the carrying amount of the long-lived asset over its fair value.
Basic and Diluted Income (Loss) per Common Share
Basic net income (loss) per share (“Basic EPS”) includes no dilution and is computed by dividing net income (loss) available to common shareholders by the weighted average number of common shares outstanding for the year.
Diluted earnings per share is computed by dividing net income by the weighted average number of shares outstanding and, when, dilutive, potential shares from stock options and share awards, stock warrants to purchase common stock using the treasury method, and conversions of outstanding convertible debt using the “if converted” method. A net loss was reported in 2011, 2010 and 2009, and accordingly, in those years, the denominator for the Basic EPS calculation was equal to the weighted average of outstanding shares with no consideration for outstanding stock options, share awards and warrants to purchase shares of the Company's common stock because to do so would have been anti-dilutive.
The following number of stock options, share awards, share warrants and shares issuable upon conversion of the convertible debentures were not included in the computation of diluted earnings per share because to do so would have been anti-dilutive for the periods presented:
F-8
SAND Technology Inc.
Notes to Consolidated Financial Statements
July 31, 2011
(Expressed in Canadian Dollars, unless otherwise stated)
| | | Year Ended | | | Year Ended | | | Year Ended | |
| | | July 31, | | | July 31, | | | July 31, | |
| | | 2011 | | | 2010 | | | 2009 | |
| | | | | | | | | | |
| Stock options | | 3,473,583 | | | 357,000 | | | 551,000 | |
| Share awards | | - | | | 302,500 | | | 402,500 | |
| Warrants | | 1,857,147 | | | 1,899,715 | | | 1,967,061 | |
| Convertible debentures, principal | | 2,228,000 | | | 2,228,000 | | | 2,228,000 | |
| Convertible debentures, interest | | 460,453 | | | 282,213 | | | 103,973 | |
| | | | | | | | | | |
| | | 8,019,183 | | | 5,069,428 | | | 5,252,534 | |
Income Taxes
The Company uses the liability method of accounting for income taxes under which deferred tax assets and liabilities are recognized for the estimated future tax consequences attributable to differences between the financial statement carrying amounts of existing assets and liabilities and their respective tax bases and operating loss and tax credit carryforwards. Deferred tax assets and liabilities are measured using enacted or substantially enacted tax rates in effect for the year in which those temporary differences are expected to be recovered or settled. The effect on deferred tax assets and liabilities of a change in tax rates is recognized as part of the provision for income taxes in the period that includes the enactment date. Valuation allowances are established when it is more likely than not that some or all of the deferred tax assets will not be realized in the future.
Deferred Lease Inducements
Deferred lease inducements are being amortized on a straight-line basis over the term of the lease as a reduction of lease expense.
Foreign Currency Translation
The Company’s functional and reporting currency is the Canadian dollar and each of the Company’s wholly-owned subsidiaries is considered an integrated foreign operation. Accordingly, transactions denominated in currencies other than the functional currency are converted into Canadian dollars using the exchange rate in effect at the date of the transaction or the average rate for the period in the case of recurring revenue and expense transactions. Monetary assets and liabilities are revalued into the functional currency at each balance sheet date using the exchange rate in effect at the balance sheet date, with any resulting exchange gains or losses being credited or charged to the statement of operations. Non-monetary assets and liabilities are recorded in the functional currency using the exchange rate in effect at the date of the transaction and are not revalued for subsequent changes in exchange rates.
Revenue Recognition
The Company generates revenues principally through the sale of software licences and services. Software licence revenues are normally generated from licensing the perpetual use of the Company’s software products. Service revenues are generated from sales of maintenance, implementation, consulting and training services performed for customers that licence the Company's products.
F-9
SAND Technology Inc.
Notes to Consolidated Financial Statements
July 31, 2011
(Expressed in Canadian Dollars, unless otherwise stated)
Revenue from the sale of software licence agreements is recognized upon delivery of the software if persuasive evidence of an arrangement exists, collection is probable, the fee is fixed or determinable and vendor-specific evidence of an arrangement exists to allocate the total fee to the different elements of an arrangement. Vendor-specific objective evidence ("VSOE") is typically based on the price charged when an element is sold separately or, in the case of an element not yet sold separately, the price established by management if it is probable that the price, once established, will not change before market introduction. If VSOE of all undelivered elements exists but evidence does not exist for one or more delivered elements, then revenue is recognized using the residual method. Under the residual method, the fair value of the undelivered elements is deferred, and the remaining portion of the agreement fee related to the delivered elements is recognized as revenue provided that all other revenue recognition criteria are met. If evidence of fair value of one or more undelivered elements cannot be established, revenue is deferred and recognized ratably over the last undelivered element.
In circumstances where the implementation services are essential to the functionality of the software or where the software requires significant customization, the Company recognizes software licence revenue using the percentage-of-completion method over the implementation period. The percentage-of-completion is measured by the percentage of implementation hours incurred to date to total estimated implementation hours. Past experience has shown expended hours to be the best measure of progress.
Revenues from maintenance services for licences previously sold and implemented are recognized over the term of the contract.
Revenues from sales with extended payment terms are recognized when collectability is reasonably assured.
Revenues from consulting and training services not considered as a part of the implementation of software licences are recognized as the services are provided.
Amounts received in advance of the delivery of products or the performance of services are classified as deferred revenue. Revenues recognized in advance of invoicing to the customer are recorded as unbilled receivables where the collection of the receivable is probable.
Share Issuance Costs
Costs directly identifiable with the raising of share capital financing are charged against share capital. Share issuance costs incurred in advance of share subscriptions are recorded as non-current deferred assets. Share issuance costs related to uncompleted share subscriptions are charged to operations.
Financing and Transaction Costs
Financing costs associated with the issuance of debt are recorded directly against net income. Transaction costs, such as legal fees, that are directly attributable to the acquisition of financial assets or incurrence of financial liabilities are recorded directly against net income.
F-10
SAND Technology Inc.
Notes to Consolidated Financial Statements
July 31, 2011
(Expressed in Canadian Dollars, unless otherwise stated)
Research and Development Costs
Research costs are charged to operations in the period in which they are incurred. Development costs are expensed as incurred unless a project meets the criteria under Canadian GAAP for deferral and amortization. The Company has not deferred any such development costs to date. Related tax credits are recorded as a reduction of research and development costs in the year that they are earned. These tax credits are periodically examined by the tax authorities and, as a result of such examinations, the amounts ultimately granted may differ from the amounts recorded.
Stock-Based Compensation
The Company estimates the fair value of share-based payment awards made to employees, officers and directors, including stock options and share awards related to employee stock purchase plans, on the date of grant using an option-pricing model. The value of the portion of the award that is ultimately expected to vest is recognized as an expense ratably over the requisite service periods. The Company uses the Black-Scholes option pricing model to determine the fair value of the stock-based compensation that it grants to employees and non-employees. The Company is required to make certain assumptions in connection with this determination, the most important of which involves the calculation of volatility with respect to the price of its common stock. The computation of volatility is intended to produce a volatility value that is representative of the Company's expectations about the future volatility of the price of its common stock over an expected term. The Company used its share price history to determine volatility and cannot predict how the price of its common shares of common stock will react on the open market in the future. As a result, the volatility value that the Company calculated may differ from the future volatility of the price of its shares of common stock.
Upon the exercise of stock options, any consideration received and the amounts previously recorded under stock-based compensation, within contributed surplus, are credited to share capital. Upon the issuance of shares resulting from share awards, amounts previously recorded under stock-based compensation, within contributed surplus, are credited to share capital.
Guarantees
In the normal course of its operations, the Company enters into agreements that contain certain features which meet the definition of a guarantee under the guidance provided by Accounting Guideline AcG–14 – Disclosure of Guarantees.
Certain agreements with customers include intellectual-property indemnification obligations that are customary in the industry. These obligations would generally require the Company to compensate a third party for certain damages and losses incurred as a result of third-party intellectual-property claims arising from these agreements.
The nature of these obligations prevents the Company from making a reasonable estimate of the maximum potential amount it could be required to pay. Historically, the Company has not made any payments under such obligations.
In addition, the Company provided warranties as part of the sale of a former subsidiary, ClarityBlue Limited, which occurred on July 31, 2003, for claims against it related to conditions existing prior to the sale. The warranties expired on January 31, 2010.
F-11
SAND Technology Inc.
Notes to Consolidated Financial Statements
July 31, 2011
(Expressed in Canadian Dollars, unless otherwise stated)
Financial Assets and Liabilities
On initial recognition, all financial assets and liabilities are measured and recognized at their fair value. Subsequently, financial assets and liabilities are measured and recognized as follows:
| - | Cash is classified as aheld-for-trading financial asset. It is measured at fair value and changes in fair value are recognized in operations. |
| - | Accounts receivable are classified asloans and receivable. They are measured at amortized cost, which is generally the amount initially recognized, less any allowance for doubtful accounts. |
| - | Accounts payable and accrued liabilities (excluding sales tax payable), due to shareholders and convertible debentures are classified asother financial liabilities. They are measured at amortized cost using the effective interest rate method. Interest calculated using the effective interest method is presented in operations as interest expense. |
Fair Value Measurements
The Company determines fair value using a fair value hierarchy that distinguishes between market participant assumptions developed based on market data (observable inputs) obtained from sources independent of the reporting entity, and a reporting entity’s own assumptions (unobservable inputs) about market participant assumptions developed based on the best information available in the circumstances.
Fair value is the price that would be received to sell an asset or paid to transfer a liability in the Company’s principal or most advantageous market for the asset or liability in an orderly transaction between market participants at the measurement date, essentially the exit price.
A financial instrument’s level within the fair value hierarchy is based on the lowest level of any input that is significant to the fair value measurement. However, the determination of what constitutes “observable” requires significant judgment by the Company.
The levels of fair value hierarchy are as follows:
- Level one – Unadjusted quoted market prices in active markets for identical assets or liabilities;
- Level two – Inputs other than level one inputs that are either directly or indirectly observable; and
- Level three – Unobservable inputs developed using estimates and assumptions, which are developed by the reporting entity and reflect those assumptions that a market participant would use.
Level 1 financial instruments are valued based on quoted market prices in active markets. Level 2 financial instruments are valued based on quoted prices in markets that are not active, broker or dealer quotations, or alternative pricing sources with reasonable levels of price transparency.
3 –FUTURE ACCOUNTING CHANGES
International Financial Reporting Standards (“IFRS”)
In February 2008, the Canadian Accounting Standards Board confirmed that Canadian GAAP for publicly accountable enterprises will be converged with IFRS effective for fiscal years beginning on or after January 1, 2011. IFRS uses a conceptual framework similar to Canadian GAAP, but there are significant differences in recognition, measurement and disclosures. The Company will change over to IFRS for its interim and annual financial statements beginning on August 1, 2011.
F-12
SAND Technology Inc.
Notes to Consolidated Financial Statements
July 31, 2011
(Expressed in Canadian Dollars, unless otherwise stated)
4–INFORMATION ON EARNINGS
| | | Year ended | | | Year ended | | | Year ended | |
| | | July 31, | | | July 31, | | | July 31, | |
| | | 2011 | | | 2010 | | | 2009 | |
| Interest expense | | | | | | | | | |
| Accretion of debt component of convertible debentures | $ | 94,362 | | $ | 86,087 | | $ | 83,879 | |
| Interest expense - due to shareholders | | 261,310 | | | 185,045 | | | 220,320 | |
| Interest expense - other | | 14,641 | | | 24,809 | | | 9,453 | |
| | | | | | | | | | |
| | $ | 370,313 | | $ | 295,941 | | $ | 313,652 | |
Amortization expense of capital assets amounted to $40,597 in 2011 ($53,298 in 2010 and $63,643 in 2009).
5- CAPITAL ASSETS
| | | | | | | | | July31, | |
| | | | | | | | | 2011 | |
| | | | | | Accumulated | | | NetBook | |
| | | Cost | | | amortization | | | Value | |
| | | | | | | | | | |
| Furniture and equipment | $ | 544,891 | | $ | 523,704 | | $ | 21,187 | |
| Computer equipment | | 114,138 | | | 98,703 | | | 15,435 | |
| Research and development equipment | | 176,111 | | | 160,827 | | | 15,284 | |
| Leasehold improvements | | 323,844 | | | 294,389 | | | 29,455 | |
| | | | | | | | | | |
| | $ | 1,158,984 | | $ | 1,077,623 | | $ | 81,361 | |
| | | | | | | | | July31, | |
| | | | | | | | | 2010 | |
| | | | | | Accumulated | | | NetBook | |
| | | Cost | | | amortization | | | Value | |
| | | | | | | | | | |
| Furniture and equipment | $ | 569,433 | | $ | 546,563 | | $ | 22,870 | |
| Computer equipment | | 325,132 | | | 307,120 | | | 18,012 | |
| Research and development equipment | | 161,565 | | | 154,527 | | | 7,038 | |
| Leasehold improvements | | 294,287 | | | 277,719 | | | 16,568 | |
| | | | | | | | | | |
| | $ | 1,350,417 | | $ | 1,285,929 | | $ | 64,488 | |
F-13
SAND Technology Inc.
Notes to Consolidated Financial Statements
July 31, 2011
(Expressed in Canadian Dollars, unless otherwise stated)
6 -ACCOUNTS PAYABLE AND ACCRUED LIABILITIES
| | | July31, | | | July31, | |
| | | 2011 | | | 2010 | |
| | | | | | | |
| Trade accounts payable and accrued liabilities | $ | 690,282 | | $ | 834,371 | |
| Salaries and commission payable | | 74,952 | | | 57,186 | |
| Sales tax payable | | 11,389 | | | 66,884 | |
| Advance from a private investor | | - | | | 25,708 | |
| | | | | | | |
| | $ | 776,623 | | $ | 984,149 | |
The advance from a private investor was settled as part of the private placement completed on March 17, 2011 (Note 9b)).
7 -DUE TO SHAREHOLDERS
| | | July 31, | | | July 31, | |
| | | 2011 | | | 2010 | |
| | | | | | | |
Loan from the Chief Executive Officer, repayable on demand,
bearing interest at 10%, interest payable monthly (a) | $ | 22,014 | | $ | 300,893 | |
| | | | | | | |
Loan from a significant shareholder, bearing interest at 15%,
interest payable semi-annually, principle of $488,892 payable
annually starting January 1, 2011, maturing on January 1, 2013 (b) | | 1,685,411 | | | 1,407,874 | |
| | | | | | | |
| Compensation payable to a significant shareholder (d) | | 165,386 | | | 165,386 | |
| | | | | | | |
| Due to a significant shareholder under a consulting agreement (c) | | 42,026 | | | - | |
| | | | | | | |
| | | 1,914,837 | | | 1,874,153 | |
| | | | | | | |
| Less: Current portion | | 1,425,945 | | | 896,369 | |
| | | | | | | |
| | $ | 488,892 | | $ | 977,784 | |
| | (a) | During fiscal year 2011 and fiscal year 2010, the Company obtained various loans from the Chief Executive Officer, who is also a shareholder, in the form of Promissory Notes for a total amount of $341,621 (U.S.$325,000) (2011: $41,728 (U.S.$40,000); 2010: 299,893 (U.S.$285,000)). Under the terms of the Promissory Notes, the amounts are repayable within 30 days of receipt of a written demand from the noteholder. The Promissory Notes bear interest at 10% payable on the last business day of each calendar month. As at July 31, 2010, an amount of $300,893 (U.S.$287,847), including accrued interest of $2,927 (U.S.$2,847), was outstanding on the Promissory Notes. During the year ended July 31, 2011, a private placement was completed (Note 9) which converted the principal value amounting to $341,621 (U.S.$325,000) of the Promissory Notes. As at July 31, 2011, an amount of accrued interest of $22,014 (U.S.$23,040) was outstanding. |
F-14
SAND Technology Inc.
Notes to Consolidated Financial Statements
July 31, 2011
(Expressed in Canadian Dollars, unless otherwise stated)
| | (b) | During fiscal year 2009, the Company formalized the conditions pertaining to a loan obtained from a significant shareholder. The loan originated from amounts owed by the Company to the shareholder by virtue of his previous employment contracts as President and Chief Executive Officer. The significant shareholder ceased to be President and Chief Executive Officer on October 31, 2009. The total amount owing under the loan agreement as at October 31, 2009 was $1,466,677. Under the terms of the loan agreement, the loan is repayable in three (3) principal annual instalments of $488,892 over 3 years on January 1, 2011, 2012 and 2013. The loan bears interest at 15% that is payable semi-annually on January 1 and June 30 of each year. The amount may be prepaid at any time by the Company without penalty. In the event of default to pay an amount when due, the significant shareholder shall have the right to convert all outstanding amounts owed to him hereunder into common shares of the Company based on the average closing price of the shares on the OTC Bulletin Board for the month immediately preceding the month in which such right is exercised. In addition and also upon default, the significant shareholder shall have the right to require the Company to purchase all common shares in the capital stock of the Company owned directly or indirectly by the significant shareholder at a purchase price per share equal to the greater of: |
| | i) | the average closing price of the shares on the OTC Bulletin Board over the previous 30-day period plus 15%, or |
| | | |
| | ii) | the book value of the shares as determined by the auditors of the Company. |
| | | As at July 31, 2011, an amount of $1,685,411 (July 31, 2010 - $1,407,874), including accrued interest of $481,751 (July 31, 2010 - $204,214), was outstanding under the loan agreement. |
| | | |
| | | As at July 31, 2011, the Company was in default as it did not make its January 1, 2011 installment. However, a Standstill Agreement was signed between the Company and the significant shareholder, effective February 1, 2011, and the default was cured subsequent to the year end as the Company paid the significant shareholder the amounts due (Note 20). |
| | | |
| | | In conjunction with the original loan agreement, the Company also issued 103,061 warrants to the significant shareholder, with each warrant entitling the holder to purchase one class "A" common share of the Company at a price of US$0.44 per share and each warrant being valid for the term of the agreement. The residual valuation method was used to allocate the proceeds between the debt and equity components of the shareholder loan. It was determined that the value of the debt component would comprise the entire face value of the loan since the loan had no maturity date. Hence, the value of the equity component was determined to be nil. These warrants expired during the fiscal year 2010. |
| | | |
| | (c) | The Company, effective November 1, 2009, also signed a consulting agreement and a marketing and sales assistance agreement with the former President and Chief Executive Officer. The consulting agreement provides for a fixed payment on the first of each month in the amount of $21,013 and expires on October 31, 2011. Payments made under the consulting agreement during fiscal year 2011 amounted to $210,130 (2010 - $189,117) with a balance owing at July 31, 2011 of $42,026 (July 31, 2010 – Nil). |
F-15
SAND Technology Inc.
Notes to Consolidated Financial Statements
July 31, 2011
(Expressed in Canadian Dollars, unless otherwise stated)
| | | Under the marketing and sales assistance agreement, the Company and the former President and Chief Executive Officer may identify prospective customers for the Company`s products and agree to designate such prospects as a registered opportunity. The marketing and sales assistance agreement provides for the payment of funds based on a percentage of sales proceeds received from a registered opportunity and which were received within a stipulated period following the date of registration of the opportunity. The marketing and sales assistance agreement expired on October 31, 2010. There were no payments made under the marketing and sales assistance agreement during fiscal year 2011 or fiscal year 2010. |
| | | |
| | (d) | The former President and Chief Executive Officer was entitled to, under his previous employment contracts, bonuses based on the achievement of gross revenues resulting from the licensing, sale or other disposition of the Company’s Nucleus software products. The bonuses terminated effective October 31, 2009 when he ceased to be the President and Chief Executive Officer. As at July 31, 2011 and 2010, bonuses payable amounted to $165,386 and $165,386, respectively. |
During fiscal year 2008, an inter-creditor priority agreement was signed between the former President and Chief Executive Officer and significant shareholder (loans disclosed under b), c) and d) above) and the holders of the secured convertible debentures (collectively the “parties”), at the time when the Company issued the secured convertible debentures described in Note 8. The parties agreed that the sums owing under the secured convertible debentures will be paid by the Company to the convertible debenture holders in priority to the sums owed by the Company to the principal shareholder. Specifically, for every $2 paid to the convertible debenture holders, the Company shall remit $1 to the significant shareholder, representing the repayment of principal only. The inter-creditor priority agreement was amended on October 31, 2009 pursuant to which the parties agreed that the sums owing under the convertible debentures will be paid by the Company to the holders of the convertible debentures pari passu to the sums owing by the Company to the significant shareholder such that for every $1 paid to the convertible debenture holders, the Company shall remit $1 to the significant shareholder.
8 -CONVERTIBLE DEBENTURES
On April 18, 2008, the Company issued secured convertible debentures ("Convertible Debentures") on a private placement basis and received gross proceeds of $1,009,819 (U.S.$1,002,600) representing a total of 1,114 units. Each unit consists of one 8% Convertible Debenture due December 31, 2017, having a nominal value of U.S.$900, redeemable at the option of the Company if the bid price of the underlying common share has been above U.S.$1.50 for 60 consecutive trading days, and convertible at the option of the holder into class "A" common shares at U.S.$0.45 per share, and 1,000 share purchase warrants of the Company. Each warrant entitles the holder to purchase one additional common share (“Warrant Share”) of the Company at a price of U.S.$0.70 per warrant share at any time until the earlier of the close of business day which is thirty six (36) months from April 18, 2008 or the date on which the bid price of the stock has been above U.S.$1.50 for sixty (60) consecutive trading days. Interest is calculated at the rate of 8% per annum, payable in common shares at a rate of U.S.$0.45 per share. The interest is due on each conversion date (date when the principal amount is being converted) subsequent to January 1, 2009 or on the maturity date. The financing is secured by a first rank hypothec on all of the Company’s property and assets, movable and immovable, corporeal and incorporeal, present and future, for the principal accrued interest amounts. The proceeds from the private placement were used for marketing and advertising and for expansion of the business.
F-16
SAND Technology Inc.
Notes to Consolidated Financial Statements
July 31, 2011
(Expressed in Canadian Dollars, unless otherwise stated)
Certain warrant holders exercised their Warrant Shares associated with the secured convertible debentures prior to their expiry date of April 18, 2011. As a result of ratchet provisions contained in the warrant security, the exercise price was reduced from U.S.$0.70 per Warrant Share to CDN.$0.01 per Warrant Share. On May 5, 2011, the Company issued 613,000 common shares pursuant to the exercise of the Warrants for proceeds of $6,879 (U.S.$6,130) while 501,000 warrants expired.
For accounting purposes, the debenture contains both a debt component and an equity component being the share warrants, the conversion option and the interest payable in shares:
| – | The debt component of the Convertible Debentures was originally calculated using the present value of the cash flows of principal and interest payments using a discount rate of 15%. The amount calculated, at the issue date, for the carrying amount of the debt component was $260,377. The carrying value of the debt component is being accreted to its face value over its life to maturity. The accretion expense, being the amortization of the convertible debentures discount, is included in interest expense in the statement of operations. The debt issuance costs were expensed directly against net income. The amortization of the debt component of the convertible debentures for the periods ended July 31, 2011, 2010 and 2009 was $94,362, $86,087 and $83,879, respectively. |
| | |
| – | The amount calculated for the carrying amount of the equity component, at the issue date, was $749,442, determined by deducting the carrying amount of the debt component from the gross proceeds received. The value of the equity component includes the fair value of the share warrants, the conversion option and the interest payable in shares. The fair value of the warrants was estimated at $303,415 and was recorded in contributed surplus. The fair value of the warrants at the time of issue the Convertible Debentures was estimated using the Black-Scholes option pricing model with the following assumptions: |
| Dividend yield | – |
| Expected volatility | 90% |
| Risk-free interest rate | 3.25% |
| Expected life | 3 years |
The remaining equity component balance, in the amount of $446,027, represents the fair value of the conversion option and the interest payable in shares and has been presented separately in shareholders’ deficiency.
9 –PRIVATE PLACEMENTS
| | a) | On November 6, 2009, the Company completed a Non-Brokered Private Placement Subscription Agreement (“Private Placement”) in the amount of $587,835 (U.S.$550,000) for Units in the Company at a price of U.S.$0.70 per Unit, resulting in the issuance of 785,715 Units. Each Unit consists of two class ”A” common shares and one share purchase warrant (“Warrant”) of the Company. Each Warrant entitles the holder to purchase one additional common share (“Warrant Share”) of the Company at a price of U.S.$0.50 per Warrant Share at any time until the earlier of the close of business day which is either thirty six (36) months from the closing date, November 6, 2009, or the date on which the bid price of the stock has been above U.S.$1.50 for sixty (60) consecutive trading days. The Company received $429,495 (U.S.$400,000) from private investors and $158,340 (U.S.$150,000) from the Chief Executive Officer. The Private Placement resulted in the issuance of 1,571,431 common shares and 785,715 warrants of the Company. |
F-17
SAND Technology Inc.
Notes to Consolidated Financial Statements
July 31, 2011
(Expressed in Canadian Dollars, unless otherwise stated)
The Company allocated the proceeds from the issuance of the Units between the common shares and the warrants according to their relative fair value, using the Black-Scholes option pricing model to determine the fair value of the warrants. The fair value allocated to the common shares was estimated at $445,667 and was recorded in share capital. The fair value allocated to the warrants was estimated at $142,168 and was recorded in contributed surplus. The fair value of the warrants at the time of issue of the Private Placement was estimated using the Black-Scholes option pricing model with the following assumptions:
| | Dividend yield | - |
| | Expected volatility | 103% |
| | Risk-free interest rate | 1.81% |
| | Expected life | 3 years |
| | b) | On March 17, 2011, the Company completed Non-Brokered Private Placement Subscription Agreement (“Private Placement”) in the amount of $775,073 (U.S.$750,000) for Units in the Company at a price of U.S.$0.70 per Unit, resulting in the issuance of 1,071,432 Units. Each Unit consists of two class ”A” common shares and one share purchase warrant (“Warrant”) of the Company. Each Warrant entitles the holder to purchase one additional common share (“Warrant Share”) of the Company at a price of U.S.$0.50 per Warrant Share at any time until the earlier of the close of business day which is either thirty six (36) months from the closing date, March 17, 2011, or the date on which the bid price of the stock has been above U.S.$1.50 for sixty (60) consecutive trading days. The Company received $448,558 (U.S.$425,000) from private investors and $326,515 (U.S.$325,000) from the Chief Executive Officer. The Private Placement resulted in the issuance of 2,142,864 common shares and 1,071,432 warrants of the Company. |
| | | |
| | | The Company allocated the proceeds from the issuance of the Units between the common shares and the warrants according to their relative fair value, using the Black-Scholes option pricing model to determine the fair value of the warrants. The fair value allocated to the common shares was estimated at $579,175 and was recorded in share capital. The fair value allocated to the warrants was estimated at $195,898 and was recorded in contributed surplus. The fair value of the warrants at the time of issue of the Private Placement was estimated using the Black-Scholes option pricing model with the following assumptions: |
| | Dividend yield | - |
| | Expected volatility | 131% |
| | Risk-free interest rate | 1.28% |
| | Expected life | 3 years |
F-18
SAND Technology Inc.
Notes to Consolidated Financial Statements
July 31, 2011
(Expressed in Canadian Dollars, unless otherwise stated)
10-SHARECAPITAL
2011 transactions
On February 2, 2011, the Company issued 411,152 common shares to current and former Directors of the Company in settlement of debt in the amount of $143,903 owing to these individuals for past service as Directors.
On March 24, 2011, the Company issued 2,142,864 common shares to private investors including the Chief Executive Officer as part of a Non-Brokered Private Placement Subscription Agreement for proceeds of $775,073 (U.S.$750,000) as described in Note 9.
On May 4, 2011, the Company issued 60,000 common shares upon the exercise of 60,000 stock options at an exercise price of $0.01 for proceeds of $600.
On May 5, 2011, the Company issued 613,000 common shares upon the exercise of 613,000 warrants relating to the Convertible Debentures offering in April 2008 at an exercise price of $0.01 for Canadian dollar proceeds of $6,879.
2010 transactions
On November 6, 2009, the Company issued 785,715 Units which included 1,571,431 common shares relating to a Non-Brokered Private Placement Subscription Agreement, as described in Note 9, for an amount of $587,835.
11 –STOCK OPTIONS, SHARE AWARDS AND WARRANTS
a)Stock Option Plans
The Company has three stock option plans:
| 1. | Under the 1996 Stock Incentive Plan, the Company may grant options to full-time employees up to a maximum of 1,100,000 class "A" common shares; |
| | |
| 2. | Under the 1996 Stock Option Plan, the Company may grant options to its full-time employees and non- employee directors up to a maximum of 900,000 class "A" common shares. |
| | |
| 3. | Under the 2010 Stock Incentive Plan, the Company may grant options or share awards to its full-time employees, executive officers, directors and consultants up to a maximum of 4,000,000 class “A” common shares. |
Under the 1996 Stock Incentive Plan, the exercise price of each option for common shares may not be less than the closing price of the Common Shares on the trading day prior to the day the option is granted or, if there was no transaction on that day, the average of the bid and ask prices on that day, less any discount as determined by the Board of Directors within the extent permitted by the applicable regulatory provisions
F-19
SAND Technology Inc.
Notes to Consolidated Financial Statements
July 31, 2011
(Expressed in Canadian Dollars, unless otherwise stated)
Under the 1996 Stock Option Plan, the exercise price of each option for common shares may not be less than the price of the common shares as determined by the Board of Directors within the extent permitted by the applicable regulatory provisions.
Under the 2010 Stock Incentive Plan, the exercise price of each option for common shares shall be determined by the Board of Directors on the date the option is granted, provided that such price may not be less than U.S.$0.01 per common share.
Stock options vest as stipulated in the stock option agreement and, under the 2010 Stock Incentive Plan, have a maximum term of10 years. Stock options issued under the 1996 Stock Incentive Plan and the 1996 Stock Option Plan have a maximum term of 20 years.
The following table summarizes information about the Company’s stock options:
| | | July 31, 2011 | | | July 31, 2010 | |
| | | | | | Weighted | | | | | | Weighted | |
| | | | | | average | | | | | | average | |
| | | Number of | | | exercise | | | Number of | | | exercise | |
| | | options | | | price | | | options | | | price | |
| | | | | | (U.S. dollars) | | | | | | (U.S. dollars) | |
| | | | | | | | | | | | | |
| Options outstanding, beginning of year | | 357,000 | | | 1.00 | | | 551,000 | | | 0.98 | |
| Granted | | 3,295,756 | | | 0.01 | | | - | | | - | |
| Exercised | | (60,000 | ) | | (0.01 | ) | | - | | | - | |
| Expired | | (27,310 | ) | | (0.01 | ) | | (21,000 | ) | | (4.97 | ) |
| Forfeited | | (91,863 | ) | | (0.01 | ) | | (173,000 | ) | | (1.00 | ) |
| | | | | | | | | | | | | |
| Options outstanding, end of year | | 3,473,583 | | | 0.11 | | | 357,000 | | | 1.00 | |
| | | | | | | | | | | | | |
| Optionse xercisable, end of year | | 2,461,160 | | | 0.16 | | | 214,200 | | | 1.00 | |
The fair value of the stock options at the time of issue was estimated using the Black-Scholes option pricing model with the following assumptions:
| Dividend yield | - |
| Expected volatility | 204% |
| Risk-free interest rate | 2.70% |
| Expected life | 8 years |
The following table summarizes significant ranges of exercise prices of outstanding and exercisable options held by employees, officers and directors as of July 31, 2011:
F-20
SAND Technology Inc.
Notes to Consolidated Financial Statements
July 31, 2011
(Expressed in Canadian Dollars, unless otherwise stated)
| | | July 31, 2011 | | | July 31, 2011 | |
| | | Options Outstanding | | | Options Exercisable | |
| | | | | | Weighted | | | Weighted | | | | | | Weighted | | | Weighted | |
| | | | | | average | | | average | | | | | | average | | | average | |
| | | Number of | | | remaining | | | exercise | | | Number of | | | remaining | | | exercise | |
| | | options | | | life (years) | | | price | | | options | | | life(years) | | | price | |
| | | | | | | | | (U.S. dollars) | | | | | | | | | (U.S. dollars) | |
| | | | | | | | | | | | | | | | | | | |
| U.S. $1.00 | | 357,000 | | | 5.06 | | | 1.00 | | | 357,000 | | | 5.06 | | | 1.00 | |
| CDN. $0.01 | | 3,116,583 | | | 7.58 | | | 0.01 | | | 2,104,160 | | | 7.58 | | | 0.01 | |
| | | | | | | | | | | | | | | | | | | |
| | | 3,473,583 | | | 7.32 | | | 0.11 | | | 2,461,160 | | | 7.22 | | | 0.16 | |
During the year ended July 31, 2011, 3,295,756 stock options were granted at an exercise price of U.S.0.01, in accordance with the 2010 Stock Incentive Plan, which was below the market price of the Company’s class “A” common shares at the time the stock options were granted.
Stock-based compensation expense included in selling, general and administrative expenses for the years ended July 31, 2011, 2010 and 2009 was $731,842, $19,577 and $19,573, respectively.
b)Warrants
The following table summarizes information about the Company’s share warrants:
| | | July 31, 2011 | | | July 31, 2010 | |
| | | | | | Weighted | | | Weighted | | | | | | Weighted | | | Weighted | |
| | | | | | average | | | average | | | | | | average | | | average | |
| | | Number of | | | remaining | | | exercise | | | Number of | | | remaining | | | exercise | |
| | | warrants | | | life (years) | | | price | | | warrants | | | life (years) | | | price | |
| | | | | | | | | (U.S. dollars) | | | | | | | | | (U.S. dollars) | |
| | | | | | | | | | | | | | | | | | | |
| Balance, beginning of year | | 1,899,715 | | | 1.40 | | | 0.61 | | | 1,967,061 | | | 1.30 | | | 0.65 | |
| Granted | | 1,071,432 | | | 2.63 | | | 0.50 | | | 785,715 | | | 3.00 | | | 0.50 | |
| Exercised | | (613,000 | ) | | - | | | (0.01 | ) | | - | | | - | | | - | |
| Expired | | (501,000 | ) | | - | | | (0.70 | ) | | (853,061 | ) | | - | | | (0.60 | ) |
| Forfeited | | - | | | - | | | - | | | - | | | - | | | - | |
| | | | | | | | | | | | | | | | | | | |
| Balance, end of year | | 1,857,147 | | | 2.04 | | | 0.50 | | | 1,899,715 | | | 1.40 | | | 0.61 | |
c)Share Awards
Under a Share Award Plan, the Company was eligible to grant class "A" common shares to its full-time employees up to a maximum of 1,000,000 class "A" common shares, at a value not to exceed the fair market value of the class "A" common shares at the time of grant and conditional upon a period of continued employment service with the Company by the employees.
F-21
SAND Technology Inc.
Notes to Consolidated Financial Statements
July 31, 2011
(Expressed in Canadian Dollars, unless otherwise stated)
The Share Award Plan is intended to promote the interests of the Company by (i) aiding the retention of employees and facilitating the recruitment of personnel by providing incentive compensation opportunities; and (ii) matching employees’ financial interests with those of the Company’s shareholders. The administrator of the Share Award Plan has the authority to determine the terms and conditions of each award granted. The Company granted 407,500 share awards on September 30, 2007 upon the one condition that the recipient remain employed with the Company for a period of 3 years. As at July 31, 2010, as a result of terminations and resignations, there remained 302,500 shares that may be issued, subject to continued employment by the employees until September 30, 2010, under the Share Award Plan. At September 30, 2010, as a result of terminations and resignations, there remained 277,500 shares that may be issued under the Share Award Plan. On December 17, 2010, in lieu of issuing common shares for such share awards, the Board of Directors issued 277,500 stock options from the 2010 Stock Incentive Plan.
The share award compensation expense included in selling, general and administrative expenses for the years ended July 31, 2011, 2010 and 2009 was $10,005, $60,028 and $60,026, respectively.
12 -RESEARCHAND DEVELOPMENT COSTS
Research and development costs presented in the consolidated statements of operations and comprehensive loss have been determined as follows:
| | | Year ended | | | Year ended | | | Year ended | |
| | | July 31, | | | July 31, | | | July 31, | |
| | | 2011 | | | 2010 | | | 2009 | |
| | | | | | | | | | |
| Research and development costs | $ | 2,191,952 | | $ | 2,164,938 | | $ | 2,120,295 | |
| Government assistance | | | | | | | | | |
| Investment tax credits (a) | | (325,708 | ) | | (706,546 | ) | | (160,000 | ) |
| | | | | | | | | | |
| | $ | 1,866,244 | | $ | 1,458,392 | | $ | 1,960,295 | |
| (a) | During fiscal year 2010, the Company received an additional amount of tax credits in the amount of $69,401 relating to the fiscal year ended July 31, 2008. This amount related to an enhanced program for tax credits offered by the Province of Quebec (Canada) and which came into effect in the fourth quarter of fiscal 2008. The tax credits for fiscal year 2010 also include an accrual for benefits under the same enhanced program for tax credits relating to the years ended July 31, 2010 and 2009. |
13 -INCOMETAXES
The reconciliation of the income tax recovery, based on reported taxable income (loss) and using Canadian statutory tax rates, with the reported income tax expense for the years ended July 31, 2011, 2010 and 2009 is as follows:
F-22
SAND Technology Inc.
Notes to Consolidated Financial Statements
July 31, 2011
(Expressed in Canadian Dollars, unless otherwise stated)
| | | Year ended | | | Year ended | | | Year ended | |
| | | July 31, | | | July 31, | | | July 31, | |
| | | 2011 | | | 2010 | | | 2009 | |
| | | | | | | �� | | | |
| Income taxr ecovery a tCanadian statutory rates | $ | (605,000 | ) | $ | (223,000 | ) | $ | (370,000 | ) |
| Non-recorded benefit from losses carried forward | | (605,000 | ) | | (223,000 | ) | | (370,000 | ) |
| | | | | | | | | | |
| | $ | - | | $ | - | | $ | - | |
The significant components of the Company’s future income tax assets and liabilities are as follows:
| | | July 31, | | | July 31, | |
| | | 2011 | | | 2010 | |
| | | | | | | |
| Future income tax assets | | | | | | |
| Losses carried forward | $ | 17,981,000 | | $ | 15,590,000 | |
| Capital assets | | 228,000 | | | 182,000 | |
| Research and development | | 4,453,000 | | | 4,136,000 | |
| | | 22,662,000 | | | 19,908,000 | |
| Future income tax liabilities | | | | | | |
| Convertible debentures | | 76,000 | | | 51,000 | |
| | | 22,586,000 | | | 19,857,000 | |
| | | | | | | |
| Less: Valuation allowance | | (22,586,000 | ) | | (19,857,000 | ) |
| | | | | | | |
| | $ | - | | $ | - | |
As at July 31, 2011, the Company has non-capital losses carried forward to reduce future taxable income expiring at various dates to 2031, as follows:
| | | July 31, | |
| | | 2011 | |
| | | (CDN. Dollars) | |
| | | | |
| Canada | $ | 18,702,000 | |
| United States | | 26,058,000 | |
| United Kingdom | | - | |
| Germany | | 5,542,000 | |
| | | | |
| | $ | 50,302,000 | |
F-23
SAND Technology Inc.
Notes to Consolidated Financial Statements
July 31, 2011
(Expressed in Canadian Dollars, unless otherwise stated)
In addition, the Company has unclaimed research and development expenditures carried forward of approximately $15,411,000, which can be used to reduce taxable income at any time in the future, and investment tax credits of approximately $4,192,000, which can be applied against future Canadian federal income taxes payable, expiring at various dates to 2020. The benefits from these unclaimed amounts have not been recognized in the consolidated financial statements.
14-COMMITMENTS
The Company is committed under operating leases for the lease of office space and certain office equipment for a total amount of $2,311,503. The minimum lease payments due in each of the next five years and thereafter are as follows:
| 2012 | | | | $ | 314,073 | |
| 2013 | | | | | 268,030 | |
| 2014 | | | | | 267,546 | |
| 2015 | | | | | 222,985 | |
| 2016 | | | | | 200,704 | |
| Thereafter | | | | | 1,038,165 | |
| | | | | | | |
| | | | | $ | 2,311,503 | |
15 –SEGMENTED INFORMATION
For purposes of segmented information, the Company has identified one reportable business segment and four main geographic areas. The geographic areas of Canada, United States, Europe and Australia market the SAND/DNA product suite. The accounting policies of the Company are consistently applied in the geographic areas of Canada, United States, Europe and Australia. Sales for each geographic area are based on the location of the third party customers with customers in areas other than Canada, United States, Europe and Australia included in the geographic area where the sales invoice is initiated. All intercompany transactions between areas have been eliminated.
F-24
SAND Technology Inc.
Notes to Consolidated Financial Statements
July 31, 2011
(Expressed in Canadian Dollars, unless otherwise stated)
| | | | | | United | | | | | | | | | | |
| | | Canada | | | States | | | Europe | | | Australia | | | Total | |
| 2011 | | | | | | | | | | | | | | | |
| Revenue | $ | 909,206 | | $ | 914,020 | | $ | 4,824,667 | | $ | 223,778 | | $ | 6,871,671 | |
| Current assets | | 835,299 | | | 316,678 | | | 685,560 | | | 296,329 | | | 2,133,866 | |
| Net capital assets | | 47,727 | | | 5,567 | | | 26,863 | | | 1,204 | | | 81,361 | |
| | | | | | | | | | | | | | | | |
| 2010 | | | | | | | | | | | | | | | |
| Revenue | | 1,131,633 | | | 812,620 | | | 4,618,158 | | | - | | | 6,562,411 | |
| Current assets | | 1,190,955 | | | 121,285 | | | 740,715 | | | - | | | 2,052,955 | |
| Net capital assets | | 25,033 | | | 8,551 | | | 30,904 | | | - | | | 64,488 | |
| | | | | | | | | | | | | | | | |
| 2009 | | | | | | | | | | | | | | | |
| Revenue | | 1,716,902 | | | 971,777 | | | 4,360,558 | | | - | | | 7,049,237 | |
| Current assets | | 915,910 | | | 295,690 | | | 1,445,274 | | | - | | | 2,656,874 | |
| Net capital assets | | 55,524 | | | - | | | 27,928 | | | - | | | 83,452 | |
F-25
SAND Technology Inc.
Notes to Consolidated Financial Statements
July 31, 2011
(Expressed in Canadian Dollars, unless otherwise stated)
16 –CAPITAL MANAGEMENT
The Company’s capital management objectives are to ensure the Company’s ability to continue as a going concern and to provide an adequate return to its shareholders through the optimization of the Company’s debt and equity balances. The Company’s capital consists of the total of due to shareholders and convertible debentures, reduced by cash and shareholders’ deficiency. The Company manages its capital structure and makes adjustments to it in the light of its expected business growth and changes in economic conditions. In order to maintain or adjust its capital structure, the Company may issue new shares or return capital to shareholders or issue new debt or pay down existing debt.
| | | July 31, | | | July 31, | |
| | | 2011 | | | 2010 | |
| | | | | | | |
| Due to shareholders | $ | 1,914,837 | | $ | 1,874,153 | |
| Convertible debentures | | 542,671 | | | 448,309 | |
| Total Debt | | 2,457,508 | | | 2,322,462 | |
| | | | | | | |
| Less Cash | | 810,745 | | | 579,270 | |
| Net Debt | | 1,646,763 | | | 1,743,192 | |
| | | | | | | |
| Shareholders' deficiency | | | | | | |
| Share capital | | 39,706,665 | | | 38,976,108 | |
| Equity component of convertible debenture | | 446,027 | | | 446,027 | |
| Contributed surplus | | 1,991,642 | | | 1,053,897 | |
| Deficit | | (45,039,165 | ) | | (42,926,696 | ) |
| | | (2,894,831 | ) | | (2,450,664 | ) |
| | | | | | | |
| Adjusted Capital | $ | (1,248,068 | ) | $ | (707,472 | ) |
17 –FINANCIAL RISKS
Financial Risk Management
The objective of the Company’s financial risk management is to minimize its risk exposure against various financial risks, which include interest rate risk, credit risk, currency risk and liquidity risk. The Company does not use derivative financial instruments to minimize such risks.
a) Interest rate risk
Interest rate risk is the risk that the future cash flows or the fair value of a financial instrument will fluctuate because of changes in market interest rates. The Company's debt is at fixed rates thereby limiting the exposure to cash flow resulting from interest rate fluctuations. However, changes in interest rates may have an impact on the fair value of the debt. Management assesses the Company’s interest rate risk to be low.
F-26
SAND Technology Inc.
Notes to Consolidated Financial Statements
July 31, 2011
(Expressed in Canadian Dollars, unless otherwise stated)
b) Credit risk
Credit risk is the risk that one party to a financial instrument will fail to discharge its obligation and cause the other party to incur a financial loss. The Company’s maximum exposure to credit risk is limited to the carrying amount of financial assets recorded at the balance sheet date.
The Company’s credit risk exposure is detailed as follows:
| | | July 31, | | | July 31, | |
| | | 2011 | | | 2010 | |
| | | | | | | |
| Cash | $ | 810,745 | | $ | 579,270 | |
| Accounts receivable | | 541,959 | | | 739,144 | |
| | | | | | | |
| | $ | 1,352,704 | | $ | 1,318,414 | |
The Company minimizes its exposure to credit risk by placing its cash with major banks. Management considers these major banks to be at low risks of loss.
The credit risk exposure of the Company’s accounts receivable is mitigated by issuing invoices for software licenses, maintenance and consulting services with short credit terms which are generally net 30 days. Software maintenance contracts are generally fully paid at the inception of the service period. In the normal course of operations, the Company evaluates the financial condition of its customers. Since most of the Company’s customers are relatively large companies in various industries and with a strong history of payment, the allowance for doubtful accounts is nominal. For the year ended July 31, 2011, the Company generated approximately 42% of its revenues from three customers and no amounts were outstanding from those customers as at July 31, 2011 (for the year ended July 31, 2010, two customers represented 23% of the revenues and $89,024 was outstanding from those two customers as at July 31, 2010). Management assesses the Company’s credit risk to be low.
c)Currency risk
Currency risk is the risk that the value of a financial instrument will fluctuate due to changes in foreign exchange rates. The Company operates internationally and is exposed to risk from changes in foreign currency rates. The Company does not hold any financial instruments that mitigate this risk. Management minimizes this risk by paying expenditures in the currency of the local operation through which funds are generated as a result of local revenue invoicing. However, the Company is still highly exposed to risks from fluctuations in foreign currency rates with respect to the financial statement translation of foreign operations denominated in the U.S. dollar, the Pound Sterling, the Euro and the Australian Dollar. The following table details the Company’s sensitivity to a 30% strengthening of the U.S. dollar, the Pound Sterling, the Euro and the Australian Dollar (2010 – 30% strengthening of the U.S. dollar and the Pound Sterling and a 21% strengthening of the Euro) against the Canadian dollar on the net income (loss) of the Company. The sensitivity analysis includes adjustments to foreign currency denominated monetary assets and liabilities and revenues and expenses for the changes described above. For a weakening of the U.S. dollar, the Pound Sterling, the Euro and the Australian Dollar by the same percentages against the Canadian dollar, there would be an equal and opposite impact on the net income (loss) of the Company. For this reason, management assesses the Company’s currency risk to be high.
F-27
SAND Technology Inc.
Notes to Consolidated Financial Statements
July 31, 2011
(Expressed in Canadian Dollars, unless otherwise stated)
| | | Year ended July 31, 2011 | |
| | | U.S. Dollar | | | U.K. Pound | | | Euro | | | Australian | |
| | | Impact | | | Sterling Impact | | | Impact | | | Dollar Impact | |
| | | | | | | | | | | | | |
| Net income (loss) | | | | | | | | | | | | |
| - in Canadian dollars | $ | 12,778 | | $ | (315,988 | ) | $ | 34,173 | | $ | 69,796 | |
| | | Year ended July 31, 2010 | |
| | | U.S. Dollar | | | U.K. Pound | | | Euro | | | Australian | |
| | | Impact | | | Sterling Impact | | | Impact | | | Dollar Impact | |
| | | | | | | | | | | | | |
| Net loss | | | | | | | | | | | | |
| - in Canadian dollars | $ | (14,499 | ) | $ | (57,446 | ) | $ | (71,990 | ) | $ | - | |
As at July 31, 2011 and July 31, 2010, the Company had the following monetary assets and liabilities denominated in foreign currencies included in its consolidated financial statements:
| | | July 31, 2011 | | | July 31, 2010 | |
| | | Current | | | Current | | | Current | | | Current | |
| | | Assets | | | Liabilities | | | Assets | | | Liabilities | |
| | | | | | | | | | | | | |
| U.S. Dollars | | 331,427 | | | 286,848 | | | 117,917 | | | 164,947 | |
| Pounds Sterling | | 85,706 | | | 313,193 | | | 343,111 | | | 461,540 | |
| Euros | | 401,585 | | | 318,572 | | | 138,540 | | | 405,958 | |
| Australian Dollar | | 282,460 | | | 61,844 | | | - | | | - | |
d)Liquidity risk
Liquidity risk is the risk that the Company is not able to meet its financial obligations as they fall due or can do so only at excessive cost. The Company manages this risk by regularly evaluating its liquid resources to fund its current and long-term obligations in a cost-effective manner.
The Company’s exposure to liquidity risk is mitigated through its continued ability to sell software licenses, services and software maintenance contracts and the prompt collection of accounts receivable. The Company controls its liquidity risk by managing its cash and cash flows using budgets and cash estimates.
The table below summarizes the Company’s financial liabilities and their due dates as at July 31, 2011 and July 31, 2010:
F-28
SAND Technology Inc.
Notes to Consolidated Financial Statements
July 31, 2011
(Expressed in Canadian Dollars, unless otherwise stated)
| | | July 31, 2011 | |
| | | Carrying | | | | | | | | | | |
| | | Amount of | | | Due within | | | Due within | | | Due beyond | |
| | | Liability | | | 1 year | | | 2 - 5 years | | | 5 years | |
| | | | | | | | | | | | | |
| Accounts payable and accrued liabilities (a) | | 765,234 | | | 765,234 | | | - | | | - | |
| Due to shareholders (b) | | 1,914,837 | | | 1,425,945 | | | 488,892 | | | - | |
| Convertible debentures (c) | | 542,671 | | | | | | - - | | | 542,671 | |
| | | July 31, 2010 | |
| | | Carrying | | | | | | | | | | |
| | | Amount of | | | Due within | | | Due within | | | Due beyond | |
| | | Liability | | | 1 year | | | 2 - 5 years | | | 5 years | |
| | | | | | | | | | | | | |
| Accounts payable and accrued liabilities (a) | | 917,265 | | | 917,265 | | | - | | | - | |
| Due to shareholders (b) | | 1,874,153 | | | 896,369 | | | 977,784 | | | - | |
| Convertible debentures (c) | | 448,309 | | | - | | | - | | | 1,777,944 | |
| | (a) | Excludes sales taxes payable |
| | (b) | Includes contractual interest expense to be paid |
| | (c) | Includes accretion and interest expense up until maturity |
As at July 31, 2011, there has been no significant change to the maturities of financial liabilities as compared to the previous year. As such, management assesses the Company’s liquidity risk to be high.
18 –FINANCIAL INSTRUMENTS
Fair value
Fair value is the estimated amount that parties dealing at arm’s length would accept to exchange in settlement of a financial instrument based on the current market for instruments with the same risk, principal and maturity date. These fair value estimates are affected by assumptions made about the amount and timing of estimated future cash flows, discount rates and terms of the contract. As a result, the fair values are not necessarily the net amounts that would be realized if such financial instruments were settled.
The fair value, as at July 31, 2011 and 2010, of cash, accounts receivable, accounts payable and accrued liabilities approximates their respective carrying value given their short-term maturities.
The Company utilizes various types of financing to fund its business needs including convertible notes with warrants attached. The Company reviews these transactions of securities issued, including its warrants and conversion features, to properly determine their proper classification between the debt and equity components and whether they are classified as a liability at each reporting period until the amount is settled and reclassified into equity with changes, if applicable, in fair value recognized in current earnings. At July 31, 2011 and 2010, the Company did not have any assets or liabilities measured at fair value on a recurring basis associated with the units consisting of convertible notes. The Canadian GAAP measurement of these instruments differs from the United States GAAP measurements and this is more fully explained in Note 19.
F-29
SAND Technology Inc.
Notes to Consolidated Financial Statements
July 31, 2011
(Expressed in Canadian Dollars, unless otherwise stated)
The fair value of the debt component of the convertible debentures was determined by discounting future cash flows using rates that the Company would otherwise use for convertible debentures with similar terms, conditions and maturity dates.
As at July 31, 2011 and July 31, 2010, the classification of financial instruments, as well as their carrying values and the fair values, is as follows:
| | | July 31, 2011 | |
| | | | | | | | | Other | | | Total | | | | |
| | | Held for | | | Loans and | | | Financial | | | Carrying | | | Fair | |
| | | Trading | | | Receivables | | | Liabilities | | | Value | | | Value | |
| Financial Assets | | | | | | | | | | | | | | | |
| Cash | $ | 810,745 | | | | | | | | $ | 810,745 | | $ | 810,745 | |
| Accounts receivable | | | | | 541,959 | | | | | | 541,959 | | | 541,959 | |
| | | | | | | | | | | | | | | | |
| Financial Liabilities | | | | | | | | | | | | | | | |
| Accounts payable and accrued liabilities | | | | | | | | 776,623 | | | 776,623 | | | 776,623 | |
| Due to shareholders | | | | | | | | 1,914,837 | | | 1,914,837 | | | | |
| Convertible debentures | | | | | | | | 542,671 | | | 542,671 | | | 723,439 | |
| | | July 31, 2010 | |
| | | | | | | | | Other | | | Total | | | | |
| | | Held for | | | Loans and | | | Financial | | | Carrying | | | Fair | |
| | | Trading | | | Receivables | | | Liabilities | | | Value | | | Value | |
| Financial Assets | | | | | | | | | | | | | | | |
| Cash | $ | 579,270 | | | | | | | | $ | 579,270 | | $ | 579,270 | |
| Accounts receivable | | | | | 739,144 | | | | | | 739,144 | | | 739,144 | |
| | | | | | | | | | | | | | | | |
| Financial Liabilities | | | | | | | | | | | | | | | |
| Accounts payable and accrued liabilities | | | | | | | | 984,149 | | | 984,149 | | | 984,149 | |
| Due to a shareholder | | | | | | | | 1,874,153 | | | 1,874,153 | | | | |
| Convertible debentures | | | | | | | | 448,309 | | | 448,309 | | | 751,201 | |
As at July 31, 2011 and July 31, 2010, the financial instruments presented at fair value on the Company`s consolidated balance sheet by level of the fair value hierarchy are as follows:
| | | | | | July 31, 2011 | | | | |
| | | Level 1 | | | Level 2 | | | Level 3 | | | Total | |
| | | | | | | | | | | | | |
| Financial assets | | | | | | | | | | | | |
| Cash | $ | 810,745 | | | - | | | - | | $ | 810,745 | |
| | | | | | | | | | | | | |
| | $ | 810,745 | | | - | | | - | | $ | 810,745 | |
F-30
SAND Technology Inc.
Notes to Consolidated Financial Statements
July 31, 2011
(Expressed in Canadian Dollars, unless otherwise stated)
| | | | | | July 31, 2010 | | | | |
| | | Level 1 | | | Level 2 | | | Level 3 | | | Total | |
| | | | | | | | | | | | | |
| Financial assets | | | | | | | | | | | | |
| Cash | $ | 579,270 | | | - | | | - | | $ | 579,270 | |
| | | | | | | | | | | | | |
| | $ | 579,270 | | | - | | | - | | $ | 579,270 | |
19 -RECONCILIATION OF FINANCIAL RESULTS BETWEEN CANADIAN AND U.S. GAAP
The material differences between Canadian and U.S. GAAP impacting the Company’s consolidated financial statements are as follows:
F-31
SAND Technology Inc.
Notes to Consolidated Financial Statements
July 31, 2011
(Expressed in Canadian Dollars, unless otherwise stated)
| | | July 31, | | | July 31, | | | July 31, | |
| | | 2011 | | | 2010 | | | 2009 | |
| | | | | | | | | | |
| A - Net Loss Reconciliation | | | | | | | | | |
| | | | | | | | | | |
| Net loss - Canadian GAAP | $ | (2,112,469 | ) | $ | (745,549 | ) | $ | (1,191,695 | ) |
| Adjustments for: | | | | | | | | | |
| Stock-based compensation (a) | | (10,312 | ) | | (2,128 | ) | | (6,156 | ) |
| Gain on change in derivative liability - Warrants (b) | | - | | | 141,488 | | | 215,779 | |
| Accretion expense - Debt component of convertible debentures (c) | | 45,013 | | | 43,425 | | | 40,637 | |
Gain (loss) on change in derivative liabilities - Warrants and conversion
option on convertible debentures (b) | | 96,769 | | | 469,285 | | | (83,459 | ) |
| Loss on change in derivative liability - Warrants on November 2009 private placement (b) | | (92,986 | ) | | (212,390 | ) | | - | |
| Loss on change in derivative liability - Warrants on March 2011 private placement (b) | | (463,802 | ) | | | | | - | |
| | | (425,318 | ) | | 439,680 | | | 166,801 | |
| | | | | | | | | | |
| Net loss - U.S. GAAP | | (2,537,787 | ) | | (305,869 | ) | | (1,024,894 | ) |
| | | | | | | | | | |
| Basic and diluted loss per common share, U.S. GAAP | | (0.15 | ) | | (0.02 | ) | | (0.07 | ) |
| | | | | | | | | | |
| | | | | | | | | | |
| B - Liabilities Reconciliation | | | | | | | | | |
| | | | | | | | | | |
| Total liabilities - Canadian GAAP | | | | | | | | | |
| Carrying value - Convertible debentures (long term) (c) | | 542,671 | | | 448,309 | | | | |
| Other liabilities | | 4,567,387 | | | 4,119,798 | | | | |
| | | 5,110,058 | | | 4,568,107 | | | | |
| Adjustments for: | | | | | | | | | |
| Carrying value - Convertible debentures (long term) (c) | | (307,499 | ) | | (262,486 | ) | | | |
| Derivative liability - Warrants on convertible debentures (short term) (b) | | 662,545 | | | 759,314 | | | | |
| Derivative liability - Warrants on November 2009 private placement (short term) (b) | | 305,376 | | | 212,390 | | | | |
| Derivative liability - Warrants on March 2011 private placement (short term) (b) | | 463,802 | | | - | | | | |
| | | 1,124,224 | | | 709,218 | | | | |
| | | | | | | | | | |
| Total liabilities - U.S. GAAP | | 6,234,282 | | | 5,277,325 | | | | |
| | | | | | | | | | |
| | | | | | | | | | |
| C - Shareholders' Deficiency Reconciliation | | | | | | | | | |
| | | | | | | | | | |
| Shareholders' deficiency - Canadian GAAP | | (2,894,831 | ) | | (2,450,664 | ) | | | |
| Adjustments for: | | | | | | | | | |
| Cumulative net income (loss) reconciling items | | (700,794 | ) | | (275,476 | ) | | | |
| Cumulative stock-based compensation (see above) (a) | | 326,012 | | | 315,700 | | | | |
| Convertible debentures equity component (b) | | (749,442 | ) | | (749,442 | ) | | | |
| | | (1,124,224 | ) | | (709,218 | ) | | | |
| | | | | | | | | | |
| Total shareholders' deficiency - U.S. GAAP | $ | (4,019,055 | ) | $ | (3,159,882 | ) | | | |
| | | | | | | | | | |
| Total assets - U.S. and Canadian GAAP | $ | 2,215,227 | | $ | 2,117,443 | | | | |
F-32
SAND Technology Inc.
Notes to Consolidated Financial Statements
July 31, 2011
(Expressed in Canadian Dollars, unless otherwise stated)
a)Stock-based compensation
Under Canadian GAAP, effective August 1, 2005, stock-based compensation expense was accounted for using the fair value based method.
Under U.S. GAAP, effective August 1, 2005, the Company adopted the standard with respect to share-based payments which requires that stock option payments, to the extent they are compensatory, be recognized based on the fair value the of the options granted by the Company and expensing such amounts over the applicable vesting period. The fair value of the unvested portion of the stock option granted prior to August 1, 2005 was determined based on the fair value of those options on the grant date , net of forfeitures.
The impact on the statement of operations for years ended July 31, 2011, 2010 and 2009 was an increase in the net loss by $10,312, $2,128 and $6,156, respectively, with a corresponding increase in contributed surplus under shareholders' deficiency.
b) Share purchase warrants and convertible debentures conversion option
Under Canadian GAAP, share purchase warrants and the convertible debentures conversion option are classified as equity, more specifically as contributed surplus for the share purchase warrants and as a separate equity component for the convertible debentures conversion option, in the shareholders' deficiency section of the Company's consolidated balance sheet.
Under U.S. GAAP, SFAS No.133, share purchase warrants with an exercise price denominated in a currency other than the functional currency, which in the case of the Company is the Canadian dollar, and the convertible debentures conversion option must be accounted for as a derivative liability. As well, any changes in the fair value of these derivative liabilities, under U.S. GAAP, is recognized in earnings during the reporting period as a gain or loss on derivative liability.
The impact for years ended July 31, 2011, 2010 and 2009 was a decrease in the net loss by $2,552 a decrease in the net loss by $398,383 and a decrease in the net loss by $132,320, respectively, and the impact on the balance sheet was an increase to current liabilities by $1,431,723 and $971,704, respectively.
c) Convertible debentures
Under Canadian GAAP, the fair value of the debt component relating to the convertible debentures is determined using the present value of the cash flows of principal and interest payments using an applicable discount rate and is disclosed as a long-term liability.
Under U.S. GAAP, the initial carrying amount of the debt component is calculated as the balance of the convertible debenture proceeds after deducting the initial fair value of the share purchase warrants and the conversion option. Under both Canadian and U.S. GAAP, the carrying amount of the debt component is accreted to its face value over the contractual period of the debentures by using the effective interest method.
The impact on the statement of operations for the years ended July 31, 2011, 2010 and 2009 was a decrease in the net loss by $45,013, $43,425 and $40,637, respectively, and the impact on the balance sheet was a decrease to long term liabilities by $307,499 and $262,486, respectively.
F-33
SAND Technology Inc.
Notes to Consolidated Financial Statements
July 31, 2011
(Expressed in Canadian Dollars, unless otherwise stated)
d) Supplementary disclosures
The following items present other supplementary disclosures required under U.S. GAAP:
| a) | Under U.S. GAAP, research and development investment tax credits (Note 12) would be classified as a reduction of the income tax expense instead of a reduction of the related research and development costs. This difference in GAAP did not have any impact on the financial position, results of operations or cash flows of the Company for the years presented. |
| | |
| b) | Under Canadian GAAP, future income taxes are calculated based on enacted or substantially enacted tax rates applicable to future years. Under U.S. GAAP, only enacted rates are used in the calculation of future income taxes. This difference in GAAP did not have any impact on the financial position, results of operations or cash flows of the Company for the years presented. |
e)Revenue recognition – Multiple-element arrangements
The FASB issued ASU 2009-13, Multiple-Deliverable Revenue Arrangements – a consensus of the FASB Emerging Issues Task Force, and ASU 2009-14, Certain Revenue Arrangements That Include Software New Developments Summary 6 Elements – a consensus of the FASB Emerging Issues Task Force, to amend the existing revenue recognition guidance. The ASUs codify consensuses reached in September 2009 by the FASB Emerging Issues Task Force on EITF Issue 08-1, “Revenue Arrangements with Multiple Deliverables” and EITF Issue 09-3, “Certain Revenue Arrangements that Include Software Elements.” ASU 2009-13 amends ASC 605, Revenue Recognition, 25, “Multiple-Element Arrangements” (formerly EITF Issue 00-21, “Revenue Arrangements with Multiple Deliverables”) as follows:
- Modifies criteria used to separate elements in a multiple-element arrangement
- Introduces the concept of “best estimate of selling price” for determining the selling price of a deliverable
- Establishes a hierarchy of evidence for determining the selling price of a deliverable
- Requires use of the relative selling price method and prohibits use of the residual method to allocate arrangement consideration among units of accounting
- Expands the disclosure requirements for all multiple-element arrangements within the scope of ASC 605-25
ASU 2009-14 amends the scope of ASC 985, Software, 605, “Revenue Recognition” (formerly AICPA Statement of Position 97-2, Software Revenue Recognition), to exclude certain tangible products and related deliverables from the scope of this guidance. Instead, the excluded products and related deliverables must be evaluated for separation, measurement, and allocation under the guidance of ASC 605-25, as amended by ASU 2009-13.
The amended guidance is effective prospectively for revenue arrangements entered into or materially modified in fiscal years beginning on or after June 15, 2010. Early adoption is permitted. An entity may elect retrospective application to all revenue arrangements for all periods presented using the guidance in ASC 250, Accounting Changes and Error Corrections (formerly FASB Statement 154, Accounting Changes and Error Corrections). Entities must adopt the amendments resulting from both of these ASUs in the same period using the same transition method, where applicable.
The Company did not enter into any such revenue arrangements during the year.
F-34
SAND Technology Inc.
Notes to Consolidated Financial Statements
July 31, 2011
(Expressed in Canadian Dollars, unless otherwise stated)
20 - SUBSEQUENT EVENTS
On September 7, 2011, the Company completed a bridge loan in the amount of $1,000,000 from a group of investors. The bridge loan has a maturity date of November 30, 2011 with interest at 15% and warrants valued at $500,000 at a price of U.S.$0.50 per warrant. The bridge loan is entirely repayable at the maturity date of November 30, 2011. Interest was prepaid from the proceeds of the bridge loan.
On October 4, 2011, the Company completed the sale of its SAP Information Lifecycle Management (ILM) Product Line to a third party for a consideration of U.S.$8,000,000. After deductions for earn-out milestones, customers' consent holdback, an escrow amount relating to representations and warranties and other amounts, the Company received initial proceeds of U.S.$4,172,465. The Company anticipates it will be able to meet all its obligations under the asset purchase agreement governing this transaction to collect the remaining amount due from the sale.
Also, further to a settlement agreement signed on September 6, 2011 with a significant shareholder referred to in Note 7, the initial proceeds received on the above-mentioned sale were used to pay a pro-rata amount owed to the significant shareholder in the amount of $1,329,781.
F-35
ITEM 19. EXHIBITS
EXHIBIT INDEX
| Exhibit | | |
| Number | | Exhibit Description |
| | | |
| 1.1 | | Articles of Incorporation, as amended on December 20, 1996 and December 31, 1996(A). |
| | | |
| 1.2 | | Amendment to Articles of Incorporation dated January 1, 2000(B). |
| | | |
| 1.3 | | By-Laws approved, confirmed and ratified by the shareholders on December 17, 2002(C). |
| | | |
| 4.1 | | SAND 1996 Stock Incentive Plan as amended(D). |
| | | |
| 4.2 | | SAND 1996 Stock Option Plan as amended(E). |
| | | |
| 4.3 | | SAND Share Award Plan dated November 2, 2006 and Share Award Agreement thereunder(F). |
| | | |
| 4.5 | | Voting Agreement by and between SAND, Arthur G. Ritchie and Bradley G. Griffith on behalf of the Debentureholders dated April 18, 2008(K). |
| | | |
| 4.6 | | Inter-Creditor Priority Agreement by and between SAND, Arthur G. Ritchie and Bradley G. Griffith on behalf of the Debentureholders, dated April 18, 2008(L). |
| | | |
| 4.7 | | Deed of Hypothec to Secure Payment of Debentures by and between SAND and Bradley G. Griffith on behalf of the Debentureholders, dated April 24, 2008(M). |
| | | |
| 4.8 | | Repayment Agreement by and between Arthur G. Ritchie, SAND and Jerart Financial Services Ltd. |
| | | |
| 4.9 | | Consulting Agreement by and between Arthur G. Ritchie, SAND and Jerart Financial Services Ltd. |
| | | |
| 4.10 | | Marketing and Sales Assistance Agreement by and between Arthur G. Ritchie and SAND. |
| | | |
| 4.11 | | Priority Agreement by and between Jerart Financial Services Limited, Arthur G. Ritchie and Bradley G. Griffith. |
| | | |
| 4.12 | | Form of Convertible Debenture(O). |
| | | |
| 4.13 | | Form of Warrant(P). |
| | | |
| 4.14 | | SAND 2010 Stock Incentive Plan(Q) |
| | | |
| 4.15 | | Employment Agreement of Michael Pilcher |
| | | |
| 4.16 | | Employment Agreement of Tony Giuliano |
| | | |
| 6.1 | | Statement detailing computation of per share earnings. |
| | | |
| 8.1 | | Subsidiaries. |
| | | |
| 11.1 | | Standards of Ethical Conduct(G). |
| | | |
| 12.1 | | Certification of the Chief Executive Officer of SAND pursuant to Section 302 of the Sarbanes-Oxley Act of 2002. |
- 72 -
Notes to Exhibit Index:
| | (A) | Previously filed as an exhibit to SAND's Annual Report on Form 20-F for the year ended July 31, 1996 and incorporated herein by reference. |
| | | |
| | (B) | Previously filed as an exhibit to Amendment No. 1 to SAND's Form F-2 Registration Statement (333-12216) filed on August 18, 2000 and incorporated herein by reference. |
| | | |
| | (C) | Previously filed as exhibit 3.3 to SAND's Annual Report on Form 20-F for the year ended July 31, 2002 and incorporated herein by reference. |
| | | |
| | (D) | Previously filed as exhibit 4.1 to SAND's Annual Report on Form 20-F for the year ended July 31, 2005 and incorporated herein by reference. |
| | | |
| | (E) | Previously filed as exhibit 4.2 to SAND's Annual Report on Form 20-F for the year ended July 31, 1996 and incorporated herein by reference. |
| | | |
| | (F) | Previously filed as exhibit 4.6 to SAND's Annual Report on Form 20-F for the year ended July 31, 2007 and incorporated herein by reference. |
| | | |
| | (G) | Previously filed as exhibit 11.1 to SAND's Annual Report on Form 20-F for the year ended July 31, 2005 and incorporated herein by reference. |
| | | |
| | (H) | Previously filed as exhibit 15.1 to SAND's Annual Report on Form 20-F for the year ended July 31, 2005 and incorporated herein by reference. |
| | | |
| | (I) | Previously filed as exhibit 15.2 to SAND's Annual Report on Form 20-F for the year ended July 31, 1996 and incorporated herein by reference. |
| | | |
| | (J) | Previously filed as exhibit 14.3 to SAND's Annual Report on Form 20-F for the year ended July 31, 2003 and incorporated herein by reference. |
- 73 -
| | (K) | Previously filed as exhibit 4.5 to SAND's Annual Report on Form 20-F for the year ended July 31, 2008 and incorporated by reference. |
| | | |
| | (L) | Previously filed as exhibit 4.6 to SAND's Annual Report on Form 20-F for the year ended July 31, 2008 and incorporated herein by reference. |
| | | |
| | (M) | Previously filed as exhibit 4.7 to SAND's Annual Report on Form 20-F for the year ended July 31, 2008 and incorporated herein by reference. |
| | | |
| | (O) | Previously filed as exhibit 4.12 to SAND's Annual Report on Form 20-F for the year ended July 31, 2010 and incorporated herein by reference. |
| | | |
| | (P) | Previously filed as exhibit 4.13 to SAND's Annual Report on Form 20-F for the year ended July 31, 2010 and incorporated herein by reference. |
| | | |
| | (Q) | Previously filed as exhibit 4.14 to SAND's Annual Report on Form 20-F for the year ended July 31, 2010 and incorporated herein by reference. |
| | | |
| | (R) | Previously filed as exhibit 99.1 to SAND's Report on Form 6-K filed on October 19, 2011 and incorporated herein by reference. |
| | | |
| | (S) | Previously filed as exhibit 99.2 to SAND's Report on Form 6-K filed on October 19, 2011 and incorporated herein by reference. |
- 73 -
SIGNATURES
The registrant hereby certifies that it meets all of the requirements for filing on Form 20-F and that it has duly caused and authorized the undersigned to sign this Annual Report on Form 20-F on its behalf.
| | SAND TECHNOLOGY INC. |
| | |
| Dated: November 7, 2011 | By: /s/ THOMAS M. O’DONNELL |
| | Thomas M. O`Donnell |
| | Chief Executive Officer |
- 100 -