SECURITIES AND EXCHANGE COMMISSION
Washington, D.C. 20549
FORM 6-K
Report of Foreign Private Issuer
Pursuant to Rule 13a-16 or 15d-16 of
The Securities Exchange Act of 1934
For the month of January 2006
Commission File Number: 0-13742
Océ N.V.
(Translation of registrants name into English)
St. Urbanusweg 43, Venlo, The Netherlands
(Address of principal executive offices)
Indicate by check mark whether the registrant files or will file annual reports under cover of Form 20-F or Form 40-F:
Form 20-F: þ Form 40-F: ¨
Indicate by check mark if the registrant is submitting the Form 6-K in paper as permitted by Regulation S-T Rule 101(b)(1): ¨
Indicate by check mark if the registrant is submitting the Form 6-K in paper as permitted by Regulation S-T Rule 101(b)(7): ¨
Indicate by check mark whether by furnishing the information contained in this Form, the registrant is also thereby furnishing the information to the Commission pursuant to Rule 12g3-2(b) under the Securities Exchange Act of 1934.
Yes: ¨ No: þ
SIGNATURES
Pursuant to the requirements of the Securities Exchange Act of 1934, the registrant has duly caused this report to be signed on its behalf by the undersigned, thereunto duly authorized.
| OCÉ N.V. | ||
By: | /s/ R.L. van Iperen | |
Chairman of the Board of Executive Directors | ||
(Principal Executive Officer) | ||
Dated: January 31, 2006
EXHIBIT INDEX
Exhibit No. | Exhibit Name | |
| 99.1 | Press Release issued January 30, 2006 | |
| 99.2 | Annual Report 2005 |
Exhibit 99.1

Océ N.V. confirms final results fiscal year 2005
Final results 2005
Dividend 2005
Annual General Meeting of Shareholders 2006
Final results 2005
Océ confirms that the final results under Dutch GAAP for the 2005 financial year are equal to the provisional results that were published on January 16, 2006. This means total revenues of € 2,677.3 million, operating income of € 110.1 million, net income of € 78.8 million and net earnings of € 0.92 per € 0.50 ordinary share.
The results under US GAAP will differ substantially from those under Dutch GAAP because the release of the pension provision in the Netherlands will, under US GAAP not be credited to the Statement of Operations in 2005 but in subsequent years.
Dividend 2005
As announced on January 16, 2006 it will be proposed to shareholders to adopt a dividend for the 2005 financial year of € 0.58 (2004: also € 0.58) per ordinary share of € 0.50 nominal. Upon adoption of this proposal the final dividend per ordinary share for 2005 will be € 0.43; the interim dividend amounted to € 0.15. It is proposed to pay out the final dividend fully in cash. The dividend will be made available for payment as from May 8, 2006. Shares in Océ N.V. will be listed “ex-dividend” as of April 24, 2006.
General Meeting of Shareholders
The Annual General Meeting of Shareholders will be held in Venlo on Thursday, April 20, 2006, commencing at 14.00 hrs. The agenda for this meeting will be available in printed form and also via the internet (www.investor.oce.com) as of March 23, 2006.
Annual Report 2005
The annual report will be published on the internet (www.investor.oce.com) on February 1, 2006 and will be available in printed form as of February 17, 2006.
January 30, 2006
Océ N.V.,Venlo, the Netherlands
| For further information: | ||
| Investor Relations: | Press: | |
| Pierre Vincent Senior VP Investor Relations | Jan Hol, Senior VP Corporate Communications | |
| Telephone +31 77 359 2240 | Telephone + 31 77 359 2000 | |
| E-mailinvestor@oce.com | E-mailjan.hol@oce.com | |
Océ N.V.
P.O. Box 101, 5900 MA Venlo, the Netherlands Telephone # 31 77 359 2240 Océ investor information on Internet:http://www.investor.oce.com |  |
Exhibit 99.2
OcéN.V.
Report for the financial year December 1, 2004
to November 30, 2005
Océ enables its customers to manage their documents efficiently and effectively by offering innovative print and document management products and services for professional environments.
More copies of the English translation of this Annual Report or of the Dutch language original version are available on request from OcéN.V.,
Corporate Communications Department
telephone [+31] 77 3594000
e-mail info@oce.com
The Annual Report as well as other publications such as press releases, presentations, speeches and other items related to the annual report can also be accessed via the corporate website [http://www.oce.com].
Contents | ||||
| 4 | ||||
| 6 | ||||
| 7 | ||||
| 8 | ||||
| 9 | ||||
| 12 | ||||
Océ and Imagistics: a strong combination on the American market | 15 | |||
Report of the Board of Executive Directors | ||||
| Financial review | ||||
| 19 | ||||
| 22 | ||||
| 22 | ||||
| 22 | ||||
Commercial developments | Digital Document Systems | ||||
| 32 | ||||
| 37 | ||||
| 39 | ||||
| 40 | ||||
Commercial developments | Wide Format Printing Systems | ||||
| 42 | ||||
| 45 | ||||
| 46 | ||||
| Technology | ||||
| 50 | ||||
| 52 | ||||
| Critical success factors | ||||
| 54 | ||||
| 57 | ||||
| 59 | ||||
| Management aspects | ||||
| 60 | ||||
| 69 | ||||
Annual Financial Statements | ||||
| 79 | ||||
| 80 | ||||
| 82 | ||||
| 84 | ||||
| 90 | ||||
| 95 | ||||
| 114 | ||||
| 114 | ||||
Notes to the Company Balance Sheet and the Statement of Operations | 116 | |||
Other information | ||||
| 120 | ||||
| 121 | ||||
| 122 | ||||
| 123 | ||||
Miscellaneous | ||||
| 124 | ||||
| 125 | ||||
| 126 | ||||
| 127 | ||||
| 129 | ||||
| 132 | ||||
| 134 | ||||
| 136 | ||||
Océ: innovative by nature
Océ is one of the world’s leading suppliers of professional printing and document management systems. For offices, industry and the graphics market the company develops and manufactures systems for the production, distribution and management of documents, in colour and black and white, in small format and in wide format.
This relates to printers, scanners, peripheral equipment and printing media but also to document management software and innovative products in the areas of system integration, outsourcing of document management activities and leasing of machines.
Océ focuses primarily on professional environments in which its products are well-known for their productivity and reliability, ease of use and favourable ‘total cost of ownership’. The company has built a world-wide reputation as an innovative business in both a commercial and a technological respect.
Océ is commercially active in 80 countries and has its own sales and service establishments in over 30 countries. In Europe and the United States it also operates research and manufacturing facilities in various locations. In 2005 Océ, which employs more than 24,000 people, achieved revenues of € 2.7 billion and a net income of € 79 million.
Business modelOcé’s business model is based on close cooperation between sales and services and research & development. Thanks to the constant feedback of experience gained from ongoing, intensive contact with users, Océ is able to respond promptly and effectively to changing market requirements.
The company’s own sales and service organisation has attuned its activities as accurately as possible to the market segments that are of strategic relevance. In this way the broad product range and technology base of Océ and selected machines ofOEMS [Original Equipment Manufacturers] can be optimally deployed to meet customer needs. In a number of countries part of the product range is made available via specialised distributors.
Océ develops its basic technologies and most of its product concepts in its ownR&D facilities. In all cases this involves searching for ways of providing specific solutions for each customer’s current and future needs. The desire and the ability to develop totally new concepts to meet these needs is the source of the company’s broad and unique technology base. Océ’s innovative capabilities are also enhanced and strengthened through alliances with strategic partners and through cooperation with co-developers andOEMS for machines in the high, medium and low volume segments.
4
Profile
Board of Supervisory Directors
J.L. Brentjens,chairman
F.J. de Wit,vice-chairman
M. Arentsen
A. Baan
P. Bouw
J.V.H. Pennings
Board of Executive Directors
R.L. van Iperen,chairman
J. van den Belt
J.F. Dix
Staff Director | Company Secretary
Vacancy
Financial yearThe company’s financial year runs from December 1 to November 30.
Articles of AssociationThe present Articles of Association were confirmed by a notarial deed dated December 23, 2004. Océ N.V. is an international holding company within the meaning of Article 153, para. 3b, Book 2 of the Dutch Civil Code.
Registered office and commercial registryThe company has its registered office in Venlo, the Netherlands, and is registered in the Commercial Registry in Venlo under No. 12002283.
Head officeThe head office is at
St. Urbanusweg 43, Venlo, the Netherlands
P.O. Box 101, 5900MA Venlo, the Netherlands
telephone [+31] 77 3592222
fax [+31] 77 3544700
Océ on Internet: http://www.oce.com
e-mail info@oce.com
For general information about Océ:
telephone [+31] 77 3592000
5
Ambitions | Strategic objectives | Actions taken in 2005 | ||
| CustomersOcé aims to be one of the top-three suppliers in the strategically relevant market segment by offering a complete range of [full-line] document management products and services. | To maintain its leading position in high-production transaction printing and to achieve this position in high-production document printing in both corporate and commercial environments. To remain a strong supplier of services in the area of document management and business services. To offer complementary products and imaging supplies which create full-line solutions. To strengthen its leading position in wide format printing. To achieve a leading position in high-production display graphics. | The acquisition of Imagistics has strongly improved our distributive strength in North America and the United Kingdom. Océ now has nation-wide sales and service coverage in America. Distributive strength reinforced through organic expansion of and productivity increase in the sales organisations. Position in colour strengthened through introduction of the OcéCPS800 and the OcéCPS900 Platinum versions and the possibility of combining these machines to form production clusters. Launch of the OcéTCS500 colour printer. Black and white portfolio further strengthened in functionality and price. Expansion of Technical Document Systems in Japan through acquisition of machine population of Shacoh. Imaging Supplies now supplies a complete range for wide and small format media. | ||
| EmployeesOcé aims to offer an inspiring working environment. | To be an attractive employer world-wide. In the Netherlands, to be one of the ten most attractive companies for graduates and one of the top-five for technical specialists. | Successful continuation of the roll-out of competencies management, corporate leadership labs and Global Océ Professionals programme. Development and succession plan for senior management intensified. Campus recruitment started up. | ||
| ShareholdersOcé aims to achieve returns that give the company a top position in its sector of industry. | To achieve a long term return on total assets [ROA] of 12% and a return on equity [ROE] of 18%.ROA is an internally focused measure; Océ studies replacement ofROA by an externally focused profitability indicator. To achieve average annual revenues growth of 10%, of which at least half is organic. | Start made on restructuring plans in Europe and the United States. Next phase of cost reduction actions initiated as part ofoperational excellence[IT, purchasing and logistics]. Outsourcing of lease activities continued. | ||
| PartnersOcé aims to build up a network of partnerships that is one of the strongest in its sector of industry. | To co-operate in the area of technology with the best specialists in the industry. To work together with high-quality suppliers and to contract out work to strong partners. To co-operate with partners in the market who contribute to the distribution of Océ products and standards. | The strengthening of product portfolio through co-operation withOEM hardware and software partners. Cost savings on purchase of components. Co-operation with universities and top-class technology institutes. Next steps taken in the relocation of part of assembly activities to Central Europe and via outsourcing to the Far East. Continued outsourcing of lease activities to strong vendor lease partners. | ||
| SocietyOcé aims to do business in a way that contributes to the sustainable development of society. | To implement the basic principles of theUN Global Compact. To minimise any unwanted effects of Océ products on the environment. | Objective for improvement in sustainability formulated in more concrete terms. Further steps taken to boost sustainability awareness in the supply chain. | ||
6
Short term [1-3 years]
Global strengthening of leading positions and improving growth and profitabilityOver the past year Océ has achieved strong growth in machine sales. A distinct improvement has also been booked in revenues from service. The purchase of Imagistics has further boosted the strength of the organisation, particularly in the important North American andUK markets. As a result Océ has now achieved nation-wide coverage in the American market for both sales and service operations, which will lead to substantial economies of scale. Océ is therefore focusing explicitly on offering a full-line product range. Thanks to its market-focused and even stronger organisation and its new products and services, Océ is well placed to raise the level of profitability and revenues.
To support this development over the short term, Océ will continue its efforts to improve operational efficiency. In the year ahead the emphasis will be on a further strengthening of efficiency, firstly by harnessing the economies of scale created through the integration of Imagistics and, secondly, by improving business processes and the related organisation structure. A definite role will be played here by an improvement in the purchasing processes, optimisation of theIT infrastructure and logistics and by raising the levels of efficiency in service activities.
��
For a number of activities Océ is increasingly working together with partners. The outsourcing of part of the assembly operations to Central Europe and the Far East is one example. At the same time, however, Océ continues to invest in the development of innovative products and services. In addition, the outsourcing of the lease activities will be completed and a further reduction in other working capital items will be achieved.
The ultimate aim of these activities is not only to supply increasingly better products and services to a growing circle of customers but also to boost the level of profitability.
Medium term [3-5 years]
Safeguarding strong positions in growth marketsOcé is expanding the positions it holds in growth markets and has launched numerous activities to safeguard its leading positions over the medium term. These include, for example, the strengthening of market shares in the Printing-on-Demand, Business Services and Display Graphics segments, as well as the positions that the company holds in colour, in software and in emerging markets, particularly those in Asia. Besides organic growth, various forms of co-operation with strong partners and also acquisitions will continuously play an important role.
Long term [> 5 years]
Expanding the position in document managementCustomers are increasingly asking for integrated solutions for document management processes. Océ already provides support to its customers by offering a growing number of services and solutions for the effective and efficient management of documents that have been produced on paper and in electronic form. Océ Business Services and Software & Professional Services are the company’s business groups that specifically respond to this demand, but the supply of integrated output management solutions also receives much attention as part of the company’s core activities.
One of Océ’s ambitions is to achieve a top-three position within selected segments of the document management market.
7
| 2005 | 2004 | x € million | ||||||
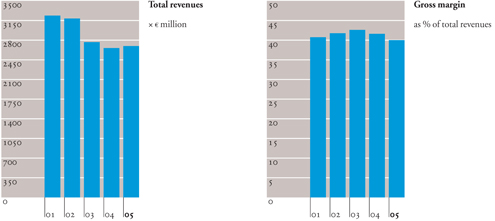
| Total revenues | 2,677.3 | 2,652.5 | ||||||
| Change on previous year [%] | 0.9 | –4.2 | ||||||
| Change [organically] | –0.1 | –0.1 | ||||||
| Non-recurring* | 6.9 | 10.6 | ||||||
| Recurring* | –2.8 | –3.6 | ||||||
| Gross margin | 1,071.8 | 1,103.4 | ||||||
| As % of total revenues | 40.0 | 41.6 | ||||||
| Operating income before impairment | 110.7 | 118.3 | ||||||
| Operating income[EBIT]** | 110.1 | 110.4 | ||||||
| Change on previous year [%] | –0.2 | –11.6 | ||||||
| As % of total revenues | 4.1 | 4.2 | ||||||
| As % of average balance sheet total [ROA] | 4.8 | 4.8 | ||||||
| Net income | 78.8 | 78.1 | ||||||
| Change on previous year [%] | 1.0 | 27.0 | ||||||
| As % of total revenues | 2.9 | 2.9 | ||||||
| Balance sheet total | 2,819.5 | 2,233.1 | ||||||
| Shareholders’ equity | 780.8 | 714.1 | ||||||
| Net capital expenditure on intangible | ||||||||
| and tangible fixed assets | 149.1 | 122.7 | ||||||
| Cash flow before financing activities | –507.5 | 370.5 | ||||||
| Number of employees at November 30 | 24,164 | 21,315 | employees | |||||
| Ordinary net income | As % of average ordinary Shareholders’ equity [ROE]*** | 11.3 | 11.3 | |||||
| Per € 0.50 ordinary share | Net income | 0.92 | 0.89 | euro | ||||
| Shareholders’ equity | 8.65 | 7.87 | ||||||
| Dividend | 0.58 | 0.58 | ||||||
| Number of € 0.50 ordinary shares | Average number outstanding | 83,698,244 | 83,487,576 | shares | ||||
| Potential increase from conversion/options | 970,609 | 1,271,054 | ||||||
| Diluted earnings per € 0.50 ordinary share | 0.91 | 0.88 | euro | |||||
| Year’s highest/lowest | 13.54/10.80 | 16.10/10.60 | ||||||
| Year end | 12.11 | 11.25 | ||||||
* Non-recurring revenues: sales from machines, software and professional services. Recurring revenues: revenues from services, materials, rentals, interest and business services. | ||||||||
** EBITDA 2005 amounted to € 256 million. | ||||||||
*** The definition ofROE has changed in 2004. | ||||||||
8
Report of the Board of Supervisory Directors
To the Annual General Meeting of Shareholders of OcéN.V., Venlo.
Annual ReportWe herewith present to you the Annual Report for 2005 which comprises the Annual Financial Statements for 2005 and was drawn up by the Board of Executive Directors. The Annual Financial Statements have been examined by the external auditors PricewaterhouseCoopers AccountantsN.V. who have issued an unqualified audit opinion that is set out on page 123 of this Annual Report. We have discussed the Annual Report with the Board of Executive Directors in the presence of the auditors. On the basis of those discussions we can state that the Annual Report provides the necessary basis for the release and discharge of our Board in respect of its accountability and its supervisory function.
We recommend that you adopt the Annual Financial Statements, including the dividend proposal, and that you grant a release and discharge to the Board of Executive Directors for its management and to the Board of Supervisory Directors for its supervision over such management during the past financial year.
Results and strategic positionOcé’s net income for the year under review amounted to € 79 million, which is equivalent to € 0.92 per ordinary share.
Total revenues, after adjustment for lease effects, increased by 2.1% on an organic basis which is particularly positive in combination with the fact that recurring revenues are now also picking up again.
Another important factor is that these improvements are occurring against an economic background that is still far from optimal. Further economic recovery is expected to strengthen this positive trend.
During the year under review the company focused its efforts on achieving a number of important preconditions that will enable it to benefit from the recovery that has now started to show through. One of those preconditions, the availability of a high-quality and competitive range, was fulfilled during the past year, and this will keep our full attention. This was reflected in particular in the increased demand for our new products. A second precondition, an efficient and cost-conscious organisation, is an ongoing task. Here again, with the support of drastic reorganisations, the targets for the past year were realised. Thirdly, a significant strengthening of distribution capabilities, has been given a vigorous impetus through the acquisition of Imagistics International Inc. On the American market in particular this has strengthened Océ’s position to an extent that could not otherwise have been achieved as quickly. Our consultations with the Board of Executive Directors about this acquisition convinced us that this acquisition was the right decision at the right moment.
9
Report of the Board of Supervisory Directors
SupervisionIn 2005 the Board of Supervisory Directors held seven meetings with the Board of Executive Directors. Aspects discussed at those meetings were the company’s strategy and the related strategic choices. Commercial and technological developments and the financial position of Océ were also discussed. A regular item on the agenda at meetings of our Board is an assessment of the risks and risk management systems, as is required under the Sarbanes-Oxley Act and the Dutch corporate governance code. Consultation was also held with the internal and external auditors. In addition, growth possibilities and potential acquisitions were discussed at various meetings.
At the meeting in January 2005 the number of shares to be granted in conformity with the share plan was determined, the targets for 2005 were discussed and the variable pay for 2004 was established on the basis of the previously set targets.
Prior to the meeting on July 6, 2005 the Board of Supervisory Directors paid a visit to theR&D facilities in Venlo, during which it was able to confirm that the company is well on track as regards its projects for the future including colour.
In August an extra meeting was devoted in full to the acquisition of Imagistics.
At each meeting time was also devoted to the feedback of the deliberations of the Audit Committee.
The Board of Supervisory Directors held two meetings at which the executive directors were not present in order to discuss the functioning of the Board of Supervisory Directors and its members. In our opinion the Board of Supervisory Directors complies with the independence requirements set by the Dutch corporate governance code.
The functioning of the Board of Executive Directors and its members was likewise discussed, as was the company’s top management structure, both now and for the future.
TheAudit Committeeheld six meetings in 2005 at which the internal and external auditors were also present. Members of the management attended these meetings when invited to do so. The Audit Committee’s main tasks comprise an extensive evaluation of the financial reporting before this is dealt with at the plenary meeting of the Board of Supervisory Directors, supervision of the effectiveness of the system of internal controls and an assessment of the company’s risk profile. To fulfil these tasks the committee discussed the annual results, including the annual reporting in accordance withUS stock exchange regulations [Form 20-F] and the quarterly results.
The committee also discussed the internal management and control systems, the financial reporting, compliance with the recommendations made by the auditors, the activities of the internal audit department, the activities, remuneration and independence of the external auditor, proposals in the area of tax planning andICT, and the company’s financing plan. Specific attention was devoted to the transition toIFRS with effect from December 1, 2005 and to the requirements set with regard to risk and risk control under the Sarbanes-Oxley Act and the Dutch corporate governance code.
TheRemuneration Committeemet twice during the year under review. The committee discussed the remuneration and bonuses of the Board of Executive Directors as well as the implementation of the remuneration policy for the Board of Executive Directors that had been approved by the General Meeting of Shareholders in 2004, including the share plan to replace the stock option plan.
The share plan and the remuneration package are dealt with in more detail on page 62 and further in the section on corporate governance.
TheSelection and Nomination Committeeheld two meetings during the year under review. This committee gave advise to the Supervisory Board on the selection, appointment and functioning of supervisory directors and executive directors.
10
Report of the Board of Supervisory Directors
Supervisory Board changesAt the General Meeting of Shareholders on April 15, 2005 Messrs. Brentjens and De Wit were reappointed. During 2005 the composition of the Board of Supervisory Directors was therefore unchanged.
Messrs. Pennings and Bouw are scheduled to retire by rotation from our Board in 2006. During their membership of the Supervisory Board Mr. Bouw and Mr. Pennings have, on the basis of their knowledge and experience, made a very great contribution to the way in which our Board functions and for this we owe them a tremendous debt of gratitude. As regards their successors, a proposal will be made to the Annual General Meeting of Shareholders on April 20, 2006. The agenda for that meeting will be published on March 23, 2006.
Océ has shown over the past year that its strategic decision to continue investing strongly in innovation and distributive strength is bearing fruit, even when the economic climate is not so favourable. We would therefore like to express our thanks to all Océ employees for the contribution they made to this performance. We have the fullest confidence in their ability to ensure that the targets that Océ has set for the future will be achieved.
Venlo, January 27, 2006
The Board of Supervisory Directors
J.L. Brentjens,chairman
F.J. de Wit,vice-chairman
M. Arentsen
A. Baan
P. Bouw
J.V.H. Pennings
In the section on corporate governance on pages 64 and 65 further details are given about the Board of Supervisory Directors, its profile, its committees and the remuneration of its members.
11
Report of the chairman of the Board of Executive Directors

2005 was an extremely important year for Océ. Looking at the strongly increased machine sales, the new products and the successful acquisition, we can see that during the year under review we gave concrete form to major elements of our strategy. The sales figures also show that, following a difficult period, we have again found the upward line. Although there is still a great deal of work ahead of us, this is the message that can be read in many places in this annual report and we are proud of that.
Strongly improved basic position
Our position has been strengthened over the past year through a series of important events and activities: the acquisition of Imagistics International Inc., which has made a substantial contribution to our distributive strength and to our portfolio, the addition of important new Océ machines to the range, which is now complete and competitive, the further sale of our lease portfolio and the increasing outsourcing of manufacturing activities to Asia. In a nutshell that is the picture of the year under review. Naturally, tough tasks still remain, such as a radical reduction in costs and the realisation of the synergy effects of the Imagistics acquisition, but that does not alter the fact that our company has grown considerably in strength over the past year.
Unique products
One of the principal factors underlying the growth in machine sales is the strength of our products. During the year we successfully made our presence felt on the market with a complete product range for all market segments in which we want to operate. In the past we were always able to offer a number of highly successful machines, many of which were pace-setters in their category. We can say that now we again have machines with those same unique qualities in the form of the OcéCPS800 and the OcéCPS900 Platinum, the Océ VarioPrint 2100 family, the Océ VarioStream 9000 family and, for wide format applications, the OcéTCS500. They will continue in the years ahead to set the standard for reliable, high-quality printing in the sectors that we serve. Thanks to the sales of machines we are also seeing a recovery in recurring revenues. However, the pace of this recovery is being slowed down because of the transition from analogue to digital machines, and in the forthcoming years, therefore, it will continue to be extremely important to keep boosting the level of machine sales whilst at the same time reducing costs further.
Greater distributive strength
Whilst the product range may have been the principal driver of the growth in machine sales, it did not form the full explanation for that growth. The economy during the year under review was still not in such a condition that it automatically lead to growth. The real explanation can be found in the expansion of our distributive strength on which we have been focusing our efforts for more than two years. Clearly, the intensive training of our sales representatives and the strengthening of the sales staff in the operating companies to include a large number of specialists are starting to bear fruit.
12
Report of the chairman of the Board of Executive Directors
By far the most important impulse for the greater distributive strength in the United States was formed by the acquisition of Imagistics International Inc. Imagistics boasts a strong distribution network in North America. It can count on around 60% of the businesses in the Fortune 1000 list as its customers, has a thorough knowledge of the American printer/ copier market and does good business there. Through this acquisition, which was largely financed by the proceeds from the sale of our lease portfolio, our financial activities have been converted into a healthy commercial activity with a specific and sustainable profit potential. This, without doubt, makes the acquisition the jewel in the crown of the year under review.
Employees form the basis
The statement that employees are the driving force behind the company may not be original, but that does not make it any less true. Océ employees have proved in recent years that they form a remarkably wide and resilient basis for the drastic changes that were needed within the company. Whilst retaining all the good characteristics of the traditional Océ approach [dedicated, close to the customer], the organisation has been transformed in recent years to make it more responsive to change and more flexible. On the basis of the core values that were chosen several years ago, our employees work on their self-development within the business and at the same time on the further growth of Océ. Training and education, as part of world-wide programmes, are not incidental activities but form an integral part of everyday work. At the same time the labour factor also represents more than one half of Océ’s costs. That is why we have decided, within the framework of a further cost reduction, to subject a number of business processes to critical scrutiny. As a result of this, around 500 jobs will be discontinued in Europe and 250 jobs in the United States.
Tight customer focus
With our complete and competitive range we are clearly showing that Océ belongs on the shortlists of preferred suppliers for wide format and small format applications and in both commercial and corporate printing environments. Less visible for the outside world, but no less important for all that, is the broad range of information, analysis, consultancy, software and professional services that we use to assist our customers in the choice, configuration and implementation of their systems and subsequently during the entire life cycle of the printing systems. When we talk about distribution, sales and service we are referring to the whole spectrum of the activities relating to the purchase of equipment. Tightly focused on the market and basing themselves in full on the customer’s requirements, a large group of Océ employees will have often been at work for quite some time even before a purchase decision is taken. For us, therefore, selling means the implementation of a complete solution in the customer’s environment. The main thrust in the years ahead will be to convince potential customers that Océ not only has the best but also the most cost-effective offerings. The cost price of our products obviously plays a role in this. That is why it is necessary for us to relocate a large proportion of our manufacturing operations to Asia. But the price that matters in the end is the ‘total cost of ownership’ and that comprises a great many more elements than simply the purchase price of the machine. That favourable ‘total cost of ownership’ is the key to Océ’s further growth.
13
Report of the chairman of the Board of Executive Directors
Strong partners
With its own research and product development and its own world-wide sales and service organisation, Océ has developed as an independent business from the very beginning and this is also a position that we emphatically wish to preserve. And yet Océ has grown through – and also thanks to – extensive and close cooperation with technological, financial and commercial partners. A substantial part of our technological strength is built on the ability to ask for and obtain the very best from our partner technology businesses and knowledge institutes in all phases of development and production. These partnerships are mostly of a long term nature. In the past few years, however, we have been able to welcome countless new partners who carry out manufacturing with us and for us in the Far East. Our experiences to date have been excellent and I am convinced that they will be excellent performers in their increasingly more prominent role.
Other important partners, especially following the amalgamation with Imagistics, are the suppliers from whom we source machines that will allow us to offer our customers complete solutions. Because of the complementary nature of the products, these partnerships work to the advantage of all concerned.
Last but not least are the partners to whom Océ owes an especially great debt of gratitude: the many local distributors who act as guardians of the Océ name in all places where we do not have our own sales organisation. They ensure that our machines are available everywhere in the world and they offer the same standard of service and support that we provide in the major European and American industrial centres. Not infrequently these partners, who regularly visit our training centres for education and refresher training, pave the way for our expansion in new territories.
Océ within society
Océ has sought throughout its entire history to strike the right balance between the needs of the company, its employees and the environmental effects of its manufacturing operations and products. Sustainability is part of our company’s genetic code. In recent years, in line with the increasingly clearer calls for corporate social responsibility, we have provided a detailed insight into our guiding principles and activities in this area. Our transparent sustainability report meanwhile comprises virtually all Océ activities.
A look ahead
The increased sales, the improved recurring revenues and the successful conversion of our financial activities into a healthy commercial activity provide the ingredients for a good recovery in our results. We saw the first signs of this during the year under review. We are therefore embarking on the year 2006 full of confidence and ambition.
I regard this largely as the success of the combined efforts of all Océ people, in all countries, at all levels and in all markets. But this success would not have been possible were it not for the confidence that our customers, our partners and our shareholders have placed in us. We would like to thank all of them for the efforts they made and the confidence they showed.
R.L. van Iperen,chairman
14
Océ and Imagistics: a strong combination on the American market
When Océ announced the proposed acquisition of Imagistics International Inc. on September 16, 2005, that fact in itself did not come as a surprise to many people. Océ had always sent out the message that the proceeds from the sale of the lease portfolio would preferably be used to boost the company’s distributive strength, specifically in the United States. For some people, however, it did come as a surprise that this related to a company which is hardly active in the areas in which Océ excels: wide format and [very] high volume. But it is specifically the complementary nature of the product offerings that makes the combination the ‘perfect fit’ from a strategic point of view. The two companies strengthen each other by working together in different segments of the printing and document management markets. The existing customers of Imagistics gain access to Océ’s extensive technology and knowledge base and, conversely, theOEM range and market knowledge of Imagistics significantly enrich the product portfolio of Océ as a whole.
Imagistics: we understand documents
The promise that Imagistics makes to its customers and potential customers is formulated in crystal-clear terms in its company motto: we understand documents. The word ‘understand’ has two meanings: an understanding of documents, their structure, their function, their use, but also a thorough knowledge of documents, how they have to be created, presented, processed and distributed.
Just as at Océ, documents form the core of the Imagistics business. And, just like Océ, the company seeks to make a contribution to improving the effectiveness of its customers’ business. The supply of equipment and service forms an important part of its activities. No less important, however, is the application in the customer’s business of the knowledge of document flows that Imagistics has built up during many years of practical experience. For customers this is the key to improving their efficiency, productivity and cost control.
Complete solutions
Imagistics, which has its headquarters in Trumbull, Connecticut, is active via its own direct sales and service establishments in all 50US states, the United Kingdom and parts of Canada. The company offers its customers complete solutions for document production, varying from stand-alone machines to complete networks for the low, medium and high volume. Imagistics sources the machines, following intensive in-house test cycles, from a few selected producers, including the machine supplier that Océ has also selected within the framework of the complete solutions that it offers for the low volume segment.
15
Océ and Imagistics: a strong combination on the American market
Océ and Imagistics: a strong combination on the American market. The amalgamation of the two businesses to form Océ Imagistics substantially boosts Océ’s presence and distributive strength in the corporate market in the United States. National and international customers of both companies can be excellently served in both Europe and the United States.
The product offerings of the two companies are complementary: Océ offers unsurpassed wide format, commercial and corporate printing systems based on its own, superior technology and Imagistics offers top-classOEM products in the high, medium and low volume segments. Océ Business Services offers document management services of a high standard; these can now also be offered to the customers of Imagistics.
Extensive distribution network
Imagistics employs more than 3,200 people, of whom almost 1,300 work in service and more than 1,200 in direct sales. Its customers include businesses that can be found in the Fortune 1000 list. Imagistics has a formidable distribution system and client network, strengthened by an excellent track record and intensive account management. In addition to its extensive distribution network in the United States and Canada, Imagistics is also active in the United Kingdom.
The activities of Imagistics comprise two main fields: on the one hand, copiers/multifunctionals [scan, copy, print] and, on the other, fax. The latter category is now rapidly losing ground as a stand-alone machine, whilst the former is gradually increasing in importance, partly also as a replacement for the fax machine.
Excellent basic position in the United States
As from January 1, 2006 the combination of Océ and Imagistics, operating under the name Océ Imagistics, has been able to offer a wide range of products to existing and new customers. The acquisition of Imagistics provides Océ with a unique opportunity to penetrate the office and printroom market in America. Océ’s revenues in the United States have grown to 1.7 billion dollars and thus account for around 43% of total revenues. The Océ Imagistics combination has given Océ an excellent basic position for further strong development in the United States, our biggest market.
The combined new company is headed by Joseph D. Skrzypczak, President andCEO of Océ Imagistics, Inc. The former President andCEO of Imagistics International Inc., Marc C. Breslawsky, has joined the Board of Océ-USA Holding, Inc.
16
Report of the Board of Executive Directors
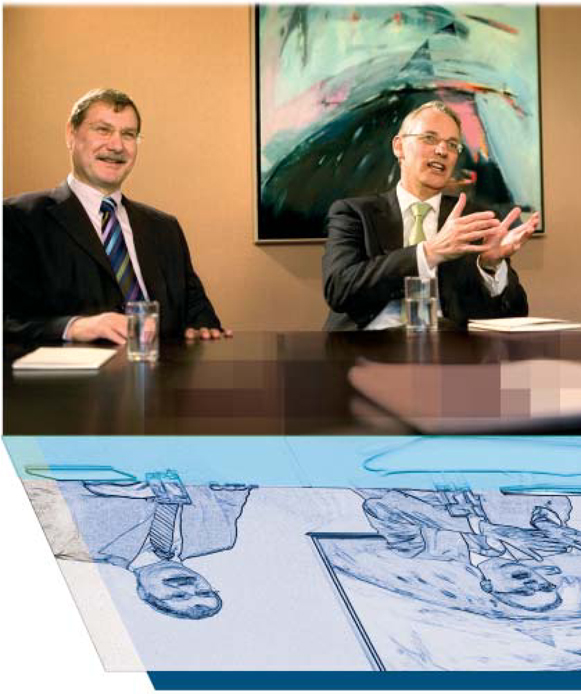
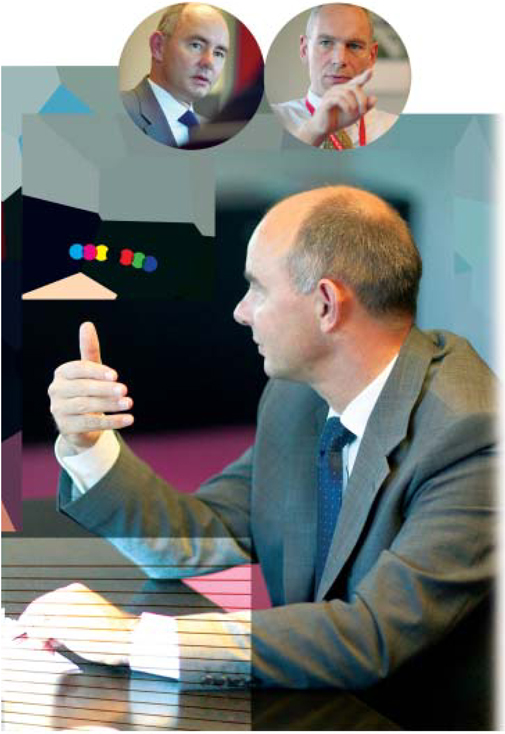
The Board of Executive Directors of OcéN.V.
From left to right: J.F. Dix,
R.L. van Iperen,chairman and J. van den Belt.
18
Financial review
In 2005 the results were influenced by the following factors:
| • | Revenues from leases [interest and book profits on the sale of the existing lease portfolio] were € 58 million lower than in 2004. For the 2005 financial year, therefore, the operating income excluding lease activities, or the commercial operating income net of lease effects, serves as a better yardstick for assessing the operational performance than the total operating income. |
| • | At the end of October 2005 Imagistics International Inc. was acquired for a consideration of € 638 million. The results of Imagistics for November 2005 have been consolidated into Océ’s results which had a positive effect of € 37 million on revenues. The impact on operating income was negligible which is particularly due to exceptional costs that were incurred in November and to the amortisation of goodwill and intangible assets obtained as a result of the acquisition. |
| • | In the fourth quarter of 2005 Océ announced plans to achieve a further reduction in costs and this will result in the loss of some 500 jobs in Europe. Measures have also been taken to boost profitability in the United States. In part, these actions will run in parallel with the integration of Imagistics. In 2005 a total provision of € 33 million was taken to cover these effects in Europe and the United States. |
Océ also reached agreement with its social partners in the Netherlands that pensions in the Netherlands will be based on a ‘career average’ system. In consequence an amount of € 68 million was released from the pension provision and credited to 2005 earnings.
Net exceptional items credited to operating income therefore amounted to € 35 million in 2005.
| • | During 2005 theUS dollar was slightly weaker on average than in 2004. However, the exchange rate of theUS dollar at the 2005 year end was substantially higher than at the 2004 year end. Compared to the result for 2004, this had the following impact on income and on the balance sheet: |
Translation result | +0.5 | x | € million | ||
Transaction result | –1.6 | ||||
Net influence of hedging | |||||
[2004 versus 2005] | –7.6 | ||||
Total influence of exchange rates on operating income | –8.7 |
On the balance sheet the translation result was:
Total assets | +83.8 | x | € million | ||
Total Shareholders’ equity | +36.6 |
19
Financial review
Revenues in 2005 [including Imagistics] amounted to € 2,677 million [2004: € 2,652 million]. On an organic basis revenues remained practically the same as in 2004. Excluding lease effects, revenues increased on an organic basis by 2.1%.
Excluding lease effects revenues from printing systems [non-recurring] showed an organic increase of 10.5% which was largely attributable to colour products.
Recurring revenues [from services, media, rentals, interest and business services] decreased organically by 1.1% [excluding lease effects] compared to 2004. During the second half of the year the trend in recurring revenues started to move in a positive direction; in the fourth quarter an organic increase was achieved.
The gross margin [40%] was lower than in the previous year [41.6%]. This decrease was due almost entirely to lower income from leases.
Operating expenses [excluding exceptional items] were slightly higher as a result of the consolidation of Imagistics. On a comparable basis, i.e. excluding the additional operating expenses of Imagistics and excluding exceptional items, these expenses were 1.4% lower than in 2004. Cost control was again an important focus of attention in 2005 and will remain so in the future.
Operating income was € 110.1 million [2004: € 110.4 million].
As a result of slightly lower financial expense [net] and income taxes, net income was € 0.8 million higher than in 2004.
The acquisition of Imagistics brought an increase in total assets from € 2,233 million at the end of 2004 to € 2,819 million at the end of 2005.
Free cash flow, excluding the acquisition of Imagistics, amounted to € 131 million [2004: € 370 million].
As a result of the acquisition of Imagistics, net debt [interest-bearing loans less cash and cash equivalents] amounted to € 754 million at the end of 2005 [end 2004: € 168 million].
Group equity increased from € 752 million at the end of 2004 to € 818 million at the end of 2005.
The solvency ratio [Group equity as a percentage of total assets] was 29%, which is below the sought after minimum level of 30%. This is not surprising, since the acquisition of Imagistics brings an increase of € 768 million in total assets, whilst there is no change in Group equity. Net interest-bearing debt as a percentage of the aggregate total of Group equity plus net interest-bearing debt [gearing] amounted to 48%.
The solvency ratio and the gearing show that, following the acquisition of Imagistics, the balance sheet of Océ remains solid.
In Digital Document Systems [DDS] revenues [excluding lease effects] showed an organic increase of 1.4%. The organic growth in non-recurring revenues [excluding lease effects] continued [+10.5%]. Recurring revenues [excluding lease effects] were 1.8% lower than in 2004 on an organic basis.
In Wide Format Printing Systems [WFPS] revenues [excluding lease effects] increased by 3.6% on an organic basis.WFPS had an excellent year and booked organic growth in both non-recurring and recurring revenues of 10.3% and 0.6% respectively. The increased revenues from service, ink cartridges and toner made a particularly substantial contribution to the organic revenues growth ofWFPS.
20
Financial review
Table 1
| Information by Strategic Business Unit | Wide Format Printing Systems | Digital Document Systems | total | |||||||||
| x € million | 2005 | 2004 | 2005 | 2004 | 2005 | 2004 | ||||||
Revenues | 834 | 818 | 1,843 | 1,834 | 2,677 | 2,652 | ||||||
Operating income [EBIT] | 71 | 55 | 39 | 55 | 110 | 110 | ||||||
Assets | 638 | 617 | 2,181 | 1,616 | 2,819 | 2,233 | ||||||
Table 2
| Quarterly revenues | 2005 | 2004 | ||||||||||
| x € million | recurring | non-recurring | total | recurring | non-recurring | total | ||||||
First quarter | 448 | 175 | 623 | 480 | 142 | 622 | ||||||
Second quarter | 461 | 179 | 640 | 496 | 186 | 682 | ||||||
Third quarter | 464 | 185 | 649 | 473 | 173 | 646 | ||||||
Fourth quarter | 510 | 255 | 765 | 468 | 234 | 702 | ||||||
Total | 1,883 | 794 | 2,677 | 1,917 | 735 | 2,652 | ||||||
Table 3
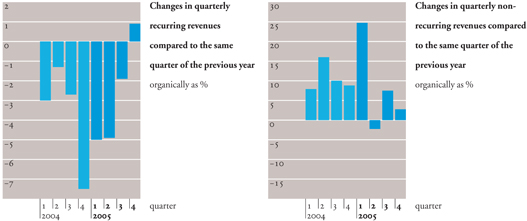
| Changes [organically] in quarterly revenues compared to the same quarter of the previous year; changesinclude the effects of the sale of the lease portfolio | 2005 | 2004 | ||||||||||
| as % | recurring | non-recurring | total | recurring | non-recurring | total | ||||||
First quarter | –5.0 | +24.8 | +1.8 | –3.0 | +7.9 | –0.7 | ||||||
Second quarter | –4.8 | –2.2 | –4.1 | –1.3 | +16.0 | +2.9 | ||||||
Third quarter | –1.8 | +7.4 | +0.6 | –2.7 | +10.0 | +0.4 | ||||||
Fourth quarter | +0.7 | +2.8 | +1.4 | –7.5 | +8.8 | –2.7 | ||||||
Table 4
| Revenues by geographical area | 2005 | 2004 | ||||||
| x € million | as % | x € million | as % | |||||
United States | 931 | 35 | 925 | 35 | ||||
Germany | 323 | 12 | 333 | 13 | ||||
The Netherlands | 289 | 11 | 291 | 11 | ||||
France | 195 | 7 | 191 | 7 | ||||
United Kingdom | 182 | 7 | 180 | 7 | ||||
Rest of Europe | 541 | 20 | 534 | 20 | ||||
Countries outside Europe and the United States | 216 | 8 | 198 | 7 | ||||
Total | 2,677 | 100 | 2,652 | 100 | ||||
21
Financial review
We propose, as in 2004, to distribute a dividend of € 0.58 per ordinary share of € 0.50 nominal for the 2005 financial year. This dividend involves an amount of € 48.6 million [2004: € 48.4 million]. If the General Meeting of Shareholders adopts this proposal the final dividend will amount to € 0.43; the interim dividend amounted to € 0.15.
It is proposed to distribute the final dividend fully in cash. The payout ratio, which amounts to 63% of net income [2004: 65%], is higher than the standard set in the dividend policy [33%].
The Board of Executive Directors takes the view that it is too early to give a forecast for 2006. However, we do expect that the results will be favourably influenced by the increase in revenues, both on an organic basis and as a result of the acquisition of Imagistics.
Savings derived from the integration of Imagistics and the restructuring operations in Europe and the United States will lead to a gradual reduction in operating expenses during the year. These will be offset by extra investments inR&D, amortisation on intangible assets and lower revenues from leases.
RevenuesIn 2005 revenues amounted to € 2,677 million [2004: € 2,652 million].
Non-recurring revenues increased by 8.1% and amounted to € 794 million [2004: € 735 million]. Recurring revenues decreased in 2005 by 1.8% and amounted to € 1,883 million [2004: € 1,917 million].
On an organic basis revenues in 2005, including lease effects, were the same as in 2004.
Excluding lease effects, revenues increased organically by 2.1%.
Excluding lease effects, non-recurring revenues increased organically by 10.5%, whilst recurring revenues showed an organic decrease of 1.1%.
Gross marginThe gross margin decreased from 41.6% in 2004 to 40.0% in 2005.
For the greater part this decrease is attributable to lower revenues from leases [interest receivables and profit on the sale of the lease portfolio]. In 2005 these were € 58.2 million lower than in 2004 and the whole of this amount is deducted from the gross margin. If adjusted for lease revenues, the gross margin decreased from 39.3% in 2004 to 39.1% in 2005.
22
Financial review
Table 5
Commercial and financial activities
| 2005 | 2004 | x € million
| ||||||
Commercial | ||||||||
Revenues | 2,641 | 2,584 | ||||||
Gross margin | 1,036 | 1,035 | ||||||
Operating income [EBIT] | 92 | 62 | ||||||
Financial expenses [net] | 5 | –1 | ||||||
Result before taxation | 87 | 63 | ||||||
Income taxes | 12 | 8 | ||||||
Result after taxation | 75 | 55 | ||||||
Net income | 74 | 53 | ||||||
Shareholders’ equity | 728 | 652 | ||||||
Minority interest | 37 | 38 | ||||||
Group equity | 765 | 690 | ||||||
Interest-bearing liabilities | 606 | 169 | ||||||
Provisions and other liabilities | 1,098 | 962 | ||||||
Balance sheet total | 2,469 | 1,821 | ||||||
Commercial operating income excluding the profit on the sale of the lease portfolio and exceptional items [release pension provision and reorganisation costs 2005] | 52 | 31 | ||||||
Ratios | ||||||||
Operating income as % of average balance sheet total [excluding Imagistics] | 5.2 | 3.7 | ||||||
Net income as % of average shareholders’ equity | 10.9 | 8.5 | ||||||
Shareholders’ equity as % of balance sheet total | 29.5 | 35.8 | ||||||
Financial | ||||||||
Interest from finance lease | 36 | 68 | ||||||
General administrative and selling expenses | 18 | 20 | ||||||
Operating income [EBIT] | 18 | 48 | ||||||
Financial expenses [net] | 13 | 19 | ||||||
Result before taxation | 5 | 29 | ||||||
Income taxes | — | 4 | ||||||
Result after taxation | 5 | 25 | ||||||
Net income | 5 | 25 | ||||||
Shareholders’ equity | 53 | 62 | ||||||
Interest-bearing liabilities | 290 | 312 | ||||||
Provisions and other liabilities | 7 | 38 | ||||||
Balance sheet total | 350 | 412 | ||||||
Ratios | ||||||||
Operating income as % of average balance sheet total [excluding Imagistics] | 5.0 | 7.6 | ||||||
Net income as % of average shareholders’ equity | 9.0 | 26.1 | ||||||
Shareholders’ equity as % of balance sheet total | 15.0 | 15.0 | ||||||
23
Financial review
Operating expensesOperating expenses [before exceptional items] increased by € 4 million to € 997 million. As a percentage of total revenues these expenses were 37.2%, practically the same as in 2004 [37.4%]. The increase in absolute terms is due to the consolidation of the results of Imagistics for November 2005. Without this consolidation, operating expenses [excluding exceptional items] declined. This was achieved without making concessions with regard to the costs of Research & Development and the investments in distributive strength. In view of the foregoing, the focus on cost control was also successful in 2005.
Financial expenses [net]Financial expenses [net] amounted to € 17.8 million, which was virtually the same as in 2004 [€ 18.1 million]. In the fourth quarter financing costs increased considerably because of the acquisition of Imagistics. In consequence, interest-bearing financing has increased strongly. At the end of 2005 net debt stood at € 754 million whilst at the end of the third quarter of 2005 it amounted to € 202 million.
Income taxesIn 2005 the effective tax rate was 12.7% [2004: 13.2%].
Over the past two years, apart from the fact that more income has been achieved in countries with a relatively low tax rate, a role has also been played by exceptional factors. In 2004 this related to the definitive settlement of tax risks, which resulted in the release of provisions. In 2005 anR&D tax credit was included in the second half of the year.
Net incomeNet income amounted to € 78.8 million [2004: € 78.1 million]. As a percentage of total revenues, net income amounted to 2.9 % [2004: 2.9%]. Basic earnings per share, calculated on the basis of the weighted average number of ordinary shares outstanding, were € 0.92 [2004: € 0.89].
Results of commercial and financial activities
Table 5 on page 23 shows the results of the commercial and financial activities separately. A five year overview of these results can be found in table 7 on page 25.
The revenues from financial activities consist of the interest receivables from financial leases. The costs consist of the selling and administration costs and the costs of financing the lease portfolio. The sale of the lease portfolio has meant that interest receivables from leases have decreased in recent years. In 2004 this item amounted to € 68 million; in 2005 it stood at € 36 million.
The commercial operating income is the total operating income excluding the financial results described above.
The commercial operating income excluding exceptional items and profit on the sale of the lease portfolio provides the best picture of the development of Océ’s core activities.
x € million
| 2005 | 2004 | ||
Commercial operating income | 92 | 62 | ||
Exceptional items [release pension provision and reorganisation costs 2005] | –35 | — | ||
Profit on the sale of the lease portfolio | –5 | –31 | ||
Commercial operating income excluding profit on sale lease portfolio and exceptional items | 52 | �� | 31 |
24
Financial review
Table 6
| Statement of cash flow* | 2005 | 2004 | x € million
| |||
Cash flow from operations | 164 | 137 | ||||
Cash flow from investment activities | –671 | 233 | ||||
Free cash flow [before financing activities] | –507 | 370 | ||||
Financing activities | 340 | –114 | ||||
Exchange rate effects | –3 | 1 | ||||
Change in cash and cash equivalents | –170 | 257 | ||||
Table 7
| Commercial versus financial results | 2005 | 2004 | 2003 | 2002 | 2001** | x € million
| ||||||
Operating income [EBIT] | ||||||||||||
Commercial | 92 | 62 | 56 | 142 | 135 | |||||||
Financial | 18 | 48 | 69 | 84 | 90 | |||||||
Total | 110 | 110 | 125 | 226 | 225 | |||||||
Net income | ||||||||||||
Commercial | 74 | 53 | 36 | 86 | 79 | |||||||
Financial | 5 | 25 | 25 | 27 | 26 | |||||||
Total | 79 | 78 | 61 | 113 | 105 | |||||||
Return on total Assets as % [ROA] | ||||||||||||
Commercial | ||||||||||||
| excluding Imagistics | 5.2 | 3.7 | 3.2 | 7.5 | 6.8 | |||||||
| including Imagistics | 4.8 | — | — | — | — | |||||||
Financial | 5.0 | 7.6 | 7.5 | 7.6 | 7.5 | |||||||
Total [excl. Imagistics] | 5.2 | 4.8 | 4.7 | 7.5 | 7.1 | |||||||
Net income as % of average shareholders’ equity | ||||||||||||
Commercial | 10.9 | 8.5 | 5.9 | 12.4 | 10.0 | |||||||
Financial | 9.0 | 26.1 | 18.3 | 16.1 | 14.6 | |||||||
Total | 10.7 | 10.9 | 8.3 | 13.1 | 10.9 | |||||||
| * | For details see pages 82 and 83. |
| ** | Before extraordinary items. |
25
Financial review
Now that almost two thirds of the lease portfolio has been sold to third parties and the proceeds from this sale have been invested in productive [core] activities, i.e. in the acquisition of Imagistics, the relative importance and the absolute size of this commercial income will increase strongly.
For this reason the breakdown of the result between commercial and financial activities will no longer be made with effect from 2006.
To enable a comparison of the results of 2005 with those of 2004, however, this split is still highly relevant.
In 2004 the operating income from commercial activities was positively influenced by a profit of € 31 million on the sale of part of the lease portfolio. Operating income of the commercial activities, excluding the profit on the sale of the lease portfolio, likewise amounted to € 31 million. In 2005 the profit on the sale of the lease portfolio amounted to € 5 million whilst exceptional items amounted to € 35 million. Operating income of the commercial activities, excluding the profit on the sale of the lease portfolio and exceptional items amounted to € 52 million.
Use of funds and finance
Gross capital expenditureIn 2005 Océ’s gross capital expenditure on property, plant and equipment amounted to € 96 million [2004: € 87 million]. Depreciation and divestments together amounted to € 99 million [2004: € 98 million].
Rental equipment and finance lease receivablesThe book value of rental equipment increased by € 66 million to € 124 million. Of this increase € 50 million resulted from the integration of Imagistics, but for the first time in many years the value of rental machines increased. This reflects the higher placements of printing systems.
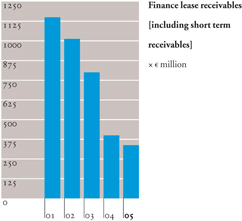
The capitalised value of finance leases [including short term receivables] decreased from € 403 million in 2004 to € 343 million in 2005. This was due to the sale of the existing lease portfolio and to the placing of new leases with third parties. The aggregate value of rental equipment and finance lease receivables amounted to 16.6% of the balance sheet total [2004: 20.7%].
The balance sheet value of rental equipment is calculated on the basis of manufacturing cost plus the cost of ensuring that the machine can operate effectively when installed with the customer, less straight line depreciation. Finance lease receivables are valued at the net present value of the contracted lease instalments plus the net present value of residual value.
Interest-bearing capitalAt the 2005 year end the interest-bearing capital amounted to € 896 million [2004 year end: € 481 million]. Over the past three years the proceeds from the sale of leases have been used to reduce net debt and for this reason it was necessary to finance the acquisition of Imagistics by taking out new credit facilities. It can be seen however that the purchase was effectively paid in full from the accumulated proceeds of outsourcing leases.
Group equityGroup equity increased from € 752 million in 2004 to € 818 million in 2005. The composition of Group equity was influenced by the distribution of dividends charged to the General reserve [– € 50 million], exchanges rate changes [+ € 37 million] and an addition from net income [+ € 79 million]. Group equity as a percentage of the balance sheet total amounted to 29.0% [2004: 33.7%]. This percentage is lower than Océ’s sought after target of 30%. Shareholders’ equity does not increase in the event of an acquisition, whilst the balance sheet total does, and so this reduction in the ratio is fully understandable and in no way alarming. On the contrary, despite the strong increase in assets, the ratio is very close to the minimum that Océ seeks to achieve and this ratio is expected to move above the 30% level in the next 2 to 3 years.
Shareholders’ equity per ordinary share, calculated on the basis of the number of ordinary shares outstanding at the end of the financial year, amounted to € 8.65 [2004: € 7.87].
26
Financial review
Cash flowThe cash flow from operational activities amounted to € 164 million [2004: € 137 million].
The cash flow from investment activities amounted to € 671 million negative [2004: € 233 million positive].
For the greater part, investment activities centred on the acquisition of Imagistics [€ 638 million]. In addition, the sale of the lease portfolio [€ 66 million] was substantially lower than in 2004 [€ 312 million].
Due to the above, free cash flow amounted to € 507 million negative. Excluding the expenditure on the acquisition of Imagistics, free cash flow amounted to € 131 million positive.
The cash flow from financing activities was € 340 million positive [2004: € 114 million negative], whilst cash and cash equivalents decreased by € 170 million.
The dividend paid in cash to holders of ordinary shares was € 48.3 million and the dividend paid in cash to holders of preference shares amounted to € 3.6 million.
Credit facilitiesTo finance the acquisition of Imagistics the Océ Group took out bridging loans amounting toUS dollar 1 billion for a maximum period of nine months. The multi-year stand by credit facilities with the relevant banks were partly frozen for the duration of these bridging loans. At the end of the financial year stand by facilities amounting to € 90 million were also available to the Océ Group. During the 2006 financial year the bridging loans will be replaced by permanent loans.
Finance leases
An essential element in Océ’s sales concept is that customers can find the complete solution for their needs, including their financing requirements, via one single point of contact. Lease programmes therefore form – and will continue to form – an indispensable component of Océ’s offerings to its customers; more than 58% of the sales of machines are financed via finance leases.
In 2003 Océ started outsourcing its lease activities, largely to specialised lease companies. Via this outsourcing the specialised know-how available to the lease partners is used to leverage the commercial potential of leasing to the full. Together with these partners new lease programmes are developed and brought to market.
The outsourcing of the lease activities also allows Océ to focus investments on its core activities and improve the return on invested capital.
Even after outsourcing, Océ continues to be the face that is presented to the customer. Outside of the United States, i.e. in Europe and the rest of the world, theprivate labelmodel is therefore used so that the lease partners operate under the name ‘Océ Finance’. Theone-stop shopping conceptis maintained and Océ’s brand name is used to full effect.
In the United States Océ operates via its own captive lease company, Océ-Financial Services, Inc. Under this concept new lease contracts are concluded in the name of the Océ captive financing company and are then bundled together and sold to an external partner. All the ‘risks and rewards’ are transferred but Océ continues to be responsible for invoicing and debt collection activities.
27
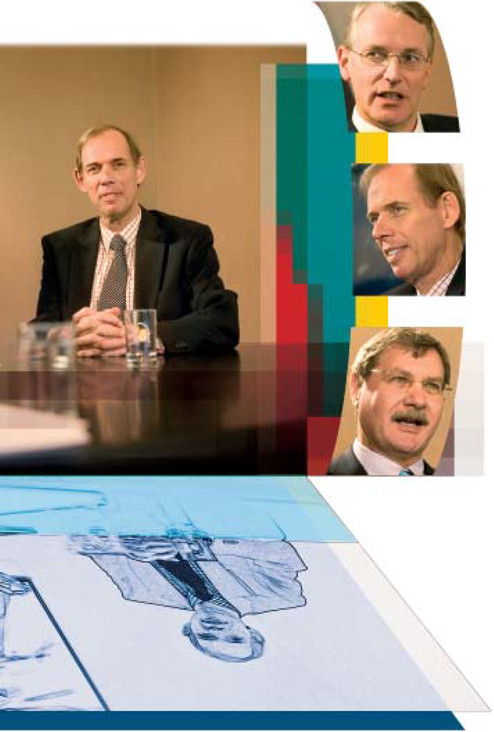
‘A healthy sort of tension exists between us andR&D’
Océ’s Business Units and its technology base are two exponents of the same philosophy: they aim to provide the customer with the best possible solution. The success of that philosophy has proved itself again and again. The vision of the Business Units is reflected in this interview with Tom Egelund [WFPS] and Michel Frequin [DDS].

Market The Business Units andR&D each have their own responsibilities and roles, but as part of the Océ business their activities are fully complementary. Océ is market-focused, but the business has no monopoly on knowledge of the market.R&D, too, has opened its doors wide to the market. And that is a must.
Obviously there is a difference in the way we look at the market. We sometimes place the emphasis on different areas, for instance when we look at which product/ market combinations need to be developed for the future.
Capacity In the way we work together there is a certain degree of healthy tension. You need that, as otherwise special things would not happen. And, of course, we sometimes askR&D to do more than they can handle which is part of that tension. But those wishes are not always in the area of innovation. For us the most important aspects, basically, are time-to-market in combination with innovative functionalities in our printers. For us that cannot
28
happen fast enough which places enormous demands onR&D capacity. And that has its limits, so you have to make clever use of it, for example by developing and applying standards wherever possible. It is certainly a dilemma. On the one hand we feel that our own technology is extremely important and we also have many top-class examples of that in-house. On the other hand, too much in-house technology can also limit you in your time-to-market.
Choices If you list our classic wishes, you will see three things: time-to-market, functionality and cost price. The market is constantly changing in all these areas and our aim at all times is at least to keep pace with other suppliers. In that way we can translate the total cost of ownership into an excellent market proposition. Then we are faced with choices. We can opt for a fast introduction followed a little later by full functionality. In fact, if you talk to customers you find that for them functionality hardly ever comes first. They see reliability and the dedication of the people as much more important. Naturally at a certain moment you have to be able to offer all the functionality that the market is asking for. It is your admission ticket, the requirement you have to meet to be allowed to play the game. But you win the game on the basis of other things: uptime, reliability, total cost of ownership. And as regards those aspects we can still make substantial steps forward.
In terms of cost price steps forward are also being taken. The fact that we are now also manufacturing in Asia is extremely important.
Extras We’ve definitely got no complaints about the activities ofR&D Just look at the products that we’ve been able to add to our portfolio in recent years. At most the tension occasionally arises because of the choices that are made. For instance, making successful machines suitable for countries that are showing significant growth-rates. That does happen, but sometimes at a late stage. We are a true multinational, European in Europe, American in the United States and Japanese in Japan, and that should be reflected in the way we think and act. In addition to technology we would also like to see new services being developed. Océ Business Services is still developing well, but expansion there means developing new, knowledge-intensive services. Pure innovation for which we needR&D And then, of course, there is the theme of colour which is growing in importance every day, for both DDS andWFPS. Right across the market there is an increasing demand for colour, and so we have to invest intensively in colour. And we are doing that. Our own technology, both for small and wide format, will play an important role here.
Speed We hold major technological trump cards and we have to play them well. It’s a combined task for us andR&D. At the point where market and technology come together, new product/market combinations are being created. It is essential for us to keep up the speed that the rapidly changing market is asking of us.
29
The world of Océ | Digital Document Systems
| Customer segments | Products and services | Competitors | ||||
| Corporate Printing | Segments in which Océ operates: Data centres Central repro departments Extensive office environments | Office and departmental printers, black and white and colour. [Very] high volume printers/copiers, black and white and colour. Production printers, black and white and colour, cutsheet and continuous feed. High speed scanners. Workflow software for the management of printing solutions. Financial services. | Canon IBM Kodak Konica Minolta Kyocera Mita Ricoh Xerox | |||
Specifically in the sectors: Financial institutions Telecom and utility companies Government and education Trade, transport, industry and consultancy | ||||||
Commercial Printing | Marketing Services General and specialised printing works Digital print providers Reprographic businesses [quick printers and copy shops] | [Very] high volume printers/copiers, black and white and colour. Production printers, black and white and colour, cutsheet and continuous feed. Workflow software for the management of printing solutions. Financial services. | Canon HP [Indigo] IBM Kodak Ricoh Xerox | |||
Océ Business Services | All customer segments of:Corporate Printing Technical Document Systems | Taking over and carrying out [outsourcing] of document management processes by Océ for both wide and small format applications. | IKON Pitney Bowes Xerox Local Suppliers | |||
| Software & Professional Services* | All customer segments of:Corporate Printing Commercial Printing Technical Document Systems Display Graphic Systems Océ Business Services | Integrated document management systems: input and output management software, document workflow software, document archiving software. Professional services: training, consultancy, implementation, support. | Canon Hewlett-Packard IBM Kodak PLP Digital Systems Seal Systems Xerox | |||
* The results of the business group Software & Professional Services are integrated in those of the business groups Corporate Printing, Commercial Printing, Technical Document Systems and Display Graphics Systems. | ||||||
30
The world of Océ | Wide Format Printing Systems
| Customer segments | Products and services | Competitors | ||||
| Technical Document Systems | Print-for-use Construction companies Architectural and engineering offices Industrial companies Utility companies Telecom businesses Government | Wide format production printers for workgroup and office environments, in both black and white and colour. Wide format scanners. Print management and distribution software. Financial services. | Fuji Xerox Hewlett-Packard KIP Ricoh Xerox | |||
Print-for-pay Reprographic businesses Digital print providers | ||||||
Display Graphics Systems | Print-for-use Corporate and retail in-house printing Printing works Advertising and design agencies | Wide format production printers [roll-to- roll and flatbed] for indoor and outdoor applications. Print workflow software. Financial services. | Durst Epson Hewlett-Packard/Scitex Mimaki Mutoh Nur Vutek | |||
Print-for-pay Digital print providers Reprographic businesses Photo processing laboratories Silkscreen printers | ||||||
Imaging Supplies | All customer segments of:Technical Document Systems Display Graphics Systems Corporate Printing Commercial Printing Océ Business Services | Wide format media. Display graphics media and inks. Print media for office and for commercial graphics applications [business graphics media]. | 3M Corporate Express Hewlett-Packard Intelicoat Paperlinx Sihl Xerox | |||
31
Commercial developments | Digital Document Systems
Results of Digital Document Systems | x € million | 2005 | 2004 | changes as % | organic as % | |||||
Revenues | 1,843 | 1,834 | +0.5 | –1.1 | ||||||
Non-recurring | 526 | 487 | +8.3 | +6.4 | ||||||
Recurring | 1,317 | 1,347 | –2.3 | –3.8 | ||||||
Operating income [EBIT] | 39 | 55 | –29.0 | — |
General
The Strategic Business Unit Digital Document Systems [DDS] focuses on document output and printing solutions for user environments with an intensive document flow.DDS comprises four business groups.
TheCorporate Printingbusiness group supplies integral solutions for document output management to corporate data centres, central repro departments and office environments, in which the emphasis is on providing support for the core processes [print-for-use]. The customers served by this business group include financial institutions, telecom companies, energy suppliers, government authorities, educational institutions and businesses engaged in trade and industry.
The customer base served by theCommercial Printingbusiness group includes marketing service businesses, digital printing firms, specialised printshops and reprographic businesses, most of which use commercial applications [print-for-pay].
TheOcé Business Servicesbusiness group uses the products and services ofDDS andWFPS to take over from customers all their activities in the area of document processing, printing and copying [complete outsourcing] so as to optimise their printing and document management processes.
TheSoftware & Professional Servicesbusiness group serves Océ customers in all target groups by providing them with software products and project services to support the implementation and use of digital solutions.
Market positionCorporate Printing offers integrated document output solutions for users in corporate environments in which documents play an essential role.
Corporate Printing focuses on three strategic, vertical market segments:
| • | Finance, telecoms and utility companies |
| • | Public services: government, healthcare and education |
| • | Trade and industry: manufacturers, retail and wholesale trade, transport, logistics and consultancy. |
Customers in the above segments concentrate primarily on improving the effectiveness of their documents and on achieving maximum efficiency and control over the process. They are aware of the importance of an integrated approach to document processes and applications. Océ supplies products and services that enable the entire document output workflow to be analysed and optimised, aimed at the implemention and management of these products, which brings cost savings for the customer.
The demand for colour is steadily increasing. To meet this need Océ has developed an extensive Production Colour Programme, which comprises scaleable colour printing systems featuring the most consistent colour quality that is currently available in the printing sector.
For the various corporate printing environments Océ offers a range of complete software programs. These encompass innovative concepts, products and services that enable companies to manage their documents more efficiently and more effectively.
32
Commercial developments | Digital Document Systems
Developments in 2005To boost distributive strength the acquisition of Imagistics was completed at the end of 2005. This acquisition has quadrupled the number ofDDS sales representatives in North America. In the office and central reprographic segments particularly, the position ofDDS has been clearly strengthened. Thanks to the bigger sales and service organisationsDDS can now provide services throughout North America which will enable big companies that operate nationally to be better served. The Océ product range for high-production corporate printing environments, consisting of the Océ VarioPrint and Océ VarioStream printers andPRISMA software, was rated in the market as extremely innovative. As a result machine sales showed healthy growth during 2005. Océ also put new versions and releases on the market during the course of the year under review.
To strengthen its position in the office environment Océ is working together with a leading supplier ofOEM equipment to supplement the range with low volume machines for black and white and colour.
For the high-production full colour market segment Océ offers the OcéCPS800 printer/copier and the OcéCPS900 digital colour printing system. These add a new dimension to scaleable production printing in colour and have therefore achieved very good sales results.
The new Océ VarioStream 9000 family for the high and very high volume segments has been positioned by Océ as the innovative leader in high volume and digital multi colour printing. These machines can print not only in black but also in any desired highlight colour as required by the customer’s house style, an option that Océ supplies under the name CustomTone Special. The underlying technology forms the basis for a new series of printers which have a colour capacity that extends to full colour and which will be introduced over the next few years.
OcéPRISMA software enables corporate customers to manage their documents in all their various printing environments and, optionally, to combine the separate document flows within one workflow management process. Océ has developed a strong market proposition with a set of software modules for different printing environments. In 2005 Océ introduced new releases for these software packages.
TrendsIn corporate environments digitisation of documents continues to advance. Document processes in the office environment, in document production and transaction printing, which initially took place completely separately, are becoming more and more integrated [convergence]. One of the results is that printing ultimately takes place on the same printers. Océ has set the standard in the area of intelligent output management software that can control all document environments and applications, regardless of whether this relates to transaction documents, office applications or processes in repro departments.
Although paper is not diminishing in importance, it is increasingly becoming more of a temporary working medium.
Lay-out and the use of colour are becoming more important because they make the information that is presented easier to assimilate. The distribution and archiving of documents will, however, take place more and more in digital form.
33
New products of Digital Document Systems in 2005
Product | Business group | Application | ||
| Océ VarioStream 9230 | Corporate and Commercial Printing | Very high volume continuous feed printer version, based on the Océ VarioStream 9000 that was introduced in 2004. This printer can print not only in black and white but also in two highlight or CustomTone colours. The Océ VarioStream 9230 is the only product on the market that offers this possibility. | ||
| Océ VarioPrint 5140 | Corporate and Commercial Printing | New model in the Océ VarioPrint 5000 series with a print speed of 137 ppm. | ||
| Océ VarioPrint 5115-, 5140- and 5160 Advanced | Corporate and Commercial Printing | New models in the Océ VarioPrint 5000 series which can automatically switch between PostScript,PDF,PCL andIPDS and therefore offer optimum flexibility. | ||
| Océ VarioPrint 5000, Océ VarioStream 7000 and Océ VarioStream 9000 user panels | Corporate and Commercial Printing | All very high volume production printers are now supplied as standard with a highly user-friendly operating panel. | ||
| Océ VarioPrint 1055, Océ VarioPrint 1065 and Océ VarioPrint 1075 | Corporate Printing | New family of very advanced multifunctional printers/copiers/scanners for departmental use, with print speeds of 55, 62 and 72 ppm respectively. This multifunctional and user-friendly machine features unique network management facilities, including a ‘follow me’ print function and a mailbox with fingerprint recognition. | ||
| Océ VarioPrint 2062 and Océ VarioPrint 2075 | Commercial Printing | New family of very advanced multifunctional printers/copiers/scanners for limited- production environments, with print speeds of 62 and 72 ppm respectively. | ||
| OcéCPS800 and OcéCPS900 Platinum | Corporate and Commercial Printing | Full colour printers/copiers for high-production environments: printrooms, central reprographic departments and commercial offices. The Platinum versions of the OcéCPS800 and OcéCPS900 offer a substantially higher print quality. | ||
| OcéCPT60 and OcéCPT90 | Corporate and Commercial Printing | The unparalleled colour consistency of OcéCPS technology also allowsCPS units to be deployed in production clusters, a unique solution that has still not been matched by competitors. An OcéCPT60 [Colour Production Tandem] consists of twoCPT systems, whilst an OcéCPT90 consists of three. | ||
| OcéCS171 | Corporate Printing | Mid volume all in one multifunctional with colour capacity, offering affordable colour possibilities in office environments which have high black and white printing volumes. | ||
| OcéCS520 | Corporate Printing | Mid volume colour printer/copier, specifically for use in corporate printrooms. | ||
34
New products of Digital Document Systems in 2005
Product | Business group | Application | ||
| Océ MP1020, Océ MP1025 and OcéMP1035 | Corporate Printing | Mid volume black and white all in one multifunctionals; a complete product line for the office environment in an economy price range. | ||
| Océ Count Logic | Software & Professional Services | Software that keeps track of copier, printer and scanner operating data for a machine, user, group or project. The application records data on machine use, traces where costs should be allocated and therefore gives a simple and complete overview of the entire printer population. | ||
| Océ Assessment Service | Software & Professional Services | Professional services backed by advanced tools that enable print behaviour to be analysed and document related needs to be identified for commercial offices and public sector organisations. This information can be used to develop a complete business case, including proposals for improvements in document workflows that will bring substantial cost savings. | ||
OcéPRISMA satellite new releases | Software & Professional Services | Print output management software for offices, printrooms and data centres. New functions enhance the pre-press processing of scanned and electronic office documents and facilitate the supply of documents to the production line. | ||
| OcéPRISMA production new releases | Software & Professional Services | Output management system, optimised for use in high volume to very high volume production centres. The latest releases focus specifically on supporting the workflows of documents that have multi-highlight colours as printed on the Océ VarioStream 9000 family. | ||
35
Commercial developments | Digital Document Systems
In the corporate environment growth is specifically taking place in colour, multifunctional and scaleable printing solutions. Printing speeds are still increasing, whilst copiers and printers that can also print in colour are replacing the mid volume black and white printers and therefore paving the way for a more widespread use of colour in office applications. Many customers realise that the costs of processing documents need to be made more manageable. As a result a need is arising for a large number of decentralised printers to be replaced by a much smaller number of high-production systems at departmental or central level, since these enable substantially lower costs to be achieved, whilst offering a better quality and reducing the need forIT management. Increasingly, customers are also opting to outsource all or part of their document production and processing activities. This decision is usually based on efficiency considerations, but outsourcing specialists such as Océ Business Services can also offer an extremely attractive product in terms of cost.
StrategyOcé’s strategy for Corporate Printing is focused on growth and on acquiring or strengthening a top position in all high-production printing segments, supported by a global full-line range of products and services. In this area Océ offers a complete range of VarioPrint, VarioStream and high-production colour printing systems that cover the entire spectrum of black and white and colour. In addition, in the form of itsPRISMA production andPRISMA satellite, Océ supplies high quality output management software that can efficiently control both Océ equipment and that of third parties. To complete the portfolio Océ co-operates in the low volume segment with strategic partners for the supply of a complete line of bought in products for black and white and colour. Intensive cooperation also exists with partners for equipment in the area of pre-press and finishing and for advanced software applications.
In response to the growing demand from customers for complete solutions – which create greater complexity – Océ is investing in its operational organisation, and in sales and consultancy. In addition, via the Océ Business Services and Software & Professional Services business groups, Océ offers an extensive range of services.
In all strategic markets Océ is working on the constant strengthening of its distribution channels. In this respect the acquisition of Imagistics International Inc. represented an important step forward.
36
Commercial developments | Digital Document Systems
Market positionThe Commercial Printing business group focuses on customers who generate income from the equipment itself.
In businesses that produce direct mail [marketing services] Océ occupies a leading position world-wide with its high and very high volume printers. In this market Océ also holds a strong position amongst digital print providers. Besides this, Océ is active in segments of the graphics market, especially for time-critical production runs, limited print runs and personalised documents or frequently changing documents such as user instructions.
In recent years Océ has built up a strong position in the production of books and newspapers with a limited print run. Although digital printing is currently used only to a limited extent in the graphics world, great potential exists here for limited print runs alongside the traditional offset process.
In the highly demanding commercial printing segments Océ is gaining ground both through the expansion of the range and through a vertical market approach. Here, reliability and productivity are of the utmost importance and these are aspects for which Océ machines score high marks. In addition, Océ has harnessed its lengthy experience of complex printing processes to develop software for integrated workflow management which can flexibly and efficiently steer the complete order processing and production process, even where this incorporates non-Océ equipment.
Scanner Speed and precision are characteristics of this small marvel. The lens looks familiar but the essence is formed by the narrow grey stripe on the print plate behind it. That is theCCD [Charge-Coupled Device] which records with amazing speed every detail of the originals flashing by, up to big poster format. Lens andCCD are aligned with extreme precision so that even the tiniest detail is registered. And that alignment remains absolutely intact. For hundreds of thousands of scans.
37
Commercial developments | Digital Document Systems
Developments in 2005In some of the printing markets of relevance to Océ the level of investments in new equipment is increasing. In the graphics market there was hardly any increase in the total number of machine placements. None the less Océ is gaining ground in this market, notably thanks to the increasingly improved and more extensive product range. The OcéCPS 900 Platinum and the Océ VarioStream 9000 family met with great success immediately after launch. Océ continues to invest in specialised sales staff in the regional sales organisations so as to improve even further the way it serves the commercial printing markets. Océ’s Digital Newspaper Network was extended further with the opening of new locations in Europe and the United States. Via this network Océ enables the publishers of daily newspapers to print their international editions anywhere in the world, which saves time and obviates the need for transport costs.
TrendsThe growth in the commercial digital printing segment is caused on the one hand by the outsourcing of printing work by the corporate environment to commercial printers and, on the other, by the migration of printed matter that was traditionally produced on offset presses to digital printers. This migration is possible due to decreasing costs, the increasingly higher quality and productivity of digital printers and the availability of workflow solutions that are tailored to the needs of the commercial segment. The shift in favour of digital printing is being further strengthened by the growing demand for smaller print runs and personalised document production for which digital printing is more suitable than offset printing. In colour printing the biggest potential growth is taking place in the most productive segments [contract printers, book printing and mailers]. In absolute terms the share of colour is still small due to the high variable costs which are still relatively high.
StrategyOcé aims to further consolidate the top position that the company holds for continuous feed solutions in the most productive segment of digital printing. The Océ VarioStream 9000 family is the benchmark for this market segment in terms of technology and innovation. Firstly because of its superior quality and, secondly, because it offers a migration route to affordable high quality colour printing.
In the graphics market, one of the growth markets for digital printing, Océ aims to achieve a leading position by offering integrated digital printing solutions for both general printing firms and specialised businesses. Here, too, a key role will be played by the Océ VarioStream 9000 family and the advanced cut sheet colour printer, the OcéCPS 900. Océ continues to strengthen the sales staff and sales support departments further to ensure that these possess the know-how and expertise to deal with the requirements, wishes and business processes that are specific to this sector.
Océ intends to expand its position as a major supplier serving print shops and copy shops, customers for whom the new mid volume and high volume printing systems such as the Océ VarioPrint 2110 and the full colour OcéCPS800 and OcéCPS900 are eminently suitable. Of great importance in this market is the bundling of hardware and software that Océ can offer.
38
Commercial developments | Digital Document Systems
Software & Professional Services
Market positionThe Software & Professional Services business group is the Océ centre of expertise in the area of output and document management. Together with the customer’s experts, this business group catalogues and analyses the customer’s print output and document processes and develops proposals for improving them. These often take the form of new printing configurations with intelligent software, which channels each print job to the most suitable and most cost effective equipment for that job. The systems that are used, both hardware and software, are designed and implemented by Océ using its own working method, the Océ Solution Delivery Process.
Ever since the introduction of the first digital printers Océ has been developing software to control the ever more integrated and complex printing processes and printing systems. This links up with the customers’ wishes to add more value to their documents and at the same time to reduce the costs of document production in their businesses.
Océ markets a complete range ofDDS output management programs and applications under the name OcéPRISMA. For corporate customers four sets with workflow solutions have been developed:PRISMA for Office,PRISMA for Printrooms,PRISMA for Enterprise Resource Planning [ERP] andPRISMA for Transaction. For the commercial market three sets are available:PRISMA for Printshops,PRISMA for Printing-on-Demand andPRISMA for Mailers.
The business group also supports Océ Business Services in the complete handling of document and printing processes that have been out-sourced by customers.
Developments in 2005The focus in 2005 was on the full introduction of the environment-specific and segment-specific workflows that were developed in 2004 and brought to market under the name OcéPRISMA. EachPRISMA solution brings together the most important applications and output management system functions for a specific customer segment within a compact but complete combination of programs. The programs improve the customer’s working processes and efficiency and the tailor made software bundles make implementation considerably simpler.
In the year under review Océ brought new applications to market which will help Océ customers to further boost the productivity of their output management solutions. Examples of these new applications are OcéPRISMA satellite for Office and Océ Document Designer Advanced which, on the basis of more than 50 advanced personalisation projects, became one of the leading printing solutions for variable data right from its very introduction.
TrendsDue to the strong advance of digitisation, the enormous quantity of paper documents is being accompanied by an abundance of digital information. Not only the management of this information but also its processing is becoming increasingly more complex, since in many cases the information has to be supplied in parallel on paper, by fax, by e-mail or as aPDF file. Customers are increasingly asking for complete solutions in the form of one single package from one supplier. The Software & Professional Services business group can meet this need, firstly via thePRISMA products package, supplemented by partner products and, secondly, via the deployment of the extensive team of the company’s own system consultants, engineers and project managers. The design, integration and implementation of complex systems, comprising both Océ products and third party equipment, are their speciality.
39
Commercial developments | Digital Document Systems
StrategyOcé aims to achieve a substantial strengthening of its position in the market for output management systems by expanding the breadth and depth of its range and by offering combinations of hardware, software and services that are targeted at specific user environments. With its OcéPRISMA output management software the company is already one of the major players in the market. Océ is continuing to concentrate on the integration of partner systems as a supplement to itsPRISMA range. The emphasis in this area will be on job preparation, transmission to the printers and production locations and the management of the complete printing process.
In co-operation with partners Océ will gradually expand its output management systems to make them into complete document management solutions. Key roles are played here by reliability, productivity, durability, user-friendliness, a low total cost of ownership and, thanks to standardisation, simplicity of integration.
Market positionOcé Business Services is active in a distinct growth market: that for the out-sourcing of document management processes and print management activities. Its customers are medium sized and large companies which want to concentrate on their core activities and, as regards other activities, want to assure themselves of the best services that are available in the market. The activities comprise all printroom processes, the operation and maintenance of complete copier/printer systems, machine fleet management, electronic and physical archives management, and scanning and postroom activities. In ten years’ time Océ has become one of the foremost companies in this field, both in the United States and in Europe. Because of its position at the heart of its customers’ document processes Océ can offer top class expertise as a partner, not only for the operational side of the processes but also for integrated document management.
In co-operation withR&D new services are being developed.
During the entire contract period possible improvements are continuously investigated, proposed and introduced. Océ acts on the one hand as the consultant who implementsbest practicesand, on the other, as the supplier of equipment and media. Working methods and results are based on service level agreements which take into account the customer’s wishes and the requirements set by each specific situation. In this way the quality, effectiveness and productivity of the document management process are improved whilst the costs for the customer remain the same or are even reduced.
Developments in 2005In 2005 profitable growth was the target and that target was achieved. Océ continues to focus on improving the profitability of current contracts by means of cost control and by expanding the services it provides through the introduction of new concepts that offer high added value. In the autumn of 2005, for example, Océ Business Services introduced OcéMAX™, the analysis instrument for document processes, and –shortly afterwards – the ‘e-Desk’ project, which enables employees in an office environment to contact all central printing facilities in the business via one keystroke on a standard keyboard. Océ continues to regard the current activities in printrooms and mailrooms as a core activity but is also using that position as a launch pad that will lead to more complex assignments.
40
Commercial developments | Digital Document Systems
TrendsThe outsourcing market is comparatively big because an increasingly wide range of activities are being contracted out. Particularly in the United States the character of the market is changing now that more and more new entrants are providing services that cross over the traditional borders between the specialist areas. Since existing suppliers are also expanding the package of services that they offer, competition is becoming more intense. In Europe, where outsourcing is still relatively new, it is possible to achieve a faster expansion in the direction of more complex activities that are linked to the management of complete information flows.
StrategyOcé is focusing on boosting its profitable revenues from business services. That means a shift in emphasis away from mailroom and printroom services towards the more complex management of the physical and electronic document flows in businesses. For this purpose investments are being made in the development of these complex services inR&D and the operational departments. Selling, implementing and managing these services also require additional investments in sales and marketing. The main focus continues to be on those processes in which printing plays an important role.
Drum The heart of the OcéCPS-line is the drum on which the image is formed. In the OcéCPS800 andCPS900 there are seven drums, each separately responsible for one colour. This is where toner particles, applied in a precisely defined place, form the basis for the quality of the print. Any deviation, even at micron level, can affect the clarity, colour and surface properties and is therefore fully excluded. In print after print.

41
Commercial developments | Wide Format Printing Systems
Results of Wide
Format Printing Systems
| X € million | 2005 | 2004 | changes as % | organic as % | ||||
| Revenues | 834 | 818 | +2.0 | +2.1 | ||||
| | Non-recurring | 268 | 248 | +7.8 | +7.8 | ||||
| | Recurring | 566 | 570 | –0.6 | –0.3 | ||||
| Operating income [EBIT] | 71 | 55 | +28.3 | — |
General
The Wide Format Printing Systems [WFPS] Strategic Business Unit comprises three business groups.
TheTechnical Document Systemsbusiness group offers technical applications for customers such as construction companies, architectural and engineering offices, industrial, utilities and tele-com businesses and the government [print-for-use] and commercial applications specifically destined for use by reprographic businesses and digital print providers [print-for-pay].
TheDisplay Graphics Systemsbusiness group supplies applications for the graphics industry and the world of advertising and focuses on indoor and outdoor advertising and other forms of graphic communication.
TheImaging Suppliesbusiness group is specialised in the supply of print media to all customer categories and the supply of toners and inks.
Market positionThe Technical Document Systems [TDS] business group supplies wide format equipment for the scanning, copying, printing, distribution and archiving of technical documents. Its customers are businesses and institutions that use wide format applications to support their own business processes, but also companies [such as specialised repro businesses] that use Océ systems and applications for commercial purposes.
Océ holds a strong, leading position in this market, especially thanks to the quality, productivity and user-friendliness of its systems. Océ has long been the pace-setter in terms of new developments: digitisation, scanning for archiving, electronic distribution and decentralised printing. The expertise that Océ has gained with black and white documents forms an ideal launch pad for marketing colour solutions to meet the growing demand for technical documents in colour. Both in black and white and in colour, Océ’s systems stand out because of their high level of productivity in the entire process, from electronic distribution via printing and copying through to finishing.
The activities are mainly concentrated in Europe and the United States. Particularly in recent years, however, the Asian markets have also been rapidly growing in importance. Over the past years Océ has made sizeable investments in Japan and China. Apart from bringing organic business growth, this has led in Japan to the recent acquisition from Shacoh of its population of high volume, wide format machines. In China, too, the business is developing strongly.
42
New products of Wide Format Printing Systems in 2005
| Product | Business group | Application | ||
OcéTDS100 | Technical Document Systems | Wide format analogue copier for workgroup and office environments in small construction companies and architectural and engineering offices. | ||
OcéTDS320 | Technical Document Systems | Wide format digital copier for workgroup and office environments in small construction companies and architectural and engineering offices. | ||
OcéTDS450 | Technical Document Systems | Wide format reproduction system, specifically aimed at offices and workgroups, comprising a newly developed colour scanner [Océ Direct Scan] which sets a new standard for ease of use. | ||
OcéTDS860 | Technical Document Systems | Highly productive, wide format printing system that can be fully adapted to meet the needs of commercial users in the high volume segment but is also suitable for corporate printing in industrial environments. Offers a wide range of options in scanners, print speed and management software to enable customer-specific configurations. | ||
OcéTCS500 | Technical Document Systems | Highly productive, wide format colour printing system; successor to the OcéTCS400 for commercial and industrial environments. | ||
Océ ArizonaT220VF | Display Graphics Systems | Mid volume flatbed printer for the market for thermoplastically formed advertising displays. | ||
OcéCS6100 | Display Graphics Systems | Extra wide format [2.5 metres] mid volume colour printer for durable, weather-resistant outdoor advertising. | ||
OcéCS7070 | Display Graphics Systems | Hybrid, high speed inkjet printer, featuring drying withUV light; suitable for both roll-to-roll and rigid materials for advertising signs, exhibition materials and outdoor advertising on buildings. |
43
Commercial developments | Wide Format Printing Systems
Developments in 2005In the black and white segment an aggressive marketing approach plus the addition to the product portfolio of the OcéTDS 100 and the OcéTDS 860 resulted in organic growth in revenues from printing systems. Printing volumes in this segment increased further. Revenues from service were maintained at the same level as last year, despite the fact that the servicing requirements of the systems were further reduced.
In all volume segments Océ succeeded in selling more black and white and colour printers than in the previous year. This was in part attributable to the many major and smaller scale innovations that were incorporated in both hardware and software to further enhance productivity and ease of use.
To maintain its leadership position as a supplier of very high production colour printing systems, Océ introduced the OcéTCS500 at the end of 2005. This printer represents a step change in productivity as compared to its predecessor, the OcéTCS400.
Black and whiteThe OcéTDS100, a stand alone copier that is manufactured in Asia, was launched on the market during 2005 and has already achieved an equal number of placements as its successful predecessor, the Océ 7050. The fastest growing product line, however, was the OcéTDS300, which has been on the market since 2004 for lower volumes in smaller companies. In part, this growth was brought about by the ongoing trend towards more decentralised printing on smaller printers.
The OcéTDS600 sold better in 2005 than in the previous year, thanks to intensive marketing efforts. At the beginning of 2005 the OcéTDS 860 was introduced. This extremely flexible and multi-configurable machine is targeted at the high and very high volume segments. The large number of placements of the OcéTDS860 in the past year showed that in this market a big demand exists for a machine with these qualities which can serve both the high and the very high volume segment in a cost effective way. That need is topical now that more and more decentralised printing is also taking place in repro-graphic environments.
In the autumn of 2005 a number of new printing systems were introduced, including the OcéTDS, successor to the OcéTDS, and the OcéTDS with a colour scanner.
As a result Océ’s current product portfolio in wide format black and white links up in full with the trends in the market: decentralisation, for which low and mid volume products are used, and flexibility in central environments, for which the high volume machines are deployed.
ColourIn the colour segment the OcéTCS400, both in the printer version and in the form of the combined printer/copier, resulted in a substantial strengthening of Océ’s market position. The recently introduced OcéTCS500 is expanding this position further. This is mainly due to the fact that Océ was the first company to produce a colour system that successfully incorporated a productivity concept that had been tried and tested in the black and white segment. As its installed population steadily grows, this machine will prove to be an important source of recurring revenues. Although many users are currently still staying with black and white printing because of its lower costs and higher productivity, there is no doubt that colour will be the catalyst for growth in the future.
TrendsTheTDS market is expected to remain fairly stable in the years ahead. However, because of the rapid developments in electronic communication and archiving, there will be a further shift from centralised towards decentralised printing, in a location close to the user. In corporate environments this means a shift of the printing volume towards smaller machines. In various geographical markets construction activities are starting to increase again. This is of importance for Océ in view of its strong market position amongst architectural and engineering offices and in building companies. Specialised repro businesses are also noticing the effects of this upswing in the form of an increase in turnover in black and white documents, which represent the greater part of their business, and they are investing in the replacement and expansion of their machines and production management software.
44
Commercial developments | Wide Format Printing Systems
Ongoing digitisation is leading to a decrease in the printing volume on analogue machines. For the time being, however, a need continues to exist for analogue systems within smaller organisations.
The shift to colour is taking place slowly but surely, both in printing, scanning and copying. This is because, step by step, technological advances are tipping the price-versus-productivity balance more in the favour of colour. Many businesses therefore use a combination of colour and black and white systems.
StrategyBy means of product innovation, a focus on user needs and greater distributive strength Océ will be able to gain market share. In this way Océ can further build its strong position in Europe and the United States, continue its expansion in Japan and invest in building up a strong position in various new and emerging markets, such as China. The programmes for developing new products are focused above all on improving the productivity, ease of use and investment value for the user. This applies not only to users in Europe and the United States, but also to users in Asia. Continual training of the sales staff and the service organisations will enhance the distributive strength and thus enable Océ to expand its market share further. Océ continues to invest in black and white and colour printing systems that improve the workflow and productivity of the end user of the systems. Here an important role will be played by Océ’s strong software products, such as Océ Repro Desk and Océ PrintExec Workgroup and their successors.
Market positionThe growing advertising market is the driving force behind the growth of the Display Graphics Systems [DGS] business group, which focuses on the flexible and fast production of posters, banners, billboards and countless other wide format graphics products. Although they have only been on the market for a relatively short time, digital techniques are increasingly replacing traditional analogue techniques such as silk screen printing, photo printing, offset and traditional lettering. Thanks to its improved print quality and the cost effective high production speed, the market for digital printing is expected to continue to grow in the forthcoming years. Océ offers a complete range of advanced printers, software, media and inks world-wide, backed by a high-quality service and support organisation. Since last year Océ has also been active with display graphics via its sales organisations in Japan and most other Asian countries and is now optimally able to serve the major markets in this segment within the Asia/Pacific region.
Océ’s subsidiary Onyx Graphics, Inc. is the world market leader for colour controller software for display graphics printing systems. In this area Onyx has complete autonomy and, as market leader, has a substantial proportion of the suppliers in the display graphics market as its customers.
Developments in 2005Revenues from sales of hardware increased strongly within theDGS business group. Partly as a result of this, recurring revenues – including revenues from inks and media – grew as well. In 2005 theDGS business group concentrated its activities in a single location in Vancouver, Canada. Operational costs will thus be limited in the years ahead thanks to the creation of a cohesive group with a tight focus, in which new products can be quickly developed, manufactured and put on the market. The launch of new products and inks specifically developed for industrial applications has strengthened the product portfolio. One of Océ’s leading core competencies is its ability to offer customers complete solutions in the form of a combination of software, hardware, media, inks, service, financing and expertise. To complement the sales of its own products the business group also supplies third party products, in most cases sold under the Océ name.
45
Commercial developments | Wide Format Printing Systems
Onyx Graphics again achieved good results in 2005. With its Postershop product the company is the global market leader in Raster Image Processors [RIPS] for wide format colour printers. Onyx also offers support in the profiling of media and the managing of digital files. In addition, Onyx targets its applications at various vertical markets, such as the printing of textiles. Onyx has meanwhile made a start on expanding its position in Asia.
TrendsIn this highly fragmented market, business consolidation is slowly starting to occur in the higher volume segment. An important factor for the growth of expenditure in the digital graphics display market is the success of outdoor advertising, which is a particularly cost effective way of advertising. Another important aspect is that average print runs are decreasing, which often makes it more economical to use digital printers. This means that the demand from traditional printing firms for digital printing is growing, since digital printers can produce such print runs at lower costs and also enable a faster response time.
StrategyTheDGS business group aims to achieve a leading position in the display graphics market. At the moment the business group has built up a balanced range for its customers thanks to a combination of Océ-developed hardware and software and bought in products. These are sourced from a limited number of partners with whom the company has long term relationships. In all cases the products are supplied to users together with the right combinations of inks and media for specialised applications. An important role is played here by Océ’s strong, world-wide sales and service organisation. This market approach will be continued and intensified. The business group concentrates on the mid volume and high volume segments of the market.
Onyx Graphics is rebuilding its core technology so that it can easily augment for targeted vertical markets and applications. Large format technologies have become more complex and the throughput of printers has become key. This is why Onyx will focus more on workflow and colour quality over the next few years rather than on additional features.
Market positionIn the market segments in which Océ is active the availability of the right media and imaging supplies plays a major role. Media and imaging supplies therefore represent a significant element in Océ’s total offerings due to the importance of the interaction between media and hardware, especially with a view to the high quality of the [colour] applications. Throughout the world the Imaging Supplies business group sells media, inks and toner for small and wide format applications on both Océ equipment and third party machines. Imaging Supplies has its own purchasing, product development, production, converting and logistics systems. With factories in Europe and the United States, Océ is the world’s biggest converter of wide format media and also holds a prominent position in black and white wide format media. In wide formatCAD and display graphics media the market share is also moving ahead. In small format paper the business group has built up an attractive market share in Europe.
Developments in 2005Although revenues decreased slightly due to the lower selling prices of paper, the profitability of the business group increased. This was mainly achieved through improved control of logistics costs. In wide format media for the display graphics market the many years of investments in the product range and in creating brand awareness resulted in a substantial growth in revenues. The market share in wide format media also showed an overall increase, partly because more media were supplied for use on Océ equipment, and partly through supplies to third parties under private labels. Another factor of significance was the sale of modified media to new users of Océ equipment. Emphasis was also placed on building up a high quality range to meet the high demands of the graphics market. The OcéCPS 700,CPS 800 andCPS 900 machines and the OcéVP2110 black and white printer particularly produce an excellent quality print when used in combination with OcéMC paper which was first introduced in 2005. Sales in this segment are therefore growing quickly.
46
Commercial developments | Wide Format Printing Systems
Activities in the area of small format specialities [including photo printing paper and textile transfers], which are produced in the company’s own [Arkwright] plants in the United States, have been considerably expanded.
To boost efficiency, but also to increase the commercial strength in Europe, the Imaging Supplies business group and the European sales organisation of Arkwright have been combined.
TrendsThe market for imaging supplies is highly competitive and fragmented. A consolidation is now gradually taking place and this is forcing the remaining parties on the market to make drastic improvements in their logistics processes. Market growth is being stimulated by the continuing digitisation of printing processes. Technological know-how and expertise in the area of supplies and basic materials are of vital importance to ensure a good performance in this market. Océ has both of these.
StrategyThe strategy of the Imaging Supplies business group is aimed at expanding its position as a supplier of high quality media for wide format printers in both theTDS and theDGS segment. In addition, the business group seeks to provide maximum support for the activities ofDDS by offering a complete and competitive range of small format media for both colour and black and white applications. Thanks to the broad range offered by Imaging Supplies, Océ is able to enhance the value of the total solutions it offers to customers.
Software Océ machines are today seldom stand-alones. Most digital machines operate in groups, are incorporated in networks, integrated in complex document flows. Océ machines are renowned as flexible working partners working together with the people who operate them and also with other machines, not only those made by Océ but equally with those of other producers. Océ’s application software makes this possible. Designed with open architecture, but at the same time with Océ quality and the intuitive structure that go hand in hand with the ultimate in user-friendliness.
47
‘The best reward forR&D is the commercial success of the products’
Technology and the Business Units are important pillars within Océ, each with its own specialisations and characteristics. However, they develop their greatest strength by working in combination with each other. The interview here shows how Océ’s topR&D executives see this.
The words are those of Wim Orbons [R&D Venlo], Peter Feldweg [R&D Poing] and Michele Pracchi [R&D software].

Approach The respective roles ofR&D and the Business Units have to be seen in the light of Océ’s total offerings to the market. The basic principle is that we should offer the best possible products and services to the customer. To do this we work side by side, each with our own specialisations and the total value of the offerings is then determined by theexcellenceof the entire organisation. But differences in approach do exist betweenR&D and the Business Units.
Iterative processR&D initially develops concepts; products only come later. Developing concepts takes place via constant interaction with the market and therefore with the Business Units as well. It is an iterative process. You always know what is happening and what is needed in the market and you translate that knowledge into products and services. But one special aspect of the work done byR&D is that we are at the same time way ahead of what is actually happening in the market. You need to be if you want to introduce radical changes on a regular basis. We are able to identify at an early stage what may become important for our
48
customers in the distant future because we look at technological developments on the basis of our market knowledge. We convert our ideas about this into concepts which are often only further developed and refined into tangible products much later, as part of the strategy of our output, and in close contact with the business.

Long term ForR&D the vision over the long term is essential. The customer, the market, is inclined to extrapolate current solutions: to demand products that are faster, cheaper, more efficient. We respond to that very keenly. But we also look very explicitly at what is going on elsewhere in the world of technology, as that is the only way to come up with pioneering concepts that will make their mark ten or fifteen years from now. For the completely new series of machines, as we now have in theCPS line and the VarioStream 9000 family, development work was started many years ago. For basic technology this applies even more strongly. Our organic photoconductor, for example, is something that we started working on as long ago as 1978. It came on the market in 1992 and it will certainly last for a further 15 years, if not longer.
Technology leader It is not always easy to convince others that our vision of developments in the distant future is right. After all, this involves enormous investments over a lengthy series of years. You also need a strong business with much stamina if you want to maintain such a constant approach to technology. On the other hand, good basic technologies also generate revenues over the long term. And it simply fits in with the type of business we are. We are a technology leader, driven by the wishes of the customer.
Balance The art is to maintain the right balance between the long and the short term. Certainly when it comes to improving and fine tuning the machines and bringing the products into line with the needs of the market, the role of the Business Units is of course crucial and we both move ahead in parallel as part of that process. Then the questions also arise which we are expected to answer over the short term. Admittedly, we sometimes cannot give an answer, but if it involves a good business case, then such a question is in turn a superb challenge. Times are past when an engineer simply looked at what he had achieved over the last few months. Everything now revolves around the ultimate success of the entire project. The best reward for an engineer is the commercial success of a complete product but cooperation with the Business Units is also, of course, of vital importance for such a success.
Solutions In this approach, but also in our products, you can recognise the way in which Océ is positioned in the market. We want to ensure that our customers are able to improve their business performances. We do not leave our customers to fend for themselves, we stand next to them all the time. That pays for itself in the form of trust. Customers expect us to provide them with solutions and this demand is handled by the Business Units. It is our task to actually create those solutions.
49
Research & Development
Océ has a broad and robust technology portfolio and modern, well equippedR&D facilities. These are the foundation stones for a portfolio of products and services that are of a high technological standard and which offer great added value to users. In-house product development is an essential feature of the Océ business model. Since this is based on making optimum use of the feedback of customer experiences via thousands of Océ consultants, sales staff and service employees, the company’s new and improved products always link up seamlessly with customer needs.
Product development takes place in centrally managed project groups in which all relevant disciplines are represented. In this way Océ can optimally harness all the know-how, experience and skills available within the business to innovate its range of offerings. Thanks to this constant innovation and its ability to meet the wishes and requirements of rapidly changing markets, Océ has built up a reputation for products that are characterised by their productivity, quality, user-friendliness and reliability.
Océ spent €193 million onR&D in 2005; excluding Imagistics, this corresponds to 7.3% of revenues [2004: 7.8%]. Approximately 1,800 employees work inR&D.
Océ has its ownR&D facilities in seven countries, all of which work closely together. In Venlo we develop cutsheet and wide format printers and scanners, strategic materials [toners and photoconductors] and software. In Poing [Germany] theR&D activities focus on the development of high volume printers and software. In Vancouver [Canada] theR&D facilities are specialised in display graphics wide format colour printers, whilst Fiskeville [USA] is the home of theR&D department of Arkwright, which develops specialised imaging media.R&D centres for software development are located in Créteil [France], Namur [Belgium], Konstanz [Germany], Timisoara [Romania], Salt Lake City and Phoenix [United States].
Strong technology portfolioOcé’s technology portfolio comprises a great many of the company’s own inventions and developments. This successful, advanced basic technology is continuously developed further and applied in new products. At the same time work is done on the [often lengthy] development of new, pioneering basic technologies that will form the backbone for the company’s future growth. One example of such a proven, but continually updated technology is the CopyPress printing technique. In this the toner image is pressed directly into the paper, a reliable technique that creates a clear, crisp image. CopyPress is used in combination with the organic photoconductor [OPC] for black and white prints but also – together with the Direct Imaging [DI] technique – for colour printing. Both the organic photoconductor and theDI technique were developed in Océ’s ownR&D laboratories. TheDI technique, which uses seven colours to create a perfect full colour image, forms the heart of the OcéCPS700,CPS800 andCPS900 cutsheet colour printers.
In developing colour printers for wide format applications Océ works together with external partners in the area of thermal inkjet technology. Partnerships of this type have proved their value in recent years because they have made it possible to develop high quality, market focused solutions within a short time frame. For the immediate future, however, Océ is also developing its own technology, offering qualities that are specifically targeted at the needs of the high production wide format market.
50
Technology
With its continuous feed products, printers and software for the very high volume segment Océ holds a leading technological position, chiefly thanks to their quality and reliability. Most of these systems also have the flexibility to print the customer’s own spot colour [CustomTone Special] or to print magnetically readable information. An important step forward was formed by the development of the Océ VarioStream 9000, a new family of high volume machines that was introduced during 2004. In these machines the printing quality has been considerably improved thanks to a new, unique technology based on the organic photoconductor. Even more important, in view of the growing demand for colour, is the fact that the user can print extra colours on the same machine by adding extra modules. Océ therefore offers its customers an optimum route to upgrade further to high speed full colour printing. Amongst the many specific applications that Océ is able to offer to its customers, a special segment is document input management systems with advanced data-recognition technology, applications for the processing of forms [for example cheques, tax forms] and for the automatic reading and processing of documents, including bulk invoice processing.
Scientific cooperationIn the earliest stage of product development Océ works together intensively with universities and other knowledge institutes. This close contact gives Océ continual access to new knowledge and, in return, the scientific world gains a first hand insight into the latest technological developments. In later stages of product development Océ works together with technology and systems specialists and with suppliers of printer technology and software.R&D assignments are also contracted out to public and private knowledge institutes such asTNO in the Netherlands, the Fraun-hofer-Gesellschaft in Germany and various universities throughout the world.
Strategic materialsStrategic materials are an important part of Océ’s proprietary technology. These materials relate to black and white and colour toners, organic photoconductors, Direct Imaging process drums and silicone materials for the CopyPress printing technique. In combination with the machines in which they are used and together with the attendantembeddedsoftware, these materials create unique properties which clearly distinguish Océ products from their competitors.
MachinesIn the development of new machines Océ applies a number of key values: productivity, quality, ease of use and reliability. These values are brought into balance with a competitive ‘total cost of ownership’ and a strong emphasis on durability. Océ develops and integrates embedded software, image processing programs and a network controller in all digital machines to ensure flexible support for a large number of printing media, formats and finishing possibilities [including those of third parties].
SoftwareIn the digital world software plays a crucial role. Software creates the link between the machine and its performances on the one hand and the user’s wishes and requirements on the other. By placing strong emphasis on automated printing workflows and output management, Océ has in recent years brought together an extensive collection of software applications and bundled them within a single integrated software architecture [PRISMA] that is tailored to meet the requirements of specific users. In the area of output management software Océ holds a leading position. The graphic design of all software products is based on a consistently applied design philosophy which shortens the learning curve for users and substantially reduces the risk of them making mistakes.
Océ focuses on two types of customers. One group of users deploys the equipment as a component – and as an expenditure item – in their own [production] process, known asprint-for-use. The factor that they regard as being most important is a far reaching reduction in the costs of printing and copying. Software is the key to achieving a simple, transparent workflow that boosts the available capacity and reduces costs.
51
Technology
For the other group printing is a core activity that has to generate maximum profit, known asprint-for-pay. For this category of customers Océ offers software that enables them to optimise the workflow and achieve a maximum high quality output with maximum efficiency. Océ’s software is of course fully attuned to working with Océ machines, but it can also function excellently in combination with third party hardware and software systems that have already been installed on the customer’s premises.
In 2005 OcéR&D developed a number of products that have considerably strengthened the range that the company has to offer.
InWFPS this related to the development of the OcéTCS500, [colour inkjet], the OcéTDS100 [a more sophisticated low volume copier], the OcéTDS450 [addition of a colour scanner] and the OcéTDS860 [high volume black and white printing system].
InDDS the high production Océ Varioprint series was extended, whilstR&D also developed the Multiple Functional Printer [MFP] and a much improved printing quality for the OcéCPS800 andCPS900 line. In the very high production segment the Océ 9000 line was further developed to include additional spot colour functionality.
The strategy ofR&D continues to be to design products that anticipate future customer requirements and to develop the technology that is best suited to meet these needs. At the same time research is conducted into technologies that may give rise to breakthrough concepts for use in the document process.
Over the past year theR&D efforts also increasingly shifted away from black and white and towards colour.
Manufacturing, logistics and purchasing
The greater proportion of the printers in the Océ range originate from the company’s own manufacturing facilities in Venlo, Poing [Germany] and Prague/Pardubice [Czech Republic]. However, by far the greater proportion of the components and modules incorporated in the machines that are assembled there have for many years been manufactured externally by a select group of suppliers. Since 2004 Océ machines and modules have also been produced in Asia by third parties on the basis of contract manufacturing. These are supplied direct from Asia to the Océ sales companies. The increasingly bigger input of suppliers and contract manufacturing partners in the production process is taking place in parallel with the company wide change process that has transformed Océ from a hardware supplier into a supplier of complete printing solutions. None the less manufacturing and final assembly still maintain their place within Océ: betweenR&D and the sales and service organisation, in a single coherent process. The good linkage and cooperation betweenR&D, manufacturing and service is essential for a smooth and efficient production start up, but also for the product improvements that are made over the course of time within each product family.
Manufacturing locationsOcé manufactures some of its machines and modules in Asia. The main reason for this is the lower level of wage costs, which enables a substantial reduction in the costs of assembly and components production. This considerably strengthens the company’s competitive position. For its production in Asia Océ uses contract manufacturers and the expertise and networks that they have to offer. The manufacturing and sourcing of a large proportion of required components also takes place in Asia. The quality is good and the cost price is substantially lower, despite higher logistics costs. To support and speed up the relocation activities an ‘Océ Asian Technology Center’ was set up in mid-2005. Expertise from Venlo is deployed to facilitate the transfer of know-how and experience to our contract manufacturers.
52
Technology
By the end of 2006 about half the current [Venlo] production value will originate from Asia. Ultimately the facilities in Venlo will only manufacture complex systems, machines that are produced in small series, and strategic materials.
The Océ factory in Prague specialises in theremanufacturingof Océ machines which have completed their first cycle of use. In this factory the machines are restored to as-new condition, provided with the latest functionality and software and put back on the market for a subsequent life cycle.
Demand for remanufactured machines and forfactory produced new models– machines to which extra functionality has been added – is high and the factory therefore operated to full capacity throughout the year.
The manufacturing of machines for Display Graphics was likewise concentrated in one location during the year under review. All production now takes place in Vancouver, Canada.
Strategic materialsDespite the growth in outsourcing, a number of components and materials that were developed by Océ in-house are still manufactured solely by Océ itself. These strategic materials, which include process drums, toner, photoconductors and silicone materials, are chiefly produced in Venlo. Furthermore, high speed ledbars are produced in Poing.
Constant improvements in the quality of these materials mainly result in an increase in the useful lifetime and thus reduce the costs of maintenance. Océ has achieved spectacular improvements in recent years in the area of organic photoconductors, which have brought a considerable extension of their useful lives.
Productivity in the manufacturing plants has also been increased further, through, as one example, the introduction of an integrated quality system.
The toner plant in Venlo, which came on stream in 2004 and whose products are principally destined for the high volume Océ VarioStream printers with colour functionality, met with expectations in full from the very start.
LogisticsIn recent years fundamental changes in the transport of machines, [service] components and supplies have brought a considerable reduction in logistics costs. There has also been a further improvement in delivery reliability and response speed. Océ now applies an integralsupply chain management systemfor the three continents. Deliveries to customers are made via a number of logistics centres which are managed from Venlo and Poing and which ensure an efficient supply of machines, spare parts and toners. Since Océ’s customers can compile their configuration from a broad range of models and options, the equipment that is supplied is often highly specific. By ensuring that all components are available in a logistics centre at all times, the systems can be configured and tailored to meet customer-specific requirements in locations that are close to the main sales areas. In this way delivery times are reduced and transport costs minimised. For Europe and the United States such a logistics system is already operational and during the year under review a centre was also set up in Singapore to handle the supply chain for the entire Asia/Pacific region.
PurchasingDuring the year under review substantial steps were taken towards the further development of purchasing policy, with an emphasis on achieving a good balance between innovative strength and costs. Following the relocation of large parts of machine manufacturing to Asia, the sourcing of materials and components again received much attention. An important aspect of purchasing policy is the creation of a network of small and big contract manufacturers who have to guarantee the flow of products from Asia. To support this process, an international purchasing office has been established in Singapore.
A major proportion, some € 650 million, of Océ’s purchasing value consists of non product-related costs. In order to reduce these costs also, a project was started at the end of 2004 in which the organisations in Venlo and Poing and the principal sales companies work together to achieve savings.
53
Critical success factors
Océ core values To promote a good internal business climate, the management of Océ has laid down seven core values that serve as a guideline for all employees. These core values represent, as it were, theDNA of the company; this is the genetic blueprint that distinguishes Océ and characterises Océ employees.
If viewed singly, these core values are not unique. But, when seen in their interrelated context they are identifiable and recognised as typically characteristic of Océ and its employees and are therefore also used internally in formulating profiles of competencies and as routes towards further self development.
In their day to day performance, both internally and externally, Océ employees are held accountable for compliance with these core values. In the periodic appraisals of employees and in formulating targets the core values play an important role, not only for each individual but also for business disciplines.
Human resources are keyA company’s success is dependent on numerous factors. Some of them, such as the quality of the markets, economic conditions or the business climate, are beyond the influence of the individuals who run the business. However, a number of success factors can certainly be influenced by the company and in this respect human resources are key. By developing effective selling skills or building a dynamic technology portfolio, for example, but also by creating a climate in which motivation, ethical behaviour, professionalism, customer-friendliness and innovative capabilities are able to flourish.
The people who work for Océ have always proved to be the decisive factor in the company’s growth and have responded appropriately when times were less favourable and it is therefore one of Océ’s principal aims to be an attractive employer. This is achieved in various ways. By offering a good remuneration package and a challenging work environment, but also by providing ample possibilities for training and education so that employees can work on their further self development. The increasingly prominent market position that Océ holds and its excellent track record in technology are guarantees that there are generally no problems in recruiting well educated and motivated personnel. In theR&D sector the high technological standard of the facilities in Poing and Venlo in particular is sufficient to ensure an adequate influx of new personnel from the scientific institutions located in the vicinity. On the basis of globally coordinated programs a workforce is formed that is optimally able to attain Océ’s objectives everywhere. This approach applies equally to the size of the workforce. The company’s continuity requires a well judged balance between revenues and the costs of revenues, and wage costs are by far the biggest cost item within the company. To ensure that this balance is maintained, it is necessary to implement a major cost reduction within a brief space of time, and one consequence of this will be the discontinuation of some 500 jobs in Europe and 250 jobs in the United States. For all those affected this is of course an extremely unpleasant measure, but it is unavoidable within the framework of the company’s continuity and, as such, is appropriate as part of a responsible conduct of the business.
| ||||||||
| Océ core values | Focus | Put the customer first Be result driven
| ||||||
| Attitude | Seek for quality at all times Be entrepreneurial Be innovative
| |||||||
| Style | Behave ethically Show respect for human values | |||||||
54
Critical success factors
Table 8
| Distribution of employees by geographical area | 2005 | 2004 | ||||||
| number | as % | number | as% | |||||
United States | 10,913 | 45 | 8,340 | 39 | ||||
The Netherlands | 3,947 | 16 | 3,922 | 18 | ||||
Germany | 2,912 | 12 | 3,028 | 14 | ||||
United Kingdom | 1,199 | 5 | 1,016 | 5 | ||||
France | 1,174 | 5 | 1,160 | 5 | ||||
Rest of Europe | 2,890 | 12 | 2,879 | 14 | ||||
Countries outside Europe and the United States | 1,129 | 5 | 970 | 5 | ||||
Total | 24,164 | 100 | 21,315 | 100 | ||||
Table 9
| Distribution of employees by type of function | 2005 | 2004 | ||||||
| number | as % | number | as% | |||||
Business Services | 6,806 | 28 | 6,693 | 31 | ||||
Sales | 5,356 | 22 | 4,192 | 20 | ||||
Service | 5,078 | 21 | 4,013 | 19 | ||||
Accounting and other | 2,666 | 11 | 2,037 | 9 | ||||
Manufacturing & Logistics | 2,453 | 10 | 2,512 | 12 | ||||
Research & Development | 1,805 | 8 | 1,868 | 9 | ||||
Total | 24,164 | 100 | 21,315 | 100 | ||||
55
Critical success factors
International human resources policy
Via its corporate human resources policy, which is applied throughout the world, Océ coordinates shared developments and programmes that are focused on optimising the deployment of its employees. Four major elements in this policy are formed by leadership, competencies management, core values and executive development.
LeadershipThe leadership programme is aimed at strengthening leadership qualities, at training new potential leaders and at analysing and optimising mutual relationships within management teams. The programme is based onleadership labs, intensive assessment programmes in which the existing and the desired status of a large number of leadership aspects is determined for each separate employee as well as for teams.
After top management set the ball rolling in 2004, all management teams in the sales companies and at head office have taken part in the leadership labs. On the basis of these leadership labs personal development plans have been individually agreed to achieve actual implementation of the improvement possibilities that were identified. The intention is that progress will be regularly monitored on the basis of a fixed protocol, which means that this programme will be given a permanent place within the corporate human resources policy. The progress of this global programme is constantly evaluated and where necessary, actions are initiated for improvement, coaching, training and development.
Competencies managementThe aim of the competencies management programme is to achieve a continual improvement in employee performances and to make dynamic adjustments to bring these performances into line with the demands made on employees by changed circumstances. The programme is based on identifying the specific roles needed for a particular working environment and the requirements that these set in terms of behaviour, professional skills and competencies. As part of the Solution Delivery Process competencies management had already been introduced several years ago in the sales, service and consultancy departments. In the meantime its use has become widespread within the organisation. In a competencies manual, which has been rolled out world-wide, the competencies and roles that are applicable to the various jobs have been clearly described and laid down. Development agreements are now being made throughout the company to ensure actual implementation of changes and improvements.
Executive developmentTo make sure that executive talent is given the opportunity of developing within the world-wide Océ organisation, the existing practice of international management development and succession planning was expanded during the year under review into a transparent programme for executive development.
The involvement of senior management has been considerably expanded by organisingExecutive Development Circuitsfor each target group [for example for each type of discipline such as commerce or technology] under the leadership of the Chairman of the Board of Executive Directors or, for the controlling circuit, under the leadership of the Chief Financial Officer.
56
Critical success factors
Océ and sustainable business practices
Since the company’s establishment more than 125 years ago doing business in a socially responsible manner has been firmly rooted in Océ’s philosophy and approach to all its stakeholders: customers, employees, investors, partners and the environment. Océ offers its customers solutions for efficient document management in the form of innovative products and services. For its employees Océ aims to be a business that they can be proud of: not just because of the innovative character of its products and services but also because of the company’s social and ethical core values and the way in which these are put into practice.
Everyone who invests in Océ can rely on transparent reporting. With regard to its suppliers and business partners Océ seeks to be a reliable and fair partner. Towards the outside world in general Océ is committed to acting as a responsible business and a good neighbour. Océ seeks to minimise environmental impact and respect human rights, not only in its own operations but also in the entire supply and manufacturing chain.
Each year Océ publishes its ambitions, objectives and policy and its concrete progress in the area of sustainable business development in the form of the Océ Sustainability Report. This report is issued mid way through the year and covers the entire Océ Group, including the operating companies in the major markets in which Océ is active. The report is drawn up in conformity with the recommendations of theGRI [Global Reporting Initiative].
Concrete objectives for the futureOcé does not limit its responsible business practices to the annual sustainablity report, but also aims to make them an integral part of its organisation. In the coming years concrete objectives will be formulated in the areas that are important to stakeholders, whilst not losing sight of the goals that are being sought in this area within our industry. It is only by ensuring that the ambitions in the area of sustainable business practices are able to converge with corporate strategy that the objectives of corporate social responsibility can be safeguarded in the future.
Toner Toner consists of microscopically small particles. Each one contains a pure colour which, once printed, contributes to the creation of thousands of new colours. Toner has to meet very high mechanical, chemical and physical requirements. Every particle has the right size, colour and transfer properties. Melting point and adhesion to different media never vary. Clarity is defined within the tightest of limits. In itself, each particle is a technical masterpiece.

57
Critical success factors
UN Global Compact Océ obviously subscribes to the principles set out in theUN Global Compact and proactively promotes compliance with these. In 2005 Océ extended the area of application of theUN Global Compact to its supply chain by asking suppliers and business partners also to subscribe to the principles of theUN Global Compact. By far the greater majority of them responded positively to this request. Océ is still holding consultations with the others.
Sustainable productsOcé seeks to develop products and services that are profitable and efficient for its customers. A precondition for this is a strong relationship with such customers and this has therefore been built up by Océ, supported by a professional service organisation. This enables customer-specific solutions to be offered as well as products that can be fully integrated in the customer’s document flow. Océ sells products which have a long useful lifetime and are safe and reliable. They also stand out because of their convenience in use and easy operation and this is also relevant for handicapped users.
EnvironmentThe key thrust of Océ’s environmental policy is to minimise the effects of its activities on the environment in all its aspects and throughout the entire supply chain. Our products are designed for several life cycles of use and the commercial and logistics processes are structured in such a way that as many machines as possible are returned toasset recoveryfor the recycling of components or to the remanufacturing plant, where they are fully or partially reconditioned and made suitable for reuse. The environmental impact is also reduced as a result of customers concentrating more volume on fewer machines. Océ also has excellent control over its flows of waste materials. Wherever possible, they are recycled and made suitable for further use.
Health and safetySickness absence continues to be low within Océ world-wide and there is only a negligible level of absence as a result of industrial accidents. Health policy has traditionally formed a strong point of attention for Océ, including cases where pressure of work leads to sickness absence. In most Océ businesses the working climate and the motivation of employees are explicitly measured.
TransparencyOcé seeks to provide its stakeholders with maximum transparency. For this purpose much time is devoted to the implementation of the Sarbanes-Oxley legislation and other corporate governance codes, toIFRS with regard to financial reporting and accountability and to theGRI recommendations on sustainability reporting.
Océ is proud of the fact that in 2005 the company was rated as one of the ten most transparent companies amongst the large cap and mid cap stocks listed on the Amsterdam stock exchange. Océ is also listed in the Dow Jones Sustainability Index in New York.
58
Critical success factors
Cooperation with partners is an integral part of the Océ business model. Reliable partners enable the company to continue to concentrate on its core capabilities and activities and thus keep at least equal pace with its, mostly bigger, competitors. Océ’s numerous partners make important contributions to the company’s success in various fields. Elsewhere in this report mention has already been made of theOEM partners from whom we source machines and of the financial institutions that work together with us in financing and leasing activities. A special position however, is occupied by the distribution partners – companies that safeguard the Océ brand name in all places in which the company does not have establishments of its own.
Important role for distribution partnersIn regions in which Océ does not have its own sales channels the company works intensively with independent local distributors. In by far the majority of cases these are energetic entrepreneurs whose knowledge of the local markets is second to none and who can position Océ’s offerings optimally in the market. There are large areas in the world in which Océ would not succeed in selling its products in so many niche markets and remote areas were it not for the help of distributors. In many cases their activities have proved crucial in building a presence, especially in emerging markets.
A different business modelOcé attaches great value to its business model in which the company’s own sales and service organisation guarantee direct management of – but at the same time direct feedback from – the market. In cases where Océ works together with distribution partners the business model is more complex but, given the other circumstances, this does not make it any less effective. Sales via distributors are managed from Venlo and Poing. This also means that the distributors can count on receiving considerable support from the Océ organisation in their activities. As they mostly also handle all maintenance work, they regularly visit the Océ training centre in Venlo to receive training and instructions about the machines that they sell.
Business developers, some of whom are stationed outside the Netherlands, are also available to develop and implement sales plans together with the distribution partners. The distributors are very enthusiastic about working together with Océ, one reason being that this gives them an extra competitive edge, but also because of the loyalty that stems from what is often a very lengthy business relationship. Océ’s distribution partners therefore rightly regard themselves as forming part of the organisation.
Océ can be found everywhereOcé books the greater part of its sales in Europe and the United States, though the level of sales in Asia is growing. However, Océ machines can be found in all corners of the globe. This means that large areas are served by distributors. Often the orders involved are of modest size but, partly because of the continuous flow of media, toners and other strategic materials, direct exports account for a significant proportion of Océ’s total revenues.
Océ is a well-known brand in numerous places in Latin America, Africa, the Middle East, Central and Eastern Europe, Russia, China and India. And, even in remote areas, the brand name is all the more successful if each distributor is able to introduce and service Océ machines in a way that fits in with the local culture. This applies in particular to wide format equipment, but to an increasing extent to small format as well. In some regions the language [of the machine and the interfaces] presents a problem but good progress is being made with translations, chiefly into Japanese and, during the year under review, into Russian.
59
Management aspects
Structure, policy and complianceOcéN.V. is an international holding company within the meaning of Article 153, para. 3b, of Book 2 of the Dutch Civil Code. This implies that shareholder rights are not restricted by the rules that are applicable in the Netherlands to companies subject to what is known as the ‘structure regime’.
Corporate governance within Océ is based on the legislation, jurisdiction and codes of best practices in the countries in which the company performs its activities.
As from 2004 this regards also the implementation of the Sarbanes-Oxley Act.
Implementation of this Act is based on regulations issued by theSEC and on adaptations to the corporate governance code that is applicable to companies listed on American stock exchanges. Compliance with these regulations is influenced by the fact that they were drawn up primarily for American companies within the United States jurisdiction and because they have a rule based character.
In the Netherlands the Dutch corporate governance code, Code Tabaksblat, [‘the Dutch Code’], consisting of 21 principles and 113 best practice provisions, has been applicable since December 2003. This code was given legal status with effect from January 1, 2005. Océ has included the relevant paragraph and indicating the way in which it applies to the Dutch code in its annual report as from the 2003 financial year.
The Board of Executive Directors and the Supervisory Board of Océ subscribe to the basic principle that was applied when drawing up the Dutch Code: a company is a long term form of collaboration between the various parties involved. These parties, the stakeholders, are the groups and individuals that directly or indirectly influence [or are influenced by] the achievement of the company’s objectives and they include employees, shareholders and other providers of capital, suppliers and customers, but also government and civil society.
The Board of Executive Directors and the Supervisory Board have overall accountability for achieving the right balance between these interests, to ensure the continuity of the company.
In December 2004 the Dutch government set up a monitoring committee to promote the topicality and practical application of the Dutch corporate governance code and to monitor how it was being implemented and complied with. One year later, in December 2005, the committee issued its first report on compliance. It is gratifying to note that the committee was able to present a predominantly positive picture of compliance and that the Dutch Code has become an effective framework for good corporate governance.
The monitoring committee’s report formed an important benchmark for the preparation of this corporate governance report.
60
Management aspects
Compliance with and enforcement of the Dutch CodeEach year Océ explains the main outlines of its corporate governance structure in the annual report; if there are any substantial changes in this structure, they will be submitted to the General Meeting of Shareholders for discussion.
More information about corporate governance and the related rules and regulations can be found on the Océ website [www.investor.oce.com] under the heading Corporate Governance. As regards the principles and best practice provisions of the Dutch Code that refer to the Board of Executive Directors and the Supervisory Board, Océ has either established that these were already being applied, or has taken steps to adopt them to the extent that they are applicable to Océ, whilst taking into account existing and future legislation.
Last year mention was made of a departure from best practice provisionIV.3.1 on presentations via websites and webcasting. As from the beginning of the 2005 financial year all quarterly presentations and telephone conferences relating to the financial results are announced in advance and are made simultaneously accessible in real time to all shareholders via webcasting. The announcement and the webcasting are available on the Océ website. This manner of disclosure of information to shareholders complies with best practice provisionIV.3.1.
Toner Transfer Fusing A super-sensitive belt forms the heart of the CopyPress printing system that was developed by Océ. In combination with a monocomponent toner a crystal clear image is transferred to the print medium by applying pressure and a little heat. The difference between the result of printing and offset printing is then only small. The similarity lies in the quality of the print. Time after time after time. No dust, little heat, no ozone, little static electricity.
That is Océ CopyPress.
61
Management aspects
Transactions involving a conflict of interests
During the financial year no transactions as referred to in best practice provisionsII.3.4,III.6.3 andIII.6.4 took place involving a conflict of interests relating to directors, supervisory directors or natural and/or legal persons holding at least 10% of the shares in the company.
Though there are still a number of best practice provisions that Océ does not apply directly, Océ is willing to comply with the Dutch Code which allows the possibility of doing this within the framework of the ‘apply or explain’ method. When the monitoring committee notes that it is not possible merely to apply a ‘box ticking’ method in order to check compliance with the Dutch corporate governance regime, we realise that the leeway allowed for applying the code in our own specific way requires us to proceed with the greatest possible care.
In complying with best practice provisionII.1.4 concerning the declaration by the management that the internal risk management and control systems are adequate and effective, we have followed the recommendations made by the monitoring committee.
This declaration can be found at the end of this report, following the description of the systems for risk identification and control.
In our opinion Océ complies in full with the Dutch Code, with the exception of the following aspects.
As regards compliance with the best practice provisionsII.1.1 appointment period executive directors,II.2.7 on severance pay for executive directors,III.3.4 maximum number of board memberships,Iv.1.1 on limiting the right to make binding nominations andIv.1.2 andIv.2.1 toIv.2.8 [issue of depositary receipts for financing preference shares] explanations are given under the relevant headings on the pages 62, 63, 64, 66 and 67.
Board of Executive Directors
The Board of Executive Directors currently consists of three members who are appointed by the General Meeting of Shareholders. In the case of each appointment the holders of the priority shares have the right to draw up a binding nomination, which can be cancelled by a resolution of the General Meeting of Shareholders that has been adopted by a majority of at least two thirds of the votes cast, provided that such votes represent at least one half of the issued share capital. If no binding nomination has been drawn up, the General Meeting is free in its choice. The Supervisory Board appoints the chairman of the Board of Executive Directors and decides on the allocation of the tasks of the Executive Board members in consultation with the Board of Executive Directors. Regardless of the allocation of tasks the Board of Executive Directors acts as a body with collective responsibility.
Appointment period executive directorsIn view of the contractual arrangements that have been agreed with the executive directors currently in office, Océ does not comply with best practice provisionII.1.1. Océ will respect the existing contractual situation. Yearly the functioning of current and future members of the Board of Executive Directors will be reviewed.
Remuneration of the Board of Executive DirectorsThe Supervisory Board fixes the remuneration of the members of the Board of Executive Directors on the basis of the advice of the Remuneration Committee.
The remuneration policy is aimed at attracting and retaining the best executives needed to manage a publicly listed company that operates on an international scale in the area of technological activities.
This policy was discussed at the Annual General Meeting of Shareholders held on March 2, 2004 and at the Extraordinary General Meeting held on September 8, 2004. Shareholders approved this policy, including the Share plan.
As remuneration experts, Hay Associates were commissioned to conduct a market comparison of the existing package of employment conditions, the basic principle being a remuneration which, on balance, corresponds to the median level in a reference group of Dutch
62
Management aspects
companies. In the case of Océ this is known as reference groupA. Recently Hay Associates indicated that they were changing over to a system of company categories based on levels of functional responsibilities. When establishing the salaries for 2005 and 2006, the Remuneration Committee still applied the classification based on company categories.
The remuneration package is made up of the following components: base salary, variable pay [i.e. short and long term bonus] and pension scheme. For Dutch members of the Board of Executive Directors the Dutch labour market is taken as a basis and for non-Dutch members the market conditions of the relevant country. The company considers variable pay to be a substantial part of the total package. The performance criteria to which short term and long term bonus are linked, are focused on value creation and on increasing shareholder value over the short and longer term respectively.
The remuneration package of the members of the Board of Executive Directors is structured as follows:
| • | Base salary |
The level is at the median of the above mentioned reference group of comparable companies.
| • | Variable pay |
Short term bonusWith effect from 2005 the bonus scheme has been linked solely to financial performance criteria, i.e. net income andROA. The maximum level of the bonus that can be earned has been fixed at 50% of base salary. The extent to which the set targets have been achieved is partly determined on the basis of the annual financial statements as verified by the external auditor.
Long term bonusWith effect from 2005 the annual Stock Option Plan has been replaced by a Share Plan that is linked to performance criteria. These are focused in full on creating shareholder value, i.e. share price gains plus dividend. Each year a three year cycle will start, whilst performances will be measured at the end of each period by comparison with the following peer group of European technology companies that have a comparable business model: Agfa, Akzo Nobel,ASML,ASMI,DSM, Heidelberger Druck, Infineon, Philips and Stork. The position that Océ occupies in the peer group will in each case determine the number of shares awarded.
The shares awarded at the end of a three year cycle are required to be retained for a further period of at least two years, which means that the total period from the moment of grant until the time when the shares become freely available to the Executive Directors complies with the five year criterion set in best practice provisionII .2.3.
For an overview of the individual remuneration of the members of the Board of Executive Directors see page 92 of the annual report. As at the end of the 2005 financial year the members of the Board of Executive Directors held no ordinary shares in Océ and, apart from the options they would be eligible to receive under the Stock Option Plan and conditionally granted shares under the Share Plan, no rights to options listed on the Euronext Options Exchange.
Pension schemeWith effect from January 1, 2003 the pension scheme for the Dutch members of the Board of Executive Directors, which was based on a defined benefit system, was modified. It was replaced by a combination of a defined benefit system, which offers a maximum pension salary of € 243,938 and a defined contribution system for the salary in excess of that amount, which means that the company no longer has any back service liabilities. For non-Dutch members of the Board of Executive Directors the pension system of the relevant country will be applicable.
An overview of the accrued pension entitlements and the related financing costs is shown on page 92.
For members of the Board of Executive Directors the contractual retirement age is 62 years and for the chairman 60 years.
63
Management aspects
Severance payAs regards payments in the event of involuntary dismissal the policy that Océ has applied to date is to pay an amount of compensation that is reasonable on the grounds of the contractual situation, social developments and jurisprudence. For such time as no change takes place in the statutory regulation of the employment conditions for executive directors Océ also intends to continue applying this policy in future. This means a departure from best practice provisionII.2.7.
Supervisory Board
The Board of Supervisory Directors currently comprises six members who are appointed in the same way as the members of the Board of Executive Directors. The Supervisory Board supervises the policy of the Board of Executive Directors and the course of business in the company and the activities relating thereto. The Supervisory Board is supplied in good time by the Board of Executive Directors with all the information that it requires for the performance of its task.
The Supervisory Directors appoint one of their members as chairman.
Best practice provisionIII.3.4has not been complied with as regards one supervisory director. He holds four supervisory directorships with Dutch publicly listed companies, two of which are as chairman of the Supervisory Board.
Profile of the Supervisory BoardIn consultation with the Board of Executive Directors, the Supervisory Board has drawn up the following profile for its own composition:
The Board consists of at least three and at most eight members. The members should operate independently of and critically with regard to each other, based on a good relationship of mutual trust. They should be experienced in the management of an international, publicly listed company and the members should have sufficient time available to fulfil the function of Supervisory Director. In order to ensure continuity a spread in ages is aimed at.
Endeavours are made to ensure a broad representation of know-how and experience in one or more of the disciplines or areas that are relevant to Océ. In particular, these are:R&D, the production of advanced machines and materials, international marketing of high value products and services, the environment, finance, government policy, human resources and social policy.
This outline profile is periodically evaluated and adapted where necessary. In doing so, the factors that are taken into account include developments in the nature and the size of the company and its business activities, the degree of internationalisation, and the extent of the specific risks over the medium and long term.
Supervisory Board committeesIn practice the following committees operate at Océ:
Selection and Nomination CommitteeThis selects and nominates candidates for appointment as a member of the Board of Executive Directors and as members of the Supervisory Board. At periodic intervals this committee also assesses the functioning of individual supervisory directors and executive directors.
This committee consists of Mr. J.L. Brentjens, chairman, Mr. F.J. de Wit and Mr. J.V.H. Pennings and, as an advisory member, the chairman of the Board of Executive Directors supported by the director Corporate Personnel & Organisation.
Remuneration CommitteeThis committee advises the Supervisory Board on matters relating to the remuneration of the members of the Board of Executive Directors, draws up the remuneration report as referred to in best practice provisionII.2.9 of the Dutch Code and monitors and evaluates the remuneration policy for the Océ Group. It consists of Mr. F.J. de Wit, chairman, Mr. J.L. Brentjens and Mr. J.V.H. Pennings. It is supported and assisted in its work by the chairman of the Board of Executive Directors and by the director Corporate Personnel & Organisation. Decisions on the level of remuneration, including the Océ Share Plan and the granting of shares, fall within the competencies of the entire Board of Supervisory Directors.
64
Management aspects
Audit CommitteeThis committee has a supervisory task as regards monitoring the integrity of the company’s financial reporting and as regards risk management. The committee was formally established in October 2002 and has its own charter which complies with the requirements set by both the Dutch Code and the Sarbanes-Oxley Act in theUSA. The members of this committee are Mr. M. Arentsen, chairman and financial specialist, Mr. P. Bouw and Mr. F.J. de Wit.
The role and powers of these committees are further defined in regulations for these committees which have been posted on the Océ website.
Remuneration of the Supervisory BoardIn 1998 the General Meeting of Shareholders fixed the remuneration of the Supervisory Board at € 40,840 for its chairman and € 27,227 for its members.
The remuneration for any financial year is automatically increased if the DutchCBS Price Index figure for household consumption in September of the preceding year is at least 10% higher than the index figure that was last used as a criterion. This increase corresponds to the percentage increase in the most recently published index figure.
In 2005 the remuneration amounted to € 46,355 for the chairman and € 30,903 for the members.
For the 2005 financial year the total remuneration of the present and former members of the Supervisory Board amounted to € 221,145 [2004: € 222,281]. As at the end of the financial year the members of the Supervisory Board held 2,969 ordinary Océ shares [2004: 2,969] and held no rights arising from options listed on the Euronext Options Exchange.
Fingerprint In many corporate environments document security is crucial. Identity cards and codes are commonplace in present day security systems. Users have learnt to accept the drawbacks: forgotten cards, codes out of date. Delay! But nothing can compete with the fingerprint. Inalienable, impossible to copy and, when used as an extra security measure, the key to a watertight security system.
65
Management aspects
General Meeting of Shareholders
A General Meeting of Shareholders is held each year.
Other meetings of shareholders may be held at the request of the Board of Executive Directors, the chairman of the Supervisory Board or two Supervisory Directors.
Shareholders who represent at least 10% of the company’s issued capital may also convene a meeting.
The agenda for the meeting is drawn up by the party that convenes the meeting. Shareholders who individually or jointly represent 1% or a value of € 50 million of the issued capital may submit proposals up to thirty days prior to the meeting. All shares carry a voting right pro rata to their nominal value.
Resolutions are adopted by an absolute majority of votes, except in those cases where a qualified majority is prescribed by law or in the company’s Articles of Association.
Capital and sharesThe company’s authorised capital consists of ordinary shares, priority shares and preference shares. For details of the composition of the authorised capital and an explanation of the various classes of shares in issue, see page 121 of this annual report.
In best practice provisionIV.1.1it is proposed that the right of the priority shareholder to draw up a binding nomination for the appointment of executive directors and supervisory directors should be limited. Océ provisionally wishes to maintain the current situation.
The right to draw up a binding nomination forms an important element in the Corporate Governance of Océ as this has existed for almost 47 years since the transition from a closed family business to an open, publicly listed company. This construction has enabled Océ to grow to become the technology company it is today. This development was not disrupted by hostile actions, i.e. actions on which no agreement has been reached with the Board of Executive Directors and the Supervisory Board. When considering whether application of a best practice provision is in the interests of the company, the consequences that this might have for the specific business climate of Océ should also be taken into account.
Océ can only operate optimally in a market in which a level playing field exists between the stakeholders. The stakeholders come from various jurisdictions, such as the European Union, where the absence of a level playing field in the area of anti-takeover measures became clear during the discussions on the introduction of the 13th Directive. In addition, they come from the United States, Central Europe and the Far East. Companies from these countries, too, generally have effective means of protecting themselves against hostile bids.
In order to continue operating in this market, Océ wants to maintain its protective structure, which was built up carefully in the past and with the approval of shareholders, so that the interests of all stakeholders can be scrupulously kept in balance. In December 2005 a draft bill was submitted to the Dutch parliament to bring legislation into line with the 13th Directive on public takeover bids.
66
Management aspects
This draft bill contains more detailed provisions on the use of anti-takeover measures.
Pending the definitive regulations, which are expected shortly, we do not propose at the moment to make any changes in the existing protective measures.
Unlisted depositary receipts for financing preference shares form part of Océ’s capital. Upon the introduction of these shares careful attention was paid to the matter of the dilution of voting rights as compared to those of ordinary shares. In connection with this it was decided at the time to opt for the issue of depositary receipts [certification] and to structure the composition of the board of the Trust Office in such a way that one director is appointed by the meeting of the holders of depositary receipts, one by the Board of Executive Directors of the company, and three by the General Meeting of Shareholders.
The issue of financing preference shares is limited to a maximum of 20% of the issued share capital, which means that the construction does not operate as a protective measure, but that it does comply with principleIV.2of the Dutch Code which states that the certification of shares is a means of preventing a [chance] minority of shareholders from bringing too much influence to bear on the decision making due to absenteeism at the General Meeting of Shareholders.
This tailor-made construction was introduced at the time with the approval of the shareholders’ meeting and was in line with the corporate governance recommendations that were applicable until 2004. Consultation has been held with the holders of depositary receipts for these financing preference shares and also with the Trust Office on the application of best practice provisionsIV.1.2[voting right on the basis of fair capital contribution] andIV.2.1toIV.2.8[composition of the Trust Office and the granting of voting proxies to holders of depositary receipts]. This consultation resulted in approval for maintaining the existing arrangements.
Another aspect that plays a role in the case of the financing preference shares is the introduction ofIFRS, as a result of which the capital contribution made via these shares is classed as borrowings. This is at odds with the legal status of share capital and with its related risk profile. Talks were initiated last year with the holders of depositary receipts to find an acceptable solution for this problem and this subject is expected to be put on the agenda for the shareholders’ meeting on April 20, 2006. More detailed written explanatory comments will then be published in the agenda for that meeting.
Record dateSince December 1999 legislation in the Netherlands has permitted the use of a record date, which has considerably reduced the period during which shareholders do not have their shares at their disposal because they have to be placed in deposit.
The Board of Executive Directors has been granted authorisation under the Articles of Association to determine a record date on the basis of which shareholders are entitled to attend the General Meeting of Shareholders. The Board of Executive Directors set a record date for the shareholders’ meeting held in 2005 and the Board intends to continue this practice in future.
67
Management aspects
Dividend policyThe dividend policy applied by Océ – as approved by the General Meeting of Shareholders on March 2, 2004 – implies that one third of the net income attributable to holders of ordinary shares is paid out to this category of shareholders.
This policy is based on a situation in which there was a strong growth in working capital [increase in the lease portfolio] in the second half of the 1990s and the beginning of the present century.
Although the investment in lease receivables contributed to the growth in net income, the funds required for this investment had to be financed from net income in order to maintain healthy balance sheet ratios. For this reason the use of net income for dividend payments was very much limited.
Developments within Océ in recent years make it necessary to review thepractical implementationof the dividend policy in view of the fact that most of the existing and new leases have been placed with external parties over the past three years. This has resulted in a strong positive free cash flow and thus in a substantial strengthening of the balance sheet ratios.
In proposing a new dividend policy the underlying principle applied by Océ will remain unchanged, namely reliability and consistency in the dividend that is distributed to holders of ordinary shares. A precondition for this is the maintenance of healthy balance sheet ratios which means to us maintaining an [implicit]investment grade rating.
Océ’s objective, within the framework of the above precondition, is to seek to distribute to holders of ordinary shares a constant, but preferably steadily growing dividend, in line with the development in income. The income and/or free cash flow must be more than sufficient to enable the achievement of this objective.
In practice more than one third of the net income attributable to holders of ordinary shares was distributed in the form of dividend in recent years. Now that the proceeds from the sale of the lease portfolio have been productively invested by acquiring Imagistics, an amended dividend policy will be worked out in further detail on the basis of the considerations set out above.
Issuing policyEach year the General Meeting of Shareholders has given its authorisation for the issue of shares and for the limiting or preclusion of the related statutory pre-emptive right.
On April 15, 2005 the General Meeting of Shareholders designated the Board of Executive Directors for a period of eighteen months as the body authorised as from the date of that meeting to resolve on the further issue and the granting of rights to subscribe to ordinary shares and financing preference shares up to a maximum of 10% of the entire share capital outstanding as at April 15, 2005, which percentage will be increased to 20% in the event of mergers or acquisitions, subject to the restriction that, following such issue, the total number of financing preference shares does not exceed 20% of the entire issued capital after such issue.
Investor Relations [IR] policy and communication with shareholdersOcé pursues an activeIR policy aimed at providing shareholders and other financial stakeholders with regular and extensive information about developments within the company. TheCEO and theCFO have primary responsibility for relations with shareholders, other providers of capital, their intermediaries and financial journalists. For more detailed information about Océ’sIR policy see page 129 of the annual report.
68
Management aspects
Océ’s market position and the related risks are determined by the following factors:
Quality of the product portfolio and the ‘pipeline’ of products expected in the years aheadThese are dependent to a large extent on the results of theR&D activities and the successful interaction betweenR&D and the Strategic Business Units. For products that are not developed or manufactured by the company itself good commercial relationships withOEM partners are of great importance.
In recent years Océ’s introductions of new products and services have been very successful and this has clearly been reflected in the development of non-recurring revenues. As regards the ‘product pipeline’: this is regularly discussed in detail with those concerned at the meetings of the Board of Executive Directors.
Competitive product portfolioIn addition to having high quality products it is essential that these can be put on the market at a competitive price. This means that the ‘total cost of ownership’ [TCO] must be attractive. Besides ongoing measures to reduce service requirements and costs, minimising the cost price of the products is therefore of crucial importance.
For this reason Océ has transferred some of its Venlo-based manufacturing operations to Central Europe and Asia. At the end of 2005 20% of the manufactured value originated from those regions; at the end of 2006 this will be 50%.
Distributive strength in the countries in which Océ operatesOcé has placed emphasis on boosting its distributive strength in recent years. This involves both a qualitative and a quantitative strengthening of our sales force. The acquisition of Imagistics has given a significant positive impetus to an increase in distributive strength in theDDS Strategic Business Unit, especially in the United States.
User interface Much has changed in the way machines are operated. Buttons have been replaced by operating consoles but that change is only the tip of the iceberg. Today, the person operating an Océ machine uses intelligent software that not only indicates the current status and options but also assists in sorting and planning the queued print jobs. In its most highly advanced form an operating console is the key to boosting productivity and efficiency in even the biggest centralised printing environment.

69
Management aspects
Operational efficiencyIt is very important that operations are conducted with optimum efficiency which implies that costs need to be kept under control. In 2005 a restructuring of the activities in Europe was initiated which will result in the discontinuation of around 500 jobs. In the United States, too, measures have been taken to increase profitability. In part, these run in parallel with the integration of Imagistics. Specific actions have also been started to optimise activities in the area ofICT, the purchase of non-production items and logistics systems. Besides efficiency and cost reduction measures, the sale of the lease portfolio and the management of working capital require constant attention. These measures are an integral part of the efforts to achieve ‘operational excellence’.
Océ takes the view that in all these areas progress has been achieved in recent years as a result of the company’s policy of active risk management. For an explanation of the system of internal control see page 77. The measures that have been taken have also had a positive influence on Océ’s market position.
Risk identification and management
Financial risks
FinancingAs a result of the acquisition of Imagistics, at the end of October 2005, net interest-bearing debt amounted to € 754 million at the end of 2005. As the funds that were released from the sale of the lease portfolio were used to pay off outstanding debt, the acquisition was financed by bridging loans; the definitive financing arrangements will be finalised during the coming months.
It is very important that the cash flow before financing activities [free cash flow] will be maximised.
This means not only optimisation of operations but also the full realisation of the synergies expected to result from the Imagistics acquisition. Achieving this is a top priority.
The free cash flow will be maximised via a good development of income and careful management of working capital. The motto for Océ is: ‘cash is crucial’, and as from 2006 this has been explicitly included in the targets of all operating units.
The emphasis on a healthy cash flow, and thus on the development of all its components, has the full attention of Océ management.
Foreign exchange and interest risksOcé achieves about one third of its revenues [following the acquisition of Imagistics] within the Euro-zone and two thirds outside it. Competing suppliers of relevance for Océ are mainly based in the United States and Japan. The prices that Océ charges its customers for products and services are denominated in the customers’ local currency and as many of the related costs as possible are also incurred in that currency. Since manufacture and development of new products mainly takes place in the Euro-zone, a foreign exchange risk arises in respect of the flows of goods from the Euro-zone to countries outside it. The relocation of part of the manufacturing activities to the Far East will reduce the net level of the foreign exchange exposure since these goods will be paid for inUS dollars.
At Océ, net cash flows in currencies other than euro, which are known as transaction exposures, are the subject of an active foreign exchange management policy which is implemented in close consultation with the Board of Executive Directors.
70
Management aspects
For many years the company has consistently applied a policy of managing the twelve months position of theUS dollar and the pound sterling on a roll over basis, with hedging being applied up to a maximum of 80% of the net transaction exposure. At the balance sheet date the contract value of forward foreign exchange contracts was € 237 million. The policy that is pursued therefore provides cover for the transaction risk over the coming 12 months. However, if the euro remains strong for a prolonged period, this will have a negative effect on Océ’s results in view of the limitation of the period during which hedging takes place.
Currency translation exposures are not hedged, neither for local income nor for equity positions outside the Euro-zone. This risk is regarded as an inherent part of doing business as a multinational company. In view of the increase in the United States operations, the equity position inUS dollars will also increase in future and therefore bring an increased risk of translation exposures.
Interest risks relate to the possible mismatch in exposures to fixed interest rates. Fixed interest revenues are generated by lease and rental contracts, whilst fixed interest charges arise from the financing of these contracts. The extent to which this risk is hedged depends upon the risk profile decided upon. Océ hedges these fixed interest revenues for at least 60% via fixed interest loans.
Because of the outsourcing of the lease activities the interest rate risk [mismatch in fixed interest exposures] has been significantly reduced. As regards the facilities that are not used for financing leases a careful choice is made between fixed and variable interest on the basis of interest rate expectations and developments. In such cases risk-averse action always has top priority.
International Financial Reporting Standards [IFRS]
For financial years commencing on or after January 1, 2005 all European publicly listed companies have to report on the basis of International Financial Reporting Standards [IFRS]. Océ will therefore draw up its quarterly reports and its annual financial statements on the basis ofIFRS as from the 2006 financial year.
On October 31, 2005 Océ published details of the provisional pro forma effects of the conversion from Dutch accounting principles [DutchGAAP] toIFRS. This relates to the financial information as from December 1, 2004 [theIFRS transition date applicable for Océ] and for the three subsequent quarters of the 2005 financial year ending on August 31, 2005.
TheIFRS accounting standards for financial instruments will be applied for the first time as from December 1, 2005. This has consequences in particular for the financing preference shares and the minority interest item. Under DutchGAAP these are classified as equity capital, and underIFRS as debt. Océ is currently holding negotiations about a change in the conditions attaching to these financial instruments and this may lead to them being classified as equity. Up to and including the third quarter of the 2005 financial year net income underIFRS is € 0.1 million higher than under DutchGAAP.
Future results underIFRS may become more volatile due to value changes in assets and liabilities which will be included at fair value and because of the change over from systematic amortisation of capitalised goodwill [supplemented by impairment testing] to a system involving solely impairment testing.
Group equity on the basis ofIFRS was reduced on December 1, 2004 by € 69 million as a result of a change in the valuation of pension obligations [€ 65 million] and option plans [€ 4 million].
In March 2006, for the purposes of comparison, Océ will announce theIFRS-based pro forma financial information for the full 2005 financial year [ending on November 30, 2005]. This will also include the application of theIFRS standards for financial instruments with effect from December 1, 2005.
71
Management aspects
Market risks
Importance of revenues growthThe Océ business model is founded on a direct sales and service organisation operating in tandem with strongR&D activities. Thanks to continual coordination and interaction between these two activities, customer developments and customer requirements can be promptly and effectively converted into actions for both the short and the long term. This results in optimum interaction with the customer and creates stronger customer loyalty. This combination is an important element of Océ’s strategic strength. However, this business model also means that fixed costs and overheads – especially personnel costs – are relatively high.
Operational efficiency and, of course, frequent cost control measures are needed in order to limit the growth in fixed costs and various examples of this are discussed in this annual report. It is important that the growth in the income contribution arising from the sales of goods and services has to be bigger than the increase in [fixed] costs. This will be achieved by means of profitable revenues growth. The acquisition of Imagistics will make a substantial contribution to this growth and to higher results for the Group.
Apart from growth through acquisitions, organic growth is also important. The annual report for 2004 dealt in detail with the concepts of ‘non-recurring’ revenues and ‘recurring’ revenues and the relationship between the two, in which recurring revenues [from services, materials, rentals, interest and business services] follow on after some time from non-recurring revenues [sales of machines, software and professional services].
The change in this relationship withinDDS was also analysed. It was stated that the renewed product portfolio inDDS and the anticipated growth in sales of printing systems were expected to lead to a growth in the population of digital machines and in printing volumes. As a consequence it was expected that the trend in recurring revenues [and therefore organic growth] would be turned around in a positive direction in 2005 and this is exactly what happened.
Excluding lease effects and the acquisition of Imagistics, total non-recurring revenues increased on an organic basis by 10.5% [2004: 7.0%], whilst recurring revenues decreased by 1.1% [2004: –2.7%]. In the fourth quarter recurring revenues increased by 1.4%. For 2006 the recovery in recurring revenues will continue. We expect that, besides growth through acquisition, 2006 will bring the positive organic growth in revenues that is needed to achieve our financial objectives.
Acquisition and integration of Imagistics
The acquisition of Imagistics offers a unique opportunity for a substantial boosting of our distributive strength [sales and service], particularly in the corporate segment in the United States. Océ and Imagistics are a perfect fit and the combination offers prospects of considerable cost and sales synergies. It is essential, however, that the integration is implemented quickly and effectively so that the potential synergy effects can be realised over the short term. Achieving these synergies is of great importance, partly because the acquisition has given rise to higher interest costs [2006: approximatelyUS dollar 40 million] and also because of the substantial considerations paid for goodwill and intangible assets. Amortisation of the latter type of assets will amount to aroundUS dollar 20 million in 2006. A risk will arise if the integration process is delayed.
As a result of the acquisition, the market risk of Océ has been increased due to its greater exposure in the office market, the most competitive market segment. As against this risk, however, there are the synergy benefits of the combination which amply outweigh the increased risk.
The integration of Imagistics is proceeding according to plan and there is no reason to assume that the synergies will not be realised.
72
Management aspects
Océ’s sizeWith annual net revenues [after the acquisition of Imagistics] of more than € 3 billion, Océ is a relatively small player in the sectors in which the company is active. Given these circumstances, acquiring and maintaining a profitable position depends entirely on the company’s ability to build up a loyal circle of customers on the basis of quality, reliability and total cost of ownership. Océ succeeds in this by focusing strongly on professional market segments in which productivity, print quality and user friendliness are of primary importance. Océ maintains its position by explicitly aiming to be one of the top-three companies in specific niches, and for around 40% of its sales Océ has already achieved such a position.
This implies a constant interaction betweenR&D and sales and services so as to respond to the current and future wishes of customers and to translate these into competitive products. Another important aspect is the ability to make an accurate estimate of developments in competitor companies.
Lastly, it is very important to work together with reliable and long term partners. Partners supply modules and components that comply with Océ’s exact specifications while Océ itself concentrates on the manufacture of strategic components. Partners are also important for the outsourcing of manufacturing. In 2006 some 50% of the production value of the factories in Venlo will have been outsourced.
Although a risk is involved in having a relatively limited size as compared to competitors, Océ is able to maintain and expand its position because of the strategic actions described above and because of the business model it has chosen.
Productivity Printing highly detailed drawings accurately on big surfaces is a technical tour de force. Doing the same in colour is top class technology. At breakneck speed the cartridges spray their fine mist onto paper with micron level clarity. Not fast enough, said Océ’s technicians, knowing that what customers want is productivity. The OcéTCS400 andTCS500 bring the answer: dual cartridges, working together accurately in tandem to produce a double performance in one pass. A seemingly simple solution, but one whose excellence is proved by the many patents taken out for it.
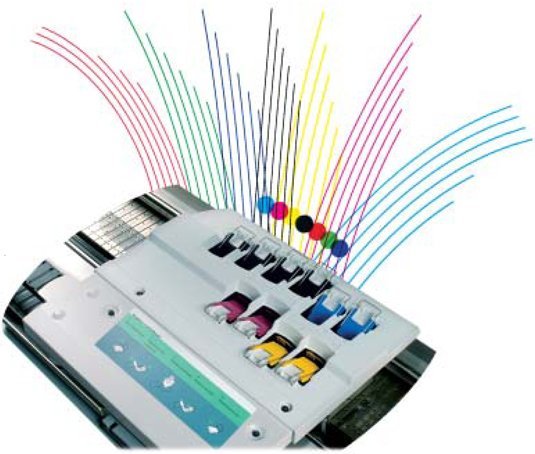
73
Management aspects
LeasingSince 2003 Océ has been busy selling or outsourcing its extensive lease portfolio. Outsourcing has been implemented by placing new lease contracts with third parties and by selling the existing portfolio on a non recourse basis. In the United States this is taking place via a captive lease company, Océ Financial Services, Inc., which handles the administrative work and the collection of accounts receivable on behalf of thefunding partners.In Europe and the rest of the world Océ works together with vendor lease partners via a private label concept in which the vendor lease company takes over all the related activities. Leasing and financing continue to form an integral part of Océ’s product offerings.
It has always been Océ’s intention to invest the proceeds from the sale of the leasing activities in profitable core activities. The acquisition of Imagistics meets the requirements set in this respect.
Compared with the stable revenues from leases, however, volatility has now increased and the return achieved on the acquisition will therefore have to be considerably higher than that on the leasing activities. Following the transfer of the lease portfolio the related debtors risk will no longer exist.
Technology
Research & Development [R&D] is one of the critical success factors for the company. Each year Océ spends some 7 to 8% of its revenues on the costs ofR&D [2005: €193 million]. As a result of the revenues increase brought to Océ by the acquisition of Imagistics, a relative decrease will take place in the costs that are allocated toR&D if the budget remains unchanged. In absolute terms the level ofR&D costs is significantly lower than that of Océ’s main competitors.
It is important that Océ’sR&D activities are focused on products in strategic markets and that the resources invested inR&D are used extremely effectively. Effective alliances with third parties are also of importance.
The Océ product range consists of printers, scanners and software for black and white and colour and for small and wide formats. The machines are also used in various configurations as copying equipment.
In terms of technology the market for black and white printers is highly developed, which means that product development focuses on aspects such as total cost of ownership, operational reliability, environmental friendliness, ease of use and productivity. These are the areas in which Océ can strengthen its competitive position. For the future the rapidly increasing colour applications are particularly important and emphasis is therefore being placed on broadening the colour range. Océ supplemented its range in 2004 and 2005 by adding a number of important product families which have considerably strengthened the company’s position in the colour segment in both small and wide formats. In the high volume production printing segment Océ now also holds a prominent position in colour. As before, the challenge for Océ’sR&D lies in further improving the time to market, optimising the machines for use in specific market segments, reducing the cost price and expanding the range of software for advanced applications.
Health, safety and the environment
Océ sets the highest standards for the safety and environmental aspects of its products. Before a product is given clearance for manufacture and sale it must amply comply with the internationally applicable safety and environmental requirements. The safety and environmental risks during the production of machines and materials are limited in their size and nature and the company regularly conducts risk assessments and evaluations aimed at identifying possible risks and taking appropriate measures in good time. The health and safety of Océ’s employees and its customers take priority at all times. The company’s sustainability report, which was published in 2005, deals in more detail with how the risks with regard to health, safety and the environment are minimised.
74
Management aspects
Internal management and control system
The Board of Executive Directors is responsible for the establishment and proper functioning of Océ’s system of internal controls and risk management. Risk management focuses on identifying and controlling risks that are related to the company’s operational and financial objectives and on putting measures in place to ensure that these risks are effectively managed. To provide the best possible assurance with regard to the integrity of the financial reporting system and the procedures that it is based on, Océ applies the following internal control framework:
Océ policy principlesThe Océ policy principles are periodically reviewed and, if necessary, amended. They provide a high level indication of the objectives of the Océ Group, how these have to be achieved and the ethical criteria that should be complied with. All Océ employees are obliged to adhere to these principles.
Ethical code for senior financial officersThis code, which is addressed to all members of the Board of Executive Directors and to all senior financial executives within the Océ Group, was drawn up in 2003. It is more detailed than the Océ policy principles and focuses mainly on financial processes and financial reporting.
Information Manual [IM]TheIM contains a detailed description of the guidelines for management reporting and external financial reporting. The guidelines set out in theIM for external financial reporting are based on generally accepted accounting principles in the Netherlands [Dutch GAAP]. As from the 2004 financial year these have been supplemented byIFRS guidelines [non conflicting standards] to the extent that the latter do not run counter to DutchGAAP. With effect from the 2006 financial year Océ will report fully on the basis ofIFRS.
Because the company is listed atNASDAQ in the United States, a 20-F statement drawn up in accordance withUSGAAP is filed each year. TheIM therefore also incorporates the relevant accounting standards underUSGAAP.
Strategic PlansThese are drawn up for all parts of the Océ organisation [operational and non operational] and converted into budgets which are evaluated in detail on a monthly basis by the Strategic Business Units and by the Board of Executive Directors, after which they are compared with the results actually achieved.
Internal and external auditsWithin the framework of control mechanisms and assurance processes an audit plan is drawn up each year by both the external auditors and the internal audit department. The internal audit plan is focused on the most important business processes and the related risks; the audits cover internal financial reporting and the existence and proper functioning of operational policy and procedures. The external auditor carries out the activities involved in the issue of an audit opinion on the annual financial statements and concentrates on the financial reporting and also takes into consideration the systems that are intended to ensure reliable reporting. Together, the activities of the internal and external auditors represent a very important evaluation of the internal control framework. The internal auditor makes a formal report on the effectiveness of the internal control framework. The external auditor reports on matters relating to the internal control measures to the extent that these have been identified during the auditing of the annual financial statements. The findings of the internal auditors as well as the observations made by the external auditors are discussed in the central and local Audit Committees.
75
Management aspects
Audit Committee [AC]TheAC consists of three members of the Supervisory Board and its task is to ensure independent monitoring of the risk management process on the basis of the supervisory role fulfilled by the Supervisory Board. TheAC focuses on the quality of internal and external reporting, on the effectiveness of internal controls with regard to both manual and computerised processes, and on the functioning of the external and internal auditors. TheAC holds at least four meetings a year and the responsible financial officers and the external and internal auditors are generally invited to attend these meetings. TheAC also holds periodic consultations with the external auditor at which Océ officers are not present.
Internal Audit Committee [IAC]The Internal Audit Committee consists of the Board of Executive Directors together with the operational directors, the Secretary of the Company, the Group Controller and the Group Internal Auditor.
Normally the external auditors are also invited to join the meetings of theIAC. TheIAC focuses in detail on the structure of the internal control framework, on how it functions and on the follow up to any material observations that result from audits. This committee also discusses specific accounting issues and monitors progress towards implementation of the Sarbanes-Oxley Act and theIFRS accounting standards. In view of the size of the operations in the United States an Internal Controls Committee [ICC] has been set up there as an extension of theIAC. The members of theIAC are theCEO andCFO of Océ-USA Holding, Inc. as well as the Presidents of the mainUS operations, the General Counsel and the Internal Audit Director in the United States, plus theCFO of Océ [who also chairs theICC].
Disclosure Committee [DC]TheDC consists of the Group Controller [chairman], representatives of all operational and non operational parts of Océ, the Secretary of the Company and the Chief Information Officer [CIO] of Océ, the Group Internal Auditor, the Investor Relations Manager and the head of the Group Consolidation department.
TheDC advises Océ’sCEO andCFO on the quality of the internal controls and the financial reporting. The process that precedes this involves in depth scrutiny and is also discussed in the Audit Committee [see above].
Besides section 403 of the Sarbanes-Oxley Act theDC also oversees the implementation of Section 404 which relates to the quality of financial reporting and the processes on which it is based.
Letter of Representation [LOR]All Managing Directors and Controllers of Group companies as well as all officers who report directly to theCFO of Océ sign a detailed declaration every quarter with regard to financial reporting, internal controls and ethical principles. Any observations made in theLORs are reported to and discussed by the Board of Executive Directors and the Audit Committee.
Whistleblowing ProcedureThis was formally approved by the Audit Committee in 2004. In the first quarter of 2005 this procedure was introduced in the United States and a start was made on its implementation within Océ’s European operations. The procedure serves to ensure that any infringement of the company’s existing policy and procedures can be reported without the person who made the report experiencing any negative consequences as a result. Implementation of the whistleblowing procedure in Océ’s European operations will be completed in 2006.
The above control framework has been evaluated for the past 3 years within Océ as to compliance with the requirements of Sarbanes-Oxley, Section 302. The whistleblowing procedure will be included in this evaluation as from 2006.
76
Management aspects
Statement relating to the system of internal management and control
The evaluation and certification of the quality of the control framework for financial reporting which we announced would be taking place in 2005 has been postponed for one year by theSEC in the United States for non-US companies that are listed on an American stock exchange. None the less we have fully continued our internal preparations to ensure compliance with the requirements of Section 404 [a] of the Sarbanes-Oxley Act. For this purpose a structured approach to the management of financial reporting procedures has been put in place. This consists of establishing targets, identifying risks, controlling and monitoring the implementation of processes, making management assessments and eliminating any deficiencies that have been found to exist. The management assessments are based on internationally accepted standards for corporate control, including those ofCOSO [the Committee of Sponsoring Organisations of the Treadway Commission]. This approach has not led to substantial changes in the system of internal controls, but it has resulted in the elimination of certain deficiencies that were identified.
Based on the results of this approach to date, after consulting the Audit Committee and the Supervisory Board, we are of the opinion that the system applied for the internal control of the processes that form the basis for financial reporting for the 2005 financial year is effective and complies with best practice provisionII.1.4. of the Dutch Corporate Governance Code [the ‘Dutch Code’]. Though the internal control system does not provide absolute certainty, it does provide a reasonable degree of assurance that no material inaccuracies in the financial reporting, losses or fraud have occurred. We take the view that the internal control system functioned effectively over the past year. There are no indications that the risk management and control systems will not function effectively in 2006.
However, as regards business processes and the related strategic and operational risks, as well as compliance with all legislation and regulations applicable to OcéN.V. as referred to in the Dutch Code, it is not possible to declare that the control system applied to these is completely effective because the Dutch Code does not provide clear assessment criteria for this. None the less, in order to comply with the Dutch Code, the risk management and control system has now become more extensive and its functioning has become more operational. Identification and management of risks is now an ongoing process within the company and as a result these systems will become increasingly more effective.
Now that OcéN.V. is implementing further procedures to document and periodically evaluate the adequacy and effectiveness of its internal controls for financial reporting processes, a number of areas of attention in which structured improvements will be achieved were identified in 2005. We refer to:
| • | the clarity and evaluation of the general principles for control of Océ operating companies [‘entity level controls’]; |
| • | the structure and implementation rules on powers of representation and separations between functions; |
| • | the access rights to computerised systems. |
Venlo, January 27, 2006
The Board of Executive Directors
R.L. van Iperen,chairman
J. van den Belt
J.F. Dix
77
Annual Financial Statements
Consolidated Statement of Operations
| The figures [ ] refer to the notes | 2005 | 2004 | x € 1,000 | |||||
| Total revenues[1] | 2,677,275 | 2,652,453 | ||||||
| Cost price | 1,605,442 | 1,549,058 | ||||||
| Gross margin | 1,071,833 | 1,103,395 | ||||||
| Selling expenses | 616,938 | 614,969 | ||||||
| Research and development expenses [2] | 195,614 | 208,105 | ||||||
| General and administrative expenses | 148,602 | 162,044 | ||||||
| Impairment [3] | 562 | 7,888 | ||||||
| 961,716 | 993,006 | |||||||
| Operating income | 110,117 | 110,389 | ||||||
| Financial expenses [net] [4] | 17,813 | 18,089 | ||||||
| Income before income taxes, equity in income of unconsolidated companies and minority interest | 92,304 | 92,300 | ||||||
| Income taxes [5] | 11,752 | 12,196 | ||||||
| Income before equity in income of unconsolidated companies and minority interest | 80,552 | 80,104 | ||||||
| Equity in income of minority interests | 580 | 507 | ||||||
| Income before minority interest | 81,132 | 80,611 | ||||||
| Minority interest in net income of subsidiaries | 2,294 | 2,535 | ||||||
| Net income | 78,838 | 78,076 | ||||||
| Earnings per share [6] | Net income per ordinary share | 0.92 | 0.89 | euro | ||||
| Diluted net income per ordinary share | 0.91 | 0.88 | ||||||
79
Consolidated Balance Sheet November 30
Before net income | Assets | 2005 | 2004 | x € 1,000 | ||||
Intangible fixed assets [7] | 550,039 | 37,207 | ||||||
Tangible fixed assets | Property, plant and equipment [8] | 455,080 | 423,490 | |||||
| Rental equipment [9] | 123,719 | 57,891 | ||||||
| 578,799 | 481,381 | |||||||
Financial fixed assets | Minority interests in associates [10] | 1,563 | 1,553 | |||||
| Finance lease [11] ? | 210,107 | 230,962 | ||||||
| Other long term financial assets [12] | 118,060 | 126,654 | ||||||
| 329,730 | 359,169 | |||||||
Current assets | Inventories [13] | 363,523 | 317,335 | |||||
| Accounts receivable [14] | 830,857 | 707,910 | ||||||
| Prepaid expenses | 23,813 | 17,025 | ||||||
| Cash and cash equivalents [15] | 142,699 | 313,060 | ||||||
| 1,360,892 | 1,355,330 | |||||||
Total | 2,819,460 | 2,233,087 | ||||||
80
Consolidated Balance Sheet November 30
Liabilities | 2005 | 2004 | x € 1,000 | |||||
Group equity | Ordinary shares [16] | 43,637 | 43,634 | |||||
| Priority shares [17] | 2 | 2 | ||||||
| Financing preference shares [18] | 10,000 | 10,000 | ||||||
| Paid-in capital [19] | 511,485 | 511,445 | ||||||
| Legal reserve [20] | 2,255 | 2,441 | ||||||
| Translation differences [21] | –103,760 | –140,391 | ||||||
| Other reserves [22] | 238,375 | 208,863 | ||||||
| Net income | 78,838 | 78,076 | ||||||
| Total shareholders’ equity | 780,832 | 714,070 | ||||||
| Minority interest [23] | 37,406 | 38,209 | ||||||
| 818,238 | 752,279 | |||||||
Long term liabilities [provisions] [24] | 512,944 | 515,977 | ||||||
Long term debt [25] | 227,112 | 438,409 | ||||||
Current liabilities | Short term debt [26] | 669,216 | 42,842 | |||||
| Other liabilities [27] | 285,592 | 219,066 | ||||||
| Accrued liabilities [28] | 250,120 | 219,359 | ||||||
| Deferred income | 56,238 | 45,155 | ||||||
| 1,261,166 | 526,422 | |||||||
Total | 2,819,460 | 2,233,087 | ||||||
81
Consolidated Statement of Cash Flow
| 2005 | 2004 | x € 1,000 | ||||||
Cash flow from operating activities | Net income | 78,838 | 78,076 | |||||
| Adjustments for: | ||||||||
Depreciation | 145,606 | 147,626 | ||||||
Impairment | 562 | 7,888 | ||||||
Installed in rental equipment | –113,015 | –116,797 | ||||||
Divestments in rental equipment | 64,134 | 77,268 | ||||||
Movements in finance lease | 6,068 | 74,337 | ||||||
Non-distributed equity in income of minority interests | –66 | –402 | ||||||
Result minority interest | 2,294 | 2,535 | ||||||
Long term liabilities [provisions] | –30,357 | -104,640 | ||||||
Provisions for finance lease, inventories and trade accounts receivable | 21,307 | 42,470 | ||||||
Trade accounts receivable and other receivables | –21,144 | 30,938 | ||||||
Inventories | 15,724 | –63,003 | ||||||
Trade accounts payable | 44,848 | 1,806 | ||||||
Net change in other working capital accounts* | –50,813 | –41,329 | ||||||
Cash flow from operating activities | 163,986 | 136,773 | ||||||
Cash flow from investing activities | Capital expenditure: | |||||||
Intangible fixed assets | –14,722 | –9,354 | ||||||
Property, plant and equipment | –96,479 | –86,738 | ||||||
Other long term financial assets | 1,340 | 3,340 | ||||||
| Divestments: | ||||||||
Intangible fixed assets | 38 | — | ||||||
Property, plant and equipment | 10,964 | 12,910 | ||||||
| Disposal of minority interests | — | 1,305 | ||||||
| Sale finance lease portfolio | 65,610 | 312,254 | ||||||
| Acquisitions [net of cash] | –638,229 | — | ||||||
Cash flow from investing activities | –671,478 | 233,717 | ||||||
* See page 83 for the specification of net change in other working capital accounts.
82
Consolidated Statement of Cash Flow
| 2005 | 2004 | x € 1,000 | ||||||
Cash flow from financing activities | Long term debt: | |||||||
Proceeds from long term debt | 18,104 | 141,476 | ||||||
Repayment of long term debt | –240,337 | –76,524 | ||||||
Borrowings and current portion of long term debts | 615,487 | –124,822 | ||||||
Movement repurchased shares Option Plan | 1,662 | 1,074 | ||||||
Dividend | –51,855 | –51,971 | ||||||
Minority interest | –3,092 | –3,099 | ||||||
Cash flow from financing activities | 339,969 | –113,866 | ||||||
Translation differences | –2,838 | 727 | ||||||
Changes in cash and cash equivalents | –170,361 | 257,351 | ||||||
Cash and cash equivalents at start of financial year | 313,060 | 55,709 | ||||||
Cash and cash equivalents at end of financial year | 142,699 | 313,060 | ||||||
| Specification of net change in other working capital accounts: | 2005 | 2004 | x € 1,000 | |||
Prepaid expenses | –2,924 | 6,360 | ||||
Income taxes | –25,206 | –31,173 | ||||
Other taxes and social security payable | –3,898 | 1,823 | ||||
Pension liabilities | 534 | –586 | ||||
Other liabilities | 4,621 | –8,665 | ||||
Accrued liabilities | –18,777 | –9,764 | ||||
Deferred income | –5,163 | 676 | ||||
Balance | –50,813 | –41,329 |
83
Summary of Significant Accounting Principles
Introduction
The following summary of significant accounting principles is intended as a guide in interpreting the financial statements. There has been no change in the accounting principles as compared to the previous financial year.
The Group’s financial year commences on December 1 and closes on November 30 of the subsequent year.
Principles of consolidation
The consolidated financial statements comprise the financial data for OcéN.V. and its Group companies. The financial data of Group companies are consolidated in full; the minority interest is stated separately. A company is considered to be a Group company if Océ directly or indirectly holds a majority controlling interest in it. As from the date of control the financial position of the relevant company is included in the consolidation.
The financial data of the relevant company are included in the consolidation as from the date on which this criterion is met.
Acquisitions of group companies are included on the basis of the ‘purchase accounting’ method. The cost of acquisition is shown as the actual amount or its equivalent that has been agreed upon for the acquisition of the acquired party, plus the costs that can be allocated direct to the acquisition. In those cases in which the acquisition value exceeds the balance of the fair value of the acquired assets and liabilities, the goodwill has been capitalised with effect from December 1, 2000. Prior to that date goodwill was charged directly to shareholders’ equity. The group companies are listed on pages 127 and 128 of this report.
The principal changes in Océ Group companies during the past financial year are the following: On October 31, 2005 Océ acquired 100% of the shares in Imagistics International Inc. and thus obtained full control. Imagistics International Inc. is a sales and service organisation in the area of printing and document management with operations in the United States, Canada and the United Kingdom. The total purchase consideration amounts to € 638 million. The fair values indentified upon aquisition are provisional and may still be subject to change. Changes in fair values will be shown as an adjustment to the initial identified goodwill within one year after acquisition date.
84
Summary of Significant Accounting Principles
The acquisition of Imagistics International Inc. had the following effect on the assets and liabilities of Océ: | Fair value | x € 1,000 | ||
Goodwill | 351,412 | |||
Software | 21,817 | |||
Customer base | 90,819 | |||
Trade marks and other | 39,552 | |||
Tangible fixed assets | 77,185 | |||
Financial fixed assets | 479 | |||
Inventories | 66,220 | |||
Accounts receivable | 102,575 | |||
Prepaid expenses | 2,558 | |||
Provisions | –35,896 | |||
Current liabilities | –78,492 | |||
Total purchase consideration | 638,229 |
The goodwill arising from the acquisition of Imagistics International Inc. mainly relates to the anticipated operational synergy effects and to the acquired personnel.
Balance sheet items of Group companies are translated into euro. As the opening shareholders’ equity and movements in equity during the year are recalculated on the basis of the closing exchange rate at the end of the reporting period, differences arise as compared to the calculation based on the exchange rate used for the previous period. These differences are charged to or added to Shareholders’ equity under ‘Translation differences’.
Items in the Statements of Operations of Group companies are translated into euro at the average exchange rate during the reporting period. The result calculated on the basis of the average exchange rate differs from that calculated on the basis of the closing exchange rate for the period. This difference is debited or credited direct to Shareholders’ equity under ‘Translation differences’.
Unrealised gains on transactions between Group companies are eliminated. Unrealised losses are eliminated unless it is clear that no margin will be realised on inventories that have been transferred.
When drawing up the annual financial statements the management is required to make assumptions and estimates. In doing so, the management takes past experiences as its basis, whilst making the best possible assessment of future developments.
Consolidated Statement of Operations
Foreign currenciesTransactions denominated in foreign currencies are included at the exchange rate applicable at the moment when the transactions take place.
Total revenuesRevenues comprise the proceeds from the sale of goods and services to third parties excluding the taxes levied on revenues and discounts granted. Revenues are recognised as follows:
MachinesRevenues are recognised after delivery and installation on the customer’s premises. If a sales contract contains an acceptance clause, the customer should have confirmed acceptance. If the customer has been offered financing by Océ in the form of a finance lease arrangement that can be classed as a sales transaction, then the finance lease receivables are likewise recognised after acceptance, with allowance being made for
85
Summary of Significant Accounting Principles
the unrealised interest and the residual value of the machines. Unrealised interest is shown as ‘Interest from finance lease’ for the duration of the lease with a fixed periodic interest rate on the net investment.
When machines are sold to a distributor the revenues are accounted for at the moment of transfer.
Proceeds from the rental of machines are included in revenues on a straight-line basis over the period of the lease.
ServiceService proceeds are mostly obtained from maintenance contracts that have been concluded for the machines sold and rented out and are recognised pro rata over the period of the contract. If service contracts have been invoiced in advance, these amounts are included in the balance sheet under ‘Deferred income’.
SuppliesRevenues are recognised at the moment of delivery.
CostsConsumption of raw materials and other cost items are included on the basis of historical costs. Depreciation on fixed production assets is charged at a fixed percentage of the acquisition value of the relevant asset. Depreciation of rental equipment amounts to a fixed percentage of the all-in manufacturing costs plus the costs of ensuring that the equipment can operate effectively on the customer’s premises. Government contributions to operating costs are deducted directly from these costs.
Rental expenditure in respect of property, plant and equipment, in which the risks and rewards of ownership of the property, plant and equipment are retained are almost entirely borne by the lessor, is recognised as costs on a straight-line basis over the period of the lease.
Research and development expensesResearch costs are charged directly to the Statement of Operations. Product development costs are activated if they comply with the relevant criteria, as described under intangible fixed assets.
Development credits and subsidiesDevelopment credits received from the government are subject to a contingent repayment liability. This contingent liability, to which a contractual mark-up is applied each year, is not included in the balance sheet. According as the relevant projects prove successful, the liability ceases to be contingent and a real liability arises which is included in the balance sheet.
Financial expenses [net]Besides interest received and interest paid, expenses relating to the raising of loan capital are also included here. The effect of interest rate instruments is also shown under this heading.
Income taxThis is calculated on the commercial results on the basis of the tax rates applicable in the various countries. This method implies that provisions are made for deferred income taxes. The entitlement to loss compensation is taken into consideration in so far as there is a reasonable expectation that it can be realised. Allowance is made for non-offsettable dividend withholding tax at the moment of dividend distribution by an affiliated company.
Earnings per shareEarnings per ordinary share are calculated by dividing the net income attributable to holders of ordinary shares by the weighted average number of ordinary shares outstanding during the year. In making this calculation the ordinary shares bought in by the company are deducted from the number of ordinary shares outstanding.
The calculation of the diluted earnings per share is based on the weighted average number of ordinary shares outstanding plus the potential increase as a result of conversion and outstanding options. As regards convertible debenture loans it is assumed that these are converted in full. An adjustment is also made to net income to eliminate interest charges, whilst allowing for the effect of taxation.
The calculation of the increase arising from options is based on the value of the options granted, i.e. the number of options times the exercise price, divided by the average share price during the financial year. This increase is only applied if the average share price is higher than the exercise price of the options upon grant. In making this calculation no adjustment is made to net income.
86
Summary of Significant Accounting Principles
Consolidated Balance Sheet
Assets and liabilities are included at face values, unless stated otherwise.
Foreign currenciesAccunts receivables and payables in foreign currencies are translated at the exchange rate in effect at the end of the reporting period. Exchange rate differences, including results on forward foreign exchange transactions are recorded direct on the Statement of Operations to the extent that these relate to [intercompany] loan exposures. The differences relating to operational cash flows, including those arising on the relevant forward foreign exchange contracts, are also included in the Statement of Operations.
Intangible fixed assetsIntangible fixed assets are valued at acquisition or manufacturing cost, less cumulative depreciation and any impairments. Goodwill and other intangible fixed assets arising upon the acquisition of Group companies or minority interests in associates are written off on a straight-line basis over their estimated economic lifetime, subject to a maximum of twenty years. Amortisation of goodwill can be charged to the Statement of Operations over a period that is longer than 5 years, since the synergy benefits arising from strategic acquisitions are in many cases realised over the longer term. The development and purchase costs of software for internal use which generates economic benefits over a number of years are capitalised. The development costs consist of the direct personnel costs on the basis of an hourly rate, in which allowance is made for a mark-up for overhead costs to the extent that these relate to manufacturing, and third-party costs.
Intangible fixed assets are periodically reviewed to assess whether any impairment has occurred; if this is the case, they are included at their net realisable value. The net realisable value is taken as the direct or indirect market value, whichever is higher.
Product development costs are shown under the heading ‘Technology’ and are capitalised if they meet the criteria of an identifiable project that probably will generate economic benefits in the future and whose manufacturing cost can be reliably measured.
The estimated useful lives of the various classes of intangible fixed assets are as follows:
goodwill: 5 to 20 years;
software: 3 to 7 years;
technology: 5 to 10 years;
customer base: 5 to 10 years;
trade marks: 2 to 10 years;
other: 5 years.
Property, plant and equipmentProperty, plant and equipment are valued at acquisition or manufacturing cost, less cumulative depreciation and any impairments. Subsequent costs are capitalised if it is probable that future economic benefits associated with the asset will accrue to Océ and if the costs can be reliably measured. All other costs of repair and maintenance are charged direct to the Statement of Operations.
Depreciation is provided for according to the straight-line method based on the expected useful lifetime of the relevant asset.
Depreciation of specific pieces of equipment used for the manufacture of machines takes place pro rata to the expected number of units to be manufactured. ‘Property, plant and equipment’ are assessed as to a possible impairment; if the latter is the case they are valued at their net realisable value. The net realisable value is taken as the direct or indirect market value, whichever is higher. If the risks and rewards attaching to the ownership of the rented assets are almost entirely for the account of Océ, then the rental agreement is classified as a finance lease. Finance leases are capitalised at the fair market value of the rented assets or the net present value of the minimum lease obligations, whichever is lower. The lease payments are allocated partially to liabilities and partially to interest, calculated on an annuities basis. The assets leased via a finance lease agreement are written off over the lease period or the asset’s useful economic life, whichever is lower.
87
Summary of Significant Accounting Principles
The estimated useful lives of the various classes of fixed assets are as follows:
property and plant: 20 to 50 years;
production machines: 8 to 10 years;
equipment: 3 to 10 years;
vehicles: 4 or 5 years.
Rental equipmentThese are valued at the all-in manufacturing cost plus the cost of ensuring that the equipment can operate effectively on the customer’ premises less cumulative depreciation on a straight-line basis. The estimated useful life of the various types of machines ranges from 3 to 5 years.
Minority interests in associatesThese are all entities over which the group can exercise significant influence but does not control. This is mostly linked to a voting right of 20% to 50%. Minority interests are included at the attributable net asset value, calculated where possible on the basis of the valuation principles applied in these Financial Statements.
Finance lease receivablesThis comprises the long term receivables and residual values in respect of finance lease contracts. They are valued at the present value of the contracted receivables, whilst taking into account the risk of non-collectability. The difference between the nominal value and the present value of the contracted receivables is shown as unrealised interest.
Other long term financial assetsThese comprise assets such as mortgage debtors, cash advances and guarantee deposits as well as deferred income tax assets. They are included at nominal value after taking into account the risk of non-collectability.
InventoriesPurchased inventories are valued at purchase price, plus any additional costs, by the First-in-First-out method. Inventories of semi-finished products, spare parts and finished products are valued at manufacturing cost including a mark-up for indirect costs relating to manufacturing. No interest charge is applied. Allowance is made for the risk of obsolescence.
Accounts receivableTrade debtors, finance leases with a duration of less than 1 year, other debtors as well as amounts receivable from minority interests are shown at nominal value less an allowance to cover bad and doubtful debts.
Cash and cash equivalentsThese include cash in hand, bank deposits that are repayable on call, balances in bank accounts, cheques and bills of exchange received.
Shareholders’ equityOwn shares that have been bought in by the company are deducted from shareholders’ equity [other reserves] for the consideration paid, including any directly attributable costs, until the moment when such shares are cancelled or reissued. If the relevant shares are reissued, then the consideration received -net of transaction costs- is added to shareholders’ equity.
Minority interestThe minority interest in Group companies is included at the attributable net asset value determined in accordance with the valuation principles used in these Financial Statements.
ProvisionsThe provision for deferred income tax liabilitiesis calculated on the basis of the nominal differences between the fiscal and commercial value of assets and liabilities, based on the rates of corporate income tax that are effective in each country. Deferred income tax assets are included to the extent that they are considered to be realisable.
Pension liabilitiesexist both under ‘defined contribution’ plans and ‘defined benefit’ plans. In the Netherlands as well as in most other countries plans of the latter type are mostly funded externally.
In the case of a defined contribution plan the contribution is booked as a charge in the year to which it relates.
88
Summary of Significant Accounting Principles
Under defined benefit plans the pension entitlements are calculated according to the ‘projected unit credit’ method. Actuarial gains and losses in excess of a threshold of 10% of the [highest of the] pension liabilities or the fair value of the pension assets are charged to the Statement of Operations over the remaining periods of employee service. Changes in pension plans and back service costs are charged direct to the Statement of Operations if they are unconditional in nature or if they are the result of a significant change. These calculations are made each year by qualified actuaries. The pension liabilities as recognised in the balance sheet are shown at the net present value of the promised entitlements at balance sheet date, less the fair value of the pension assets and after adding or deducting the actuarial gains or losses and back service costs that have not yet been incorporated in the result.
Early retirement liabilitiesrelate to specific mostly individual agreements.
The provisions shown hereafter are included at the nominal value of the expenditures that are expected to be needed to settle the liabilities; in cases where the time value of money has a significant impact, valuation takes place on the basis of the net present value.
Liabilities arising from the termination of employment contractsrelate in most cases to the legal obligation to make a severance payment which is based on years of service and is related to the salary of the relevant employee at the moment of termination. Payment takes place upon leaving company service. Liabilities in respect of long-service awards are also included under this heading.
The reorganisation provisionrelates to costs connected with the reorganisation of business activities.
Other long term liabilities [provisions]relate among other things to [legal] proceedings, guarantee commitments and onerous contracts in respect of buildings.
Long term debtThis relates to liabilities that fall due after more than one year.
Current liabilitiesThese commitments comprise liabilities falling due within one year.
Commitments not stated in the balance sheet These consist of operational lease receivables arising from contracts for equipment rented out to third parties, most of which have a duration of more than one year.
Contingent liabilities not stated in the balance sheetThese consist of contingent liabilities arising from contracts, most of which have a duration of more than one year [lease contracts, rental contracts, capital expenditure commitments, repayable development credits, financial instruments etc.].
Consolidated Statement of Cash Flow
The Consolidated Statement of Cash Flow has been drawn up on the basis of the indirect method. This statement is derived from the movements in the Consolidated Balance Sheet. In the event of a major acquisition, however, the acquired net asset value, less cash and cash equivalents, is shown separately. Foreign currency translations have been eliminated from the changes in the balance sheet items as they do not generate a cash flow. As a result, the movements in the cash flow statement cannot be derived directly from the movements in the relevant balance sheet items.
The movement in the portions of long term debt falling due within one year is shown under ‘Long term debt: repayments’.
89
Notes to the Consolidated Statement of Operations
| Segmental information | ||||||||||||||
Business segmentation | x € million | Wide Format Printing Systems | Digital Document Systems | total | ||||||||||
| 2005 | 2004 | 2005 | 2004 | 2005 | 2004 | |||||||||
[1] Total revenues | 834 | 818 | 1,843 | 1,834 | 2,677 | 2,652 | ||||||||
Operating income | 71 | 55 | 39 | 55 | 110 | 110 | ||||||||
Operating income, excluding release pension provision and reorganisation costs 2005 | 57 | 55 | 18 | 55 | 75 | 110 | ||||||||
Net income | 59 | 43 | 20 | 35 | 79 | 78 | ||||||||
Assets | 638 | 617 | 2,181 | 1,616 | 2,819 | 2,233 | ||||||||
Liabilities | 295 | 328 | 1,706 | 1,153 | 2,001 | 1,481 | ||||||||
Group equity | 343 | 289 | 475 | 463 | 818 | 752 | ||||||||
Expenditure* | 26 | 24 | 123 | 99 | 149 | 123 | ||||||||
Depreciation | 30 | 31 | 97 | 98 | 127 | 129 | ||||||||
Amortisation | 7 | 11 | 12 | 8 | 19 | 19 | ||||||||
Impairment | 1 | 8 | — | — | 1 | 8 | ||||||||
| Geographical segmentation | x € million | total revenues | assets | expenditure* | ||||||||||
| 2005 | 2004 | 2005 | 2004 | 2005 | 2004 | |||||||||
United States | 931 | 925 | 1,180 | 414 | 28 | 19 | ||||||||
Germany | 323 | 333 | 325 | 347 | 19 | 18 | ||||||||
The Netherlands | 289 | 291 | 647 | 855 | 56 | 53 | ||||||||
France | 195 | 191 | 117 | 115 | 10 | 6 | ||||||||
United Kingdom | 182 | 180 | 109 | 100 | 7 | 4 | ||||||||
Rest of Europe | 541 | 534 | 314 | 305 | 22 | 18 | ||||||||
Countries outside Europe and the United States | 216 | 198 | 127 | 97 | 7 | 5 | ||||||||
Total | 2,677 | 2,652 | 2,819 | 2,233 | 149 | 123 | ||||||||
| Development of total revenues and gross margin | x € million | total revenues | cost price | gross margin | ||||||||||
| 2005 | 2004 | 2005 | 2004 | 2005 | 2004 | |||||||||
Proceeds from sales | 1,631 | 1,564 | 1,008 | 939 | 623 | 625 | ||||||||
Proceeds from rental and service | 1,010 | 1,020 | 597 | 610 | 413 | 410 | ||||||||
Interest from finance leases | 36 | 68 | — | — | 36 | 68 | ||||||||
Total | 2,677 | 2,652 | 1,605 | 1,549 | 1,072 | 1,103 | ||||||||
In total revenues and gross | ||||||||||||||
margin the result of € 4.7 | ||||||||||||||
million [2004: € 30.9 million] on the sale of lease | ||||||||||||||
portfolio is shown under | ||||||||||||||
‘Proceeds from sales’. | ||||||||||||||
* Net expenditure in intangible and tangible fixed assets. | ||||||||||||||
90
Notes to the Consolidated Statement of Operations
Exchange rates of a number of currencies of importance to Océ | average rate in euro | balance sheet rate in euro | ||||||||
| 2005 | 2004 | 2005 | 2004 | |||||||
| Pound sterling | 0.68 | 0.68 | 0.68 | 0.70 | ||||||
| US dollar | 1.25 | 1.23 | 1.18 | 1.32 | ||||||
| Australian dollar | 1.64 | 1.68 | 1.59 | 1.72 | ||||||
| Swiss franc | 1.55 | 1.55 | 1.55 | 1.52 | ||||||
| Japanese yen | 136.65 | 133.73 | 140.85 | 136.64 | ||||||
| Expenses | ||||||||||
Material costs | Material costs amount to € 753.5 million [2004: € 674.7 million] and have been included in full under the heading ‘Cost price’ in the Statement of Operations. | |||||||||
| 2005 | 2004 | x € 1,000 | ||||||||
Depreciation costs | Intangible fixed assets | 19,445 | 19,045 | |||||||
| Property, plant and equipment | 88,378 | 85,489 | ||||||||
| Rental equipment | 37,783 | 43,092 | ||||||||
| Total | 145,606 | 147,626 | ||||||||
Payroll expenses | Wages and salaries | 964,915 | 966,595 | |||||||
| Social security | 221,690 | 193,638 | ||||||||
| Pension costs for: | ||||||||||
defined contribution plans | 11,430 | 13,969 | ||||||||
defined benefit plans | –13,997 | 53,377 | ||||||||
| Total | 1,184,038 | 1,227,579 | ||||||||
| In the 2005 financial year agreement was reached in the Netherlands on a significant change in the pension scheme, which means that with effect from January 1, 2006 pension entitlements will be based on career average instead of final pay. | ||||||||||
| The resultant reduction of € 68.4 million of the provision for pensions was credited to the Statement of Operations in the 2005 financial year. | ||||||||||
| In 2005 a reorganisation was initiated to achieve a further reduction in costs. This will result in the discontinuation of around 500 jobs in Europe. Measures have also been taken in the United States to increase profitability. In part, these run in parallel with the integration of Imagistics International Inc. The reorganisation and integration costs relate to personnel costs and costs in connection with onerous contracts in respect of buildings. | ||||||||||
| Recognition of these two effects in the Statement of Operations: | pension provision | reorganisation costs | total | x € 1,000 | ||||||
| Cost price | –8,029 | 8,029 | — | |||||||
| Selling expenses | –14,185 | 10,185 | –4,000 | |||||||
| Research and development expenses | –21,366 | 6,866 | –14,500 | |||||||
| General and administrative expenses | –24,780 | 8,045 | –16,735 | |||||||
| Total | –68,360 | 33,125 | –35,235 | |||||||
91
Notes to the Consolidated Statement of Operations
The individual remuneration of the members of the Board of Executive Directors is:
| periodic pay | performance related pay over 2005 | total | pension contributions | in euro | ||||||
R.L. van Iperen | 612,780 | 240,000 | 852,780 | 368,001 | ||||||
J. van den Belt | 411,737 | 180,000 | 591,737 | 122,017 | ||||||
J.F. Dix | 461,392 | 270,000 | 731,392 | 117,498 | ||||||
For the method of establishing performance related pay, see page 62.
Mr. J.F. Dix was awarded an additional, discretionary, bonus of 20% in connection with his activities in the United States and the results that were achieved there.
In 2004 it was decided to replace the option plan for the Board of Executive Directors by a share plan, which was introduced in 2005.
A description of the share plan as well as a table showing the interests of the members of the Board of Executive Directors in the option plans can be found on page 111 of this annual report. At the end of the financial year the members of the Board of Executive Directors held no ordinary shares in Océ [2004: nil] and no rights to options listed on the Euronext Options Exchange. | ||||||||||
| amounts in euro | age on 30-11-2005 | final pension age | increase in accrued entitlements 2005 | accrued pension rights as at 30-11-2005 | capital build-up in defined contribution plan as at 30-11-2005 | |||||
R.L. van Iperen | 52 | 60 | 6,014 | 228,350 | 296,540 | |||||
J. van den Belt | 59 | 62 | 4,009 | 40,135 | 205,378 | |||||
J.F. Dix | 59 | 62 | 9,325 | 200,311 | 179,370 | |||||
Pension entitlementsThe above table shows the accrued pension entitlements of the members of the Board of Executive Directors and the annual pension amounts that would be paid to them on the basis of their years of service as at the end of 2005. With effect from January 2003 the pension scheme for members of the Board of Executive Directors was converted from a defined benefit plan into a hybrid scheme [defined benefit plus defined contribution plan].
The remuneration for the 2005 financial year of the present and former members of the Board of Supervisory Directors amounted to € 221,145 [2004: € 222,281]. The remuneration for the Board of Supervisory Directors is fixed at € 46,355 for the chairman and at € 30,903 for the members, in conformity with the scheme set out on page 65. At the end of the financial year the members of the Board of Supervisory Directors held 2,969 ordinary shares in Océ [2004: 2,969] and no rights to options listed on the Euronext Options Exchange [2004: nil]. | ||||||||||
92
Notes to the Consolidated Statement of Operations
| 2005 | 2004 | x € 1,000 | ||||||
[2] Research and development expenses | Total expenditure on research and development | 192,705 | 206,555 | |||||
| Development credit repayable and net subsidies received | 2,909 | 1,550 | ||||||
| Total | 195,614 | 208,105 | ||||||
[3] Impairment | Impairment of intangible and tangible fixed assets | 562 | 7,888 | |||||
| In the Statement of Operations impairment costs are shown as a separate item so as to provide a clearer picture. | ||||||||
In 2005 an impairment of tangible fixed assets was booked. | ||||||||
In 2004 a goodwill impairment was booked for the Display Graphics Systems business group. In 2004 there was also a limited impairment of tangible fixed assets.
| ||||||||
| 2005 | 2004 | x € 1,000 | ||||||
[4] Financial expenses [net] | Interest and similar income items | –7,076 | –6,440 | |||||
| Interest charges and similar expenses | 22,311 | 22,103 | ||||||
| Other financial expenses | 2,578 | 2,426 | ||||||
| Total | 17,813 | 18,089 | ||||||
[5] Income taxes | A reconciliation of the Dutch statutory income tax rate to the effective income tax rate is set out below: | |||||||
| Dutch statutory tax rate | 31.5 | 34.5 | per cent | |||||
| Non-deductible expenses | 2.8 | 2.2 | ||||||
| Foreign tax rate deviating from the Dutch tax rate | –9.6 | –12.5 | ||||||
| Tax credits | –7.2 | –2.2 | ||||||
| Movements in unrecognised deferred income tax assets | –0.4 | –6.7 | ||||||
| Other | –4.4 | –2.1 | ||||||
| Effective income tax rate | 12.7 | 13.2 | ||||||
| The ‘Tax credits’ item includes a deferred income tax reduction of € 4.9 million in respect of research and development activities in the United States. | ||||||||
| In 2004 the ‘Movement in unrecognised deferred income tax assets’ includes a release of € 7.0 million. This release resulted from the definitive settlement of the tax risks to which these provisions related. | ||||||||
93
Notes to the Consolidated Statement of Operations
| 2005 | 2004 | x € 1,000 | ||||||
[6] Earnings per share | Net income attributable to holders of ordinary shares | 76,730 | 74,525 | |||||
| Weighted average number of ordinary shares outstanding [x 1,000] | 83,698 | 83,488 | shares | |||||
| Net income per ordinary share | 0.92 | 0.89 | euro | |||||
| Net income attributable to holders of ordinary shares | 76,730 | 74,525 | ||||||
| Interest costs of convertible loans [net] | 308 | 322 | ||||||
| Net income based on full conversion | 77,038 | 74,847 | ||||||
| Weighted average number of ordinary shares outstanding [x 1,000] | 83,698 | 83,488 | shares | |||||
| Adjustment for assumed conversion [x 1,000] | 750 | 728 | ||||||
| Adjustment for options [x 1,000] | 221 | 543 | ||||||
Weighted average number of ordinary shares outstanding on the basis of full conversion [x 1,000] | 84,669 | 84,759 | ||||||
| Net income per ordinary share on the basis of full conversion | 0.91 | 0.88 | euro | |||||
Employees by category | 2005 | 2004 | number | |||||
| Business Services | 6,806 | 6,693 | ||||||
| Sales | 5,356 | 4,192 | ||||||
| Service | 5,078 | 4,013 | ||||||
| Accounting and other | 2,666 | 2,037 | ||||||
| Manufacturing and Logistics | 2,453 | 2,512 | ||||||
| Research and Development | 1,805 | 1,868 | ||||||
| Numbers of employees at November 30 | 24,164 | 21,315 | ||||||
| Of whom, employed in the Netherlands | 3,947 | 3,922 | ||||||
| Weighted average number of employees | 21,657 | 21,760 | ||||||
94
Notes to the Consolidated Balance Sheet
| [7] | Intangible fixed assets x € 1,000 | goodwill | software | technology | customer base | trade marks and other | total | |||||||
At December 1, 2003 | ||||||||||||||
Acquisition value | 28,087 | 47,312 | 7,399 | 11,669 | 4,756 | 99,223 | ||||||||
Accumulated amortisation | 18,705 | 16,179 | 3,481 | 11,148 | 989 | 50,502 | ||||||||
Book value | 9,382 | 31,133 | 3,918 | 521 | 3,767 | 48,721 | ||||||||
Movements in book value in 2004: | ||||||||||||||
Expenditure | 756 | 6,608 | 1,990 | — | — | 9,354 | ||||||||
Reclassifications | — | 7,891 | -73 | 268 | — | 8,086 | ||||||||
Amortisation | 1,063 | 15,749 | 1,588 | 201 | 444 | 19,045 | ||||||||
Impairment | 7,207 | — | — | 280 | — | 7,487 | ||||||||
Foreign currency translations | -264 | -1,560 | -271 | – | -327 | -2,422 | ||||||||
At November 30, 2004 | 1,604 | 28,323 | 3,976 | 308 | 2,996 | 37,207 | ||||||||
Acquisition value | 11,652 | 71,859 | 8,737 | 10,969 | 4,305 | 107,522 | ||||||||
Accumulated amortisation | 10,048 | 43,536 | 4,761 | 10,661 | 1,309 | 70,315 | ||||||||
Book value at November 30, 2004 | 1,604 | 28,323 | 3,976 | 308 | 2,996 | 37,207 | ||||||||
Movements in book value in 2005: | ||||||||||||||
Expenditure | — | 14,052 | 170 | 483 | 17 | 14,722 | ||||||||
Divestments | — | 38 | — | — | — | 38 | ||||||||
Net expenditure | — | 14,014 | 170 | 483 | 17 | 14,684 | ||||||||
Acquisition subsidiary | 351,412 | 21,817 | — | 90,819 | 39,552 | 503,600 | ||||||||
Amortisation | 1,758 | 13,998 | 1,641 | 948 | 1,100 | 19,445 | ||||||||
Foreign currency translations | 8,343 | 1,957 | 216 | 2,207 | 1,270 | 13,993 | ||||||||
At November 30, 2005 | 359,601 | 52,113 | 2,721 | 92,869 | 42,735 | 550,039 | ||||||||
Acquisition value | 362,068 | 102,275 | 8,828 | 94,054 | 45,318 | 612,543 | ||||||||
Accumulated amortisation | 2,467 | 50,162 | 6,107 | 1,185 | 2,583 | 62,504 | ||||||||
Book value at November 30, 2005 | 359,601 | 52,113 | 2,721 | 92,869 | 42,735 | 550,039 | ||||||||
| Recognition for amortisation costs in the Statement of Operations: | 2005 | 2004 | x € 1,000 | |||
Cost price | 4,211 | 3,225 | ||||
Selling expenses | 5,066 | 8,059 | ||||
Research and development expenses | 1,533 | 1,611 | ||||
General and administrative expenses | 8,635 | 6,150 | ||||
Total | 19,445 | 19,045 |
95
Notes to the Consolidated Balance Sheet
| Tangible fixed assets x € 1,000 | property and plant | production equipment | other fixed assets | under construction and prepayments | not in production process and investment property | total | ||||||||
[8] Property, plant and equipment | At December 1, 2003 | |||||||||||||
| Acquisition value | 338,104 | 434,134 | 431,341 | 18,292 | 19,048 | 1,240,919 | ||||||||
| Accumulated depreciation | 151,301 | 326,849 | 317,428 | — | 14,814 | 810,392 | ||||||||
| Book value | 186,803 | 107,285 | 113,913 | 18,292 | 4,234 | 430,527 | ||||||||
| Movements in book value in 2004: | ||||||||||||||
| Expenditure | 1,936 | 23,111 | 44,413 | 16,592 | 686 | 86,738 | ||||||||
| Divestments | 1,410 | 911 | 10,589 | — | — | 12,910 | ||||||||
| Net expenditure | 526 | 22,200 | 33,824 | 16,592 | 686 | 73,828 | ||||||||
| Reclassifications | 3,688 | 4,040 | 3,878 | — | –947 | 10,659 | ||||||||
| Depreciation | 10,202 | 32,848 | 42,223 | — | 216 | 85,489 | ||||||||
| Impairment | 85 | 206 | 110 | — | — | 401 | ||||||||
| Foreign currency translations | –1,354 | –1,934 | –2,164 | –138 | –44 | –5,634 | ||||||||
| At November 30, 2004 | 179,376 | 98,537 | 107,118 | 34,746 | 3,713 | 423,490 | ||||||||
| Acquisition value | 349,396 | 428,331 | 420,489 | 34,746 | 13,018 | 1,245,980 | ||||||||
| Accumulated depreciation | 170,020 | 329,794 | 313,371 | — | 9,305 | 822,490 | ||||||||
| Book value at November 30, 2004 | 179,376 | 98,537 | 107,118 | 34,746 | 3,713 | 423,490 | ||||||||
| Movements in book value in 2005: | ||||||||||||||
| Expenditure | 17,417 | 36,451 | 57,683 | –15,253 | 181 | 96,479 | ||||||||
| Divestments | 3,077 | 1,549 | 6,338 | — | — | 10,964 | ||||||||
| Net expenditure | 14,340 | 34,902 | 51,345 | –15,253 | 181 | 85,515 | ||||||||
| Acquisition subsidiary | 7,982 | 3,725 | 13,319 | — | 1,722 | 26,748 | ||||||||
| Depreciation | 10,395 | 32,320 | 45,361 | — | 302 | 88,378 | ||||||||
| Impairment | — | 562 | — | — | — | 562 | ||||||||
| Foreign currency translations | 1,847 | 2,157 | 4,107 | 88 | 68 | 8,267 | ||||||||
| At November 30, 2005 | 193,150 | 106,439 | 130,528 | 19,581 | 5,382 | 455,080 | ||||||||
| Acquisition value | 370,320 | 467,686 | 464,744 | 19,581 | 15,079 | 1,337,410 | ||||||||
| Accumulated depreciation | 177,170 | 361,247 | 334,216 | — | 9,697 | 882,330 | ||||||||
| Book value at November 30, 2005 | 193,150 | 106,439 | 130,528 | 19,581 | 5,382 | 455,080 | ||||||||
96
Notes to the Consolidated Balance Sheet
The book value of ‘Other fixed assets’ contains an amount of € 10.3 million for finance leases [2004: € 4.7 million].
Recognition for depreciation costs in the Statement of Operations:
| 2005 | 2004 | x € 1,000 | ||||||
| Cost price | 50,161 | 49,945 | ||||||
| Selling expenses | 21,957 | 16,871 | ||||||
| Research and development expenses | 10,174 | 12,630 | ||||||
| General and administrative expenses | 6,086 | 6,043 | ||||||
| Total | 88,378 | 85,489 | ||||||
[9] Rental equipment | At December 1, 2004/2003 | |||||||
| Cost price | 302,798 | 364,469 | ||||||
| Accumulated depreciation | 244,907 | 301,190 | ||||||
| Book value | 57,891 | 63,279 | ||||||
| Movements in book value: | ||||||||
| Acquisition subsidiary | 50,437 | — | ||||||
| Installed on rental | 113,015 | 116,797 | ||||||
| Divestments | 64,134 | 77,268 | ||||||
| Depreciation | 37,783 | 43,092 | ||||||
| Foreign currency translations | 4,293 | –1,825 | ||||||
| At November 30 | 123,719 | 57,891 | ||||||
| Cost price | 353,644 | 302,798 | ||||||
| Accumulated depreciation | 229,925 | 244,907 | ||||||
| Book value at November 30 | 123,719 | 57,891 | ||||||
| In the Statement of Operations depreciation is included in full under ‘Cost price’. | ||||||||
97
Notes to the Consolidated Balance Sheet
| Financial fixed assets | 2005 | 2004 | x € 1,000 | |||||
| [10] Minority interests in associates | Book value at December 1, 2004/2003 | 1,553 | 2,535 | |||||
| Changes in the value of minority interests due to: | ||||||||
| Equity in income | 580 | 507 | ||||||
| Divestments | — | –1,305 | ||||||
| Dividend | –514 | –105 | ||||||
| Foreign currency translations | –56 | –79 | ||||||
| Book value at November 30 | 1,563 | 1,553 | ||||||
| [11] Finance lease | Finance lease receivables comprise the following components: | |||||||
| Finance lease receivables [gross] | 418,694 | 490,806 | ||||||
| Unrealised interest | –64,302 | –71,528 | ||||||
| Residual values | 4,633 | 3,190 | ||||||
| 359,025 | 422,468 | |||||||
| Provision for lease receivables | –15,866 | –19,011 | ||||||
| Finance lease receivables [net] | 343,159 | 403,457 | ||||||
| To short term lease receivables | –133,052 | –172,495 | ||||||
| Long term finance lease receivables | 210,107 | 230,962 | ||||||
| The gross finance lease receivables can be subdivided into the following durations: | ||||||||
| Less than one year | 133,052 | 172,495 | ||||||
| More than one year but less than five years | 280,982 | 316,071 | ||||||
| More than five years | 4,660 | 2,240 | ||||||
| Total | 418,694 | 490,806 | ||||||
| [12] Other long term financial assets | Book value at December 1, 2004/2003 | 126,654 | 106,503 | |||||
| Acquisition subsidiary | 479 | — | ||||||
| New amounts receivable | 3,455 | 31,284 | ||||||
| Repayments | –17,790 | –7,608 | ||||||
| Foreign currency translations | 5,262 | –3,525 | ||||||
| Book value at November 30 | 118,060 | 126,654 | ||||||
‘Other long term financial assets’ includes the deferred tax assets of € 98.6 million [2004: € 106.6 million], see note [24]. This item also includes an amount of € 0.3 million [2004: € 0.4 million] for loans provided to the Board of Executive Directors. The specification of this amount is as follows: R.L. van Iperen € 0.1 million, J. van den Belt € 0.1 million and J.F. Dix € 0.1 million. These loans are interest-free and were made available prior to November 30, 2002. Repayment takes place upon exercise or cancellation of the annual tranche of options in respect of which the loan was provided.
An amount of € 0.7 million [2004: € 1.1 million] was provided to personnel in the form of loans. | ||||||||
98
Notes to the Consolidated Balance Sheet
| Current assets | 2005 | 2004 | x € 1,000 | |||||
| [13]Inventories | Raw and other materials | 61,441 | 35,723 | |||||
| Semi-finished products and spare parts | 134,916 | 135,087 | ||||||
| Finished products and trade inventories | 167,166 | 146,525 | ||||||
| Total | 363,523 | 317,335 | ||||||
| [14]Accounts receivable | Trade accounts receivable | 572,705 | 451,911 | |||||
| Discounted trade bills | –27 | –11 | ||||||
| Finance lease | 133,052 | 172,495 | ||||||
| Income taxes | 59,509 | 25,555 | ||||||
| Other receivables | 65,618 | 57,960 | ||||||
| Total | 830,857 | 707,910 | ||||||
Trade debtors have been reduced by a provision for bad debt amounting to € 58 million [2004: € 54 million]. During the financial year € 12.3 million [2004: € 15.5 million] was charged to the Statement of Operations on account of non- collectability and € 7.5 million was credited to the Statement of Operations from the release of the provision due to a change in accounting estimate.
Both these items have been included under the heading ‘Selling expenses’. | ||||||||
| [15]Cash and cash equivalents | Cash and bank balances | 39,575 | 26,401 | |||||
| Time deposits | 103,124 | 286,659 | ||||||
| Total | 142,699 | 313,060 | ||||||
| The effective interest rate on the deposits is 1.98% [2004: 2.09%]. These deposits have an average duration of 1 day [2004: 5.8 days]. | ||||||||
99
Notes to the Consolidated Balance Sheet
| Group equity | 2005 | 2004 | x € 1,000 | |||||
| Authorised capital* | Ordinary shares | 72,500 | 72,500 | |||||
| Priority shares | 2 | 2 | ||||||
| Financing preference shares | 15,000 | 15,000 | ||||||
| Protective preference shares | 87,500 | 87,500 | ||||||
| Total | 175,002 | 175,002 | ||||||
| Paid-up share capital | [16]Ordinary shares | |||||||
| Amount at December 1, 2004/2003 | 43,634 | 43,631 | ||||||
| Conversion of convertible loans | 3 | 3 | ||||||
| At November 30 | 43,637 | 43,634 | ||||||
| [17]Priority shares | ||||||||
| At November 30 | 2 | 2 | ||||||
| [18]Financing preference shares | ||||||||
| At November 30 | 10,000 | 10,000 | ||||||
| [19]Paid-in capital | At December 1, 2004/2003 | 511,445 | 511,408 | |||||
| Conversion of convertible loans | 40 | 37 | ||||||
| At November 30** | 511,485 | 511,445 | ||||||
| [20]Legal reserve | Reserve for non-distributed income of minority interests and capitalised development costs | |||||||
| At December 1, 2004/2003 | 2,441 | 592 | ||||||
| Movement in reserve of non-distributed income | 155 | 357 | ||||||
| Movement in reserve of capitalised development costs | –341 | 1,492 | ||||||
| At November 30 | 2,255 | 2,441 | ||||||
| [21]Translationdifferences | At December 1, 2004/2003 | –140,391 | –114,477 | |||||
| Foreign currency translations | 36,631 | –25,914 | ||||||
| At November 30 | –103,760 | –140,391 | ||||||
* For further information about authorised capital see page 121.
** If distributed in the form of shares, this amount is available to shareholders without attracting the Dutch dividend withholding tax. | ||||||||
100
Notes to the Consolidated Balance Sheet
| 2005 | 2004 | x € 1,000 | ||||||
| [22]Other reserves | Retained earnings | |||||||
| At December 1, 2004/2003 | 261,148 | 253,698 | ||||||
| Movement in Legal reserve | 186 | -1,849 | ||||||
| Net income previous financial year | 78,076 | 61,462 | ||||||
| Result on shares purchased via exercise of options | -1,240 | -192 | ||||||
| Dividend | -50,412 | -51,971 | ||||||
| At November 30 | 287,758 | 261,148 | ||||||
Repurchased shares relating to the Stock Option Plan | ||||||||
| At December 1, 2004/2003 | -52,285 | -53,551 | ||||||
| Repurchased | -1,517 | — | ||||||
| Exercise of options | 4,419 | 1,266 | ||||||
| At November 30 | -49,383 | -52,285 | ||||||
| Repurchased shares are valued at cost; the average purchase price amounts to € 13.85 [2004: € 13.94] | ||||||||
| Total other reserves | 238,375 | 208,863 | ||||||
Overview of movements in number of shares outstanding | number at 1-12-2004 | conversion | repurchase | exercise of options | number at 30-11-2005 | |||||
Ordinary shares | 87,268,562 | 5,898 | — | — | 87,274,460 | |||||
Repurchased shares relating to the Stock Option Plan | 3,750,442 | — | 116,430 | -302,000 | 3,564,872 | |||||
Number of ordinary shares | 83,518,120 | 5,898 | -116,430 | 302,000 | 83,709,588 | |||||
Priority shares | 30 | — | — | — | 30 | |||||
Financing preference shares | 20,000,000 | — | — | — | 20,000,000 |
| 2005 | 2004 | x € 1,000 | ||||||
| [23]Minority interest | At December 1, 2004/2003 | 38,209 | 38,822 | |||||
| Capital distribution | -3,092 | -3,099 | ||||||
| Share in income | 2,294 | 2,535 | ||||||
| Foreign currency translations | -5 | -49 | ||||||
| At November 30 | 37,406 | 38,209 | ||||||
101
Notes to the Consolidated Balance Sheet
Long term liabilities [provisions] x € 1,000 | as at 1-12-2004 | acquisition subsidiary | addition charged to Statement of Operations | release to Statement of Operations | withdrawals | differences in exchange rates | as at 30-11-2005 | |||||||||
[24] | ||||||||||||||||
| Provisions for: | ||||||||||||||||
| Deferred income tax liabilities | 6,918 | 33,605 | 3,625 | — | — | 871 | 45,019 | |||||||||
| Pension liabilities | 407,246 | — | 53,892 | -68,532 | -47,811 | 2,156 | 346,951 | |||||||||
| Early retirement provision | 16,195 | — | 5,591 | -673 | -5,943 | 13 | 15,183 | |||||||||
| Liabilities termination employment contracts | 32,456 | — | 3,833 | -6 | -2,151 | 90 | 34,222 | |||||||||
| Reorganisation | 24,801 | — | 21,976 | -1,354 | -16,405 | 309 | 29,327 | |||||||||
| Other | 28,361 | 2,291 | 17,184 | -2,241 | -4,337 | 984 | 42,242 | |||||||||
| Total | 515,977 | 35,896 | 106,101 | -72,806 | -76,647 | 4,423 | 512,944 | |||||||||
| The short term part of these provisions is approximately € 163 million [2004: € 85 million]. | ||||||||||||||||
Of the total reorganisation and integration costs of € 33.1 million, an amount of € 22 million has been included under the reorganisation provision and € 11.1 million under other provisions.
Of the release of the provision for pensions an amount of € 68.4 million relates to the change in the pension scheme in the Netherlands. | ||||||||||||||||
102
Notes to the Consolidated Balance Sheet
| 2005 | 2004 | x € 1,000 | ||||||||||
| assets | liabilities | assets | liabilities | |||||||||
Provision for deferred income tax liabilities | The composition of deferred income tax assets and liabilities is as follows: | |||||||||||
| Intangible fixed assets | 23,309 | 34,022 | 19,917 | — | ||||||||
| Leasing | — | 6,699 | — | 37,942 | ||||||||
| Other fixed assets | 29,083 | — | 45,490 | 714 | ||||||||
| Current assets | 30,590 | 121 | 44,136 | — | ||||||||
| Long term liabilities and provisions | 42,304 | — | 71,115 | — | ||||||||
| Current liabilities | 285 | 18,977 | 130 | 20,264 | ||||||||
| Total deferred assets/liabilities | 125,571 | 59,819 | 180,788 | 58,920 | ||||||||
| Deferred assets/liabilities netted by fiscal entity | 110,771 | 45,019 | 128,786 | 6,918 | ||||||||
| Carry forward losses | 24,048 | — | 14,377 | — | ||||||||
| Non-recognised deferred income tax assets | -36,196 | — | -36,604 | — | ||||||||
| Provision for deferred income tax assets and liabilities | 98,623 | 45,019 | 106,559 | 6,918 | ||||||||
| Deferred income tax assets form part of the balance sheet caption ‘Other long term financial assets’. [12] | ||||||||||||
| The claim for carry forward losses as at November 30, 2005 falls due as follows: | 2009 | 2010 | after 2010 | unlimited | total | |||||||
| x € million | 1.1 | 0.3 | 5.5 | 17.1 | 24.0 | |||||||
103
Notes to the Consolidated Balance Sheet
| The changes in deferred income tax assets and liabilities were as follows: | 2005 | 2004 | x £ 1,000
| ||||||
| At December 1, 2004/2003 | -99,641 | -53,464 | |||||||
| Acquisition subsidiary | 33,605 | — | |||||||
| Exchange rate differences | -4,187 | -3,262 | |||||||
| Statement of Operations | 16,619 | -42,915 | |||||||
| At November 30 | -53,604 | -99,641 | |||||||
| Pension liabilities | With effect from 2003 the pension accounting standard ‘IAS 19’ has been applied. | ||||||||
| The principal actuarial assumptions are: | |||||||||
| Discount rate | 4.47 | 4.87 | per cent | ||||||
| Expected return on pension assets | 6.67 | 6.62 | |||||||
| Expected increase in salaries | 2.69 | 2.70 | |||||||
| Expected increase in benefits | 2.05 | 2.05 | |||||||
| The amounts charged to the Statement of Operations are as follows: | |||||||||
| Service costs | 47,595 | 42,663 | |||||||
| Interest costs | 67,596 | 65,285 | |||||||
| Expected return on pension assets | -62,163 | -54,322 | |||||||
| Other | -67,025 | * | -249 | ||||||
| Pension costs | -13,997 | 53,377 | |||||||
| Recognition for pension costs in the Statement of Operation: | |||||||||
| Cost price | 15,204 | 22,612 | |||||||
| Selling expenses | 2,659 | 16,357 | |||||||
| Research and development expenses | -15,059 | 5,582 | |||||||
| General and administrative expenses | -16,801 | 8,826 | |||||||
| Total | -13,997 | 53,377 | |||||||
* This mainly relates to the release of the pension provision of € 68.4 million. See page 91. | |||||||||
104
Notes to the Consolidated Balance Sheet
| The amounts included in the balance sheet are shown below: | 2005 | 2004 | x € 1,000
| ||||||
Present value of funded pension obligations | –1,284,391 | –1,169,973 | |||||||
Fair value of plan assets | 1,077,013 | 896,934 | |||||||
| –207,378 | –273,039 | ||||||||
Present value of unfunded pension obligations | –256,686 | –216,981 | |||||||
Status of the funds | –464,064 | –490,020 | |||||||
Actuarial losses not yet included | 118,259 | 83,515 | |||||||
Back service not yet included | 36 | 161 | |||||||
Pension provisions | –345,769 | –406,344 | |||||||
| These pension provisions are stated in the Consolidated Balance Sheet as follows: | |||||||||
Pension provisions | –346,951 | –407,246 | |||||||
Other long term financial assets | 1,182 | 902 | |||||||
Total | –345,769 | –406,344 | |||||||
| Movements in pension liabilities: | 2005 | 2004 | x € 1,000
| ||||||
Pension liabilities at December 1, 2004/2003 | –1,386,954 | –1,204,068 | |||||||
Service costs | –47,595 | –42,663 | |||||||
Interest costs | –67,596 | –65,285 | |||||||
Employee contributions | –13,868 | –12,478 | |||||||
Amendments | 69,615 | * | 684 | ||||||
Actuarial losses | –111,102 | –109,712 | |||||||
Benefits paid | 37,007 | 33,193 | |||||||
Exchange rate differences | –20,584 | 13,375 | |||||||
Pension liabilities at November 30 | –1,541,077 | –1,386,954 | |||||||
Changes in pension assets: | |||||||||
Fair value of pension assets at | |||||||||
December 1, 2004/2003 | 896,934 | 788,404 | |||||||
Actual return on investments | 139,101 | 62,456 | |||||||
Employer contributions | 48,711 | 76,221 | |||||||
Employee contributions | 13,868 | 12,478 | |||||||
Benefits paid | –37,007 | –33,193 | |||||||
Exchange rate differences | 15,406 | –9,432 | |||||||
Fair value of pension assets at November 30 | 1,077,013 | 896,934 | |||||||
* This mainly relates to the change in the pension scheme in the Netherlands and results in the release of the pension provision of € 68.4 million, net of the related and not yet recognised actuarial losses of € 1.2 million. See page 91. | |||||||||
105
Notes to the Consolidated Balance Sheet
| [25] | Long term debt | 2005 | 2004 | x € 1,000 | ||||
| Convertible debentures to Company personnel | 8,189 | 10,360 | ||||||
| Loans | 211,871 | 424,650 | ||||||
| Finance lease obligations | 7,052 | 3,399 | ||||||
| Total | 227,112 | 438,409 | ||||||
| Convertible debentures to Company personnel | Employees may opt for convertible personnel debentures under the annual profit-sharing scheme. The duration is 6.5 years. The average interest is 4.2% [2004: 4.3%] and the average conversion price is € 11.94 [2004: € 14.66]. | |||||||
| Loans | principal amount x € 1,000 | average interest rate [%] at November 30 | redemption | amounts due after more than five years x € 1,000 | ||||||
Euro debenture loan | 123,129 | 6.25 | 2007 | — | ||||||
Euro | 4,538 | 5.84 | 2013 | 4,538 | ||||||
US dollar | 33,585 | 5.06 | 2008 | — | ||||||
Other | 50,619 | 3.58 | 2007/2008 | 3 | ||||||
Total | 211,871 | 5.41 | 4,541 | |||||||
| The fixed interest rates of the euro [debenture] loans have been fully swapped into variable interest rates. The heading ‘Loans’ also includes multi-year stand-by credit facilities. The fair value of the above loans is € 10.4 million higher than the principal amount [2004: € 26.5 million]. | ||||||||||
| The short term portion of the loans amounting to € 214 million [2004: € 26 million] is shown under ‘Bank borrowings’. | ||||||||||
| Finance lease obligations | Redemption of the finance lease obligations will take place from 2006 up to and including 2010. The short term portion is shown under ‘Bank borrowings’. The interest rate amounts to 8.8% [2004: 6%]. | |||||||||
106
Notes to the Consolidated Balance Sheet
| Current liabilities | 2005 | 2004 | x € 1,000 | |||||
| [26]Short term debt | Borrowings under bank lines of credit | 12,336 | 15,052 | |||||
| Bank borrowings | 656,880 | 27,790 | ||||||
| Total | 669,216 | 42,842 | ||||||
| To finance the acquisition of Imagistics International Inc. Océ took out a bridging loan for a maximum period of nine months. This loan will be converted into a long term financing arrangement in 2006. | ||||||||
| [27]Other liabilities | Trade accounts payable | 185,756 | 126,579 | |||||
| Notes payable | 8,286 | 5,832 | ||||||
| Income taxes | 3,967 | 10,622 | ||||||
| Other taxes and social security payable | 60,175 | 57,999 | ||||||
| Pension liabilities | 2,505 | 1,699 | ||||||
| Preference dividend | 2,108 | 3,551 | ||||||
| Other | 22,795 | 12,784 | ||||||
| Total | 285,592 | 219,066 | ||||||
| [28]Accrued liabilities | Salary expenses and payroll taxes | 156,477 | 144,949 | |||||
| Other costs | 93,643 | 74,410 | ||||||
| Total | 250,120 | 219,359 | ||||||
107
Notes to the Consolidated Balance Sheet
Financial instruments
Financial instruments are used to hedge against the financial risks that are inherent to the Group’s underlying commercial activities. For an explanation of the foreign exchange management policy, see page 70.
Foreign exchange risks The foreign exchange management policy is aimed at protecting the operating margin and [intercompany] loan exposures in foreign currencies. Forward foreign exchange contracts are entered into to control these foreign exchange risks. The contract value and fair value of foreign exchange forward contracts at balance sheet date are as follows [in millions]:
| • | in respect of future cash flows: € 237.2 and € –9.9 [2004: € 225.0 and € 7.9]; |
| • | in respect of [intercompany] loans: € 197.0 and € 0.2 [2004: € 79.8 and € 1.3]. |
Interest rate risks Interest rate instruments are used to achieve the desired risk profile in terms of fixed and variable interest rate exposures. The central objective of the policy is to prevent a mismatch between the portfolio of rentals and leases and the financing of the Group. Efforts are made to achieve a ratio of 60 to 80% between the above fixed-interest assets and the related liabilities. At balance sheet date the contract value/notional amount and the fair value of interest rate instruments [Interest Rate Swaps] are as follows [in millions]: € 580.2 and € 12.8 [2004: € 431.5 and € 21.0].
Credit risks These risks are reduced by doing business solely with financial institutions which have a high credit rating, with fixed limits being applied to each separate institution.
Commitments and contingent liabilities not stated in the Balance Sheet
Operational lease receivables These are lease receivables arising from contracts for the equipment rented out to third parties. The future minimum rental revenues amount to:
x € million
| 2005 | 2004 | ||
Less than one year | 173 | 66 | ||
More than one year but less than 5 years | 174 | 87 | ||
| 347 | 153 | |||
Contingent liabilities
| ||||
x € million
| 2005 | 2004 | ||
Guarantee commitments | 2.5 | 2.8 | ||
Government development credits | 48.0 | 49.2 |
Guarantee commitments include guarantees given in respect of import duties and loans from third parties.
Legal proceedings Océ is involved in a number of legal proceedings, most of which relate to matters resulting from the normal conduct of business. Océ does not expect these court cases to result in obligations that may have a material effect on the company’s financial position. To cover those cases in which it is likely that the outcome of the legal proceedings will be unfavourable for Océ and in which the resultant obligation can be reliably estimated, a provision has been made in the consolidated financial statements.
108
Notes to the Consolidated Balance Sheet
Other commitments Repurchase commitments amounting to € 7.7 million [2004: € 7.9 million] exist under the terms of lease contracts with third parties. In respect of these commitments, the amount expected to be paid within one year is nil [2004: nil] and the amount expected to be paid within five years is € 7.7 million [2004: € 7.9 million]. As a result of these commitments the machines can be sold again upon their return. The estimated market value upon return is higher than the repurchase commitment.
Total contracted operating lease commitments amount to € 315 million [2004: € 313 million]. These commitments fall due over the next years. The maturity dates over the next years are as follows:
| x € million | ||||
2006 | 90 | |||
2007 | 62 | |||
2008 | 47 | |||
2009 | 31 | |||
2010 | 27 | |||
after 2010 | 58 | |||
Total | 315 |
Other commitments, such as buying contracts etc., have been entered into solely as part of normal business operations.
Option plan
As an incentive for the achievement of the Company’s objectives over the long term Océ operated an option plan up to and including the 2004 financial year in which decisions were taken each year on the granting to certain senior company executives of option rights and/or Share Appreciation Rights [SARS] in respect of ordinary shares in Océ. ASAR is the right to receive payment of the share price gain, whereby the share price gain is the difference between the stock market price of the share on the day of exercise and the exercise price fixed on the day when the grant was made. Instead of receiving payment of the share price gain, a participant may also request delivery of shares.
In addition, conditional options were also granted to a limited number of participants. In 2004 the option plan for the members of the Board of Executive Directors was replaced by a share plan. At the beginning of 2005 a conditional right to shares was granted to the members of the Board of Executive Directors for the first time. In 2005 the option plan for the other participants was also replaced by a share plan. At the beginning of 2006 a conditional right to shares will also be granted to these other participants for the first time. As a consequence, no more option rights and/orSARS were granted in 2005.
109
Notes to the Consolidated Balance Sheet
Regulations Participation in the Océ Stock Option Plan is subject to regulations so as to prevent the misuse of inside information. Participants are prohibited from trading in Océ options on the Euronext Options Exchange in Amsterdam and are not allowed to dispose of or pledge the options that they have been granted. Participants have to transfer the exercise of their options to an independent Trustee designated by the company; this Trustee will then exercise the options according to the instructions given by the participants. Participants can only give such instructions if they are not in possession of inside information during the designated exercise periods. A designated period is a period of at most 9 stock exchange trading days after publication of the quarterly results.
Total number of options/SARS As at November 30, 2005 a total of 2,627,000 unconditional option rights orSARS [2004: 3,675,500] in respect of ordinary shares were outstanding at an average exercise price of € 12.22 [2004: € 13.17], whilst a total of 876,000 conditional option rights [2004: 1,280,000], based on anOIPS norm of at least 10%, had been granted at an average exercise price of € 11.67 [2004: € 11.39]. The average remaining duration of these options is five years.
Purchase of shares The company’s policy is to purchase the shares required to satisfy the Océ Stock Option Plan either before or upon exercise of the option rights. Shares may also be issued to cover commitments under existing stock option plans. For the purpose of delivering ordinary shares as a result of the exercise of options, nil shares were purchased in 2005 [2004: nil shares] and nil shares [2004: nil shares] were issued at the moment of exercise. The table below gives more details about the share options andSARS outstanding as at November 30, 2005. During 2005 116,430 shares were bought in [2004: nil] to cover commitments under the existing Stock Option Plans and 302,000 shares [2004: 106,500] were used, which means that the total number of shares purchased amounts to 3,564,872 [2004: 3,750,442].
Stock Option Plan of year | number of options granted | exercise price in euro | options forfeited | exercised number of options | outstanding at November 30, 2005 | expiration date | ||||||||||
2001 | 847,500 | 18.10-24.44 | 443,500 | — | 404,000 | 29-11-2005/2006 | ||||||||||
2002 | unconditional | 716,000 | 9.77-13.19 | 29,000 | 220,500 | 466,500 | 28-11-2009/2010 | |||||||||
2002 | conditional | 392,000 | 9.77 | 392,000 | — | — | 28-11-2009/2010 | |||||||||
2003 | unconditional | 793,000 | 10.75-14.51 | 14,000 | 182,000 | 597,000 | 27-11-2010/2011 | |||||||||
2003 | conditional | 470,000 | 10.75 | 470,000 | — | — | 27-11-2010/2011 | |||||||||
2004 | unconditional | 692,500 | 12.21-16.48 | 16,000 | 33,000 | 643,500 | 26-11-2011/2012 | |||||||||
2004 | conditional | 446,000 | 12.21 | 62,000 | — | 384,000 | 26-11-2011/2012 | |||||||||
2005 | unconditional | 523,000 | 11.25-15.19 | 7,000 | — | 516,000 | 30-11-2012/2013 | |||||||||
2005 | conditional | 492,000 | 11.25 | — | — | 492,000 | 30-11-2012/2013 | |||||||||
Total | 5,372,000 | 1,433,500 | 435,500 | 3,503,000 | ||||||||||||
110
Notes to the Consolidated Balance Sheet
The table below shows the rights granted under this Option plan to the members of the Executive Board.
| Stock Option Plan of year | number of options granted | exercise price in euro | outstanding at November 30, 2005 | expiration date | ||||||||
R.L. van Iperen | 2001 | 42,000 | 18.10 | 42,000 | 29-11-2006 | |||||||
| 2002 | unconditional | 21,000 | 9.77 | 21,000 | 28-11-2010 | |||||||
| 2003 | unconditional | 21,000 | 10.75 | 21,000 | 27-11-2011 | |||||||
| 2004 | unconditional | 21,000 | 12.21 | 21,000 | 26-11-2012 | |||||||
| 2004 | conditional | 42,000 | 12.21 | 42,000 | 26-11-2012 | |||||||
J. van den Belt | 2001 | 35,000 | 18.10 | 35,000 | 29-11-2006 | |||||||
| 2002 | unconditional | 17,500 | 9.77 | 17,500 | 28-11-2010 | |||||||
| 2003 | unconditional | 17,500 | 10.75 | 17,500 | 27-11-2011 | |||||||
| 2004 | unconditional | 17,500 | 12.21 | 17,500 | 26-11-2012 | |||||||
| 2004 | conditional | 35,000 | 12.21 | 35,000 | 26-11-2012 | |||||||
J.F. Dix | 2001 | 35,000 | 18.10 | 35,000 | 29-11-2006 | |||||||
| 2002 | unconditional | 17,500 | 9.77 | 17,500 | 28-11-2010 | |||||||
| 2003 | unconditional | 17,500 | 10.75 | 17,500 | 27-11-2011 | |||||||
| 2004 | unconditional | 17,500 | 12.21 | 17,500 | 26-11-2012 | |||||||
| 2004 | conditional | 35,000 | 12.21 | 35,000 | 26-11-2012 | |||||||
Share Plan In 2004 the option plan for the members of the Board of Executive Directors was replaced by a share plan. The Share plan [of March 1, 2005] comprises the conditional granting of shares in OcéN.V. This grant is conditional on the achievement of certain performance criteria that are fully focused on the creation of shareholder’s value. Each year a three year plan with a conditional granting period starts in which the company’s performance is measured at the end of the relevant period against that of a peer group of companies. The relative ranking that Océ achieves in the peer group determines the definitive number of shares that are granted. This number corresponds to a percentage [at most 60%] of the fixed reference salary divided by the price of the share on the stock market on the first day of the performance period. The shares from this plan thus acquired after three years must be retained by the members of the Board of Executive Directors for a further period of three years.
| Share Plan of year | number of conditionally shares granted | stock price at first day of performance period in euro | conditionally outstanding shares at November 30, 2005 | expiration date | ||||||||
R.L. van Iperen | 2005 | 28,685 | 12.55 | 28,685 | 28-02-2008 | |||||||
J. van den Belt | 2005 | 21,514 | 12.55 | 21,514 | 28-02-2008 | |||||||
J.F. Dix | 2005 | 21,514 | 12.55 | 21,514 | 28-02-2008 | |||||||
111
Notes to the Consolidated Balance Sheet
| Net income and Shareholders’ equity based on United States accounting principles | United States generally accepted accounting principles [USGAAP]
Océ’s consolidated financial statements are drawn up on the basis of the accounting principles applied in the Netherlands, which differ in a number of respects from United States generally accepted accounting principles [USGAAP]. The following statements give an approximate indication of the effect that application ofUSGAAP would have on net income, earnings per share and shareholders’ equity. This information is presented in greater detail in the 20-F statement which will be submitted to the Securities and Exchange Commission and will be available on request by early March 2006. | |
| 2005 | 2004 | x € million
| ||||||
| Net income as reported in the Consolidated Statement of Operations | 78.8 | 78.1 | ||||||
| USGAAP adjustments | Amortisation of goodwill | 1.8 | –2.3 | |||||
| Costs Imagistics not included in opening balance | –2.8 | — | ||||||
| Release [addition] provision | 3.0 | –12.4 | ||||||
| Product development costs | 0.3 | –1.5 | ||||||
| Pension costs | –15.9 | –14.2 | ||||||
| Change pension scheme the Netherlands | –68.4 | — | ||||||
| Derivatives/financial instruments | –2.6 | 4.2 | ||||||
| Option plan | –1.0 | –1.3 | ||||||
| Sale lease portfolio | 1.8 | –13.9 | ||||||
| Deferred income taxes on above adjustments | 13.2 | 22.6 | ||||||
| Net income underUSGAAP | 8.2 | 59.3 | ||||||
| Earnings per ordinary share of € 0,50 nominal | Based on average number of shares outstanding [basic] | 0.07 | 0.67 | euro | ||||
| Based on increase upon conversion/options [diluted] | 0.08 | 0.66 | euro | |||||
| Shareholders’ equity as included in the consolidated balance sheet | 780.8 | 714.1 | ||||||
| USGAAPadjustments | Intangible fixed assets | 194.3 | 195.3 | |||||
| Provisions | 25.2 | 22.2 | ||||||
| Product development costs | –1.2 | –1.5 | ||||||
| Pension provision | 192.3 | 274.7 | ||||||
| Additional minimum pension liability | –134.7 | –163.8 | ||||||
| Derivatives/financial instruments | 10.0 | 28.9 | ||||||
| Sale lease portfolio | –12.1 | –13.9 | ||||||
| Deferred income taxes on above adjustments | –16.2 | –28.6 | ||||||
| Shareholders’ equity underUSGAAP | 1,038.4 | 1,027.4 | ||||||
112
Notes to the Consolidated Balance Sheet
Balance sheet items under USGAAP
| UnderUSGAAP the Consolidated Balance Sheet items set out below
| 2005 | 2004 | x € million
| ||||
| Intangible fixed assets | 745.4 | 233.6 | ||||||
| Tangible fixed assets | 578.8 | 481.4 | ||||||
| Financial fixed assets | 345.2 | 359.2 | ||||||
| Current assets | 1,366.3 | 1,355.3 | ||||||
| Group equity | 1,075.8 | 1,065.6 | ||||||
| Long term liabilities [provisions] | 318.3 | 247.7 | ||||||
| Long term debt | 222.0 | 438.4 | ||||||
| Current liabilities | 1,419.6 | 677.8 | ||||||
The main differences between the accounting principles applied by Océ [DutchGAAP] andUSGAAP are summarised below:
• Amortisation of goodwill Goodwill paid has been capitalised by Océ with effect from December 1, 2000. Previously goodwill was charged direct to Shareholders’ equity.USGAAP requires goodwill to be capitalised and following the adoption ofFAS 142 as from December 1, 2002 goodwill is no longer allowed to be amortised, rather it is subject to an annual impairment test. Prior to December 1, 2002 goodwill was amortised on a straight-line basis over a period of 10 to 40 years. Goodwill relating to acquisitions made after June 15, 2000 is no longer amortised but is subject to the impairment test as described above.
• Costs Imagistics not included in opening balance These are costs which underUSGAAP are not allowed to be recognised as a liability in the opening balance.
• Provision UnderUSGAAP the formation of a provision is subject to more stringent criteria. For this reason certain elements of a provision are often not yet recognised inUSGAAP.
• Product development costs These costs are not allowed to be capitalised underUSGAAP.
• Pension costs UnderUSGAAP pension costs are calculated according toFAS 87. At the transition toIAS 19 in the 2003 financial year all unrecognised actuarial losses have been charged to Shareholders’ equity, whilstUSGAAP requires these unrealised losses to be amortised over the average remaining period of service.
• Change pension scheme the Netherlands UnderIAS 19 this change is a one time result. UnderUSGAAP this result will be amortised over the average remaining period of service, which will have a positive effect on theUSGAAP results in future years.
• Derivatives/financial instruments Under DutchGAAP, receivables and liabilities, denominated in a foreign currency, including foreign exchange contracts, should in principle be carried at cost, translated into euros at the exchange rates prevailing at year end.USGAAP requires financial instruments to be included at their fair market value.
• Option Plan UnderUSGAAP the Option Plan is subject to ‘variable option plan accounting’, which implies that up to the moment when the entitlement becomes definitive [two or three years] the difference between the fair market value of the share and the exercise price is charged as costs.
• Sale lease portfolio The assets relating to existing finance lease contracts transferred to a buyer can be split into finance lease receivables and the equipment residual value.USGAAP applies different rules to achieve sales type treatment for these assets, which have not been met for the equipment residual value. | ||||||||
113
OcéN.V. | Balance Sheet November 30
114
OcéN.V. | Balance Sheet November 30
Liabilities | 2005 | 2004 | x € 1,000
| |||||
| Shareholders’ equity | Ordinary shares | 43,637 | 43,634 | |||||
| Priority shares | 2 | 2 | ||||||
| Financing preference shares | 10,000 | 10,000 | ||||||
| Paid-in capital | 511,485 | 511,445 | ||||||
| Legal reserve | 2,255 | 2,441 | ||||||
| Translation differences | –103,760 | –140,391 | ||||||
| Other reserves | 238,375 | 208,863 | ||||||
| Net income | 78,838 | 78,076 | ||||||
| 780,832 | 714,070 | |||||||
| Long term liabilities | Provision for deferred income tax liabilities | 1,420 | 1,410 | |||||
| Long term debt | Amounts payable to consolidated companies | 34 | 18,844 | |||||
| Long term liabilities [33] | 135,856 | 333,382 | ||||||
| 135,890 | 352,226 | |||||||
| Current liabilities | Amounts payable to consolidated companies | 293,217 | 296,784 | |||||
| Short term debt [34] | 597,512 | 8,968 | ||||||
| Other liabilities [35] | 4,520 | 3,555 | ||||||
| Accrued liabilities | 5,686 | 3,734 | ||||||
| 900,935 | 313,041 | |||||||
| Total | 1,819,077 | 1,380,747 | ||||||
115
OcéN.V. | Notes to the Balance Sheet and the Statement of Operations
| Summary of Significant Accounting Principles | ||||||||
| The accounting principles are the same as those used for the consolidated financial statements. The Statement of Operations has been drawn up in accordance with the provisions of Article 402, Book 2, of the Dutch Civil Code. | ||||||||
Financial fixed assets
| ||||||||
| Affiliated companies | For a list of companies affiliated to the Group in the Netherlands and elsewhere see pages 127 and 128. Principal affiliated companies are included at the pro rata value of Océ’s share in their net assets value. | |||||||
| 2005 | 2004 | x € 1,000 | ||||||
| [29] Consolidated companies | Book value at December 1, 2004/2003 | 469,272 | 491,338 | |||||
| Changes in the value of consolidated companies due to: | ||||||||
| Incorporation and capital increase | 147,838 | 24 | ||||||
| Equity in income | 68,653 | 74,248 | ||||||
| Elimination result on transactions between Group companies | –23,354 | –33,378 | ||||||
| Capital decrease | –17,475 | –15,080 | ||||||
| Dividend | –34,295 | –22,832 | ||||||
| Foreign currency translations | 36,453 | –25,048 | ||||||
| Book value at November 30 | 647,092 | 469,272 | ||||||
| In 2005 Orange Merger Corp. was established. Imagistics International Inc. was acquired via this affiliated company. Following the acquisition Orange Merger Corp. and Imagistics International Inc. were merged. | ||||||||
| Results on Intercompany transactions, related to changes in Group structure, in the Company Financial Statements are eliminated based on the new DutchGAAP accounting guideline regarding intercompany transactions [RJ 260.3]. The figures of 2004 are for comparability adjusted accordingly. | ||||||||
116
OcéN.V. | Notes to the Balance Sheet and the Statement of Operations
| 2005 | 2004 | x € 1,000 | ||||||
| [30] Amounts receivable from consolidated companies | At December 1, 2004/2003 | 530,406 | 639,218 | |||||
| Payment | 578,587 | 14,369 | ||||||
| Repayments | –170,295 | –107,606 | ||||||
| Foreign currency translations | 31,124 | –15,575 | ||||||
| Book value at November 30 | 969,822 | 530,406 | ||||||
| [31] Minority interests in associates | Book value at December 1, 2004/2003 | 1,467 | 2,301 | |||||
| Changes in the value of minority interests due to: | ||||||||
| Equity in income | 66 | 494 | ||||||
| Dividend | — | –104 | ||||||
| Other | — | –1,144 | ||||||
| Foreign currency translations | –56 | –80 | ||||||
| Book value at November 30 | 1,477 | 1,467 |
117
OcéN.V. | Notes to the Balance Sheet and the Statement of Operations
| Current assets | 2005 | 2004 | x € 1,000 | |||||
[32] Cash and cash equivalents | Cash and bank balances | 6,579 | 12,431 | |||||
Time deposits | 101,900 | 281,395 | ||||||
Total | 108,479 | 293,826 | ||||||
| Shareholders’ equity | ||||||||
For specification see pages 100 and 101. | ||||||||
| Long term debt | ||||||||
[33]Long term liabilities | Convertible debentures to Company personnel | 8,189 | 10,360 | |||||
Loans | 127,667 | 323,022 | ||||||
Total | 135,856 | 333,382 | ||||||
| Convertible debentures to Company personnel | Employees may opt for convertible personnel debentures under the annual profit-sharing scheme. The duration is 6.5 years. The average interest rate is 4.2% [2004: 4.3%] and the average conversion price is € 11.94 [2004: € 14.66].
| |||||||
Loans | principal amount x € 1,000 | average interest rate [%] at November 30 | redemption | amounts due after more than five years x € 1,000 | ||||||
| Euro debenture loan | 123,129 | 6.25 | 2007 | — | ||||||
| Euro | 4,538 | 5.84 | 2013 | 4,538 | ||||||
| Total | 127,667 | 6.24 | 4,538 | |||||||
The fixed interest rates of the euro [debenture] loans have been fully swapped into variable interest rates.
The total fair value of the above loans exceeds the principal amount by € 10.4 million [2004: € 26.4 million]
The short term portion of the loans amounting to € 154 million [2004: € 1 million] is shown under ‘Bank borrowings’. |
118
OcéN.V. | Notes to the Balance Sheet and the Statement of Operations
| Current liabilities | 2005 | 2004 | x € 1,000 | |||||
[34] Short term debt | Borrowings under bank lines of credit | 5,324 | 7,711 | |||||
| Bank borrowings | 592,188 | 1,257 | ||||||
| Total | 597,512 | 8,968 | ||||||
| To finance the acquisition of Imagistics International Inc. Océ took out a bridging loan for a maximum period of nine months. This loan will be converted into a long term financing arrangement in 2006. | ||||||||
[35] Other liabilities | Preference dividend | 2,108 | 3,551 | |||||
| Other | 2,412 | 4 | ||||||
| Total | 4,520 | 3,555 | ||||||
| Commitments and contingent liabilities not stated in the balance sheet | 2005 | 2004 | x €1,000 | |||||
Other commitments | Bank guarantees for Group companies | 38.5 | 104.5 | |||||
| Collateral security provided for Group companies | 54.5 | 52.1 | ||||||
| For an explanation of the financial instruments see page 108. | ||||||||
119
Upon adoption of this proposed net income appropriation, the dividend for the 2005 financial year will be: € 2 per priority share of € 50, € 0.11 [rounded] per financing preference share of € 0.50 and € 0.58 per ordinary share of € 0.50. The final dividend per ordinary share for the 2005 financial year will amount to € 0.43, as a distribution of € 0.15 per ordinary share was made on October 26, 2005 on account of the expected dividend. It is proposed to make the final dividend per ordinary share available fully in cash. This proposed net income appropriation is in conformity with Article 36 of the Company’s Articles of Association.
Extract from the Articles of Association relating to net income appropriation The rules for net income appropriation as laid down in the Articles of Association can – where of relevance at the present time – be summarised as follows [for literal text see Article 36 of the Articles of Association]. Where possible, the following dividends shall be distributed in turn from the net income: first, on the protective preference shares: a percentage of the paid-up amount equal to the average three-monthEURIBOR percentage, weighted according to the number of days during which it was applicable, increased or reduced where necessary by at most two percentage points; then on the financing preference shares: 3.716% of the paid-up amount including share premium, which percentage was established on December 1, 2004 and will subsequently be adapted each time eight years thereafter; then on the priority shares 4% of the nominal value. Out of the remainder of the net income that is available for distribution, dividend shall be distributed on the ordinary shares. Subsequently, of the net income then remaining, as much shall be reserved as may be deemed necessary by the Board of Executive Directors, subject to approval of the Supervisory Board. In so far as the net income has not been set aside in the form of reserves, it shall be at the disposal of the holders of ordinary shares.
120
Other information
The authorised capital amounts to € 175,001,500 and is subdivided into:
| • | 145,000,000 ordinary shares of € 0.50 each; |
| • | 30 priority shares of € 50 each; |
| • | 30,000,000 cumulative financing preference shares of € 0.50 each; and |
| • | 175,000 cumulative protective preference shares of € 500 each. |
Ordinary shares During the financial year the total number of shares outstanding increased by 191,468 to 83,709,588 as at November 30, 2005. The main reason for this increase was the exercise of options in connection with the Stock Option Plan.
Priority shares All priority shares are issued. They are held by Foundation Fort Ginkel, Venlo, the directors of this Foundation are: J.L. Brentjens [chairman], R.L. van Iperen and F.J. de Wit. The Articles of Association grant certain rights to the holders of priority shares, including the following:
| • | they determine the number of members of the Supervisory and Executive Boards; |
| • | they draw up a binding nomination list for shareholders for the appointment of Supervisory and Executive Directors; |
| • | alteration of the Articles of Association is possible only if proposed by them; |
| • | their approval is required for the issue of shares as yet not issued. |
In any one year not more than € 60 may be distributed as a dividend on all the priority shares together. The Board of Executive Directors of OcéN.V. and the directors of Foundation Fort Ginkel are jointly of the opinion that, as regards the exercise of the voting rights attaching to the priority shares, Foundation Fort Ginkel has complied with the requirements set in respect hereof in AppendixX of Euronext Rulebook, Book 11, General Rules Euronext Amsterdam Stock Market.
121
Other information
Preference shares Since 1979 the Company has been under the irrevocable obligation to issue protective preference shares to the Lodewijk Foundation, Venlo, on the latter’s first request. As to the nominal value of such issue, the Company’s obligation has since February 1997 related to at most an amount equal to the total nominal value of the ordinary and financing preference shares of the Company issued at the time of the request. The directors of the Lodewijk Foundation are: N.J. Westdijk [chairman], S.D. de Bree, M.W. den Boogert and F.J.G.M. Cremers.
The Board of Executive Directors of OcéN.V. and the directors of the Lodewijk Foundation are jointly of the opinion that, as regards the independence of the directors of the Lodewijk Foundation, the requirements set in respect hereof in AppendixX of Euronext Rulebook, Book 11, General Rules Euronext Amsterdam Stock Market have been complied with. In 1996 5,000,000 financing preference shares were placed with the Foundation ‘Stichting Administratiekantoor Preferente Aandelen Océ’ in return for the issue to a number of institutional investors of registered depositary receipts with limited cancellability. As a result of the share split the number of financing preference shares currently placed amounts to 20,000,000. The directors of the Foundation ‘Stichting Administratiekantoor Preferente Aandelen Océ’ are: H. de Ruiter [chairman], S. Bergsma, J.M. Boll, and L. Traas.
On December 1, 2005 Océ in Japan acquired the population of high volume, wide format machines from Shacoh. The consideration paid for this acquisition was € o.8 million.
On January 16, 2005 Océ announced a reorganisation in America. Following on from the acquisition of Imagistics International Inc. some 250 jobs will be discontinued in America. The related reorganisation costs will amount to around € 1.7 million.
Signatures to the financial statements and other information set out on pages 79 to 122:
January 27, 2006
The Board of Supervisory Directors
J.L. Brentjens
M. Arentsen
A. Baan
P. Bouw
J.V.H. Pennings
F.J. de Wit
The Board of Executive Directors
R.L. van Iperen
J. van den Belt
J.F. Dix
122
Other information
To the General Meeting of Shareholders of Océ N.V.
Introduction In accordance with your instructions we have audited the financial statements as included in the annual report for the year ended November 30, 2005 of OcéN.V., Venlo. These financial statements are the responsibility of the company’s management. Our responsibility is to express an opinion on these financial statements based on our audit.
Scope We conducted our audit in accordance with auditing standards generally accepted in the Netherlands. Those standards require that we plan and perform the audit to obtain reasonable assurance about whether the financial statements are free of material misstatement. An audit includes examining, on a test basis, evidence supporting the amounts and disclosures in the financial statements. An audit also includes assessing the accounting principles used and significant estimates made by management, as well as evaluating the overall presentation of the financial statements. We believe that our audit provides a reasonable basis for our opinion.
Opinion In our opinion, the financial statements give a true and fair view of the financial position of the company as at November 30, 2005 and of the result for the year then ended in accordance with accounting principles generally accepted in the Netherlands and comply with the financial reporting requirements included in Part 9 of Book 2 of the Netherlands Civil Code.
Amsterdam, January 27, 2006
PricewaterhouseCoopers Accountants N.V.
123
Board of Supervisory Directors as at January 27, 2006
J.L. [Joep] Brentjens, chairman [1940], Bloemendaal
Post[s] held former chairman of the Board of Directors ofVNUN.V.
Nationality Dutch.
Appointed in 2001.
Current term of office until 2009.
Maximum period of office until 2013.
Supervisory directorships chairman of the Supervisory Board of HeijmansN.V. and member of the Supervisory Board of
VNUN.V., FortisOBAMN.V. and Holdingmaatschappij P. Bakker HillegomB.V.
Other posts vice-chairman of Van Leer Group Foundation, chairman of the Board of the Nijmegen Catholic University Foundation and board member of several other foundations.
F.J. [Frank] de Wit, vice-chairman [1939], Bonaire [the Netherlands Antilles]
Post[s] heldformer chairman of the Board of Directors ofN.V.KNPB.T.
Nationality Dutch.
Appointed in 1997.
Current term of office until 2009.
Maximum period of office until 2009.
Supervisory directorships member of the Supervisory Board of PontMeyerN.V.
Other posts member of the Advisory Board of Keyser & Mackay [International]C.V. and board member of several foundations.
M. [Rinus] Arentsen [1939], Reeuwijk
Post[s] held former member of the Board of Executive Directors ofCSMN.V.
Nationality Dutch.
Appointed in 2004.
Current term of office until 2008.
Maximum period of officeuntil 2016.
Supervisory directorshipschairman of the Supervisory Board ofCSM NederlandB.V., Klaverblad Onderlinge VerzekeringsmaatschappijU.A. and Royal Frans Maas GroepN.V. and member of the Supervisory Board of Zuivelcoöperatie CampinaU.A., IncotecB.V. and Van der Moolen HoldingN.V.
Other posts board member of several foundations.
A. [Adri] Baan [1942], Eindhoven
Post[s] held former member of the Board of Management of Royal Philips ElectronicsN.V. and a former member of the Group Management Committee of Royal Philips ElectronicsN.V.
Nationality Dutch.
Appointed in 2003.
Current term of officeuntil 2007.
Maximum period of office until 2015.
Supervisory directorships non-executive director of Imperial Chemical IndustriesICIPLC and International PowerPLC [London], member of the Supervisory Board of Royal Volker Wessels StevinN.V., Wolters KluwerN.V. and HagemeyerN.V.
Other posts director Port of Singapore Authority Europe and member of the Supervisory Board of the Netherlands Authority for Financial Markets [AFM].
P. [Pieter] Bouw [1941], Amsterdam
Post[s] heldformer chairman of Koninklijke Luchtvaart MaatschappijN.V. [KLM].
Nationality Dutch.
Appointed in1998.
Current term of office until 2006.
Maximum period of office until 2010.
Supervisory directorships chairman of the Supervisory Board ofCSMN.V. and member of the Supervisory Board ofNUONN.V.
Other postspart-time professor in Business Administration at Twente University, chairman of the Board of Trustees of Amsterdam Free Reformed University/Windesheim andVU Medical Centre, chairman of the Banking Council and board member of several foundations.
J.V.H. [Harry] Pennings [1934], Maaseik [Belgium]
Post[s] held former chairman of the Board of Executive Directors of OcéN.V.
NationalityDutch.
Appointedin 1998.
Current term of office until 2006.
Maximum period of office until 2010.
Supervisory directorships chairman of the Supervisory Board ofAZLN.V., EssentN.V. andN.V. Industriebank Liof, vice-chairman of the Supervisory Board of Wolters KluwerN.V. and member of the Supervisory Board of Berenschot GroepB.V.
Other posts board member of several foundations.
124
Board of Executive Directors as at January 27, 2006
R.L. [Rokus] van Iperen [1953], Venlo
Post chairman Board of Executive Directors.
Nationality Dutch.
Appointedas member of the Board of Executive Directors in May 1995 and as chairman of the Board of Executive Directors in September 1999.
Functional responsibilities Strategy, Corporate Personnel and Organisation, Research & Development, Manufacturing & Logistics, Secretariat of the Company and Legal Affairs, Corporate Communications.
GeographicalThe Netherlands, United States [chairman], Germany, Switzerland, Italy, Belgium and Japan.
Other posts member of the Advisory Board Technical University Eindhoven and member of the Advisory Board of Rabobank Nederland.
Post[s] heldEmployed by Océ since 1978. After several posts withinR&D, appointed assistant director in 1986. Since 1989 responsible for the Printing Systems business unit. Managing Director of Océ-BelgiumN.V. from 1992 until his appointment as member of the Executive Board.
J. [Jan] van den Belt [1946], Venlo
Post member Board of Executive Directors.
Nationality Dutch.
Appointed March 2001.
Functional responsibilities Finance and Administration, Treasury, Tax, Internal Audit, Information Technology, Investor Relations and financing companies.
Geographical France, Spain and Portugal.
Post[s] held From 1970 employed by Unilever in the Netherlands and the United Kingdom. Since 1977 employed byN.V. Royal Dutch Petroleum Company [Shell]. Until 1997 several management posts with Shell in the field of treasury and controlling and as Chief Financial Officer [CFO] in various countries in Latin America, the United Kingdom and the Netherlands. From 1997 until 2000 [CFO] of Shell in Brazil. Since September 1, 2000 employed by Océ asCFO.
J.F. [Jan] Dix [1946], Schoten [Belgium]
Post member Board of Executive Directors.
Nationality Dutch.
Appointed May 1998.
Functional responsibilities United States [CEO], Direct Export, Emerging Markets and Marketing Communications.
Geographical United States, Canada, Mexico, United Kingdom, Nordic, Australia, Central Europe, Far East and Brazil.
Post[s] held From 1970 until 1972 director of the family business Trappen-fabriek DixB.V., Utrecht. Joined Douwe EgbertsN.V. in 1972; from 1973 until 1977 as director in Denmark. Employed by Océ since March 1, 1977. After several management posts, appointed Managing Director of Océ-BelgiumN.V. in 1985. Mr. Dix worked for Océ in the United States from 1988 until 1998, and since 1992 as President of Océ-USA, Inc. until his appointment as member of the Executive Board. He has been a member of the Executive Board of OcéN.V. since 1998 and with effect from September 15, 2004 he was also appointedCEO of Océ-USA Holding, Inc.
125
Senior Executive Central Services
January 2006
| Strategic Business Units | Digital Document Systems | M.J.A. Frequin | ||
| Wide Format Printing Systems | T. Egelund | |||
| Digital Document Systems | Corporate Printing | M.W. Drontmann | ||
| Commercial Printing | H. Würges | |||
| Software & Professional Services | K. Sommer | |||
| Océ Business Services | M.C. Kingmans | |||
| Wide Format Printing Systems | Technical Document Systems | G. Rongen | ||
| Display Graphics Systems | G.H. van Praag | |||
| Imaging Supplies | A.P. Langendoen | |||
| Research and Development [R&D] | Wide Format Systems & Cutsheet Systems | W.H.M. Orbons | ||
| Continuous Feed Systems | P. Feldweg | |||
| Software | M. Pracchi | |||
| Manufacturing and Logistics | N.J. Koole | |||
| Central Operating Company | Executive Committee | H.J. Blekman, chairman | ||
| Venlo | P.H.G.M. Creemers | |||
| T. Egelund | ||||
| P. Hagedoorn | ||||
| J. Hol | ||||
| N.J. Koole | ||||
| W.H.M. Orbons | ||||
| E.E.C. Vandoninck | ||||
| G.C. Wilbrink | ||||
| Central Operating Company | Executive Committee | P. Feldweg | ||
| Poing [Germany] | M.J.A. Frequin | |||
| M. Meyer | ||||
| Corporate Staff | Secretariat of the Company, Legal Affairs | Vacancy | ||
| Corporate Personnel and Organisation | P.H.G.M. Creemers | |||
| Group Controlling | E.E.C. Vandoninck | |||
| Chief Information Officer | P. Hagedoorn | |||
| Corporate Finance | P.M. Vincent | |||
| Corporate Communications | J. Hol | |||
126
Principal group companies and their chief executives *
January 2006
| Europe | ||||||||
Belgium | Océ-BelgiumN.V. /S.A. | J. van Boerdonk | Brussels | 2 7294811 | ||||
| Océ Software Laboratories NamurS.A. | B. Hucq | Gembloux | 81 876710 | |||||
Denmark | Océ-Nordic Holding ApS | J. Bjørkmann | Copenhagen | 43 297000 | ||||
| Océ-Danmark a/s | H. Risør | Copenhagen | 43 297000 | |||||
Germany | Océ Holding Deutschland | P. Feldweg and | Mülheim/Ruhr | 208 48450 | ||||
| Verwaltungsgesellschaft m.b.H. | S. Landesberger | |||||||
| Océ-Deutschland G.m.b.H. | S. Landesberger and | Mülheim/Ruhr | 208 48450 | |||||
| L. Pouwels | ||||||||
| Océ Printing Systems G.m.b.H. | P. Feldweg, | Poing | 8121 724031 | |||||
| M.J.A. Frequin and | ||||||||
| M. Meyer | ||||||||
| Océ Document Technologies G.m.b.H. | M. Mertgen | Konstanz | 75 31874010 | |||||
Finland | Océ-Finland Oy | J.P. Koskenmies | Helsinki | 9 6859110 | ||||
France | Océ-FranceS.A. | N. Debargue | Noisy-le-Grand | 1 45925000 | ||||
| Océ Print Logic TechnologiesS.A. | R. Balmès | Créteil | 1 48988000 | |||||
Hungary | Océ-Hungária Kft. | G. Németh | Budapest | 1 2361040 | ||||
Ireland | Océ-Ireland Ltd. | N. Kooij | Dublin | 1 4039100 | ||||
Italy | Océ-Italia S.p.A. | G. Seno | Milan | 02 927261 | ||||
Netherlands | Océ-TechnologiesB.V. | H.J. Blekman | Venlo | 77 3592222 | ||||
| Océ-NederlandB.V. | J.W.C. Verschaeren | ‘s-Hertogenbosch | 73 6815815 | |||||
| Arkwright EuropeB.V. | J. Heath | Venlo | 77 3209020 | |||||
| Océ-America, Inc. | R.P.M.J. van Loenen | Venlo | 77 3592222 | |||||
| and P.M. Vincent | ||||||||
| Océ General Partnership | R.P.M.J. van Loenen | Venlo | 77 3592222 | |||||
| and P.M. Vincent | ||||||||
Norway | Océ-NorgeA.S. | J. Bjørkmann | Oslo | 2 2027000 | ||||
Austria | Océ-Österreich Ges.m.b.H. | G. Schennet | Vienna | 1 86336 | ||||
Poland | Océ-Poland Ltd. Sp. Z o.o. | M. Kozlowski | Warsaw | 22 5002100 | ||||
Portugal | Océ-Portugal Equipamentos | F. Calvache | Lisbon | 21 4125700 | ||||
| GráficosS.A. | ||||||||
Romania | Océ-SoftwareS.R.L. | M. Mühe | Timisoara | 256 200786 | ||||
Slovakia | Océ-Slovenská republika s.r.o. | I. Konecný | Bratislava | 2 44010111 | ||||
Spain | Océ-Iberia Holding ValoresS.L. | I. Esteve | Barcelona | 93 4844800 | ||||
| Océ-EspañaS.A. | I. Esteve | Barcelona | 93 4844800 | |||||
Czech Republic | Océ-Czeska republika s.r.o. | I. Konecný | Prague | 2 44010111 | ||||
United Kingdom | Océ [UK] Limited | N. Kooij | Brentwood | 870 6005544 | ||||
| Océ Imagistics [UK] Limited | B. Curley | Brentwood | 870 6005544 | |||||
Sweden | Océ SvenskaAB | J. Bjørkmann | Stockholm | 8 7034000 | ||||
Switzerland | Océ [Schweiz]A.G. | Ph. Convents | Glattbrugg | 1 8291111 | ||||
* Where holdings are less than 95% of total equity, the percentage of capital held is stated. A list of affiliated companies is available for public inspection at the Commercial Registry, Venlo, in conformity with the provisions of Article 379, Book 2 of the Dutch Civil Code. | ||||||||
127
Principal group companies and their chief executives
January 2006
| North America | ||||||||
United States | Océ-USA Holding, Inc. | J. Dix | Chicago, ILL | 773 7143762 | ||||
| Océ North America, Inc. | P. Chapuis | Chicago,ILL | 773 7148500 | |||||
| and M. Baboyian | Boca Raton, FL | 561 9973100 | ||||||
| Océ Imagistics Inc. | J.D. Skzrypczak | Trumbull,CT | 203 3657000 | |||||
| Arkwright, Inc. | J. Heath | Fiskeville,RI | 401 8211000 | |||||
| Océ Business Services, Inc. | J.R. Marciano | New York,NY | 212 5022100 | |||||
| Océ Reprographic | ||||||||
| Technologies, Corp. | R. Newson a.i. | Phoenix,AZ | 602 7441353 | |||||
| Onyx Graphics, Inc. | W. Noot | Salt Lake City, UT | 801 5689900 | |||||
Canada | Océ-Canada, Inc. | S. Goodall | Toronto | 416 2245600 | ||||
| Océ Imagistics Canada Inc. | G.E. Clark | Mississauga | 905 5640195 | |||||
Mexico | Océ-MexicoS.A deC.V. | J. Escudero | Mexico City | 55 50898710 | ||||
| Asia/Pacific | ||||||||
Australia | Océ-Australia Ltd. | S.J.J. Notermans | Scoresby | 3 97303333 | ||||
China | Océ Office Equipment | M. Sak | Shanghai | 21 62729698 | ||||
| [Shanghai] Co., Ltd. | ||||||||
Hong Kong | Océ [Hong Kong China] Ltd. | M. Sak | Hong Kong | 25776064 | ||||
Japan | Océ-Japan Corporation | Y. Yamamoto | Tokyo | 3 54026112 | ||||
Malaysia | Océ Malaysia Sdn. Bhd. | M.A.M.E. van Mierlo | Petaling Jaya | 3 79668000 | ||||
Singapore | Océ [Singapore] Pte. Ltd. | M.A.M.E. van Mierlo | Singapore | 6 4701500 | ||||
Thailand | Océ [Thailand] Ltd. | A.G.F. van Mastrigt | Bangkok | 2 2607133 | ||||
| Other countries | ||||||||
Brazil | Océ-Brasil Comércio e Indústria Ltda. | R. Uildriks | São Paulo | 11 30535300 | ||||
| Direct Export/Emerging Markets | ||||||||
Netherlands | Océ Direct Export/Emerging Markets | H. Würges | Venlo | 77 3592222 | ||||
| Financing companies | ||||||||
Australia | Océ-Australia Finance Pty. Ltd. | S.J.J. Notermans | Scoresby | 3 97303333 | ||||
Belgium | Océ-InterservicesN.V. /S.A. | J. van Boerdonk | Brussels | 2 7294992 | ||||
Germany | Océ-Deutschland Financial | L. Pouwels | Mülheim/Ruhr | 208 48450 | ||||
| Services G.m.b.H. | ||||||||
France | Océ-France FinancementS.A. | Ph. Poulalhon | Saint-Cloud | 1 45925055 | ||||
Spain | Océ-RentingS.A. | E. de Sus | Barcelona | 93 4844800 | ||||
United States | Océ-Financial Services, Inc. | S. Schulein | Boca Raton,FL | 1 5619973100 | ||||
| Minority holdings | ||||||||
Cyprus | Heliozid Océ-Reprographic | 25% | ||||||
| [Cyprus] Ltd. | ||||||||
Singapore | Datapost Pte. Ltd. | 30% | ||||||
128
Supplementary information for shareholders
Investor Relations [IR] policy The aim of Océ’sIR policy is to keep [potential] investors informed in good time and in the most effective possible way about developments within the company, the objective being to provide them with a clear picture on which to base their investment decisions with regard to Océ. Not only information about the financial results and prospects is of key importance, but also the provision of information in the broadest sense about the company’s strategic choices and objectives and about social aspects such as sustainable development.
The principal document for the provision of information is the annual report. In addition Océ regularly organises roadshows and other informative meetings for institutional investors and analysts.
When the annual results are published Océ holds a press conference. Following publication of the annual [and six-monthly] results Océ also organises a number of meetings for analysts and after the announcement of the results for the first and the third quarters Océ holds aconference call for analysts. These information sessions can be followed in real time via webcasting.
Océ opts to interact proactively with its shareholders. By maintaining regular and direct contacts with investors Océ is able to form a picture of their wishes and ideas and these dialogues are an extremely useful way of gaining an insight into how Océ is perceived. Twice a year Océ publishes a magazine that is especially focused on private investors who are interested in Océ. This magazine, calledInside Océ, is aimed at giving private investors a better insight into Océ. Every year Océ also organises a day on which the company presents itself to groups of private investors. This is known as theOcé Private Investor Day.
Via theInvestor Information link on the Océ website all sorts of relevant information can be found, such as quarterly and annual figures, press releases and background information and links to other sources. On the website it is also possible to take out a subscription to theInside Océ magazine.
The agenda for the Annual General Meeting of Shareholders is also posted on the Océ website. In that agenda authorisation is requested, inter alia, for the issue of shares and the restriction or preclusion of the pre-emptive right. An explanation is given in the agenda of the objectives and restrictions that the Board of Executive Directors and the Supervisory Board will comply with in the event that they make use of such authorisation.
Investors and/or their advisers are welcome to submit any questions direct to Océ’s Investor Relations department by telephone [+31] [0]77 3592240 or via e-mail [marij.verlinden@oce.com], if desired by mentioning their own telephone number and the times when they can be called back.
129
Supplementary information for shareholders
Quarterly results [net income]
| 2005 | 2004 | ||||||
| x € million | % change on previous year | x € million | % change on previous year | |||||
First quarter | 9.1 | –47 | 17.2 | –19 | ||||
Second quarter | 10.6 | –51 | 21.4 | +13 | ||||
Third quarter | 8.9 | –37 | **14.1 | — | ||||
Fourth quarter | *50.2 | +98 | **25.4 | –6 | ||||
Year | 78.8 | +1 | 78.1 | +27 | ||||
Quarterly results [basic earnings per ordinary share calculated on the
| 2005 | 2004 | ||||||
| in euro | % change on previous year | in euro | % change on previous year | |||||
First quarter | 0.10 | –47 | 0.20 | –20 | ||||
Second quarter | 0.12 | –51 | 0.25 | +13 | ||||
Third quarter | 0.10 | –37 | 0.15 | — | ||||
Fourth quarter | 0.60 | +103 | 0.29 | –6 | ||||
Year | 0.92 | +3 | 0.89 | +29 | ||||
Distribution of ordinary shares as % at end of financial year [indication
| 2005 | 2004 | ||||||||||
| private | institutional | total | private | institutional | total | |||||||
Netherlands | 18 | 14 | 32 | 19 | 13 | 32 | ||||||
United Kingdom | — | 23 | 23 | — | 21 | 21 | ||||||
Belgium / Luxembourg | 1 | 20 | 21 | 1 | 20 | 21 | ||||||
United States | — | 21 | 21 | — | 19 | 19 | ||||||
Other | — | 3 | 3 | 1 | 6 | 7 | ||||||
Total | 19 | 81 | 100 | 21 | 79 | 100 | ||||||
| * | Net income for the fourth quarter 2005 includes a decrease of the pension provisions of € 48.1 million and reorganisation costs of € 22.6 million [both after taxation]. |
| ** | Net income for the third and fourth quarters of 2004 includes impairment of € 4.4 million and € 0.3 million respectively [after taxation] and the release of a net tax provision of € 5.6 million and € 1.4 million respectively. |
130
Supplementary information for shareholders
| Important [publication] dates | ||
| [subject to modification] | ||
| April 4, 2006 | first quarter results 2006 | |
| April 20, 2006 | general meeting of shareholders | |
| July 5, 2006 | second quarter / first half year results 2006 | |
| October 3, 2006 | third quarter / nine months results 2006 | |
| January 2007 | provisional results for 2006 | |
| February 2007 | publication of 2006 annual report | |
| Stock exchange listings Ordinary shares in Océ are listed on the stock exchanges in Amsterdam, Düsseldorf, Frankfurt/Main and on the electronic stock exchange [EBS] in Switzerland. They are traded in the United States as American Depositary Receipts [ADRS] viaNASDAQ. Options to Océ shares are traded on the Euronext Options Exchange. | ||
Large Shareholdings Notification Act On the basis of the Act on the Notification of Large Shareholdings in Publicly Listed Companies [Dutch abbreviation:WMZ] which requires, inter alia, that shareholders must notify any holdings of more than 5% of the ordinary outstanding shares, the following holder of ordinary shares is known: Internationale Nederlanden Groep [6.33%], notification February 28, 1992.
Depositary receipts with limited cancellability for financing preference shares are held by: Rabobank Nederland [6.25%], notification May 31, 1996; FortisN.V. [5.68%], notification May 10, 1999; and NewNIB PartnersLP [5.59%], notification December 15, 2005.
The percentages mentioned above are the percentages of the total outstanding share capital held at the time when the notification was made. | ||
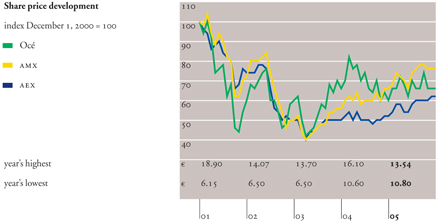
131
Consolidated Statement of Operations
| 2005 | 2004 | 2003 | 2002 | 2001 | amounts x € million | ||||||
Total revenues | 2,677 | 2,652 | 2,769 | 3,176 | 3,234 | |||||||
Operating income | 110 | 110 | 125 | 226 | 225 | |||||||
Net income | 79 | 78 | 61 | 113 | 10 | |||||||
Key figures: | ||||||||||||
Total revenues | ||||||||||||
Increase/decrease in % | 1 | –4 | –13 | –2 | — | |||||||
Expenditure on research and development | 193 | 207 | 212 | 215 | 203 | |||||||
As % of total revenues | 7.2 | 7.8 | 7.7 | 6.8 | 6.3 | |||||||
Operating income | ||||||||||||
As % of total revenues | 4.1 | 4.2 | 4.5 | 7.1 | 6.9 | |||||||
As % of average balance sheet total | 4.8 | 4.8 | 4.7 | 7.5 | 7.1 | |||||||
Net income | ||||||||||||
As % of total revenues | 2.9 | 2.9 | 2.2 | 3.5 | *3.2 | |||||||
As % of average shareholders’ equity | 10.7 | 10.9 | 8.3 | 13.1 | *10.9 | |||||||
Ordinary net income | ||||||||||||
As % of average ordinary shareholders’ equity [ROE]*** | 11.3 | 11.3 | 8.5 | 13.6 | *11.2 | |||||||
Net income retained | 28 | 26 | 10 | 60 | *53 | |||||||
As % of net income | 36.7 | 35.0 | 16.5 | 55.5 | *51.9 | |||||||
Payroll expenses | 1,184 | 1,228 | 1,271 | 1,347 | 1,310 | |||||||
As % of total revenues | 44.2 | 46.3 | 45.9 | 42.4 | 40.5 | |||||||
Number of employees | 24,164 | 21,315 | 22,204 | 22,489 | 22,472 | |||||||
Per € 0.50 ordinary share [in euro]: | ||||||||||||
Basic earnings** | 0.92 | 0.89 | 0.69 | 1.30 | *1.19 | |||||||
Diluted earnings | 0.91 | 0.88 | 0.69 | 1.29 | *1.18 | |||||||
Free cash flow | –6.06 | 4.44 | 3.93 | 4.02 | 2.04 | |||||||
Shareholders’ equity | 8.65 | 7.87 | 7.87 | 8.55 | 10.56 | |||||||
Dividend | 0.58 | 0.58 | 0.58 | 0.58 | 0.58 | |||||||
Average number of ordinary shares outstanding [x 1,000] | 83,698 | 83,488 | 83,409 | 84,086 | 85,241 | |||||||
Increase from dilution [x 1,000] | 971 | 1,271 | 759 | 693 | 714 | |||||||
Shareprice [in euro]: | ||||||||||||
Year’s highest | 13.54 | 16.10 | 13.70 | 14.07 | 18.90 | |||||||
Year’s lowest | 10.80 | 10.60 | 6.50 | 6.50 | 6.15 | |||||||
Year end | 12.11 | 11.25 | 11.92 | 11.45 | 10.20 | |||||||
| * | Before extraordinary items. |
| ** | Basic earnings after extraordinary items amount to € 0.08 in 2001. |
| *** | The definition ofROE has changed since 2004. |
132
Océ 2001 - 2005
Consolidated Balance Sheet
| 2005 | 2004 | 2003 | 2002 | 2001 | amounts x € million | ||||||
Assets: | ||||||||||||
Intangible fixed assets | 550 | 37 | 49 | 86 | 44 | |||||||
Tangible fixed assets | 579 | 481 | 494 | 578 | 637 | |||||||
Financial fixed assets | 330 | 360 | 560 | 693 | 751 | |||||||
Fixed assets | 1,459 | 878 | 1,103 | 1,357 | 1,432 | |||||||
Current assets | 1,360 | 1,355 | 1,318 | 1,505 | 1,696 | |||||||
Total | 2,819 | 2,233 | 2,421 | 2,862 | 3,128 | |||||||
Liabilities: | ||||||||||||
Group equity | 818 | 752 | 752 | 811 | 985 | |||||||
Long term liabilities [provisions] | 513 | 516 | 596 | 637 | 426 | |||||||
Long term debts | 227 | 438 | 381 | 756 | 754 | |||||||
Current liabilities | 1,261 | 527 | 692 | 658 | 963 | |||||||
Total | 2,819 | 2,233 | 2,421 | 2,862 | 3,128 | |||||||
Key figures: | ||||||||||||
Property, plant and equipment | 455 | 423 | 431 | 459 | 458 | |||||||
Net expenditure | 86 | 74 | 81 | 101 | 106 | |||||||
Depreciation | 89 | 86 | 94 | 95 | 91 | |||||||
Rental equipment | 124 | 58 | 63 | 119 | 179 | |||||||
Net expenditure | 49 | 40 | 14 | 30 | 50 | |||||||
Depreciation | 38 | 43 | 65 | 87 | 103 | |||||||
Finance lease receivables [net] including short term finance leases | 343 | 403 | 801 | 1,013 | 1,153 | |||||||
As % of balance sheet total | 12 | 18 | 33 | 35 | 37 | |||||||
Inventories | 364 | 317 | 310 | 346 | 365 | |||||||
As % of total revenues | 14 | 12 | 11 | 11 | 11 | |||||||
Trade accounts receivables | 573 | 452 | 503 | 574 | 649 | |||||||
As % of total revenues | 21 | 17 | 18 | 18 | 20 | |||||||
Ratio of current assets to current liabilities | 1.1 | 2.6 | 1.9 | 2.3 | 1.8 | |||||||
Group equity as % of balance sheet total | 29 | 34 | 31 | 28 | 31 | |||||||
133
List of terms and abbreviations
AnalogueIn relation to copiers: non-digital production of a copy with the aid of a photo-lens; analogue machines cannot communicate with other copying machines [see also digital below].
Application software Software designed to handle specific applications.
Asset recovery The recovery from used equipment of all serviceable materials, parts and components so that they can be made suitable for reuse.
Back service The increase in accrued pension rights under a defined benefit scheme prior to retirement as a result of salary increases or index-linking.
CADComputer Aided Design: designing with the aid of the computer.
Captive lease company/business An Océ subsidiary which takes over leases and leasing activities from other Océ subsidiary companies. The lease receivables are then sold to external financiers.
CEO Chief Executive Officer.
CFO Chief Financial Officer.
CIO Chief Information Officer.
Competence CentreUsed within Océ to mean: knowledge centre within the Océ organisation in which technological expertise and specialisations are concentrated.
Conference callUsed within Océ to mean: a telephone meeting convened by Océ with investment analysts to explain the financial results and provide background information.
Continuous feed printing Printing on rolls of paper or on pinfeed forms.
CopyPress printing technique System for producing copies of offset quality, in which the toner is ‘pressed’ into the paper.
Cost of ownership Ongoing fixed and variable costs linked to the use of a product after it has passed into customer ownership.
Cutsheet printing Printing on separate sheets of paper.
DDS The Strategic Business Unit Digital Document Systems.
Design for reuse Making allowance for the reuse of a product, starting in the actual design stage.
DGS The business group Display Graphics Systems.
DigitalIn relation to printers and copiers: producing a print or copy by means of laser orLED exposure in a computer controlled machine which can also communicate via a network; used here as the opposite to analogue [see above].
Digital print providers Businesses that are specialised in the production of prints for third parties [copy shops and job printers].
Direct Imaging[DI] Technique in which the image is formed in one single pass on a drum before being transferred to the copying material.
Document workflow software Software used for the processing of document flows and all related activities.
DpiDots per inch: indicates the resolution of a scan or print, i.e. the number of dots scanned or displayed per inch.
DutchGAAP Dutch Generally Accepted Accounting Principles.
EBIT Term used to describe the financial results: Earnings Before Interest and Tax.
EDPElectronic Data Processing: the processing of data on a computer.
Embedded software Basic software for controlling Océ products.
ERPEnterprise Resource Planning: standard software that integrates the most important business functions within one complete package [company-wide IT solution].
Finishing In relation to printers: post printing operations such as folding, cutting, stapling, collecting, glueing, franking, bundling etc.
Flatbed printers Wide format printers in which the printing head moves across a flat plate, enabling the printing of large, non-flexible surfaces.
Free cash flow The cash flow before financing activities.
Graphics market Market for [commercial] printed matter in which conventional, non-digital processes are used.
GRIGlobal Reporting Initiative: organisation that develops basic principles for the reporting of factors relating to sustainable business practices.
Hedging policy Providing cover against foreign exchange risks by means of forward buying or selling of expected physical net outflows and inflows in foreign currencies that are not the functional currency of the reporting unit. Interest risks can also be hedged so as to minimise mismatches between net interest inflows and outflows.
IAC Internal Audit Committee.
ICC Internal Controls Committee.
IFRSInternational Financial Reporting Standards; standard accounting priciples prescribed in the EU for publicly listed companies.
Imaging supplies All materials required for printing, such as carrier media [paper, plastics, textiles], inks and toners.
Inkjet technology Printing technique in which fine droplets of ink are used to build up the printed image.
Input and output management All activities involved in preparing for and executing print jobs.
IR Investor Relations.
134
List of terms and abbreviations
MCPAPERMachine-coated paper. Because of its smooth, slightly glossy coating this type of paper is particularly suitable for the printing of clear photos and illustrations. Mainly used for high quality printed advertising matter.
MediaIn relation to printing: all materials on which a print is produced.
Non recourse basisUsed here to mean: the sale of the existing lease portfolio in a manner that cannot be reversed.
Non recurring revenues Income from the sale of machines, software and professional services.
OEMOriginal Equipment Manufacturer: refers to the producer of a machine that is used in the sales process of another producer or distributor.
OIPS Operating Income Per Share.
One-stop shopping conceptUsed within Océ to mean: Buying in as many services as possible from one single supplier, e.g. printers, systems, application software, service, support and their financing.
OPCOrganic Photoconductor: Light-sensitive and durable photoconductor [drum or belt] for transferring the image onto paper.
Organic growth The development of the results excluding acquisition and exchange rate effects.
Outsourcing Important for Océ in the sense that document processes within a company are contracted out to a specialised external party such as Océ Business Services.
Print-for-use Refers to printing processes that serve to support a company’s primary business processes.
Print-for-pay Refers to printing processes of users whose primary process is commercial printing.
Private label concept Performing activities under a brand name other than the company’s own brand name. In the case of finance leasing the lease partner may use the Océ name to offer its financing facilities to its contract partners.
Process drum Image carrier in the Direct Imaging [DI] process.
Proxy solicitation Giving shareholders the possibility of casting their vote without being physically present at the meeting of shareholders.
Recurring revenues Income from services, materials, rentals interest and business services.
Remanufacturing Restoring machines to an as-new condition again so that they can embark upon a subsequent new life cycle; this involves thorough cleaning, replacement of parts subject to wear and tear and possibly the addition of new functionalities.
R&DResearch & Development.
ROAReturn on Assets [financial ratio].
ROEReturn on Equity: Ordinary net income as % of ordinary shareholders’ equity [financial ratio].
Roll-to-rollMethod of [wide format] printing for very long media in which the printed material is directly wound on another roller. Fast drying is needed in this process.
SECSecurities and Exchange Commission; the stock market supervisory authority in the United States.
Solution delivery process Standardised method developed by Océ for customer-specific design and implementation of [complex] printing solutions, comprising the entire process used by the customer.
Stakeholders All those who have an interest in Océ’s activities.
TDS The business group Technical Document Systems.
Thermal inkjet Printing technique in which the ink used in an inkjet printer is heated so that it becomes fluid at the exact moment of printing. As soon as the ink comes into contact with the print medium, the ink sets again.
Transaction print production Production of prints and copies on request in either big or small print runs.
USGAAP United States Generally Accepted Accounting Principles.
Value added resellers Distribution partners who supply their customers not only with machines but also with a range of related services, ranging from primary consultancy to regular service and the delivery of supplies.
Volume segment Internationally accepted industrial standard for classifying the copying and printing markets into segments based on the number of prints or copies produced per machine per month.
WFPS The Strategic Business Unit Wide Format Printing Systems.
Workflow managementUsed at Océ to mean: managing the quantity of print assignments and the related activities within an organisation.
135
This annual report contains certainforward-looking statements within the meaning of Section 27A of the Securities Act of 1933, as amended, and Section 21E of the Securities Exchange Act of 1934, as amended. These forward-looking statements refer to future events and may be expressed in a variety of ways, including the use of future or present tense language such as ‘expects’, ‘projects’, ‘anticipates’, ‘intends’ or other similar words.
Océ has based these forward-looking statements on its current expectations and projections about future events.
Océ’s expectations and projections may change and Océ’s actual results, performance or achievements could be significantly different from the results expressed in or implied by these forward-looking statements based on various important factors, risks and uncertainties which are neither manageable nor foreseeable by Océ [and some of which are beyond Océ’s control]. When considering these forward-looking statements, one should keep in mind these risks, uncertainties and other cautionary statements made in this Annual Report or in Océ’s other annual or periodic filings made with the United States Securities and Exchange Commission. These factors, risks and uncertainties include, but are not limited to, changes in economic and business conditions, customer demand in competitive markets, the successful introduction of new products and services into markets, developments in technology, adequate pricing of products and services, competitive pricing pressures within Océ’s markets, the financing of Océ’s business activities, efficient and cost effective operations, changes in foreign currency exchange rates, fluctuations in interest rates, political uncertainties, changes in governmental regulations and laws, tax rates, successful acquisitions, joint ventures and disposals and the effects of recent or further terrorist attacks and the war on terrorism.
For a more detailed discussion of the factors, risks and uncertainties that may affect Océ’s actual results, performance or achievements, reference is made to pages 69 to 74 of this annual report, Océ’s Annual Report on Form 20-F and any other filings made by Océ with the United States Securities and Exchange Commission.
Océ’s forward-looking statements speak only as of the date on which the statements are made, and Océ is under no obligation to update or revise publicly any forward-looking statement, whether as a result of new information, future events or otherwise.
136
Océ enables its customers to manage their documents efficiently and effectively by offering innovative print and document management products and services for professional environments.