 Strategic Overview of Exar’s acquisition of Hifn March 11, 2009 Creating Optimized Connectivity AMS Solutions Exhibit (a)(5)(H) |
 Cautionary Remarks 2 3/11/09 Cautionary Statement Regarding Forward-Looking Statements This document contains certain forward-looking statements relating to Exarf and their expectations for Exar’s proposed acquisition of hi/fn. All statements included in this document concerning activities, events or developments that Exar and/or hi/fn expects, believes or anticipates will or may occur in the future are forward-looking statements. Such statements can generally be identified by words such as “anticipates”, “expects”, “intends”, “will”, “could”, “believes”, “estimates”, “continue” and similar expressions. Actual results could differ materially from the results discussed in the forward-looking statements. Forward-looking statements are based on current expectations and projections about future events and involve known and unknown risks, uncertainties and other factors that may cause actual results and performance to be materially different from any future results or performance expressed or implied by forward-looking statements, including the following: the risk that the exchange offer and the merger will not close because of a failure to satisfy one or more of the offer conditions or closing conditions; the risk that Exar’s business and/or Hifn’s business will have been adversely impacted during the pendency of the exchange offer and the merger; the risk that the operations will not be integrated successfully; and the risk that the expected cost savings and other synergies from the transaction may not be fully realized, realized at all or take longer to realize than anticipated; the ability to retain key employees and other economic, business, competitive and/or regulatory factors affecting the business of Exar and hi/fn generally, including those set forth in the filings of Exar and hi/fn with the Securities and Exchange Commission, especially in the “Risk Factors” and “Management’s Discussion and Analysis of Financial Condition and Results of Operations” sections of their respective annual reports on Form 10-K and quarterly reports on Form 10-Q, their current reports on Form 8-K and other SEC filings. Exar and hi/fn are under no obligation to (and expressly disclaim any obligation to) update or alter their forward-looking statements whether as a result of new information, future events, or otherwise. About the Transaction In connection with the exchange offer, Exar filed a registration statement on Form S-4 and a Tender Offer Statement on Schedule TO on March 5, 2009 with the Securities Exchange Commission (the “SEC”) and hi/fn filed a solicitation/recommendation statement on Schedule 14D-9 with the SEC on March 5, 2009. These documents contain important information about the transaction and investors and security holders are urged to read these documents carefully before any decision is made with respect to the exchange offer. Investors and security holders may obtain free copies of the registration statement on Form S-4, Schedule TO, Schedule 14D-9 as well as other filings containing information about Exar and hi/fn without charge, at the SEC’s website (http://www.sec.gov). A free copy of the exchange offer materials, may also be obtained from Exar’s website at www.exar.com or from hi/fn’s website at www.hifn.com. You may also read and copy any reports, statements and other information filed by Exar or hi/fn with the SEC at the SEC public reference room at 100 F Street N.E., Room 1580, Washington, D.C. 20549. Please call the SEC at (800) 732-0330 or visit the SEC’s website for further information on its public reference room. Copies of the exchange offer materials may also be obtained at no charge from BNY Mellon Shareholder Services, the information agent for the offer, by telephone from 9 a.m. to 6 p.m. New York City Time, Monday through Friday, except for bank holidays, toll free at 1-866-208-8754 (from within the U.S., Canada or Puerto Rico) or collect at 1-201-680-6579 (from outside the U.S.). Generally Accepted Accounting Principles In this presentation, we include various financial measures, non-GAAP gross margin, non-GAAP research and development expenses, non-GAAP selling, general and administrative expenses, non-GAAP operating expenses, non-GAAP operating income (loss), non-GAAP net income (loss), and non-GAAP diluted earnings (loss) per share, which are adjusted to exclude from our GAAP results all stock-based compensation expense, amortization of acquired intangible assets, fair value adjustment of acquired inventories, acquired in-process research and development expenses, merger-related costs, separation cost of executive officers, acceleration of depreciation on abandoned equipment, goodwill and other intangible asset impairment, impairment charges on investments, net of realized gains, income tax effects, a charge establish deferred tax asset valuation allowance, and an income tax benefit from the closure of federal tax audit. These non-GAAP measures are not in accordance with, or an alternative for measures prepared in accordance with GAAP, and may be different from non-GAAP measures used by other companies. In addition, these non-GAAP measures are not based on any comprehensive set of accounting rules or principles. The Company believes that non-GAAP measures have limitations in that they do not reflect all of the amounts associated with the Company’s results of operations as determined in accordance with GAAP. These measures should only be used to evaluate the Company’s results of operations in conjunction with the corresponding GAAP measures. |
 EXAR Overview 3 • Repositioning Exar for Growth & Profitability • Attracted a proven veteran management team • Added world-class engineering talent • Laser focus on product marketing, ROI, and short time-to-revenue • Leveraged expanded channel, cross-selling and design win focus • Thirty new product releases in CY 2009 (2X most ever in one year) • Generated > $51M in cash in the past 13 quarters • REV/employee up 31% Mar-07 to Sep-08 (Proforma $335K) • $22M in annualized Op-Ex savings in the past 21 months (thru 12/08q) • Purchased > $100M of stock in past 21 months (thru 12/08q) • Strong Balance Sheet > $257M cash (12/08q) + Net Tangible Assets • We will exit the recession with an enhanced product portfolio - we will take market share & grow revenue! 3/11/09 |
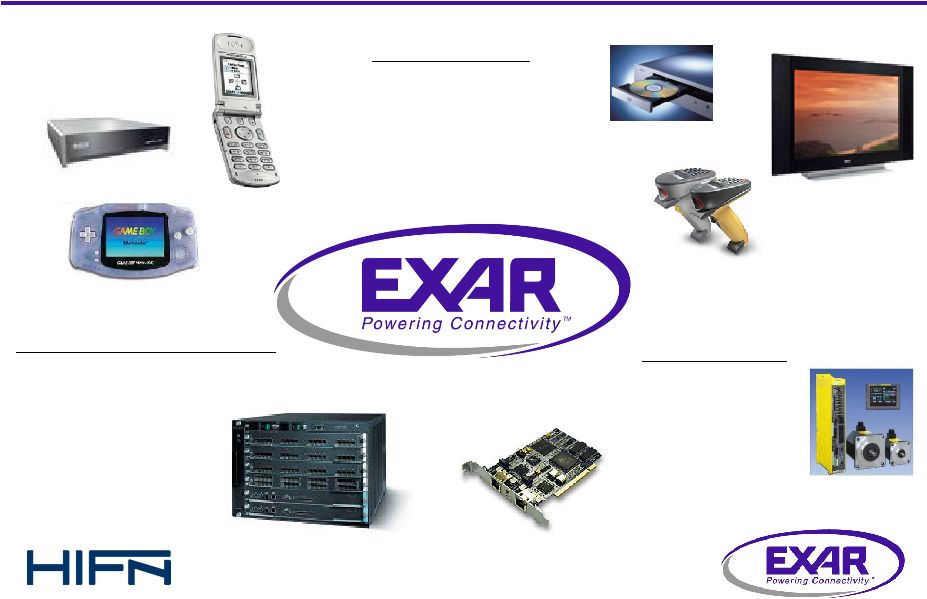 EXAR = Bringing Technology to Life ! 4 Consumer Portable Gaming Display Media Gateway Storage Industrial Security HVAC Lighting Control Motor Control PC Modules Factory Automation Communications Voice Infrastructure Data Infrastructure Switch/Routers Modems LAN 3/11/09 |
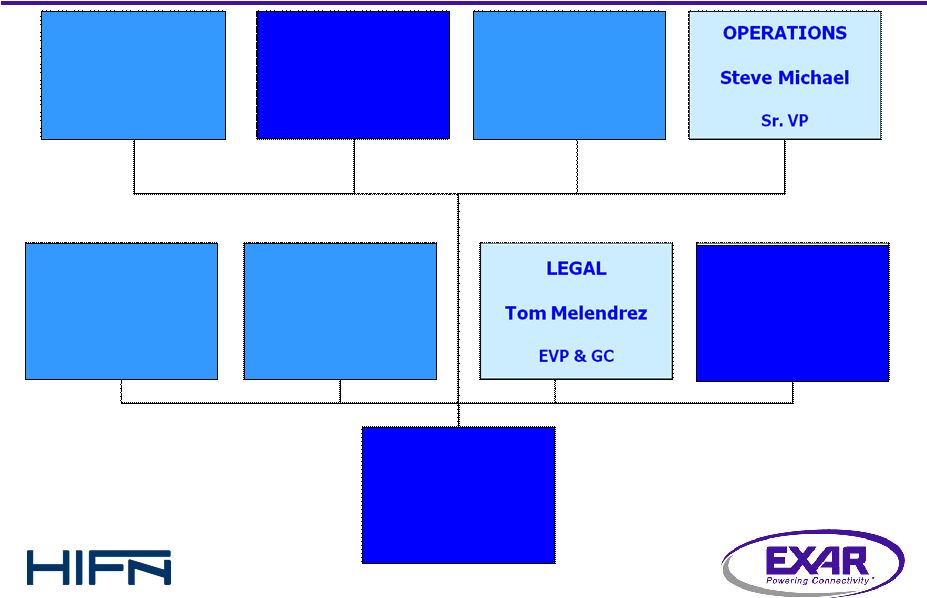 EXAR Management Team 5 Pete Rodriguez President & CEO TECHNOLOGY George Apostol Sr. VP & CTO MARKETING Paul Pickering Sr. VP FINANCE Scott Kamsler Sr. VP & CFO HR Diane Hill VP ENGINEERING Hung Le VP SALES Bentley Long VP 3/11/09 |
  EXAR Analog Mixed-Signal Excellence 6 Digital Analog Mixed Signal 3/11/09 Mappers Framers Protocol Engines UARTs Digital Power Control High Speed Asynchronous Bridges SAS, SATA Jitter Attenuators 15KV ESD Protection PLLs, CDRs Line Interface Units GHz PHYs High Speed Multi-Protocol Transceivers LED Drivers Fractional Gain Switched Capacitor High Power Density Regulators High Frequency Switching Controllers |
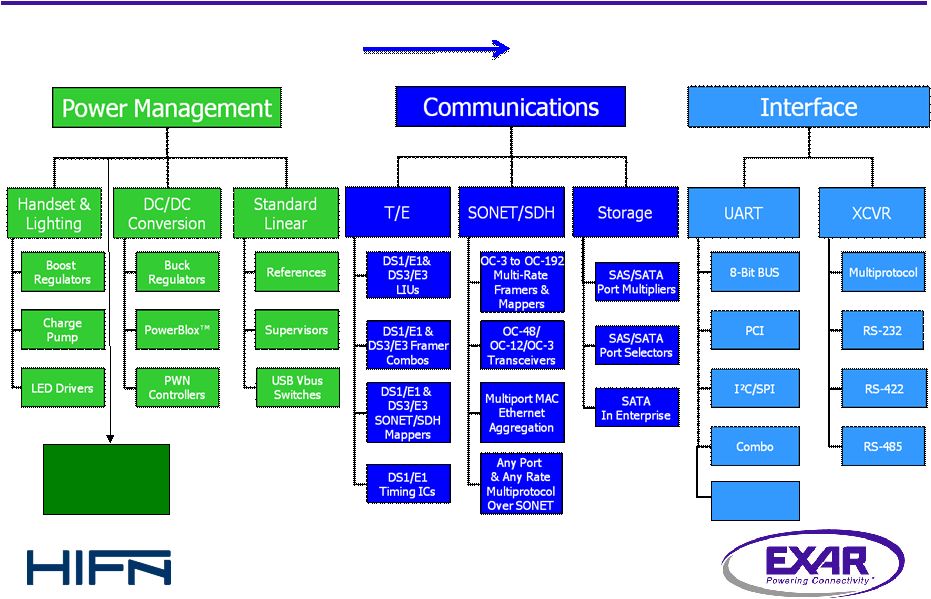   EXAR Product Lines 7 Digital Power Powering Connectivity Wireless 3/11/09 |
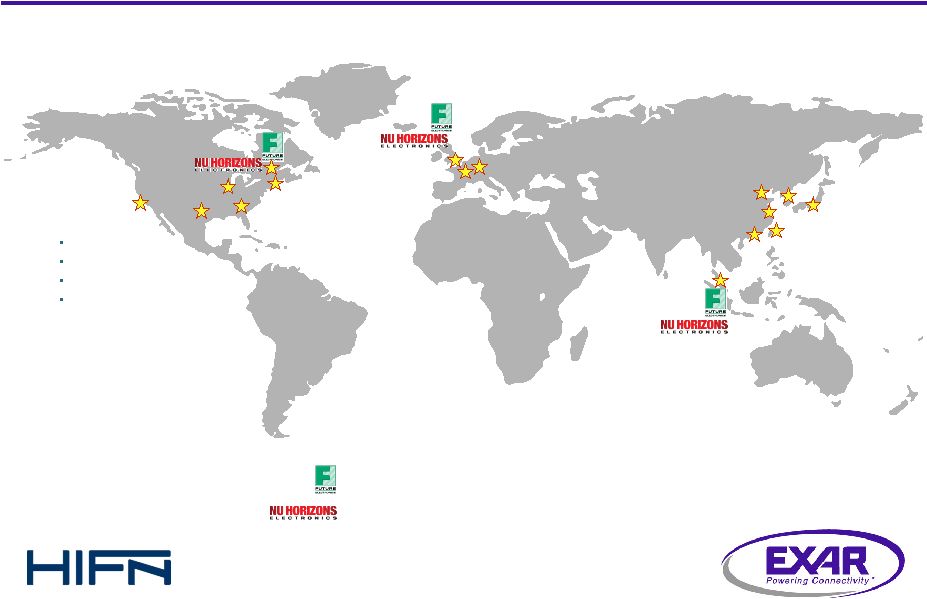 EXAR Worldwide Sales & Support 8 Future Electronics Corporate Locations Nu Horizons Corporate Locations Fremont, CA Headquarters Design Manufacturing Sales & Marketing Taipei, Taiwan Shenzhen, China Tokyo, Japan Billerica, MA Montréal, Canada Beijing, China Seoul, Korea Atlanta, GA Palatine, IL Plano, TX Munich, Germany Paris, France London, UK Shanghai, China Ipoh, Malaysia 3/11/09 |
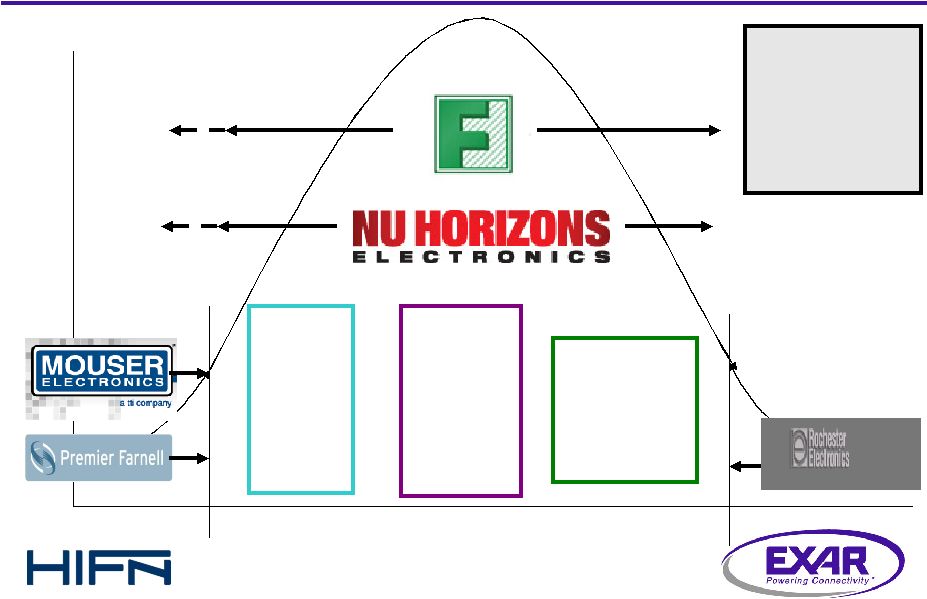 EXAR Channel Partners 9 # of Components Concept Discontinuance Mass Production Japan NDS Local Distys Asia NDS Pan-Asian & Local Distys •Global •Regional •Niche Europe NDS Pan-Euro & Local Distys 3/11/09 |
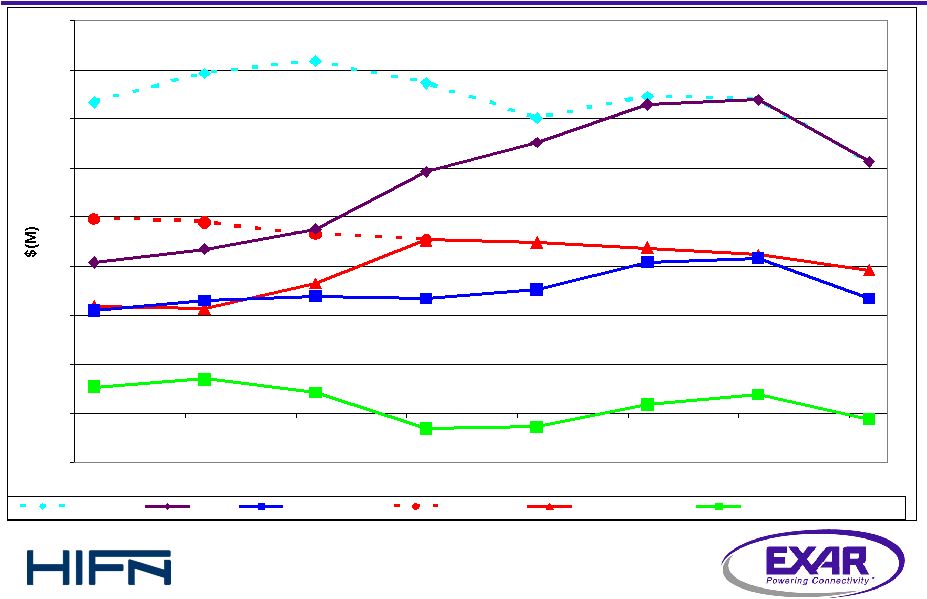 EXAR P&L Trends (Mar 07q – Dec 08q) 10 -5 0 5 10 15 20 25 30 35 40 Mar-07 Jun-07 Sep-07 Dec-07 Mar-08 Jun-08 Sep-08 Dec-08 As If Rev Rev Non-GAAP GP As If Opex Non-GAAP Opex Non-GAAP Net Inc (Loss) 32.5 35.5 36.9 34.5 30.8 33.1 32.7 26.3 20.3 19.9 18.1 18.1 19.2 11.1 13.5 17.8 17.3 16.5 14.8 10.9 10.6 12.1 11.9 12.8 15.7 16.1 11.9 11.6 (0.8) 2.7 3.5 2.0 (1.8) (1.7) 0.8 1.8 18.6 17.1 25.2 28.3 32.2 32.7 26.3 15.7 3/11/09 |
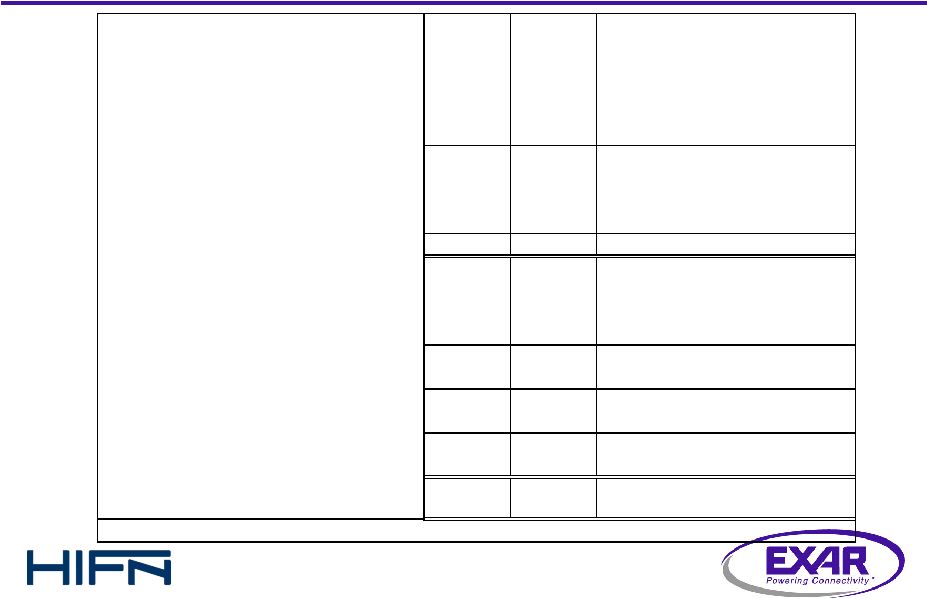 EXAR Balance Sheets 11 3/11/09 (Millions) Mar-07 Mar-08 Jun-08 Sep-08 Dec-08 Cash & marketable securities $356.1 $268.9 $258.6 $260.8 $257.4 Accounts receivable 4.4 13.7 13.5 12.7 7.4 Inventories 4.8 14.2 14.4 15.4 18.1 Other current assets 6.1 4.4 4.6 3.7 4.7 Total current assets 371.3 301.1 291.1 292.6 287.6 P,P&E, net 25.4 46.1 45.3 43.8 44.1 Goodwill & intangibles 10.6 73.6 71.8 70.1 8.1 Other long-term assets 13.8 3.3 3.5 2.6 2.7 Total assets $421.2 $424.2 $411.8 $409.1 $342.5 Accts payable & accrued comp $5.6 $14.5 $15.3 $14.4 $12.1 Deferred Income - 12.4 12.7 12.4 10.6 Other current liabilities 8.7 8.1 8.7 8.6 6.4 Total current liabilities 14.2 35.1 36.8 35.4 29.1 Long-term obligations 0.2 18.1 17.7 17.2 17.6 Total liabilities 14.4 53.1 54.5 52.6 46.7 Shareholders' equity 406.8 371.1 357.3 356.5 295.8 Total liabilities and shareholders' equity $421.2 $424.2 $411.8 $409.1 $342.5 Shares outstanding at quarter end 36.2 43.9 42.7 42.8 42.9 Amounts are rounded |
 Strategic Rationale for Hifn • Objectives • Create a leading solution provider of optimized connectivity products • Drive revenue growth and profitability with increased functionality and system level solutions • Complementary technologies • Hifn technology is used by major systems companies to accelerate, secure, classify and compress data over various connections and stored in systems • Enables Exar to extend market position in connectivity products by providing broader solutions with expanded content, system functionality and software • Both technology efforts addressing Telecom, Network and Storage applications with optimized connectivity solutions and supporting application software • Shared and expanded industry position • Shared customers – Cisco, Huawei, Alcatel-Lucent, HP, ZTE • Hifn customers include top tier storage systems OEM’s like EMC, Quantum, Brocade & NetApps • Exar can extend Hifn product base into to a wider telecom customer base and into the broader industry including the industrial market • Company cultures • Both companies are engineering focused to provide leading edge silicon solutions • Committed to excellence and developing products that solve meaningful customer challenges 12 3/11/09 |
 Strategic Rationale - continued • World-Class Technologists Marketing leading design expertise and patented technology for hardware accelerated encryption, compression & deduplication • Architects have 20+ years of industry experience • Active participants that drive standards bodies • Develop complex SoC & PCB level products • Experienced application software developers • Ethernet, Embedded Processors • Network security, compression, de-duplication, RAID, system software • Expanded Sales Channel • Complementary sales channels provide broader customer access and support • Multiple product lines will enable full solution selling to major accounts – cross-selling opportunities for increased silicon content for each design win • Synergistic with Exar AMS to deliver higher levels of integration for value added solutions • Additive to Exar mixed-signal and power management capabilities for more robust solutions • Leverage Exar’s physical design capabilities & suppliers to improve design efficiency & lower cost • Acquired IP can be implemented into current Exar roadmap reducing development costs • Cost Synergies > $5M/yr 13 3/11/09 - |
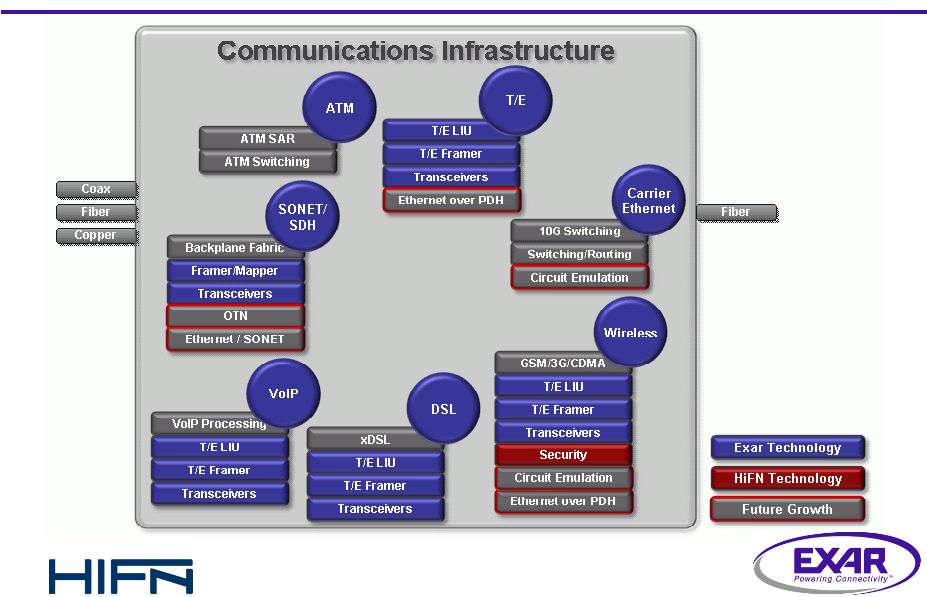
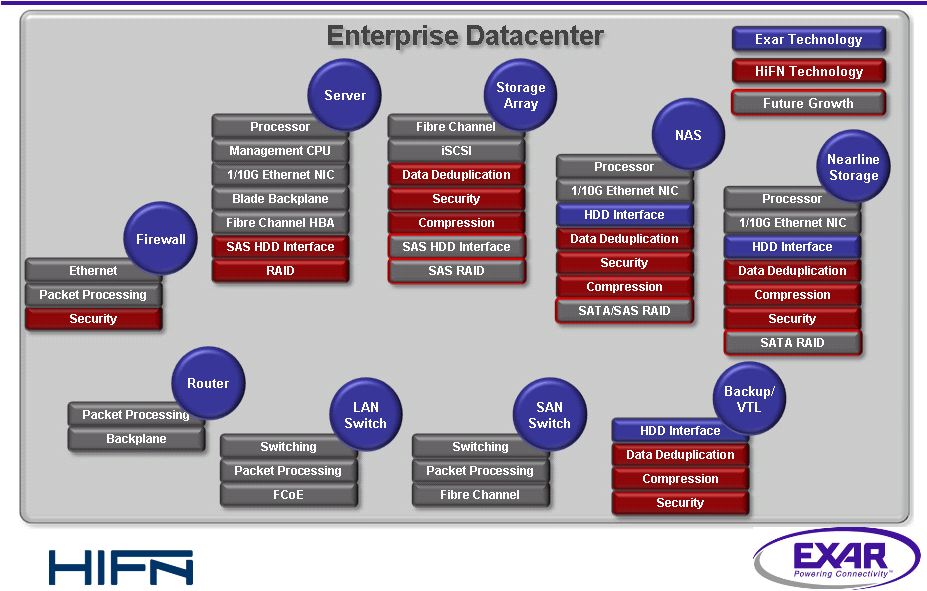
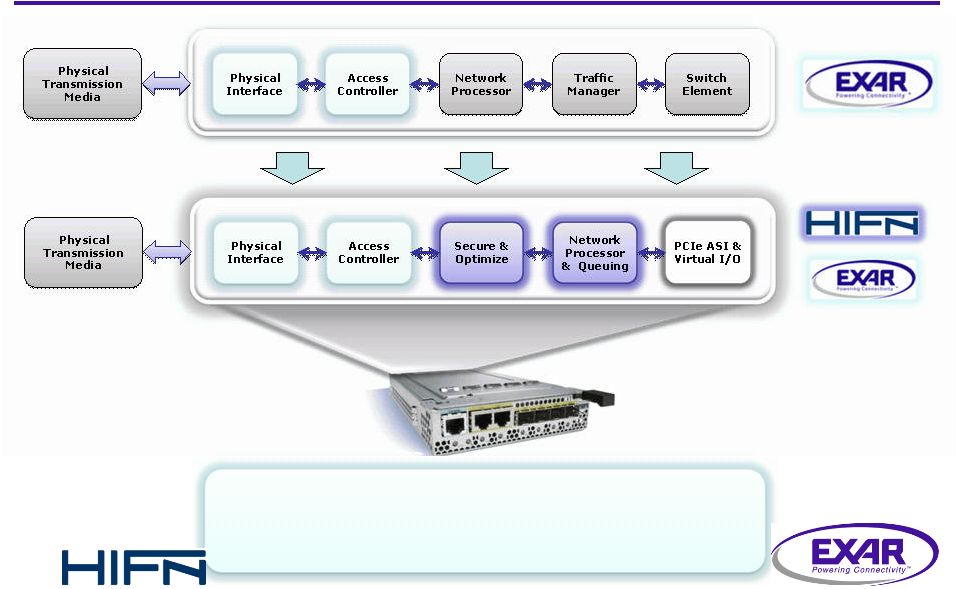 Broadened Connectivity Solutions 14 3/11/09 The Exar solution moves from Physical Interface And Access Control to expanded capabilities including Security, Compression and Classification |
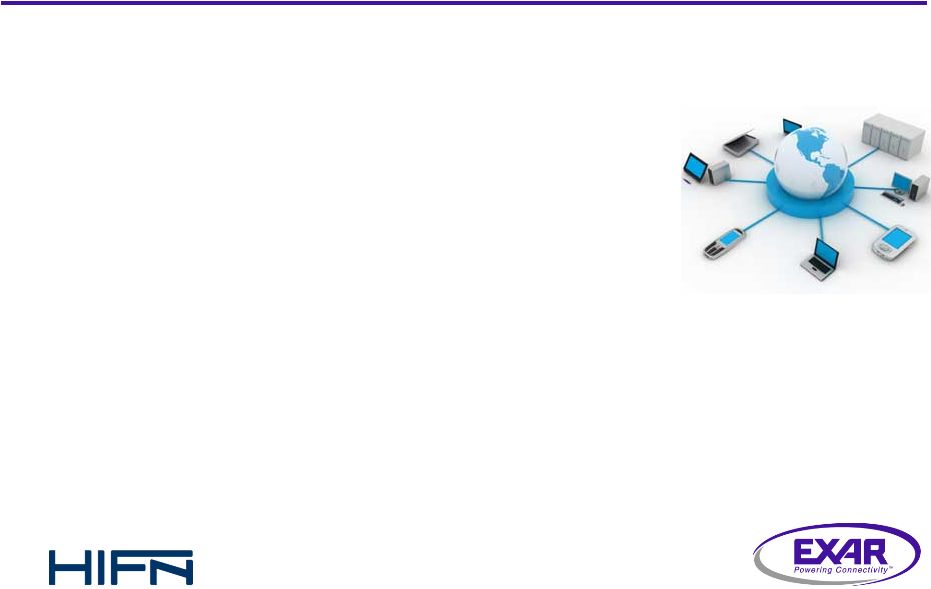 What is Driving the Network? • Migration to packet-based infrastructure • Cost, flexibility, service revenue • Ubiquity of connected devices • Multimedia = more bandwidth to more users • Cloud computing model • SMB outsourcing IT to manage costs • ‘Mega datacenter’ economies of scale • Virtualized enterprise datacenters • Green initiatives = less power • 20% of hardware cost in 2000, 70% in 2010* • Power density increasing 15% annually* • Network and storage security • Efficient utilization of compute, network and storage resources • Power efficiency • Space efficiency 15 *Source: IDC 3/11/09 |
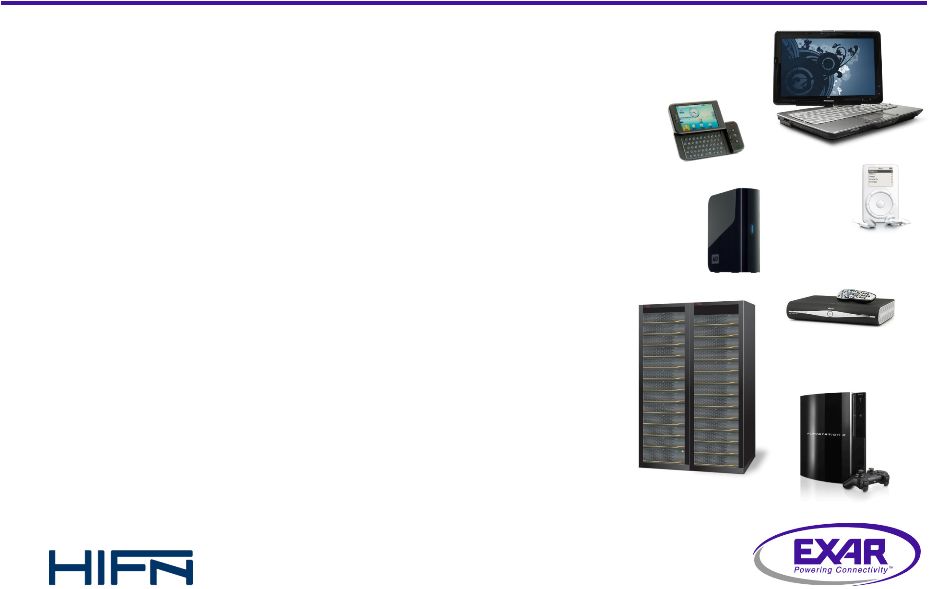 What is Driving Storage? • Capacity • 45 GB of data for every human on Earth* • 10X growth from 2006 to 2011 (60% CAGR)* • Multiplication effect • Performance • Becoming an integral part of the network • Backup moving from tape to disk-based • Migration to SSD in some segments • Lower power, higher performance, more robust • Security • Corporate governance • Protecting personal information • Efficiency • Data compression becoming common • Minimizing data redundancy is a necessity • Increasing back-up/restore speeds is critical 16 *Source: IDC 3/11/09 |
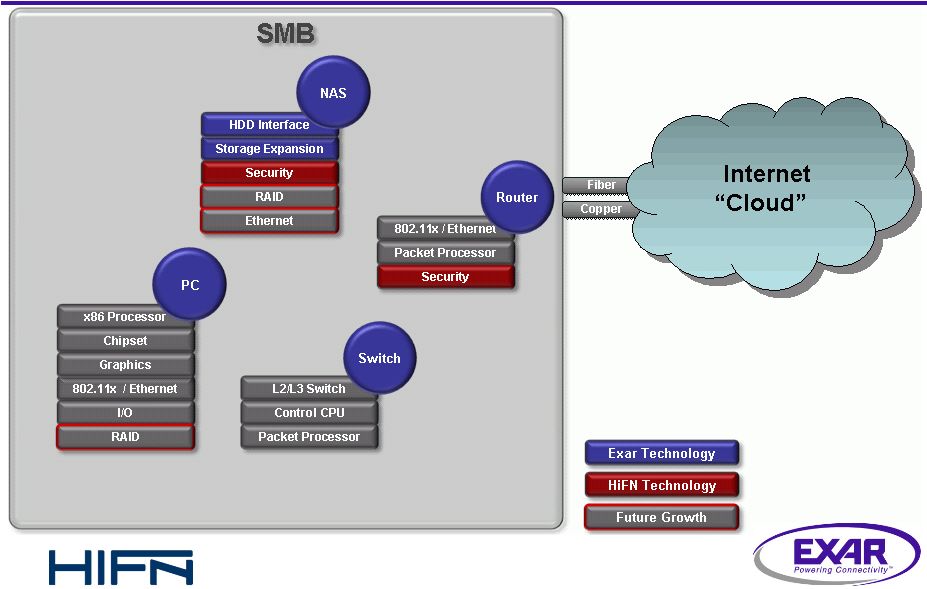
 Strategic Opportunities - Overview 17 3/11/09 |
 Strategic Opportunities: 18 3/11/09 |
 Strategic Opportunities: 19 3/11/09 |
 Strategic Opportunities: 20 3/11/09 |
 Strategic Opportunities: 21 3/11/09 |
 Exar Solution Stack 22 3/11/09 |
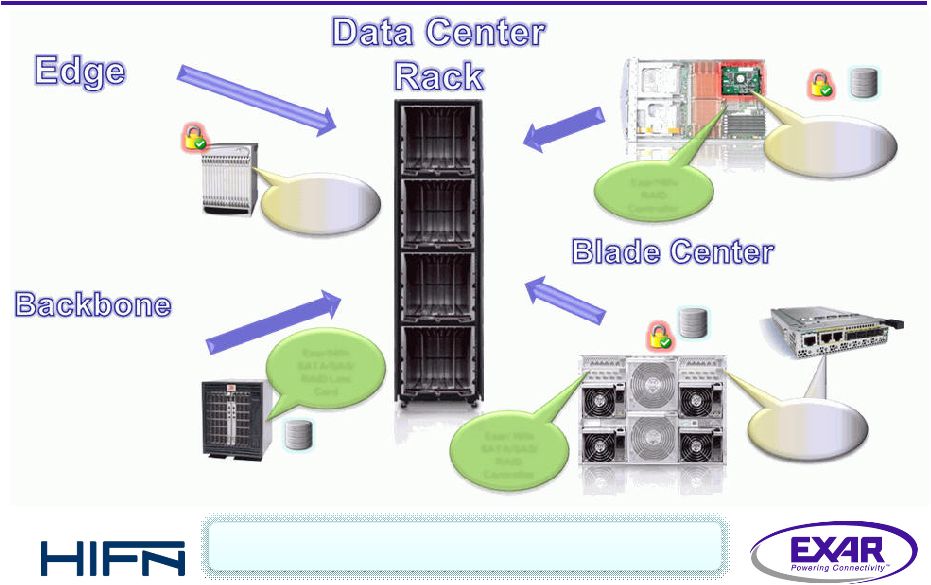 Shared Application Examples 23 3/11/09 Hifn/Exar ASP-based Line Cards Exar/Hifn Exar/Hifn SATA/SAS/ SATA/SAS/ RAID Line RAID Line Card Card Exar/ Hifn Exar/ Hifn SATA/SAS/ SATA/SAS/ RAID RAID Controller Controller Hifn ASP- based Cards Exar/Hifn Exar/Hifn RAID RAID Controller Controller Hifn Capacity Hifn Capacity Optimization Optimization Card Card • Security • Firewall • WAFS • Replication • 10Gb Switch • Trunking • Clustering • Redundant Exar Digital & Linear Power Solutions |
 Revenue Trends – Exar/Hifn/Combined 24 3/11/09 Combined Revenue 16 17 19 25 28 32 33 26 11 12 11 11 9 10 9 8 0 5 10 15 20 25 30 35 40 45 Mar-07 Jun-07 Sep-07 Dec-07 Mar-08 Jun-08 Sep-08 Dec-08 $(M) Exar Rev Hifn Rev |
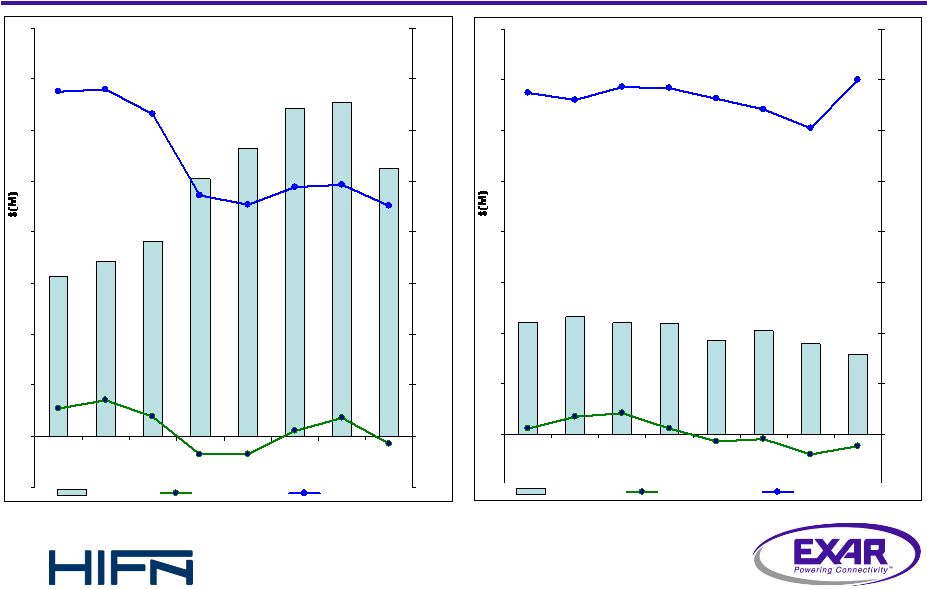 Revenue/Non-GAAP GM %/Non-GAAP Net Inc (Loss) HIFN 11 11 11 9 10 9 8 12 (5) 0 5 10 15 20 25 30 35 40 Mar-07 Jun-07 Sep-07 Dec-07 Mar-08 Jun-08 Sep-08 Dec-08 -10% 0% 10% 20% 30% 40% 50% 60% 70% 80% Revenue Net Inc (Loss) Gross Margin % EXAR 16 17 19 25 28 32 33 26 (5) 0 5 10 15 20 25 30 35 40 Mar-07 Jun-07 Sep-07 Dec-07 Mar-08 Jun-08 Sep-08 Dec-08 -10% 0% 10% 20% 30% 40% 50% 60% 70% 80% Revenue Net Inc (Loss) Gross Margin % Note: Please see the appendix for the GAAP to Non-GAAP reconciliations for both Exar and Hifn. 25 3/11/09 |
 Appendix 26 3/11/09 |
 Transaction Summary • Consideration: Exar will acquire all of the outstanding shares of Hifn common stock pursuant to an exchange offer, followed by a second step merger. In the exchange offer Hifn stockholders will be able to elect to either receive (i) 0.3529 shares of Exar common stock and $1.60 in cash; or (ii) $4.00 in cash • Transaction Timing Expected to be competed during the second calendar quarter of 2009 • Transaction Value Approximately $60M (Includes Hifn Net Cash of $35M as of 12/31/08) • Expected Synergy Approximately $5M annualized, within two to three quarters • Executive Management: Pete Rodriguez, Exar President and CEO, J. Scott Kamsler, Senior VP, CFO • Board of Directors Adding 1 director from Hifn (Albert Sisto, Hifn Chairman and CEO) for a total of 8 Directors On February 23, 2009 Exar Signed a Definitive Agreement to Acquire Hifn – Unanimously Approved by the Boards of both Companies 27 3/11/09 |
 Hifn Highlights • Business Description: Hifn offers a broad set of products that protect information at risk while it is in-transit across the network or at-rest, stored on back-up arrays or tape devices ��� Ticker Symbol: Hifn is traded on Nasdaq • Financial Overview: Net revenue for fiscal 2008 was $39.4 million (9/30/08 year end); net revenue for fiscal year 2009 first quarter (12/31/08) was $8 million • Principal Customers: As of 12/31/08: Cisco Systems (38%), EMC (10%), HP (10%) • Sales and Distribution Hifn sales offices, manufacturing representatives, and distribution partners (Avnet in North America and China) • Manufacturing: Toshiba Corporation, IBM and TSMC • Employees Approximately 150 employees (as of 1/31/09) with 42% in research and development 28 3/11/09 |
 Exar GAAP to Non-GAAP Reconciliation of Results (1/2) 29 3/11/09 Number of Months Ended >>> 9-MTHS (In thousands, except per share amounts) Mar 31, 07 Jun 30, 07 Mar 30, 07 Dec, 07 Mar 30, 08 JUN 29 08 Sep 28, 08 Dec 28, 08 Mar 31, 07 Mar 30, 08 Mar 30, 08 Net Sales 15,660 $ 17,101 $ 19,173 $ 25,207 $ 28,262 $ 32,211 $ 32,748 $ 26,305 $ 68,502 $ 89,743 $ 91,264 $ GAAP gross margin $ 10,330 $ 11,357 $ 10,484 $ 7,567 $ 10,705 $ 14,470 $ 15,005 $ 10,704 $ 46,534 $ 40,112 $ 40,179 $ Stock-based compensation 14 28 106 361 128 192 174 118 91 623 484 Amortization of acquired intangible assets 240 240 1,158 2,539 1,515 955 955 783 960 5,452 2,693 Fair value adjustment of acquired inventories - - 341 1,458 432 - - - - 2,231 - Merger-related costs - - 16 - 36 115 - - - 52 115 Acceleration of depreciation on abandoned equipment - - - - - - - 300 - - 300 Non-GAAP gross margin $ 10,584 $ 11,625 $ 12,105 $ 11,925 $ 12,816 $ 15,732 $ 16,134 $ 11,905 $ 47,585 $ 48,470 $ 43,771 $ GAAP gross margin % 66.0% 66.4% 54.7% 30.0% 37.9% 44.9% 45.8% 40.7% 67.9% 44.7% 44.0% Stock-based compensation 0.1% 0.2% 0.6% 1.4% 0.5% 0.6% 0.5% 0.5% 0.1% 0.7% 0.5% Amortization of acquired intangible assets 1.5% 1.4% 6.0% 10.1% 5.4% 3.0% 2.9% 3.0% 1.4% 6.1% 3.0% Fair value adjustment of acquired inventories - - 1.8% 5.8% 1.5% - - - - 2.5% - Merger-related costs - - - - 0.1% 0.4% - - - 0.1% 0.1% Acceleration of depreciation on abandoned equipment - - - - - - - 1.1% - - 0.3% Non-GAAP gross margin % 67.6% 68.0% 63.1% 47.3% 45.3% 48.8% 49.3% 45.3% 69.5% 54.0% 48.0% GAAP research and development expenses 6,325 $ 6,058 $ 7,452 $ 8,890 $ 8,259 $ 8,092 $ 8,133 $ 8,092 $ 25,838 $ 30,660 $ 24,317 $ Stock-based compensation 218 224 324 389 270 358 481 392 1,181 1,207 1,231 Amortization of acquired intangible assets - - - - - 263 263 200 - - 726 Merger-related costs - - 253 9 131 - - - - 393 - Acceleration of depreciation on abandoned equipment - - - - - - - 437 - - 437 Non-GAAP research and development expenses 6,107 $ 5,834 $ 6,875 $ 8,492 $ 7,858 $ 7,471 $ 7,389 $ 7,063 $ 24,657 $ 29,060 $ 21,923 $ GAAP selling, general and administrative expenses 6,834 $ 5,531 $ 8,503 $ 12,071 $ 11,793 $ 11,301 $ 9,746 $ 9,099 $ 24,925 $ 37,899 $ 30,146 $ Stock-based compensation 831 509 938 1,035 884 809 435 768 3,077 3,366 2,012 Amortization of acquired intangible assets - - 196 474 266 162 162 122 - 936 446 Merger-related costs - - 766 509 717 541 - - - 1,992 541 Separation costs of executive officers 985 - - 465 - - - - 1,649 465 - Acceleration of depreciation on abandoned equipment - - - - - - - 437 - - 437 Non-GAAP selling, general and administrative expenses 5,018 $ 5,022 $ 6,603 $ 9,588 $ 9,926 $ 9,789 $ 9,149 $ 7,772 $ 20,199 $ 31,140 $ 26,710 $ GAAP operating expenses 13,159 $ 11,589 $ 24,755 $ 20,961 $ 185,243 $ 19,393 $ 17,879 $ 76,867 $ 50,763 $ 242,550 $ 114,139 $ Stock-based compensation 1,049 733 1,262 1,424 1,154 1,167 916 1,160 4,258 4,573 3,243 Amortization of acquired intangible assets - - 196 474 266 425 425 322 - 936 1,172 Acquired in-process research and development - - 8,800 - - - - - - 8,800 - Merger-related costs - - 1,019 518 848 541 - - - 2,385 541 Separation costs of executive officers 985 - - 465 - - - - 1,649 465 - Acceleration of depreciation on abandoned equipment - - - - - - - 874 - - 874 Goodwill and other intangible asset impairment - - - - 165,191 - - 59,676 - 165,191 59,676 Non-GAAP operating expenses 11,125 $ 10,856 $ 13,478 $ 18,080 $ 17,784 $ 17,260 $ 16,538 $ 14,835 $ 44,856 $ 60,200 $ 48,633 $ GAAP operating income (loss) (2,829) $ (232) $ (14,271) $ (13,394) $ (174,538) $ (4,923) $ (2,874) $ (66,163) $ (4,229) $ (202,438) $ (73,960) $ Stock-based compensation 1,063 761 1,368 1,785 1,282 1,359 1,090 1,278 4,349 5,196 3,727 Amortization of acquired intangible assets 240 240 1,354 3,013 1,781 1,380 1,380 1,105 960 6,388 3,865 Fair value adjustment of acquired inventories - - 341 1,458 432 - - - - 2,231 - Acquired in-process research and development - - 8,800 - - - - - - 8,800 - Merger-related costs - - 1,035 518 884 656 - - - 2,437 656 Separation costs of executive officers 985 - - 465 - - - - 1,649 465 - Acceleration of depreciation on abandoned equipment - - - - - - - 1,174 - - 1,174 Goodwill and other intangible asset impairment - - - - 165,191 - - 59,676 - 165,191 59,676 Non-GAAP operating income (loss) (541) $ 769 $ (1,373) $ (6,155) $ (4,968) $ (1,528) $ (404) $ (2,930) $ 2,729 $ (11,730) $ (4,862) $ Notes: Certain amounts may not total due to rounding. Certain amounts previously reported above have been reclassified to conform to the current periods' presentation. EXAR CORPORATION AND SUBSIDIARIES (Unaudited) 12-MTHS 3-MTHS |
 Exar GAAP to Non-GAAP Reconciliation of Results (2/2) 30 3/11/09 Number of Months Ended >>> 9-MTHS (In thousands, except per share amounts) Mar 31, 07 Jun 30, 07 Mar 30, 07 Dec, 07 Mar 30, 08 JUN 29 08 Sep 28, 08 Dec 28, 08 Mar 31, 07 Mar 30, 08 Mar 30, 08 GAAP net income (loss) 1,255 $ 4,611 $ (16,410) $ (11,682) $ (172,398) $ (2,461) $ (2,187) $ (63,823) $ 8,024 $ (195,879) $ (68,471) $ Stock-based compensation 1,063 761 1,368 1,785 1,282 1,359 1,090 1,278 4,349 5,196 3,727 Amortization of acquired intangible assets 240 240 1,354 3,013 1,781 1,380 1,380 1,105 960 6,388 3,865 Fair value adjustment of acquired inventories - - 341 1,458 432 - - - - 2,231 - Acquired in-process research and development - - 8,800 - - - - - - 8,800 - Merger-related costs - - 1,035 518 884 656 - - - 2,437 656 Separation costs of executive officers 985 - - 465 - - - - 1,649 465 - Acceleration of depreciation on abandoned equipment - - - - - - - 1,174 - - 1,174 Goodwill and other intangible asset impairment - - - - 165,191 - - 59,676 - 165,191 59,676 Impairment charges on investments, net of realized gains (7) (21) 418 (20) 39 (218) 1,427 (82) 905 416 1,127 Income tax effects (859) (253) (3,169) 2,691 1,035 (161) 142 (103) (2,394) 304 (122) Charge to establish deferred tax asset valuation allowance - - 8,323 - - - - - - 8,323 - Income tax benefit from the closure of federal tax audit - (1,852) (81) - - - - - - (1,933) - Non-GAAP net income (loss) 2,677 $ 3,486 $ 1,979 $ (1,772) $ (1,754) $ 555 $ 1,852 $ (775) $ 13,493 $ 1,939 $ 1,632 $ GAAP diluted earnings (loss) per share 0.03 $ 0.13 $ (0.39) $ (0.24) $ (3.77) $ (0.06) $ (0.05) $ (1.49) $ 0.22 $ (4.55) $ (1.60) $ Stock-based compensation 0.03 0.02 0.03 0.04 0.03 0.03 0.03 0.03 0.12 0.12 0.09 Amortization of acquired intangible assets 0.01 0.01 0.03 0.06 0.04 0.03 0.03 0.03 0.03 0.16 0.09 Fair value adjustment of acquired inventories - - 0.01 0.03 0.01 - - - - 0.05 - Acquired in-process research and development - - 0.21 - - - - - - 0.21 - Merger-related costs - - 0.02 0.01 0.02 0.02 - - - 0.06 0.02 Separation costs of executive officers 0.03 - - 0.01 - - - - 0.05 0.01 - Acceleration of depreciation on abandoned equipment - - - - - - - 0.03 - - 0.03 Goodwill and other intangible asset impairment - - - - 3.61 - - 1.39 - 3.80 1.39 Impairment charges on investments, net of realized gains - - 0.01 - - (0.01) 0.03 - 0.03 0.01 0.03 Income tax effects (0.02) (0.01) (0.07) 0.05 0.02 - - - (0.07) 0.02 - Charge to establish deferred tax asset valuation allowance - - 0.19 - - - - - - 0.20 - Income tax benefit from the closure of federal tax audit - (0.05) - - - - - - - (0.04) - Non-GAAP diluted earnings (loss) per share 0.07 $ 0.10 $ 0.05 $ (0.04) $ (0.04) $ 0.01 $ 0.04 $ (0.02) $ 0.37 $ 0.04 $ 0.04 $ Shares used in diluted earnings (loss) per share --- GAAP 36,369 36,134 41,796 49,301 45,712 42,973 42,735 42,889 36,480 43,090 42,866 The effect of dilutive potential common shares due to reporting Non-GAAP net income 95 - 626 - - 260 246 - 137 540 - The effect of removing stock-based compensation expense under SFAS 123R for Non-GAAP presentation purpose (115) 13 350 - - (81) (130) - (225) - - Shares used in diluted earnings (loss) per share --- Non-GAAP 36,349 36,147 42,772 49,301 45,712 43,152 42,851 42,889 36,392 43,630 42,866 EXAR CORPORATION AND SUBSIDIARIES (Unaudited) 3-MTHS 12-MTHS Notes: Certain amounts may not total due to rounding. Certain amounts previously reported above have been reclassified to conform to the current periods' presentation. |
 Hifn GAAP to Non-GAAP Reconciliation of Results 31 3/11/09 Mar 31, 07 Jun 30, 07 Sep 30, 07 Dec 31, 07 Mar 31, 08 Jun 30, 08 Sep 30, 08 Dec 31, 08 Net revenue 11,029 11,671 10,998 10,929 9,265 10,220 9,004 7,958 GAAP gross profit 7,433 7,707 7,530 7,457 6,143 6,551 5,444 5,554 Stock-based compensation 7 12 6 7 8 7 8 13 Non-GAAP gross profit 7,426 7,695 7,524 7,450 6,135 6,544 5,436 5,541 GAAP gross margin % 67.4% 66.0% 68.5% 68.2% 66.3% 64.1% 60.5% 69.8% Stock-based compensation 67.4% 66.0% 68.5% 68.2% 66.3% 64.1% 60.5% 69.8% Non-GAAP gross margin % 67.3% 65.9% 68.4% 68.2% 66.2% 64.0% 60.4% 69.6% GAAP operating expenses 7,876 6,953 6,383 7,718 7,701 7,634 8,056 7,501 Stock-based compensation 537 750 506 426 529 403 466 625 Non-GAAP Operating expenses 7,339 6,203 5,877 7,292 7,172 7,231 7,590 6,876 GAAP net income (Loss) (707) 284 584 (680) (2,034) (1,889) (3,153) (2,497) Stock-based compensation 544 762 512 433 537 410 474 638 Acquired intangible amortization 738 737 826 749 749 749 749 749 Acquired in-process research and development 159 Impairment charge on investment 90 Non-GAAP net income (loss) 575 1,783 2,081 592 (748) (730) (1,930) (1,110) THREE MONTHS ENDED |