Exhibit 99.2
First-Quarter 2012 CFO Commentary
As reflected in our earnings release, there are a number of items that impact the comparability of our results with those in the trailing quarter and the first quarter of last year. Any discussion of our results will exclude these items to give you a better sense of our operating results. As always, the operating information we provide to you should be used as a complement to GAAP numbers. For a complete reconciliation between our GAAP and Non-GAAP results, please refer to our earnings release or the earnings reconciliation found at the end of this document.
The following first quarter and pro forma information included in this CFO commentary is unaudited and should be read in conjunction with the company's consolidated financial statements and related notes appearing in the company's 2011 Annual Report on Form 10-K as filed with the Securities and Exchange Commission.
First-Quarter Summary
We executed well in the first quarter with sales and earnings per share in line with our expectations. Cash flow generation was a bright spot in the first quarter, as we generated $250 million in cash flow from operations, with contributions from both business segments. We continue to manage the company for long-term growth and continuous improvement, which enables us to outperform the market regardless of the market conditions we operate in. We have also maintained gross margins in what is still a very difficult macro environment. Our return on working capital and return on invested capital continue to be strong.
In our global enterprise computing solutions segment, we had another very strong performance this quarter. Sales were well ahead of normal seasonality and increased 15% year over year, or nearly 3x the rate at which the market is expected to grow. Highlights for the quarter included robust product line performance for storage, software, and services, which each grew in excess of 20% year over year. We have and will continue to outperform the market and execute on our strategic objectives to differentiate Arrow ECS by expanding our geographic reach, increasing our services portfolio, and utilizing our broad product offerings to create better value for our customers and suppliers.
In our global components business, the Americas region performed well and we continue to generate operating margins above the targeted level for the region. The well publicized macroeconomic challenges in the European region as well as slower growth in China have impacted our performance in those regions. Despite these headwinds, we did see an improvement in the global book-to-bill which is now at 1.04, reflecting sequential increases across all regions. We continue to see strong design activity in all regions with both approved registrations up 21% from the prior quarter. Our global teams remain focused on driving increased market share in all regions while providing the highest possible level of service to our customers.
Consolidated Overview – First Quarter
| P&L Highlights* | Q1 2012 | Y/Y Change | Y/Y Change Pro Forma | Q/Q Change |
| Sales | $4,890 | -6% | -9% | -10% |
| Gross Profit Margin | 13.9% | +10bps | -30bps | +20bps |
| Operating Expense/Sales | 9.9% | +60bps | +30bps | +70bps |
| Operating Income | $195.7 | -17% | -20% | -21% |
| Operating Margin | 4.0% | -50bps | -50bps | -50bps |
| Net Income | $119.8 | -18% | -21% | -24% |
| Diluted EPS | $1.05 | -15% | -19% | -24% |
* $ in millions, except per share data, may reflect rounding
| ● | First quarter sales of $4.9 billion were in line with our expectations |
| o | Decreased 6% year over year and 10% on a sequential basis |
| ■ | Pro forma for acquisitions and excluding FX, sales were down 8% year over year and decreased 10% sequentially |
| ● | Consolidated gross profit margin was 13.9% |
| o | Increased 10 basis year over year, driven primarily by acquisitions, and was up 20 basis points sequentially |
| o | Pro forma for acquisitions and excluding FX, gross profit margin was down 30 basis points year over year primarily due to a change in mix of products and customers |
| ● | Operating expenses as a percentage of sales were 9.9% |
| o | Increased 60 basis points year over year and 70 basis points sequentially |
| ■ | On an absolute dollar basis, operating expenses declined 1% year over year |
| ■ | Excluding acquisitions and foreign exchange, operating expenses declined $24 million year over year |
| ● | Operating income was $195.7 million |
| o | Decreased 17% year over year and 21% sequentially |
| o | Pro forma for acquisitions, operating income was down 20% year over year |
| ● | Operating income as a percentage of sales was 4.0% |
| o | Decreased 50 basis points year over year and sequentially |
| o | Pro forma for acquisitions, operating income as a percentage of sales decreased 50 basis points year over year |
| ● | Effective tax rate for the quarter was 29.8% |
| ● | Net income was $119.8 million |
| o | Decreased 18% compared with last year and 24% sequentially |
| o | Pro forma for acquisitions, net income was down 21% year over year |
| ● | Earnings per share were $1.07 and $1.05 on a basic and diluted, respectively |
| o | Diluted EPS decreased 15% year over year and 24% sequentially |
| o | Pro forma for acquisitions, EPS decreased 19% year over year |
Global Components
| ● | Sales decreased 14% year over year and declined 3% sequentially |
| o | Pro forma and excluding the impact of foreign exchange, sales declined 15% year over year and 3% sequentially |
| ● | Gross margin increased 50 basis points year over year primarily due to the impact of recently acquired businesses and strength in the Americas region |
| o | Sequentially, gross margin increased 20 basis points |
| ● | Book to bill improved sequentially in all regions and is now 1.04 on a global basis |
| ● | We continue to see solid design activity in all regions |
| o | Approved registrations up 21% sequentially |
| ● | Leading indicators, including lead times and cancellation rates, are in line with historical levels |
| ● | Operating profit declined 25% year over year |
| o | Operating margin decreased 80 basis points year over year to 5.1% |
● | Return on working capital declined 630 basis points year over year |
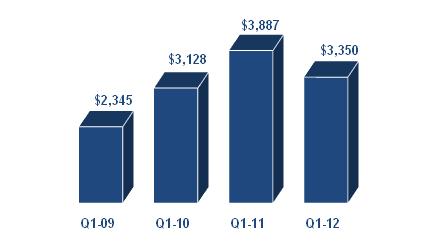
Americas Components Region
Sales ($ in millions)
| ● | Sales decreased 3% year over year and 4% sequentially |
| o | Pro forma for acquisitions, sales decreased 6% year over year and 4% on a sequential basis |
| o | Sales below normal seasonality on a sequential basis following a very strong fourth quarter |
| ● | We continued to see strong growth in the lighting market, with sales up 22% year over year and 20% sequentially |
| ● | PEMCO sales also were strong, increasing 6% from the previous quarter |
| ● | Operating income decreased 8% year over year |
| o | Operating margin declined 40 basis points year over year |
| o | We continue to generate operating margins above the targeted level in what was a more difficult environment compared to a year ago. |
| ● | Looking ahead to the second quarter, we expect sales in our traditional Americas components legacy business to be in line with normal seasonality |
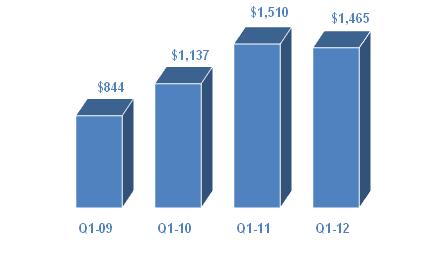
Europe Components Region
Sales ($ in millions)
| ● | Sales declined 22% year over year and increased 5% sequentially |
| o | Pro forma for acquisitions and excluding FX, sales decreased 21% year over year and increased 7% sequentially |
| o | Sales below normal seasonality due to ongoing market softness |
| ● | Vertical market growth continues to be strong, outperforming the broader market |
| o | Automotive and medical increased 6% and 4% year over year, respectively |
| o | Sequentially, we saw strength in medical (+51%), automotive (+30%), and lighting (+17%) |
| ● | Operating income declined 45% year over year |
| o | Operating margin declined 190 basis points year over year |
| ● | Looking ahead to the second quarter, we expect sales in our traditional European components legacy business to be in line with normal seasonality |
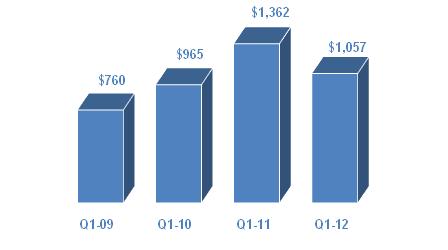
Asia Pacific Components Region
| ● | Sales declined 18% year over year and 9% sequentially |
| o | Pro forma for acquisitions, sales decreased 23% year over year and 12% sequentially |
| o | Below normal seasonality on a sequential basis, primarily due to soft market conditions, particularly in China as core small and medium size customers continue to be impacted by tight credit market |
| ● | Core Asia sales decreased 16% year over year |
| o | Sequentially, the core business was below normal seasonality due to the aforementioned tight credit market |
| ● | Within our vertical markets, transportation increased 17% year over year and 8% compared to the fourth quarter |
| ● | Operating profit declined 52% year over year |
| o | Operating margin declined 120 basis points year over year |
| ● | Looking ahead to the second quarter, we expect sales in our traditional Asia Pacific components legacy business to be in line with normal seasonality |
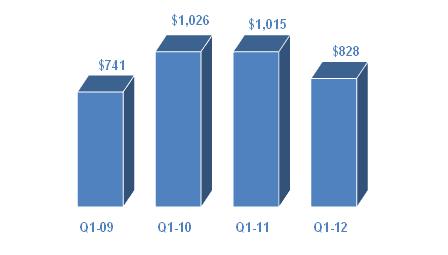
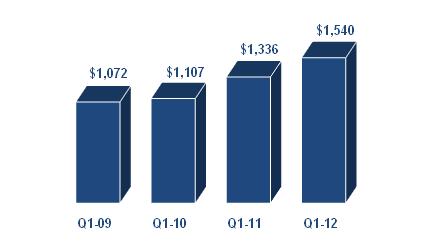
Global Enterprise Computing Solutions
Sales ($ in millions)
| ● | Sales increased 15% year over year and declined 23% sequentially |
| o | Record first quarter revenue |
| o | Pro forma for acquisitions and excluding FX, sales increased 14% year over year |
| ● | Strong double-digit year-over-year growth in storage (+29%), services (+21%), and software (+20%) |
| o | Robust growth in faster-growing product lines with networking, infrastructure, security, and virtualization up strong double digits year over year |
| ● | Gross margin decreased 40 basis points year over year driven primarily by product mix |
| o | Pro forma for acquisitions, gross profit decreased 80 basis points year over year |
| o | Gross margin was down 10 basis points on a sequential basis |
| ● | Operating income grew 42% year over year and increased nearly 3x faster than sales |
| o | Operating margin increased 70 basis points year over year to 3.6% |
| ● | Return on working capital continues to excel |
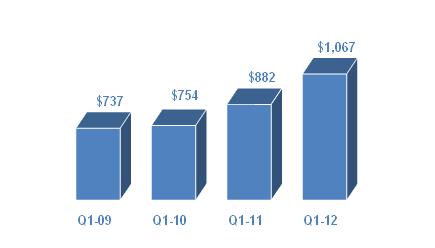
ECS America
| ● | Sales increased 21% year over year and declined 21% sequentially |
| o | Pro forma for acquisitions, sales increased 16% year over year and decreased 21% sequentially |
| o | Sales well ahead of normal seasonality |
| ● | Robust double-digit year-over-year growth in storage (+39%), services (+26%), and software (+23%) |
| o | Within software, networking grew 79% and infrastructure grew 37% year over year |
| ● | Gross profit decreased 30 basis points year over year and declined 10 basis points sequentially |
| o | Year-over-year increase driven by strength in our core North American value-added distribution business, changes in product mix, and the addition of recent acquisitions |
| ● | Operating income grew 46% year over year |
| o | Operating income grew 2x faster than sales year over year |
| o | Operating margin expanded 70 basis points year over year |
| ● | Looking ahead to the second quarter, we expect sales in our traditional Americas value-added computing solutions business to be in line with normal seasonality |
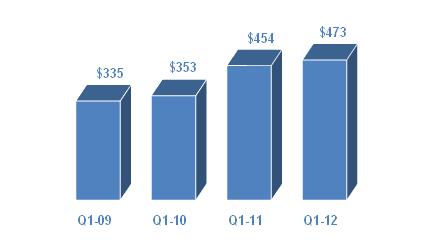
ECS Europe
| ● | Sales increased 4% year over year and declined 27% sequentially |
| o | Pro forma for acquisitions and excluding FX, sales increased 8% year over year and declined 26% sequentially |
| ● | Sales growth in line with normal seasonality on a sequential basis |
| o | Strong growth across United Kingdom which increased 21% year over year |
| ■ | All other regions grew single digits |
| o | Strong year-over-year growth in software with virtualization and infrastructure up 21%, and security up 14% |
| ● | Gross profit declined 60 basis points year over year due primarily to product mix |
| o | Pro forma for acquisitions, gross profit declined 70 basis points year over year |
| o | Decreased 10 basis points sequentially |
| ● | Operating profit increased 13% year over year |
| o | Operating income grew more than 3x faster than sales year over year |
| o | Operating margin increased 20 basis points year over year |
| ● | Looking ahead to the second quarter, we expect sales in our traditional European value-added computing solutions business to be slightly ahead of normal seasonality |
Cash Flow and Balance Sheet Highlights
| ● | Cash Flow from Operations |
We generated $250 million in cash from operations in the first quarter, with contributions from both business segments. Over the last twelve months we have generated $550 million in cash flow from operations.
We continue to effectively manage all levers of our working capital with working capital to sales of $.16. Return on working capital is 25.6%.
| ● | Return on Invested Capital |
Our return on invested capital of 10.2% is well ahead of our weighted average cost of capital.
In the first quarter we repurchased 1.2 million shares for a total of $50 million. We currently have $100 million remaining on our most recent repurchase authorization to fund future share buybacks.
Our balance sheet and capital structure remain strong with conservative debt levels, and a net debt to EBITDA ratio of approximately 1.7x. Our total liquidity is over $2.7 billion when including our cash of almost $750 million. Thus, we have the flexibility to continue to take advantage of opportunities in the marketplace.
| Second Quarter 2012 Guidance | |
| Consolidated Sales | $5.04 billion to $5.44 billion |
| Global Components | $3.37 billion to $3.57 billion |
| Global ECS | $1.67 billion to $1.87 billion |
| | |
| Diluted Earnings per Share | $1.08 to $1.20 |
Arrow Electronics Revenue Seasonality*
| Global Components | NAC | EMEA ex FX | AAP |
| Q1 | -2% to +4% | +13% to +19% | -1% to +5% |
| Q2 | -3% to +3% | -5% to -11% | +4% to +10% |
| Q3 | -2% to +4% | -5% to +1% | +3% to +9% |
| Q4 | -4% to +2% | -3% to -9% | -1% to +7% |
| Global ECS | NA | EMEA ex FX |
| Q1 | -28% to -34% | -21% to -27% |
| Q2 | +20% to +26% | +1% to +7% |
| Q3 | -2% to -8% | -12% to -18% |
| Q4 | +28% to +34% | +59% to +65% |
* Revenue seasonality based on historical sequential sales growth for 2007-2011 for our traditional components and ECS businesses excluding acquisitions
Risk Factors
The discussion of the company’s business and operations should be read together with the risk factors contained in Item 1A of its 2011 Annual Report on Form 10-K, filed with the Securities and Exchange Commission, which describe various risks and uncertainties to which the company is or may become subject. If any of the described events occur, the company’s business, results of operations, financial condition, liquidity, or access to the capital markets could be materially adversely affected.
Certain Non-GAAP Financial Information
In addition to disclosing results that are determined in accordance with Generally Accepted Accounting Principles ("GAAP"), the company provides certain non-GAAP financial information relating to operating income, net income attributable to shareholders and net income per basic and diluted share, each as adjusted for certain charges, credits and losses that the company believes impact the comparability of its results of operations. These charges, credits and losses arise out of the company's efficiency enhancement initiatives, acquisitions, prepayment of debt, and settlement of certain legal and tax matters. A reconciliation of the company's non-GAAP financial information to GAAP is set forth in the table below.
The company believes that such non-GAAP financial information is useful to investors to assist in assessing and understanding the company's operating performance and underlying trends in the company's business because management considers the charges, credits and losses referred to above to be outside the company's core operating results. This non-GAAP financial information is among the primary indicators management uses as a basis for evaluating the company's financial and operating performance. In addition, the company's Board of Directors may use this non-GAAP financial information in evaluating management performance and setting management compensation.
The presentation of this additional non-GAAP financial information is not meant to be considered in isolation or as a substitute for, or alternative to, operating income, net income attributable to shareholders and net income per basic and diluted share determined in accordance with GAAP. Analysis of results and outlook on a non-GAAP basis should be used as a complement to, and in conjunction with, data presented in accordance with GAAP.
Earnings Reconciliation
($ in thousands, except per share data)
| | | | Q1 2012 | | | | Q4 2011 | | | | Q1 2011 | |
| Operating income, as Reported | | | $187,449 | | | | $232,183 | | | | $219,168 | |
| Restructuring, integration, and other charges | | | 8,243 | | | | 14,135 | | | | 9,607 | |
| Settlement of legal matter | | | -- | | | | -- | | | | 5,875 | |
| Operating income, as Adjusted | | | $195,692 | | | | $246,318 | | | | $234,650 | |
| | | | | | | | | | | | | |
| Net income attributable to shareholders, as Reported | | | $113,628 | | | | $174,088 | | | | $136,309 | |
| Restructuring, integration, and other charges | | | 6,141 | | | | 11,223 | | | | 7,199 | |
| Settlement of legal matter | | | -- | | | | -- | | | | 3,609 | |
| Gain/(adjustment) on bargain purchase | | | -- | | | | 410 | | | | -1,078 | |
| Loss on prepayment of debt | | | -- | | | | 549 | | | | -- | |
| Reversal of valuation allowance on international deferred tax assets | | | -- | | | | -28,928 | | | | -- | |
| Net income attributable to shareholders, as Adjusted | | | $119,769 | | | | $157,342 | | | | $146,039 | |
| | | | | | | | | | | | | |
| Diluted EPS, as Reported | | | $1.00 | | | | $1.53 | | | | $1.16 | |
| Restructuring, integration, and other charges | | | 0.05 | | | | 0.1 | | | | 0.06 | |
| Settlement of legal matter | | | -- | | | | -- | | | | 0.03 | |
| Gain/(adjustment) on bargain purchase | | | -- | | | | -- | | | | -0.01 | |
| Loss on prepayment of debt | | | -- | | | | -- | | | | -- | |
| Reversal of valuation allowance on international deferred tax assets | | | -- | | | | -0.25 | | | | -- | |
| Diluted EPS, as Adjusted | | | $1.05 | | | | $1.38 | | | | $1.24 | |
The sum of the components for net income per share, as Adjusted, may not agree to totals, as presented, due to rounding.
Earnings Reconciliation
References to restructuring and other charges refer to the following incremental charges taken in the periods indicated:
Q1-12 Restructuring, Integration, and Other Charges: During the first quarter of 2012, the company recorded restructuring, integration, and other charges of $8.2 million ($6.1 million net of related taxes or $.05 per share on both a basic and diluted basis).
Q4-11 Restructuring, Integration, and Other Charges: During the fourth quarter of 2011, the company recorded restructuring, integration, and other charges of $14.1 million ($11.2 million net of related taxes or $.10 per share on both a basic and diluted basis).
Q4-11 Gain/ (Adjustment) on Bargain Purchase: During the fourth quarter of 2011, the company recorded an adjustment to the gain on bargain purchase recorded in the first quarter of 2011 of $.7 million ($.4 million net of related taxes).
Q4-11 Loss on Prepayment of Debt: During the fourth quarter of 2011, the company recorded a loss on prepayment of debt of $.9 million ($.5 million net of related taxes).
Q4-11 Reversal of Valuation Allowance on International Deferred Tax Assets: During the fourth quarter of 2011, the company recorded a net reduction of the provision for income taxes of $28.9 million ($.26 and $.25 per share on a basic and diluted basis, respectively) principally due to a reversal of a valuation allowance on certain international deferred tax assets.
Q1-11 Restructuring, Integration, and Other Charges: During the first quarter of 2011, the company recorded restructuring, integration, and other charges of $9.6 million ($7.2 million net of related taxes or $.06 per share on both a basic and diluted basis).
Q1-11 Settlement of Legal Matter: During the first quarter of 2011, the company recorded a charge of $5.9 million ($3.6 million net of related taxes or $.03 per share on both a basic and diluted basis) in connection with the settlement of a legal matter.
Q1-11 Gain/ (Adjustment) on Bargain Purchase: During the first quarter of 2011, the company recognized a gain on bargain purchase of $1.8 million ($1.1 million net of related taxes or $.01 per share on both a basic and diluted basis).
14