Exhibit 99.2
First-Quarter 2013 CFO Commentary
As reflected in our earnings release, there are a number of items that impact the comparability of our results with those in the trailing quarter and the first quarter of last year. Any discussion of our results will exclude these items to give you a better sense of our operating results. As always, the operating information we provide to you should be used as a complement to GAAP numbers. For a complete reconciliation between our GAAP and Non-GAAP results, please refer to our earnings release or the earnings reconciliation found at the end of this document.
The following first quarter as reported and adjusted information included in this CFO commentary is unaudited and should be read in conjunction with the Form 10-Q for the quarterly period ended March 30, 2013, as well as the company's consolidated financial statements and related notes appearing in the company's 2012 Annual Report on Form 10-K as filed with the Securities and Exchange Commission.
First-Quarter Summary
We performed well in what remained challenging markets in the first quarter. Our consolidated sales were in excess of $4.8 billion and diluted earnings per share were $.89. Revenue was in line with the midpoint of our guidance while EPS came in above the midpoint.
In our global components segment, we executed well in a market that continues to be impacted by the weak macroeconomic environment. The year-over-year sales decline of 5% was in line with our expectations. In the Americas, market conditions weakened as economic uncertainty persisted in the first quarter, and customers maintained a cautious stance. In Europe, the core business did experience normal seasonal strength on a sequential basis. Our Asia Pacific business saw double-digit year-over-year growth, driven by strength in the core business. Book to bill was above one globally, with all regions reporting positive ratios.
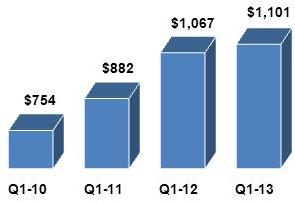
Our strong performance over the past 3 years in our enterprise computing solutions segment continued in 2013. Sales reached a record first-quarter level increasing 8% year over year. This represents the 13th consecutive quarter of organic growth for the ECS organization. Storage, software, and services continued to grow at a healthy rate year over year as customers focus on productivity and efficiency enhancements for their organizations. In the Americas sales growth was above normal seasonality in the core value-added distribution business with a stronger-than-expected close to the quarter. In Europe, as expected, sales were modestly below normal seasonality, as the European economies further weakened in the first quarter.
Consolidated Overview – First Quarter
| P&L Highlights* | Q1 2013 | Y/Y Change | Y/Y Change Adjusted for Acquisitions | Q/Q Change |
| Sales | $4,850 | -1% | -3% | -10% |
| Gross Profit Margin | 13.2% | -70bps | -80bps | +10bps |
| Operating Expense/Sales | 10.0% | +10bps | Flat | +60bps |
| Operating Income | $159.2 | -19% | -20% | -19% |
| Operating Margin | 3.3% | -70bps | -70bps | -30bps |
| Net Income | $96.0 | -20% | -21% | -27% |
| Diluted EPS | $.89 | -15% | -17% | -27% |
* $ in millions, except per share data, may reflect rounding
| · | First quarter sales of $4.8 billion were in line with our expectations |
| o | Decreased 1% year over year and 10% sequentially |
| o | Adjusted for the impact of acquisitions and foreign currency, sales declined 3% year over year |
| · | Consolidated gross profit margin was 13.2% |
| o | Decreased 70 basis points year over year primarily due to ongoing pricing pressure as well as a change in mix of products |
| § | Increased 10 basis points sequentially |
| o | Adjusted for the impact of acquisitions and foreign currency, gross profit margins decreased by approximately 70 basis points year over year due to ongoing pricing pressure in the global components segment, as well as a change in geographic and product mix |
| · | Operating expenses as a percentage of sales were 10.0% |
| o | Increased 10 basis points year over year and 60 basis points sequentially |
| § | On an absolute dollar basis, operating expenses were flat year over year on a reported basis and declined 4% year over year when adjusted for the impact of acquisitions and foreign currency |
| · | Operating income was $159.2 million |
| o | Decreased 19% both year over year and sequentially |
| o | Adjusted for the impact of acquisitions, operating income was down 20% year over year |
| · | Operating income as a percentage of sales was 3.3% |
| o | Decreased 70 basis points year over year as reported and adjusted for the impact of acquisitions |
| o | Decreased 30 basis points sequentially |
| · | Effective tax rate for the quarter was 27.0% |
| · | Net income was $96.0 million |
| o | Decreased 20% compared with last year and 27% sequentially |
| o | Adjusted for the impact of acquisitions, net income was down 21% year over year |
| · | Earnings per share were $.91 and $.89 on a basic and diluted basis, respectively |
| o | Diluted EPS decreased 15% year over year and 27% sequentially |
| o | Adjusted for the impact of acquisitions, diluted EPS decreased 17% year over year |
Global Components
| ● | Sales decreased 5% year over year and were flat sequentially |
| | o | Adjusted for the impact of acquisitions and foreign currency, sales in global components were down 6% year over year |
| | Gross margin declined 60 basis points year over year due to ongoing pricing pressure as well as a change in geographic mix and product mix |
| | o | Sequentially, gross margin was flat |
| | o | Adjusted for the impact of acquisitions and foreign currency, gross margin declined 70 basis points year over year due to the aforementioned ongoing pricing pressure and change in mix |
| ● | Book-to-bill was above one on a global basis |
| | o | Above parity in all regions |
| ● | Leading indicators, including lead times and cancellation rates, are in line with historical levels |
| ● | Operating profit declined 25% year over year |
| | o | Operating margin of 4.0% decreased 110 basis points year over year as reported and 100 basis points adjusted for the impact of acquisitions |
| ● | Return on working capital declined 660 basis points year over year |
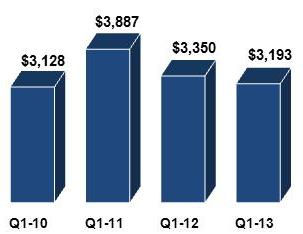
Americas Components Region
| · | Sales decreased 5% year over year and 4% sequentially |
| o | Adjusted for the impact of acquisitions, sales decreased 7% year over year |
| o | Sales below normal seasonality on a sequential basis |
| § | Broad based market weakness as customers remain cautious |
| · | Lighting growth continues to be very robust, increasing 14% year over year and 4% sequentially |
| o | Aerospace & defense and medical verticals grew faster than the overall market year over year |
| · | PEMCO initiatives continue to gain momentum, with sales increasing 1% year over year and 5% sequentially |
| · | Operating income decreased 25% year over year |
| o | Operating margin declined 150 basis points year over year |
| · | Looking ahead to the second quarter, we expect sales in our legacy Americas components business to be at the mid to high end of normal seasonality |
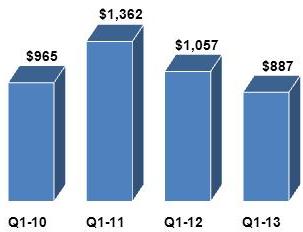
Europe Components Region
| · | Sales declined 16% year over year and increased 15% sequentially |
| o | Adjusted for the impact of foreign currency, sales declined 17% year over year and increased 13% sequentially |
| o | Sales in our core business were at the low end of normal seasonality |
| · | Automotive and lighting vertical market growth continues to outperform the broader market |
| · | Operating income declined 30% year over year |
| o | Operating margin declined 70 basis points year over year |
| · | Looking ahead to the second quarter, we expect sales in our legacy European components business to be at the mid to high end of normal seasonality |
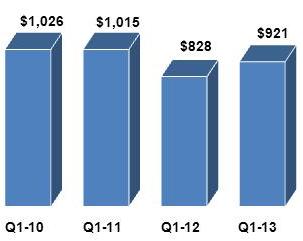
Asia Pacific Components Region
| · | Sales increased 11% year over year and declined 5% sequentially |
| o | Adjusted for the impact of acquisitions, sales increased 11% year over year |
| o | Sales in our core Asia business below normal seasonality |
| § | Core Asia sales increased 14% year over year, driven by broad-based strength in China |
| · | The mobile vertical market continues continue to show excellent year-over-year growth, increasing 74% |
| o | Transportation grew a strong 16% year over year |
| · | Operating profit increased 23% year over year |
| o | Operating income increased 2x faster than sales year over year |
| o | Operating margin increased 20 basis points year over year |
| · | Looking ahead to the second quarter, we expect sales in our legacy Asia Pacific components business to be at the mid to high end of normal seasonality |
Global Enterprise Computing Solutions
| · | Sales increased 8% year over year and declined 25% sequentially |
| o | Record level revenue for any first quarter |
| o | Adjusted for the impact of acquisitions and foreign currency, sales increased 2% year over year |
| § | 13th consecutive quarter of year-over-year organic growth |
| · | Strong year-over-year growth in storage (+12%), software (+10%), industry-standard servers (+7%), and services (+6%) |
| o | Infrastructure, networking, and virtualization increased 17%, 15%, and 7% year over year, respectively |
| · | Gross margin decreased 60 basis points year over year driven primarily by changes in product mix |
| o | Gross margin decreased 10 basis points on a sequential basis |
| · | Operating income increased faster than sales, growing 11% year over year |
| o | Operating margin was up 10 basis points year over year to 3.7% |
| § | Highest first-quarter level since 2007 |
| · | Return on working capital continues to excel |
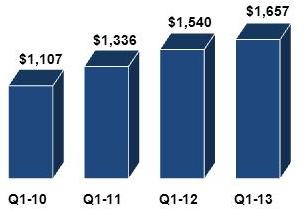
ECS America
| · | Sales increased 3% year over year and declined 21% sequentially |
| o | Sales in our core value-added distribution business well above normal seasonality |
| § | Very strong close to the March quarter |
| · | Robust double-digit year-over-year growth in software (+16%), storage (+14%), and industry-standard servers (+9%) |
| o | Networking grew 25%, security and infrastructure each grew 16%, and virtualization grew 13% year over year |
| · | Operating income increased 9% year over year |
| o | Operating income grew nearly 3x faster than sales year over year |
| o | Operating margin increased 20 basis points year over year |
| o | Remains within our long-term target range |
| · | Looking ahead to the second quarter, we expect sales in our legacy Americas value-added computing solutions business to be below normal seasonality |
ECS Europe
| · | Sales increased 17% year over year and declined 32% sequentially |
| o | Adjusted for the impact of acquisitions and foreign currency, sales declined 2% year over year |
| § | Organic sales growth below normal seasonality on a sequential basis following very strong fourth quarter performance |
| o | Year-over year growth led by the Nordics, Southern and Eastern Europe, and the West |
| · | Strong year-over-year growth driven by services (+13%) and proprietary servers (+11%) |
| o | Storage and software increased 6% and 5% year over year, respectively |
| § | Infrastructure software was up 18% year over year |
| · | Operating profit increased 32% year over year |
| o | Operating income grew nearly 2x faster than sales year over year |
| o | Operating margin increased 20 basis points year over year |
| · | Looking ahead to the second quarter, we expect sales in our legacy European value-added computing solutions business to be at the high end of normal seasonality |
Cash Flow and Balance Sheet Highlights
| · | Cash Flow from Operations |
Cash used for operating activities in the first quarter was $179 million. There was a combination of factors which impacted our performance here. We expect cash flow to be positive in the second quarter and we expect to achieve our stated cash goal of converting 70% of GAAP net income into cash in 2013.
We continue to effectively manage all levers of our working capital with working capital to sales of $.17. Return on working capital is 19.4%.
| · | Return on Invested Capital |
Return on invested capital was 8.1% in the first quarter.
In the first quarter we repurchased 2.4 million shares for $98 million. Since the end of the first quarter, we have repurchased almost $14 million of our stock, leaving $186 million remaining on our most recent repurchase authorization to fund future share buybacks. We have returned more than $910 million to shareholders in the form of stock repurchases since the beginning of 2007.
Our balance sheet and capital structure remain very strong with conservative debt levels, and a net debt to EBITDA ratio of approximately 2.5x. Our total liquidity is $2.3 billion when including our cash of $364 million. Thus, we have the flexibility to continue to take advantage of opportunities in the marketplace.
| Second-Quarter 2013 Guidance | |
| Consolidated Sales | $4.9 billion to $5.3 billion |
| Global Components | $3.15 billion to $3.35 billion |
| Global ECS | $1.75 billion to $1.95 billion |
| | |
| Diluted Earnings per Share* | $.95 to $1.07 |
* Second quarter guidance assumes average diluted shares outstanding of 107.1 million.
Arrow Electronics Revenue Seasonality*
Global Components | NAC | EMEA ex FX | AAP |
| Q1 | -2% to +4% | +13% to +19% | -1% to +5% |
| Q2 | -3% to +3% | -5% to -11% | +4% to +10% |
| Q3 | -2% to +4% | -5% to +1% | +3% to +9% |
| Q4 | -4% to +2% | -3% to -9% | -1% to -7% |
| Global ECS | NA | EMEA ex FX |
| Q1 | -28% to -34% | -21% to -27% |
| Q2 | +20% to +26% | +1% to +7% |
| Q3 | -2% to -8% | -12% to -18% |
| Q4 | +28% to +34% | +59% to +65% |
* Revenue seasonality based on historical sequential sales growth for 2007-2011 for our traditional components and ECS businesses excluding acquisitions
Risk Factors
The discussion of the company’s business and operations should be read together with the risk factors contained in Item 1A of its 2012 Annual Report on Form 10-K, filed with the Securities and Exchange Commission, which describe various risks and uncertainties to which the company is or may become subject. If any of the described events occur, the company’s business, results of operations, financial condition, liquidity, or access to the capital markets could be materially adversely affected.
Certain Non-GAAP Financial Information
In addition to disclosing results that are determined in accordance with Generally Accepted Accounting Principles ("GAAP"), the company provides certain non-GAAP financial information relating to operating income, net income attributable to shareholders and net income per basic and diluted share, each as adjusted for certain charges, credits, gains, and losses that the company believes impact the comparability of its results of operations. These charges, credits, gains, and losses arise out of the company's efficiency enhancement initiatives, acquisitions, and prepayment of debt. A reconciliation of the company's non-GAAP financial information to GAAP is set forth in the table below.
The company believes that such non-GAAP financial information is useful to investors to assist in assessing and understanding the company's operating performance and underlying trends in the company's business because management considers the charges, credits, gains and losses referred to above to be outside the company's core operating results. This non-GAAP financial information is among the primary indicators management uses as a basis for evaluating the company's financial and operating performance. In addition, the company's Board of Directors may use this non-GAAP financial information in evaluating management performance and setting management compensation.
The presentation of this additional non-GAAP financial information is not meant to be considered in isolation or as a substitute for, or alternative to, operating income, net income attributable to shareholders and net income per basic and diluted share determined in accordance with GAAP. Analysis of results and outlook on a non-GAAP basis should be used as a complement to, and in conjunction with, data presented in accordance with GAAP.
Earnings Reconciliation
($ in thousands, except per share data)
| | | | Q1 2013 | | | | Q4 2012 | | | | Q1 2012 | |
| Operating income, as Reported | | $ | 137,552 | | | $ | 264,168 | | | $ | 187,449 | |
| Restructuring, integration, and other charges | | | 21,610 | | | | 11,285 | | | | 8,243 | |
| Settlement of legal matter | | | -- | | | | (79,158 | ) | | | -- | |
| Operating income, as Adjusted | | $ | 159,162 | | | $ | 196,295 | | | $ | 195,692 | |
| | | | | | | | | | | | | |
| Net income attributable to shareholders, as Reported | | $ | 77,875 | | | $ | 174,704 | | | $ | 113,628 | |
| Restructuring, integration, and other charges | | | 15,495 | | | | 6,320 | | | | 6,141 | |
| Settlement of legal matter | | | -- | | | | (48,623 | ) | | | -- | |
| Loss on prepayment of debt | | | 2,627 | | | | -- | | | | -- | |
| Net income attributable to shareholders, as Adjusted | | $ | 95,997 | | | $ | 132,401 | | | $ | 119,769 | |
| | | | | | | | | | | | | |
| Diluted EPS, as Reported | | $ | 0.72 | | | $ | 1.62 | | | $ | 1.00 | |
| Restructuring, integration, and other charges | | | 0.14 | | | | 0.06 | | | | 0.05 | |
| Settlement of legal matter | | | -- | | | | (0.45 | ) | | | -- | |
| Loss on prepayment of debt | | | 0.02 | | | | -- | | | | -- | |
| Diluted EPS, as Adjusted | | $ | 0.89 | | | $ | 1.22 | | | $ | 1.05 | |
The sum of the components for diluted EPS, as Adjusted, may not agree to totals, as presented, due to rounding.
Earnings Reconciliation
References to restructuring and other charges refer to the following incremental charges taken in the periods indicated:
Q1-13 Restructuring, Integration, and Other Charges: During the first quarter of 2013, the company recorded restructuring, integration, and other charges of $21.6 million ($15.5 million net of related taxes or $.15 and $.14 per share on a basic and diluted basis, respectively).
Q1-13 Loss on Prepayment of Debt: During the first quarter of 2013, the company recorded a loss on prepayment of debt of $4.3 million ($2.6 million net of related taxes or $.02 on both a basic and diluted basis).
Q4-12 Restructuring, Integration, and Other Charges: During the fourth quarter of 2012, the company recorded restructuring, integration, and other charges of $11.3 million ($6.3 million net of related taxes or $.06 per share on both a basic and diluted basis).
Q4-12 Settlement of Legal Matter: During the fourth quarter of 2012, the company recorded a gain of $79.2 million ($48.6 million net of related taxes or $.46 and $.45 per share on a basic and diluted basis, respectively) related to the settlement of a legal matter.
Q1-12 Restructuring, Integration, and Other Charges: During the first quarter of 2012, the company recorded restructuring, integration, and other charges of $8.2 million ($6.1 million net of related taxes or $.05 per share on both a basic and diluted basis).
14