Exhibit 99.2
Fourth-Quarter 2013 CFO Commentary
As reflected in our earnings release, there are a number of items that impact the comparability of our results with those in the trailing quarter and the fourth quarter of last year. Any discussion of our results will exclude these items to give you a better sense of our operating results. As always, the operating information we provide to you should be used as a complement to GAAP numbers. For a complete reconciliation between our GAAP and Non-GAAP results, please refer to our earnings release and the earnings reconciliation found at the end of this document.
The following fourth quarter as reported and adjusted information included in this CFO commentary is unaudited and should be read in conjunction with the company’s 2013 Annual Report on Form 10-K as filed with the Securities and Exchange Commission.
Fourth-Quarter Summary
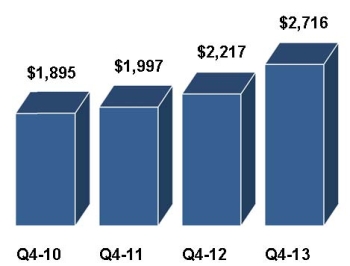
We had an excellent fourth quarter, completing a good year in 2013. We executed well on our organic strategic initiatives, executed on M&A that further accelerated our strategy, drove best in class financial performance, and returned substantial capital to our shareholders through our buyback program. In the fourth quarter, sales of $6.2 billion were ahead of our guidance and were up 14 percent over the prior year. Operating income and diluted earnings per share advanced 29 percent and 31 percent, respectively, year over year. Operating margins were up over last year’s fourth quarter in both businesses and we posted record operating income. Cash generation was, again, very strong at over $210 million. Return on working capital grew significantly to 31%. We continue to invest in our business and advance what is already one of the most comprehensive set of solutions in the market.
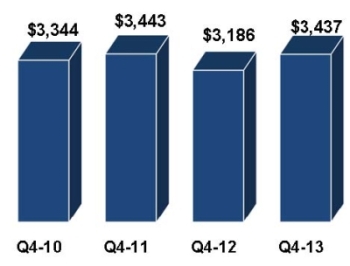
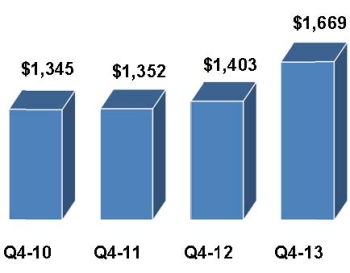
In global components, the overall market remains stable, with lead times and cancellation rates operating in normal ranges. Our sales of $3.4 billion were at the high end of expectations, advancing 8 percent year over year with increases in all three regions. Book to bill, at 1.03, was ahead of prior year. Our Americas region showed steady growth, at 3 percent. Asia continued its strong growth trends, advancing 11 percent in the core business and 9 percent overall. The highest growth region was Europe, with sales growth of 10 percent year over year, on a constant currency basis. Gross margins, while holding steady sequentially, were down slightly in the core year over year. Operating income increased 16 percent year over year, or 2 times our growth in sales.
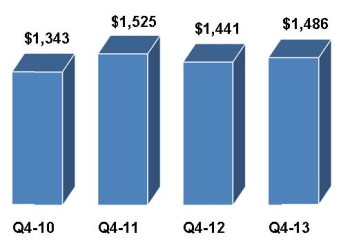
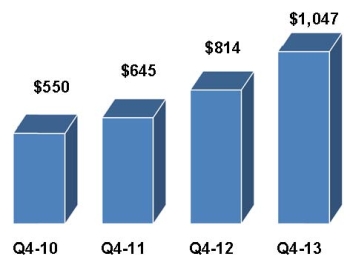
In enterprise computing solutions our supplier matrix expansion, share growth, and excellent execution in the quarter all drove our record sales and operating income. Sales advanced 13 percent year over year, excluding the impact of the acquisition of Computerlinks on October 28, 2013. Computerlinks added $208 million in revenue in the fourth quarter. We continue to see excellent growth in storage, services, and software in both regions. Our server business also saw growth year over year. ECS margins advanced 30 percent in the fourth quarter to 5.6% percent, again generating record operating income.
Full Year
For the full year 2013, sales increased 5 percent to $21.4 billion, with growth of 1 percent in global components and 12 percent in ECS. Operating income was $823 million, up $14 million year over year. Global components operating income was down 7 percent year over year to $596 million, or 4.4 percent of sales. ECS operating income advanced 19 percent year over year to $367 million, as operating margins improved 30 basis points to 4.7 percent.
As we look to the first quarter, we expect no meaningful change to the markets we serve. However as we proved once again in 2013, we are able to produce strong results independent of the market environment, and we look forward to continuing this in 2014.
Consolidated Overview – Fourth Quarter
P&L Highlights* | | | Q4 2013 | | | Y/Y Change | | | Y/Y Change Adjusted for Acquisitions | | | Q/Q Change | |
| Sales | | $ | 6,153 | | | | +14% | | | | +10% | | | | +22% | |
| Gross Profit Margin | | | 12.8 | % | | -30bps | | | -40bps | | | -50bps | |
| Operating Expense/Sales | | | 8.5 | % | | -80bps | | | -90bps | | | -100bps | |
| Operating Income | | $ | 266 | | | | +29% | | | | +23% | | | | +37% | |
| Operating Margin | | | 4.3 | % | | +50bps | | | +50bps | | | +50bps | |
| Net Income | | $ | 172 | | | | +23% | | | | +17% | | | | +43% | |
| Diluted EPS | | $ | 1.69 | | | | +31% | | | | +24% | | | | +43% | |
* $ in millions, except per share data, may reflect rounding
| ● | Fourth-quarter sales of $6.2 billion were ahead of our guidance |
o | Increased 14% year over year and 22% sequentially |
o | Adjusted for the impact of acquisitions and changes in foreign currencies, sales increased 8% year over year |
| ● | Consolidated gross profit margin was 12.8% |
o | Decreased 30 basis points year over year, principally due to a higher mix of ECS and Asia components sales |
| § | Decreased 50 basis points sequentially due to a higher mix of ECS sales |
| ● | Operating expenses as a percentage of sales were 8.5% |
o | Declined 80 basis points year over year and 100 basis points sequentially |
| § | On an absolute dollar basis, operating expenses increased 4% year over year |
| § | Adjusted for the impact of acquisitions and changes in foreign currencies, operating expenses were 90 basis points lower as a percentage of sales, driven by our operating leverage and efficiency initiatives |
| ● | Operating income was $266 million, a record quarter |
| o | Increased 29% year over year as reported, more than 2 x our sales growth |
| o | Increased 23% as adjusted for the impact of acquisitions |
| ● | Operating income as a percentage of sales was 4.3% |
| o | Increased 50 basis points year over year and sequentially |
| ● | Effective tax rate for the quarter was 28.4% |
| ● | Net income was $172 million |
| o | Increased $32 million year over year |
| o | Increased $52 million sequentially |
| ● | Earnings per share were $1.71 and $1.69 on a basic and diluted basis, respectively |
| o | Diluted EPS increased 31% year over year and 43% sequentially |
Global Components
| ● | Sales increased 8% year over year and were down 1% sequentially |
| ● | Gross profit dollars increased 6% year over year and were down 1% sequentially |
o | Sales growth and an improvement in European gross profit dollars drove the improvement year over year |
o | Highest fourth-quarter level in the last four years |
| ● | Leading indicators, including lead times and cancellation rates, are in line with historical norms |
| ● | Gross margins decreased 30 basis points year over year and were flat sequentially |
| ● | Operating margin of 4.3% |
o | Increased 30 basis points year over year and as adjusted for the impact of acquisitions, primarily driven by operating leverage and our efficiency initiatives |
| ● | Return on working capital increased 130 basis points year over year, driven by higher operating income |
Americas Components Region
| ● | Sales increased 3% year over year and were flat sequentially |
o | Growth in all tracked verticals, with particularly good growth in medical and lighting year over year |
o | In line with normal seasonality on a sequential basis |
| ● | Operating income increased 2% year over year |
o | Operating margin was down 10 basis points year over year |
| ● | Looking ahead to the first quarter, we expect sales in our core Americas components business to be ahead of seasonality |
Europe Components Region
| ● | Sales increased 15% year over year and decreased 3% sequentially |
o | Adjusted for the impact of changes in foreign currencies, sales increased 10% year over year and decreased 6% sequentially |
o | All regions at or above prior year sales levels |
o | Sequential sales in line with traditional seasonality |
| ● | Operating income increased 97% year over year |
o | Operating margins increased 165 basis points year over year |
o | Driven by improvement in gross margins, operating leverage, and our efficiency initiatives |
| ● | Looking ahead to the first quarter, we expect sales in our core European components business to be in line with our seasonality range |
Asia Pacific Components Region
● | Sales increased 9% year over year and were down 1% sequentially |
o | Strong improvements in China drove year over year growth |
o | Sequential sales in line with traditional seasonality |
| ● | Operating profit increased 18% year over year |
o | Primarily due to improving gross margins in our core business and operating leverage |
o | Operating margin increased 20 basis points year over year |
| ● | Looking ahead to the first quarter, we expect sales in our core Asia Pacific components business to be near the low end of our seasonality range |
Global Enterprise Computing Solutions
| ● | Sales increased 23% year over year and 72% sequentially |
o | Double digit growth year over year in services, storage, and software |
| § | Networking and infrastructure software lead the gains, up 31% and 33%, respectively |
| ● | Gross margin was flat year over year and decreased 40 basis points sequentially |
o | Up 30 basis points year over year |
o | Income increased 30% year over year to a record level |
| ● | Return on working capital continues to excel, increasing year over year and quarter over quarter |
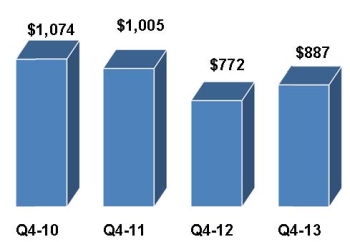
ECS America
| ● | Sales increased 19% year over year and 46% sequentially |
o | Year over year growth in software (+25%), storage (+23%), and services (+19%) |
o | Sales in our core value-added distribution business ahead of seasonality |
| ● | Operating income increased 22% year over year and 63% sequentially |
o | Operating margin increased 20 basis points year over year |
| ● | Looking ahead to the first quarter, we expect sales in our core Americas value-added computing solutions business to be below seasonality, due to our early quarter end cut off when compared to several of our suppliers |
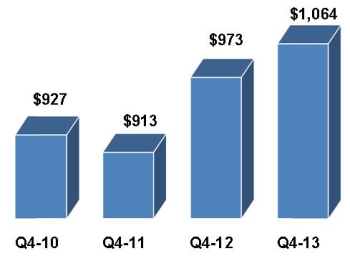
ECS Europe
| ● | Sales increased 29% year over year and 138% sequentially |
o | Excluding the impact of Computerlinks, sales increased 94% sequentially in constant currency |
o | Year over year growth in software (+66%), services (+31%), and storage (+29%) |
| ● | Operating profit increased 56% year over year |
o | Operating margin increased 100 basis points year over year |
| ● | Looking ahead to the first quarter, we expect sales in our core European value-added computing solutions business to be in line with seasonality, including the impact of our early quarter end cut off |
Consolidated Overview – Full Year 2013
| P&L Highlights* | | 2013 | | | Y/Y Change | | | Y/Y Change Adjusted for Acquisitions | |
| Sales | | $ | 21,357 | | | +5% | | | +2% | |
| Gross Profit Margin | | | 13.1 | % | | -30bps | | | -40bps | |
| Operating Expense/Sales | | | 9.2 | % | | -20bps | | | -30bps | |
| Operating Income | | $ | 823 | | | +2% | | | flat | |
| Operating Margin | | | 3.9 | % | | -110bps | | | -110bps | |
| Net Income | | $ | 519 | | | flat | | | -2% | |
| Diluted EPS | | $ | 5.01 | | | +7% | | | +5% | |
* $ in millions, except per share data, may reflect rounding
| ● | 2013 sales of $21.4 billion |
| o | Increased 5% year over year |
| o | Adjusted for the impact of acquisitions and changes in foreign currencies, sales increased 2% year over year |
| ● | Consolidated gross profit margin was 13.1% |
| o | Decreased 30 basis points year over year, largely due to substantial growth in ECS and Asia components sales |
| ● | Operating expenses as a percentage of sales were 9.2% |
| o | Declined 20 basis points year over year |
| § | On an absolute dollar basis, operating expenses increased 2% year over year |
| § | Adjusted for the impact of acquisitions and changes in foreign currencies, operating expense dollars declined 1 percent year over year and were 30 basis points lower as a percentage of sales, driven by our efficiency initiatives |
| ● | Operating income was $823 million |
| o | Increased 2% year over year as reported, and was flat as adjusted for the impact of acquisitions |
| ● | Operating income as a percentage of sales was 3.9% |
| ● | Effective tax rate for the year was 27.6% |
| ● | Net income was $519 million |
| o | Flat compared with last year |
| o | Pro forma for acquisitions, net income was down 2% year over year |
| ● | Earnings per share were $5.06 and $5.01 on a basic and diluted basis, respectively |
| o | Diluted EPS increased 7% year over year |
| o | Pro forma for acquisitions, EPS increased 5% year over year |
| ● | Returns on capital accretive to shareholders |
| o | Return on working capital was 25.1% |
| o | Return on invested capital of 10.2%, ahead of our weighted cost of capital |
Cash Flow and Balance Sheet Highlights
| · | Cash Flow from Operations |
Cash generated from operating activities in the fourth quarter was $215 million and $451 million on a trailing 12-month basis. We converted more than 113% of GAAP net income to cash over the last 12-months, well in excess of our target.
We continued to effectively manage all levers of our working capital throughout the fourth quarter, with working capital to sales of 14 percent. Return on working capital was 30.9%.
| · | Return on Invested Capital |
Return on invested capital in the fourth quarter was 12.7%, a substantial increase over both the third quarter and prior year, and well ahead of our weighted average cost of capital.
We repurchased $50 million shares in the fourth quarter, bringing our total cash returned to shareholders in 2013 to approximately $350 million.
Our balance sheet and capital structure remain very strong with conservative debt levels and a net debt to EBITDA ratio of approximately 1.6x. Our total liquidity is $2.7 billion when including our cash of $391 million. Our capital structure strategy includes remaining investment grade over the long term, as well as maintaining the flexibility to invest in our strategy and execute on our share repurchase program.
| First-Quarter 2014 Guidance | |
| Consolidated Sales | $5.1 billion to $5.5 billion |
| Global Components | $3.3 billion to $3.5 billion |
| Global ECS | $1.8 billion to $2.0 billion |
| | |
| Diluted Earnings per Share* | $1.14 to $1.26 |
* First quarter guidance assumes average diluted shares outstanding of 102 million.
Arrow Electronics Updated Revenue Seasonality*
Global Components | NAC | EMEA ex FX | AAP |
| Q1 | -7% to +1% | +9% to +17% | -10% to -2% |
| Q2 | -1% to +7% | -5% to +3% | +9% to +17% |
| Q3 | -6% to +2% | -3% to +5% | -4% to +4% |
| Q4 | -3% to +5% | -13% to -5% | -4% to +4% |
| Global ECS | NA | EMEA ex FX | |
| Q1 | -27% to -19% | -34% to -26% | |
| Q2 | +15% to +23% | +3% to +11% | |
| Q3 | -15% to -7% | -25% to -17% | |
| Q4 | +31% to +39% | +75% to +83% | |
* Revenue seasonality based on historical sequential sales growth for our components and ECS businesses, updated1/1/2014
Risk Factors
The discussion of the company’s business and operations should be read together with the risk factors contained in Item 1A of its 2013 Annual Report on Form 10-K, filed with the Securities and Exchange Commission, which describe various risks and uncertainties to which the company is or may become subject. If any of the described events occur, the company’s business, results of operations, financial condition, liquidity, or access to the capital markets could be materially adversely affected.
Certain Non-GAAP Financial Information
In addition to disclosing results that are determined in accordance with Generally Accepted Accounting Principles ("GAAP"), the company provides certain non-GAAP financial information relating to operating income, net income attributable to shareholders, and net income per basic and diluted share, each as adjusted for certain charges, credits, gains, and losses that the company believes impact the comparability of its results of operations. These charges, credits, gains, and losses arise out of the company's efficiency enhancement initiatives, acquisitions (including intangible assets amortization expense), prepayment of debt, and adjustments related to certain tax matters. A reconciliation of the company's non-GAAP financial information to GAAP is set forth in the table below.
The company believes that such non-GAAP financial information is useful to investors to assist in assessing and understanding the company's operating performance and underlying trends in the company's business because management considers the charges, credits, gains and losses referred to above to be outside the company's core operating results. This non-GAAP financial information is among the primary indicators management uses as a basis for evaluating the company's financial and operating performance. In addition, the company's Board of Directors may use this non-GAAP financial information in evaluating management performance and setting management compensation.
The presentation of this additional non-GAAP financial information is not meant to be considered in isolation or as a substitute for, or alternative to, operating income, net income attributable to shareholders and net income per basic and diluted share determined in accordance with GAAP. Analysis of results and outlook on a non-GAAP basis should be used as a complement to, and in conjunction with, data presented in accordance with GAAP.
Earnings Reconciliation
($ in thousands, except per share data)
| | | | Q4 2013 | | | | Q3 2013 | | | | Q4 2012 | |
| Operating income, as Reported | | $ | 237,337 | | | $ | 162,736 | | | $ | 264,168 | |
| Intangible assets amortization expense | | | 10,007 | | | | 8,936 | | | | 9,136 | |
| Restructuring, integration, and other charges | | | 18,248 | | | | 22,568 | | | | 11,285 | |
| Settlement of legal matter | | | -- | | | | -- | | | | (79,158 | ) |
| Operating income, as Adjusted | | $ | 265,592 | | | $ | 194,240 | | | $ | 205,431 | |
| | | | | | | | | | | | | |
| Net income attributable to shareholders, as Reported | | $ | 134,831 | | | $ | 96,779 | | | $ | 174,704 | |
| Intangible assets amortization expense | | | 8,120 | | | | 7,074 | | | | 7,255 | |
| Restructuring, integration, and other charges | | | 13,341 | | | | 16,077 | | | | 6,320 | |
| Settlement of legal matter | | | -- | | | | -- | | | | (48,623 | ) |
| Settlement of tax matters | | | | | | | | | | | | |
| Income taxes | | | 15,447 | | | | -- | | | | -- | |
| Interest (net of taxes) | | | 297 | | | | -- | | | | -- | |
| Net income attributable to shareholders, as Adjusted | | $ | 172,036 | | | $ | 119,930 | | | $ | 139,656 | |
| | | | | | | | | | | | | |
| Diluted EPS, as Reported | | $ | 1.32 | | | $ | .95 | | | $ | 1.62 | |
| Intangible assets amortization expense | | | .08 | | | | .07 | | | | .07 | |
| Restructuring, integration, and other charges | | | .13 | | | | .16 | | | | .06 | |
| Settlement of legal matter | | | -- | | | | -- | | | | (.45 | ) |
| Settlement of tax matters | | | | | | | | | | | | |
| Income taxes | | | .15 | | | | -- | | | | -- | |
| Interest (net of taxes) | | | -- | | | | -- | | | | -- | |
| Diluted EPS, as Adjusted | | $ | 1.69 | | | $ | 1.18 | | | $ | 1.29 | |
The sum of the components for diluted EPS, as Adjusted, may not agree to totals, as presented, due to rounding.
Earnings Reconciliation
References to restructuring and other charges refer to the following incremental charges taken in the periods indicated:
Q4-13 Intangible Assets Amortization Expense: During the fourth quarter of 2013, the company recorded intangible assets amortization expense of $10.0 million ($8.1 million net of related taxes or $.08 per share on both a basic and diluted basis).
Q4-13 Restructuring, Integration, and Other Charges: During the fourth quarter of 2013, the company recorded restructuring, integration, and other charges of $18.2 million ($13.3 million net of related taxes or $.13 per share on both a basic and diluted basis).
Q4-13 Settlement of tax matters: During the fourth quarter of 2013, the company recorded an increase in the provision for income taxes of $15.4 million ($.15 per share on both a basic and diluted basis) and interest expense (net of related taxes) of $.3 million relating to the settlement of certain international tax matters.
Q3-13 Intangible Assets Amortization Expense: During the third quarter of 2013, the company recorded intangible assets amortization expense of $8.9 million ($7.1 million net of related taxes or $.07 per share on both a basic and diluted basis).
Q3-13 Restructuring, Integration, and Other Charges: During the third quarter of 2013, the company recorded restructuring, integration, and other charges of $22.6 million ($16.1 million net of related taxes or $.16 per share on both a basic and diluted basis).
Q4-12 Intangible Assets Amortization Expense: During the fourth quarter of 2012, the company recorded intangible assets amortization expense of $9.1 million ($7.3 million net of related taxes or $.07 per share on both a basic and diluted basis).
Q4-12 Restructuring, Integration, and Other Charges: During the fourth quarter of 2012, the company recorded restructuring, integration, and other charges of $11.3 million ($6.3 million net of related taxes or $.06 per share on both a basic and diluted basis).
Q4-12 Settlement of legal matter: During the fourth quarter of 2012, the company recorded a gain of $79.2 million ($48.6 million net of related taxes or $.46 and $.45 per share on a basic and diluted basis, respectively).
Earnings Reconciliation
($ in thousands, except per share data)
| | | 2013 | | | 2012 | |
| Operating income, as Reported | | $ | 693,500 | | | $ | 804,123 | |
| Intangible assets amortization expense | | | 36,769 | | | | 36,508 | |
| Restructuring, integration, and other charges | | | 92,650 | | | | 47,437 | |
| Settlement of legal matter | | | -- | | | | (79,158 | ) |
| Operating income, as Adjusted | | $ | 822,919 | | | $ | 808,910 | |
| | | | | | | | | |
| Net income attributable to shareholders, as Reported | | $ | 399,420 | | | $ | 506,332 | |
| Intangible assets amortization expense | | | 29,339 | | | | 29,336 | |
| Restructuring, integration, and other charges | | | 65,601 | | | | 30,739 | |
| Settlement of legal matter | | | -- | | | | (48,623 | ) |
| Loss on prepayment of debt | | | 2,627 | | | | -- | |
| Settlement of tax matters | | | | | | | | |
| Income taxes | | | 20,809 | | | | -- | |
| Interest (net of taxes) | | | 1,236 | | | | -- | |
| Net income attributable to shareholders, as Adjusted | | $ | 519,032 | | | $ | 517,784 | |
| | | | | | | | | |
| Diluted EPS, as Reported | | $ | 3.85 | | | $ | 4.56 | |
| Intangible assets amortization expense | | | .28 | | | | .26 | |
| Restructuring, integration, and other charges | | | .63 | | | | .28 | |
| Settlement of legal matter | | | -- | | | | (.44 | ) |
| Loss on prepayment of debt | | | .03 | | | | -- | |
| Settlement of tax matters | | | | | | | | |
| Income taxes | | | .20 | | | | -- | |
| Interest (net of taxes) | | | .01 | | | | -- | |
| Diluted EPS, as Adjusted | | $ | 5.01 | | | $ | 4.66 | |
The sum of the components for diluted EPS, as Adjusted, may not agree to totals, as presented, due to rounding.
Earnings Reconciliation
References to restructuring and other charges refer to the following incremental charges taken in the periods indicated:
2013 Intangible Assets Amortization Expense: In 2013, the company recorded intangible assets amortization expense of $36.8 million ($29.3 million net of related taxes or $.29 and $.28 per share on a basic and diluted basis, respectively).
2013 Restructuring, Integration, and Other Charges: In 2013, the company recorded restructuring, integration, and other charges of $92.7 million ($65.6 million net of related taxes or $.64 and $.63 per share on a basic and diluted basis, respectively).
2013 Loss on prepayment of debt: In 2013, the company recorded a loss on prepayment of debt of $4.3 million ($2.6 million net of related taxes or $.03 per share on both a basic and diluted basis).
2013 Settlement of tax matters: In 2013, the company recorded an increase in the provision for income taxes of $20.8 million ($.20 per share on both a basic and diluted basis) and interest expense of $1.6 million ($1.2 million net of related taxes or $.01 per share on both a basic and diluted basis) relating to the settlement of certain international tax matters.
2012 Intangible Assets Amortization Expense: In 2012, the company recorded intangible assets amortization expense of $36.5 million ($29.3 million net of related taxes or $.27 and $.26 per share on a basic and diluted basis, respectively).
2012 Restructuring, Integration, and Other Charges: In 2012, the company recorded restructuring, integration, and other charges of $47.4 million ($30.7 million net of related taxes or $.28 per share on both a basic and diluted basis).
2012 Settlement of legal matter: During 2012, the company recorded a gain of $79.2 million ($48.6 million net of related taxes or $.45 and $.44 per share on a basic and diluted basis, respectively).
20