Exhibit 99.1
| | | | |

| | PACCAR Inc |
| | Public Affairs Department |
| | P.O. Box 1518 |
| | Bellevue, WA 98009 |
| | Contact: | | Ken Hastings |
| | | | (425) 468-7530 |
FOR IMMEDIATE RELEASE
PACCAR Achieves Good First Quarter Results
Strong European Truck Market Drives Record DAF Share
April 26, 2016, Bellevue, Washington – “PACCAR reported good revenues and operating income for the first quarter of 2016,” said Ron Armstrong, chief executive officer. “PACCAR benefitted from a favorable truck market in North America and record DAF market share of 16.6% year-to-date in Europe. PACCAR generated increased truck and parts segment margins, and good financial services results worldwide. I am very proud of our 23,000 employees who have delivered industry leading products and services to our customers.”
First quarter 2016 net sales and financial services revenues were $4.30 billion compared to $4.83 billion for the first quarter of 2015. PACCAR earned adjusted net income (non-GAAP)1 of $348.0 million ($.99 per diluted share) in the first quarter of 2016, excluding a $942.6 million non-recurring charge for the European Commission investigation of all European truck manufacturers. The Company earned net income of $378.4 million ($1.06 per diluted share) in the first quarter last year. Including the non-recurring charge, which is not tax deductible, PACCAR reported a net loss of $594.6 million ($1.69 per diluted share) in the first quarter of 2016. The Company will continue to evaluate the amount of the charge pending final resolution of the proceeding.
Ron Armstrong added, “PACCAR’s strong balance sheet and positive operating cash flow, which has averaged $2.1 billion per year in the last five years, have enabled the company to invest $3.3 billion in new facilities, products and services during the same period. New Kenworth, Peterbilt and DAF vehicles, an expanded PACCAR engine range and strong aftermarket sales are contributing to the company’s long-term growth.”
PACCAR Share Repurchases
PACCAR repurchased 1.1 million of its common shares for $56.3 million during the first quarter of 2016. Under the current Board of Directors authorization for $300 million of stock repurchases, PACCAR has repurchased 3.8 million shares for $192.6 million. “PACCAR’s excellent net profits and cash flow make the company’s shares an attractive long-term investment. The stock repurchase program reflects the Board’s confidence in PACCAR’s successful global business growth,” said Bob Christensen, PACCAR president and chief financial officer.
| 1 | See attached supplementary information on non-GAAP financial measures. |
Highlights – First Quarter 2016
Highlights of PACCAR’s financial results during the first quarter of 2016 include:
| | • | | Consolidated net sales and revenues of $4.30 billion. |
| | • | | Adjusted net income of $348.0 million (non-GAAP), excluding a $942.6 million non-recurring charge for the European Commission investigation. |
| | • | | Net loss of $594.6 million. |
| | • | | Truck, Parts and Other gross margin of 14.9%. |
| | • | | Cash generated from operations of $795.8 million. |
| | • | | Financial Services pretax income of $80.3 million. |
| | • | | Research and development expenses of $59.6 million. |
| | • | | Manufacturing cash and marketable securities of $3.23 billion. |
| | • | | Stockholders’ equity of $6.34 billion. |
Global Truck Markets
DAF is the above 16-tonne market share leader in the United Kingdom, the Netherlands, Hungary and Poland. “Our customers recognize DAF’s excellent product quality, low operating costs and strong resale value,” said Preston Feight, DAF president and PACCAR vice president. “European truck industry sales in the above 16-tonne truck market are estimated to increase and be in the range of 260,000-290,000 vehicles in 2016, the strongest market since 2008.”
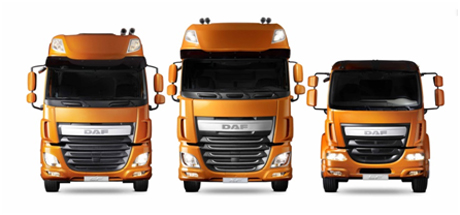
DAF CF, XF and LF Trucks
Class 8 truck industry retail sales for the U.S. and Canada in 2016 are expected to be in a range of 220,000-250,000 vehicles, the third highest market in the last 10 years. “The truck market reflects the good economy and steady freight demand,” said Gary Moore, PACCAR executive vice president. “Our customers’ operations are benefitting from the fuel-efficient PACCAR MX engines, Kenworth and Peterbilt aerodynamic trucks and low oil prices.”
PACCAR Parts Achieves Solid Results
PACCAR’s 17 parts distribution centers (PDC) support over 2,000 DAF, Kenworth and Peterbilt dealer service locations. PACCAR Parts generated quarterly revenues of $719.5 million in the first quarter of 2016, compared to $752.7 million achieved in the first quarter of 2015. First quarter 2016 pretax income was $134.6 million, compared to $138.9 million earned in the first quarter last year. PACCAR Parts’ pretax return on revenues increased to 18.7%, compared to 18.5% in the first quarter of 2015.
“PACCAR Parts’ sales growth over the last five years has been driven by ongoing investment in distribution, technology and products, and an increase in the North American and European truck parcs,” said Harrie Schippers, PACCAR senior vice president.
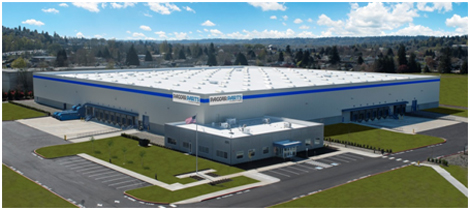
PACCAR Parts’ New 160,000 square-foot Distribution Center in Renton, Washington
PACCAR Parts opened its new 160,000 square-foot PDC in Renton, Washington this month. The PDC provides enhanced aftermarket support for dealers and customers in the Pacific Northwest and Western Canada.
Financial Services Companies Achieve Good Results
PACCAR Financial Services (PFS) has a portfolio of 175,000 trucks and trailers, with total assets of $12.3 billion. PACCAR Leasing, a major full-service truck leasing company in North America and Europe with a fleet of 38,000 vehicles, is included in this segment. PFS’ first quarter 2016 pretax income was $80.3 million compared to $89.0 million earned in the first quarter of 2015. PFS achieved first quarter 2016 revenues of $289.4 million compared to $284.7 million in 2015. “Excellent portfolio performance contributed to good PFS results during the first quarter of 2016,” said Bob Bengston, PACCAR senior vice president. “Our Kenworth, Peterbilt and DAF dealers and customers appreciate PFS’s commitment to providing technology solutions, excellent customer service and dedicated support of the transportation industry in all phases of the business cycle.”
“PACCAR’s excellent balance sheet, complemented by its A+/A1 credit ratings, enables PFS to offer competitive retail financing to Kenworth, Peterbilt and DAF dealers and customers in 22 countries on four continents,” said Todd Hubbard, PACCAR Financial Corp. president.
Environmental Leadership
PACCAR is an environmental leader as reflected by the industry-leading fuel-efficiency of its Kenworth, Peterbilt and DAF trucks. The Kenworth T680Advantage is Kenworth’s most fuel-efficient truck. Newly-designed aerodynamic features enhance the airflow around the vehicle. “Kenworth engineers continue to innovate and develop enhancements that will provide fuel economy gains for Kenworth customers,” said Mike Dozier, Kenworth general manager and PACCAR vice president.
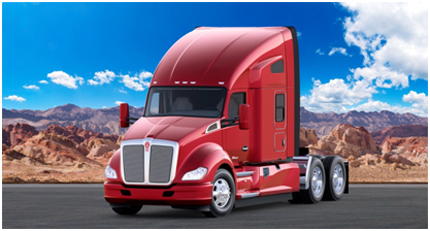
Kenworth Aerodynamic T680Advantage Model
Capital Investments Focused on Enhanced Efficiency
PACCAR’s excellent long-term profits, strong balance sheet, and intense focus on quality, technology and productivity have enabled the company to invest $6.0 billion in world-class facilities, innovative products and new technologies during the past decade. “In 2016, capital expenditures of $325-$375 million are targeted for new product development, enhanced manufacturing facilities and aftermarket support programs. Research and development expenses are estimated at $240-$260 million this year as Kenworth, Peterbilt and DAF invest in industry-leading products and services to enable our customers to enhance the performance of their businesses,” commented George West, PACCAR vice president.
Peterbilt began construction of a 102,000 square-foot expansion to its truck manufacturing facility in Denton, Texas during the first quarter of 2016. “This expansion is Peterbilt’s largest facility investment since the construction of the Denton plant in 1980 and will enhance our manufacturing efficiency and provide additional production capacity,” said Darrin Siver, Peterbilt general manager and PACCAR vice president.
Industry Recognition
Peterbilt’s truck factory in Denton, Texas, earnedFrost & Sullivan’s Manufacturing Leadership Awards in 2016. The Manufacturing Leadership Awards honor companies that are shaping the future of global manufacturing. Peterbilt was honored in the‘Operational Excellence Leadership’ category for truck assembly and quality management processes.
PACCAR is a global technology leader in the design, manufacture and customer support of high-quality light-, medium- and heavy-duty trucks under the Kenworth, Peterbilt and DAF nameplates. PACCAR also designs and manufactures advanced diesel engines, provides financial services and information technology, and distributes truck parts related to its principal business.
PACCAR will hold a conference call with securities analysts to discuss first quarter earnings on April 26, 2016, at 8:00 a.m. Pacific time. Interested parties may listen to the call by selecting “Q1 Earnings Webcast” at PACCAR’s homepage. The Webcast will be available on a recorded basis through May 3, 2016. PACCAR shares are traded on the Nasdaq Global Select Market, symbol PCAR. Its homepage iswww.paccar.com.
This release contains “forward-looking statements” within the meaning of the Private Securities Litigation Reform Act. These statements are based on management’s current expectations and are subject to uncertainty and changes in circumstances. Actual results may differ materially from those included in these statements due to a variety of factors. More information about these factors is contained in PACCAR’s filings with the Securities and Exchange Commission.
PACCAR Inc
SUMMARY STATEMENTS OF OPERATIONS
(in millions except per share amounts)
| | | | | | | | |
| | | Three Months Ended | |
| | | March 31 | |
| | | 2016 | | | 2015 | |
Truck, Parts and Other: | | | | | | | | |
Net sales and revenues | | $ | 4,010.6 | | | $ | 4,548.0 | |
Cost of sales and revenues | | | 3,413.6 | | | | 3,910.2 | |
Research and development | | | 59.6 | | | | 56.2 | |
Selling, general and administrative | | | 110.3 | | | | 109.5 | |
European Commission charge | | | 942.6 | | | | | |
Interest and other expense, net | | | .1 | | | | 4.5 | |
| | | | | | | | |
| | |
Truck, Parts and Other (Loss) Income Before Income Taxes | | | (515.6 | ) | | | 467.6 | |
| | |
Financial Services: | | | | | | | | |
Revenues | | | 289.4 | | | | 284.7 | |
Interest and other | | | 181.2 | | | | 169.5 | |
Selling, general and administrative | | | 24.5 | | | | 23.5 | |
Provision for losses on receivables | | | 3.4 | | | | 2.7 | |
| | | | | | | | |
| | |
Financial Services Income Before Income Taxes | | | 80.3 | | | | 89.0 | |
Investment income | | | 5.7 | | | | 5.1 | |
| | | | | | | | |
| | |
Total (Loss) Income Before Income Taxes | | | (429.6 | ) | | | 561.7 | |
Income taxes | | | 165.0 | | | | 183.3 | |
| | | | | | | | |
| | |
Net (Loss) Income | | $ | (594.6 | ) | | $ | 378.4 | |
| | | | | | | | |
| | |
Net (Loss) Income Per Share: | | | | | | | | |
Basic | | $ | (1.69 | ) | | $ | 1.07 | |
| | | | | | | | |
Diluted | | $ | (1.69 | ) | | $ | 1.06 | |
| | | | | | | | |
| | |
Weighted Average Shares Outstanding: | | | | | | | | |
Basic | | | 351.3 | | | | 355.1 | |
| | | | | | | | |
Diluted | | | 351.3 | | | | 356.1 | |
| | | | | | | | |
| | |
Dividends declared per share | | $ | .24 | | | $ | .22 | |
| | | | | | | | |
PACCAR Inc
CONDENSED BALANCE SHEETS
(in millions)
| | | | | | | | |
| | | March 31 | | | December 31 | |
| | | 2016 | | | 2015 | |
ASSETS | | | | | | | | |
Truck, Parts and Other: | | | | | | | | |
Cash and marketable debt securities | | $ | 3,231.1 | | | $ | 3,378.0 | |
Trade and other receivables, net | | | 1,066.1 | | | | 879.0 | |
Inventories, net | | | 829.1 | | | | 796.5 | |
Property, plant and equipment, net | | | 2,207.7 | | | | 2,176.4 | |
Equipment on operating leases and other, net | | | 1,700.7 | | | | 1,625.3 | |
Financial Services Assets | | | 12,322.2 | | | | 12,254.6 | |
| | | | | | | | |
| | |
| | $ | 21,356.9 | | | $ | 21,109.8 | |
| | | | | | | | |
| | |
LIABILITIES AND STOCKHOLDERS’ EQUITY | | | | | | | | |
Truck, Parts and Other: | | | | | | | | |
Accounts payable, deferred revenues and other | | $ | 5,183.3 | | | $ | 4,331.9 | |
Financial Services Liabilities | | | 9,830.4 | | | | 9,837.5 | |
STOCKHOLDERS’ EQUITY | | | 6,343.2 | | | | 6,940.4 | |
| | | | | | | | |
| | |
| | $ | 21,356.9 | | | $ | 21,109.8 | |
| | | | | | | | |
| | |
Common Shares Outstanding | | | 350.4 | | | | 351.3 | |
| | | | | | | | |
PACCAR Inc
CONDENSED CASH FLOW STATEMENTS
(in millions)
| | | | | | | | |
Three Months Ended March 31 | | 2016 | | | 2015 | |
OPERATING ACTIVITIES: | | | | | | | | |
Net (loss) income | | $ | (594.6 | ) | | $ | 378.4 | |
Depreciation and amortization: | | | | | | | | |
Property, plant and equipment | | | 75.8 | | | | 70.3 | |
Equipment on operating leases and other | | | 166.7 | | | | 150.8 | |
European Commission charge | | | 942.6 | | | | | |
Net change in trade receivables, inventory and payables | | | (15.3 | ) | | | 37.8 | |
Net decrease (increase) in wholesale receivables on new trucks | | | 73.7 | | | | (215.5 | ) |
All other operating activities, net | | | 146.9 | | | | 54.4 | |
| | | | | | | | |
| | |
Net Cash Provided by Operating Activities | | | 795.8 | | | | 476.2 | |
| | |
INVESTING ACTIVITIES: | | | | | | | | |
Payments for property, plant and equipment | | | (77.3 | ) | | | (54.8 | ) |
Acquisitions of equipment for operating leases | | | (340.1 | ) | | | (340.9 | ) |
Net increase in financial services receivables | | | (4.9 | ) | | | (13.7 | ) |
Net decrease (increase) in marketable securities | | | 14.0 | | | | (45.8 | ) |
Proceeds from asset disposals | | | 116.1 | | | | 123.0 | |
| | | | | | | | |
| | |
Net Cash Used in Investing Activities | | | (292.2 | ) | | | (332.2 | ) |
| | |
FINANCING ACTIVITIES: | | | | | | | | |
Payments of cash dividends | | | (576.9 | ) | | | (432.4 | ) |
Purchases of treasury stock | | | (56.3 | ) | | | | |
Proceeds from stock compensation transactions | | | 2.6 | | | | 6.3 | |
Net (decrease) increase in debt | | | (92.3 | ) | | | 186.2 | |
| | | | | | | | |
| | |
Net Cash Used in Financing Activities | | | (722.9 | ) | | | (239.9 | ) |
Effect of exchange rate changes on cash | | | 50.2 | | | | (77.0 | ) |
| | | | | | | | |
| | |
Net Decrease in Cash and Cash Equivalents | | | (169.1 | ) | | | (172.9 | ) |
Cash and cash equivalents at beginning of period | | | 2,016.4 | | | | 1,737.6 | |
| | | | | | | | |
| | |
Cash and cash equivalents at end of period | | $ | 1,847.3 | | | $ | 1,564.7 | |
| | | | | | | | |
PACCAR Inc
SEGMENT AND OTHER INFORMATION
(in millions)
| | | | | | | | |
| | | Three Months Ended | |
| | | March 31 | |
| | | 2016 | | | 2015 | |
Sales and Revenues: | | | | | | | | |
Truck | | $ | 3,270.5 | | | $ | 3,769.1 | |
Parts | | | 719.5 | | | | 752.7 | |
Financial Services | | | 289.4 | | | | 284.7 | |
Other | | | 20.6 | | | | 26.2 | |
| | | | | | | | |
| | |
| | $ | 4,300.0 | | | $ | 4,832.7 | |
| | | | | | | | |
| | |
Pretax (Loss) Profit: | | | | | | | | |
Truck | | $ | 304.1 | | | $ | 339.1 | |
Parts | | | 134.6 | | | | 138.9 | |
Financial Services | | | 80.3 | | | | 89.0 | |
European Commission Charge | | | (942.6 | ) | | | | |
Investment Income and Other | | | (6.0 | ) | | | (5.3 | ) |
| | | | | | | | |
| | |
| | $ | (429.6 | ) | | $ | 561.7 | |
| | | | | | | | |
|
GEOGRAPHIC REVENUE | |
|
| (in millions) | |
| |
| | | Three Months Ended | |
| | | March 31 | |
| | | 2016 | | | 2015 | |
United States and Canada | | $ | 2,591.5 | | | $ | 3,299.4 | |
Europe | | | 1,270.1 | | | | 1,033.0 | |
Other | | | 438.4 | | | | 500.3 | |
| | | | | | | | |
| | |
| | $ | 4,300.0 | | | $ | 4,832.7 | |
| | | | | | | | |
|
| NEW TRUCK DELIVERIES | |
| |
| | | Three Months Ended | |
| | | March 31 | |
| | | 2016 | | | 2015 | |
United States and Canada | | | 18,500 | | | | 24,400 | |
Europe | | | 13,500 | | | | 10,100 | |
Other | | | 3,300 | | | | 3,800 | |
| | | | | | | | |
| | |
| | | 35,300 | | | | 38,300 | |
| | | | | | | | |
PACCAR Inc
SUPPLEMENTARY INFORMATION
RECONCILIATION OF NON-GAAP TO GAAP FINANCIAL MEASURES
This earnings release includes “adjusted net income (non-GAAP)” and “adjusted net income per diluted share (non-GAAP)”, which are financial measures that are not in accordance with U.S. generally accepted accounting principles (“GAAP”), since they exclude the non-recurring European Commission charge. These measures differ from the most directly comparable measures calculated in accordance with GAAP and may not be comparable to similarly titled non-GAAP financial measures used by other
companies.
Management utilizes these non-GAAP measures to evaluate the Company’s performance and believes these measures allow investors and management to evaluate operating trends by excluding a significant non-recurring charge that is not representative of underlying operating trends.
Reconciliations of adjusted net income (non-GAAP) and adjusted net income per diluted share (non-GAAP) to the most directly comparable GAAP measures are as follows:
| | | | |
| | | Three Months Ended | |
(in millions) | | March 31, 2016 | |
Adjusted Net Income (Non-GAAP) | | $ | 348.0 | |
Non-recurring European Commission Charge | | | (942.6 | ) |
| | | | |
Net Loss | | $ | (594.6 | ) |
| | | | |
| |
| | | Three Months Ended | |
| | | March 31, 2016 | |
Per Diluted Share: | | | | |
Adjusted Net Income (Non-GAAP) | | $ | .99 | |
Non-recurring European Commission Charge | | | (2.68 | ) |
| | | | |
Net Loss | | $ | (1.69 | ) |
| | | | |
Shares (millions) used in per share calculations: Non-GAAP - 351.9 and GAAP - 351.3.